Embed Size (px)
Citation preview

arX
iv:0
906.
5022
v1 [
cs.R
O]
26 J
un 2
009
Chemical Power for Microscopic Robots in Capillaries
Tad HoggHewlett-Packard Laboratories
Palo Alto, CA
Robert A. Freitas Jr.Institute for Molecular Manufacturing
Palo Alto, CA
June 27, 2009
Abstract
The power available to microscopic robots (nanorobots) that oxidize bloodstream glucose while aggre-gated in circumferential rings on capillary walls is evaluated with a numerical model using axial symmetryand time-averaged release of oxygen from passing red blood cells. Robots about one micron in size canproduce up to several tens of picowatts, in steady-state, ifthey fully use oxygen reaching their surfacefrom the blood plasma. Robots with pumps and tanks for onboard oxygen storage could collect oxygento support burst power demands two to three orders of magnitude larger. We evaluate effects of oxygendepletion and local heating on surrounding tissue. These results give the power constraints when robotsrely entirely on ambient available oxygen and identify aspects of the robot design significantly affectingavailable power. More generally, our numerical model provides an approach to evaluating robot designchoices for nanomedicine treatments in and near capillaries.
Keywords: nanomedicine, nanorobotics, capillary, power, numericalmodel, oxygen transport
1

1 Introduction
Nanotechnology has the potential to revolutionize health care [65, 66, 49, 63]. A current example is enhancedimaging with nanoscale particles [86, 68]. Future possibilities include programmable machines comparablein size to cells [26, 27, 30, 59]. Such microscopic robots (“nanorobots”) could provide significant medicalbenefits [27, 65, 39].
Realizing these benefits requires fabricating the robots cheaply and in large numbers. Such fabricationis beyond current technology, but could result from ongoingprogress in developing nanoscale devices. Oneapproach is engineering biological systems, e.g., RNA-based logic inside cells [92] and bacteria attachedto nanoparticles [60]. However, biological organisms havelimited material properties and computationalspeed. Instead, we consider machines based on plausible extensions of currently demonstrated nanoscaleelectronics, sensors and motors [7, 12, 19, 20, 46, 31, 58, 64, 89] and relying on directed assembly [51].These components enable nonbiological robots that are stronger, faster and more flexibly programmed thanis possible with biological organisms.
A major challenge for nanorobots arises from the physics of their microenvironments, which differ inseveral significant respects from today’s larger robots. First, the robots will often operate in fluids containingmany moving objects, such as cells, dominated by viscous forces. Second, thermal noise is a significantsource of sensor error and Brownian motion limits the ability to follow precisely specified paths. Finally,power significantly constrains the robots [57, 77], especially for long-term applications where robots maypassively monitor for specific rare conditions (e.g., injury or infection) and must respond rapidly when thoseconditions occur.
Individual robots moving passively with the circulation can approach within a few cell diameters of mosttissue cells of the body. To enable passing through even the smallest vessels, the robots must be at most a fewmicrons in diameter. This small size limits the capabilities of individual robots. For tasks requiring greatercapabilities, robots could form aggregates by using self-assembly protocols [27]. For robots reaching tissuesthrough the circulation, the simplest aggregates are formed on the inner wall of the vessel. Robots could alsoaggregate in tissue spaces outside small blood vessels by exiting capillaries via diapedesis [27], a processsimilar to that used by immune cells [2].
Aggregates of robots in one location for an extended period of time could be useful in a variety of tasks.For example, they could improve diagnosis by combining multiple measurements of chemicals [44]. Usingthese measurements, the aggregate could give precise temporal and spatial control of drug release [27, 30] asan extension of anin vitro demonstration using DNA computers [9]. Using chemical signals, the robots couldaffect behavior of nearby tissue cells. For such communication, molecules on the robot’s surface could mimicexisting signalling molecules to bind to receptors on the cell surface [27, 29]. Examples include activatingnerve cells [88] and initiating immune response [29], whichcould in turn amplify the actions of robots byrecruiting cells to aid in the treatment. Such actions wouldbe a small-scale analog of robots affecting self-organized behavior of groups of organisms [36]. Aggregatescould also monitor processes that take place overlong periods of time, such as electrical activity (e.g., from nearby nerve cells), thereby extending capabilitiesof devices tethered to nanowires introduced through the circulatory system [54]. In these cases, the robotswill likely need to remain on station for tens of minutes to a few hours or even longer.
The aggregate itself could be part of the treatment by providing structural support, e.g., in rapid responseto injured blood vessels [28]. Aggregates could perform precise microsurgery at the scale of individual cells,extending surgical capabilities of simpler nanoscale devices [52]. Since biological processes often involve ac-tivities at molecular, cell, tissue and organ levels, such microsurgery could complement conventional surgeryat larger scales. For instance, a few millimeter-scale manipulators, built from micromachine (MEMS) tech-nology, and a population of microscopic devices could act simultaneously at tissue and cellular size scales,e.g., for nerve repair [80, 45].
For medical tasks of limited duration, onboard fuel createdduring robot manufacture could suffice. Oth-erwise, the robots need energy drawn from their environment, such as converting externally generated vibra-tions to electricity [90] or chemical generators [27]. Power and a coarse level of control can be combined byusing an external source, e.g., light, to activate chemicals in the fluid to power the machines in specific loca-tions [83], similar to nanoparticle activation during photodynamic therapy [8], or by using localized thermal,
2

acoustic or chemical demarcation [27].
This paper examines generating power for long-term robot activity from reacting glucose and oxygen,which are both available in the blood. Such a power source is analogous to bacteria-based fuel cells whoseenzymes enable full oxidation of glucose [17, 55, 56]. We describe a computationally feasible model in-corporating aspects of microenvironments with significanteffect on robot performance but not previouslyconsidered in robot designs, e.g., kinetic time constants determining how rapidly chemical concentrationsadjust to robot operations. As a specific scenario, we focus on modest numbers of robots aggregated incapillaries.
A second question we consider is how the robots affect surrounding tissue. Locally, the robots competefor oxygen with the tissue and also physically block diffusion out of the capillary. Robot power generationresults in waste heat, which could locally heat the tissue. The robot oxygen consumption could also havelonger range effects by depleting oxygen carried in passingred blood cells.
In the remainder of this paper, we present a model of the key physical properties relevant to powergeneration for robots using oxygen and glucose in the blood plasma. Using this model, we then evaluate thesteady-state power generation capabilities of aggregatedrobots and how they influence surrounding tissue.
2 Modeling Physical Processes for Microscopic Robots
We consider microscopic robots using oxygen and glucose available in blood plasma as the robots’ powersource. This scenario involves fluid flow, chemical diffusion, power generation from reacting chemicals andwaste heat production. Except for the simplest geometries,behaviors must be computed numerically, e.g.,via the finite element method [81]. Computational feasibility requires a choice between level of detail ofmodeling individual devices and the scale of the simulation, both in number of devices and physical sizeof the environment considered. For microscopic biologicalenvironments relevant for nanorobots, detailedphysical properties may not be known or measurable with current technology, thereby limiting the level ofdetail possible to specify.
This section describes our model. The simplifying approximations are similar to those used in biophys-ical models of microscopic environments, such as oxygen transport in small blood vessels with diffusioninto surrounding tissue [62, 67]. We focus on steady-state behavior indicating long-term robot performancewhen averaged over short-term changes in the local environment such as individual blood cells (exclusivelyerythrocytes, not white cells or platelets unless noted otherwise) passing the robots.
2.1 Blood Vessel and Robot Geometry
Evaluating behavior in general three-dimensional geometries is computationally intensive. Simplified phys-ical models give useful insight with significantly reduced computational requirements [67]. Such simplifi-cations include using two-dimensional and axially-symmetric three-dimensional geometries. The latter case,appropriate for behavior within vessels, has physical properties independent of angle of rotation around thevessel axis. We adopt this approach and consider the axially-symmetric geometry illustrated in Fig. 1: asegment of a small vessel with robots forming one or more rings around the vessel wall. The figure includesthe Fahraeus effect: confinement of blood cells near the center of the vessel. Section 2.8 describes how wemodel this effect.
To ensure axial symmetry, we model the robot’s interior withuniform physical properties and take theirshapes conforming to the vessel wall with no gaps between neighboring robots [27]. Thus, as seen in Fig. 1(b),the surfaces of the robots contacting the plasma or the vessel wall are curved, so the robots are only roughlycubical. The other robot surfaces indicated in Fig. 1 are nottreated explicitly in our model.
Physically uniform robot interiors are convenient but not necessary for this model. An axially symmetricmodel only requires the robots to be uniform in the directionaround the vessel and that the radial boundarysurfaces between robots are treated as continuous with the interiors. Robot characteristics could vary in thedirection along the vessel axis or radially. For example, the axially symmetric model could apply to robotswhose power generators are close to the plasma-contacting surface to minimize internal oxygen transport,
3

tissue
robots
vessel wall
vessel axis
R
Rtissue
plasma only
plasma and cells
R
Rtissue
tissue
plasma
and cells
vessel wall
robots
plasma only
(a) (b)
Figure 1: Schematic geometry of vessel, robots and surrounding tissue. The relative sizes of the regionsare not to scale for the parameters of our model (described inSection 2.9). (a) A slice through the axiallysymmetric geometry with the vessel axis at the bottom, showing a cross section of 10 rings of robots. Fluidflows through the vessel from left to right, with varying speed depending on distance to the vessel wall. (b)Vessel cross section at the position of one ring of robots.
analogous to clumping of mitochondria in cells near capillaries [67]. Moreover, while we primarily focuson physically adjacent rings of robots, axial symmetry alsoholds for sets of rings that are spaced apart fromeach other along the vessel. We refer to a set of rings of robots as aringset.
We ignore pulsatile variations in vessel circumference as these are mostly confined to the larger arterialvessels [76]. Thus our model geometry is both axially symmetric and static.
2.2 Fluid Flow
Viscosity dominates the motion of microscopic objects in fluids, producing different physical behaviors thanfor larger organisms and robots in fluids [70, 87, 32, 47, 79].The Navier-Stokes equation describes theflow [24, 47]. For the vessel geometry of Fig. 1, the pressure difference between the inlet and outlet of thevessel determines the nature of the flow. We specify the pressure difference as∇pL where∇p is the overallpressure gradient andL is the length of the modeled segment of the vessel. While somefluid leaks into orout of capillaries, we ignore this small component of the flow, in common with other models of blood flow incapillaries [67, 69]. In our scenario, the robots are attached to the vessel wall. For modeling fluid behavior,such static robots merely change the shape of the vessel boundary. We apply the “no slip” boundary conditionon both the robots and the vessel wall, i.e., fluid speed is zero at these boundaries. Thus the flow speed variesfrom zero at the wall to a maximum value in the center of the vessel.
2.3 Chemical Diffusion
Microscopic robots and bacteria face similar physical constraints in obtaining chemicals [11]. At smallscales, diffusion arising from random thermal motions is the main process transporting chemicals. Even atthe scale of these robots, individual molecules and their distances between successive collisions are tiny.Thus chemicals in the fluid are well-approximated by a continuous concentrationC specifying the numberof molecules per unit volume. The concentration obeys the diffusion equation [10],
∂C
∂t= −∇ ·F + Γ (1)
4
whereF = −D∇C + vC is the chemical flux,∇C is the concentration gradient,v is the fluid velocityvector,D is the chemical diffusion coefficient andΓ is the reaction rate density, i.e., rate at which moleculesare created by chemical reactions per unit volume. The first term in the flux is diffusion, which acts to reduceconcentration gradients, and the second term arises from movement of the fluid in which the chemical isdissolved.
Small molecules such as oxygen and glucose readily diffuse from capillaries into surrounding tissue.Eq. (1) also describes the transport within the tissues whereinv ≈ 0, i.e., the transport is completely due todiffusion. The diffusion coefficient of oxygen in tissue is close to that in plasma [62], and for simplicity weuse the same diffusion coefficients in both regions.
2.4 Kinetics of Oxygen Release from Red Blood Cells
As robots consume oxygen from the plasma, passing red blood cells respond to the reduced concentration byreleasing oxygen. An important issue for powering robots ishow rapidly cells replenish the oxygen in theplasma as the cells pass the robots.
A key value determining the oxygen release from red blood cells is the hemoglobin saturationS: thefraction of hemoglobin capacity in a cell which has bound oxygen [61]. The oxygen concentration in the cellis Cmax
O2S, whereCmax
O2is the concentration in the cell when all the hemoglobin has bound oxygen.
The saturation is high when the cell is in fluid with high oxygen content, i.e., in the lungs, and low afterthe cell has delivered oxygen to tissues of the body. Quantitatively, the equilibrium saturation, conventionallyexpressed in terms of the equivalent partial pressurep of O2 in the fluid around the cell, is well-described bythe Hill equation [67]:
Sequib(a) =an
1 + an(2)
wherea = p/p50 is the partial pressure ratio,p50 is the partial pressure at which half the hemoglobin isbound to oxygen andn characterizes the steepness of the change from low to high saturation. The saturationin small blood vessels ranges from near1 within the lungs to around1/3 within working tissues. Henry’sLaw relates the partial pressure to the concentration:p = HO2
CO2with the proportionality constantHO2
depending on the fluid temperature.
Eq. (2) gives the equilibrium saturation, i.e., the value ina red cell after residing a sufficiently long time ina fluid with partial pressurep. However, small robots consuming oxygen from the plasma mayproduce largegradients in oxygen concentration. If the oxygen concentration gradients and flow speed are high enough,passing cells will not have time to equilibrate with the abruptly decreased oxygen concentration before theflow moves them past the robots. Whether this is the case depends on the kinetics, i.e., how rapidly cellschange their saturation level when exposed to concentration changes. The time scale for oxygen release isdetermined by reaction kinetics of oxygen binding to hemoglobin in the cell and diffusion of these chemicalswithin the cell.
One model of this kinetics is a lumped-model differential equation relating saturation to concentrationoutside the cell [18]. In this model, the change inS, and hence the flux of oxygen from a cell into thesurrounding plasma, is determined from the partial pressure ratioa as
dS(t)
dt= − 1
tu
√
s(a, S(t)) (3)
wheretu is a characteristic time scale for oxygen unloading and the saturation unloading functions is
s(a, S) =2(1 − S)
n + 1an+1 − 2Sa +
2n
n + 1
S1+1/n
(1 − S)1/n(4)
If oxygen partial pressure,p, varies over the surface of the cell, the rate of change is theaverage of the right-hand-side of Eq. (3) over the surface of the cell. Eq. (3) is consistent with the equilibrium relation of Eq. (2)becauses(a, Sequib(a)) = 0.
As a boundary condition on oxygen saturationS, at the vessel inlet we takeS equal to the equilibriumvalue with the oxygen plasma concentration specified at the inlet. Numerical evaluation of Eq. (3) requires
5

care to accurately evaluates when the concentration is close to equilibrium to avoid numerical instability ifthe computed concentration in the plasma is even slightly above the cell saturation.
The blood cells also have a role in removing the carbon dioxide produced by the robots (Section 2.5).Only a small portion is transported dissolved in the plasma.Instead, most CO2 is transported or chemicallyconverted to bicarbonate within red cells. The detailed kinetics of these processes [34] does not directly limitrobot power production, and thus is beyond the scope of this paper. Moreover, the robot power productionrates considered here increase the carbon dioxide concentration by only a few percent, which can be bufferedby processes within the passing cells and so is not likely to be a safety constraint on the power levels in thescenarios we consider.
2.5 Robot Power Generation
The overall chemical reaction combining glucose and oxygento produce water and carbon dioxide is
C6H12O6 + 6 O2 → 6 CO2 + 6 H2O
We denote the energy released by each such reaction bye. A robot absorbing oxygen molecules at a rateJO2
produces powerJO2e/6 because each reaction uses six O2 molecules.
We consider robots on the vessel wall absorbing chemicals from the fluid only on their plasma-facingsides. For generating power with oxygen and glucose from theblood, oxygen is the limiting chemical [27].We examine two design choices for the robots: how they collect oxygen arriving at their surface and theircapacity for processing that oxygen to produce power.
For the first design choice, oxygen transport within the robots, we examine two extremes. In the basic(“no pumps”) design, the robots absorb oxygen passively viadiffusion. In the advanced (“with pumps”)design, the robots use pumps on their surfaces to actively absorb all arriving oxygen and distribute this gas tointernal power generating sites. We treat the full surface as available to absorb chemicals. In practice, robotswill absorb chemicals with only a fraction of their surface.This is not a significant constraint for microscopicrobots since even a modest fraction of a surface with absorbing sites gives absorption almost as large as thatof a fully absorbing surface [11].
For the second design choice, robot power production capacity, we also examine two cases. Onboardgenerating capacity arises from the number and efficiency ofthe internal reaction sites, e.g., fuel cells [27,17, 56], in each robot. If capacity is constrained by engineering feasibility of fuel cell fabrication or bydifficulty of placement into the robots, the robots will haverelatively few fuel cells – and consequently a lowmaximum capacity for power generation – hence are called “low capacity” robots. When these constraintsdo not apply, we have “high capacity” robots.
A robot with sufficient pump and generating capacity produces power from all oxygen reaching the robot.This oxygen-limited situation corresponds to a zero-concentration boundary condition for the oxygen con-centration in the fluid at the robot surface. With this boundary condition, integrating the dot product of theflux F (determined from Eq. (1)) and normal vector of the plasma-facing surface of the robot gives the rateJO2
(molecules per unit time) at which the robot absorbs oxygen molecules, with no need to explicitly modeloxygen transport and consumption inside the robot. While pumps cannot maintain the zero-concentrationboundary condition at arbitrarily high oxygen flux, theoretical pump capacity appears more than adequate forthe oxygen concentrations relevant to our model [27].
A robot’s power generating capacity is limited by the numberof reaction sites it contains,Nreact, andby the maximum rate of reacting glucose and oxygen at each site, r. Specifically, the steady-state oxygenabsorption rate must satisfyJO2
≤ 6Nreactr. If this bound on absorption rate is smaller than the oxygenflux corresponding to the zero-concentration boundary condition the pumps could maintain, then the robot’spower generation will be capacity-limited rather than oxygen-limited and the zero-concentration boundarycondition will not apply. In this situation, for a robot withpumps we consider the pumps delivering as muchoxygen as the reaction sites can process, giving robot powergeneration equal to its maximum possible value,namely,Nreactre.
Determining power generation for robots without pumps requires explicitly modeling the oxygen trans-port and power generation within the robot. In this case the oxygen moves by diffusion within the robot.
6

We treat power generation as spatially continuous rather than occurring at discrete reaction sites, therebymaintaining axial symmetry. Thus Eq. (1) applies within therobot, with the reaction rate density for oxygen,Γ, determined by the number density of reaction sites,ρreact, and the reaction kinetics of each site. For uni-formly distributed reaction sites,ρreact = Nreact/Vrobot whereVrobot is the volume of each robot. Specifically,at a given location inside the robot,Γ = 6Probot/e whereProbot is the power generation density, i.e., thepower generated per unit volume at that location. We model robot power generation using Michaelis-Mentenkinetics [14] assuming oxygen is the limiting factor because glucose concentrations are typically two ordersof magnitude larger than those of oxygen [27]:
Probot = eρreactrCO2
K + CO2
(5)
whereK is the concentration of O2 giving half the maximum reaction rate. The total power generated by arobot is the integral ofProbot over the robot’s volume, which is the same as the power determined from therate the robot absorbs oxygen, i.e.,eJO2
/6. In this no-pumps caseJO2is determined from the solution of
Eq. (1) in the fluid and robot interior rather than from a boundary condition on the robot’s surface.
The number of reaction sites in a robot is a design choice, limited by the volume of each reaction site.As an example, a nanoscale oxygen-glucose fuel cell could beas small as3000 nm3 with r = 106 glucosemolecules per second [27].ρreactcan’t be larger than the reciprocal of this volume – which would correspondto the robot entirely filled by power generation reaction sites. To illustrate the tradeoffs among these designchoices, we consider high and low capacity robots, both withand without pumps. Increasing oxygen concen-tration at the reaction sites increases their power output closer to their maximum (since the fraction appearingin Eq. (5) gets closer to its maximum value of one). Thus pumpscan at least somewhat compensate for adecrease in the number of functional reaction sites by increasing the oxygen concentration so the remainingreaction sites operate more efficiently. On the other hand, if pumps are more difficult to fabricate than fuelcells, robots would benefit from a large number of fuel cells (high capacity) to compensate for the inability ofpassive diffusion to increase concentrations. As another approach to dealing with few fuel cells, we also con-sider placing all of them near the plasma-facing surface of the robot, where oxygen concentration is highestin the passive diffusion (no-pumps) design.
2.6 Oxygen Use in Tissues
Models of oxygen use and power generation in tissues can include various details of tissue structure [67]. Asimple approach, adopted in this paper, treats the tissue surrounding the vessel as homogeneous and metabo-lizing oxygen (assumed to be the rate-limiting chemical) with kinetics similar in form to Eq. (5):
Ptissue= P maxtissue
CO2
Ktissue+ CO2
(6)
whereP maxtissueis the power demand (power per unit volume) of the tissue andKtissueis the concentration of O2
giving half the maximum reaction rate.
2.7 Heating
The robot-generated power eventually dissipates as waste heat into the environment. Heat transfer from therobots to their surroundings occurs by both conduction and convection due to the moving fluid. We takethe tissue environment outside the vessel to be small enoughso as not to include other vessels. Thus heattransport in the tissue is via conduction only.
The temperatureT obeys a version of Eq. (1) [24]:
ρ cthermal∂T
∂t= −∇ ·F + Q (7)
whereF = −kthermal∇T +ρ cthermalTv is the heat flux,∇T is the temperature gradient,v is the fluid velocityvector,ρ is fluid density,kthermal is the fluid’s thermal conductivity,cthermal is the fluid’s heat capacity, andQ
7

is the heat generation rate density which is the same as the power production per unit volume. For robotsabsorbing all oxygen reaching them (i.e., using pumps), we takeQ uniform within the robot, i.e., equal toeJO2
/(6Vrobot). For robots without pumps, power generation varies within the robot, withQ = Probot fromEq. (5). For temperature boundary conditions, we take the incoming fluid and the outermost radius of thetissue cylinder to be held at body temperature.
While we could include tissue power generation as a heat source in the heat equation, here we focus onthe additionalheat from the robots alone. Thus we evaluate how robot power generation adds to the heatload produced by the tissue. We do not consider any changes inthe tissue, either locally or systemically (e.g.,increasing blood flow), in response to the additional heating. This is a reasonable assumption given the tinytemperature increase described in Section 3.3.
2.8 Effects of Cells on Flow and Chemical Transport
In small blood vessels, individual blood cells are comparable in size to the vessel diameter. Thus, at thelength scales relevant for microscopic robots, the fluid consists of plasma separating relatively large objects.The cells significantly affect the fluid flow and, because cells are not rigid, the flow alters the shape of thecells (though we can ignore red blood cell rotation-inducedelevation of diffusivity [48] because these cellsare motionally restricted in capillaries and elevation is lowest for small molecules such as O2). Similarly, thevessel walls are not rigid, which somewhat changes both the flow and the vessel boundary. A key consequencefor oxygen transport is the confinement of cells toward the center of the vessel. The cell-free fluid nearthe vessel wall is a gap over which oxygen released by cells must diffuse to reach the vessel wall or theplasma-facing robot surface. In capillaries, this gap ranges from about 1/2 to 1 micron, depending on flowspeed [73, 69].
Modeling the interactions between fluid and blood cells is computationally feasible for a few cells incapillaries [61, 42]. However, modeling interactions withmany deforming cells is challenging and closepacking of objects moving in fluid leads to complex hydrodynamic interactions [38, 71]. Instead of evaluatingthese effects in detail, we use approximate models that average over the cell behaviors and assume rigid vesselwalls. Such models are commonly used to study oxygen delivery in tissue [67]. This averaging approach alsosimplifies analysis of collective robot behavior [53, 40, 37].
In this approximation, the vessel only contains fluid, whichconsists of two components as illustrated inFig. 1. The first component models the mix of cells and plasma in the central portion of the vessel. Insteadof explicitly modeling individual cells this approximation averages over the cell positions in the fluid. Thesecond component is the fluid near the vessel wall, consisting of plasma only.
The fluid component modeling the mix of cells and plasma is confined to a distanceRcell from the vesselaxis. This distance varies with position along the vessel, as shown in Fig. 1, since robots on the wall reducethe volume available to the passing fluid. Thus all oxygen released by the passing cells is within a distanceRcell of the vessel axis, and this oxygen must diffuse through the plasma gap to reach the robots or the tissue.We takeRcell to follow a fluid streamline with the gap appropriate for the fluid speed in the section of thevessel far from the robots [73]. This approximation accounts for the location of cells toward the center of thevessel without the complexity of modeling how cells change shape as they pass the robots.
A key parameter for oxygen delivery is the hematocrit,hfull , i.e., the fraction of the capillary volumeoccupied by cells. In our model, the more relevant parameteris the hematocrit,h, within the fluid componentcontaining the cells, which has a smaller volume than the full vessel. Since both values must give the samerate for cells passing through the vessel, these quantitiesare related by
h = hfullR2vavg
R2cellvcell
(8)
wherevavg is the average flow speed in the vessel andvcell is the average flow speed within the central portionof the vessel with fluid component modeling the cells. Fluid speed is faster near the center of the vessel thannear the walls, sovcell is larger thanvavg. The quantitiesvavg, vcell andRcell vary along the length of thevessel, but the ratio appearing in Eq. (8) is constant due to our choice ofRcell following a fluid flow streamline.Within the cell fluid component, oxygen bound to hemoglobin has concentrationhCmax
O2S and oxygen in the
8

plasma has concentration(1 − h)CO2. Future evaluations of the accuracy of this simplifying approach to
oxygen delivery might include results from more detailed models comparing oxygen release from red cellswith that of hemoglobin-based oxygen carriers dissolved inplasma rather than contained in cells [84]. Thisaveraging over cell position can also be viewed as approximating the time-averaged behavior as cells pass therobots on the vessel wall.
We model the kinetics of oxygen release from passing cells asdue to changes in cell saturation in the cellfluid component, i.e.,S. The effect of oxygen release from red cells into the plasma arises from the rate ofchange in saturation inside the cells [18], as discussed in Section 2.4 with Eq. (3). Thus the reaction term inEq. (1) for oxygen in the fluid component with the cells is
Γ = −hCmaxO2
dS
dt(9)
SincedS/dt from Eq. (3) is negative, this value forΓ is positive, giving an increase in oxygen in the plasma.
We determineS along the vessel using the lumped model discussed in Section2.4. The value ofSalong the vessel is governed by a one-dimensional version ofthe diffusion equation based on the averageflow speed in the cell fluid component,vcell, and using the chemical diffusion coefficient for oxygen boundto hemoglobin in the cell,Dheme. We determine the reaction term in the diffusion equation for S, for eachposition along the vessel, by averaging the right-hand sideof Eq. (3) over the cross section of the vessel atthat position, based on the oxygen concentration in the plasma of the plasma and cell component of the fluid.This average value gives the rate of change for the saturation of cells as they pass that position along thevessel. In this way the changes in saturation within the cells and the concentration in the plasma are coupledequations that are solved simultaneously.
2.9 Model Parameters
Table 1 lists the parameter values we use. To locate the boundary between the fluid component modeling thecells and the cell-free component near the vessel wall, we use cell-free gaps of0.98 and1.27 µm at the vesselinlet for pressure gradients of105 and5× 105 Pa/m, respectively. For the10 µm ringset, the fluid streamlinebecomes nearly flat (i.e., fluid velocity in the radial direction is nearly zero) near the middle of the aggregate,and the corresponding cell-free gap for the narrow section of the vessel by the robots (i.e., of radius3 µm)matches that for a long vessel with radius3 µm [73].
We assume the fluid properties (i.e., density, viscosity, heat capacity and thermal conductivity) are uni-form throughout the model and roughly equal to those of water. The pressure gradient range we considercorresponds to average flow speeds of0.2–1 mm/s in a vessel of radiusR without robots. These speedsare typical of measured flow in capillaries [27]. For comparing vessels with and without robots we use thesame pressure gradients in both cases. That is, we compare constant-pressure boundary conditions ratherthan constant-velocity conditions. The ambient temperature is body temperature and the hematocrit value istypical of small blood vessels [27], which is somewhat lowerthan in larger vessels.
For the kinetics,Ktissue is from Ref. [62] and the blood cell kinetics parameters are from Refs. [18]and [67]. The oxygen concentration range corresponds to venous and arterial ends of capillaries [27]. Con-centrations of glucose and CO2 in blood plasma are in the millimolar range (about1024 molecule/m3), farlarger than the oxygen concentrations [27]. For evaluatingmicroscopic robot behavior, a convenient measureof chemical concentration in a fluid is number of molecules per unit volume. Much of the existing litera-ture uses units convenient for larger scales, such as moles of chemical per liter of fluid (i.e., molar, M) andgrams of chemical per cubic centimeter. Discussions of gases dissolved in blood often specify concentrationindirectly via the corresponding partial pressure of the gas under standard conditions. As an example, oxy-gen concentrationCO2
= 1022 molecule/m3 corresponds to a17 µM solution,0.53 µg/cm3 and to a partialpressure of1600 Pa or12 mmHg.
Tissue power demands vary considerably, depending on the tissue type and overall activity level. Weconsider typical values of resting and high power demand [27] and focus on two extreme scenarios givenin Table 2. The low demand scenario is the likely situation for most medical procedures in practice. Thehigh demand scenario has a relatively high tissue demand, but is not the peak metabolic rate in human tissue,which can reach rates as high as200 kW/m3 [62].
9
parameter value
geometryvessel radius R = 4 µmtissue cylinder radius Rtissue= 40 µmmodeled vessel length L = 100 µm
fluidambient temperature T = 310 Kthermal conductivity kthermal = 0.6 W/m/Kheat capacity cthermal = 4200 J/kg/Kfluid density ρ = 103 kg/m3
fluid viscosity η = 10−3 kg/m/spressure gradient ∇p = 1–5 × 10⁵ Pa/mhematocrit hfull = 25%
tissuepower demand P max
tissue= 4–60 kW/m3
O2 concentration for half power Ktissue= 1021 molecule/m3
reaction energy from one glucose molecule e = 4 × 10⁻¹⁸ Jdensity, thermal conductivity, heat capacity same as fluid
red blood cellspartial pressure for 50% O2 saturation p50 = 3500 PaO2 saturation exponent n = 2.7time constant for O2 unloading tu = 76 msmaximum O2 concentration in cell Cmax
O2= 1025 molecule/m3
heme diffusion coefficient Dheme= 1.4 × 10⁻¹¹ m2/schemicals in plasma
O2 diffusion coefficient DO2= 2 × 10⁻⁹ m2/s
O2 concentration at inlet CO2= 3–7 × 10²² molecule/m3
O2 partial pressure to concentration ratio HO2= 1.6 × 10⁻¹⁹ Pa/(molecule/m3)
Table 1: Model parameters for fluid, vessel and tissue. We consider two values, the extremes of the listedrange, for parameters indicated in bold. For the vessel without robots, the pressure gradient range correspondsto average flow speeds ofvavg = 0.2–1 mm/s. The corresponding hematocrit values within the cell fluidcomponent areh = 0.31–0.36. See text for source references.
Fluid and chemical properties vary with temperature, but, as described below, the temperature range seenin our model is very small. Thus we take the values at body temperature. We also treat the saturation curveof Eq. (4) as constant although it varies somewhat with CO2 concentration through a change inp50.
The robot size, number aggregated on the vessel wall and power generation capacity are design choices,with the values we consider given in Table 3. We consider setsof circumferential rings along the vesselwall either one or ten adjacent robots long. These aggregates consist of 20 and 200 robots, respectively.We estimateK as the value corresponding to fuel cells based on the glucoseoxidase enzyme [6]. The highand low capacity robot designs correspond to the choices of reaction site density given in Table 3. For thehigh capacity case, the power generation uses about 1% of therobot volume with the fuel cells describedin Section 2.5. As shown in Section 3 the maximum power generation, even for the low capacity case,is considerably larger than possible with the available oxygen. So these design choices are reasonable forstudying limitations due to available oxygen.
In our model, the fluid flow is independent of the chemical concentrations, and both are independent ofthe heat generation due to our assumption that the parameters of Table 1 are independent of temperature in thenarrow physiological range. This simplifies the numerical solution by allowing an iterative procedure: solvingfirst for the fluid flow, then for the chemical concentration and finally for the temperature. Specifically, we firstsolve for the fluid flow in the vessel as determined by the vessel and robot geometry and the imposed pressuregradient. Given the fluid velocity, we then simultaneously solve Eq. (1) for the oxygen concentration and
10

scenarioparameter low demand high demand
pressure gradient ∇p = 105 Pa/m ∇p = 5 × 10⁵ Pa/mtissue power demand P max
tissue= 4 kW/m3 P maxtissue= 60 kW/m3
Table 2: Two scenarios:low with low tissue power demand (basal rate) and slow fluid flow, and high withhigh tissue power demand and fast fluid flow. Both scenarios use high inlet concentration:CO2
= 7 ×10²² molecule/m3 (arterial).
parameter value
geometryrobot size Lrobot = 1 µmrobots per circumferential ring 20robot volume Vrobot = 1.1 µm3
length of aggregate 1–10 µmpower generation
power generation site density ρreact= 0.06–3 × 10²¹/m3
power generation reaction rate r = 106/sO2 concentration for half power K = 1024 molecule/m3
Table 3: Robot design parameters. The robot size is the length of each robot in the radial and longitudinaldirections. The curved surfaces facing the plasma and vessel wall have slightly different lengths. When notlimited by availability of oxygen or glucose, a power generation reaction site produceser = 4 pW. Weconsider two values, the extremes of the listed range, for parameters indicated in bold. The number of powergeneration sites in each robot,Nreact = ρreactVrobot, ranges from66 to 3300, with corresponding maximumpower per robot,Nreactre, of 260 pW and13000 pW for low and high capacity robots, respectively.
Eq. (3) for the blood cell average oxygen saturation. Eq. (5)and Eq. (6) give the power generation density inthe robots and tissue, respectively. For robots with pumps,we impose the boundary conditions on the plasma-facing robot surface described in Section 2.5 and do not needto solve Eq. (1) inside the robot. Dividing thepower generation bye/6, wheree is the energy per reaction, gives the corresponding oxygen reaction ratedensitiesΓ appearing in Eq. (1), i.e, the number of oxygen molecules consumed per unit volume per unit timeat each location. This solution gives the oxygen concentration CO2
and fluxF throughout the vessel and thetissue, and the average cell saturationS as a function of distance along the vessel. Finally, solvingEq. (7)using the solutions for the fluid flow and power generated by the robots gives the temperature increase due tothe robots. We solve for steady-state behaviors, though themodel also applies to time-dependent scenarios.
For the numerical solution, we used a multiphysics finite element solver [1] with about ten to twentythousand mesh points in the two-dimensional geometry representing a slice through the axially symmetricgeometry shown in Fig. 1a. We used the default meshing procedure except constraining the mesh point spac-ing along the plasma-facing robot surface to be at most0.1 µm for the 10-micron ringset and0.01 µm for the1-micron ring. This constraint gives tiny spacing between mesh nodes in the region where the concentrationis changing most rapidly, i.e., near the robot surface. To ensure numerical stability when evaluating Eq. (3), ifthe plasma concentration is above the equilibrium saturation of Eq. (2), we use the opposite sign in Eq. (3) socell saturation increases rather than decreases. This situation only occurs to a slight extent, due to numericalerrors in evaluatingS and the concentration in the plasma whenS is close to the equilibrium value. We solvefor the average cell saturation as a function of position along the vessel in a one-dimensional geometry with900 mesh points.
11

Figure 2: Oxygen concentration in the tissue and plasma within the vessel. Each diagram shows a crosssection through the vessel and surrounding tissue of length30 µm. Typically, this length of vessel containsabout 4 cells. The left plots are for the vessel without robots. The right plots include the 10-micron ringsetwith pumps, which occupies the circumferential volume indicated by the white rectangles next to the vesselwall. The top and bottom plots are for the low and high demand scenarios of Table 2, respectively. Fluidin the vessel flows from left to right. Distances along the sides of each plot are indicated in microns andconcentrations on the color bars are in units of1022 molecule/m3. The horizontal black lines are the vesselwalls and the gray curves inside the vessel are fluid flow streamlines.
3 Results
Fig. 2 shows the distribution of oxygen in the tissue and plasma in the vessel near the robots. The robotsreduce the local oxygen concentration far more than the surrounding tissue, as seen by comparing with thevessel without robots. Most of the extra oxygen used by the robots comes from the passing blood cells,which have about 100 times the oxygen concentration of the plasma. Within the vessel with the robots, theconcentration in the plasma is lowest in the fluid next to the robots. Downstream of the robots is a recoveryregion where the concentration increases a bit as cells respond to the abruptly lowered concentration near therobots. In the low demand scenario, the concentration in thevessel just downstream of the robots is somewhatlower than in the surrounding tissue. Thus in this region, the net movement of oxygen is from the tissue intothe vessel, where the fluid motion transports the oxygen somewhat downstream before it diffuses back intothe tissue. In effect, part of the oxygen entering the vesseltravels through the tissue around robots to thedownstream section of the vessel, in contrast to the patternwithout robots where oxygen is always movingfrom the vessel into the surrounding tissue. The streamlines in Fig. 2 show that the laminar flow speeds up asthe fluid passes through the narrower vessel section where the robots are stationed.
Fig. 3 gives another view of how the robots affect the oxygen concentration in the surrounding tissue. Theconcentration is zero at the robot surface facing into the vessel. The robots decrease the oxygen concentrationsomewhat but do not affect tissue power generation much since the concentration remains well above the
12

tissue
0 10 20 30 400
1´1022
2´1022
3´1022
4´1022
distanceHΜmL
oxyg
enco
ncen
trat
ion
tissue
0 10 20 30 400
1´1022
2´1022
3´1022
4´1022
distanceHΜmL
oxyg
enco
ncen
trat
ion
Figure 3: Oxygen concentration, in molecule/m3, along a radial cross section from the center of the vesselto the outer edge of the tissue region. The cross section is inthe middle of the modeled section of vessel andtissue, corresponding to a vertical line in the center of each plot of Fig. 2. The gray area indicates the interiorof the vessel. The left and right plots correspond to the low and high demand scenarios of Table 2. In eachplot, the upper curve is for the vessel without robots and thelower curve is for the vessel containing the10 µmringset with pumps. For comparison, the dashed curves are solutions to the Krogh model [50] correspondingto the vessel without robots.
threshold where power generation drops significantly, i.e., Ktissuegiven in Table 1. However, at large distancesfrom the vessel in the high demand scenario oxygen concentration is low enough to significantly decreasetissue power production. This low level of oxygen also occurs when there are no robots.
Fig. 3 includes comparison with the simpler Krogh model of oxygen transport to tissue from vesselswithout robots [50]. The Krogh model assumes constant powerdensity in the tissue and no diffusion alongthe vessel direction in the tissue. For the low demand scenario, the Krogh model results are close to thosefrom our model. However in the high demand case, the Krogh model has oxygen concentration drop to zeroabout10 µm from the vessel, due to the unrealistic assumption of constant power use rather than the decreasein power use at low concentrations given by Eq. (6).
Oxygen flux to the robots ranges from about1019 to 1020 molecule/m2/s with the zero-concentrationboundary condition. Estimates of pump capabilities are up to 1022 molecule/m2/s [27], which is more than100 times the actual flux to the robots. Such pumps could thereby maintain the zero concentration boundarycondition. At an energy use of10−20 J/molecule [27], the pumps would require about1 pW per robot tohandle the incoming flux, slightly reducing the power benefitof the pumps. However, much of this pumpingenergy may be recoverable by adding a generator using the subsequent expansion of the reaction products totheir lower partial pressure outside the robot [26].
3.1 Robot Power
This section describes the steady-state power available tothe robots according to our model in various sce-narios. We first discuss the average per robot power in the aggregate, for both high and low capacity cases,which also indicates the total power available to the aggregate as a whole. We then show how the power isdistributed among the robots, based on their location in theringset. Finally, we illustrate the qualitative fea-tures of these results in a simpler, analytically-solvablemodel to identify key scaling relationships betweenrobot design choices and power availability.
3.1.1 Average Robot Power
Table 4 gives the average power generated using the available oxygen, per robot within the aggregate. Asexpected, robots receive more oxygen and hence can generatemore power when inlet concentration is high,fluid speed is high or tissue power demand is low. In the first two cases, the flow brings oxygen through thevessel more quickly; in the last case, surrounding tissue removes less oxygen. The less than 2-fold decreasein robot power generation in the face of a larger 2.5-fold decrease in O2 inlet concentration from the arterial
13

robot power generation capacity high capacity low capacityinlet concentrationCO2
(1022 /m3) 3 7 7pressure gradient∇p (105 Pa/m) 1 5 1 5 1 5tissue power demandP max
tissue(kW/m3) 4 60 4 60 4 60 4 60 4 60 4 6010-micron ringset (with pumps) 12 8 14 12 17 11 24 18 17 11 24 1810-micron ringset (free diffusion) 11 7 12 10 15 10 22 16 6 3 8 61-micron ring (with pumps) 44 27 49 36 69 36 99 58 69 36 99 581-micron ring (free diffusion) 31 19 34 25 49 25 71 38 9 4 12 7
Table 4: Average per-robot power generation (in picowatts)in various scenarios. Free diffusion is the “nopumps” case. The values in bold correspond to the low and highdemand scenarios of Table 2.
to the venous end of the capillary shows that robots extract more oxygen from red cells than these cellswould normally release while passing the length of the vessel. Thus robots get some of their oxygen as “newoxygen” rather than just taking it from what the tissues would normally get. This is possible because in thiscase robots create steeper concentration gradients than the tissue does.
The 10-micron ringset with pumps produces about the same power in the low and high demand scenarios,consuming oxygen at5 × 109 molecule/s.
Comparing the different aggregate sizes shows lower power generation, per robot, in the large aggregatecompared to the small one. This arises from the competition among nearby robots for the oxygen. Neverthe-less the larger aggregate, with ten times as many robots, generates several times as much power in aggregateas the smaller one. This difference identifies a design choice for aggregation: larger aggregates have moretotal power available but less on a per robot basis.
Robots using pumps generate only modestly more power than robots relying on diffusion alone in ourhigh capacity design example (Section 2.5). In this case, for robots without pumps, the power generation sitedensity,ρreact, is sufficiently large that oxygen molecules diffusing intothe robot are mostly consumed by thepower generators near the surface of the robot before they have a chance to diffuse back out of the robot. Forsuch robots, power generators far from the plasma-facing surface receive very little oxygen and hence do notadd significantly to the robot power production.
Pumps give higher benefit for isolated rings of robots than for tightly clustered aggregates. Although notevaluated in the axially symmetric model used here, pumps may be even more significant for a single isolatedrobot on the vessel wall. Such a robot would not be competing with any other robots for the available oxygen,though would still compete with nearby tissue.
3.1.2 Low Capacity Robots
The low capacity robots have only1/50th the maximum power generating capability of the high capacityrobots discussed above. Nevertheless, each robot’s maximum power is several times larger than the limit dueto available oxygen. Thus pumps allow the robots to produce the same power as given in Table 4 for thehigh capacity robots. The pumps ensure the absorbed oxygen is completely used by the smaller number ofreaction sites by increasing the concentration of oxygen within the robots so Eq. (5) gives the same powergeneration in spite of the smaller value ofρreact.
On the other hand, the smaller number of reaction sites is a significant limitation for robots withoutpumps. Comparing with Table 4 shows pumps improve the average power by factors of about 3 and 8 forthe 10 and 1-micron ringsets, respectively. Comparing withhigh capacity robots without pumps shows thefactor of 50 reduction in reaction sites only reduces average power by factors of about 3 and 5 for the 10 and1-micron ringsets, respectively. Thus the reaction sites in the low capacity scenario are used more effectivelythan in the high capacity robots: with a smaller number of sites, each site does not compete as much withnearby sites for the available oxygen.
Much of the power in robots without pumps is generated near the plasma-facing surface, where oxygenconcentration is largest. In our case, the power for the highcapacity robots is generated primarily within
14

1 2 3 4 5 6 7 8 9 10
5
10
15
20
25
30
35
powerHpWLlow demand
high capacity with pumps
high capacity free diffusion
low capacity with pumps
low capacity free diffusion
position
1 2 3 4 5 6 7 8 9 10
5
10
15
20
25
30
35
powerHpWLhigh demand
high capacity with pumps
high capacity free diffusion
low capacity with pumps
low capacity free diffusion
position
Figure 4: Steady-state power generation, in picowatts, forrobots as a function of their position along thevessel wall, starting from those at the upstream end of the ringset (position 1) and continuing to those at thedownstream end (position 10). The charts, corresponding tothe low and high demand scenarios of Table 2,compare robots with pumps, absorbing all oxygen reaching them, with robots relying on free diffusion (i.e.,without pumps), and high and low capacity robots. For robotswith pumps, power for high and low capacitycases are the same.
100 nm of the robot surface. This observation suggests that a design with power generating sites placednear this surface instead of uniformly throughout the robotvolume, as we have assumed, could significantlyimprove power generation for robots without pumps. For example, placing all the reaction sites uniformlywithin the1/50th of the robot volume nearest the surface would increase the local reaction site density inthat volume by a factor of 50. For low capacity robots, this placement would increaseρreact to the same valueas the high capacity case, but only in a narrow volume, within23 nm of the surface with the robot geometrywe use. Elsewhere in the robot with this designρreact = 0. While we might expect this concentration toincrease power significantly, in fact we find only a small increase (e.g., 12% for the 10-micron ringset in thelow demand scenario). Thus concentrating the reaction sites near the plasma-facing surface does not offermuch of a performance advantage.
3.1.3 Distribution of Power Among Robots
While all robots in a single ring have the same power due to theassumption of axial symmetry, Fig. 4shows that power varies with ring position in the 10-micron ringset. The robots at the upstream edge ofthe aggregate receive more oxygen than the other robots and hence produce more power. Power generationdoes not decrease monotonically along the vessel: robots atthe downstream edge have somewhat moreavailable oxygen than those in the middle of the aggregate since robots at the edge of the aggregate haveless competition for oxygen. Fig. 4 shows significantly larger benefits of pumps at the edges of multi-ringaggregates than in their middle sections, especially in thelow demand scenario.
In the scenarios described above, robots produce power fromall the available oxygen. This is appropriatefor applications requiring as much power as possible for theaggregate as a whole. At the other extreme, anapplication requiring the same behavior from all robots in the aggregate would be limited by the robots withthe least available power. This would be the case for identical robots, all of which perform the same task andhence use the same power. In this case, the robots could increase performance by transferring power fromthose at the edges of the aggregate to those in the middle. Such transfer could take place after generation, e.g.,via shared electric current, or prior to generation by transfer of oxygen among neighboring robots. However,such internal transfer would require additional hardware capabilities. For robots with pumps, an alternativetransfer method is for robots near the edge of the aggregate to run their pumps at lower capacity and thusavoid collecting all the oxygen arriving at their surfaces.This uncollected oxygen would then be availablefor other robots, though some of this oxygen would be transported by the fluid past the robots or be capturedby the tissue rather than other robots. This approach increases power to robots in the middle of the aggregate
15

without requiring additional hardware for internal transfers between robots, but at the cost of somewhat lowertotal power for the aggregate. Increasing as much as possible the power to the robots with the least powerleads to a uniform distribution of power among the robots.
To quantify the trade-off between total power and its uniformity among the robots, we consider all robotssetting each of the pumps on their surfaces to operate at the same rate and the pumps uniformly distributedover the surface. This gives a uniform flux of oxygen over the entire surface of all the robots. The largestpossible value for this uniform flux, and hence the largest power for the aggregate, occurs when the minimumoxygen concentration on the robot surfaces is zero – at that point, the robot whose surface includes thelocation of zero concentration cannot further increase itsuniform flux. For example, in the low demandscenario the maximum value for this uniform flux is approximately 2.22 × 10¹⁹ molecule/m2/s. Comparedto the situation in Fig. 4, this uniform flux gives significantly lower power (39% leading ring, 56% trailingring) for the robots at the edges of the aggregate, somewhat lower power for robots in positions 2 and 3 (87%and 98%, respectively) and somewhat more power (ranging from 104% to 116%) for the other robots. Thecombination of these changes gives a total of84% of the power for the aggregate when every robot collectsall the oxygen reaching its surface. The minimum power per robot increases from12 pW to 14 pW. Robotscould slightly increase power by accepting some nonuniformity of flux over each surface while maintainingthe same total flux to each robot. This would occur when the minimum oxygen concentration on the entirelength of the robot surfaces in a particular robot ring is zero.
Using this approach to uniform power in practice would require the robots to determine the maximum ratethey can operate their pumps while achieving uniform power distribution. This rate would vary with tissuedemand, and also over time as cells pass the robots. A simple control protocol is for each robot to adjustits pump rate up or down according to whether its power generation is below or above that of its neighbors,respectively. When concentration reaches zero on one robot, increasing pump rate at that location would notincrease power generation. Communicating information forthis protocol is likely simpler than the hardwarerequired to internally transfer power or oxygen among robots, but also requires each robot is able to measureits power generation rate. Such measurements and communication would give an effective control providedthey operate rapidly compared to the time over which oxygen flux changes, e.g., as cells pass the robots onmillisecond time scales. Longer reaction times could lead to oscillations or chaotic behavior [43].
A second approach to achieving a more uniform distribution of power is to space the robots at some dis-tance from each other on the vessel wall. This approach wouldbe suitable if the aggregated robots do not needphysical contact to achieve their task. For example, somewhat separating the robots would allow a relativelysmall number to span a distance along the vessel wall larger than the size of a single cell passing throughthe vessel. This aggregate would always have at least some robots between successive cells. Communicatingsensor readings among the robots would then ensure the response, e.g., releasing chemicals, is not affected bymisleading sensor values due to the passage of a single cell,giving greater stability and reliability without theneed for delaying response due to averaging over sensor readings as an alternative approach to accounting forpassing cells. Another example for spaced robots is for directional acoustic communication, at distances ofabout100 µm [27]. Achieving directional control requires acoustic sources extending over distances compa-rable to or larger than the sound wavelength. Plausible acoustic communication between nanorobots involveswavelengths of tens of microns [27].
As a quantitative example of the benefit of spacing robots in the context of our axially symmetric model,we consider a set of rings of robots spaced apart along the vessel wall. When the distance between successiverings is sufficiently large, the power for each ring would be close to that of the isolated 1-micron ring givenin Table 4. For example, the power for the low demand scenarioin the 1-micron ring of high-capacity robotsdecreases from69 pW at high inlet concentration to44 pW at low inlet concentration, which spans the rangeof power for a modest number of widely spaced 1-micron rings within a single vessel. As described inSection 3.3, oxygen absorption by robots can affect concentration over a few tens of microns upstream ofthose robots. Thus separating robot rings by, say,100 µm will give power close to that of the isolated rings,with a gradual decrease in power for successive rings due to the decreasing cell saturation along the vessel.
A third approach to reducing variation in robot power, on average, is through changing pump rates intime. For example, adjacent nanorobot rings could operate with counterphased 50% duty cycles, with onering and its second nearest neighbor ring using pumps while the intervening nearest neighbor has its pumpsoff and does not absorb oxygen. The alternating rings of robots would switch pumps on and off. In this case,
16

robots would have larger power than seen in Fig. 4 for the halfof the time they are active, and zero power forthe other half. This temporal approach would not be suitablefor tasks requiring all robots to have the samepowersimultaneously, but would be useful for tasks requiring higher burst power from robots throughoutthe aggregate where the robots are unable to store oxygen or power for later use. Provided the duty cycle issufficiently long, our steady-state model can quantify the resulting power distribution. For example, in thelow demand scenario, total flux for the aggregate is 79% of that when every robot collects all the oxygenreaching its surface, and the minimum power per robotdropsfrom 12 pW to 10 pW. Thus, when averagedover the duty cycle, this temporal technique reduces total power without benefiting the robots receiving theminimum power. In this case, the temporal approach does not improve minimum robot power (on average)since the power gain to a robot while its neighbors are off is less than a factor of 2, which does not compensatefor the loss due to each robot being off for half the time. Applying the steady-state model to this temporalvariation in robot activity requires the duty cycle be long enough for the system to reach steady-state behaviorafter each switch between the active subset of robots, and that the switching time is short compared to theduty cycle so most of the robots’ power arises during the steady-state portions of the cycle between switching.Diffusion provides one lower bound on this time: when neighboring robots switch pumps from on to off orvice versa, the characteristic diffusion time for oxygen over the distance between next nearest neighbors (onemicron) is about0.1 ms. Adjustments in cell saturation for the 1-micron shift inthe location of the activerobots between each half of the duty cycle is a further limitation on the duty cycle time for the validity ofthe steady-state model, though this is likely to be minimal since the cells are separated from the robots bythe plasma gap in the fluid. Since the steady-state model averages over the position of passing cells, anotherlower bound on the duty cycle arises from the time for a cell topass the robots. From the speeds in Table 1,this time is at least100 ms.
3.1.4 Analytical Model for an Isolated Spherical Robot
The dependence of robot power on design parameters described above may appear contrary to simple intu-itions. First, one might expect that the 10-micron ringset,with ten times the surface area in contact with theplasma, would absorb about ten times as much oxygen as the 1-micron ring. Instead we find only about afactor of 2 to 4 increase. Second, the benefit of pumps, less than a factor of 2 for the high capacity robots, mayseem surprisingly small. Third, the low capacity robots, with 1/50th the reaction sites of the high capacityrobots, nevertheless generate about1/5th as much power as high capacity robots in the case with no pumps.And finally, in spite of the higher concentration near the robot surface than deep inside the robot when thereare no pumps, increasing the reaction site density by placing all the reaction sites near the robot surface giveslittle benefit. While the specific values of these designs depend on the geometry and environment used in ourmodel, these general features of small robots obtaining power through diffusion apply in other situations aswell.
In this section we illustrate how these consequences of design choices arise in the context of a scenario forwhich the diffusion equation has a simple analytic solution, thereby identifying key physical effects leadingto these behaviors. Specifically, we consider an isolated spherical robot of radiusa in a stationary fluid withoxygen concentrationC far from the sphere.
Such a sphere with a fully absorbing surface collects oxygenat a rate4πDO2aC [10]. This expression
illustrates a key property of diffusive capture: the rate depends not on the object’s surface area but on its size.This behavior, which also applies to other shapes [10], arises because while larger objects have greater surfaceareas they also encounter smaller concentration gradients. As a quantitative example, taking the sphere tohave the same volume as the robot, i.e.,(4/3)πa3 = Vrobot given in Table 3, the oxygen absorbed by thesphere generates320 and750 pW for C equal to the low and high inlet oxygen concentrations in the plasmafrom Table 1, respectively. These power values are larger than for robots on the vessel wall described above.Unlike the sphere in a stationary fluid, the aggregated robots compete with each other for the oxygen, thefluid moves some of the oxygen past the robots before they havea chance to absorb it, and the surroundingtissue also consumes some of the oxygen. The replenishment of oxygen from the passing blood cells is notsufficient to counterbalance these effects.
The spherical robot also indicates the benefit of pumps. The fully absorbing sphere, with a zero con-centration boundary condition at the surface, correspondsto using pumps. For robots without pumps, an
17

approximation to Eq. (5) allows a simple solution. Specifically, since the Michaelis-Menten constant for therobot power generators,K, is much larger than the oxygen concentrations (e.g., as seen in Fig. 2), robotpower generation from Eq. (5) is approximatelyProbot ≈ (eρreactr/K)CO2
. Dividing bye/6 gives the oxygenconsumption rate density asγCO2
whereγ = 6ρreactr/K. Solving the diffusion equation, Eq. (1), for a spherein a stationary fluid with concentrationC far from the sphere, with free diffusion through the sphere’s surfaceand reaction rate densityγCO2
inside the sphere, gives the rate oxygen is absorbed by the sphere (and hencereacted to produce power) as [41]4πDO2
C(a − µ tanh(a/µ)) whereµ =√
DO2/γ. Thus free diffusion
produces a fraction
fµ = 1 − µ
atanh
(
a
µ
)
(10)
of the power produced by the fully absorbing sphere. The distanceµ is roughly the average distance anoxygen molecule diffuses in the time a power generation siteconsumes an oxygen molecule. When a freelydiffusing molecule inside the robot has a high chance to diffuse out of the robot before it reacts (µ largecompared toa), fµ is small so pumps provide a significant increase in power. Conversely, whenµ is smallcompared toa, pumps provide little benefit: the large number of reaction sites ensure the robot consumesalmost all the diffusing oxygen reaching its surface.
This argument illustrates a tradeoff between using pumps tokeep oxygen within the robot and the numberof power generators. In particular, if internal reaction sites are easy to implement, then robots with manyreaction sites and no pumps would be a reasonable design choice. Conversely, if reaction sites are difficult toimplement while pumps are easy, then robots with pumps and few reaction sites would be a better choice.
A caveat for robots with few power generating sites is that Eq. (10) applies when oxygen consumptionis linear in the concentration, as given byγCO2
. This expression allows arbitrarily increasing the reactionrate by increasing the concentration, no matter how small the number of reaction sites. This linearity is agood approximation of Eq. (5) only whenCO2
≪ K. At larger concentrations the power density saturatesat eρreactr. Whenρreact is sufficiently small, this limit is below the power that could be produced from all theoxygen that a fully absorbing sphere collects. Thus, in practice, the benefit of using pumps estimated fromthe linear reaction rate,G = f−1
µ , is limited by this bound whenρreact is small.
As an example, for a spherical robot with the high capacity reaction site density of Table 3,γ = 1.8 ×10⁴/s andµ = 0.33 µm, with the fairly modest benefit of pumpsG = 2.0. The low capacity robots haveγ = 360/s andµ = 2.4 µm with G = 42. In this case, the limit due to the maximum reaction rate of Eq. (5)applies, somewhat limiting the benefit of pumps to a factor of34, but pumps still offer considerable benefit.These values for the benefits of pumps are somewhat larger than seen with our model for robots on the vesselwall. Nevertheless, the spherical example identifies the key physical properties influencing power generationwith and without pumps, and how they vary with robot design choices.
Eq. (10) also illustrates why power in the low capacity robots is not as small as one might expect basedon the reduction in reaction sites by a factor of 50. While thevalue ofγ is proportional toρreact, the typicaldiffusion distanceµ varies as1/
√ρreact, so a decrease in reaction sites by a factor of 50 only increasesµ by
about a factor of 7. The square root dependence arises from the fundamental property of diffusion: typicaldistance a diffusing particle travels grows only with the square root of the time. The modest change indiffusion distance, combined with Eq. (10), gives a smallerdecrease in power than the factor of 50 decreasein capacity. The low capacity robot has higher concentrations throughout the sphere, so each reaction siteoperates more rapidly than in the high capacity case. This increase partially offsets the decrease in the numberof reaction sites.
Without pumps, the higher oxygen concentration near the sphere’s surface than near its center meansmuch of the power generation takes place close to the surface. Thus we can expect an increase in power byplacing reaction sites close to the surface rather than uniformly distributed throughout the sphere. Consistentwith the results from the model described in Section 2, evaluating Eq. (1) with the reaction confined to aspherical shell shows only a modest benefit compared to a uniform distribution. The benefit is larger fora thinner shell and is determined by the same ratio,a/µ, appearing in Eq. (10). In particular, the largestbenefit of using a thin shell, only12%, occurs fora/µ ≈ 3.5. The parameters for the high and low capacityrobots are somewhat below this optimal value, giving only10% and less than1% benefit from a thin shell,respectively, for the sphere. These modest improvements correspond to the small benefits of using a thin shell
18

low demand
high demand
-30 -20 -10 0 10 20 300.0
0.1
0.2
0.3
0.4
0.5
0.6
distanceHΜmL
S-
S equ
ib
Figure 5: Deviation from equilibrium oxygen saturation in cells, S − Sequib, along the boundary betweenthe cell and cell-free portions of the fluid illustrated in Fig. 1, as a function of distance along that boundary.A deviation of zero indicates the oxygen held in the cells is in perfect equilibrium with the surroundingplasma. Saturation ranges between 0 and 1. The curves correspond to the low and high demand scenariosof Table 2, when robots are present (upper curves) or absent (lower curves). For the vessel without robotsand low demand,S − Sequib is indistinguishable from zero on the scale of the plot. The gray band indicatesthe 10-micron length of the vessel wall in which the robots are stationed, within the 60-micron length of thecapillary illustrated.
seen in the solution to our model for both high and low capacity robots. Hence the solution of Eq. (1) forthe sphere illustrates how, with a fixed number of reaction sites, concentrating them near the robot surfaceprovides only limited benefit. The benefit of the higher reaction site density in the shell is almost entirelyoffset by the shorter distance molecules need to diffuse to escape from the thin reactive region. That is, thebenefit of placing all the reaction sites in a thin shell arises from two competing effects. Whenµ is large (lowcapacity) the concentration is only slightly higher near the surface than well inside the sphere. So there islittle benefit from placing the reaction sites closer to the surface. On the other hand, whenµ is small (highcapacity), even uniformly distributed reaction sites manage to consume most of the arriving oxygen, givingnear-zero concentration at the surface of the sphere and little scope for further improvement by concentratingthe reaction sites. Thus the largest, though still modest, benefit for a shell design is for intermediate values ofa/µ.
3.2 Oxygen Replenishment from Passing Cells
The high power density of the robots creates a steep gradientof oxygen concentration in the plasma. Thus,unlike the minor role for nonequilibrium oxygen release in tissue [67], the small size of the robots makespassing red cells vary significantly from equilibrium with the concentration in the plasma. Fig. 5 illustratesthis behavior, using one measure of the amount of disequilibration: the difference between saturationS andthe equilibrium valueSequib corresponding to the local concentration of oxygen in the plasma, as given byEq. (2). We compare with a vessel without robots, in which theblood cells remain close to equilibrium.
Fig. 5 shows that the kinetics of oxygen release from red cells plays an important role in limiting theoxygen available to the robots. However, the region of significant disequilibration is fairly small, extendingonly a few microns from the robots.
19
low demand
high demand
-30 -20 -10 0 10 20 30
0.90
0.92
0.94
0.96
0.98
1.00
distanceHΜmL
rela
tive
pow
erde
nsity
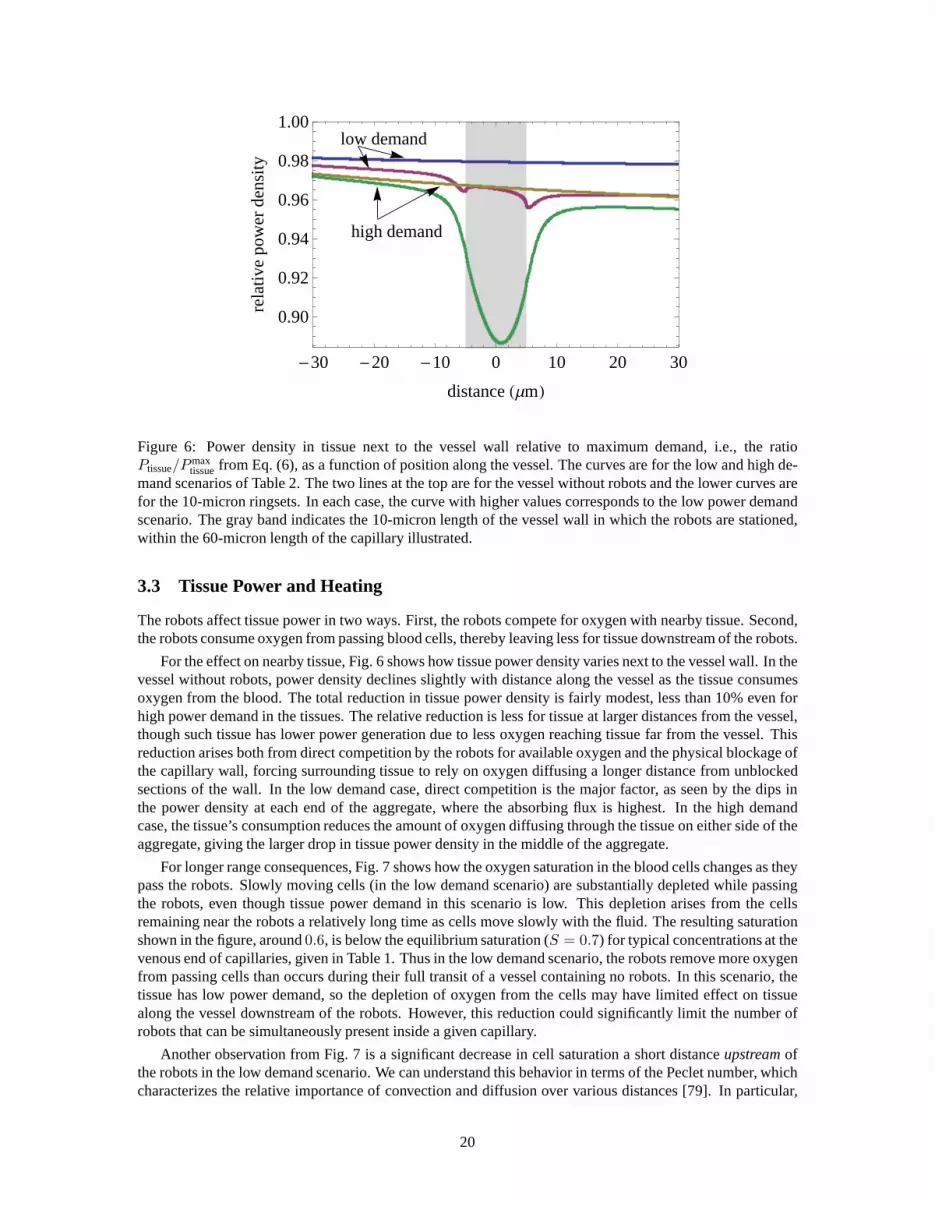
Figure 6: Power density in tissue next to the vessel wall relative to maximum demand, i.e., the ratioPtissue/P max
tissuefrom Eq. (6), as a function of position along the vessel. The curves are for the low and high de-mand scenarios of Table 2. The two lines at the top are for the vessel without robots and the lower curves arefor the 10-micron ringsets. In each case, the curve with higher values corresponds to the low power demandscenario. The gray band indicates the 10-micron length of the vessel wall in which the robots are stationed,within the 60-micron length of the capillary illustrated.
3.3 Tissue Power and Heating
The robots affect tissue power in two ways. First, the robotscompete for oxygen with nearby tissue. Second,the robots consume oxygen from passing blood cells, therebyleaving less for tissue downstream of the robots.
For the effect on nearby tissue, Fig. 6 shows how tissue powerdensity varies next to the vessel wall. In thevessel without robots, power density declines slightly with distance along the vessel as the tissue consumesoxygen from the blood. The total reduction in tissue power density is fairly modest, less than 10% even forhigh power demand in the tissues. The relative reduction is less for tissue at larger distances from the vessel,though such tissue has lower power generation due to less oxygen reaching tissue far from the vessel. Thisreduction arises both from direct competition by the robotsfor available oxygen and the physical blockage ofthe capillary wall, forcing surrounding tissue to rely on oxygen diffusing a longer distance from unblockedsections of the wall. In the low demand case, direct competition is the major factor, as seen by the dips inthe power density at each end of the aggregate, where the absorbing flux is highest. In the high demandcase, the tissue’s consumption reduces the amount of oxygendiffusing through the tissue on either side of theaggregate, giving the larger drop in tissue power density inthe middle of the aggregate.
For longer range consequences, Fig. 7 shows how the oxygen saturation in the blood cells changes as theypass the robots. Slowly moving cells (in the low demand scenario) are substantially depleted while passingthe robots, even though tissue power demand in this scenariois low. This depletion arises from the cellsremaining near the robots a relatively long time as cells move slowly with the fluid. The resulting saturationshown in the figure, around0.6, is below the equilibrium saturation (S = 0.7) for typical concentrations at thevenous end of capillaries, given in Table 1. Thus in the low demand scenario, the robots remove more oxygenfrom passing cells than occurs during their full transit of avessel containing no robots. In this scenario, thetissue has low power demand, so the depletion of oxygen from the cells may have limited effect on tissuealong the vessel downstream of the robots. However, this reduction could significantly limit the number ofrobots that can be simultaneously present inside a given capillary.
Another observation from Fig. 7 is a significant decrease in cell saturation a short distanceupstreamofthe robots in the low demand scenario. We can understand thisbehavior in terms of the Peclet number, whichcharacterizes the relative importance of convection and diffusion over various distances [79]. In particular,
20

low demand
high demand
-30 -20 -10 0 10 20 300.60
0.65
0.70
0.75
0.80
0.85
0.90
0.95
distanceHΜmL
cell
satu
ratio
n
Figure 7: Cell saturationS as a function of distance along the vessel. Saturation ranges between 0 and 1.The curves correspond to the low and high demand scenarios ofTable 2, with the upper curves of each paircorresponding to a vessel without robots. The gray band indicates the 10-micron length of the vessel wall inwhich the robots are stationed, within the 60-micron lengthof the capillary illustrated.
D/vavg is the distance at which diffusion and convection have aboutthe same effect on mass transport in amoving fluid. At significantly longer distances, convectionis the dominant effect and absorption of oxygen ata given location in the vessel has little effect on upstream concentrations over such distances. In our scenarios,D/vavg ranges from∼ 2 µm (high demand) to∼ 10 µm (low demand). Thus the oxygen concentration inthe plasma is significantly affected by the robots over a few tens of microns upstream of their location.Cell saturation remains close to equilibrium in this upstream region (Fig. 5), hence the reduced oxygenconcentration in the plasma lowers cell saturation in this region upstream of the robots (Fig. 7). This distanceis also relevant for spacing rings of robots far enough apartto achieve nearly uniform power, as described inSection 3.1.3.
The devices in this example have a volume ofVrobot ≈ 1 µm3 so the robot power generation corresponds topower densities around107 W/m3, several orders of magnitude larger than power densities intissue, raisingconcerns of possible significant tissue heating by the robots. However, for the isolated aggregate used in thisscenario, waste heat due to the robots’ power generation is rapidly removed, resulting in negligible maximumtemperature elevation of about10−4 ◦C.
3.4 Fluid Flow and Forces on the Robots
The robots change the fluid flow by constricting the vessel. With the same pressure difference as a vesselwithout robots, as used in our model, this constriction results in somewhat lower flow speed through thevessel. Specifically, the one and ten-micron long aggregates reduce flow speed by 6% and 20%, respectively.
The fluid moving past the robots exerts a force on them. To remain on the wall the robots must resistthis force through their attachment to the vessel wall [27].This force is a combination of pressure difference,between the upstream and downstream ends of the aggregate, and viscous drag. For the laminar flow theforcef is linear in the pressure gradient∇p imposed on the vessel:f = a∇p wherea = 1.56 × 10⁻¹⁵ m3
and5.02 × 10−16 m3 for the10 µm and1 µm ringsets, respectively. For example, the flow imposes a forceof 160 pN on the10 µm ringset when the pressure gradient is105 Pa/m. The10 µm ringset experiencesabout three times the force of the1 µm ring, but covers ten times the surface area. Thus the largeraggregaterequires about one-third the attachment force per robot. Applied forces can affect cells [22]. In particular,endothelial cells use forces as a trigger for new vessel growth [21], which is important for modeling changesin the vessels over longer time scales than we consider in this paper [82].
21

4 Discussion
The scenarios of this paper illustrate how various physicalproperties affect robot power generation. Robotsabout one micron in size positioned in rings on capillary walls could generate a few tens of picowatts insteady state from oxygen and glucose scavenged locally fromthe bloodstream. Aggregates can combine theiroxygen intake for tasks requiring higher sustained power generation. The resulting high power densities donot significantly heat the surrounding tissue, but do introduce steep gradients in oxygen concentration due tothe relatively slow reaction kinetics of oxygen release from red cells. The robots reduce oxygen concentrationin nearby tissues, but generally not enough to significantlyaffect tissue power generation.
The fraction of the generated power available for useful activity within the robot depends on the efficiencyof the glucose engine design, with∼ 50% a reasonable estimate for fuel cells [27]. The robots will have5–30 pW of usable steady-state power while on the vessel wall. As one indication of the usefulness of thispower for computation, current nanoscale electronics and sensors have an energy cost per logic operationor sensor switching event of a few hundredkBT [89]. While future technology should enable lower energyuse [27], even with500 kBT ≈ 2 × 10⁻¹⁸J the available power from circulating oxygen could supportseveral million computational operations per second. At the size of these robots, significant movements ofblood cells and chemical transport occur on millisecond time scales. Thus the power could support thousandsof computational operations, e.g., for chemical pattern recognition, in this time frame. The aggregated robotscould share sensor information and CPU cycles, thereby increasing this capability by a factor of tens tohundreds.
The robots need not generate power as fast as they receive oxygen, but could instead store oxygen re-ceived over time to enable bursts of activity as they detect events of interest. Robots with pumps have asignificant advantage in burst-power applications becausepumps enable long-term high-concentration on-board gas accumulation to support brief periods of near maximal power generation. As an example, in ourscenarios individual robots with pumps receive about108 molecule/s. If instead of using this oxygen forimmediate power generation, the robot stored the oxygen received over one second, it would have enough torun the power generators at near maximal rate (giving about104 pW) for several milliseconds. By contrast,robots without pumps would only have a modest benefit from oxygen diffusing into the robot, achieving aconcentration equal to the ambient concentration in the surrounding plasma as given in Table 1. This con-centration could only support generating several hundred picowatts for about a tenth of a millisecond. Thuswhile pumps may give only modest improvement for steady-state power generation, they can significantlyincrease power available in short bursts.
Our model could be extended to estimate the amount of onboardstorage that would be required to avoidpathological conditions related to O2 competition between tissues and nanorobots. In particular, larger ag-gregates would deplete oxygen over longer distances for which diffusion through the tissue from upstreamof the robots would be insufficient. Furthermore, larger aggregates of tightly-spaced robots would blocktransport from the capillary into the surrounding tissue even if the robots did not use much oxygen. Onboardoxygen storage would allow higher transient power densities for the robots, though this could lead to heatingissues for larger aggregates. To estimate the potential foronboard storage, a ringset containing 200 robotswith volume200Vrobot ≈ 220 µm3 of which 10% is devoted to compressed O2 storage at 1000 atmospheresat body temperature can store about5 × 1011 molecules of O2 in the aggregate. The incoming flow in thecapillary provides about0.2–1 × 10¹¹ molecules per second, depending on the flow speed, of which about1/4 to 1/2 is available to the tissue and robots. This means the oxygen stored in the aggregate is equivalentto only several seconds of oxygen delivery through the vessel. Thus oxygen storage in the robots themselvescan not significantly increase mission duration, though such storage might be useful for short-term (i.e., afew seconds) load leveling functions (e.g., maintaining function during temporary capillary blockage due towhite cell passage).
Alternatively, the aggregated robots could have oxygen supplemented with a modest circulating popu-lation of respirocytes [26], i.e.,1 µm spherical robots able to carry oxygen to tissues far more effectivelythan red blood cells. Such robots would continuously and entirely eliminate any oxygen depletion regionsin the tissue due to robot power generation, and allow higherrobot power generation since oxygen wouldno longer be such a limiting factor. Such machines could not only carry significantly more oxygen than redblood cells, but would also respond more quickly to abrupt decreases in partial pressure due to consumption
22

by aggregated robots on vessel walls. For example, sensors should be able to detect the drop in concentrationof the size we see near the robots – e.g.,(3 to 2) × 1022 molecule/m3 (or about40 − 20 mmHg) – within amillisecond [27]. This time is short enough that the machines will have moved only about a micron and sowill still be near the robots. Once they detect the pressure drop, the machines could release oxygen rapidly,up to1.5 × 108 molecule/s [26], while passing near the aggregated robots. However, in practice the releaserate is constrained by the effervescence limit in plasma to about2.5 × 107 molecule/s [27]. An interestingquestion for future work is evaluating how much of this released oxygen reaches the robots on the vesselwall, which will depend on how close to the vessel wall the fluid places the respirocytes. In this situation,aggregated robots could also communicate [27] to passing respirocytes to activate or suppress their oxygendelivery, depending on the task at hand. Thus both the oxygenhandling capabilities of respirocytes, givingfaster kinetics than red cells and larger storage capacity,and the possibility of communication provide ex-amples of the flexibility of small devices with programmablecontrol. Moreover, this scenario illustrates thebenefits of mixing robots with differing hardware capabilities.
Our model considers static aggregates on vessel walls, but could be extended to study power availabilityfor aggregates that move along the walls [25]. Another significant scenario is robots moving passively withthe fluid, where they could draw oxygen from the surrounding plasma. The oxygen unloading model usedhere could evaluate how rapidly nearby cells would replenish oxygen in the plasma as the cells and robotsmove through the capillary.
We treat environmental parameters (e.g., fluid flow speed andtissue oxygen demand) as fixed by thesurroundings. Beyond the local changes in the robots’ environment described by the model, sustained useof these robots could induce larger scale responses. For example, the increased use of oxygen by the robotscould lead to increased blood flow, as occurs with, say, exercising muscles, by increased pressure to drivethe fluid at higher speed or dilation of the vessels. The localoxygen deficits due to high robot power useare smaller in scale than higher tissue demand (e.g., from increased activity in a muscle). Thus an importantopen question is whether localized robot oxygen consumption over a long period of time can initiate a lesslocalized response to increase flow in the vessels.
The possibility of large-scale responses to robot activityraises a broader issue for nanomedicine treatmentdesign when technology allows altering the normal correlation among physical quantities used for signallingin the body [27, 30]. An example at larger scales is the response to low oxygen mediated by excess carbondioxide in the blood, which can lead to edema and other difficulties for people at high altitudes [72]. Interms of downstream consequences of the robots’ oxygen use,low saturation of cells leaving an isolatedcapillary should not be a problem because the bulk of oxygen exchange occurs in the capillary bed, notin the larger collecting vessels. However, cells reaching low saturation before exiting the capillary wouldproduce localized anoxia in the tissue near the end of the capillary. This could be relieved in part by oxygendiffusion from neighboring tissue cells if the anoxic region is not too large or too severe. Specific effectsof such localized anoxia remain to be fully identified. Wholecapillaries subjected to ischemic conditionsover a period of days remodel themselves, e.g., by adding newvascular branches and by increasing thetortuosity of existing vessels [5]. This observed behavioris likely to be a localized (i.e., cell-level) response,hence we might expect such a response if a portion of a capillary downstream of the robots was driveninto ischemic conditions. There could also be a localized inflammatory response to a large enough numberof capillary-wall endothelial cells under stress, especially for cells stressed to the point of apoptosis, butmoderate ischemia alone seems unlikely to generate this response [15]. Various chemicals (e.g., adrenalin)make the heart pump faster and thus drive the blood at higher speed. Other chemicals (such as NO, PGD2and LTD4) dilate the vessels. These chemicals can produce significant activity in the endothelial cells thatline (and thus form the tube geometry of) the capillary vessel, so their influence can be fairly direct andquick [78, 74]. Similarly, a large robot population constantly drawing excess oxygen supply could induceelevated erythropoietin secretion (if unregulated by the robots), increasing red cell production in the erythroidmarrow [26, 23].
Direct heating is not a problem with aggregates of the size considered here, in spite of their high powerdensity compared to tissue. For the large aggregate we examined (tightly covering10 µm along the vesselwall), oxygen diffusion through the tissue from regions upstream and downstream of the robots providedoxygen to the tissue outside the section of the vessel blocked by the robots. Larger aggregates, especiallyif tightly packed, would significantly reduce oxygen in the tissues even if the robots used little power them-
23

selves, simply due to their covering the vessel wall over a long enough distance that diffusion through thetissue from unblocked regions is no longer effective. The inducement of nonlinear tissue thermal responses(e.g., inflammation or fever) due to the heat generated by larger aggregates or multiple aggregates in nearbycapillaries is an important question for future work.
Nanorobots parked or crawling along the luminal surface of the vessel may activate mechanosensoryresponses from the endothelial cells across whose surfacesthe nanorobots touch [29]. If the aggregates covera long section of the vessel wall, they could produce local edemas since narrowing of the vessels by thepresence of the nanorobots increases local pressure gradients and fluid velocities. While we focus on a singleaggregate in one microscopic vessel, additional issues arise if a large population of circulating robots formmany aggregates. In that case, the multiple aggregates willincrease hydrodynamic resistance throughout thefluidic circuit. Thus the robots could make the heart work slightly harder to pump fluid against the slightlyhigher load. Moreover, if robot aggregates detach from the wall without complete disaggregation, thesesmaller aggregates moving in the blood may be large enough toblock a small vessel.
The scenarios examined in this paper can suggest suitable controls to distribute power when robots ag-gregate. Moreover, power control decisions interact with the choices made for the aggregation process. Forexample, if the task requires a certain amount of total powerfor the aggregate (e.g., as a computation hub)then the aggregation self-assembly protocol would depend on how much oxygen is available, e.g., to makea larger aggregate in vessels with less available oxygen, orrecruit more passing robots when the task needsmore power. An example of this latter case could be if aggregates are used as computation hubs to validateresponses to rare events: when local sensor readings indicate the possibility of such an event, the aggregatecould temporarily recruit additional robots to increase power and computational capability for evaluatingwhether those readings warrant initiating treatment.
Another approach to designing controls for teams of robots is the formalism of partially observableMarkov processes [16, 75]. This formalism allows for arbitrarily complex computations among the robotsto update their beliefs about their environment and other robots. Unfortunately this generality leads to in-tractable computations for determining optimal control processes. For the situations we studied, the powerconstraints on capillary wall-resident microscopic robots operating with oxygen availablein vivo means thelocal rules must be simple. Including this constraint in theformalism could allow it to identify feasible controlchoices for large aggregates of microscopic robots in thesesituations.
The power constraints from our model could provide useful parameters for less detailed models of thebehavior of large numbers of robots in the circulation in thecontext of the scenarios examined in this pa-per. In particular, power limits the computation, communication and locomotion capabilities of the robots.These constraints could be incorporated in simplified models, such as cellular automata approaches to robotbehavior. These automata are a set of simple machines, typically arranged on a regular lattice. Each ma-chine is capable of communicating with its neighbors on the lattice and updates its internal state based ona simple rule. For example, a two-dimensional scenario shows how robots could assemble structures [4]using local rules. Such models can help understand structures formed at various scales through simple localrules and some random motions [91, 35]. A related analysis technique considers swarms [13], i.e., groups ofmany simple machines or biological organisms such as ants. In these systems, individuals use simple rulesto determine their behavior from information about a limited portion of their environment and neighboringindividuals. Typically, individuals in swarms are not constrained to have a fixed set of neighbors but insteadcontinually change their neighbors as they move. Swarm models are well-suited to microscopic robots withtheir limited physical and computational capabilities andlarge numbers. Most swarm studies focus on macro-scopic robots or behaviors in abstract spaces [33]. In spiteof the simplified physics, these studies show howlocal interactions among robots lead to various collectivebehaviors [85] and provide broad design guidelines.A step toward more realistic, though still tractable, models of large aggregates could incorporate the powerconstraints from the model presented in this paper.
In addition to evaluating performance of hypothetical medical nanorobots, theoretical studies identifyingtradeoffs between control complexity and hardware capabilities can aid future fabrication. One example isthe design complexity of the robot’s fuel acquisition and utilization systems. For steady-state operation onvessel walls, we found limited benefit of pumps over free diffusion when numerous onboard power gener-ators can be employed. In such cases, our results indicate that a design without pumps does not sacrificemuch performance. More generally, control can compensate for limited hardware (e.g., sensor errors or
24
power limitations), providing design freedom to simplify the hardware through additional control programs.Thus the studies could help determine minimum hardware performance capabilities needed to provide robustsystems-level behavior.
A key challenge for robot design studies based on approximate models is validating the results. In ourcase, the most significant approximations are the treatmentof cells as an averaged component in the fluid andthe lumped-model kinetics for oxygen unloading. With increased computational power, numerical solution ofmore accurate models could test the validity of these approximations. As technology advances to constructingearly versions of microscopic robots, experimental evaluations will supplement theoretical studies. Onesuch experiment is operating the robots in manufactured microfluidic channels [79]. This would test therobots’ ability to aggregate at chemically defined locations and generate power reliably from known chemicalconcentrations in the fluid. After suchin vitro experiments, earlyin vivo tests could involve robots acting aspassive sensors in the circulatory system and aggregating at chemically distinctive locations. Such nanorobotswill be useful not only as diagnostic tools and sophisticated extensions to drug delivery capabilities [3], butalso as an aid to develop robot designs and control methods for more active tasks.
Acknowledgements
RAF acknowledges private grant support for this work from the Life Extension Foundation and the Institute for MolecularManufacturing.
References
[1] Comsol multiphysics. comsol.com, 2008.
[2] Ann Ager. Inflammation: Border crossings.Nature, 421:703–705, 2003.
[3] Thresa M. Allen and Pieter R. Cullis. Drug delivery systems: Entering the mainstream.Science, 303:1818–1822,2004.
[4] Daniel Arbuckle and Aristides A. G. Requicha. Active self-assembly. InProc. of the IEEE Intl. Conf. on Roboticsand Automation, pages 896–901, 2004.
[5] A. M. Bailey, T. J. O’Neill 4th, C. E. Morris, and S. M. Peirce. Arteriolar remodeling following ischemic injuryextends from capillary to large arteriole in the microcirculation. Microcirculation, 15:389–404, 2008.
[6] Jie Bao, Keiji Furumoto, Kimitoshi Fukunaga, and Katsumi Nakao. A kinetic study on air oxidation of glucosecatalyzed by immobilized glucose oxidase for production ofcalcium gluconate.Biochemical Engineering Journal,8:91–102, 2001.
[7] Amelia Barreiro et al. Subnanometer motion of cargos driven by thermal gradients along carbon nanotubes.Science,320:775–778, 2008.
[8] Denise Bechet et al. Nanoparticles as vehicles for delivery of photodynamic therapy agents.Trends in Biotechnol-ogy, 26:612–621, 2008.
[9] Yaakov Benenson, Binyamin Gil, Uri Ben-Dor, Rivka Adar,and Ehud Shapiro. An autonomous molecular computerfor logical control of gene expression.Nature, 429:423–429, 2004.
[10] Howard C. Berg.Random Walks in Biology. Princeton Univ. Press, 2nd edition, 1993.
[11] Howard C. Berg and Edward M. Purcell. Physics of chemoreception.Biophysical Journal, 20:193–219, 1977.
[12] Jose Berna et al. Macroscopic transport by synthetic molecular machines.Nature Materials, 4:704–710, 2005.
[13] Eric Bonabeau, Marco Dorigo, and Guy Theraulaz.Swarm Intelligence: From Natural to Artificial Systems. OxfordUniversity Press, Oxford, 1999.
[14] George E. Briggs and John B. S. Haldane. A note on the kinetics of enzyme action.Biochemical Journal, 19:338–339, 1925.
[15] M. D. Brown, J. Kent, C. J. Kelsall, M. Milkiewicz, and O.Hudlicka. Remodeling in the microcirculation of ratskeletal muscle during chronic ischemia.Microcirculation, 10:179–191, 2003.
[16] Anthony R. Cassandra, Leslie Pack Kaelbling, and Michael L. Littman. Acting optimally in partially observablestochastic domains. InProc. of the 12th Natl. Conf. on Artificial Intelligence (AAAI94), pages 1023–1028, MenloPark, CA, 1994. AAAI Press.
25

[17] Swades K. Chaudhuri and Derek R. Lovley. Electricity generation by direct oxidation of glucose in mediatorlessmicrobial fuel cells.Nature Biotechnology, 21:1229–1232, 2003.
[18] Alfred Clark, Jr. et al. Oxygen delivery from red cells.Biophysical Journal, 47:171–181, 1985.
[19] C. P. Collier et al. Electronically configurable molecular-based logic gates.Science, 285:391–394, 1999.
[20] H. G. Craighead. Nanoelectromechanical systems.Science, 290:1532–1535, 2000.
[21] Christophe F. Deroanne, Charles M. Lapiere, and Betty V. Nusgens. In vitro tubulogenesis of endothelial cells byrelaxation of the coupling extracellular matrix-cytoskeleton.Cardiovascular Research, 49:647–658, 2001.
[22] Dennis E. Discher, Paul Janmey, and Yu-li Wang. Tissue cells feel and respond to the stiffnes of their substrate.Science, 310:1139–1143, 2005.
[23] A. J. Erslev and E. Beutler. Production and destructionof erythrocytes. In E. Beutler et al., editors,WilliamsHematology, pages 425–441. McGraw-Hill, NY, 5th edition, 1995.
[24] Alexander L. Fetter and John Dirk Walecka.Theoretical Mechanics of Particles and Continua. McGraw-Hill, NY,1980.
[25] Robert A. Freitas Jr. The end of heart disease. Technical report, Institute for Molecular Manufacturing, Palo Alto,CA, 1996.
[26] Robert A. Freitas Jr. Exploratory design in medical nanotechnology: A mechanical artificial red cell.ArtificialCells, Blood Substitutes and Immobilization Biotechnology, 26:411–430, 1998.
[27] Robert A. Freitas Jr.Nanomedicine, volume I: Basic Capabilities. Landes Bioscience, Georgetown, TX, 1999.Available at www.nanomedicine.com/NMI.htm.
[28] Robert A. Freitas Jr. Clottocytes: Artificial mechanical platelets. Technical Report 18: Nanomedicine, Institute forMolecular Manufacturing, Palo Alto, CA, 2000.
[29] Robert A. Freitas Jr.Nanomedicine, volume IIA: Biocompatibility. Landes Bioscience, Georgetown, TX, 2003.Available at www.nanomedicine.com/NMIIA.htm.
[30] Robert A. Freitas Jr. Pharmacytes: An ideal vehicle fortargeted drug delivery.Journal of Nanoscience and Nan-otechnology, 6:2769–2775, 2006.
[31] J. Fritz et al. Translating biomolecular recognition into nanomechanics.Science, 288:316–318, 2000.
[32] Y. C. Fung.Biomechanics: Circulation. Springer, NY, 2nd edition, 1997.
[33] V. Gazi and K. M. Passino. Stability analysis of social foraging swarms. IEEE Trans. on Systems, Man andCybernetics, B34:539–557, 2004.
[34] Cornelia Geers and Gerolf Gros. Carbon dioxide transport and carbonic anhydrase in blood and muscle.Physio-logical Reviews, 80:681–715, 2000.
[35] Saul Griffith, Dan Goldwater, and Joseph M. Jacobson. Robotics: Self-replication from random parts.Nature,437:636, 2005.
[36] J. Halloy et al. Social integration of robots into groups of cockroaches to control self-organized choices.Science,318:1155–1158, 2007.
[37] Heiko Hamann, Heinz Worn, Karl Crailsheim, and Thomas Schmickl. Spatial macroscopic models of a bio-inspiredrobotic swarm algorithm. InProc. of Intl. Conf. on Intelligent Robots and Systems (IROS2008). INRIA, 2008.
[38] Juan P. Hernandez-Ortiz, Christopher G. Stoltz, and Michael D. Graham. Transport and collective dynamics insuspensions of confined swimming particles.Physical Review Letters, 95:204501, 2005.
[39] Ciaran Hill, Antonio Amodeo, Jean V. Joseph, and Hitendra R. H. Patel. Nano- and microrobotics: how far is thereality? Expert Review of Anticancer Therapy, 8:1891–1897, 2008.
[40] Tad Hogg. Coordinating microscopic robots in viscous fluids. Autonomous Agents and Multi-Agent Systems,14(3):271–305, 2007.
[41] Tad Hogg. Diffusion to a spherical reactor. The WolframDemonstrations Project, February 2009.http://demonstrations.wolfram.com/DiffusionToASphericalReactor/.
[42] Tad Hogg. Modeling microscopic chemical sensors in capillaries. The Open Nanomedicine Journal, 2:1–9, 2009.
[43] Tad Hogg and Bernardo A. Huberman. Dynamics of large autonomous computational systems. In Kagan Tumerand David Wolpert, editors,Collectives and the Design of Complex Systems, pages 295–315. Springer, New York,2004.
26

[44] Tad Hogg and Philip J. Kuekes. Mobile microscopic sensors for high-resolution in vivo diagnostics.Nanomedicine:Nanotechnology, Biology, and Medicine, 2:239–247, 2006.
[45] Tad Hogg and David W. Sretavan. Controlling tiny multi-scale robots for nerve repair. InProc. of the 20th Natl.Conf. on Artificial Intelligence (AAAI2005), pages 1286–1291. AAAI Press, 2005.
[46] Joe Howard. Molecular motors: Structural adaptationsto cellular functions.Nature, 389:561–567, 1997.
[47] George Karniadakis, Ali Beskok, and Narayan Aluru.Microflows and Nanoflows: Fundamentals and Simulation.Springer, Berlin, 2005.
[48] Kenneth H. Keller. Effect of fluid shear on mass transport in flowing blood. InProc. of Federation of AmericanSocieties for Experimental Biology, pages 1591–1599, Sept.-Oct. 1971.
[49] Balazs L. Keszler, Istvan J. Majoros, and James R. BakerJr. Molecular engineering in nanotechnology: Structureand composition of multifunctional devices for medical application. InProc. of the Ninth Foresight Conference onMolecular Nanotechnology, 2001.
[50] August Krogh. The number and distribution of capillaries in muscles with calculations of the oxygen pressure headnecessary for supplying the tissue.J. of Physiology, 52:409–415, 1919.
[51] S. K. Kufer et al. Single-molecule cut-and-paste surface assembly.Science, 319:594–596, 2008.
[52] Scott P. Leary, Charles Y. Liu, and Michael L. J. Apuzzo.Toward the emergence of nanoneurosurgery: Partiii-nanomedicine: Targeted nanotherapy, nanosurgery, and progress toward the realization of nanoneurosurgery.Neurosurgery, 58:1009–1026, 2006.
[53] Kristina Lerman, Aram Galstyan, Alcherio Martinoli, and Auke Jan Ijspeert. A macroscopic analytical model ofcollaboration in distributed robotic systems.Artificial Life, 7:375–393, 2001.
[54] Rodolfo R. Llinas et al. Neuro-vascular central nervous recording/stimulating system: Using nanotechnologyprobes.J. of Nanoparticle Research, 7:111–127, 2005.
[55] Bruce E. Logan et al. Electricity generation from cysteine in a microbial fuel cell.Water Research, 39:942–952,2005.
[56] Moustafa Malki, Antonio L. De Lacey, Nuria Rodrı́guez,Ricardo Amils, and Victor M. Fernandez. Preferentialuse of an anode as an electron acceptor by an acidophilic bacterium in the presence of oxygen.Applied andEnvironmental Microbiology, 74:4472–4476, 2008.
[57] Thomas E. Mallouk and Ayusman Sen. Powering nanorobots. Scientific American, 300(5):72–77, May 2009.
[58] James H. Marden and Lee R. Allen. Molecules, muscles, and machines: Universal performance characteristics ofmotors.Proceedings of the National Academy of Science USA, 99:4161–4166, 2002.
[59] Sylvain Martel. The coming invasion of the medical nanorobots.Nanotechnology Perceptions, 3:165–173, 2007.
[60] Sylvain Martel et al. Flagellated bacterial nanorobots for medical interventions in the human body. InProc. of 2ndIEEE Conf. on Biomedical Robotics and Biomechatronics, pages 264–269, 2008.
[61] Benjamin Mauroy. Following red blood cells in a pulmonary capillary. ESAIM Proceedings, 23:48–65, 2008.
[62] B. J. McGuire and T. W. Secomb. A theoretical model for oxygen transport in skeletal muscle under conditions ofhigh oxygen demand.Journal of Applied Physiology, 91:2255–2265, 2001.
[63] Don Monroe. Micromedicine to the rescue.Communications of the ACM, 52:13–15, June 2009.
[64] Carlo Montemagno and George Bachand. Constructing nanomechanical devices powered by biomolecular motors.Nanotechnology, 10:225–231, 1999.
[65] Kelly Morris. Macrodoctor, come meet the nanodoctors.The Lancet, 357:778, March 10 2001.
[66] NIH. National Institutes of Health roadmap: Nanomedicine, 2003. Available atnihroadmap.nih.gov/nanomedicine/index.asp.
[67] Aleksander S. Popel. Theory of oxygen transport to tissue. Critical Reviews in Biomedical Engineering, 17:257–321, 1989.
[68] Rachela Popovtzer et al. Targeted gold nanoparticles enable molecular CT imaging of cancer.Nano Letters, 8:4593–4596, 2008.
[69] C. Pozrikidis. Axisymmetric motion of a file of red bloodcells through capillaries.Physics of Fluids, 17:031503,2005.
[70] E. M. Purcell. Life at low Reynolds number.American Journal of Physics, 45:3–11, 1977.
27

[71] Ingmar H. Riedel et al. A self-organized vortex array ofhydrodynamically entrained sperm cells.Science, 309:300–303, 2005.
[72] Robert B. Schoene. Illnesses at high altitude.Chest, 134:402–416, 2008.
[73] T. W. Secomb, R. Hsu, and A. R. Pries. Motion of red blood cells in a capillary with an endothelial surface layer:effect of flow velocity.American J. of Physiology: Heart and Circulatory Physiology, 281:H629–H636, 2001.
[74] K. Sekar. Inhaled nitric oxide in term and preterm infants. J. of Perinatology, 26(1):S4–7, discussion S22–23, May2006.
[75] Sven Seuken and Shlomo Zilberstein. Formal models and algorithms for decentralized decision making underuncertainty.Autonomous Agents and Multi-Agent Systems, 17:190–250, 2008.
[76] Frederick H. Silver.Biological Materials: Structure, Mechanical Properties,and Modeling of Soft Tissues. NewYork Univ. Press, NY, 1987.
[77] Ricky K. Soong et al. Powering an inorganic nanodevice with a biomolecular motor.Science, 290:1555–1558,2000.
[78] N. A. Soter et al. Local effects of synthetic leukotrienes (LTC4, LTD4, LTE4, and LTB4) in human skin.J. ofInvestigative Dermatology, 80:115–119, 1983.
[79] Todd M. Squires and Stephen R. Quake. Microfluidics: Fluid physics at the nanoliter scale.Reviews of ModernPhysics, 77:977–1026, 2005.
[80] D. Sretavan, W. Chang, C. Keller, and M. Kliot. Microscale surgery on axons for nerve injury treatment.Neuro-surgery, 57(4):635–646, 2005.
[81] W. G. Strang and G. J. Fix.An Analysis of the Finite Element Method. Prentice-Hall, Englewood Cliffs, 1973.
[82] Dominik Szczerba, Gabor Szekely, and Haymo Kurz. A multiphysics model of capillary growth and remodeling.In V. N. Alexandrov et al., editors,Proc. of ICCS, Part II, pages 86–93, Berlin, 2006. Springer.
[83] Robert Tucker, Parag Katira, and Henry Hess. Herding nanotransporters: Localized activation via release andsequestration of control molecules.Nano Letters, 8:221–226, 2008.
[84] A. Vadapalli, D. Goldman, and A. S. Popel. Calculationsof oxygen transport by red blood cells and hemoglobinsolutions in capillaries.Artificial Cells, Blood Substitutes and Immobilization Biotechnology, 30:157–188, 2002.
[85] Tamas Vicsek et al. Novel type of phase transition in a system of self-driven particles.Physical Review Letters,75:1226–1229, 1995.
[86] Tuan Vo-Dinh, Paul Kasili, and Musundi Wabuyele. Nanoprobes and nanobiosensors for monitoring and imagingindividual living cells.Nanomedicine: Nanotechnology, Biology, and Medicine, 2:22–30, 2006.
[87] Steven Vogel.Life in Moving Fluids. Princeton Univ. Press, 2nd edition, 1994.
[88] Tania Q. Vu et al. Activation of membrane receptors by a neurotransmitter conjugate designed for surface attach-ment.Biomaterials, 26:1895–1903, 2005.
[89] S.-Y. Wang and R. Stanley Williams, editors.Nanoelectronics, volume 80, New York, March 2005. Springer.Special issue ofApplied Physics A.
[90] Xudong Wang et al. Direct-current nanogenerator driven by ultrasonic waves.Science, 316:102–105, 2007.
[91] George M. Whitesides and Bartosz Grzybowski. Self-assembly at all scales.Science, 295:2418–2421, 2002.
[92] Maung Nyan Win and Christina D. Smolke. Higher-order cellular information processing with synthetic RNAdevices.Science, 322:456–460, 2008.
28


