Embed Size (px)
Citation preview

The Pakistan Development Review 45 : 3 (Autumn 2006) pp. 439–459
Does Inequality Matter for Poverty Reduction? Evidence from Pakistan’s Poverty Trends
HAROON JAMAL*
The paper explores the linkages between poverty, growth and inequality in the context of Pakistan. Time series macro data are used for the period 1979 to 2002. Consistent poverty and inequality measures are interpolated to facilitate the estimation of poverty elasticity with respect to growth and inequality in a multivariate regression framework. The paper also attempts to find out macroeconomic and structural correlates of inequality. The empirical findings—high poverty elasticity with respect to inequality measures—confirm the importance of inequality in poverty reducing effort. Inflation, sectoral wage gap, and terms of trade in favour of manufacturing exacerbate inequality, while progressive taxation, investment and development expenditure on social services play a significant role in reducing inequality. The results also indicate a positive correlation between per capita GDP and income inequality.
JEL classification: D31, D63, I32 Keywords: Pakistan, Poverty Trend, Income Distribution, Poverty Elasticity with
respect to Growth and Inequality
1. INTRODUCTION
Inequality has been brought out of the cold and now has re-entered the mainstream development policy agenda in many developing countries. This is the consequence of a deep-rooted disillusionment with the development paradigm which placed exclusive emphasis on the pursuit of growth. Growth-optimists believe in “trickle-down”1, i.e. the notion that growth in average incomes automatically sinks down to and benefit the poor. However, the premise of ‘trickle-down’ that higher investment would alleviate poverty through higher employment and real wages did not work. In many situations the pro-growth development agenda was accompanied by rising inequality.
During the 1990s, the proliferation of quality data on income distribution from a number of countries has allowed rigorous empirical testing of standing debates on the relative importance of growth and redistribution in poverty reduction. While the debate is still inconclusive, the majority of development economists emphasised, based on empirical cross-country data, that an unequal income distribution is a serious impediment to effective poverty alleviation [Ravallion (1997)]. Many researchers suggested that growth is, in practice the main tool for fighting poverty. However, they also reiterated that the imperative of growth for combating poverty should not be misinterpreted to mean
Haroon Jamal <[email protected]> is Principal Economist, Social Policy and Development Centre, Karachi.
Author’s Note: The views expressed in this paper are those of the author and do not necessarily represent those of the Social Policy and Development Centre (SPDC).
1Trickle-down was the dominant development thinking in the 1950s through 1980s. It implies a vertical flow from the rich to the poor that happens on its own accord. The benefits of the economic growth go to the rich first, and then in the second round the poor begin to benefit when the rich start spending their gains. Thus, the poor benefit from economic growth only indirectly through a vertical flow from the rich. It implies that the proportional benefits of growth going to the poor will always be less.

Haroon Jamal 440
that “growth is all that matters”. Growth is a necessary condition for poverty alleviation, no doubt, but inequality also matters and should also be on the development agenda.
The purpose of this paper is to supplement the debate by providing empirical evidence from Pakistan’s poverty trends. The paper estimates the poverty elasticity with respect to growth and inequality. It also explores the macroeconomic and structural proximate determinants of inequality. Section 2 presents a short review of research conducted during last two decades on poverty, inequality and growth. However, the focus of this section is to highlight the links of inequality with growth and poverty. Previous attempts to model poverty trends in Pakistan are summarised in Section 3. The methodology used for this research is also furnished in this section. Traditionally, Household Income and Expenditure Surveys (HIES) are used to compute poverty and inequality in Pakistan. Comparable poverty figures (headcount) are available upto 1992-93 based on consistent methodology. Using the same methodology, this consistent series is updated upto 2001-02. Household surveys are not conducted regularly; therefore to fill the gap interpolation is necessary. The estimated and interpolated series of headcount and Gini coefficients are provided in Section 4. Empirical findings are presented in Section 5, while the last section gives concluding remarks.
2. RELEVANCE OF INEQUALITY FOR GROWTH AND POVERTY REDUCTION
Income inequality2 and poverty affect each other directly and indirectly through their link with economic growth. These interact with one another through a set of two-way links (see Figure 1). Some of these links can be explored separately, but often one influences another causing indirect effects. For instance inequality can indirectly influence poverty as inequality affects growth and growth in turn influences poverty.
Small changes in income distribution can have a large effect on poverty. A simple arithmetic example can help visualize this. Imagine that the share of national income that goes to the poorest 20 percent of the population of Pakistan increases from 7 percent to 7.25 percent. A change in income distribution of one quarter of one percent would barely affect the Gini coefficient, but for the poor this represents about 4 percent increase in their total income. Such a small redistribution would have the same effect on poverty as doubling the annual growth (distribution neutral) of national income from 4 percent to 8 percent.
Fig. 1. Relationship between Inequality, Poverty and Growth
Source: Reproduced from Naschold (2002).
2Knowledge about the links between non-income inequality and poverty remains very limited. The studies that do exist generally focus on the effect of non-income inequality on income rather than other dimensions of poverty and suggests that income inequality also acts as a proxy for asset inequality.

Inequality Matter for Poverty Reduction 441
Cross-country studies have argued that, on average, within country inequality is stable over time, or changes too slowly to make a significant difference in poverty reduction [Deininger and Squire (1998)]. Recent country and regional studies have looked beyond the ‘average’ and refuted the initial cross-country evidence. Large distributional changes can occur even over relatively short periods of time—for example, in sub-Saharan African; in Latin America where income distribution improved during the expansion in the 1970s and deteriorated during the recession of the 1980s; in China; and, in the transition economies of Eastern Europe and Central Asia over the 1990s. While the rapid increase in inequality in the latter region is a special case, it very much confirms the importance of distribution changes for poverty reduction. Gini coefficients for the majority of these countries increased by between 5 and 20 percentage points, in some by even more than that, greatly exacerbating the effects of negative growth on poverty [Kanbur and Lustig (1999)]. Policies and growth patterns that improve distribution are, therefore, a potentially significant additional tool in the fight against poverty. Past changes in distribution occurred without active policy intervention, as the focus of development policy and research was on growth, rather than distribution issues. If, in future, development policy makes inequality an explicit target, it will greatly enhance the poverty reducing effect of growth. Of course the big question is how best to improve the distribution of income?
In addition to its direct effect on poverty, inequality also affects poverty indirectly through its impact on growth. A resurgence of work on inequality in the 1990s has reconfirmed the classical view that distribution is not only a final outcome, but also a determinant of economic growth. Initial cross-country studies, including Birdsall, et al. (1995), found that greater initial income inequality actually reduces future growth even after controlling for initial levels of GDP and human capital. The robustness of these findings has been the subject of much debate,3 however recent analysis using an updated and more comparable inequality data reconfirms the negative effects of inequality on growth [Knowles (2001)]. Low inequality can, therefore, benefit the poor in two ways: by increasing overall growth and average incomes, and by letting them share more in that growth.
Is there any inherent link in the other direction—from growth to inequality? The seminal Kuznets hypothesis predicted increases in inequality during early periods of growth and reduction in inequality during subsequent periods [Kuznets (1955)]. However, the recent evidence has rejected this pattern. Deininger and Squire (1996, 1998), for example, detect no statistically significant link between income and distribution in 80 percent of cases, with the rest being evenly split between a positive and a negative effect. They confirmed their findings using a larger cross-country data set.
3Some critics quote the argument of trade-off between equity and efficiency. It is often hypothesised that distribution policies give rise to distortions in the economy, resulting in inefficiencies or loss of growth. Such loss of growth may be so much that the overall well-being of society falls. It is not certain that policies for equity necessarily create inefficient outcomes. The issue of trade-off is closely related to the choice of a social welfare function. If the concern is more about the well-being of the poor, then greater weight must be given to those at the bottom of the distribution than those at the top. Nevertheless, the magnitude of its impact on social welfare compared with the gains that results form improved equity needs to be assessed. It should be pointed out that the removal or correction of the various anti-poor institutional constraints and policy-induced biases might actually improve market efficiency besides promoting equity. For instance, social policy ensuring adequate provision of education and health services to the poor will improve their productivity and contribution to the economy.

Haroon Jamal 442
Only in Eastern Europe and Central Asia has there been a significant positive correlation (though not necessarily causality) between incomes and inequality, but this was during a period of negative growth coinciding with increasing inequality—the structural transformation in this region clearly makes it a special case. The consensus is that inequality is no more likely to rise than it is to fall in periods of economic growth and increasing inequality is not an inevitable consequence of early growth. It is not the rate of economic growth or the stage of economic development but the kind of economic growth which affects inequality. Overall, there is no trade-off per se between growth and inequality, so distribution can be pursued as an additional policy objective to enhance the poverty reducing effect of growth. In countries where distortions are causing inequalities, distribution policies would have a doubly beneficial effect on poverty reduction. However, in other countries where distortions have kept inequalities low there is likely to be a trade-off between distribution and growth. There is a gap in current knowledge about which countries fall into which category and, where appropriate, about how to make tradeoffs to maximize poverty reduction.
Another avenue of the recent research is to determine the relative importance of growth and inequality in reducing poverty. The major empirical finding is that “overall the growth effect dominates”. However, this is not true in all cases or for all groups of countries. Inequality has been more important in reducing poverty than growth in a quarter of the case studies cited in White and Anderson (2001). The dominance of growth overall may also be partly due to the growth focus of policies over the last 20 years and the weight given to cross-country studies looking at average effects across countries (the lack of time-series analysis has largely been due to insufficient data over time). Arguably there is unused potential for reducing poverty in implementing distribution policies.
Further, growth is less effective in reducing poverty in high inequality countries. This should come as no surprise as what matters for poverty reduction is not the rate of growth, but the distribution-corrected rate of growth [Ravallion (2001)]. In some high inequality countries, particularly those with low rates of growth, this means that changes in income distribution may be more effective in reducing poverty than growth.
To recap the above discussion regarding the relevance of re-distribution for growth and poverty reduction, the following major conclusions4 emerge, based on cross-country research during last decade:
Poverty and inequality are intrinsically linked. Poverty reduction—especially for the poorest—can be greatly enhanced through distributional policies. All the evidence confirms that distribution is central to fighting poverty. Distribution objectives should be an integral part of the poverty reduction agenda.
There is no inevitable trade-off between equity and efficiency. On the contrary growth and better distribution are complementary, rather than competing objectives in the fight against poverty. More equal distribution of income and assets can foster growth, whereas high inequality can retard it. Thus, reducing inequalities can be doubly beneficial for the poor.
Distribution policies should be pursued (a) where they remove redundant/dysfunctional inequalities, and (b) in countries where the inequality
4Reproduced from Naschold (2002).

Inequality Matter for Poverty Reduction 443
effect on poverty is greater than the growth effect.
The relative importance of growth and distribution varies across countries. The growth effect dominates in the majority of cases, but in a significant number of cases distribution can have a larger impact.
Small changes in distribution can have a very large effect on poverty reduction. There are cases where inequality levels have changed relatively quickly. Moreover, the lack of knowledge of the determinants of inequalities and the relative neglect of distribution issues in recent decades may mean that there is untapped potential for reducing poverty through distribution changes.
It is not possible to separate poverty and inequality. No commonly used measure of poverty is entirely absolute. The difference lies in the extent to which they incorporate relative measures. The choice of poverty measure, therefore, makes an implicit judgment about how much the poor should benefit from increases in national income. Development policy could make this explicit, even if it stops short of an internationally accepted standard for income distribution.
Knowledge of the effects of non-income dimensions of inequality is very limited and the evidence somewhat anecdotal. Even the determinants of income inequality are insufficiently understood. There is a need for further country-based work on the nature, extent and determinants of various dimensions of inequality, and their effects on different dimensions of poverty.
3. MODELING PAKISTAN’S POVERTY TRENDS
The first attempt to explain poverty trends in Pakistan with the help of macro determinants was made by Amjad and Kemal (1997). They operationalised various macro explanations of poverty into observed variables and empirically tested a prior impact of macro policies on poverty in Pakistan. Given the very small number of observations the authors employed simple one variable regression. Using a double log transformation they regressed one exogenous variable at a time on poverty incidence (headcount) series. Real per capita GNP, real remittances per capita, real wages in manufacturing, total labour force as percent of total population and real subsidies per capita were statistically significant and had the expected signs.
Using simple econometric techniques Akhtar and Ahmed (1999) extended the work of Amjad and Kemal (1997) conceptually and empirically to a multi-variable framework and quantified relative contribution of various correlates in explaining trends in overall poverty in Pakistan. They concluded that the estimates of various versions of the reduced multi-variate model on explaining poverty trends during 1979-93 confirm that per capita income, remittances, and unemployment not only impact independently, but also impact jointly. In addition they verified that inflation in food prices exacerbates poverty. The household endowment, proxied at macro level by aggregate human capital index, in explaining poverty trends is also tested and found statistically significant. They estimated that one percent increase in income will result in a 1.58 percent decline in poverty incidence.
The previous attempts to model Pakistan’s poverty trends did not incorporate the dependence of poverty on the degree of inequality. It is fairly well-known that the poverty elasticity of growth depends on the specific poverty measure being used

Haroon Jamal 444
[Kakwani (1993)], the degree of inequality of the income distribution [Ravallion (1997)] as well as the specific characteristics of growth episodes (inequality increasing or decreasing). Therefore, this paper proposes that the degree of poverty in any given country depends upon two factors: the average income level of the country and the extent of income inequality. Formally,
P = f (Y, L(p)) … … … … … … … (1)
Where P is a poverty measure, Y is per capita income and L(p) is the Lorenz curve measuring the relative income distribution.
Changes in poverty can be decomposed into a growth component and an inequality component. In general, increases in average income (growth) will reduce poverty. Thus, denoting by the growth elasticity of poverty one could write:
0*P
Y
Y
P … … … … … … (2)
Measuring the effect on inequality on poverty is slightly more complex because inequality can change in an infinite number of ways. It is difficult to say anything general about the growth-poverty relationship when the distribution is allowed to change during growth. Although intuitively progressive distributional change is likely to reduce poverty, this result cannot be generalised without additional assumption regarding the distribution. Kakwani (1993) developed a formula for the inequality elasticity of poverty under the assumption of an equal proportionate change in the Lorenz curve. Under this assumption it is possible to express the inequality elasticity of poverty as the elasticity of poverty with respect to the Gini index G:
0*P
G
G
P … … … … … … (3)
This framework may be used to observe the impact of macroeconomic policies on poverty and inequality. Formally one can write,
G
X
dX
dG
Y
X
dX
dY
P
X
dX
dP … … … … … (4)
Equation (4) reads that the impact that a change in policy X will have on poverty will depend on: (i) the impact that the policy has on growth; (ii) how growth is translated into poverty reduction; (iii) the simultaneous impact that the policy has on inequality, and finally (iv) how inequality changes are translated into poverty reduction.
Since the purpose of this paper is to estimate poverty elasticity and not to analyse the impact of various policies on poverty reduction, the analysis is restricted to estimating Equation (1) with the following specification,
Log (Headcount) = + Log (Per Capita GDP) + Log (Gini) +
… (5)
However, an attempt is also made to explain the variation in inequality with the help of various macroeconomic and structural policies. Besides income (per capita GDP), following determinants were considered in modelling inequality.

Inequality Matter for Poverty Reduction 445
There is widespread consensus that macroeconomic stability is a prerequisite for pro-poor growth. In particular, it has been found repeatedly that high inflation (particularly above a level of about 10 percent) hurts the poor and economic growth. Low inflation rate is considered a good indicator for macroeconomic stabilization in an economy; therefore it is included in the equation as a determinant of inequality. A negative relationship is hypothesised between development expenditure, especially on social services (as a percent of GDP) and income distribution. More public expenditure on health and education certainly increases the human capital endowment of the poor and hence affects on their empowerment. A major redistribution policy is to make the tax structure pro-poor. Therefore, it is hypothesised that there is a direct link between progressive tax structure (proxied by the rate of direct to indirect taxes) and equity. Investments, especially in infrastructure have a major impact on making economic growth pro-poor. Growth in investments is essential for reducing rate of unemployment and under-employment in the economy. Public investments by providing infrastructure play an important role in reducing poverty and increasing the share of people at the bottom of the income distribution.5
Two elements of economic structure are considered in the analysis: first, the manufacturing to agriculture wage6 gap and secondly, the manufacturing to agriculture terms of trade.7 Keeping the economic structure of the country in view, it is expected that the increase in these ratios will worsen the income distribution and will have a positive relationship with the Gini coefficient.
4. GENERATING AN INTERPOLATED POVERTY SERIES
Malik (1988) generated five poverty observations during the period 1963-64 to 1984-85 based on household surveys. They have applied a consistent methodology8 to compute poverty lines for these particular years. Amjad and Kemal (1999) inflated the poverty line for 1984-85 by the consumer price index and using the same methodology added three more observations for the years 1987-88, 1990-91 and 1992-93. Three more observations were added for the year 1996-97, 1998-99 and 2001-02 by this author. Consumer prices indices are used to inflate the poverty line and poverty incidences were estimated using the same methodology for these years. These estimates along with the Gini coefficients9 and share of bottom 20 percent of population in national income are reported in Table 1.
5Other possible candidates for explaining inequality, like economic and food subsidies, remittances, unemployment rate etc. were also tested, but turned out not to be statistically significant.
6Sectoral wage is computed as the sectoral value added divided by sectoral labour force. 7This is the ratio of manufacturing implicit GDP deflator to that of agriculture implicit GDP deflator. 8They defined a poverty line based on calorie requirement of 2550 per day plus ‘other basic needs of a
person’. In the estimation of the non-food consumption, he used the average ratio of food to non-food consumption of the poor.
9The estimates of Gini coefficients and share of bottom 20 percent are available in the Pakistan Economic Survey upto 1996-97. The author estimated these for the last two years from the raw data of household surveys.

Haroon Jamal 446
Table 1
Poverty and Inequality (Consistent Estimates)
Survey Years
Percentage of Population Below the Poverty Line Gini Coefficient
Share (%) of Bottom 20 Percent
of Population 1963-64 40.24 0.386 6.4 1966-67 44.50 0.355 7.6 1969-70 46.53 0.336 8.0 1979 30.68 0.373 7.4 1984-85 24.47 0.369 7.3 1987-88 17.32 0.348 8.0 1990-91 22.11 0.407 5.7 1992-93 22.40 0.410 6.2 1996-97 27.72 0.400 7.0 1998-99 24.31 0.410 6.2 2001-02 29.71 0.399 6.7
Sources: Amjad and Kemal (1997). Pakistan Economic Survey (Various Issues). Pakistan Integrated Household Surveys (1996-97, 1998-99, 2001-02).
A simple interpolation technique is to take the decline or growth in trend between two points in time and fill the data gaps between successive observations. However, a slightly more sophisticated method is applied to generate an interpolated series for poverty and inequality measures.10 A quadratic curve was fitted on the actual observations by regressing log of poverty measure (or log of Gini coefficient) on time and time square variables. The estimated series for poverty incidence (headcount) and Gini coefficient are provided in Annexure (Table B-1, Appendix – B) and are also plotted in the following Figure 2.
Fig. 2. Poverty and Inequality Trends
10Various techniques are applied to interpolate poverty measure in order to check the robustness, sensitivity and consistency with economic growth. See the Appendix – A.
Inequality Matter for Poverty Reduction 447
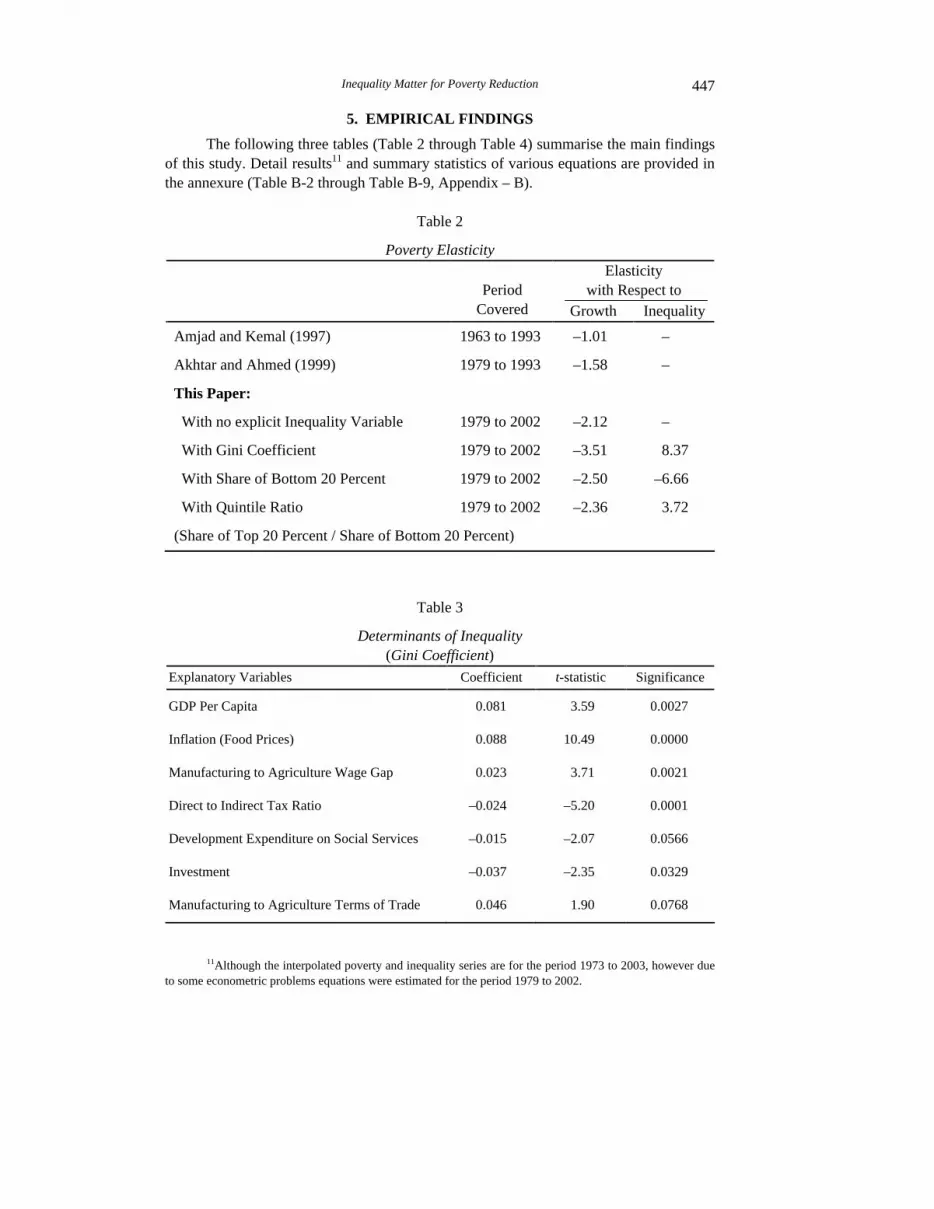
5. EMPIRICAL FINDINGS
The following three tables (Table 2 through Table 4) summarise the main findings of this study. Detail results11 and summary statistics of various equations are provided in the annexure (Table B-2 through Table B-9, Appendix – B).
Table 2
Poverty Elasticity Elasticity
with Respect to
Period Covered Growth Inequality
Amjad and Kemal (1997) 1963 to 1993 –1.01 –
Akhtar and Ahmed (1999) 1979 to 1993 –1.58 –
This Paper:
With no explicit Inequality Variable 1979 to 2002 –2.12 –
With Gini Coefficient 1979 to 2002 –3.51 8.37
With Share of Bottom 20 Percent 1979 to 2002 –2.50 –6.66
With Quintile Ratio 1979 to 2002 –2.36 3.72
(Share of Top 20 Percent / Share of Bottom 20 Percent)
Table 3
Determinants of Inequality (Gini Coefficient)
Explanatory Variables Coefficient t-statistic Significance
GDP Per Capita 0.081 3.59 0.0027
Inflation (Food Prices) 0.088 10.49 0.0000
Manufacturing to Agriculture Wage Gap 0.023 3.71 0.0021
Direct to Indirect Tax Ratio –0.024 –5.20 0.0001
Development Expenditure on Social Services –0.015 –2.07 0.0566
Investment –0.037 –2.35 0.0329
Manufacturing to Agriculture Terms of Trade 0.046 1.90 0.0768
11Although the interpolated poverty and inequality series are for the period 1973 to 2003, however due to some econometric problems equations were estimated for the period 1979 to 2002.

Haroon Jamal 448
Table 4
Determinants of Inequality (Share of Bottom 20 Percent of Population)
Explanatory Variables Coefficient t-statistic Significance
GDP Per Capita 0.046 1.03 0.3166
Inflation (Food) –0.121 –8.62 0.0000
Manufacturing to Agriculture Wage Gap –0.018 –1.84 0.0837
Direct to Indirect Tax Ratio 0.027 3.85 0.0014
Development Expenditure on Social Services 0.024 6.04 0.0000
Private Investment 0.051 3.65 0.0021
Manufacturing to Agriculture Terms of Trade –0.078 –2.45 0.0258
For the purpose of comparison with earlier research, poverty is regressed, first on growth and some other explanatory variables. This specification did not incorporate inequality explicitly in the equation. The growth elasticity estimate from this specification12 turned out to be –2.1 (Table 2) as against –1.6 of Akhtar and Ahmed (1999). Apparently, it is due to the inclusion of new data and also because of different exogenous variables.
Table 2 also presents the estimates of poverty elasticity (Equation 5) with respect to growth and inequality. The equation is estimated with two different methods: OLS13
and 2SLS,14 treating inequality both as an exogenous variable and as a pre-determined variable. Interestingly, both methods estimated very similar magnitudes for poverty elasticity with respect to per capita GDP (–3.51 versus –3.54) and Gini (8.37 versus 8.44).
A few observations emerge from Table 2. First, the magnitude of inequality elasticity measures is quite high as compared with the growth (per capita GDP) elasticity. Second, the magnitude of poverty elasticity of growth is more than doubled as compared with the earlier research.15 This is partly due to inclusion of new data and partly because of ignoring the dependence of poverty on inequality in earlier attempts. Third, the poverty elasticity is sensitive with the choice of inequality measure. The growth, as well as inequality, elasticity reduces if the share of bottom 20 percent is replaced with Gini coefficient. The results seem plausible. The cross-country research indicates that lower growth elasticity is associated with higher inequality. Similar phenomenon is, perhaps
12The detail results and summary statistics for this specification are provided in annexure, Table B-2 (Appendix–B).
13For Gini, share of bottom 20 percent of population and quintile ratio treated as exogenous, see Tables B-3, B- 4 and B-5 respectively in the Appendix–B.
14For Gini, share of bottom 20 percent of population and quintile ratio treated as pre-determined, see Tables B-8, B-9 and B-10 respectively in the Appendix–B.
15Using cross-country data and dollar-a-day poverty line, Richard H. Adams recently estimated poverty elasticity as –2.79 and –2.27 for survey mean and per capita GDP respectively after controlling for changes in income inequality. For results and specification see “Economic Growth, Inequality and Poverty: Estimating the Growth Elasticity of Poverty”, World Development, December 2004, 32(12), pp. 1989–2014.

Inequality Matter for Poverty Reduction 449
working here. To address the lower tail of distribution, relatively high elasticity of growth is required.
As for the empirical model for inequality (Gini coefficient), Table 3 presents16 the elasticities with respect to various macroeconomic and structural variables. Food prices are dominating in term of elasticity and are highly significant. Progressive taxation and development expenditure on social services also appear as important determinants of inequality. The magnitude of the effect of development expenditure is, however quite low. Public investment is considered pro-poor by directly providing employment through public works and indirectly crowding-in private investment. However, it did not appear as statistically significant. Total investment,17 therefore tried and it turned out an important determinant. The negative relationship between inequality and investment demands further assessment and research, as it is expected that the investment (especially private investment) in Pakistan works as an instrument for raising inequality. One possible explanation however, lies in the argument that informal economy is pro-cyclical with respect to trends in investment. This would imply that during period of higher investment and growth of the formal economy, the informal economy would also exhibit higher growth. Informal economy, in fact is supposed to be pro-poor as it provides unskilled jobs.
Two proxies for structural elements were incorporated in modelling inequality, i.e. manufacturing to agriculture wage gap and manufacturing to agriculture terms of trade. Both turned out significant and exhibited a positive relationship with inequality. Their significant clearly indicates rural versus urban income disparities and highlights the need for policy intervention in agriculture sector and rural economy.
The positive relationship between average income (per capita GDP) and level of inequality (Gini coefficient) again confirms some of the cross-country research that higher growth is accompanied with higher inequality. The seminal Kuznets hypothesis is therefore tested18 by incorporating the square term of per capita GDP in the Gini equation. The coefficients associated with per capita GDP and the square of per capita GDP were not statistically significant. However, the negative sign of square term did indicate an inverted U-shaped curve.
Another inequality measure (share of bottom 20 percent of population) is modelled with the same explanatory variables. The results19 are displayed in Table 4. Except the income (GDP per capita) variable, all variables exhibited the similar trends. Income did not turn out as statistically significant. Again, the findings are plausible. Average growth is distributional neutral and explicit distribution policies are required to address the poor 20 percent population.
6. CONCLUDING REMARKS
Poverty reduction has always been a priority of development policy, albeit sometime only at the rhetorical level. The end of the 1990s brought increased
16Detailed results and summary statistics are provided in annexure, Table B-6 (Appendix–B). 17The collinearity between per capita GDP and investment is tested through Auto Regressive Conditional
Hetroschadasticity (ARCH). According to the statistic. No evidence of presence of ARCH was found. 18Results are not explicitly reported here. 19Detailed results and summary statistics are provided in annexure, Table B-7 (Appendix–B).

Haroon Jamal 450
emphasis on bringing the benefits of growth to the poor. However, growth alone is a rather blunt instrument for poverty reduction, since the consensus of empirical work suggests that it is distribution neutral. Along with emphasis on poverty reduction, a shift occurred in the policy literature towards a moiré favourable view of policies to redistribute income and assets. An integration of distributional concerns and a priority on poverty reduction could be the basis for a new policy agenda to foster growth with equity.
This paper highlights the importance of distribution policies in poverty reduction using Pakistan poverty trends during the period 1979 to 2002. Summing up, the conclusions of this research are the following: First, the poverty elasticity with respect to various inequality measures is statistically significant and also the magnitude is relatively high as compared with poverty elasticity of growth. Second, as compared with earlier efforts in Pakistan, the magnitude of poverty elasticity of growth is quite high. This is partly due to inclusion of new data and partly because of ignoring the dependence of poverty on inequality in earlier attempts. Third, the study found inflation, sectoral wage gap, and terms of trade in favour of manufacturing as the significant positive correlates of inequality, while progressive taxation, investment and development expenditure on social services are negatively impacting on inequality.
Finally, it is true that redistribution often has limited potential and that growth is a necessary condition for poverty reduction. Yet the level of inequality and change therein, still matters. This is because the level of inequality affects the degree of poverty as well as growth elasticity of poverty. Further, low level of inequality contributes for an acceleration of poverty reduction for a given level of growth. For these reasons, inequality still matters, and the search for effective policies for reducing inequality, or at least prevent them from rising, should be an integral part of the development agenda.

Inequality Matter for Poverty Reduction 451
Appendices
APPENDIX – A SENSITIVITY OF INTERPOLATION TECHNIQUES
Poverty and inequality are estimated from occasional household surveys, therefore smoothing is not irrational to control, for instance exceptionally good or bad survey years in terms of national growth.
Three interpolation techniques (Linear, Exponential Growth and Quadratic) were applied to check the robustness and sensitivity of poverty and inequality measures. The summary results of these models (regression equations) for poverty measures are furnished below. For visual demonstration of proximity, the predicted values are also plotted vis-à-vis the observed poverty figures in Chart-A1.
Models Adjusted R2 F-value Significance of F-value
Linear 0.20 3.037 0.125
Growth 0.11 1.978 0.202
Quadratic 0.90 37.475 0.000
Chart-A1. Observed and Predicted Poverty Incidences
50
45
40
35
30
25
20
15
10
5
01970 1975 1980 1985 1990 1995 2000 2005
Linear Quadratic Growth Observed Poverty
Clearly the values predicted through quadratic model are very close to the observed poverty figures. It is also plausible to argue that the predicted poverty incidences with 0.9 adjusted R2 will produce alike correlation with the other economic variables. Following charts, which show the relationship between actual and predicted poverty with GDP growth confirm this hypothesis.

Haroon Jamal 452
Chart-A2. Observed Poverty and GDP Growth
50
45
40
35
30
25
20
15
10
5
0
1970 1975 1980 1985 1990 1995 2000 2005
12
10
8
6
4
2
0
Poverty GDP Growth Rate
Chart–A3. Predicted Poverty and GDP Growth
50
45
40
35
30
25
20
15
10
5
0
1970 1975 1980 1985 1990 1995 2000 2005
12
10
8
6
4
2
0
Poverty GDP Growth Rate GDP Growth (Trend) Poverty GDP Growth Rate
GDP Growth (Trend)

Inequality Matter for Poverty Reduction 453
APPENDIX–B
Table B-1
Poverty and Inequality Trends (Interpolated)
Year Gini Coefficient
(%) Population Below the Poverty Line
Headcount (%)
1973 30.6444 45.75
1974 31.1047 43.00
1975 31.5586 40.41
1976 32.0062 37.98
1977 32.4473 35.71
1978 32.8821 33.60
1979 33.3105 31.65
1980 33.7325 29.86
1981 34.1482 28.23
1982 34.5575 26.76
1983 34.9603 25.45
1984 35.3569 24.30
1985 35.7470 23.31
1986 36.1307 22.47
1987 36.5081 21.80
1988 36.8791 21.29
1989 37.2438 20.94
1990 37.6020 20.74
1991 37.9539 20.71
1992 38.2994 20.84
1993 38.6385 21.13
1994 38.9712 21.57
1995 39.2976 22.18
1996 39.6175 22.94
1997 39.9312 23.87
1998 40.2384 24.96
1999 40.5392 26.20
2000 40.8337 27.61
2001 41.1218 29.17
2002 41.4035 30.90
2003 41.6788 32.78 Source: Author’s Estimates (Based on Table 1 in the Text).

Haroon Jamal 454
Table B-2
Determinants of Poverty Dependent Variable: Poverty Incidence (Headcount)
(Method: OLS)
Explanatory Variables Coefficient
t-statistic Significance
GDP Per Capita –2.117 –6.93 0.0000
Inflation (Food) 0.603 5.17 0.0001
Development Expenditure on Social Services
–0.243 –5.09 0.0001
Private Investment –0.492 –3.30 0.0039
Direct to Indirect Tax Ratio –0.073 –1.13 0.2693
Terms of Trade 0.688 2.79 0.0120
Constant 15.490 7.13 0.0000
R-squared 0.955 F-statistic 64.95
Adjusted R-squared 0.941 Probability (F-statistics)
0.00
Durbin-Watson Stat 1.497 Number of Observations
24
Notes: All variables are used after Logarithmic transformation LM and ARCH tests are applied and found no evidence of serial correlation Except Direct to Indirect Tax Ratio, all variables are statistically significant.
Table B-3
Determinants of Poverty Dependent Variable: Poverty Incidence (Headcount)
(Method: OLS)
Explanatory Variables Coefficient t-statistic Significance
GDP Per Capita –3.505
–12.83
0.0000
GINI Coefficient 8.365
12.68
0.0000
Dummy Variable (1985, 1986,1987,1988 =1) –0.059
–2.95
0.0078
Constant 2.147
4.48
0.0002
R-squared 0.911 F-statistic 68.09
Adjusted R-squared 0.897 Probability (F-statistics) 0.00
Durbin-Watson Stat 1.645 Number of Observations 24
Notes: Variables (except dummy) are used after Logarithmic transformation. All variables are statistically significant. LM and ARCH tests are applied and found no evidence of serial correlation. The dummy variable helps to captures the extreme point estimates.

Inequality Matter for Poverty Reduction 455
Table B-4
Determinants of Poverty Dependent Variable: Poverty Incidence (Headcount)
(Method: OLS)
Explanatory Variables Coefficient t-statistic Significance
GDP Per Capita –2.50 –20.73 0.0000
Share of Bottom 20 Percent of Population –6.66 –18.92 0.0000
Dummy Variable (1985, 1986,1987,1988 =1) –0.036 –2.06 0.0522
Constant 67.73 20.66 0.0000
R-squared 0.960 F-statistic 160.81
Adjusted R-squared 0.954 Probability (F-statistics) 0.00
Durbin-Watson stat 1.776 Number of Observations 24
Notes: Variables (except dummy) are used after Logarithmic transformation. All variables are statistically significant. LM and ARCH tests are applied and found no evidence of serial correlation. The dummy variable helps to captures the extreme point estimates.
Table B-5
Determinants of Poverty Dependent Variable: Poverty Incidence (Headcount)
(Method: OLS) Explanatory Variables Coefficient t-statistic Significance
GDP Per Capita –2.362 –22.40 0.0000
Quintile Ratio (Top 20 Percent / Bottom 20 Percent Population) 3.718 20.40 0.0000
Dummy Variable (1985, 1986,1987,1988 =1) –0.032 –1.99 0.0601
Constant –1.255 –2.76 0.0121
R-squared 0.965 F-statistic 186.53
Adjusted R-squared 0.960 Probability (F-statistics) 0.0000
Durbin-Watson Stat 1.805 Number of Observations 24
Notes: Variables (except dummy) are used after Logarithmic transformation. All variables are statistically significant. LM and ARCH tests are applied and found no evidence of serial correlation. The dummy variable helps to captures the extreme point estimates

Haroon Jamal 456
Table B-6
Determinant of Inequality (Dependent Variable: Gini Coefficient—Percentage)
Explanatory Variables Coefficient
t-statistic Significance
GDP Per capita 0.081 3.59 0.0027
Inflation (Food) 0.088 10.49 0.0000
Wage Gap 0.023 3.71 0.0021
Direct to Indirect Tax Ratio –0.024 –5.20 0.0001
Development Expenditure on Social Services –0.015 –2.07 0.0566
Investment –0.037 –2.35 0.0329
Terms of Trade 0.046 1.90 0.0768
Dummy Variable (1985, 1986,1987,1988 =1) 0.006 2.78 0.0140
Constant 2.317 14.29 0.0000
R-squared 0.998 F-statistic 1543.25
Adjusted R-squared 0.998 Probability (F-statistics) 0.00
Durbin-Watson Stat 1.683 Number of Observations 24 Notes: Variables (except dummy) are used after Logarithmic transformation. All variables are statistically
significant. LM and ARCH tests are applied and found no evidence of serial correlation. The dummy variable helps to captures the extreme point estimates.
Table B-7
Determinants of Inequality (Dependent Variable: Share of Bottom 20 Percent of Population—Percentage)
Explanatory Variables Coefficient t-statistic Significance
GDP Per Capita 0.046 1.03 0.3166
Inflation (Food) –0.121 –8.62 0.0000
Wage Gap –0.018 –1.84 0.0837
Direct to Indirect Tax Ratio 0.027 3.85 0.0014
Development Expenditure on Social Services 0.024 6.04 0.0000
Investment 0.051 3.65 0.0021
Terms of Trade –0.078 –2.45 0.0258
Dummy Variable (1985, 1986,1987,1988 =1) –0.006 –2.57 0.0205
Constant 7.054 23.71 0.0000
R-squared 0.997 F-statistic 926.46
Adjusted R-squared 0.996 Probability (F-statistics) 0.000
Durbin-Watson Stat 1.608 Number of Observations 24 Notes: Variables (except dummy) are used after Logarithmic transformation. Except GDP per capita, all
variables are statistically significant. LM and ARCH tests are applied and found no evidence of serial correlation. The dummy variable helps to captures the extreme point estimates.

Inequality Matter for Poverty Reduction 457
Table B-8
Determinants of Poverty Dependent Variable: Poverty Incidence (Headcount)
(Method: TSLS)
Explanatory Variables Coefficient t-statistic Significance
GDP Per Capita –3.537 –13.07 0.0000
GINI Coefficient 8.435 12.11 0.0000
Dummy Variable (1985, 1986,1987,1988 =1) –0.058 –2.31 0.0312
Constant 2.115 3.77 0.0012
R-squared 0.911 F-statistic 67.39
Adjusted R-squared
0.897 Probability (F-statistics) 0.0000
Durbin-Watson Stat
1.659 Number of Observations 24
Notes: Variables (except dummy) are used after Logarithmic transformation. All variables are statistically significant. LM and ARCH tests are applied and found no evidence of serial correlation. The dummy variable helps to captures the extreme point estimates.
Table B-9
Determinants of Poverty Dependent Variable: Poverty Incidence (Headcount)
(Method: TSLS)
Explanatory Variables Coefficient t-statistic Significance
GDP Per Capita –2.482 –20.21 0.0000
Share of Bottom 20 Percent of Population –6.601 –18.39 0.0000
Dummy Variable (1985, 1986,1987,1988 =1) –0.037 –2.11 0.0473
Constant 67.136 20.09 0.0000
R-squared 0.960 F-statistic 154.14
Adjusted R-squared 0.954 Probability (F-statistics) 0.0000
Durbin-Watson Stat 1.761 Number of Observations 24
Notes: Variables (except dummy) are used after Logarithmic transformation. All variables are statistically significant. LM and ARCH tests are applied and found no evidence of serial correlation. The dummy variable helps to captures the extreme point estimates.

Haroon Jamal 458
Table B-10
Determinants of Poverty Dependent Variable: Poverty Incidence (Headcount)
(Method: TSLS)
Explanatory Variables Coefficient t-statistic Significance
GDP Per Capita –2.344 –21.79 0.0000
Quintile Ratio (Top 20 Percent / Bottom 20 Percent Population)
3.679 19.78 0.0000
Dummy Variable (1985, 1986,1987,1988 =1) –0.033 –2.05 0.0534
Constant –1.179 –2.55 0.0187
R-squared 0.965 F-statistic 178.12
Adjusted R-squared 0.960 Probability (F-statistics) 0.0000
Durbin-Watson Stat 1.787 Number of Observations 24
Notes: Variables (except dummy) are used after Logarithmic transformation. All variables are statistically significant. LM and ARCH tests are applied and found no evidence of serial correlation. The dummy variable helps to captures the extreme point estimates.
Instrumental Variables (for Tables B-8, B-9, and B-10):
GDP Per capita
Inflation (Food)
Wage Gap
Direct to Indirect Tax Ratio
Development Expenditure on Social Services
Investment
Terms of Trade
Dummy Variable (1985, 1986,1987,1988 =1)
Constant
REFERENCES
Adams, R. H. Jr. (2004) Economic Growth, Inequality and poverty: Estimating the Growth Elasticity of Poverty. World Development 32:12, 1989–2014, December.
Akhtar, Sajjad, and Mansoor Ahmed (1999) Modelling Poverty Trends in Pakistan: Some additional Empirical Evidence. Social Policy and Development Centre, Karachi. (Social Policy and Development Centre Research Report Number 27.)
Amjad, Rashid, and Abdul Razzaq Kemal (1997) Macroeconomic Policies and their Impact on Poverty Alleviation in Pakistan. The Pakistan Development Review 36:1, 39–68.
Birdsall, Nancy, David Ross, and Richard Sabot R. (1995) Inequality and Growth Reconsidered: Lessons from East Asia. World Bank Economic Review 9:3, 477–508.

Inequality Matter for Poverty Reduction 459
Deininger, Klaus, and Lyn Squire (1996) A New Data Set Measuring Income Inequality. World Bank Economic Review 10:3, 565–91.
Deininger, Klaus, and Lyn Squire (1998) New Ways of Looking at Old Issues: Inequality and Growth. Journal of Development Economics 57:2, 259–287.
Kakwani, Nanak (1993) Poverty and Economic Growth with an Application to Cote d’Ivoire. Review of Income and Wealth 39:2, 121–139.
Kanbur, Ravi, and Lustig Nora (1999) Why is Inequality Back on the Agenda? Paper prepared for the Annual Bank Conference on Development Economics, World Bank, Washington, D.C.
Knowles, Stephen (2001) Inequality and Economic Growth: The Empirical Relationship Reconsidered in the Light of Comparable Data. Paper for UNU/Wider Development Conference on Growth and Poverty, WIDER, Helsinki.
Kuznets, Simon (1955) Economic Growth and Income Inequality. American Economic Review 45, 1–28.
Malik, Muhammad Hussain (1988) Some New Evidence on the Incidence of Poverty in Pakistan. The Pakistan Development Review 27:4, 509–16.
Naschold, Felix (2002) Why Inequality Matters for Poverty? UK Department for International Development (DFID), UK. (Briefing Paper No. 2.)
Ravallion, Martin (1997) Can High Inequality Developing Countries Escape Absolute Poverty? World Bank, Washington, D.C. (World Bank Working Paper No. 1775.)
Ravallion, Martin (2001) Growth, Inequality and Poverty: Looking Beyond Averages. World Development 29:11, 1803–1815.
White, Howard, and Edward Anderson (2001) Growth versus Distribution: Does the Pattern of Growth Matter? Development Policy Review 19:3, 267–289.