Embed Size (px)
Citation preview
x
x
x
x
x
x
x
x x
x
x
x
x
x
x
x
x
x
x
x
x
x
x
x
x
x
x
x
x
x
x
x
x
x
x
x
x
x
x
x
x
x
x
x
x
x
x
x
x
x
x
x
x
x
x
x
x
x
x
x
x
x
x
x
x
x
x
x
1
CIBC Canadian Index Fund
Interim Financial Reports (unaudited)
for the period ended June 30, 2021
Statements of Financial Position (unaudited)
(in 000s, except per unit amounts)
As at June 30, 2021 and December 31, 2020 (note 1)
June 30, 2021 December 31, 2020
Assets
Current assets
Investments (non-derivative financial assets) † (notes 2
and 3) $ 1,232,023 $ 955,920
Cash including foreign currency holdings, at fair value – 96
Margin 599 957
Dividends receivable 2,569 2,195
Receivable for units issued 1,349 611
Other receivables 7 2
Derivative assets 80 –
Total Assets 1,236,627 959,781
Liabilities
Current liabilities
Bank overdraft 28 –
Payable for portfolio securities purchased 533 303
Payable for units redeemed 893 615
Other accrued expenses – 1
Derivative liabilities – 139
Total Liabilities 1,454 1,058
Net Assets Attributable to Holders of
Redeemable Units (note 5) $ 1,235,173 $ 958,723
Net Assets Attributable to Holders of
Redeemable Units per Class
Class A $ 472,195 $ 431,494
Premium Class $ 342,142 $ 248,116
Class F $ 48 $ –
Class F-Premium $ 530 $ 460
Class O $ 420,258 $ 278,653
Net Assets Attributable to Holders of
Redeemable Units per Unit (note 5)
Class A $ 38.30 $ 32.81
Premium Class $ 17.73 $ 15.14
Class F $ 13.03 $ 11.16
Class F-Premium $ 17.92 $ 15.28
Class O $ 17.66 $ 15.04
† Securities Lending
The tables that follow indicate the Fund had assets involved in securities lending transactions
outstanding as at June 30, 2021 and December 31, 2020.
Aggregate Value
of Securities
on Loan
($000s)
Aggregate Value
of Collateral
for Loan
($000s)
June 30, 2021 74,143 79,037
December 31, 2020 60,553 64,056
Collateral Type* ($000s)
i ii iii iv
June 30, 2021 – 79,037 – –
December 31, 2020 – 64,056 – –
* See note 2j for Collateral Type definitions.
Organization of the Fund (note 1)
The Fund was established on July 8, 1996 (referred to as Date Established).
Inception Date
Class A July 25, 1996
Premium Class November 23, 2011
Class F July 6, 2020
Class F-Premium November 29, 2011
Class O June 1, 2010
The accompanying notes are an integral part of these financial statements.
CIBC Canadian Index Fund
x
x
x
x
x
x
x
x
x
x
x
x
x
x
x
x
x
x
x
x
x
x
x
x
x
x
x
x
x
x
x
x
x
x
x
x
x
x
x
x
x
x
x
x
x
x
x
x
x
x
x
x
x
x
x
x
x
x
x
x
x
x
x
x
x
x
x
x
x
x
x
x
x
x
x
x
x
x
x
x
x
x
x x
x
x
x
x
x
x
x
x
x
x
x
x
x
x
x
x
..
2
The accompanying notes are an integral part of these financial statements.
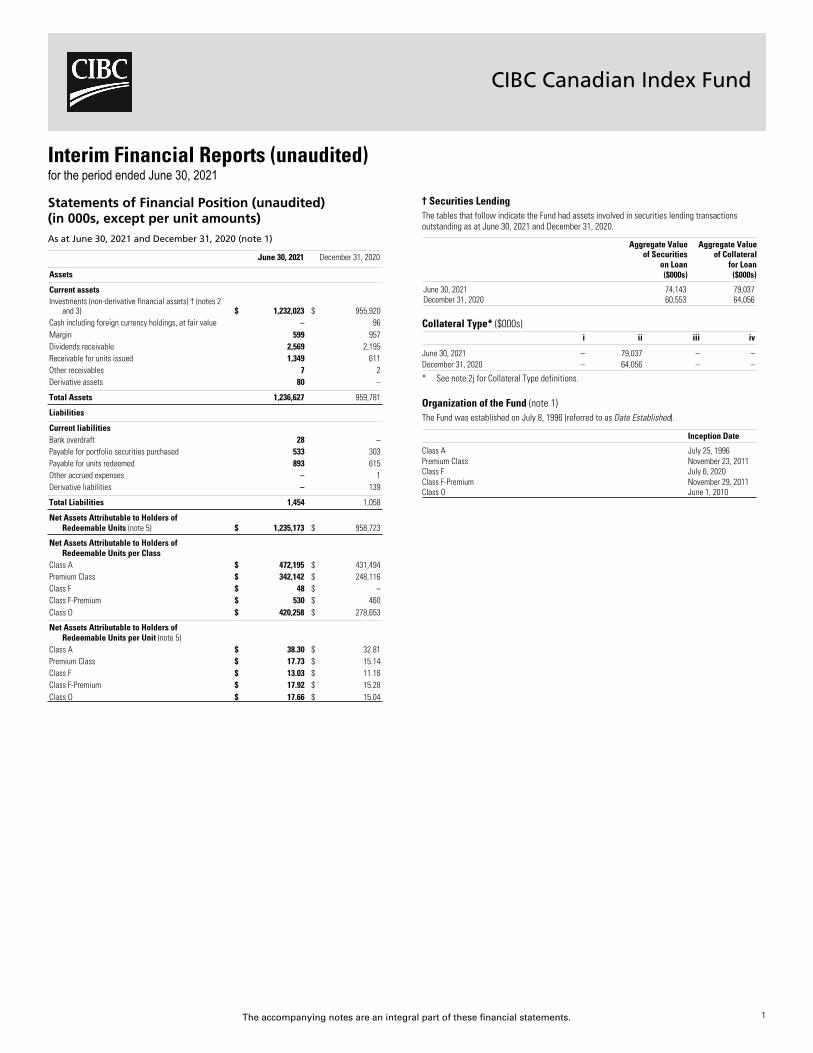
Statements of Comprehensive Income (unaudited)
(in 000s, except per unit amounts)
For the periods ended June 30, 2021 and 2020 (note 1)
June 30, 2021 June 30, 2020
x
Net Gain (loss) on Financial Instruments
Interest for distribution purposes
$ 261
$ 299
Dividend revenue
15,090
11,913
Derivative income (loss)
4,097
52
Other changes in fair value of investments and
x
derivatives
Net realized gain (loss) on sale of investments and
derivatives
5,384
(12,410)
Net realized gain (loss) on foreign currency (notes 2f
and g)
(2)
(9)
Net change in unrealized appreciation (depreciation)
of investments and derivatives
150,706
(56,385)
Net Gain (loss) on Financial Instruments 175,536
(56,540)
x
Other Income
Foreign exchange gain (loss) on cash
2
3
Securities lending revenue ±
98
510
100
513
x
Expenses (note 6)
Management fees ±±
3,727
2,977
Audit fees
7
6
Custodial fees
22
25
Independent review committee fees
1
–
Legal fees
3
2
Regulatory fees
19
19
Transaction costs ±±±
82
73
Unitholder reporting costs
478
486
Withholding taxes (note 7)
2
–
Other expenses
13
16
4,354
3,604
Expenses waived/absorbed by the Manager
(1,081)
(933)
3,273
2,671
Increase (Decrease) in Net Assets Attributable to
Holders of Redeemable Units (excluding
distributions) 172,363
(58,698)
Increase (Decrease) in Net Assets Attributable to
Holders of Redeemable Units per Class
x
(excluding distributions)
Class A
$ 71,004
$ (31,254)
Premium Class
$ 45,416
$ (17,918)
Class F
$ 3
n/a
Class F-Premium
$ 74
$ (437)
Class O
$ 55,866
$ (9,089)
Average Number of Units Outstanding for the
x
period per Class
Class A
12,901
13,009
Premium Class
17,669
15,878
Class F
2
n/a
Class F-Premium
29
79
Class O
21,455
11,431
Increase (Decrease) in Net Assets Attributable to
Holders of Redeemable Units per Unit
x
(excluding distributions)
Class A
$ 5.51
$ (2.41)
Premium Class
$ 2.56
$ (1.13)
Class F
$ 1.29
n/a
Class F-Premium
$ 2.56
$ (5.52)
Class O
$ 2.60
$ (0.79)
± Securities Lending Revenue (note 2j)
June 30, 2021 June 30, 2020
(in 000s)
% of Gross
securities lending
revenue (in 000s)
% of Gross
securities
lending revenue
Gross securities lending revenue $ 142 100.0 $ 681 100.0
Interest paid on collateral – – – –
Withholding taxes (11) (7.7) (1) (0.1)
Agent fees - Bank of New York
Mellon Corp. (The) (33) (23.2) (170) (25.0)
Securities lending revenue $ 98 69.1 $ 510 74.9
±± Maximum Chargeable Annual Management Fee Rates (note 6)
Class A 1.00%
Premium Class 0.75%
Class F 0.75%
Class F-Premium 0.60%
Class O 0.00%
±±± Brokerage Commissions and Fees (notes 8 and 9)
x
2021 2020
Brokerage commissions and other fees ($000s)
Total Paid
80
71
Paid to CIBC World Markets Inc.
31
26
Paid to CIBC World Markets Corp.
–
–
Soft dollars ($000s)
Total Paid
–
–
Paid to CIBC World Markets Inc. and CIBC World Markets Corp.
–
–
Administrative and Other Fund Operating Expenses (note 9)
2021 2020
($000s)
395
413
Service Provider (note 9)
The amounts paid by the Fund (including all applicable taxes) to CIBC Mellon Trust Company for
custodial fees, and to CIBC Mellon Global Securities Services Company (referred to as CIBC GSS)
for securities lending, fund accounting and reporting, and portfolio valuation (all net of absorptions)
for the periods ended June 30, 2021 and 2020 were as follows:
2021 2020
($000s)
54
243
xCIBC Canadian Index Fund
x
Increase (Decrease) in Net Assets Attributable to
x
x
x
x
x
x
x
x
x
x
x
x
x
x
x
x
x
x
x
For the periods ended June 30, 2021 and 2020 (note 1)
x
xx
x
x
xx
x
x
xx
x
x
x
x
xx
x
x
..
.
3
The accompanying notes are an integral part of these financial statements.
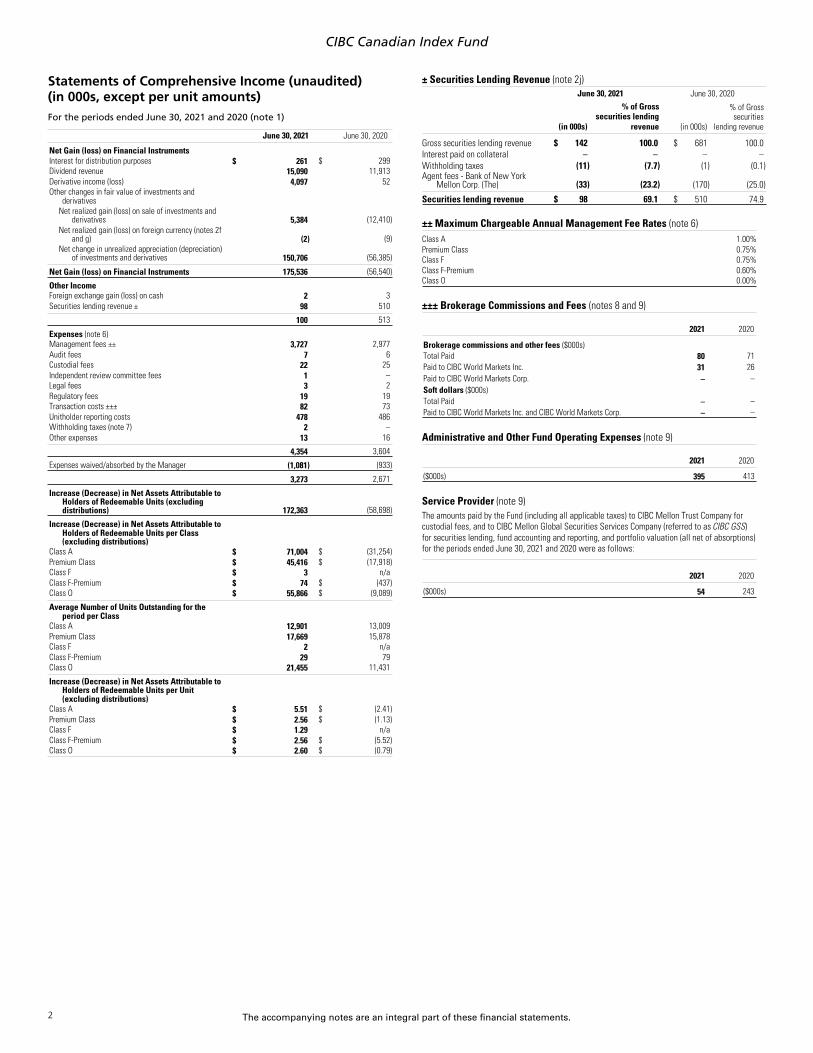
Statements of Changes in Net Assets Attributable to Holders of Redeemable Units (unaudited)
(in 000s)
For the periods ended June 30, 2021 and 2020 (note 1)
Class A Units Premium Class Units Class F Units Class F-Premium Units
June 30, 2021 June 30, 2020 June 30, 2021 June 30, 2020 June 30, 2021 June 30, 2021 June 30, 2020
Holders of Redeemable Units (excluding
distributions) $ 71,004 $ (31,254) $ 45,416 $ (17,918) $ 3 $ 74 $ (437)
Distributions Paid or Payable to Holders of Redeemable
Units ‡
From net investment income (13) (10) – – – – –
(13) (10) – – – – –
Redeemable Unit Transactions
Amount received from the issuance of units 42,785 42,676 68,609 33,166 45 69 205
Amount received from reinvestment of distributions 13 10 – – – – –
Amount paid on redemptions of units (73,088) (36,838) (19,999) (29,719) – (73) (1,688)
(30,290) 5,848 48,610 3,447 45 (4) (1,483)
Increase (Decrease) in Net Assets Attributable to
Holders of Redeemable Units
Net Assets Attributable to Holders of Redeemable Units
at Beginning of Period
40,701
431,494
(25,416)
416,057
94,026
248,116
(14,471)
231,710
48
–
70
460
(1,920)
2,274
Net Assets Attributable to Holders of Redeemable Units
at End of Period $ 472,195 $ 390,641 $ 342,142 $ 217,239 $ 48 $ 530 $ 354
Redeemable Units Issued and Outstanding (note 5)
As at June 30, 2021 and 2020
Balance - beginning of period 13,151 12,996 16,392 15,693 – 30 153
Redeemable units issued 1,196 1,491 4,121 2,486 4 5 17
Redeemable units issued on reinvestments – 1 – – – – –
14,347 14,488 20,513 18,179 4 35 170
Redeemable units redeemed (2,017) (1,254) (1,216) (2,278) – (5) (144)
Balance - end of period 12,330 13,234 19,297 15,901 4 30 26
Class O Units
June 30, 2021 June 30, 2020
Increase (Decrease) in Net Assets Attributable to
Holders of Redeemable Units (excluding
distributions) $ 55,866 $ (9,089)
Redeemable Unit Transactions
Amount received from the issuance of units 94,600 69,243
Amount paid on redemptions of units (8,861) (5,854)
85,739 63,389
Increase (Decrease) in Net Assets Attributable to
Holders of Redeemable Units
Net Assets Attributable to Holders of Redeemable Units
at Beginning of Period
141,605
278,653
54,300
120,536
Net Assets Attributable to Holders of Redeemable Units
at End of Period $ 420,258 $ 174,836
Redeemable Units Issued and Outstanding (note 5)
As at June 30, 2021 and 2020
Balance - beginning of period 18,522 8,224
Redeemable units issued 5,814 5,071
24,336 13,295
Redeemable units redeemed (537) (430)
Balance - end of period 23,799 12,865
‡ Net Capital and Non-Capital Losses (note 7)
As at December 2020, the Fund had net capital and non-capital losses (in $000s) for income tax purposes available to be carried forward as follows:
Total Net Capital Losses
Total Non-Capital Losses
that Expire in:
2030 to 2040
47,676
.
–
xCIBC Canadian Index Fund
x
x
x
x
x
x
x
x
x
x
x
x
x
x
x
x
x
4
The accompanying notes are an integral part of these financial statements.
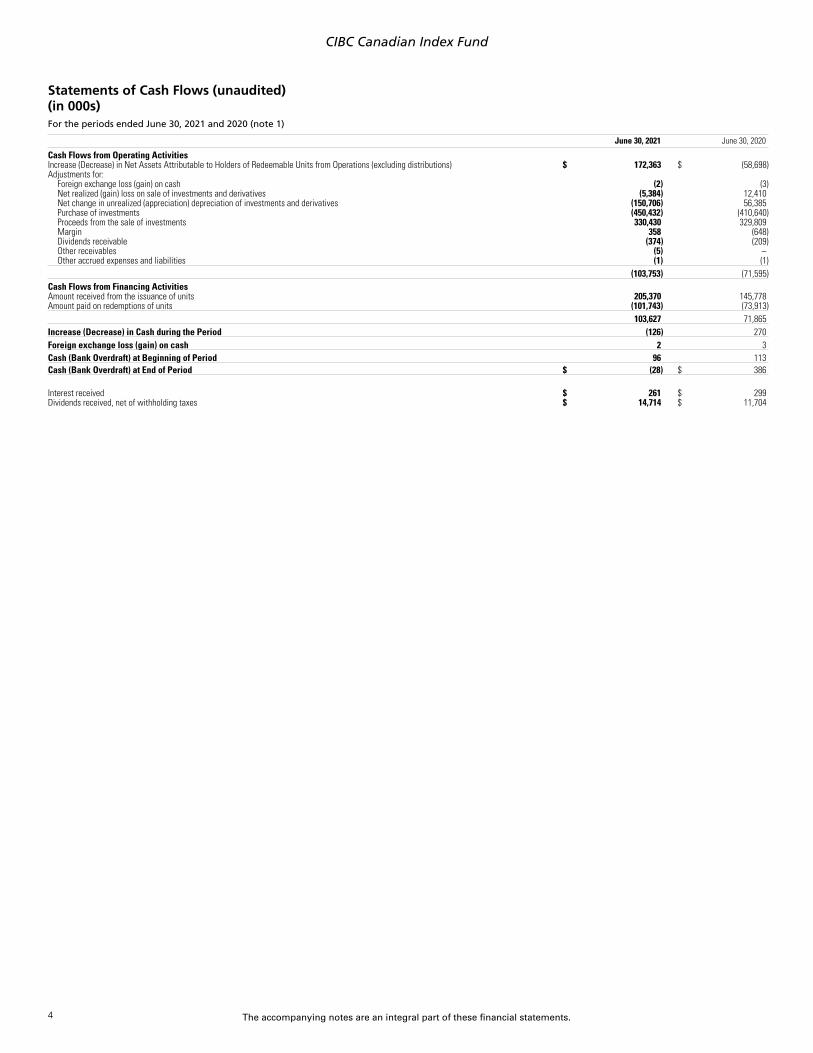
Statements of Cash Flows (unaudited)
(in 000s)
For the periods ended June 30, 2021 and 2020 (note 1)
June 30, 2021 June 30, 2020
Cash Flows from Operating Activities
Increase (Decrease) in Net Assets Attributable to Holders of Redeemable Units from Operations (excluding distributions) $ 172,363 $ (58,698)
Adjustments for:
Foreign exchange loss (gain) on cash (2) (3)
Net realized (gain) loss on sale of investments and derivatives (5,384) 12,410
Net change in unrealized (appreciation) depreciation of investments and derivatives (150,706) 56,385
Purchase of investments (450,432) (410,640)
Proceeds from the sale of investments 330,430 329,809
Margin 358 (648)
Dividends receivable (374) (209)
Other receivables (5) –
Other accrued expenses and liabilities (1) (1)
(103,753) (71,595)
Cash Flows from Financing Activities
Amount received from the issuance of units 205,370 145,778
Amount paid on redemptions of units (101,743) (73,913)
103,627 71,865
Increase (Decrease) in Cash during the Period (126) 270
Foreign exchange loss (gain) on cash 2 3
Cash (Bank Overdraft) at Beginning of Period 96 113
Cash (Bank Overdraft) at End of Period $ (28) $ 386
Interest received $ 261 $ 299
Dividends received, net of withholding taxes $ 14,714 $ 11,704
CIBC Canadian Index Fund
x
..
..
..
..
..
..
..
..
..
..
.
.
..
..
..
..
..
..
..
..
..
..
..
..
..
..
..
.
.
..
..
..
..
..
..
..
..
..
..
..
..
..
..
.
.
..
..
..
..
..
..
..
..
..
..
..
..
..
..
..
..
..
..
..
..
..
..
..
..
..
..
.
.
..
..
..
..
..
..
..
..
..
..
..
..
..
5
The accompanying notes are an integral part of these financial statements.
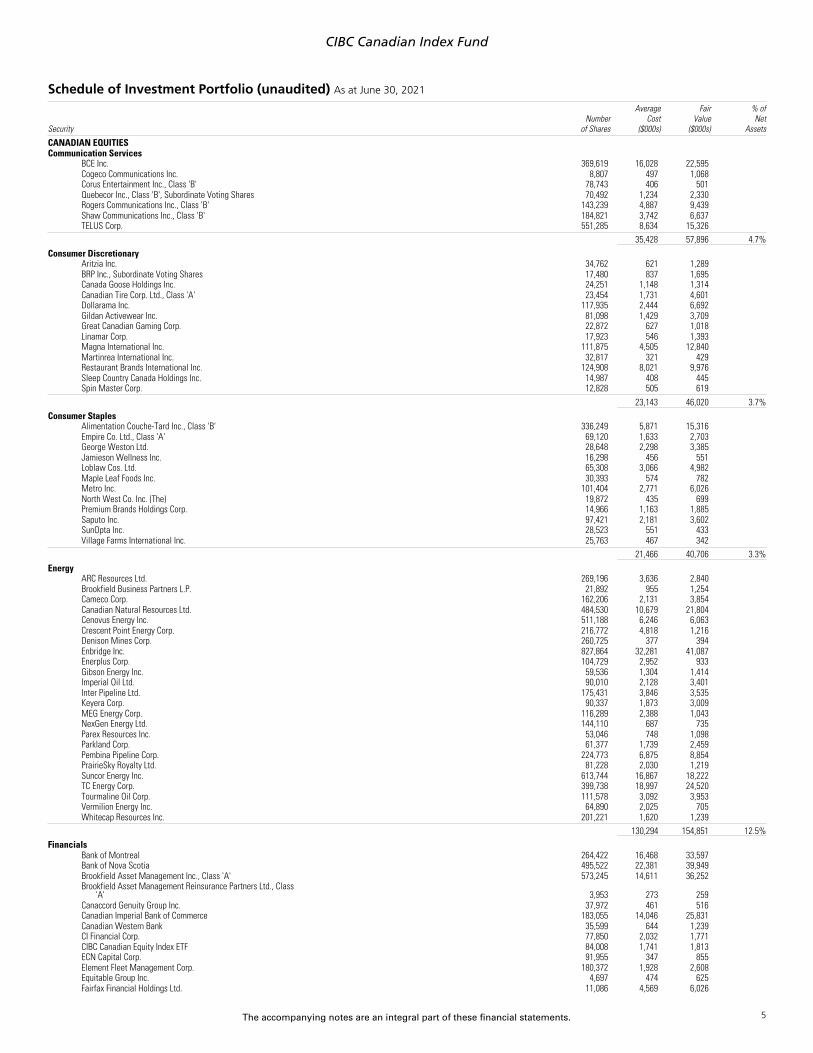
Schedule of Investment Portfolio (unaudited) As at June 30, 2021
Security
Number
of Shares
Average
Cost
($000s)
Fair
Value
($000s)
% of
Net
Assets
CANADIAN EQUITIES
Communication Services
BCE Inc. 369,619 16,028 22,595
Cogeco Communications Inc. 8,807 497 1,068
Corus Entertainment Inc., Class 'B' 78,743 406 501
Quebecor Inc., Class 'B', Subordinate Voting Shares 70,492 1,234 2,330
Rogers Communications Inc., Class 'B' 143,239 4,887 9,439
Shaw Communications Inc., Class 'B' 184,821 3,742 6,637
TELUS Corp. 551,285 8,634 15,326
35,428 57,896 4.7%
Consumer Discretionary
Aritzia Inc. 34,762 621 1,289
BRP Inc., Subordinate Voting Shares 17,480 837 1,695
Canada Goose Holdings Inc. 24,251 1,148 1,314
Canadian Tire Corp. Ltd., Class 'A' 23,454 1,731 4,601
Dollarama Inc. 117,935 2,444 6,692
Gildan Activewear Inc. 81,098 1,429 3,709
Great Canadian Gaming Corp. 22,872 627 1,018
Linamar Corp. 17,923 546 1,393
Magna International Inc. 111,875 4,505 12,840
Martinrea International Inc. 32,817 321 429
Restaurant Brands International Inc. 124,908 8,021 9,976
Sleep Country Canada Holdings Inc. 14,987 408 445
Spin Master Corp. 12,828 505 619
23,143 46,020 3.7%
Consumer Staples
Alimentation Couche-Tard Inc., Class 'B' 336,249 5,871 15,316
Empire Co. Ltd., Class 'A' 69,120 1,633 2,703
George Weston Ltd. 28,648 2,298 3,385
Jamieson Wellness Inc. 16,298 456 551
Loblaw Cos. Ltd. 65,308 3,066 4,982
Maple Leaf Foods Inc. 30,393 574 782
Metro Inc. 101,404 2,771 6,026
North West Co. Inc. (The) 19,872 435 699
Premium Brands Holdings Corp. 14,966 1,163 1,885
Saputo Inc. 97,421 2,181 3,602
SunOpta Inc. 28,523 551 433
Village Farms International Inc. 25,763 467 342
21,466 40,706 3.3%
Energy
ARC Resources Ltd. 269,196 3,636 2,840
Brookfield Business Partners L.P. 21,892 955 1,254
Cameco Corp. 162,206 2,131 3,854
Canadian Natural Resources Ltd. 484,530 10,679 21,804
Cenovus Energy Inc. 511,188 6,246 6,063
Crescent Point Energy Corp. 216,772 4,818 1,216
Denison Mines Corp. 260,725 377 394
Enbridge Inc. 827,864 32,281 41,087
Enerplus Corp. 104,729 2,952 933
Gibson Energy Inc. 59,536 1,304 1,414
Imperial Oil Ltd. 90,010 2,128 3,401
Inter Pipeline Ltd. 175,431 3,846 3,535
Keyera Corp. 90,337 1,873 3,009
MEG Energy Corp. 116,289 2,388 1,043
NexGen Energy Ltd. 144,110 687 735
Parex Resources Inc. 53,046 748 1,098
Parkland Corp. 61,377 1,739 2,459
Pembina Pipeline Corp. 224,773 6,875 8,854
PrairieSky Royalty Ltd. 81,228 2,030 1,219
Suncor Energy Inc. 613,744 16,867 18,222
TC Energy Corp. 399,738 18,997 24,520
Tourmaline Oil Corp. 111,578 3,092 3,953
Vermilion Energy Inc. 64,890 2,025 705
Whitecap Resources Inc. 201,221 1,620 1,239
130,294 154,851 12.5%
Financials
Bank of Montreal 264,422 16,468 33,597
Bank of Nova Scotia 495,522 22,381 39,949
Brookfield Asset Management Inc., Class 'A' 573,245 14,611 36,252
Brookfield Asset Management Reinsurance Partners Ltd., Class
'A' 3,953 273 259
Canaccord Genuity Group Inc. 37,972 461 516
Canadian Imperial Bank of Commerce 183,055 14,046 25,831
Canadian Western Bank 35,599 644 1,239
CI Financial Corp. 77,850 2,032 1,771
CIBC Canadian Equity Index ETF 84,008 1,741 1,813
ECN Capital Corp. 91,955 347 855
Element Fleet Management Corp. 180,372 1,928 2,608
Equitable Group Inc. 4,697 474 625
Fairfax Financial Holdings Ltd. 11,086 4,569 6,026
CIBC Canadian Index Fund
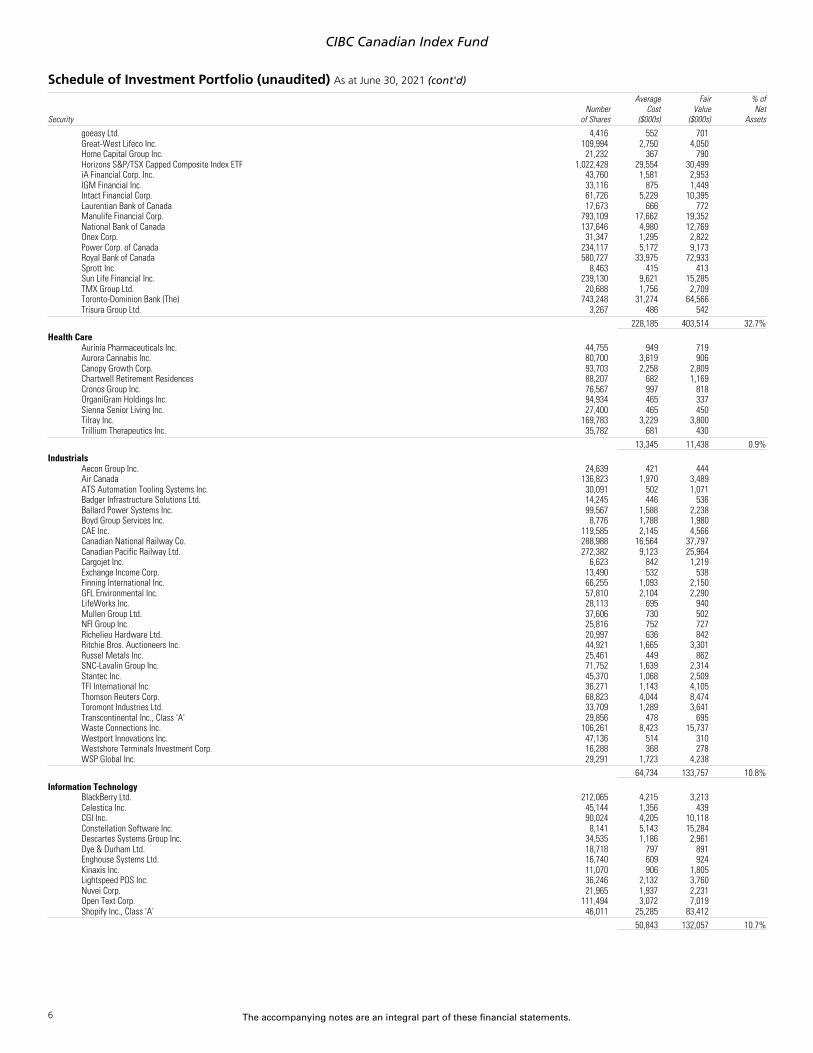
Schedule of Investment Portfolio (unaudited) As at June 30, 2021 (cont'd)
..
..
..
..
..
..
..
..
..
..
..
..
..
..
..
..
..
..
..
..
.
.
..
..
..
..
..
..
..
..
..
..
..
.
.
..
..
..
..
..
..
..
..
..
..
..
..
..
..
..
..
..
..
..
..
..
..
..
..
..
..
..
..
..
..
..
.
.
..
..
..
..
..
..
..
..
..
..
..
..
..
..
.
.
6
The accompanying notes are an integral part of these financial statements.
Security
Number
of Shares
Average
Cost
($000s)
Fair
Value
($000s)
% of
Net
Assets
goeasy Ltd. 4,416 552 701
Great-West Lifeco Inc. 109,994 2,750 4,050
Home Capital Group Inc. 21,232 367 790
Horizons S&P/TSX Capped Composite Index ETF 1,022,428 29,554 30,499
iA Financial Corp. Inc. 43,760 1,581 2,953
IGM Financial Inc. 33,116 875 1,449
Intact Financial Corp. 61,726 5,229 10,395
Laurentian Bank of Canada 17,673 666 772
Manulife Financial Corp. 793,109 17,662 19,352
National Bank of Canada 137,646 4,980 12,769
Onex Corp. 31,347 1,295 2,822
Power Corp. of Canada 234,117 5,172 9,173
Royal Bank of Canada 580,727 33,975 72,933
Sprott Inc. 8,463 415 413
Sun Life Financial Inc. 239,130 9,621 15,285
TMX Group Ltd. 20,688 1,756 2,709
Toronto-Dominion Bank (The) 743,248 31,274 64,566
Trisura Group Ltd. 3,267 486 542
228,185 403,514 32.7%
Health Care
Aurinia Pharmaceuticals Inc. 44,755 949 719
Aurora Cannabis Inc. 80,700 3,619 906
Canopy Growth Corp. 93,703 2,258 2,809
Chartwell Retirement Residences 88,207 682 1,169
Cronos Group Inc. 76,567 997 818
OrganiGram Holdings Inc. 94,934 465 337
Sienna Senior Living Inc. 27,400 465 450
Tilray Inc. 169,783 3,229 3,800
Trillium Therapeutics Inc. 35,782 681 430
13,345 11,438 0.9%
Industrials
Aecon Group Inc. 24,639 421 444
Air Canada 136,823 1,970 3,489
ATS Automation Tooling Systems Inc. 30,091 502 1,071
Badger Infrastructure Solutions Ltd. 14,245 446 536
Ballard Power Systems Inc. 99,567 1,588 2,238
Boyd Group Services Inc. 8,776 1,788 1,980
CAE Inc. 119,585 2,145 4,566
Canadian National Railway Co. 288,988 16,564 37,797
Canadian Pacific Railway Ltd. 272,382 9,123 25,964
Cargojet Inc. 6,623 842 1,219
Exchange Income Corp. 13,490 532 538
Finning International Inc. 66,255 1,093 2,150
GFL Environmental Inc. 57,810 2,104 2,290
LifeWorks Inc. 28,113 695 940
Mullen Group Ltd. 37,606 730 502
NFI Group Inc. 25,816 752 727
Richelieu Hardware Ltd. 20,997 636 842
Ritchie Bros. Auctioneers Inc. 44,921 1,665 3,301
Russel Metals Inc. 25,461 449 862
SNC-Lavalin Group Inc. 71,752 1,639 2,314
Stantec Inc. 45,370 1,068 2,509
TFI International Inc. 36,271 1,143 4,105
Thomson Reuters Corp. 68,823 4,044 8,474
Toromont Industries Ltd. 33,709 1,289 3,641
Transcontinental Inc., Class 'A' 29,856 478 695
Waste Connections Inc. 106,261 8,423 15,737
Westport Innovations Inc. 47,136 514 310
Westshore Terminals Investment Corp. 16,288 368 278
WSP Global Inc. 29,291 1,723 4,238
64,734 133,757 10.8%
Information Technology
BlackBerry Ltd. 212,065 4,215 3,213
Celestica Inc. 45,144 1,356 439
CGI Inc. 90,024 4,205 10,118
Constellation Software Inc. 8,141 5,143 15,284
Descartes Systems Group Inc. 34,535 1,186 2,961
Dye & Durham Ltd. 18,718 797 891
Enghouse Systems Ltd. 16,740 609 924
Kinaxis Inc. 11,070 906 1,805
Lightspeed POS Inc. 36,246 2,132 3,760
Nuvei Corp. 21,965 1,937 2,231
Open Text Corp. 111,494 3,072 7,019
Shopify Inc., Class 'A' 46,011 25,285 83,412
50,843 132,057 10.7%
CIBC Canadian Index Fund
Schedule of Investment Portfolio (unaudited) As at June 30, 2021 (cont'd)
..
..
..
..
..
..
..
..
..
..
..
..
..
..
..
..
..
..
..
..
..
..
..
..
..
..
..
..
..
..
..
..
..
..
..
..
..
..
..
..
..
..
..
..
..
..
..
..
..
..
..
..
..
..
.
.
..
..
..
..
..
..
..
..
..
..
..
..
..
..
..
..
..
..
..
..
..
..
..
..
..
..
..
.
.
7
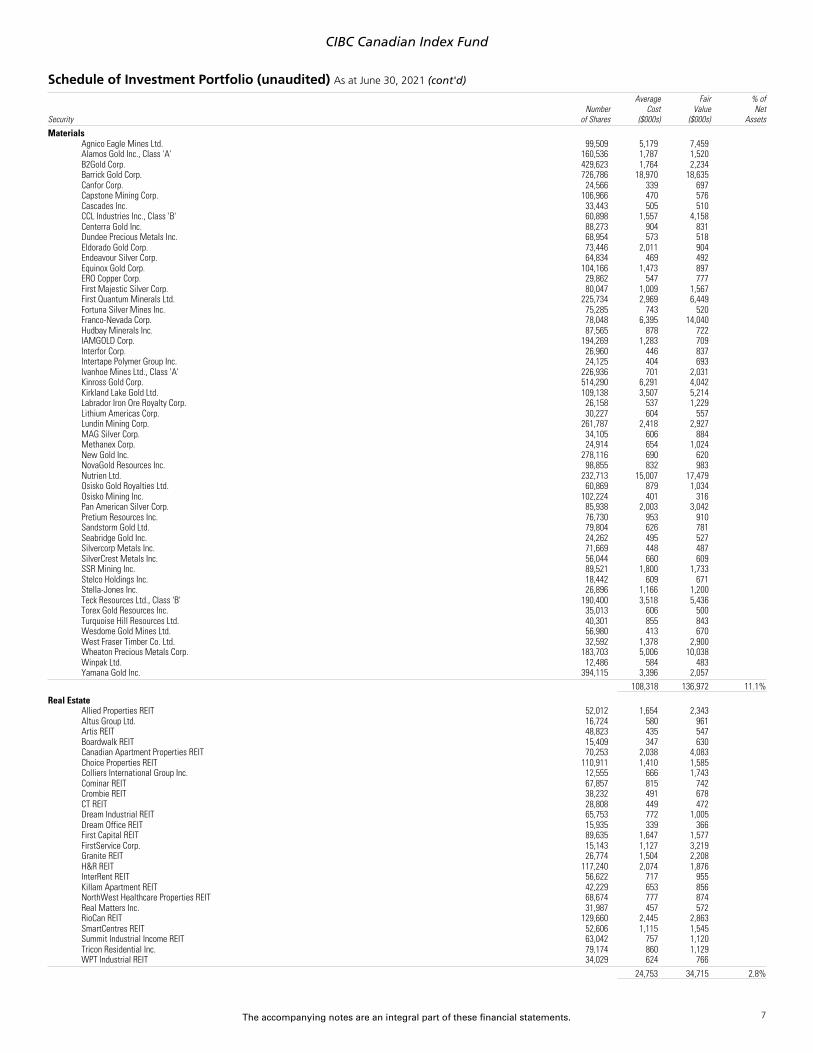
The accompanying notes are an integral part of these financial statements.
Security
Number
of Shares
Average
Cost
($000s)
Fair
Value
($000s)
% of
Net
Assets
Materials
Agnico Eagle Mines Ltd. 99,509 5,179 7,459
Alamos Gold Inc., Class 'A' 160,536 1,787 1,520
B2Gold Corp. 429,623 1,764 2,234
Barrick Gold Corp. 726,786 18,970 18,635
Canfor Corp. 24,566 339 697
Capstone Mining Corp. 106,966 470 576
Cascades Inc. 33,443 505 510
CCL Industries Inc., Class 'B' 60,898 1,557 4,158
Centerra Gold Inc. 88,273 904 831
Dundee Precious Metals Inc. 68,954 573 518
Eldorado Gold Corp. 73,446 2,011 904
Endeavour Silver Corp. 64,834 469 492
Equinox Gold Corp. 104,166 1,473 897
ERO Copper Corp. 29,862 547 777
First Majestic Silver Corp. 80,047 1,009 1,567
First Quantum Minerals Ltd. 225,734 2,969 6,449
Fortuna Silver Mines Inc. 75,285 743 520
Franco-Nevada Corp. 78,048 6,395 14,040
Hudbay Minerals Inc. 87,565 878 722
IAMGOLD Corp. 194,269 1,283 709
Interfor Corp. 26,960 446 837
Intertape Polymer Group Inc. 24,125 404 693
Ivanhoe Mines Ltd., Class 'A' 226,936 701 2,031
Kinross Gold Corp. 514,290 6,291 4,042
Kirkland Lake Gold Ltd. 109,138 3,507 5,214
Labrador Iron Ore Royalty Corp. 26,158 537 1,229
Lithium Americas Corp. 30,227 604 557
Lundin Mining Corp. 261,787 2,418 2,927
MAG Silver Corp. 34,105 606 884
Methanex Corp. 24,914 654 1,024
New Gold Inc. 278,116 690 620
NovaGold Resources Inc. 98,855 832 983
Nutrien Ltd. 232,713 15,007 17,479
Osisko Gold Royalties Ltd. 60,869 879 1,034
Osisko Mining Inc. 102,224 401 316
Pan American Silver Corp. 85,938 2,003 3,042
Pretium Resources Inc. 76,730 953 910
Sandstorm Gold Ltd. 79,804 626 781
Seabridge Gold Inc. 24,262 495 527
Silvercorp Metals Inc. 71,669 448 487
SilverCrest Metals Inc. 56,044 660 609
SSR Mining Inc. 89,521 1,800 1,733
Stelco Holdings Inc. 18,442 609 671
Stella-Jones Inc. 26,896 1,166 1,200
Teck Resources Ltd., Class 'B' 190,400 3,518 5,436
Torex Gold Resources Inc. 35,013 606 500
Turquoise Hill Resources Ltd. 40,301 855 843
Wesdome Gold Mines Ltd. 56,980 413 670
West Fraser Timber Co. Ltd. 32,592 1,378 2,900
Wheaton Precious Metals Corp. 183,703 5,006 10,038
Winpak Ltd. 12,486 584 483
Yamana Gold Inc. 394,115 3,396 2,057
108,318 136,972 11.1%
Real Estate
Allied Properties REIT 52,012 1,654 2,343
Altus Group Ltd. 16,724 580 961
Artis REIT 48,823 435 547
Boardwalk REIT 15,409 347 630
Canadian Apartment Properties REIT 70,253 2,038 4,083
Choice Properties REIT 110,911 1,410 1,585
Colliers International Group Inc. 12,555 666 1,743
Cominar REIT 67,857 815 742
Crombie REIT 38,232 491 678
CT REIT 28,808 449 472
Dream Industrial REIT 65,753 772 1,005
Dream Office REIT 15,935 339 366
First Capital REIT 89,635 1,647 1,577
FirstService Corp. 15,143 1,127 3,219
Granite REIT 26,774 1,504 2,208
H&R REIT 117,240 2,074 1,876
InterRent REIT 56,622 717 955
Killam Apartment REIT 42,229 653 856
NorthWest Healthcare Properties REIT 68,674 777 874
Real Matters Inc. 31,987 457 572
RioCan REIT 129,660 2,445 2,863
SmartCentres REIT 52,606 1,115 1,545
Summit Industrial Income REIT 63,042 757 1,120
Tricon Residential Inc. 79,174 860 1,129
WPT Industrial REIT 34,029 624 766
24,753 34,715 2.8%
CIBC Canadian Index Fund
Schedule of Investment Portfolio (unaudited) As at June 30, 2021 (cont'd)
..
..
..
..
..
..
..
..
..
..
..
..
..
..
..
..
..
..
.
.
..
.
.
..
..
..
..
..
.
.
..
..
..
..
..
.
.
..
.
.
..
.
.
..
.
.
..
..
..
..
..
.
.
..
.
..
..
.
.
..
..
..
..
..
..
.
.
..
x
x
x
..
..
..
..
.
.
..
8
The accompanying notes are an integral part of these financial statements.
Security
Number
of Shares
Average
Cost
($000s)
Fair
Value
($000s)
% of
Net
Assets
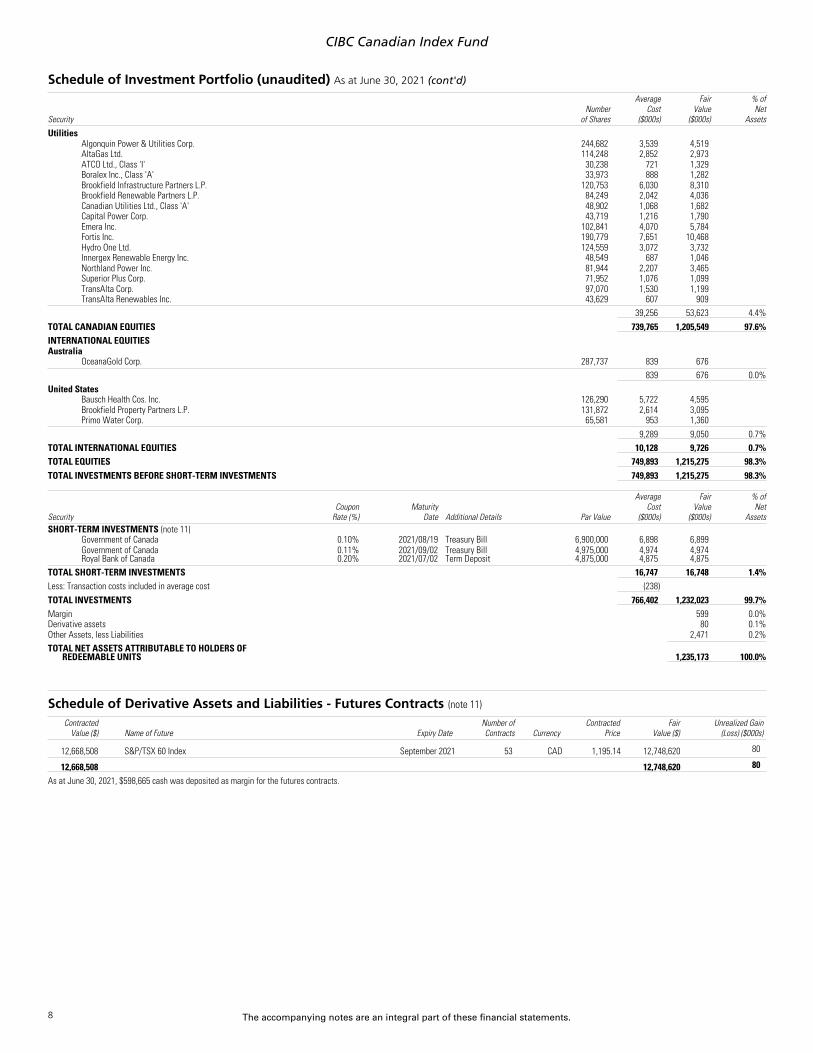
Utilities
Algonquin Power & Utilities Corp. 244,682 3,539 4,519
AltaGas Ltd. 114,248 2,852 2,973
ATCO Ltd., Class 'I' 30,238 721 1,329
Boralex Inc., Class 'A' 33,973 888 1,282
Brookfield Infrastructure Partners L.P. 120,753 6,030 8,310
Brookfield Renewable Partners L.P. 84,249 2,042 4,036
Canadian Utilities Ltd., Class 'A' 48,902 1,068 1,682
Capital Power Corp. 43,719 1,216 1,790
Emera Inc. 102,841 4,070 5,784
Fortis Inc. 190,779 7,651 10,468
Hydro One Ltd. 124,559 3,072 3,732
Innergex Renewable Energy Inc. 48,549 687 1,046
Northland Power Inc. 81,944 2,207 3,465
Superior Plus Corp. 71,952 1,076 1,099
TransAlta Corp. 97,070 1,530 1,199
TransAlta Renewables Inc. 43,629 607 909
39,256 53,623 4.4%
TOTAL CANADIAN EQUITIES 739,765 1,205,549 97.6%
INTERNATIONAL EQUITIES
Australia
OceanaGold Corp. 287,737 839 676
839 676 0.0%
United States
Bausch Health Cos. Inc. 126,290 5,722 4,595
Brookfield Property Partners L.P. 131,872 2,614 3,095
Primo Water Corp. 65,581 953 1,360
9,289 9,050 0.7%
TOTAL INTERNATIONAL EQUITIES 10,128 9,726 0.7%
TOTAL EQUITIES 749,893 1,215,275 98.3%
TOTAL INVESTMENTS BEFORE SHORT-TERM INVESTMENTS 749,893 1,215,275 98.3%
Security
Coupon
Rate (%)
Maturity
Date Additional Details Par Value
Average
Cost
($000s)
Fair
Value
($000s)
% of
Net
Assets
SHORT-TERM INVESTMENTS (note 11)
Government of Canada 0.10% 2021/08/19 Treasury Bill 6,900,000 6,898 6,899
Government of Canada 0.11% 2021/09/02 Treasury Bill 4,975,000 4,974 4,974
Royal Bank of Canada 0.20% 2021/07/02 Term Deposit 4,875,000 4,875 4,875
TOTAL SHORT-TERM INVESTMENTS 16,747 16,748 1.4%
Less: Transaction costs included in average cost (238)
TOTAL INVESTMENTS 766,402 1,232,023 99.7%
Margin 599 0.0%
Derivative assets 80 0.1%
Other Assets, less Liabilities 2,471 0.2%
TOTAL NET ASSETS ATTRIBUTABLE TO HOLDERS OF
REDEEMABLE UNITS 1,235,173 100.0%
Schedule of Derivative Assets and Liabilities - Futures Contracts (note 11)
Contracted
Value ($) Name of Future Expiry Date
Number of
Contracts Currency
Contracted
Price
Fair
Value ($)
Unrealized Gain
(Loss) ($000s)
12,668,508 S&P/TSX 60 Index September 2021 53 CAD 1,195.14 12,748,620
80
12,668,508 12,748,620
80
As at June 30, 2021, $598,665 cash was deposited as margin for the futures contracts.
CIBC Canadian Index Fund
9
The accompanying notes are an integral part of these financial statements.
Supplemental Schedule to Schedule of Investment Portfolio (unaudited)
Offsetting Arrangements (note 2d)
The Fund may enter into various master netting arrangements or other similar agreements that do not meet the criteria for offsetting in the Statements of Financial Position but still allow
for the related amounts to be set off in certain circumstances, such as bankruptcy or the termination of the contracts.
As at June 30, 2021 and December 31, 2020, the Fund did not enter into any arrangements whereby the financial instruments were eligible for offset.
Interests in Underlying Funds (note 4)
As at June 30, 2021 and December 31, 2020, the Fund had no investments in underlying funds where the ownership exceeded 20% of each underlying fund.
CIBC Canadian Index Fund
x
x
x
x
x
x
x
x
x
x
x
x
x
x
x
x
x
x
x
x
x
x
x
x
x
x
x
x
x
x
x
x
x
x
x
x
.
x
x
x
x
x
x
x
x
x
x
x
x
x
x
x
x
x
x
x
x
x
x
x
x
x
10
The accompanying notes are an integral part of these financial statements.
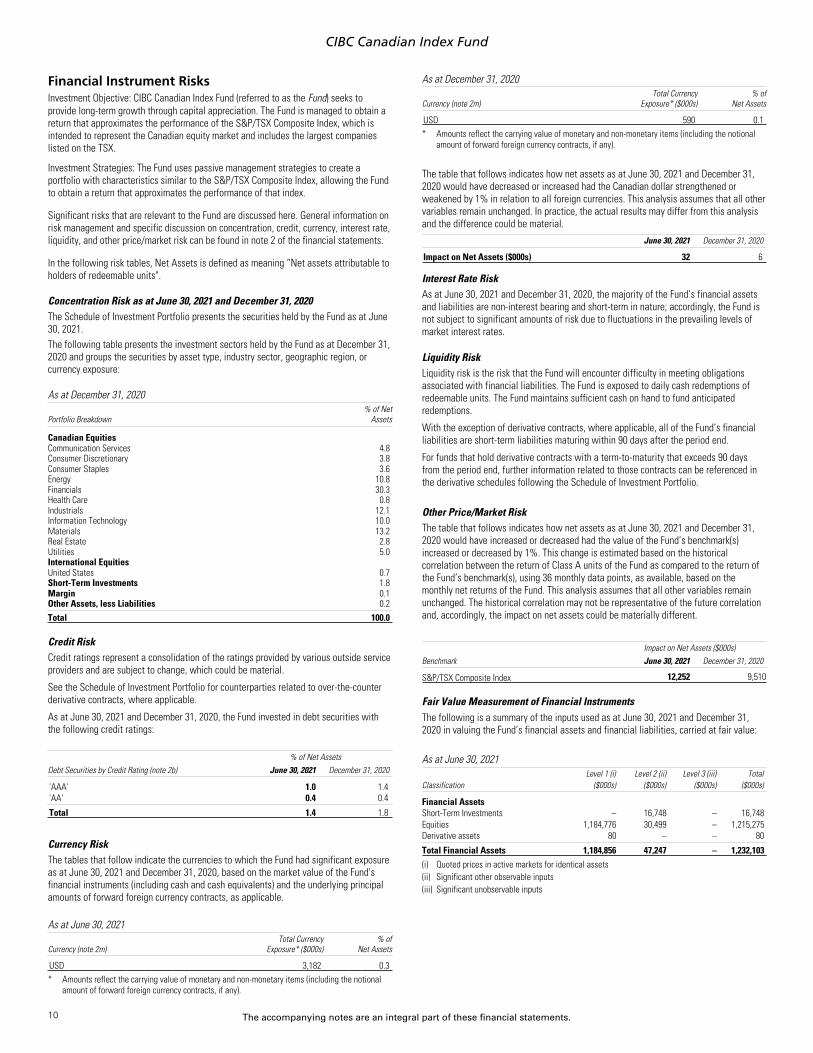
Financial Instrument Risks
Investment Objective: CIBC Canadian Index Fund (referred to as the Fund) seeks to
provide long-term growth through capital appreciation. The Fund is managed to obtain a
return that approximates the performance of the S&P/TSX Composite Index, which is
intended to represent the Canadian equity market and includes the largest companies
listed on the TSX.
Investment Strategies: The Fund uses passive management strategies to create a
portfolio with characteristics similar to the S&P/TSX Composite Index, allowing the Fund
to obtain a return that approximates the performance of that index.
Significant risks that are relevant to the Fund are discussed here. General information on
risk management and specific discussion on concentration, credit, currency, interest rate,
liquidity, and other price/market risk can be found in note 2 of the financial statements.
In the following risk tables, Net Assets is defined as meaning “Net assets attributable to
holders of redeemable units".
Concentration Risk as at June 30, 2021 and December 31, 2020
The Schedule of Investment Portfolio presents the securities held by the Fund as at June
30, 2021.
The following table presents the investment sectors held by the Fund as at December 31,
2020 and groups the securities by asset type, industry sector, geographic region, or
currency exposure:
As at December 31, 2020
Portfolio Breakdown
% of Net
Assets
Canadian Equities
Communication Services 4.8
Consumer Discretionary 3.8
Consumer Staples 3.6
Energy 10.8
Financials 30.3
Health Care 0.8
Industrials 12.1
Information Technology 10.0
Materials 13.2
Real Estate 2.8
Utilities 5.0
International Equities
United States 0.7
Short-Term Investments 1.8
Margin 0.1
Other Assets, less Liabilities 0.2
Total 100.0
Credit Risk
Credit ratings represent a consolidation of the ratings provided by various outside service
providers and are subject to change, which could be material.
See the Schedule of Investment Portfolio for counterparties related to over-the-counter
derivative contracts, where applicable.
As at June 30, 2021 and December 31, 2020, the Fund invested in debt securities with
the following credit ratings:
% of Net Assets
Debt Securities by Credit Rating (note 2b) June 30, 2021 December 31, 2020
'AAA' 1.0 1.4
'AA' 0.4 0.4
Total 1.4 1.8
Currency Risk
The tables that follow indicate the currencies to which the Fund had significant exposure
as at June 30, 2021 and December 31, 2020, based on the market value of the Fund's
financial instruments (including cash and cash equivalents) and the underlying principal
amounts of forward foreign currency contracts, as applicable.
As at June 30, 2021
Currency (note 2m)
Total Currency
Exposure* ($000s)
% of
Net Assets
USD 3,182 0.3
* Amounts reflect the carrying value of monetary and non-monetary items (including the notional
amount of forward foreign currency contracts, if any).
As at December 31, 2020
Currency (note 2m)
Total Currency
Exposure* ($000s)
% of
Net Assets
USD 590 0.1
* Amounts reflect the carrying value of monetary and non-monetary items (including the notional
amount of forward foreign currency contracts, if any).
The table that follows indicates how net assets as at June 30, 2021 and December 31,
2020 would have decreased or increased had the Canadian dollar strengthened or
weakened by 1% in relation to all foreign currencies. This analysis assumes that all other
variables remain unchanged. In practice, the actual results may differ from this analysis
and the difference could be material.
June 30, 2021 December 31, 2020
Impact on Net Assets ($000s) 32 6
Interest Rate Risk
As at June 30, 2021 and December 31, 2020, the majority of the Fund’s financial assets
and liabilities are non-interest bearing and short-term in nature; accordingly, the Fund is
not subject to significant amounts of risk due to fluctuations in the prevailing levels of
market interest rates.
Liquidity Risk
Liquidity risk is the risk that the Fund will encounter difficulty in meeting obligations
associated with financial liabilities. The Fund is exposed to daily cash redemptions of
redeemable units. The Fund maintains sufficient cash on hand to fund anticipated
redemptions.
With the exception of derivative contracts, where applicable, all of the Fund’s financial
liabilities are short-term liabilities maturing within 90 days after the period end.
For funds that hold derivative contracts with a term-to-maturity that exceeds 90 days
from the period end, further information related to those contracts can be referenced in
the derivative schedules following the Schedule of Investment Portfolio.
Other Price/Market Risk
The table that follows indicates how net assets as at June 30, 2021 and December 31,
2020 would have increased or decreased had the value of the Fund’s benchmark(s)
increased or decreased by 1%. This change is estimated based on the historical
correlation between the return of Class A units of the Fund as compared to the return of
the Fund’s benchmark(s), using 36 monthly data points, as available, based on the
monthly net returns of the Fund. This analysis assumes that all other variables remain
unchanged. The historical correlation may not be representative of the future correlation
and, accordingly, the impact on net assets could be materially different.
x
Impact on Net Assets ($000s)
Benchmark June 30, 2021 December 31, 2020
S&P/TSX Composite Index
12,252 9,510
Fair Value Measurement of Financial Instruments
The following is a summary of the inputs used as at June 30, 2021 and December 31,
2020 in valuing the Fund’s financial assets and financial liabilities, carried at fair value:
As at June 30, 2021
Classification
Level 1 (i)
($000s)
Level 2 (ii)
($000s)
Level 3 (iii)
($000s)
Total
($000s)
Financial Assets
x
Short-Term Investments – 16,748 – 16,748
Equities 1,184,776 30,499 – 1,215,275
Derivative assets 80 – – 80
Total Financial Assets 1,184,856 47,247 – 1,232,103
(i) Quoted prices in active markets for identical assets
(ii) Significant other observable inputs
(iii) Significant unobservable inputs
CIBC Canadian Index Fund
x
x
x
x
x
x
x
x
x
x
x
x
x
x
x
x
x
x
x
x
x
x
.
x
x
x
x
11
The accompanying notes are an integral part of these financial statements.
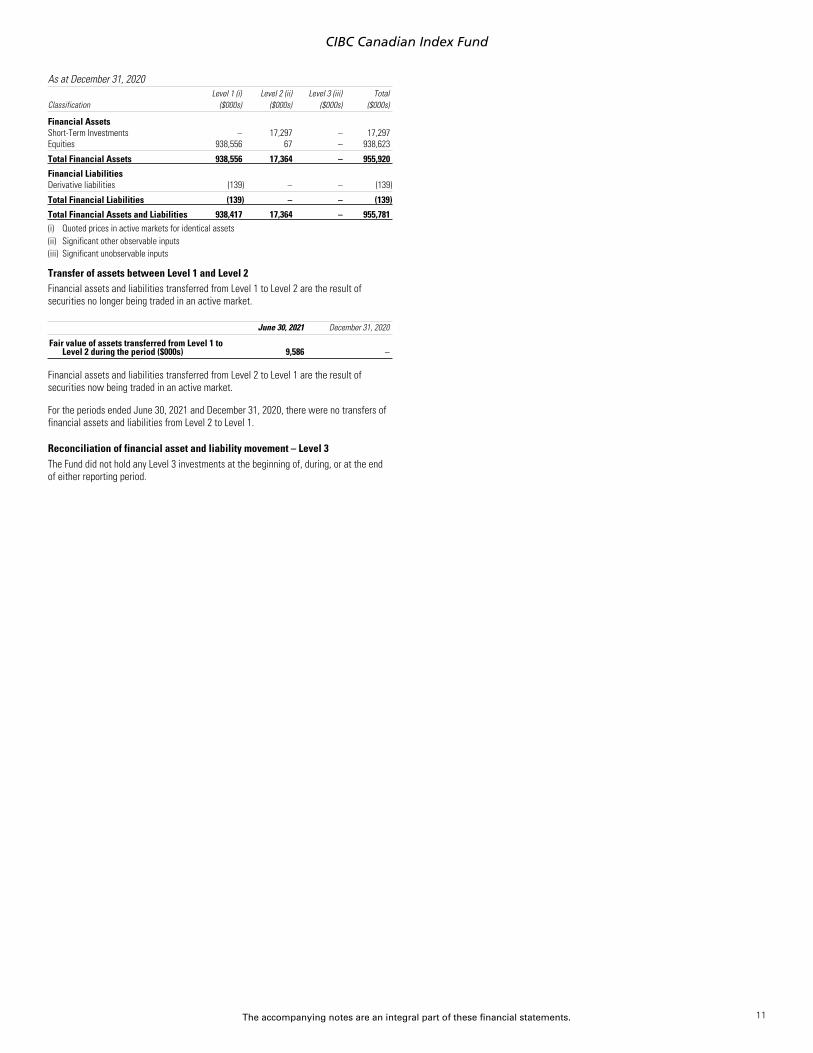
As at December 31, 2020
Classification
Level 1 (i)
($000s)
Level 2 (ii)
($000s)
Level 3 (iii)
($000s)
Total
($000s)
Financial Assets
Short-Term Investments – 17,297 – 17,297
Equities 938,556 67 – 938,623
Total Financial Assets 938,556 17,364 – 955,920
Financial Liabilities
Derivative liabilities (139) – – (139)
Total Financial Liabilities (139) – – (139)
Total Financial Assets and Liabilities 938,417 17,364 – 955,781
(i) Quoted prices in active markets for identical assets
(ii) Significant other observable inputs
(iii) Significant unobservable inputs
Transfer of assets between Level 1 and Level 2
Financial assets and liabilities transferred from Level 1 to Level 2 are the result of
securities no longer being traded in an active market.
June 30, 2021 December 31, 2020
Fair value of assets transferred from Level 1 to
Level 2 during the period ($000s) 9,586 –
Financial assets and liabilities transferred from Level 2 to Level 1 are the result of
securities now being traded in an active market.
For the periods ended June 30, 2021 and December 31, 2020, there were no transfers of
financial assets and liabilities from Level 2 to Level 1.
Reconciliation of financial asset and liability movement – Level 3
The Fund did not hold any Level 3 investments at the beginning of, during, or at the end
of either reporting period.
x
x
12
Notes to Financial Statements (unaudited)
x
As at and for the periods as disclosed in the financial statements (see note 1)
1. Organization of the Funds and Financial Reporting Periods
Each of the CIBC Mutual Funds and CIBC Family of Portfolios (referred to as individually, a Fund, and collectively, the Funds) is a mutual fund trust organized under the laws of Ontario and governed by a declaration
of trust (referred to as Declaration of Trust). The address of the Funds’ head office is Brookfield Place, 161 Bay Street, 22
nd
Floor, Toronto, Ontario M5J 2S1.
CIBC Securities Inc. is the principal distributor, Canadian Imperial Bank of Commerce (referred to as CIBC) is the manager (referred to as the Manager), and CIBC Trust Corporation is the trustee (referred to as the
Trustee) of the Funds.
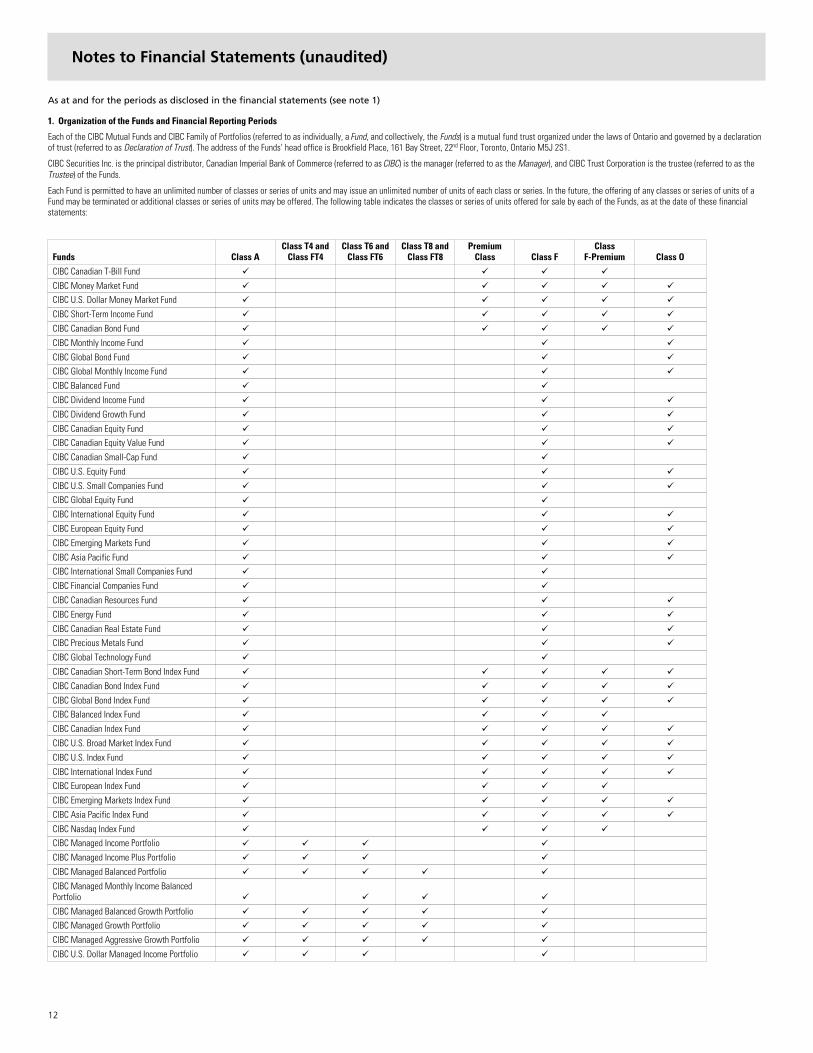
Each Fund is permitted to have an unlimited number of classes or series of units and may issue an unlimited number of units of each class or series. In the future, the offering of any classes or series of units of a
Fund may be terminated or additional classes or series of units may be offered. The following table indicates the classes or series of units offered for sale by each of the Funds, as at the date of these financial
statements:
Funds Class A
Class T4 and
Class FT4
Class T6 and
Class FT6
Class T8 and
Class FT8
Premium
Class Class F
Class
F-Premium Class O
x
CIBC Canadian T-Bill Fund
x
✓ ✓ ✓ ✓
CIBC Money Market Fund
x
✓ ✓ ✓ ✓ ✓
CIBC U.S. Dollar Money Market Fund
x
✓ ✓ ✓ ✓ ✓
CIBC Short-Term Income Fund
x
✓ ✓ ✓ ✓ ✓
CIBC Canadian Bond Fund
x
✓ ✓ ✓ ✓ ✓
CIBC Monthly Income Fund
x
✓ ✓ ✓
CIBC Global Bond Fund
x
✓ ✓ ✓
CIBC Global Monthly Income Fund
x
✓ ✓ ✓
CIBC Balanced Fund
x
✓ ✓
CIBC Dividend Income Fund
x
✓ ✓ ✓
CIBC Dividend Growth Fund
x
✓ ✓ ✓
CIBC Canadian Equity Fund
x
✓ ✓ ✓
CIBC Canadian Equity Value Fund
x
✓ ✓ ✓
CIBC Canadian Small-Cap Fund
x
✓ ✓
CIBC U.S. Equity Fund
x
✓ ✓ ✓
CIBC U.S. Small Companies Fund
x
✓ ✓ ✓
CIBC Global Equity Fund
x
✓ ✓
CIBC International Equity Fund
x
✓ ✓ ✓
CIBC European Equity Fund
x
✓ ✓ ✓
CIBC Emerging Markets Fund
x
✓ ✓ ✓
CIBC Asia Pacific Fund
x
✓ ✓ ✓
CIBC International Small Companies Fund
x
✓ ✓
CIBC Financial Companies Fund
x
✓ ✓
CIBC Canadian Resources Fund
x
✓ ✓ ✓
CIBC Energy Fund
x
✓ ✓ ✓
CIBC Canadian Real Estate Fund
x
✓ ✓ ✓
CIBC Precious Metals Fund
x
✓ ✓ ✓
CIBC Global Technology Fund
x
✓ ✓
CIBC Canadian Short-Term Bond Index Fund
x
✓ ✓ ✓ ✓ ✓
CIBC Canadian Bond Index Fund
x
✓ ✓ ✓ ✓ ✓
CIBC Global Bond Index Fund
x
✓ ✓ ✓ ✓ ✓
CIBC Balanced Index Fund
x
✓ ✓ ✓ ✓
CIBC Canadian Index Fund
x
✓ ✓ ✓ ✓ ✓
CIBC U.S. Broad Market Index Fund
x
✓ ✓ ✓ ✓ ✓
CIBC U.S. Index Fund
x
✓ ✓ ✓ ✓ ✓
CIBC International Index Fund
x
✓ ✓ ✓ ✓ ✓
CIBC European Index Fund
x
✓ ✓ ✓ ✓
CIBC Emerging Markets Index Fund
x
✓ ✓ ✓ ✓ ✓
CIBC Asia Pacific Index Fund
x
✓ ✓ ✓ ✓ ✓
CIBC Nasdaq Index Fund
x
✓ ✓ ✓ ✓
CIBC Managed Income Portfolio
x
✓ ✓ ✓✓
CIBC Managed Income Plus Portfolio
x
✓ ✓ ✓✓
CIBC Managed Balanced Portfolio
x
✓ ✓✓ ✓✓
CIBC Managed Monthly Income Balanced
Portfolio
x
✓ ✓ ✓✓
CIBC Managed Balanced Growth Portfolio
x
✓ ✓✓ ✓✓
CIBC Managed Growth Portfolio
x
✓ ✓✓ ✓✓
CIBC Managed Aggressive Growth Portfolio
x
✓ ✓✓ ✓✓
CIBC U.S. Dollar Managed Income Portfolio
✓ ✓ ✓✓
p / 2 Notes to Financial Statements (unaudited)
x
Class T4 and Class T6 and Class T8 and Class
Funds Class A Class FT4 Class FT6 Class FT8 Premium Class Class F F-Premium Class O
x
{
x
x
x
x
x
x
x
x
x
x
x
x
13
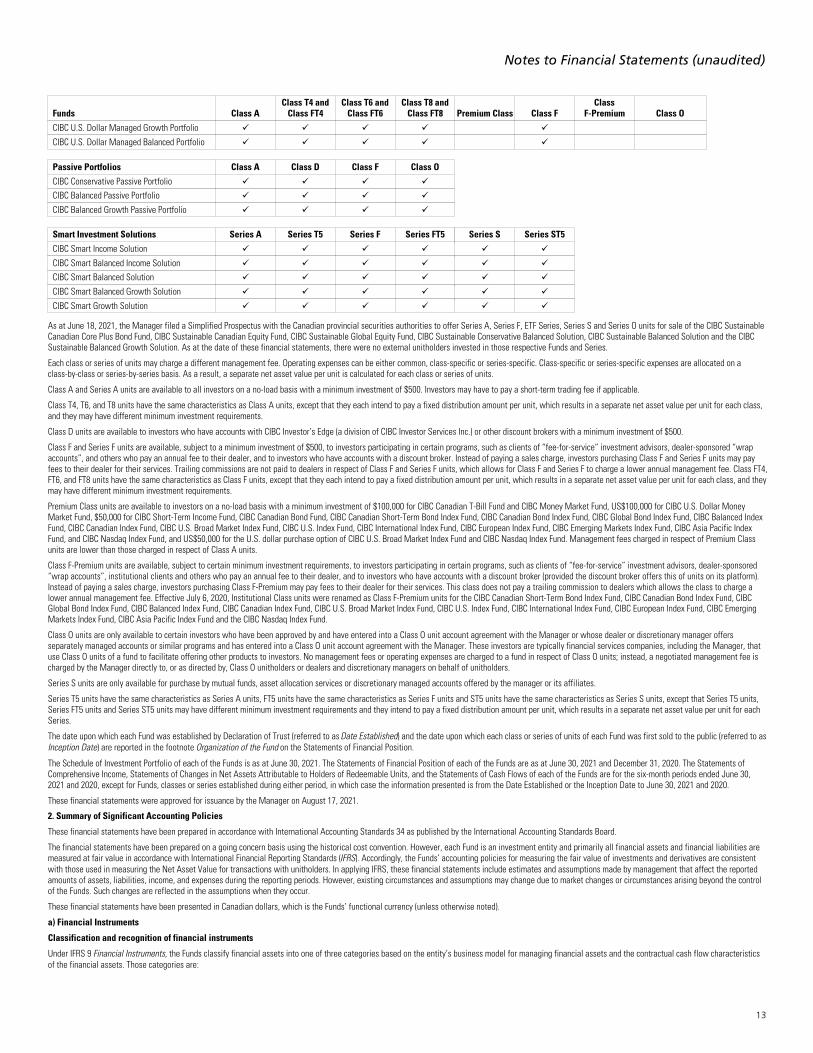
CIBC U.S. Dollar Managed Growth Portfolio
x
✓ ✓✓ ✓✓
x
CIBC U.S. Dollar Managed Balanced Portfolio
✓ ✓✓ ✓✓
Passive Portfolios Class A Class D Class F Class O
CIBC Conservative Passive Portfolio
✓ ✓ ✓ ✓
CIBC Balanced Passive Portfolio
✓ ✓ ✓ ✓
CIBC Balanced Growth Passive Portfolio
✓ ✓ ✓ ✓
Smart Investment Solutions Series A Series T5 Series F Series FT5 Series S Series ST5
CIBC Smart Income Solution
✓ ✓ ✓ ✓ ✓ ✓
CIBC Smart Balanced Income Solution
✓ ✓ ✓ ✓ ✓ ✓
CIBC Smart Balanced Solution
✓ ✓ ✓ ✓ ✓ ✓
CIBC Smart Balanced Growth Solution
✓ ✓ ✓ ✓ ✓ ✓
CIBC Smart Growth Solution
✓ ✓ ✓ ✓ ✓ ✓
As at June 18, 2021, the Manager filed a Simplified Prospectus with the Canadian provincial securities authorities to offer Series A, Series F, ETF Series, Series S and Series O units for sale of the CIBC Sustainable
Canadian Core Plus Bond Fund, CIBC Sustainable Canadian Equity Fund, CIBC Sustainable Global Equity Fund, CIBC Sustainable Conservative Balanced Solution, CIBC Sustainable Balanced Solution and the CIBC
Sustainable Balanced Growth Solution. As at the date of these financial statements, there were no external unitholders invested in those respective Funds and Series.
Each class or series of units may charge a different management fee. Operating expenses can be either common, class-specific or series-specific. Class-specific or series-specific expenses are allocated on a
class-by-class or series-by-series basis. As a result, a separate net asset value per unit is calculated for each class or series of units.
Class A and Series A units are available to all investors on a no-load basis with a minimum investment of $500. Investors may have to pay a short-term trading fee if applicable.
Class T4, T6, and T8 units have the same characteristics as Class A units, except that they each intend to pay a fixed distribution amount per unit, which results in a separate net asset value per unit for each class,
and they may have different minimum investment requirements.
Class D units are available to investors who have accounts with CIBC Investor’s Edge (a division of CIBC Investor Services Inc.) or other discount brokers with a minimum investment of $500.
Class F and Series F units are available, subject to a minimum investment of $500, to investors participating in certain programs, such as clients of “fee-for-service” investment advisors, dealer-sponsored “wrap
accounts”, and others who pay an annual fee to their dealer, and to investors who have accounts with a discount broker. Instead of paying a sales charge, investors purchasing Class F and Series F units may pay
fees to their dealer for their services. Trailing commissions are not paid to dealers in respect of Class F and Series F units, which allows for Class F and Series F to charge a lower annual management fee. Class FT4,
FT6, and FT8 units have the same characteristics as Class F units, except that they each intend to pay a fixed distribution amount per unit, which results in a separate net asset value per unit for each class, and they
may have different minimum investment requirements.
Premium Class units are available to investors on a no-load basis with a minimum investment of $100,000 for CIBC Canadian T-Bill Fund and CIBC Money Market Fund, US$100,000 for CIBC U.S. Dollar Money
Market Fund, $50,000 for CIBC Short-Term Income Fund, CIBC Canadian Bond Fund, CIBC Canadian Short-Term Bond Index Fund, CIBC Canadian Bond Index Fund, CIBC Global Bond Index Fund, CIBC Balanced Index
Fund, CIBC Canadian Index Fund, CIBC U.S. Broad Market Index Fund, CIBC U.S. Index Fund, CIBC International Index Fund, CIBC European Index Fund, CIBC Emerging Markets Index Fund, CIBC Asia Pacific Index
Fund, and CIBC Nasdaq Index Fund, and US$50,000 for the U.S. dollar purchase option of CIBC U.S. Broad Market Index Fund and CIBC Nasdaq Index Fund. Management fees charged in respect of Premium Class
units are lower than those charged in respect of Class A units.
Class F-Premium units are available, subject to certain minimum investment requirements, to investors participating in certain programs, such as clients of “fee-for-service” investment advisors, dealer-sponsored
“wrap accounts”, institutional clients and others who pay an annual fee to their dealer, and to investors who have accounts with a discount broker (provided the discount broker offers this of units on its platform).
Instead of paying a sales charge, investors purchasing Class F-Premium may pay fees to their dealer for their services. This class does not pay a trailing commission to dealers which allows the class to charge a
lower annual management fee. Effective July 6, 2020, Institutional Class units were renamed as Class F-Premium units for the CIBC Canadian Short-Term Bond Index Fund, CIBC Canadian Bond Index Fund, CIBC
Global Bond Index Fund, CIBC Balanced Index Fund, CIBC Canadian Index Fund, CIBC U.S. Broad Market Index Fund, CIBC U.S. Index Fund, CIBC International Index Fund, CIBC European Index Fund, CIBC Emerging
Markets Index Fund, CIBC Asia Pacific Index Fund and the CIBC Nasdaq Index Fund.
Class O units are only available to certain investors who have been approved by and have entered into a Class O unit account agreement with the Manager or whose dealer or discretionary manager offers
separately managed accounts or similar programs and has entered into a Class O unit account agreement with the Manager. These investors are typically financial services companies, including the Manager, that
use Class O units of a fund to facilitate offering other products to investors. No management fees or operating expenses are charged to a fund in respect of Class O units; instead, a negotiated management fee is
charged by the Manager directly to, or as directed by, Class O unitholders or dealers and discretionary managers on behalf of unitholders.
Series S units are only available for purchase by mutual funds, asset allocation services or discretionary managed accounts offered by the manager or its affiliates.
Series T5 units have the same characteristics as Series A units, FT5 units have the same characteristics as Series F units and ST5 units have the same characteristics as Series S units, except that Series T5 units,
Series FT5 units and Series ST5 units may have different minimum investment requirements and they intend to pay a fixed distribution amount per unit, which results in a separate net asset value per unit for each
Series.
The date upon which each Fund was established by Declaration of Trust (referred to as Date Established) and the date upon which each class or series of units of each Fund was first sold to the public (referred to as
Inception Date) are reported in the footnote Organization of the Fund on the Statements of Financial Position.
The Schedule of Investment Portfolio of each of the Funds is as at June 30, 2021. The Statements of Financial Position of each of the Funds are as at June 30, 2021 and December 31, 2020. The Statements of
Comprehensive Income, Statements of Changes in Net Assets Attributable to Holders of Redeemable Units, and the Statements of Cash Flows of each of the Funds are for the six-month periods ended June 30,
2021 and 2020, except for Funds, classes or series established during either period, in which case the information presented is from the Date Established or the Inception Date to June 30, 2021 and 2020.
These financial statements were approved for issuance by the Manager on August 17, 2021.
2. Summary of Significant Accounting Policies
These financial statements have been prepared in accordance with International Accounting Standards 34 as published by the International Accounting Standards Board.
The financial statements have been prepared on a going concern basis using the historical cost convention. However, each Fund is an investment entity and primarily all financial assets and financial liabilities are
measured at fair value in accordance with International Financial Reporting Standards (IFRS). Accordingly, the Funds’ accounting policies for measuring the fair value of investments and derivatives are consistent
with those used in measuring the Net Asset Value for transactions with unitholders. In applying IFRS, these financial statements include estimates and assumptions made by management that affect the reported
amounts of assets, liabilities, income, and expenses during the reporting periods. However, existing circumstances and assumptions may change due to market changes or circumstances arising beyond the control
of the Funds. Such changes are reflected in the assumptions when they occur.
These financial statements have been presented in Canadian dollars, which is the Funds’ functional currency (unless otherwise noted).
a) Financial Instruments
Classification and recognition of financial instruments
Under IFRS 9 Financial Instruments, the Funds classify financial assets into one of three categories based on the entity’s business model for managing financial assets and the contractual cash flow characteristics
of the financial assets. Those categories are:
Notes to Financial Statements (unaudited) p / 3
14
• Amortized Cost - Assets held within a business model whose objective is to collect cash flows and where the contractual cash flows of the assets are solely payments of principal and interest (SPPI
criterion). Amortization of the asset is calculated utilizing the Effective Interest Rate Method.
• Fair Value Through Other Comprehensive Income (referred to as FVOCI) - Financial assets such as debt instruments that meet the SPPI criterion and are held within a business model with objectives that
include both collecting the associated contractual cash flows and selling financial assets. Gains and losses are reclassified to profit or loss upon derecognition for debt instruments but remain in other
comprehensive income for equity instruments.
• Fair Value Through Profit or Loss (referred to as FVTPL) - A financial asset is measured at FVTPL unless it is measured at Amortized Cost or FVOCI. Derivative contracts are measured at FVTPL. For all
instruments classified as FVTPL, the gains and losses are recognized in profit or loss.
Financial liabilities are classified at FVTPL when they meet the definition of held-for-trading or when they are designated as FVTPL on initial recognition using the fair value option.
The Manager has assessed the business models of the Funds and has determined that the Funds’ portfolio of financial assets and financial liabilities are managed and performance is evaluated on a fair value basis
in accordance with the Funds’ risk management and investment strategies; therefore, classification and measurement of financial assets is FVTPL.
All Funds have contractual obligations to distribute cash to the unitholders. As a result, each Fund's obligation for net assets attributable to holders of redeemable units represents a financial liability and is
presented at the redemption amount.
b) Risk Management
The Funds’ overall risk management approach includes formal guidelines that govern the extent of exposure to various types of risk, including diversification within asset classes and limits on the exposure to
individual investments and counterparties. In addition, derivative financial instruments may be used to manage certain risk exposures. The Manager also has various internal controls to oversee the Funds’
investment activities, including monitoring compliance with the investment objectives and strategies, internal guidelines, and securities regulations. Please refer to each Fund’s Supplemental Schedule to Schedule
of Investment Portfolio for specific risk disclosures.
Fair value of financial instruments by using valuation techniques
Financial instruments are valued at their fair value, which is defined as the price that would be received to sell an asset or paid to transfer a liability in an orderly transaction between market participants at the
measurement date. Refer to notes 3a to 3f for valuation of each specific type of financial instrument held by the Funds. The fair value of financial assets and liabilities traded in active markets are based on quoted
market prices at the close of trading on the reporting date. The Funds use the last traded market price for both financial assets and financial liabilities where the last traded price falls within that day’s bid-ask
spread. In circumstances where the last traded price is not within the bid-ask spread, the Manager determines the price that is most representative of fair value based on the specific facts and circumstances.
For financial assets and financial liabilities that are not traded in an active market, fair value is determined using valuation techniques.
The Funds classify fair value measurement within a hierarchy, which gives the highest priority to unadjusted quoted prices in active markets for identical assets or liabilities (referred to as Level 1) and the lowest
priority to unobservable inputs (referred to as Level 3). The three levels of the fair value hierarchy are:
Level 1: Quoted prices (unadjusted) in active markets for identical assets or liabilities that the entity can access at the measurement date;
Level 2: Inputs other than quoted prices included within Level 1 that are observable for the asset or liability, either directly or indirectly; and
Level 3: Inputs are unobservable for the asset or liability.
If inputs are used to measure an asset’s or a liability’s fair value, the classification within the hierarchy is based on the lowest level input that is significant to the fair value measurement. Each Fund’s fair value
hierarchy classification of its assets and liabilities is included in the Supplemental Schedule to Schedule of Investment Portfolio.
The carrying values of all non-investment assets and liabilities approximate their fair values due to their short-term nature. Fair values are classified as Level 1 when the related security or derivative is actively
traded and a quoted price is available. If an instrument classified as Level 1 subsequently ceases to be actively traded, it is transferred out of Level 1. In such cases, instruments are reclassified into Level 2, unless
the measurement of its fair value requires the use of significant unobservable inputs, in which case it is classified as Level 3.
The Manager is responsible for performing the fair value measurements included in the financial statements of a Fund, including the Level 3 measurements. The Manager obtains pricing from third-party pricing
vendors and the pricing is reviewed daily. At each financial reporting date, the Manager reviews and approves all Level 3 fair value measurements. The Funds also have a Valuation Committee that meets quarterly
to perform detailed reviews of the valuations of investments held by the Funds, which includes discussion on Level 3 measurements.
Credit risk
Credit risk is the risk that a counterparty to a financial instrument, such as a fixed income security or a derivative contract, will fail to discharge an obligation or commitment that it has entered into with the Funds.
The value of fixed income securities and derivatives as presented on the Schedule of Investment Portfolio includes consideration of the creditworthiness of the issuer and, accordingly, represents the maximum
credit risk exposure of the Funds. Certain Funds may invest in short-term fixed income securities issued or guaranteed primarily by the Government of Canada or, any Canadian provincial or Canadian municipal
government, obligations of Canadian chartered banks or trust companies, and commercial paper with approved credit ratings. The risk of default on these short-term fixed income securities is considered low and
these securities primarily have credit ratings of "A-1 (Low)" or higher (as rated by S&P Global Ratings, a division of S&P Global, or equivalent rating from another rating service).
The bond ratings noted in the Funds’ "Financial Instruments Risk" under sub-section "Credit Risk" represent ratings collected and disseminated by recognized third-party vendors. These ratings utilized by the
Manager, while obtained from vendors skilled and recognized for bond rating services, may not be the same as those used directly by the portfolio advisor or portfolio sub-advisors. Ratings used by the portfolio
advisor or portfolio sub-advisors could be higher or lower than those used for risk disclosure in the financial statements in compliance with their investment policy guidelines.
The Funds may engage in securities lending transactions. The credit risk related to securities lending transactions is limited by the fact that the value of cash or securities held as collateral by the Funds in
connection with these transactions is at least 102% of the fair value of the securities loaned. The collateral and loaned securities are marked to market on each business day. Further information regarding the
collateral and securities on loan can be found in the footnotes to the Statements of Financial Position and in note 2j.
Currency risk
Currency risk is the risk that the value of an investment will fluctuate due to changes in foreign exchange rates. Mutual funds may invest in securities denominated or traded in currencies other than the Funds’
reporting currency.
Interest rate risk
Prices of fixed income securities generally increase when interest rates decline and decrease when interest rates rise. This risk is known as interest rate risk. Prices of longer-term fixed income securities will
generally fluctuate more in response to interest rate changes than would shorter-term securities. Due to the nature of short-term fixed income securities with a remaining term-to-maturity of less than one year,
these investments are not generally exposed to a significant risk that their value will fluctuate in response to changes in the prevailing levels of market interest rates.
Liquidity risk
The Funds are exposed to daily cash redemptions of redeemable units. Generally, the Funds retain sufficient cash and cash equivalent positions to maintain adequate liquidity. However, liquidity risk also involves
the ability to sell an asset for cash easily and at a fair price. Some securities are illiquid due to legal restrictions on their resale, the nature of the investment, or simply a lack of interested buyers for a particular
security or security type. Certain securities may become less liquid due to changes in market conditions, such as interest rate changes or market volatility, which could impair the ability of a Fund to sell such
securities quickly or at a fair price. Difficulty in selling securities could result in a loss or a lower return for a Fund.
Other price/market risk
Other price/market risk is the risk that the value of investments will fluctuate as a result of changes in market conditions. Several factors can influence market trends, such as economic developments, changes in
interest rates, political changes, and catastrophic events, such as pandemics or disasters which occur naturally or are exacerbated by climate change. Pandemics such as coronavirus disease 2019 (referred to as
COVID-19) may adversely affect global markets and the performance of the Funds. All investments are exposed to other price/market risk.
c) Investment Transactions, Income Recognition, and Recognition of Realized and Unrealized Gains and Losses
i) Interest for distribution purposes shown on the Statements of Comprehensive Income represents the coupon interest received by the Funds accounted for on an accrual basis. The Funds do not amortize
premiums paid or discounts received on the purchase of fixed income securities except for zero coupon bonds, which are amortized on a straight-line basis.
p / 4 Notes to Financial Statements (unaudited)
15
ii) Dividend income is recorded on the ex-dividend date.
iii) Investment transactions are recorded on a trade date basis. Securities that are exchange-traded are recorded at fair value established by the last traded market price when that price falls within that
day’s bid-ask spread. Debt securities are recorded at fair value, established by the last traded price on the over-the-counter market (referred to as OTC) when that price falls within that day’s bid-ask
spread. In circumstances where the last traded price is not within the bid-ask spread, the Manager determines the price that is most representative of fair value based on the specific facts and
circumstances. Gold bullion recorded at fair value established by the last traded market price when the price falls within that day’s bid-ask spread. Unlisted securities are recorded at fair value using fair
valuation techniques established by the Manager in establishing a fair value.
iv) Realized gains and losses on investments and unrealized appreciation or depreciation of investments are calculated using the average cost, excluding transaction costs, of the related investments.
v) Investment income is the sum of income paid to the Fund that is generated from a Fund’s investment fund holdings.
vi) Other income is the sum of income, excluding transaction costs, other than that which is separately classified on the Statements of Comprehensive Income.
d) Offsetting
Financial assets and liabilities are offset and the net amount reported in the Statements of Financial Position, if there is a currently enforceable legal right to offset the recognized amounts and there is an intention
to settle on a net basis, or to realize the asset and settle the liability simultaneously.
Where applicable, additional information can be found in the table Offsetting Arrangements as part of the Supplemental Schedule to Schedule of Investment Portfolio. This supplemental schedule discloses the OTC
derivatives which are subject to offsetting.
e) Portfolio Securities
The cost of securities of a Fund is determined in the following manner: securities are purchased and sold at a market-traded price to arrive at a value for the position traded. The total purchased value represents the
total cost of the security to the Fund. When additional units of the same security are purchased, the cost of those additional units is added to the total security cost. When units of the same security are sold, the
proportionate cost of the units of the security sold is deducted from the total security cost. If there is a return of capital paid by a security, the amount of this return of capital is deducted from the total security cost.
This method of tracking security cost is known as “average cost” and the current total for any one security is referred to as the “adjusted cost base” or “ACB” of the security. Transaction costs incurred in portfolio
transactions are excluded from the average cost of investments and are recognized immediately in Increase (Decrease) in Net Assets Attributable to Holders of Redeemable Units and are presented as a separate
expense item in the financial statements.
The difference between the fair value of securities and their average cost, excluding transaction costs, represents the unrealized appreciation (depreciation) in value of the portfolio investments. The applicable
period change in unrealized appreciation (depreciation) of investments is included on the Statements of Comprehensive Income.
Short-term investments on the Schedule of Investment Portfolio are presented at their amortized cost which approximates the fair value. Accrued interest for bonds is disclosed separately on the Statements of
Financial Position.
f) Foreign Exchange
The value of investments and other assets and liabilities denominated in foreign currencies is translated into Canadian dollars, which is the Funds’ functional and presentation currency (except for CIBC U.S. Dollar
Money Market Fund, CIBC U.S. Dollar Managed Income Portfolio, CIBC U.S. Dollar Managed Balanced Portfolio, and CIBC U.S. Dollar Managed Growth Portfolio, which are valued in U.S. dollars) at the current rates
prevailing on each valuation date.
Purchases and sales of investments, income, and expenses are translated into Canadian dollars, which is the Funds’ functional and presentation currency (with the exception of the above-mentioned Funds which
are valued in U.S. dollars) at the foreign exchange rates prevailing on the dates of such transactions. Foreign currency translation gains (losses) on investments and income transactions are included in Net realized
gain (loss) on foreign currency and in Income, respectively, on the Statements of Comprehensive Income.
g) Forward Foreign Currency Contracts
The Funds may enter into forward foreign currency contracts for either hedging or non-hedging purposes where such activity is consistent with their investment objectives and as permitted by the Canadian
securities regulatory authorities.
Changes in the fair value of forward foreign currency contracts are included in derivative assets or derivative liabilities on the Statements of Financial Position, and are recorded as an Increase (decrease) in
unrealized appreciation (depreciation) of investments and derivatives during the applicable period on the Statements of Comprehensive Income.
The gain or loss arising from the difference between the value of the original forward foreign currency contract and the value of such contract at close or delivery is realized and recorded as Net realized gain (loss)
on foreign currency for Funds that use the forward foreign currency contracts for hedging, or as Derivative income (loss) from forward foreign currency contracts for Funds that do not use the forward foreign
currency contracts for hedging.
h) Futures Contracts
The Funds may enter into futures contracts for either hedging or non-hedging purposes where such activity is consistent with their investment objectives and as permitted by the Canadian securities regulatory
authorities.
The margin deposits with brokers relating to futures contracts are included in Margin on the Statements of Financial Position. Any change in the margin requirement is settled daily and included in Receivable for
portfolio securities sold or Payable for portfolio securities purchased on the Statements of Financial Position.
Any difference between the settlement value at the close of business on each valuation date and the settlement value at the close of business on the previous valuation date is recorded as Derivative income (loss)
from futures contracts on the Statements of Comprehensive Income.
i) Options
The Funds may enter into options contracts for either hedging or non-hedging purposes where such activity is consistent with their investment objectives and as permitted by the Canadian securities regulatory
authorities.
Premiums paid for purchased call and put options are included in derivative assets and subsequently measured at fair value on the Statements of Financial Position. When a purchased option expires, the Fund will
realize a loss in the amount of the cost of the option. For a closing transaction, the Fund will realize a gain or loss depending on whether the proceeds are greater or less than the premium paid at the time of
purchase. When a purchased call option is exercised, the cost of the security purchased is increased by the premium paid at the time of purchase.
Premiums received from writing options are included in derivative liabilities and subsequently measured at fair value on the Statements of Financial Position as initial reductions in the value of investments.
Premiums received from writing options that expire unexercised are recorded as realized gains and reported as Net gain (loss) on sale of investments and derivatives on the Statements of Comprehensive Income.
For a closing transaction, if the cost of closing the transaction exceeds the premium received, the Fund will record a realized loss or, if the premium received at the time the option was written is greater than the
amount paid, the Fund will record a realized gain and is reported as Net gain (loss) on sale of investments and derivatives. If a written put option is exercised, the cost for the security delivered is reduced by the
premiums received at the time the option was written.
j) Securities Lending
A Fund may lend portfolio securities in order to earn additional revenue, which is disclosed on the Statements of Comprehensive Income. The loaned assets of any one Fund are not permitted to exceed 50% of the
fair value of the assets of that Fund (excluding collateral debt for the loaned securities). The minimum allowable collateral is 102% of the fair value of the loaned securities as per the requirements of National
Instrument 81-102 – Investment Funds. Collateral can consist of the following:
i) Cash.
ii) Qualified securities.
iii) Irrevocable letters of credit issued by a Canadian financial institution that is not the counterparty, or an affiliate counterparty, of the fund in the transaction, if evidences of indebtedness of the Canadian
financial institution that are rated as short-term debt by an approved credit rating organization have an approved credit rating.
iv) Securities that are immediately convertible into securities of the same issuer, class, or type, and the same term, as the securities loaned.
Notes to Financial Statements (unaudited) p / 5
x
x
..
..
..
..
..
..
..
..
..
..
..
..
..
..
..
..
..
..
..
..
..
..
..
..
..
x
x
x
x
x
x
x
x
16
The fair value of the loaned securities is determined on the close of any valuation date and any additional required collateral is delivered to the Fund on the next business day. The securities on loan continue to be
included on the Schedule of Investment Portfolio and are included in the total value on the Statements of Financial Position in Investments (non-derivative financial assets) at fair value. Where applicable, a Fund’s
securities lending transactions are reported in the footnote Securities Lending on the Statements of Financial Position.
National Instrument 81-106 – Investment Fund Continuous Disclosure requires a reconciliation of the gross income amount generated from the securities lending transactions of the Funds to the revenue from
securities lending disclosed in the Funds’ Statements of Comprehensive Income. The gross amount generated from securities lending includes interest paid on collateral, withholding taxes deducted, the fees paid to
the Funds’ lending agent and the securities lending revenue received by the Funds. Where applicable, the reconciliation can be found in the footnotes to the Funds’ Statements of Comprehensive Income.
k) Multi-Class or Multi-Series Structured Funds
The realized and unrealized capital gains or losses, income, and common expenses (other than class-specific or series-specific operating expenses and management fees) of the Fund are allocated on each valuation
date to the unitholders in proportion to the respective prior day’s net asset value, which includes unitholder trades dated for that day, of each class or series of units at the date on which the allocation is made. All
class-specific or series-specific operating expenses and management fees do not require allocation. All class-specific or series-specific operating expenses are paid by the Manager and are collected from the Funds
on a recoverable basis.
l) Loans and Receivables, Other Assets and Liabilities
Loans and receivables, other assets and liabilities are recorded at cost, which approximates their fair value, with the exception of net assets attributable to holders of redeemable units which are presented at the
redemption value.
m) Legend of Abbreviations
The following is a list of abbreviations (foreign currency translation and others) that may be used on the Schedule of Investment Portfolio:
Currency Abbreviations
AED – United Arab Emirates Dirham
ARS – Argentine Peso
AUD – Australian Dollar
BRL – Brazilian Real
CAD – Canadian Dollar
CHF – Swiss Franc
CLP – Chilean Peso
CNY – Chinese Renminbi
COP – Colombian Peso
CZK – Czech Koruna
DKK – Danish Krone
EGP – Egyptian Pound
EUR – Euro
GBP – British Pound
HKD – Hong Kong Dollar
HUF – Hungarian Forint
IDR – Indonesian Rupiah
ILS – Israeli Shekel
INR – Indian Rupee
JOD – Jordanian Dinars
JPY – Japanese Yen
KRW – South Korean Won
MAD – Morocco Dirham
MXN – Mexican Peso
MYR – Malaysian Ringgit
NOK – Norwegian Krone
NZD – New Zealand Dollar
PEN – Peruvian Nuevo Sol
PHP – Philippine Peso
PKR – Pakistan Rupee
PLN – Polish Zloty
QAR – Qatari Riyal
RUB – Russian Ruble
SAR – Saudi Riyal
SEK – Swedish Krona
SGD – Singapore Dollar
THB – Thai Baht
TRY – New Turkish Lira
TWD – Taiwan Dollar
USD – United States Dollar
ZAR – South African Rand
Other Abbreviations
ADR – American Depositary Receipt
CVO – Contingent Value Obligations
ELN – Equity Linked Note
ETF – Exchange-Traded Fund
GDR – Global Depositary Receipt Securities
NVDR – Non-Voting Depositary Receipt
n) Increase (Decrease) in Net Assets Attributable to Holders of Redeemable Units per Unit
Increase (decrease) in net assets attributable to holders of redeemable units per unit of each class or series is calculated by dividing the Increase (decrease) in net assets attributable to holders of redeemable
units (excluding distributions), as reported on the Statements of Comprehensive Income, by the weighted average number of units in issue during the related period.
3. Valuation of Investments
The valuation date (referred to as Valuation Date) for a Fund is any day when the Manager’s head office is open for business. The Manager may, at its discretion, establish other Valuation Dates.
The value of the investments or assets of a Fund is determined as follows:
a) Cash and Other Assets
Cash, accounts receivable, dividends receivable, distributions receivable, and interest receivable are valued at fair value or at their recorded cost, plus or minus any foreign exchange between recognition of the
asset by the Fund and the current Valuation Date, which approximates fair value.
b) Bonds, Debentures, and Other Debt Obligations
Bonds, debentures, and other debt obligations are fair valued using the last traded price provided by a recognized vendor upon the close of trading on a Valuation Date, whereby the last traded price falls within
that day’s bid-ask spread. If the last traded price does not fall within that day’s bid-ask spread, the Manager will then determine the price that is most representative of fair value based on the specific facts and
circumstances.
c) Listed Securities, Unlisted Securities and Fair Value Pricing of Foreign Securities
Any security that is listed or traded on a securities exchange is fair valued using the last traded price, whereby the last traded price falls within that day’s bid-ask spread or, if there is no traded price on that
exchange or the last traded price does not fall within that day’s bid-ask spread and in the case of securities traded on an OTC market, at the fair value as determined by the Manager as an appropriate basis for
valuation. In such situations, a fair value will be determined by the Manager to establish current value. If any securities are inter-listed or traded on more than one exchange or market, the Manager will use the
principal exchange or market for the fair value of such securities.
Units of each mutual fund in which a Fund invests will be valued at fair value using the most recent net asset value quoted by the Trustee or Manager of the mutual fund on the Valuation Date.
Unlisted securities are fair valued using the last traded price quoted by a recognized dealer, or the Manager may determine a price that more accurately reflects the fair value of these securities if the Manager
feels the last traded price does not reflect fair value.
p / 6 Notes to Financial Statements (unaudited)
17
Fair value pricing is designed to avoid stale prices and to provide a more accurate fair value, and may assist in the deterrence of harmful short-term or excessive trading in the Fund. When securities listed or
traded on markets or exchanges that close prior to North or South American markets or exchanges are valued by the Manager at their fair market value, instead of using quoted or published prices, the prices of
such securities used to calculate the Fund’s net assets or net asset value may differ from quoted or published prices of such securities.
d) Derivatives
Long positions in options, debt-like securities, and listed warrants are fair valued using the last traded price as established on either their principal trading exchange or by a recognized dealer in such securities,
whereby the last traded price falls within that day’s bid-ask spread and the credit rating of each counterparty (as rated by S&P Global Ratings, a division of S&P Global) meets or exceeds the minimum designated
rating.
When any option is written by any Fund, the premium received by the Fund will be reflected as a liability that will be valued at an amount equal to the current fair value of the option that would have the effect of
closing the position. Any difference resulting from revaluation shall be treated as an unrealized gain or loss on investment; the liability shall be deducted in arriving at the net assets attributable to holders of
redeemable units of the Fund. The securities that are the subject of a written option, if any, will be valued in the manner described above for listed securities.
Futures contracts, forward contracts, or swaps will be valued at fair value of the gain or loss, if any, that would be realized on the Valuation Date if the position in the futures contracts, forward contracts, or
swaps were to be closed out.
Margin paid or deposited in respect of futures contracts and forward contracts will be reflected as an account receivable and margin consisting of assets other than cash will be noted as held as collateral.
Other derivatives and margin are fair valued in a manner that the Manager determines to represent their fair value.
e) Restricted Securities
Restricted securities purchased by any Fund will be fair valued in a manner that the Manager determines to represent their fair value.
f) Other Investments
All other investments of the Funds will be fair valued in accordance with the laws of the Canadian securities regulatory authorities where applicable.
The value of any security or other property of a Fund for which a market quotation is not readily available or where the market quotations do not properly reflect the fair value of such securities will be determined
by the Manager by valuing the securities at their fair value. In such situations, fair value will be determined using fair valuation techniques that most accurately reflect their fair value as established by the
Manager.
4. Interest in Underlying Funds
The Funds may invest in other investment funds (referred to as Underlying Funds). Each Underlying Fund invests in a portfolio of assets to generate returns in the form of investment income and capital
appreciation for its unitholders. Each Underlying Fund finances its operations primarily through the issuance of redeemable units, which are puttable at the unitholder’s option and entitle the unitholder to a
proportionate share of the Underlying Fund’s net assets. The funds’ interests in Underlying Funds held in the form of redeemable units, are reported in their Schedule of Investments at fair value, which represents
the Funds’ maximum exposure on those investments. The Funds' interests in Underlying Funds as at the prior year period ends are presented in the "Financial Instruments Risks" section under sub-section
"Concentration Risk" in the Supplemental Schedule to Schedule of Investment Portfolio. Distributions earned from Underlying Funds are included in “Investment Income” in the Statements of Comprehensive
Income. The total realized and change in unrealized gains (losses) arising from Underlying Funds are also included in the Statements of Comprehensive Income. The Funds do not provide any additional significant
financial or other support to Underlying Funds.
Where applicable, the table “Interests in Underlying Funds” presented as part of the Supplemental Schedule to Schedule of Investment Portfolio, provides additional information on the Funds’ investments in
Underlying Funds where the ownership interest exceeds 20% of each Underlying Fund.
5. Redeemable Units Issued and Outstanding
Each Fund is permitted to have an unlimited number of classes or series of units and may issue an unlimited number of units of each class or series. The outstanding units represent the net assets attributable to
holders of redeemable units of a Fund. Each unit has no par value and the value of each unit is the net asset value as determined on each valuation date. Settlement of the cost for units issued is completed as per
security regulations in place at the time of issue. Distributions made by a Fund and reinvested by unitholders in additional units also constitute issued redeemable units of a Fund.
Units are redeemed at the net assets attributable to holders of a redeemable unit per unit of a Fund. A right to redeem units of a Fund may be suspended with the approval of the Canadian securities regulatory
authorities or when normal trading is suspended on a stock, options, or futures exchange within Canada or outside of Canada on which securities or derivatives that make up more than 50% of the value or
underlying exposure of the total assets of a Fund, not including any liabilities of a Fund, are traded and when those securities or derivatives are not traded on any other exchange that represents a reasonably
practical alternative for a Fund. The Fund is not subject to any externally imposed capital requirements.
The capital received by a Fund is utilized within the respective investment mandate of the Fund. This includes the ability to make liquidity available to satisfy unitholder unit redemption requirements upon a
unitholder’s request.
Changes in issued and outstanding units for the six-month periods ended June 30, 2021 and 2020 can be found on the Statements of Changes in Net Assets Attributable to Holders of Redeemable Units.
x
6. Management Fees and Operating Expenses
Management fees are based on the net asset value of the Funds and are calculated daily. Management fees are paid to the Manager in consideration for providing, or arranging for the provision of, management,
distribution, and portfolio advisory services. The maximum annual management fee expressed as a percentage of the average net asset value for each class or series of units of the Fund is reported in footnote
Maximum Chargeable Annual Management Fee Rates on the Statements of Comprehensive Income. For Class O units, management fees are negotiated with and paid by, or as directed by, unitholders, or dealers
and discretionary managers on behalf of unitholders.
In addition to the management fees, the Funds are responsible for all expenses relating to the operation and conduct of the business of the Funds, including interest, operating, and administrative costs (other than
advertising and promotional expenses, which are the responsibility of the Manager), brokerage fees, commissions, spreads, regulatory fees, Independent Review Committee fees, taxes, audit and legal fees and
expenses, safekeeping and custodial fees, investor servicing costs, and costs of unitholder reports, prospectuses, and other reports. All class-specific or series-specific operating expenses are paid by the Manager
and recovered from the Funds. The Funds do not pay a fee to the Trustee.
The Manager may recover from a Fund less than the actual class-specific or series-specific operating expenses paid by the Manager, resulting in the Manager absorbing class-specific or series-specific expenses.
The Manager may also charge to a Fund less than the maximum management fee in footnote Maximum Chargeable Annual Management Fee Rates on the Statements of Comprehensive Income, resulting in the
Manager waiving management fees.
At its sole discretion, the Manager may stop absorbing class-specific or series-specific operating expenses and/or waiving management fees at any time. Class-specific or series-specific operating expenses
absorbed and/or management fees waived by the Manager are disclosed on the Statements of Comprehensive Income.
In some cases, the Manager may charge management fees to a Fund that are less than the management fees the Manager is entitled to charge in respect of certain investors in a Fund. The difference in the
amount of the management fees will be paid out by the Fund to the applicable investors as a distribution of additional units of the Fund (referred to as Management Fee Distributions). Management Fee
Distributions are negotiable between the Manager and the investor and are dependent primarily on the size of the investor’s investment in the Fund. Management Fee Distributions paid to qualified investors do
not adversely impact the Fund or any of the Fund’s other investors. The Manager may increase or decrease the amount of Management Fee Distributions to certain investors from time to time.
The Manager pays the operating expenses of the CIBC Conservative Passive Portfolio, CIBC Balanced Passive Portfolio and CIBC Balanced Growth Passive Portfolio (referred to as Passive Portfolios) and the CIBC
Smart Income Solution, CIBC Smart Balanced Income Solution, CIBC Smart Balanced Solution, CIBC Smart Balanced Growth Solution and the CIBC Smart Growth Solution (referred to as Smart Investment
Solutions), which may include but is not limited to, operating and administrative costs; regulatory fees; audit, and legal fees and expenses; trustee, safekeeping, custodial, and any agency fees; and investor
servicing costs and costs of unitholder reports, prospectuses, Fund Facts, and other reports, in exchange for the payment by the Passive Portfolios and Smart Investment Solutions of a fixed rate administration fee
to the Manager. The Fixed Administration Fee will be equal to a specified percentage of the net asset value of the class units of the Passive Portfolios and the series of units of the Smart Investment Solutions,
calculated and accrued daily and paid monthly. The Fixed Administration Fee charged for each class of the Passive Portfolios and the series of units of the Smart Investment Solutions is reported in the footnote
Fixed Administration Fee on the Statements of Comprehensive Income. For Class O, no Fixed Administration Fee will be charged. The Fixed Administration Fee payable by the Passive Portfolios and the Smart
Investment Solutions, may, in any particular period, exceed or be lower than the expenses we incur in providing such services to the Passive Portfolios or Smart Investment Solutions.
Where a Fund invests in units of an Underlying fund, the Fund does not pay duplicate management fees on the portion of its assets that it invests in units of the Underlying Fund. In addition, the Fund will not pay
duplicate sales fees or redemption fees with respect to the purchase or redemption by it of units of the Underlying Fund. Some of the Underlying Funds held by the Funds may offer Management Fee Distributions.
Notes to Financial Statements (unaudited) p / 7
x
18
Such Management Fee Distributions of an Underlying Fund will be paid out as required for taxable distribution payments by a Fund. The manager of an Underlying Fund may, in some cases, waive a portion of an
Underlying Fund’s management fee and/or absorb a portion of an Underlying Fund’s operating expenses.
7. Income Taxes and Withholding Taxes
The Funds qualify as mutual fund trusts under the Income Tax Act (Canada). No income tax is payable by the Funds on net income and/or net realized capital gains that are distributed to unitholders. In addition,
income taxes payable on undistributed net realized capital gains are refundable on a formula basis when units of the Funds are redeemed. Sufficient net income and realized capital gains of the Funds have been,
or will be, distributed to the unitholders such that no tax is payable by the Funds and, accordingly, no provision for income taxes has been made in the financial statements. Occasionally, a Fund may pay
distributions in excess of the net income and net realized capital gains of the Fund. This excess distribution is called a return of capital and is non-taxable to the unitholder. However, a return of capital reduces the
average cost of the unitholder’s units for tax purposes, which may result in a capital gain to the unitholder to the extent the average cost becomes less than zero.
CIBC U.S. Dollar Money Market Fund, CIBC U.S. Dollar Managed Income Portfolio, CIBC U.S. Dollar Managed Balanced Portfolio, and CIBC U.S. Dollar Managed Growth Portfolio may realize net foreign currency
gains and losses on the translation of their net realized capital gains to Canadian dollars for tax purposes. These gains will be distributed to investors annually unless these Funds elect to retain them, with the
result that the tax would be payable by the Funds.
Non-capital losses are available to be carried forward for 20 years.
Capital losses for income tax purposes may be carried forward indefinitely and applied against capital gains realized in future years. Where applicable, a Fund’s net capital and non-capital losses are reported in
Canadian dollars in the footnote Net Capital and Non-Capital Losses on the Statements of Changes in Net Assets Attributable to Holders of Redeemable Units.
The Funds have a taxation year-end of December 15 (except for CIBC Canadian T-Bill Fund, CIBC Money Market Fund and CIBC U.S. Dollar Money Market Fund, which have a taxation year-end of December 31).
The Funds currently incur withholding taxes imposed by certain countries on investment income and capital gains. Such income and gains are recorded on a gross basis and the related withholding taxes are
shown as a separate expense in the Statements of Comprehensive Income.
8. Brokerage Commissions and Fees
The total commissions paid by the Funds to brokers in connection with portfolio transactions are reported in footnote Brokerage Commissions and Fees on the Statements of Comprehensive Income of each Fund
where applicable. In allocating brokerage business to a dealer, consideration may be given by the portfolio advisor or the portfolio sub-advisors of the Funds to the provision of goods and services by the dealer or
a third party, other than order execution (referred to in the industry as “soft dollar” arrangements). These goods and services are paid for with a portion of brokerage commissions and assist the portfolio advisor
and portfolio sub-advisors with their investment decision-making services to the Funds or relate directly to the execution of portfolio transactions on behalf of the Funds. The total soft dollar payments paid by the
Funds to brokers are reported in footnote Brokerage Commissions and Fees on the Statements of Comprehensive Income of each Fund. In addition, the Manager may enter into commission recapture arrangements
with certain dealers with respect to the Fund. Any commission recaptured will be paid to the applicable Fund.
Fixed income and certain other securities are transacted in an OTC market, where participants are dealing as principals. Such securities are generally traded on a net basis and do not normally involve brokerage
commissions, but will typically include a “spread” (being the difference between the bid and the offer prices on the security of the applicable marketplace).
Spreads associated with fixed income securities trading and certain other securities are not ascertainable and, for that reason, are not included in the dollar amounts. In addition, the soft dollar amounts only
include the value of research and other services supplied by a third party to CIBC Asset Management Inc. (referred to as CAMI or the Portfolio Advisor) and any portfolio sub-advisors, as the value of the services
supplied to the Portfolio Advisor and any portfolio sub-advisors by the dealer is not ascertainable. When these services benefit more than one Fund, the costs are allocated among the Funds based on transaction
activity or some other fair basis as determined by the Portfolio Advisor and any portfolio sub-advisors.
9. Related Party Transactions
CIBC and its affiliates have the following roles and responsibilities with respect to the Funds and receive the fees described below in connection with their roles and responsibilities. The Funds may hold securities
of CIBC. CIBC and its affiliates may also be involved in underwriting or lending to issuers of securities that may be held by the Funds, have purchased or sold securities from or to the Funds while acting as
principal, have purchased or sold securities from or to the Funds on behalf of another investment fund managed by CIBC or an affiliate, and also may have been involved as a counterparty to derivative
transactions. Management fees payable and other accrued expenses on the Statements of Financial Position are amounts generally payable to a related party of the Fund.
Manager, Trustee, Portfolio Advisor, and certain Portfolio Sub-Advisors of the Funds
CIBC is the Manager, CIBC Trust Corporation is the Trustee, and CAMI is the Portfolio Advisor of each of the Funds.
The Manager also arranges for fund administrative services (other than advertising and promotional, which are the responsibility of the Manager), legal, investor servicing, and costs of unitholder reports,
prospectuses, and other reports. The Manager is the registrar and transfer agent for the Funds and provides, or arranges for the provision of, all other administrative services required by the Funds. The dollar
amount (including all applicable taxes) of all fund administrative expenses (net of absorptions) that the Manager recovers from a Fund is reported in footnote Administrative and Other Fund Operating Expenses on
the Statements of Comprehensive Income.
Brokerage Arrangements and Soft Dollars
The Portfolio Advisor generally delegates trading and execution authority to the portfolio sub-advisors.
The Portfolio Advisor and portfolio sub-advisors make decisions, including the selection of markets and dealers and the negotiation of commissions, with respect to the purchase and sale of portfolio securities,
certain derivative products and the execution of portfolio transactions. Brokerage business may be allocated by the Portfolio Advisor or portfolio sub-advisors to CIBC World Markets Inc. and CIBC World Markets
Corp., each a subsidiary of CIBC. The total commissions paid to related brokers in connection with portfolio transactions are reported in footnote Brokerage Commissions and Fees on the Statements of
Comprehensive Income of each Fund.
CIBC World Markets Inc. and CIBC World Markets Corp. may also earn spreads on the sale of fixed income and other securities, and certain derivative products to the Funds. Dealers, including CIBC World
Markets Inc. and CIBC World Markets Corp., may furnish goods and services, other than order execution, to the Portfolio Advisor and portfolio sub-advisors that process trades through them (referred to in the
industry as “soft dollar” arrangements). These goods and services are paid for with a portion of brokerage commissions and assist the Portfolio Advisor and portfolio sub-advisors with their investment
decision-making services to the Fund or relate directly to executing portfolio transactions on behalf of the Fund. As per terms of the portfolio advisory and sub-advisory agreements, such soft dollar arrangements
are in compliance with applicable laws. Custodial fees directly related to portfolio transactions incurred by a Fund, otherwise payable by the Fund, shall be paid by CAMI, and/or dealer(s) directed by CAMI, up to
the amount of the credits generated under soft dollar arrangements from trading on behalf of the Fund, or a portion of the Fund, during that month. The total soft dollar payments paid by the Fund to related
brokers are reported in footnote Brokerage Commissions and Fees on the Statements of Comprehensive Income of each Fund. In addition, the Manager may enter into commission recapture arrangements with
certain dealers with respect to the Funds. Any commission recaptured will be paid to the relevant Fund.
Custodian
The custodian holds all cash and securities for the Funds and ensures that those assets are kept separate from any other cash or securities that the custodian might be holding. The custodian also provides other
services to the Funds including record keeping and processing of foreign exchange transactions. CIBC Mellon Trust Company is the custodian of the Funds (referred to as the Custodian). The Custodian may hire
sub-custodians for the Funds. The fees and spreads for services of the Custodian directly related to the execution of portfolio transactions by a Fund, or a portion of a Fund, are paid by CAMI and/or dealer(s)
directed by CAMI up to the amount of the credits generated under soft dollar arrangements from trading on behalf of the Funds during that month. All other fees for the services of the Custodian are paid by the
Manager, and charged to the Funds on a recoverable basis. CIBC owns a 50% interest in CIBC Mellon Trust Company.
Service Provider
CIBC Mellon Global Securities Services Company (referred to as CIBC GSS) provides certain services to the Funds, including securities lending, fund accounting and reporting, and portfolio valuation. Such
servicing fees are paid by the Manager and charged to the Funds on a recoverable basis. CIBC indirectly owns a 50% interest in CIBC GSS.
The dollar amount paid by the Funds (including all applicable taxes) to CIBC Mellon Trust Company for custodial fees (net of absorptions) and to CIBC GSS for securities lending, fund accounting and reporting, and
portfolio valuation (net of absorptions) for the six-month periods ended June 30, 2021 and 2020 is reported in footnote Service Provider on the Statements of Comprehensive Income.

p / 8 Notes to Financial Statements (unaudited)
x
x
19
10. Hedging
Certain foreign currency denominated positions have been hedged, or partially hedged, by forward foreign currency contracts as part of the investment strategies of certain Funds. These hedges are indicated by a
hedging reference number on the Schedule of Investment Portfolio and a corresponding hedging reference number on the Schedule of Derivative Assets and Liabilities - Forward Foreign Currency Contracts for
those Funds.
11. Collateral on Specified Derivatives
Short-term investments may be used as collateral for futures contracts outstanding with brokers.

This page is intentionally left blank.
®
"S&P ", and “S&P/TSX Composite” are trademarks of “S&P Global Ratings”, a division of S&P Global, and have been licensed for use by CIBC. "TSX" is a trademark of TSX, Inc. and
has been licensed for use by S&P Global Ratings. The Fund is not sponsored, endorsed, sold, or promoted by S&P Global Ratings or TSX, Inc. and neither S&P Global Ratings nor TSX,
Inc. make any representation regarding the advisability of investing in the Fund.
CIBC Mutual Funds
CIBC Family of Portfolios
CIBC
Brookfield Place, 161 Bay Street, 22nd Floor
Toronto, Ontario
M5J 2S1
CIBC Securities Inc.
1-800-465-3863
Website
www.cibc.com/mutualfunds
CIBC Securities Inc. is a wholly-owned subsidiary of CIBC and is the principal distributor of the CIBC Mutual Funds and the CIBC Family of Portfolios. CIBC Family of Portfolios are
mutual funds that primarily invest in other CIBC Mutual Funds. To obtain a copy of the simplified prospectus, call CIBC Securities Inc. at 1-800-465-3863 or ask your advisor.