Embed Size (px)
Citation preview
A Luxembourg based mutual investment fund
Audited Annual Report
as at December 31, 2007
No subscription can be received on the basis of financial reports. Subscriptions are only valid if made on the basis of the current prospectusaccompanied by the latest annual and the most recent semi-annual report if published thereafter.
DANSKE FUND

3
Table of contents
DANSKE FUND
Page
Management and Administration 5
Information to Unitholders 6
Report of The Management Company 7
Auditor's Report 13
Statement of Net Assets 14
Statement of Operations and Changes in Net Assets 19
Changes in the Number of Units for the Year ended December 31, 2007 25
Statistics 33
DANSKE FUND - DANISH BOND
Statement of Investments 38Geographical and Economic Portfolio Breakdown 40
DANSKE FUND - EUROPEAN BOND
Statement of Investments 41Geographical and Economic Portfolio Breakdown 44
DANSKE FUND - DENMARK
Statement of Investments 45Geographical and Economic Portfolio Breakdown 47
DANSKE FUND - NORDIC
Statement of Investments 48Geographical and Economic Portfolio Breakdown 49
DANSKE FUND - SWEDISH BOND
Statement of Investments 50Geographical and Economic Portfolio Breakdown 52
DANSKE FUND - US DOLLAR BOND
Statement of Investments 53Geographical and Economic Portfolio Breakdown 55
DANSKE FUND - SWEDEN
Statement of Investments 56Geographical and Economic Portfolio Breakdown 57
DANSKE FUND - DANISH MORTGAGE BOND
Statement of Investments 58Geographical and Economic Portfolio Breakdown 61
DANSKE FUND - GLOBAL EMERGING MARKETS
Statement of Investments 62Geographical and Economic Portfolio Breakdown 65
DANSKE FUND - EUROPE
Statement of Investments 66Geographical and Economic Portfolio Breakdown 68
DANSKE FUND - STOCKPICKING
Statement of Investments 69Geographical and Economic Portfolio Breakdown 71
DANSKE FUND - EUROPE SMALL CAP
Statement of Investments 72Geographical and Economic Portfolio Breakdown 74
DANSKE FUND - HIGH DIVIDEND
Statement of Investments 75Geographical and Economic Portfolio Breakdown 77
4
Table of contents (continued)
DANSKE FUND
Page
DANSKE FUND - GLOBAL HIGH INCOME
Statement of Investments 78Geographical and Economic Portfolio Breakdown 83
DANSKE FUND - EASTERN EUROPE CONVERGENCE
Statement of Investments 84Geographical and Economic Portfolio Breakdown 89
DANSKE FUND - GREATER CHINA
Statement of Investments 90Geographical and Economic Portfolio Breakdown 93
DANSKE FUND - JAPAN
Statement of Investments 94Geographical and Economic Portfolio Breakdown 97
DANSKE FUND - INDIA
Statement of Investments 98Geographical and Economic Portfolio Breakdown 100
DANSKE FUND - BALTIC
Statement of Investments 101Geographical and Economic Portfolio Breakdown 103
DANSKE FUND - TRANS - BALKAN
Statement of Investments 104Geographical and Economic Portfolio Breakdown 108
DANSKE FUND - GERMANY
Statement of Investments 109Geographical and Economic Portfolio Breakdown 110
DANSKE FUND - GLOBAL EMERGING MARKET SMALL CAP
Statement of Investments 111Geographical and Economic Portfolio Breakdown 114
Notes to the Financial Statements 116
DANSKE FUND
Management and Administration
MANAGEMENT COMPANY SUB-INVESTMENT MANAGERS
Danske Fund Management Company S.A. 2, rue du Fossé L-1536 Luxembourg (G. D. of Luxembourg)
Aberdeen Asset Management Asia Limited21, Church Street #01-01 Capital square TwoSingapore 049480 (Singapore)
BOARD OF DIRECTORS Torben KRAG Chairman of the Board of Directors Deputy General Manager of Danske Bank International S.A. Luxembourg (G. D. of Luxembourg) Mads JENSEN First Vice-President of Danske Bank A/S Copenhagen (Denmark)
Schroder Investment Management Limited31, Gresham Street GB-London EC2V 7QA (U.K.) Danske Capital Sverige AB Norrmalmstorg 1, BOX 7523 S-103 92 Stockholm (Sweden) Danske Capital Finland OY Aleksanterinkatu 44, 7. floor FI-00100 Helsinki (Finland)
Klaus EBERT Head of Fund Products of Danske Bank International S.A. Luxembourg (G. D. of Luxembourg) DAY-TO-DAY MANAGEMENT Klaus EBERT Head of Fund Products of Danske Bank International S.A. Luxembourg (G. D. of Luxembourg) Peter DYHR Senior Fund Administration Officer of Danske Bank International S.A. Luxembourg (G. D. of Luxembourg)
Danske Capital Norge AS Stortingsgata 6 N-0161 Oslo (Norway) JP Morgan Asset Management (Japan) LimitedTokyo Building 7-3, Marunouchi 2-chome Chiyoda-Ku, Tokyo 100-6432 (Japan) AUDITOR Deloitte SA 560, rue de Neudorf L-2220 Luxembourg (G. D. of Luxembourg) DISTRIBUTOR
CUSTODIAN AND CENTRAL ADMINISTRATION RBC Dexia Investor Services Bank S.A. 14, Porte de France L-4360 Esch-sur-Alzette (G. D. of Luxembourg)
Danske Bank International S.A. 2, rue du Fossé L-1536 Luxembourg (G. D. of Luxembourg)
PAYING AGENT AND REGISTRAR AND TRANSFERAGENT
Danske Bank International S.A. 2, rue du Fossé L-1536 Luxembourg (G. D. of Luxembourg)
INVESTMENT MANAGER
Danske Bank A/S (acting through its division Danske Capital)Strødamvej 46 DK-2100 Copenhagen Ø (Denmark)
5
DANSKE FUND
Information to Unitholders
6
Information about the Net Asset Value of the units of each Sub-Fund and about the issue and redemption prices is available at all times at the registered office of the Management Company. Copies of the annual report and all interim reports of the Fund may be obtained by holders of units from the registered office of the Management Company, the Custodian Bank and any paying agent. A detailed schedule of the changes in the portfolio statement for each sub-fund is available free of charge upon request at the registered office of the Management Company. EU Council Directive 2003/48/EC of 3 June 2003 on the taxation of savings income in the form of interest payments: By Circular Resolution dated 11th May 2007, the Board of Directors approved the status of each Sub-Fund in relation to the tax treatment applicable to distributions and realised income of Danske Fund.
DANSKE FUND
Report of the Management Company
7
BOARD OF DIRECTORS At the Annual General Meeting held on February 21, 2007, Mr. Torben Krag (Danske Bank International S.A.), Mr. Mads Jensen (Danske Bank A/S) and Mr. Klaus Ebert (Danske Bank International S.A.) were duly elected as Board Members. REPORT ON THE ACTIVITIES DURING THE YEAR In accordance with demands from the distribution channels of the products available under the Danske Fund umbrella, the prospectus was updated twice during the year 2007. Significant events during the year a) Prospectus update 2 April 2007: • Creation of two new Sub-Funds as follows:
ο Danske Fund - Germany – both Unit Class A and Unit Class I were launched on 22 May 2007; ο Danske Fund - Global Emerging Markets Small Cap - both Unit Class A and Unit Class I were launched on 10
April 2007;
• Creation of a Unit Class D to the Sub-Fund Danske Fund - Sweden - this Unit Class has not yet been launched;
• Change of the name of the Sub-Fund Danske Fund - Global Stockpicking into Danske Fund - Stockpicking – this name change became effective as of 20 April 2007.
The details of these Prospectus updates were described in a general Notice to the Unitholders of Danske Fund published on 16 March 2007. b) Mergers effective 20 April 2007: • Three mergers were decided and carried out effective 20 April 2007 as follows:
ο Danske Fund - Global was merged with Danske Fund Stockpicking; ο Danske Fund - Global Biotech was merged with Danske Fund Stockpicking; ο Danske Fund - Global Health Care was merged with Danske Fund Stockpicking.
The details of the mergers were described in separate Notice to the Unitholders of Danske Fund - Global, Danske Fund - Global Biotech and Danske Fund - Global Health Care mailed to each individual Unitholder on 16 March 2007. c) Launch of several Unit Class I’s as follows:
• Danske Fund - High Dividend Class I – this Unit Class was launched on 24 January 2007;
• Danske Fund - Global Emerging Markets Class I – this Unit Class was launched on 2 March 2007;
• Danske Fund - Europe Class I – this Unit Class was launched on 25 April 2007. d) Prospectus update January 2008:
This update was approved orally by CSSF in December 2007 with some changes taking effect on 18 December 2007 and some on 14 January 2008 as follows: December 2007 • Two mergers were decided and carried out effective 18 December 2007 as follows:
ο Danske Fund - North American Small Cap was merged with Danske Fund - Stockpicking; ο Danske Fund - Danish Mortgage Short Term was merged with Danske Fund - Danish Mortgage Bond.
The details of the mergers were described in separate Notice to the Unitholders of Danske - Fund North American Small Cap and Danske Fund - Danish Mortgage Short Term mailed to each individual Unitholder on 16 November 2007.
DANSKE FUND
Report of the Management Company (continued)
8
January 2008
• Creation of one new Sub-Fund as follows: ο Danske Fund - Alternative – this Sub-Fund will be launched during the 1st quarter of 2008;
• Adjustment of the Investment Objectives of the Sub-Fund Danske Fund - European Bond with the removal of EUSD Grandfathering clause;
• Adjustment of the Investment Objectives of the Sub-Fund Danske Fund - Global High Income with increase from 10% to 25% of investments allowed in bonds with credit rating below Baa3/BBB- and bonds with no rating;
• Adjustment of the Investment Objectives of the Sub-Funds Danske Fund - Global Emerging Markets, Danske Fund - Global Emerging Markets Bond, Danske Fund - Global Emerging Markets Small Cap and Danske Fund - Global High Income – with updates on the paragraph relating to investments in Russia, whereby securities listed on the Moscow Interbank Currency Exchange (MICEX) and on the Russian Trading System (RTS) which are now recognised as regulated markets;
• Allowing all Sub-Funds of Danske Fund to be marketed in Sweden under the name “Danske Fonder”;
• Update of the Prospectus Section 4. Investment Policy and Restrictions to incorporate CSSF Circular 07/308 covering rules and conduct to be adopted by UCITS with respect to the use of a method for the management of financial risks, as well as the use of derivative financial instruments;
• Removal of Subscription/Conversion/Redemption Fees for all Danske Fund Sub-Funds investing in bonds. The details of these Prospectus updates were described in a general Notice to the Unitholders of Danske Fund published on 13 December 2007. Danske Fund Securities Lending Activities
In order to utilise earnings possibilities by securities lending of Danske Fund Sub-Funds underlying securities, Danske Fund Management Company has entered into a Securities Lending Agreement with RBC Dexia Investor Services Netherlands N.V on 6 March 2007. PERFORMANCE Danske Fund - Danish Bond Class A The net asset value per unit of this Sub-Fund rose from DKK 303.11 to DKK 306.02 at the year-end. The yield for 2007 is therefore 0.96%. Danske Fund - Danish Bond Class D The net asset value per unit of this Sub-Fund decreased from DKK 111.90 to DKK 109.96 at the year-end. The yield for 2007 is 0.95%, when account is taken of the dividend of DKK 3.00 per unit paid in February 2007. The dividend for 2008 has been fixed at DKK 2.00 per unit. Danske Fund - European Bond Class A The net asset value per unit of this Sub-Fund decreased from EUR 13.710 to EUR 13.623 at the year-end. The yield for 2007 is therefore -0.63%. Danske Fund - European Bond Class D The net asset value per unit of this Sub-Fund decreased from EUR 10.509 to EUR 10.194 at the year-end. The yield for 2007 is -0.65%, when account is taken of the dividend of EUR 0.25 per unit paid in February 2007. The dividend for 2008 has been fixed at EUR 0.20 per unit.
DANSKE FUND
Report of the Management Company (continued)
9
Danske Fund - Denmark Class A The net asset value per unit of this Sub-Fund rose from DKK 731.46 to DKK 736.33 at the year-end. The yield for 2007 is therefore 0.67%. Danske Fund - Denmark Class SP The net asset value per unit of this Sub-Fund rose from DKK 184.58 to DKK 187.43 at the year-end. The yield for 2007 is therefore 1.54%. Danske Fund - Nordic Class A The net asset value per unit of this Sub-Fund rose from EUR 58.302 to EUR 60.298 at the year-end. The yield for 2007 is therefore 3.42%. Danske Fund - Swedish Bond Class A The net asset value per unit of this Sub-Fund rose from SEK 195.75 to SEK 197.09 at the year-end. The yield for 2007 is therefore 0.68%. Danske Fund - Swedish Bond Class S (Distributed in Sweden under the name of Danske Fund Sverige Ränta) The net asset value per unit of this Sub-Fund rose from SEK 105.81 to SEK 106.86 at the year-end. The yield for 2007 is therefore 0.99%. Danske Fund - US Dollar Bond Class A The net asset value per unit of this Sub-Fund rose from USD 31.132 to USD 33.123 at the year-end. The yield for 2007 is therefore 6.40%. Danske Fund - Sweden Class A The net asset value per unit of this Sub-Fund decreased from SEK 349.76 to SEK 323.80 at the year-end. The yield for 2007 is therefore -7.42%. Danske Fund - Danish Mortgage Bond Class A The net asset value per unit of this Sub-Fund decreased from DKK 157.23 to DKK 157.11 at the year-end. The yield for 2007 is therefore -0.22%. Danske Fund - Danish Mortgage Bond Class D The net asset value per unit of this Sub-Fund decreased from DKK 123.60 to DKK 115.47 at the year-end. The yield for 2007 is -0.25%, when account is taken of the dividend of DKK 4.00 per unit paid in February 2007 and DKK 4.00 per unit paid in August 2007. The dividend for 2008 has been fixed at DKK 8.00 per unit to be paid out in February with DKK 4.00 per unit and in August with DKK 4.00 per unit. Danske Fund - Danish Mortgage Bond Class SP The net asset value per unit of this Sub-Fund increased from DKK 104.36 to DKK 104.68 at the year-end. The yield for 2007 is therefore 0.15%.
DANSKE FUND
Report of the Management Company (continued)
10
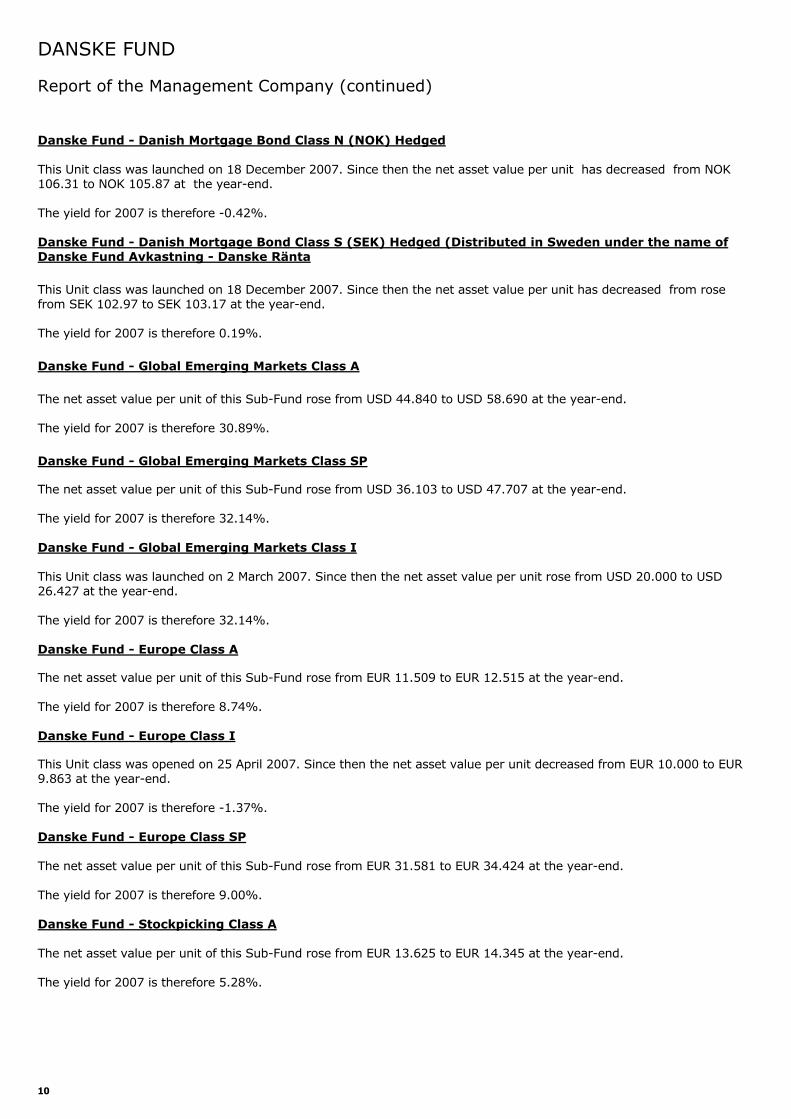
Danske Fund - Danish Mortgage Bond Class N (NOK) Hedged This Unit class was launched on 18 December 2007. Since then the net asset value per unit has decreased from NOK 106.31 to NOK 105.87 at the year-end. The yield for 2007 is therefore -0.42%. Danske Fund - Danish Mortgage Bond Class S (SEK) Hedged (Distributed in Sweden under the name of Danske Fund Avkastning - Danske Ränta This Unit class was launched on 18 December 2007. Since then the net asset value per unit has decreased from rose from SEK 102.97 to SEK 103.17 at the year-end. The yield for 2007 is therefore 0.19%. Danske Fund - Global Emerging Markets Class A The net asset value per unit of this Sub-Fund rose from USD 44.840 to USD 58.690 at the year-end. The yield for 2007 is therefore 30.89%. Danske Fund - Global Emerging Markets Class SP The net asset value per unit of this Sub-Fund rose from USD 36.103 to USD 47.707 at the year-end. The yield for 2007 is therefore 32.14%. Danske Fund - Global Emerging Markets Class I This Unit class was launched on 2 March 2007. Since then the net asset value per unit rose from USD 20.000 to USD 26.427 at the year-end. The yield for 2007 is therefore 32.14%. Danske Fund - Europe Class A The net asset value per unit of this Sub-Fund rose from EUR 11.509 to EUR 12.515 at the year-end. The yield for 2007 is therefore 8.74%. Danske Fund - Europe Class I This Unit class was opened on 25 April 2007. Since then the net asset value per unit decreased from EUR 10.000 to EUR 9.863 at the year-end. The yield for 2007 is therefore -1.37%. Danske Fund - Europe Class SP The net asset value per unit of this Sub-Fund rose from EUR 31.581 to EUR 34.424 at the year-end. The yield for 2007 is therefore 9.00%. Danske Fund - Stockpicking Class A The net asset value per unit of this Sub-Fund rose from EUR 13.625 to EUR 14.345 at the year-end. The yield for 2007 is therefore 5.28%.
DANSKE FUND
Report of the Management Company (continued)
11
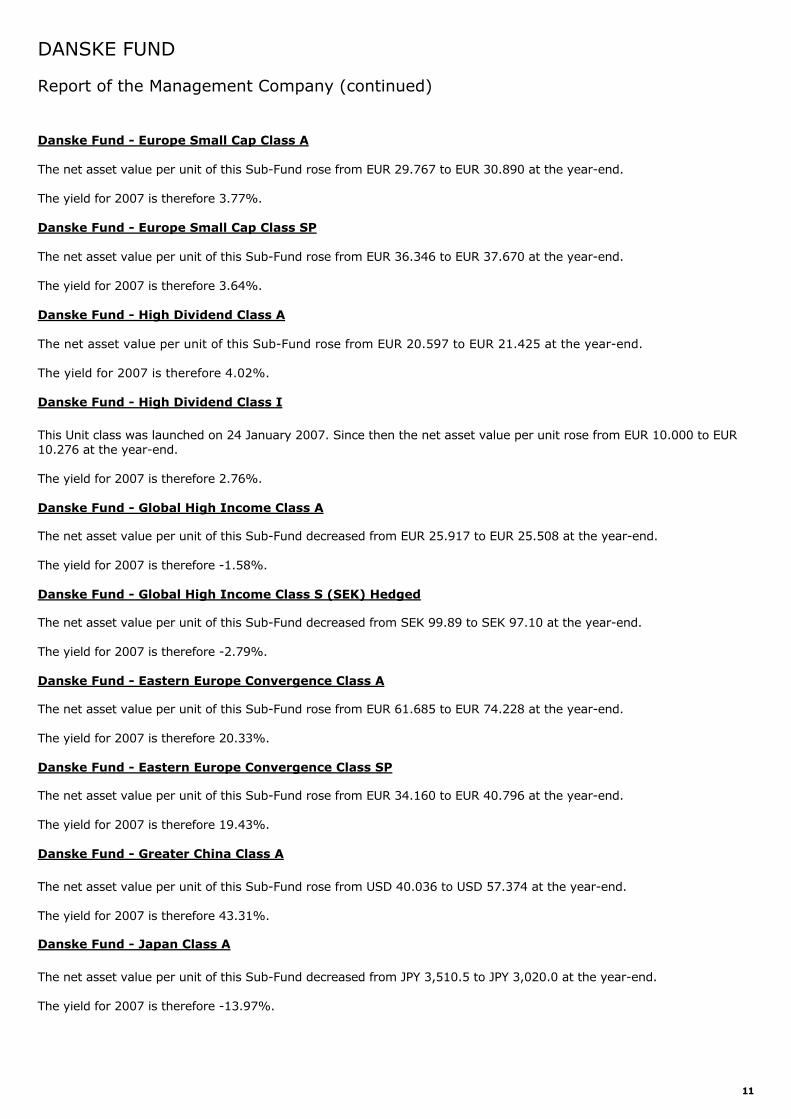
Danske Fund - Europe Small Cap Class A The net asset value per unit of this Sub-Fund rose from EUR 29.767 to EUR 30.890 at the year-end. The yield for 2007 is therefore 3.77%. Danske Fund - Europe Small Cap Class SP The net asset value per unit of this Sub-Fund rose from EUR 36.346 to EUR 37.670 at the year-end. The yield for 2007 is therefore 3.64%. Danske Fund - High Dividend Class A The net asset value per unit of this Sub-Fund rose from EUR 20.597 to EUR 21.425 at the year-end. The yield for 2007 is therefore 4.02%. Danske Fund - High Dividend Class I This Unit class was launched on 24 January 2007. Since then the net asset value per unit rose from EUR 10.000 to EUR 10.276 at the year-end. The yield for 2007 is therefore 2.76%. Danske Fund - Global High Income Class A The net asset value per unit of this Sub-Fund decreased from EUR 25.917 to EUR 25.508 at the year-end. The yield for 2007 is therefore -1.58%. Danske Fund - Global High Income Class S (SEK) Hedged The net asset value per unit of this Sub-Fund decreased from SEK 99.89 to SEK 97.10 at the year-end. The yield for 2007 is therefore -2.79%. Danske Fund - Eastern Europe Convergence Class A The net asset value per unit of this Sub-Fund rose from EUR 61.685 to EUR 74.228 at the year-end. The yield for 2007 is therefore 20.33%. Danske Fund - Eastern Europe Convergence Class SP The net asset value per unit of this Sub-Fund rose from EUR 34.160 to EUR 40.796 at the year-end. The yield for 2007 is therefore 19.43%. Danske Fund - Greater China Class A The net asset value per unit of this Sub-Fund rose from USD 40.036 to USD 57.374 at the year-end. The yield for 2007 is therefore 43.31%. Danske Fund - Japan Class A The net asset value per unit of this Sub-Fund decreased from JPY 3,510.5 to JPY 3,020.0 at the year-end. The yield for 2007 is therefore -13.97%.
DANSKE FUND
Report of the Management Company (continued)
12
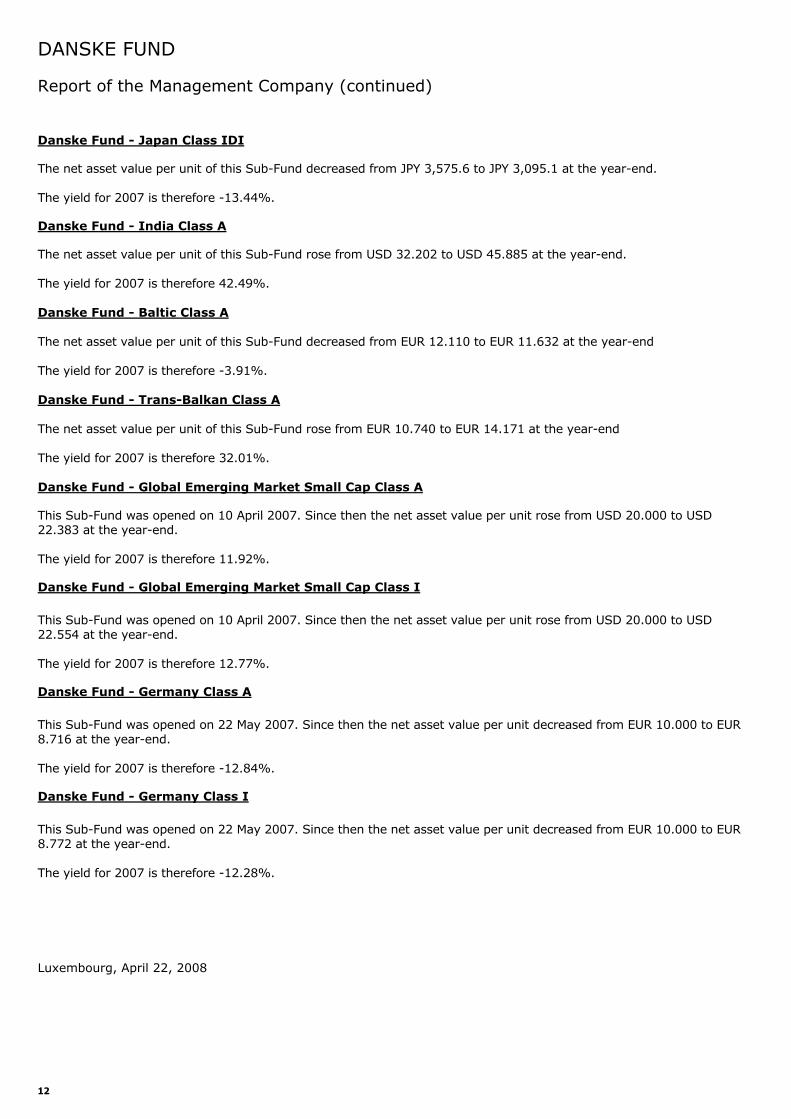
Danske Fund - Japan Class IDI The net asset value per unit of this Sub-Fund decreased from JPY 3,575.6 to JPY 3,095.1 at the year-end. The yield for 2007 is therefore -13.44%. Danske Fund - India Class A The net asset value per unit of this Sub-Fund rose from USD 32.202 to USD 45.885 at the year-end. The yield for 2007 is therefore 42.49%. Danske Fund - Baltic Class A The net asset value per unit of this Sub-Fund decreased from EUR 12.110 to EUR 11.632 at the year-end The yield for 2007 is therefore -3.91%. Danske Fund - Trans-Balkan Class A The net asset value per unit of this Sub-Fund rose from EUR 10.740 to EUR 14.171 at the year-end The yield for 2007 is therefore 32.01%. Danske Fund - Global Emerging Market Small Cap Class A This Sub-Fund was opened on 10 April 2007. Since then the net asset value per unit rose from USD 20.000 to USD 22.383 at the year-end. The yield for 2007 is therefore 11.92%. Danske Fund - Global Emerging Market Small Cap Class I This Sub-Fund was opened on 10 April 2007. Since then the net asset value per unit rose from USD 20.000 to USD 22.554 at the year-end. The yield for 2007 is therefore 12.77%. Danske Fund - Germany Class A This Sub-Fund was opened on 22 May 2007. Since then the net asset value per unit decreased from EUR 10.000 to EUR 8.716 at the year-end. The yield for 2007 is therefore -12.84%. Danske Fund - Germany Class I This Sub-Fund was opened on 22 May 2007. Since then the net asset value per unit decreased from EUR 10.000 to EUR 8.772 at the year-end. The yield for 2007 is therefore -12.28%. Luxembourg, April 22, 2008
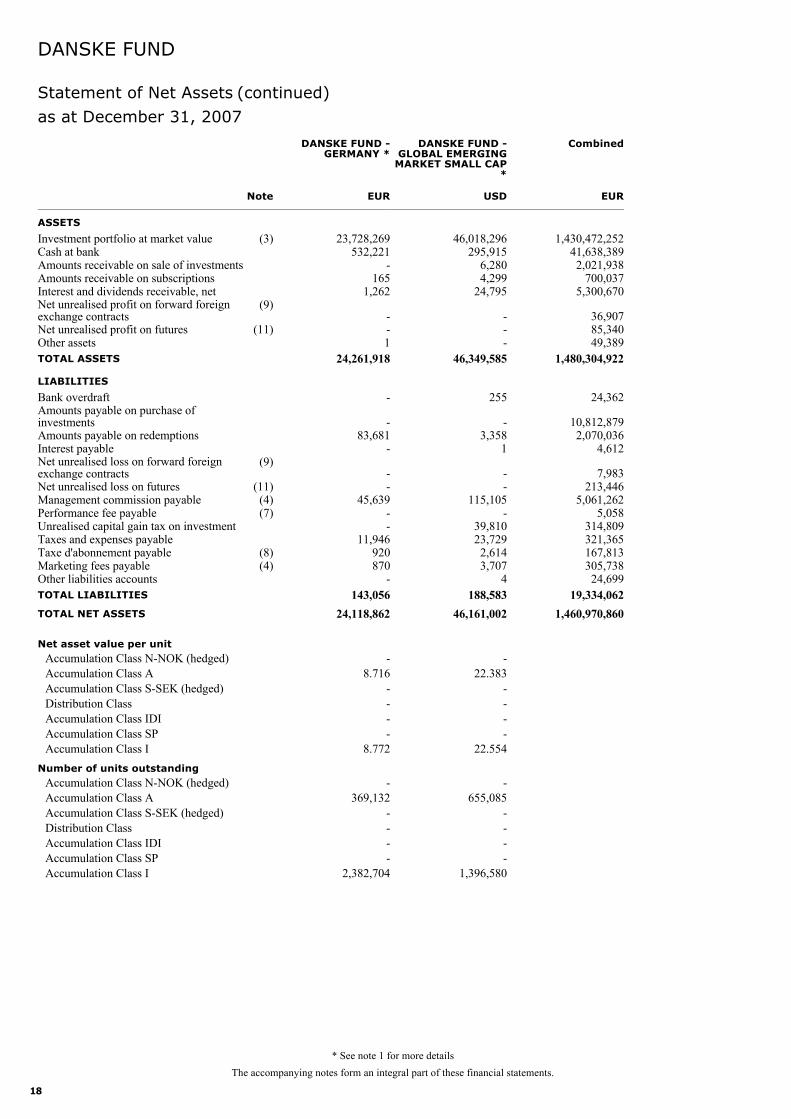
14
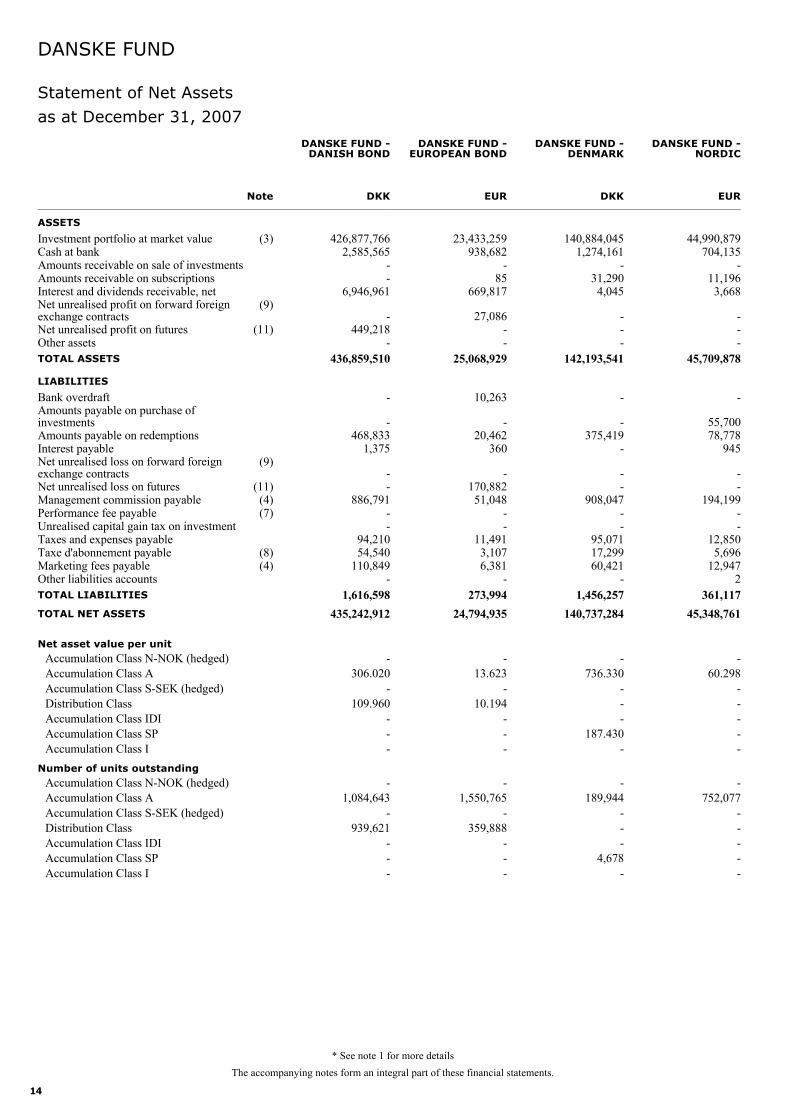
Statement of Net Assets
DANSKE FUND
as at December 31, 2007
ASSETS
Investment portfolio at market value (3) 426,877,766Cash at bank 2,585,565Amounts receivable on sale of investments -Amounts receivable on subscriptions -Interest and dividends receivable, net 6,946,961Net unrealised profit on forward foreignexchange contracts
(9)-
Net unrealised profit on futures (11) 449,218Other assets -TOTAL ASSETS 436,859,510
LIABILITIES
Bank overdraft -Amounts payable on purchase ofinvestments -Amounts payable on redemptions 468,833Interest payable 1,375Net unrealised loss on forward foreignexchange contracts
(9)-
Net unrealised loss on futures (11) -Management commission payable (4) 886,791Performance fee payable (7) -Unrealised capital gain tax on investment -Taxes and expenses payable 94,210Taxe d'abonnement payable (8) 54,540Marketing fees payable (4) 110,849Other liabilities accounts -TOTAL LIABILITIES 1,616,598TOTAL NET ASSETS 435,242,912
DKKNote
DANSKE FUND -DANISH BOND
23,433,259938,682
-85
669,817
27,086--
25,068,929
10,263
-20,462
360
-170,88251,048
--
11,4913,1076,381
-273,994
24,794,935
EUR
DANSKE FUND -EUROPEAN BOND
140,884,0451,274,161
-31,2904,045
---
142,193,541
-
-375,419
-
--
908,047--
95,07117,29960,421
-1,456,257
140,737,284
DKK
DANSKE FUND -DENMARK
44,990,879704,135
-11,1963,668
---
45,709,878
-
55,70078,778
945
--
194,199--
12,8505,696
12,9472
361,11745,348,761
EUR
DANSKE FUND -NORDIC
The accompanying notes form an integral part of these financial statements.
-1,084,643
-939,621
---
-306.020
-109.960
---
Net asset value per unit
Number of units outstanding
Accumulation Class N-NOK (hedged)Accumulation Class AAccumulation Class S-SEK (hedged)Distribution ClassAccumulation Class IDIAccumulation Class SPAccumulation Class I
Accumulation Class N-NOK (hedged)Accumulation Class AAccumulation Class S-SEK (hedged)Distribution ClassAccumulation Class IDIAccumulation Class SPAccumulation Class I
-1,550,765
-359,888
---
-13.623
-10.194
---
-189,944
---
4,678-
-736.330
---
187.430-
-752,077
-----
-60.298
-----
* See note 1 for more details
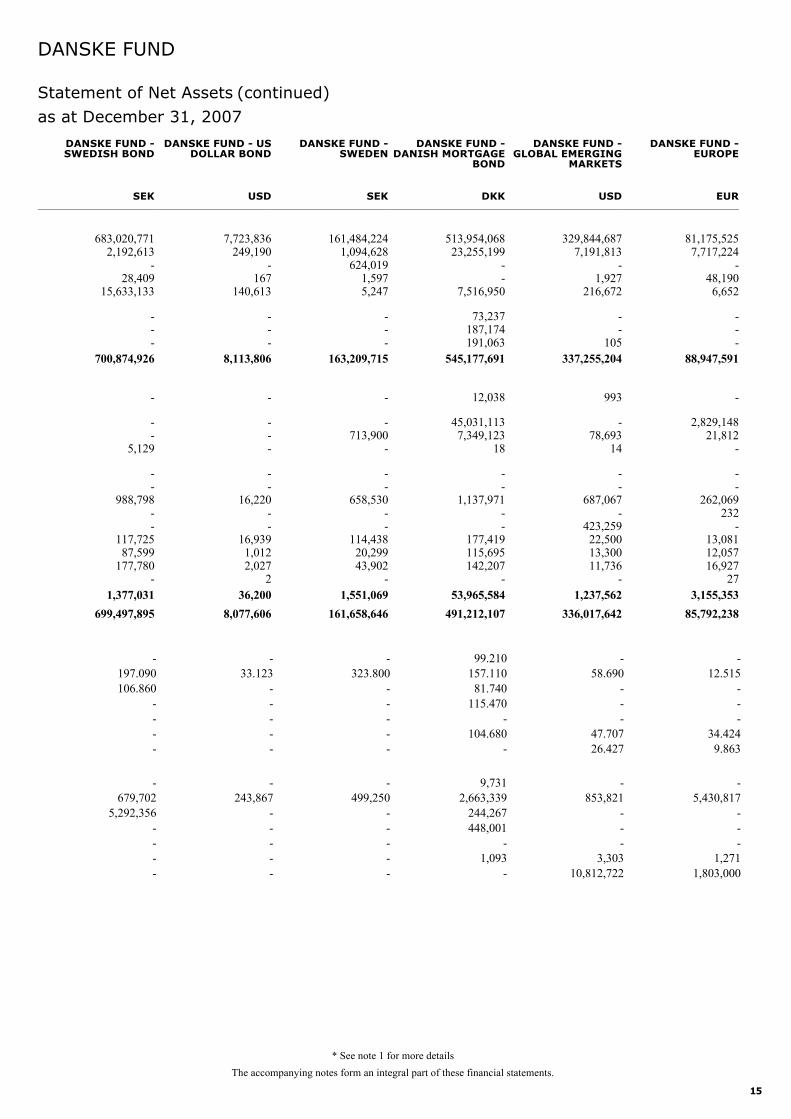
15
Statement of Net Assets
DANSKE FUND
as at December 31, 2007
(continued)
683,020,7712,192,613
-28,409
15,633,133
---
700,874,926
-
--
5,129
--
988,798--
117,72587,599
177,780-
1,377,031699,497,895
SEK
DANSKE FUND -SWEDISH BOND
7,723,836249,190
-167
140,613
---
8,113,806
-
---
--
16,220--
16,9391,0122,027
236,200
8,077,606
USD
DANSKE FUND - USDOLLAR BOND
161,484,2241,094,628
624,0191,5975,247
---
163,209,715
-
-713,900
-
--
658,530--
114,43820,29943,902
-1,551,069
161,658,646
SEK
DANSKE FUND -SWEDEN
513,954,06823,255,199
--
7,516,950
73,237187,174191,063
545,177,691
12,038
45,031,1137,349,123
18
--
1,137,971--
177,419115,695142,207
-53,965,584
491,212,107
DKK
DANSKE FUND -DANISH MORTGAGE
BOND
329,844,6877,191,813
-1,927
216,672
--
105337,255,204
993
-78,693
14
--
687,067-
423,25922,50013,30011,736
-1,237,562
336,017,642
USD
DANSKE FUND -GLOBAL EMERGING
MARKETS
81,175,5257,717,224
-48,1906,652
---
88,947,591
-
2,829,14821,812
-
--
262,069232
-13,08112,05716,927
273,155,353
85,792,238
EUR
DANSKE FUND -EUROPE
The accompanying notes form an integral part of these financial statements.
-679,702
5,292,356----
-197.090106.860
----
-243,867
-----
-33.123
-----
-499,250
-----
-323.800
-----
9,7312,663,339
244,267448,001
-1,093
-
99.210157.11081.740
115.470-
104.680-
-853,821
---
3,30310,812,722
-58.690
---
47.70726.427
-5,430,817
---
1,2711,803,000
-12.515
---
34.4249.863
* See note 1 for more details
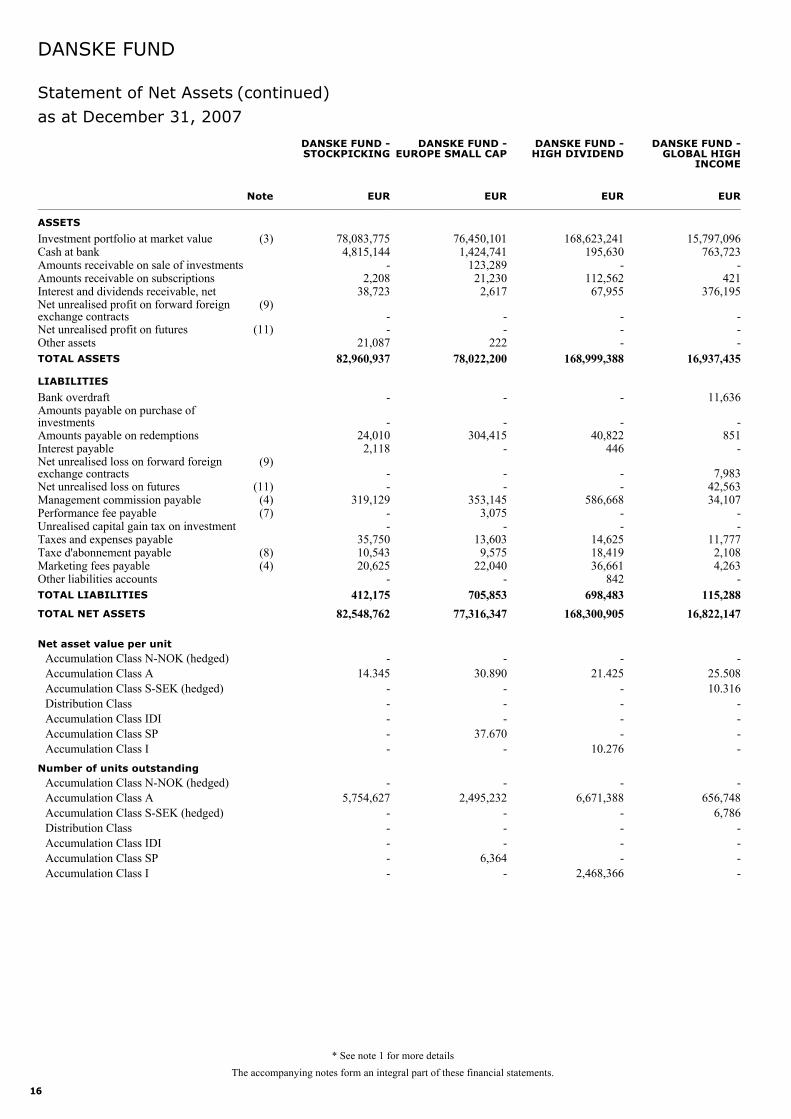
16
Statement of Net Assets
DANSKE FUND
as at December 31, 2007
(continued)
ASSETS
Investment portfolio at market value (3) 78,083,775Cash at bank 4,815,144Amounts receivable on sale of investments -Amounts receivable on subscriptions 2,208Interest and dividends receivable, net 38,723Net unrealised profit on forward foreignexchange contracts
(9)-
Net unrealised profit on futures (11) -Other assets 21,087TOTAL ASSETS 82,960,937
LIABILITIES
Bank overdraft -Amounts payable on purchase ofinvestments -Amounts payable on redemptions 24,010Interest payable 2,118Net unrealised loss on forward foreignexchange contracts
(9)-
Net unrealised loss on futures (11) -Management commission payable (4) 319,129Performance fee payable (7) -Unrealised capital gain tax on investment -Taxes and expenses payable 35,750Taxe d'abonnement payable (8) 10,543Marketing fees payable (4) 20,625Other liabilities accounts -TOTAL LIABILITIES 412,175TOTAL NET ASSETS 82,548,762
EURNote
DANSKE FUND -STOCKPICKING
76,450,1011,424,741
123,28921,2302,617
--
22278,022,200
-
-304,415
-
--
353,1453,075
-13,6039,575
22,040-
705,85377,316,347
EUR
DANSKE FUND -EUROPE SMALL CAP
168,623,241195,630
-112,56267,955
---
168,999,388
-
-40,822
446
--
586,668--
14,62518,41936,661
842698,483
168,300,905
EUR
DANSKE FUND -HIGH DIVIDEND
15,797,096763,723
-421
376,195
---
16,937,435
11,636
-851
-
7,98342,56334,107
--
11,7772,1084,263
-115,288
16,822,147
EUR
DANSKE FUND -GLOBAL HIGH
INCOME
The accompanying notes form an integral part of these financial statements.
-5,754,627
-----
-14.345
-----
Net asset value per unit
Number of units outstanding
Accumulation Class N-NOK (hedged)Accumulation Class AAccumulation Class S-SEK (hedged)Distribution ClassAccumulation Class IDIAccumulation Class SPAccumulation Class I
Accumulation Class N-NOK (hedged)Accumulation Class AAccumulation Class S-SEK (hedged)Distribution ClassAccumulation Class IDIAccumulation Class SPAccumulation Class I
-2,495,232
---
6,364-
-30.890
---
37.670-
-6,671,388
----
2,468,366
-21.425
----
10.276
-656,748
6,786----
-25.50810.316
----
* See note 1 for more details
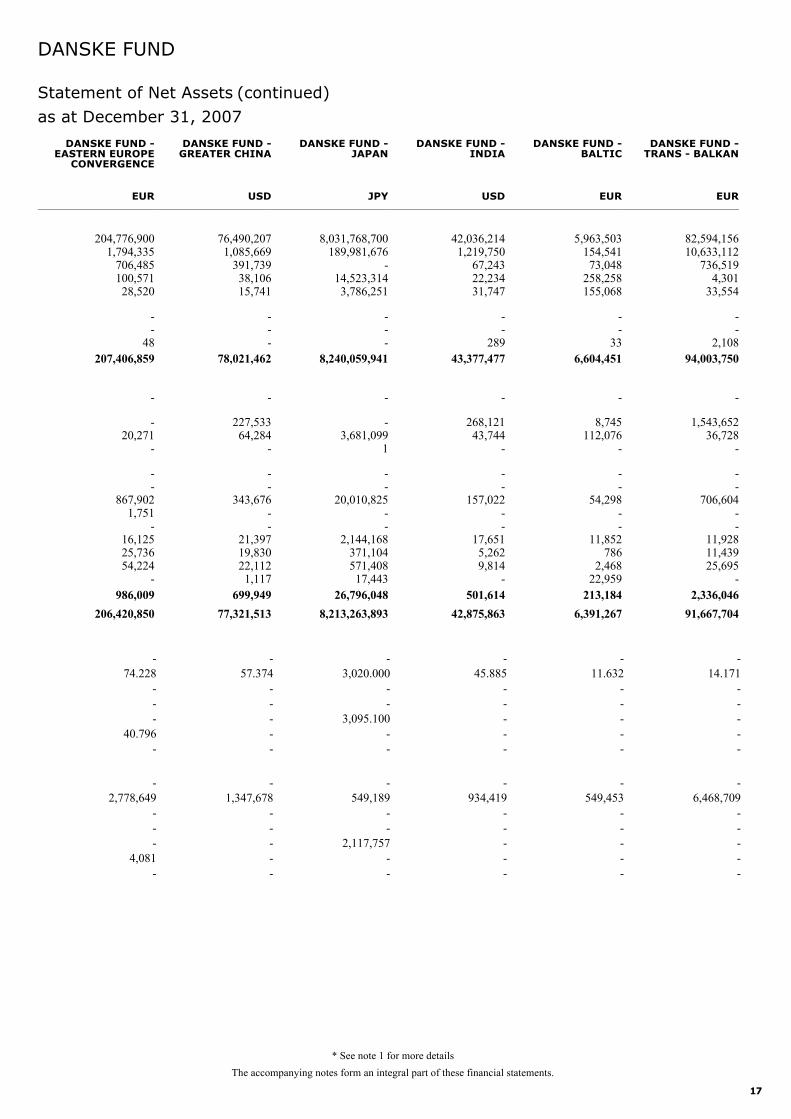
17
Statement of Net Assets
DANSKE FUND
as at December 31, 2007
(continued)
204,776,9001,794,335
706,485100,57128,520
--
48207,406,859
-
-20,271
-
--
867,9021,751
-16,12525,73654,224
-986,009
206,420,850
EUR
DANSKE FUND -EASTERN EUROPE
CONVERGENCE
76,490,2071,085,669
391,73938,10615,741
---
78,021,462
-
227,53364,284
-
--
343,676--
21,39719,83022,1121,117
699,94977,321,513
USD
DANSKE FUND -GREATER CHINA
8,031,768,700189,981,676
-14,523,3143,786,251
---
8,240,059,941
-
-3,681,099
1
--
20,010,825--
2,144,168371,104571,40817,443
26,796,0488,213,263,893
JPY
DANSKE FUND -JAPAN
42,036,2141,219,750
67,24322,23431,747
--
28943,377,477
-
268,12143,744
-
--
157,022--
17,6515,2629,814
-501,614
42,875,863
USD
DANSKE FUND -INDIA
5,963,503154,54173,048
258,258155,068
--
336,604,451
-
8,745112,076
-
--
54,298--
11,852786
2,46822,959
213,1846,391,267
EUR
DANSKE FUND -BALTIC
82,594,15610,633,112
736,5194,301
33,554
--
2,10894,003,750
-
1,543,65236,728
-
--
706,604--
11,92811,43925,695
-2,336,046
91,667,704
EUR
DANSKE FUND -TRANS - BALKAN
The accompanying notes form an integral part of these financial statements.
-2,778,649
---
4,081-
-74.228
---
40.796-
-1,347,678
-----
-57.374
-----
-549,189
--
2,117,757--
-3,020.000
--
3,095.100--
-934,419
-----
-45.885
-----
-549,453
-----
-11.632
-----
-6,468,709
-----
-14.171
-----
* See note 1 for more details
18
Statement of Net Assets
DANSKE FUND
as at December 31, 2007
(continued)
ASSETS
Investment portfolio at market value (3) 23,728,269Cash at bank 532,221Amounts receivable on sale of investments -Amounts receivable on subscriptions 165Interest and dividends receivable, net 1,262Net unrealised profit on forward foreignexchange contracts
(9)-
Net unrealised profit on futures (11) -Other assets 1TOTAL ASSETS 24,261,918
LIABILITIES
Bank overdraft -Amounts payable on purchase ofinvestments -Amounts payable on redemptions 83,681Interest payable -Net unrealised loss on forward foreignexchange contracts
(9)-
Net unrealised loss on futures (11) -Management commission payable (4) 45,639Performance fee payable (7) -Unrealised capital gain tax on investment -Taxes and expenses payable 11,946Taxe d'abonnement payable (8) 920Marketing fees payable (4) 870Other liabilities accounts -TOTAL LIABILITIES 143,056TOTAL NET ASSETS 24,118,862
EURNote
DANSKE FUND -GERMANY *
46,018,296295,915
6,2804,299
24,795
---
46,349,585
255
-3,358
1
--
115,105-
39,81023,7292,6143,707
4188,583
46,161,002
USD
DANSKE FUND -GLOBAL EMERGING
MARKET SMALL CAP*
1,430,472,25241,638,3892,021,938
700,0375,300,670
36,90785,34049,389
1,480,304,922
24,362
10,812,8792,070,036
4,612
7,983213,446
5,061,2625,058
314,809321,365167,813305,73824,699
19,334,0621,460,970,860
EUR
Combined
The accompanying notes form an integral part of these financial statements.
-369,132
----
2,382,704
-8.716
----
8.772
Net asset value per unit
Number of units outstanding
Accumulation Class N-NOK (hedged)Accumulation Class AAccumulation Class S-SEK (hedged)Distribution ClassAccumulation Class IDIAccumulation Class SPAccumulation Class I
Accumulation Class N-NOK (hedged)Accumulation Class AAccumulation Class S-SEK (hedged)Distribution ClassAccumulation Class IDIAccumulation Class SPAccumulation Class I
-655,085
----
1,396,580
-22.383
----
22.554
* See note 1 for more details
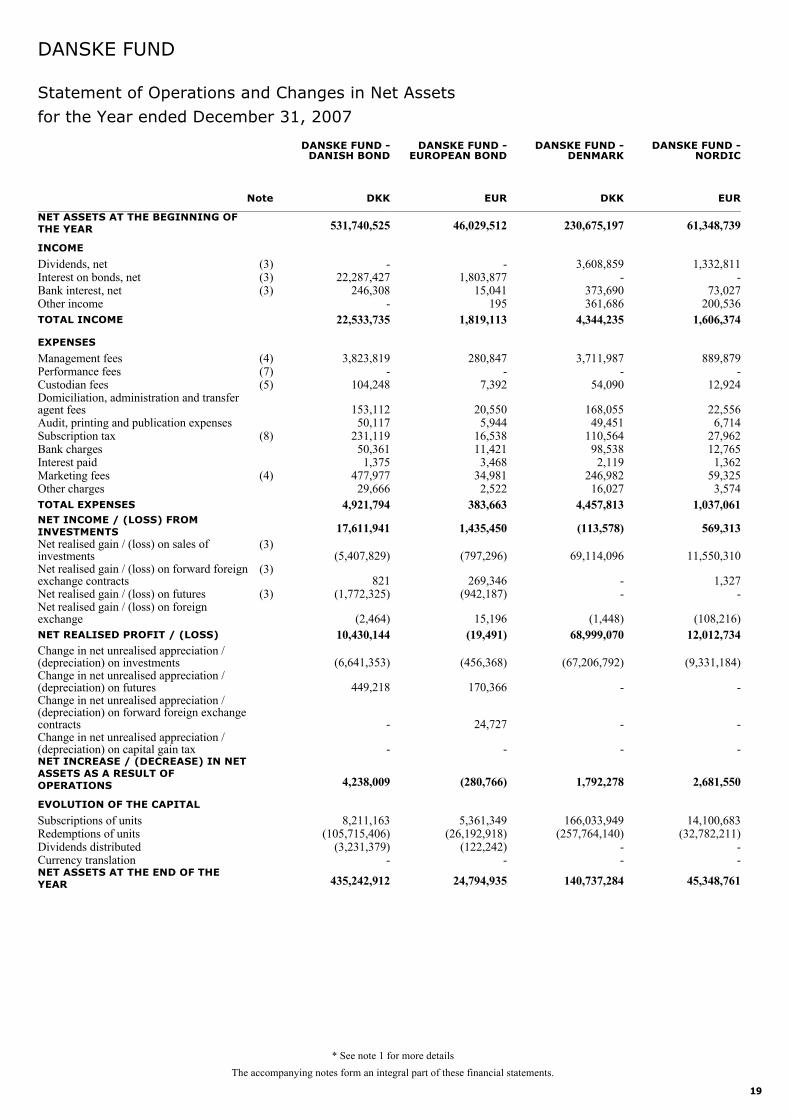
19
The accompanying notes form an integral part of these financial statements.
Statement of Operations and Changes in Net Assets
NET ASSETS AT THE BEGINNING OFTHE YEAR 531,740,525
INCOME
Dividends, net (3) -Interest on bonds, net (3) 22,287,427Bank interest, net (3) 246,308Other income -TOTAL INCOME 22,533,735
EXPENSES
Management fees (4) 3,823,819Performance fees (7) -Custodian fees (5) 104,248Domiciliation, administration and transferagent fees 153,112Audit, printing and publication expenses 50,117Subscription tax (8) 231,119Bank charges 50,361Interest paid 1,375Marketing fees (4) 477,977Other charges 29,666TOTAL EXPENSES 4,921,794NET INCOME / (LOSS) FROMINVESTMENTS 17,611,941Net realised gain / (loss) on sales ofinvestments
(3)(5,407,829)
Net realised gain / (loss) on forward foreignexchange contracts
(3)821
Net realised gain / (loss) on futures (3) (1,772,325)Net realised gain / (loss) on foreignexchange (2,464)NET REALISED PROFIT / (LOSS) 10,430,144Change in net unrealised appreciation /(depreciation) on investments (6,641,353)Change in net unrealised appreciation /(depreciation) on futures 449,218Change in net unrealised appreciation /(depreciation) on forward foreign exchangecontracts -Change in net unrealised appreciation / (depreciation) on capital gain tax -NET INCREASE / (DECREASE) IN NETASSETS AS A RESULT OFOPERATIONS 4,238,009
EVOLUTION OF THE CAPITAL
Subscriptions of units 8,211,163Redemptions of units (105,715,406)Dividends distributed (3,231,379)Currency translation -NET ASSETS AT THE END OF THEYEAR 435,242,912
DKKNote
DANSKE FUND -DANISH BOND
46,029,512
-1,803,877
15,041195
1,819,113
280,847-
7,392
20,5505,944
16,53811,4213,468
34,9812,522
383,663
1,435,450
(797,296)
269,346(942,187)
15,196(19,491)
(456,368)
170,366
24,727
-
(280,766)
5,361,349(26,192,918)
(122,242)-
24,794,935
EUR
DANSKE FUND -EUROPEAN BOND
230,675,197
3,608,859-
373,690361,686
4,344,235
3,711,987-
54,090
168,05549,451
110,56498,5382,119
246,98216,027
4,457,813
(113,578)
69,114,096
--
(1,448)68,999,070
(67,206,792)
-
-
-
1,792,278
166,033,949(257,764,140)
--
140,737,284
DKK
DANSKE FUND -DENMARK
61,348,739
1,332,811-
73,027200,536
1,606,374
889,879-
12,924
22,5566,714
27,96212,7651,362
59,3253,574
1,037,061
569,313
11,550,310
1,327-
(108,216)12,012,734
(9,331,184)
-
-
-
2,681,550
14,100,683(32,782,211)
--
45,348,761
EUR
DANSKE FUND -NORDIC
DANSKE FUND
for the Year ended December 31, 2007
* See note 1 for more details
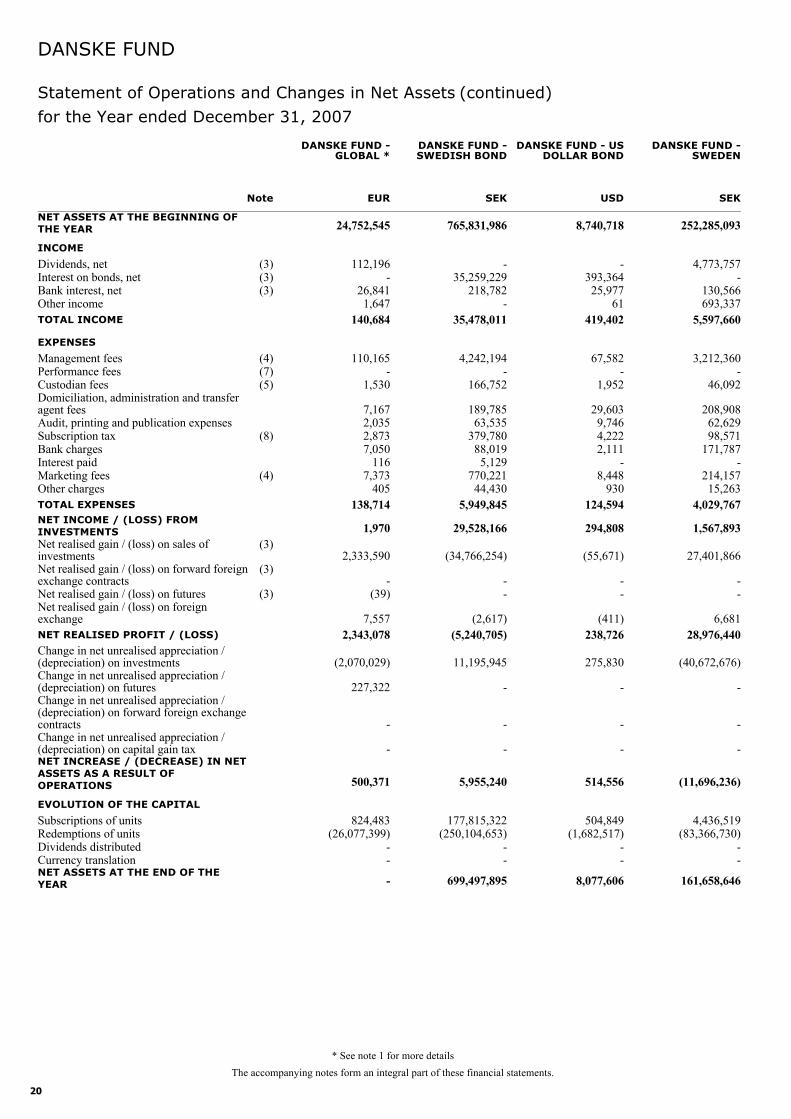
20
The accompanying notes form an integral part of these financial statements.
Statement of Operations and Changes in Net Assets
NET ASSETS AT THE BEGINNING OFTHE YEAR 24,752,545
INCOME
Dividends, net (3) 112,196Interest on bonds, net (3) -Bank interest, net (3) 26,841Other income 1,647TOTAL INCOME 140,684
EXPENSES
Management fees (4) 110,165Performance fees (7) -Custodian fees (5) 1,530Domiciliation, administration and transferagent fees 7,167Audit, printing and publication expenses 2,035Subscription tax (8) 2,873Bank charges 7,050Interest paid 116Marketing fees (4) 7,373Other charges 405TOTAL EXPENSES 138,714NET INCOME / (LOSS) FROMINVESTMENTS 1,970Net realised gain / (loss) on sales ofinvestments
(3)2,333,590
Net realised gain / (loss) on forward foreignexchange contracts
(3)-
Net realised gain / (loss) on futures (3) (39)Net realised gain / (loss) on foreignexchange 7,557NET REALISED PROFIT / (LOSS) 2,343,078Change in net unrealised appreciation /(depreciation) on investments (2,070,029)Change in net unrealised appreciation /(depreciation) on futures 227,322Change in net unrealised appreciation /(depreciation) on forward foreign exchangecontracts -Change in net unrealised appreciation / (depreciation) on capital gain tax -NET INCREASE / (DECREASE) IN NETASSETS AS A RESULT OFOPERATIONS 500,371
EVOLUTION OF THE CAPITAL
Subscriptions of units 824,483Redemptions of units (26,077,399)Dividends distributed -Currency translation -NET ASSETS AT THE END OF THEYEAR -
EURNote
DANSKE FUND -GLOBAL *
765,831,986
-35,259,229
218,782-
35,478,011
4,242,194-
166,752
189,78563,535
379,78088,0195,129
770,22144,430
5,949,845
29,528,166
(34,766,254)
--
(2,617)(5,240,705)
11,195,945
-
-
-
5,955,240
177,815,322(250,104,653)
--
699,497,895
SEK
DANSKE FUND -SWEDISH BOND
8,740,718
-393,36425,977
61419,402
67,582-
1,952
29,6039,7464,2222,111
-8,448
930124,594
294,808
(55,671)
--
(411)238,726
275,830
-
-
-
514,556
504,849(1,682,517)
--
8,077,606
USD
DANSKE FUND - USDOLLAR BOND
252,285,093
4,773,757-
130,566693,337
5,597,660
3,212,360-
46,092
208,90862,62998,571
171,787-
214,15715,263
4,029,767
1,567,893
27,401,866
--
6,68128,976,440
(40,672,676)
-
-
-
(11,696,236)
4,436,519(83,366,730)
--
161,658,646
SEK
DANSKE FUND -SWEDEN
DANSKE FUND
for the Year ended December 31, 2007
* See note 1 for more details
(continued)
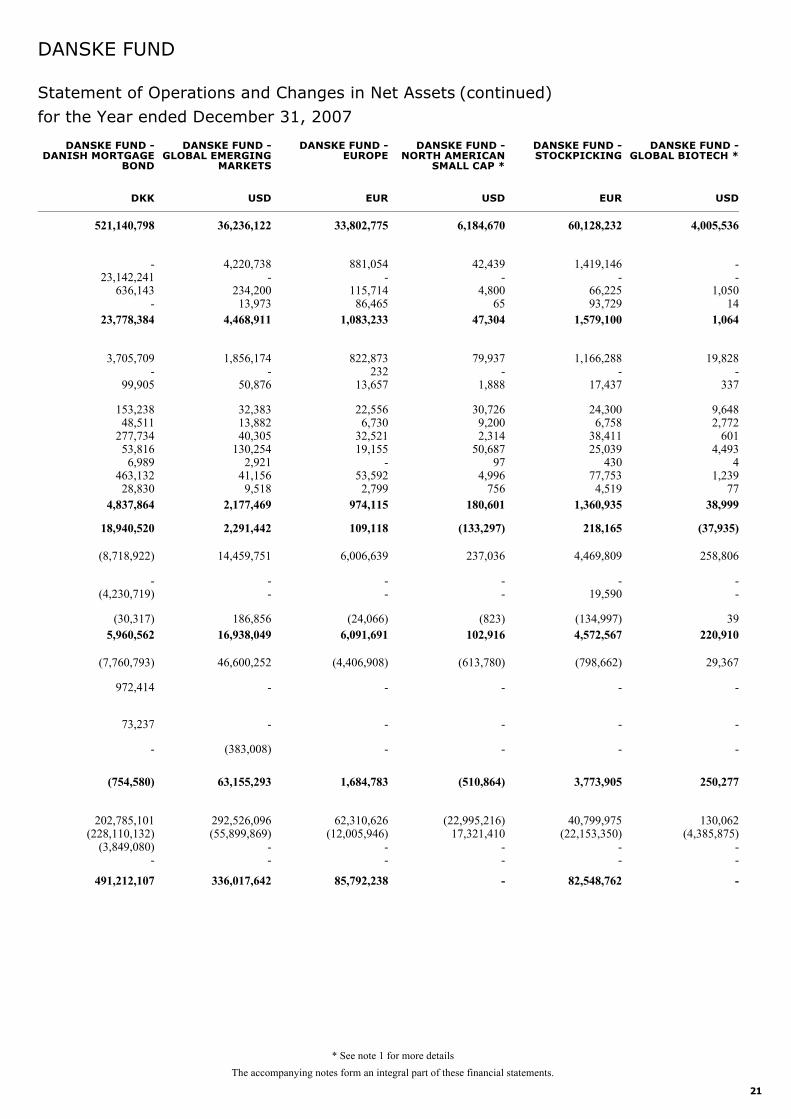
21
The accompanying notes form an integral part of these financial statements.
Statement of Operations and Changes in Net Assets
521,140,798
-23,142,241
636,143-
23,778,384
3,705,709-
99,905
153,23848,511
277,73453,8166,989
463,13228,830
4,837,864
18,940,520
(8,718,922)
-(4,230,719)
(30,317)5,960,562
(7,760,793)
972,414
73,237
-
(754,580)
202,785,101(228,110,132)
(3,849,080)-
491,212,107
DKK
DANSKE FUND -DANISH MORTGAGE
BOND
36,236,122
4,220,738-
234,20013,973
4,468,911
1,856,174-
50,876
32,38313,88240,305
130,2542,921
41,1569,518
2,177,469
2,291,442
14,459,751
--
186,85616,938,049
46,600,252
-
-
(383,008)
63,155,293
292,526,096(55,899,869)
--
336,017,642
USD
DANSKE FUND -GLOBAL EMERGING
MARKETS
33,802,775
881,054-
115,71486,465
1,083,233
822,873232
13,657
22,5566,730
32,52119,155
-53,5922,799
974,115
109,118
6,006,639
--
(24,066)6,091,691
(4,406,908)
-
-
-
1,684,783
62,310,626(12,005,946)
--
85,792,238
EUR
DANSKE FUND -EUROPE
6,184,670
42,439-
4,80065
47,304
79,937-
1,888
30,7269,2002,314
50,68797
4,996756
180,601
(133,297)
237,036
--
(823)102,916
(613,780)
-
-
-
(510,864)
(22,995,216)17,321,410
--
-
USD
DANSKE FUND -NORTH AMERICAN
SMALL CAP *
60,128,232
1,419,146-
66,22593,729
1,579,100
1,166,288-
17,437
24,3006,758
38,41125,039
43077,7534,519
1,360,935
218,165
4,469,809
-19,590
(134,997)4,572,567
(798,662)
-
-
-
3,773,905
40,799,975(22,153,350)
--
82,548,762
EUR
DANSKE FUND -STOCKPICKING
4,005,536
--
1,05014
1,064
19,828-
337
9,6482,772
6014,493
41,239
7738,999
(37,935)
258,806
--
39220,910
29,367
-
-
-
250,277
130,062(4,385,875)
--
-
USD
DANSKE FUND -GLOBAL BIOTECH *
DANSKE FUND
for the Year ended December 31, 2007
* See note 1 for more details
(continued)
22
The accompanying notes form an integral part of these financial statements.
Statement of Operations and Changes in Net Assets
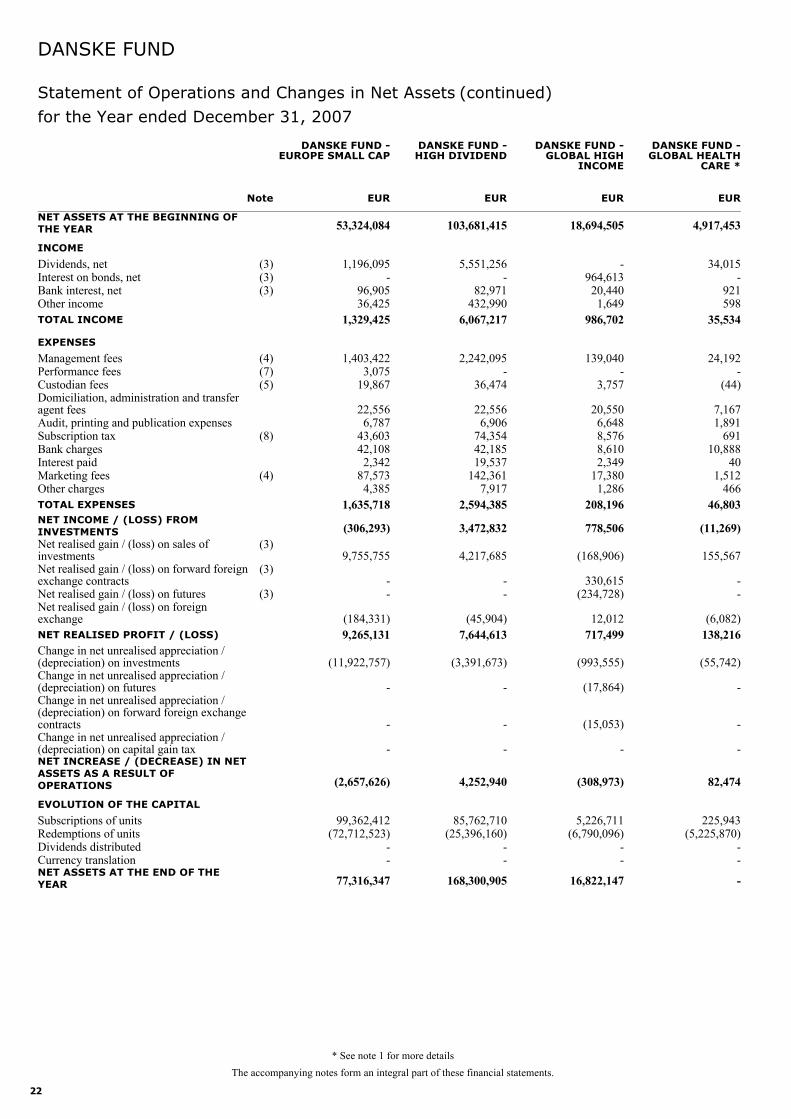
NET ASSETS AT THE BEGINNING OFTHE YEAR 53,324,084
INCOME
Dividends, net (3) 1,196,095Interest on bonds, net (3) -Bank interest, net (3) 96,905Other income 36,425TOTAL INCOME 1,329,425
EXPENSES
Management fees (4) 1,403,422Performance fees (7) 3,075Custodian fees (5) 19,867Domiciliation, administration and transferagent fees 22,556Audit, printing and publication expenses 6,787Subscription tax (8) 43,603Bank charges 42,108Interest paid 2,342Marketing fees (4) 87,573Other charges 4,385TOTAL EXPENSES 1,635,718NET INCOME / (LOSS) FROMINVESTMENTS (306,293)Net realised gain / (loss) on sales ofinvestments
(3)9,755,755
Net realised gain / (loss) on forward foreignexchange contracts
(3)-
Net realised gain / (loss) on futures (3) -Net realised gain / (loss) on foreignexchange (184,331)NET REALISED PROFIT / (LOSS) 9,265,131Change in net unrealised appreciation /(depreciation) on investments (11,922,757)Change in net unrealised appreciation /(depreciation) on futures -Change in net unrealised appreciation /(depreciation) on forward foreign exchangecontracts -Change in net unrealised appreciation / (depreciation) on capital gain tax -NET INCREASE / (DECREASE) IN NETASSETS AS A RESULT OFOPERATIONS (2,657,626)
EVOLUTION OF THE CAPITAL
Subscriptions of units 99,362,412Redemptions of units (72,712,523)Dividends distributed -Currency translation -NET ASSETS AT THE END OF THEYEAR 77,316,347
EURNote
DANSKE FUND -EUROPE SMALL CAP
103,681,415
5,551,256-
82,971432,990
6,067,217
2,242,095-
36,474
22,5566,906
74,35442,18519,537
142,3617,917
2,594,385
3,472,832
4,217,685
--
(45,904)7,644,613
(3,391,673)
-
-
-
4,252,940
85,762,710(25,396,160)
--
168,300,905
EUR
DANSKE FUND -HIGH DIVIDEND
18,694,505
-964,61320,4401,649
986,702
139,040-
3,757
20,5506,6488,5768,6102,349
17,3801,286
208,196
778,506
(168,906)
330,615(234,728)
12,012717,499
(993,555)
(17,864)
(15,053)
-
(308,973)
5,226,711(6,790,096)
--
16,822,147
EUR
DANSKE FUND -GLOBAL HIGH
INCOME
4,917,453
34,015-
921598
35,534
24,192-
(44)
7,1671,891
69110,888
401,512
46646,803
(11,269)
155,567
--
(6,082)138,216
(55,742)
-
-
-
82,474
225,943(5,225,870)
--
-
EUR
DANSKE FUND -GLOBAL HEALTH
CARE *
DANSKE FUND
for the Year ended December 31, 2007
* See note 1 for more details
(continued)
23
The accompanying notes form an integral part of these financial statements.
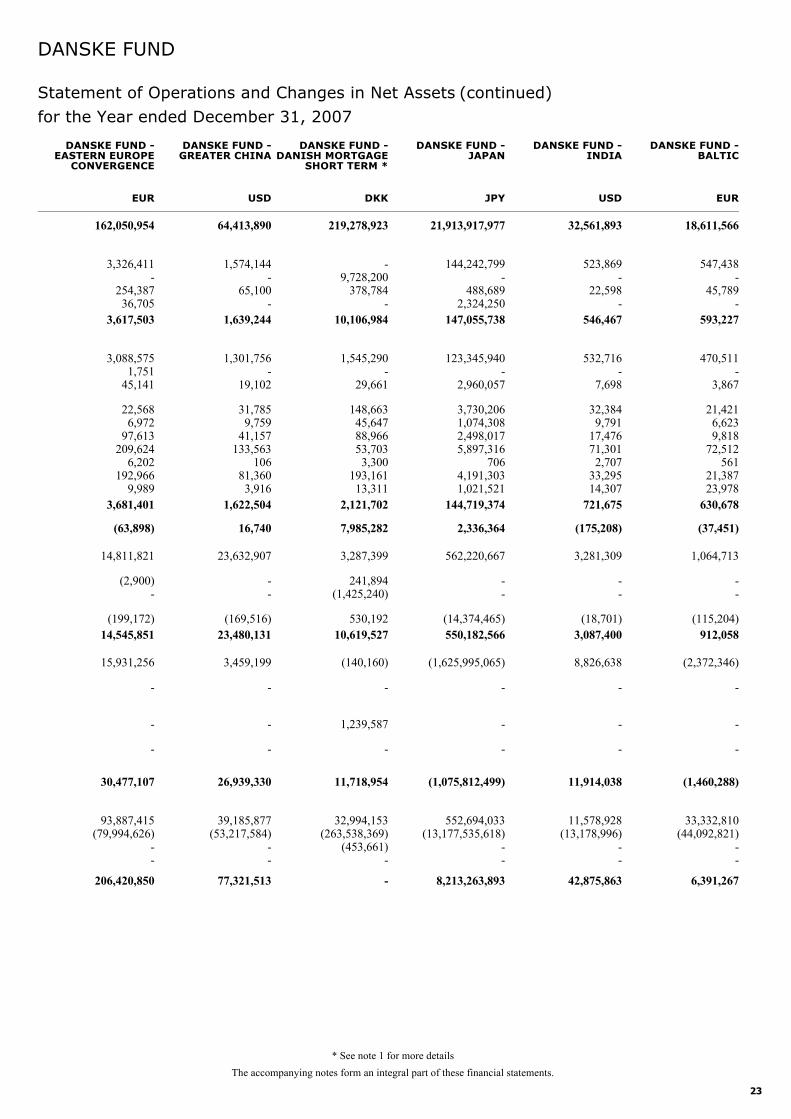
Statement of Operations and Changes in Net Assets
162,050,954
3,326,411-
254,38736,705
3,617,503
3,088,5751,751
45,141
22,5686,972
97,613209,624
6,202192,966
9,9893,681,401
(63,898)
14,811,821
(2,900)-
(199,172)14,545,851
15,931,256
-
-
-
30,477,107
93,887,415(79,994,626)
--
206,420,850
EUR
DANSKE FUND -EASTERN EUROPE
CONVERGENCE
64,413,890
1,574,144-
65,100-
1,639,244
1,301,756-
19,102
31,7859,759
41,157133,563
10681,3603,916
1,622,504
16,740
23,632,907
--
(169,516)23,480,131
3,459,199
-
-
-
26,939,330
39,185,877(53,217,584)
--
77,321,513
USD
DANSKE FUND -GREATER CHINA
219,278,923
-9,728,200
378,784-
10,106,984
1,545,290-
29,661
148,66345,64788,96653,7033,300
193,16113,311
2,121,702
7,985,282
3,287,399
241,894(1,425,240)
530,19210,619,527
(140,160)
-
1,239,587
-
11,718,954
32,994,153(263,538,369)
(453,661)-
-
DKK
DANSKE FUND -DANISH MORTGAGE
SHORT TERM *
21,913,917,977
144,242,799-
488,6892,324,250
147,055,738
123,345,940-
2,960,057
3,730,2061,074,3082,498,0175,897,316
7064,191,3031,021,521
144,719,374
2,336,364
562,220,667
--
(14,374,465)550,182,566
(1,625,995,065)
-
-
-
(1,075,812,499)
552,694,033(13,177,535,618)
--
8,213,263,893
JPY
DANSKE FUND -JAPAN
32,561,893
523,869-
22,598-
546,467
532,716-
7,698
32,3849,791
17,47671,3012,707
33,29514,307
721,675
(175,208)
3,281,309
--
(18,701)3,087,400
8,826,638
-
-
-
11,914,038
11,578,928(13,178,996)
--
42,875,863
USD
DANSKE FUND -INDIA
18,611,566
547,438-
45,789-
593,227
470,511-
3,867
21,4216,6239,818
72,512561
21,38723,978
630,678
(37,451)
1,064,713
--
(115,204)912,058
(2,372,346)
-
-
-
(1,460,288)
33,332,810(44,092,821)
--
6,391,267
EUR
DANSKE FUND -BALTIC
DANSKE FUND
for the Year ended December 31, 2007
* See note 1 for more details
(continued)
24
The accompanying notes form an integral part of these financial statements.
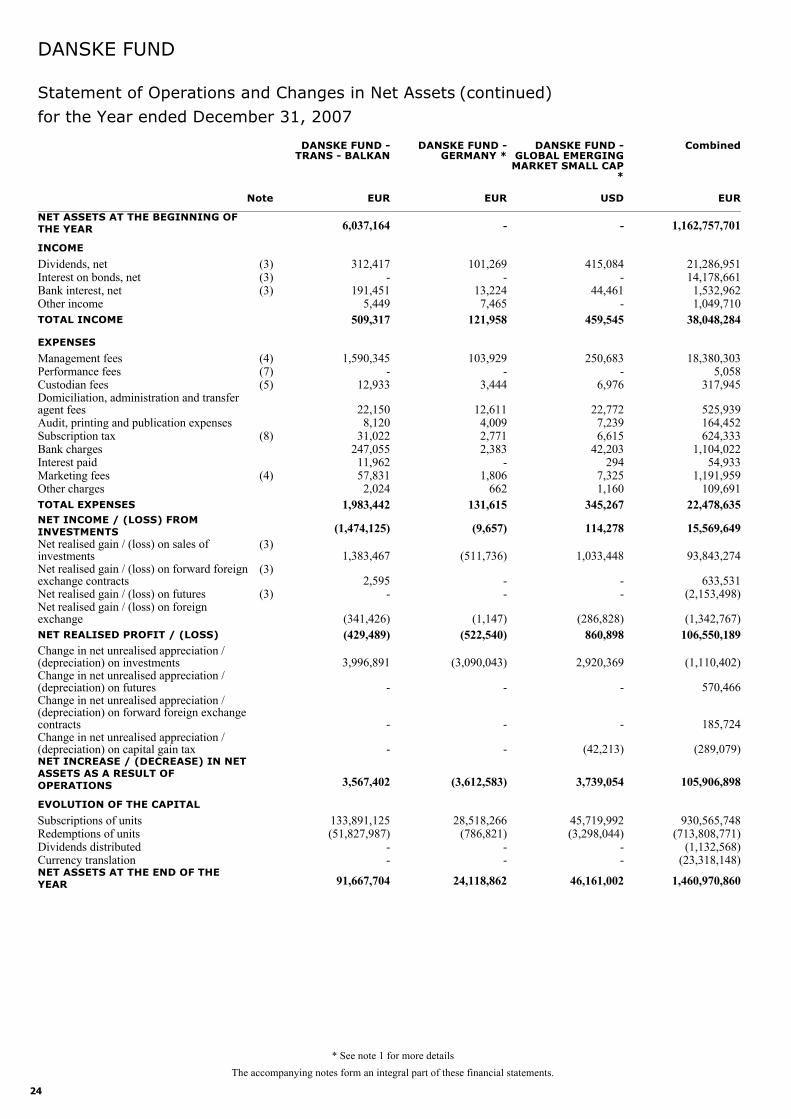
Statement of Operations and Changes in Net Assets
NET ASSETS AT THE BEGINNING OFTHE YEAR 6,037,164
INCOME
Dividends, net (3) 312,417Interest on bonds, net (3) -Bank interest, net (3) 191,451Other income 5,449TOTAL INCOME 509,317
EXPENSES
Management fees (4) 1,590,345Performance fees (7) -Custodian fees (5) 12,933Domiciliation, administration and transferagent fees 22,150Audit, printing and publication expenses 8,120Subscription tax (8) 31,022Bank charges 247,055Interest paid 11,962Marketing fees (4) 57,831Other charges 2,024TOTAL EXPENSES 1,983,442NET INCOME / (LOSS) FROMINVESTMENTS (1,474,125)Net realised gain / (loss) on sales ofinvestments
(3)1,383,467
Net realised gain / (loss) on forward foreignexchange contracts
(3)2,595
Net realised gain / (loss) on futures (3) -Net realised gain / (loss) on foreignexchange (341,426)NET REALISED PROFIT / (LOSS) (429,489)Change in net unrealised appreciation /(depreciation) on investments 3,996,891Change in net unrealised appreciation /(depreciation) on futures -Change in net unrealised appreciation /(depreciation) on forward foreign exchangecontracts -Change in net unrealised appreciation / (depreciation) on capital gain tax -NET INCREASE / (DECREASE) IN NETASSETS AS A RESULT OFOPERATIONS 3,567,402
EVOLUTION OF THE CAPITAL
Subscriptions of units 133,891,125Redemptions of units (51,827,987)Dividends distributed -Currency translation -NET ASSETS AT THE END OF THEYEAR 91,667,704
EURNote
DANSKE FUND -TRANS - BALKAN
-
101,269-
13,2247,465
121,958
103,929-
3,444
12,6114,0092,7712,383
-1,806
662131,615
(9,657)
(511,736)
--
(1,147)(522,540)
(3,090,043)
-
-
-
(3,612,583)
28,518,266(786,821)
--
24,118,862
EUR
DANSKE FUND -GERMANY *
-
415,084-
44,461-
459,545
250,683-
6,976
22,7727,2396,615
42,203294
7,3251,160
345,267
114,278
1,033,448
--
(286,828)860,898
2,920,369
-
-
(42,213)
3,739,054
45,719,992(3,298,044)
--
46,161,002
USD
DANSKE FUND -GLOBAL EMERGING
MARKET SMALL CAP*
1,162,757,701
21,286,95114,178,6611,532,9621,049,710
38,048,284
18,380,3035,058
317,945
525,939164,452624,333
1,104,02254,933
1,191,959109,691
22,478,635
15,569,649
93,843,274
633,531(2,153,498)
(1,342,767)106,550,189
(1,110,402)
570,466
185,724
(289,079)
105,906,898
930,565,748(713,808,771)
(1,132,568)(23,318,148)
1,460,970,860
EUR
Combined
DANSKE FUND
for the Year ended December 31, 2007
* See note 1 for more details
(continued)

25
Changes in the Number of Units for the Year ended December 31, 2007
Number of units outstanding at the beginning of the yearAccumulation Class N-NOK (hedged)
Number of units issuedNumber of units redeemedNumber of units outstanding at the end of the year
1,342,81123,950
(282,118)1,084,643
Number of units outstanding at the beginning of the yearAccumulation Class A
Number of units issuedNumber of units redeemedNumber of units outstanding at the end of the year
Number of units outstanding at the beginning of the yearAccumulation Class S-SEK (hedged)
Number of units issuedNumber of units redeemedNumber of units outstanding at the end of the year
1,114,5268,435
(183,340)939,621
Number of units outstanding at the beginning of the yearDistribution Class
Number of units issuedNumber of units redeemedNumber of units outstanding at the end of the year
Number of units outstanding at the beginning of the yearAccumulation Class IDI
Number of units issuedNumber of units redeemedNumber of units outstanding at the end of the year
Number of units outstanding at the beginning of the yearAccumulation Class SP
Number of units issuedNumber of units redeemedNumber of units outstanding at the end of the year
Number of units outstanding at the beginning of the yearAccumulation Class I
Number of units issuedNumber of units redeemedNumber of units outstanding at the end of the year
DANSKE FUND -DANISH BOND
2,964,696374,703
(1,788,634)1,550,765
512,26824,903
(177,283)359,888
DANSKE FUND -EUROPEAN BOND
314,272208,484
(332,812)189,944
4,321723
(366)4,678
DANSKE FUND -DENMARK
DANSKE FUND
* See note 1 for more detailsThe accompanying notes form an integral part of these financial statements.
26
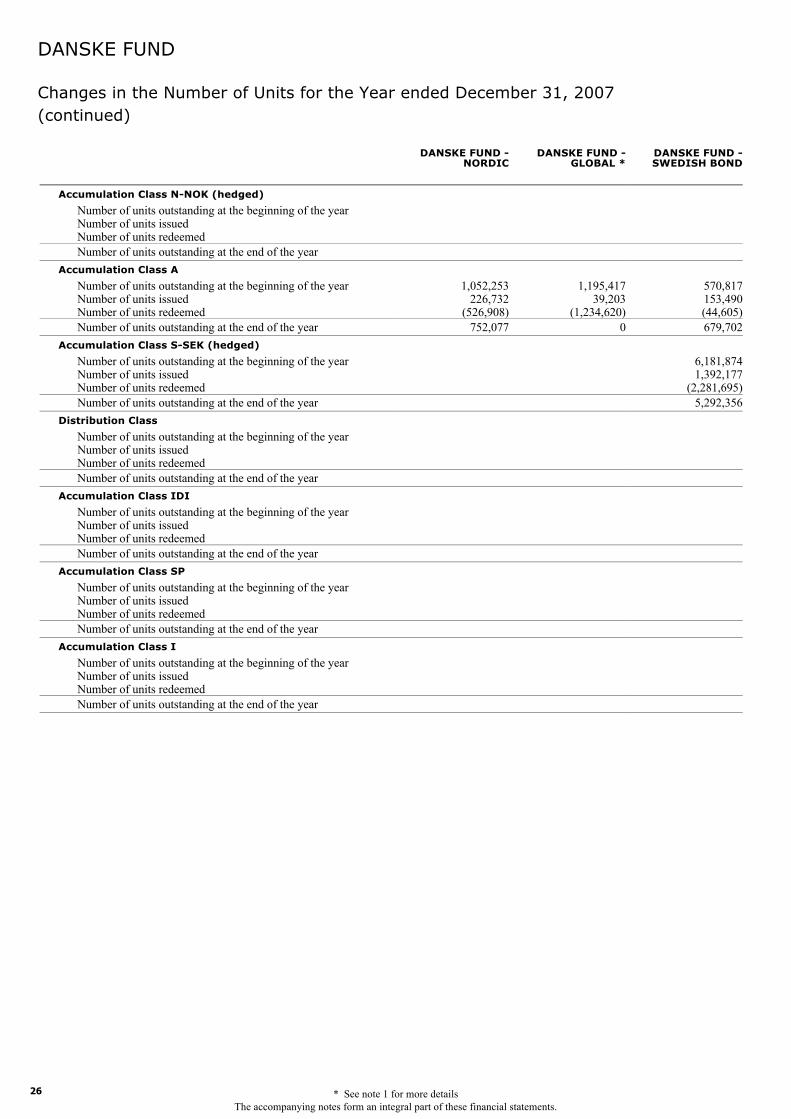
Changes in the Number of Units for the Year ended December 31, 2007
Number of units outstanding at the beginning of the yearAccumulation Class N-NOK (hedged)
Number of units issuedNumber of units redeemedNumber of units outstanding at the end of the year
1,052,253226,732
(526,908)752,077
Number of units outstanding at the beginning of the yearAccumulation Class A
Number of units issuedNumber of units redeemedNumber of units outstanding at the end of the year
Number of units outstanding at the beginning of the yearAccumulation Class S-SEK (hedged)
Number of units issuedNumber of units redeemedNumber of units outstanding at the end of the year
Number of units outstanding at the beginning of the yearDistribution Class
Number of units issuedNumber of units redeemedNumber of units outstanding at the end of the year
Number of units outstanding at the beginning of the yearAccumulation Class IDI
Number of units issuedNumber of units redeemedNumber of units outstanding at the end of the year
Number of units outstanding at the beginning of the yearAccumulation Class SP
Number of units issuedNumber of units redeemedNumber of units outstanding at the end of the year
Number of units outstanding at the beginning of the yearAccumulation Class I
Number of units issuedNumber of units redeemedNumber of units outstanding at the end of the year
DANSKE FUND -NORDIC
1,195,41739,203
(1,234,620)0
DANSKE FUND -GLOBAL *
570,817153,490(44,605)679,702
6,181,8741,392,177
(2,281,695)5,292,356
DANSKE FUND -SWEDISH BOND
DANSKE FUND
(continued)
* See note 1 for more detailsThe accompanying notes form an integral part of these financial statements.
27
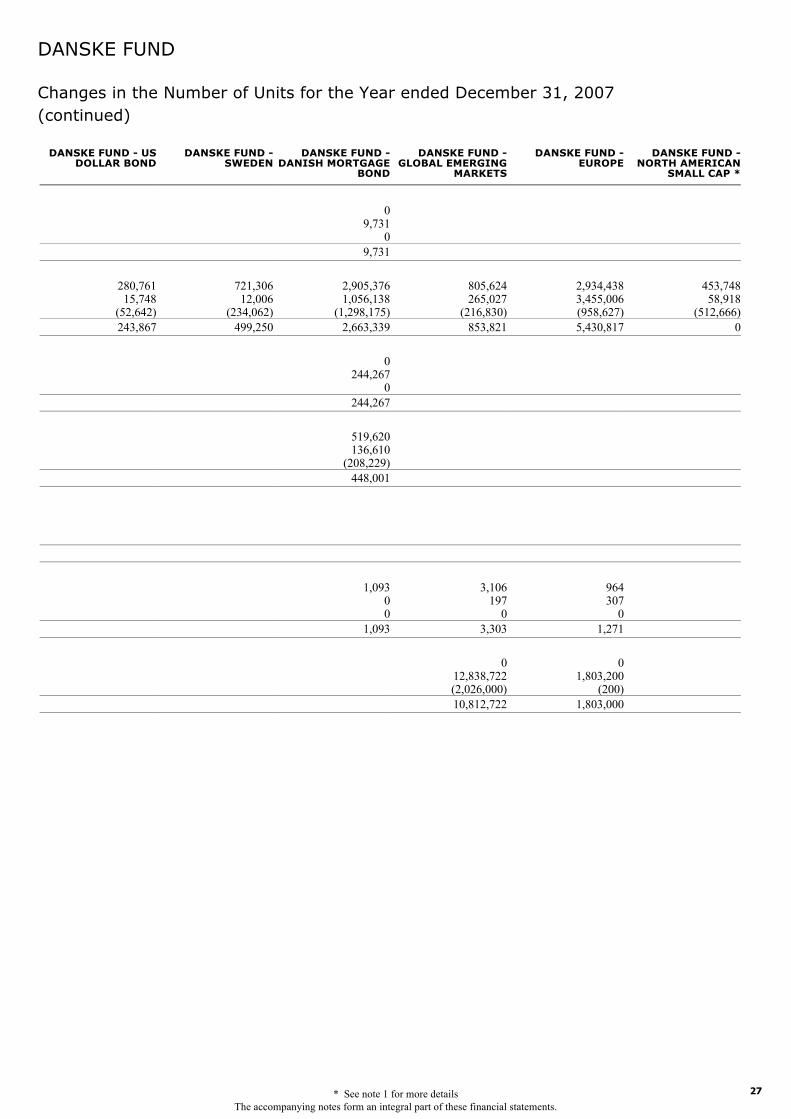
Changes in the Number of Units for the Year ended December 31, 2007
280,76115,748
(52,642)243,867
DANSKE FUND - USDOLLAR BOND
721,30612,006
(234,062)499,250
DANSKE FUND -SWEDEN
09,731
09,731
2,905,3761,056,138
(1,298,175)2,663,339
0244,267
0244,267
519,620136,610
(208,229)448,001
1,09300
1,093
DANSKE FUND -DANISH MORTGAGE
BOND
805,624265,027
(216,830)853,821
3,106197
03,303
012,838,722(2,026,000)10,812,722
DANSKE FUND -GLOBAL EMERGING
MARKETS
2,934,4383,455,006(958,627)5,430,817
964307
01,271
01,803,200
(200)1,803,000
DANSKE FUND -EUROPE
453,74858,918
(512,666)0
DANSKE FUND -NORTH AMERICAN
SMALL CAP *
DANSKE FUND
(continued)
* See note 1 for more detailsThe accompanying notes form an integral part of these financial statements.
28
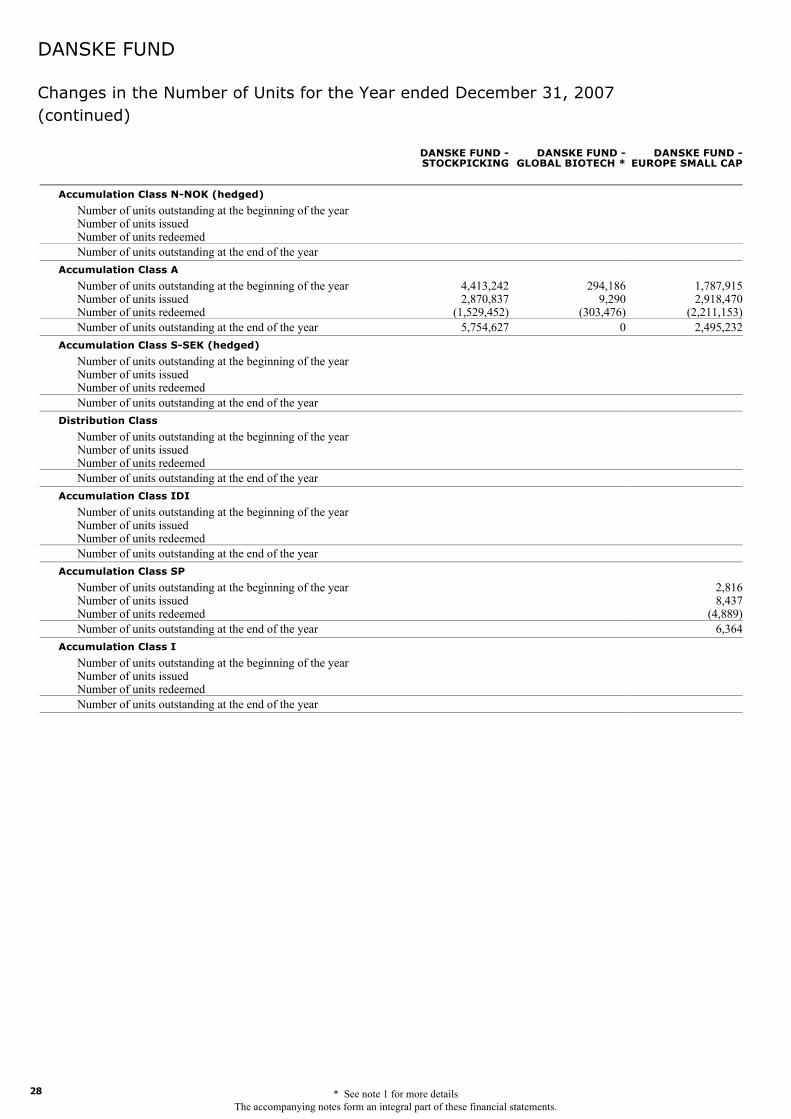
Changes in the Number of Units for the Year ended December 31, 2007
Number of units outstanding at the beginning of the yearAccumulation Class N-NOK (hedged)
Number of units issuedNumber of units redeemedNumber of units outstanding at the end of the year
4,413,2422,870,837
(1,529,452)5,754,627
Number of units outstanding at the beginning of the yearAccumulation Class A
Number of units issuedNumber of units redeemedNumber of units outstanding at the end of the year
Number of units outstanding at the beginning of the yearAccumulation Class S-SEK (hedged)
Number of units issuedNumber of units redeemedNumber of units outstanding at the end of the year
Number of units outstanding at the beginning of the yearDistribution Class
Number of units issuedNumber of units redeemedNumber of units outstanding at the end of the year
Number of units outstanding at the beginning of the yearAccumulation Class IDI
Number of units issuedNumber of units redeemedNumber of units outstanding at the end of the year
Number of units outstanding at the beginning of the yearAccumulation Class SP
Number of units issuedNumber of units redeemedNumber of units outstanding at the end of the year
Number of units outstanding at the beginning of the yearAccumulation Class I
Number of units issuedNumber of units redeemedNumber of units outstanding at the end of the year
DANSKE FUND -STOCKPICKING
294,1869,290
(303,476)0
DANSKE FUND -GLOBAL BIOTECH *
1,787,9152,918,470
(2,211,153)2,495,232
2,8168,437
(4,889)6,364
DANSKE FUND -EUROPE SMALL CAP
DANSKE FUND
(continued)
* See note 1 for more detailsThe accompanying notes form an integral part of these financial statements.
29
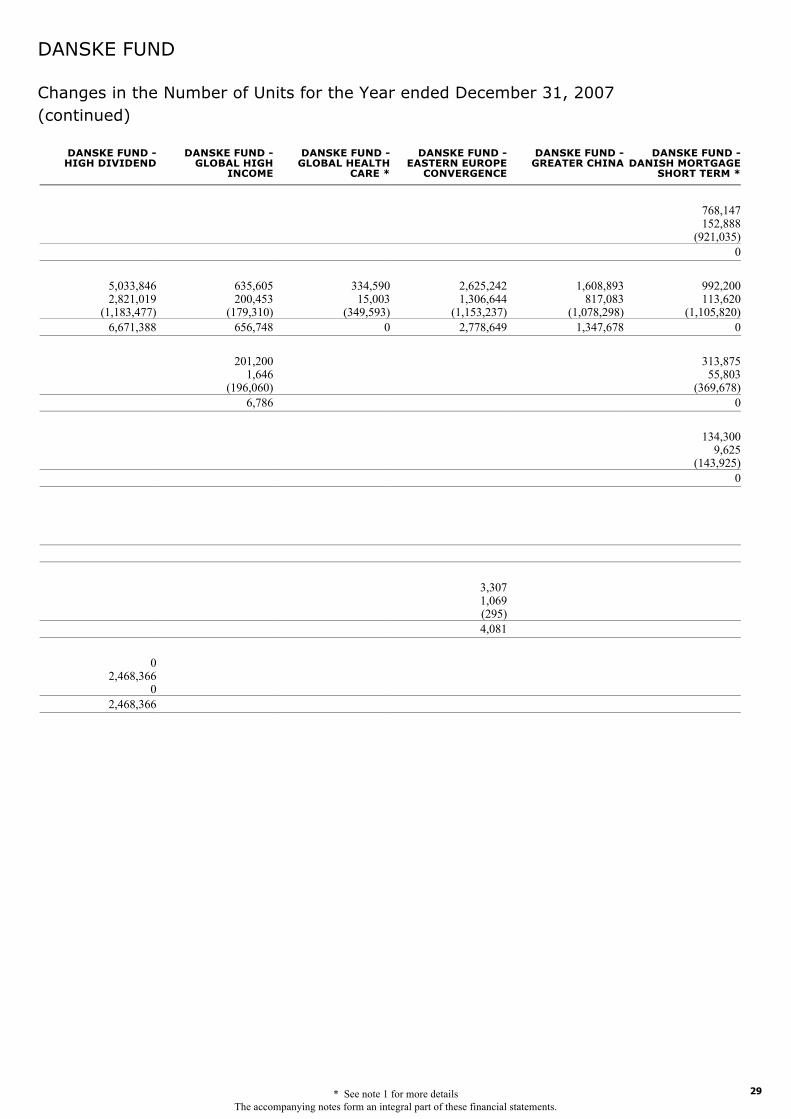
Changes in the Number of Units for the Year ended December 31, 2007
5,033,8462,821,019
(1,183,477)6,671,388
02,468,366
02,468,366
DANSKE FUND -HIGH DIVIDEND
635,605200,453
(179,310)656,748
201,2001,646
(196,060)6,786
DANSKE FUND -GLOBAL HIGH
INCOME
334,59015,003
(349,593)0
DANSKE FUND -GLOBAL HEALTH
CARE *
2,625,2421,306,644
(1,153,237)2,778,649
3,3071,069(295)4,081
DANSKE FUND -EASTERN EUROPE
CONVERGENCE
1,608,893817,083
(1,078,298)1,347,678
DANSKE FUND -GREATER CHINA
768,147152,888
(921,035)0
992,200113,620
(1,105,820)0
313,87555,803
(369,678)0
134,3009,625
(143,925)0
DANSKE FUND -DANISH MORTGAGE
SHORT TERM *
DANSKE FUND
(continued)
* See note 1 for more detailsThe accompanying notes form an integral part of these financial statements.
30
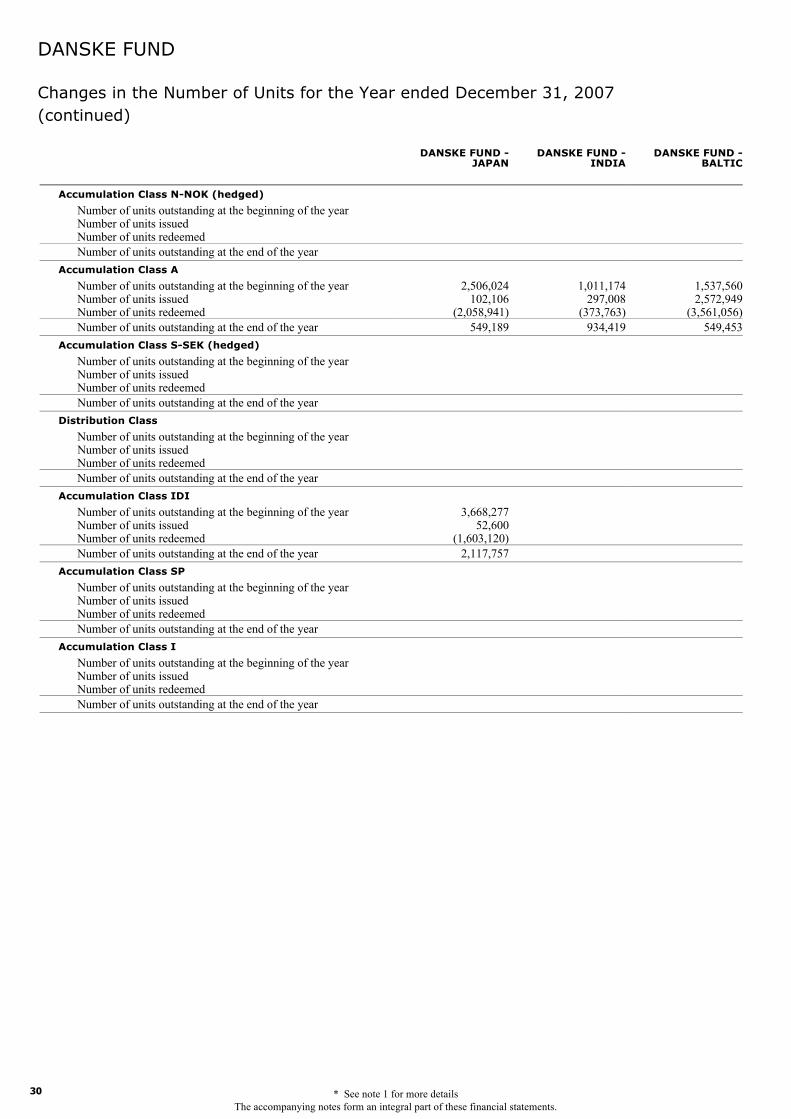
Changes in the Number of Units for the Year ended December 31, 2007
Number of units outstanding at the beginning of the yearAccumulation Class N-NOK (hedged)
Number of units issuedNumber of units redeemedNumber of units outstanding at the end of the year
2,506,024102,106
(2,058,941)549,189
Number of units outstanding at the beginning of the yearAccumulation Class A
Number of units issuedNumber of units redeemedNumber of units outstanding at the end of the year
Number of units outstanding at the beginning of the yearAccumulation Class S-SEK (hedged)
Number of units issuedNumber of units redeemedNumber of units outstanding at the end of the year
Number of units outstanding at the beginning of the yearDistribution Class
Number of units issuedNumber of units redeemedNumber of units outstanding at the end of the year
3,668,27752,600
(1,603,120)2,117,757
Number of units outstanding at the beginning of the yearAccumulation Class IDI
Number of units issuedNumber of units redeemedNumber of units outstanding at the end of the year
Number of units outstanding at the beginning of the yearAccumulation Class SP
Number of units issuedNumber of units redeemedNumber of units outstanding at the end of the year
Number of units outstanding at the beginning of the yearAccumulation Class I
Number of units issuedNumber of units redeemedNumber of units outstanding at the end of the year
DANSKE FUND -JAPAN
1,011,174297,008
(373,763)934,419
DANSKE FUND -INDIA
1,537,5602,572,949
(3,561,056)549,453
DANSKE FUND -BALTIC
DANSKE FUND
(continued)
* See note 1 for more detailsThe accompanying notes form an integral part of these financial statements.
31
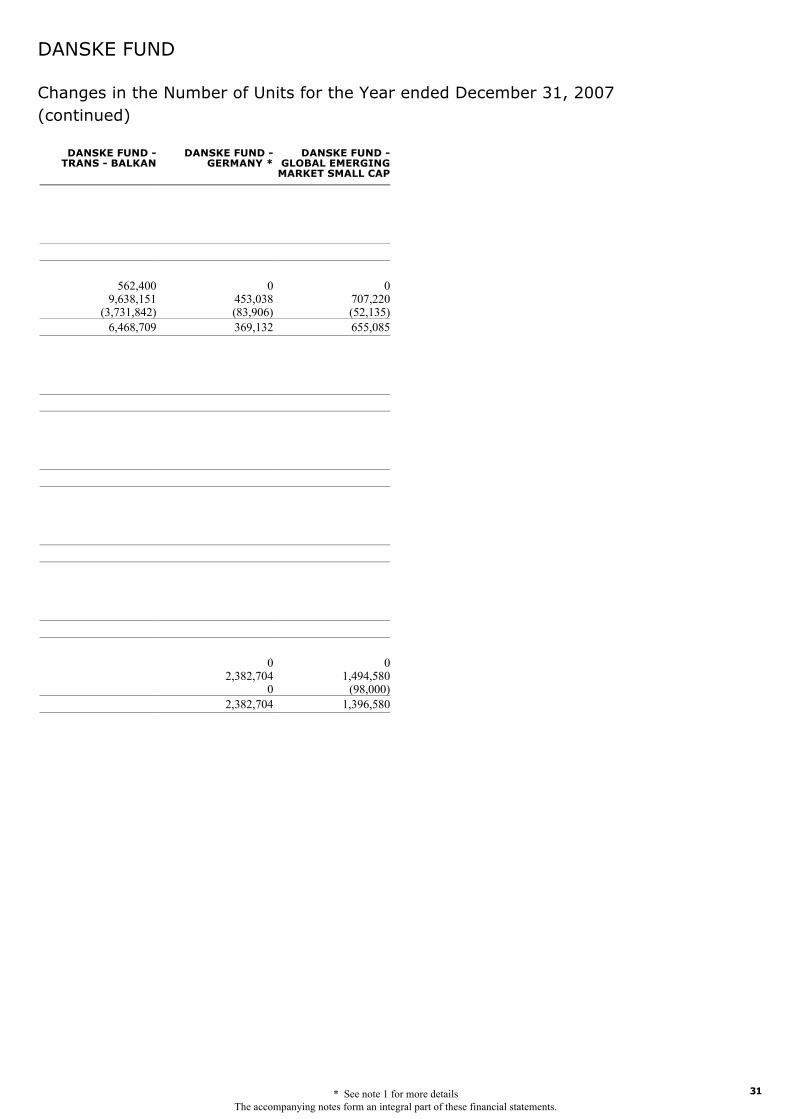
Changes in the Number of Units for the Year ended December 31, 2007
562,4009,638,151
(3,731,842)6,468,709
DANSKE FUND -TRANS - BALKAN
0453,038(83,906)369,132
02,382,704
02,382,704
DANSKE FUND -GERMANY *
0707,220(52,135)655,085
01,494,580
(98,000)1,396,580
DANSKE FUND -GLOBAL EMERGING
MARKET SMALL CAP
DANSKE FUND
(continued)
* See note 1 for more detailsThe accompanying notes form an integral part of these financial statements.
32
DKK
-306.020
-109.960
---
-303.110
-111.900
---
-301.240
-114.210
---
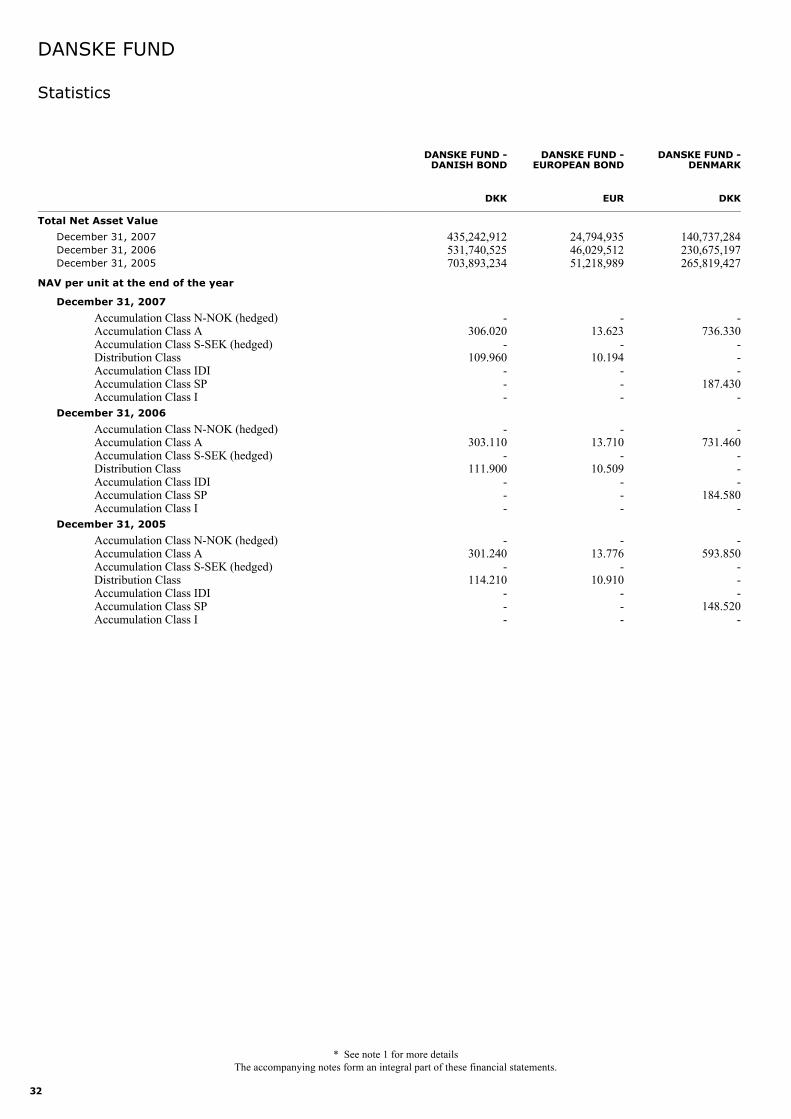
435,242,912531,740,525703,893,234
Total Net Asset Value
Accumulation Class N-NOK (hedged)Accumulation Class AAccumulation Class S-SEK (hedged)Distribution ClassAccumulation Class IDIAccumulation Class SPAccumulation Class I
NAV per unit at the end of the year
December 31, 2007December 31, 2006December 31, 2005
December 31, 2007
December 31, 2006
December 31, 2005
Accumulation Class N-NOK (hedged)Accumulation Class AAccumulation Class S-SEK (hedged)Distribution ClassAccumulation Class IDIAccumulation Class SPAccumulation Class I
Accumulation Class N-NOK (hedged)Accumulation Class AAccumulation Class S-SEK (hedged)Distribution ClassAccumulation Class IDIAccumulation Class SPAccumulation Class I
DANSKE FUND -DANISH BOND
EUR
-13.623
-10.194
---
-13.710
-10.509
---
-13.776
-10.910
---
24,794,93546,029,51251,218,989
DANSKE FUND -EUROPEAN BOND
DKK
-736.330
---
187.430-
-731.460
---
184.580-
-593.850
---
148.520-
140,737,284230,675,197265,819,427
DANSKE FUND -DENMARK
DANSKE FUND
Statistics
* See note 1 for more detailsThe accompanying notes form an integral part of these financial statements.
33
EUR
-60.298
-----
-58.302
-----
-47.069
-----
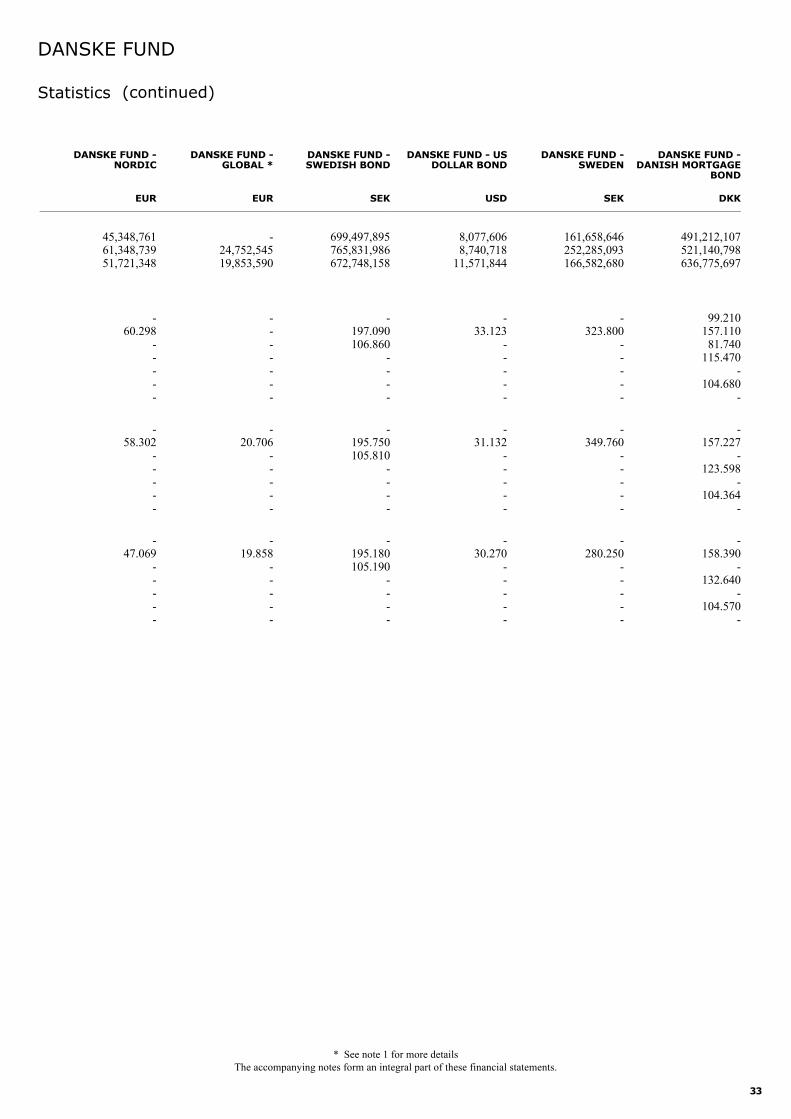
45,348,76161,348,73951,721,348
DANSKE FUND -NORDIC
EUR
-------
-20.706
-----
-19.858
-----
-24,752,54519,853,590
DANSKE FUND -GLOBAL *
SEK
-197.090106.860
----
-195.750105.810
----
-195.180105.190
----
699,497,895765,831,986672,748,158
DANSKE FUND -SWEDISH BOND
USD
-33.123
-----
-31.132
-----
-30.270
-----
8,077,6068,740,718
11,571,844
DANSKE FUND - USDOLLAR BOND
SEK
-323.800
-----
-349.760
-----
-280.250
-----
161,658,646252,285,093166,582,680
DANSKE FUND -SWEDEN
DKK
99.210157.11081.740
115.470-
104.680-
-157.227
-123.598
-104.364
-
-158.390
-132.640
-104.570
-
491,212,107521,140,798636,775,697
DANSKE FUND -DANISH MORTGAGE
BOND
DANSKE FUND
Statistics (continued)
* See note 1 for more detailsThe accompanying notes form an integral part of these financial statements.
34
USD
-58.690
---
47.70726.427
-44.840
---
36.103-
-33.793
---
27.005-
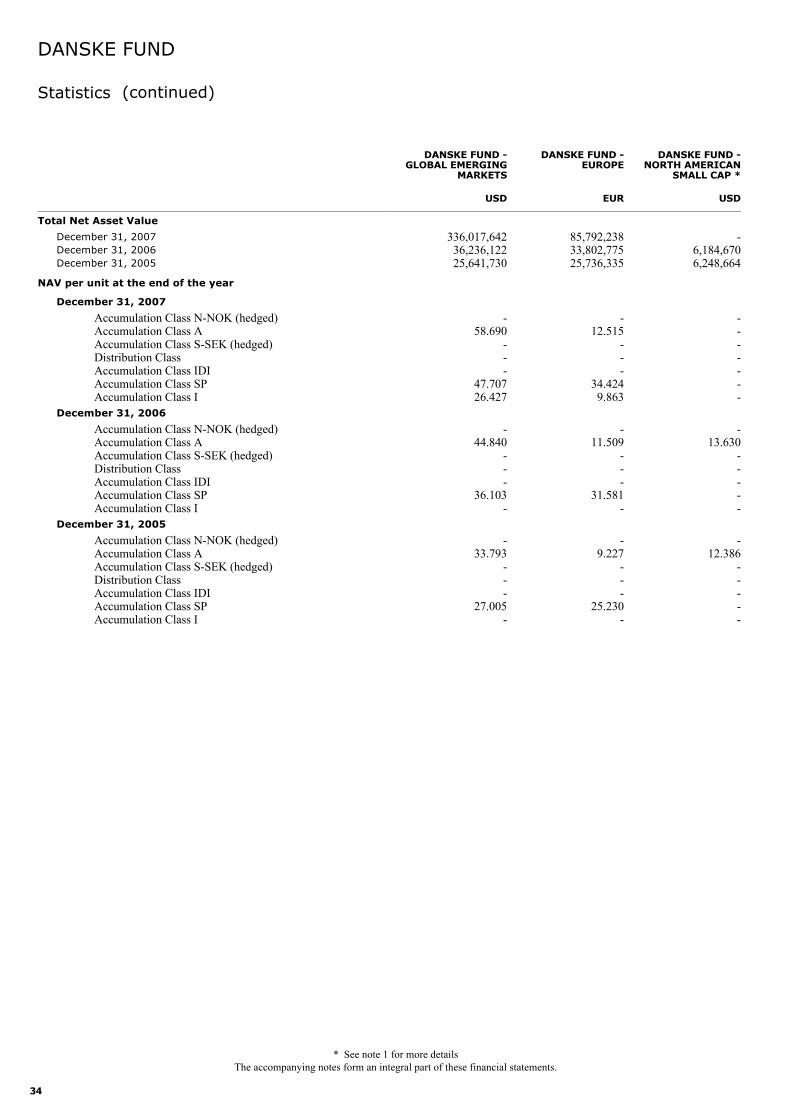
336,017,64236,236,12225,641,730
Total Net Asset Value
Accumulation Class N-NOK (hedged)Accumulation Class AAccumulation Class S-SEK (hedged)Distribution ClassAccumulation Class IDIAccumulation Class SPAccumulation Class I
NAV per unit at the end of the year
December 31, 2007December 31, 2006December 31, 2005
December 31, 2007
December 31, 2006
December 31, 2005
Accumulation Class N-NOK (hedged)Accumulation Class AAccumulation Class S-SEK (hedged)Distribution ClassAccumulation Class IDIAccumulation Class SPAccumulation Class I
Accumulation Class N-NOK (hedged)Accumulation Class AAccumulation Class S-SEK (hedged)Distribution ClassAccumulation Class IDIAccumulation Class SPAccumulation Class I
DANSKE FUND -GLOBAL EMERGING
MARKETS
EUR
-12.515
---
34.4249.863
-11.509
---
31.581-
-9.227
---
25.230-
85,792,23833,802,77525,736,335
DANSKE FUND -EUROPE
USD
-------
-13.630
-----
-12.386
-----
-6,184,6706,248,664
DANSKE FUND -NORTH AMERICAN
SMALL CAP *
DANSKE FUND
Statistics (continued)
* See note 1 for more detailsThe accompanying notes form an integral part of these financial statements.
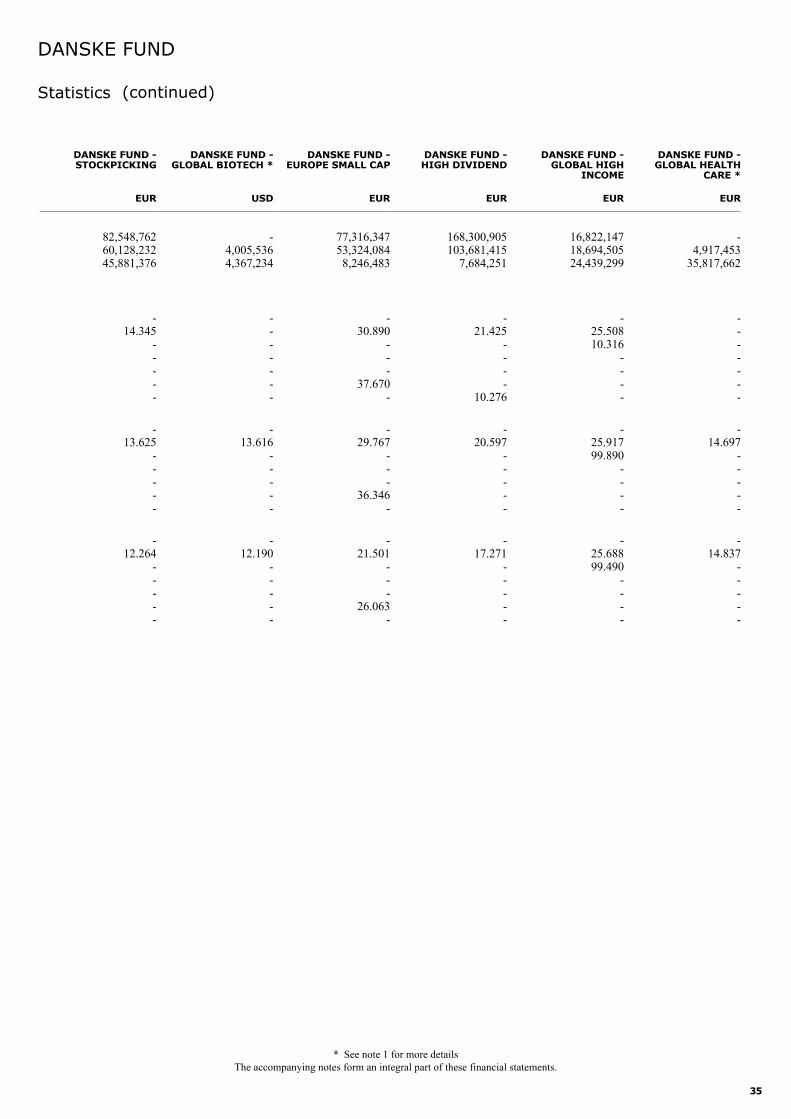
35
EUR
-14.345
-----
-13.625
-----
-12.264
-----
82,548,76260,128,23245,881,376
DANSKE FUND -STOCKPICKING
USD
-------
-13.616
-----
-12.190
-----
-4,005,5364,367,234
DANSKE FUND -GLOBAL BIOTECH *
EUR
-30.890
---
37.670-
-29.767
---
36.346-
-21.501
---
26.063-
77,316,34753,324,0848,246,483
DANSKE FUND -EUROPE SMALL CAP
EUR
-21.425
----
10.276
-20.597
-----
-17.271
-----
168,300,905103,681,415
7,684,251
DANSKE FUND -HIGH DIVIDEND
EUR
-25.50810.316
----
-25.91799.890
----
-25.68899.490
----
16,822,14718,694,50524,439,299
DANSKE FUND -GLOBAL HIGH
INCOME
EUR
-------
-14.697
-----
-14.837
-----
-4,917,453
35,817,662
DANSKE FUND -GLOBAL HEALTH
CARE *
DANSKE FUND
Statistics (continued)
* See note 1 for more detailsThe accompanying notes form an integral part of these financial statements.
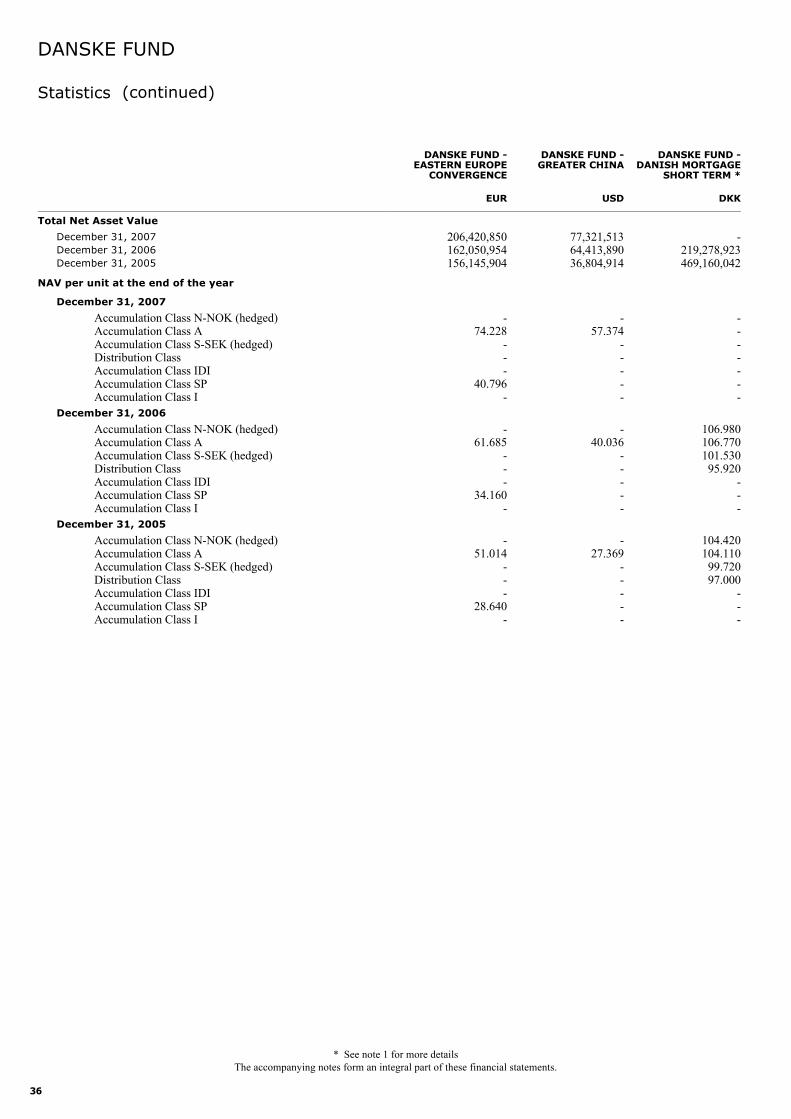
36
EUR
-74.228
---
40.796-
-61.685
---
34.160-
-51.014
---
28.640-
206,420,850162,050,954156,145,904
Total Net Asset Value
Accumulation Class N-NOK (hedged)Accumulation Class AAccumulation Class S-SEK (hedged)Distribution ClassAccumulation Class IDIAccumulation Class SPAccumulation Class I
NAV per unit at the end of the year
December 31, 2007December 31, 2006December 31, 2005
December 31, 2007
December 31, 2006
December 31, 2005
Accumulation Class N-NOK (hedged)Accumulation Class AAccumulation Class S-SEK (hedged)Distribution ClassAccumulation Class IDIAccumulation Class SPAccumulation Class I
Accumulation Class N-NOK (hedged)Accumulation Class AAccumulation Class S-SEK (hedged)Distribution ClassAccumulation Class IDIAccumulation Class SPAccumulation Class I
DANSKE FUND -EASTERN EUROPE
CONVERGENCE
USD
-57.374
-----
-40.036
-----
-27.369
-----
77,321,51364,413,89036,804,914
DANSKE FUND -GREATER CHINA
DKK
-------
106.980106.770101.53095.920
---
104.420104.11099.72097.000
---
-219,278,923469,160,042
DANSKE FUND -DANISH MORTGAGE
SHORT TERM *
DANSKE FUND
Statistics (continued)
* See note 1 for more detailsThe accompanying notes form an integral part of these financial statements.
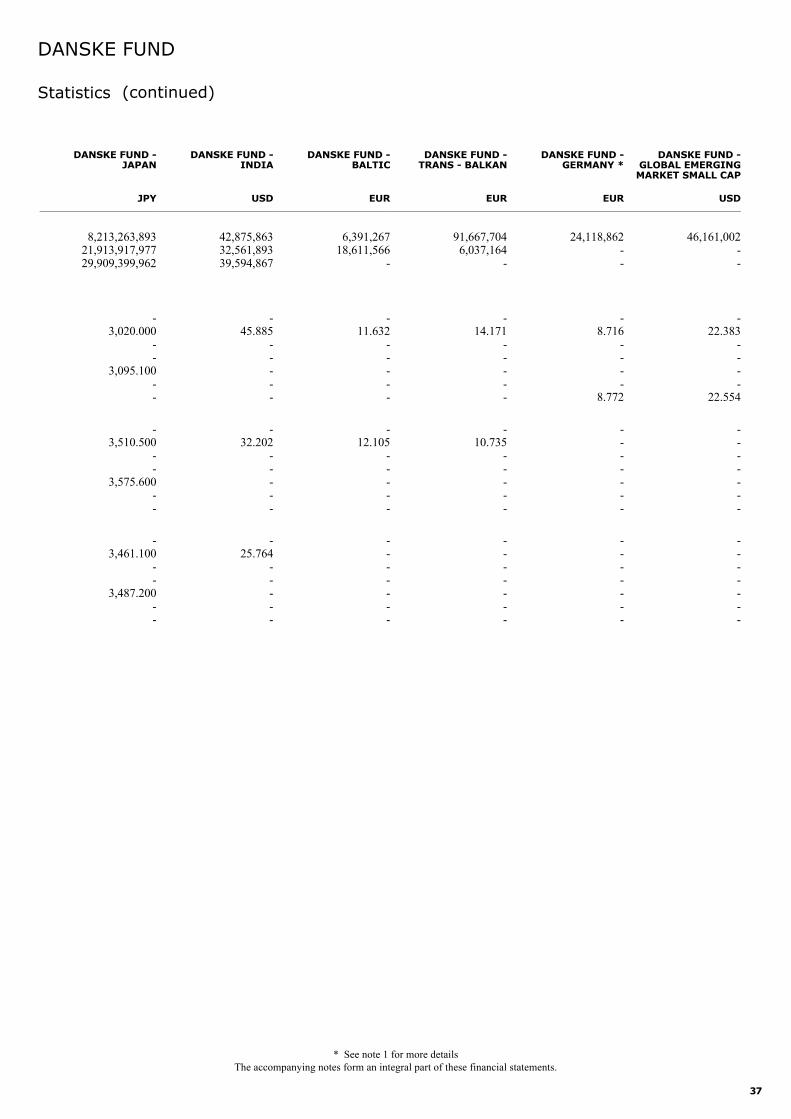
37
JPY
-3,020.000
--
3,095.100--
-3,510.500
--
3,575.600--
-3,461.100
--
3,487.200--
8,213,263,89321,913,917,97729,909,399,962
DANSKE FUND -JAPAN
USD
-45.885
-----
-32.202
-----
-25.764
-----
42,875,86332,561,89339,594,867
DANSKE FUND -INDIA
EUR
-11.632
-----
-12.105
-----
-------
6,391,26718,611,566
-
DANSKE FUND -BALTIC
EUR
-14.171
-----
-10.735
-----
-------
91,667,7046,037,164
-
DANSKE FUND -TRANS - BALKAN
EUR
-8.716
----
8.772
-------
-------
24,118,862--
DANSKE FUND -GERMANY *
USD
-22.383
----
22.554
-------
-------
46,161,002--
DANSKE FUND -GLOBAL EMERGINGMARKET SMALL CAP
DANSKE FUND
Statistics (continued)
* See note 1 for more detailsThe accompanying notes form an integral part of these financial statements.
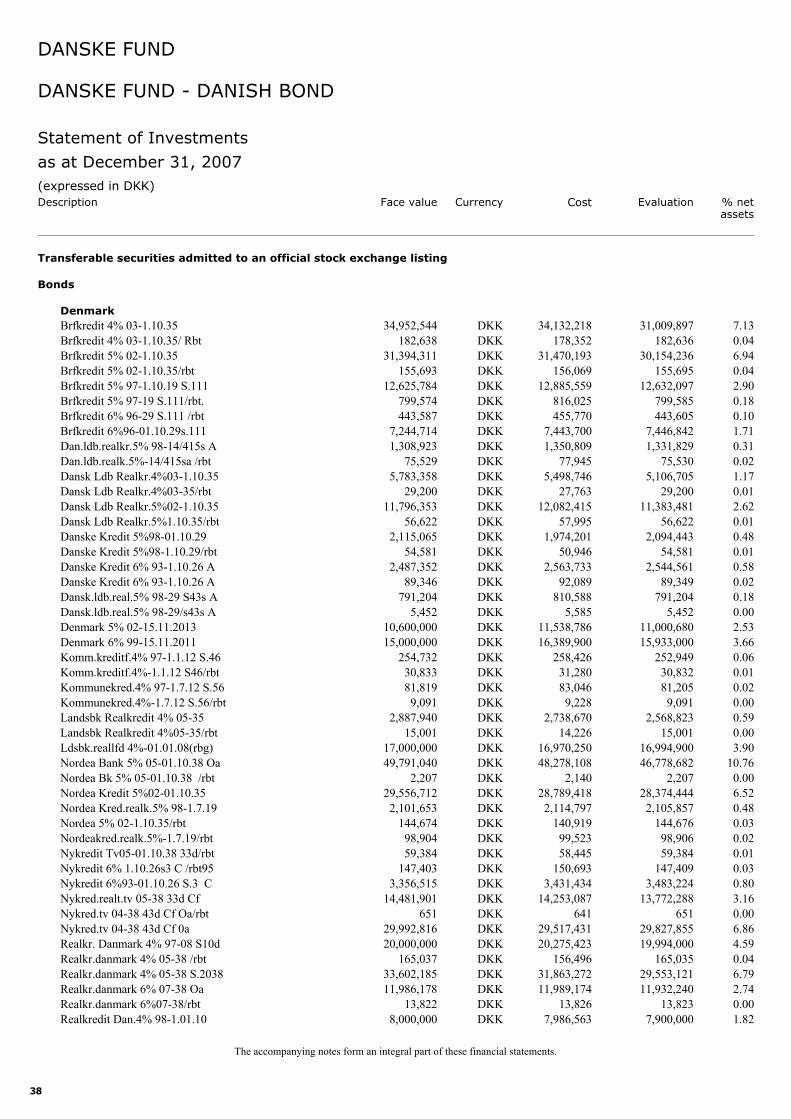
38
Brfkredit 4% 03-1.10.35 34,952,544 31,009,897 7.13DKK 34,132,218
Transferable securities admitted to an official stock exchange listing
Bonds
Denmark
Brfkredit 4% 03-1.10.35/ Rbt 182,638 182,636 0.04DKK 178,352Brfkredit 5% 02-1.10.35 31,394,311 30,154,236 6.94DKK 31,470,193Brfkredit 5% 02-1.10.35/rbt 155,693 155,695 0.04DKK 156,069Brfkredit 5% 97-1.10.19 S.111 12,625,784 12,632,097 2.90DKK 12,885,559Brfkredit 5% 97-19 S.111/rbt. 799,574 799,585 0.18DKK 816,025Brfkredit 6% 96-29 S.111 /rbt 443,587 443,605 0.10DKK 455,770Brfkredit 6%96-01.10.29s.111 7,244,714 7,446,842 1.71DKK 7,443,700Dan.ldb.realkr.5% 98-14/415s A 1,308,923 1,331,829 0.31DKK 1,350,809Dan.ldb.realk.5%-14/415sa /rbt 75,529 75,530 0.02DKK 77,945Dansk Ldb Realkr.4%03-1.10.35 5,783,358 5,106,705 1.17DKK 5,498,746Dansk Ldb Realkr.4%03-35/rbt 29,200 29,200 0.01DKK 27,763Dansk Ldb Realkr.5%02-1.10.35 11,796,353 11,383,481 2.62DKK 12,082,415Dansk Ldb Realkr.5%1.10.35/rbt 56,622 56,622 0.01DKK 57,995Danske Kredit 5%98-01.10.29 2,115,065 2,094,443 0.48DKK 1,974,201Danske Kredit 5%98-1.10.29/rbt 54,581 54,581 0.01DKK 50,946Danske Kredit 6% 93-1.10.26 A 2,487,352 2,544,561 0.58DKK 2,563,733Danske Kredit 6% 93-1.10.26 A 89,346 89,349 0.02DKK 92,089Dansk.ldb.real.5% 98-29 S43s A 791,204 791,204 0.18DKK 810,588Dansk.ldb.real.5% 98-29/s43s A 5,452 5,452 0.00DKK 5,585Denmark 5% 02-15.11.2013 10,600,000 11,000,680 2.53DKK 11,538,786Denmark 6% 99-15.11.2011 15,000,000 15,933,000 3.66DKK 16,389,900Komm.kreditf.4% 97-1.1.12 S.46 254,732 252,949 0.06DKK 258,426Komm.kreditf.4%-1.1.12 S46/rbt 30,833 30,832 0.01DKK 31,280Kommunekred.4% 97-1.7.12 S.56 81,819 81,205 0.02DKK 83,046Kommunekred.4%-1.7.12 S.56/rbt 9,091 9,091 0.00DKK 9,228Landsbk Realkredit 4% 05-35 2,887,940 2,568,823 0.59DKK 2,738,670Landsbk Realkredit 4%05-35/rbt 15,001 15,001 0.00DKK 14,226Ldsbk.reallfd 4%-01.01.08(rbg) 17,000,000 16,994,900 3.90DKK 16,970,250Nordea Bank 5% 05-01.10.38 Oa 49,791,040 46,778,682 10.76DKK 48,278,108Nordea Bk 5% 05-01.10.38 /rbt 2,207 2,207 0.00DKK 2,140Nordea Kredit 5%02-01.10.35 29,556,712 28,374,444 6.52DKK 28,789,418Nordea Kred.realk.5% 98-1.7.19 2,101,653 2,105,857 0.48DKK 2,114,797Nordea 5% 02-1.10.35/rbt 144,674 144,676 0.03DKK 140,919Nordeakred.realk.5%-1.7.19/rbt 98,904 98,906 0.02DKK 99,523Nykredit Tv05-01.10.38 33d/rbt 59,384 59,384 0.01DKK 58,445Nykredit 6% 1.10.26s3 C /rbt95 147,403 147,409 0.03DKK 150,693Nykredit 6%93-01.10.26 S.3 C 3,356,515 3,483,224 0.80DKK 3,431,434Nykred.realt.tv 05-38 33d Cf 14,481,901 13,772,288 3.16DKK 14,253,087Nykred.tv 04-38 43d Cf Oa/rbt 651 651 0.00DKK 641Nykred.tv 04-38 43d Cf 0a 29,992,816 29,827,855 6.86DKK 29,517,431Realkr. Danmark 4% 97-08 S10d 20,000,000 19,994,000 4.59DKK 20,275,423Realkr.danmark 4% 05-38 /rbt 165,037 165,035 0.04DKK 156,496Realkr.danmark 4% 05-38 S.2038 33,602,185 29,553,121 6.79DKK 31,863,272Realkr.danmark 6% 07-38 Oa 11,986,178 11,932,240 2.74DKK 11,989,174Realkr.danmark 6%07-38/rbt 13,822 13,823 0.00DKK 13,826Realkredit Dan.4% 98-1.01.10 8,000,000 7,900,000 1.82DKK 7,986,563
(expressed in DKK)Cost Evaluation % net
assetsCurrencyDescription
DANSKE FUND
as at December 31, 2007
Statement of Investments
The accompanying notes form an integral part of these financial statements.
Face value
DANSKE FUND - DANISH BOND
39
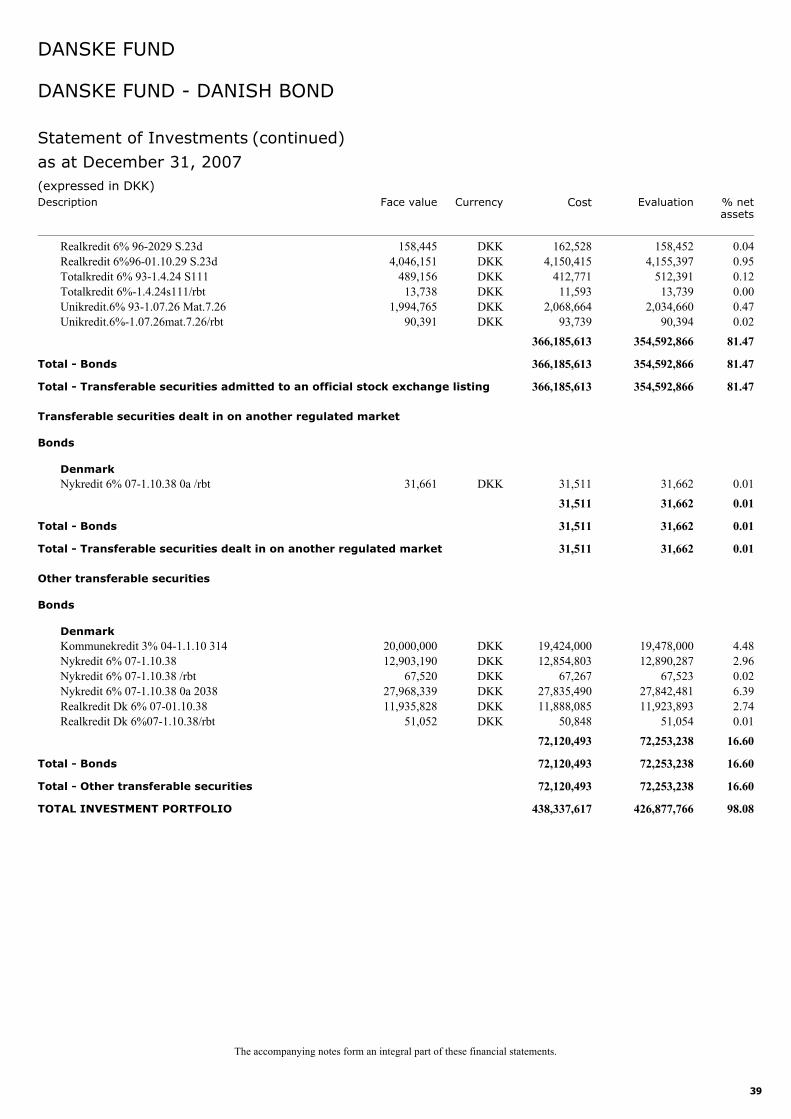
Realkredit 6% 96-2029 S.23d 158,445 158,452 0.04DKK 162,528Realkredit 6%96-01.10.29 S.23d 4,046,151 4,155,397 0.95DKK 4,150,415Totalkredit 6% 93-1.4.24 S111 489,156 512,391 0.12DKK 412,771Totalkredit 6%-1.4.24s111/rbt 13,738 13,739 0.00DKK 11,593Unikredit.6% 93-1.07.26 Mat.7.26 1,994,765 2,034,660 0.47DKK 2,068,664Unikredit.6%-1.07.26mat.7.26/rbt 90,391 90,394 0.02DKK 93,739
354,592,866 81.47366,185,613
Total - Bonds 354,592,866 81.47366,185,613
Total - Transferable securities admitted to an official stock exchange listing 354,592,866 81.47366,185,613
Nykredit 6% 07-1.10.38 0a /rbt 31,661 31,662 0.01DKK 31,511
Transferable securities dealt in on another regulated market
Bonds
Denmark
31,662 0.0131,511
Total - Bonds 31,662 0.0131,511
Total - Transferable securities dealt in on another regulated market 31,662 0.0131,511
Kommunekredit 3% 04-1.1.10 314 20,000,000 19,478,000 4.48DKK 19,424,000
Other transferable securities
Bonds
Denmark
Nykredit 6% 07-1.10.38 12,903,190 12,890,287 2.96DKK 12,854,803Nykredit 6% 07-1.10.38 /rbt 67,520 67,523 0.02DKK 67,267Nykredit 6% 07-1.10.38 0a 2038 27,968,339 27,842,481 6.39DKK 27,835,490Realkredit Dk 6% 07-01.10.38 11,935,828 11,923,893 2.74DKK 11,888,085Realkredit Dk 6%07-1.10.38/rbt 51,052 51,054 0.01DKK 50,848
72,253,238 16.6072,120,493
Total - Bonds 72,253,238 16.6072,120,493
Total - Other transferable securities 72,253,238 16.6072,120,493
TOTAL INVESTMENT PORTFOLIO 426,877,766 98.08438,337,617
(expressed in DKK)Cost Evaluation % net
assetsCurrencyDescription
DANSKE FUND
as at December 31, 2007
Statement of Investments (continued)
The accompanying notes form an integral part of these financial statements.
Face value
DANSKE FUND - DANISH BOND
40
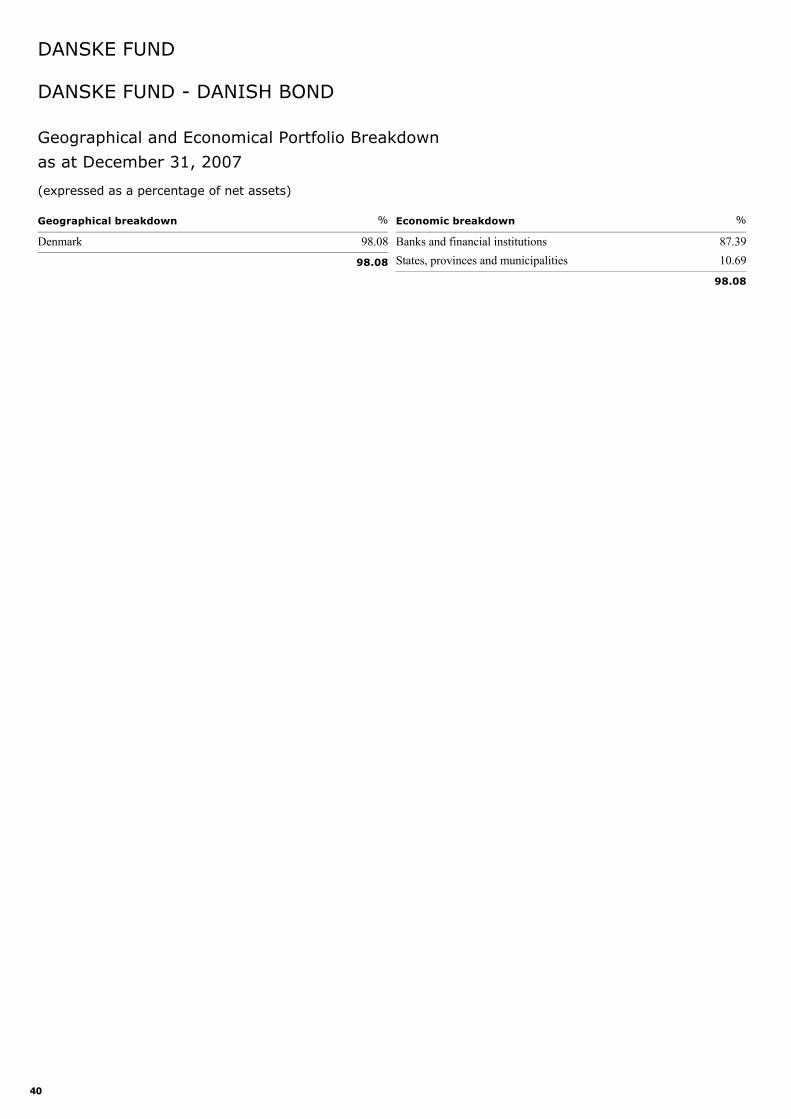
Denmark 98.08
Geographical breakdown %
98.08
Banks and financial institutions 87.39States, provinces and municipalities 10.69
Economic breakdown %
98.08
Geographical and Economical Portfolio Breakdown
DANSKE FUND - DANISH BOND
DANSKE FUND
as at December 31, 2007
(expressed as a percentage of net assets)
41
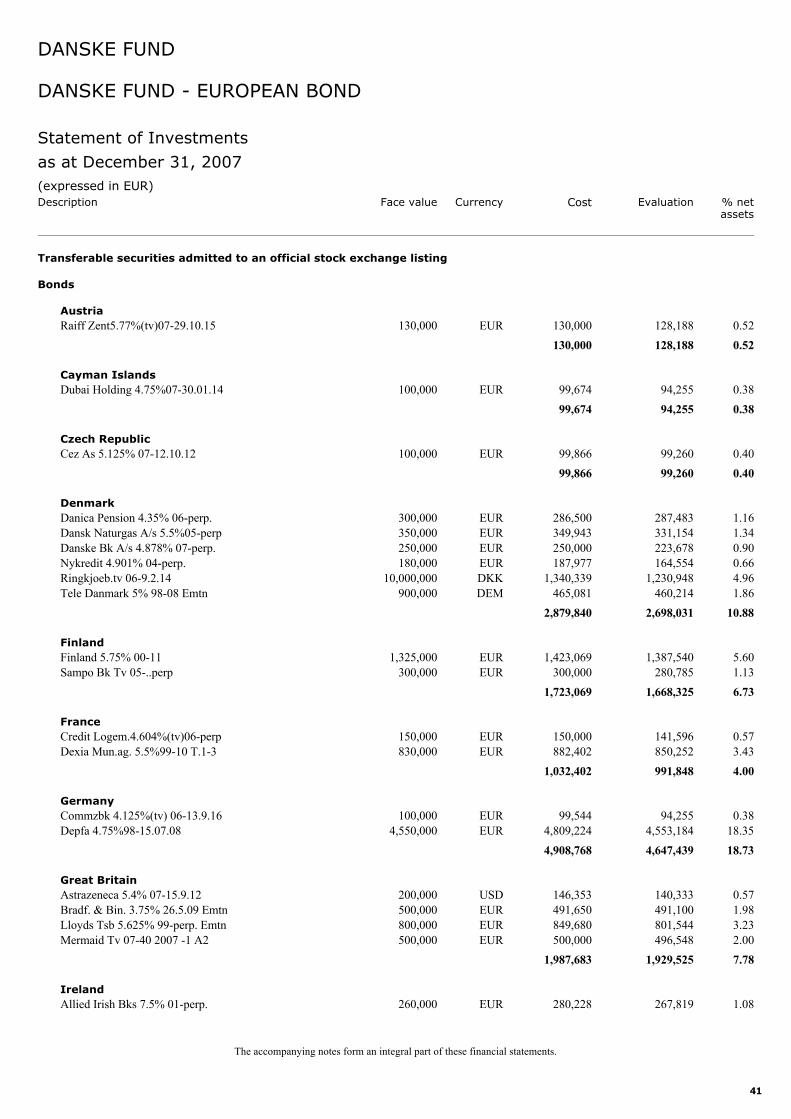
Raiff Zent5.77%(tv)07-29.10.15 130,000 128,188 0.52EUR 130,000
Transferable securities admitted to an official stock exchange listing
Bonds
Austria
128,188 0.52130,000
Dubai Holding 4.75%07-30.01.14 100,000 94,255 0.38EUR 99,674Cayman Islands
94,255 0.3899,674
Cez As 5.125% 07-12.10.12 100,000 99,260 0.40EUR 99,866Czech Republic
99,260 0.4099,866
Danica Pension 4.35% 06-perp. 300,000 287,483 1.16EUR 286,500Denmark
Dansk Naturgas A/s 5.5%05-perp 350,000 331,154 1.34EUR 349,943Danske Bk A/s 4.878% 07-perp. 250,000 223,678 0.90EUR 250,000Nykredit 4.901% 04-perp. 180,000 164,554 0.66EUR 187,977Ringkjoeb.tv 06-9.2.14 10,000,000 1,230,948 4.96DKK 1,340,339Tele Danmark 5% 98-08 Emtn 900,000 460,214 1.86DEM 465,081
2,698,031 10.882,879,840
Finland 5.75% 00-11 1,325,000 1,387,540 5.60EUR 1,423,069Finland
Sampo Bk Tv 05-..perp 300,000 280,785 1.13EUR 300,0001,668,325 6.731,723,069
Credit Logem.4.604%(tv)06-perp 150,000 141,596 0.57EUR 150,000France
Dexia Mun.ag. 5.5%99-10 T.1-3 830,000 850,252 3.43EUR 882,402991,848 4.001,032,402
Commzbk 4.125%(tv) 06-13.9.16 100,000 94,255 0.38EUR 99,544Germany
Depfa 4.75%98-15.07.08 4,550,000 4,553,184 18.35EUR 4,809,2244,647,439 18.734,908,768
Astrazeneca 5.4% 07-15.9.12 200,000 140,333 0.57USD 146,353Great Britain
Bradf. & Bin. 3.75% 26.5.09 Emtn 500,000 491,100 1.98EUR 491,650Lloyds Tsb 5.625% 99-perp. Emtn 800,000 801,544 3.23EUR 849,680Mermaid Tv 07-40 2007 -1 A2 500,000 496,548 2.00EUR 500,000
1,929,525 7.781,987,683
Allied Irish Bks 7.5% 01-perp. 260,000 267,819 1.08EUR 280,228Ireland
(expressed in EUR)Cost Evaluation % net
assetsCurrencyDescription
DANSKE FUND
as at December 31, 2007
Statement of Investments
The accompanying notes form an integral part of these financial statements.
Face value
DANSKE FUND - EUROPEAN BOND
42
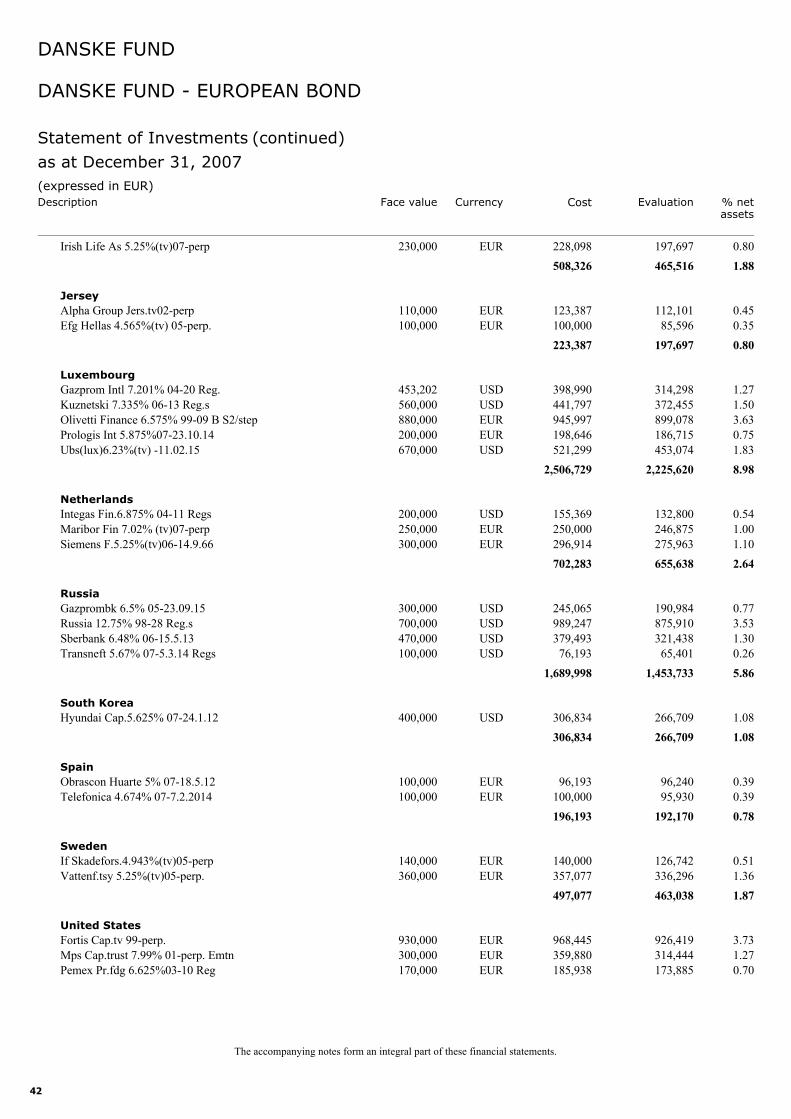
Irish Life As 5.25%(tv)07-perp 230,000 197,697 0.80EUR 228,098465,516 1.88508,326
Alpha Group Jers.tv02-perp 110,000 112,101 0.45EUR 123,387Jersey
Efg Hellas 4.565%(tv) 05-perp. 100,000 85,596 0.35EUR 100,000197,697 0.80223,387
Gazprom Intl 7.201% 04-20 Reg. 453,202 314,298 1.27USD 398,990Luxembourg
Kuznetski 7.335% 06-13 Reg.s 560,000 372,455 1.50USD 441,797Olivetti Finance 6.575% 99-09 B S2/step 880,000 899,078 3.63EUR 945,997Prologis Int 5.875%07-23.10.14 200,000 186,715 0.75EUR 198,646Ubs(lux)6.23%(tv) -11.02.15 670,000 453,074 1.83USD 521,299
2,225,620 8.982,506,729
Integas Fin.6.875% 04-11 Regs 200,000 132,800 0.54USD 155,369Netherlands
Maribor Fin 7.02% (tv)07-perp 250,000 246,875 1.00EUR 250,000Siemens F.5.25%(tv)06-14.9.66 300,000 275,963 1.10EUR 296,914
655,638 2.64702,283
Gazprombk 6.5% 05-23.09.15 300,000 190,984 0.77USD 245,065Russia
Russia 12.75% 98-28 Reg.s 700,000 875,910 3.53USD 989,247Sberbank 6.48% 06-15.5.13 470,000 321,438 1.30USD 379,493Transneft 5.67% 07-5.3.14 Regs 100,000 65,401 0.26USD 76,193
1,453,733 5.861,689,998
Hyundai Cap.5.625% 07-24.1.12 400,000 266,709 1.08USD 306,834South Korea
266,709 1.08306,834
Obrascon Huarte 5% 07-18.5.12 100,000 96,240 0.39EUR 96,193Spain
Telefonica 4.674% 07-7.2.2014 100,000 95,930 0.39EUR 100,000192,170 0.78196,193
If Skadefors.4.943%(tv)05-perp 140,000 126,742 0.51EUR 140,000Sweden
Vattenf.tsy 5.25%(tv)05-perp. 360,000 336,296 1.36EUR 357,077463,038 1.87497,077
Fortis Cap.tv 99-perp. 930,000 926,419 3.73EUR 968,445United States
Mps Cap.trust 7.99% 01-perp. Emtn 300,000 314,444 1.27EUR 359,880Pemex Pr.fdg 6.625%03-10 Reg 170,000 173,885 0.70EUR 185,938
(expressed in EUR)Cost Evaluation % net
assetsCurrencyDescription
DANSKE FUND
as at December 31, 2007
Statement of Investments (continued)
The accompanying notes form an integral part of these financial statements.
Face value
DANSKE FUND - EUROPEAN BOND
43
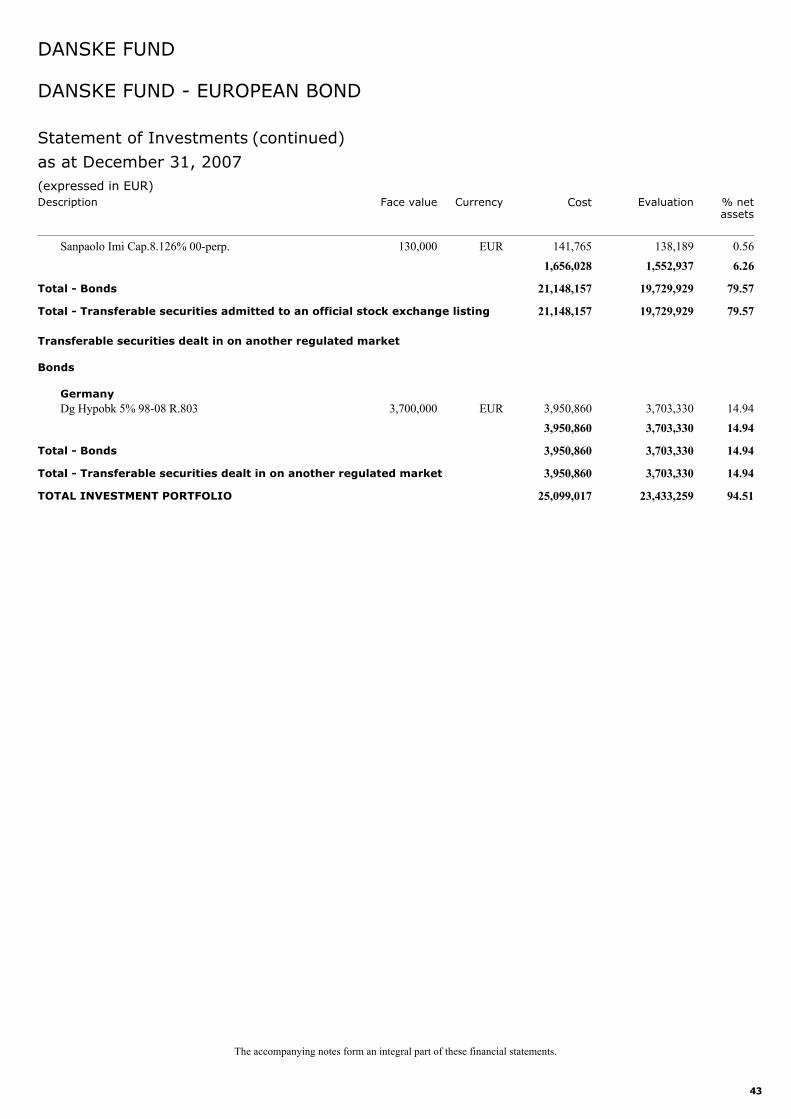
Sanpaolo Imi Cap.8.126% 00-perp. 130,000 138,189 0.56EUR 141,7651,552,937 6.261,656,028
Total - Bonds 19,729,929 79.5721,148,157
Total - Transferable securities admitted to an official stock exchange listing 19,729,929 79.5721,148,157
Dg Hypobk 5% 98-08 R.803 3,700,000 3,703,330 14.94EUR 3,950,860
Transferable securities dealt in on another regulated market
Bonds
Germany
3,703,330 14.943,950,860
Total - Bonds 3,703,330 14.943,950,860
Total - Transferable securities dealt in on another regulated market 3,703,330 14.943,950,860
TOTAL INVESTMENT PORTFOLIO 23,433,259 94.5125,099,017
(expressed in EUR)Cost Evaluation % net
assetsCurrencyDescription
DANSKE FUND
as at December 31, 2007
Statement of Investments (continued)
The accompanying notes form an integral part of these financial statements.
Face value
DANSKE FUND - EUROPEAN BOND
44
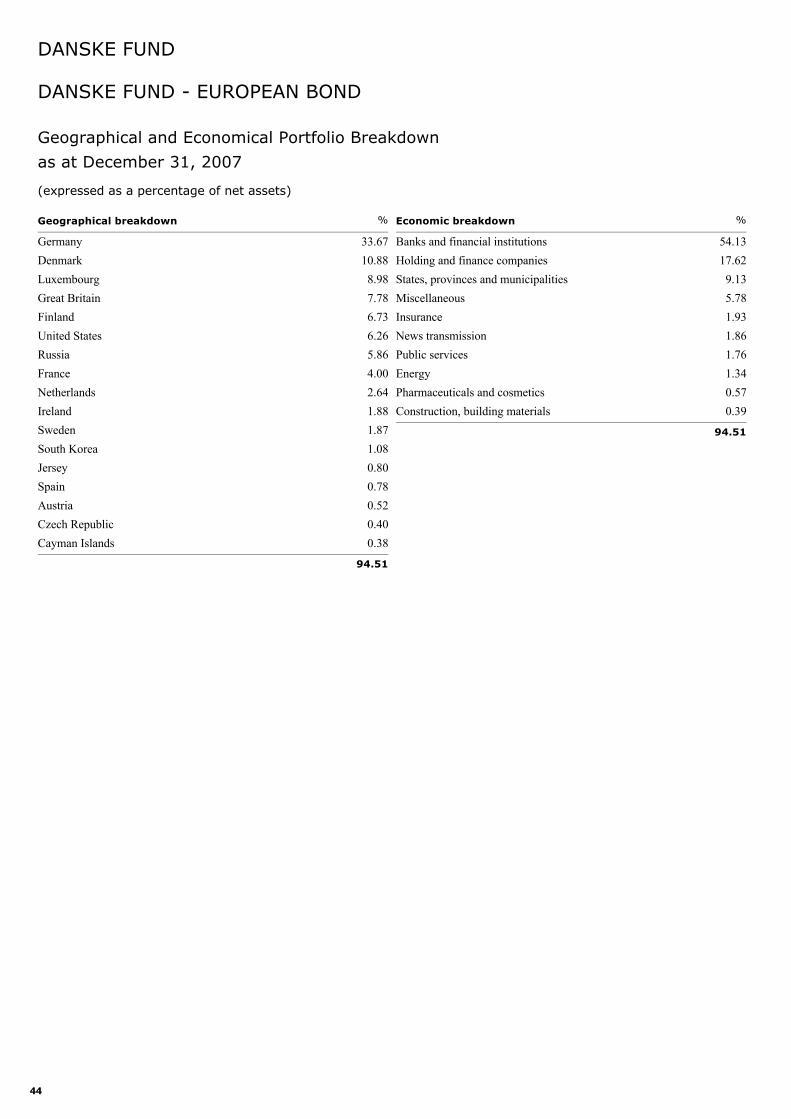
Germany 33.67Denmark 10.88Luxembourg 8.98Great Britain 7.78Finland 6.73United States 6.26Russia 5.86France 4.00Netherlands 2.64Ireland 1.88Sweden 1.87South Korea 1.08Jersey 0.80Spain 0.78Austria 0.52Czech Republic 0.40Cayman Islands 0.38
Geographical breakdown %
94.51
Banks and financial institutions 54.13Holding and finance companies 17.62States, provinces and municipalities 9.13Miscellaneous 5.78Insurance 1.93News transmission 1.86Public services 1.76Energy 1.34Pharmaceuticals and cosmetics 0.57Construction, building materials 0.39
Economic breakdown %
94.51
Geographical and Economical Portfolio Breakdown
DANSKE FUND - EUROPEAN BOND
DANSKE FUND
as at December 31, 2007
(expressed as a percentage of net assets)
45
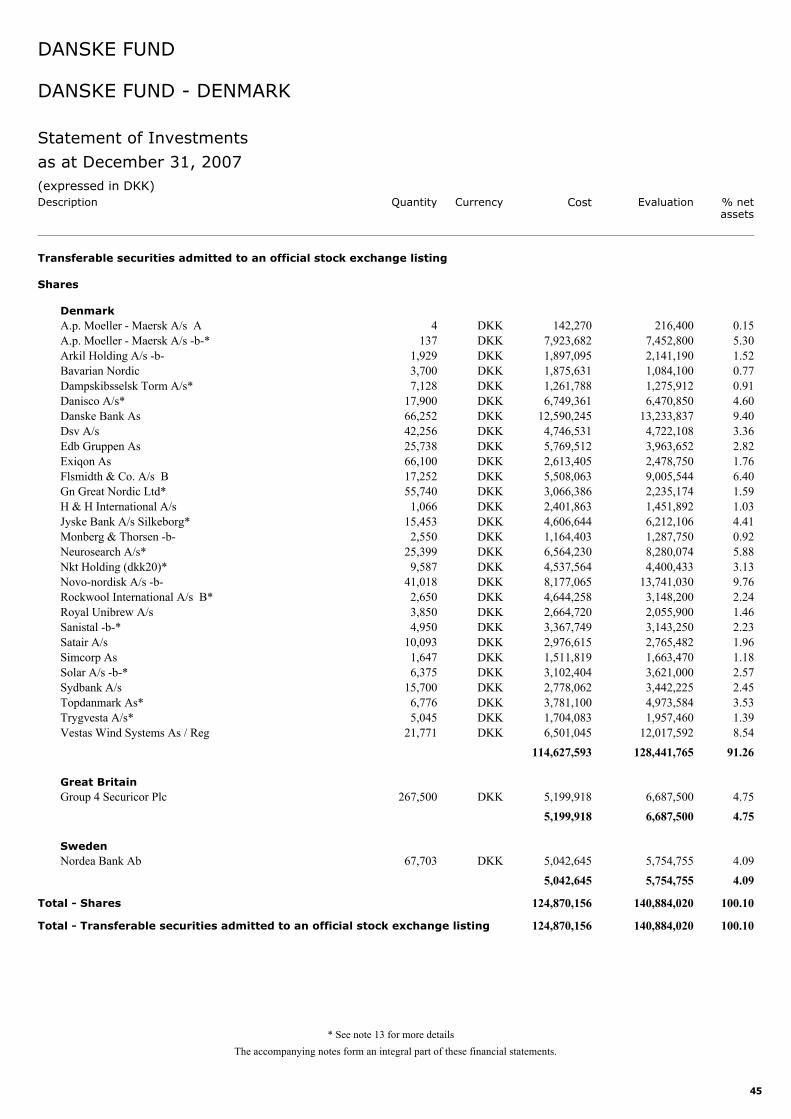
A.p. Moeller - Maersk A/s A 4 216,400 0.15DKK 142,270
Transferable securities admitted to an official stock exchange listing
Shares
Denmark
A.p. Moeller - Maersk A/s -b-* 137 7,452,800 5.30DKK 7,923,682Arkil Holding A/s -b- 1,929 2,141,190 1.52DKK 1,897,095Bavarian Nordic 3,700 1,084,100 0.77DKK 1,875,631Dampskibsselsk Torm A/s* 7,128 1,275,912 0.91DKK 1,261,788Danisco A/s* 17,900 6,470,850 4.60DKK 6,749,361Danske Bank As 66,252 13,233,837 9.40DKK 12,590,245Dsv A/s 42,256 4,722,108 3.36DKK 4,746,531Edb Gruppen As 25,738 3,963,652 2.82DKK 5,769,512Exiqon As 66,100 2,478,750 1.76DKK 2,613,405Flsmidth & Co. A/s B 17,252 9,005,544 6.40DKK 5,508,063Gn Great Nordic Ltd* 55,740 2,235,174 1.59DKK 3,066,386H & H International A/s 1,066 1,451,892 1.03DKK 2,401,863Jyske Bank A/s Silkeborg* 15,453 6,212,106 4.41DKK 4,606,644Monberg & Thorsen -b- 2,550 1,287,750 0.92DKK 1,164,403Neurosearch A/s* 25,399 8,280,074 5.88DKK 6,564,230Nkt Holding (dkk20)* 9,587 4,400,433 3.13DKK 4,537,564Novo-nordisk A/s -b- 41,018 13,741,030 9.76DKK 8,177,065Rockwool International A/s B* 2,650 3,148,200 2.24DKK 4,644,258Royal Unibrew A/s 3,850 2,055,900 1.46DKK 2,664,720Sanistal -b-* 4,950 3,143,250 2.23DKK 3,367,749Satair A/s 10,093 2,765,482 1.96DKK 2,976,615Simcorp As 1,647 1,663,470 1.18DKK 1,511,819Solar A/s -b-* 6,375 3,621,000 2.57DKK 3,102,404Sydbank A/s 15,700 3,442,225 2.45DKK 2,778,062Topdanmark As* 6,776 4,973,584 3.53DKK 3,781,100Trygvesta A/s* 5,045 1,957,460 1.39DKK 1,704,083Vestas Wind Systems As / Reg 21,771 12,017,592 8.54DKK 6,501,045
128,441,765 91.26114,627,593
Group 4 Securicor Plc 267,500 6,687,500 4.75DKK 5,199,918Great Britain
6,687,500 4.755,199,918
Nordea Bank Ab 67,703 5,754,755 4.09DKK 5,042,645Sweden
5,754,755 4.095,042,645
Total - Shares 140,884,020 100.10124,870,156
Total - Transferable securities admitted to an official stock exchange listing 140,884,020 100.10124,870,156
(expressed in DKK)Cost Evaluation % net
assetsCurrencyDescription
DANSKE FUND
as at December 31, 2007
Statement of Investments
The accompanying notes form an integral part of these financial statements.
Quantity
DANSKE FUND - DENMARK
* See note 13 for more details
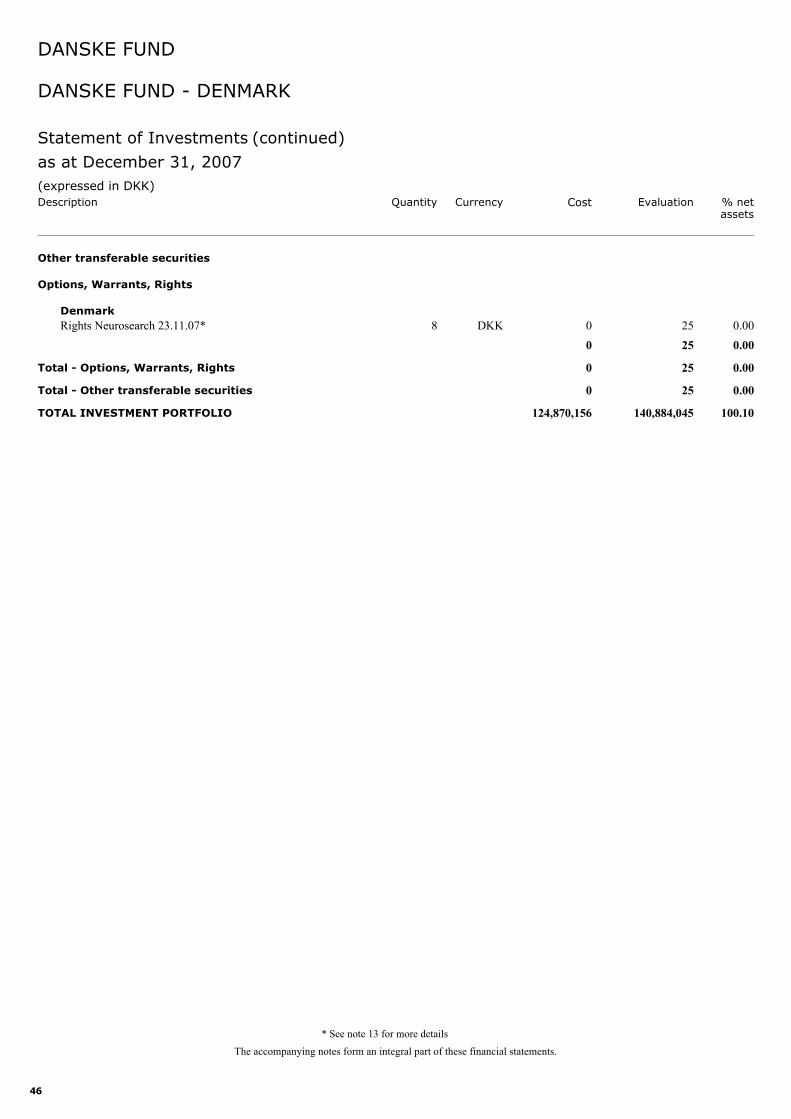
46
Rights Neurosearch 23.11.07* 8 25 0.00DKK 0
Other transferable securities
Options, Warrants, Rights
Denmark
25 0.000
Total - Options, Warrants, Rights 25 0.000
Total - Other transferable securities 25 0.000
TOTAL INVESTMENT PORTFOLIO 140,884,045 100.10124,870,156
(expressed in DKK)Cost Evaluation % net
assetsCurrencyDescription
DANSKE FUND
as at December 31, 2007
Statement of Investments (continued)
The accompanying notes form an integral part of these financial statements.
Quantity
DANSKE FUND - DENMARK
* See note 13 for more details
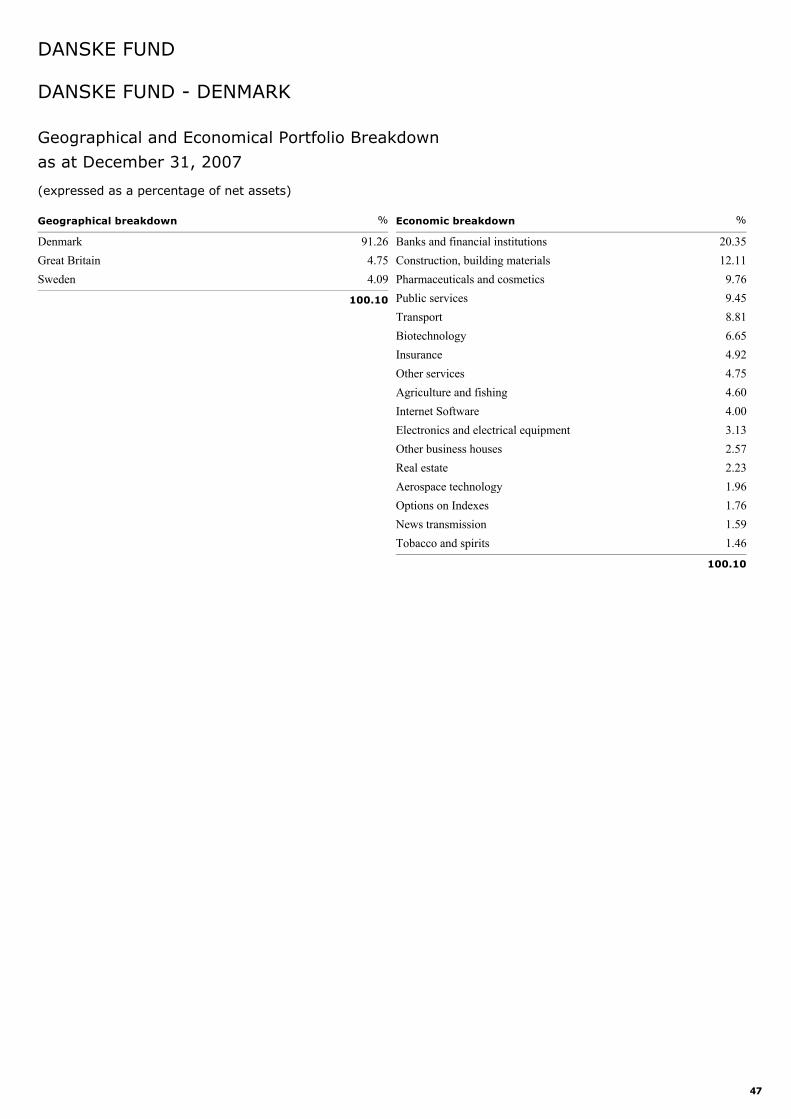
47
Denmark 91.26Great Britain 4.75Sweden 4.09
Geographical breakdown %
100.10
Banks and financial institutions 20.35Construction, building materials 12.11Pharmaceuticals and cosmetics 9.76Public services 9.45Transport 8.81Biotechnology 6.65Insurance 4.92Other services 4.75Agriculture and fishing 4.60Internet Software 4.00Electronics and electrical equipment 3.13Other business houses 2.57Real estate 2.23Aerospace technology 1.96Options on Indexes 1.76News transmission 1.59Tobacco and spirits 1.46
Economic breakdown %
100.10
Geographical and Economical Portfolio Breakdown
DANSKE FUND - DENMARK
DANSKE FUND
as at December 31, 2007
(expressed as a percentage of net assets)
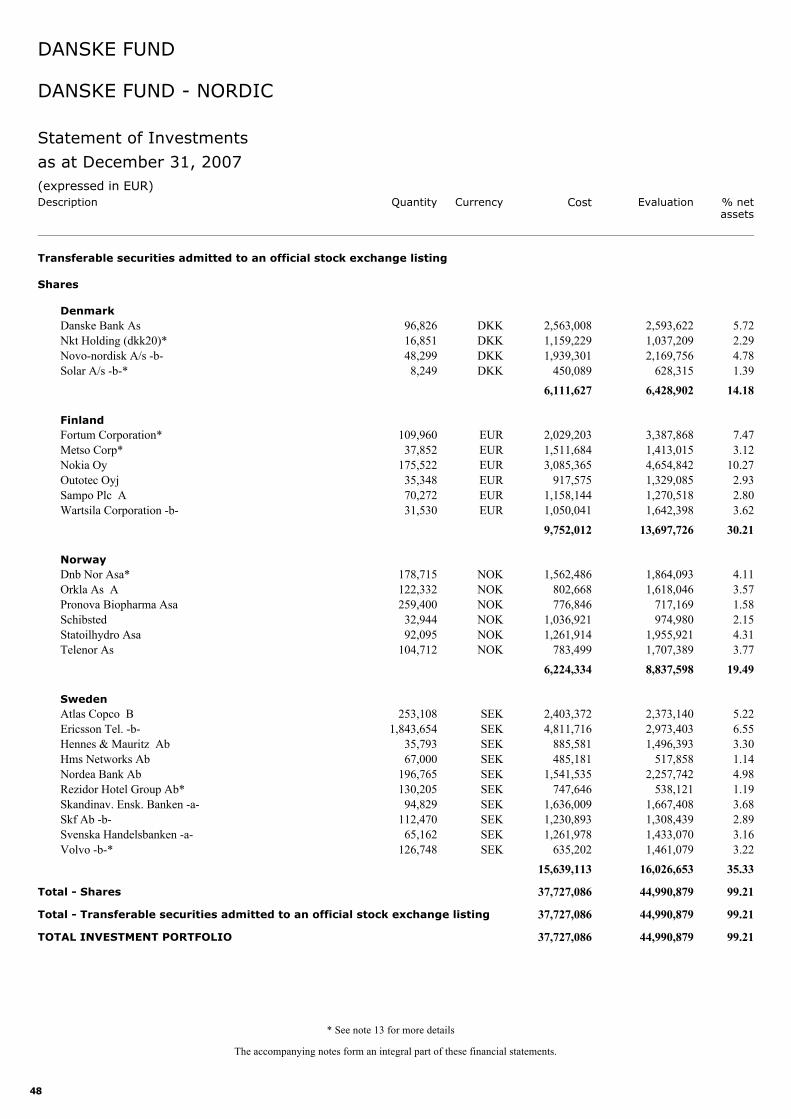
48
Danske Bank As 96,826 2,593,622 5.72DKK 2,563,008
Transferable securities admitted to an official stock exchange listing
Shares
Denmark
Nkt Holding (dkk20)* 16,851 1,037,209 2.29DKK 1,159,229Novo-nordisk A/s -b- 48,299 2,169,756 4.78DKK 1,939,301Solar A/s -b-* 8,249 628,315 1.39DKK 450,089
6,428,902 14.186,111,627
Fortum Corporation* 109,960 3,387,868 7.47EUR 2,029,203Finland
Metso Corp* 37,852 1,413,015 3.12EUR 1,511,684Nokia Oy 175,522 4,654,842 10.27EUR 3,085,365Outotec Oyj 35,348 1,329,085 2.93EUR 917,575Sampo Plc A 70,272 1,270,518 2.80EUR 1,158,144Wartsila Corporation -b- 31,530 1,642,398 3.62EUR 1,050,041
13,697,726 30.219,752,012
Dnb Nor Asa* 178,715 1,864,093 4.11NOK 1,562,486Norway
Orkla As A 122,332 1,618,046 3.57NOK 802,668Pronova Biopharma Asa 259,400 717,169 1.58NOK 776,846Schibsted 32,944 974,980 2.15NOK 1,036,921Statoilhydro Asa 92,095 1,955,921 4.31NOK 1,261,914Telenor As 104,712 1,707,389 3.77NOK 783,499
8,837,598 19.496,224,334
Atlas Copco B 253,108 2,373,140 5.22SEK 2,403,372Sweden
Ericsson Tel. -b- 1,843,654 2,973,403 6.55SEK 4,811,716Hennes & Mauritz Ab 35,793 1,496,393 3.30SEK 885,581Hms Networks Ab 67,000 517,858 1.14SEK 485,181Nordea Bank Ab 196,765 2,257,742 4.98SEK 1,541,535Rezidor Hotel Group Ab* 130,205 538,121 1.19SEK 747,646Skandinav. Ensk. Banken -a- 94,829 1,667,408 3.68SEK 1,636,009Skf Ab -b- 112,470 1,308,439 2.89SEK 1,230,893Svenska Handelsbanken -a- 65,162 1,433,070 3.16SEK 1,261,978Volvo -b-* 126,748 1,461,079 3.22SEK 635,202
16,026,653 35.3315,639,113
Total - Shares 44,990,879 99.2137,727,086
Total - Transferable securities admitted to an official stock exchange listing 44,990,879 99.2137,727,086
TOTAL INVESTMENT PORTFOLIO 44,990,879 99.2137,727,086
(expressed in EUR)Cost Evaluation % net
assetsCurrencyDescription
DANSKE FUND
as at December 31, 2007
Statement of Investments
The accompanying notes form an integral part of these financial statements.
Quantity
DANSKE FUND - NORDIC
* See note 13 for more details
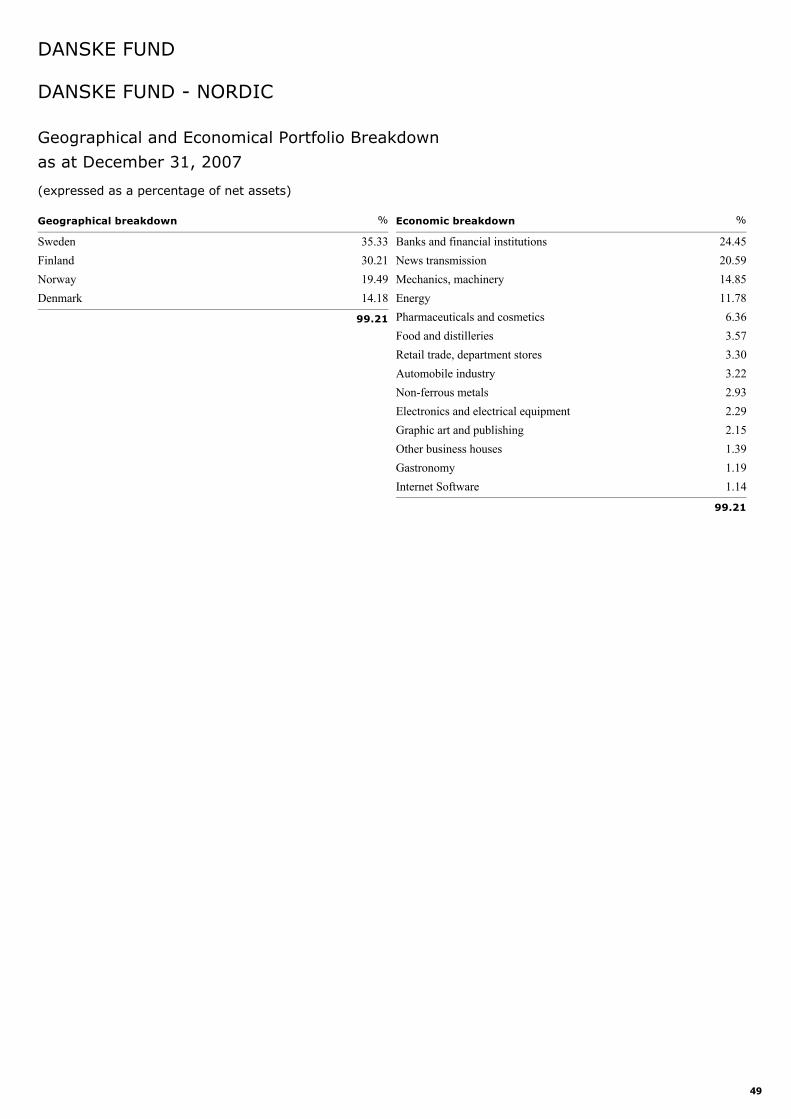
49
Sweden 35.33Finland 30.21Norway 19.49Denmark 14.18
Geographical breakdown %
99.21
Banks and financial institutions 24.45News transmission 20.59Mechanics, machinery 14.85Energy 11.78Pharmaceuticals and cosmetics 6.36Food and distilleries 3.57Retail trade, department stores 3.30Automobile industry 3.22Non-ferrous metals 2.93Electronics and electrical equipment 2.29Graphic art and publishing 2.15Other business houses 1.39Gastronomy 1.19Internet Software 1.14
Economic breakdown %
99.21
Geographical and Economical Portfolio Breakdown
DANSKE FUND - NORDIC
DANSKE FUND
as at December 31, 2007
(expressed as a percentage of net assets)
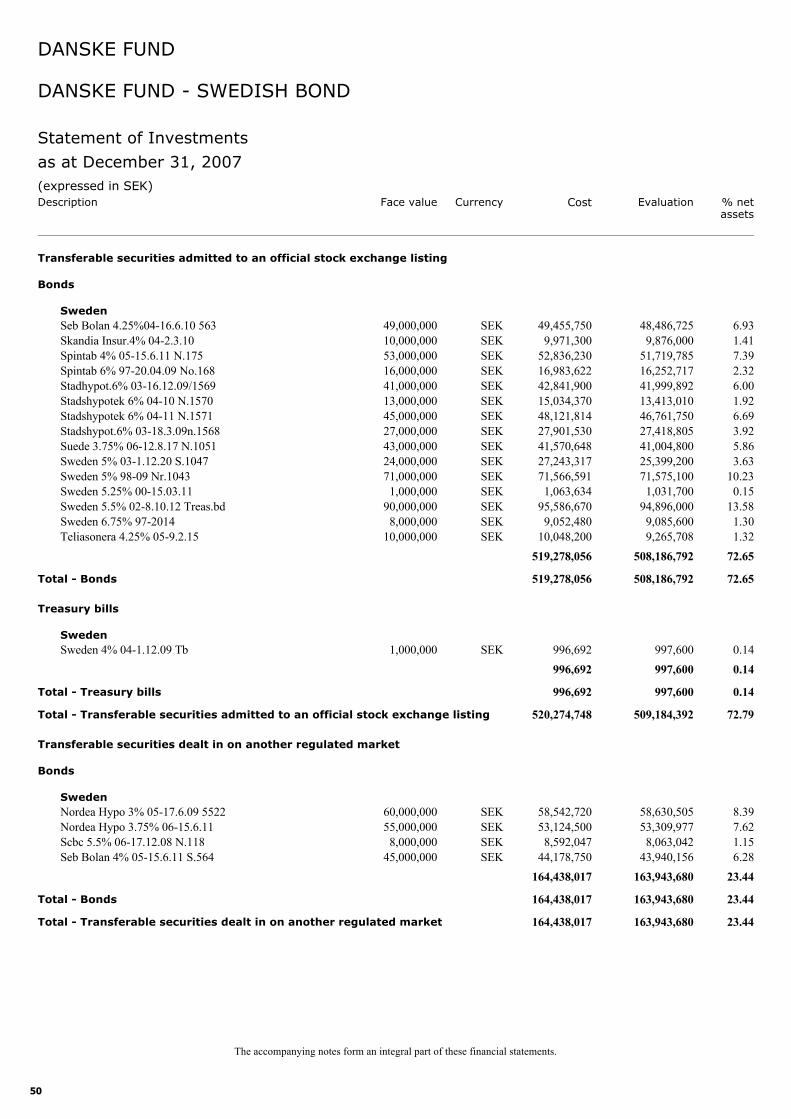
50
Seb Bolan 4.25%04-16.6.10 563 49,000,000 48,486,725 6.93SEK 49,455,750
Transferable securities admitted to an official stock exchange listing
Bonds
Sweden
Skandia Insur.4% 04-2.3.10 10,000,000 9,876,000 1.41SEK 9,971,300Spintab 4% 05-15.6.11 N.175 53,000,000 51,719,785 7.39SEK 52,836,230Spintab 6% 97-20.04.09 No.168 16,000,000 16,252,717 2.32SEK 16,983,622Stadhypot.6% 03-16.12.09/1569 41,000,000 41,999,892 6.00SEK 42,841,900Stadshypotek 6% 04-10 N.1570 13,000,000 13,413,010 1.92SEK 15,034,370Stadshypotek 6% 04-11 N.1571 45,000,000 46,761,750 6.69SEK 48,121,814Stadshypot.6% 03-18.3.09n.1568 27,000,000 27,418,805 3.92SEK 27,901,530Suede 3.75% 06-12.8.17 N.1051 43,000,000 41,004,800 5.86SEK 41,570,648Sweden 5% 03-1.12.20 S.1047 24,000,000 25,399,200 3.63SEK 27,243,317Sweden 5% 98-09 Nr.1043 71,000,000 71,575,100 10.23SEK 71,566,591Sweden 5.25% 00-15.03.11 1,000,000 1,031,700 0.15SEK 1,063,634Sweden 5.5% 02-8.10.12 Treas.bd 90,000,000 94,896,000 13.58SEK 95,586,670Sweden 6.75% 97-2014 8,000,000 9,085,600 1.30SEK 9,052,480Teliasonera 4.25% 05-9.2.15 10,000,000 9,265,708 1.32SEK 10,048,200
508,186,792 72.65519,278,056
Total - Bonds 508,186,792 72.65519,278,056
Sweden 4% 04-1.12.09 Tb 1,000,000 997,600 0.14SEK 996,692
Treasury bills
Sweden
997,600 0.14996,692
Total - Treasury bills 997,600 0.14996,692
Total - Transferable securities admitted to an official stock exchange listing 509,184,392 72.79520,274,748
Nordea Hypo 3% 05-17.6.09 5522 60,000,000 58,630,505 8.39SEK 58,542,720
Transferable securities dealt in on another regulated market
Bonds
Sweden
Nordea Hypo 3.75% 06-15.6.11 55,000,000 53,309,977 7.62SEK 53,124,500Scbc 5.5% 06-17.12.08 N.118 8,000,000 8,063,042 1.15SEK 8,592,047Seb Bolan 4% 05-15.6.11 S.564 45,000,000 43,940,156 6.28SEK 44,178,750
163,943,680 23.44164,438,017
Total - Bonds 163,943,680 23.44164,438,017
Total - Transferable securities dealt in on another regulated market 163,943,680 23.44164,438,017
(expressed in SEK)Cost Evaluation % net
assetsCurrencyDescription
DANSKE FUND
as at December 31, 2007
Statement of Investments
The accompanying notes form an integral part of these financial statements.
Face value
DANSKE FUND - SWEDISH BOND
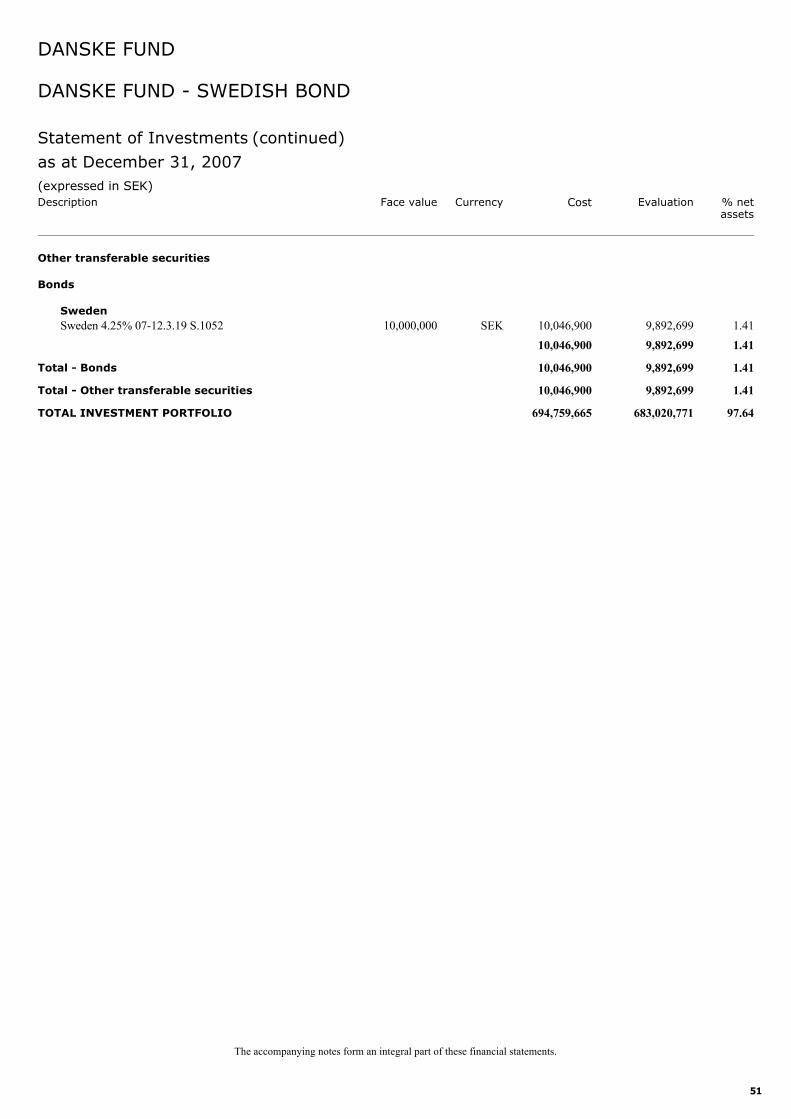
51
Sweden 4.25% 07-12.3.19 S.1052 10,000,000 9,892,699 1.41SEK 10,046,900
Other transferable securities
Bonds
Sweden
9,892,699 1.4110,046,900
Total - Bonds 9,892,699 1.4110,046,900
Total - Other transferable securities 9,892,699 1.4110,046,900
TOTAL INVESTMENT PORTFOLIO 683,020,771 97.64694,759,665
(expressed in SEK)Cost Evaluation % net
assetsCurrencyDescription
DANSKE FUND
as at December 31, 2007
Statement of Investments (continued)
The accompanying notes form an integral part of these financial statements.
Face value
DANSKE FUND - SWEDISH BOND
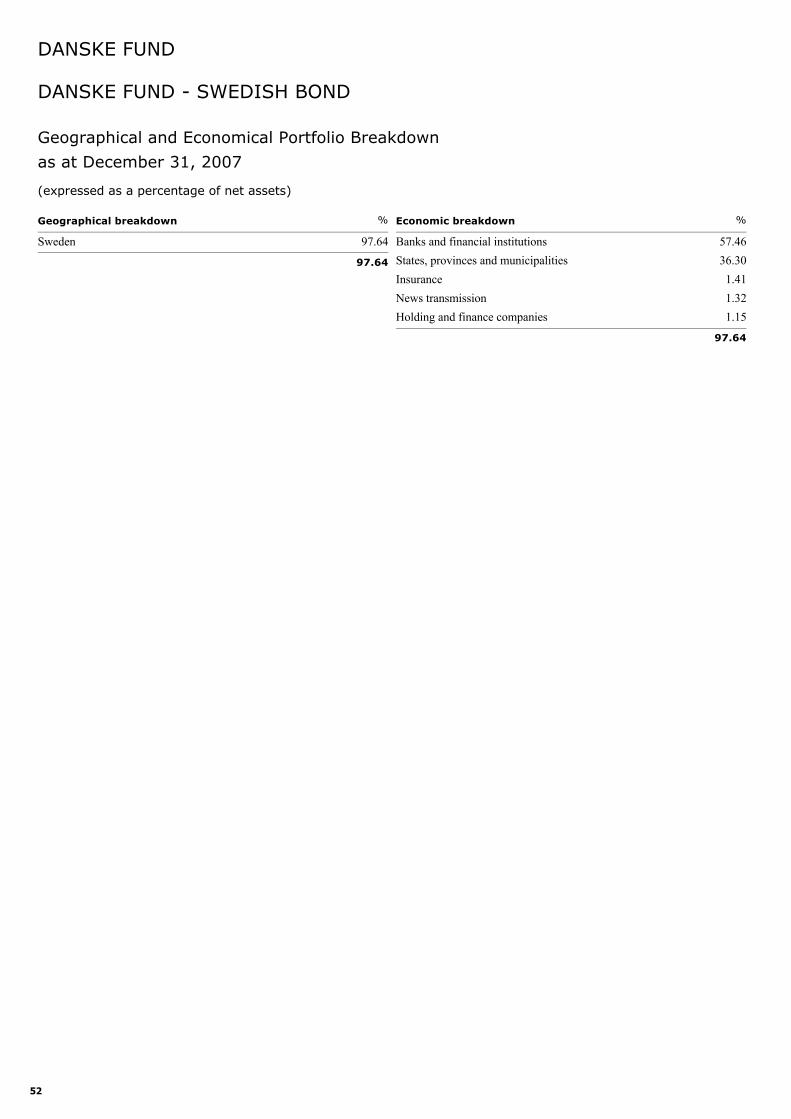
52
Sweden 97.64
Geographical breakdown %
97.64
Banks and financial institutions 57.46States, provinces and municipalities 36.30Insurance 1.41News transmission 1.32Holding and finance companies 1.15
Economic breakdown %
97.64
Geographical and Economical Portfolio Breakdown
DANSKE FUND - SWEDISH BOND
DANSKE FUND
as at December 31, 2007
(expressed as a percentage of net assets)
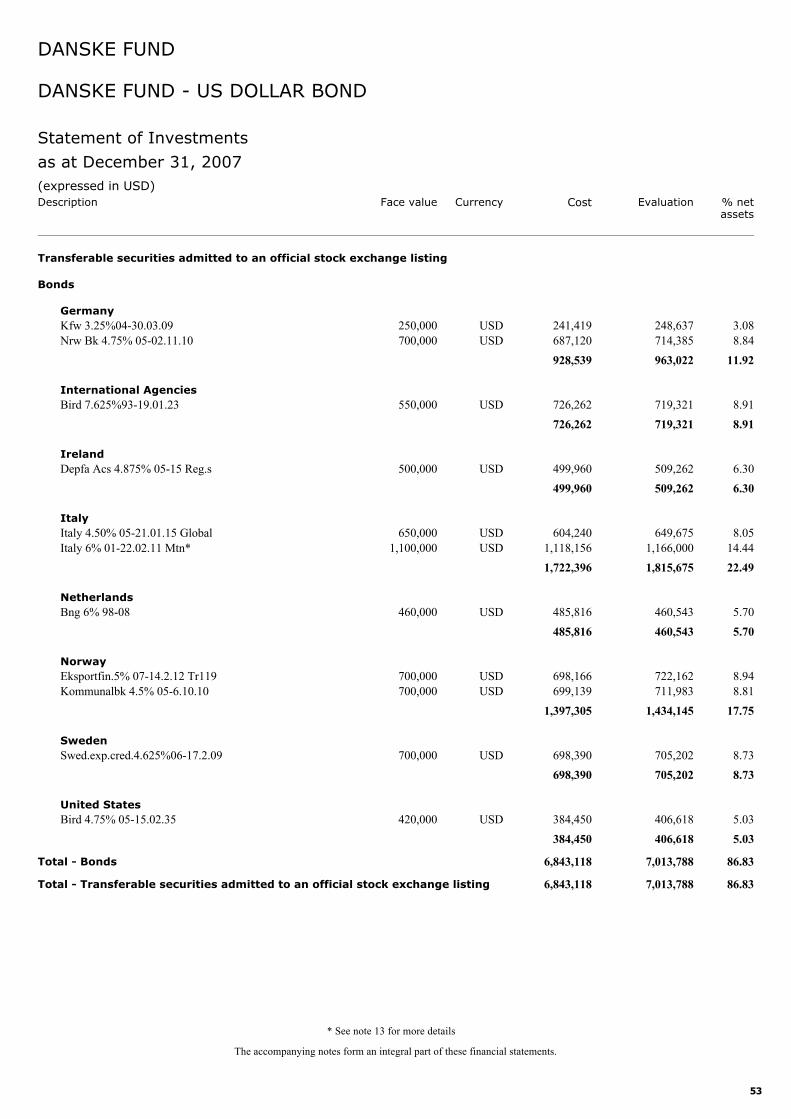
53
Kfw 3.25%04-30.03.09 250,000 248,637 3.08USD 241,419
Transferable securities admitted to an official stock exchange listing
Bonds
Germany
Nrw Bk 4.75% 05-02.11.10 700,000 714,385 8.84USD 687,120963,022 11.92928,539
Bird 7.625%93-19.01.23 550,000 719,321 8.91USD 726,262International Agencies
719,321 8.91726,262
Depfa Acs 4.875% 05-15 Reg.s 500,000 509,262 6.30USD 499,960Ireland
509,262 6.30499,960
Italy 4.50% 05-21.01.15 Global 650,000 649,675 8.05USD 604,240Italy
Italy 6% 01-22.02.11 Mtn* 1,100,000 1,166,000 14.44USD 1,118,1561,815,675 22.491,722,396
Bng 6% 98-08 460,000 460,543 5.70USD 485,816Netherlands
460,543 5.70485,816
Eksportfin.5% 07-14.2.12 Tr119 700,000 722,162 8.94USD 698,166Norway
Kommunalbk 4.5% 05-6.10.10 700,000 711,983 8.81USD 699,1391,434,145 17.751,397,305
Swed.exp.cred.4.625%06-17.2.09 700,000 705,202 8.73USD 698,390Sweden
705,202 8.73698,390
Bird 4.75% 05-15.02.35 420,000 406,618 5.03USD 384,450United States
406,618 5.03384,450
Total - Bonds 7,013,788 86.836,843,118
Total - Transferable securities admitted to an official stock exchange listing 7,013,788 86.836,843,118
(expressed in USD)Cost Evaluation % net
assetsCurrencyDescription
DANSKE FUND
as at December 31, 2007
Statement of Investments
The accompanying notes form an integral part of these financial statements.
Face value
DANSKE FUND - US DOLLAR BOND
* See note 13 for more details
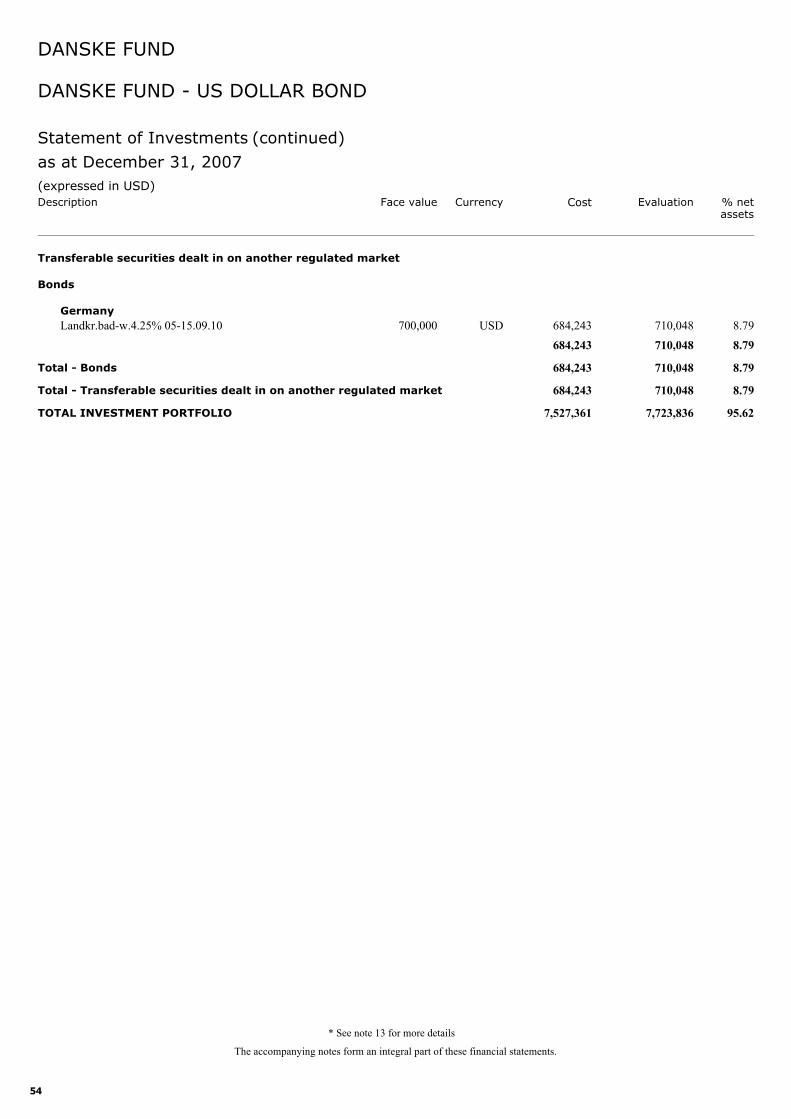
54
Landkr.bad-w.4.25% 05-15.09.10 700,000 710,048 8.79USD 684,243
Transferable securities dealt in on another regulated market
Bonds
Germany
710,048 8.79684,243
Total - Bonds 710,048 8.79684,243
Total - Transferable securities dealt in on another regulated market 710,048 8.79684,243
TOTAL INVESTMENT PORTFOLIO 7,723,836 95.627,527,361
(expressed in USD)Cost Evaluation % net
assetsCurrencyDescription
DANSKE FUND
as at December 31, 2007
Statement of Investments (continued)
The accompanying notes form an integral part of these financial statements.
Face value
DANSKE FUND - US DOLLAR BOND
* See note 13 for more details
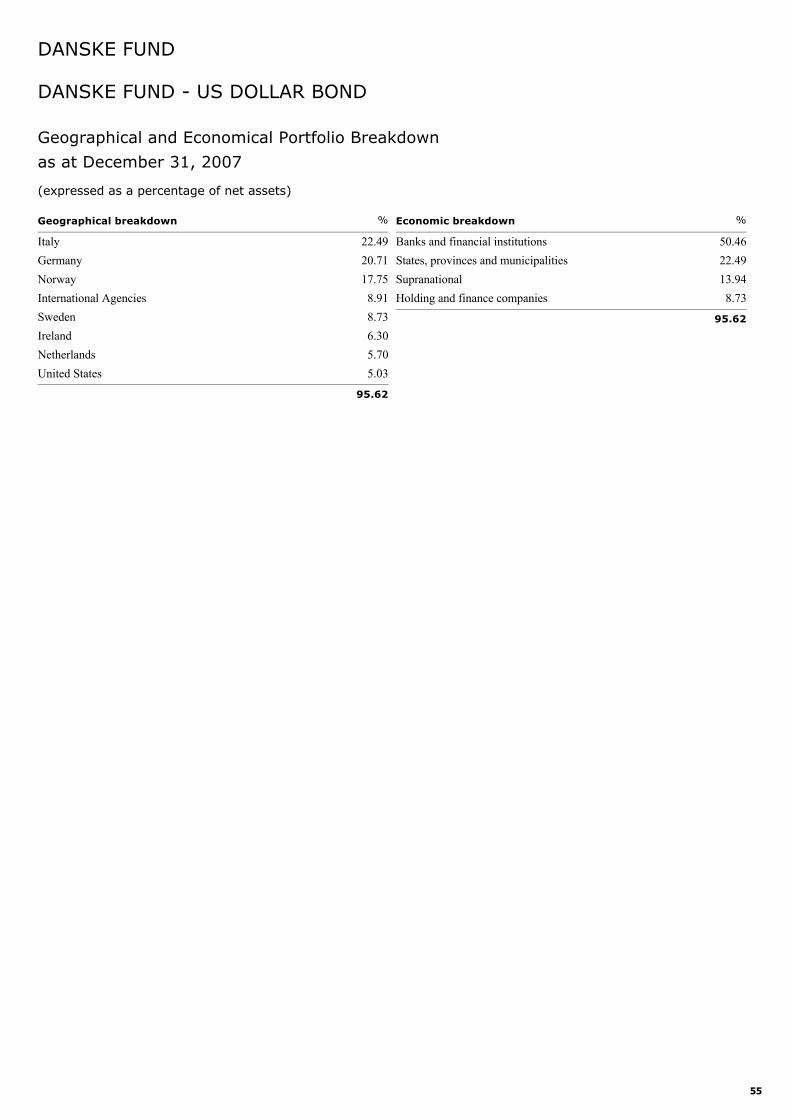
55
Italy 22.49Germany 20.71Norway 17.75International Agencies 8.91Sweden 8.73Ireland 6.30Netherlands 5.70United States 5.03
Geographical breakdown %
95.62
Banks and financial institutions 50.46States, provinces and municipalities 22.49Supranational 13.94Holding and finance companies 8.73
Economic breakdown %
95.62
Geographical and Economical Portfolio Breakdown
DANSKE FUND - US DOLLAR BOND
DANSKE FUND
as at December 31, 2007
(expressed as a percentage of net assets)
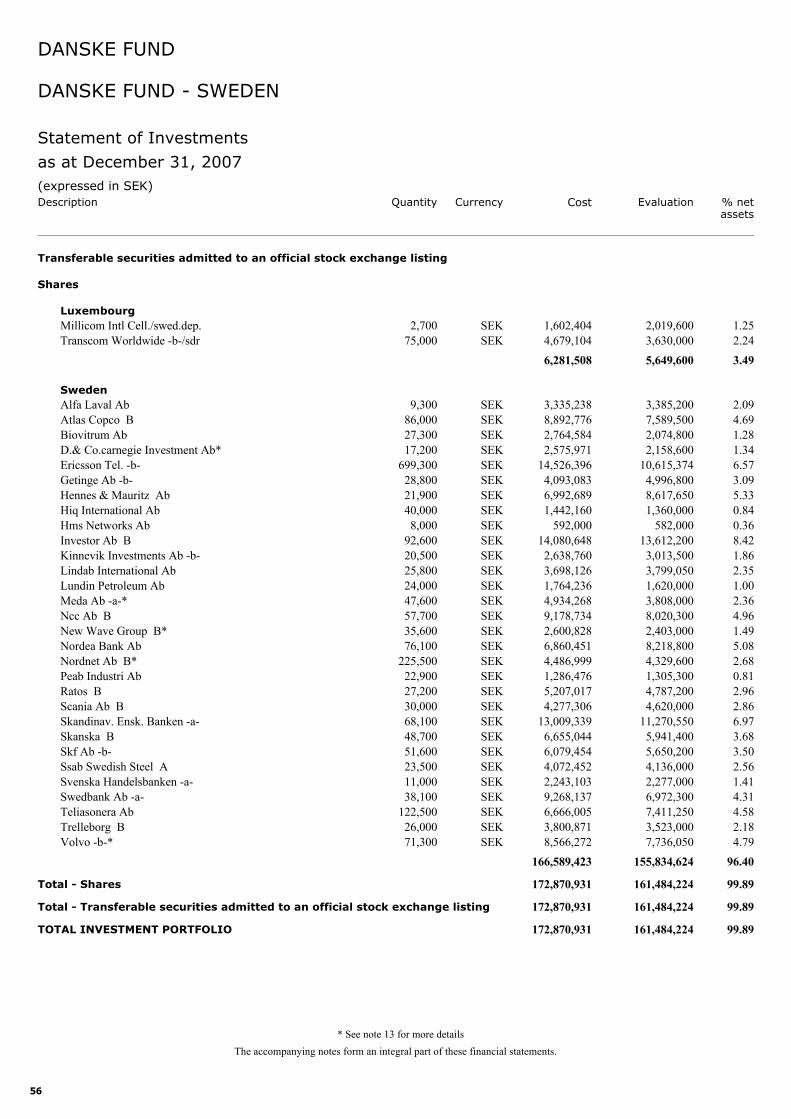
56
Millicom Intl Cell./swed.dep. 2,700 2,019,600 1.25SEK 1,602,404
Transferable securities admitted to an official stock exchange listing
Shares
Luxembourg
Transcom Worldwide -b-/sdr 75,000 3,630,000 2.24SEK 4,679,1045,649,600 3.496,281,508
Alfa Laval Ab 9,300 3,385,200 2.09SEK 3,335,238Sweden
Atlas Copco B 86,000 7,589,500 4.69SEK 8,892,776Biovitrum Ab 27,300 2,074,800 1.28SEK 2,764,584D.& Co.carnegie Investment Ab* 17,200 2,158,600 1.34SEK 2,575,971Ericsson Tel. -b- 699,300 10,615,374 6.57SEK 14,526,396Getinge Ab -b- 28,800 4,996,800 3.09SEK 4,093,083Hennes & Mauritz Ab 21,900 8,617,650 5.33SEK 6,992,689Hiq International Ab 40,000 1,360,000 0.84SEK 1,442,160Hms Networks Ab 8,000 582,000 0.36SEK 592,000Investor Ab B 92,600 13,612,200 8.42SEK 14,080,648Kinnevik Investments Ab -b- 20,500 3,013,500 1.86SEK 2,638,760Lindab International Ab 25,800 3,799,050 2.35SEK 3,698,126Lundin Petroleum Ab 24,000 1,620,000 1.00SEK 1,764,236Meda Ab -a-* 47,600 3,808,000 2.36SEK 4,934,268Ncc Ab B 57,700 8,020,300 4.96SEK 9,178,734New Wave Group B* 35,600 2,403,000 1.49SEK 2,600,828Nordea Bank Ab 76,100 8,218,800 5.08SEK 6,860,451Nordnet Ab B* 225,500 4,329,600 2.68SEK 4,486,999Peab Industri Ab 22,900 1,305,300 0.81SEK 1,286,476Ratos B 27,200 4,787,200 2.96SEK 5,207,017Scania Ab B 30,000 4,620,000 2.86SEK 4,277,306Skandinav. Ensk. Banken -a- 68,100 11,270,550 6.97SEK 13,009,339Skanska B 48,700 5,941,400 3.68SEK 6,655,044Skf Ab -b- 51,600 5,650,200 3.50SEK 6,079,454Ssab Swedish Steel A 23,500 4,136,000 2.56SEK 4,072,452Svenska Handelsbanken -a- 11,000 2,277,000 1.41SEK 2,243,103Swedbank Ab -a- 38,100 6,972,300 4.31SEK 9,268,137Teliasonera Ab 122,500 7,411,250 4.58SEK 6,666,005Trelleborg B 26,000 3,523,000 2.18SEK 3,800,871Volvo -b-* 71,300 7,736,050 4.79SEK 8,566,272
155,834,624 96.40166,589,423
Total - Shares 161,484,224 99.89172,870,931
Total - Transferable securities admitted to an official stock exchange listing 161,484,224 99.89172,870,931
TOTAL INVESTMENT PORTFOLIO 161,484,224 99.89172,870,931
(expressed in SEK)Cost Evaluation % net
assetsCurrencyDescription
DANSKE FUND
as at December 31, 2007
Statement of Investments
The accompanying notes form an integral part of these financial statements.
Quantity
DANSKE FUND - SWEDEN
* See note 13 for more details
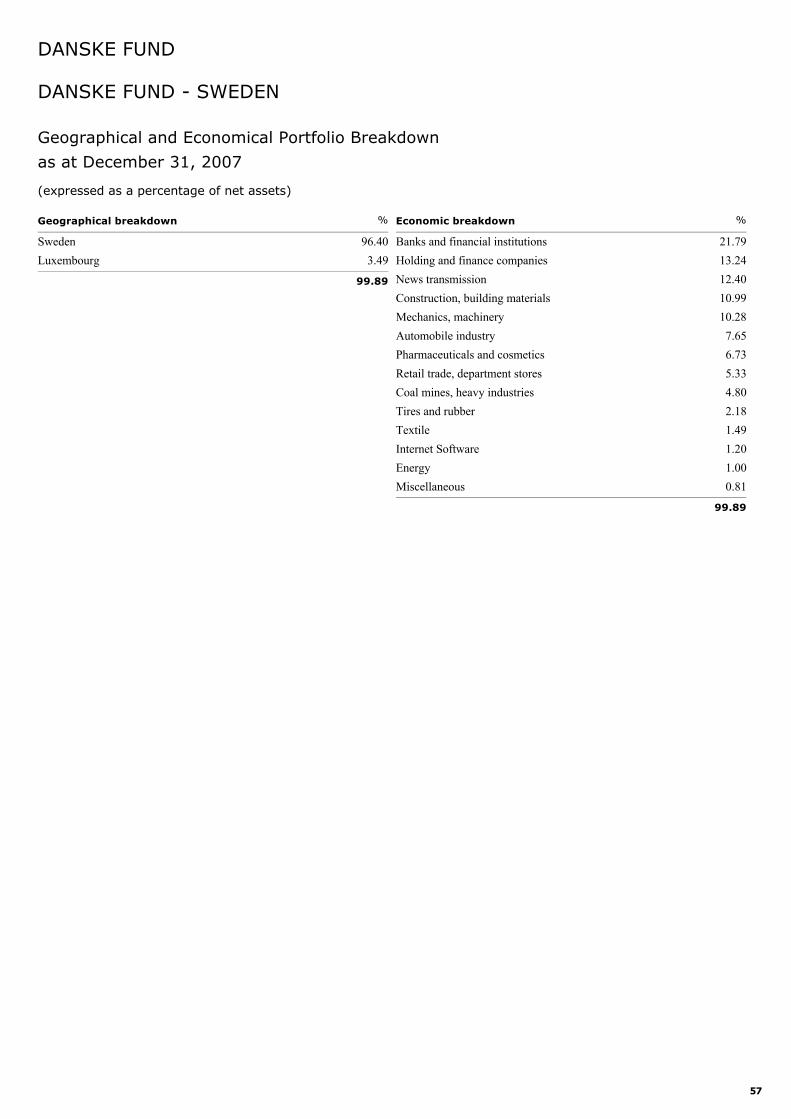
57
Sweden 96.40Luxembourg 3.49
Geographical breakdown %
99.89
Banks and financial institutions 21.79Holding and finance companies 13.24News transmission 12.40Construction, building materials 10.99Mechanics, machinery 10.28Automobile industry 7.65Pharmaceuticals and cosmetics 6.73Retail trade, department stores 5.33Coal mines, heavy industries 4.80Tires and rubber 2.18Textile 1.49Internet Software 1.20Energy 1.00Miscellaneous 0.81
Economic breakdown %
99.89
Geographical and Economical Portfolio Breakdown
DANSKE FUND - SWEDEN
DANSKE FUND
as at December 31, 2007
(expressed as a percentage of net assets)
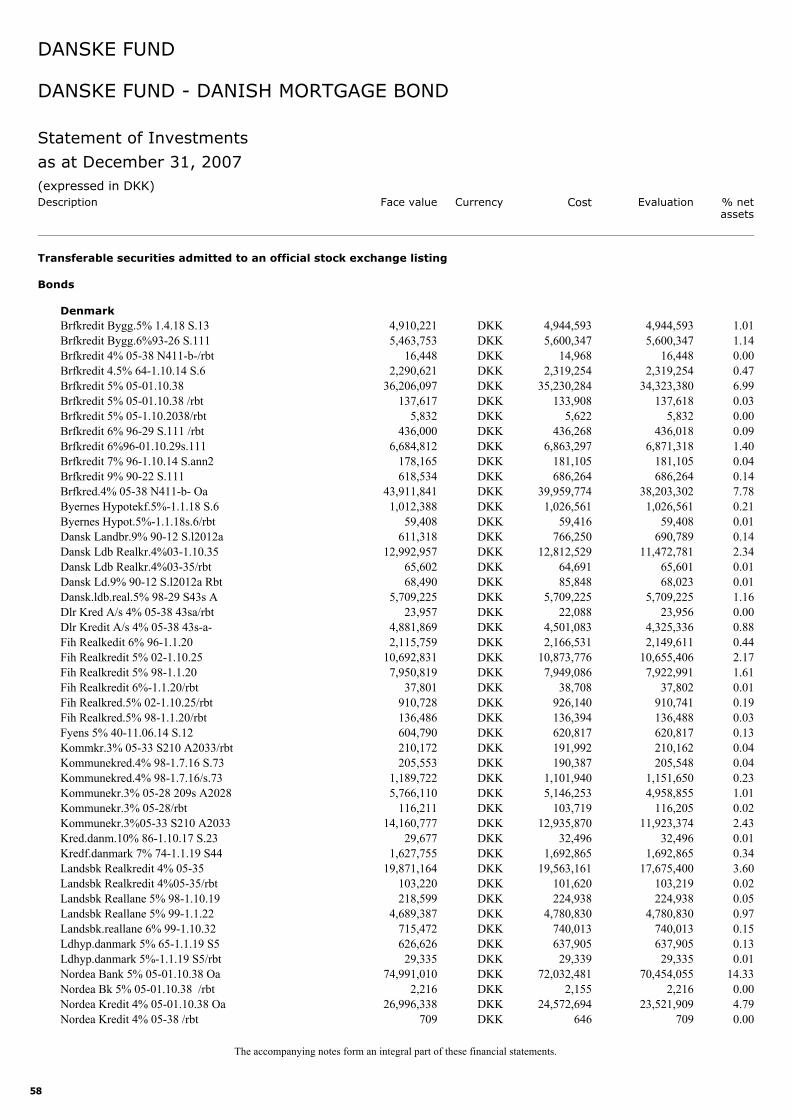
58
Brfkredit Bygg.5% 1.4.18 S.13 4,910,221 4,944,593 1.01DKK 4,944,593
Transferable securities admitted to an official stock exchange listing
Bonds
Denmark
Brfkredit Bygg.6%93-26 S.111 5,463,753 5,600,347 1.14DKK 5,600,347Brfkredit 4% 05-38 N411-b-/rbt 16,448 16,448 0.00DKK 14,968Brfkredit 4.5% 64-1.10.14 S.6 2,290,621 2,319,254 0.47DKK 2,319,254Brfkredit 5% 05-01.10.38 36,206,097 34,323,380 6.99DKK 35,230,284Brfkredit 5% 05-01.10.38 /rbt 137,617 137,618 0.03DKK 133,908Brfkredit 5% 05-1.10.2038/rbt 5,832 5,832 0.00DKK 5,622Brfkredit 6% 96-29 S.111 /rbt 436,000 436,018 0.09DKK 436,268Brfkredit 6%96-01.10.29s.111 6,684,812 6,871,318 1.40DKK 6,863,297Brfkredit 7% 96-1.10.14 S.ann2 178,165 181,105 0.04DKK 181,105Brfkredit 9% 90-22 S.111 618,534 686,264 0.14DKK 686,264Brfkred.4% 05-38 N411-b- Oa 43,911,841 38,203,302 7.78DKK 39,959,774Byernes Hypotekf.5%-1.1.18 S.6 1,012,388 1,026,561 0.21DKK 1,026,561Byernes Hypot.5%-1.1.18s.6/rbt 59,408 59,408 0.01DKK 59,416Dansk Landbr.9% 90-12 S.l2012a 611,318 690,789 0.14DKK 766,250Dansk Ldb Realkr.4%03-1.10.35 12,992,957 11,472,781 2.34DKK 12,812,529Dansk Ldb Realkr.4%03-35/rbt 65,602 65,601 0.01DKK 64,691Dansk Ld.9% 90-12 S.l2012a Rbt 68,490 68,023 0.01DKK 85,848Dansk.ldb.real.5% 98-29 S43s A 5,709,225 5,709,225 1.16DKK 5,709,225Dlr Kred A/s 4% 05-38 43sa/rbt 23,957 23,956 0.00DKK 22,088Dlr Kredit A/s 4% 05-38 43s-a- 4,881,869 4,325,336 0.88DKK 4,501,083Fih Realkedit 6% 96-1.1.20 2,115,759 2,149,611 0.44DKK 2,166,531Fih Realkredit 5% 02-1.10.25 10,692,831 10,655,406 2.17DKK 10,873,776Fih Realkredit 5% 98-1.1.20 7,950,819 7,922,991 1.61DKK 7,949,086Fih Realkredit 6%-1.1.20/rbt 37,801 37,802 0.01DKK 38,708Fih Realkred.5% 02-1.10.25/rbt 910,728 910,741 0.19DKK 926,140Fih Realkred.5% 98-1.1.20/rbt 136,486 136,488 0.03DKK 136,394Fyens 5% 40-11.06.14 S.12 604,790 620,817 0.13DKK 620,817Kommkr.3% 05-33 S210 A2033/rbt 210,172 210,162 0.04DKK 191,992Kommunekred.4% 98-1.7.16 S.73 205,553 205,548 0.04DKK 190,387Kommunekred.4% 98-1.7.16/s.73 1,189,722 1,151,650 0.23DKK 1,101,940Kommunekr.3% 05-28 209s A2028 5,766,110 4,958,855 1.01DKK 5,146,253Kommunekr.3% 05-28/rbt 116,211 116,205 0.02DKK 103,719Kommunekr.3%05-33 S210 A2033 14,160,777 11,923,374 2.43DKK 12,935,870Kred.danm.10% 86-1.10.17 S.23 29,677 32,496 0.01DKK 32,496Kredf.danmark 7% 74-1.1.19 S44 1,627,755 1,692,865 0.34DKK 1,692,865Landsbk Realkredit 4% 05-35 19,871,164 17,675,400 3.60DKK 19,563,161Landsbk Realkredit 4%05-35/rbt 103,220 103,219 0.02DKK 101,620Landsbk Reallane 5% 98-1.10.19 218,599 224,938 0.05DKK 224,938Landsbk Reallane 5% 99-1.1.22 4,689,387 4,780,830 0.97DKK 4,780,830Landsbk.reallane 6% 99-1.10.32 715,472 740,013 0.15DKK 740,013Ldhyp.danmark 5% 65-1.1.19 S5 626,626 637,905 0.13DKK 637,905Ldhyp.danmark 5%-1.1.19 S5/rbt 29,335 29,335 0.01DKK 29,339Nordea Bank 5% 05-01.10.38 Oa 74,991,010 70,454,055 14.33DKK 72,032,481Nordea Bk 5% 05-01.10.38 /rbt 2,216 2,216 0.00DKK 2,155Nordea Kredit 4% 05-01.10.38 Oa 26,996,338 23,521,909 4.79DKK 24,572,694Nordea Kredit 4% 05-38 /rbt 709 709 0.00DKK 646
(expressed in DKK)Cost Evaluation % net
assetsCurrencyDescription
DANSKE FUND
as at December 31, 2007
Statement of Investments
The accompanying notes form an integral part of these financial statements.
Face value
DANSKE FUND - DANISH MORTGAGE BOND
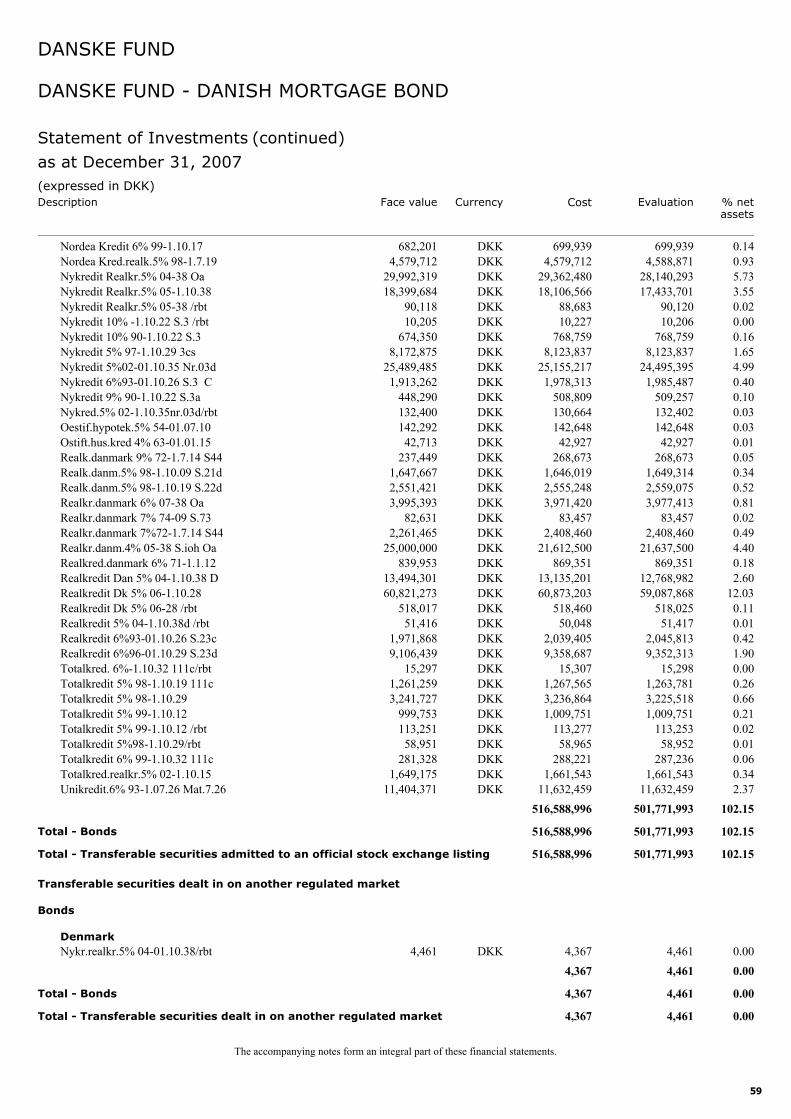
59
Nordea Kredit 6% 99-1.10.17 682,201 699,939 0.14DKK 699,939Nordea Kred.realk.5% 98-1.7.19 4,579,712 4,588,871 0.93DKK 4,579,712Nykredit Realkr.5% 04-38 Oa 29,992,319 28,140,293 5.73DKK 29,362,480Nykredit Realkr.5% 05-1.10.38 18,399,684 17,433,701 3.55DKK 18,106,566Nykredit Realkr.5% 05-38 /rbt 90,118 90,120 0.02DKK 88,683Nykredit 10% -1.10.22 S.3 /rbt 10,205 10,206 0.00DKK 10,227Nykredit 10% 90-1.10.22 S.3 674,350 768,759 0.16DKK 768,759Nykredit 5% 97-1.10.29 3cs 8,172,875 8,123,837 1.65DKK 8,123,837Nykredit 5%02-01.10.35 Nr.03d 25,489,485 24,495,395 4.99DKK 25,155,217Nykredit 6%93-01.10.26 S.3 C 1,913,262 1,985,487 0.40DKK 1,978,313Nykredit 9% 90-1.10.22 S.3a 448,290 509,257 0.10DKK 508,809Nykred.5% 02-1.10.35nr.03d/rbt 132,400 132,402 0.03DKK 130,664Oestif.hypotek.5% 54-01.07.10 142,292 142,648 0.03DKK 142,648Ostift.hus.kred 4% 63-01.01.15 42,713 42,927 0.01DKK 42,927Realk.danmark 9% 72-1.7.14 S44 237,449 268,673 0.05DKK 268,673Realk.danm.5% 98-1.10.09 S.21d 1,647,667 1,649,314 0.34DKK 1,646,019Realk.danm.5% 98-1.10.19 S.22d 2,551,421 2,559,075 0.52DKK 2,555,248Realkr.danmark 6% 07-38 Oa 3,995,393 3,977,413 0.81DKK 3,971,420Realkr.danmark 7% 74-09 S.73 82,631 83,457 0.02DKK 83,457Realkr.danmark 7%72-1.7.14 S44 2,261,465 2,408,460 0.49DKK 2,408,460Realkr.danm.4% 05-38 S.ioh Oa 25,000,000 21,637,500 4.40DKK 21,612,500Realkred.danmark 6% 71-1.1.12 839,953 869,351 0.18DKK 869,351Realkredit Dan 5% 04-1.10.38 D 13,494,301 12,768,982 2.60DKK 13,135,201Realkredit Dk 5% 06-1.10.28 60,821,273 59,087,868 12.03DKK 60,873,203Realkredit Dk 5% 06-28 /rbt 518,017 518,025 0.11DKK 518,460Realkredit 5% 04-1.10.38d /rbt 51,416 51,417 0.01DKK 50,048Realkredit 6%93-01.10.26 S.23c 1,971,868 2,045,813 0.42DKK 2,039,405Realkredit 6%96-01.10.29 S.23d 9,106,439 9,352,313 1.90DKK 9,358,687Totalkred. 6%-1.10.32 111c/rbt 15,297 15,298 0.00DKK 15,307Totalkredit 5% 98-1.10.19 111c 1,261,259 1,263,781 0.26DKK 1,267,565Totalkredit 5% 98-1.10.29 3,241,727 3,225,518 0.66DKK 3,236,864Totalkredit 5% 99-1.10.12 999,753 1,009,751 0.21DKK 1,009,751Totalkredit 5% 99-1.10.12 /rbt 113,251 113,253 0.02DKK 113,277Totalkredit 5%98-1.10.29/rbt 58,951 58,952 0.01DKK 58,965Totalkredit 6% 99-1.10.32 111c 281,328 287,236 0.06DKK 288,221Totalkred.realkr.5% 02-1.10.15 1,649,175 1,661,543 0.34DKK 1,661,543Unikredit.6% 93-1.07.26 Mat.7.26 11,404,371 11,632,459 2.37DKK 11,632,459
501,771,993 102.15516,588,996
Total - Bonds 501,771,993 102.15516,588,996
Total - Transferable securities admitted to an official stock exchange listing 501,771,993 102.15516,588,996
Nykr.realkr.5% 04-01.10.38/rbt 4,461 4,461 0.00DKK 4,367
Transferable securities dealt in on another regulated market
Bonds
Denmark
4,461 0.004,367
Total - Bonds 4,461 0.004,367
Total - Transferable securities dealt in on another regulated market 4,461 0.004,367
(expressed in DKK)Cost Evaluation % net
assetsCurrencyDescription
DANSKE FUND
as at December 31, 2007
Statement of Investments (continued)
The accompanying notes form an integral part of these financial statements.
Face value
DANSKE FUND - DANISH MORTGAGE BOND
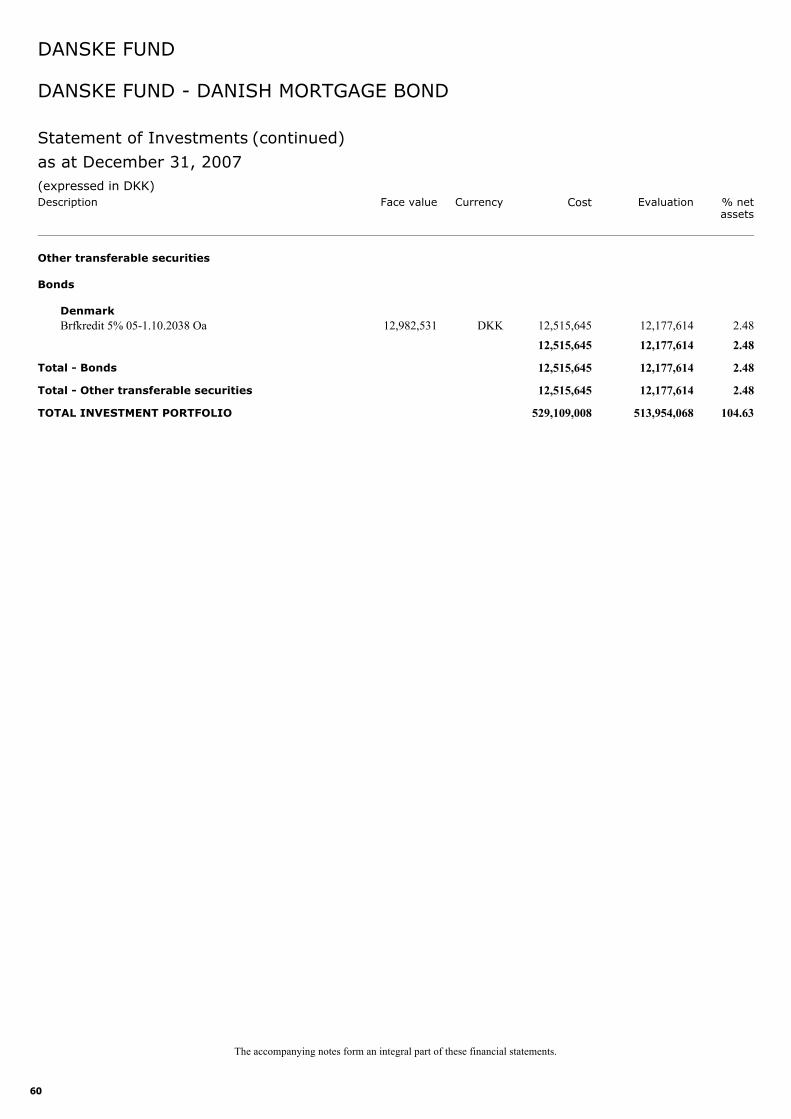
60
Brfkredit 5% 05-1.10.2038 Oa 12,982,531 12,177,614 2.48DKK 12,515,645
Other transferable securities
Bonds
Denmark
12,177,614 2.4812,515,645
Total - Bonds 12,177,614 2.4812,515,645
Total - Other transferable securities 12,177,614 2.4812,515,645
TOTAL INVESTMENT PORTFOLIO 513,954,068 104.63529,109,008
(expressed in DKK)Cost Evaluation % net
assetsCurrencyDescription
DANSKE FUND
as at December 31, 2007
Statement of Investments (continued)
The accompanying notes form an integral part of these financial statements.
Face value
DANSKE FUND - DANISH MORTGAGE BOND
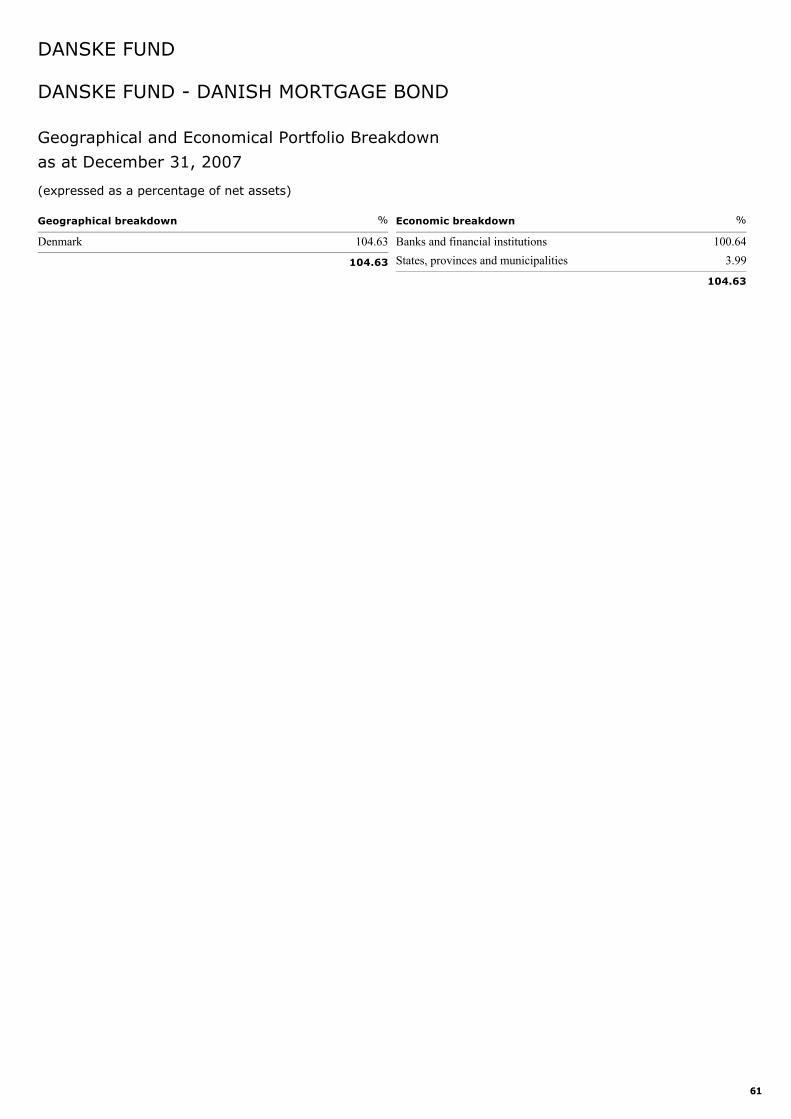
61
Denmark 104.63
Geographical breakdown %
104.63
Banks and financial institutions 100.64States, provinces and municipalities 3.99
Economic breakdown %
104.63
Geographical and Economical Portfolio Breakdown
DANSKE FUND - DANISH MORTGAGE BOND
DANSKE FUND
as at December 31, 2007
(expressed as a percentage of net assets)
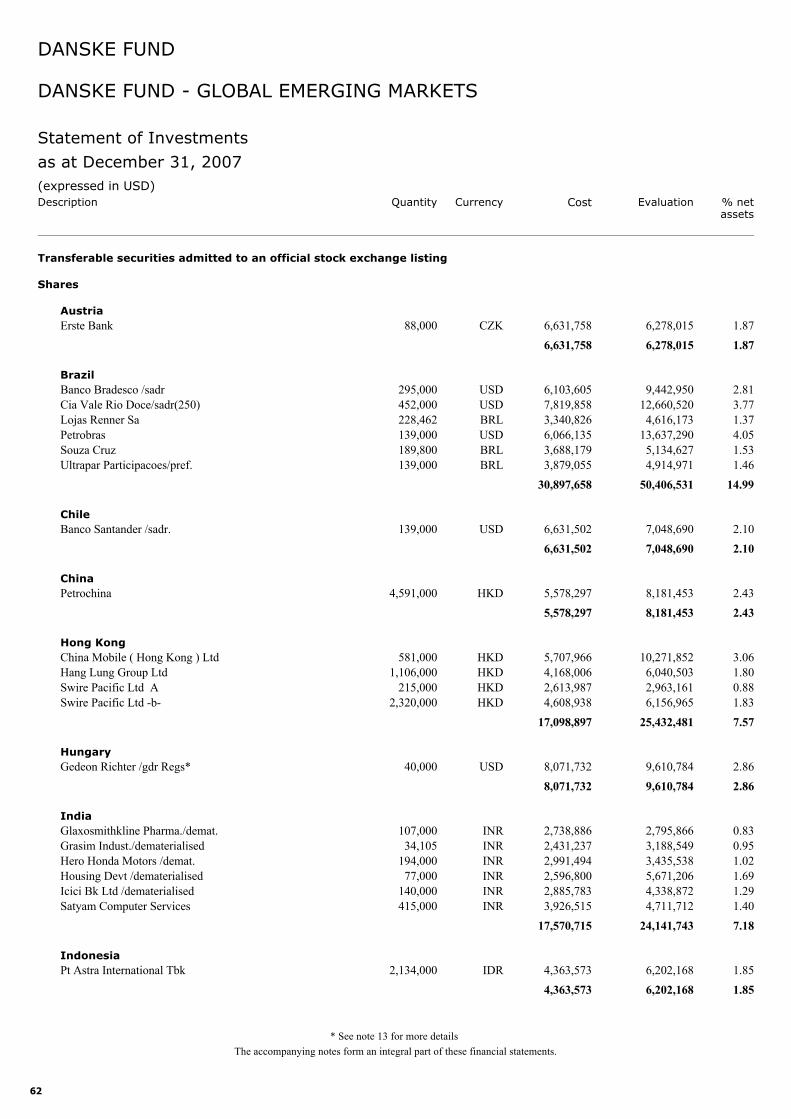
62
Erste Bank 88,000 6,278,015 1.87CZK 6,631,758
Transferable securities admitted to an official stock exchange listing
Shares
Austria
6,278,015 1.876,631,758
Banco Bradesco /sadr 295,000 9,442,950 2.81USD 6,103,605Brazil
Cia Vale Rio Doce/sadr(250) 452,000 12,660,520 3.77USD 7,819,858Lojas Renner Sa 228,462 4,616,173 1.37BRL 3,340,826Petrobras 139,000 13,637,290 4.05USD 6,066,135Souza Cruz 189,800 5,134,627 1.53BRL 3,688,179Ultrapar Participacoes/pref. 139,000 4,914,971 1.46BRL 3,879,055
50,406,531 14.9930,897,658
Banco Santander /sadr. 139,000 7,048,690 2.10USD 6,631,502Chile
7,048,690 2.106,631,502
Petrochina 4,591,000 8,181,453 2.43HKD 5,578,297China
8,181,453 2.435,578,297
China Mobile ( Hong Kong ) Ltd 581,000 10,271,852 3.06HKD 5,707,966Hong Kong
Hang Lung Group Ltd 1,106,000 6,040,503 1.80HKD 4,168,006Swire Pacific Ltd A 215,000 2,963,161 0.88HKD 2,613,987Swire Pacific Ltd -b- 2,320,000 6,156,965 1.83HKD 4,608,938
25,432,481 7.5717,098,897
Gedeon Richter /gdr Regs* 40,000 9,610,784 2.86USD 8,071,732Hungary
9,610,784 2.868,071,732
Glaxosmithkline Pharma./demat. 107,000 2,795,866 0.83INR 2,738,886India
Grasim Indust./dematerialised 34,105 3,188,549 0.95INR 2,431,237Hero Honda Motors /demat. 194,000 3,435,538 1.02INR 2,991,494Housing Devt /dematerialised 77,000 5,671,206 1.69INR 2,596,800Icici Bk Ltd /dematerialised 140,000 4,338,872 1.29INR 2,885,783Satyam Computer Services 415,000 4,711,712 1.40INR 3,926,515
24,141,743 7.1817,570,715
Pt Astra International Tbk 2,134,000 6,202,168 1.85IDR 4,363,573Indonesia
6,202,168 1.854,363,573
(expressed in USD)Cost Evaluation % net
assetsCurrencyDescription
DANSKE FUND
as at December 31, 2007
Statement of Investments
The accompanying notes form an integral part of these financial statements.
Quantity
DANSKE FUND - GLOBAL EMERGING MARKETS
* See note 13 for more details
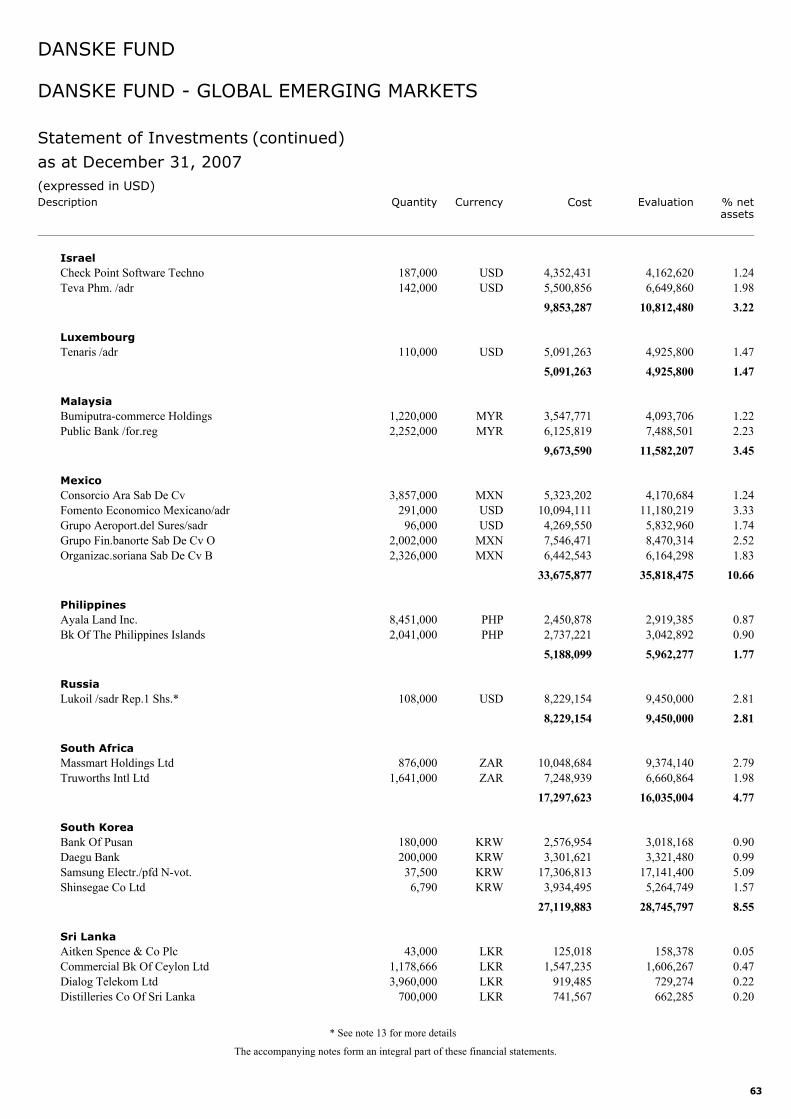
63
Check Point Software Techno 187,000 4,162,620 1.24USD 4,352,431Israel
Teva Phm. /adr 142,000 6,649,860 1.98USD 5,500,85610,812,480 3.229,853,287
Tenaris /adr 110,000 4,925,800 1.47USD 5,091,263Luxembourg
4,925,800 1.475,091,263
Bumiputra-commerce Holdings 1,220,000 4,093,706 1.22MYR 3,547,771Malaysia
Public Bank /for.reg 2,252,000 7,488,501 2.23MYR 6,125,81911,582,207 3.459,673,590
Consorcio Ara Sab De Cv 3,857,000 4,170,684 1.24MXN 5,323,202Mexico
Fomento Economico Mexicano/adr 291,000 11,180,219 3.33USD 10,094,111Grupo Aeroport.del Sures/sadr 96,000 5,832,960 1.74USD 4,269,550Grupo Fin.banorte Sab De Cv O 2,002,000 8,470,314 2.52MXN 7,546,471Organizac.soriana Sab De Cv B 2,326,000 6,164,298 1.83MXN 6,442,543
35,818,475 10.6633,675,877
Ayala Land Inc. 8,451,000 2,919,385 0.87PHP 2,450,878Philippines
Bk Of The Philippines Islands 2,041,000 3,042,892 0.90PHP 2,737,2215,962,277 1.775,188,099
Lukoil /sadr Rep.1 Shs.* 108,000 9,450,000 2.81USD 8,229,154Russia
9,450,000 2.818,229,154
Massmart Holdings Ltd 876,000 9,374,140 2.79ZAR 10,048,684South Africa
Truworths Intl Ltd 1,641,000 6,660,864 1.98ZAR 7,248,93916,035,004 4.7717,297,623
Bank Of Pusan 180,000 3,018,168 0.90KRW 2,576,954South Korea
Daegu Bank 200,000 3,321,480 0.99KRW 3,301,621Samsung Electr./pfd N-vot. 37,500 17,141,400 5.09KRW 17,306,813Shinsegae Co Ltd 6,790 5,264,749 1.57KRW 3,934,495
28,745,797 8.5527,119,883
Aitken Spence & Co Plc 43,000 158,378 0.05LKR 125,018Sri Lanka
Commercial Bk Of Ceylon Ltd 1,178,666 1,606,267 0.47LKR 1,547,235Dialog Telekom Ltd 3,960,000 729,274 0.22LKR 919,485Distilleries Co Of Sri Lanka 700,000 662,285 0.20LKR 741,567
(expressed in USD)Cost Evaluation % net
assetsCurrencyDescription
DANSKE FUND
as at December 31, 2007
Statement of Investments (continued)
The accompanying notes form an integral part of these financial statements.
Quantity
DANSKE FUND - GLOBAL EMERGING MARKETS
* See note 13 for more details
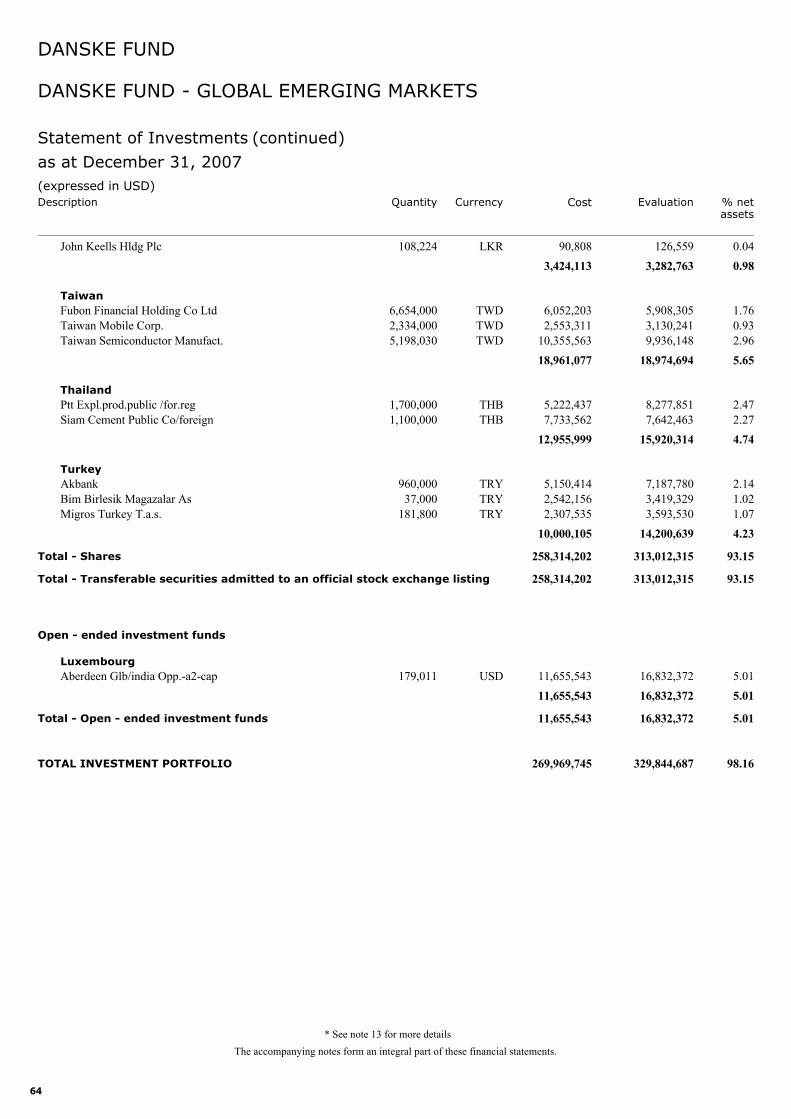
64
John Keells Hldg Plc 108,224 126,559 0.04LKR 90,8083,282,763 0.983,424,113
Fubon Financial Holding Co Ltd 6,654,000 5,908,305 1.76TWD 6,052,203Taiwan
Taiwan Mobile Corp. 2,334,000 3,130,241 0.93TWD 2,553,311Taiwan Semiconductor Manufact. 5,198,030 9,936,148 2.96TWD 10,355,563
18,974,694 5.6518,961,077
Ptt Expl.prod.public /for.reg 1,700,000 8,277,851 2.47THB 5,222,437Thailand
Siam Cement Public Co/foreign 1,100,000 7,642,463 2.27THB 7,733,56215,920,314 4.7412,955,999
Akbank 960,000 7,187,780 2.14TRY 5,150,414Turkey
Bim Birlesik Magazalar As 37,000 3,419,329 1.02TRY 2,542,156Migros Turkey T.a.s. 181,800 3,593,530 1.07TRY 2,307,535
14,200,639 4.2310,000,105
Total - Shares 313,012,315 93.15258,314,202
Total - Transferable securities admitted to an official stock exchange listing 313,012,315 93.15258,314,202
Aberdeen Glb/india Opp.-a2-cap 179,011 16,832,372 5.01USD 11,655,543
Open - ended investment funds
Luxembourg
16,832,372 5.0111,655,543
Total - Open - ended investment funds 16,832,372 5.0111,655,543
TOTAL INVESTMENT PORTFOLIO 329,844,687 98.16269,969,745
(expressed in USD)Cost Evaluation % net
assetsCurrencyDescription
DANSKE FUND
as at December 31, 2007
Statement of Investments (continued)
The accompanying notes form an integral part of these financial statements.
Quantity
DANSKE FUND - GLOBAL EMERGING MARKETS
* See note 13 for more details
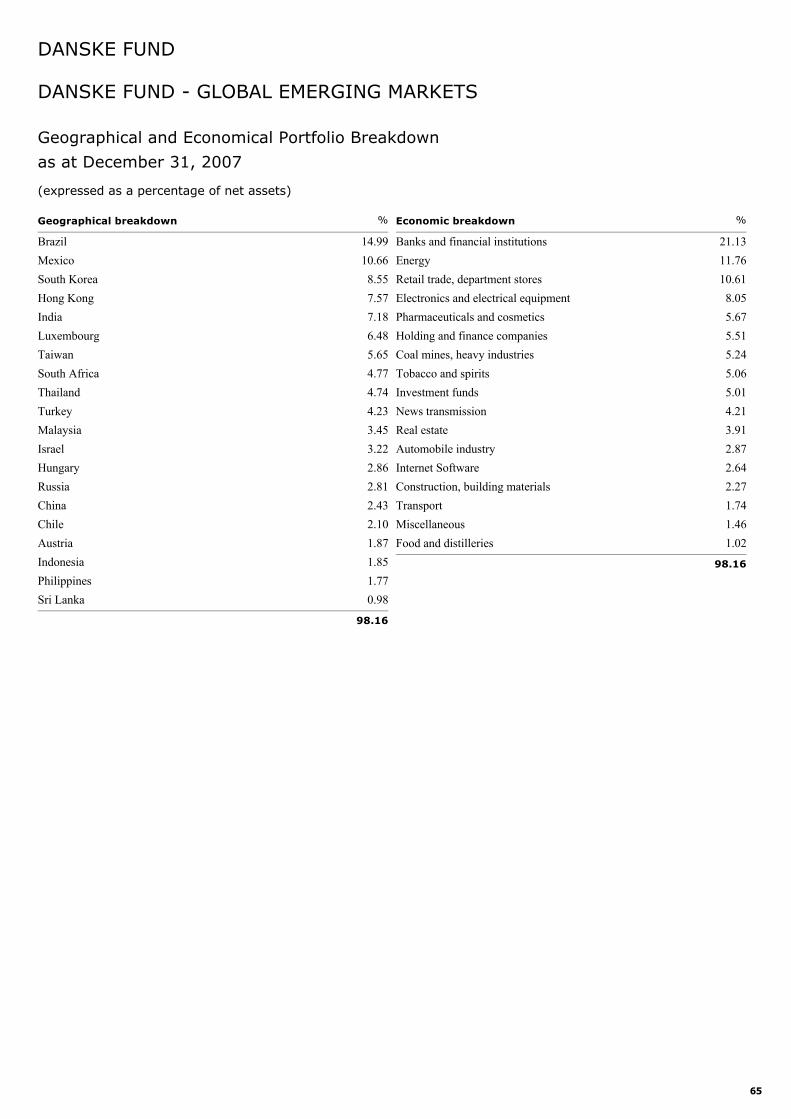
65
Brazil 14.99Mexico 10.66South Korea 8.55Hong Kong 7.57India 7.18Luxembourg 6.48Taiwan 5.65South Africa 4.77Thailand 4.74Turkey 4.23Malaysia 3.45Israel 3.22Hungary 2.86Russia 2.81China 2.43Chile 2.10Austria 1.87Indonesia 1.85Philippines 1.77Sri Lanka 0.98
Geographical breakdown %
98.16
Banks and financial institutions 21.13Energy 11.76Retail trade, department stores 10.61Electronics and electrical equipment 8.05Pharmaceuticals and cosmetics 5.67Holding and finance companies 5.51Coal mines, heavy industries 5.24Tobacco and spirits 5.06Investment funds 5.01News transmission 4.21Real estate 3.91Automobile industry 2.87Internet Software 2.64Construction, building materials 2.27Transport 1.74Miscellaneous 1.46Food and distilleries 1.02
Economic breakdown %
98.16
Geographical and Economical Portfolio Breakdown
DANSKE FUND - GLOBAL EMERGING MARKETS
DANSKE FUND
as at December 31, 2007
(expressed as a percentage of net assets)
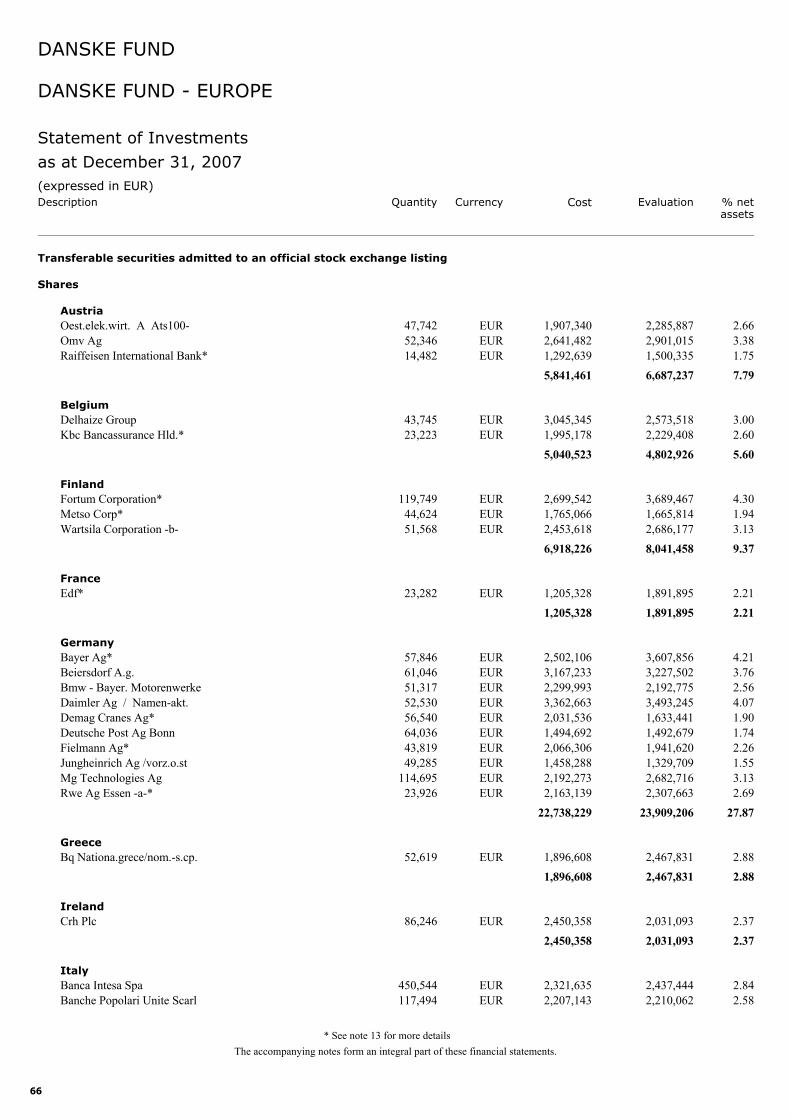
66
Oest.elek.wirt. A Ats100- 47,742 2,285,887 2.66EUR 1,907,340
Transferable securities admitted to an official stock exchange listing
Shares
Austria
Omv Ag 52,346 2,901,015 3.38EUR 2,641,482Raiffeisen International Bank* 14,482 1,500,335 1.75EUR 1,292,639
6,687,237 7.795,841,461
Delhaize Group 43,745 2,573,518 3.00EUR 3,045,345Belgium
Kbc Bancassurance Hld.* 23,223 2,229,408 2.60EUR 1,995,1784,802,926 5.605,040,523
Fortum Corporation* 119,749 3,689,467 4.30EUR 2,699,542Finland
Metso Corp* 44,624 1,665,814 1.94EUR 1,765,066Wartsila Corporation -b- 51,568 2,686,177 3.13EUR 2,453,618
8,041,458 9.376,918,226
Edf* 23,282 1,891,895 2.21EUR 1,205,328France
1,891,895 2.211,205,328
Bayer Ag* 57,846 3,607,856 4.21EUR 2,502,106Germany
Beiersdorf A.g. 61,046 3,227,502 3.76EUR 3,167,233Bmw - Bayer. Motorenwerke 51,317 2,192,775 2.56EUR 2,299,993Daimler Ag / Namen-akt. 52,530 3,493,245 4.07EUR 3,362,663Demag Cranes Ag* 56,540 1,633,441 1.90EUR 2,031,536Deutsche Post Ag Bonn 64,036 1,492,679 1.74EUR 1,494,692Fielmann Ag* 43,819 1,941,620 2.26EUR 2,066,306Jungheinrich Ag /vorz.o.st 49,285 1,329,709 1.55EUR 1,458,288Mg Technologies Ag 114,695 2,682,716 3.13EUR 2,192,273Rwe Ag Essen -a-* 23,926 2,307,663 2.69EUR 2,163,139
23,909,206 27.8722,738,229
Bq Nationa.grece/nom.-s.cp. 52,619 2,467,831 2.88EUR 1,896,608Greece
2,467,831 2.881,896,608
Crh Plc 86,246 2,031,093 2.37EUR 2,450,358Ireland
2,031,093 2.372,450,358
Banca Intesa Spa 450,544 2,437,444 2.84EUR 2,321,635Italy
Banche Popolari Unite Scarl 117,494 2,210,062 2.58EUR 2,207,143
(expressed in EUR)Cost Evaluation % net
assetsCurrencyDescription
DANSKE FUND
as at December 31, 2007
Statement of Investments
The accompanying notes form an integral part of these financial statements.
Quantity
DANSKE FUND - EUROPE
* See note 13 for more details

67
Maire Tecnimont Spa 290,992 1,038,841 1.21EUR 814,7785,686,347 6.635,343,556
Aalberts Industries Nv* 128,777 1,725,612 2.01EUR 1,907,365Netherlands
Kon.vopak Nv* 110,286 4,217,336 4.92EUR 4,348,073Royal Philips Electronics Nv 91,459 2,698,041 3.14EUR 2,671,255Wavin Nv 146,303 1,300,634 1.52EUR 2,253,421
9,941,623 11.5911,180,114
Banco Bpi Sa /nom.* 349,618 1,863,464 2.17EUR 2,264,798Portugal
1,863,464 2.172,264,798
Atlas Copco Ab -a- 339,297 3,478,644 4.05SEK 3,769,268Sweden
3,478,644 4.053,769,268
Holcim Ltd* 32,766 2,398,798 2.80CHF 2,437,325Switzerland
Kuehne + Nagel International* 31,699 2,075,796 2.42CHF 2,013,162Novartis Ag Basel /nam 79,315 2,972,736 3.46CHF 3,349,855Panalpina Weltrans./namen-akt. 24,701 2,926,471 3.41CHF 2,753,600
10,373,801 12.0910,553,942
Total - Shares 81,175,525 94.6279,202,411
Total - Transferable securities admitted to an official stock exchange listing 81,175,525 94.6279,202,411
TOTAL INVESTMENT PORTFOLIO 81,175,525 94.6279,202,411
(expressed in EUR)Cost Evaluation % net
assetsCurrencyDescription
DANSKE FUND
as at December 31, 2007
Statement of Investments (continued)
The accompanying notes form an integral part of these financial statements.
Quantity
DANSKE FUND - EUROPE
* See note 13 for more details
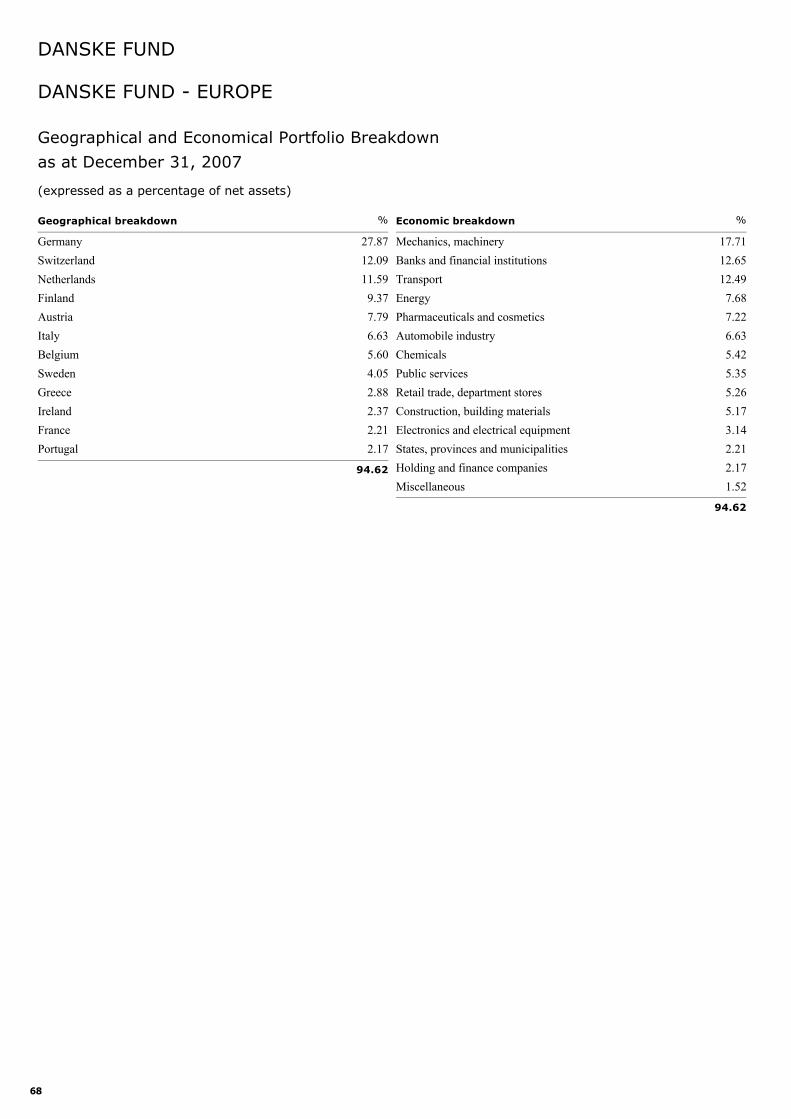
68
Germany 27.87Switzerland 12.09Netherlands 11.59Finland 9.37Austria 7.79Italy 6.63Belgium 5.60Sweden 4.05Greece 2.88Ireland 2.37France 2.21Portugal 2.17
Geographical breakdown %
94.62
Mechanics, machinery 17.71Banks and financial institutions 12.65Transport 12.49Energy 7.68Pharmaceuticals and cosmetics 7.22Automobile industry 6.63Chemicals 5.42Public services 5.35Retail trade, department stores 5.26Construction, building materials 5.17Electronics and electrical equipment 3.14States, provinces and municipalities 2.21Holding and finance companies 2.17Miscellaneous 1.52
Economic breakdown %
94.62
Geographical and Economical Portfolio Breakdown
DANSKE FUND - EUROPE
DANSKE FUND
as at December 31, 2007
(expressed as a percentage of net assets)
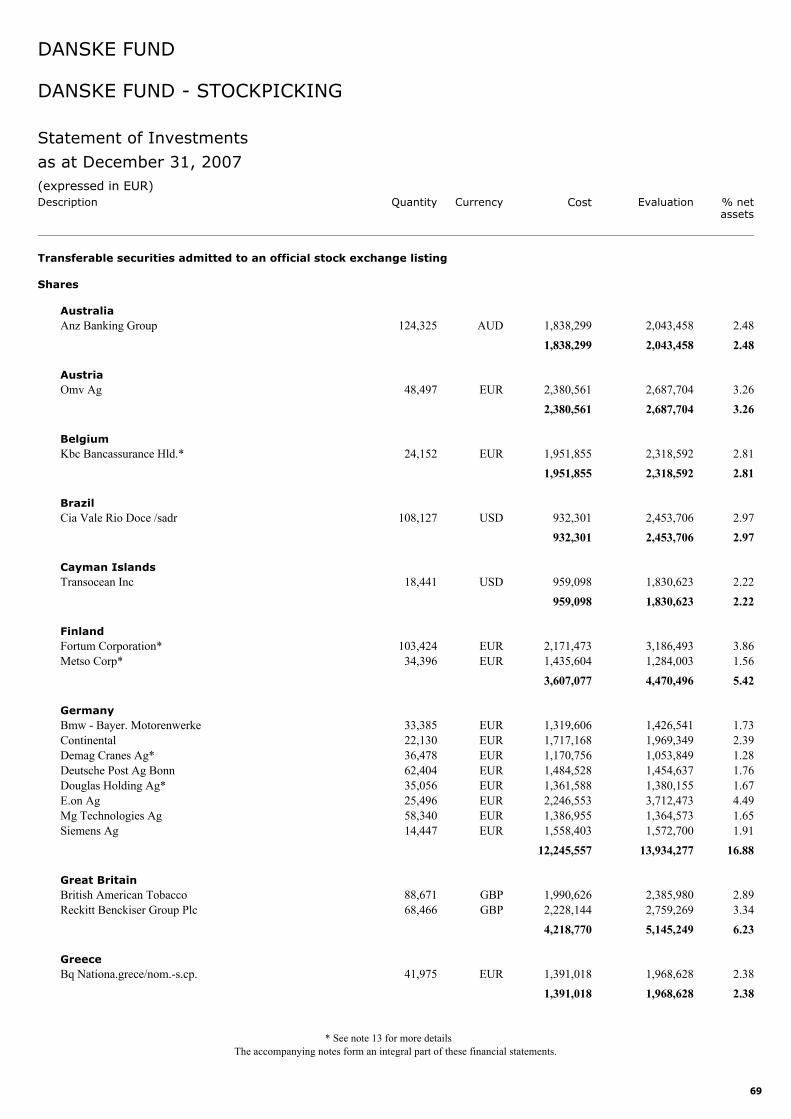
69
Anz Banking Group 124,325 2,043,458 2.48AUD 1,838,299
Transferable securities admitted to an official stock exchange listing
Shares
Australia
2,043,458 2.481,838,299
Omv Ag 48,497 2,687,704 3.26EUR 2,380,561Austria
2,687,704 3.262,380,561
Kbc Bancassurance Hld.* 24,152 2,318,592 2.81EUR 1,951,855Belgium
2,318,592 2.811,951,855
Cia Vale Rio Doce /sadr 108,127 2,453,706 2.97USD 932,301Brazil
2,453,706 2.97932,301
Transocean Inc 18,441 1,830,623 2.22USD 959,098Cayman Islands
1,830,623 2.22959,098
Fortum Corporation* 103,424 3,186,493 3.86EUR 2,171,473Finland
Metso Corp* 34,396 1,284,003 1.56EUR 1,435,6044,470,496 5.423,607,077
Bmw - Bayer. Motorenwerke 33,385 1,426,541 1.73EUR 1,319,606Germany
Continental 22,130 1,969,349 2.39EUR 1,717,168Demag Cranes Ag* 36,478 1,053,849 1.28EUR 1,170,756Deutsche Post Ag Bonn 62,404 1,454,637 1.76EUR 1,484,528Douglas Holding Ag* 35,056 1,380,155 1.67EUR 1,361,588E.on Ag 25,496 3,712,473 4.49EUR 2,246,553Mg Technologies Ag 58,340 1,364,573 1.65EUR 1,386,955Siemens Ag 14,447 1,572,700 1.91EUR 1,558,403
13,934,277 16.8812,245,557
British American Tobacco 88,671 2,385,980 2.89GBP 1,990,626Great Britain
Reckitt Benckiser Group Plc 68,466 2,759,269 3.34GBP 2,228,1445,145,249 6.234,218,770
Bq Nationa.grece/nom.-s.cp. 41,975 1,968,628 2.38EUR 1,391,018Greece
1,968,628 2.381,391,018
(expressed in EUR)Cost Evaluation % net
assetsCurrencyDescription
DANSKE FUND
as at December 31, 2007
Statement of Investments
The accompanying notes form an integral part of these financial statements.
Quantity
DANSKE FUND - STOCKPICKING
* See note 13 for more details
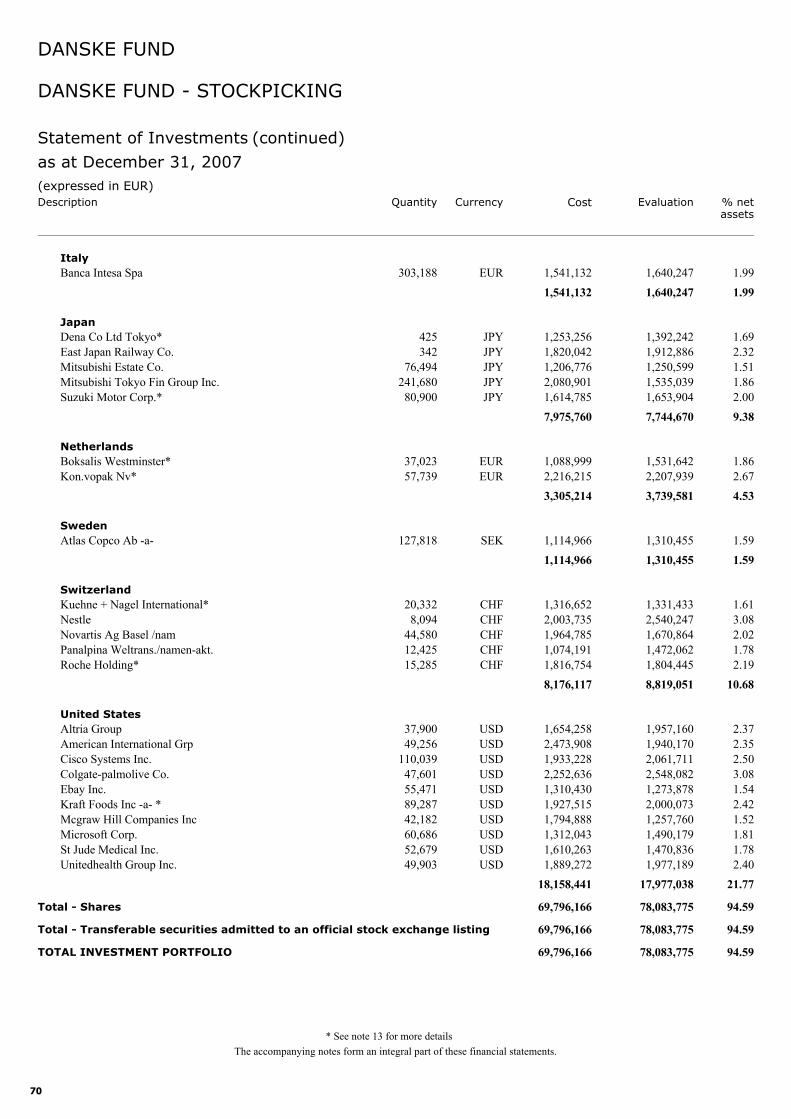
70
Banca Intesa Spa 303,188 1,640,247 1.99EUR 1,541,132Italy
1,640,247 1.991,541,132
Dena Co Ltd Tokyo* 425 1,392,242 1.69JPY 1,253,256Japan
East Japan Railway Co. 342 1,912,886 2.32JPY 1,820,042Mitsubishi Estate Co. 76,494 1,250,599 1.51JPY 1,206,776Mitsubishi Tokyo Fin Group Inc. 241,680 1,535,039 1.86JPY 2,080,901Suzuki Motor Corp.* 80,900 1,653,904 2.00JPY 1,614,785
7,744,670 9.387,975,760
Boksalis Westminster* 37,023 1,531,642 1.86EUR 1,088,999Netherlands
Kon.vopak Nv* 57,739 2,207,939 2.67EUR 2,216,2153,739,581 4.533,305,214
Atlas Copco Ab -a- 127,818 1,310,455 1.59SEK 1,114,966Sweden
1,310,455 1.591,114,966
Kuehne + Nagel International* 20,332 1,331,433 1.61CHF 1,316,652Switzerland
Nestle 8,094 2,540,247 3.08CHF 2,003,735Novartis Ag Basel /nam 44,580 1,670,864 2.02CHF 1,964,785Panalpina Weltrans./namen-akt. 12,425 1,472,062 1.78CHF 1,074,191Roche Holding* 15,285 1,804,445 2.19CHF 1,816,754
8,819,051 10.688,176,117
Altria Group 37,900 1,957,160 2.37USD 1,654,258United States
American International Grp 49,256 1,940,170 2.35USD 2,473,908Cisco Systems Inc. 110,039 2,061,711 2.50USD 1,933,228Colgate-palmolive Co. 47,601 2,548,082 3.08USD 2,252,636Ebay Inc. 55,471 1,273,878 1.54USD 1,310,430Kraft Foods Inc -a- * 89,287 2,000,073 2.42USD 1,927,515Mcgraw Hill Companies Inc 42,182 1,257,760 1.52USD 1,794,888Microsoft Corp. 60,686 1,490,179 1.81USD 1,312,043St Jude Medical Inc. 52,679 1,470,836 1.78USD 1,610,263Unitedhealth Group Inc. 49,903 1,977,189 2.40USD 1,889,272
17,977,038 21.7718,158,441
Total - Shares 78,083,775 94.5969,796,166
Total - Transferable securities admitted to an official stock exchange listing 78,083,775 94.5969,796,166
TOTAL INVESTMENT PORTFOLIO 78,083,775 94.5969,796,166
(expressed in EUR)Cost Evaluation % net
assetsCurrencyDescription
DANSKE FUND
as at December 31, 2007
Statement of Investments (continued)
The accompanying notes form an integral part of these financial statements.
Quantity
DANSKE FUND - STOCKPICKING
* See note 13 for more details
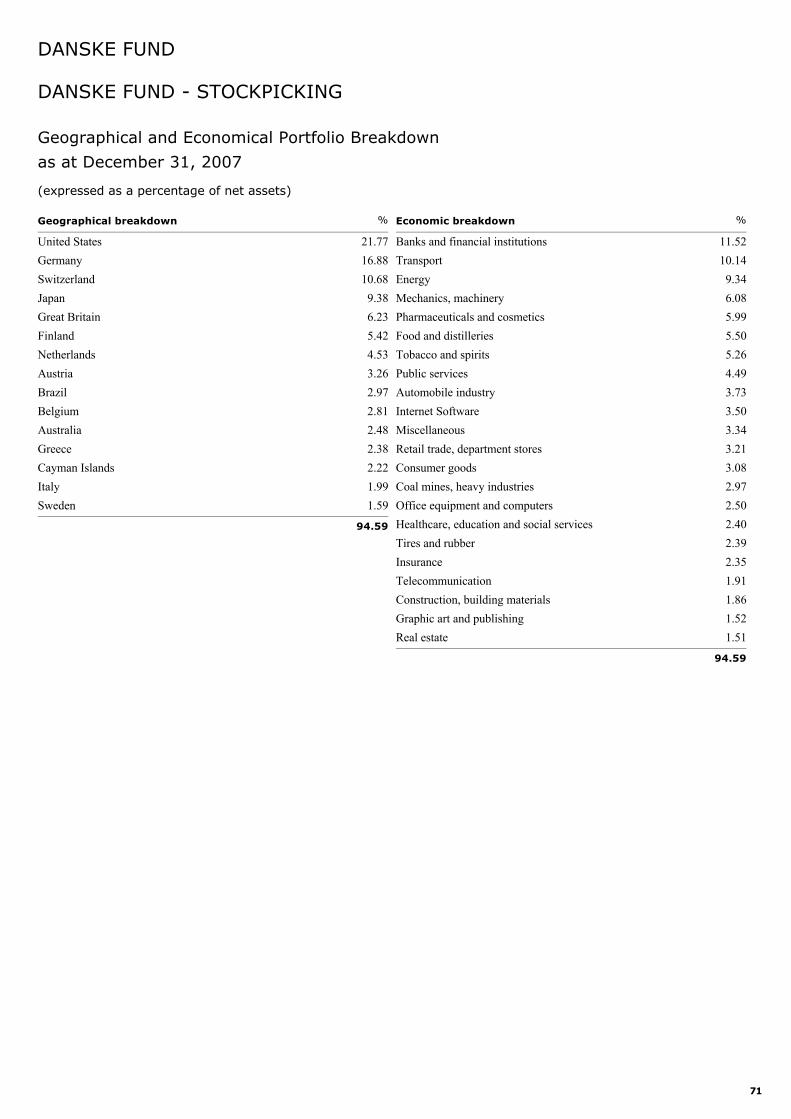
71
United States 21.77Germany 16.88Switzerland 10.68Japan 9.38Great Britain 6.23Finland 5.42Netherlands 4.53Austria 3.26Brazil 2.97Belgium 2.81Australia 2.48Greece 2.38Cayman Islands 2.22Italy 1.99Sweden 1.59
Geographical breakdown %
94.59
Banks and financial institutions 11.52Transport 10.14Energy 9.34Mechanics, machinery 6.08Pharmaceuticals and cosmetics 5.99Food and distilleries 5.50Tobacco and spirits 5.26Public services 4.49Automobile industry 3.73Internet Software 3.50Miscellaneous 3.34Retail trade, department stores 3.21Consumer goods 3.08Coal mines, heavy industries 2.97Office equipment and computers 2.50Healthcare, education and social services 2.40Tires and rubber 2.39Insurance 2.35Telecommunication 1.91Construction, building materials 1.86Graphic art and publishing 1.52Real estate 1.51
Economic breakdown %
94.59
Geographical and Economical Portfolio Breakdown
DANSKE FUND - STOCKPICKING
DANSKE FUND
as at December 31, 2007
(expressed as a percentage of net assets)
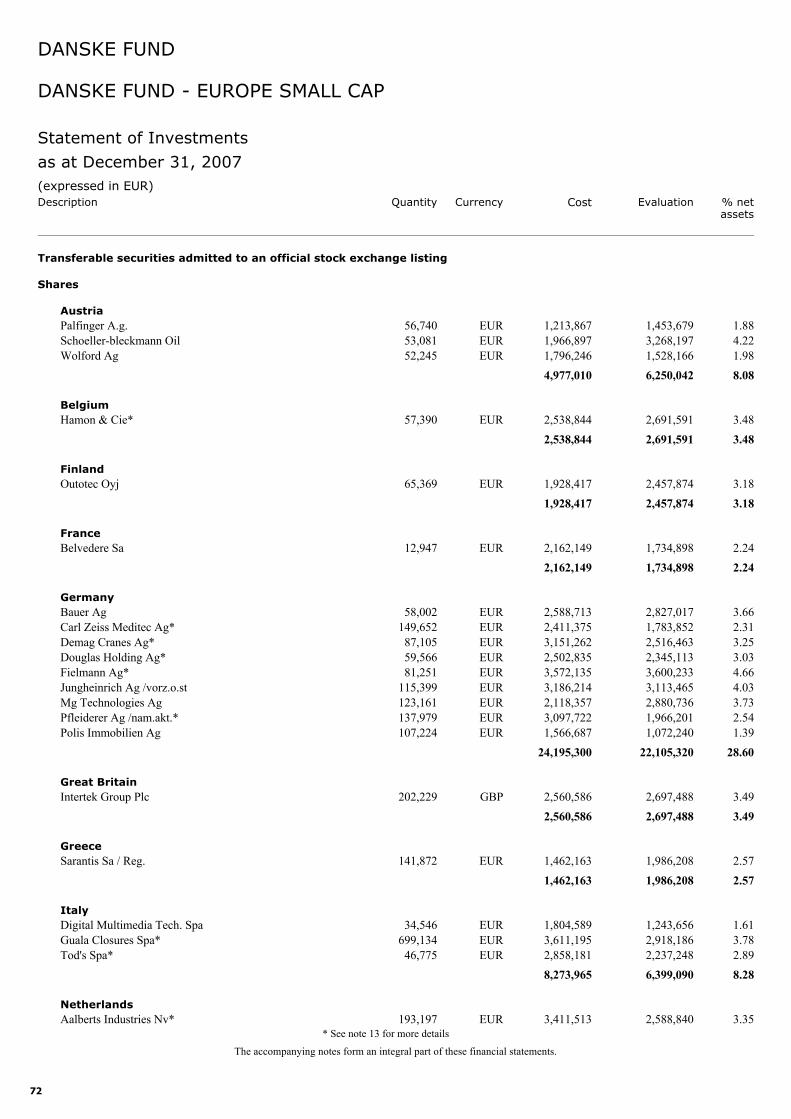
72
Palfinger A.g. 56,740 1,453,679 1.88EUR 1,213,867
Transferable securities admitted to an official stock exchange listing
Shares
Austria
Schoeller-bleckmann Oil 53,081 3,268,197 4.22EUR 1,966,897Wolford Ag 52,245 1,528,166 1.98EUR 1,796,246
6,250,042 8.084,977,010
Hamon & Cie* 57,390 2,691,591 3.48EUR 2,538,844Belgium
2,691,591 3.482,538,844
Outotec Oyj 65,369 2,457,874 3.18EUR 1,928,417Finland
2,457,874 3.181,928,417
Belvedere Sa 12,947 1,734,898 2.24EUR 2,162,149France
1,734,898 2.242,162,149
Bauer Ag 58,002 2,827,017 3.66EUR 2,588,713Germany
Carl Zeiss Meditec Ag* 149,652 1,783,852 2.31EUR 2,411,375Demag Cranes Ag* 87,105 2,516,463 3.25EUR 3,151,262Douglas Holding Ag* 59,566 2,345,113 3.03EUR 2,502,835Fielmann Ag* 81,251 3,600,233 4.66EUR 3,572,135Jungheinrich Ag /vorz.o.st 115,399 3,113,465 4.03EUR 3,186,214Mg Technologies Ag 123,161 2,880,736 3.73EUR 2,118,357Pfleiderer Ag /nam.akt.* 137,979 1,966,201 2.54EUR 3,097,722Polis Immobilien Ag 107,224 1,072,240 1.39EUR 1,566,687
22,105,320 28.6024,195,300
Intertek Group Plc 202,229 2,697,488 3.49GBP 2,560,586Great Britain
2,697,488 3.492,560,586
Sarantis Sa / Reg. 141,872 1,986,208 2.57EUR 1,462,163Greece
1,986,208 2.571,462,163
Digital Multimedia Tech. Spa 34,546 1,243,656 1.61EUR 1,804,589Italy
Guala Closures Spa* 699,134 2,918,186 3.78EUR 3,611,195Tod's Spa* 46,775 2,237,248 2.89EUR 2,858,181
6,399,090 8.288,273,965
Aalberts Industries Nv* 193,197 2,588,840 3.35EUR 3,411,513Netherlands
(expressed in EUR)Cost Evaluation % net
assetsCurrencyDescription
DANSKE FUND
as at December 31, 2007
Statement of Investments
The accompanying notes form an integral part of these financial statements.
Quantity
DANSKE FUND - EUROPE SMALL CAP
* See note 13 for more details
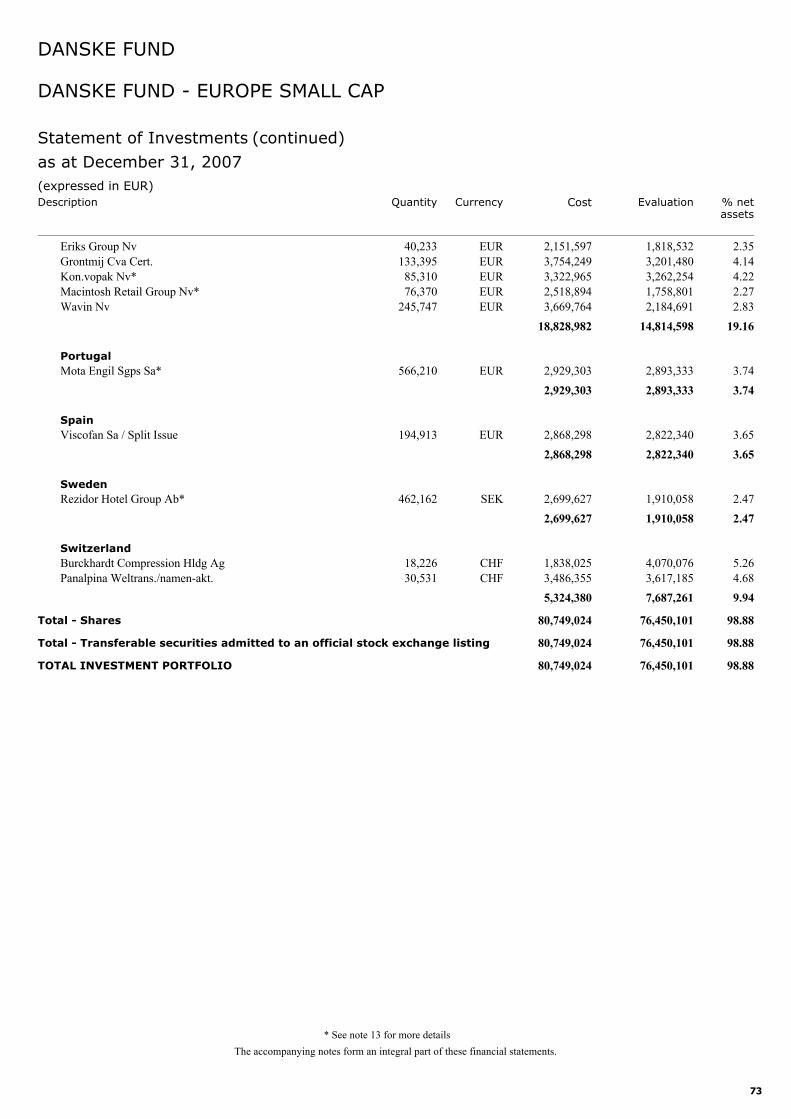
73
Eriks Group Nv 40,233 1,818,532 2.35EUR 2,151,597Grontmij Cva Cert. 133,395 3,201,480 4.14EUR 3,754,249Kon.vopak Nv* 85,310 3,262,254 4.22EUR 3,322,965Macintosh Retail Group Nv* 76,370 1,758,801 2.27EUR 2,518,894Wavin Nv 245,747 2,184,691 2.83EUR 3,669,764
14,814,598 19.1618,828,982
Mota Engil Sgps Sa* 566,210 2,893,333 3.74EUR 2,929,303Portugal
2,893,333 3.742,929,303
Viscofan Sa / Split Issue 194,913 2,822,340 3.65EUR 2,868,298Spain
2,822,340 3.652,868,298
Rezidor Hotel Group Ab* 462,162 1,910,058 2.47SEK 2,699,627Sweden
1,910,058 2.472,699,627
Burckhardt Compression Hldg Ag 18,226 4,070,076 5.26CHF 1,838,025Switzerland
Panalpina Weltrans./namen-akt. 30,531 3,617,185 4.68CHF 3,486,3557,687,261 9.945,324,380
Total - Shares 76,450,101 98.8880,749,024
Total - Transferable securities admitted to an official stock exchange listing 76,450,101 98.8880,749,024
TOTAL INVESTMENT PORTFOLIO 76,450,101 98.8880,749,024
(expressed in EUR)Cost Evaluation % net
assetsCurrencyDescription
DANSKE FUND
as at December 31, 2007
Statement of Investments (continued)
The accompanying notes form an integral part of these financial statements.
Quantity
DANSKE FUND - EUROPE SMALL CAP
* See note 13 for more details
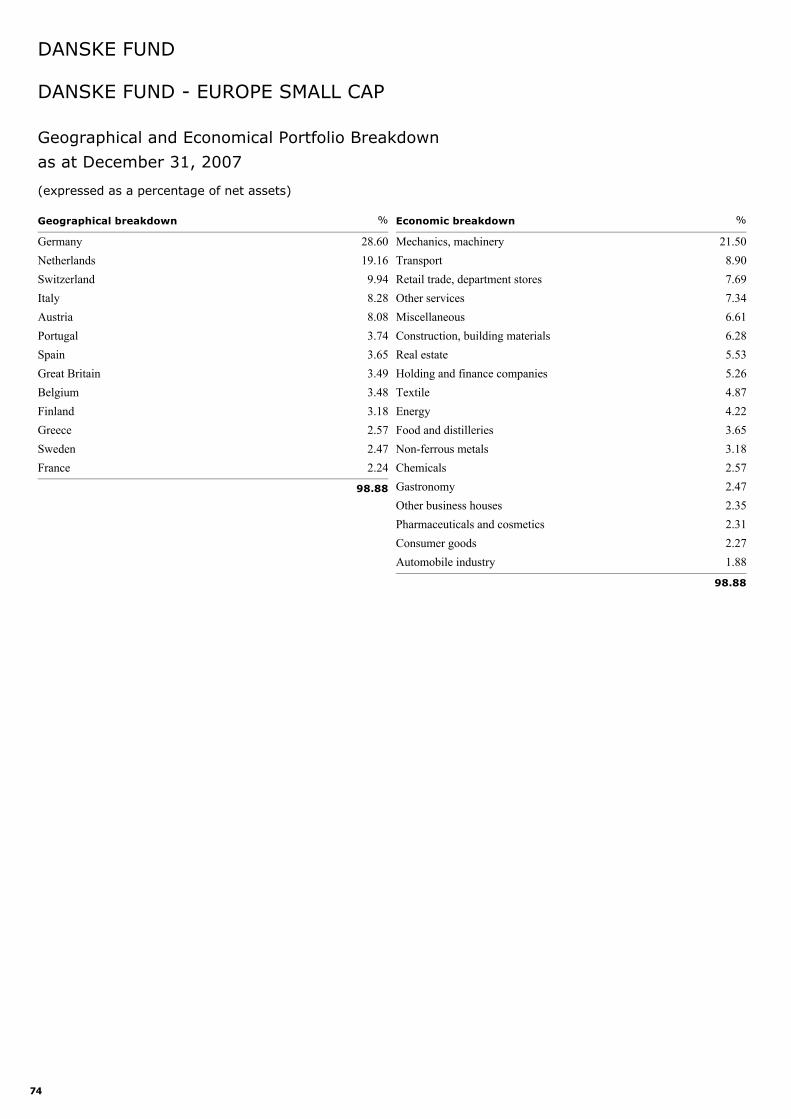
74
Germany 28.60Netherlands 19.16Switzerland 9.94Italy 8.28Austria 8.08Portugal 3.74Spain 3.65Great Britain 3.49Belgium 3.48Finland 3.18Greece 2.57Sweden 2.47France 2.24
Geographical breakdown %
98.88
Mechanics, machinery 21.50Transport 8.90Retail trade, department stores 7.69Other services 7.34Miscellaneous 6.61Construction, building materials 6.28Real estate 5.53Holding and finance companies 5.26Textile 4.87Energy 4.22Food and distilleries 3.65Non-ferrous metals 3.18Chemicals 2.57Gastronomy 2.47Other business houses 2.35Pharmaceuticals and cosmetics 2.31Consumer goods 2.27Automobile industry 1.88
Economic breakdown %
98.88
Geographical and Economical Portfolio Breakdown
DANSKE FUND - EUROPE SMALL CAP
DANSKE FUND
as at December 31, 2007
(expressed as a percentage of net assets)
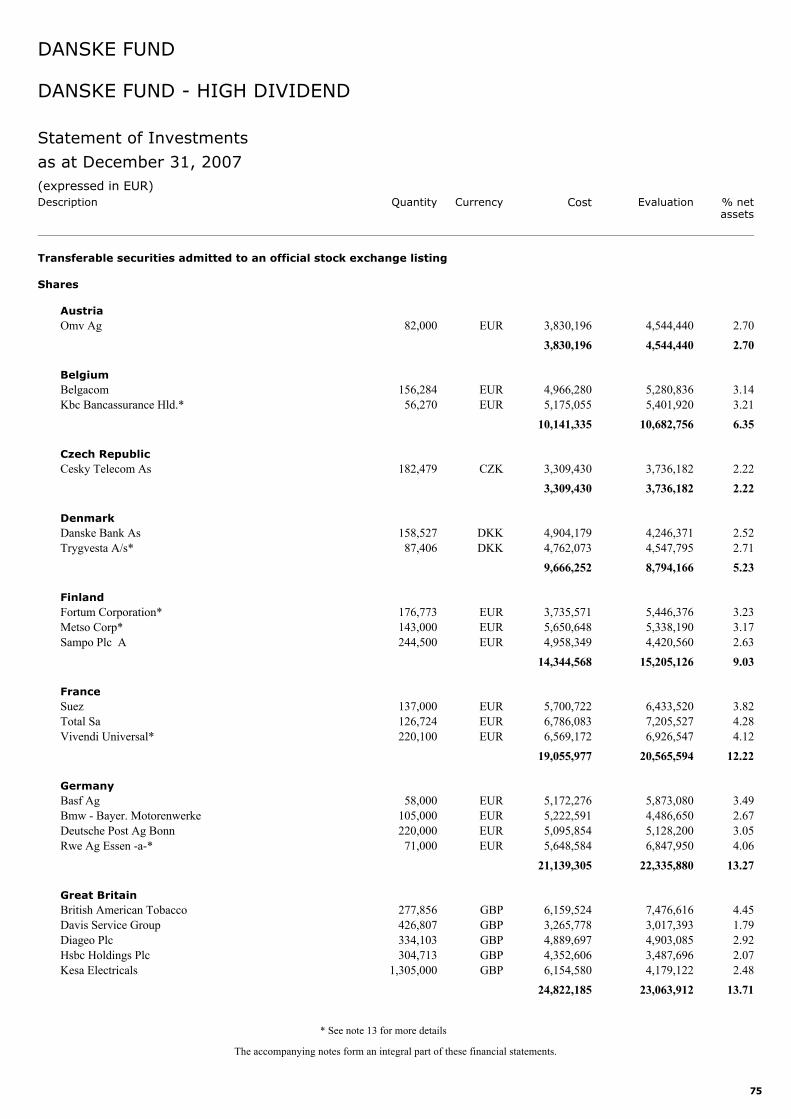
75
Omv Ag 82,000 4,544,440 2.70EUR 3,830,196
Transferable securities admitted to an official stock exchange listing
Shares
Austria
4,544,440 2.703,830,196
Belgacom 156,284 5,280,836 3.14EUR 4,966,280Belgium
Kbc Bancassurance Hld.* 56,270 5,401,920 3.21EUR 5,175,05510,682,756 6.3510,141,335
Cesky Telecom As 182,479 3,736,182 2.22CZK 3,309,430Czech Republic
3,736,182 2.223,309,430
Danske Bank As 158,527 4,246,371 2.52DKK 4,904,179Denmark
Trygvesta A/s* 87,406 4,547,795 2.71DKK 4,762,0738,794,166 5.239,666,252
Fortum Corporation* 176,773 5,446,376 3.23EUR 3,735,571Finland
Metso Corp* 143,000 5,338,190 3.17EUR 5,650,648Sampo Plc A 244,500 4,420,560 2.63EUR 4,958,349
15,205,126 9.0314,344,568
Suez 137,000 6,433,520 3.82EUR 5,700,722France
Total Sa 126,724 7,205,527 4.28EUR 6,786,083Vivendi Universal* 220,100 6,926,547 4.12EUR 6,569,172
20,565,594 12.2219,055,977
Basf Ag 58,000 5,873,080 3.49EUR 5,172,276Germany
Bmw - Bayer. Motorenwerke 105,000 4,486,650 2.67EUR 5,222,591Deutsche Post Ag Bonn 220,000 5,128,200 3.05EUR 5,095,854Rwe Ag Essen -a-* 71,000 6,847,950 4.06EUR 5,648,584
22,335,880 13.2721,139,305
British American Tobacco 277,856 7,476,616 4.45GBP 6,159,524Great Britain
Davis Service Group 426,807 3,017,393 1.79GBP 3,265,778Diageo Plc 334,103 4,903,085 2.92GBP 4,889,697Hsbc Holdings Plc 304,713 3,487,696 2.07GBP 4,352,606Kesa Electricals 1,305,000 4,179,122 2.48GBP 6,154,580
23,063,912 13.7124,822,185
(expressed in EUR)Cost Evaluation % net
assetsCurrencyDescription
DANSKE FUND
as at December 31, 2007
Statement of Investments
The accompanying notes form an integral part of these financial statements.
Quantity
DANSKE FUND - HIGH DIVIDEND
* See note 13 for more details
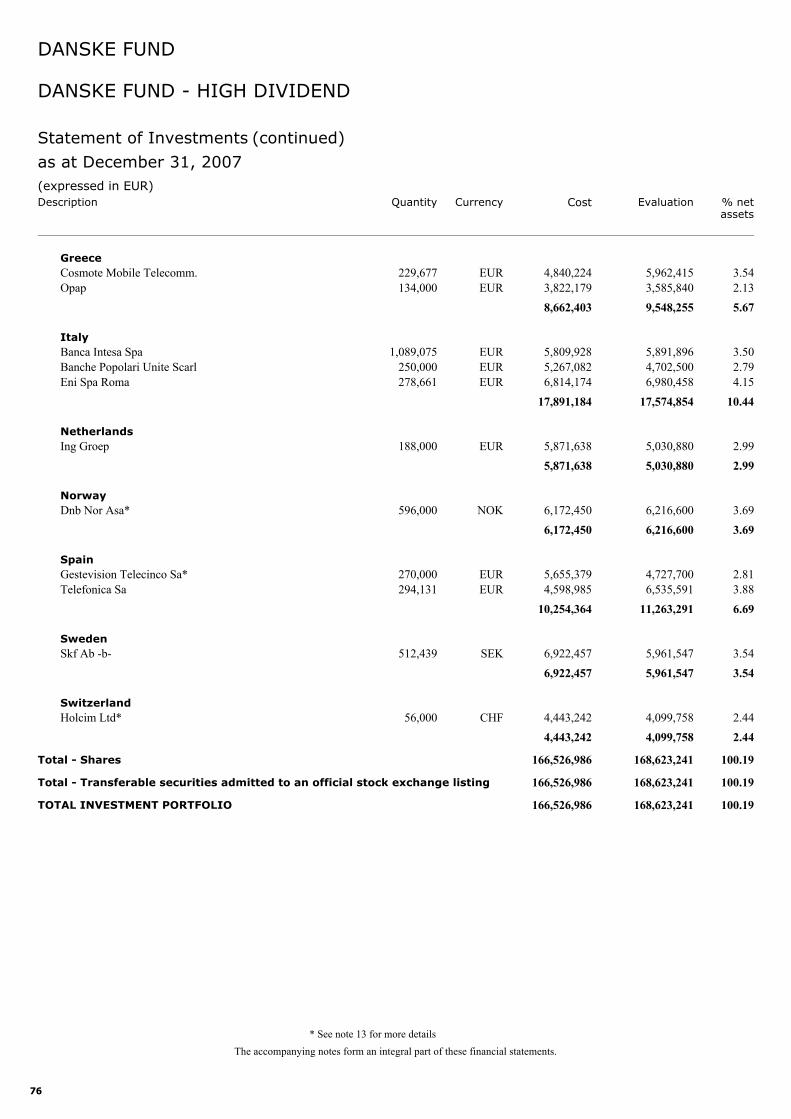
76
Cosmote Mobile Telecomm. 229,677 5,962,415 3.54EUR 4,840,224Greece
Opap 134,000 3,585,840 2.13EUR 3,822,1799,548,255 5.678,662,403
Banca Intesa Spa 1,089,075 5,891,896 3.50EUR 5,809,928Italy
Banche Popolari Unite Scarl 250,000 4,702,500 2.79EUR 5,267,082Eni Spa Roma 278,661 6,980,458 4.15EUR 6,814,174
17,574,854 10.4417,891,184
Ing Groep 188,000 5,030,880 2.99EUR 5,871,638Netherlands
5,030,880 2.995,871,638
Dnb Nor Asa* 596,000 6,216,600 3.69NOK 6,172,450Norway
6,216,600 3.696,172,450
Gestevision Telecinco Sa* 270,000 4,727,700 2.81EUR 5,655,379Spain
Telefonica Sa 294,131 6,535,591 3.88EUR 4,598,98511,263,291 6.6910,254,364
Skf Ab -b- 512,439 5,961,547 3.54SEK 6,922,457Sweden
5,961,547 3.546,922,457
Holcim Ltd* 56,000 4,099,758 2.44CHF 4,443,242Switzerland
4,099,758 2.444,443,242
Total - Shares 168,623,241 100.19166,526,986
Total - Transferable securities admitted to an official stock exchange listing 168,623,241 100.19166,526,986
TOTAL INVESTMENT PORTFOLIO 168,623,241 100.19166,526,986
(expressed in EUR)Cost Evaluation % net
assetsCurrencyDescription
DANSKE FUND
as at December 31, 2007
Statement of Investments (continued)
The accompanying notes form an integral part of these financial statements.
Quantity
DANSKE FUND - HIGH DIVIDEND
* See note 13 for more details
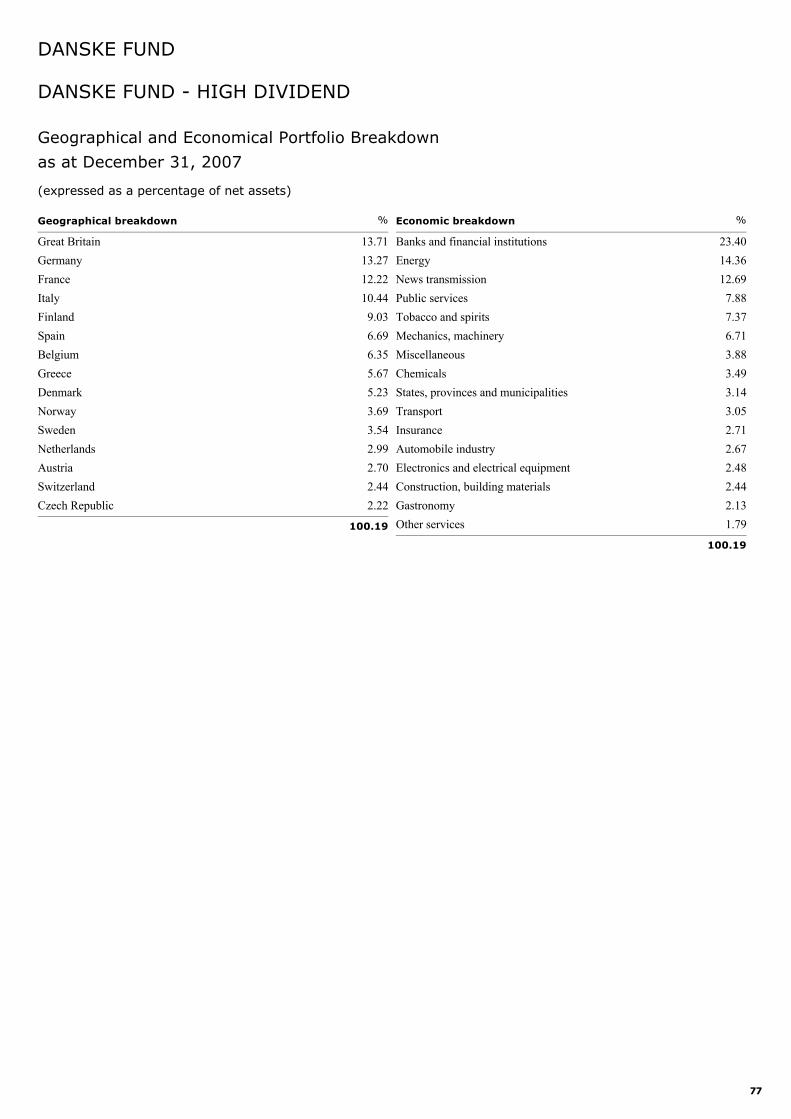
77
Great Britain 13.71Germany 13.27France 12.22Italy 10.44Finland 9.03Spain 6.69Belgium 6.35Greece 5.67Denmark 5.23Norway 3.69Sweden 3.54Netherlands 2.99Austria 2.70Switzerland 2.44Czech Republic 2.22
Geographical breakdown %
100.19
Banks and financial institutions 23.40Energy 14.36News transmission 12.69Public services 7.88Tobacco and spirits 7.37Mechanics, machinery 6.71Miscellaneous 3.88Chemicals 3.49States, provinces and municipalities 3.14Transport 3.05Insurance 2.71Automobile industry 2.67Electronics and electrical equipment 2.48Construction, building materials 2.44Gastronomy 2.13Other services 1.79
Economic breakdown %
100.19
Geographical and Economical Portfolio Breakdown
DANSKE FUND - HIGH DIVIDEND
DANSKE FUND
as at December 31, 2007
(expressed as a percentage of net assets)
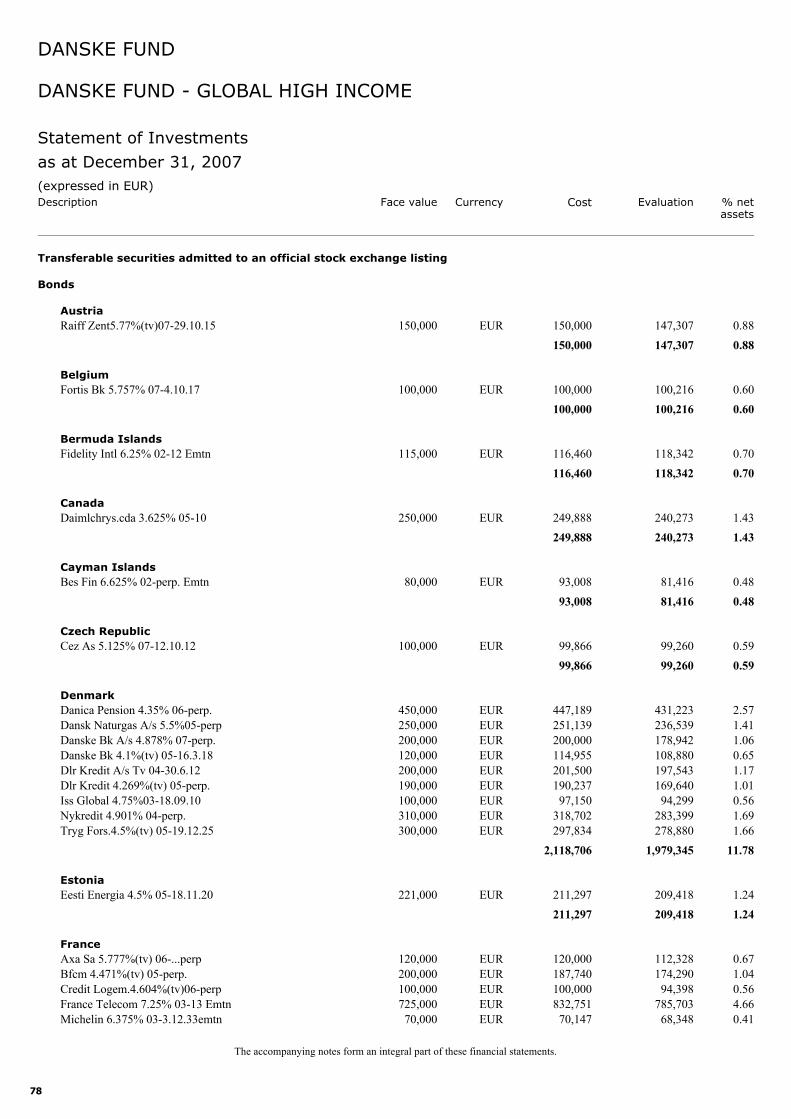
78
Raiff Zent5.77%(tv)07-29.10.15 150,000 147,307 0.88EUR 150,000
Transferable securities admitted to an official stock exchange listing
Bonds
Austria
147,307 0.88150,000
Fortis Bk 5.757% 07-4.10.17 100,000 100,216 0.60EUR 100,000Belgium
100,216 0.60100,000
Fidelity Intl 6.25% 02-12 Emtn 115,000 118,342 0.70EUR 116,460Bermuda Islands
118,342 0.70116,460
Daimlchrys.cda 3.625% 05-10 250,000 240,273 1.43EUR 249,888Canada
240,273 1.43249,888
Bes Fin 6.625% 02-perp. Emtn 80,000 81,416 0.48EUR 93,008Cayman Islands
81,416 0.4893,008
Cez As 5.125% 07-12.10.12 100,000 99,260 0.59EUR 99,866Czech Republic
99,260 0.5999,866
Danica Pension 4.35% 06-perp. 450,000 431,223 2.57EUR 447,189Denmark
Dansk Naturgas A/s 5.5%05-perp 250,000 236,539 1.41EUR 251,139Danske Bk A/s 4.878% 07-perp. 200,000 178,942 1.06EUR 200,000Danske Bk 4.1%(tv) 05-16.3.18 120,000 108,880 0.65EUR 114,955Dlr Kredit A/s Tv 04-30.6.12 200,000 197,543 1.17EUR 201,500Dlr Kredit 4.269%(tv) 05-perp. 190,000 169,640 1.01EUR 190,237Iss Global 4.75%03-18.09.10 100,000 94,299 0.56EUR 97,150Nykredit 4.901% 04-perp. 310,000 283,399 1.69EUR 318,702Tryg Fors.4.5%(tv) 05-19.12.25 300,000 278,880 1.66EUR 297,834
1,979,345 11.782,118,706
Eesti Energia 4.5% 05-18.11.20 221,000 209,418 1.24EUR 211,297Estonia
209,418 1.24211,297
Axa Sa 5.777%(tv) 06-...perp 120,000 112,328 0.67EUR 120,000France
Bfcm 4.471%(tv) 05-perp. 200,000 174,290 1.04EUR 187,740Credit Logem.4.604%(tv)06-perp 100,000 94,398 0.56EUR 100,000France Telecom 7.25% 03-13 Emtn 725,000 785,703 4.66EUR 832,751Michelin 6.375% 03-3.12.33emtn 70,000 68,348 0.41EUR 70,147
(expressed in EUR)Cost Evaluation % net
assetsCurrencyDescription
DANSKE FUND
as at December 31, 2007
Statement of Investments
The accompanying notes form an integral part of these financial statements.
Face value
DANSKE FUND - GLOBAL HIGH INCOME
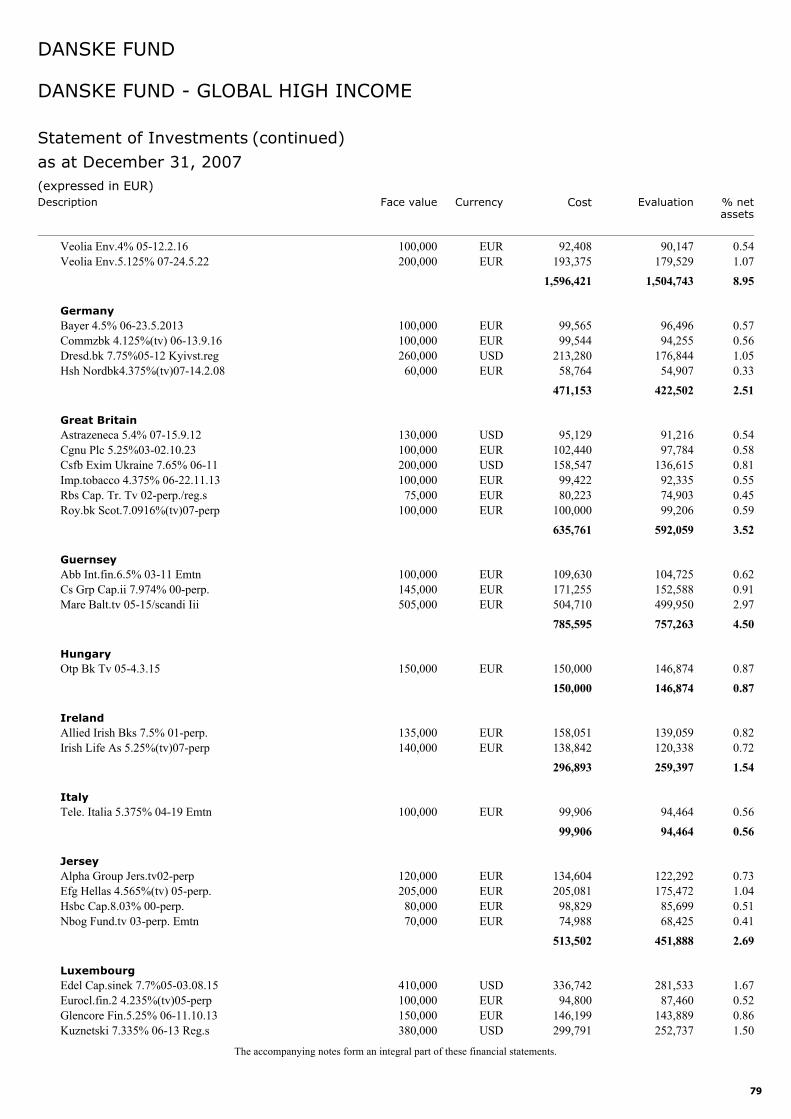
79
Veolia Env.4% 05-12.2.16 100,000 90,147 0.54EUR 92,408Veolia Env.5.125% 07-24.5.22 200,000 179,529 1.07EUR 193,375
1,504,743 8.951,596,421
Bayer 4.5% 06-23.5.2013 100,000 96,496 0.57EUR 99,565Germany
Commzbk 4.125%(tv) 06-13.9.16 100,000 94,255 0.56EUR 99,544Dresd.bk 7.75%05-12 Kyivst.reg 260,000 176,844 1.05USD 213,280Hsh Nordbk4.375%(tv)07-14.2.08 60,000 54,907 0.33EUR 58,764
422,502 2.51471,153
Astrazeneca 5.4% 07-15.9.12 130,000 91,216 0.54USD 95,129Great Britain
Cgnu Plc 5.25%03-02.10.23 100,000 97,784 0.58EUR 102,440Csfb Exim Ukraine 7.65% 06-11 200,000 136,615 0.81USD 158,547Imp.tobacco 4.375% 06-22.11.13 100,000 92,335 0.55EUR 99,422Rbs Cap. Tr. Tv 02-perp./reg.s 75,000 74,903 0.45EUR 80,223Roy.bk Scot.7.0916%(tv)07-perp 100,000 99,206 0.59EUR 100,000
592,059 3.52635,761
Abb Int.fin.6.5% 03-11 Emtn 100,000 104,725 0.62EUR 109,630Guernsey
Cs Grp Cap.ii 7.974% 00-perp. 145,000 152,588 0.91EUR 171,255Mare Balt.tv 05-15/scandi Iii 505,000 499,950 2.97EUR 504,710
757,263 4.50785,595
Otp Bk Tv 05-4.3.15 150,000 146,874 0.87EUR 150,000Hungary
146,874 0.87150,000
Allied Irish Bks 7.5% 01-perp. 135,000 139,059 0.82EUR 158,051Ireland
Irish Life As 5.25%(tv)07-perp 140,000 120,338 0.72EUR 138,842259,397 1.54296,893
Tele. Italia 5.375% 04-19 Emtn 100,000 94,464 0.56EUR 99,906Italy
94,464 0.5699,906
Alpha Group Jers.tv02-perp 120,000 122,292 0.73EUR 134,604Jersey
Efg Hellas 4.565%(tv) 05-perp. 205,000 175,472 1.04EUR 205,081Hsbc Cap.8.03% 00-perp. 80,000 85,699 0.51EUR 98,829Nbog Fund.tv 03-perp. Emtn 70,000 68,425 0.41EUR 74,988
451,888 2.69513,502
Edel Cap.sinek 7.7%05-03.08.15 410,000 281,533 1.67USD 336,742Luxembourg
Eurocl.fin.2 4.235%(tv)05-perp 100,000 87,460 0.52EUR 94,800Glencore Fin.5.25% 06-11.10.13 150,000 143,889 0.86EUR 146,199Kuznetski 7.335% 06-13 Reg.s 380,000 252,737 1.50USD 299,791
(expressed in EUR)Cost Evaluation % net
assetsCurrencyDescription
DANSKE FUND
as at December 31, 2007
Statement of Investments (continued)
The accompanying notes form an integral part of these financial statements.
Face value
DANSKE FUND - GLOBAL HIGH INCOME
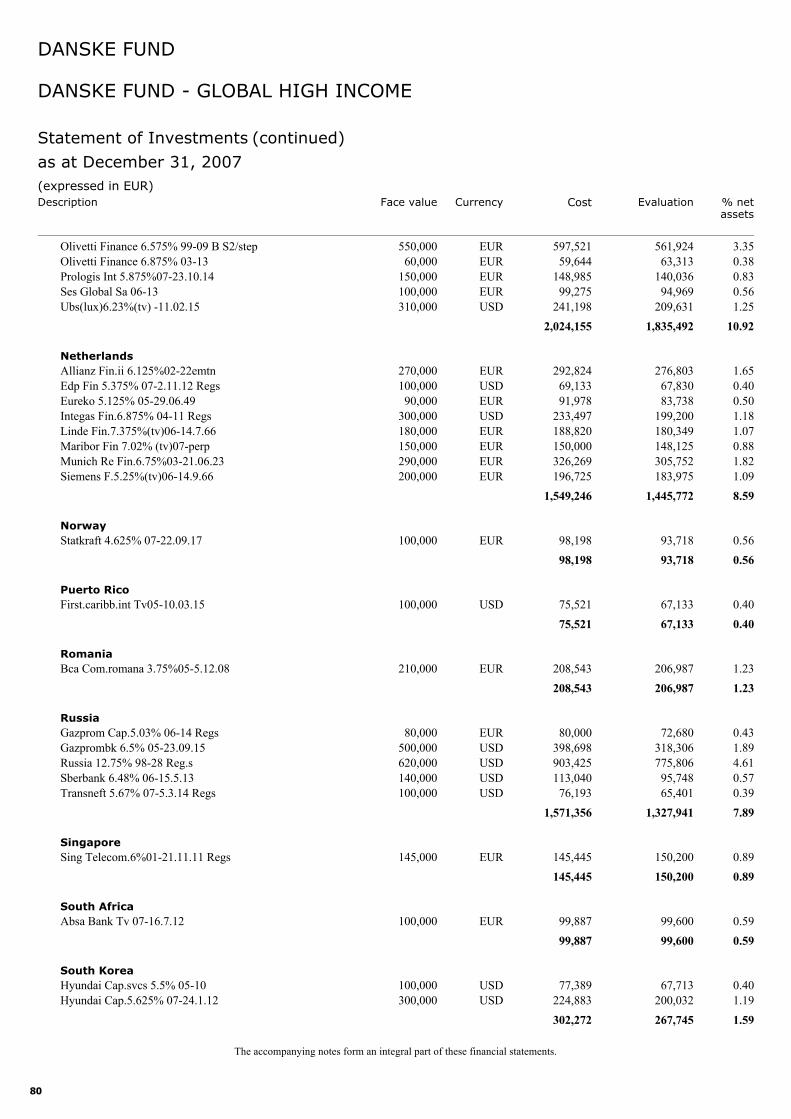
80
Olivetti Finance 6.575% 99-09 B S2/step 550,000 561,924 3.35EUR 597,521Olivetti Finance 6.875% 03-13 60,000 63,313 0.38EUR 59,644Prologis Int 5.875%07-23.10.14 150,000 140,036 0.83EUR 148,985Ses Global Sa 06-13 100,000 94,969 0.56EUR 99,275Ubs(lux)6.23%(tv) -11.02.15 310,000 209,631 1.25USD 241,198
1,835,492 10.922,024,155
Allianz Fin.ii 6.125%02-22emtn 270,000 276,803 1.65EUR 292,824Netherlands
Edp Fin 5.375% 07-2.11.12 Regs 100,000 67,830 0.40USD 69,133Eureko 5.125% 05-29.06.49 90,000 83,738 0.50EUR 91,978Integas Fin.6.875% 04-11 Regs 300,000 199,200 1.18USD 233,497Linde Fin.7.375%(tv)06-14.7.66 180,000 180,349 1.07EUR 188,820Maribor Fin 7.02% (tv)07-perp 150,000 148,125 0.88EUR 150,000Munich Re Fin.6.75%03-21.06.23 290,000 305,752 1.82EUR 326,269Siemens F.5.25%(tv)06-14.9.66 200,000 183,975 1.09EUR 196,725
1,445,772 8.591,549,246
Statkraft 4.625% 07-22.09.17 100,000 93,718 0.56EUR 98,198Norway
93,718 0.5698,198
First.caribb.int Tv05-10.03.15 100,000 67,133 0.40USD 75,521Puerto Rico
67,133 0.4075,521
Bca Com.romana 3.75%05-5.12.08 210,000 206,987 1.23EUR 208,543Romania
206,987 1.23208,543
Gazprom Cap.5.03% 06-14 Regs 80,000 72,680 0.43EUR 80,000Russia
Gazprombk 6.5% 05-23.09.15 500,000 318,306 1.89USD 398,698Russia 12.75% 98-28 Reg.s 620,000 775,806 4.61USD 903,425Sberbank 6.48% 06-15.5.13 140,000 95,748 0.57USD 113,040Transneft 5.67% 07-5.3.14 Regs 100,000 65,401 0.39USD 76,193
1,327,941 7.891,571,356
Sing Telecom.6%01-21.11.11 Regs 145,000 150,200 0.89EUR 145,445Singapore
150,200 0.89145,445
Absa Bank Tv 07-16.7.12 100,000 99,600 0.59EUR 99,887South Africa
99,600 0.5999,887
Hyundai Cap.svcs 5.5% 05-10 100,000 67,713 0.40USD 77,389South Korea
Hyundai Cap.5.625% 07-24.1.12 300,000 200,032 1.19USD 224,883267,745 1.59302,272
(expressed in EUR)Cost Evaluation % net
assetsCurrencyDescription
DANSKE FUND
as at December 31, 2007
Statement of Investments (continued)
The accompanying notes form an integral part of these financial statements.
Face value
DANSKE FUND - GLOBAL HIGH INCOME
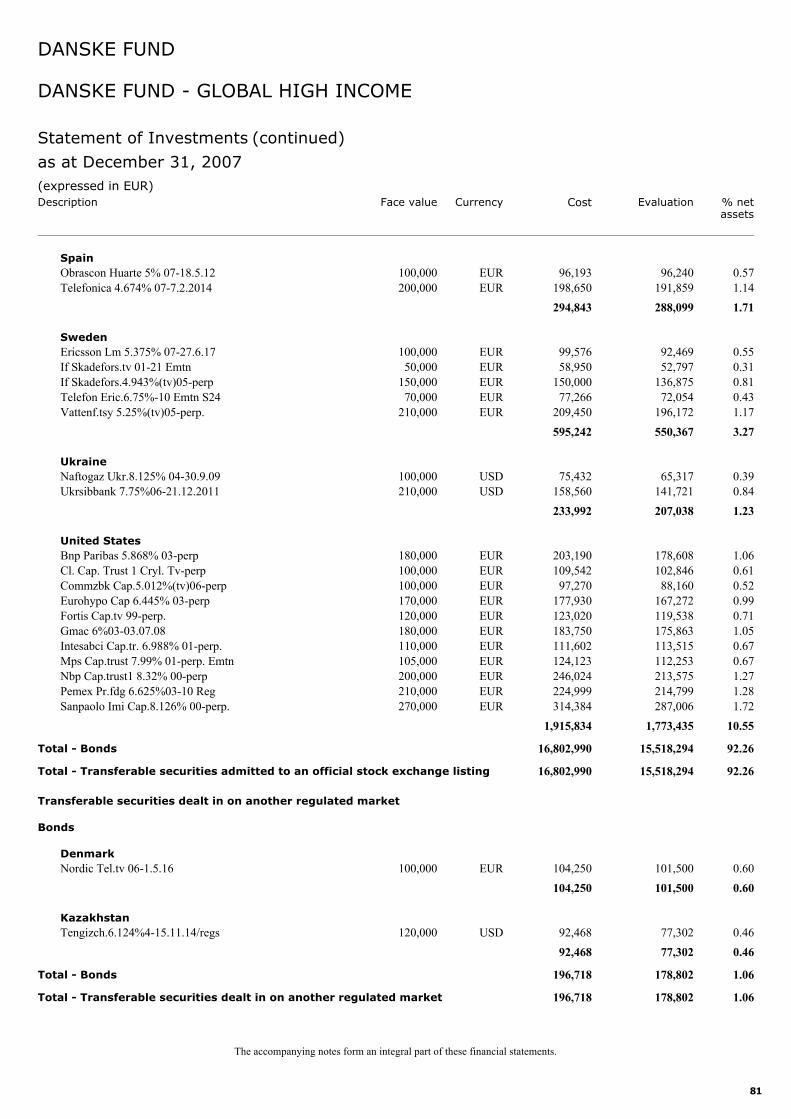
81
Obrascon Huarte 5% 07-18.5.12 100,000 96,240 0.57EUR 96,193Spain
Telefonica 4.674% 07-7.2.2014 200,000 191,859 1.14EUR 198,650288,099 1.71294,843
Ericsson Lm 5.375% 07-27.6.17 100,000 92,469 0.55EUR 99,576Sweden
If Skadefors.tv 01-21 Emtn 50,000 52,797 0.31EUR 58,950If Skadefors.4.943%(tv)05-perp 150,000 136,875 0.81EUR 150,000Telefon Eric.6.75%-10 Emtn S24 70,000 72,054 0.43EUR 77,266Vattenf.tsy 5.25%(tv)05-perp. 210,000 196,172 1.17EUR 209,450
550,367 3.27595,242
Naftogaz Ukr.8.125% 04-30.9.09 100,000 65,317 0.39USD 75,432Ukraine
Ukrsibbank 7.75%06-21.12.2011 210,000 141,721 0.84USD 158,560207,038 1.23233,992
Bnp Paribas 5.868% 03-perp 180,000 178,608 1.06EUR 203,190United States
Cl. Cap. Trust 1 Cryl. Tv-perp 100,000 102,846 0.61EUR 109,542Commzbk Cap.5.012%(tv)06-perp 100,000 88,160 0.52EUR 97,270Eurohypo Cap 6.445% 03-perp 170,000 167,272 0.99EUR 177,930Fortis Cap.tv 99-perp. 120,000 119,538 0.71EUR 123,020Gmac 6%03-03.07.08 180,000 175,863 1.05EUR 183,750Intesabci Cap.tr. 6.988% 01-perp. 110,000 113,515 0.67EUR 111,602Mps Cap.trust 7.99% 01-perp. Emtn 105,000 112,253 0.67EUR 124,123Nbp Cap.trust1 8.32% 00-perp 200,000 213,575 1.27EUR 246,024Pemex Pr.fdg 6.625%03-10 Reg 210,000 214,799 1.28EUR 224,999Sanpaolo Imi Cap.8.126% 00-perp. 270,000 287,006 1.72EUR 314,384
1,773,435 10.551,915,834
Total - Bonds 15,518,294 92.2616,802,990
Total - Transferable securities admitted to an official stock exchange listing 15,518,294 92.2616,802,990
Nordic Tel.tv 06-1.5.16 100,000 101,500 0.60EUR 104,250
Transferable securities dealt in on another regulated market
Bonds
Denmark
101,500 0.60104,250
Tengizch.6.124%4-15.11.14/regs 120,000 77,302 0.46USD 92,468Kazakhstan
77,302 0.4692,468
Total - Bonds 178,802 1.06196,718
Total - Transferable securities dealt in on another regulated market 178,802 1.06196,718
(expressed in EUR)Cost Evaluation % net
assetsCurrencyDescription
DANSKE FUND
as at December 31, 2007
Statement of Investments (continued)
The accompanying notes form an integral part of these financial statements.
Face value
DANSKE FUND - GLOBAL HIGH INCOME
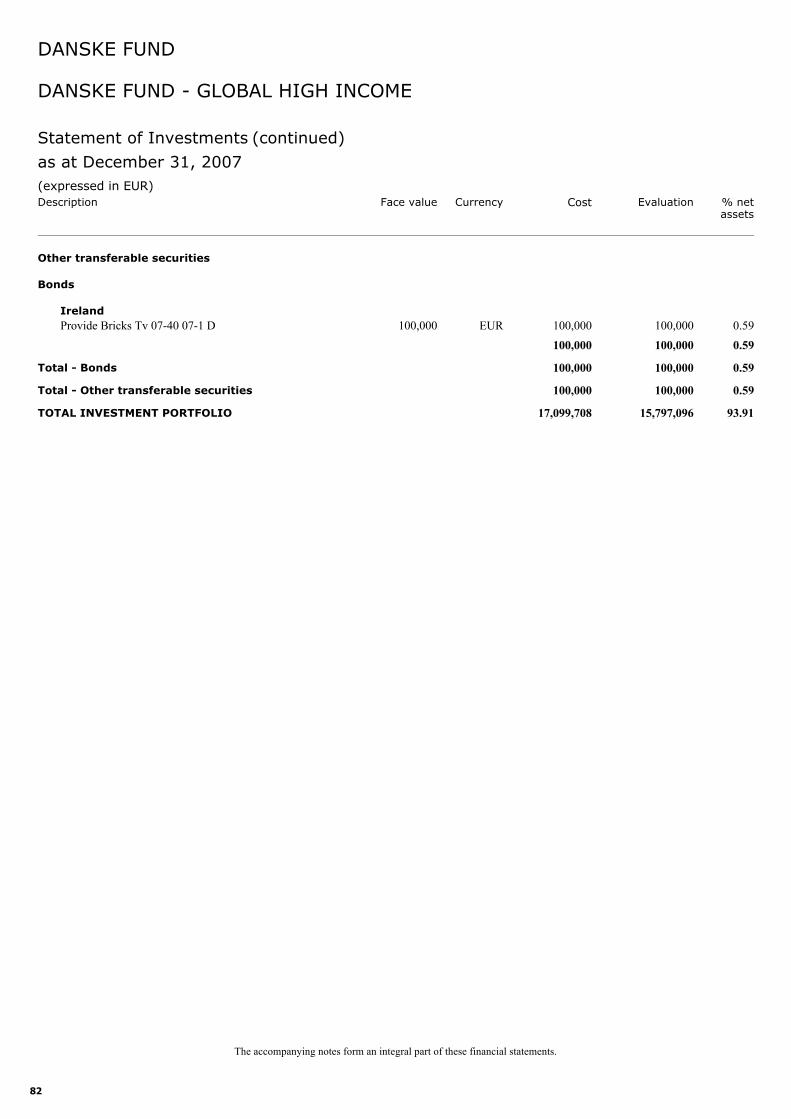
82
Provide Bricks Tv 07-40 07-1 D 100,000 100,000 0.59EUR 100,000
Other transferable securities
Bonds
Ireland
100,000 0.59100,000
Total - Bonds 100,000 0.59100,000
Total - Other transferable securities 100,000 0.59100,000
TOTAL INVESTMENT PORTFOLIO 15,797,096 93.9117,099,708
(expressed in EUR)Cost Evaluation % net
assetsCurrencyDescription
DANSKE FUND
as at December 31, 2007
Statement of Investments (continued)
The accompanying notes form an integral part of these financial statements.
Face value
DANSKE FUND - GLOBAL HIGH INCOME
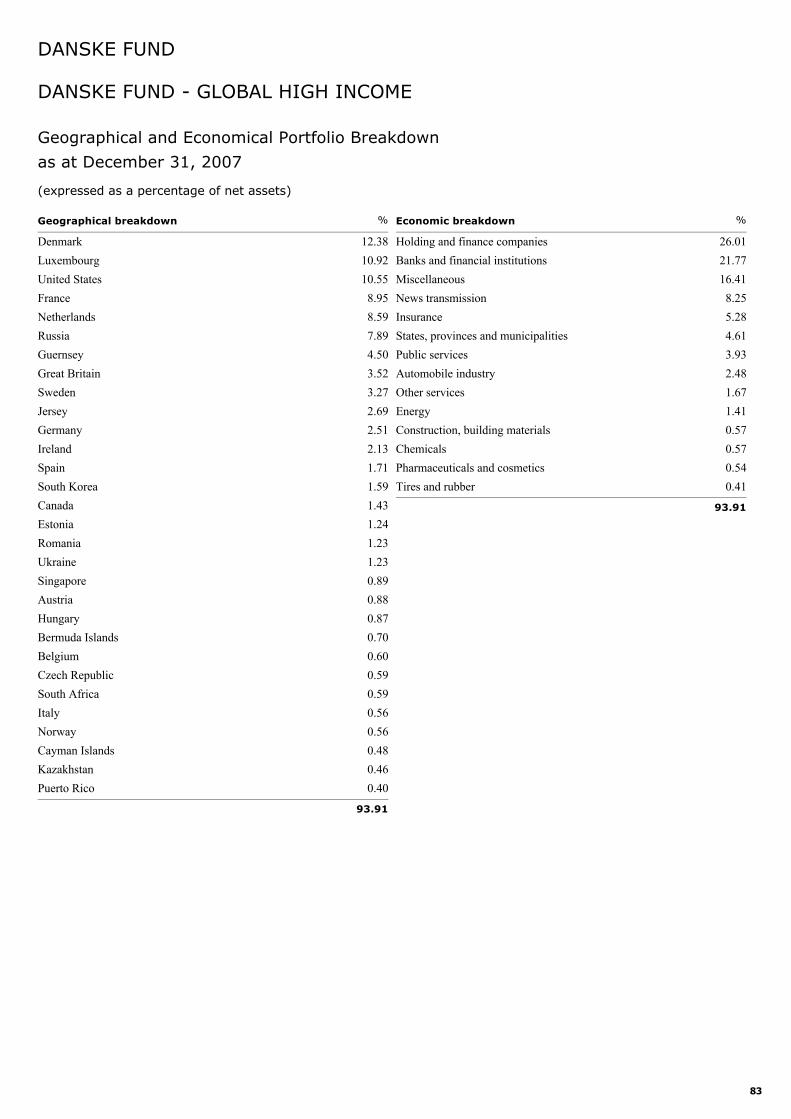
83
Denmark 12.38Luxembourg 10.92United States 10.55France 8.95Netherlands 8.59Russia 7.89Guernsey 4.50Great Britain 3.52Sweden 3.27Jersey 2.69Germany 2.51Ireland 2.13Spain 1.71South Korea 1.59Canada 1.43Estonia 1.24Romania 1.23Ukraine 1.23Singapore 0.89Austria 0.88Hungary 0.87Bermuda Islands 0.70Belgium 0.60Czech Republic 0.59South Africa 0.59Italy 0.56Norway 0.56Cayman Islands 0.48Kazakhstan 0.46Puerto Rico 0.40
Geographical breakdown %
93.91
Holding and finance companies 26.01Banks and financial institutions 21.77Miscellaneous 16.41News transmission 8.25Insurance 5.28States, provinces and municipalities 4.61Public services 3.93Automobile industry 2.48Other services 1.67Energy 1.41Construction, building materials 0.57Chemicals 0.57Pharmaceuticals and cosmetics 0.54Tires and rubber 0.41
Economic breakdown %
93.91
Geographical and Economical Portfolio Breakdown
DANSKE FUND - GLOBAL HIGH INCOME
DANSKE FUND
as at December 31, 2007
(expressed as a percentage of net assets)
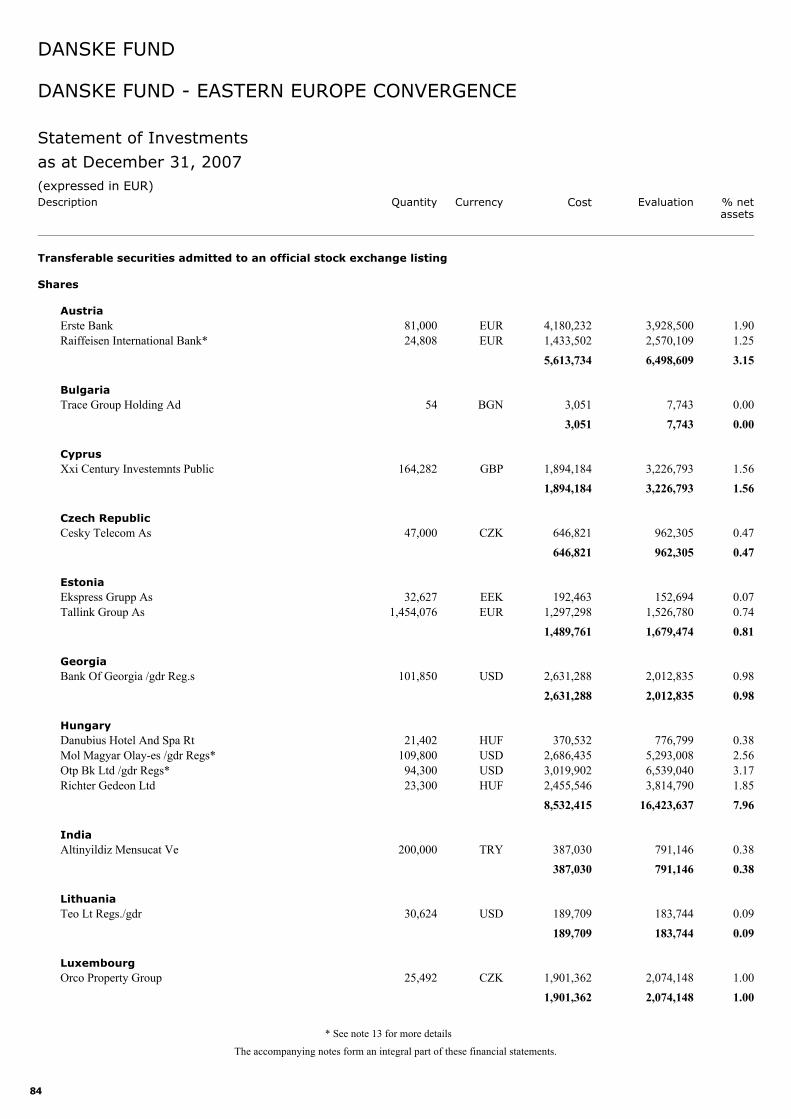
84
Erste Bank 81,000 3,928,500 1.90EUR 4,180,232
Transferable securities admitted to an official stock exchange listing
Shares
Austria
Raiffeisen International Bank* 24,808 2,570,109 1.25EUR 1,433,5026,498,609 3.155,613,734
Trace Group Holding Ad 54 7,743 0.00BGN 3,051Bulgaria
7,743 0.003,051
Xxi Century Investemnts Public 164,282 3,226,793 1.56GBP 1,894,184Cyprus
3,226,793 1.561,894,184
Cesky Telecom As 47,000 962,305 0.47CZK 646,821Czech Republic
962,305 0.47646,821
Ekspress Grupp As 32,627 152,694 0.07EEK 192,463Estonia
Tallink Group As 1,454,076 1,526,780 0.74EUR 1,297,2981,679,474 0.811,489,761
Bank Of Georgia /gdr Reg.s 101,850 2,012,835 0.98USD 2,631,288Georgia
2,012,835 0.982,631,288
Danubius Hotel And Spa Rt 21,402 776,799 0.38HUF 370,532Hungary
Mol Magyar Olay-es /gdr Regs* 109,800 5,293,008 2.56USD 2,686,435Otp Bk Ltd /gdr Regs* 94,300 6,539,040 3.17USD 3,019,902Richter Gedeon Ltd 23,300 3,814,790 1.85HUF 2,455,546
16,423,637 7.968,532,415
Altinyildiz Mensucat Ve 200,000 791,146 0.38TRY 387,030India
791,146 0.38387,030
Teo Lt Regs./gdr 30,624 183,744 0.09USD 189,709Lithuania
183,744 0.09189,709
Orco Property Group 25,492 2,074,148 1.00CZK 1,901,362Luxembourg
2,074,148 1.001,901,362
(expressed in EUR)Cost Evaluation % net
assetsCurrencyDescription
DANSKE FUND
as at December 31, 2007
Statement of Investments
The accompanying notes form an integral part of these financial statements.
Quantity
DANSKE FUND - EASTERN EUROPE CONVERGENCE
* See note 13 for more details
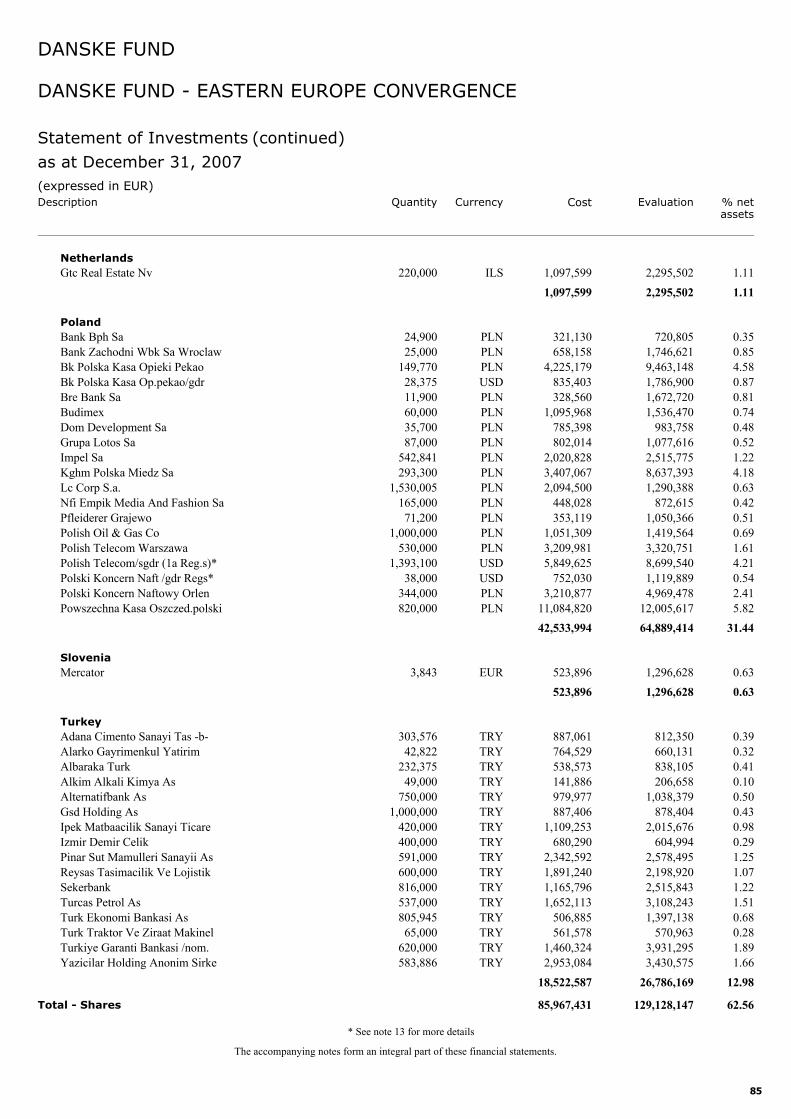
85
Gtc Real Estate Nv 220,000 2,295,502 1.11ILS 1,097,599Netherlands
2,295,502 1.111,097,599
Bank Bph Sa 24,900 720,805 0.35PLN 321,130Poland
Bank Zachodni Wbk Sa Wroclaw 25,000 1,746,621 0.85PLN 658,158Bk Polska Kasa Opieki Pekao 149,770 9,463,148 4.58PLN 4,225,179Bk Polska Kasa Op.pekao/gdr 28,375 1,786,900 0.87USD 835,403Bre Bank Sa 11,900 1,672,720 0.81PLN 328,560Budimex 60,000 1,536,470 0.74PLN 1,095,968Dom Development Sa 35,700 983,758 0.48PLN 785,398Grupa Lotos Sa 87,000 1,077,616 0.52PLN 802,014Impel Sa 542,841 2,515,775 1.22PLN 2,020,828Kghm Polska Miedz Sa 293,300 8,637,393 4.18PLN 3,407,067Lc Corp S.a. 1,530,005 1,290,388 0.63PLN 2,094,500Nfi Empik Media And Fashion Sa 165,000 872,615 0.42PLN 448,028Pfleiderer Grajewo 71,200 1,050,366 0.51PLN 353,119Polish Oil & Gas Co 1,000,000 1,419,564 0.69PLN 1,051,309Polish Telecom Warszawa 530,000 3,320,751 1.61PLN 3,209,981Polish Telecom/sgdr (1a Reg.s)* 1,393,100 8,699,540 4.21USD 5,849,625Polski Koncern Naft /gdr Regs* 38,000 1,119,889 0.54USD 752,030Polski Koncern Naftowy Orlen 344,000 4,969,478 2.41PLN 3,210,877Powszechna Kasa Oszczed.polski 820,000 12,005,617 5.82PLN 11,084,820
64,889,414 31.4442,533,994
Mercator 3,843 1,296,628 0.63EUR 523,896Slovenia
1,296,628 0.63523,896
Adana Cimento Sanayi Tas -b- 303,576 812,350 0.39TRY 887,061Turkey
Alarko Gayrimenkul Yatirim 42,822 660,131 0.32TRY 764,529Albaraka Turk 232,375 838,105 0.41TRY 538,573Alkim Alkali Kimya As 49,000 206,658 0.10TRY 141,886Alternatifbank As 750,000 1,038,379 0.50TRY 979,977Gsd Holding As 1,000,000 878,404 0.43TRY 887,406Ipek Matbaacilik Sanayi Ticare 420,000 2,015,676 0.98TRY 1,109,253Izmir Demir Celik 400,000 604,994 0.29TRY 680,290Pinar Sut Mamulleri Sanayii As 591,000 2,578,495 1.25TRY 2,342,592Reysas Tasimacilik Ve Lojistik 600,000 2,198,920 1.07TRY 1,891,240Sekerbank 816,000 2,515,843 1.22TRY 1,165,796Turcas Petrol As 537,000 3,108,243 1.51TRY 1,652,113Turk Ekonomi Bankasi As 805,945 1,397,138 0.68TRY 506,885Turk Traktor Ve Ziraat Makinel 65,000 570,963 0.28TRY 561,578Turkiye Garanti Bankasi /nom. 620,000 3,931,295 1.89TRY 1,460,324Yazicilar Holding Anonim Sirke 583,886 3,430,575 1.66TRY 2,953,084
26,786,169 12.9818,522,587
Total - Shares 129,128,147 62.5685,967,431
(expressed in EUR)Cost Evaluation % net
assetsCurrencyDescription
DANSKE FUND
as at December 31, 2007
Statement of Investments (continued)
The accompanying notes form an integral part of these financial statements.
Quantity
DANSKE FUND - EASTERN EUROPE CONVERGENCE
* See note 13 for more details
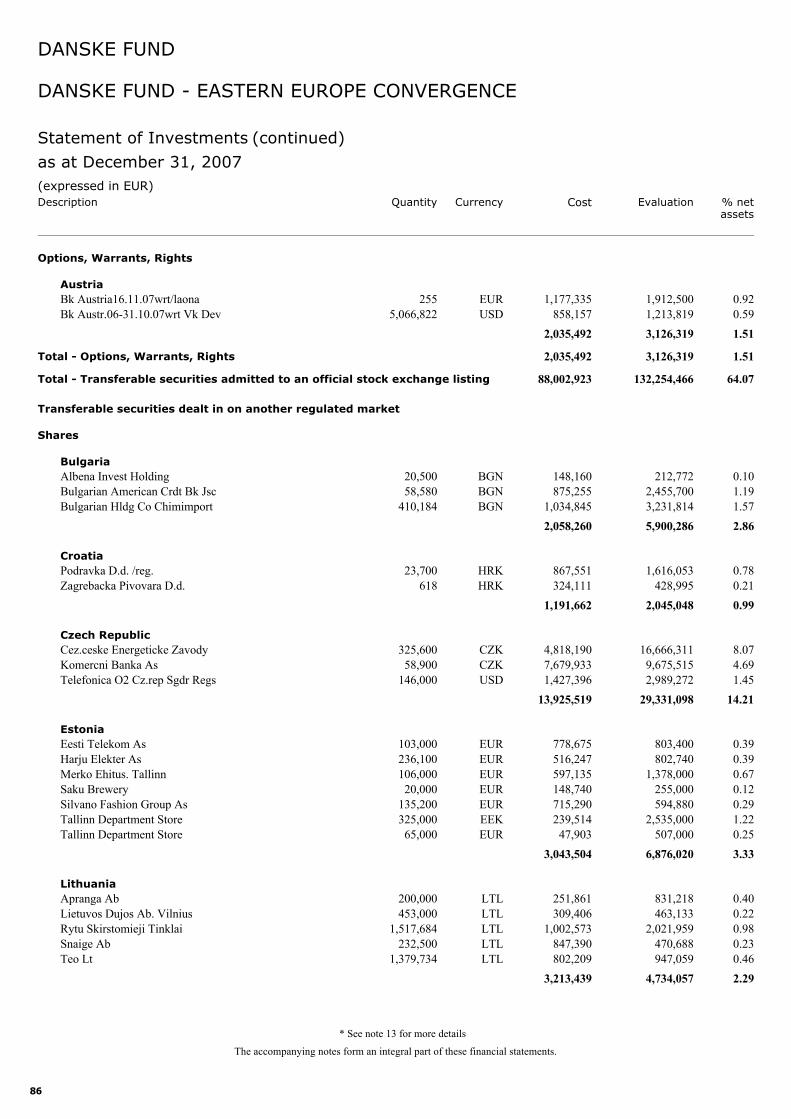
86
Bk Austria16.11.07wrt/laona 255 1,912,500 0.92EUR 1,177,335
Options, Warrants, Rights
Austria
Bk Austr.06-31.10.07wrt Vk Dev 5,066,822 1,213,819 0.59USD 858,1573,126,319 1.512,035,492
Total - Options, Warrants, Rights 3,126,319 1.512,035,492
Total - Transferable securities admitted to an official stock exchange listing 132,254,466 64.0788,002,923
Albena Invest Holding 20,500 212,772 0.10BGN 148,160
Transferable securities dealt in on another regulated market
Shares
Bulgaria
Bulgarian American Crdt Bk Jsc 58,580 2,455,700 1.19BGN 875,255Bulgarian Hldg Co Chimimport 410,184 3,231,814 1.57BGN 1,034,845
5,900,286 2.862,058,260
Podravka D.d. /reg. 23,700 1,616,053 0.78HRK 867,551Croatia
Zagrebacka Pivovara D.d. 618 428,995 0.21HRK 324,1112,045,048 0.991,191,662
Cez.ceske Energeticke Zavody 325,600 16,666,311 8.07CZK 4,818,190Czech Republic
Komercni Banka As 58,900 9,675,515 4.69CZK 7,679,933Telefonica O2 Cz.rep Sgdr Regs 146,000 2,989,272 1.45USD 1,427,396
29,331,098 14.2113,925,519
Eesti Telekom As 103,000 803,400 0.39EUR 778,675Estonia
Harju Elekter As 236,100 802,740 0.39EUR 516,247Merko Ehitus. Tallinn 106,000 1,378,000 0.67EUR 597,135Saku Brewery 20,000 255,000 0.12EUR 148,740Silvano Fashion Group As 135,200 594,880 0.29EUR 715,290Tallinn Department Store 325,000 2,535,000 1.22EEK 239,514Tallinn Department Store 65,000 507,000 0.25EUR 47,903
6,876,020 3.333,043,504
Apranga Ab 200,000 831,218 0.40LTL 251,861Lithuania
Lietuvos Dujos Ab. Vilnius 453,000 463,133 0.22LTL 309,406Rytu Skirstomieji Tinklai 1,517,684 2,021,959 0.98LTL 1,002,573Snaige Ab 232,500 470,688 0.23LTL 847,390Teo Lt 1,379,734 947,059 0.46LTL 802,209
4,734,057 2.293,213,439
(expressed in EUR)Cost Evaluation % net
assetsCurrencyDescription
DANSKE FUND
as at December 31, 2007
Statement of Investments (continued)
The accompanying notes form an integral part of these financial statements.
Quantity
DANSKE FUND - EASTERN EUROPE CONVERGENCE
* See note 13 for more details
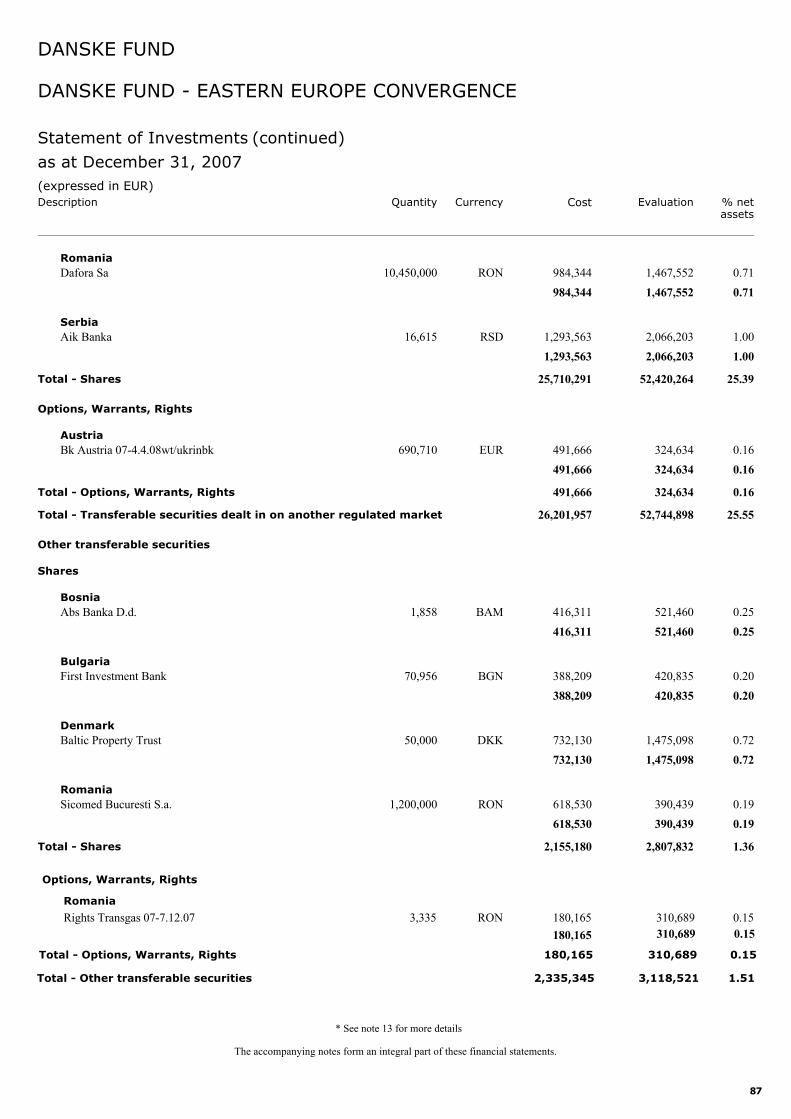
87
Dafora Sa 10,450,000 1,467,552 0.71RON 984,344Romania
1,467,552 0.71984,344
Aik Banka 16,615 2,066,203 1.00RSD 1,293,563Serbia
2,066,203 1.001,293,563
Total - Shares 52,420,264 25.3925,710,291
Bk Austria 07-4.4.08wt/ukrinbk 690,710 324,634 0.16EUR 491,666
Options, Warrants, Rights
Austria
324,634 0.16491,666
Total - Options, Warrants, Rights 324,634 0.16491,666
Total - Transferable securities dealt in on another regulated market 52,744,898 25.5526,201,957
Abs Banka D.d. 1,858 521,460 0.25BAM 416,311
Other transferable securities
Shares
Bosnia
521,460 0.25416,311
First Investment Bank 70,956 420,835 0.20BGN 388,209Bulgaria
420,835 0.20388,209
Baltic Property Trust 50,000 1,475,098 0.72DKK 732,130Denmark
1,475,098 0.72732,130
Sicomed Bucuresti S.a. 1,200,000 390,439 0.19RON 618,530Romania
390,439 0.19618,530
Total - Shares 2,807,832 1.362,155,180
(expressed in EUR)Cost Evaluation % net
assetsCurrencyDescription
DANSKE FUND
as at December 31, 2007
Statement of Investments (continued)
The accompanying notes form an integral part of these financial statements.
Quantity
DANSKE FUND - EASTERN EUROPE CONVERGENCE
Options, Warrants, Rights
Romania
Rights Transgas 07-7.12.07 3,335 RON 180,165 310,689 0.15
180,165 310,689 0.15
Total - Options, Warrants, Rights 180,165 310,689 0.15
Total - Other transferable securities 2,335,345 3,118,521 1.51
* See note 13 for more details
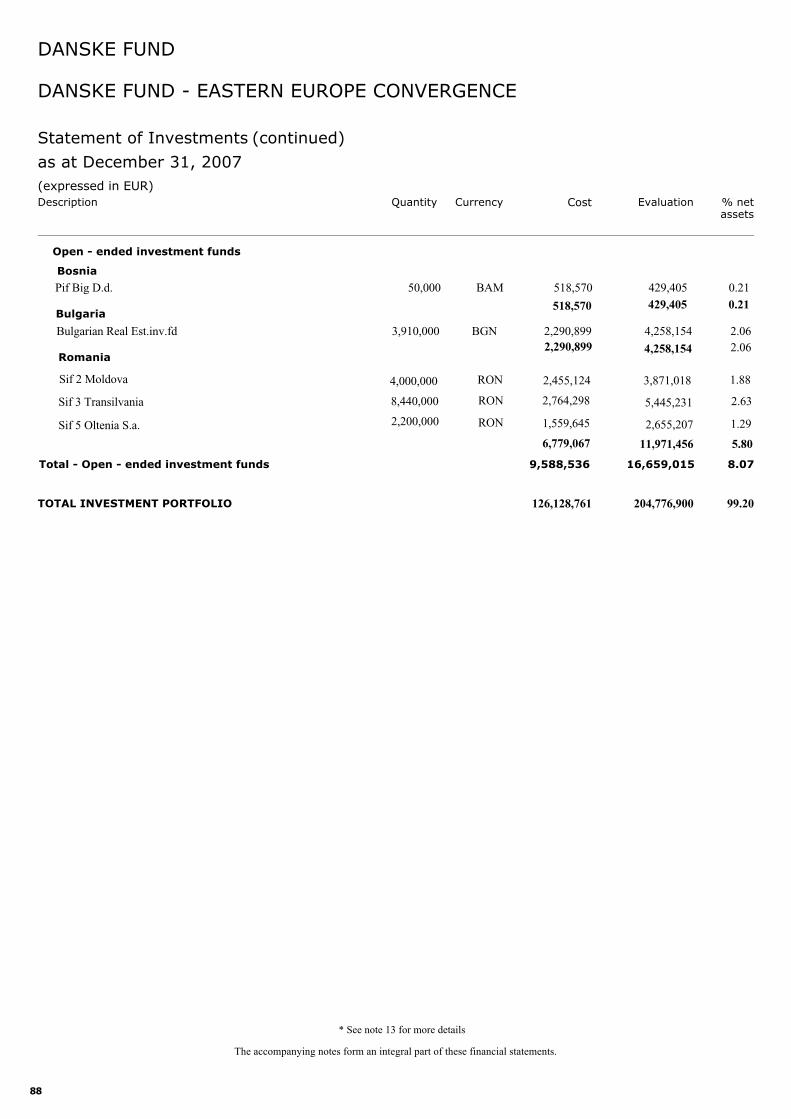
88
TOTAL INVESTMENT PORTFOLIO 204,776,900 99.20126,128,761
(expressed in EUR)Cost Evaluation % net
assetsCurrencyDescription
DANSKE FUND
as at December 31, 2007
Statement of Investments (continued)
The accompanying notes form an integral part of these financial statements.
Quantity
DANSKE FUND - EASTERN EUROPE CONVERGENCE
Open - ended investment funds
Bosnia
Pif Big D.d. 50,000 BAM 518,570 429,405 0.21
518,570 429,405 0.21Bulgaria
Bulgarian Real Est.inv.fd 3,910,000 BGN 2,290,899 4,258,154 2.062,290,899 4,258,154
Total - Open - ended investment funds 9,588,536 16,659,015 8.07
6,779,067 11,971,456 5.80
Sif 5 Oltenia S.a. 1.292,655,207 2,200,000 RON 1,559,645
Sif 3 Transilvania 2.635,445,231 8,440,000 RON 2,764,298
Sif 2 Moldova 1.883,871,018 4,000,000 RON 2,455,124
Romania2.06
* See note 13 for more details
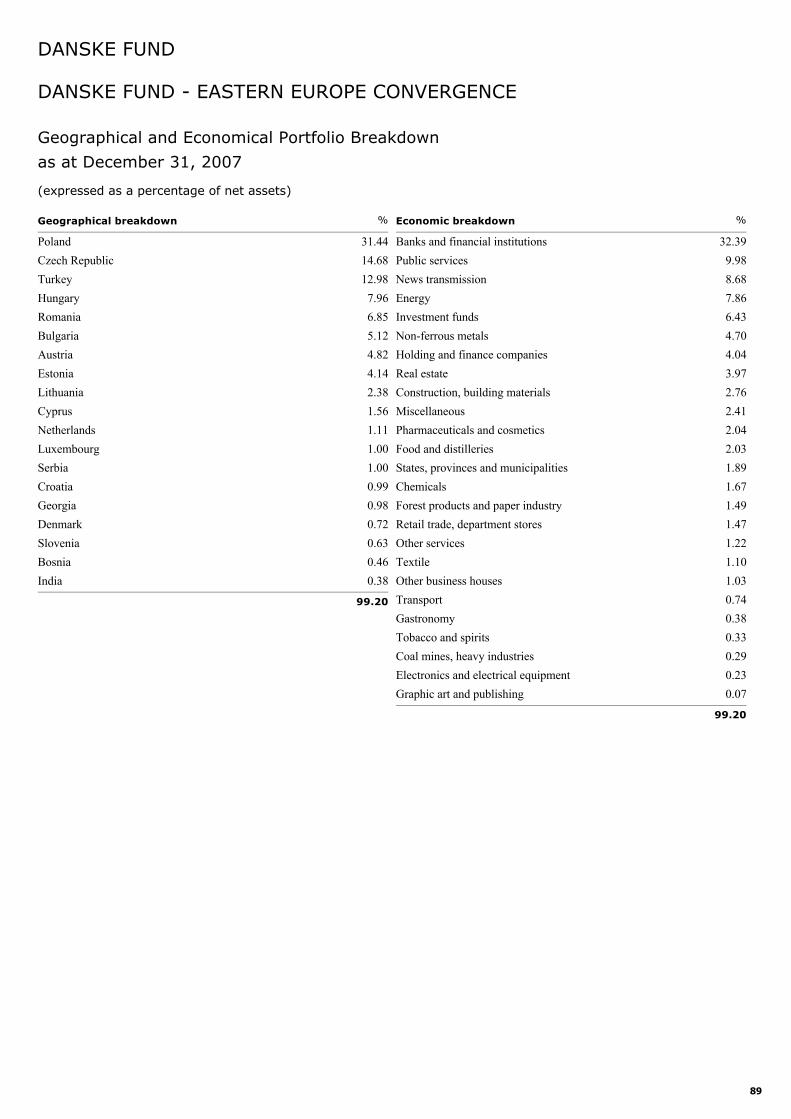
89
Poland 31.44Czech Republic 14.68Turkey 12.98Hungary 7.96Romania 6.85Bulgaria 5.12Austria 4.82Estonia 4.14Lithuania 2.38Cyprus 1.56Netherlands 1.11Luxembourg 1.00Serbia 1.00Croatia 0.99Georgia 0.98Denmark 0.72Slovenia 0.63Bosnia 0.46India 0.38
Geographical breakdown %
99.20
Banks and financial institutions 32.39Public services 9.98News transmission 8.68Energy 7.86Investment funds 6.43Non-ferrous metals 4.70Holding and finance companies 4.04Real estate 3.97Construction, building materials 2.76Miscellaneous 2.41Pharmaceuticals and cosmetics 2.04Food and distilleries 2.03States, provinces and municipalities 1.89Chemicals 1.67Forest products and paper industry 1.49Retail trade, department stores 1.47Other services 1.22Textile 1.10Other business houses 1.03Transport 0.74Gastronomy 0.38Tobacco and spirits 0.33Coal mines, heavy industries 0.29Electronics and electrical equipment 0.23Graphic art and publishing 0.07
Economic breakdown %
99.20
Geographical and Economical Portfolio Breakdown
DANSKE FUND - EASTERN EUROPE CONVERGENCE
DANSKE FUND
as at December 31, 2007
(expressed as a percentage of net assets)
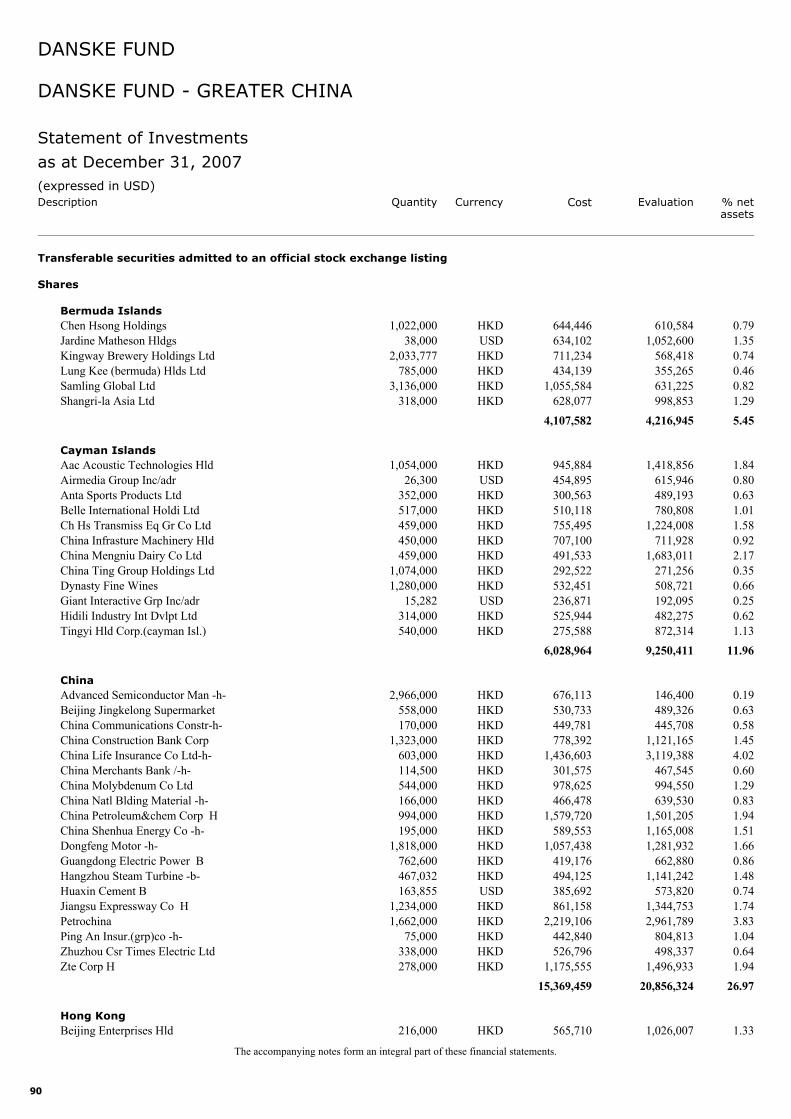
90
Chen Hsong Holdings 1,022,000 610,584 0.79HKD 644,446
Transferable securities admitted to an official stock exchange listing
Shares
Bermuda Islands
Jardine Matheson Hldgs 38,000 1,052,600 1.35USD 634,102Kingway Brewery Holdings Ltd 2,033,777 568,418 0.74HKD 711,234Lung Kee (bermuda) Hlds Ltd 785,000 355,265 0.46HKD 434,139Samling Global Ltd 3,136,000 631,225 0.82HKD 1,055,584Shangri-la Asia Ltd 318,000 998,853 1.29HKD 628,077
4,216,945 5.454,107,582
Aac Acoustic Technologies Hld 1,054,000 1,418,856 1.84HKD 945,884Cayman Islands
Airmedia Group Inc/adr 26,300 615,946 0.80USD 454,895Anta Sports Products Ltd 352,000 489,193 0.63HKD 300,563Belle International Holdi Ltd 517,000 780,808 1.01HKD 510,118Ch Hs Transmiss Eq Gr Co Ltd 459,000 1,224,008 1.58HKD 755,495China Infrasture Machinery Hld 450,000 711,928 0.92HKD 707,100China Mengniu Dairy Co Ltd 459,000 1,683,011 2.17HKD 491,533China Ting Group Holdings Ltd 1,074,000 271,256 0.35HKD 292,522Dynasty Fine Wines 1,280,000 508,721 0.66HKD 532,451Giant Interactive Grp Inc/adr 15,282 192,095 0.25USD 236,871Hidili Industry Int Dvlpt Ltd 314,000 482,275 0.62HKD 525,944Tingyi Hld Corp.(cayman Isl.) 540,000 872,314 1.13HKD 275,588
9,250,411 11.966,028,964
Advanced Semiconductor Man -h- 2,966,000 146,400 0.19HKD 676,113China
Beijing Jingkelong Supermarket 558,000 489,326 0.63HKD 530,733China Communications Constr-h- 170,000 445,708 0.58HKD 449,781China Construction Bank Corp 1,323,000 1,121,165 1.45HKD 778,392China Life Insurance Co Ltd-h- 603,000 3,119,388 4.02HKD 1,436,603China Merchants Bank /-h- 114,500 467,545 0.60HKD 301,575China Molybdenum Co Ltd 544,000 994,550 1.29HKD 978,625China Natl Blding Material -h- 166,000 639,530 0.83HKD 466,478China Petroleum&chem Corp H 994,000 1,501,205 1.94HKD 1,579,720China Shenhua Energy Co -h- 195,000 1,165,008 1.51HKD 589,553Dongfeng Motor -h- 1,818,000 1,281,932 1.66HKD 1,057,438Guangdong Electric Power B 762,600 662,880 0.86HKD 419,176Hangzhou Steam Turbine -b- 467,032 1,141,242 1.48HKD 494,125Huaxin Cement B 163,855 573,820 0.74USD 385,692Jiangsu Expressway Co H 1,234,000 1,344,753 1.74HKD 861,158Petrochina 1,662,000 2,961,789 3.83HKD 2,219,106Ping An Insur.(grp)co -h- 75,000 804,813 1.04HKD 442,840Zhuzhou Csr Times Electric Ltd 338,000 498,337 0.64HKD 526,796Zte Corp H 278,000 1,496,933 1.94HKD 1,175,555
20,856,324 26.9715,369,459
Beijing Enterprises Hld 216,000 1,026,007 1.33HKD 565,710Hong Kong
(expressed in USD)Cost Evaluation % net
assetsCurrencyDescription
DANSKE FUND
as at December 31, 2007
Statement of Investments
The accompanying notes form an integral part of these financial statements.
Quantity
DANSKE FUND - GREATER CHINA
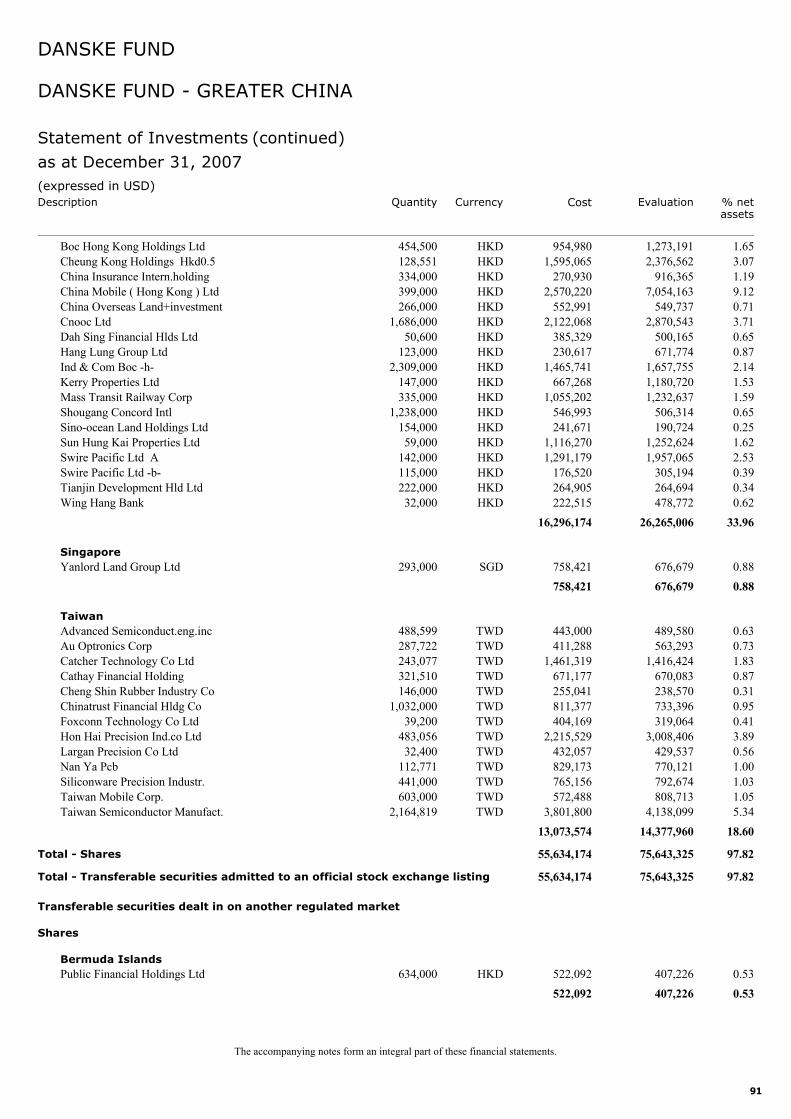
91
Boc Hong Kong Holdings Ltd 454,500 1,273,191 1.65HKD 954,980Cheung Kong Holdings Hkd0.5 128,551 2,376,562 3.07HKD 1,595,065China Insurance Intern.holding 334,000 916,365 1.19HKD 270,930China Mobile ( Hong Kong ) Ltd 399,000 7,054,163 9.12HKD 2,570,220China Overseas Land+investment 266,000 549,737 0.71HKD 552,991Cnooc Ltd 1,686,000 2,870,543 3.71HKD 2,122,068Dah Sing Financial Hlds Ltd 50,600 500,165 0.65HKD 385,329Hang Lung Group Ltd 123,000 671,774 0.87HKD 230,617Ind & Com Boc -h- 2,309,000 1,657,755 2.14HKD 1,465,741Kerry Properties Ltd 147,000 1,180,720 1.53HKD 667,268Mass Transit Railway Corp 335,000 1,232,637 1.59HKD 1,055,202Shougang Concord Intl 1,238,000 506,314 0.65HKD 546,993Sino-ocean Land Holdings Ltd 154,000 190,724 0.25HKD 241,671Sun Hung Kai Properties Ltd 59,000 1,252,624 1.62HKD 1,116,270Swire Pacific Ltd A 142,000 1,957,065 2.53HKD 1,291,179Swire Pacific Ltd -b- 115,000 305,194 0.39HKD 176,520Tianjin Development Hld Ltd 222,000 264,694 0.34HKD 264,905Wing Hang Bank 32,000 478,772 0.62HKD 222,515
26,265,006 33.9616,296,174
Yanlord Land Group Ltd 293,000 676,679 0.88SGD 758,421Singapore
676,679 0.88758,421
Advanced Semiconduct.eng.inc 488,599 489,580 0.63TWD 443,000Taiwan
Au Optronics Corp 287,722 563,293 0.73TWD 411,288Catcher Technology Co Ltd 243,077 1,416,424 1.83TWD 1,461,319Cathay Financial Holding 321,510 670,083 0.87TWD 671,177Cheng Shin Rubber Industry Co 146,000 238,570 0.31TWD 255,041Chinatrust Financial Hldg Co 1,032,000 733,396 0.95TWD 811,377Foxconn Technology Co Ltd 39,200 319,064 0.41TWD 404,169Hon Hai Precision Ind.co Ltd 483,056 3,008,406 3.89TWD 2,215,529Largan Precision Co Ltd 32,400 429,537 0.56TWD 432,057Nan Ya Pcb 112,771 770,121 1.00TWD 829,173Siliconware Precision Industr. 441,000 792,674 1.03TWD 765,156Taiwan Mobile Corp. 603,000 808,713 1.05TWD 572,488Taiwan Semiconductor Manufact. 2,164,819 4,138,099 5.34TWD 3,801,800
14,377,960 18.6013,073,574
Total - Shares 75,643,325 97.8255,634,174
Total - Transferable securities admitted to an official stock exchange listing 75,643,325 97.8255,634,174
Public Financial Holdings Ltd 634,000 407,226 0.53HKD 522,092
Transferable securities dealt in on another regulated market
Shares
Bermuda Islands
407,226 0.53522,092
(expressed in USD)Cost Evaluation % net
assetsCurrencyDescription
DANSKE FUND
as at December 31, 2007
Statement of Investments (continued)
The accompanying notes form an integral part of these financial statements.
Quantity
DANSKE FUND - GREATER CHINA
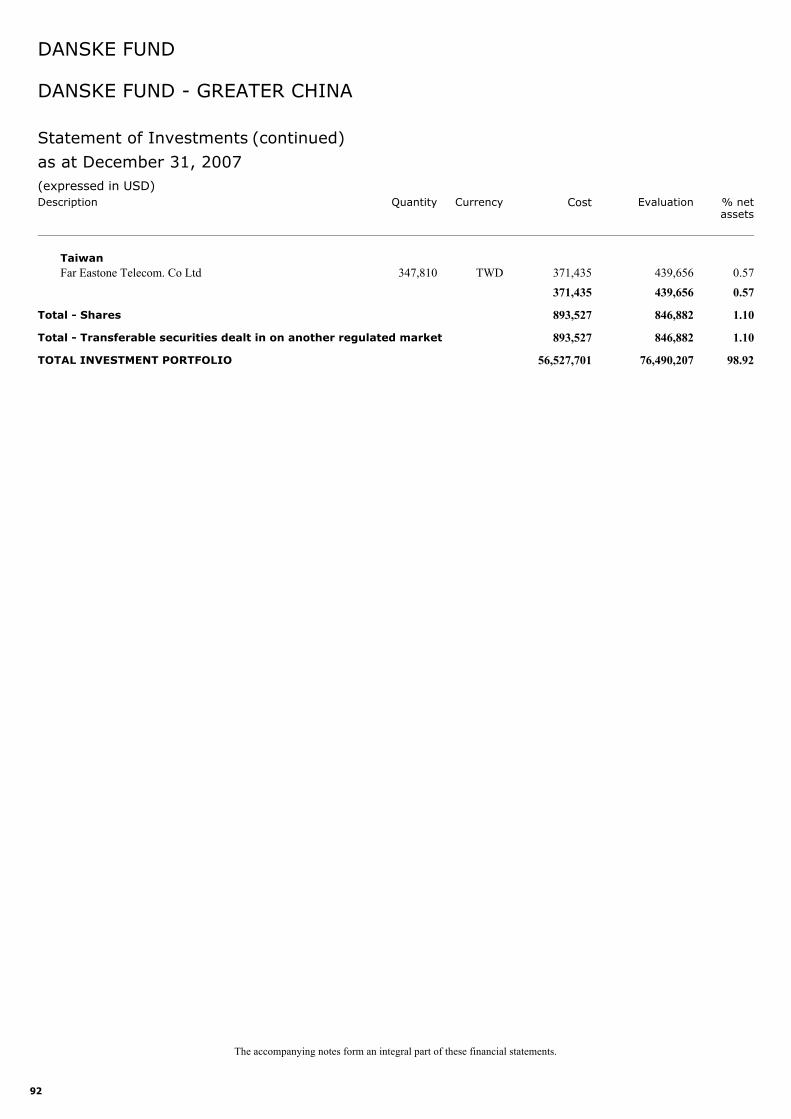
92
Far Eastone Telecom. Co Ltd 347,810 439,656 0.57TWD 371,435Taiwan
439,656 0.57371,435
Total - Shares 846,882 1.10893,527
Total - Transferable securities dealt in on another regulated market 846,882 1.10893,527
TOTAL INVESTMENT PORTFOLIO 76,490,207 98.9256,527,701
(expressed in USD)Cost Evaluation % net
assetsCurrencyDescription
DANSKE FUND
as at December 31, 2007
Statement of Investments (continued)
The accompanying notes form an integral part of these financial statements.
Quantity
DANSKE FUND - GREATER CHINA
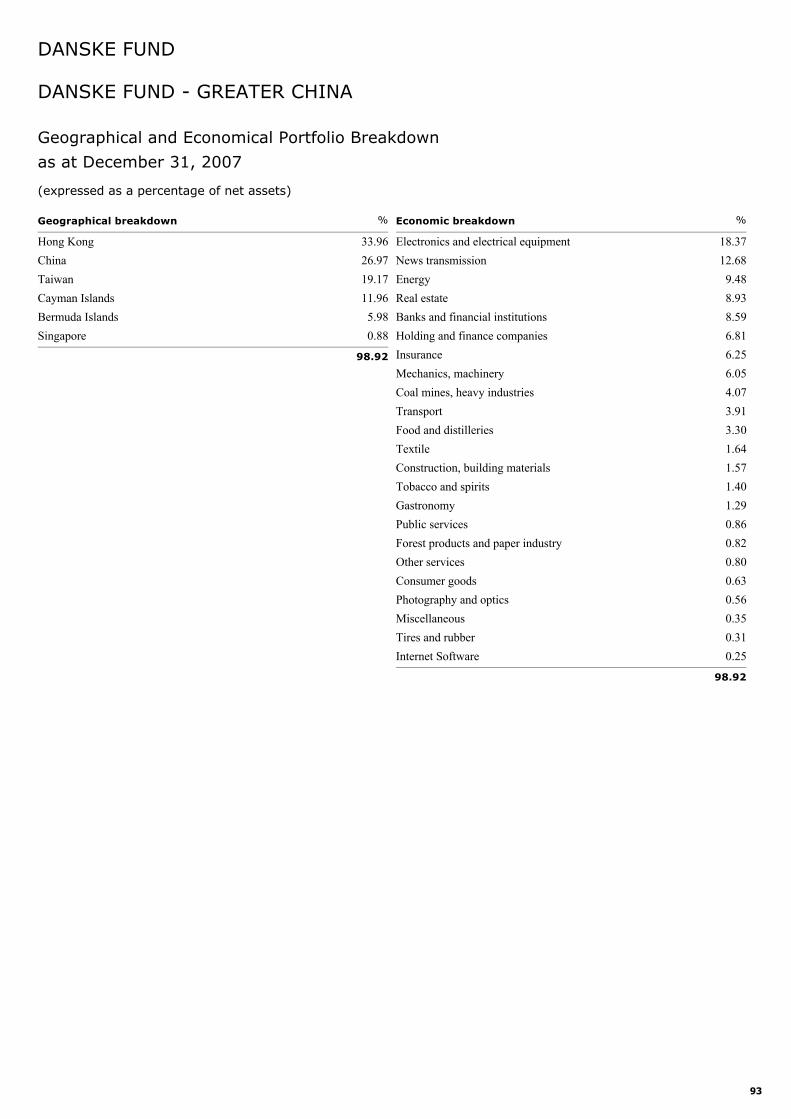
93
Hong Kong 33.96China 26.97Taiwan 19.17Cayman Islands 11.96Bermuda Islands 5.98Singapore 0.88
Geographical breakdown %
98.92
Electronics and electrical equipment 18.37News transmission 12.68Energy 9.48Real estate 8.93Banks and financial institutions 8.59Holding and finance companies 6.81Insurance 6.25Mechanics, machinery 6.05Coal mines, heavy industries 4.07Transport 3.91Food and distilleries 3.30Textile 1.64Construction, building materials 1.57Tobacco and spirits 1.40Gastronomy 1.29Public services 0.86Forest products and paper industry 0.82Other services 0.80Consumer goods 0.63Photography and optics 0.56Miscellaneous 0.35Tires and rubber 0.31Internet Software 0.25
Economic breakdown %
98.92
Geographical and Economical Portfolio Breakdown
DANSKE FUND - GREATER CHINA
DANSKE FUND
as at December 31, 2007
(expressed as a percentage of net assets)
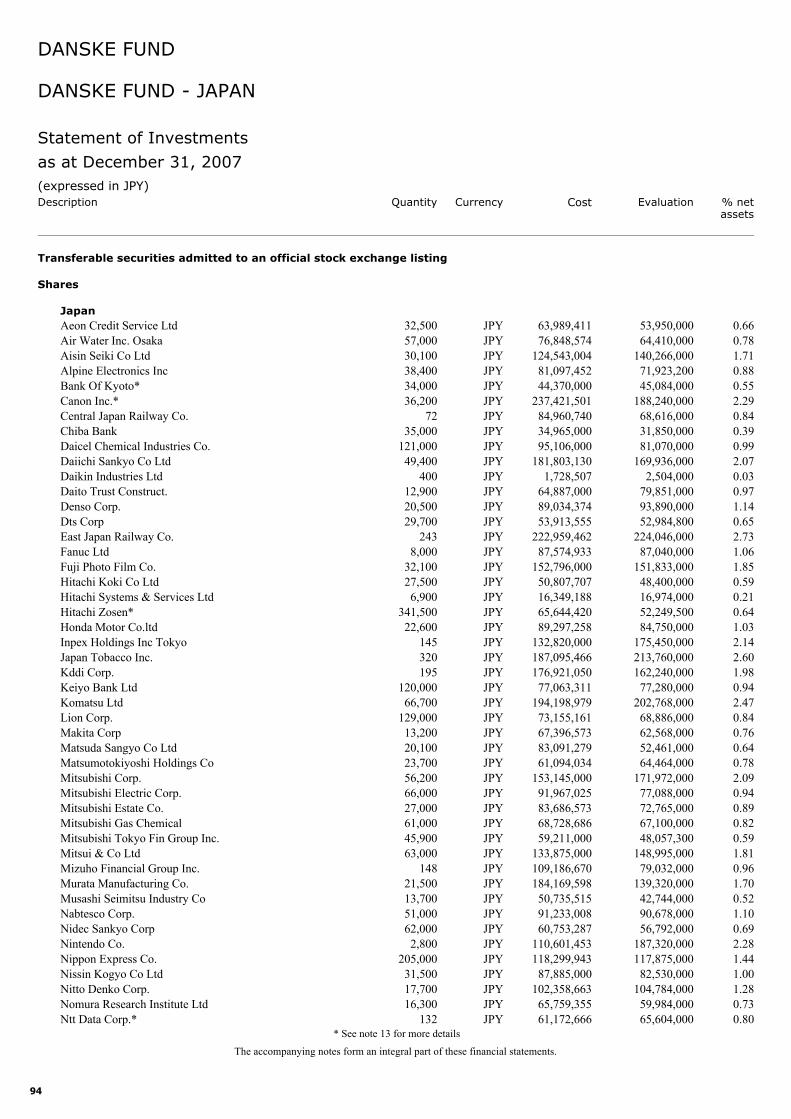
94
Aeon Credit Service Ltd 32,500 53,950,000 0.66JPY 63,989,411
Transferable securities admitted to an official stock exchange listing
Shares
Japan
Air Water Inc. Osaka 57,000 64,410,000 0.78JPY 76,848,574Aisin Seiki Co Ltd 30,100 140,266,000 1.71JPY 124,543,004Alpine Electronics Inc 38,400 71,923,200 0.88JPY 81,097,452Bank Of Kyoto* 34,000 45,084,000 0.55JPY 44,370,000Canon Inc.* 36,200 188,240,000 2.29JPY 237,421,501Central Japan Railway Co. 72 68,616,000 0.84JPY 84,960,740Chiba Bank 35,000 31,850,000 0.39JPY 34,965,000Daicel Chemical Industries Co. 121,000 81,070,000 0.99JPY 95,106,000Daiichi Sankyo Co Ltd 49,400 169,936,000 2.07JPY 181,803,130Daikin Industries Ltd 400 2,504,000 0.03JPY 1,728,507Daito Trust Construct. 12,900 79,851,000 0.97JPY 64,887,000Denso Corp. 20,500 93,890,000 1.14JPY 89,034,374Dts Corp 29,700 52,984,800 0.65JPY 53,913,555East Japan Railway Co. 243 224,046,000 2.73JPY 222,959,462Fanuc Ltd 8,000 87,040,000 1.06JPY 87,574,933Fuji Photo Film Co. 32,100 151,833,000 1.85JPY 152,796,000Hitachi Koki Co Ltd 27,500 48,400,000 0.59JPY 50,807,707Hitachi Systems & Services Ltd 6,900 16,974,000 0.21JPY 16,349,188Hitachi Zosen* 341,500 52,249,500 0.64JPY 65,644,420Honda Motor Co.ltd 22,600 84,750,000 1.03JPY 89,297,258Inpex Holdings Inc Tokyo 145 175,450,000 2.14JPY 132,820,000Japan Tobacco Inc. 320 213,760,000 2.60JPY 187,095,466Kddi Corp. 195 162,240,000 1.98JPY 176,921,050Keiyo Bank Ltd 120,000 77,280,000 0.94JPY 77,063,311Komatsu Ltd 66,700 202,768,000 2.47JPY 194,198,979Lion Corp. 129,000 68,886,000 0.84JPY 73,155,161Makita Corp 13,200 62,568,000 0.76JPY 67,396,573Matsuda Sangyo Co Ltd 20,100 52,461,000 0.64JPY 83,091,279Matsumotokiyoshi Holdings Co 23,700 64,464,000 0.78JPY 61,094,034Mitsubishi Corp. 56,200 171,972,000 2.09JPY 153,145,000Mitsubishi Electric Corp. 66,000 77,088,000 0.94JPY 91,967,025Mitsubishi Estate Co. 27,000 72,765,000 0.89JPY 83,686,573Mitsubishi Gas Chemical 61,000 67,100,000 0.82JPY 68,728,686Mitsubishi Tokyo Fin Group Inc. 45,900 48,057,300 0.59JPY 59,211,000Mitsui & Co Ltd 63,000 148,995,000 1.81JPY 133,875,000Mizuho Financial Group Inc. 148 79,032,000 0.96JPY 109,186,670Murata Manufacturing Co. 21,500 139,320,000 1.70JPY 184,169,598Musashi Seimitsu Industry Co 13,700 42,744,000 0.52JPY 50,735,515Nabtesco Corp. 51,000 90,678,000 1.10JPY 91,233,008Nidec Sankyo Corp 62,000 56,792,000 0.69JPY 60,753,287Nintendo Co. 2,800 187,320,000 2.28JPY 110,601,453Nippon Express Co. 205,000 117,875,000 1.44JPY 118,299,943Nissin Kogyo Co Ltd 31,500 82,530,000 1.00JPY 87,885,000Nitto Denko Corp. 17,700 104,784,000 1.28JPY 102,358,663Nomura Research Institute Ltd 16,300 59,984,000 0.73JPY 65,759,355Ntt Data Corp.* 132 65,604,000 0.80JPY 61,172,666
(expressed in JPY)Cost Evaluation % net
assetsCurrencyDescription
DANSKE FUND
as at December 31, 2007
Statement of Investments
The accompanying notes form an integral part of these financial statements.
Quantity
DANSKE FUND - JAPAN
* See note 13 for more details
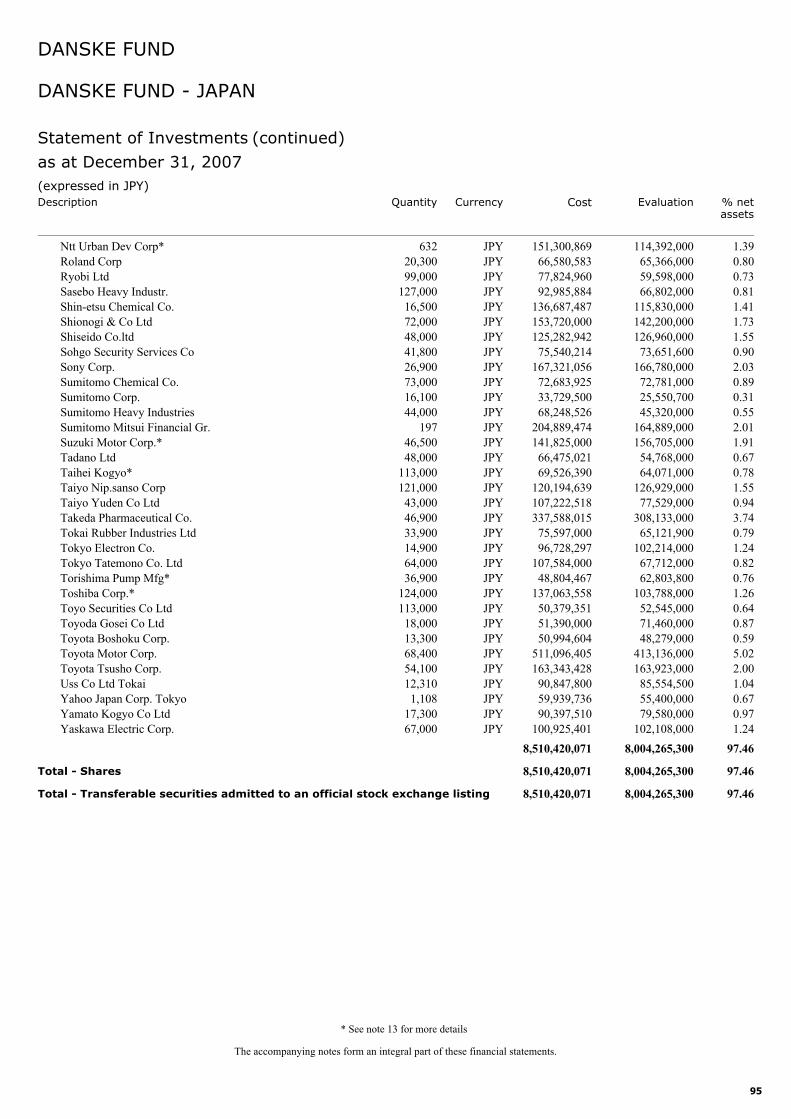
95
Ntt Urban Dev Corp* 632 114,392,000 1.39JPY 151,300,869Roland Corp 20,300 65,366,000 0.80JPY 66,580,583Ryobi Ltd 99,000 59,598,000 0.73JPY 77,824,960Sasebo Heavy Industr. 127,000 66,802,000 0.81JPY 92,985,884Shin-etsu Chemical Co. 16,500 115,830,000 1.41JPY 136,687,487Shionogi & Co Ltd 72,000 142,200,000 1.73JPY 153,720,000Shiseido Co.ltd 48,000 126,960,000 1.55JPY 125,282,942Sohgo Security Services Co 41,800 73,651,600 0.90JPY 75,540,214Sony Corp. 26,900 166,780,000 2.03JPY 167,321,056Sumitomo Chemical Co. 73,000 72,781,000 0.89JPY 72,683,925Sumitomo Corp. 16,100 25,550,700 0.31JPY 33,729,500Sumitomo Heavy Industries 44,000 45,320,000 0.55JPY 68,248,526Sumitomo Mitsui Financial Gr. 197 164,889,000 2.01JPY 204,889,474Suzuki Motor Corp.* 46,500 156,705,000 1.91JPY 141,825,000Tadano Ltd 48,000 54,768,000 0.67JPY 66,475,021Taihei Kogyo* 113,000 64,071,000 0.78JPY 69,526,390Taiyo Nip.sanso Corp 121,000 126,929,000 1.55JPY 120,194,639Taiyo Yuden Co Ltd 43,000 77,529,000 0.94JPY 107,222,518Takeda Pharmaceutical Co. 46,900 308,133,000 3.74JPY 337,588,015Tokai Rubber Industries Ltd 33,900 65,121,900 0.79JPY 75,597,000Tokyo Electron Co. 14,900 102,214,000 1.24JPY 96,728,297Tokyo Tatemono Co. Ltd 64,000 67,712,000 0.82JPY 107,584,000Torishima Pump Mfg* 36,900 62,803,800 0.76JPY 48,804,467Toshiba Corp.* 124,000 103,788,000 1.26JPY 137,063,558Toyo Securities Co Ltd 113,000 52,545,000 0.64JPY 50,379,351Toyoda Gosei Co Ltd 18,000 71,460,000 0.87JPY 51,390,000Toyota Boshoku Corp. 13,300 48,279,000 0.59JPY 50,994,604Toyota Motor Corp. 68,400 413,136,000 5.02JPY 511,096,405Toyota Tsusho Corp. 54,100 163,923,000 2.00JPY 163,343,428Uss Co Ltd Tokai 12,310 85,554,500 1.04JPY 90,847,800Yahoo Japan Corp. Tokyo 1,108 55,400,000 0.67JPY 59,939,736Yamato Kogyo Co Ltd 17,300 79,580,000 0.97JPY 90,397,510Yaskawa Electric Corp. 67,000 102,108,000 1.24JPY 100,925,401
8,004,265,300 97.468,510,420,071
Total - Shares 8,004,265,300 97.468,510,420,071
Total - Transferable securities admitted to an official stock exchange listing 8,004,265,300 97.468,510,420,071
(expressed in JPY)Cost Evaluation % net
assetsCurrencyDescription
DANSKE FUND
as at December 31, 2007
Statement of Investments (continued)
The accompanying notes form an integral part of these financial statements.
Quantity
DANSKE FUND - JAPAN
* See note 13 for more details
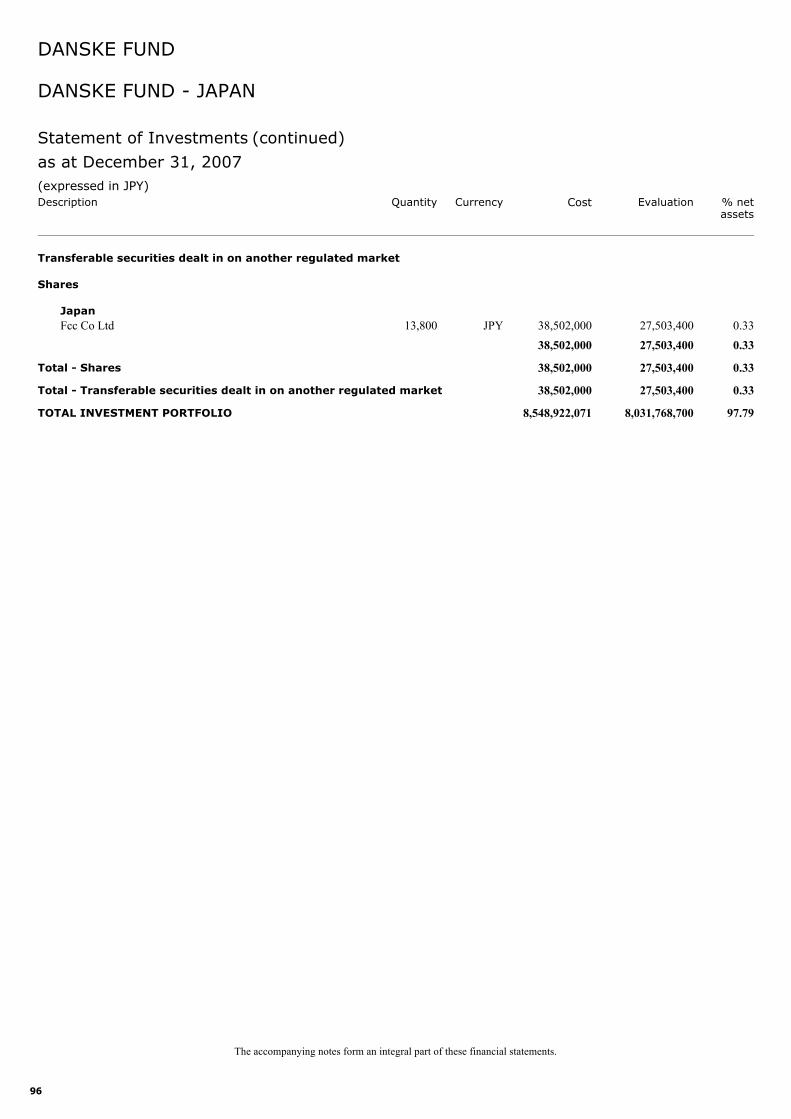
96
Fcc Co Ltd 13,800 27,503,400 0.33JPY 38,502,000
Transferable securities dealt in on another regulated market
Shares
Japan
27,503,400 0.3338,502,000
Total - Shares 27,503,400 0.3338,502,000
Total - Transferable securities dealt in on another regulated market 27,503,400 0.3338,502,000
TOTAL INVESTMENT PORTFOLIO 8,031,768,700 97.798,548,922,071
(expressed in JPY)Cost Evaluation % net
assetsCurrencyDescription
DANSKE FUND
as at December 31, 2007
Statement of Investments (continued)
The accompanying notes form an integral part of these financial statements.
Quantity
DANSKE FUND - JAPAN
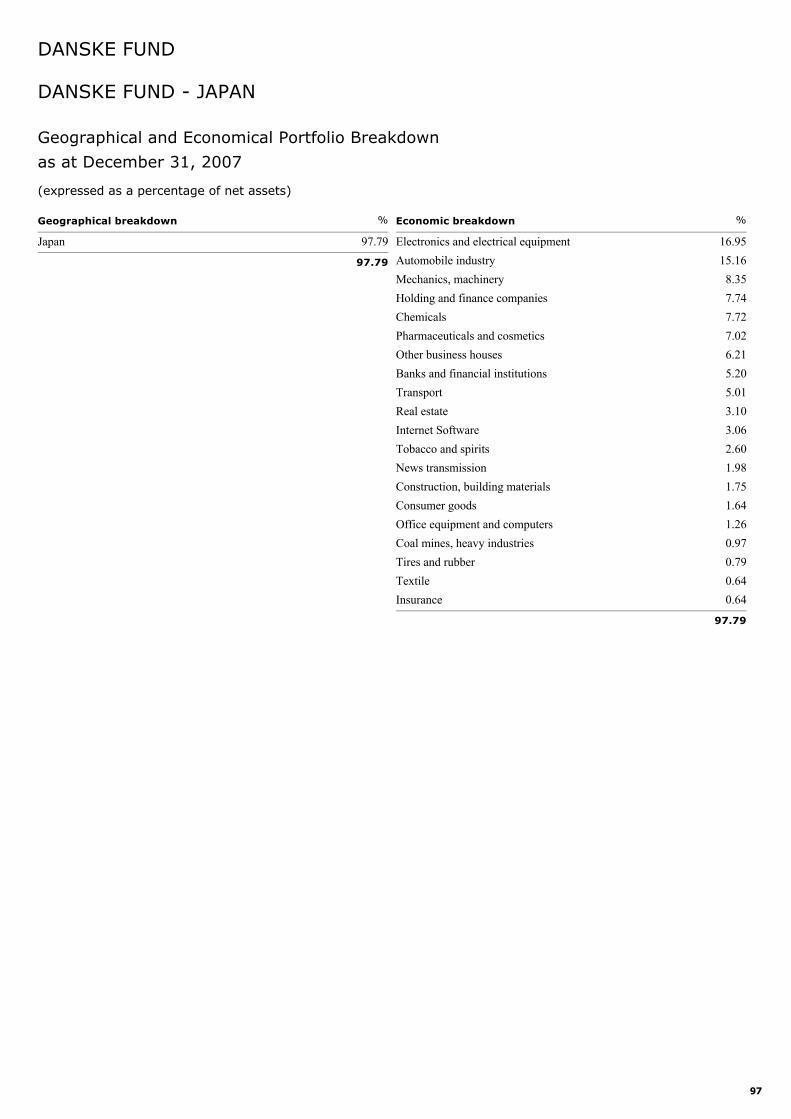
97
Japan 97.79
Geographical breakdown %
97.79
Electronics and electrical equipment 16.95Automobile industry 15.16Mechanics, machinery 8.35Holding and finance companies 7.74Chemicals 7.72Pharmaceuticals and cosmetics 7.02Other business houses 6.21Banks and financial institutions 5.20Transport 5.01Real estate 3.10Internet Software 3.06Tobacco and spirits 2.60News transmission 1.98Construction, building materials 1.75Consumer goods 1.64Office equipment and computers 1.26Coal mines, heavy industries 0.97Tires and rubber 0.79Textile 0.64Insurance 0.64
Economic breakdown %
97.79
Geographical and Economical Portfolio Breakdown
DANSKE FUND - JAPAN
DANSKE FUND
as at December 31, 2007
(expressed as a percentage of net assets)
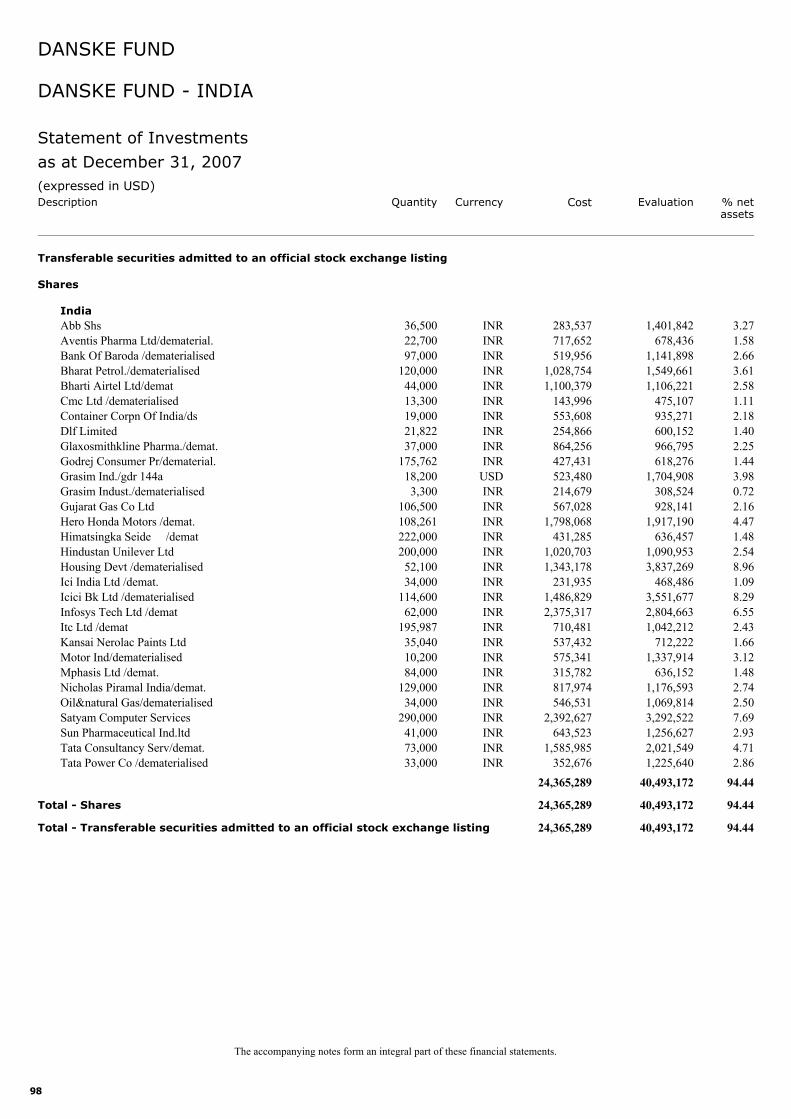
98
Abb Shs 36,500 1,401,842 3.27INR 283,537
Transferable securities admitted to an official stock exchange listing
Shares
India
Aventis Pharma Ltd/dematerial. 22,700 678,436 1.58INR 717,652Bank Of Baroda /dematerialised 97,000 1,141,898 2.66INR 519,956Bharat Petrol./dematerialised 120,000 1,549,661 3.61INR 1,028,754Bharti Airtel Ltd/demat 44,000 1,106,221 2.58INR 1,100,379Cmc Ltd /dematerialised 13,300 475,107 1.11INR 143,996Container Corpn Of India/ds 19,000 935,271 2.18INR 553,608Dlf Limited 21,822 600,152 1.40INR 254,866Glaxosmithkline Pharma./demat. 37,000 966,795 2.25INR 864,256Godrej Consumer Pr/dematerial. 175,762 618,276 1.44INR 427,431Grasim Ind./gdr 144a 18,200 1,704,908 3.98USD 523,480Grasim Indust./dematerialised 3,300 308,524 0.72INR 214,679Gujarat Gas Co Ltd 106,500 928,141 2.16INR 567,028Hero Honda Motors /demat. 108,261 1,917,190 4.47INR 1,798,068Himatsingka Seide /demat 222,000 636,457 1.48INR 431,285Hindustan Unilever Ltd 200,000 1,090,953 2.54INR 1,020,703Housing Devt /dematerialised 52,100 3,837,269 8.96INR 1,343,178Ici India Ltd /demat. 34,000 468,486 1.09INR 231,935Icici Bk Ltd /dematerialised 114,600 3,551,677 8.29INR 1,486,829Infosys Tech Ltd /demat 62,000 2,804,663 6.55INR 2,375,317Itc Ltd /demat 195,987 1,042,212 2.43INR 710,481Kansai Nerolac Paints Ltd 35,040 712,222 1.66INR 537,432Motor Ind/dematerialised 10,200 1,337,914 3.12INR 575,341Mphasis Ltd /demat. 84,000 636,152 1.48INR 315,782Nicholas Piramal India/demat. 129,000 1,176,593 2.74INR 817,974Oil&natural Gas/dematerialised 34,000 1,069,814 2.50INR 546,531Satyam Computer Services 290,000 3,292,522 7.69INR 2,392,627Sun Pharmaceutical Ind.ltd 41,000 1,256,627 2.93INR 643,523Tata Consultancy Serv/demat. 73,000 2,021,549 4.71INR 1,585,985Tata Power Co /dematerialised 33,000 1,225,640 2.86INR 352,676
40,493,172 94.4424,365,289
Total - Shares 40,493,172 94.4424,365,289
Total - Transferable securities admitted to an official stock exchange listing 40,493,172 94.4424,365,289
(expressed in USD)Cost Evaluation % net
assetsCurrencyDescription
DANSKE FUND
as at December 31, 2007
Statement of Investments
The accompanying notes form an integral part of these financial statements.
Quantity
DANSKE FUND - INDIA
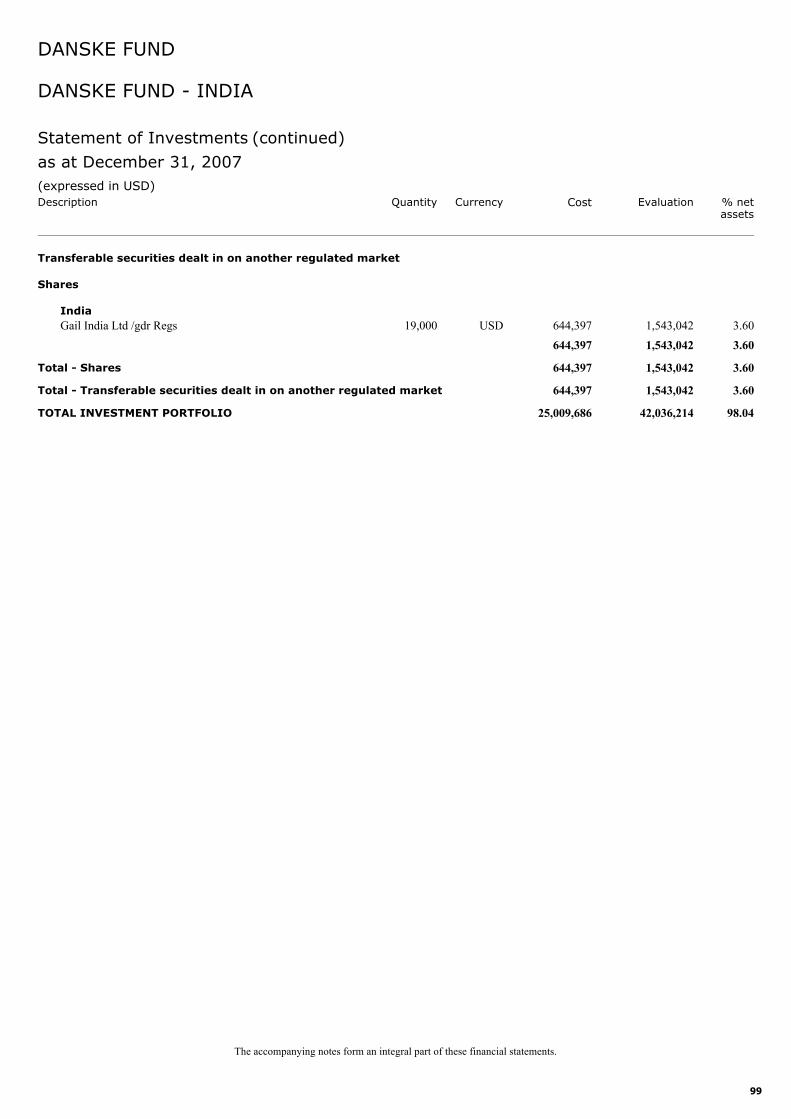
99
Gail India Ltd /gdr Regs 19,000 1,543,042 3.60USD 644,397
Transferable securities dealt in on another regulated market
Shares
India
1,543,042 3.60644,397
Total - Shares 1,543,042 3.60644,397
Total - Transferable securities dealt in on another regulated market 1,543,042 3.60644,397
TOTAL INVESTMENT PORTFOLIO 42,036,214 98.0425,009,686
(expressed in USD)Cost Evaluation % net
assetsCurrencyDescription
DANSKE FUND
as at December 31, 2007
Statement of Investments (continued)
The accompanying notes form an integral part of these financial statements.
Quantity
DANSKE FUND - INDIA
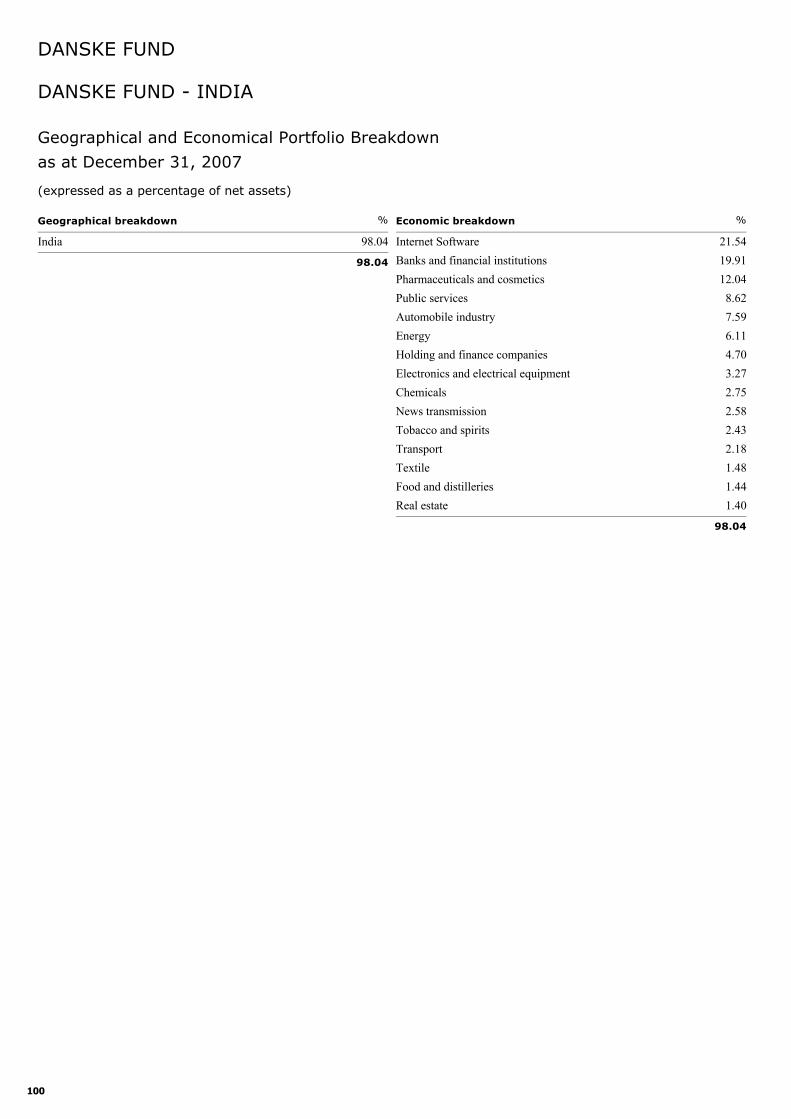
100
India 98.04
Geographical breakdown %
98.04
Internet Software 21.54Banks and financial institutions 19.91Pharmaceuticals and cosmetics 12.04Public services 8.62Automobile industry 7.59Energy 6.11Holding and finance companies 4.70Electronics and electrical equipment 3.27Chemicals 2.75News transmission 2.58Tobacco and spirits 2.43Transport 2.18Textile 1.48Food and distilleries 1.44Real estate 1.40
Economic breakdown %
98.04
Geographical and Economical Portfolio Breakdown
DANSKE FUND - INDIA
DANSKE FUND
as at December 31, 2007
(expressed as a percentage of net assets)
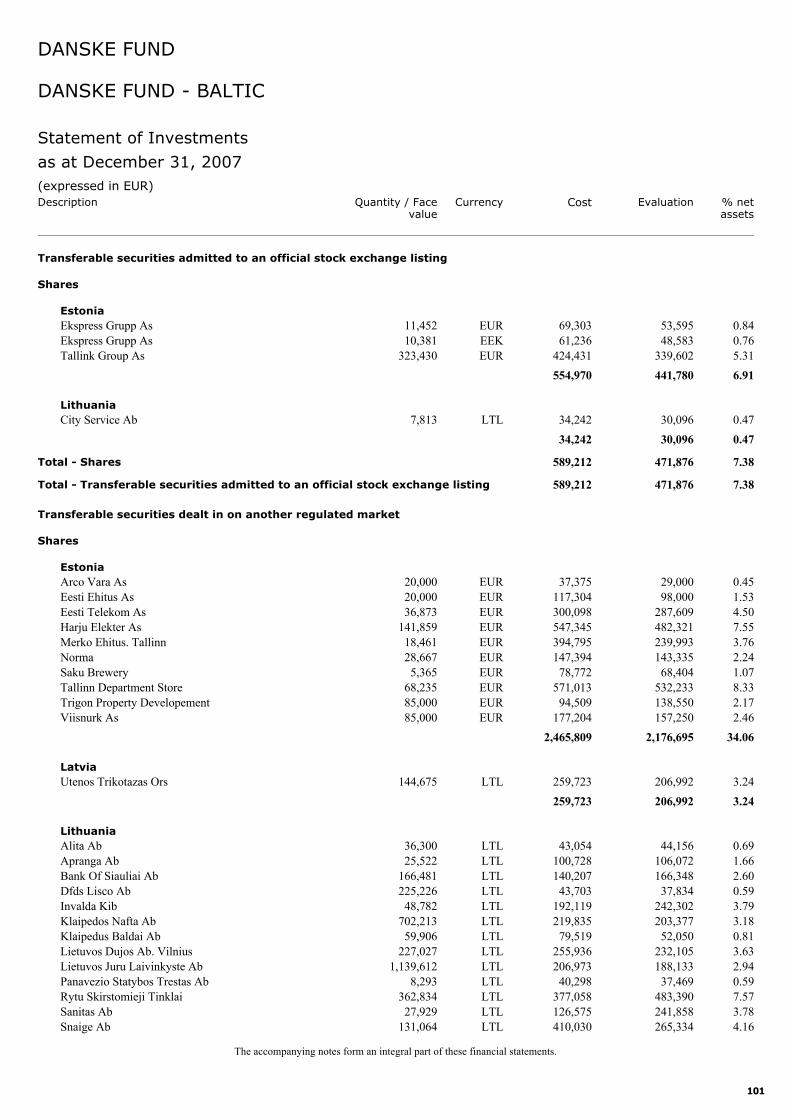
101
Ekspress Grupp As 11,452 53,595 0.84EUR 69,303
Transferable securities admitted to an official stock exchange listing
Shares
Estonia
Ekspress Grupp As 10,381 48,583 0.76EEK 61,236Tallink Group As 323,430 339,602 5.31EUR 424,431
441,780 6.91554,970
City Service Ab 7,813 30,096 0.47LTL 34,242Lithuania
30,096 0.4734,242
Total - Shares 471,876 7.38589,212
Total - Transferable securities admitted to an official stock exchange listing 471,876 7.38589,212
Arco Vara As 20,000 29,000 0.45EUR 37,375
Transferable securities dealt in on another regulated market
Shares
Estonia
Eesti Ehitus As 20,000 98,000 1.53EUR 117,304Eesti Telekom As 36,873 287,609 4.50EUR 300,098Harju Elekter As 141,859 482,321 7.55EUR 547,345Merko Ehitus. Tallinn 18,461 239,993 3.76EUR 394,795Norma 28,667 143,335 2.24EUR 147,394Saku Brewery 5,365 68,404 1.07EUR 78,772Tallinn Department Store 68,235 532,233 8.33EUR 571,013Trigon Property Developement 85,000 138,550 2.17EUR 94,509Viisnurk As 85,000 157,250 2.46EUR 177,204
2,176,695 34.062,465,809
Utenos Trikotazas Ors 144,675 206,992 3.24LTL 259,723Latvia
206,992 3.24259,723
Alita Ab 36,300 44,156 0.69LTL 43,054Lithuania
Apranga Ab 25,522 106,072 1.66LTL 100,728Bank Of Siauliai Ab 166,481 166,348 2.60LTL 140,207Dfds Lisco Ab 225,226 37,834 0.59LTL 43,703Invalda Kib 48,782 242,302 3.79LTL 192,119Klaipedos Nafta Ab 702,213 203,377 3.18LTL 219,835Klaipedus Baldai Ab 59,906 52,050 0.81LTL 79,519Lietuvos Dujos Ab. Vilnius 227,027 232,105 3.63LTL 255,936Lietuvos Juru Laivinkyste Ab 1,139,612 188,133 2.94LTL 206,973Panavezio Statybos Trestas Ab 8,293 37,469 0.59LTL 40,298Rytu Skirstomieji Tinklai 362,834 483,390 7.57LTL 377,058Sanitas Ab 27,929 241,858 3.78LTL 126,575Snaige Ab 131,064 265,334 4.16LTL 410,030
(expressed in EUR)Cost Evaluation % net
assetsCurrencyQuantity / Face
valueDescription
DANSKE FUND
as at December 31, 2007
Statement of Investments
The accompanying notes form an integral part of these financial statements.
DANSKE FUND - BALTIC
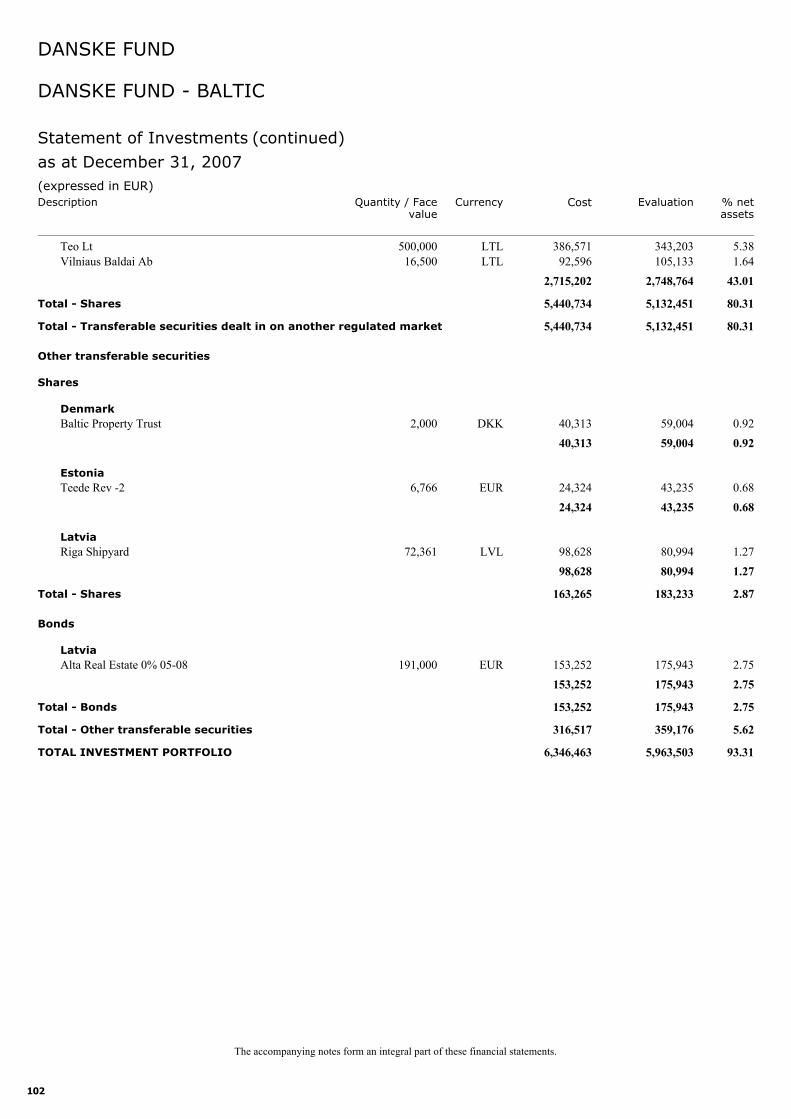
102
Teo Lt 500,000 343,203 5.38LTL 386,571Vilniaus Baldai Ab 16,500 105,133 1.64LTL 92,596
2,748,764 43.012,715,202
Total - Shares 5,132,451 80.315,440,734
Total - Transferable securities dealt in on another regulated market 5,132,451 80.315,440,734
Baltic Property Trust 2,000 59,004 0.92DKK 40,313
Other transferable securities
Shares
Denmark
59,004 0.9240,313
Teede Rev -2 6,766 43,235 0.68EUR 24,324Estonia
43,235 0.6824,324
Riga Shipyard 72,361 80,994 1.27LVL 98,628Latvia
80,994 1.2798,628
Total - Shares 183,233 2.87163,265
Alta Real Estate 0% 05-08 191,000 175,943 2.75EUR 153,252
Bonds
Latvia
175,943 2.75153,252
Total - Bonds 175,943 2.75153,252
Total - Other transferable securities 359,176 5.62316,517
TOTAL INVESTMENT PORTFOLIO 5,963,503 93.316,346,463
(expressed in EUR)Cost Evaluation % net
assetsCurrencyQuantity / Face
valueDescription
DANSKE FUND
as at December 31, 2007
Statement of Investments (continued)
The accompanying notes form an integral part of these financial statements.
DANSKE FUND - BALTIC
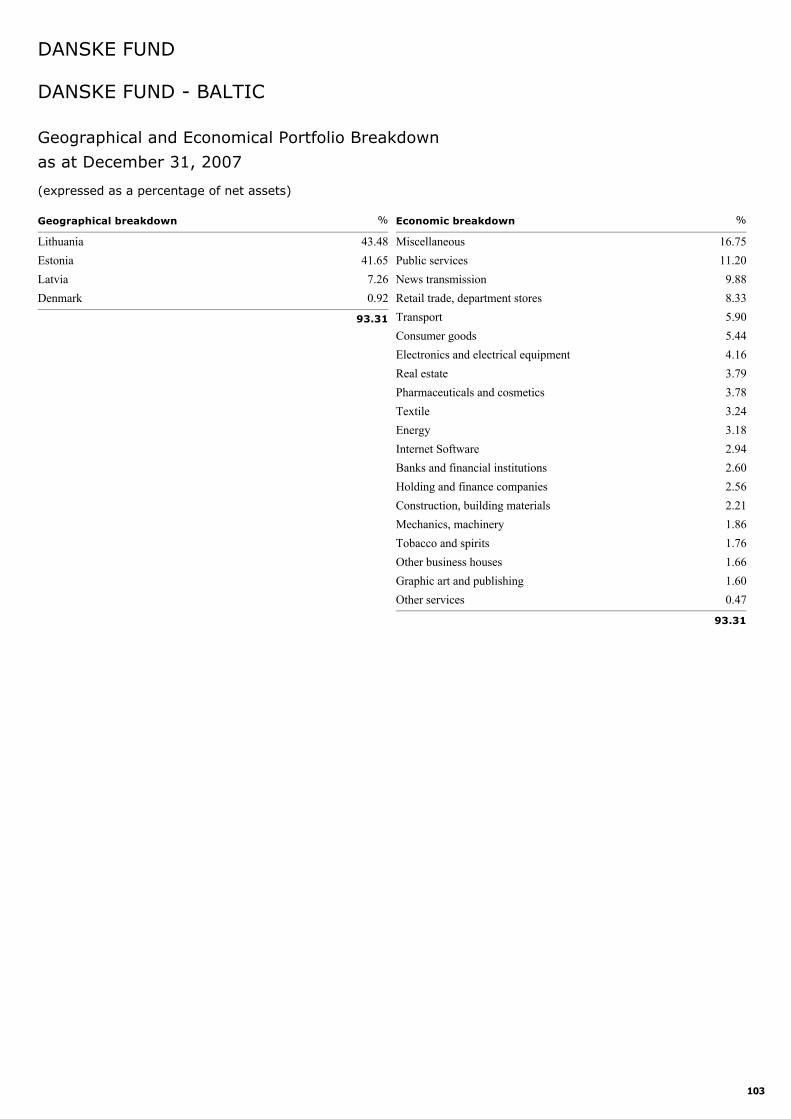
103
Lithuania 43.48Estonia 41.65Latvia 7.26Denmark 0.92
Geographical breakdown %
93.31
Miscellaneous 16.75Public services 11.20News transmission 9.88Retail trade, department stores 8.33Transport 5.90Consumer goods 5.44Electronics and electrical equipment 4.16Real estate 3.79Pharmaceuticals and cosmetics 3.78Textile 3.24Energy 3.18Internet Software 2.94Banks and financial institutions 2.60Holding and finance companies 2.56Construction, building materials 2.21Mechanics, machinery 1.86Tobacco and spirits 1.76Other business houses 1.66Graphic art and publishing 1.60Other services 0.47
Economic breakdown %
93.31
Geographical and Economical Portfolio Breakdown
DANSKE FUND - BALTIC
DANSKE FUND
as at December 31, 2007
(expressed as a percentage of net assets)
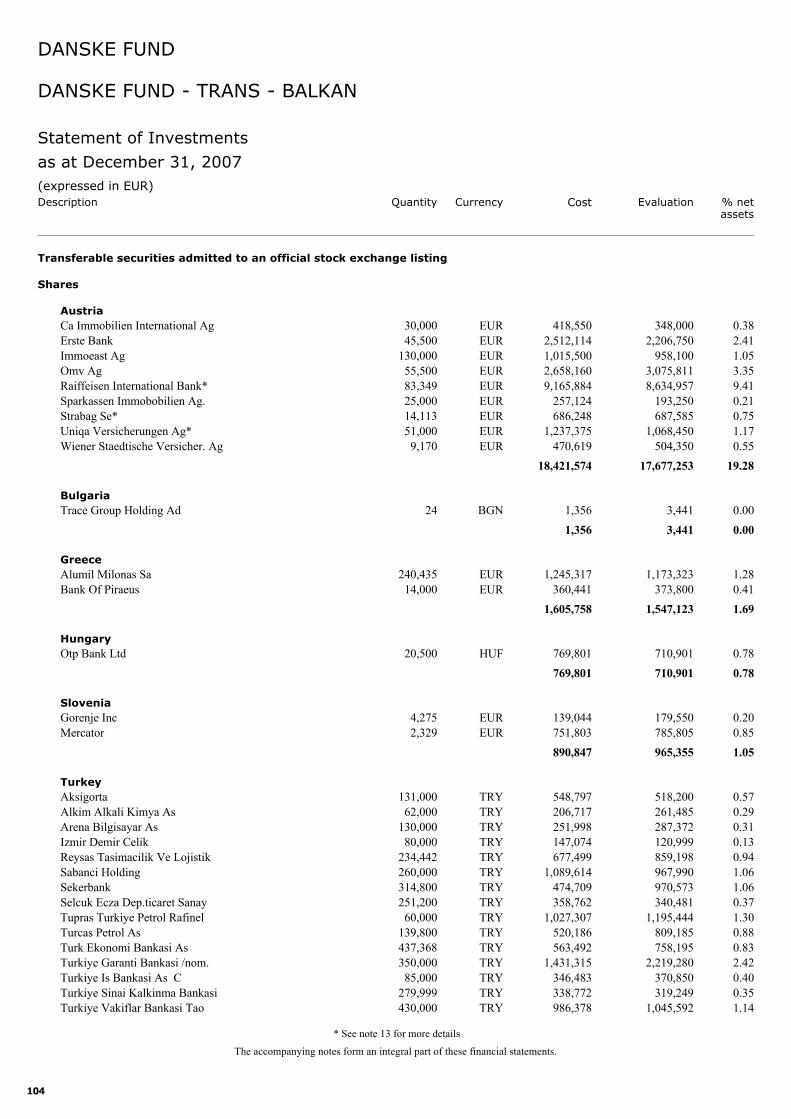
104
Ca Immobilien International Ag 30,000 348,000 0.38EUR 418,550
Transferable securities admitted to an official stock exchange listing
Shares
Austria
Erste Bank 45,500 2,206,750 2.41EUR 2,512,114Immoeast Ag 130,000 958,100 1.05EUR 1,015,500Omv Ag 55,500 3,075,811 3.35EUR 2,658,160Raiffeisen International Bank* 83,349 8,634,957 9.41EUR 9,165,884Sparkassen Immobobilien Ag. 25,000 193,250 0.21EUR 257,124Strabag Se* 14,113 687,585 0.75EUR 686,248Uniqa Versicherungen Ag* 51,000 1,068,450 1.17EUR 1,237,375Wiener Staedtische Versicher. Ag 9,170 504,350 0.55EUR 470,619
17,677,253 19.2818,421,574
Trace Group Holding Ad 24 3,441 0.00BGN 1,356Bulgaria
3,441 0.001,356
Alumil Milonas Sa 240,435 1,173,323 1.28EUR 1,245,317Greece
Bank Of Piraeus 14,000 373,800 0.41EUR 360,4411,547,123 1.691,605,758
Otp Bank Ltd 20,500 710,901 0.78HUF 769,801Hungary
710,901 0.78769,801
Gorenje Inc 4,275 179,550 0.20EUR 139,044Slovenia
Mercator 2,329 785,805 0.85EUR 751,803965,355 1.05890,847
Aksigorta 131,000 518,200 0.57TRY 548,797Turkey
Alkim Alkali Kimya As 62,000 261,485 0.29TRY 206,717Arena Bilgisayar As 130,000 287,372 0.31TRY 251,998Izmir Demir Celik 80,000 120,999 0.13TRY 147,074Reysas Tasimacilik Ve Lojistik 234,442 859,198 0.94TRY 677,499Sabanci Holding 260,000 967,990 1.06TRY 1,089,614Sekerbank 314,800 970,573 1.06TRY 474,709Selcuk Ecza Dep.ticaret Sanay 251,200 340,481 0.37TRY 358,762Tupras Turkiye Petrol Rafinel 60,000 1,195,444 1.30TRY 1,027,307Turcas Petrol As 139,800 809,185 0.88TRY 520,186Turk Ekonomi Bankasi As 437,368 758,195 0.83TRY 563,492Turkiye Garanti Bankasi /nom. 350,000 2,219,280 2.42TRY 1,431,315Turkiye Is Bankasi As C 85,000 370,850 0.40TRY 346,483Turkiye Sinai Kalkinma Bankasi 279,999 319,249 0.35TRY 338,772Turkiye Vakiflar Bankasi Tao 430,000 1,045,592 1.14TRY 986,378
(expressed in EUR)Cost Evaluation % net
assetsCurrencyDescription
DANSKE FUND
as at December 31, 2007
Statement of Investments
The accompanying notes form an integral part of these financial statements.
Quantity
DANSKE FUND - TRANS - BALKAN
* See note 13 for more details
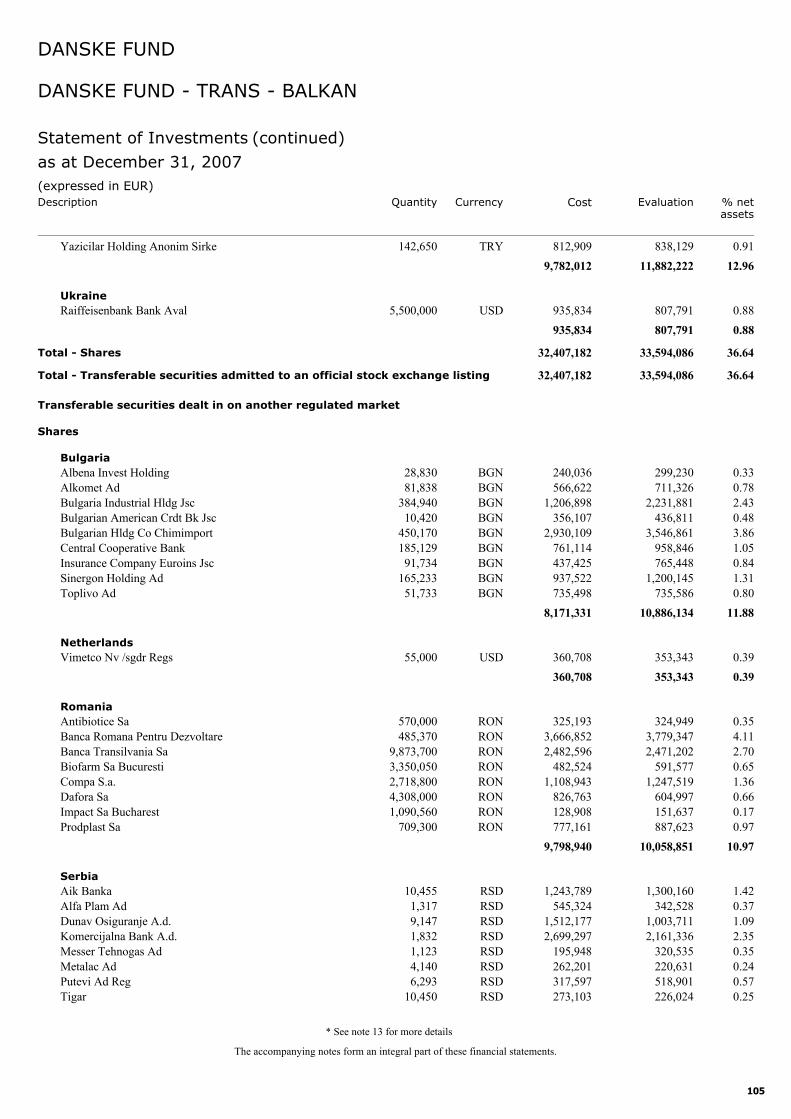
105
Yazicilar Holding Anonim Sirke 142,650 838,129 0.91TRY 812,90911,882,222 12.969,782,012
Raiffeisenbank Bank Aval 5,500,000 807,791 0.88USD 935,834Ukraine
807,791 0.88935,834
Total - Shares 33,594,086 36.6432,407,182
Total - Transferable securities admitted to an official stock exchange listing 33,594,086 36.6432,407,182
Albena Invest Holding 28,830 299,230 0.33BGN 240,036
Transferable securities dealt in on another regulated market
Shares
Bulgaria
Alkomet Ad 81,838 711,326 0.78BGN 566,622Bulgaria Industrial Hldg Jsc 384,940 2,231,881 2.43BGN 1,206,898Bulgarian American Crdt Bk Jsc 10,420 436,811 0.48BGN 356,107Bulgarian Hldg Co Chimimport 450,170 3,546,861 3.86BGN 2,930,109Central Cooperative Bank 185,129 958,846 1.05BGN 761,114Insurance Company Euroins Jsc 91,734 765,448 0.84BGN 437,425Sinergon Holding Ad 165,233 1,200,145 1.31BGN 937,522Toplivo Ad 51,733 735,586 0.80BGN 735,498
10,886,134 11.888,171,331
Vimetco Nv /sgdr Regs 55,000 353,343 0.39USD 360,708Netherlands
353,343 0.39360,708
Antibiotice Sa 570,000 324,949 0.35RON 325,193Romania
Banca Romana Pentru Dezvoltare 485,370 3,779,347 4.11RON 3,666,852Banca Transilvania Sa 9,873,700 2,471,202 2.70RON 2,482,596Biofarm Sa Bucuresti 3,350,050 591,577 0.65RON 482,524Compa S.a. 2,718,800 1,247,519 1.36RON 1,108,943Dafora Sa 4,308,000 604,997 0.66RON 826,763Impact Sa Bucharest 1,090,560 151,637 0.17RON 128,908Prodplast Sa 709,300 887,623 0.97RON 777,161
10,058,851 10.979,798,940
Aik Banka 10,455 1,300,160 1.42RSD 1,243,789Serbia
Alfa Plam Ad 1,317 342,528 0.37RSD 545,324Dunav Osiguranje A.d. 9,147 1,003,711 1.09RSD 1,512,177Komercijalna Bank A.d. 1,832 2,161,336 2.35RSD 2,699,297Messer Tehnogas Ad 1,123 320,535 0.35RSD 195,948Metalac Ad 4,140 220,631 0.24RSD 262,201Putevi Ad Reg 6,293 518,901 0.57RSD 317,597Tigar 10,450 226,024 0.25RSD 273,103
(expressed in EUR)Cost Evaluation % net
assetsCurrencyDescription
DANSKE FUND
as at December 31, 2007
Statement of Investments (continued)
The accompanying notes form an integral part of these financial statements.
Quantity
DANSKE FUND - TRANS - BALKAN
* See note 13 for more details
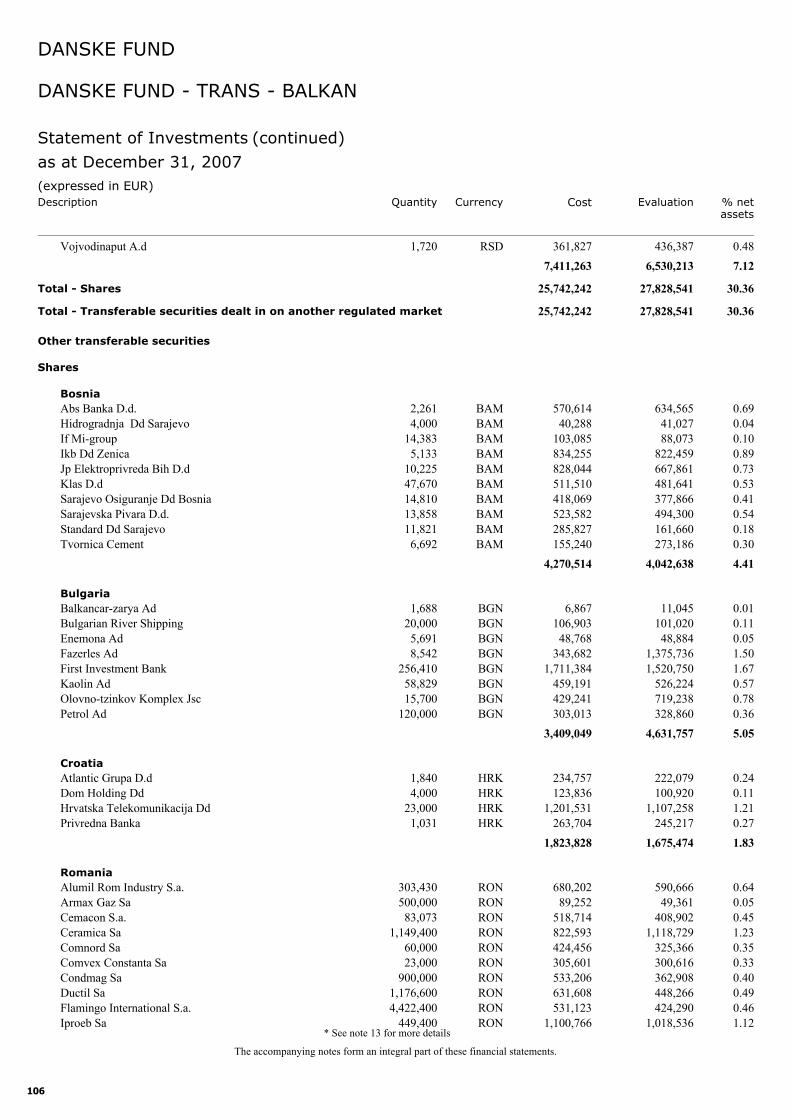
106
Vojvodinaput A.d 1,720 436,387 0.48RSD 361,8276,530,213 7.127,411,263
Total - Shares 27,828,541 30.3625,742,242
Total - Transferable securities dealt in on another regulated market 27,828,541 30.3625,742,242
Abs Banka D.d. 2,261 634,565 0.69BAM 570,614
Other transferable securities
Shares
Bosnia
Hidrogradnja Dd Sarajevo 4,000 41,027 0.04BAM 40,288If Mi-group 14,383 88,073 0.10BAM 103,085Ikb Dd Zenica 5,133 822,459 0.89BAM 834,255Jp Elektroprivreda Bih D.d 10,225 667,861 0.73BAM 828,044Klas D.d 47,670 481,641 0.53BAM 511,510Sarajevo Osiguranje Dd Bosnia 14,810 377,866 0.41BAM 418,069Sarajevska Pivara D.d. 13,858 494,300 0.54BAM 523,582Standard Dd Sarajevo 11,821 161,660 0.18BAM 285,827Tvornica Cement 6,692 273,186 0.30BAM 155,240
4,042,638 4.414,270,514
Balkancar-zarya Ad 1,688 11,045 0.01BGN 6,867Bulgaria
Bulgarian River Shipping 20,000 101,020 0.11BGN 106,903Enemona Ad 5,691 48,884 0.05BGN 48,768Fazerles Ad 8,542 1,375,736 1.50BGN 343,682First Investment Bank 256,410 1,520,750 1.67BGN 1,711,384Kaolin Ad 58,829 526,224 0.57BGN 459,191Olovno-tzinkov Komplex Jsc 15,700 719,238 0.78BGN 429,241Petrol Ad 120,000 328,860 0.36BGN 303,013
4,631,757 5.053,409,049
Atlantic Grupa D.d 1,840 222,079 0.24HRK 234,757Croatia
Dom Holding Dd 4,000 100,920 0.11HRK 123,836Hrvatska Telekomunikacija Dd 23,000 1,107,258 1.21HRK 1,201,531Privredna Banka 1,031 245,217 0.27HRK 263,704
1,675,474 1.831,823,828
Alumil Rom Industry S.a. 303,430 590,666 0.64RON 680,202Romania
Armax Gaz Sa 500,000 49,361 0.05RON 89,252Cemacon S.a. 83,073 408,902 0.45RON 518,714Ceramica Sa 1,149,400 1,118,729 1.23RON 822,593Comnord Sa 60,000 325,366 0.35RON 424,456Comvex Constanta Sa 23,000 300,616 0.33RON 305,601Condmag Sa 900,000 362,908 0.40RON 533,206Ductil Sa 1,176,600 448,266 0.49RON 631,608Flamingo International S.a. 4,422,400 424,290 0.46RON 531,123Iproeb Sa 449,400 1,018,536 1.12RON 1,100,766
(expressed in EUR)Cost Evaluation % net
assetsCurrencyDescription
DANSKE FUND
as at December 31, 2007
Statement of Investments (continued)
The accompanying notes form an integral part of these financial statements.
Quantity
DANSKE FUND - TRANS - BALKAN
* See note 13 for more details
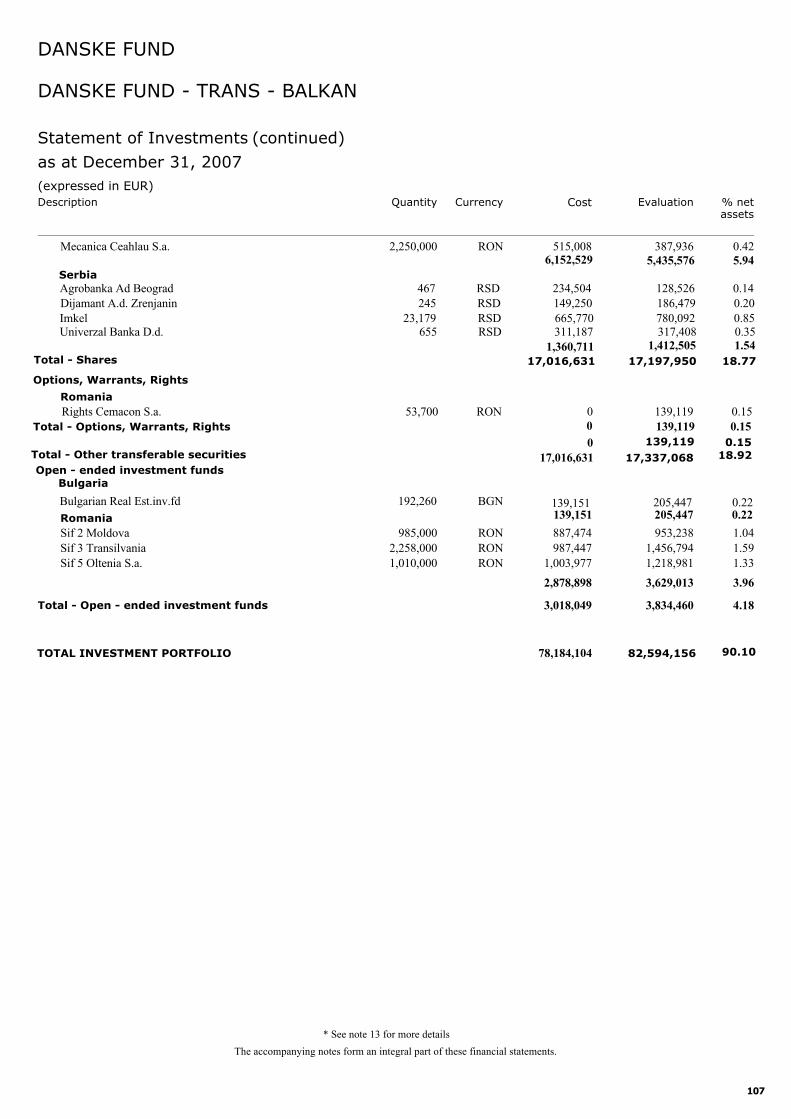
107
Mecanica Ceahlau S.a. 2,250,000 387,936 0.42RON 515,008
Sif 2 Moldova 985,000 953,238 1.04RON 887,474Romania
Sif 3 Transilvania 2,258,000 1,456,794 1.59RON 987,447Sif 5 Oltenia S.a. 1,010,000 1,218,981 1.33RON 1,003,977
3,629,013 3.962,878,898
Total - Open - ended investment funds 3,834,460 4.183,018,049
(expressed in EUR)Cost Evaluation % net
assetsCurrencyDescription
DANSKE FUND
as at December 31, 2007
Statement of Investments (continued)
The accompanying notes form an integral part of these financial statements.
Quantity
DANSKE FUND - TRANS - BALKAN
SerbiaAgrobanka Ad Beograd 467 RSD 234,504 128,526 0.14Dijamant A.d. Zrenjanin 245 RSD 149,250 186,479 0.20Imkel 23,179 RSD 665,770 780,092 0.85Univerzal Banka D.d. 655 RSD 311,187 317,408 0.35
1,360,711 1,412,505 1.54Total - Shares
6,152,529 5,435,576 5.94
Options, Warrants, Rights
RomaniaRights Cemacon S.a. 53,700 RON 0 139,119 0.15
17,016,631 17,197,950 18.77
0 139,119 0.15Total - Options, Warrants, Rights 0.15139,119
TOTAL INVESTMENT PORTFOLIO 90.1082,594,156 78,184,104
Bulgaria
0.22139,151 205,447 0.22
205,447 139,151Bulgarian Real Est.inv.fd 192,260 BGN
Open - ended investment fundsTotal - Other transferable securities
017,016,631 17,337,068 18.92
* See note 13 for more details
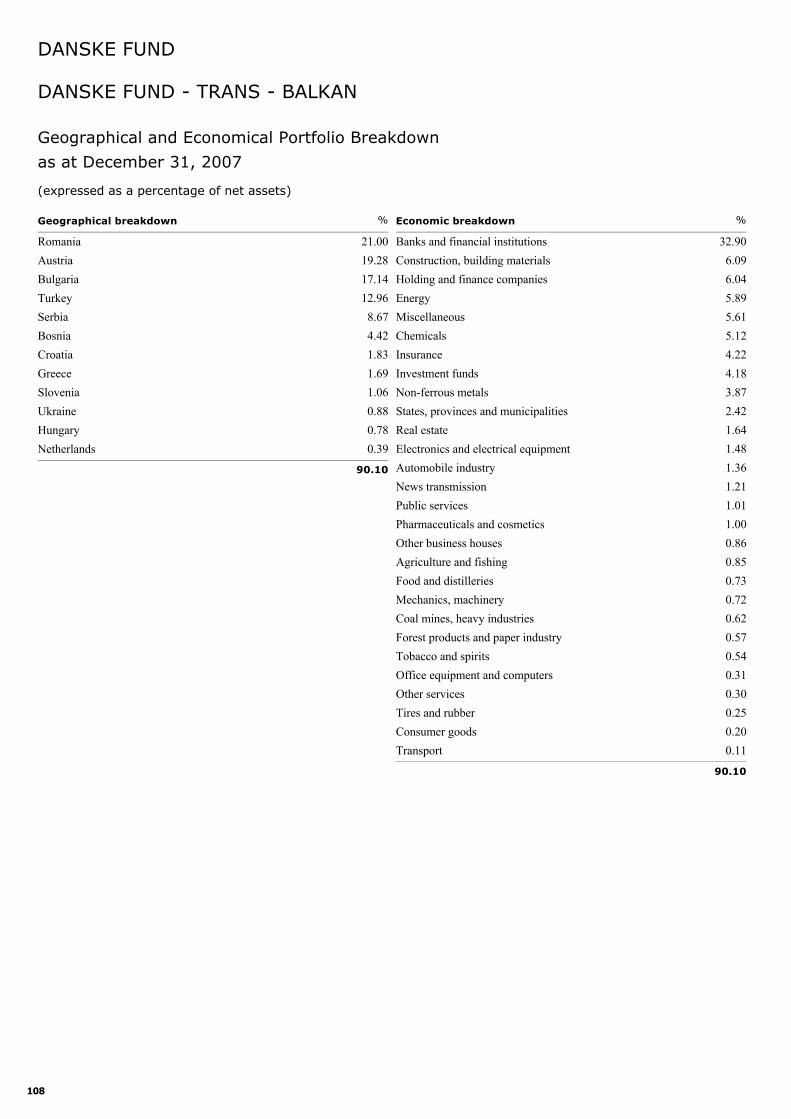
108
Romania 21.00Austria 19.28Bulgaria 17.14Turkey 12.96Serbia 8.67Bosnia 4.42Croatia 1.83Greece 1.69Slovenia 1.06Ukraine 0.88Hungary 0.78Netherlands 0.39
Geographical breakdown %
90.10
Banks and financial institutions 32.90Construction, building materials 6.09Holding and finance companies 6.04Energy 5.89Miscellaneous 5.61Chemicals 5.12Insurance 4.22Investment funds 4.18Non-ferrous metals 3.87States, provinces and municipalities 2.42Real estate 1.64Electronics and electrical equipment 1.48Automobile industry 1.36News transmission 1.21Public services 1.01Pharmaceuticals and cosmetics 1.00Other business houses 0.86Agriculture and fishing 0.85Food and distilleries 0.73Mechanics, machinery 0.72Coal mines, heavy industries 0.62Forest products and paper industry 0.57Tobacco and spirits 0.54Office equipment and computers 0.31Other services 0.30Tires and rubber 0.25Consumer goods 0.20Transport 0.11
Economic breakdown %
90.10
Geographical and Economical Portfolio Breakdown
DANSKE FUND - TRANS - BALKAN
DANSKE FUND
as at December 31, 2007
(expressed as a percentage of net assets)
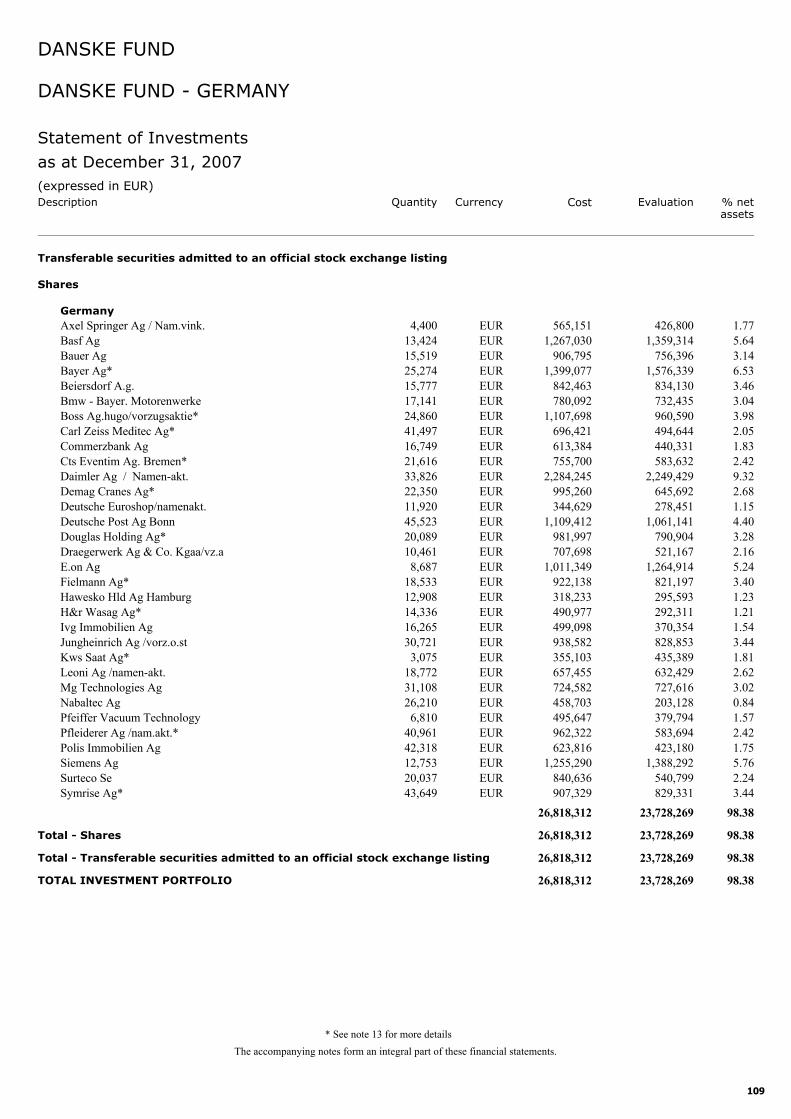
109
Axel Springer Ag / Nam.vink. 4,400 426,800 1.77EUR 565,151
Transferable securities admitted to an official stock exchange listing
Shares
Germany
Basf Ag 13,424 1,359,314 5.64EUR 1,267,030Bauer Ag 15,519 756,396 3.14EUR 906,795Bayer Ag* 25,274 1,576,339 6.53EUR 1,399,077Beiersdorf A.g. 15,777 834,130 3.46EUR 842,463Bmw - Bayer. Motorenwerke 17,141 732,435 3.04EUR 780,092Boss Ag.hugo/vorzugsaktie* 24,860 960,590 3.98EUR 1,107,698Carl Zeiss Meditec Ag* 41,497 494,644 2.05EUR 696,421Commerzbank Ag 16,749 440,331 1.83EUR 613,384Cts Eventim Ag. Bremen* 21,616 583,632 2.42EUR 755,700Daimler Ag / Namen-akt. 33,826 2,249,429 9.32EUR 2,284,245Demag Cranes Ag* 22,350 645,692 2.68EUR 995,260Deutsche Euroshop/namenakt. 11,920 278,451 1.15EUR 344,629Deutsche Post Ag Bonn 45,523 1,061,141 4.40EUR 1,109,412Douglas Holding Ag* 20,089 790,904 3.28EUR 981,997Draegerwerk Ag & Co. Kgaa/vz.a 10,461 521,167 2.16EUR 707,698E.on Ag 8,687 1,264,914 5.24EUR 1,011,349Fielmann Ag* 18,533 821,197 3.40EUR 922,138Hawesko Hld Ag Hamburg 12,908 295,593 1.23EUR 318,233H&r Wasag Ag* 14,336 292,311 1.21EUR 490,977Ivg Immobilien Ag 16,265 370,354 1.54EUR 499,098Jungheinrich Ag /vorz.o.st 30,721 828,853 3.44EUR 938,582Kws Saat Ag* 3,075 435,389 1.81EUR 355,103Leoni Ag /namen-akt. 18,772 632,429 2.62EUR 657,455Mg Technologies Ag 31,108 727,616 3.02EUR 724,582Nabaltec Ag 26,210 203,128 0.84EUR 458,703Pfeiffer Vacuum Technology 6,810 379,794 1.57EUR 495,647Pfleiderer Ag /nam.akt.* 40,961 583,694 2.42EUR 962,322Polis Immobilien Ag 42,318 423,180 1.75EUR 623,816Siemens Ag 12,753 1,388,292 5.76EUR 1,255,290Surteco Se 20,037 540,799 2.24EUR 840,636Symrise Ag* 43,649 829,331 3.44EUR 907,329
23,728,269 98.3826,818,312
Total - Shares 23,728,269 98.3826,818,312
Total - Transferable securities admitted to an official stock exchange listing 23,728,269 98.3826,818,312
TOTAL INVESTMENT PORTFOLIO 23,728,269 98.3826,818,312
(expressed in EUR)Cost Evaluation % net
assetsCurrencyDescription
DANSKE FUND
as at December 31, 2007
Statement of Investments
The accompanying notes form an integral part of these financial statements.
Quantity
DANSKE FUND - GERMANY
* See note 13 for more details
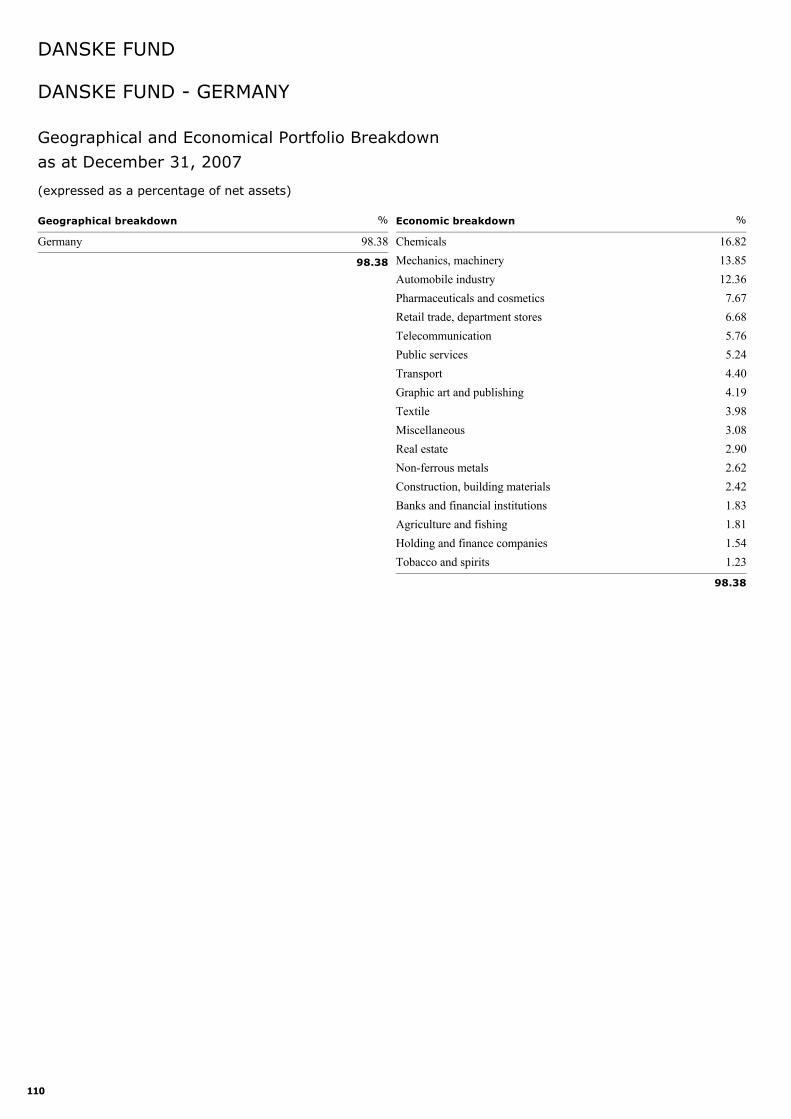
110
Germany 98.38
Geographical breakdown %
98.38
Chemicals 16.82Mechanics, machinery 13.85Automobile industry 12.36Pharmaceuticals and cosmetics 7.67Retail trade, department stores 6.68Telecommunication 5.76Public services 5.24Transport 4.40Graphic art and publishing 4.19Textile 3.98Miscellaneous 3.08Real estate 2.90Non-ferrous metals 2.62Construction, building materials 2.42Banks and financial institutions 1.83Agriculture and fishing 1.81Holding and finance companies 1.54Tobacco and spirits 1.23
Economic breakdown %
98.38
Geographical and Economical Portfolio Breakdown
DANSKE FUND - GERMANY
DANSKE FUND
as at December 31, 2007
(expressed as a percentage of net assets)
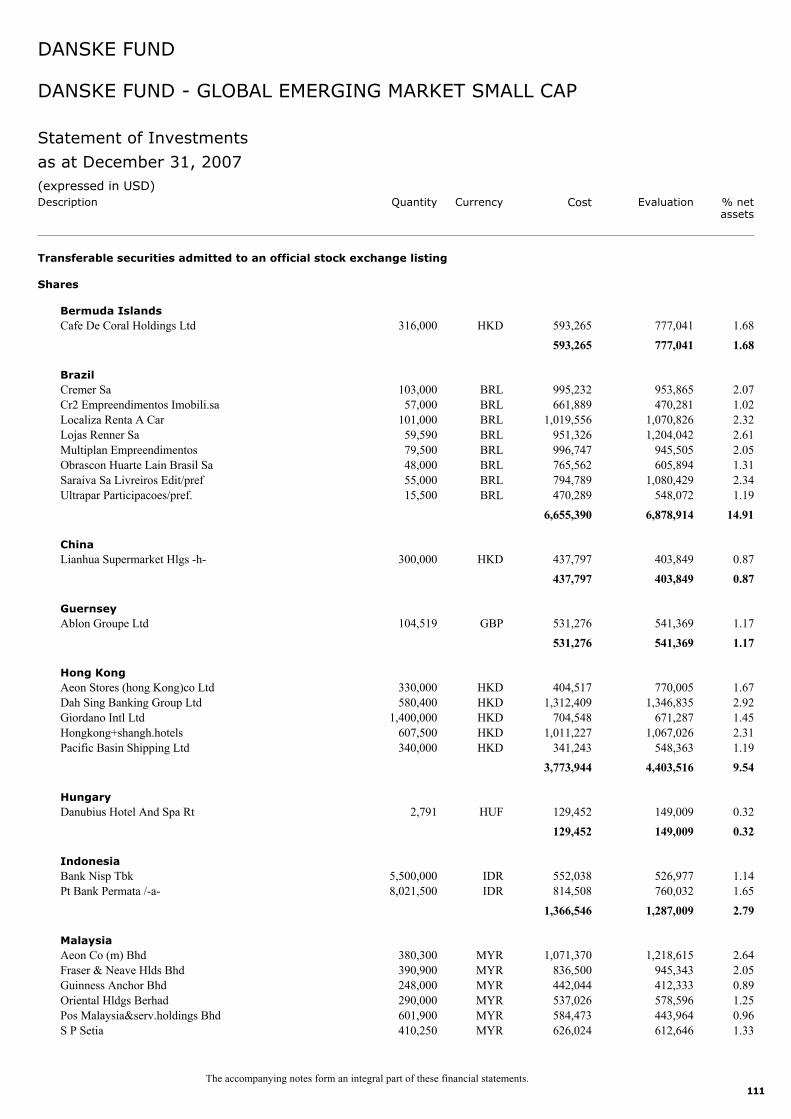
111
Cafe De Coral Holdings Ltd 316,000 777,041 1.68HKD 593,265
Transferable securities admitted to an official stock exchange listing
Shares
Bermuda Islands
777,041 1.68593,265
Cremer Sa 103,000 953,865 2.07BRL 995,232Brazil
Cr2 Empreendimentos Imobili.sa 57,000 470,281 1.02BRL 661,889Localiza Renta A Car 101,000 1,070,826 2.32BRL 1,019,556Lojas Renner Sa 59,590 1,204,042 2.61BRL 951,326Multiplan Empreendimentos 79,500 945,505 2.05BRL 996,747Obrascon Huarte Lain Brasil Sa 48,000 605,894 1.31BRL 765,562Saraiva Sa Livreiros Edit/pref 55,000 1,080,429 2.34BRL 794,789Ultrapar Participacoes/pref. 15,500 548,072 1.19BRL 470,289
6,878,914 14.916,655,390
Lianhua Supermarket Hlgs -h- 300,000 403,849 0.87HKD 437,797China
403,849 0.87437,797
Ablon Groupe Ltd 104,519 541,369 1.17GBP 531,276Guernsey
541,369 1.17531,276
Aeon Stores (hong Kong)co Ltd 330,000 770,005 1.67HKD 404,517Hong Kong
Dah Sing Banking Group Ltd 580,400 1,346,835 2.92HKD 1,312,409Giordano Intl Ltd 1,400,000 671,287 1.45HKD 704,548Hongkong+shangh.hotels 607,500 1,067,026 2.31HKD 1,011,227Pacific Basin Shipping Ltd 340,000 548,363 1.19HKD 341,243
4,403,516 9.543,773,944
Danubius Hotel And Spa Rt 2,791 149,009 0.32HUF 129,452Hungary
149,009 0.32129,452
Bank Nisp Tbk 5,500,000 526,977 1.14IDR 552,038Indonesia
Pt Bank Permata /-a- 8,021,500 760,032 1.65IDR 814,5081,287,009 2.791,366,546
Aeon Co (m) Bhd 380,300 1,218,615 2.64MYR 1,071,370Malaysia
Fraser & Neave Hlds Bhd 390,900 945,343 2.05MYR 836,500Guinness Anchor Bhd 248,000 412,333 0.89MYR 442,044Oriental Hldgs Berhad 290,000 578,596 1.25MYR 537,026Pos Malaysia&serv.holdings Bhd 601,900 443,964 0.96MYR 584,473S P Setia 410,250 612,646 1.33MYR 626,024
(expressed in USD)Cost Evaluation % net
assetsCurrencyDescription
DANSKE FUND
as at December 31, 2007
Statement of Investments
Quantity
DANSKE FUND - GLOBAL EMERGING MARKET SMALL CAP
The accompanying notes form an integral part of these financial statements.
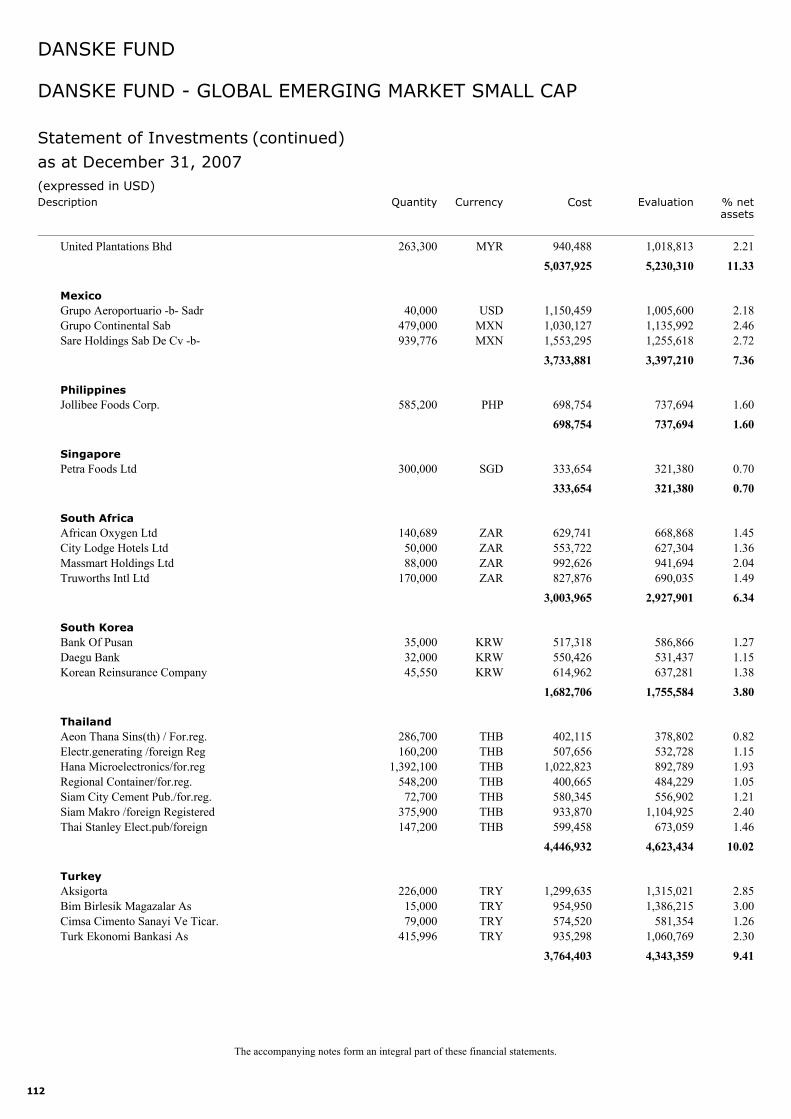
112
United Plantations Bhd 263,300 1,018,813 2.21MYR 940,4885,230,310 11.335,037,925
Grupo Aeroportuario -b- Sadr 40,000 1,005,600 2.18USD 1,150,459Mexico
Grupo Continental Sab 479,000 1,135,992 2.46MXN 1,030,127Sare Holdings Sab De Cv -b- 939,776 1,255,618 2.72MXN 1,553,295
3,397,210 7.363,733,881
Jollibee Foods Corp. 585,200 737,694 1.60PHP 698,754Philippines
737,694 1.60698,754
Petra Foods Ltd 300,000 321,380 0.70SGD 333,654Singapore
321,380 0.70333,654
African Oxygen Ltd 140,689 668,868 1.45ZAR 629,741South Africa
City Lodge Hotels Ltd 50,000 627,304 1.36ZAR 553,722Massmart Holdings Ltd 88,000 941,694 2.04ZAR 992,626Truworths Intl Ltd 170,000 690,035 1.49ZAR 827,876
2,927,901 6.343,003,965
Bank Of Pusan 35,000 586,866 1.27KRW 517,318South Korea
Daegu Bank 32,000 531,437 1.15KRW 550,426Korean Reinsurance Company 45,550 637,281 1.38KRW 614,962
1,755,584 3.801,682,706
Aeon Thana Sins(th) / For.reg. 286,700 378,802 0.82THB 402,115Thailand
Electr.generating /foreign Reg 160,200 532,728 1.15THB 507,656Hana Microelectronics/for.reg 1,392,100 892,789 1.93THB 1,022,823Regional Container/for.reg. 548,200 484,229 1.05THB 400,665Siam City Cement Pub./for.reg. 72,700 556,902 1.21THB 580,345Siam Makro /foreign Registered 375,900 1,104,925 2.40THB 933,870Thai Stanley Elect.pub/foreign 147,200 673,059 1.46THB 599,458
4,623,434 10.024,446,932
Aksigorta 226,000 1,315,021 2.85TRY 1,299,635Turkey
Bim Birlesik Magazalar As 15,000 1,386,215 3.00TRY 954,950Cimsa Cimento Sanayi Ve Ticar. 79,000 581,354 1.26TRY 574,520Turk Ekonomi Bankasi As 415,996 1,060,769 2.30TRY 935,298
4,343,359 9.413,764,403
(expressed in USD)Cost Evaluation % net
assetsCurrencyDescription
DANSKE FUND
as at December 31, 2007
Statement of Investments (continued)
The accompanying notes form an integral part of these financial statements.
Quantity
DANSKE FUND - GLOBAL EMERGING MARKET SMALL CAP
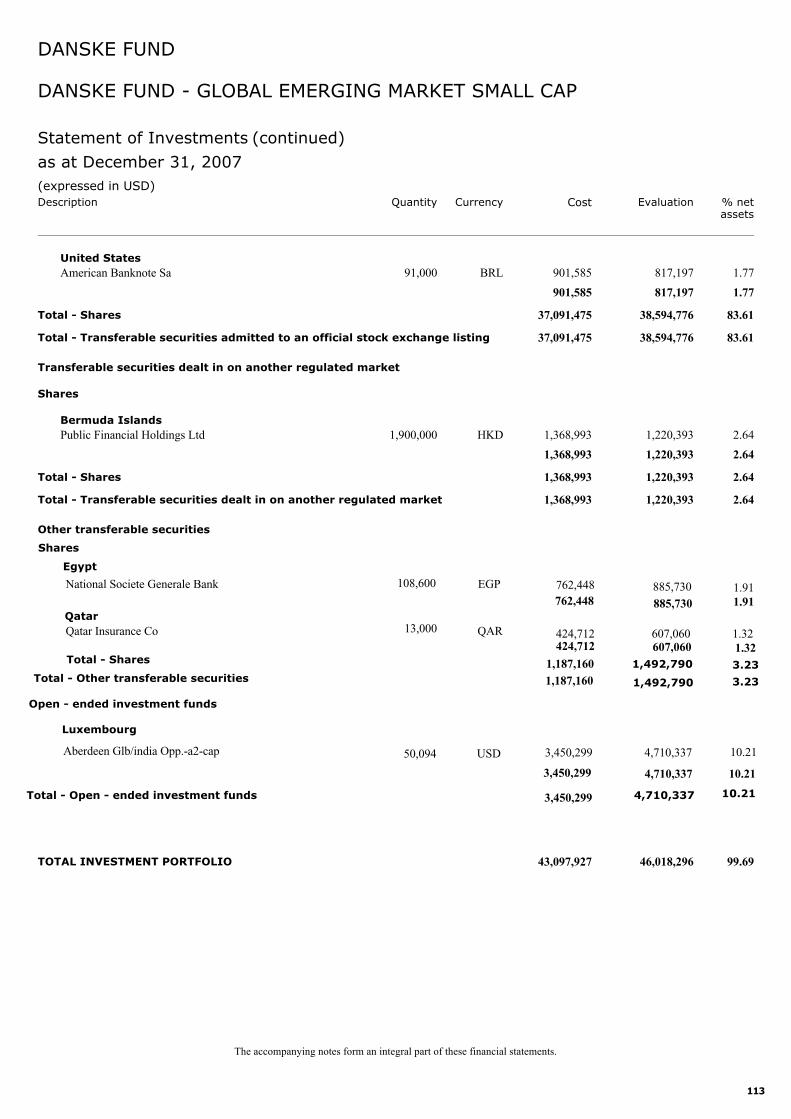
113
American Banknote Sa 91,000 817,197 1.77BRL 901,585United States
817,197 1.77901,585
Total - Shares 38,594,776 83.6137,091,475
Total - Transferable securities admitted to an official stock exchange listing 38,594,776 83.6137,091,475
Public Financial Holdings Ltd 1,900,000 1,220,393 2.64HKD 1,368,993
Transferable securities dealt in on another regulated market
Shares
Bermuda Islands
1,220,393 2.641,368,993
Total - Shares 1,220,393 2.641,368,993
Total - Transferable securities dealt in on another regulated market 1,220,393 2.641,368,993
Other transferable securities
TOTAL INVESTMENT PORTFOLIO 46,018,296 99.6943,097,927
(expressed in USD)Cost Evaluation % net
assetsCurrencyDescription
DANSKE FUND
as at December 31, 2007
Statement of Investments (continued)
The accompanying notes form an integral part of these financial statements.
Quantity
DANSKE FUND - GLOBAL EMERGING MARKET SMALL CAP
Open - ended investment funds
Luxembourg
Aberdeen Glb/india Opp.-a2-cap 10.214,710,337 50,094 3,450,299USD
QAR
3,450,299 4,710,337
Total - Open - ended investment funds 10.214,710,337 3,450,299
Shares
Egypt
National Societe Generale Bank 1.91 885,730 108,600 762,448EGP762,448 1.91885,730
QatarQatar Insurance Co 1.32607,060 13,000 424,712
424,712 607,060 1.32Total - Shares 3.231,492,790 1,187,160
Total - Other transferable securities 3.231,492,790 1,187,160
10.21
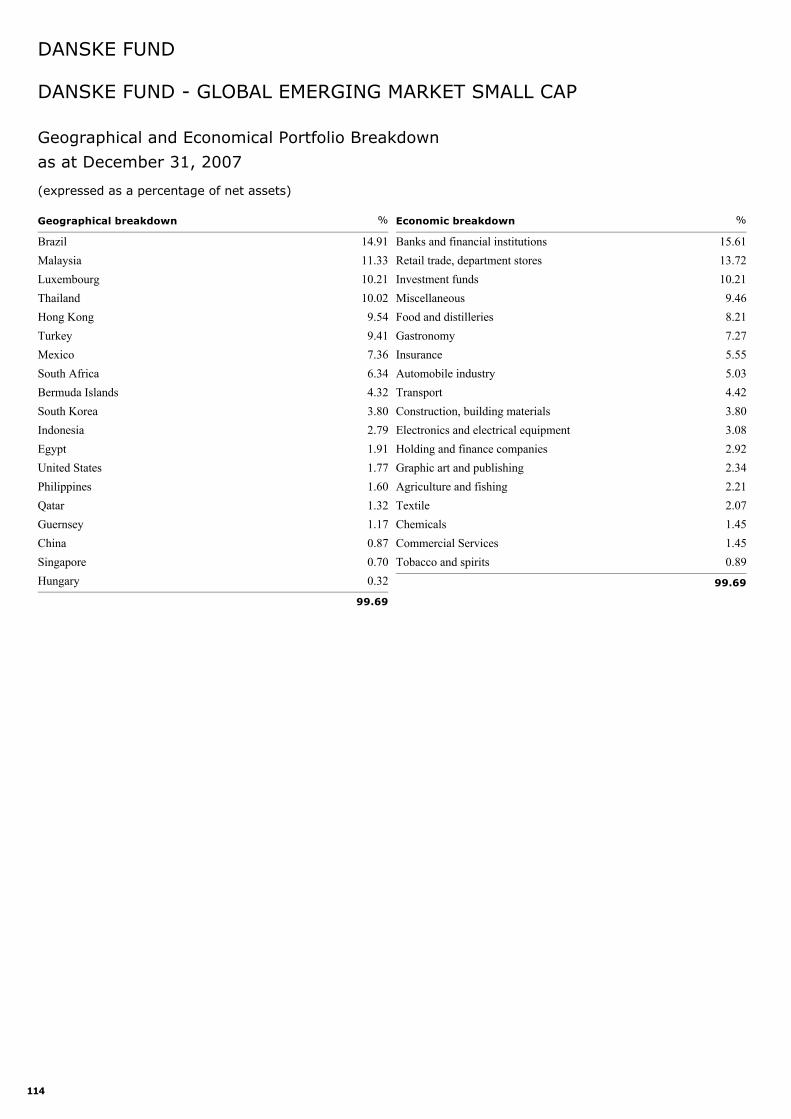
114
Brazil 14.91Malaysia 11.33Luxembourg 10.21Thailand 10.02Hong Kong 9.54Turkey 9.41Mexico 7.36South Africa 6.34Bermuda Islands 4.32South Korea 3.80Indonesia 2.79Egypt 1.91United States 1.77Philippines 1.60Qatar 1.32Guernsey 1.17China 0.87Singapore 0.70Hungary 0.32
Geographical breakdown %
99.69
Banks and financial institutions 15.61Retail trade, department stores 13.72Investment funds 10.21Miscellaneous 9.46Food and distilleries 8.21Gastronomy 7.27Insurance 5.55Automobile industry 5.03Transport 4.42Construction, building materials 3.80Electronics and electrical equipment 3.08Holding and finance companies 2.92Graphic art and publishing 2.34Agriculture and fishing 2.21Textile 2.07Chemicals 1.45Commercial Services 1.45Tobacco and spirits 0.89
Economic breakdown %
99.69
Geographical and Economical Portfolio Breakdown
DANSKE FUND - GLOBAL EMERGING MARKET SMALL CAP
DANSKE FUND
as at December 31, 2007
(expressed as a percentage of net assets)
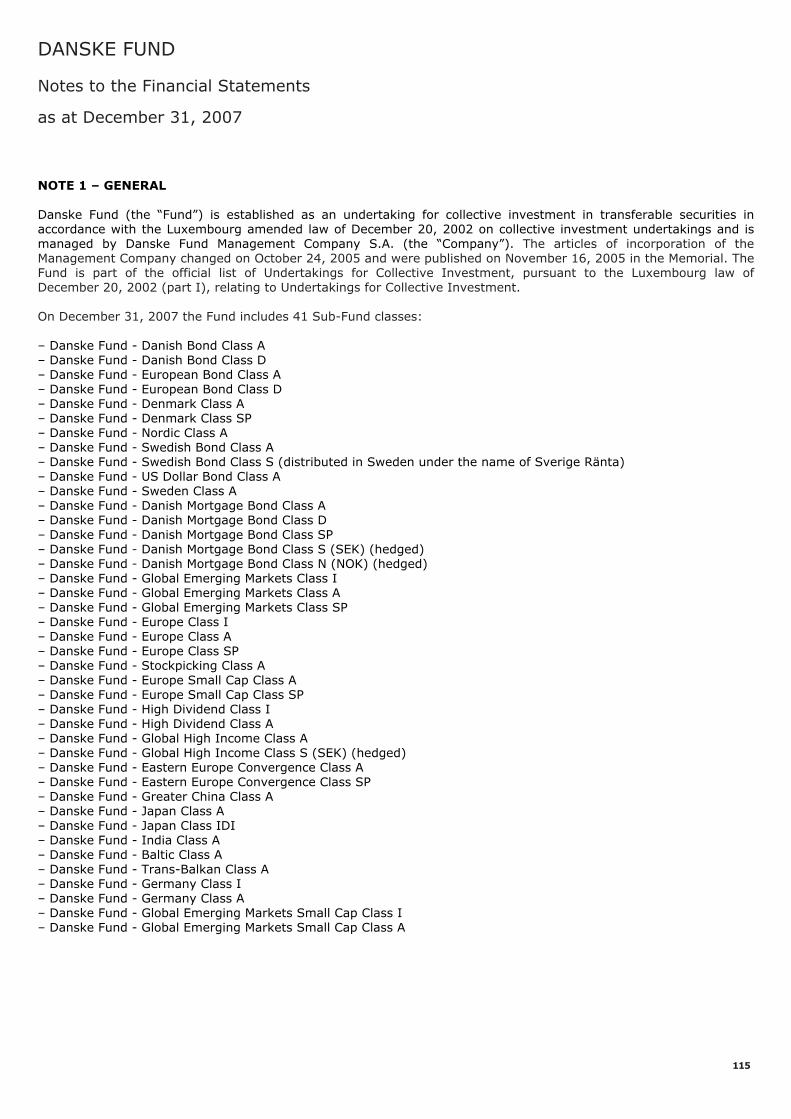
DANSKE FUND
Notes to the Financial Statements
as at December 31, 2007
115
NOTE 1 – GENERAL Danske Fund (the “Fund”) is established as an undertaking for collective investment in transferable securities in accordance with the Luxembourg amended law of December 20, 2002 on collective investment undertakings and is managed by Danske Fund Management Company S.A. (the “Company”). The articles of incorporation of the Management Company changed on October 24, 2005 and were published on November 16, 2005 in the Memorial. The Fund is part of the official list of Undertakings for Collective Investment, pursuant to the Luxembourg law of December 20, 2002 (part I), relating to Undertakings for Collective Investment. On December 31, 2007 the Fund includes 41 Sub-Fund classes: – Danske Fund - Danish Bond Class A – Danske Fund - Danish Bond Class D – Danske Fund - European Bond Class A – Danske Fund - European Bond Class D – Danske Fund - Denmark Class A – Danske Fund - Denmark Class SP – Danske Fund - Nordic Class A – Danske Fund - Swedish Bond Class A – Danske Fund - Swedish Bond Class S (distributed in Sweden under the name of Sverige Ränta) – Danske Fund - US Dollar Bond Class A – Danske Fund - Sweden Class A – Danske Fund - Danish Mortgage Bond Class A – Danske Fund - Danish Mortgage Bond Class D – Danske Fund - Danish Mortgage Bond Class SP – Danske Fund - Danish Mortgage Bond Class S (SEK) (hedged) – Danske Fund - Danish Mortgage Bond Class N (NOK) (hedged) – Danske Fund - Global Emerging Markets Class I – Danske Fund - Global Emerging Markets Class A – Danske Fund - Global Emerging Markets Class SP – Danske Fund - Europe Class I – Danske Fund - Europe Class A – Danske Fund - Europe Class SP – Danske Fund - Stockpicking Class A – Danske Fund - Europe Small Cap Class A – Danske Fund - Europe Small Cap Class SP – Danske Fund - High Dividend Class I – Danske Fund - High Dividend Class A – Danske Fund - Global High Income Class A – Danske Fund - Global High Income Class S (SEK) (hedged) – Danske Fund - Eastern Europe Convergence Class A – Danske Fund - Eastern Europe Convergence Class SP – Danske Fund - Greater China Class A – Danske Fund - Japan Class A – Danske Fund - Japan Class IDI – Danske Fund - India Class A – Danske Fund - Baltic Class A – Danske Fund - Trans-Balkan Class A – Danske Fund - Germany Class I – Danske Fund - Germany Class A – Danske Fund - Global Emerging Markets Small Cap Class I – Danske Fund - Global Emerging Markets Small Cap Class A
DANSKE FUND
Notes to the Financial Statements (continued)
as at December 31, 2007
116
NOTE 1 – GENERAL (continued) Significant Events during the year: a) Launch of new Sub-Funds - Danske Fund - German Class A and Class I were launched on May 22, 2007 - Danske Fund - Global Emerging Market Small Cap Class A and Class I were launched on April 10, 2007 b) Change of Name on April 20, 2007, the Sub-Fund Danske Fund - Global Stockpicking become Danske Fund - Stockpicking. c) Launch of new Sub-Classes - Danske Fund - High Dividend Class I was Launched on January 24, 2007. - Danske Fund - Global Emerging Market class I was launched on March 2, 2007. - Danske Fund - Europe Class I was launched on April 25, 2007. d) Mergers On April 20, 2007, Danske Fund - Global, Danske Fund - Global Biotech, Danske Fund - Global Healthcare merged into Danske fund - Stockpicking. On December 18, 2007, Danske Fund - North American Small Cap merged into Danske Fund - Stockpicking and Danske Fund - Danish Mortgage Short term merged into Danske Fund - Danish Mortgage Bond. NOTE 2 – INVESTMENT OBJECTIVES The investment objective of the Fund in each Sub-Fund is to achieve a high total return compatible with a sound diversification of risks. As per the prospectus dated April, 2007, the investment objective of each relevant Sub-Fund is as follows: Danske Fund - Danish Bond invests in transferable securities, mainly bonds denominated in Danish Krone. The bonds must be listed on an Official Stock Exchange. The total duration of the Sub-Fund, including cash holdings and adjusted for estimated premature redemption risk, must be between two and five years. For the purpose of hedging and/or efficient portfolio management, the Sub-Fund may use all the techniques and instruments described in Section 4.(B) of the Prospectus as well as the pooling and co-management described in Section 3.1 of the Prospectus. The Sub-Fund may invest up to 10% of its net assets in shares/units of other investment funds which comply with the rules set out in Section 4 of the Prospectus. Class A has an accumulation policy and Class D has a distribution policy. The Sub-Fund is expressed in Danish Krone (“DKK”).
DANSKE FUND
Notes to the Financial Statements (continued)
as at December 31, 2007
117
NOTE 2 – INVESTMENT OBJECTIVES (continued) Danske Fund - European Bond The Danske Fund - European Bond invests in transferable securities, mainly bonds denominated in Euro or in the national currencies of countries participating in the European Union (EU) or the European Economic Area (EEA) and of issuers of theses countries. The bonds must be listed on a) an Official Stock Exchange or b) dealt in on another market which operates regularly and is recognized and open to the public (a “Regulated Market”). At least 60% of the Sub-Funds investment must at any given time be placed in grandfathered bonds as defined in the Council Directive 2003/48/EC of June 3, 2003 (European Savings Directive). The total duration of the Sub-Fund, including cash holdings and adjusted for estimated premature redemption risk, must be between three and seven years. For the purpose of hedging and/or efficient portfolio management, the Sub-Fund may use all the techniques and instruments described in Section 4.(B) of the Prospectus as well as the pooling and co-management described in Section 3.1 of the Prospectus. The Sub-Fund may invest up to 10% of its net assets in shares/units of other investment funds which comply with the rules set out in Section 4 of the Prospectus. Class A has an accumulation policy and Class D has a distribution policy. The Sub-Fund is expressed in Euros (“EUR”). Danske Fund - Denmark invests in transferable securities, mainly equities and equity-related securities quoted on the Copenhagen Stock Exchange (Denmark). The investments will be made according to expected performance; sectors may be overweighted or underweighted accordingly. For the purpose of hedging and/or efficient portfolio management, the Sub-Fund may use all the techniques and instruments described in Section 4.(B) of the Prospectus as well as the pooling and co-management described in Section 3.1 of the Prospectus. The Sub-Fund may invest up to 10% of its net assets in shares/units of other investment funds which comply with the rules set out in Section 4 of the Prospectus. Class A and SP have an accumulation policy. The Sub-Fund is expressed in Danish Krone (“DKK”). Danske Fund - Nordic invests in transferable securities, mainly equities and equity-related securities quoted on one or several of the Official Stock Exchanges in the Nordic countries (Denmark, Finland, Norway and Sweden). The investments will be made according to expected performance; sectors, countries and currencies may be overweighted or underweighted accordingly. For the purpose of hedging and/or efficient portfolio management, the Sub-Fund may use all the techniques and instruments described in Section 4.(B) of the Prospectus as well as the pooling and co-management described in Section 3.1 of the Prospectus. The Sub-Fund may invest up to 10% of its net assets in shares/units of other investment funds which comply with the rules set out in Section 4 of the Prospectus. The Sub-Fund has an accumulation policy. The Sub-Fund is expressed in Euros (“EUR”). Danske Fund - Swedish Bond invests in transferable securities, mainly bonds denominated in Swedish Kroner. The bonds must be listed on an Official Stock Exchange. The total duration of the Sub-Fund, including cash holdings, must be between one to five years. For the purpose of hedging and/or efficient portfolio management, the Sub-Fund may use all the techniques and instruments described in Section 4.(B) of the Prospectus as well as the pooling and co-management described in Section 3.1 of the Prospectus. The Sub-Fund may invest up to 10% of its net assets in shares/units of other investment funds which comply with the rules set out in Section 4 of the Prospectus. Class A and Class S have an accumulation policy. The Sub-Fund is expressed in Swedish Krona (“SEK”). Class S is distributed in Sweden under the name of Sverige Ränta. Danske Fund - US Dollar Bond invests in transferable securities, mainly bonds denominated in American Dollars. The bonds must be a) an Official Stock Exchange or b) dealt in on another market which operates regularly and is recognized and open to the public (a “Regulated Market”). The total duration of the Sub-Fund, including cash holdings, must be between three and seven years. For the purpose of hedging and/or efficient portfolio management, the Sub-Fund may use all the techniques and instruments described in Section 4.(B) of the Prospectus as well as the pooling and co-management described in Section 3.1 of the Prospectus. The Sub-Fund may invest up to 10% of its net assets in shares/units of other investment funds which comply with the rules set out in Section 4 of the Prospectus. The Sub-Fund has an accumulation policy. The Sub-Fund is expressed in American Dollars (“USD”).
DANSKE FUND
Notes to the Financial Statements (continued)
as at December 31, 2007
118
NOTE 2 – INVESTMENT OBJECTIVES (continued) Danske Fund - Sweden invests in transferable securities, mainly equities and equity-related securities quoted on the Stockholm Stock Exchange (Sweden). The investments will be made according to expected performance; sectors may be overweighted or underweighted accordingly. For the purpose of hedging and/or efficient portfolio management, the Sub-Fund may use all the techniques and instruments described in Section 4.(B) of the Prospectus as well as the pooling and co-management described in Section 3.1 of the Prospectus. The Sub-Fund may invest up to 10% of its net assets in shares/units of other investment funds which comply with the rules set out in Section 4 of the Prospectus. Class A has an accumulation policy. The Sub-Fund is expressed in Swedish Krona (“SEK”). Danske Fund - Danish Mortgage Bond invests in bonds issued by Danish mortgage credit institutions and listed on the Copenhagen Stock Exchange. The bonds are denominated in Danish Kroner. The total duration of the Sub-Fund, including cash holdings and adjusted for estimated premature redemption risk, must be between three and nine years. For the purpose of hedging and/or efficient portfolio management, the Sub-Fund may use all the techniques and instruments described in Section 4.(B) of the Prospectus as well as the pooling and co-management described in Section 3.1 of the Prospectus. For the purpose of efficient portfolio management, the Sub-Fund may use options on portfolio securities, financial futures as well as options on such futures which are denominated in other currencies than the underlying assets and/or in other currencies than the reference currency of the Sub-Fund. The Sub-Fund may invest up to 10% of its net assets in shares/units of other investment funds which comply with the rules set out in Section 4 of the Prospectus. Class A and SP have an accumulation policy and Class D has a distribution policy. The Sub-Fund is expressed in Danish Krona (“DKK”). Danske Fund - Global Emerging Markets invests in transferable securities, mainly equities and equity-related securities quoted on various Official Stock Exchanges in emerging markets. The investment in emerging markets countries may include, but will not be limited to investment in the countries mentioned in the following paragraph. The investments will be made according to expected performance; sectors, countries and currencies may be overweighted or underweighted accordingly. List of countries: Mexico, Brazil, Chile, Argentina, Peru, Venezuela, Colombia, Korea, Taiwan, Hong Kong, China, Malaysia, Thailand, Indonesia, Philippines, India, Sri Lanka, Russia (with maximum 10% of the net assets), Poland, Hungary, Czech Republic, Estonia, Lithuania, Latvia, Slovenia, Slovakia, Croatia, Romania, Turkey, Israel, Egypt, Jordan, Morocco, South Africa, Bulgaria and Cyprus, and in other emerging market countries as defined by the emerging markets classification of Standard and Poor’s/IFCG and Standard and Poor’s/Frontier Markets. Furthermore the Sub-Fund is allowed to invest in companies with a major part of their business in emerging markets but quoted in other OECD countries. The Sub-Fund may invest in securities of developing countries, including Eastern Europe, with new or developing capital markets. These countries may have relatively unstable governments, economies based on only a few industries and securities markets that trade a limited number of securities. Securities of issuers located in these countries tend to have volatile prices and offer the potential for substantial losses as well as gains. Undertakings for collective investment, which invest their assets in these countries, are subject to the same risks. In addition, these securities may be less liquid than investments in more established markets as a result of inadequate trading volume or restrictions on trading imposed by the governments of such countries. In addition, developing markets may have increased risks associated with clearance and settlement. Delays in settlement could result in periods of uninvested assets, missed investment opportunities or losses to the Sub-Fund. Furthermore, investments in Russia are currently subject to certain heightened risks with regard to the ownership and custody of securities. In Russia this is evidenced by entries in the books of a company or its registrar (which is neither an agent nor responsible to the Custodian).
DANSKE FUND
Notes to the Financial Statements (continued)
as at December 31, 2007
119
NOTE 2 – INVESTMENT OBJECTIVES (continued) No certificates representing ownership of Russian companies will be held by the Custodian or any of its local correspondents or in an effective central depository system. As a result of this system and the lack of the effective state regulation and enforcement, the Sub-Fund could lose its registration and ownership of Russian securities through fraud, negligence or even mere oversight. In addition, Russian debt securities have an increased custodial risk associated with them as such securities are, in accordance with market practice, held in custody with Russian institutions which may not have adequate insurance coverage to cover loss due to theft, destruction or default whilst such assets are in its custody. The Sub-Fund's investments in Russia, combined with investments that are made in other assets than Transferable Securities as defined in section 4.1 through 4.5 of the Prospectus, shall not exceed 10% of the net assets of the Sub-Fund. For the purpose of hedging and/or efficient portfolio management, the Sub-Fund may use all the techniques and instruments described in Section 4.(B) of the Prospectus as well as the pooling and co-management described in Section 3.1 of the Prospectus. The Sub-Fund may invest up to 10% of its net assets in shares/units of other investment funds which comply with the rules set out in Section 4 of the Prospectus. Class A and SP have an accumulation policy. The Sub-Fund is expressed in American Dollars (“USD”). Danske Fund – Europe invests in transferable securities, mainly equities and equity-related securities quoted on various Official Stock Exchanges in all countries of Europe except for Russia. The investments will be made according to expected performance; sectors, countries and currencies may be overweighted or underweighted accordingly. The Sub-Fund may invest in securities of developing countries, including Eastern Europe, with new or developing capital markets. These countries may have relatively unstable governments, economies based on only a few industries and securities markets that trade a limited number of securities. Securities of issuers located in these countries tend to have volatile prices and offer the potential for substantial losses as well as gains. Undertakings for collective investment, which invest their assets in these countries, are subject to the same risks. In addition, these securities may be less liquid than investments in more established markets as a result of inadequate trading volume or restrictions on trading imposed by the governments of such countries. In addition, developing markets may have increased risks associated with clearance and settlement. Delays in settlement could result in periods of uninvested assets, missed investment opportunities or losses to the Sub-Fund. For the purpose of hedging and/or efficient portfolio management, the Sub-Fund may use all the techniques and instruments described in Section 4.(B) of the Prospectus as well as the pooling and co-management described in Section 3.1 of the Prospectus. The Sub-Fund may invest up to 10% of its net assets in shares/units of other investment funds which comply with the rules set out in Section 4 of the Prospectus. Class A and SP have an accumulation policy. Class I is intended for institutional investors. The Sub-Fund is expressed in Euros (“EUR”).
DANSKE FUND
Notes to the Financial Statements (continued)
as at December 31, 2007
120
NOTE 2 – INVESTMENT OBJECTIVES (continued) Danske Fund - Stockpicking invests in transferable securities, mainly equities and equity-related securities quoted on various Official Stock Exchanges worldwide. The Sub-Fund will be invested in those shares, which are expected to give the highest return without consideration to a diversification based on countries, sectors and/or currencies. It is to be expected that this Sub-Fund will be characterised by greater price fluctuations than would be the case for a traditional portfolio with a global investment universe. For the purpose of hedging and/or efficient portfolio management, the Sub-Fund may use all the techniques and instruments described in Section 4.(B) of the Prospectus as well as the pooling and co-management described in Section 3.1 of the Prospectus. The Sub-Fund may invest up to 10% of its net assets in shares/units of other investment funds which comply with the rules set out in Section 4 of the Prospectus. The Sub-Fund has an accumulation policy. The Sub-Fund is expressed in Euros (“EUR”). Danske Fund - Europe Small Cap invests in transferable securities, mainly equities and equity-related securities of small and medium sized companies listed on Official Stock Exchanges in the Europe except Russia. The Sub-Fund seeks a stable long-term return that exceeds the average return on the shares of small and medium sized European companies. The Sub-Fund may invest in securities of developing countries, including Eastern Europe, with new or developing capital markets. These countries may have relatively unstable governments, economies based on only a few industries and securities markets that trade a limited number of securities. Securities of issuers located in these countries tend to have volatile prices and offer the potential for substantial losses as well as gains. Undertakings for collective investment, which invest their assets in these countries, are subject to the same risks. In addition, these securities may be less liquid than investments in more established markets as a result of inadequate trading volume or restrictions on trading imposed by the governments of such countries. In addition, developing markets may have increased risks associated with clearance and settlement. Delays in settlement could result in periods of uninvested assets, missed investment opportunities or losses to the Sub-Fund.
DANSKE FUND
Notes to the Financial Statements (continued)
as at December 31, 2007
121
NOTE 2 – INVESTMENT OBJECTIVES (continued) For the purpose of hedging and/or efficient portfolio management, the Sub-Fund may use all the techniques and instruments described in Section 4.(B) of the Prospectus as well as the pooling and co-management described in Section 3.1 of the Prospectus. The Sub-Fund may invest up to 10% of its net assets in shares/units of other investment funds which comply with the rules set out in Section 4 of the Prospectus. Class A and SP have an accumulation policy. The Sub-Fund is expressed in Euros (“EUR”). Danske Fund - High Dividend invests in transferable securities, mainly equities and equity-related securities quoted on various Official Stock Exchanges. The investments will be made in companies, which are expected to generate high levels of direct dividends. The companies chosen in this Sub-Fund will typically have been existing for a number of years and furthermore have a well established position in the relevant market for their products/services. For the purpose of hedging and/or efficient portfolio management, the Sub-Fund may use all the techniques and instruments described in Section 4.(B) of the Prospectus as well as the pooling and co-management described in Section 3.1 of the Prospectus. The Sub-Fund may invest up to 10% of its net assets in shares/units of other investment funds which comply with the rules set out in Section 4 of the Prospectus. Class A has an accumulation policy. The Sub-Fund is expressed in Euros (“EUR”). Danske Fund - Global High Income invests in transferable securities, mainly bonds globally, which are a) listed on an Official Stock Exchange or b) dealt in on another market which operates regularly and is recognized and open to the public (a “Regulated Market”) located in any Member State of the European Union or the OECD, or any other country of Western or Eastern Europe, Asia, Oceania, the American continents or Africa. The Sub-Fund's net assets will generally be invested in bonds with credit ratings between A1/A+ and Baa3/BBB- at Moody’s, Fitch or Standard & Poors, or a corresponding rating at another recognised first class rating institute. The rating criterion is based on the individual issuer’s rating if such a rating exists or on the issuers' general long-term rating for Euro denominated debt. Bonds with credit rating below Baa3/BBB- and bonds with no rating must not exceed 10% of the total Net Asset Value of the Sub-Fund. The aim is a wide spread of debtors and segments. The Sub-Fund’s net assets may be invested in government bonds. At least 75% of total Net Asset Value of the Sub-Fund shall be denominated in Euro, or be hedged into Euro. It is to be expected that the bonds this Sub-Fund will invest in will be characterised by higher volatility than would be the case for bond investments in a traditional portfolio with a global investment universe. Lower rated bonds are considered predominantly speculative by traditional investment standards and of lower credit quality. In addition, bonds are subject to the risk of an issuer's inability to meet principal and interest payments on the obligation (credit risk) and may also be subject to general market liquidity (market risk). Lower rated bonds are more likely to react to developments affecting the market and credit risk than more highly rated securities. The Sub-Fund may invest in bonds of developing countries, including Eastern Europe, with new or developing capital markets. These countries may have relatively unstable governments, economies based on only a few industries and bonds markets that trade a limited number of bonds. Bonds of issuers located in these countries tend to have volatile prices and offer the potential for substantial losses as well as gains. Undertakings for collective investment, which invest their assets in these countries, are subject to the same risks. In addition, these bonds may be less liquid than investments in more established markets as a result of inadequate trading volume or restrictions on trading imposed by the governments of such countries. In addition, developing markets may have increased risks associated with clearance and settlement. Delays in settlement could result in periods of uninvested assets, missed investment opportunities or losses to the Sub-Fund.
DANSKE FUND
Notes to the Financial Statements (continued)
as at December 31, 2007
122
NOTE 2 – INVESTMENT OBJECTIVES (continued) Furthermore, investments in Russia are currently subject to certain heightened risks with regard to the ownership and custody of securities. In Russia this is evidenced by entries in the books of a company or its registrar (which is neither an agent nor responsible to the Custodian). No certificates representing ownership of Russian companies will be held by the Custodian or any of its local correspondents or in an effective central depository system. As a result of this system and the lack of the effective state regulation and enforcement, the Sub-Fund could lose its registration and ownership of Russian bonds through fraud, negligence or even mere oversight. In addition, Russian debt securities have an increased custodial risk associated with them as such bonds are, in accordance with market practice, held in custody with Russian institutions which may not have adequate insurance coverage to cover loss due to theft, destruction or default whilst such assets are in its custody. The Sub-Fund's investments in Russia, combined with investments that are made in other assets than Transferable Securities as defined in section 4.1 through 4.5 of the Prospectus, shall not exceed 10% of the net assets of the Sub-Fund. For the purpose of hedging and/or efficient portfolio management, the Sub-Fund may use all the techniques and instruments described in Section 4.(B) of the Prospectus as well as the pooling and co-management described in Section 3.1 of the Prospectus. The Sub-Fund may invest up to 10% of its net assets in shares/units of other investment funds which comply with the rules set out in Section 4 of the Prospectus. The total duration of the Sub-Fund, including cash holdings, will be between three and seven years. Class A has an accumulation policy. The Sub-Fund is expressed in Euros (“EUR”). Danske Fund - Eastern Europe Convergence invests in transferable securities, mainly equities and equity-related securities quoted on various Official Stock Exchanges primarily in Eastern Europe except Russia. The investments in Eastern Europe may include, but will not be limited to investment in the hereunder countries. The investments will be made according to expected performance; sectors, countries and currencies may be overweighted or underweighted accordingly. List of countries: Poland, Hungary, Czech Republic, Estonia, Latvia, Lithuania, Slovenia, Slovakia, Romania, Bulgaria, Croatia, Ukraine, Turkey, Malta, Cyprus and other Eastern European countries that are members of either OECD or the European Union. Furthermore the Sub-Fund is allowed to invest in companies with a major part of their business in Eastern European markets but quoted on Official Stock Exchanges in other OECD countries as well as in companies quoted in EU countries and EU Candidate countries. The Sub-Fund may invest in securities of developing countries, including Eastern Europe, with new or developing capital markets. These countries may have relatively unstable governments, economies based on only a few industries and securities markets that trade a limited number of securities. Securities of issuers located in these countries tend to have volatile prices and offer the potential for substantial losses as well as gains. Undertakings for collective investment, which invest their assets in these countries, are subject to the same risks. In addition, these securities may be less liquid than investments in more established markets as a result of inadequate trading volume or restrictions on trading imposed by the governments of such countries. In addition, developing markets may have increased risks associated with clearance and settlement. Delays in settlement could result in periods of uninvested assets, missed investment opportunities or losses to the Sub-Fund. For the purpose of hedging and/or efficient portfolio management, the Sub-Fund may use all the techniques and instruments described in Section 4.(B) of the Prospectus as well as the pooling and co-management described in Section 3.1 of the Prospectus. The Sub-Fund may invest up to 10% of its net assets in shares/units of other investment funds which comply with the rules set out in Section 4 of the Prospectus. Class A and SP have an accumulation policy. The Sub-Fund is expressed in Euros (“EUR”).
DANSKE FUND
Notes to the Financial Statements (continued)
as at December 31, 2007
123
NOTE 2 – INVESTMENT OBJECTIVES (continued) Danske Fund - Greater China invests in transferable securities, mainly equities and equity-related securities issued by companies located in or with main activities within the Peoples Republic of China, the Republic of China (Taiwan) or Hong Kong. The equities and equity-related securities must be quoted on various Official Stock Exchanges or other publicly recognised and regulated market. The Sub-Fund may invest in securities of developing countries, with new or developing capital markets. These countries may have relatively unstable governments, economies based on only a few industries and securities markets that trade a limited number of securities. Securities of issuers located in these countries tend to have volatile prices and offer the potential for substantial losses as well as gains. Undertakings for collective investment, which invest their assets in these countries, are subject to the same risks. In addition, these securities may be less liquid than investments in more established markets as a result of inadequate trading volume or restrictions on trading imposed by the governments of such countries. In addition, developing markets may have increased risks associated with clearance and settlement. Delays in settlement could result in periods of uninvested assets, missed investment opportunities or losses to the Sub-Fund. For the purpose of hedging and/or efficient portfolio management, the Sub-Fund may use all the techniques and instruments described in Section 4.(B) of the Prospectus as well as the pooling and co-management described in Section 3.1 of the Prospectus. The Sub-Fund may invest up to 10% of its net assets in shares / units of other investment funds which comply with the rules set out in Section 4 of the Prospectus. The Sub-Fund has an accumulation policy. The Sub-Fund is expressed in American Dollars (“USD”). Danske Fund - Japan invests in transferable securities, mainly equities and equity-related securities quoted on Official Stock Exchanges in Japan. Part of the portfolio, up to 10% of its net assets, can be invested outside Japan. The investments will be made according to expected performance; sectors may be overweighted or underweighted accordingly. For the purpose of hedging and/or efficient portfolio management, the Sub-Fund may use all the techniques and instruments described in Section 4.(B) of the Prospectus as well as the pooling and co-management described in Section 3.1 of the Prospectus. The Sub-Fund may invest up to 10% of its net assets in shares/units of other investment funds which comply with the rules set out in Section 4 of the Prospectus. Class A and Class IDI have an accumulation policy. The Sub-Fund is expressed in Japanese Yen (“YEN”).
DANSKE FUND
Notes to the Financial Statements (continued)
as at December 31, 2007
124
NOTE 2 – INVESTMENT OBJECTIVES (continued) Danske Fund - India invests in transferable securities in India, mainly equities and equity-related securities quoted on various stock exchanges in India. Furthermore the fund is allowed to invest in companies traded on exchanges outside India, which have a majority of their business activities in India. The Sub-fund and the Net Asset Value and liquidity of the Units may be affected generally by exchange rates and controls, interest rates, changes in Indian governmental policy, taxation, social and religious instability and political, economic or other developments in or affecting India. Furthermore, the economy of India may differ favorably or unfavorably from the economies of other more developed countries, including in the rate of growth of gross domestic product, the rate of inflation, capital reinvestment, availability of resources, self-sufficiency and balance of payments position. Agriculture occupies a more prominent position in the Indian economy than in many more developed countries and the Indian economy therefore is more susceptible to adverse changes in weather. Power shortages, which may directly or indirectly disrupt commerce, frequently occur in nearly all regions of India. Also, because the Government of India exercises significant influence over many aspects of the Indian economy, Government actions in the future could have a significant impact on the Indian economy, which in turn could affect issuers of the securities in which the Fund invests. Market conditions and the prices and yields of securities in the Fund's portfolio. For the purpose of hedging and/or efficient portfolio management, the Sub-Fund may use all the techniques and instruments described in Section 4.(B) of the Prospectus as well as the pooling and co-management described in Section 3.1 of the Prospectus. The Sub-Fund may invest up to 10% of its net assets in shares/units of other investment funds which comply with the rules set out in Section 4 of the Prospectus. The Sub-Fund has an accumulation policy. The Sub-Fund is expressed in American Dollars (“USD”). Danske Fund – Baltic invests in transferable securities, mainly equities and equity-related securities quoted on various Official Stock Exchanges primarily in the Balkan region. The investments in the Balkan region may include, but will not be limited to investment in the hereunder countries provided that they are qualified as regulated markets. The investments will be made according to expected performance; sectors, countries and currencies may be overweighted or underweighted accordingly. List of countries for Baltic: Estonia, Latvia and Lithuania. Furthermore the Sub-Fund is allowed to invest in companies with a major part of their business in Balkan markets but quoted on Official Stock Exchanges in other OECD countries. The Sub-Fund may invest in securities of developing countries, including Eastern Europe, with new or developing capital markets. These countries may have relatively unstable governments, economies based on only a few industries and securities markets that trade a limited number of securities. Securities of issuers located in these countries tend to have volatile prices and offer the potential for substantial losses as well as gains. Undertakings for collective investment, which invest their assets in these countries, are subject to the same risks. In addition, these securities may be less liquid than investments in more established markets as a result of inadequate trading volume or restrictions on trading imposed by the governments of such countries. In addition, developing markets may have increased risks associated with clearance and settlement. Delays in settlement could result in periods of uninvested assets, missed investment opportunities or losses to the Sub-Fund. For the purpose of hedging and/or efficient portfolio management, the Sub-Fund may use all the techniques and instruments described in Section 4.(B) of the Prospectus as well as the pooling and co-management described in Section 3.1 of the Prospectus. The Sub-Fund may invest up to 10% of its net assets in shares / units of other investment funds which comply with the rules set out in Section 4 of the Prospectus.
DANSKE FUND
Notes to the Financial Statements (continued)
as at December 31, 2007
125
NOTE 2 – INVESTMENT OBJECTIVES (continued) Danske Fund - Trans-Balkan invests in transferable securities, mainly equities and equity-related securities quoted on various Official Stock Exchanges primarily in the Balkan region. The investments in the Balkan region may include, but will not be limited to investment in the hereunder countries provided that they are qualified as regulated markets. The investments will be made according to expected performance; sectors, countries and currencies may be overweighted or underweighted accordingly. List of countries for Trans-Balkan: Bulgaria, Croatia, Romania, Slovenia, Serbia & Montenegro, Greece and Turkey. Furthermore the Sub-Fund is allowed to invest in companies with a major part of their business in Balkan markets but quoted on Official Stock Exchanges in other OECD countries. The Sub-Fund may invest in securities of developing countries, including Eastern Europe, with new or developing capital markets. These countries may have relatively unstable governments, economies based on only a few industries and securities markets that trade a limited number of securities. Securities of issuers located in these countries tend to have volatile prices and offer the potential for substantial losses as well as gains. Undertakings for collective investment, which invest their assets in these countries, are subject to the same risks. In addition, these securities may be less liquid than investments in more established markets as a result of inadequate trading volume or restrictions on trading imposed by the governments of such countries. In addition, developing markets may have increased risks associated with clearance and settlement. Delays in settlement could result in periods of uninvested assets, missed investment opportunities or losses to the Sub-Fund. For the purpose of hedging and/or efficient portfolio management, the Sub-Fund may use all the techniques and instruments described in Section 4.(B) of the Prospectus as well as the pooling and co-management described in Section 3.1 of the Prospectus. The Sub-Fund may invest up to 10% of its net assets in shares / units of other investment funds which comply with the rules set out in Section 4 of the Prospectus. Danske Fund – Germany invests in transferable securities, mainly equities and equity-related securities issued by companies located in or with main activities within Germany. The equities and equity-related securities must be quoted on various Official Stock Exchanges or other publicly recognised and regulated market. For the purpose of hedging and/or efficient portfolio management, the Sub-Fund may use all the techniques and instruments described in Section 4.(B) of the Prospectus as well as the pooling and co-management described in Section 3.1 of the Prospectus. The Sub-Fund may invest up to 10% of its net assets in shares / units of other investment funds which comply with the rules set out in Section 4 of the Prospectus.
DANSKE FUND
Notes to the Financial Statements (continued)
as at December 31, 2007
126
NOTE 2 – INVESTMENT OBJECTIVES (continued) Danske Fund - Global Emerging Markets Small Cap invests in transferable securities, mainly equities and equity-related securities of small and medium sized companies quoted on various Official Stock Exchanges in emerging markets. The investment inemerging markets countries may include, but will not be limited to investment in the countries mentioned in the following paragraph, provided that they are qualified as regulated markets. The investments will be made according to expected performance; sectors, countries and currencies may be overweighted or underweighted accordingly.List of countries: Mexico, Brazil, Chile, Argentina, Peru, Venezuela, Colombia, Korea, Taiwan, Hong Kong, China,Malaysia, Thailand, Indonesia, Philippines, India, Sri Lanka, Russia (with maximum 10% of the net assets),Poland, Hungary, Czech Republic, Estonia, Lithuania, Latvia, Slovenia, Slovakia, Croatia, Romania, Turkey,Israel, Egypt, Jordan, Morocco, South Africa, Bulgaria and Cyprus, and in other emerging market countries as defined by the emerging markets classification of Standard and Poor’s/IFCG and Standard and Poor’s/Frontier Markets. Furthermore the Sub-Fund is allowed to invest in companies with a major part of their business in emerging markets but quoted in other OECD countries. The Sub-Fund may invest in securities of developing countries, including Eastern Europe, with new or developing capital markets. These countries may have relatively unstable governments, economies based on only a few industries and securities markets that trade a limited number of securities. Securities of issuers located in these countries tend to have volatile prices and offer the potential for substantial losses as well as gains. Undertakings for collective investment, which invest their assets in these countries, are subject to the same risks. In addition, these securities may be less liquid than investments in more established markets as a result of inadequate trading volume or restrictions on trading imposed by the governments of such countries. In addition, developing markets may have increased risks associated with clearance and settlement. Delays in settlement could result in periods of uninvested assets, missed investment opportunities or losses to the Sub-Fund. Furthermore, investments in Russia are currently subject to certain heightened risks with regard to the ownership and custody of securities. In Russia this is evidenced by entries in the books of a company or its registrar (which is neither an agent nor responsible to the Custodian). No certificates representing ownership of Russian companies will be held by the Custodian or any of its local correspondents or in an effective central depository system. As a result of this system and the lack of the effective state regulation and enforcement, the Sub-Fund could lose its registration and ownership of Russian securities through fraud, negligence or even mere oversight. In addition, Russian debt securities have an increased custodial risk associated with them as such securities are, in accordance with market practice, held in custody with Russian institutions which may not have adequate insurance coverage to cover loss due to theft, destruction or default whilst such assets are in its custody. The Sub-Fund’s investments in Russia, combined with investments that are made in other assets than Transferable Securities as defined in section 4.1 through 4.5 of the Prospectus, shall not exceed 10% of the net assets of the Sub-Fund. For the purpose of hedging and/or efficient portfolio management, the Sub-Fund may use all the techniques and instruments described in Section 4.(B) of the Prospectus as well as the pooling and co-management described in Section 3.1 of the Prospectus. The Sub-Fund may invest up to 10% of its net assets in shares / units of other investment funds which comply with the rules set out in Section 4 of the Prospectus. NOTE 3 – SIGNIFICANT ACCOUNTING POLICIES The financial statements are prepared in accordance with Luxembourg regulations relating to investment funds, including the following significant accounting policies: a) Valuation of investments in portfolio The securities listed on an official stock exchange are valued at the last available price on the stock exchange which is the principal market for such security. The securities which are not listed on an official stock exchange but which are actively traded on another organized market are also valued at the last available price.
DANSKE FUND
Notes to the Financial Statements (continued)
as at December 31, 2007
127
NOTE 3 – SIGNIFICANT ACCOUNTING POLICIES (continued) a) Valuation of investments in portfolio (continued) The securities which are not listed on an official stock exchange or on another organized market are valued at the last available price. Investment Funds are valued at the last available net asset value. The price of Bosnian securities are the prices retrieved from their websites. If these prices do not reflect the fair value of such securities these are valued on the basis of their probable realizable value, estimated in good faith by the Management Company. The Board of Directors approved that the most appropriate pricing for Teedle Rev II security will be a price of 100 EEK per share and that the most appropriate pricing for DFDS LISCO AB will be a price of 0.58 LTL per share. Gains and losses on investment securities sold are computed on the basis of the average cost of securities sold. b) Realised gains/losses on sale of securities Gains and losses on investment securities are computed on the basis of average cost. c) Foreign exchange translation The net asset values of the different Sub-Fund classes are expressed as follows: - Danske Fund - Danish Bond Class A in Danish Krone - Danske Fund - Danish Bond Class D in Danish Krone - Danske Fund - European Bond Class A in Euros - Danske Fund - European Bond Class D in Euros - Danske Fund - Denmark Class A in Danish Krone - Danske Fund - Denmark Class SP in Danish Krone - Danske Fund - Nordic Class A in Euros - Danske Fund - Swedish Bond Class A in Swedish Krona - Danske Fund - Swedish Bond Class S in Swedish Krona - Danske Fund - US Dollar Bond Class A in US Dollars - Danske Fund - Sweden Class A in Swedish Krona - Danske Fund - Danish Mortgage Bond Class A in Danish Krone - Danske Fund - Danish Mortgage Bond Class D in Danish Krone - Danske Fund - Danish Mortgage Bond Class SP in Danish Krone - Danske Fund - Danish Mortgage Bond Class N (NOK) (hedged) in Norwegian Kroner - Danske Fund - Danish Mortgage Bond Class S (SEK) (hedged) in Swedish Krona - Danske Fund - Global Emerging Markets Class I in US Dollars - Danske Fund - Global Emerging Markets Class A in US Dollars - Danske Fund - Global Emerging Markets Class SP in US Dollars - Danske Fund - Europe Class I in Euros - Danske Fund - Europe Class A in Euros - Danske Fund - Europe Class SP in Euros - Danske Fund - Stockpicking Class A in Euros - Danske Fund - Europe Small Cap Class A in Euros - Danske Fund - Europe Small Cap Class SP in Euros - Danske Fund - High Dividend Class I in Euros - Danske Fund - High Dividend Class A in Euros - Danske Fund - Global High Income Class A in Euros - Danske Fund - Global High Income Class S (SEK) (hedged) in Swedish Krona - Danske Fund - Eastern Europe Convergence Class A in Euros - Danske Fund - Eastern Europe Convergence Class SP in Euros - Danske Fund - Greater China Class A in US Dollars - Danske Fund - Japan Class A in Japanese Yen - Danske Fund - Japan Class IDI in Japanese Yen
DANSKE FUND
Notes to the Financial Statements (continued)
as at December 31, 2007
128
NOTE 3 – SIGNIFICANT ACCOUNTING POLICIES (continued)
c) Foreign exchange translation (continued) - Danske Fund - India Class A in US Dollars - Danske Fund - Baltic Class A in Euros - Danske Fund - Trans-Balkan Class A in Euros - Danske Fund - Germany Class I in Euros - Danske Fund - Germany Class A in Euros - Danske Fund - Global Emerging Markets Small Cap Class I in US Dollars - Danske Fund - Global Emerging Markets Small Cap Class A in US Dollars.
All assets and liabilities, which are valued in a currency other than the currency in which units of the relevant Sub- Fund are expressed, are converted into the relevant currency at the exchange rate prevailing at December 31, 2007. The exchange rates used as at December 31, 2007 are the following:
1 AUD = 0.59855867 EUR 1 LTL = 0.28962304 EUR 1 BAM = 0.51028531 EUR 1 LVL = 0.69686265 EUR 1 BGN = 0.51128718 EUR 1 MXN = 0.06229851 EUR 1 BRL = 0.38487417 EUR 1 MYR = 0.20551140 EUR 1 CAD = 0.69505406 EUR 1 NOK = 0.12566913 EUR 1 CHF = 0.60354474 EUR 1 PHP = 0.01648050 EUR 1 CZK = 0.03758183 EUR 1 PLN = 0.27834599 EUR 1 DKK = 0.13409974 EUR 1 RON = 0.27809032 EUR 1 EEK = 0.06391176 EUR 1 RSD = 0.01268568 EUR 1 EGP = 0.12321425 EUR 1 SEK = 0.10624358 EUR 1 GBP = 1.35694600 EUR 1 SGD = 0.47291073 EUR 1 HKD = 0.08715864 EUR 1 THB = 0.02018491 EUR 1 HRK = 0.13637854 EUR 1 TRY = 0.58172477 EUR 1 HUF = 0.00394518 EUR 1 TWD = 0.02095992 EUR 1 ILS = 0.17657977 EUR 1 UAH = 0.13462048 EUR
100 IDR = 0.00723750 EUR 1 USD = 0.67983276 EUR 1 INR = 0.01739765 EUR 1 ZAR = 0.10034400 EUR 1 JPY = 0.00606641 EUR 1 KRW = 0.00072606 EUR 1 LKR = 0.00625990 EUR
Income and expenses expressed in a currency other than the currency in which units of the relevant Sub-Fund are expressed are translated into such currency at the applicable exchange rate prevailing at the payment date. Resulting realised and unrealised foreign exchange gains or losses are included in the statement of operations and changes in net assets. d) Cost of investment securities Cost of investment securities for each Sub-Fund expressed in a currency other than the currency of denomination is translated at the exchange rate prevailing at the purchase date. e) Income from investments Dividends are recognised as income on the date the securities are first quoted ex-dividend, to the extent information thereon is reasonably available to the Fund. Interest is accrued for each net asset valuation.
DANSKE FUND
Notes to the Financial Statements (continued)
as at December 31, 2007
129
NOTE 3 – SIGNIFICANT ACCOUNTING POLICIES (continued) f) Forward foreign exchange contracts. Gains or losses arising from un-matured forward foreign exchange contracts are determined on the basis of the applicable forward exchange rates at the valuation date, and are recorded in the statement of operations and changes in aggregate net assets. g) Valuation of future contracts. Futures are valued based on the last available published price on the valuation date. NOTE 4 – MANAGEMENT FEES AND MARKETING FEES The Fund pays the Management Company a Management fee as detailed below: 0.40% per annum in respect of the Sub-Fund class investing in bonds;
- Danish Mortgage Bond Class SP, - and
0.50% per annum in respect of the Sub-Fund class investing in bonds;
- Swedish Bond Class S (SEK), - and
0.60% per annum in respect of the Sub-Fund class investing in shares;
- Europe Class I, High Dividend Class I, Germany Class I, - And
0.65% per annum in respect of the Sub-Fund class investing in shares;
- Japan Class IDI, - And
0.70% per annum in respect of the Sub-Fund class investing in shares;
- Global Emerging Markets Class I, Global Emerging Markets Small Cap Class I, - and
0.75% per annum in respect of the Sub-Fund class investing in shares;
- Denmark Class SP, Europe Class SP, Europe Small Cap Class SP, Eastern Europe Convergence Class SP, Global Emerging Markets Class SP,
- and 0.80% per annum in respect of the Sub-Fund classes investing in bonds;
- Danish Bond Class A and Class D, European Bond Class A and Class D, Swedish Bond Class A, US Dollar Bond Class A, Danish Mortgage Bond Class A and Class D, Global High Income Class A, Global High Income Class S (SEK), Danish Mortgage Bond Class N (NOK) hedged, Danish Mortgage Bond Class S (SEK) hedged,
- and 1.50% per annum in respect of the Sub-Fund class investing in shares;
- Denmark Class A, Nordic Class A, Sweden Class A, Europe Class A, Japan Class A, Stockpicking Class A, High Dividend Class A and Germany Class A,
- and 1.60% per annum in respect of the Sub-Fund class investing in shares;
- Global Emerging Markets Small Cap Class A, Europe Small Cap Class A, Eastern Europe Convergence Class A, Greater China Class A, India Class A , Global emerging Markets Class A,
- and 2.20% per annum in respect of the Sub-Fund class investing in shares for Baltic Class A and 2.75% per annum in respect of the Sub-Fund class investing in shares for Trans-Balkan Class A.
DANSKE FUND
Notes to the Financial Statements (continued)
as at December 31, 2007
130
NOTE 4 – MANAGEMENT FEES AND MARKETING FEES (continued) The fees are based on the net assets of the Fund as determined on each valuation date and payable quarterly in arrears. In addition to the Management Fee, the Fund pays the Management Company a marketing fee (the “Marketing Fee”) amounting to a percentage of maximum 0.10% per annum of the Net Asset Value determined in respect of each Sub-Fund except for the Japan Class IDI and all Classes SP and I, where the marketing fee is not charged. The remuneration of the sub-investment manager is at the expense of the Investment manager or the Management Company. NOTE 5 – CUSTODIAN FEES In accordance with Custodian Agreement dated June 28, 2002 as novated, RBC Dexia Investor Services Bank S.A. is entitled to a fee agreed with the Management Company to be paid by the Management Company out of the Fund’s assets. NOTE 6 – ACCOUNTING FEES AND REPORT EXPENSES In accordance with the Central Administration Agency Agreement dated December 30, 2005 as novated, RBC Dexia Investor Services Bank S.A. is entitled to a fee agreed with the Management Company to be paid by the Management Company out of the Fund’s assets. NOTE 7 – PERFORMANCE FEES The Investment Manager is entitled to a performance fee for some Sub-Funds, which exceeds the return of the benchmark as fully described in the prospectus. Each Sub-Fund may pay in certain circumstances to the Investment Manager a performance fee which will be calculated and accrued on each Valuation Day and shall be paid annually in arrears on or after the last Valuation Day in each financial year. Danske Fund - Denmark Class SP: 10% of performance above hurdle rate (calculated as return above the return Copenhagen Stock Exchange's All-Share Index (capped), including dividends) with a two year running watermark pursuant to the procedure described in the prospectus. Danske Fund - Danish Mortgage Bond Class SP: 10% of performance above hurdle rate (calculated as return above the return of Danske Capital Danish Mortgage Composite Index with a 5 year overall duration (option-adjusted)) with a two year running watermark pursuant to the procedure described in the prospectus. Danske Fund - Global Emerging Markets Class SP: 10% of performance above hurdle rate (calculated as return above the return of the MSCI Emerging Markets Free Index) with a two year running watermark pursuant to the procedure described in the prospectus. Danske Fund - Europe Class SP: 10% of performance above hurdle rate (calculated as return above the return of the MSCI Europe Index) with a two year running watermark pursuant to the procedure described in the prospectus. Danske Fund - Europe Small Cap Class SP: 10% of performance above hurdle rate (calculated as return above the return of the MSCI Europe Small Cap Index) with a two year running watermark pursuant to the procedure described in the prospectus. Danske Fund – Eastern Europe Convergence Class SP: 10% of performance above hurdle rate (calculated as return above 3mths Euribor + 4,00%) with a two year running watermark pursuant to the procedure described in the prospectus.
DANSKE FUND
Notes to the Financial Statements (continued)
as at December 31, 2007
131
NOTE 8 – TAXE D’ABONNEMENT Under present Luxembourg law, the Fund is subject to “Taxe d’abonnement” at the annual rate of 0.05% for classes intended for retail investors and at the rate of 0.01% for classes intended for institutional investors. The “Taxe d’abonnement” is payable quarterly in arrears and calculated on the basis of the net assets calculated as at the end of each calendar quarter. NOTE 9 – FORWARD FOREIGN EXCHANGE CONTRACTS For the period ended December 31, 2007, the following forward foreign exchange contracts were outstanding:
Amount purchased Amount sold Maturity Unrealisedgain/(loss)
Danske Fund - European Bond
EUR 2,996,743 USD 4,370,000 10/03/2008 27,086 EUR 27,086 EUR
Danske Fund - Danish Mortgage Bond
SEK 24,900,000 DKK 19,638,773 18/02/2008 88,015 DKKNOK 4,255,000 DKK 3,968,661 18/02/2008 12,298 DKKDKK 2,990,264 NOK 3,225,000 18/02/2008 (27,076) DKK
73,237 DKK Danske Fund - Global High Income
SEK 1,200,000 EUR 128,044 10/01/2008 (560) EUREUR 3,255,473 USD 4,800,000 10/01/2008 (7,423) EUR
(7,983) EUR
NOTE 10 – COMBINED STATEMENTS The Fund’s total net assets are expressed in EUR and correspond to the difference between the total assets and the total liabilities of the Fund. In order to calculate this value, the net assets of each Sub-Fund are, unless they are already expressed in EUR, converted into EUR at the exchange rates prevailing at December 31, 2007 and added together. NOTE 11 – FINANCIAL FUTURES CONTRACTS For the period ended December 31, 2007 , the following financial futures contracts were outstanding: Danske Fund - Danish Bond
Contracts Maturity
date Currency Commitment
(EUR) Unrealised Gain
(DKK)
SALE 24 EURO BUND 06/03/2008 EUR (2,714,640) 449,218
449,218
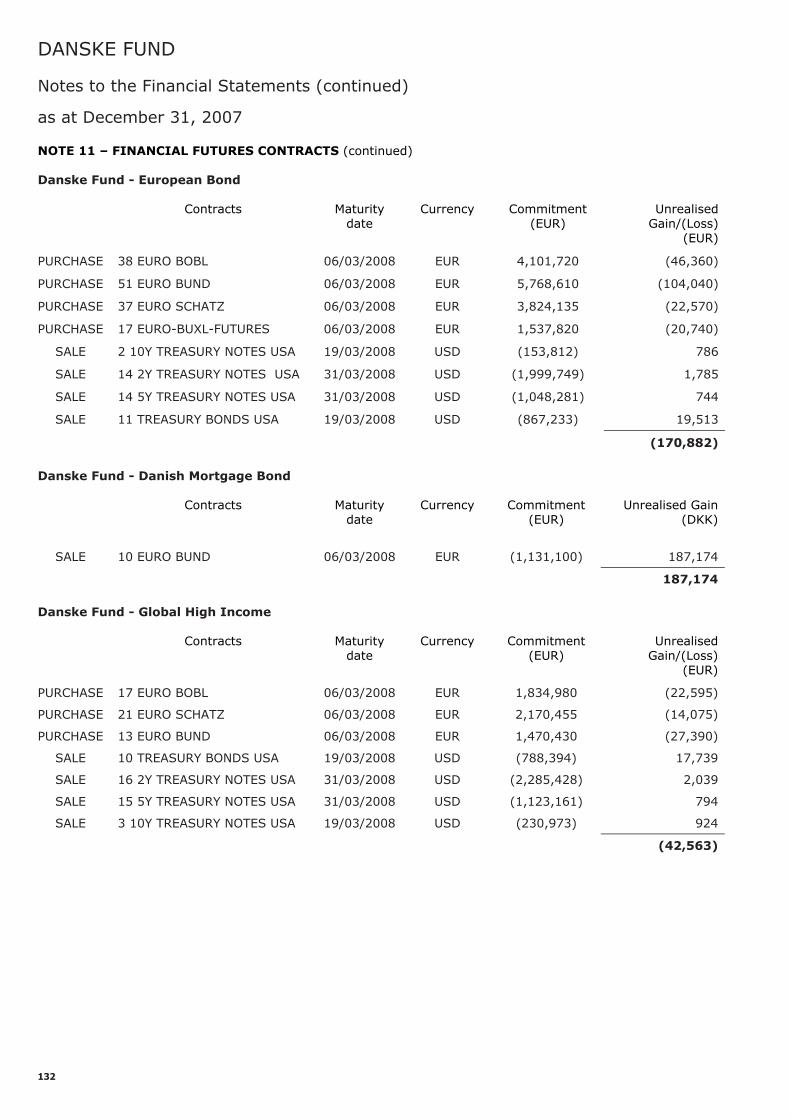
DANSKE FUND
Notes to the Financial Statements (continued)
as at December 31, 2007
132
NOTE 11 – FINANCIAL FUTURES CONTRACTS (continued) Danske Fund - European Bond Contracts Maturity
date Currency Commitment
(EUR) Unrealised
Gain/(Loss) (EUR)
PURCHASE 38 EURO BOBL 06/03/2008 EUR 4,101,720 (46,360)
PURCHASE 51 EURO BUND 06/03/2008 EUR 5,768,610 (104,040)
PURCHASE 37 EURO SCHATZ 06/03/2008 EUR 3,824,135 (22,570)
PURCHASE 17 EURO-BUXL-FUTURES 06/03/2008 EUR 1,537,820 (20,740)
SALE 2 10Y TREASURY NOTES USA 19/03/2008 USD (153,812) 786
SALE 14 2Y TREASURY NOTES USA 31/03/2008 USD (1,999,749) 1,785
SALE 14 5Y TREASURY NOTES USA 31/03/2008 USD (1,048,281) 744
SALE 11 TREASURY BONDS USA 19/03/2008 USD (867,233) 19,513
(170,882)
Danske Fund - Danish Mortgage Bond Contracts Maturity
date Currency Commitment
(EUR) Unrealised Gain
(DKK)
SALE 10 EURO BUND 06/03/2008 EUR (1,131,100) 187,174
187,174
Danske Fund - Global High Income Contracts Maturity
date Currency Commitment
(EUR) Unrealised
Gain/(Loss) (EUR)
PURCHASE 17 EURO BOBL 06/03/2008 EUR 1,834,980 (22,595)
PURCHASE 21 EURO SCHATZ 06/03/2008 EUR 2,170,455 (14,075)
PURCHASE 13 EURO BUND 06/03/2008 EUR 1,470,430 (27,390)
SALE 10 TREASURY BONDS USA 19/03/2008 USD (788,394) 17,739
SALE 16 2Y TREASURY NOTES USA 31/03/2008 USD (2,285,428) 2,039
SALE 15 5Y TREASURY NOTES USA 31/03/2008 USD (1,123,161) 794
SALE 3 10Y TREASURY NOTES USA 19/03/2008 USD (230,973) 924
(42,563)
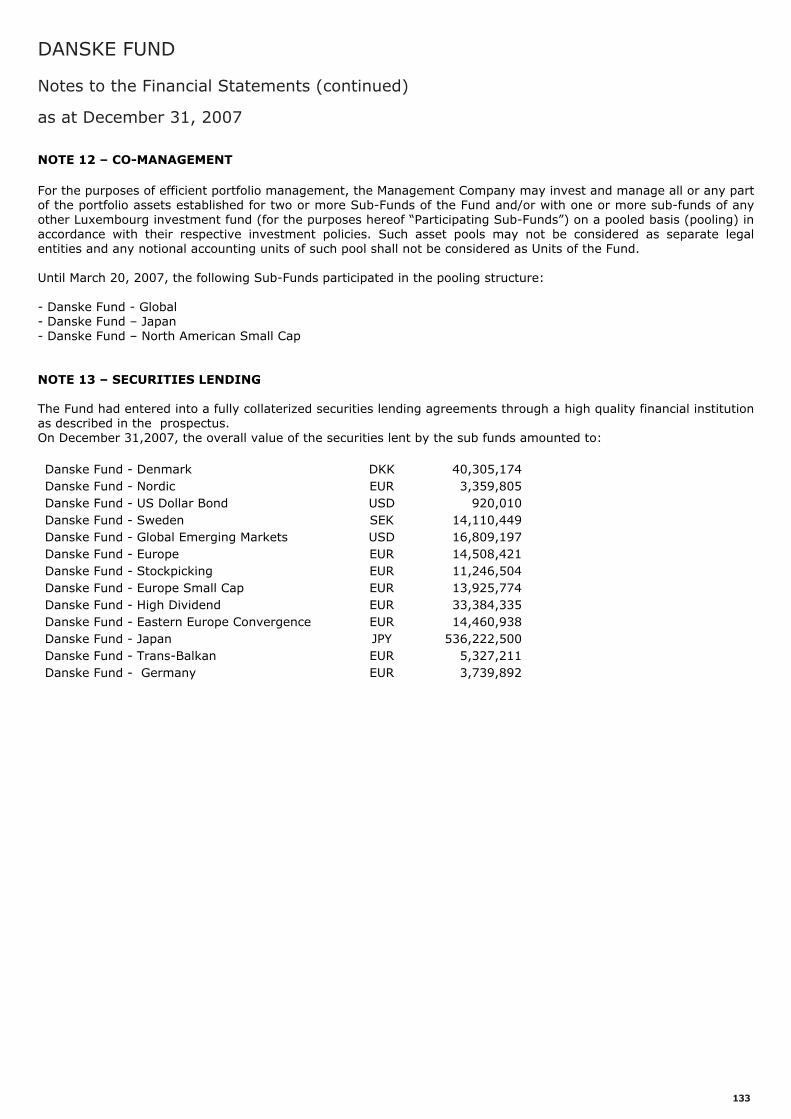
DANSKE FUND
Notes to the Financial Statements (continued)
as at December 31, 2007
133
NOTE 12 – CO-MANAGEMENT For the purposes of efficient portfolio management, the Management Company may invest and manage all or any part of the portfolio assets established for two or more Sub-Funds of the Fund and/or with one or more sub-funds of any other Luxembourg investment fund (for the purposes hereof “Participating Sub-Funds”) on a pooled basis (pooling) in accordance with their respective investment policies. Such asset pools may not be considered as separate legal entities and any notional accounting units of such pool shall not be considered as Units of the Fund. Until March 20, 2007, the following Sub-Funds participated in the pooling structure: - Danske Fund - Global - Danske Fund – Japan - Danske Fund – North American Small Cap NOTE 13 – SECURITIES LENDING The Fund had entered into a fully collaterized securities lending agreements through a high quality financial institution as described in the prospectus. On December 31,2007, the overall value of the securities lent by the sub funds amounted to: Danske Fund - Denmark DKK 40,305,174Danske Fund - Nordic EUR 3,359,805Danske Fund - US Dollar Bond USD 920,010Danske Fund - Sweden SEK 14,110,449Danske Fund - Global Emerging Markets USD 16,809,197Danske Fund - Europe EUR 14,508,421Danske Fund - Stockpicking EUR 11,246,504Danske Fund - Europe Small Cap EUR 13,925,774Danske Fund - High Dividend EUR 33,384,335Danske Fund - Eastern Europe Convergence EUR 14,460,938Danske Fund - Japan JPY 536,222,500Danske Fund - Trans-Balkan EUR 5,327,211Danske Fund - Germany EUR 3,739,892