Embed Size (px)
Citation preview
CITY OF WILTON MANORS
TOD MASTER PLAN
Charrette Workshop Date: October 11th Studio Dates: October 15th-18th 2018
SEPTEMBER 2019
T R E A S U R E C O A S T R E G I O N A L P L A N N I N G C O U N C I L
I n d i a n R i v e r - S t . L u c i e - M a r t i n - P a l m B e a c h

prepared by
Treasure Coast Regional Planning Council
Thomas J. Lanahan, Executive Director Kim Delaney, Director of Strategic Development and Policy
Dana P. Little, Urban Design Director Stephanie Heidt, Economic Development and Intergovernmental Programs Director
Jessica Cortor Seymour, RA, LEED AP, Regional Planner Brad Davis, AICP, CNU-A , Senior Associate Planner
Rick Gonzalez, Architect Vlad Dumitrescu, Architect
Andrew Georgiadis, Architect Jose J. Venegas, Architect
Thomas Lavash, Economic Analysis Kat Maines LEED GA , Planner
Thomas Moriarti, Economic Analysis Lauren Moss Clark, Urban Designer
in coordination with
South Florida Regional Transportation Authority (SFRTA), Florida Department of Transportation (FDOT), South Florida Regional Planning Council (SFRPC), and adjacent municipalities
for the
City of Wilton Manors

Table of Contents
I. Executive Summary...............................................................................................................5
II. Market Overview................ ................................................................................................19
III. Tour of the Plan...................................................................................................................29
III. Key Recommendations & Implementation....................................................................73
Appendix A: Creation of the Master Plan
Appendix B: Background & Existing Conditions
Appendix C: Market & Economic Analysis
Acknowledgments City of Wilton Manors
South Florida Regional Transportation Authority (SFRTA) South Florida Regional Planning Council (SFRPC)
2017-2018
Mayor, Gary Resnick
Vice-Mayor, Justin Flippen
Commissioner, Julie A. Carson
Commissioner, Tom Green
Commissioner, Scott Newton
2019-Present
Mayor, Justin Flippen
Vice-Mayor, Tom Green
Commissioner, Julie A. Carson
Commissioner, Gary Resnick
Commissioner, Paul Rolli
T R E A S U R E C O A S T R E G I O N A L P L A N N I N G C O U N C I L
I n d i a n R i v e r - S t . L u c i e - M a r t i n - P a l m B e a c h

This page intentionally left blank.

WILTON MANORS TOD MASTER PLAN EXECUTIVE SUMMARY
EXECUTIVE SUMMARY
Introduction
In October 2018, the City of Wilton Manors (City), in collaboration with the Treasure Coast Regional Planning Council (TCRPC), South Florida Regional Planning Council (SFRPC), and the South Florida Regional Transportation Authority (SFRTA), held a public economic development and urban design charrette to study ways to improve mobility, quality of life, and economic vitality around the planned Tri-Rail Coastal Link Station in the City of Wilton Manors. Funding for the charrette and Transit Oriented Development (TOD) Master Plan was provided through a Federal Transit Administration (FTA) Pilot Planning Grant secured by the SFRTA for station area planning activities along the planned Tri-Rail Coastal Link Corridor. Funds were disbursed through the “South Florida Transit Oriented Development” (SFTOD) grant program, and the City was selected as one of the recipients. Additional matching funding was provided by the City.
Land development patterns around transit stations, along with the connectivity and access to stations from surrounding areas, are highly correlated with successful transit systems. Accordingly, there is a need for thoughtful land use planned around future station areas to increase the competitiveness of an entire transit corridor, especially to secure competitive federal or state funding for system development. This includes an assessment of existing and planned land development patterns around planned stations and along planned transit corridors. The SFRTA has concluded transit-oriented development (TOD) is the most important factor for ridership on the Tri-Rail system. As de ned by the SFRTA, TOD is “a mixed-use pattern of pedestrian-friendly, higher density development with reduced parking around transit stations.”
Images: TOD is not a one-size- ts-all approach, but rather, as depicted in the various TOD images above, station area development corresponds to the land development context of communities.
Rendering of the new Tri-Rail Coastal Link Station and possible redevelopment opportunities.
Way nding signage that will feature the City’s tagline “Life’s Just Better Here,” will be placed at various entrances to the City.
Source: City of Wilton Manors
5

EXECUTIVE SUMMARY WILTON MANORS TOD MASTER PLAN
There are four key characteristics the SFRTA emphasizes in its TOD de nition for the region:
1. A continuous in ll pattern extending at least a half-mile from stations that is safe, pedestrian friendly, and reduces auto-dependency;
2. An increased mix of uses to support vibrant activity around stations;
3. Higher density to support ridership and boost local economies, with diversi ed housing types that support all walks of life; and
4. Reduced or eliminated parking requirements to stimulate business investment, generate increased local revenue, and encourage transit usage.
Tri-Rail service today runs on the South Florida Rail Corridor (SFRC) formerly owned by the CSX railroad. The service is indicated by the western red and blue lines in the graphic below. Tri-Rail provides service to 18 stations along the 72-mile railway segment from the Mangonia Park Station in Palm Beach County to Miami International Airport. Since the service began in 1989, there have been plans for the service to be extended onto the Florida East Coast Railway (FEC) rail corridor.
Note: Brightline has indicated the system will be re-randed to “Virgin Trains USA” in Fall of 2019.
6

WILTON MANORS TOD MASTER PLAN EXECUTIVE SUMMARY
Transit-Oriented Development (TOD) is a priority consideration for the extension of Tri-Rail service in the region. The SFRTA has adopted a TOD policy, described in the image above, that highlights TOD’s importance for ridership, economic development, and station accessibility.
7

EXECUTIVE SUMMARY WILTON MANORS TOD MASTER PLAN
Accordingly, for the City of Wilton Manors, the goal of the SFTOD planning effort is to identify ways to improve TOD conditions around the planned station to re ect the character of the City, facilitate future mobility, support system ridership, and enhance the economic sustainability of the area. This planning effort is also designed to advance the implementation of “Complete Streets,” which is a local, regional, and national priority to improve transportation facilities with multi-modal characteristics to provide the best and safest accommodations for all users – motorists, cyclists, pedestrians, and transit users.
The key elements of the Wilton Manors Station Area TOD Master Plan include:
• The creation of a physical master plan for the anticipated Wilton Manors Tri-Rail Coastal Link Station Area that considers future station locations, roadway recon gurations and mobility enhancements, advances Complete Streets initiatives, illustrates desirable in ll and redevelopment opportunities that support TOD, and re ects the community’s vision for the future of the City;
• The development of TOD design concept scenarios for select properties within a district centered around a station location south of the intersection of NE 26th Street and the FEC Railway. The TOD district extends in all directions, and illustrative TOD design concepts have been developed for several key sites identi ed for in ll development and redevelopment. These sites include the Pioneer Maintenance Complex site, the “Old Florida Seafood” site, “Shoppes at Wilton Manors” site, the core station area, and opportunities along North Dixie Highway;
• The development of a Market Overview that reviews historic, existing, and projected market conditions and demographics and analyzes key market trends within the study area, the City of Wilton Manors, and relevant areas within the region;
• Coordination with all relevant agencies, including but not limited to the City, SFRTA, Florida Department of Transportation (FDOT), Broward Metropolitan Planning Organization (MPO), Broward County, Broward County Transit, and adjacent municipalities;
• A review of the land use and development regulations to recommend improvements and ways to incentivize desired redevelopment and business creation; and
• Recommendations for the City to implement TOD, improved walkability and connectivity, and desired economic development in the area.
The aerial above indicates the development pattern surrounding the station as well as properties within the ½-mile radius that is a key focus in TOD planning.
8

WILTON MANORS TOD MASTER PLAN EXECUTIVE SUMMARY
Transit-Oriented Development (TOD) is a land use pattern that is correlated with the most successful transit systems in the U.S. and internationally. Characterized by a strong urban form and good pedestrian friendliness, TOD and land use patterns are considered by FTA among the evaluation criteria for funding new or expanded transit systems.
While Transit-Oriented Development is considered highly bene cial for transit systems, land development patterns that are auto-oriented, disconnected, and low-density are considered detrimental to successful transit service. Termed “transit-adjacent,” uses such as suburban of ce campuses, big-box format retail, storage facilities, and industrial warehouses are considered non-contributing and can reduce ridership per acre of land within a station area.
9

EXECUTIVE SUMMARY WILTON MANORS TOD MASTER PLAN
Study Area
The Wilton Manors TOD Master Plan is focused around the intersection of NE 26th Street and the FEC Rail Corridor, extending generally a half-mile in all directions. Additional areas have been included for land use analysis that are bene cial to the master planning effort.
Existing Conditions of the Study Area
(TOD Design and Redevelopment Concepts)
N D
IXIE HW
Y
NE
6TH
AVE
NE
16TH
AVE
NE
15TH
AVE
NE 26TH ST
NE 24TH STWILTON DR
N 20TH ST
NE 7TH AVE
NE 21ST CT
811
NE 22ND DR
NE 21ST CT
Base Map
WILTON MANORS
1/2 Mile
FE
C R
R
Potential Station Location
Recommended Station Location
Legend
10
1 Central Station Location
2. “Five Points”Intersection & Conceptual Redesign
3. Wilton Manors B&B District
4. North Dixie Highway & Redevelopment Concepts
5. Old Florida Seafood Site
6. Pioneer Maintenance Complex Site
7. Shoppes at Wilton Manors Site
8. Municipal Campus
The map above highlights the key parcels in the station area which includes the recommended station location.
WILTON MANORS TOD MASTER PLAN EXECUTIVE SUMMARY
NE 26th St
Wilton Dr
FEC
RRN D
ixie
Hw
y
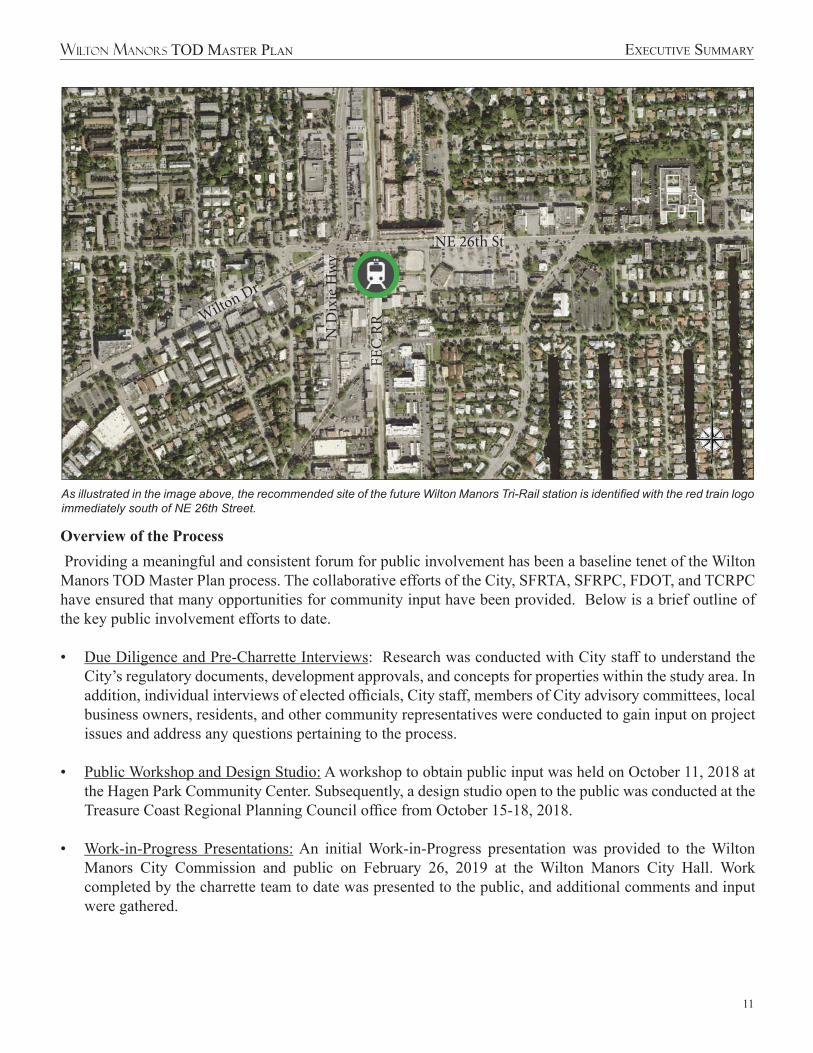
As illustrated in the image above, the recommended site of the future Wilton Manors Tri-Rail station is identi ed with the red train logo immediately south of NE 26th Street.
Overview of the Process
Providing a meaningful and consistent forum for public involvement has been a baseline tenet of the Wilton Manors TOD Master Plan process. The collaborative efforts of the City, SFRTA, SFRPC, FDOT, and TCRPC have ensured that many opportunities for community input have been provided. Below is a brief outline of the key public involvement efforts to date.
• Due Diligence and Pre-Charrette Interviews: Research was conducted with City staff to understand the City’s regulatory documents, development approvals, and concepts for properties within the study area. In addition, individual interviews of elected of cials, City staff, members of City advisory committees, local business owners, residents, and other community representatives were conducted to gain input on project issues and address any questions pertaining to the process.
• Public Workshop and Design Studio: A workshop to obtain public input was held on October 11, 2018 at the Hagen Park Community Center. Subsequently, a design studio open to the public was conducted at the Treasure Coast Regional Planning Council of ce from October 15-18, 2018.
• Work-in-Progress Presentations: An initial Work-in-Progress presentation was provided to the Wilton Manors City Commission and public on February 26, 2019 at the Wilton Manors City Hall. Work completed by the charrette team to date was presented to the public, and additional comments and input were gathered.
11

EXECUTIVE SUMMARY WILTON MANORS TOD MASTER PLAN
There were three potential station locations tested to accommodate the future Wilton Manors Tri-Rail station: immediately north of NE 26th Street, immediately south of NE 26th Street, and immediately south of NE 24th Street adjacent to the City-owned Pioneer Maintenance complex. Although a station and platform could be accommodated at any of the three locations, the recommended location is the central site, abutting NE 26th Street to the south. This location has superior access, visibility, TOD potential, and is expected to provide the maximum yield and bene t to the City. It is important to note the in ll development opportunities that surround the recommended station location. The City is currently considering the addition of density to the NE 26th Street corridor to enhance in ll development and redevelopment to better accommodate the City’s future residential population. In addition to addressing the City’s increasing residential demand, the densi cation of the station area will enhance the City’s competitiveness for a future station as well as improve its mobility, trip capture, and economic development potentials.
The public workshop on October 11th, 2018 at the Hagen Park Community Center adjacent to the Wilton Manors City Hall was well attended by City elected of cials and staff, business and property owners, residents, and other community representatives.
Following the public workshops, the design team worked in a studio format from October 15-18, 2018 to analyze key sites and develop TOD conceptual designs.
12

WILTON MANORS TOD MASTER PLAN EXECUTIVE SUMMARY
Because every transit trip begins and ends as a pedestrian journey, the hallmarks of well-planned TOD are pedestrian-friendliness and interconnectivity between and among sites. The most successful TOD districts are the most walkable ones. The TOD in ll pattern illustrated here provides walkability, intensi cation, and “eyes on the street” to improve the natural surveillance surrounding the future station.
NE 26TH STREET
FE
C R
R
NE
13T
H A
VE
NU
E
NE 26TH STREET
FE
C R
R
NE
13T
H A
VE
NU
E
NE
14T
H A
VE
NU
E
Conceptual plan for the Old Florida Seafood Center site.
13

EXECUTIVE SUMMARY WILTON MANORS TOD MASTER PLAN
Market Summary A market analysis was conducted to help guide the recommendations and strategies of the master plan, including an assessment of demographics, market trends, and forecasts with a focus on four categories of use: residential, workplace/of ce, lodging/hospitality, and retail. Key ndings are noted below.
Demographics & Employment: The City’s population is roughly 12,548 residents, with a forecasted population gain of just over 600 new residents in the next ve years. The City represents roughly 0.6% of the total County population. Overall, City residents are older than the County average, with a median age of 51 years (markedly higher than the County’s median of 41 years). Growth forecasts indicate the greatest growth will be in the 65-74 and 75+ age brackets, with moderate growth in the 55-64 bracket. This suggests future demand for speci c types of age-restricted and specialty housing such as independent living/continuing care. It should be noted the City’s younger age cohorts, between 25-54 years of age, are projected to slightly decline, which heightens the focus on housing product mix, size, and amenities for the City’s residential composition.
The City’s population is predominately White (76%), with 17% Black and 8% combined for other races. 18% of the total population indicates Hispanic origin.
Income characteristics in the City indicate the community is solidly middle-class, with average household incomes of roughly $79,260 per year (2018 data), growing at 3.5% annually to almost $94,150 per year by 2023. This is on par with the County’s average household incomes, which are projected to be $93,800 by 2023. Approximately 25% of the City’s households have annual incomes greater than $100,000 per year.
Residential: The City’s housing stock contains 7,503 units, of which nearly 74% are single-family detached homes with the balance being multi-family units. Average values in 2018 were just over $360,000, with a projected increase to $397,290 over the next ve years.
Like many communities across the U.S. following the 2007-09 recession, the number of owner-occupied units decreased from 46.5% in 2010 to 40.3% in 2018, but is projected to rise to more than 42% in the next ve years. The trend for renter-occupied units increased in the same time period to nearly 49% in 2018. U.S. Census data indicates the number of unoccupied housing units has been declining from 927 units in the 2010 Census to 836 in 2018, which re ects an improving economy.
For multi-family residential, the City is grouped with Oakland Park as a component of the Broward County submarket. Three new projects in the past 12 years have introduced more than 1,000 new multi-family units. The newest Class A property (The Metropolitan) leased nearly all of its 179 units within two years, indicating market acceptance for a higher-quality investment-grade product.
Overall, the Wilton Manors housing market re ects generally stabilized market conditions with high occupancies, increasing values, and strong achieved monthly rents.
Wilton Manors is known for its boutique style, appreciating residential neighborhoods with a mix of older, well-maintained housing stock as well as newer modern structures.
images coutesy of RAPB + GFLR
14

WILTON MANORS TOD MASTER PLAN EXECUTIVE SUMMARY
Wilton Manors has seen several new market-rate, multi-family residential projects in the past several years, such as Wilton Station pictured above.
Hospitality/Lodging: While the City lacks a traditional hotel within the City Limits, Wilton Manors is served by the surrounding market that contains 1,050 rooms in nine hotels. Performance metrics over the past six years have been strong, with average occupancies at nearly 72%, with very strong growth in room rates and revenues. The City is also served by bed and breakfasts and vacation rentals. However, neither of these groups report data to national sources for tracking. These ndings support the City’s recent hotel market study and reinforce the expectation the market appears able to support a mid-scale brand hotel with up to 100 rooms by 2023. The City’s unique positioning as an LGBTQ friendly destination is notable and further reinforces this nding.
Workplace/Of ce: The City is in the Broward County of ce market, which contains roughly 27.6 million sq. ft. of of ce space. Countywide there is a vacancy rate of 12.2%, representing nearly 3.4 million sq. ft. of of ce space. Near the City’s potential station location, within one-mile of the Five Points intersection, there is less than 200,000 sq. ft. of of ce space in 21 buildings. 183,500 sq. ft. is in the City. The buildings tend to be smaller and are geared to professional services tenants. Additional data is needed to fully determine vacancies within the core market. However, as a tertiary of ce market, Wilton Manors presents a general soft market, which presents limited demand for new investment-grade multi-tenant of ce space.
Retail: The City contains a substantial amount of retail that well exceeds the retail space that the resident population can support. Retail data collected for this TOD Master Plan indicates the City has just over 950,000 square feet of retail/commercial space, which equates to 74 square feet per resident. By comparison, the U.S. average is approximately 26 square feet per person, while European countries average 2.6 square feet per person. At the time of the study, there were 55 vacant retail spaces documented in the City, totaling just over 230,000 square feet or nearly 24% of the City’s total retail inventory. In ow spending from residents outside the City, including tourists, is key to the sustainability of the City’s retail market. Existing retail uses would bene t from modernization and reorganization, and the addition of new residents is a critical component to improve retail performance and better balance the City’s land use composition.
Further discussion of the market ndings is presented in Chapter 2, and the full market report is included in Appendix C.
15

EXECUTIVE SUMMARY WILTON MANORS TOD MASTER PLAN
Key Recommendations of the Plan
1. Evaluate land use and zoning changes in the TOD station area to consider higher density, higher intensity, mixed-use land development opportunities with incentives to promote orderly redevelopment. Special consideration should be given to the NE 26th Street Corridor, Wilton Drive Corridor, and North Dixie Highway district.
2. Consider incentives to accelerate hotel development, with consideration of the City Hall property and its prominent placement on Wilton Drive as a potential catalyst for redevelopment, including disposition of property through potential fee simple sale or ground lease and incorporation of other supporting uses (e.g., multi-family, recreational, public/civic, retail, workplace, and parking).
3. Develop a City Mobility Plan to improve safety, access, and functionality with the following components:
a. Thoroughfare network with a hierarchy of streets b. Bicycle network with prioritization of key roadways as “bike boulevards” c. Completed sidewalk network d. On-street parking and street lighting e. Consideration of “Dutch intersection” treatment at the Five Points Intersection to
incorporate protected bicycle lanes f. Consideration of “road diet” for North Dixie Highway with improved bicycle
facilities (protected and/or separated bicycle lanes) g. Long-term funding for future Tri Rail station
4. An expansion of the boundaries of the Business Improvement District (BID) as an alternate means of raising more revenue to support a downtown revitalization program focused on marketing, branding, and strategic data analysis and evaluation to enhance the City’s commercial core,
5. Formalize the Wilton Drive commercial/redevelopment program and provide additional resources in consideration of the following elements:
a. Provide organizational support and collect and evaluate retail/leasing data to help sustain the retail mix and reduce vacancies;
b. Event planning and management coordination; and c. Coordinate nightlife district management programs including a central point
of contact for business operators, commercial property owners,tourism/marketing coordination, and emergency services;
16

WILTON MANORS TOD MASTER PLAN EXECUTIVE SUMMARY
Key Recommendations of the Plan Continued
6. Formalize the collection and evaluation of tourism and visitation data, including: a. Conduct an Annual Lodging Survey to track locally-owned guest houses, rooms
and occupied room-nights per year, monitor tourism data as well as per capita visitor expenditures and visitor spending;
b. Formalize partnerships with local sources and the Convention and Visitors Bureau to collect visitor data, conduct and analyze consumer surveys and data, document special event impacts and the frequency and length of stay of outside visitors;
c. Collect data to determine actual attendance at local charity and corporate events, performances, weddings and receptions, and other event categories;
d. Conduct a survey-based analysis of the Wicked Manors Halloween event as a parallel to the Stonewall Festival to determine attendance, spending, origin of visitation, and related data; and
e. Formalize data collection and evaluation related to LGBTQ visitor activity as key travel market.
7. Develop a Real Property Information Network to expand economic development and real estate transactions, including a network with local commercial property owners and brokers to collect information available regarding pending commercial vacancies, interested retail tenants and potential tenant relocations and/or closings.
8. Optimize public value and returns from key public sites, such as the City Hall complex and other public facilities, including consideration of mixed-use in ll development on surface parking lots, reorganization of the Pioneer Maintenance complex, and structured parking in a mixed-use format at higher densities to generate net new ad valorem tax revenues and other public bene ts.
9. Consider incentives to assist with the conversion of retail space to residential or of ce to address market demand.
Next Steps
• City adoption of Station Area Master Plan Report.
• City Commission discussions regarding potential amendments to the City’s Comprehensive Plan, Land Development Regulations, and Planned Unit Development agreements over time.
• Negotiations with private land owners to advance TOD design concepts on properties within TOD station area.
17

This page intentionally left blank.

N
W H ILLSBORO BLVD
SW 10T H ST
HIL
LS
BO
RO
BE
AC
H
NDIXIEHWY
NW9THAVE
NW 48TH ST
NFEDERALHWYWI LES RD
NSR7
CORALRIDGEDR
UNIVERSITYDR
W COPAN S RD
RO YAL PALM BLVD
NOCEANBLVD
SHIATUSRD
NNOBHILLRD
NPINEISLANDRD
NUNIVERSITTTTIIIISSSSSSSRRRR NE 62ND STR
VVEEE
II
ROCKISL
C O MM E R I C A L B L V D
esadlg
erv W OAKLAND
Ehe I
T
NUS27
SUNSE T STRIP
HIATUSRD
E SSEEI75SSSSEEE
NW 5TH S T
SW27THAVEAR
VIDAPKY DAVIE BLVD
SE 17 TH ST
SSR7I595
PETERS RDINDIAN TRCE
SUNIVERSITYDR
SR84
NOBHILLRD
NOVA DR
US27
NSR7
S POS T RD
GRI FFIN RD
DAVIERD
E DAN IA BEACH BLVD
STIRLIN G RDI75
NPALMAVE
A1A
NW184THAVE
NUS27
JOHN SON S T
SDIXIEHWY
HOLLYWOOD BLVD
SW72NDAVE
PEMBROKE RD
SSR7
FLAMINGORD MIRAMAR PKY
SW 41S T ST
WILTON MANORS TOD MASTER PLAN MARKET OVERVIEW
MARKET OVERVIEW
Overview of Market and Economic Analysis
To guide the recommendations and strategies of the master plan with realistic market-driven development expectations, a market analysis was performed to understand future growth potential in the City. WTL+a, in partnership with Retail Development Strategies, LLC, undertook a comprehensive analysis of the City, including an assessment of demographic data, market conditions and historic, current, and forecasted development potentials. Four key uses were focused upon in the market study: residential, workplace/of ce, lodging/hospitality, and retail. This chapter contains a summary of the key ndings. The full report, titled “Market Analysis: City of Wilton Manors & TOD Station Area” by WTL+a, is attached as Appendix C of this report.
Broward County Municipal BoundariesWTL+a note that while typical market studies consider a ve- to ten-year time frame for the absorption of new
Palm Beach County
uses, TOD is a much longer process PARKLAND DEERFIELD
than that of conventional real estate HOLMBERG RD BEACH
SAWGRASS EXPY
analysis and market projections. In CORAL
LIGHT-HOUSEPOINT
COCON UTSPRINGS
locations in which enough time has passed, there has consistently been
CREEK Lan d Fill
W SAMPLE RD
Water Conservation Area
a substantial increase in land values,
MINGORD
FLA
IATUSRD
H
COOPERCITY
PINE S BLVD
POMPANOMARGATE BEACH
and developers now market rail station proximity as a key amenity across multiple land uses. However, it takes
W ATLANTIC BLVD
Wilton Manors TAMARAC
RDDW M CNAB RDDSEARANCHLAKES
decades for market forces to be fully LAUDERDALE-BY-THE-SEA
realized. Therefore, the economists LAUDERDALAKES
LAUDERHILL
SUNRISE
suggest the City’s TOD Station Area Plan consider a twenty- to thirty-year time frame for build-out. Near- PLANTATION
W BROWARD BLVDE LAS O LAS BLVD
FORTLAUDERDALEterm development activity will serve
as building blocks for the long-term realization of TOD impacts, and there DAVIE
WESTON
Ft L auderda leHo lly woodIn t ernat io nal
Air por tare several key parcels within the SOUTHWEST
RANCHEShalf-mile TOD station area for which DANIASOUTHWESTRANCHES BEACH
SEMINOLELan d Fillredevelopment will likely occur in TRIBEOF FL ORIDA
the short term. Well-planned TOD HOLLYWOOD
WEST PEMBROKE
development, with strong walkability PEMBROKE PINES
and connectivity from the future MIRAMAR
station to adjacent parcels, addresses a critical need to establish the expected
PARK PARK
WEST HALLANDALEBEACHPARK
Miami-Dade County
This map is for conceptual purposes only and should not be used for legal boundary determinations.
Prepared By: 0 1.5
GIS SectionPlanning and Redevelopment Division
pattern of in ll and redevelopment Miles
#12719 SNow icki 09/2015Environm ental Protection and Growth Managementthat will ultimately make the City’s Tri-Rail Coastal Link station The market study for the Wilton Manors TOD Station Area utilizes national, state-
wide, and county data. The City of Wilton Manors, located in eastern Browardaccessible and successful. County, is outlined in the map above.
19
3

MARKET OVERVIEW WILTON MANORS TOD MASTER PLAN
The Market Analysis Study Area
To properly analyze economic characteristics of the City, the market study utilizes national, state-wide, and county data for comparison. The City is located in central Broward County as illustrated in the maps in this section. The general Wilton Manors TOD station area is centrally located within the City along the FEC rail corridor, adjacent to NE 26th Street. Three potential station locations have been identi ed within this general area, and maps of these study areas are included in this section.
FE
C R
R
NE 26TH STREET
N. D
IXIE
HW
Y
WILTON
DRIVE
N. D
IXIE
HW
Y
Recommended Alternate Station Station Location Locations
This diagram illustrates potential sites for a future Tri-Rail Coastal Link Station.
20

WILTON MANORS TOD MASTER PLAN MARKET OVERVIEW
Summary of Market/Development Potential
The market analysis focuses on four sectors: housing, workplace/of ce, lodging/hospitality, and retail demand. Noted characteristics regarding the City’s general demographic composition along with key ndings for each sector are noted below, with greater detail available in the full market report (Appendix C).
City Demographics
Current population estimates indicate the City’s population is 12,548 residents, with a forecasted population gain of just over 600 new residents in the next ve years. The City represents roughly 0.6% of the total County population. Overall, City residents are older than the County average, with a median age of 51 years (markedly higher than the County’s median of 41 years). Growth forecasts indicate the greatest growth will be in the 65-74 and 75+ age brackets, with moderate growth in the 55-64 bracket. This suggests future demand for speci c types of age-restricted and specialty housing such as independent living/
PROJECTED POPULATION BY GENERATION continuing care. It should be noted the City’s younger age cohorts, between 25-54 years of age, are projected to slightly decline, which heightens the focus on housing product mix, size, and amenities for the City’s residential composition.
The City’s population is predominately White (76%), with 17% Black and 8% combined for other ethnicities. 18% of the total population indicates Hispanic origin.
Income characteristics in the City indicate the community is solidly middle-class, with average household incomes of roughly $79,260 per year (2018 data), growing at 3.5% annually to almost $94,150 per year by 2023. This is on par with County’s average household incomes, which are projected to be $93,800 by 2023. Approximately 25% of the City’s households have annual incomes greater than $100,000 per year.
As illustrated in the charts above and below, Millennial are quickly becoming the largest cohort in the US, surpassing the “Boomers,” suggesting demand for smaller units could help broaden the City’s attractiveness for younger residents.
World Population by Generation Silent (a.k.a. Builders) Boomers
Gen X
Millennials
Next Gen
2015 2020 2025 2030 2040 21

MARKET OVERVIEW WILTON MANORS TOD MASTER PLAN
Housing
The City’s housing stock contains 7,503 units, of which nearly 74% are single-family detached with the balance multi-family. Average values in 2018 were just over $360,000, with a projected increase to $397,290 over the next ve years. Placeholder: This is above the average unit value in Broward County ($322,400 for 2017), the rate of forecasted increase in the City’s housing values is markedly higher than that of the County over the next ve years.
Like many communities across the U.S. following the 2007-09 recession, the number of owner-occupied units decreased from 46.5% in 2010 to 40.3% in 2018, but it is projected to rise to more than 42% in the next ve years. The trend for renter-occupied units increased in the same time period, to nearly 49% in 2018. U.S. Census data indicates the number of “unoccupied” housing units has been declining, from 927 units in the 2010 Census to 836 in 2018, which re ects an improving economy.
For multi-family residential, the City is grouped with Oakland Park as a component of the Broward County submarket. Three new projects in the past 12 years have introduced more than 1,000 new multi-family units. The newest Class A property (The Metropolitan) leased nearly all of its 179 units within two years, indicating market acceptance for a higher-quality investment-grade product.
Overall, the Wilton Manors housing market re ects generally stabilized market conditions—with high occupancies, increasing values, and strong achieved monthly rents.
Studies by the National Association of Realtors and others have found that housing near transit stations increases in value up to 42% more than similar types of units outside of a station area.
The Metropolitan is a multi-family residential Class-A property. Courtesy of: www.wiltonmetro.com/
22

WILTON MANORS TOD MASTER PLAN MARKET OVERVIEW
Employment
National data suggests Broward County contained just more than 892,000 full-time jobs in 87,369 registered businesses in 2018 (latest data available), which re ects a jobs-to-population ratio of 0.47 (meaning there is almost one-half a job for every one of the 1.89 million residents in the County). The County experienced strong job growth pre-recession, adding nearly 20,000 jobs per year from 1995 through 2005, but it experienced job losses of more than 87,000 in the economic downtown of 2007-2009. Following that decline, the County has experienced a strong post-recession recovery, adding 135,200 new jobs between 2011 and 2017. These new jobs are concentrated in the Services sector (58,900 total jobs, which comprises multiple categories such as Business and Professional Services, Health, Education and Leisure/Hospitality). Job forecasts are positive, with a projected growth of nearly 130,000 jobs through 2025, a rate of 16,200 jobs per year according to Florida Department of Economic Opportunity (DEO) forecasts. New jobs are expected to be predominately in the Services sector, with the largest gains projected in the Health Care, Professional and Business Services, and Accommodation and Food Services sectors.
Employment in Wilton Manors tend to be associated with smaller, locally owned businesses along with a limited selection of national franchise establishments.
23

MARKET OVERVIEW WILTON MANORS TOD MASTER PLAN
Similar to Broward County, U.S. Census data for 2006—2015 (latest data available) indicate the recession had a signi cant impact on the City’s employment base, with 1,020 jobs lost. Manufacturing, Wholesale Trade and Real Estate/Rental & Leasing exhibited the largest losses. Since 2011, the City’s economy has rebounded, adding 644 new jobs through 2015. Despite recession-based job losses, Wilton Manors had a net gain of 330 new jobs since 2006. According to Dun & Bradstreet, Inc., there are 6,222 jobs in 940 registered businesses in Wilton Manors, accounting for 0.70% of the 892,300 full-time jobs in Broward County. If the City maintains its fair share of countywide jobs, this translates into almost 670 new jobs by 2025 using DEO employment forecasts.
The two largest sectors generating demand for workplace real estate in Wilton Manors include: Wholesale/ Retail Trade (1,980 jobs) and Services (2,860 jobs). Within Services, “Other Services” accounts for fully 66% of the total (1,890 jobs). Together, these sectors account for 78% of the 6,222 jobs in Wilton Manors. “Other Services” includes such industries as automotive repair and maintenance. The data also suggest that the City’s current jobs-to-population ratio is 0.50 (i.e., there is one-half of a job for every resident living in Wilton Manors). This is slightly higher than the County’s ratio (0.47) and re ects a diverse business mix and concentration of businesses along commercial corridors such as Wilton Drive, N. Andrews Avenue and NE 26th Street. This job concentration is re ected in the map below.
According to U.S. Census Bureau data, there are more outbound daily workers than inbound. According to 2015 data, the City appears to have 3,755 workers who live elsewhere and work in Wilton Manors while more than 5,000 residents leave the City on a daily basis to work elsewhere.
INFLOW/OUTFLOW ANALYSIS
According to U.S. Census Bureau data, the City has a net out ow of residents, with 5,056 residents who leave the City daily to work elsewhere, while 3,755 employees arrive to work in the City but live elsewhere.
WORK AREA PROFILE ANALYSIS
As illustrated in the Work Area Pro le Analysis, the City’s highest concentration of jobs is clustered in the center of the City including Wilton Drive and along the FEC.
24

WILTON MANORS TOD MASTER PLAN MARKET OVERVIEW
Workplace/Of ce
The City is in the Broward County of ce sub-market, which contains roughly 27.6 million square feet of of ce supply. 2018 market data indicates approximately 3.37 million square feet is currently vacant, or 12.2% of the of ce market. There are multiple factors contributing to strengthen overall leasing activity, including recovery from the 2007-2009 recession, net new job growth in of ce-using sectors, and new or expanded businesses throughout the County. With an annual absorption pace of approximately 340,000 square feet per year, it would require approximately 9.2 years to reduce the County’s vacant of ce space to stabilized levels in the range of 7% vacancy (i.e., the real estate industry considers stabilized occupancies for of ce buildings to be in the range of 93% to 95%).
Based on absorption trends, it appears the County’s of ce market weakened signi cantly in 2018, with only 14,300 square feet of net absorption for the entire year. This compares to almost 732,000 square feet in 2016 and 274,100 square feet of net absorption in 2017. Despite declining absorption, rents continued to increase, with average asking rents increasing by 14% between 2016 and 2018, from nearly $27 per square foot in 2018 to nearly $31 per square foot at year-end 2018.
Millennials are the fastest growing segment of the U.S. workforce, triggering adjustments in workplaces across the U.S. source: VisionSpark
Wilton Manors is considered a tertiary of ce location in Broward County, with a total of ce inventory estimated at only 198,800 square feet spread across 22 buildings located within one-mile of Five Points based on data compiled from REIS, Inc. (a national commercial real estate data provider) and the Broward County Property Appraiser. Wilton Manors comprises only 0.66% of Broward County’s 27.6 million sq. ft. of of ce supply. There is limited data on key metrics for rent and leasing activity. The larger of ce catchment extends two miles from Five Points, which includes of ce buildings in adjacent municipalities. In this larger area, which includes 722,490 square feet of of ce space, there is 82,000 square feet of vacant
space, representing a 13% vacancy rate. Average asking rents are $23.35 per square foot, and net absorption is highly limited, averaging below 5,000 square feet per year over the past ve years.
In summary, given the tertiary market conditions in and surrounding the City, it appears the of ce market is fairly soft, with higher vacancy rates and limited/nominal annual net absorption. These conditions suggest that market opportunities for new (investment-grade) speculative/multi-tenant of ce development are limited.
Retail
Existing retail uses in Wilton Manors represent a disproportionate amount of the City’s commercial space as compared to similarly-sized communities. This is due, in part, to Wilton Manors’ lower building scale, proximity to Fort Lauderdale and this part of south Florida’s coastal development, and the evolution of Wilton Manors into a destination for LGBTQ residents and visitors. There is signi cantly more retail space in the City than the resident population alone would support. Incremental support for the City’s retail inventory appears to be largely attributable to the visitor market to Wilton Manors.
25

MARKET OVERVIEW WILTON MANORS TOD MASTER PLAN
Although the resident population of Wilton Manors is relatively small (less than 13,000 residents), the City contains just over 950,000 square feet of retail/commercial space within the City Limits. This represents approximately 74 sq. ft. of retail space per resident, which is a remarkable amount of retail space per capita, particularly without any major shopping malls within the City’s boundaries. By comparison, the U.S. average is approximately 26 sq. ft. per capita. European countries tend to contain roughly 2.6 square feet per person. It also indicates that there could be too much retail space in Wilton Manors today, as re ected in the large amount of vacant retail space.
As of the time of the station area plan, eld data indicated there were 55 vacant retail spaces in Wilton Manors totaling almost 231,400 sq. ft. of space, or fully 24% of the City’s total retail/commercial supply. This is considerably higher than the amount of vacant space found in more reasonably balanced markets. Given the real estate industry’s expectations of a vacancy rate of 5-7% to support new retail development, the retail environment of Wilton Manors is considered challenging. Many commercial structures are single-story and awkwardly designed for
As illustrated in the pictures above, many retail spaces in Wilton Manors are located modern use.in smaller, single-story buildings, which limits retail site adaptability for conventional
retail users. image source: outofthecloset.com; out.com; thrillest.com
The City’s resident consumer market is relatively small, and therefore the City’s retail sustainability relies on in ow from surrounding residents as well as visitors. Many newer spaces, developed as ground oor retail within mixed-use buildings, are based on a residential structural grid and therefore too shallow for conventional retail. Therefore, careful strategies have been identi ed in the implementation section of the report to enhance the sustainability of retail, including the addition of residential “rooftops,” hotel/lodging, conversion of existing retail to residential where feasible, and improved and incentivized retail assistance and management. There are also substantial redevelopment opportunities represented by the “Old Florida Seafood” site and the Shoppes at Wilton Manors (former Piggly Wiggly grocery store), which will likely require redevelopment in a mixed-use format to assist in expanding the residential base to support retail spending.
26

WILTON MANORS TOD MASTER PLAN MARKET OVERVIEW
Hotel/Lodging
The City of Wilton Manors has expressed strong interest in attracting an investment-grade hotel to the City to support the tourism/visitor market. In larger population centers and communities with established commercial of ce concentrations, hotels can serve as an important supporting amenity to corporate and business activity generators, for tourism destinations and for nearby residential clusters. Hotel quality levels are generally determined by the depth and sustainability of support from available market segments. In areas with lower spending potentials or more price-sensitive consumers (such as logistics-related markets serving truck drivers and others), market potentials may be best met by a limited-service property (which is de ned by the hotel industry to include no on-site restaurant, and limited other amenities such as gyms, meeting/conference/ event spaces, swimming pools, spas, etc.) as opposed to higher-priced hotel categories (such as full-service business-oriented hotels, which include all of the above amenities) or destination resort properties oriented toward beaches/waterfronts, golf courses, etc.
Broward County contains 31,402 hotel rooms in multiple submarkets across the County. Fort Lauderdale is the largest submarket in Broward, with 14,168 rooms, or 45% of the County total. The hotel room inventory is spread across multiple hotel class levels, including economy, midscale, upper midscale, upscale, upper upscale, and luxury.
Wilton Manors currently has no investment-grade hotels within the City Limits. While there are multiple independent inns and bed and breakfast properties, there is no inventory of “performance data” such as occupancy rates, length of trip, or visitor return-rate. The industry benchmark identi ed for construction feasibility/potential expansion is a sustained annual occupancy level between 65% and 72%. If a market/location sustains an average annual occupancy within these levels (or higher), that location can support additional capacity and warrant development of new hotel rooms. Data for hotels surrounding the City indicate a six-year
average occupancy rate of 71.8%, which indicates potential market support for an investment-level hotel to be developed within the City. As the key commercial corridor in the City, strong consideration should be given for hotel placement fronting Wilton Drive if possible to maximize the visibility of the hotel and its bene ts for the City’s retail and
Current hotel and lodging inventory in the City is limited to bed and breakfasts, small inns, and vacation rentals; however, market data indicates there is potential support for an investment-grade hotel within the City Limits.
entertainment district.
image source: calypsoinn.com; edlugoresort.com; cabanasguesthouseandspa.com
27

MARKET OVERVIEW WILTON MANORS TOD MASTER PLAN
Summary
Given the development potentials and concepts set forth in the station area master plan, ranges of TOD development were determined for analysis purposes. For residential development, given historic trends, up to 691 new residential units could be absorbed City-wide through 2028, with an average annual absorption of approximately 70 units per year. As discussed in this chapter, the workplace/of ce market contains high vacancies and is therefore somewhat limited. If trends are maintained, demand for new of ce appears to be approximately 55,000 square feet through 2025, however current vacancy rates and rent levels may not support new construction. Hotel demand appears to exist for an 80 to 100-room hotel within the City Limits in the next ve years, ideally situated on Wilton Drive for visibility and proximity to the City’s signature commercial corridor. The retail market appears oversupplied, and therefore, net new retail does not appear market-supportable.
The City of Wilton Manors has a specialized tourism market, and the City bene ts from its evolution as a destination for the LGBTQ visitor submarket, attracted by the safe and gay-friendly atmosphere of the community. Two key annual events – the Stonewall Festival and Wicked Manors Halloween event – are recognized as major destination events for gay visitors. Although limited data exists on the City’s LGBTQ visitor market, data analyzed for the market study indicate the City attracts likely 150,000 to 250,000 LGBTQ visitors annually, with visitor spending that appears to support as much as 217,000 square feet of the City’s retail inventory. Given the importance of retail spending for the City’s sustainability, these gures further reinforce the importance of a hotel and better organization of lodging activity in the City to expand and strengthen this important visitor market.
The market and economic ndings have been incorporated into the planning analysis and recommendations to generate the greatest yield from the recommended station location, with acknowledgment that the other two station locations could also work as well. It is noted that plans for the future Tri-Rail station and collateral TOD opportunities need to be collaterally integrated into a coherent road network and comprehensive land use strategy to maximize coordination, effectiveness, and potential yield. Strategic investment in pedestrian circulation, transit access, and transportation mobility will further enhance station development potentials. Accordingly, transportation and roadway planning and investment can provide real estate bene ts that extend beyond the accommodation of traf c into job creation, ad valorem and other revenues, and a more sustainable economic climate for the City.
28

WILTON MANORS TOD MASTER PLAN TOUR OF THE PLAN
TOUR OF THE PLAN
Introduction
The City of Wilton Manors Transit Oriented Development (TOD) Master Plan process is designed to evaluate land use and mobility conditions to identify preferred patterns that will provide the most transit-supportive conditions in and around the City’s future Tri-Rail Station. Properties within the station area are mostly developed, with a mix of retail, of ce, hospitality, industrial, and residential uses. However, these sites were developed in a suburban pattern that tends to highlight vehicular circulation and parking with limited connections and accommodations for cyclists and pedestrians and may be appropriate for redevelopment.
For successful TOD, the key criteria include walkability, connectivity, land uses that are mixed vertically as well as horizontally, and an urbanized format that helps naturally create comfortable pedestrian spaces along transportation corridors. Accordingly, the TOD Master Plan concepts illustrate ways in which these TOD principles could be applied to develop or redevelop properties within the station area, with consideration of market demand and the City’s close attention to detail and architecture. This chapter is organized as follows:
(1) Discussion of TOD (2) Existing Conditions (3) Station Location Assessment (4) Overview of TOD Conceptual Designs (5) Discussion of Connectivity
The recommended pattern of in ll development and redevelopment illustrated in the master plan would complement the City’s desire for improved mobility and connectivity, help reduce vehicular trips on the roadway network, enhance economic development, and enable the City to better meet market demand for housing and non-residential uses as it continues to evolve and advance. Well-planned in ll development in this manner would provide immediate bene ts to the City with improved economic productivity from land development, enhanced destination quality in the City’s core area, much-needed choice in residential development, and enhanced mobility through the district. These outcomes can be achieved in the years preceding Tri-Rail service to the City, and, when implemented, would actually improve the funding competitiveness for the overall system.
This artist conceptual sketch illustrates a new Tri-Rail Coastal Link Station with possible redevelopment opportunities that incorporate residential and commercial uses.
29

TOUR OF THE PLAN WILTON MANORS TOD MASTER PLAN
SECTION 1: TRANSIT-ORIENTED DEVELOPMENT
TOD is a strategy that is associated with the most successful transit services and the communities served by them. Because TOD helps generate ridership, economic development, and quality of life enhancements, the Federal Transit Administration (FTA), which provides funding for transit services, and the SFRTA, which provides the Tri-Rail service, have prioritized TOD as part of an overall transit service development program. The SFRTA has determined TOD is a core part of the regional transportation strategy. The SFRTA de nes TOD as “a mixed-use pattern of pedestrian-friendly, higher-density development with reduced parking around transit stations – all factors that help generate revenues for local governments and ridership for Tri-Rail. More people living and working around Tri-Rail stations will increase ridership and make the region more successful and livable.”
TOD is further de ned by the State of Florida in state statutes and by the Florida Department of Transportation (FDOT) because of its contributions towards the ef ciency and effectiveness of the overall transportation network. FDOT’s more detailed de nition of TOD is included in this section.
What is TOD?
TOD focuses on the land use patterns located within a quarter- to a half-mile of transit stations and corridors served by a premium transit system. TOD maintains a strong emphasis on mobility, walkability, connectivity, urban form, and a mix of uses arranged in a pattern of higher density and intensity than typically found beyond the half-mile “transit shed.” In addition to providing higher ridership potential, well-designed TOD offers a range of uses accessible by pedestrians, thereby reducing demand for vehicular traf c and parking while enhancing mobility and access by other modes (e.g., walking, cycling, riding transit). By closely coordinating land use with transit systems, TOD patterns of development provide a stronger economic return on transit investments, frequently yielding higher rents and property values, and better-developed markets for a range of uses. These economic bene ts help reinforce TOD development activity, expanding both the real estate market and ridership for the transit service. These in turn increase further demand for TOD land development in a cyclical fashion.Florida TOD Guidebook, FDOT, December 2012
30

WILTON MANORS TOD MASTER PLAN TOUR OF THE PLAN
Well-planned TOD is designed as a highly walkable, interconnected series of streets and blocks that has a comfortable urban form, with pedestrian friendliness as a hallmark of the design. By locating building fronts near roadways, shielding them from large expanses of parking, pedestrian corridors are well-de ned, shaded, and protected from the elements.
By locating active building uses (such as display windows, sidewalk cafes, and interactive features) along roadway frontages, pedestrian corridors are more interesting and safer. An expanded mix of uses, with a combination of residential, retail, of ce, recreational, and other active uses, ideally helps create eighteen hours of daily activity, which further enhances the liveliness of streetscapes and safety through “natural surveillance.”
The Florida TOD Guidebook details the various design features of well-planned TODs as summarized in the graphic above.
31

TOUR OF THE PLAN WILTON MANORS TOD MASTER PLAN
TOD’s Relevance to the City of Wilton Manors
The City of Wilton Manors has long prioritized a future commuter rail station as part of its long-range planning and visioning. A future station in Wilton Manors would provide both origin and destination ridership. The residential population of the City, with daily outbound commuters exceeding 5,000 residents, underscores the value of a rail connection for Wilton Manors residents to regional job centers. Additionally, Wilton Manors is known as a unique tourist and visitor destination, hallmarked by an LGBTQ-friendly commercial core and special events such as the Stonewall Parade and Wicked Manors Halloween event. Accordingly, a rail station in the City could facilitate in-bound employees, tourists, and visitors, expanding the City’s access to outside resources and discretionary spending.
By de nition, TOD focuses on the properties that immediately surround a transit station. The inner “transit core” is critical for establishing successful pedestrian connections that extend through the entire transit supportive area. The further pedestrians can comfortably travel, the more extensively the transportation and ridership bene ts emanate from a transit station.
Wilton Manors is a successful, full-service city with a broad range of residential, workplace/ of ce, retail, industrial, recreational, and civic uses and a strong sense of community. Transportation access and connectivity is a critical component to expand economic development opportunities and maintain a high quality of life in communities. As Florida continues to grow, the state’s transportation network has become busier, with forecasts for intensi ed transportation demand of all forms over time. To increase ef ciency and predictability, the state has expanded its commitment to multi-modal transportation networks to bring diversi cation and expand choices for the traveling public.
The City considers a new Tri-Rail station as a major hub for commuters and visitors to Wilton Manors.
32

WILTON MANORS TOD MASTER PLAN TOUR OF THE PLAN
Photograph looking North along Wilton Drive just East of NE 22 Street. These colorful restaurants and retail are examples of the variety and character of Wilton Manors.
One component of the state’s transportation solution is “Complete Streets,” which are streets designed for all users – motorized (in vehicles and transit) and non-motorized (on foot, bike, scooter, etc.). Larger-scale mobility planning is another component, with a diverse transportation network that offers a wider range of choices, including local and regional transit.
At the state level, the FDOT long-range transportation plan is highly multi-modal, with an integrated network of facilities for travel by car, bus, train, air, and sea as well as by bicycle and on foot. Regionally, the SFRTA operates the Tri- Rail service, with a three-county commuter rail system poised to expand into the City of Wilton Manors, bringing a commuter rail station into the city as a central feature of the Tri-Rail Coastal Link. At the County level, Broward County Transit operates four routes through the City, with fteen routes interconnecting at the Broward Central Terminal just south of the City.
Locally, Wilton Manors has intermittently offered trolley service, and the City is well-served by ride-sharing. The City has long planned for a Tri-Rail Coastal Link station to be located near the intersection of NE 26th Street with the FEC Rail Corridor. Wilton Station, a mixed-use higher-density project was constructed within the past ten years, highlighting local anticipation and market-responsive development. At the time of the Station Area Master Plan process, the City was actively evaluating an increase in density and intensity to enable more transit-supportive development in and near the planned station and along NE 26th Street. The City is also implementing bicycle/pedestrian connections, in partnership with the Broward Metropolitan Planning Organization and FDOT, including a Complete Streets improvement to Wilton Drive and additional neighborhood mobility improvements.
Improved local and regional mobility provides bene ts for businesses, residents, and visitors in the City. Both employees and patrons of City businesses will bene t from improved access, and multi-modal solutions that include transit to reduce peak-hour demand on the roadway network. Residents are also bene ted by improved access to jobs, entertainment, educational resources, and recreational destinations outside the City, which contribute to a more sustainable region. Aerial view paddling under the FEC rail corridor on
the South Fork of the Middle River in Wilton Manors. 33

TOUR OF THE PLAN WILTON MANORS TOD MASTER PLAN
95
BoulevardulGardensa
CommunitymCenterC
y
Franklin Park
Lafayette Hart Park
everend Samuel DelevoeReMemorial ParkM
Roosevelt Gardens
Park
Secret Woodsoo
HolidayPark
ororHuHughh Taylooh TayloBirrchir
rkStatee Pare Par
Galleria Mall
Sears Town
Southport Shopping
Center
waphop
Bonuseum & GardensMu
ternational SwimmingInteall of Fame MuseumHa
ngle Queen RiverboatJunBroward Center for The Performing Arts
Museum of Discoveryand Science/Autonation
yy
IMAX Theater
NSU Art Museum Fort Lauderdale
Port Everglades
Stranahan House
ridFlorida poMetropolitan
versitUniversityp
Amtrak Station
Broward HealthBMedical CenterM
Millsccessr
Health Center y Kindred Hospital
Broward CountyHealth Dept.
72
60
81
31
36
40
40
50
20
9
9
11
11
11
14
10
6
1
MA
RTIN
LU
THER
K
N F
EDER
AL
HW
Y.
POW
ERLI
NE
RD.
NE
4 AV
E.
NW
15
AVE.
AA
ND
REW
S AV
E.
NE
15 A
VE.
WILTON DR.
E.S.
AN
DRE
WS
AVE.
SW 4
AVE
.
SE 3
AVE
.
NW
7 A
VEW
.
WER
BLV
D.
WE
NW 6TH ST.
NW 2 ST.
NW 19 ST.
DAVIE BLVD.
.
RD.
OAKLAND PARK BLVD.RAR
NE 26 ST.
SE 24 ST
BROWARD BLVD.
NW
27AV
EW
.
NW 15 ST.5
SE 17 ST.
E. LAS OLAS BLVD.
SUNRISE BLVD.
rt LauderdaleForach ParkBea
Park ll iaGaGalll MMalalll
Broward College/FAUGre hyho dund SSt iation A1A
NE
3 AV
E11 72 55
30 31 40 50 81 U.S. 1Breeze
61 9 10 11 14 20 22BrowardCentral
Terminal (See inset)
60
FORT LAUDERDALE
ALEWILTON
MANORS
can Americann Amsearch Libraryhh Lultural Centeraal
y
95
A1A
1
Map Legend
Commuter Limited Stop Service
Miami-Dade Transit Bus Route
County Line
Palm Tran Bus Route1 92
95A1A
Street
State Road
Interstate
Federal Highway
Florida’s Turnpike
23 Broward County Transit Bus Route
95 95 Express Pembroke Pines/Miramar (Route 109)CB Smith Park/Ansin Sports Complex to Downtown Miam
Breeze Stop
1
95 Express Pembroke Pines (Route 108)North Perry Airport to Miami Civic Center
95
595 Express (Route 110)Sunrise to Miami/Brickell
595
595 Express (Route 114)Sunrise to Miami/Civic Center
595
P Park and Ride Lot
95 Express Miramar (Route 106)Miramar Regional Park to Miami Civic Center 95
Tri-Rail
Implementing TOD in and around the planned Tri-Rail Coastal Link station area is already acknowledged to improve ridership and access to a future transit investment. But beyond the relationship to Tri-Rail, TOD as a land development pattern offers a range of other immediate and long-term bene ts to the City. By improving interconnections between and among workplaces and residences, TOD offers ef ciency improvements to the transportation network, enabling easier access on foot or by bike, bus, or shorter trips by car. These can reduce demand on the roadway network and provide other environmental and health bene ts. Higher density development within the City’s core also bene ts adjacent land uses, whereby complementary businesses can operate synergistically. This creates improved information and resource sharing, faster product development, and more comprehensive solutions. Residential uses integrated into workplace districts can further reduce transportation impacts, increase employee productivity, and provide health bene ts. Together, the bene ts of TOD can begin to materialize well before the introduction of the transit service that helps expand them, with implementation of the City’s long-range plans, improved economic development, and enhanced quality of life for its residents.
Broward County Transit is the local transit provider to the City of Wilton Manors and provides four routes through the City with the nearby Broward Central Terminal providing additional interconnectivity.
34

WILTON MANORS TOD MASTER PLAN TOUR OF THE PLAN
SECTION 2: EXISTING CONDITIONS
The study area for the Wilton Manors TOD Station Area Master Plan process was centered around the intersection of NE 26th Street and the FEC Rail Corridor. This location had historically been identi ed by the City, transportation agencies, and other entities as the preferred location for the City’s future station. NE 26th Street is a primary east/west corridor in Wilton Manors, providing connections to three prominent north/ south roadways: North Andrews Avenue, North Dixie Highway, and North Federal Highway. Proximate to this key City intersection, there were three potential station locations identi ed during the due diligence and public outreach activities: a northern site immediately north of (and abutting) NE 26th Street; a central site immediately south of (and abutting) NE 26th Street; and a southern site immediately south of (and abutting) NE 24th Street (adjacent to the City’s Pioneer Maintenance Complex property. All three of these potential station locations were evaluated for their ability to accommodate a station and platform, parking, multimodal access, and ancillary TOD potential. The locations are depicted in the graphics in this section. Due to the proximity of the sites to one another, (with only 800 feet separating the northern and southern potential locations) the planning recommendations contained in this report apply equally to any of the three locations. While any of the three could potentially accommodate the future Wilton Manors Tri-Rail Coastal Link station, the central location is recommended due to its superior connectivity, visibility, access, and potential TOD yield.
As illustrated in the map above, the recommended future Tri-Rail station location near the intersection of NE 26th Street and Wilton Drive is easily accessible and centrally located. The yellow dashed circle represents a half-mile radius around the general station location.
35

TOUR OF THE PLAN WILTON MANORS TOD MASTER PLAN
Existing Conditions of the Study Area
(TOD Design and Redevelopment Concepts)
1 Central Station Location
2. “Five Points”Intersection & Conceptual Redesign
3. Wilton Manors B&B District
4. North Dixie Highway & Redevelopment Concepts
5. Old Florida Seafood Site
6. Pioneer Maintenance Complex Site
7. Shoppes at Wilton Site
8. Municipal Campus
The map above highlights the key parcels in the station area which includes the recommended station locations.
N D
IXIE HW
Y
NE
6TH
A V E
NE
16TH
A V E
NE
15TH
A V E
NE 26TH ST
NE 24TH STWILTON DR
N 20TH ST
NE 7TH AVENE 21ST CT
811
NE 22ND DR
NE 21ST C T
Base Map
WILTON MANORS
1/2 Mile
FE
C R
R
Poten t ia l S ta t i on Loca t ion
Recommended S ta t i on Loca t ion
Legend
“Wilton Station”
“Metropolitan”
36

WILTON MANORS TOD MASTER PLAN TOUR OF THE PLAN
Existing Conditions
Wilton Manors is a diverse, progressive, energetic community with a broad mix of residents and an active nightlife setting that draws from a regional and, at times, nationally-scaled market. The City is characterized by well-maintained residential neighborhoods of single-family, townhouse, and multi-family residential uses centrally located and within walking distance to Wilton Drive, the City’s signature commercial corridor. The high cost of the City’s single-family and townhouse units tend towards upper-income residents, and the limited supply of modestly-priced single- and multi-family inventory limits the City’s ability to attract Millenials, which is evidenced in the City’s demographic data. There exists strong demand for smaller, more affordable residential units to assist the City in attracting a younger, working population. Further, higher density residential development would create more buyers for the City’s retail and service offerings.
While the City’s housing inventory is undersupplied, its retail/commercial inventory is oversupplied. The City has approximately 950,000 square feet of retail/commercial space, which is a substantially higher per capita than the national average (74 square feet per capita in Wilton Manors versus 26 square feet per capita across the United States). Accordingly, as retail spending patterns have changed over time and due to the age, design, and structural limitations of the City’s retail inventory, nearly a quarter of the City’s retail space was vacant at the time of the TOD Station Area Master Plan study. Removing vacant retail/commercial space from the City’s total, food and beverage uses constitute roughly 14% of the City’s remaining occupied retail inventory. Given the limited spending power of the City’s small residential population (12,800 people as of 2018), the economic sustainability of the City’s retail businesses is heavily dependent on in ow revenue from tourists and visitors. In ow accounts for nearly $34 million in annual sales among Wilton Manors’ businesses and almost half the total sales in restaurants and drinking places within the City.
Given the need for in ow spending and the City’s special events and visitor pro le, the City has long prioritized the establishment of a hotel as a core component of continued economic sustainability. The City’s current hotel and lodging inventory is limited to smaller boutique hotels and bed and breakfast inns along with a dispersion of vacation rentals within the City’s neighborhoods. While these lodging facilities meet a portion of the City’s demand, market data indicates unmet demand for an 80 to 100 room hotel to expand the City’s lodging options and formalize its positioning as a visitor destination. Planning analysis during the Station Area Master Plan process concluded the primary site for a future hotel should include placement on Wilton Drive to maximize visibility, access, presence, and proximity to the entertainment venues on the City’s primary commercial corridor.
The planning concepts set forth in the Station Area Master Plan consider these economic and market ndings as they illustrate the transit-supportive land development pattern needed to support a future Wilton Manors Tri-Rail Coastal Link Station in the heart of the City. Rendering of the Wilton Drive “Complete Streets” project that
was underway at the time of the TOD Station Area Master Plan process.
37

TOUR OF THE PLAN WILTON MANORS TOD MASTER PLAN
As pictured in the images above, Wilton Manors is well-known for its active nightlife along Wilton Drive and The Venue, which hosts regionally-scaled special events, weddings, and receptions. The popularity of these destinations help illustrate the unmet demand for a hotel in the City.
38

WILTON MANORS TOD MASTER PLAN TOUR OF THE PLAN
The City’s hotel and lodging inventory is limited to bed and breakfast inns, and vacation rentals. However, demand exists for an 80-100 room hotel that would help stabilize the City’s retail inventory and broaden its economic strength.
39
TOUR OF THE PLAN WILTON MANORS TOD MASTER PLAN
SECTION 3: POTENTIAL STATION LOCATIONS IN WILTON MANORS
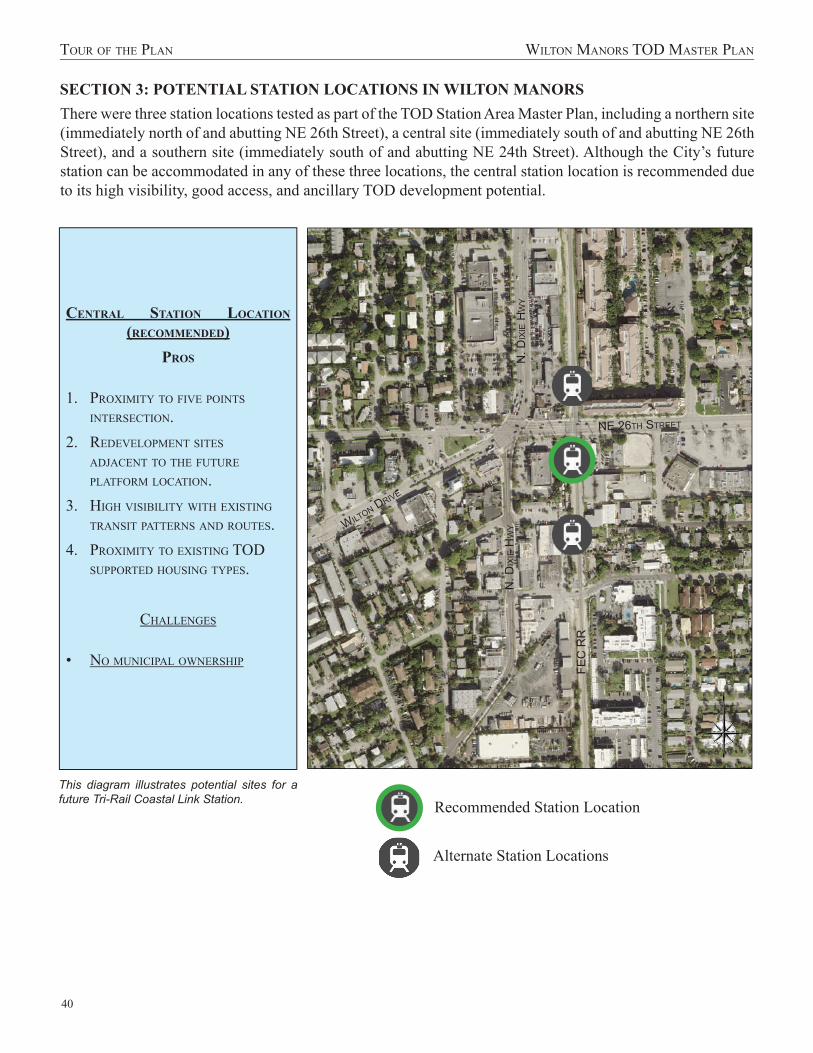
There were three station locations tested as part of the TOD Station Area Master Plan, including a northern site (immediately north of and abutting NE 26th Street), a central site (immediately south of and abutting NE 26th Street), and a southern site (immediately south of and abutting NE 24th Street). Although the City’s future station can be accommodated in any of these three locations, the central station location is recommended due to its high visibility, good access, and ancillary TOD development potential.
CENTRAL STATION LOCATION
(RECOMMENDED)
PROS
1. PROXIMITY TO FIVE POINTS
INTERSECTION.
2. REDEVELOPMENT SITES
ADJACENT TO THE FUTURE
PLATFORM LOCATION.
3. HIGH VISIBILITY WITH EXISTING
TRANSIT PATTERNS AND ROUTES.
4. PROXIMITY TO EXISTING TOD SUPPORTED HOUSING TYPES.
CHALLENGES
• NO MUNICIPAL OWNERSHIP
FE
C R
R
NE 26TH STREET
N. D
IXIE
HW
Y
WILTON
DRIVE
N. D
IXIE
HW
Y
This diagram illustrates potential sites for a future Tri-Rail Coastal Link Station.
Recommended Station Location
Alternate Station Locations
40

WILTON MANORS TOD MASTER PLAN TOUR OF THE PLAN
Station Location
This artist conceptual elevation along NE 26th Street looking South at the new Tri-Rail Coastal Link Station with possible redevelopment opportunities incorporating both residential and commercial uses.
The central station location, immediately south of and abutting NE 26th Street, west of the FEC rail corridor, offers signi cant TOD in ll and redevelopment opportunities for the City of Wilton Manors. The station and platform can be positioned such that pedestrians can utilize the at-grade crossing and sidewalk along NE 26th Street to access platforms on either side of the station (northbound and southbound)thus obviating the need for raised crossing with stairs, elevators, etc. The site’s proximity to the Five Points intersection raises its visibility and prominence as a civic statement. As illustrated in this section, a consistent pedestrian frontage along NE 26th Street would facilitate pedestrian and bicycle access to the station by helping frame the roadway and increase the comfort and itinerary for nonmotorized users. The adjacent Old Florida Seafood site, which is a prime redevelopment opportunity, could provide higher-density residential and mixed-use development, providing both riders and destinations for future train service.
Public input received during the workshop and outreach components of the Station Area Master Plan process indicated support for regulatory measures to enable higher density, higher intensity development along prime commercial corridors such as NE 26th Street. Accordingly, the in ll pattern illustrated in this section depicts mixed-use buildings that would contain primarily residential uses in the upper stories with a mix of residential, retail/commercial, and of ce at the ground oors to maintain an active pedestrian condition. Building heights should be varied, from a one to four stories with additional upper-story architectural enhancement, with appropriate step-down transitions at rear property lines abutting single-family residential neighborhoods. A taller building pro le would be appropriate along the major commercial corridors, with suitable residential neighborhood transitions. However, city regulatory modi cations would be needed for their accommodation.
The rendering above shows one possible design for the Wilton Manors Tri-Rail Coastal Link Station. The view above is at the intersection of the FEC Railway and NE 26th Street.
41

TOUR OF THE PLAN WILTON MANORS TOD MASTER PLAN
Station Location
RECOMMENDED STATION LOCATION
THE CENTRAL RECOMMENDED STATION LOCATION IN WILTON MANORS, IMMEDIATELY SOUTH OF AND ABUTTING
NE 26TH STREET, HAS HIGH VISIBILITY DUE TO ITS FRONTAGE ON A MAJOR COMMERCIAL CORRIDOR AND
GOOD PROXIMITY TO THE CITY’S MAIN INTERSECTION - FIVE POINTS - WHICH REPRESENTS THE INTERFACE
OF NE 26TH STREET, WILTON DRIVE, AND NORTH DIXIE HIGHWAY.
THIS LOCATION OFFERS OPPORTUNITIES FOR PARKING AND REDEVELOPMENT ADJACENT TO THE SUGGESTED PLATFORM
LOCATION, WHICH WOULD REQUIRE ACQUISITION OF PARTNERSHIP WITH PRIVATE LANDS TO COMPLETE THE STATION
DEVELOPMENT PROGRAM.
NE 26TH STREET
FE
C R
R
N. D
IXIE
HW
Y
WILTON DRIVE
NE 26TH STREET
N. D
IXIE
HW
Y
VIEW FOR
RENDERING
42

WILTON MANORS TOD MASTER PLAN TOUR OF THE PLAN
Station Location
The future Wilton Manors Tri-Rail Coast Link Station is depicted with a modern aesthetic. Mixed-use buildings with residential above suggested for redevelopment adjacent to the station would increase ridership by bringing a higher density to the area.
The station location at the center of Wilton Manors offers the opportunity for a signi cant, distinctive architectural theme to celebrate the City and its uniqueness as a fun, modern destination for residents, tourists, and visitors. Depicted in these images is a blended architectural style that incorporates mid-century modern with elements of the futuristic “Googie” style of the 1930s to the 1960s. Stylistically, the suggested palate includes clean lines, asymmetrical roof lines, and some whimsical detailing to add signature statements to the frontage of NE 26th Street. The Wilton Manors future station offers an opportunity for an iconic building design and district that itself could become a destination as visitors and tourists access the community from its new rail “front door.”
In terms of massing and to maintain suf cient parking, new buildings are depicted with internal parking structures, lined with habitable space along roadway frontages to maximize land development yield, enhance urban form, and ensure active pedestrian spaces along roadways. Maintaining habitable, occupied space along frontages also increases “eyes on the street,” which provides natural surveillance and improves safety.
43

TOUR OF THE PLAN WILTON MANORS TOD MASTER PLAN
Station Location
The rendering above illustrates possible redevelopment of the area around the proposed Tri-Rail Coastal Link Station at NE 26th Street and the FEC Rail Corridor. Mixed-use buildings with added structured parking and public open space are represented in this illustration. A maximum of four-story building heights is shown with an overall added density.
44

WILTON MANORS TOD MASTER PLAN TOUR OF THE PLAN
SECTION 4: STUDY AREA TOD DESIGN CONCEPTS
The area immediately adjacent to the future train station represent the City’s “transit core” of the TOD Station Area. Properties within the inner quarter-mile are typically the most bene ted by station development. The walkability and development pattern of the transit core surrounding the station will contribute directly to the success of the continued TOD pattern that extends through the larger half-mile station area and beyond. Pedestrian comfort, with shared, wide sidewalks, traf c calmed streets, buildings lining the road to create an urban “edge”, and a mix of uses that create eighteen hours of daily activity are all components of a successful TOD district.
This TOD effort examines the opportunities and constraints of different levels of detail depending on proximity to the potential station location within the inner core as well as properties with municipal ownership. The plan also focuses on Wilton Drive, which acts as the main street for Wilton Manors. There are several key sites evaluated for the application of TOD design principles as part of the master plan. They include the Five Points Intersection, Wilton Manors B&B District, North Dixie Highway. Redevelopment Opportunities including the Old Florida Seafood Site, Pioneer Maintenance Complex Site, Shoppes at Wilton Site, and the City Hall/ Municipal Campus Site. These sites are identi ed on the base map included on page 36.
Each conceptual redevelopment scenario was developed with enough detail to enable the team to calculate the potential residential, non-residential, and parking yield for each project. All conceptual plans maintain the existing four-story building height limits as set forth in the City’s land development regulations. However, the City’s policy goals may warrant consideration of higher densities to enable more residential units and increased economic development and municipal revenue bene ts.
45

TOUR OF THE PLAN WILTON MANORS TOD MASTER PLAN
Five Points Intersection - Conceptual Redesign
N N
OR
TH D
IXIE
HIG
HW
AY
WILTON DRIVE
NE 26TH ST
C I T Y
MARKER
The illustration above depicts the new Five Points intersection with improvements within the existing right-of-way. The addition of buffered and/or protected bike lanes and improved dynamics of how cyclists and pedestrians move through the intersection are implemented with new painted striping and bulb-outs at the curb. On-street parking was also added along North Dixie Highway.
The Five Points intersection includes each of the major roads that traverse the heart of Wilton Manors, which has been a signature landmark in the City since its platting in 1925. Today, Five Points includes NE 26th Street, North Dixie Highway, and the termination of Wilton Drive. The intersection creates a navigation challenge for pedestrians, drivers and cyclists. The Station Area Master Plan process included a special focus on this intersection and evaluated various ways in which its safety and navigability could be improved. The on-going roadway recon guration of Wilton Drive will reduce the number of travel lanes, and will signi cantly improve the intersection’s safety and appearance. One signi cant improvement will be the already planned lane reduction at Wilton Drive. Reducing the number of lanes reduces the asphalt necessary for pedestrians to cross and reduces the size of the cross sections. Future lane reductions would have the same effect on the intersection. The addition of bicycle lanes at NE 26th Street and Wilton Drive is also an opportunity to provide safer, protected bicycle lanes at the intersection.
One intersection redesign considered in the master plan process involved the introduction of a roundabout. However, existing conditions and traf c patterns were determined to be inappropriate for a roundabout solution until and unless additional roadway recon gurations are advanced to reduce the number of lanes entering the intersection.
46

WILTON MANORS TOD MASTER PLAN TOUR OF THE PLAN
Five Points Intersection - Conceptual Redesign
Another design solution looked at the past and how this unique intersection was composed historically. Part of the 1925 platting included a series of Romanesque towers which were used as a sales tool. This landmark, located in an important intersection helped create an identity for the City. In 1964, the towers were removed along with the City’s key identifying architectural monument. Replacing the tower on the site can provide a way of announcing a change in the transportation patterns to those entering the intersection and provide a directional landmark.
A landmark design is an opportunity to anchor a park or public space and re ect the identity of Wilton Manors. The depicted design draws from the past tower, the important mid-century growth of the city and the diversity of the city today and into the future. Lighting of the landmark is a opportunity to promote awareness of speci c events in the city and add a dynamic component. The tower also acts an anchor for an open public green space for pedestrian comfort in a part of the City that lacks those civic amenities. The design below re ects the “Island City” theme with a continuous bench that simultaneously encloses a green landscaped area, provides ample seating, and a signage pedestal. Both the tower and signage should provide a placemaking photo opportunity to help further distinguish Wilton Manors as a unique destination without rival.
47

TOUR OF THE PLAN WILTON MANORS TOD MASTER PLAN
North Dixie Highway District
WILTON MANORS DIXIE HIGHWAY: LEGEND
48

WILTON MANORS TOD MASTER PLAN TOUR OF THE PLAN
North Dixie Highway District
The North Dixie Highway District provides an opportunity to expand commercial and mixed-use beyond Wilton Drive and enhance cultural arts in close proximity to the recommended station location. The District is comprised of main redevelopment opportunities including the Old Florida Seafood and the City-owned Pioneer Maintenance Complex Site as well was opportunities to reconnect the street grid and introduce mixed use development, additional parking and green public open space as part of a phased redevelopment approach. The image below depicts a potential redevelopment strategy for the area.
Already there two important anchors to the east of the FEC. Metropolitan project which introduced 179 new residential units, and the Wilton Station mixed-use development. Other proximate uses of interest include the Eucalyptus Garden, which is home to local favorite establishments like The Alchemist and pop-up vendors with live music. It is important that any future redevelopment of the Eucalyptus Garden property integrate a continued roadway network grid to connect, for example, NE 13th Avenue from NE 26th Street to NE 24th Street. A connection will provide further opportunity for mobility to and from the station and opportunities for on-street parking.
The plan above depicts the conceptual design for a new connective street grid. The aerial shows the existing conditions surrounding possible redevelopment sites and the future Tri-Rail Coast Link station.
NE 26TH STREET
FE
C R
R
N D
IXIE
HW
Y
NE 24TH ST
WIL
TO
N D
R
NE
13T
H A
VE
NE
14T
H A
VE
STREET GRID
CONCEPTUAL DESIGN
1. EUCALYPTUS GARDEN, CONNECT NE 13TH
AVE FROM NE 26TH TO 24TH ST.
2. CONNECT NE 24TH STREET BETWEEN NORTH
DIXIE HIGHWAY AND NE 11TH AVE.
3. DIVIDE PIONEER MAINTENANCE COMPLEX
INTO BLOCKS, SEE PIONEER MAINTENANCE
COMPLEX CONCEPTUAL DESIGN FOR MORE
DETAIL. ROUTE NE 12TH AVE AS A NORTH-
SOUTH ROAD ALONG FEC RAIL CORRIDOR
AND PROVIDE NEW EAST-WEST ROADS.
4. CONTINUE NE 14TH AVE FROM NORTH OF
26TH STREET TO NE 25TH ST, SEE THE OLD
FLORIDA SEAFOOD CONCEPTUAL DESIGN.
49

TOUR OF THE PLAN WILTON MANORS TOD MASTER PLAN
Old Florida Seafood Center Property
NE 26TH STREET
FE
C R
R
1.
3.
2.
3.
NE 26TH STREET
FE
C R
R
3.
3. 3.
2.
NE
13T
H A
VE
NU
E
NE
13T
H A
VE
NU
E
NE
14T
H A
VE
NU
E
Conceptual plan for the “Old Florida Seafood Center” site.
OLD FLORIDA SEAFOOD CENTER - CONCEPTUAL DESIGN
1. MIXED-USE (62,500 SQ.FT.) + (27,300 SQ.FT. PARKING)
2. OFFICE (17,300 SQ.FT.) + (PARKING)
3. TOWN HOMES (49,900 SQ.FT.) + (PARKING)
50

WILTON MANORS TOD MASTER PLAN TOUR OF THE PLAN
Old Florida Seafood Center Property
The Old Florida Seafood Center site represents a prime redevelopment opportunity for the City of Wilton Manors. With signi cant and visible frontage along NE 26th Street and proximity to the recommended station location, the successful redevelopment of this property is critical for the success of the station. One of the challenges of older, suburban commercial sites such as this one is their vehicular orientation, with large surface parking areas separating buildings on the site from the surrounding roadway network. This site was clearly designed to accommodate the majority of patrons by vehicles, with limited consideration for pedestrians or cyclists to access its uses. The current site design makes the property inhospitable for pedestrians within the site, and further, it is unpleasant for pedestrians to walk by the site on the fronting sidewalk. This limits the pedestrian capture opportunities and desire to use the station from surrounding neighborhoods.
The redevelopment concept for this property proposes breaking the site into parcels by connecting the street grid. With the extension of NE 13th and NE 14th Avenues between NE 25th and NE 26th Streets, the site becomes a part of the City instead of an island extending off NE 26th Street. The new roadway connections are designed with on-street parking and landscaping, with buildings fronting the roadway edge, to facilitate pedestrian traf c in a safe and desirable manner. The roadway grid creates connections to the residential neighborhoods to the south, enabling easy access to the newly available goods and services. The concept also illustrates a transecting of use and density between the existing single-family homes and the NE 26th Street commercial areas. Currently the single-family homes directly abut the rear of the commercial uses fronting NE 26th Street. Instead, in the proposed concept, the site could include townhouses (approximately 25 are depicted in the concept) in a back-to-back relationship with the single-family homes, which creates the proper transitional relationship and can increase property values.
Buildings depicted between NE 13th Avenue and the new extension of NE 14th Avenue are shown as of ce buildings (approximately 17,300 square feet) with a limited amount of parking. Adjacent to the FEC at the eastern end of the property, the concept suggests the greatest density and exibility of use, with a larger-scale mixed-use development that contains internalized parking. The concept illustrates approximately 62,500 square feet, but additional occupiable space could be accommodated with adjustments to building heights and parking.
The concept for the Old Florida Seafood Center site, along with all the other conceptual plans included in the master plan, maintain a building height maximum of four stories. The image above represents a massing diagram looking southwest across the site from NE 26th Street.
51

TOUR OF THE PLAN WILTON MANORS TOD MASTER PLAN
Pioneer Maintenance Complex Property
Conceptual plan for the “Pioneer Maintenance Complex” site.
1.
2.
2.
2.2.
3.
NE 25TH STREET
FE
C R
R
N. D
IXIE
HW
Y
S. D
IXIE
HW
Y
NE 24TH STREET
2. 2.
2.
2.
2.
NE 25TH STREET
FE
C R
R
N. D
IXIE
HW
Y
S. D
IXIE
HW
Y
NE 24TH STREET
PIONEER MAINTENANCE COMPLEX PROPERTY
CONCEPTUAL DESIGN
1. CIVIC/THEATER (3,800 SQ.FT. PROPOSED) + (PARKING)
2. LIVE-WORK/TOWN HOMES (55,800 SQ.FT.) + (PARKING)
3. CIVIC/PUBLIC WORKS (21,200 SQ.FT. PROPOSED) + (PARKING)
52

WILTON MANORS TOD MASTER PLAN TOUR OF THE PLAN
Pioneer Maintenance Complex Property
Above image shows scale of redevelopment recommendations at City-owned property and N Dixie Highway.
South of NE 24th Street on a triangle-shaped lot, the City currently owns and operates a utility yard referred to as the Pioneer Maintenance Complex. For several years, the City has been evaluating the yard and its best use for the City’s needs. In the redevelopment concept developed as part of the master plan, it is suggested the City acquires the property to the south of the City-owned property to improve the ef ciency of the site’s development. By arranging the uses in a long rectangular con guration, the City’s storage and maintenance needs can be more ef ciently accommodated versus the current triangular con guration. The redevelopment concept illustrates a long narrow public works building to house current uses and ample space to enable larger vehicles to navigate the site. This con guration would allow the City to keep its utility yard within the City Limits, preventing the need to engage in additional land acquisition perhaps outside the City for this purpose.
By consolidating the City’s utility and public works uses, the property can be broken into regular blocks with an improved and more navigable street network. The new rectangular blocks can be more easily developed, and the triangular block can become a small remnant parcel that could house a municipal amenity such as a dog park or playground. The small street network provides more potential traf c circulation and the opportunity for on-street parking. Within the regular blocks, the redevelopment concept suggests a series of live-work townhomes (25-30 total townhomes) where the previous public works yard was located.
Located within this redevelopment area is the Wilton Theater Factory which houses two black-box stages and hosts two theater companies. Arts and entertainment uses are important cultural facets in the City of Wilton Manors. With redevelopment consideration can be made to add signi cance to places of arts and entertainment with open public spaces. In the redevelopment concept, a theater is suggested located along North Dixie Highway adjacent to public open space. Open space could be utilized to host events in conjunction with the theater.
53

TOUR OF THE PLAN WILTON MANORS TOD MASTER PLAN
Shoppes of Wilton Manors Property
WILT
ONDRIV
E
NE
6 TH
A VE
NE
7TH
A VE
SH O P P E S O F WI LT O N MA N O R S PR O P E R T Y
EXISTING CONDITIONS
• 225 SURFACE PARKING SPACES
• 78,600 SQ.FT. COMMERCIAL BUILDING
Existing aerial view of the Shoppes of Wilton Manors property
In recent years, the Shoppes of Wilton Manors property has been the center of the entertainment district in the City. Located along Wilton Drive and at the terminus of NE 6th Avenue, the site is often the rst property at Wilton Drive for those traveling from highway arterials and Oakland Park Boulevard. Located in the Shoppes property is George’s Alibi Monkey Bar, which is a long-standing local bar that has shaped the area and is still a popular destination in the City. Other businesses within the Shoppes have been vacant for some time including a large big-box footprint. The site is another primary opportunity for redevelopment. Through the station area master plan process, a phased redevelopment scenario was developed for the property. The advantage of redevelopment in phases allows successful business and area anchors to continue to operate in place while increasing the use of the property. 54

WILTON MANORS TOD MASTER PLAN TOUR OF THE PLAN
Shoppes of Wilton Manors Property
Phase 1 plan for the “Shoppes of Wilton Manors”
WILT
ONDRIV
E
NE
6 TH
A VE
NE
7TH
A VE
Phase 1:
The rst phase depicts the demolition of the existing big box footprint to the northeast side of the site, while keeping George’s Alibi Monkey Bar and the strip-mall to the southwest. Along 7th Avenue, a new structured parking garage with a mixed-use liner is proposed along with a new mixed-use/residential building at the corner or Wilton Drive and NE 7th Avenue. Parking for the new mixed-use building would be accommodated in a new garage that would replace the surface parking currently serving the strip-mall.
SH O P P E S O F WI LT O N MA N O R S
PHASE 1 CONCEPTUAL DESIGN
25 DUA’S (3 STORIES)
1. MIXED-USE/RESIDENTIAL 25,900 SQ.FT. FOOTPRINT
2. PARKING STRUCTURE 37,900 SQ.FT.
3. MIXED-USE LINER 5,000 SQ.FT.
4. EXISTING TO REMAIN - RETAIL AND
“GEORGE’S ALIBI MONKEY BAR” WITH 26 SURFACE PARKING SPACES
55

TOUR OF THE PLAN WILTON MANORS TOD MASTER PLAN
Shoppes of Wilton Manors Property
WILT
ONDRIV
E
NE
6 TH
A VE
NE
7TH
A VE
Phase 1 plan for the Shoppes of Wilton Manors property
Phase 2:
In a second phase, the redevelopment concept suggests replacing the existing building with a new mixed use/ residential structure capped at the height and density allowed by code and market conditions. As a previously designed strip-mall, any redevelopment should be carefully to consider the neighborhood connections and bring the pedestrian connections into the site.
SH O P P E S O F WI LT O N MA N O R S
PHASE 2 CONCEPTUAL DESIGN
25 DUA’S (3 STORIES)
1. MIXED-USE/RESIDENTIAL 25,900 SF
FOOTPRINT
2. PARKING STRUCTURE 37,900 SF
3. MIXED-USE LINER 5,000 SF
4. MIXED-USE/RESIDENTIAL 31,500 SF WITH
RELOCATED “GEORGE’S ALIBI MONKEY
BAR”
56

WILTON MANORS TOD MASTER PLAN TOUR OF THE PLAN
City Hall/Municipal Campus Property
NE
22N
D D
RIV
E
NE 20 TH S TREET
WIL
TON
DR
IVE
NE 21ST C
OURT
NE 21 ST S TREET
NE
21S
T D
RIV
E
The aerial above shows the existing conditions of the municipal campus/hotel site. The boundary of the suggested redevelopment is marked with a black dashed line.
The City has tremendous opportunity in redevelopment at the City Hall/Municipal Campus property located along Wilton Drive between NE 20th Avenue and NE 21th Avenue. The property is owned by the City up to the NE 21st Drive. At NE 22nd Drive is Hagen Park, which currently houses a community center, tness center, tennis center, volleyball courts and the Women’s Club which was donated in 2011. Today, the Women’s Club functions as a community center and rental event space. City Hall and the police station was recently built and completed in 2012. With each of those municipal functions, there is still an excess amount of surface parking spaces which serve as metered parking today.
The site’s current design includes City Hall fronting Wilton Drive along with a large, poorly lighted surface parking lot and inconsistent landscaping. Consequently, the City Hall property represents an “activation gap,” which discourages pedestrian traf c past the site, especially at night. The lack of evening uses on the site present a safety concern, which is elevated given the signi cant bar and restaurant activity occurring along Wilton Drive. To advance the station area master plan and address the hotel demand discussed in this report, it is recommended the City consider engaging a private development entity to enable hotel development on the site along with other potential residential, retail/commercial, of ce/workplace, recreational, and public/ civic uses.
The City Hall/Municipal Campus represents the prime hotel development opportunity in the City of Wilton Manors. The site’s depth and public ownership enable the City to enter into a public/private partnership with a hotel developer if so desired, enabling the City greater control over architectural detail, building design and amenities, and ancillary site amenities.
57
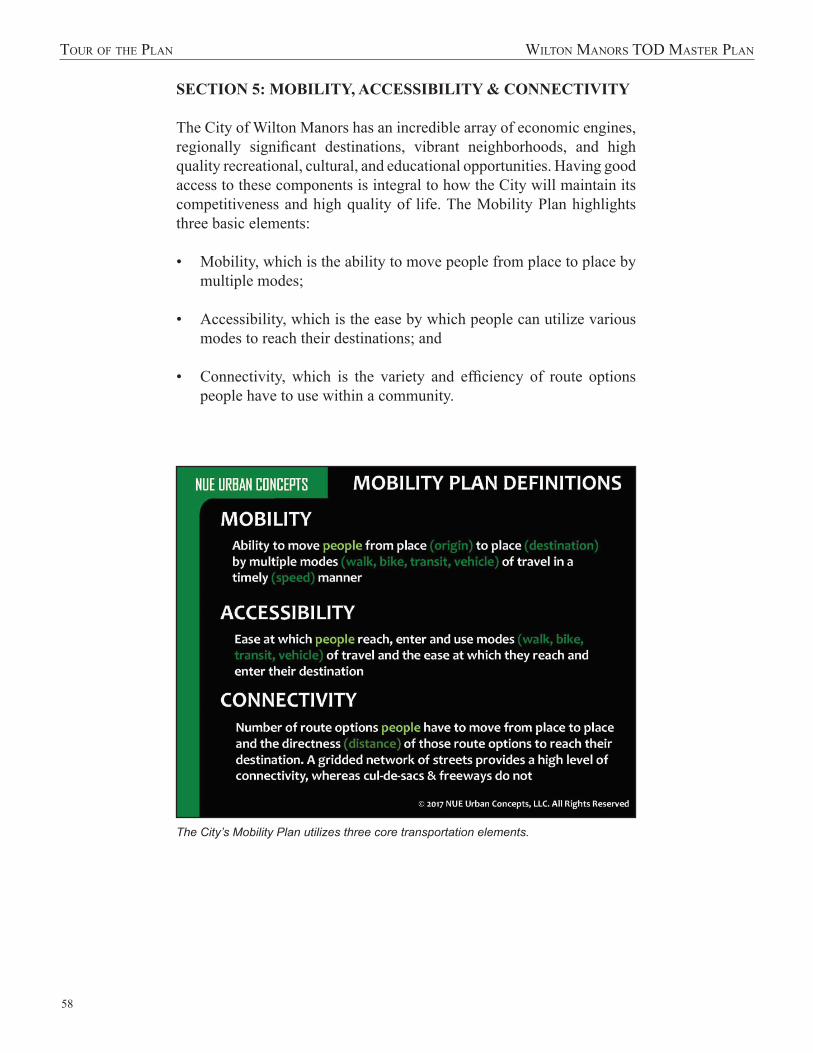
TOUR OF THE PLAN WILTON MANORS TOD MASTER PLAN
SECTION 5: MOBILITY, ACCESSIBILITY & CONNECTIVITY
The City of Wilton Manors has an incredible array of economic engines, regionally signi cant destinations, vibrant neighborhoods, and high quality recreational, cultural, and educational opportunities. Having good access to these components is integral to how the City will maintain its competitiveness and high quality of life. The Mobility Plan highlights three basic elements:
• Mobility, which is the ability to move people from place to place by multiple modes;
• Accessibility, which is the ease by which people can utilize various modes to reach their destinations; and
• Connectivity, which is the variety and ef ciency of route options people have to use within a community.
The City’s Mobility Plan utilizes three core transportation elements.
58

WILTON MANORS TOD MASTER PLAN TOUR OF THE PLAN
Mobility
The ways in which residents, businesses, and visitors move to and through a community are evolving, with progressive communities embracing a growing array of choices to meet individual needs and demands. The most successful and competitive communities have shifted away from auto-centric transportation networks,that limit transportation options to primarily personal vehicle, to multi-modal networks that offer an array of motorized and non-motorized choices.
Across Florida and the nation, transportation patterns and choices have been expanding, with an increase in cycling and other human-powered modes, ride-sharing modes like Uber and Lyft, and transit options of all shapes and sizes. Within Broward County, available transit services today range from pedicabs, bike rental, local trolleys and water taxis to Broward County Transit Buses (BCT), Tri-Rail commuter rail, Amtrak, and Brightline’s intercity rail. Millennials, already noted as the fastest growing segment of the population, seek workplaces and residential communities where they can avoid driving and instead walk, bike, and take transit. As cities seek to attract these buyers and workers, the transportation network becomes a selling feature.
source: ALTA Planning and Design
59

TOUR OF THE PLAN WILTON MANORS TOD MASTER PLAN
The most competitive cities of the future are nding ways to provide an expanding array of travel modes, because the most connected cities will ultimately be the most successful. Images above: Courtesy of “Nue Urban Concepts”
60

WILTON MANORS TOD MASTER PLAN TOUR OF THE PLAN
Accessibility
To accommodate the broader range of users on the roadway network, and to improve safety, mobility, and accessibility, there has been a shift towards the development of Complete Streets. This approach relies on an integration of land use and transportation planning to create holistic transportation systems that can properly accommodate motorized and nonmotorized users. The image below details some of the components, all of which are embodied in TOD: parking behind or within buildings, on-street parking, active ground- oor uses, realms for different modes, pedestrian amenities, and narrow streets that have traf c-calming.
Complete Streets are a national and state-wide priority that offer safety, functional, and ef ciency improvements to the transportation network. TOD principles help create complete streets by integrating land use and transportation as areas develop.
61

TOUR OF THE PLAN WILTON MANORS TOD MASTER PLAN
Accessibility
Traf c calming is a proven method for slowing vehicular traf c and improving bicyclist and pedestrian safety. Wider roadways with limited landscaping and few de ections cause drivers to naturally increase speed, while narrower roadways, with landscaping and well-de ned pedestrian pathways, cause drivers to slow down. Faster moving drivers have a narrower range of vision than slower drivers, so pedestrians and cyclists that might be invisible at 40 MPH are inherently safer and less likely to be involved in an accident at 20 MPH. Further, the likelihood of surviving a pedestrian/vehicle or cyclist/ vehicle accident are markedly better at slower speeds.
The image above illustrates the bene t of traf c calming. While pedestrians and cyclists are virtually invisible to drivers at 40 MPH, they are clearly visible at lower speeds, which makes for signi cantly safer transportation networks.
The dangers of higher speeds and pedestrian accidents are illustrated in the graphic above.
62

WILTON MANORS TOD MASTER PLAN TOUR OF THE PLAN
Connectivity
Connectivity to and from the TOD site for all modes of mobility is crucial to the success of both the transit service and future redevelopment. Riders may choose to use vehicles, walk, or bike to reach their travel destination. To achieve the greatest transportation ef ciency from the Tri-Rail station, all connecting modes should be convenient, time-saving, comfortable, and safe. Because all transit trips begin and end with a pedestrian experience, focusing on pedestrian and bicycle infrastructure was an important component in developing the plan. The following series of diagrams provide an analysis of existing and recommended pedestrian, bicycle, transit, and public space infrastructure. The diagrams illustrate the ½-mile radii as drawn around the recommended station location. The map below illustrates the existing hierarchy of streets.
Hierarchy of Key Streets
SHARED ALLEY
NEIGHBORHOOD RESIDENTIAL
NEIGHBORHOOD COMMERCIAL
THOROUGHFARE ARTERIAL
0 ¼1⁄8 N
WILTON MANORS
N D
IXIE
HW
Y
NE
6TH
A V E N
E 16
TH A
V E
NE
15TH
AVE
NE 26TH ST
NE 24TH ST
WILTON DR
NE 22ND DR
N 20TH ST
NE 7TH AVE
NE 21ST CT
811
1/2 Mile
FE
C R
R
The diagram above is the project study area. The circle which is highlighted is a 1/2 mile radius from the center of the proposed Tri-Rail Coast Link Station.
63

TOUR OF THE PLAN WILTON MANORS TOD MASTER PLAN
Connectivity
As illustrated above, complete streets include more the then vehicular travel.
The Complete Streets improvements currently being constructed on Wilton Drive will strengthens will strengthen the multi-modal connections to a proposed station and nodes of interests in Wilton Manors including the B&B District and the Arts and Entertainment districts. As discussed in this report, completing the streets with facilities to safely and properly accommodate all members of the traveling public regardless of mode is a community-wide bene t and enhancement. Currently, Wilton Drive is undergoing a lane recon guration that will result in a three-lane roadway for vehicular travel with bicycle lanes, sidewalks, on-street parking, lighting, and landscaping with well-de ned crosswalks.
The City has also recognized the importance of improvements at NE 26th Street. Concepts being evaluated for NE 26th Street include lane recon guration; the addition of enhanced bicycle lanes (either protected or buffered); improved sidewalks, lighting, and landscaping; and better de ned crosswalks.
The roadway network and grid to the south of 26th Street is much more extensive and interconnected than to the north. In the proposed redevelopment concepts, design solutions were evaluated to provide safer and more desirable passage across NE 26th Street for pedestrians and cyclists. Enhancement of the Five Points intersection and redevelopment of the Old Florida Seafood Center property are important opportunities to strengthen the network and expand the potential for multi-modal paths.
64

WILTON MANORS TOD MASTER PLAN TOUR OF THE PLAN
Improving Mobility
The diagram above depicts the existing and programmed bike network within the study area. There are no dedicated bike routes along the areas marked in the dashed lines.
The City’s planned and completed bicycle facilities along NE 26th Street, NE 16th Avenue and Wilton Drive provide a strong North-South and East-West Network. In the diagram above, the dashed lines indicate opportunities to expand the bicycle network. Neighborhood paths are important for connecting the neighborhoods to the proposed station, City Hall/Municipal Campus, Wilton Drive, and other nodes of interest.
0 ¼1⁄8 N
WILTON MANORS
Bikeways on Key Streets
NO DEDICATED BIKEWAY
BIKE LANES (EXISTING OR PROGRAMMED)
N D
IXIE
HW
Y
NE
6TH
A V E N
E 16
TH A
V E
NE
15TH
AVE
NE 26TH ST
NE 24TH ST
WILTON DR
NE 22ND DR
N 20TH ST
NE 7TH AVE
NE 21ST CT
811
1/2 Mile
FE
C R
R
65

TOUR OF THE PLAN WILTON MANORS TOD MASTER PLAN
Improving Mobility
The diagram above depicts the sidewalk network and areas needing improvement within the study area.
A robust sidewalk network is critical to the success of TOD and any mobility system. Critical sidewalk connections are missing, or are under served in the existing network along NE 24th Street, portions of N Dixie Highway and NE 9th Avenue.
N D
IXIE HW
Y
WILTON DR
N 20TH ST
NE 7TH AVENE 21ST CT
NE 22ND DR
NE 21ST C T
N D
IXIE
HW
Y
NE
6TH
A V E N
E 16
TH A
V E
NE
15TH
AVE
NE 26TH ST
NE 24TH ST
WILTON DR
NE 22ND DR
N 20TH ST
NE 7TH AVENE 21ST CT
811
0 ¼1⁄8 N
WILTON MANORS
Sidewalks on Key Streets
NO SIDEWALK
SIDEWALK ON ONE SIDE
SIDEWALK ON BOTH SIDES
1/2 Mile
FE
C R
R
66

WILTON MANORS TOD MASTER PLAN TOUR OF THE PLAN
Improving Mobility
The diagram above depicts existing transit network within the study area.
Because every transit trip begins and ends as a pedestrian trip, the interconnection of pedestrian and bicycle facilities to transit are key to ef ciency and safe, convenient access. The diagram above indicates the BCT bus routes and stops in the study area. These routes will be further enhanced with the development of more complete connections into the neighborhoods. Pedestrian and bike paths to the existing bus routes can be improved and allow for greater utilization of multiple modes of transportation.
Future Commuter Rail Station [approximate location]
N D
IXIE
HW
Y
NE
6TH
A V E N
E 16
TH A
V E
NE
15TH
AVE
NE 26TH ST
NE 24TH STWILTON DR
NE 22ND DR
N 20TH ST
NE 7TH AVE
NE 21ST CT
811
Transit Network
WILTON MANORS
COMMUTER RAIL
BCT BUS STOP
COMMUTER RAIL STATION [APPROXIMATE LOCATION]
BCT BUS ROUTE
0 ¼1⁄8 N
1/2 Mile
FE
C R
R
67

TOUR OF THE PLAN WILTON MANORS TOD MASTER PLAN
Improving Mobility
0 ¼1⁄8 N
Streets + Civic Spaces
WILTON MANORS
PUBLIC PARCELS
PUBLIC PARKS
N D
IXIE HW
Y
NE
6TH
AVE
NE
16TH
AVE
NE
15TH
AVE
NE 26TH ST
NE 24TH STWILTON DR
N 20TH ST
NE 7TH AVENE 21ST CT
811
NE 22ND DR
NE 21ST CT
1/2 Mile
FE
C R
R
The diagram above depicts the existing streets and civic spaces within the study area.
Public parks and public spaces, as shown in the diagram above, are located at the periphery of the City. Through in ll development and redevelopment, there are opportunities to add more green space, civic space, and spaces designed for public use. When designed properly public spaces lend identity and sense of ownership for both residents and visitors.
68
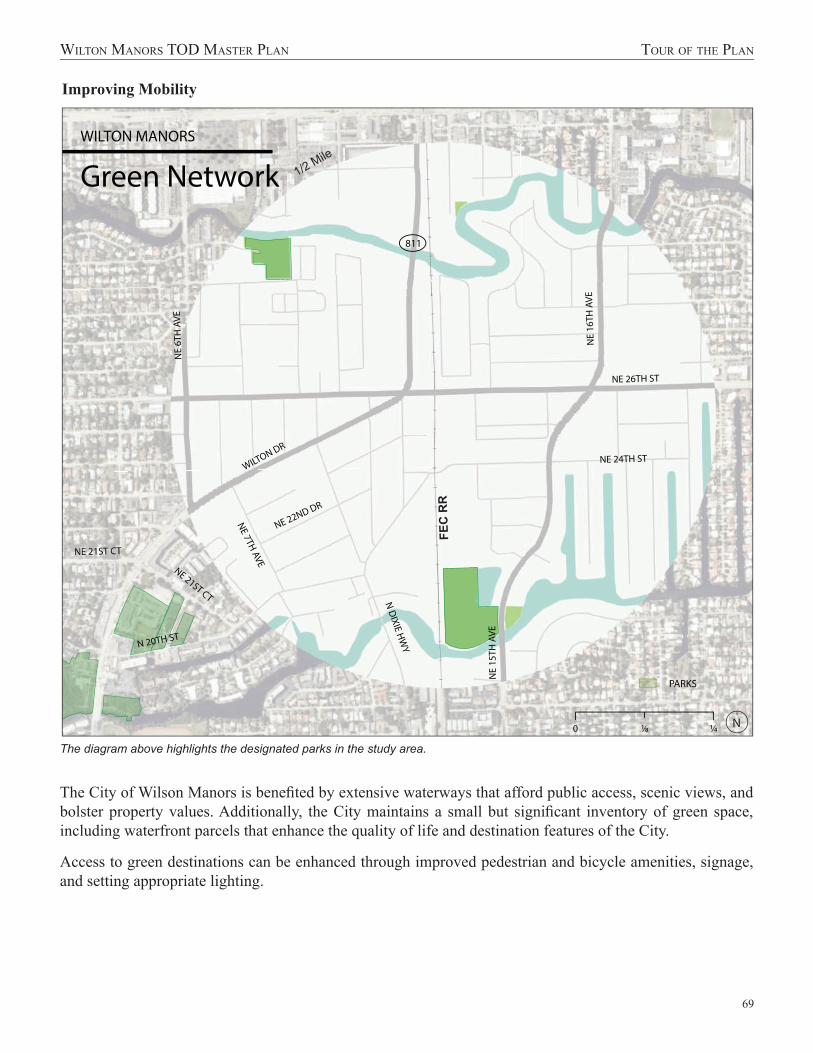
WILTON MANORS TOD MASTER PLAN TOUR OF THE PLAN
Improving Mobility
GGGGGGGreeeeeeennnnnn Netttttttttttwwwwwwwwwwwoooooooooooooooorrrrrrrkkkkkkkkkkkkkk MMMMMMMMMMMMaaaaaaappppppp
0 ¼1⁄8 N
Green Network WILTON MANORS
PARKS
N D
IXIE HW
Y
NE
6TH
AVE
NE
16TH
AVE
NE
15TH
AVE
NE 26TH ST
NE 24TH STWILTON DR
N 20TH ST
NE 7TH AVE
NE 21ST CT
811
NE 22ND DR
NE 21ST CT
1/2 Mile
FE
C R
R
The diagram above highlights the designated parks in the study area.
The City of Wilson Manors is bene ted by extensive waterways that afford public access, scenic views, and bolster property values. Additionally, the City maintains a small but signi cant inventory of green space, including waterfront parcels that enhance the quality of life and destination features of the City.
Access to green destinations can be enhanced through improved pedestrian and bicycle amenities, signage, and setting appropriate lighting.
69

TOUR OF THE PLAN WILTON MANORS TOD MASTER PLAN
Improving Mobility
Improving mobility begins with an assessment of needs and existing conditions, available right-of-way, available transportation modes, and transportation ows to and from primary origins and destinations. The following pages contain illustrations of existing conditions and proposed improvements to better balance the mobility needs of the City.
NE 6th Street is fronted with many single family residential homes, but it also accommodates travel from highway arterials into the entertainment district of the City. Currently, one sidewalk is adjacent to the road with no designed safety protection for the pedestrian. There is a shoulder on both sides, but it is not a marked bike lane. Within the 50’ right-of-way,a complete street is recommended that would include marked bike lanes adjacent to the north and south travel lanes, the addition of curb and landscape buffers, and widened sidewalks on both sides of the roadway. Completing this street will greatly improve the safety and opportunities for greater mobility in this neighborhood.
NE 24th Street is an another neighborhood street that calls for greater connectivity to the surrounding area through means other then vehicular travel. Unlike 6th Street which has a 50’ right-of-way, NE 24th has a signi cantly smaller right-of-way which varies from 28’-30’ In the long term, there may be opportunities to expand the right-of-way or create a private-public partnership that will accommodate curbed sidewalks, bike lanes, and street parking as illustrated below.
Proposed wider sidewalks and bike lanes along 6th Ave.
Progression of improvements along 24th St.
70

WILTON MANORS TOD MASTER PLAN TOUR OF THE PLAN
Improving Mobility
For typical residential streets, there is a fairly standard 50’ right-of-way. In Wilton Manors, especially considering the high volumes of pedestrian traf c, it is recommended that sidewalks be included consistently. On neighborhood streets marked 35 mph or below, bicycles can be accommodated within the travel lanes, and sharrow markings can be utilized. Marking the travel lanes clearly helps communicate to drivers that slower bicycle traf c should be expected, which improves safety for these exposed users.
Improvements to neighborhood streets shown above.
At NE 26th Street, east of the FEC railroad crossing, a lane elimination is suggested that could re-establish the roadway in a three-lane format (with a center turning lane). This redesign could enable the inclusion of separated bicycle lanes and sidewalks, to maximize the safety and comfort of non motorized users.
Improvements to NE 26th Street east of the FEC Railway.
71
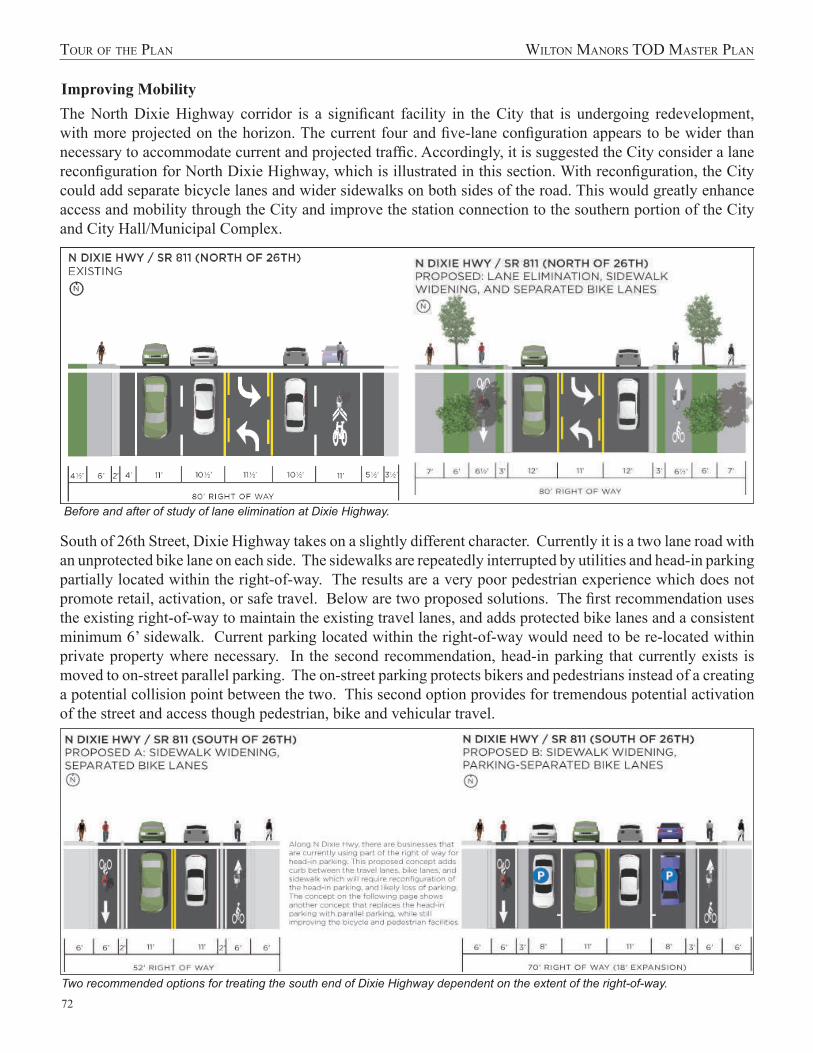
TOUR OF THE PLAN WILTON MANORS TOD MASTER PLAN
Improving Mobility
The North Dixie Highway corridor is a signi cant facility in the City that is undergoing redevelopment, with more projected on the horizon. The current four and ve-lane con guration appears to be wider than necessary to accommodate current and projected traf c. Accordingly, it is suggested the City consider a lane recon guration for North Dixie Highway, which is illustrated in this section. With recon guration, the City could add separate bicycle lanes and wider sidewalks on both sides of the road. This would greatly enhance access and mobility through the City and improve the station connection to the southern portion of the City and City Hall/Municipal Complex.
Before and after of study of lane elimination at Dixie Highway.
South of 26th Street, Dixie Highway takes on a slightly different character. Currently it is a two lane road with an unprotected bike lane on each side. The sidewalks are repeatedly interrupted by utilities and head-in parking partially located within the right-of-way. The results are a very poor pedestrian experience which does not promote retail, activation, or safe travel. Below are two proposed solutions. The rst recommendation uses the existing right-of-way to maintain the existing travel lanes, and adds protected bike lanes and a consistent minimum 6’ sidewalk. Current parking located within the right-of-way would need to be re-located within private property where necessary. In the second recommendation, head-in parking that currently exists is moved to on-street parallel parking. The on-street parking protects bikers and pedestrians instead of a creating a potential collision point between the two. This second option provides for tremendous potential activation of the street and access though pedestrian, bike and vehicular travel.
Two recommended options for treating the south end of Dixie Highway dependent on the extent of the right-of-way.
72

WILTON MANORS TOD MASTER PLAN KEY RECOMMENDATIONS & IMPLEMENTATION
KEY RECOMMENDATIONS & IMPLEMENTATION
The success of any master plan depends upon its ability to be implemented economically and consistently within a given timeframe. To that end, the recommended projects and actions contained in this report have been developed as independent but interrelated projects. Some projects, such as regulatory revisions, Wilton Drive merchant and programming assistance, and mobility planning are within the City’s control to pursue implementation, with funding and policy prioritization as the primary challenges. Other policy initiatives, such as those related to improving City-speci c tourism data, will bene t from coordination with other agencies, such as the Broward Tourist Development Council. Transportation projects will also require coordination with other parties, including the FDOT, SFRTA, BCT, and Broward County along with the FEC Railway and Brightline. The most extensive changes to the TOD environment will result from private investment, with in ll redevelopment and new development on private properties that will shape the walkable, livable, economically vibrant conditions leading to a successful station for the City of Wilton Manors.
Overview of Key Policy Recommendations
Entrepreneurial Policy Leadership
The Wilton Manors TOD Master Plan includes a series of different TOD development scenarios on strategic parcels in the heart of the City. One of the most valuable incentives the City can provide is through its regulatory documents to provide incentives and streamlined development approvals, predictability for investors, and protections for residents. In addition, the City can forge partnerships with investors through strategic
capital infrastructure improvements and enhanced economic use of City assets and resources. Within the Master Plan, there is a strong emphasis on encouaging mixed-use and higher-density, multi-family residential development as a strategy, both to expand the residential inventory to make the City more competitive as well as grow the number of rooftops to support the City’s substantial retail inventory. The City can lead in an entrepreneurial mode to assist the market’s delivery of higher density development that will make the station area its most successful, both for ridership as well as economic development. A more extensive mix of uses, especially with expanded options for housing, of ce, and hospitality will produce more balanced use of the transportation network and greater ef ciency in utilization of the City’s infrastructure. Further, it will produce an activated and vibrant district, with extended hours of daily activity, provide a “natural surveillance” that creates more “eyes on the street,” and a more robust and naturally safe environment.
The City’s mixed-use land use and zoning regulations already incorporate aspects of TOD principles. However, to maximize the station area’s competitiveness and help bolster the City’s economic sustainability, the City should consider: increasing densities and intensities; carefully addressing appropriate transitions between uses; protections for single-family residential neighborhoods; incentives to encourage a land use mix
73
KEY RECOMMENDATIONS & IMPLEMENTATION WILTON MANORS TOD MASTER PLAN
that leans heavily towards residential; and improving walkability, connectivity, and access. The increased densities and intensities as well as land development principles should be extended along the City’s major commercial corridors.
The City may also want to establish a thoroughfare plan speci c to the station area in its Comprehensive Plan to secure new roadway alignments and connections for redevelopment as illustrated in the conceptual plans. This plan should include the designation of an “A/B” roadway network that elevates select “A”roadways for enhanced complete streets improvements, while “B” streets can remain with a more simplistic design.
Land Development Regulations (LDR): The City is currently evaluating opportunities to gear its land development regulations to produce a more transit-supportive pattern of land development with increased densities and intensities, increased building heights, expanded mix of uses, appropriate transitions, consolidated parking areas, and good walkability, connectivity, and access. Primary consideration should be given to NE 26th Street, Wilton Drive, and North Dixie Highway to maximize the land development bene ts from these areas.
TOD Economic Development Incentives: The City’s economic development activities should prioritize forms of in ll development and redevelopment that help facilitate desired land development patterns, especially before the arrival of the train station. There are several prime redevelopment parcels and districts identi ed in the Master Plan, including the “Shoppes at Wilton Manors,” “Old Florida Seafood House,” and “North Dixie Highway District” that could be catalytic given their potential impact on adjacent and surrounding parcels. Also, the two City-owned sites discussed in the plan, the City Hall/Municipal Campus on Wilton Drive and the “Pioneer Maintenance Complex” properties, should receive special consideration as they represent City assets that could be utilized as leverage for highly prioritized uses such as a future hotel and additional residential units of varying forms and scale.
Wilton Drive Improvement District/Downtown Revitalization: The Wilton Drive Corridor is perhaps the most visible and popular attraction in the City of Wilton Manors for residents as well as tourists and visitors. It contains a unique array of restaurants, drinking establishments, and entertainment venues that draw from a regional market as well as special events that are nationally known. The City’s continued investment in this important amenity will help protect its economic performance and quality of life contributions to the community. The City’s high concentration of retail/commercial uses well-exceed national averages for a smaller community, with nearly triple the square feet per capita versus what is typical across the U.S. Improved organization and collaboration for marketing, branding, data collection, and nightlife district management will help bolster and improve the economic viability and sustainability of the district. Strategic steps to improve the district’s safety is to implement improved lighting along the corridor to eliminate dark areas. Also, additional residential and hotel uses will increase “eyes on the street” that will help contribute to a safer condition and potentially reduce municipal policing needs as the district continues to evolve.
Real Property Information Network: As a small community, the business inventory in Wilton Manors is challenging to maintain and expand, and a potential City partnership with its investors and business operators is an opportunity to leverage the City’s organizational skills and abilities in its economic development activities. To help facilitate the City’s continued economic success, the City can provide assistance and leadership through the formation of a Real Property Information Network. This effort could include a business network among local commercial property owners and brokers to collect and maintain data regarding commercial vacancies, rents, status of renovations, interested retail tenants, and potential tenant relocations and/or closings. The City should stress that a successful district in bene cial for all property owners.
74

WILTON MANORS TOD MASTER PLAN KEY RECOMMENDATIONS & IMPLEMENTATION
Intensi ed Station Area
To be successful as a TOD district, the City’s station area will need to be intensi ed with additional residential and non-residential uses at higher densities and intensities than the existing pattern. The station area master plan concepts illustrate ways in which new uses can be added to existing sites in various redevelopment approaches. Residential use has already been noted as a critical component of successful TOD and will create much-needed rooftops to help support existing retail. The City’s zoning code promotes increased residential and mixed-use development, and strong consideration should be given to utilizing the City’s regulations to incentive higher density and intensity development in select locations.
The introduction of a more formal block structure, with building footprints lining drive aisles and new roadway connections, will help urbanize the station area, improve walkability, add vibrancy, and add energy to areas that are otherwise devoid of activity after-hours. To help promote walkability and improved urbanism, the City should consider minimum building heights (not fewer than two stories), build-to lines versus setbacks (to bring building fronts closer to roadways), and maximum parking requirements to prevent an oversupply of parking.
To accelerate development in the station area, the City should consider allocating a xed amount of development intensity (square footage of non-residential and units of residential) to the TOD district that can become available on a rst-come, rst-serve basis through a streamlined development approval process. This can provide a regulatory incentive for TOD. To discourage speculation, the City should consider time limitations for submittal of site plans, securing site plan approval, initiating construction activity, and completion of phases.
Expanded Housing Opportunities
Mixing residential and nonresidential uses that correspond to one another is a foundational element of sustainability. The integration of housing to produce a truly mixed-use environment can also help promote trip-capture, whereby multi-purpose trips can be accomplished with either shorter trip lengths, a single journey into a park-once environment, or via non-auto modes such as walking, biking, or transit. Trip-capture is another positive outcome from the introduction of more housing, as the mix of workplace and residences in the same district can reduce the number of auto trips generated on the roadway network. This produces infrastructure ef ciencies, reduces driving demands, and allows economic expansion with a greater utilization rate for business activity
75

KEY RECOMMENDATIONS & IMPLEMENTATION WILTON MANORS TOD MASTER PLAN
The market study developed for the station area master plan indicates modest demand for additional residential use in the City over time. An evaluation of the City’s demographics indicates the population is projected to continue to age while other communities have become more attractive to the growing population of Millenials. Recent development activity indicates the market tendency towards multi-family with a mix of workforce and market rate units varying by location. The City’s TOD district offers an opportunity for a vibrant, mixed-use district with retail and entertainment destinations within walking and biking distance of potential new housing. Not only is this vibrancy attractive for Millennials, it is also a housing environment that is increasingly sought by empty nesters. From a policy perspective, this could allow the City to better accommodate aging residents who desire the ability to “age in place” and downsize to a smaller unit within the City, while freeing up larger units to accommodate new and expanding households. Actions for the City to consider include increasing densities within the TOD district (either on a site-by-site basis or allocating a total number to the district available on a rst-come, rst-serve basis), reducing parking requirements, streamlining permitting, and establishing incentives for the development of housing within the TOD district to accelerate this investment.
Improved Mobility, Connectivity & Access
Mobility to and through the City of Wilton Manors, with multiple modes of access and safe, strong connections, will improve the City’s competitiveness and reinforce its high quality of life. The City’s multi-layered transportation network includes transit service via BCT and opportunity for a well-connected bicycle/pedestrian network. With the pending arrival of a Tri-Rail station, the City will need to expand its transit access and
circulation and improve facilities for non-motorized users to maximize the effectiveness and bene ts of its station. The master plan identi es corridors to prioritize bicycle and pedestrian investments and new roadway connections to help improve the City’s network of streets.
A further re ned roadway network will also improve mobility, connectivity, and access. The master plan illustrates station area concepts that suggest alignments for new roadways that can be accomplished through carefully planned redevelopment. The City can facilitate the roadway connections with the adoption of a thoroughfare plan that delineates roadway alignments and speci es building locations through a form-based component of the Land Development Regulations. The City should provide policy guidance through its Comprehensive Plan for the development of the expanded thoroughfare network and require the introduction and maintenance of blocks, an improved network of streets, and appropriate traf c calming as redevelopment occurs. The network can also delineate a hierarchy of streets, with focal roadway corridors identi ed for enhanced Complete Streets improvements and superior bicycle and pedestrian facilities as part of a non-motorized network plan to improve the City’s mobility and help prioritize investment.
The Five Points intersection, at the interface of NE 26th Street, North Dixie Highway, and Wilton Drive, is a particularly notable component of the City’s transportation network due to its visibility, prominence, and renown. This intersection represents an opportunity for a mobility improvement with the addition of protected bicycle lanes, perhaps as a “Dutch intersection,” to improve safety and navigation through this busy location. A Dutch intersection allows the cyclists to be protected at the intersections as an extra curb is applied to the outside of the bike lane with the same radius as the existing curb, creating a protective traf c island at each of the four corners of the intersection. The intersection could be further enhanced with the addition of a public park and landmark at the small vacant triangular parcel abutting the intersection on Wilton Drive.
76

WILTON MANORS TOD MASTER PLAN KEY RECOMMENDATIONS & IMPLEMENTATION
The City can identify nancial commitments for improved mobility, connectivity, and access through its Comprehensive Plan (Capital Improvements Element) to secure development revenue and become more competitive for grant funding. In addition, the City may wish to consider the establishment of a mobility plan as contemplated in Section 339.175 of the Florida Statutes,with an appropriate revenue collection mechanism to offset both capital and operations/maintenance costs for transportation improvements. With an expanded and more complete transportation network in place, the City’s planned Tri-Rail station will be more accessible through multiple modes, enabling it to operate more ef ciently and more effectively for the City’s residents, employees, and patrons.
Lodging, Hospitality & Tourism in Wilton Manors
Hospitality is a critical component of the City’s economic sustainability that can help support the City’s core retail district along Wilton Drive and enhance the City’s attractiveness for longer-term visitation. Market data assembled for the TOD plan indicates a fairly strong market for a new 80 to 100-room hotel, which could capitalize on the energy of Wilton Drive and help improve the corridor’s performance. The City’s
ownership of the City Hall/Municipal Campus presents a unique, valuable public asset to help attract a hotel and ancillary development to a location that otherwise lacks activity after-hours. Further, by leveraging the City’s land ownership in a public/private venture, a hotel development could include public amenities, such as an amphitheatre, improved lighting and landscaping, parking, and public art to celebrate the signi cance of the location and provide a broader contribution to the community.
Additionally, the City could play a leadership role for an annual lodging survey. Tasks for the City would include helping assemble and document the performance and availability of the existing inventory of small boutique hotels, bed and breakfast inns, and vacation rentals as well as providing assistance for improved marketing and economic data to further bolster new hotel development.
As a component of the City’s economic sustainability, tourism is a critical contributor for the retention and successful operation of the City’s extensive retail inventory. As discussed in the market ndings and recommendations, the City is especially known within the LGBTQ community a gay-friendly and tolerant destination, with many of the City’s retail/commercial establishments catering to this niche market. Although the City’s role as a destination for LGBTQ visitors is well-known and long-standing, there is surprisingly little data to document the correlated economic impact for special events and year-round travel activity. A leadership role exists for the City to formalize a partnership with the Convention and Visitors Bureau for the collection and evaluation of LGBTQ-speci c visitor data, including consumer surveys, special event impacts, and the frequency and length of stay for out of town visitors. This effort should include documentation of attendance at local charity and special events, performances, weddings and receptions, and other event categories.
Moving Forward
The City is well positioned to secure a Tri-Rail station as part of a future Coastal Link extension of service. Although any of the three potential station areas could accommodate a station, the central location (immediately abutting NE 26th Street to the south) is the recommended location as discussed in the master plan report. The land use and transportation pattern surrounding the future station, both existing and anticipated through planning and market trends, will be a key determinant in setting the stage for TOD and securing amenity value and municipal revenue.
The City has already begun to establish TOD-supportive policy leadership through its comprehensive plan and land development regulations. These efforts should be advanced as discussed in this section and throughout the master plan report. An expanded and more diverse inventory of residential units, especially in a multi-story
77

KEY RECOMMENDATIONS & IMPLEMENTATION WILTON MANORS TOD MASTER PLAN
and mixed-use format along the City’s key commercial corridors, will provide catalytic energy for the City’s retail performance, eyes on the street, and improved destination quality. The City should consider advancing implementation of the policy recommendations to accelerate investment in a manner that accomplishes the City’s goals and objectives. These measures will help enhance the City’s economic competitiveness, reduce commuter demands through strategically located housing, and add quality of life enhancements for its residents, businesses, and visitors.
Recommended Implementation Time-frame
SHORT-TERM IMPROVEMENTS (6 MONTHS - 12 MONTHS)
1. Adopt TOD Station Area Master Plan a. Facilitate Visioning Discussion with City Council to Prioritize Policy Objectives and Actions b. Develop a Five-Year City TOD Work Program as a Component of Annual Budgeting
2. Initiate Amendments to Land Development Regulations a. Determine Desired Density and Height Increases for TOD District b. Consider Bonus Density to be Assigned to TOD District c. Consider Increased Density and Height within TOD Core d. Consider Parking Modi cations (Maximum Quantity versus Minimum Quantity) e. Consider Build-to Lines versus Setbacks f. Identify Desired Public Realm Improvements (e.g., civic open space, wider sidewalks,
mobility fund contributions) g. Consider Time-Limited Density or Intensity Bonuses h. Incorporate complete streets concepts into engineering standards
3. Initiate Comprehensive Plan Amendment Process a. Add Density and Intensity Increases b. Add Thoroughfare Plan to Secure Roadway Alignments Upon Redevelopment
4. Initiate Tourism Data Collection a. Engage Convention and Visitors Bureau b. Initiate Annual Lodging Survey
c. Formalize Event Tracking d. Initiate Development of Visitor Survey for Special Events
5. Develop concepts for the City Hall/ municioke campus and initiate Selection Process for Redevelopment including Hotel Development
images: Government Building: https://www.onlinewebfonts.com/icon/425801 Skyline – buildings and trees: https://www.onlinewebfonts.com/icon/473645 Housing: https://www.onlinewebfonts.com/icon/449312 Car icon: https://www.onlinewebfonts.com/icon/538230 Bike icon: https://www.onlinewebfonts.com/icon/538221 Train icon: https://www.onlinewebfonts.com/icon/538271 Walking icon: https://www.onlinewebfonts.com/icon/432428 Hotel: https://www.onlinewebfonts.com/icon/123231 Dutch Intersection: Bicycle Dutch 78

WILTON MANORS TOD MASTER PLAN KEY RECOMMENDATIONS & IMPLEMENTATION
INTERMEDIATE IMPROVEMENTS (6 MONTHS - 24 MONTHS)
1. Adopt Amendments to Comprehensive Plan (includes Mobility Plan, Thoroughfare Plan, Density/Intensity Increases)
2. Adopt Amendments to Land Development Regulations
3. Initiate Mobility Plan Process a. Convene Kickoff Workshop with TOD District Property Owners to Identify Thoroughfare
Network and Determine Street Hierarchy b. Identify Preferred Bicycle and Pedestrian Access Routes c. Identify Missing Roadway Network Connections d. Determine Project Prioritization for Broward MPO, FDOT and Other Matching Grants e. Develop 10-Year Grant Application Forecast for Project Implementation
4. Advance Mobility Plan Improvements in TOD Core Area for Connectivity a. Prioritize Bicycle/Pedestrian Network Improvements
b. Prioritize Neighborhood Traf c Calming Improvements c. Initiate Design Discussions with FDOT, Broward County, and Broward MPO for Five Points
Intersection Improvement
5. Evaluate Redevelopment Options for “Pioneer Maintenance Complex” Site
6. Initiate Real Property Network Program a. Formalize Steering Committee with Commercial Real Estate Brokers and Property Owners b. Initiate Data Collection
LONGER-TERM IMPROVEMENTS (2 YEARS - 5 YEARS)
1. Implement Station Design & Funding
2. Implement Phased Improvements from Mobility Plan
3. Continue Implementation of TOD Master Plan through Development and Redevelopment
4. Initiate RFQ/P Selection Process for Development of “Pioneer Maintenance Complex” Site
5. Continue Implementation of Wilton Drive Improvement District
6. Continue Implementation of Annual Lodging Survey & Visitor Data Collection
7. Continue Implementation of Real Property Network 79

This page intentionally left blank.

WILTON MANORS TOD MASTER PLAN
APPENDIX A
CREATION OF THE MASTER PLAN

This page intentionally left blank.

WILTON MANORS TOD MASTER PLAN Appendix A: Creation of the Master Plan
Creation of the Master Plan
The Wilton Manors TOD Master Plan was created during a public planning process designed to ensure broad community participation to determine how to best resolve potential impacts, maximize opportunities, and establish a vision for the future. A multidisciplinary team of professionals - “the charrette team” - helped record the citizens’ ideas, test the feasibility of the various proposals, and create a document to record and guide the citizens’ vision.
Charrette
Charrette means “cart” in French. An architectural school legend holds that at the Ecole des Beaux Arts, in 19th Century Paris, work was so intense that students continued to draw after climbing onto the carts that carried their boards away to be juried.
Today charrette refers to a high speed, intense, and focused creative session in which a team works with citizens on design problems and presents solutions.
Due Diligence and Background Research
Research was conducted with City staff to understand the City’s regulatory framework, development approvals, and concepts for properties within and near the station area.
Pre-Charrette Interviews
The purpose of the pre-charrette interviews is to enable the charrette team to gain a better understanding of the area’s local issues, challenges, and strengths. A series of interviews were conducted with elected of cials, City staff, members of City advisory boards, local business owners, residents, and other community representatives to gain input on project issues and background details.
Public Workshop
A public workshop was held on October 11th, 2018 at the Hagen Park Community Center, with an opening presentation that outlined the intent of the project and issues in the area. Citizens were asked to shape a vision for the Tri-Rail Coastal Link station location and surrounding area, including land use, access, complementary uses, design, and community continuity. After the presentation, participants gathered around tables with an aerial photo of the study area. Each table group debated issues and drew their ideas on the aerial. At the end of the workshop, a representative from each table presented the group’s ideas to the rest of the charrette participants. A summary of the suggestions and concerns is contained on the following pages.
W I L T O N M A N O R S S T AT I O N A R E A P L A N W O R K S H O P
PLEASE JOIN US FOR A PLANNING WORKSHOP TO DEVELOP A TRANSIT
ORIENTED DEVELOPMENT (TOD) PLAN FOR A FUTURE TRI-RAIL STATION
An opening presentation will provide an overview of opportunities and concerns.
Participants will gather in groups around tables to record their ideas and priorities.
Kids view the community from a unique perspective and are welcomed participants.
Members from the community will present their tables’ plans to workshop participants, providing key direction for the plan.
Wilton Manors Station Area Plan Workshop Thursday, October 11, 2018 from 6:00 – 9:00 PM
Hagen Park Community Center 2020 Wilton Drive, Wilton Manors, FL
Refreshments will be provided.
For more information, please contact: Kim DeLaney, Ph.D., Director of Strategic Development & Policy, TCRPC
(772) 221-4060 or [email protected]
This important planning effort is made possible through funding from the City of Wilton Manors and the Federal Transit Administration, in coordination with the South Florida Regional Transportation Authority and the South Florida and Treasure Coast Regional Planning Councils.
Flyer used to promote the charrette.
1

Appendix A: Creation of the Master Plan WILTON MANORS TOD MASTER PLAN
Table 1 Main Ideas
• Locate station between NE 24th Street and NE 26th Street.
• Need direct pedestrian access to station.
• Provide 50 parking spots at station and busconnections to/from station.
• Incorporate bike racks.
• Implement way- nding solutions in the City.
• Provide shuttle service through Wilton Manors.
• Program Uber / Lyft lounge or waiting areas at the future station.
• Encourage redevelopment of the City Hallproperty with hotel, mixed-use, retail, andcultural center.
• Develop mixed-use units at “Old FloridaSeafood” property.
• Desire for lofts and co-working space alongFEC Railway.
• Eucalyptus Garden (home to “Alchemist”)identi ed as local landmark / focal point of City.
Table 1 citizens’ drawing and photos from the public workshop.
2

WILTON MANORS TOD MASTER PLAN Appendix A: Creation of the Master Plan
Table 2
Main Ideas
• Locate station to the south along PioneerMaintenance Complex Property.
• Develop an “Old Main Street” at NE 24th Streetleading to North Dixie Highway.
• Increase density along NE 26th Street with morehousing units.
• Develop more direct pedestrian path from station to Wilton Drive and the Shoppes at Wilton property.
• Provide a roundabout at the Five Points intersection.
• Improve walkablity along Wilton Drive.
• Make the City more attractive to Millenials.
Table 2 citizens’ drawing and photos from the public workshop.
3

Appendix A: Creation of the Master Plan WILTON MANORS TOD MASTER PLAN
Table 3
Main Ideas
• Locate station between NE 24th Street and NE 26th Street.
• Develop City lot with hotel and 100-seat indoorperformance arts center, similar to the Pompano Arts Center.
• Develop senior housing and medial of ce at “Old Florida Seafood” and Church properties(fronting NE 26th Street).
• Desire more housing and density along FECRail Corridor.
• Eucalyptus Garden (Alchemist) seen as locallandmark / focal point of the City.
• Architectural style should be with clean linessimilar to that of Palm Springs (mid-centurymodern).
• Develop arts and warehouse district “Wynwood-esque” along northern portion of FEC RailCorridor and/or NE 26th Street.
• Desire for dog parks in the City.
• Bring back Five Points City marker.
Table 3 citizens’ drawing and photos from the public workshop.
4

WILTON MANORS TOD MASTER PLAN Appendix A: Creation of the Master Plan
Table 4
Main Ideas
• Locate station between NE 24th Street and NE 26th Street.
• Provide more shade trees along roadways andsidewalks.
• More walkable streets including North DixieHighway and NE 26th Street.
• Develop more daytime uses in City.
• More density in target areas.
• Bring a branch of a college or university into theCity.
Table 4 citizens’ drawing and photos from the public workshop.
5

Appendix A: Creation of the Master Plan WILTON MANORS TOD MASTER PLAN
Table 5
Main Ideas
• Locate station between NE 24th Street and NE 26th Street.
• Maintain 4-story limit in most locations.
• Ensure service hours of train later than 10pm fornight-life.
Table 5 citizens’ drawing and photos from the public workshop.
6

WILTON MANORS TOD MASTER PLAN Appendix A: Creation of the Master Plan
Table 6
Main Ideas
• Locate station north of NE 26th Street alongFEC corridor.
• Create open garden/park north of NE 26th Streetalong FEC corridor and proposed station.
• Desire for quite zones on FEC Railway.
• Continue mix of primarily food and beveragewith limited retail at storefronts.
• Need boutique hotel in City.
• Provide affordable housing and parking at Pioneer Maintenance Complex site andredeveloped lots between NE 26th and NE 24thstreets along FEC corridor and North DixieHighway.
• Address Five Points confusion; re-institutelandmark at Five Points where previousmonument stood.
• Maintain 4-story maximum building heights.
• Mid-century modern architectural style isdesired by residents. Create city identity withcolors and rainbow.
• Design and develop a river-walk along waterway which surrounds the City.
Table 6 citizens’ drawing and photos from the public workshop.
7

Appendix A: Creation of the Master Plan WILTON MANORS TOD MASTER PLAN
Studio
The charrette team listened, recorded, and took notes on the citizens’ requests. A design studio was set up at the Treasure Coast Regional Planning Council in Stuart, FL from October 23rd- October 26th, 2018.
8

WILTON MANORS TOD MASTER PLAN
APPENDIX B
BACKGROUND AND EXISTING CONDITIONS

This page intentionally left blank.

WILTON MANORS TOD MASTER PLAN Appendix B: Background & Existing Conditions
History of Wilton Manors
Prior to 1925, Wilton Manors was referred to as Colohatchee. The name Colohatchee is borrowed from the Seminole language. ‘Hatchee’ means river, but there are a few competing theories on the origin of ’Colo’.
Colohatchee was a productive farming and agricultural community. Successful production led to a demand for freight service on the FEC Railway. It is widely held there was a Colohatchee Depot located at the intersection of present day NE 24th Street and North Dixie Highway. An active Women’s Club was also located at the intersection. The Women’s Club at its founding had 19 members.
Producers in the area included the ‘Bee King of Florida’ O.O. Poppleton, meat from the Southeast Packing Company, and fruit from Williams Packing Company and East Coast Grower Association.
The Colohatchee Depot station was freight only, and by 1932, it had been relocated further north to serve a proposed high-end development called Floranada. Floranada was not realized, but passenger rail began serving the area through the Oakland Park Station.
Wilton Manors was named in 1925 by Edward J ‘Ned’ Willingham. Ned proposed a development sporting 15 miles of lighted streets and laid out the streets and plats with a grand entrance at the ve
Photo: Wilton Manors Historical Society
Colohatchee FEC Depot location Plat Photo: Wilton Manors Historical Society
1

Appendix B: Background & Existing Conditions WILTON MANORS TOD MASTER PLAN
pointed intersection of Dixie Highway, Prospect Road, and Wilton Boulevard. Prospective buyers and residents were greeted with four Romanesque towers designed by architect Francis Abreu. Ned was able to lead buyers to the top of the tallest tower and observe the platted city and select a lot for purchase. By 1964, each tower had been removed. Ned’s plans were slowed by the 1926 economic crash. The City was incorporated in 1947 as a Village with 350 residences. The st town meetings were held at Hagen’s Real Estate of ces on Wilton Drive. In 1953 the Village became the eleventh city in Broward County, and nally, Wilton Drive began satisfying the commercial dreams of the city’s founder.
1894 FEC Field survey book Photo: Wilton Manors Historical Society
Artistic rendering based on the FEC standard design represented by the Dania Station of the era.
Photo: Wilton Manors Historical Society
2
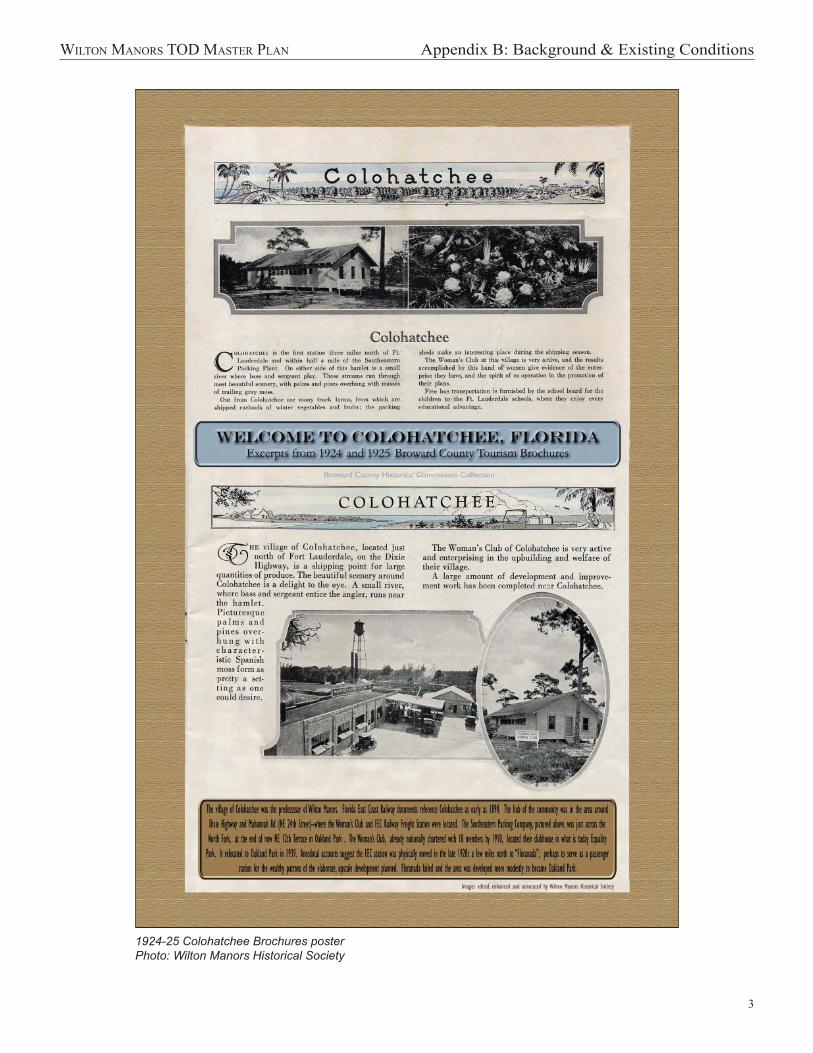
WILTON MANORS TOD MASTER PLAN Appendix B: Background & Existing Conditions
1924-25 Colohatchee Brochures poster Photo: Wilton Manors Historical Society
3

Appendix B: Background & Existing Conditions WILTON MANORS TOD MASTER PLAN
Top image: The Florida East Coast Railway (FEC) connected the early settlements along the coast of Florida, giving way for trade and also passenger services.
Bottom image: Henry Flagler, the “Father” of the Florida East Coast Railway and the development of the East coast of Florida.
Top image: FEC corridor. Middle image: CSX corridor. Bottom image: Combined Routes of FEC and CSX, where Tri-Rail and Amtrak both have service along the CSX track, but there is no passenger service along FEC (1968- 2018). Brightline now operates from Miami to West Palm Beach.
4

WILTON MANORS TOD MASTER PLAN Appendix B: Background & Existing Conditions
Tri Rail Coastal Link For more than a decade, the Treasure Coast Regional Planning Council has been assisting SFRTA, the Florida Department of Transportation, associated agencies, and local governments with planning and technical assistance in support of the expansion of Tri-Rail service onto the Florida East Coast rail corridor. The Tri-Rail Coastal Link project is currently anticipated to include up to twenty- ve stations between Miami and Jupiter. Land use patterns around these stations and along the corridor, particularly transit-oriented development, are critical to the success of passenger rail service. This land use/transit relationship has become increasingly important in the Federal Transit Administration (FTA) funding process. To increase transit-oriented planning along passenger rail corridors, the FTA recently awarded a series of TOD planning grants to several regions. Working in collaboration with TCRPC and the SFRPC, FTA awarded a $1.25 million grant in support of TOD planning and analysis along the planned Tri-Rail Coastal Link corridor.
Photo: Tri-Rail in Mangonia Park, 2016.
5

Appendix B: Background & Existing Conditions WILTON MANORS TOD MASTER PLAN
The Tri-Rail Coastal Link service is intended to provide a Tri-Rail-like commuter service on the FEC corridor. The FEC corridor has been improved and double-tracked to accommodate the Brightline private rail service, which will potentially enable the more local Tri-Rail Coastal Link. The map above illustrates how the two primary rail corridors in southeast Florida, the CSX (aka SFRC) and FEC will be interconnected at different locations. The map also illustrates the potential phasing of physical improvements and transit service.
6

WILTON MANORS TOD MASTER PLAN Appendix B: Background & Existing Conditions
TOD Policy and Local Government Outreach prepared by: South Florida Regional Transportation Authority
While public transit, and by extension TODs, require regional coordination and participation, the local land uses and zoning allowances remain in the authority of local governments. Clearly there are land use policies and minimum densities that are encouraged to be more transit-supportive, but there is not a “one size ts all” rule for TOD. The corridor has a typology of communities that range from highly urban (downtown Miami) to moderately urban (Delray Beach) to neighborhood scale (Jupiter). Accordingly, local governments address TOD densities, intensities, building heights, and other characteristics in a manner appropriate to their context.
7

Appendix B: Background & Existing Conditions WILTON MANORS TOD MASTER PLAN
The creation of successful TODs is clearly in the best interests of the transportation authority as ridership is shown to increase when these districts are properly implemented.
The creation of successful TODs is also a regional bene t by removing vehicles from the roadway network, providing mobility options, attracting outside investment, and improving the overall quality of life for residents, workers, and visitors.
8

WILTON MANORS TOD MASTER PLAN Appendix B: Background & Existing Conditions
Transit Oriented Development PolicyAdvancing Vibrant Communities and a more Prosperous Region
SFTRA is a transit agency that provides a critical service for Southeast Florida’s economy, mobility, and quality of life. To ful ll our role as a partner with local governments, SFTRA needs funding to survive and grow, and one of our primary revenue sources is ticket sales. Without Transit Oriented Development (TOD) we cannot operate and make sound investments in passenger rail.
TOD is the most important factor in ridership. TOD is a mixed-use pattern of pedestrian-friendly, higher density development with reduced parking around transit stations - all factors that help generate revenues for local governments and Tri-Rail.
Local governments are leader to advance TOD in the region through zoning and development regulations. Although it can be challenging to balance engineering, design, and political considerations, successful TOD must embrace higher density, reduce parking, and a broad mix of uses surrounding the station at it’s core. Without these characteristics, TOD cannot be supported along the Tri-Rail service corridors.
TOD has many bene ts to residents, businesses and local governments, but the SFRTA needs it for one reason: ridership. As a partner with local governments and the development community, SFTRA advocates zoning and land development regulations that maximize these principles.
TOD Policy and Local Government Outreach Prepared by: South Florida Regional Transportation Authority
9

Appendix B: Background & Existing Conditions WILTON MANORS TOD MASTER PLAN
Existing TOD
Established in 2006, Wilton Station is a luxury condominium association adjacent to the FEC Railway and NE 26th Street. The plan consists of 272 residential units (apartments and town homes) and retail spaces on 10 acres. The primary structures are ve stories in height.
Wilton Station provides amenities similar to other resort-style and luxury housing developments. Walkability and location are included as another prime aspect of the development. On its web page, the projects indicates “Wilton Station is a serene enclave, steps away from the most popular destinations on Wilton Drive and minutes away from the spectacular beaches Fort Lauderdale is famous for!”
Along the FEC, the development site is long and narrow. The arrangement of the buildings allowed the development to create a roadway around the apartments and townhomes with porch entries, sidewalks, and on-street parking. Below is an image of the inner street scale and treatment. Unfortunately, the roads are limited to the development site and do not become a part of the city fabric. As a result, the pedestrian path to walking destinations is limited and in some cases made longer. - courtesy of Wilton Station LLC; http://www. wiltonstation.net.
Wilton Station is located at the intersection of the FEC Railway and NE 26th St. Photo : Wilton Station, LLC
View along a pedestrian friendly street within the Wilton Station development.
Photo : Wilton Station, LLC
10

WILTON MANORS TOD MASTER PLAN Appendix B: Background & Existing Conditions
Brown elds
Existing Brown elds sites and areas could be considered as part of TOD planning for Wilton Manors. A Brown elds site is a parcel of land that has real or perceived contamination that could hinder or complicate redevelopment. A Brown elds area is a contiguous area of one or more brown eld sites, some of which may not be contaminated, that has been designated by a local government by resolution. Such properties are often located in high-traf c commercial corridors that allow for the use of existing infrastructure and can be prime locations for future commercial businesses.
Designation as a Brown elds site or area is a very useful redevelopment tool that supports economic activity and new and sustained employment opportunities. In the State of Florida, the Department of Environmental Protection (FDEP) has a Targeted Brown elds Assessment Program. This program offers Voluntary Cleanup Tax Credits; sales tax exemptions on building materials for affordable housing or mixed use projects; job bonus refunds; a loan guarantee program; and liability protections. This program is designed to provide assistance with some of the costs of redevelopment and minimize risk, which adds to the value of the project and makes it more feasible for the private sector to become involved.
As would be expected, there are challenges with redevelopment on such sites. These challenges include the assessment and remediation of any identi ed contaminants; liability issues (both legal and nancial); and the stigma of what the effects of such a property has on the health of the general public. However, there are many resources to help mitigate these obstacles. The U.S. Environmental Protection Agency (EPA) has funding through both grants and revolving loan fund programs to inventory, assess, and remediate properties, as well as conduct preliminary redevelopment planning. Both of these programs can be obtained through the Treasure Coast Regional Planning Council in cooperation with the South Florida Regional Planning Council. Additionally, EPA offers workforce development and job training grants that provide environmental training to the residents of Brown elds communities.
11

This page intentionally left blank.

WILTON MANORS TOD MASTER PLAN
APPENDIX C
MARKET AND ECONOMIC ANALYSIS

WTL+a
Market Analysis City of Wilton Manors & TOD Station Area
Wilton Manors, FL
Prepared for: Treasure Coast Regional Planning Council Stuart, FL
On behalf of: City of Wilton ManorsWilton Manors, FL
September 2019—FINAL
WTL +a
R e a l E s t a t e & E c o n o m i c A d v i s o r s W a s h i n g t o n , D C — P r o v i n c e t o w n , M A 2 0 2 . 8 8 5 . 9 1 2 1 3 0 1 . 5 0 2 . 4 1 7 1 7 7 4 . 5 3 8 . 6 0 7 0 1

WTL+a
General & Limiting Conditions Every reasonable effort has been made to ensure that the data contained in this study reflect
the most accurate and timely information possible. These data are believed to be reliable at the
time the study was conducted. This study is based on estimates, assumptions, and other
information developed by WTL +Associates (referred hereinafter as “WTL+a”) from its
independent research effort, general knowledge of the market and the industry, and
consultations with the client and its representatives. No responsibility is assumed for
inaccuracies in reporting by the client, its agent and/or representatives, or any other data source
used in preparing or presenting this study.
No warranty or representation is made by WTL+a that any of the projected values or results
contained in this study will be achieved. Possession of this study does not carry with it the right
of publication thereof or to use the name of "WTL+a" in any manner without first obtaining the
prior written consent of WTL+a. No abstracting, excerpting or summarizing of this study may be
made without first obtaining the prior written consent of WTL+a. This report is not to be used in
conjunction with any public or private offering of securities or other similar purpose where it may
be relied upon to any degree by any person, other than the client, without first obtaining the prior
written consent of WTL+a. This study may not be used for purposes other than that for which it
is prepared or for which prior written consent has first been obtained from WTL+a.
This study is qualified in its entirety by, and should be considered in light of, these limitations,
conditions and considerations.
WTL +a
R e a l E s t a t e & E c o n o m i c A d v i s o r s W a s h i n g t o n , D C — P r o v i n c e t o w n , M A 2 0 2 . 8 8 5 . 9 1 2 1 3 0 1 . 5 0 2 . 4 1 7 1 7 7 4 . 5 3 8 . 6 0 7 0 2

WTL+a
Table of Contents
General & Limiting Conditions ........................................................................................ 2
Table of Contents ................................................................................................................ 3
Tables & Figures.................................................................................................................. 4
1 Executive Summary ..................................................................................................... 6
Introduction ................................................................................................................................ 6
Key Findings: Demographics ....................................................................................................10
Key Findings: Real Estate Market Conditions ...........................................................................11
Key Findings: Market Potentials................................................................................................14
Preliminary Implementation Strategies......................................................................................19
2 Demographic & Economic Profile...........................................................................20
Demographic Trends & Forecasts.............................................................................................20
Household Incomes & Retail Spending .....................................................................................27
Retail “Recapture” Opportunities...............................................................................................30
Economic Characteristics..........................................................................................................34
3 Real Estate Market Conditions................................................................................44
Housing.....................................................................................................................................44
Hotel/Lodging............................................................................................................................58
Workplace: Office......................................................................................................................64
General Retail ...........................................................................................................................76
4 Market Potentials ........................................................................................................81
Potential TOD Station Area Concepts .......................................................................................81
Market-rate Housing..................................................................................................................83
Workplace/Office.......................................................................................................................86
Hotel/Lodging............................................................................................................................92
General Retail ...........................................................................................................................96
5 Preliminary Implementation Strategies..............................................................115
Commercial District Management ...........................................................................................116
WTL +a
R e a l E s t a t e & E c o n o m i c A d v i s o r s W a s h i n g t o n , D C — P r o v i n c e t o w n , M A 2 0 2 . 8 8 5 . 9 1 2 1 3 0 1 . 5 0 2 . 4 1 7 1 7 7 4 . 5 3 8 . 6 0 7 0 3
WTL+a
Data Collection/Documentation...............................................................................................119
Public Policies & Planning.......................................................................................................122
Tables & Figures Table 1: Regional Population Trends & Forecasts, 2000—2040 ...............................................21 Table 2: Demographic Trends & Forecasts—City of Wilton Manors, 2000—2023.....................23 Table 3: Demographic Trends & Forecasts—1/2-Mile Trade Area, 2010—2023 .......................26 Table 4: Annual Household Consumer Spending, 2018 ............................................................28 Table 5: Retail “Recapture” Opportunities—City of Wilton Manors, 2018 ..................................31 Table 6: Broward County Employment Trends, 1995—2017.....................................................35 Table 7: Business Mix—Broward County, 2018 ........................................................................36 Table 8: State Employment Forecasts—Broward County, 2017—2025 ....................................38 Table 9: Business Mix—City of Wilton Manors, 2018 ................................................................39 Table 10: 10-Year Employment Trends—City of Wilton Manors, 2006—2015...........................41 Table 11: Housing Profile—City of Wilton Manors, 2010—2023................................................45 Table 12: 12-Year Housing Starts—Broward County & Selected Municipalities, 2006—2017...48 Table 13: Apartment Market Profile—Broward County, 2018 ....................................................51 Table 14: Apartment Market Profile—Wilton Manors Area ........................................................53 Table 15: Proposed Rental & For-Sale Multi-family Projects .....................................................56 Table 16: Broward County Hotel Inventory, 2018......................................................................60 Table 17: Market Performance of Selected Competitive Hotel Properties, 2012—2017 ............63 Table 18: Office Market Profile—Broward County, 2016—2018................................................65 Table 19: Office Market Profile—Wilton Manors (Within 1-Mile), 2013—2018...........................69 Table 20: Office Market Characteristics—Wilton Manors (1- to 2-Miles), 2013—2018...............71 Table 21: Wilton Manors Retail Inventory..................................................................................78 Table 22: Housing Potentials—Scenario #1, 2019—2028.........................................................84 Table 23: Housing Potentials—Scenario #2, 2019—2028.........................................................85 Table 24: Workplace/Office Potentials—Broward County, 2017—2025 ....................................88 Table 25: Office Potentials Scenario #1—Wilton Manors, 2017—2025 .....................................90 Table 26: Office Potentials Scenario #2—Wilton Manors, 2017—2025 .....................................91 Table 27: Half-cent Sales Tax & Estimated Retail Sales in Comparable Communities, 2018....99 Table 28: Half-cent & Estimated Retail Sales Attributable to Other Sources, 2018..................100 Table 29: Actual Taxable Retail Sales & Performance Metrics—Wilton Manors, 2018............102 Table 30: LGBTQ Visitation Analysis ......................................................................................110 Table 31: Estimated Annual Spending by LGBTQ Visitors to Wilton Manors...........................112 Table 32: Estimated LGBTQ Visitor-Supported Retail Space..................................................114
WTL +a
R e a l E s t a t e & E c o n o m i c A d v i s o r s W a s h i n g t o n , D C — P r o v i n c e t o w n , M A 2 0 2 . 8 8 5 . 9 1 2 1 3 0 1 . 5 0 2 . 4 1 7 1 7 7 4 . 5 3 8 . 6 0 7 0 4

WTL+a
Figure 1: Wilton Manors & TOD Station Area Map ..................................................................... 7 Figure 2: 0.5-Mile Study Area Surrounding Proposed TRCL Station Location............................ 8 Figure 3: Retail Leakage & Surplus—City of Wilton Manors, 2018............................................30 Figure 4: Employment Densities—City of Wilton Manors, 2015.................................................42 Figure 5: Employment Inflow/Outflow—City of Wilton Manors, 2015 .........................................43 Figure 6: Wilton Manors Area Multi-Family Rental Properties Map............................................52 Figure 7: Potential Catalyst & TOD Site Concepts—Five Points ...............................................81 Figure 8: Potential Catalyst & TOD Site Concepts—Old Florida Seafood House Property ........82 Figure 9: Potential Catalyst & TOD Site Concepts—Shoppes at Wilton Site .............................82
WTL +a
R e a l E s t a t e & E c o n o m i c A d v i s o r s W a s h i n g t o n , D C — P r o v i n c e t o w n , M A 2 0 2 . 8 8 5 . 9 1 2 1 3 0 1 . 5 0 2 . 4 1 7 1 7 7 4 . 5 3 8 . 6 0 7 0 5
WTL+a
1Executive Summary
Introduction
WTL+a, a national real estate and economic development consulting firm based in Washington,
DC, with significant project experience throughout Florida, was retained by the Treasure Coast
Regional Planning Council (TCRPC) to prepare a real estate market analysis of the City of
Wilton Manors and the transit-oriented development (TOD) potentials for the area surrounding a
proposed rail station in Wilton Manors in Broward County.
In 2016, the Federal Transit Administration (FTA) awarded a $1.2 million planning grant to the
South Florida Regional Transportation Authority (SFRTA) to conduct comprehensive transit-
oriented development (TOD) planning associated with potential Tri-Rail Coastal Link (TRCL)
station areas, as part of region-wide Tri-Rail expansion onto the Florida East Coast (FEC)
Railway corridor. According to the SFRTA, the TRCL project is planned to introduce new
commuter rail service along 85 miles of the FEC rail corridor and provide new regional and
intercity mobility, economic development and transportation choices. TRCL is planned to fully
integrate its existing system with the FEC rail corridor and connect South Florida’s most
populous eastern cities between downtown Miami and Jupiter.
Numerous public agencies are partnering with SFRTA in support of TRCL, including the Miami-
Dade, Broward, and Palm Beach MPOs; FDOT; the Southeast Florida Transportation Council
(SEFTC); the South Florida and Treasure Coast Regional Planning Councils; and several local
governments along the FEC corridor. The Council is assisting SFRTA in administering the
planning grant, which is focused on several key objectives, including:
Guide and manage development or redevelopment activities within designated station
area(s) or along transit corridors;
Integrate transit facilities and mobility improvements into a municipality’s land use plans and
land development regulations;
WTL +a
R e a l E s t a t e & E c o n o m i c A d v i s o r s W a s h i n g t o n , D C — P r o v i n c e t o w n , M A 2 0 2 . 8 8 5 . 9 1 2 1 3 0 1 . 5 0 2 . 4 1 7 1 7 7 4 . 5 3 8 . 6 0 7 0 6
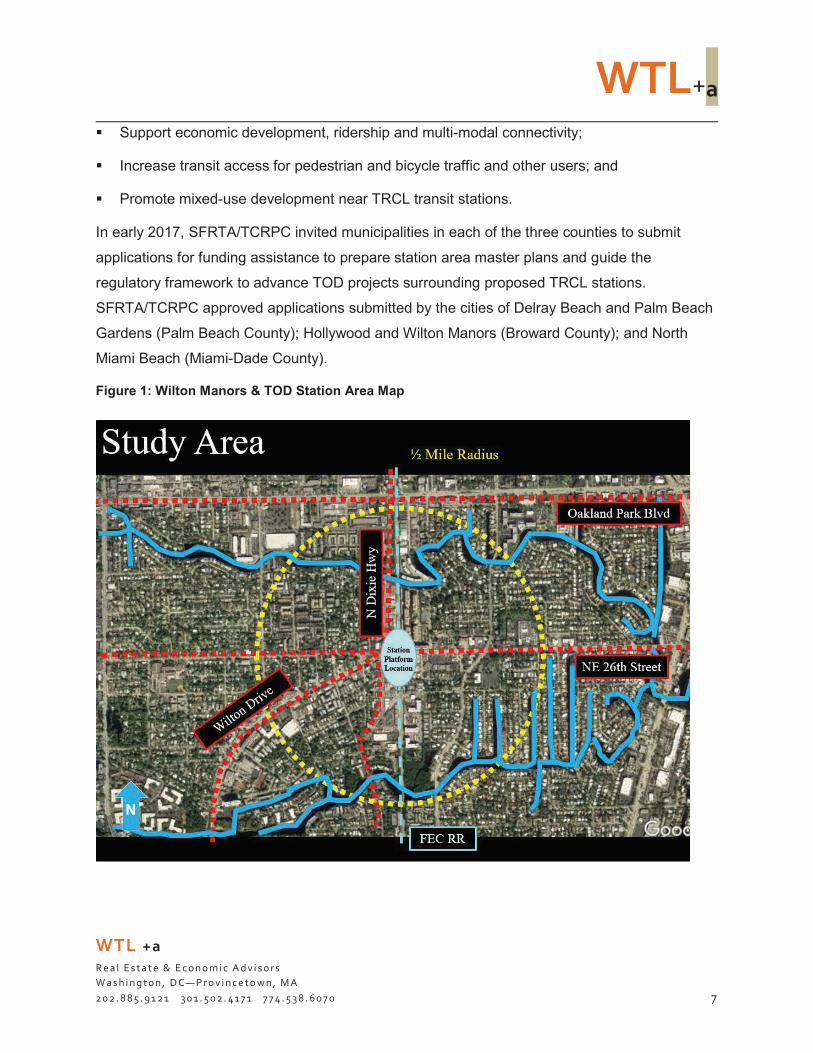
WTL+a
Support economic development, ridership and multi-modal connectivity;
Increase transit access for pedestrian and bicycle traffic and other users; and
Promote mixed-use development near TRCL transit stations.
In early 2017, SFRTA/TCRPC invited municipalities in each of the three counties to submit
applications for funding assistance to prepare station area master plans and guide the
regulatory framework to advance TOD projects surrounding proposed TRCL stations.
SFRTA/TCRPC approved applications submitted by the cities of Delray Beach and Palm Beach
Gardens (Palm Beach County); Hollywood and Wilton Manors (Broward County); and North
Miami Beach (Miami-Dade County).
Figure 1: Wilton Manors & TOD Station Area Map
WTL +a
R e a l E s t a t e & E c o n o m i c A d v i s o r s W a s h i n g t o n , D C — P r o v i n c e t o w n , M A 2 0 2 . 8 8 5 . 9 1 2 1 3 0 1 . 5 0 2 . 4 1 7 1 7 7 4 . 5 3 8 . 6 0 7 0 7

WTL+a
As illustrated in Figure 1 and Figure 2, the proposed area for the TRCL station is located in the
FEC rail corridor in the vicinity of the “Five Points” intersection of NE 26th Street, Wilton Drive
and North Dixie Highway. The commercial core of downtown Wilton Manors extends in multiple
directions on each of these streets, although the predominant civic and commercial corridor is
served by Wilton Drive. NE 26th Street connects downtown Wilton Manors with North Federal
Highway on the east while N. Dixie Highway links the city with Oakland Park on the north and
Fort Lauderdale on the south. The core study area comprises a 0.5-mile radius around the
proposed station area location.
Figure 2: 0.5-Mile Study Area Surrounding Proposed TRCL Station Location
As noted in the City’s grant application, in anticipation of future transit-oriented development, the
City of Wilton Manors adopted a Transit Oriented Corridor (TOC) land use category in the City’s
Comprehensive Plan on October 12, 2010. The purpose of the TOC land use category is to
“facilitate mixed use development with access to transit stations or stops along existing and
planned high performance transit service corridors designated in the Broward Comprehensive
WTL +a
R e a l E s t a t e & E c o n o m i c A d v i s o r s W a s h i n g t o n , D C — P r o v i n c e t o w n , M A 2 0 2 . 8 8 5 . 9 1 2 1 3 0 1 . 5 0 2 . 4 1 7 1 7 7 4 . 5 3 8 . 6 0 7 0 8

WTL+a
Transportation Element, the Broward County Transit Master Plan and Broward County
Metropolitan Planning Organization’s (MPO) Long Range Transportation Plan, Broward County
Transit Development Plan, or a locally adopted, financially feasible transportation or transit
plan.”
In addition, the City of Wilton Manors adopted Ordinance
No. 999 on February 13, 2012 which approved the Urban
Center Mixed-Use Zoning District. This district
encourages and facilitates “the development of a mixture
of residential units, entertainment, cultural facilities,
restaurants, shopping, commercial, retail, and professional
office uses within a safe and convenient walkable
environment that supports all modes of transportation, and
specifically supports high-frequency bus and commuter rail service and meets the needs of the
residential and working populations of the City.” In summary, these land use and zoning
regulations support additional density, building heights, and design guidelines that encourage
pedestrian amenities in the City’s Urban Center Mixed-Use Zoning District.
The City’s grant application also identified potential redevelopment sites along and adjacent to
the FEC corridor which are anticipated to add between 500 and 1,418 multi-family residential
units and additional commercial space. It is not known which sites have formal development
proposals under review. Potential redevelopment sites include:
The Shoppes of Wilton Manors—mixed use with up to 200 to 300 multi-family units or
150-room hotel with parking garage
DaVinci Plaza—up to 50 to 75 multi-family units
PJ’s/Latino Salud/Executive Suites & Adjacent Parcel—up to 50 to 100 multi-family units
Boomerang & Galanga Site—up to 50 to 75 multi-family units
Estrella Insurance/Dunkin Donuts Plaza—undetermined amount of commercial space or
up to 25 multi-family units
WTL +a
R e a l E s t a t e & E c o n o m i c A d v i s o r s W a s h i n g t o n , D C — P r o v i n c e t o w n , M A 2 0 2 . 8 8 5 . 9 1 2 1 3 0 1 . 5 0 2 . 4 1 7 1 7 7 4 . 5 3 8 . 6 0 7 0 9

WTL+a
All Parcels Adjacent (West Side) of FEC Corridor—these properties are located on Dixie
Highway, and could accommodate mixed use with up to 150 to 200 multi-family units and a
parking garage
Old Florida Seafood Shopping Center—mixed use with up to 300 multi-family units
1550 NE 26 Street—up to 88 multi-family units
Gulf Plating/NE 26th Street Parcels—mixed use with up to 75 multi-family units
The Pride Center at Equality Park—up to 130 multi-family units, and
1501 NE 26 Street—mixed use with up to 50 multi-family units.
WTL+a has prepared an analysis of real estate market potentials and preliminary economic
benefits of several development scenarios prepared by the TCRPC planning team. Our market
study focused on two (of four) core uses, housing and workplace/office. We also worked
collaboratively with Retail & Development Strategies, LLC, which focused on two other core
uses (TOD retail and lodging/hospitality) and preliminary implementation strategies. While
WTL+a and RDS were contracted separately by TCRPC, we have prepared a single, fully-
integrated market analysis report for the City of Wilton Manors and TOD Station Area.
Key Findings: Demographics
In 2018, data from ESRI Business Analyst suggests that Wilton Manors contains 12,548
residents in 6,667 households. Since 2000, the city’s population declined by 149 residents
but gained 791 new households. By comparison, the official state estimate of the City’s
population was 12,831 residents on April 1, 2018, with a nominal increase of 134 residents
since 2000;
ESRI’s five-year forecasts through 2023 suggest that Wilton Manors’ population will
increase, with a forecast population gain of 607 new residents in 295 new households;
The (87,200) recession-based job losses in Broward County have been replaced with
135,200 new jobs since 2011. DEO forecasts suggest that Broward County will add
almost 95,900 new jobs between 2017 and 2025, reflecting a sustained annual pace of
12,000 new jobs annually;
WTL +a
R e a l E s t a t e & E c o n o m i c A d v i s o r s W a s h i n g t o n , D C — P r o v i n c e t o w n , M A 2 0 2 . 8 8 5 . 9 1 2 1 3 0 1 . 5 0 2 . 4 1 7 1 7 7 4 . 5 3 8 . 6 0 7 0 10

WTL+a
U.S. Census data for 2006—2015 (latest data available) indicate that the recession had a
significant impact on the city’s employment base, with 1,020 jobs lost. Manufacturing,
Wholesale Trade and Real Estate/Rental & Leasing exhibited the largest losses. Since
2011, the city’s economy has rebounded, adding 644 new jobs through 2015. Despite
recession-based job losses, Wilton Manors had a net gain of 330 new jobs since 2006;
and
According to Dun & Bradstreet, Inc., there are 6,222 jobs in 940 registered businesses in
Wilton Manors, accounting for 0.70% of the 892,300 full-time jobs in Broward County. If the
city maintains its fair share of countywide jobs translates into almost 670 new jobs by
2025 using DEO employment forecasts.
Key Findings: Real Estate Market Conditions
Housing
The city contains 7,503 housing units. Like many communities after the 2007—2009
recession, the number of owner-occupied units has decreased—from 46.5% in 2010 to
40.3% in 2018 while renter-occupied units increased—from 40.5% to 48.6% by 2018;
The city’s true vacancy rate was 6.5% in 2010 (469 units). The American Community
Survey (ACS) suggests that the true vacancy rate increased to 7.5% in 2016 (561 units),
which can be attributed, in part, to newly delivered units in lease-up or sale;
HUD data indicate 408 units were built in Wilton Manors over the past 12 years, an
average annual pace of 34 units per year. This includes 114 single-family detached units
(28% of the total) and 294 multi-family units (72%). Wilton Manors accounted for only 1.2%
of the County’s total housing starts during this period;
In 2018, the multi-family vacancy rate in the Oakland Park/Wilton Manors submarket
was 8.7%. Notably, this was the highest multi-family vacancy rate of all 12 multi-
family submarkets in Broward County and above the industry’s threshold rate of 5% for
stabilized vacancies;
While the City’s grant application identified between 500 and 1,418 potential new residential
units, only one project (Pride Center) has been approved (for 48 affordable units);
WTL +a
R e a l E s t a t e & E c o n o m i c A d v i s o r s W a s h i n g t o n , D C — P r o v i n c e t o w n , M A 2 0 2 . 8 8 5 . 9 1 2 1 3 0 1 . 5 0 2 . 4 1 7 1 7 7 4 . 5 3 8 . 6 0 7 0 11

WTL+a
Hotel/Lodging
The hotel market among selected competitive properties surrounding Wilton Manors
is strong, with average annual occupancies ranging from 71.9% to 75.2% over the past
three years, well-above the industry breakeven threshold of 65%. Continued strong
performance over the next several years suggests that market potentials should be sufficient
to support new lodging in/surrounding Wilton Manors;
Office
Wilton Manors is considered a tertiary office location in Broward County, with a total
office inventory estimated at only 198,800 sq. ft. in 22 buildings located within one-mile of
Five Points based on data compiled from REIS, Inc. (a national commercial real estate data
provider) and the Broward County Property Appraiser. Wilton Manors comprises only 0.66%
of Broward County’s 27.6 million sq. ft. of office supply;
Data on key metrics of the Wilton Manors office market were available from REIS, Inc. for
only five of these 22 buildings. As such, any analysis of recent and current vacancy rates,
commercial office rents and net absorption (net leasing) activity cannot be completed;
REIS, Inc. has more complete data for office buildings located one- to two-miles of Five
Points, which includes office buildings located on several surrounding commercial corridors
such as North Federal Highway, Sunrise Boulevard and Oakland Park Boulevard. Key
metrics on these 17 buildings indicate:
o Inventory of 722,490 sq. ft. of office space
o 82,000 sq. ft. of vacant space (13% vacancy rate)
o Average asking rents of $23.35 per sq. ft., and
o Net absorption averaging only 4,878 sq. ft. per year over the past five years
Retail
Existing retail uses in Wilton Manors represent a disproportionate amount of the city’s
commercial space as compared to similarly-sized communities due, in part, to Wilton’s lower
building scale, proximity to Fort Lauderdale and this part of south Florida’s coastal
development, and the evolution of Wilton Manors into a destination for LGBTQ residents
and visitors. There is significantly more retail space in the city than the resident
WTL +a
R e a l E s t a t e & E c o n o m i c A d v i s o r s W a s h i n g t o n , D C — P r o v i n c e t o w n , M A 2 0 2 . 8 8 5 . 9 1 2 1 3 0 1 . 5 0 2 . 4 1 7 1 7 7 4 . 5 3 8 . 6 0 7 0 1 2

WTL+a
population alone would support. Incremental support for the city’s retail inventory
appears to be largely attributable to the visitor market to Wilton Manors, but there is also a
high vacancy rate in the existing retail inventory;
Wilton Manors contains 950,045 sq. ft. of retail/commercial space, which equates to 74
sq. ft. of retail space per resident. This is a remarkable amount of retail space per capita,
particularly without any major shopping malls within the city’s boundaries. By comparison,
the U.S. average is approximately 26 sq. ft. per capita;
At the time of the inventory, there were 55 vacant retail spaces in Wilton Manors totaling
231,400 sq. ft. of vacant space, or fully 24% of the city’s total retail/commercial
supply. This is considerably higher than the amount of vacant space found in more
reasonably balanced markets. The real estate industry considers a normal ‘stabilized’ retail
market to contain a vacancy rate of 5% to 7%. This indicates that there could be too much
retail space in Wilton Manors today, as indicated in the large amount of vacant retail
space;
The presence of Old Florida Seafood, a former shopping center, and the former Piggly
Wiggly grocery store located at Shoppes at Wilton, were almost completely vacant at the
time of the inventory. Both sites may be redeveloped at some point, but current conditions
account for a high proportion of total vacant space;
Other blocks of vacant space are located in more recently developed mixed-use residential
projects, in which the ground-level floorplates of mid-rise condominium towers are scaled by
the dimensions of the residential units above and, therefore, can be both more difficult to
lease and less attractive to prospective tenants; and
To put the city’s retail supply total into perspective, the 2018 U.S. estimate of total retail
space is approximately 26 sq. ft. per capita, or only about one-third of the per capita
estimate in Wilton Manors. Even at 26 sq. ft. per capita, the U.S. average is one of the
highest in the world; by comparison, average retail supply per resident in developed
European countries is about 2.5 sq. ft., or only 3.5% of the per capita estimate in Wilton
Manors.
WTL +a
R e a l E s t a t e & E c o n o m i c A d v i s o r s W a s h i n g t o n , D C — P r o v i n c e t o w n , M A 2 0 2 . 8 8 5 . 9 1 2 1 3 0 1 . 5 0 2 . 4 1 7 1 7 7 4 . 5 3 8 . 6 0 7 0 13

WTL+a
Key Findings: Market Potentials
As noted, the overarching objective of the TOD Station Area Master Plan is to allow infill
redevelopment to occur over time, expanding to those blocks that surround a future train station
in the area of NE 24th to NE 26th Street. Recommendations regarding market potentials, by use,
are summarized below:
Housing
A key recommendation in the TOD Station Area Master Plan is to encourage redevelopment
with infill housing as a means of growing the city’s population, increasing potential transit
ridership and enhancing potential market support for the city’s commercial retail uses;
WTL+a prepared a demand analysis that measures market potentials for new housing for a
10-year period between 2019 and 2028. The first scenario utilizes a “straight-line” growth
rate of 0.06% per year consistent with historic actual population growth rates in Wilton
Manors between 2000—2018 and the second utilizes an annual growth rate of 0.95% per
year based on near-term (2018—2023) population forecasts by ESRI Business Analyst, a
demographic forecasting service and extrapolated through 2028:
o Scenario #1: the historic rate of 0.06% per year yields only 75 new residents in 41
new households (i.e., housing units) if average household size of 1.84 remains
unchanged
o Scenario #2: the forecast growth rate of 0.95% per year yields 1,271 new residents
in 691 new households (i.e., housing units) if average household size of 1.84
remains unchanged
Both scenarios allocate market share to known residential projects (as identified by the City)
to determine the number of “unallocated” units elsewhere in Wilton Manors that could be
available to accommodate future population/household growth and captured as part of TOD
infill redevelopment. At the time this market study was prepared, the only known project
included the Pride Center, which is planning 48 affordable multi-family units:
o Scenario #1: results in limited demand for only 41 total units and no “unallocated”
units citywide. In effect, this scenario supports the Pride Center project but no
other new housing elsewhere in the city
WTL +a
R e a l E s t a t e & E c o n o m i c A d v i s o r s W a s h i n g t o n , D C — P r o v i n c e t o w n , M A 2 0 2 . 8 8 5 . 9 1 2 1 3 0 1 . 5 0 2 . 4 1 7 1 7 7 4 . 5 3 8 . 6 0 7 0 14

WTL+a
o Scenario #2: results in unallocated demand for 640+ units citywide (through
2028) after accounting for the Pride Center’s 48 units. The higher growth rate in
Scenario #2 would significantly strengthen opportunities for new TOD housing in
Wilton Manors
The analysis in both scenarios assumes that developable sites are readily available, full
entitlements are in-place, and construction financing is secured to support infill
redevelopment with new housing;
As noted in Section 3, Wilton Manors has a number of “true vacant” housing units. True
vacancy is defined as unoccupied units available for rent but excludes units that are
unoccupied because they are for sale or are seasonally-occupied units. According to the
2016 American Community Survey (ACS), Wilton Manors has 561 “truly vacant” units,
which reflects a vacancy rate of 7.5%. While the physical and/or functional obsolescence
of these units is unknown, some portion of these vacant units are assumed to be habitable
and may serve to reduce demand for new construction that are also affected by such
variables as the availability of financing;
Market opportunities for new housing surrounding a proposed TRCL station in Wilton
Manors over the next five to 10 years will also be determined by market response to
actual built projects. For example, while the City’s grant application identified between
500 and 1,400+ units in several redevelopment sites, none of these projects are under
construction; and
As a result, while our analysis for new housing covers a 10-year forecast period, in light of
uncertainties created by the lack of approved/under construction projects but rapid
absorption generated when The Metropolitan’s 179 units were delivered in 2016 (averaging
annual absorption of 87 units per year), WTL+a believes that a reasonable planning target
of 250 to 350 units appears market supportable over the next five years.
5-Year Planning Target for New TOD Housing:
250 to 350 Units
WTL +a
R e a l E s t a t e & E c o n o m i c A d v i s o r s W a s h i n g t o n , D C — P r o v i n c e t o w n , M A 2 0 2 . 8 8 5 . 9 1 2 1 3 0 1 . 5 0 2 . 4 1 7 1 7 7 4 . 5 3 8 . 6 0 7 0 15

WTL+a
Workplace: Office
The first step in measuring support for new multi-tenant/speculative office space as part of TOD
infill redevelopment in Wilton Manors examines market potentials for office use in Broward
County, and allocates demand to the city. The analysis translates employment forecasts (for
2017—2025) among specific industry sectors in Broward County (as prepared by the Florida
Department of Economic Opportunity/DEO), into demand for office space by applying an
occupancy factor (of occupied space per employee) and estimates the proportion of employees
in each sector who are office workers. We note that DEO employment forecasts are issued only
in eight-year periods. Opportunities for new office development were evaluated based on two
scenarios: 1) the city’s current share of countywide employment, and 2) the city’s current share
of office space. Key findings are summarized below:
In the employment analysis, with an estimated 6,222 employees working in Wilton Manors,
the city’s share of Broward County’s total jobs is 0.70%. Under this “fair share” analysis,
Wilton Manors would continue to capture 0.6% of future countywide job growth, or
approximately 670 new employees, by 2025. Assuming similar proportions of office-using
jobs (42%) and occupancy factors (194 sq. ft. per employee) translates into gross demand
for roughly 54,500 sq. ft. of office space over the next eight years;
In the space analysis, Wilton Manors’ office inventory accounts for roughly 0.72% of
Broward County’s total office supply. Based on growth in office-using jobs through 2025
suggests net demand for 7.6 million sq. ft. countywide. If the city maintains its fair share
suggests demand for more than 54,800 sq. ft. of office space—on par with the
employment analysis above;
However, since the amount of vacant office space in Wilton Manors is unknown, it is
therefore not possible to determine the amount of existing vacant space that would need to
be leased before financing is provided for new office construction. In other words, reducing
the amount of existing vacant space is intended to reduce overall risk in financing for multi-
tenant/speculative office buildings;
8-Year Planning Target for New Office:
Up to 55,000 SF; Recommend Build-to-Suit for Owner/User(s)
WTL +a
R e a l E s t a t e & E c o n o m i c A d v i s o r s W a s h i n g t o n , D C — P r o v i n c e t o w n , M A 2 0 2 . 8 8 5 . 9 1 2 1 3 0 1 . 5 0 2 . 4 1 7 1 7 7 4 . 5 3 8 . 6 0 7 0 16

WTL+a
Moreover, current rent levels in the range of $22 per sq. ft. (gross) in Wilton Manors may not
be sufficient to support new construction. Minimum required rents can be determined by
preparing a financial feasibility analysis of a prototype new office building, taking into
consideration construction costs, land acquisition, the provision of on-site parking, and other
factors affecting threshold office rents; and
As a result, this suggests that consideration of public policies tailored to offset construction
cost premiums with the use of regulatory and/or financial incentives, such as the provision of
adequate parking for office/professional and business service tenants that enhance the
marketability of Wilton Manors as a more viable, tertiary office location in Broward County.
Hotel/Lodging
As confirmed by the hotel market study prepared by HVS on behalf of the City of Wilton
Manors (as well as our preliminary analysis), there appears to be latent market demand for
a branded, limited-service hotel in Wilton Manors. However, its location, price points,
branding, and timing will influence the overall financial performance of the project. HVS
characterized a new hotel in Wilton Manors as a “moderate investment opportunity”;
RDS/WTL+a agree that a mid-scale hotel brand (such as those identified in the HVS study,
including Moxy by Marriott, Avid Hotels by Intercontinental Hotels Group, and VIB by Best
Western) can work based on recent and current market performance of competitive
properties. We concur with the HVS recommendation that a hotel of up to 100 rooms be
developed (around 2023) and that it should be affiliated with a brand (both for the
availability of central reservations systems and to capitalize on hotel loyalty programs); and
As HVS noted, any new hotel development would be phased/implemented according to the
availability of construction/development financing and market conditions of the competitive
hotel inventory at the time of construction. The preferred site is on Wilton Drive, potentially
as part of the redevelopment of a portion of the City Hall campus if the City so chooses to
offer this site for redevelopment. The suggested location provides excellent visibility to
travelers, is adjacent to public event sites, and would be highly visible for destination events
such as the annual Stonewall Parade and the Wicked Manors Halloween parade and street
party along Wilton Drive. The site is also central to the Wilton Drive nightlife district and to
The Venue, which reportedly draws tens of thousands of patrons to weddings, parties,
WTL +a
R e a l E s t a t e & E c o n o m i c A d v i s o r s W a s h i n g t o n , D C — P r o v i n c e t o w n , M A 2 0 2 . 8 8 5 . 9 1 2 1 3 0 1 . 5 0 2 . 4 1 7 1 7 7 4 . 5 3 8 . 6 0 7 0 17

WTL+a
performances and other events throughout the year. As we understand, The Venue sends
an undetermined number of overnight guests to hotels outside the city because there are no
hotels in Wilton Manors;
Perhaps most compelling in support of the redevelopment of the City Hall location with a
potential hotel is that the City of Wilton Manors already owns the land. Currently in use
as a surface parking lot for visitors to City Hall and adjacent recreation activities,
development of a hotel in this location would provide multiple sources of additional (net new)
tax revenues to the City as well as revenues generated by a long-term ground lease or a
direct land sale. The City should also consider enacting a ‘bed tax’ for the proposed hotel to
provide an ongoing, dedicated revenue stream for tourism and marketing; and
If timing/delivery of a new hotel is adversely affected by development or land
acquisition costs, the City should consider a land ‘write-down’ or discount, to reduce
the cost of entry to investors. This would serve to accelerate financial viability of an initial
capital investment, but the long-term sustainability of the hotel’s business model and its
position in the competitive market should be the primary governing factors in determining
economic viability.
General Retail
In terms of transit station impact on retail, incremental market support for TOD-based retail
stores is heavily affected by total ridership volumes and by head times between trains. As
currently understood, SFRTA head times (the amount of time between commuter train
arrivals) will range from 20 minutes (at rush hour) to 60 minutes (non-rush). Commuter
volumes are projected to be well below the 150,000 to 200,000 passengers per day that
begin to justify a sustained transit-based retail program. In Wilton Manors, the station
alone will not provide sufficient market for more than a minimal amount of retail
space in/next to the station;
The city’s sizable, existing retail inventory of 950,000 sq. ft. is dependent upon both a
sustained capture of a share of resident/household spending, and a continuing pattern of
spending by LGBTQ visitors to Wilton Manors. We note that no viable estimates of LGBTQ
visitors to Wilton Manors is available, although the Fort Lauderdale Convention & Visitors
Bureau estimates that 1.5 million LGBTQ visitors come to Broward County annually (no
source available). However, based on our analysis, RDS/WTL+a estimate that the
WTL +a
R e a l E s t a t e & E c o n o m i c A d v i s o r s W a s h i n g t o n , D C — P r o v i n c e t o w n , M A 2 0 2 . 8 8 5 . 9 1 2 1 3 0 1 . 5 0 2 . 4 1 7 1 7 7 4 . 5 3 8 . 6 0 7 0 18

WTL+a
number of LGBTQ visitors to Wilton Manors ranges between 157,000 and 247,000 per
year, and VISITFlorida data suggests an average stay of 3.7 nights for the Southeast
Florida “vacation region”. We also estimate that spending attributable to the LGBTQ
visitor market ranged from $51.2 million to $80.6 million in 2018; and
While some vacant retail spaces in Wilton Manors are attributable to dysfunctional layouts
and/or floorplan sizes, our September 2018 inventory indicated a retail vacancy rate of
approximately 25%, with almost 231,400 sq. ft. of vacant retail space in the city. By
comparison, the retail industry considers a 5% to 7% vacancy as illustrative of “stabilized”
market conditions). Additional new retail space in Wilton Manors is not recommended
at this time, although there are opportunities to upgrade existing spaces, reconfigure
existing space layouts, and strengthen connectivity along Wilton Drive to improve the
corridor’s retail mix. This is especially important in light of the ongoing streetscape
improvements underway by FDOT over the next couple of years.
Preliminary Implementation Strategies
Given the depth and magnitude of potential implementation of TOD (and related strategies to
document the number of visitors and their economic impacts), 10 preliminary strategies are
detailed in Section 5 of this report.
Preliminary implementation strategies are organized into three major topical areas:
Commercial District Management
Data Collection and Documentation, and
Public Policies and Planning
Each part begins with specific recommendations, with the rationale for the recommendations
presented in the text which follows each of the 10 recommendations.
WTL +a
R e a l E s t a t e & E c o n o m i c A d v i s o r s W a s h i n g t o n , D C — P r o v i n c e t o w n , M A 2 0 2 . 8 8 5 . 9 1 2 1 3 0 1 . 5 0 2 . 4 1 7 1 7 7 4 . 5 3 8 . 6 0 7 0 19

WTL+a
2Demographic & Economic Profile
The following evaluates those indices that drive fundamental market demand for various land
uses to inform transit-oriented development potentials surrounding the future Wilton Manors
station. This section of the report focuses on population and household growth, employment
trends and forecasts, household incomes and annual retail spending power, the current
business mix in Broward County and Hollywood, and other economic indicators based on
available data that form the basis of potential market support.
This profile and analysis are based on data from various secondary public and private sources,
including U.S. Census Bureau; University of Florida Bureau of Business & Economic Research;
City of Wilton Manors and Broward County; ESRI Business Analyst; Dun & Bradstreet, Inc.; and
other sources.
Demographic Trends & Forecasts
WTL+a evaluated historic population
patterns and growth forecasts in
various geographies—including the
0.5-mile study area, the city as a
whole, and in adjacent and nearby
communities in Broward County using
the sources above. Key findings are
summarized below, with data illustrated
in the accompanying tables.
WTL +a
R e a l E s t a t e & E c o n o m i c A d v i s o r s W a s h i n g t o n , D C — P r o v i n c e t o w n , M A 2 0 2 . 8 8 5 . 9 1 2 1 3 0 1 . 5 0 2 . 4 1 7 1 7 7 4 . 5 3 8 . 6 0 7 0 20

WTL+a
Table 1: Regional Population Trends & Forecasts, 2000—2040
Population Broward County
2000
1,623,018
% of County 2010
1,748,066
% of County
1-Apr 2018
1,897,976
% of County
Change: 2000-2018
Amount CAGR (2)
274,958 0.87%
Forecasts (3) 2020 2030
1,943,800 2,126,900
2040
2,249,300
% of County
Change: 2018-2040
Amount CAGR (2)
351,324 0.77%
Fort Lauderdale 152,397 9.4% 165,521 9.5% 182,827 9.6% 30,430 1.0% 186,563 37,047 73,526 47,228
206,419 40,047 83,082 58,325
228,388 43,290 93,880 72,030
10.2% 1.9% 4.2% 3.2%
45,561 6,815
22,129 26,754
Lauderdale Lakes 31,705 2.0% 32,593 1.9% 36,475 1.9% 4,770 0.8% Lauderhill 57,585 3.5% 66,887 3.8% 71,751 3.8% 14,166 1.2% Oakland Park 30,966 1.9% 41,363 2.4% 45,276 2.4% 14,310 2.1%
Wilton Manors 12,697 0.8% 11,632 0.67% 12,831 0.68% 134 0.06% 12,846 12,921 12,997 0.58% 166
Total: 285,350 17.6% 317,996 18.2% 349,160 18.4% 63,810 1.13% 357,210 400,795 450,585 20.0% 101,425 1.17%
(1) Based on the 2018-2045 Low-Medium-High Population Forecasts prepared by BEBR. Analysis uses the Medium Growth Scenario for Broward County. (2) CAGR=Compound Annual Growth Rate. (3) Population projections for 2018-2040 for nearby municipalities assume that each continues the same annual rate of growth as occurred between 2000-2018.
Source: U.S. Census Bureau; University of Florida, Bureau of Business & Economic Research; ESRI Business Analyst; WTL+a, updated January 2019.
WTL +a
R e a l E s t a t e & E c o n o m i c A d v i s o r s W a s h i n g t o n , D C — P r o v i n c e t o w n , M A 2 0 2 . 8 8 5 . 9 1 2 1 3 0 1 . 5 0 2 . 4 1 7 1 7 7 4 . 5 3 8 . 6 0 7 0 2 1

WTL+a
Broward County
As illustrated in Table 1 above, Broward County’s population increased—from 1.62 million
residents in 2000 to more than 1.89 million residents as of the April 1, 2018 state census,
reflecting significant population growth of almost 275,000 over the past 18 years. This
represents sustained annual growth of 0.87% per year;
The five municipalities surrounding or proximate to Wilton Manors contain a combined
population of over 349,160 residents, accounting for less than 20% of the County’s total
population. This share has remained generally stable in the range of 17% to 18% since
2000, with over 63,800 new residents since 2000. However, the average annual growth rate
in these communities—1.13% per year—exceeded the growth rate of Broward County
during this period; and
Since 2000, Broward County Added
274,950 New Residents
Based on the Moderate Growth scenario of long-term population forecasts through 2040
(prepared by the University of Florida/Bureau of Economic & Business Research/BEBR),
Broward County is expected to add another 351,300 new residents, which translates
into an annual growth rate of 0.77% per year over the next 18 years, for a 2040 population
of 2,237,900 residents.
Wilton Manors
Key demographic characteristics of the City of Wilton Manors are illustrated in Table 2 and
summarized below:
In 2018, data from ESRI Business Analyst suggests that Wilton Manors contains 12,548
residents in 6,667 households. This is on par with the official April 1st state estimate of
12,831 residents;
WTL +a
R e a l E s t a t e & E c o n o m i c A d v i s o r s W a s h i n g t o n , D C — P r o v i n c e t o w n , M A 2 0 2 . 8 8 5 . 9 1 2 1 3 0 1 . 5 0 2 . 4 1 7 1 7 7 4 . 5 3 8 . 6 0 7 0 2 2

WTL+a
Table 2: Demographic Trends & Forecasts—City of Wilton Manors, 2000—2023
Change: 2018-2023
2000 2010 2018 % Dist. 2023 % Dist. No. CAGR % Demographic Profile Population 12,697 11,632 12,548 13,155 607 0.95% As % of County 0.78% 0.67% 0.66% 0.66% Households 5,876 6,235 6,667 6,962 295 0.87% Avg. HH Size 2.06 1.82 1.84 1.85 Median Age 47.6 49.3 51.0 Race White 9,396 9,549 76% 9,551 73% 2 0.0% Black 1,440 1,890 15% 2,249 17% 359 3.5% American Indian 30 41 0% 49 0% 8 3.6% Asian, Pacific Islander 255 345 3% 422 3% 77 4.1% Other 293 425 3% 534 4% 109 4.7% Two or More Races 218 299 2% 350 3% 51 3.2% Total: 11,632 12,549 13,155 606 Hispanic (1) 1,498 2,213 18% 2,852 22% 639 5.2%
Age Distribution 0-14 950 1,004 8% 1,134 9% 130 2.5% 15-24 807 828 7% 849 6% 21 0.5% 25-34 1,447 1,527 12% 1,518 12% (9) -0.1% 35-44 2,048 1,828 15% 1,764 13% (64) -0.7% 45-54 2,734 2,565 20% 2,321 18% (244) -2.0% 55-64 1,886 2,338 19% 2,493 19% 155 1.3% 65-74 844 1,363 11% 1,760 13% 397 5.2% 75+ 916 1,097 9% 1,318 10% 221 3.7%
Income Profile Households by Income <$15,000 9.1% 6.9% $15,000 - $24,999 7.9% 6.2% $25,000 - $34,999 9.1% 7.7% $35,000 - $49,999 16.5% 15.4% $50,000 - $74,999 20.3% 20.3% $75,000 - $99,999 13.9% 15.2% $100,000 - $149,999 13.9% 16.6% $150,000 - $199,999 3.5% 4.3% $200,000+ 5.7% 7.5% Average HH Income $ 79,260 $ 94,148 3.5% Median HH Income $ 56,723 $ 64,852 2.7%
Educational Profile Years of Education (2016 American Community Survey/ACS) Less than 9th Grade 3.1% 9th-12th Grade, No Diploma 4.6% High School Graduate (Includes Equivalency) 21.2% Some College, No Degree 20.6% Associate Degree 8.2% Bachelor's Degree 27.6% Graduate/Professional Degree 14.7%
(1) Persons of Hispanic origin are a subset of other race categories; therefore, totals do not add. https://factfinder.census.gov/faces/tableservices/jsf/pages/productview.xhtml?src=CF
Source: U.S. Census Bureau; American Community Survey; ESRI Business Analyst; WTL +a, October 2018.
WTL +a
R e a l E s t a t e & E c o n o m i c A d v i s o r s W a s h i n g t o n , D C — P r o v i n c e t o w n , M A 2 0 2 . 8 8 5 . 9 1 2 1 3 0 1 . 5 0 2 . 4 1 7 1 7 7 4 . 5 3 8 . 6 0 7 0 23

WTL+a
Since 2000, the City’s population has fluctuated. Between 2000 and 2010, population
declined by fully 1,000 residents, likely as a result of the national recession and attendant
housing collapse. Since 2010, however, that loss has been reversed—with a gain of 916
residents in 432 new households;
It is notable that, despite a net loss in population between 2000 and 2018, household growth
in Wilton Manors during this same period has been strong—with a gain of 791 new
households. This suggests the loss of larger-sized households (families) and an increase in
single-headed households (or households without children), which would be consistent with
a large LGBT population;
The city’s share of Broward County’s population has declined over the past 17 years—from
0.78% in 2000 to 0.66% in 2018. Over the next five years, ESRI data suggest that the rate
of decline will stabilize—to 0.66% by 2023;
A population that is 76% White, 15% Black, and 18% Hispanic (can be two or more races);
Residents have a median age of 49.3 years, which is forecast to increase to 51.0 years by
2023. By comparison, Broward County’s median age is younger—41.0 with a forecast
increase to 41.4 by 2023;
A solidly middle-class community, with average household incomes in 2018 of $79,260 per
year. Fully 25% of households have annual incomes greater than $100,000 per year;
Average household incomes are forecast to increase by 3.5% per year over the next five
years, to almost $94,150 by 2023. The city’s average household income is forecast to
remain slightly more than their counterparts across Broward County—which is forecast to be
more than $93,800 by 2023;
Notably, ESRI’s five-year forecasts through 2023 suggest that Wilton Manor’s growth will
strengthen over the 2010—2018 period, with a forecast population gain of over 600 new
residents in 295 new households. This forecast suggests average annual growth rates of
0.95% and 0.87% per year, respectively; and
ESRI forecasts further suggest that population growth will be greatest in two age
cohorts over the next five years: ages 65-74 and 75+. More moderate growth is also
expected in the 55-64 age cohort. This is likely to translate into opportunities for specific
WTL +a
R e a l E s t a t e & E c o n o m i c A d v i s o r s W a s h i n g t o n , D C — P r o v i n c e t o w n , M A 2 0 2 . 8 8 5 . 9 1 2 1 3 0 1 . 5 0 2 . 4 1 7 1 7 7 4 . 5 3 8 . 6 0 7 0 24

WTL+a
types of housing, such as age-restricted and independent living/continuing care for these
older cohorts. Notably, forecasts suggest slight declines in the three age cohorts between
25 and 54 years, which likewise has implications on housing demand for Millennials, first-
time home buyers and move-up buyers/peak earning years.
Population Growth in Wilton Manors Next 5 Years:
600+ New Residents in 295 New Households by 2023
½-Mile Trade Area
To understand the impacts on TOD potentials in downtown Wilton Manors, we examined short-
term demographic trends and forecasts for a one-half mile ring surrounding the proposed station
site. Key findings are summarized below and illustrated in Table 3:
The trade area’s population of almost 5,200 residents accounts for fully 41% of the city’s
population. Notably, as new housing such as the Metropolitan (179 rental units) and others
are delivered, the trade area’s population is forecast to increase over the next five years.
ESRI forecasts suggest 330 new residents in 156 new households by 2023;
Consistent with the forecasts for Wilton Manors as a whole, the largest increases in age
cohorts are forecast to occur in those over the age of 55. Other notable gains are
anticipated in the 0—14 and 15—24 cohorts while declines are forecast in 25—34 (typically,
first-time buyers), 35—44 (typically, move-up buyers) and 45—54 (peak earning years);
Average household incomes among trade area residents are expected to increase at a rate
below that of than their counterparts citywide—3.1% per year versus 3.5% per year over the
next five years, increasing to almost $90,800 per year by 2023; and
Average household size is slightly larger than it is citywide—1.86 people per household
versus 1.84 citywide.
WTL +a
R e a l E s t a t e & E c o n o m i c A d v i s o r s W a s h i n g t o n , D C — P r o v i n c e t o w n , M A 2 0 2 . 8 8 5 . 9 1 2 1 3 0 1 . 5 0 2 . 4 1 7 1 7 7 4 . 5 3 8 . 6 0 7 0 25

WTL+a
Table 3: Demographic Trends & Forecasts—1/2-Mile Trade Area, 2010—2023
Change: 2018-2023
2010 2018 % Dist. 2023 % Dist. No. CAGR % Demographic Profile Population 4,614 5,181 5,511 330 1.24% As % of City 39.7% 41.3% 41.9% Households 2,453 2,720 2,876 156 1.12% Avg. HH Size 1.84 1.86 1.88 Median Age 45.1 47.4 49.4 Race White 3,811 4,055 78% 4,137 75% 82 0.4% Black 465 637 12% 770 14% 133 3.9% American Indian 17 23 0% 28 1% 5 4.0% Asian, Pacific Islander 59 90 2% 115 2% 25 5.0% Other 174 253 5% 313 6% 60 4.3% Two or More Races 87 124 2% 148 3% 24 3.6% Total: 4,613 5,182 5,511 329 Hispanic (1) 790 1,157 22% 1,472 27% 315 4.9%
Age Distribution 0-14 420 501 10% 586 11% 85 3.2% 15-24 339 373 7% 419 8% 46 2.4% 25-34 680 671 13% 632 11% (39) -1.2% 35-44 860 804 16% 743 13% (61) -1.6% 45-54 1,025 1,026 20% 933 17% (93) -1.9% 55-64 639 850 16% 970 18% 120 2.7% 65-74 296 518 10% 690 13% 172 5.9% 75+ 354 437 8% 537 10% 100 4.2%
Income Profile Households by Income <$15,000 10.6% 8.2% $15,000 - $24,999 7.6% 6.1% $25,000 - $34,999 8.9% 7.7% $35,000 - $49,999 15.3% 14.5% $50,000 - $74,999 19.7% 20.0% $75,000 - $99,999 13.6% 14.8% $100,000 - $149,999 15.3% 17.7% $150,000 - $199,999 4.2% 4.9% $200,000+ 4.8% 6.1% Average HH Income $ 77,921 $ 90,782 3.1% Median HH Income $ 57,419 $ 64,521 2.4%
(1) Persons of Hispanic origin are a subset of other race categories; therefore, totals do not add. https://factfinder.census.gov/faces/tableservices/jsf/pages/productview.xhtml?src=CF
Source: U.S. Census Bureau; American Community Survey; ESRI Business Analyst; WTL +a, October 2018.
WTL +a
R e a l E s t a t e & E c o n o m i c A d v i s o r s W a s h i n g t o n , D C — P r o v i n c e t o w n , M A 2 0 2 . 8 8 5 . 9 1 2 1 3 0 1 . 5 0 2 . 4 1 7 1 7 7 4 . 5 3 8 . 6 0 7 0 26

WTL+a
Household Incomes & Retail Spending
Household retail spending is the primary driver of demand for retail space such as shopping
centers, “Big Box” stores such as Wal-Mart or Target, food & beverage, and specialty or
destination retail projects. Household retail spending patterns among households in Broward
County, Wilton Manors and the 0.5-mile trade area are illustrated in Table 4.
With 2018 average household incomes of $79,260, households in Wilton Manors have
sufficient disposable income to support a wide range of retail offerings. Households spend
approximately 26% of annual incomes on various retail categories compared to 23% among
households countywide;
The City’s households spend over $18,250 per year on consumer retail goods,
including clothing, entertainment/recreation, electronics, groceries, food & beverage,
household furnishings and health care. This generally parallels what trade area households
spend ($18,080) as well as households across Broward County spend ($18,230 per
household); and
Retail spending among the City’s households totals over $121.6 million per year, as
compared to almost $49.2 million among trade area households and over $13.3 billion per
year for all County households. Notably, household spending totals are irrespective of
location (i.e., spending can occur anywhere).
WTL +a
R e a l E s t a t e & E c o n o m i c A d v i s o r s W a s h i n g t o n , D C — P r o v i n c e t o w n , M A 2 0 2 . 8 8 5 . 9 1 2 1 3 0 1 . 5 0 2 . 4 1 7 1 7 7 4 . 5 3 8 . 6 0 7 0 27

WTL+a
Table 4: Annual Household Consumer Spending, 2018
Broward City of 1/2-Mile
County Wilton Manors Study Area
Total Households (2018) 737,040 6,667 2,720
Apparel & Accessories
Men's Wear $ 411 $ 396
Women's Wear 721 717 711
Children's Wear 327 296 301
Footwear 454 446 448
Watches & Jewelry 117 139 137
Apparel Products & Services 83 78 77
394$
Subtotal: $ 2,112 $ 2,073 $ 2,068
Computers
Computers & Hardware $ 173 $ 170 $ 170
Software & Accessories 35 35 35
Subtotal: $ 208 $ 205 $ 204
Entertainment & Recreation
Membership Fees for Clubs $ 207 $ 216 $ 209
Fees for Participant Sports 100 108 104
Tickets to Theater/Operas/Concerts 58 66 64
Tickets to Movies/Museums/Parks 78 78 78
Admission to Sporting Events 54 56 54
Fees for Recreational Lessons 130 126 122
Dating Services 0.87 0.83 0.86
Subtotal: $ 628 $ 649 $ 631
TV/Video/Audio
Cable & Satellite TV Services $ 919 $ 912 $ 902
Televisions 119 116 117
Satellite Dishes 1 2 2
VCRs, Video Cameras & DVD Players 7 6 6
Miscellaneous Video Equipment 9 13 13
Video Cassettes & DVDs 15 12 12
Video Game Hardware/Accessories 29 30 31
Video Game Software 16 16 16
Streaming/Downloaded Video 26 34 34
Rental of Video Cassettes & DVDs 15 13 13
Installation of Televisions 1 1 1
Audio 86 88 88
Rental & Repair of TV/Radio/Audio 4 3 4
Subtotal: $ 1,246 $ 1,245 $ 1,238
(1) Consumer spending data are derived from the 2015 and 2016 Consumer Expenditure Surveys conducted by
the Bureau of Labor Statistics.
Source: US Department of Labor, Bureau of Labor Market Statistics; ESRI Business Analyst; WTL +a,
October 2018.
WTL +a
R e a l E s t a t e & E c o n o m i c A d v i s o r s W a s h i n g t o n , D C — P r o v i n c e t o w n , M A 2 0 2 . 8 8 5 . 9 1 2 1 3 0 1 . 5 0 2 . 4 1 7 1 7 7 4 . 5 3 8 . 6 0 7 0 28

WTL+a
Table 4 (Continued): Annual Household Consumer Spending, 2018
Broward City of 1/2-Mile
County Wilton Manors Trade Area
Other Entertainment
Pets 555$ 572$ 558$
Toys & Games 116 111 110
Recreational Vehicles & Fees 92 92 88
Sports/Recreation/Exercise Equipment 162 169 165
Photo Equipment & Supplies 54 50 50
Reading 120 110 106
Catered Affairs 30 27 26
Subtotal: $ 1,130 $ 1,131 $ 1,103
Food & Alcohol
Food at Home $ 4,879 $ 4,766
Food Away from Home 3,275 3,370 3,359
Alcoholic & Non-alcoholic Beverages 546 558 550
Subtotal: $ 8,700 $ 8,693 $ 8,661
Household Furnishings & Equipment
Household Textiles $ 94 $ 95
Furniture 567 586 581
Floor Coverings 22 24 23
Major Appliances 303 311 303
Housewares 93 98 96
Small Appliances 47 48 48
Luggage 12 13 13
Telephones & Accessories 69 66 66
Lawn & Garden 390 381 363
Housekeeping Supplies 688 670 662
Maintenance & Remodeling Materials 353 412 387
Subtotal: $ 2,639 $ 2,705 $ 2,637
Health & Personal Care
Non- & Prescription Drugs $ 487 $ 460 $ 445
Optical 89 87 84
Personal Care Products 459 467 464
School Supplies 153 144 145
Smoking Products 380 394 399
Subtotal: $ 1,569 $ 1,550 $ 1,537
4,752 $
95$
TOTAL:
Total Annual Spending $ 13,330,448,041 $ 121,681,750 $ 49,177,138
Per Household
As % of Average HH Income 23.3% 26.1% 23.2%
18,232 $ 18,251 $ 18,080 $
(1) Consumer spending data are derived from the 2015 and 2016 Consumer Expenditure Surveys conducted by
the Bureau of Labor Statistics.
Source: US Department of Labor, Bureau of Labor Market Statistics; ESRI Business Analyst; WTL +a,
October 2018.
WTL +a
R e a l E s t a t e & E c o n o m i c A d v i s o r s W a s h i n g t o n , D C — P r o v i n c e t o w n , M A 2 0 2 . 8 8 5 . 9 1 2 1 3 0 1 . 5 0 2 . 4 1 7 1 7 7 4 . 5 3 8 . 6 0 7 0 29

WTL+a
Retail “Recapture” Opportunities
Another key indicator of retail market potentials involves what is known as “retail opportunity
gap”. This compares annual household spending (i.e., “demand”) in specific merchandise
categories against estimated annual retail sales by businesses in those same categories (i.e.,
“supply”). The difference between demand and supply represents the “recapture” opportunity,
or surplus, available in each retail category in the reporting geography.
When demand is greater than supply, there is an apparent opportunity for additional
retail space in that category. By comparison, when demand is less than supply, there is a
surplus of sales in that retail category. That is, a positive value in green = a potential recapture
opportunity, while a negative value in red = a surplus of sales among businesses, or an “inflow”
of sales from outside of the reporting geography. In Figure 1 below, recapture opportunities
among specific merchandise categories are on the right side of the graph, while surplus sales
(inflow) are illustrated on the left side of the graph. Numerical findings for the City of Wilton
Manors are illustrated in Table 5.
Figure 3: Retail Leakage & Surplus—City of Wilton Manors, 2018
WTL +a
R e a l E s t a t e & E c o n o m i c A d v i s o r s W a s h i n g t o n , D C — P r o v i n c e t o w n , M A 2 0 2 . 8 8 5 . 9 1 2 1 3 0 1 . 5 0 2 . 4 1 7 1 7 7 4 . 5 3 8 . 6 0 7 0 3 0

WTL+a
Table 5: Retail “Recapture” Opportunities—City of Wilton Manors, 2018
Demand Supply "Recapture"
Retail Category (HH Spending) (Store Sales) Opportunity
General Merchandise Stores
Department Stores Excl Leased Depts.
Other General Merchandise Stores
Subtotal:
$
$
24,611,150
10,460,507
35,071,657
$
$
1,019,868
1,959,788
2,979,656
$
$
23,591,282
8,500,719
32,092,001
Clothing & Accessories Stores
Clothing Stores
Shoe Stores
Jewelry, Luggage, Leather Goods
Subtotal:
$
$
7,295,941
1,635,136
1,927,814
10,858,891
$
$
8,039,297
-
699,310
8,738,607
$
$
(743,356)
1,635,136
1,228,504
2,120,284
Furniture & Home Furnishings Stores
Furniture Stores
Home Furnishing Stores
Subtotal:
$
$
4,335,152
3,349,423
7,684,575
$
$
6,875,045
2,627,495
9,502,540
$
$
(2,539,893)
721,928
(1,817,965)
Electronics & Appliance Stores
Appliances, TVs, Electronics Stores
Subtotal:
$
$
6,167,436
6,167,436
$
$
3,399,125
3,399,125
$
$
2,768,311
2,768,311
Leisure & Entertainment
Sporting Goods/Hobby/Musical Instruments
Books, Periodicals & Music Stores
Subtotal:
$
$
4,268,022
936,064
5,204,086
$
$
1,401,299
936,064
2,337,363
$
$
2,866,723
654,152
3,520,875
Food Services & Drinking Places
Special Food Services
Drinking Places - Alcoholic Beverages
Restaurants/Other Eating Places
$ 379,185
1,870,499
20,852,814
$ 403,384
18,148,675
24,412,486
$ (24,199)
(16,278,176)
(3,559,672)
Subtotal: $ 23,102,498 $ 42,964,545 $ (19,862,047)
(1) Claritas' "Retail Market Power" data is derived from two major sources of information. Demand data are
derived from Consumer Expenditure Surveys fielded by the U.S. Bureau of Labor Statistics (BLS). Supply
data are derived from the Census Bureau. The difference between demand and supply represents the
"recapture opportunity", or surplus, available for each retail category in the reporting geography. When
demand is greater than supply, there is an apparent opportunity for additional retail space in that category.
By comparison, when demand is less than supply, there is a surplus of sales in that retail category (i.e.,
positive value = recapture opportunity, while negative value = surplus of sales).
(2) Total household retail spending excludes spending on Non-Store Retailers (Internet); Motor Vehicle
Parts and Dealers; and Gas Stations.
Source: Bureau of Labor Statistics; Claritas, Inc.; ESRI Business Analyst; WTL +a, October 2018.
WTL +a
R e a l E s t a t e & E c o n o m i c A d v i s o r s W a s h i n g t o n , D C — P r o v i n c e t o w n , M A 2 0 2 . 8 8 5 . 9 1 2 1 3 0 1 . 5 0 2 . 4 1 7 1 7 7 4 . 5 3 8 . 6 0 7 0 3 1

WTL+a
Table 5 (Continued): Retail “Recapture” Opportunities—City of Wilton Manors, 2018
Demand Supply "Recapture"
Retail Category (HH Spending) (Store Sales) Opportunity
Food & Beverage Stores
Grocery Stores
Specialty Food Stores
Beer, Wine & Liquor Stores
Subtotal:
$
$
34,459,161
1,588,566
1,901,876
37,949,603
$
$
79,448,836
1,421,512
3,668,224
84,538,572
$
$
(44,989,675)
167,054
(1,766,348)
(46,588,969)
Health & Personal Care Stores
Health & Personal Care Stores
Subtotal:
$
$
14,128,657
14,128,657
$
$
18,115,182
18,115,182
$
$
(3,986,525)
(3,986,525)
Building Material, Garden Equipment Stores
Building Materials & Supplies
Lawn & Garden Equipment & Supplies
Subtotal:
$
$
12,553,414
1,023,879
13,577,293
$
$
13,177,280
1,023,879
14,201,159
$
$
(623,866)
1,023,879
400,013
Miscellaneous Store Retailers
Florists
Office Supplies, Stationery, Gift Stores
Used Merchandise Stores
Other Miscellaneous Retail Stores
Subtotal:
$
$
359,486
1,863,244
1,947,273
4,459,061
8,629,064
$
$
2,064,427
1,042,829
2,591,260
3,616,067
9,314,583
$
$
(1,704,941)
820,415
(643,987)
842,994
(685,519)
TOTAL:
HH Demand vs. Retail Sales $ 162,373,760 $ 196,091,332 $ (33,717,572)
(2)
(1) Claritas' "Retail Market Power" data is derived from two major sources of information. Demand data are
derived from Consumer Expenditure Surveys fielded by the U.S. Bureau of Labor Statistics (BLS). Supply
data are derived from the Census Bureau. The difference between demand and supply represents the
"recapture opportunity", or surplus, available for each retail category in the reporting geography. When
demand is greater than supply, there is an apparent opportunity for additional retail space in that category.
By comparison, when demand is less than supply, there is a surplus of sales in that retail category (i.e.,
positive value = recapture opportunity, while negative value = surplus of sales).
(2) Total household retail spending excludes spending on Non-Store Retailers (Internet); Motor Vehicle
Parts and Dealers; and Gas Stations.
Source: Bureau of Labor Statistics; Claritas, Inc.; ESRI Business Analyst; WTL +a, October 2018.
WTL +a
R e a l E s t a t e & E c o n o m i c A d v i s o r s W a s h i n g t o n , D C — P r o v i n c e t o w n , M A 2 0 2 . 8 8 5 . 9 1 2 1 3 0 1 . 5 0 2 . 4 1 7 1 7 7 4 . 5 3 8 . 6 0 7 0 3 2

WTL+a
Another source for household retail spending includes the Bureau of Labor Statistics (BLS) and
Claritas, Inc. Key findings for Wilton Manors indicate that:
The City’s households spend over $162 million per
year. This estimate is higher than annual spending
illustrated previously in Table 3 because it includes
multiple additional merchandise categories such as
Building Materials, Leisure & Entertainment and
Miscellaneous Store sales. This compares to estimated
citywide store sales of over $196 million per year.
The difference between spending and sales is known as
inflow; in other words, there is more than $33.7 million
in annual retail sales inflow into Wilton Manors from
sources other than resident households. We note that
resident household sales can occur anywhere (i.e.,
oftentimes outside of Wilton Manors), so sources of inflow
include daytime employees (who don’t live in Wilton), visitors and pass-through traffic;
This analysis reveals that there are several merchandise categories where apparent
opportunities could be recaptured to support either new retail development or stronger
performance among existing businesses in Wilton Manors. These include: General
Merchandise Stores ($32 million); Leisure & Entertainment ($3.5 million); Electronics &
Appliances ($2.8 million); and Apparel & Accessories ($2.1 million); and
Highly notable is the level of spending on restaurants and drinking places ($42.5
million per year). Almost half (47%) of these annual sales are generated by inflow
spending from other sources.
47% of All Food & Beverage Sales ($19.8 Million/Year) in
Wilton Manors are Generated from Inflow Sources like Visitors
WTL +a
R e a l E s t a t e & E c o n o m i c A d v i s o r s W a s h i n g t o n , D C — P r o v i n c e t o w n , M A 2 0 2 . 8 8 5 . 9 1 2 1 3 0 1 . 5 0 2 . 4 1 7 1 7 7 4 . 5 3 8 . 6 0 7 0 3 3

WTL+a
Economic Characteristics
Employment Trends—Broward County
Job growth is a key barometer of demand for “workplace” uses such as multi-tenant office
space, industrial parks, retail centers and the like. WTL+a examined trends and forecasts in
employment growth, utilizing data for Broward County as prepared by the state’s labor agency,
the Department of Economic Opportunity (DEO), for the period between 1995 and 2017. This
data is critical to understanding TOD development potentials in Wilton Manors. Key findings are
summarized below and illustrated in Table 6:
Broward County added a remarkable 196,300 new jobs in the 10-year period between
1995 and 2005. This growth, which translates into over 19,600 new jobs annually, was
focused largely in specific sectors, including: Professional/Business Services (67,800),
Construction (22,000) and Education/Health Services (23,700);
Growth in Professional/Business Services has fueled demand for office space in key
locations across Broward County during this period. Other sectors with solid job growth
during this period also included Financial Activities (19,300) and Government (22,300);
By contrast, the economic downturn of 2007—2009 resulted in the loss of 87,200 jobs in
Broward County. Over the past 10 years (and over multiple economic cycles), job losses
have been greatest in Construction (-8,100) and Manufacturing (-5,000);
In only seven years between 2011 and 2017, however, the economy of Broward County
has significantly recovered from the 2007—2009 recession, with the creation of
135,200 new jobs;
Notably, the Services sector—which comprises multiple categories such as Business and
Professional Services, Health, Education and Leisure/Hospitality, has gained the largest
share of new jobs in the County, exhibiting a net gain of 58,900 new jobs between 2007 and
2017;
(87,200) Recession-based Job Losses in Broward County
Replaced with 135,200 New Jobs Since 2011
WTL +a
R e a l E s t a t e & E c o n o m i c A d v i s o r s W a s h i n g t o n , D C — P r o v i n c e t o w n , M A 2 0 2 . 8 8 5 . 9 1 2 1 3 0 1 . 5 0 2 . 4 1 7 1 7 7 4 . 5 3 8 . 6 0 7 0 3 4

WTL+a
Table 6: Broward County Employment Trends, 1995—2017
10-Year Change: 1995-2005
National Recession 11-Year Change:
2007-2017 Industry Sector 1995 2000 2005 Amount CAGR % 2007 2009 2011 2013 2015 2016 2017 Amount CAGR %
In 000s Construction 36,300 46,900 58,300 22,000 4.9% 56,900 33,600 30,900 34,700 43,500 44,900 48,800 (8,100) -1.5% Manufacturing 44,500 38,200 33,000 (11,500) -2.9% 32,700 25,500 25,600 26,700 28,000 27,900 27,700 (5,000) -1.6% Transp/Warehousing/Utilities 19,500 21,100 24,800 5,300 2.4% 26,700 22,000 22,700 24,700 26,500 27,400 30,100 3,400 1.2% Trade Wholesale 32,700 39,700 46,100 13,400 3.5% 48,800 44,600 45,300 46,700 48,700 49,200 48,500 (300) -0.1% Retail 95,800 106,300 105,300 9,500 0.9% 107,900 97,600 103,800 111,000 114,700 115,200 112,700 4,800 0.4% Information 15,300 21,800 19,900 4,600 2.7% 19,400 16,600 17,700 18,400 19,200 19,200 20,400 1,000 0.5% Financial Activities 47,800 54,800 67,100 19,300 3.4% 64,300 53,700 54,500 55,200 57,000 57,400 58,600 (5,700) -0.9% Services Prof'l/Business Services 55,000 95,300 122,800 67,800 8.4% 127,700 116,500 123,600 134,500 146,900 151,700 154,000 26,300 1.9% Education/Health Services 65,500 74,300 89,200 23,700 3.1% 93,600 95,500 97,700 99,500 104,300 107,200 111,500 17,900 1.8% Leisure & Hospitality 65,100 72,200 78,100 13,000 1.8% 82,300 75,500 81,400 87,400 93,500 96,100 93,500 11,200 1.3% Other Services 27,100 31,300 34,000 6,900 2.3% 35,600 31,500 34,200 36,200 38,200 38,500 39,100 3,500 0.9% Government 82,100 93,900 104,400 22,300 2.4% 106,500 102,600 98,700 101,700 103,000 105,600 105,500 (1,000) -0.1%
Total (In 000s): 586,700 695,800 783,000 196,300 2.9% 802,400 715,200 736,100 776,700 823,500 840,300 850,400 48,000 0.6%
Change During Period: 109,100 87,200 19,400 (87,200) 20,900 40,600 46,800 16,800 10,100
(1) As of year-end for each reported year.
http://floridajobs.org/labor-market-information/data-center/statistical-programs/current-employment-statistics
Source: US Department of Labor, Bureau of Labor Market Statistics; Florida Department of Economic Opportunity, Bureau of Labor Market Statistics; WTL +a, October 2018.
WTL +a
R e a l E s t a t e & E c o n o m i c A d v i s o r s W a s h i n g t o n , D C — P r o v i n c e t o w n , M A 2 0 2 . 8 8 5 . 9 1 2 1 3 0 1 . 5 0 2 . 4 1 7 1 7 7 4 . 5 3 8 . 6 0 7 0 3 5

WTL+a
Table 7: Business Mix—Broward County, 2018
NAICS Category No. % of Total No. % of Total
Businesses Employees
Mining & Natural Resources 1,228 1.4% 7,820 0.9% Construction 5,607 6.4% 42,550 4.8% Manufacturing 2,451 2.8% 39,375 4.4% Transportation & Warehousing 2,649 3.0% 23,189 2.6% Communications 881 1.0% 14,257 1.6% Utilities 171 0.2% 3,047 0.3% Wholesale & Retail Trade
Wholesale 3,556 47,471 Retail 17,648 202,340 - Home Improvement 971 10,246 - General Merchandise 633 18,910 - Food Stores 1,721 29,127 - Auto Dealers/Gas Stations 2,677 31,002 - Apparel & Accessory Stores 1,239 9,528 - Furniture/Home Furnishings 1,524 11,619 - Eating & Drinking Places 4,579 61,748 - Miscellaneous & Non-store Retail 4,304 30,334 Subtotal - All Retail: 21,204 24.3% 249,811 28.0%
Finance/Insurance/Real Estate 9,862 11.3% 89,827 10.1% Services
- Hotel/Lodging 675 17,718 - Automotive Services 2,455 12,886 - Motion Pictures & Amusements 2,333 27,679 - Health Services 5,692 94,468 - Legal Services 2,570 18,443 - Educational Institutions 1,386 49,135 - Other Services 20,796 165,689 Subtotal - Services: 35,907 41.1% 386,018 43.3%
Government 1,225 1.4% 34,877 3.9% Unclassified Establishments 6,184 7.1% 1,495 0.2%
TOTAL: 87,369 100.0% 892,266 100.0%
ANALYSIS:
2017 Employment 892,266
2018 Population 1,901,425
Jobs/Population Ratio 0.47
Source: ESRI Business Analyst; InfoGroup, Inc.; Dun & Bradstreet, Inc.; WTL +a, October 2018.
WTL +a
R e a l E s t a t e & E c o n o m i c A d v i s o r s W a s h i n g t o n , D C — P r o v i n c e t o w n , M A 2 0 2 . 8 8 5 . 9 1 2 1 3 0 1 . 5 0 2 . 4 1 7 1 7 7 4 . 5 3 8 . 6 0 7 0 3 6

WTL+a
As illustrated in Table 7, Dun & Bradstreet, Inc. estimates that Broward County contained
approximately 892,300 full-time jobs in 87,369 registered businesses in 2018, which
reflects a jobs-to-population ratio of 0.47. That is, there is almost one-half a job for every
one of the 1,901,425 residents in the County, and reflects the concentration of larger
employment centers such as downtown Fort Lauderdale, the west suburban communities of
Sunrise and Plantation and the Cypress Creek/Commercial Boulevard area; and
Employment is concentrated in particular sectors, including Services (43%),
Wholesale/Retail Trade (28%), and Financial Activities (10%).
Employment Trends & Forecasts—Broward County
Employment forecasts for specific jurisdictions in Florida (defined as Workforce Development
Regions) are also prepared by the Department of Economic Opportunity in eight-year forecast
periods. As illustrated in Table 8 below, these forecasts suggest that:
Broward County is expected to add more than 95,800 new jobs between 2017 and
2025, reflecting a sustained annual pace of 12,000 new jobs annually over this eight-year
period; and
The Services sector is expected to comprise over 56% of all new jobs in the county—adding
over 54,000 new jobs—with the largest gains expected in Health Care, Professional and
Business Services and Accommodation & Leisure & Hospitality sectors. This could be
expected to fuel demand for professional and medical office space, retail uses and lodging.
Employment Trends—Wilton Manors
As illustrated in Table 9 below, Dun & Bradstreet, Inc. estimates that there are 6,222 jobs in
940 registered businesses in Wilton Manors. The City accounts for approximately 0.70%
of the 892,300 full-time jobs in Broward County;
The two largest sectors generating demand for workplace real estate in Wilton Manors
include: Wholesale/Retail Trade (1,980 jobs) and Services (2,860 jobs). Within Services,
“Other Services” accounts for fully 66% of the total (1,890 jobs). Together, these sectors
account for 78% of the 6,222 jobs in Wilton. “Other Services” includes such industries as
automotive repair and maintenance;
WTL +a
R e a l E s t a t e & E c o n o m i c A d v i s o r s W a s h i n g t o n , D C — P r o v i n c e t o w n , M A 2 0 2 . 8 8 5 . 9 1 2 1 3 0 1 . 5 0 2 . 4 1 7 1 7 7 4 . 5 3 8 . 6 0 7 0 3 7

WTL+a
Table 8: State Employment Forecasts—Broward County, 2017—2025
Change: 2017-2025
Employment Category 2017 % Dist. 2025 % Dist. Total CAGR
Agriculture & Mining 932 0.1% 928 0.1% (4) -0.1%
Construction 45,711 5.1% 52,017 5.2% 6,306 1.6%
Manufacturing 27,909 3.1% 28,739 2.9% 830 0.4%
Transportation & Utilities 27,409 3.1% 29,961 3.0% 2,552 1.1%
Trade Wholesale Retail
Subtotal:
48,987 112,215 161,202 18.0%
51,883121,936173,819 17.5%
2,896 9,721
12,617 0.9%
Information 19,380 2.2% 20,223 2.0% 843 0.5%
Financial Activities 58,518 6.5% 64,476 6.5% 5,958 1.2%
Services Professional, Scientific & Technical Services Education & Health Services Leisure & Hospitality Other Services (Except Government)
Subtotal:
152,528 109,685 94,750 36,209
393,172 43.9%
176,735 126,529 103,908 40,055
447,227 45.1%
24,207 16,844 9,158 3,846
54,055
1.9% 1.8% 1.2% 1.3% 1.6%
Government 104,021 11.6% 110,888 11.2% 6,867 0.8%
Self-Employed & Unpaid Family Workers 57,440 6.4% 63,284 6.4% 5,844 1.2%
TOTAL:
Annual Increase (Rounded):
895,694 991,562 95,868
12,000
1.3%
http://www.floridajobs.org/labor-market-information/data-center/statistical-programs/employment-projections
Source: Florida Department of Economic Opportunity, Bureau of Labor Statistics; WTL +a, October 2018.
WTL +a
R e a l E s t a t e & E c o n o m i c A d v i s o r s W a s h i n g t o n , D C — P r o v i n c e t o w n , M A 2 0 2 . 8 8 5 . 9 1 2 1 3 0 1 . 5 0 2 . 4 1 7 1 7 7 4 . 5 3 8 . 6 0 7 0 3 8

WTL+a
Table 9: Business Mix—City of Wilton Manors, 2018
NAICS Category No. % of Total No. % of Total
Businesses Employees
Agriculture & Mining 15 1.6% 85 1.4% Construction 34 3.6% 206 3.3% Manufacturing 15 1.6% 90 1.4% Transportation & Warehousing 16 1.7% 68 1.1% Communications 3 0.3% 8 0.1% Utilities - 0.0% - 0.0% Wholesale & Retail Trade
Wholesale 17 205 Retail 226 1,781 - Home Improvement 7 24 - General Merchandise 4 16 - Food Stores 23 447 - Auto Dealers/Gas Stations 20 63 - Apparel & Accessory Stores 11 45 - Furniture/Home Furnishings 14 148 - Eating & Drinking Places 78 810 - Miscellaneous & Non-store Retail 69 228 Subtotal - All Retail: 243 25.9% 1,986 31.9%
Finance/Insurance/Real Estate 103 11.0% 611 9.8% Services
- Hotel/Lodging 11 24 - Automotive Services 19 76 - Motion Pictures & Amusements 28 110 - Health Services 66 419 - Legal Services 32 107 - Educational Institutions 9 234 - Other Services 257 1,893 Subtotal - Services: 422 44.9% 2,863 46.0%
Government 17 1.8% 287 4.6% Unclassified Establishments 72 7.7% 18 0.3%
TOTAL: 940 100.0% 6,222 100.0%
ANALYSIS:
2017 Employment 6,222
As Share of Broward County 0.70%
2017 Population 12,548
Jobs/Population Ratio 0.50
Source: ESRI Business Analyst; InfoGroup, Inc.; Dun & Bradstreet, Inc.; WTL +a, October 2018.
WTL +a
R e a l E s t a t e & E c o n o m i c A d v i s o r s W a s h i n g t o n , D C — P r o v i n c e t o w n , M A 2 0 2 . 8 8 5 . 9 1 2 1 3 0 1 . 5 0 2 . 4 1 7 1 7 7 4 . 5 3 8 . 6 0 7 0 3 9

WTL+a
As noted, Wilton Manors contains only 0.70% of all at-place jobs in Broward County.
This is known as fair share, and has been considered in our analysis of workplace market
potentials in Section 4 of this report;
Fair Share:
Wilton Manors Accounts for Only
0.7% of Broward County’s Total Jobs
The data also suggest that the City’s current jobs-to-population ratio is 0.50 (i.e., there is
one-half of a job for every resident living in Wilton). This is slightly higher than the County’s
ratio (0.47) and reflects a diverse business mix and concentration of businesses along
commercial corridors such as Wilton Drive, N. Andrews Avenue and NE 26th Street;
As illustrated in Table 10 below, U.S. Census Bureau data indicate that the 2007—2010
recession had a significant impact on the City’s employment base as over 1,000 jobs
were lost. Construction, Manufacturing, Information and Real Estate exhibited the largest
job losses, as did Administrative jobs within the Services sector;
Since 2011, however, the City’s economy has strengthened, adding more than 640 new
jobs over this six-year period;
In summary, despite recession-based
job losses, Wilton Manors had a net
gain of 330 new jobs since 2005. We
note that differences between Dun &
Bradstreet (Table 9) and U.S. Census
Bureau (Table 10) are attributed to part-
time, self-employed and those jobs not
contributing to the Unemployment
Insurance Fund.
WTL +a
R e a l E s t a t e & E c o n o m i c A d v i s o r s W a s h i n g t o n , D C — P r o v i n c e t o w n , M A 2 0 2 . 8 8 5 . 9 1 2 1 3 0 1 . 5 0 2 . 4 1 7 1 7 7 4 . 5 3 8 . 6 0 7 0 40

WTL+a
Table 10: 10-Year Employment Trends—City of Wilton Manors, 2006—2015
Change: 2006-2015
Industry Sector 2006 2007 2008 2009 2010 2011 2012 2013 2014 2015 % Dist. Amount CAGR %
Agriculture & Mining - 4 1 - - - - 3 - - 0.0% - 0.0% Construction 199 922 771 474 348 382 398 409 550 534 12.9% 335 11.6% Manufacturing 71 73 71 38 31 40 41 47 44 39 0.9% (32) -6.4% Transp & Warehousing 8 8 2 19 21 9 14 20 14 22 0.5% 14 11.9% Utilities - - - - - - - - - - 0.0% - 0.0% Trade Wholesale 152 127 142 350 315 259 228 164 56 40 1.0% (112) -13.8% Retail 567 603 619 628 631 627 619 610 598 597 14.4% 30 0.6% Information 110 146 139 36 33 35 34 31 38 21 0.5% (89) -16.8% Finance & Insurance 79 70 48 46 42 67 61 77 93 90 2.2% 11 1.5% Real Estate/Rental & Leasing 540 124 122 97 61 69 74 58 70 104 2.5% (436) -16.7% Services Prof'l/Business Services 301 334 321 274 239 286 287 291 308 359 8.7% 58 2.0% Management of Companies 1 - 1 2 4 21 15 19 18 26 0.6% 25 43.6% Administration/Waste Mgmt. 111 129 264 71 58 118 82 100 91 107 2.6% (4) -0.4% Educational Services 51 41 49 56 39 18 22 34 35 34 0.8% (17) -4.4% Health Care & Social Assistance 824 914 851 852 682 722 761 780 865 919 22.2% 95 1.2% Arts/Entertainment/Recreation 18 34 30 44 58 63 63 50 39 28 0.7% 10 5.0% Accommodation & Food Services 514 605 613 593 624 663 764 784 781 821 19.8% 307 5.3% Other Services 126 238 249 245 180 216 216 245 243 260 6.3% 134 8.4% Public Administration/Gov't 137 145 129 138 129 137 129 132 137 138 3.3% 1 0.1%
Total (In 000s): 3,809 4,517 4,422 3,963 3,495 3,732 3,808 3,854 3,980 4,139 330 0.9%
Annual Change: - 708 (95) (459) (468) 237 76 46 126 159
Job Loss (As % of All Jobs): -2% -12% -13% 6% 2% 1% 3% 4%
Source: U.S. Census Bureau, On-the-Map; WTL +a, October 2018.
WTL +a
R e a l E s t a t e & E c o n o m i c A d v i s o r s W a s h i n g t o n , D C — P r o v i n c e t o w n , M A 2 0 2 . 8 8 5 . 9 1 2 1 3 0 1 . 5 0 2 . 4 1 7 1 7 7 4 . 5 3 8 . 6 0 7 0 41

WTL+a
As illustrated in Figure 4 below, in 2015, the U.S. Census Bureau estimates that the highest
employment densities were concentrated in the core of Wilton along Wilton Drive, NE 26th
Street and in the N. Andrews Avenue corridor; and
Figure 4: Employment Densities—City of Wilton Manors, 2015
As illustrated in Figure 5 below, according to U.S. Census Bureau data, in 2015 the City
exhibited a gain of 3,755 workers who live elsewhere working in Wilton while over 5,000
residents leave the City on a daily basis to work elsewhere.
WTL +a
R e a l E s t a t e & E c o n o m i c A d v i s o r s W a s h i n g t o n , D C — P r o v i n c e t o w n , M A 2 0 2 . 8 8 5 . 9 1 2 1 3 0 1 . 5 0 2 . 4 1 7 1 7 7 4 . 5 3 8 . 6 0 7 0 42

WTL+a
Figure 5: Employment Inflow/Outflow—City of Wilton Manors, 2015
WTL +a
R e a l E s t a t e & E c o n o m i c A d v i s o r s W a s h i n g t o n , D C — P r o v i n c e t o w n , M A 2 0 2 . 8 8 5 . 9 1 2 1 3 0 1 . 5 0 2 . 4 1 7 1 7 7 4 . 5 3 8 . 6 0 7 0 43

WTL+a
3Real Estate Market Conditions
WTL +a evaluated real estate market conditions in Wilton Manors and in other selected, nearby
competitive locations in Broward County to understand how recent market trends, current
economic conditions, and future growth affect opportunities for new TOD-supportive
development around the proposed TRCL station area.
This section of the report analyzes historic and current building inventory, occupancy and
vacancy levels, annual absorption (leasing) activity, historic development trends, and other
appropriate market indices for housing, workplace, supporting commercial (retail) and
lodging/hospitality uses based on available data. Key findings are summarized below and
illustrated in Table 13 through Table 20.
Housing
Wilton Manors contains a diverse array of
residential neighborhoods. Market metrics
of the City’s housing stock are illustrated in
Table 13 and detailed below:
Based on data from ESRI Business
Analyst and the American Community
Survey (ACS), Wilton contains over 7,500
housing units. Since 2010, ESRI data
suggest that the City’s housing inventory
has increased by 341 units;
Like many communities across the U.S. after the 2007—2009 recession, the number of
owner-occupied units has decreased—from 46.5% in 2010 to 40.3% in 2018.
Conversely, the number of renter-occupied units increased during this time—from 40.5% in
2010 to almost 49% by 2018. As discussed in greater detail below, 11% of the City’s
housing stock is “unoccupied” (estimated at 836 units);
WTL +a
R e a l E s t a t e & E c o n o m i c A d v i s o r s W a s h i n g t o n , D C — P r o v i n c e t o w n , M A 2 0 2 . 8 8 5 . 9 1 2 1 3 0 1 . 5 0 2 . 4 1 7 1 7 7 4 . 5 3 8 . 6 0 7 0 44

WTL+a
Table 11: Housing Profile—City of Wilton Manors, 2010—2023
Change: 2018-2023
2010 2018 % Dist. 2023 % Dist. No. CAGR % Housing Tenure Owner-occupied 3,331 3,020 3,322 302 1.92%
% of Total 46.5% 40.3% 42.4% Renter-occupied 2,904 3,647 3,641 (6) -0.03%
% of Total Unoccupied
40.5% 927
48.6% 836
46.5% 871 35 0.82%
% of Total 12.9% 11.1% 11.1% Total Units: 7,162 7,503 7,834 672 0.87%
Net Change 341 331
Owner-Occupied Value $0 - $99,999 157 5% 81 2% (76) -12.4% $100,000 - $199,999 481 16% 347 10% (134) -6.3% $200,000 - $299,999 614 20% 634 19% 20 0.6% $300,000 - $399,999 728 24% 860 26% 132 3.4% $400,000 - $499,999 504 17% 689 21% 185 6.5% $500,000 - $749,999 433 14% 573 17% 140 5.8% $750,000+ 103 3% 137 4% 34 5.9%
Median Value $ 335,440 $ 369,593 1.96% Average Value $ 360,538 $ 397,290 1.96%
All Housing Units By Structure (2016 American Community Survey) 1 Unit, Detached 5,530 73.7% 1 Unit, Attached 83 1.1% 2 Units 143 1.9% 3 or 4 Units 330 4.4% 5 to 9 Units 360 4.8% 10 or More Units 195 2.6% Mobile Home 870 11.6%
Total Units: 7,511 100%
Unoccupied Housing Units By Status Unoccupied-All Reasons 2010 2016 (ACS)
Rented (Not Occupied) 14 For Sale Only 196 Sold (Not Occupied) 30 Seasonal Use 218 3% For Migrant Workers -
Subtotal: 458
TRUE VACANCIES Other Vacant Vacant, For Rent
173 296
Subtotal: 469 561
True Vacancy Rate 6.5% 7.5%
Total Unoccupied Units: 927 1,108 50.6%
https://factfinder.census.gov/faces/tableservices/jsf/pages/productview.xhtml?src=CF
Source: ESRI Business Analyst; American Community Survey; WTL +a, October 2018.
WTL +a
R e a l E s t a t e & E c o n o m i c A d v i s o r s W a s h i n g t o n , D C — P r o v i n c e t o w n , M A 2 0 2 . 8 8 5 . 9 1 2 1 3 0 1 . 5 0 2 . 4 1 7 1 7 7 4 . 5 3 8 . 6 0 7 0 45

WTL+a
The average unit value of all housing units in Wilton in 2018 is $360,500. Over the next five
years, ESRI forecasts suggest that average housing values will increase at a nominal
compound annual rate of 1.96% per year—to almost $397,300;
More specific analysis of the City’s unoccupied housing stock indicates that units are
unoccupied for various reasons. As a result, this does not accurately reflect actual vacant
units. U.S. Census data indicate that 927 units were unoccupied as of the 2010 Census, as
the economic recovery from the 2007—2009 recession ended, and recovery gained
momentum. As a result, the number of vacant units in many housing markets has declined
with an improving economy. In Wilton, the number of unoccupied units decreased
between 2010 and 2018—from 927 units in 2010 to 836 units in 2018;
The number of unoccupied units includes 218 units that are seasonally-owned (i.e.,
occupied for only a portion of the year, such as by snowbirds who vacation in Florida).
When such units (as well as other units, such as those that are sold but not yet occupied)
are removed from the unoccupied category, the City’s true vacancy in 2010 was
significantly lower—6.5%, or 469 units. The 2016 American Community Survey (ACS)
suggests that the number of truly vacant units has increased slightly—to 561 units in 2016,
revealing a true vacancy rate of 7.5%. In effect, the City’s housing market is nearing
stabilized levels, as 5% vacancy is considered industry-standard; and
ACS data reveal that the City’s housing stock consists of a diverse array of housing types,
with pockets of low- and high-density buildings. This includes single-family attached and
detached (74.8%) and multi-family units (13.7%). In addition, almost 12% of Wilton’s
housing stock, or 870 units, consists of mobile homes.
WTL +a
R e a l E s t a t e & E c o n o m i c A d v i s o r s W a s h i n g t o n , D C — P r o v i n c e t o w n , M A 2 0 2 . 8 8 5 . 9 1 2 1 3 0 1 . 5 0 2 . 4 1 7 1 7 7 4 . 5 3 8 . 6 0 7 0 46

WTL+a
Housing Starts
To document how population and household growth affects TOD market potentials for new
housing in Wilton Manors, WTL+a reviewed information on annual housing starts/residential
building permits. This analysis also compares housing starts to household growth to
understand whether the pace of one metric is consistent with (or exceeds) the other. Housing
starts for the 12-year period between 2006 and 2017 are illustrated in Table 14 below. Key
findings indicate that:
Since the 2007-2009 recession and subsequent recovery and economic momentum,
housing starts across Broward County resulted in delivery of more than 33,400 new housing
units, producing a sustained annual pace of over 3,300 units per year. In terms of unit
distribution, this includes 17,615 single-family units (41% of the total) and 24,938 multi-
family units (59% of the total);
In Wilton Manors, according to data provided by the U.S. Department of Housing & Urban
Development, there were 408 units built over the past 12 years, resulting in an average
annual pace of 34 units per year. This included only 114 single-family detached units and
294 multi-family units. In total, Wilton Manors accounted for only 0.6% of the County’s
single-family starts and 1.2% of the County’s multi-family units over the past 12 years; and
Over the past two years, several single-family units were built in scattered locations, and
one multi-family rental project was delivered, The Metropolitan, containing 179 rental units.
A detailed property profile is provided below.
WTL +a
R e a l E s t a t e & E c o n o m i c A d v i s o r s W a s h i n g t o n , D C — P r o v i n c e t o w n , M A 2 0 2 . 8 8 5 . 9 1 2 1 3 0 1 . 5 0 2 . 4 1 7 1 7 7 4 . 5 3 8 . 6 0 7 0 47

WTL+a
Table 12: 12-Year Housing Starts—Broward County & Selected Municipalities, 2006—2017
Municipality Single-family Detached
Fort Lauderdale Lauderdale Lakes Lauderhill Oakland Park Wilton Manors
Subtotal: As % of County
2006
289 -163 166 19
637 18%
2007
137 2
60 257
1 457 26%
2008
92 1 9
21 45
168 19%
2009
38 12
-25
-75
13%
2010
42 --12
-54 6%
2011
42 --40 4
86 6%
2012
81 --20 4
105 10%
2013
94 -45 29 8
176 12%
2014
79 -62 8 6
155 13%
2015
124 -19 9 1
153 10%
2016
124 2
12 142 18
298 19%
2017
133 1
12 97 8
251 14%
Change: 2006-2017
Total Annual % of Starts Average County
1,275 106 7% 18 2 0%
382 32 2% 826 69 5% 114 10 0.6%
2,615 218 15% 15%
SFD-Broward County: 3,550 1,754 908 563 979 1,446 1,023 1,434 1,181 1,494 1,535 1,748 17,615 1,468 41%
Multi-family Fort Lauderdale 1,021 535 369 - - 4 2 889 283 4 21 1,141 4,269 356 17% Lauderdale Lakes - - - - 10 10 - - - - 492 26 538 45 2% Lauderhill - - - - - - - - - - - - - - 0% Oakland Park - 2 - - - - 6 - 5 - 80 64 157 13 1% Wilton Manors 50 8 57 - - - - - - 179 - - 294 25 1.2%
Subtotal:
As % of County
1,071
34%
545
25%
426
34%
-
0%
10
5%
14
1%
8
0%
889
29%
288
22%
183
5%
593
23%
1,231
37%
5,258
21%
438 21%
MF-Broward County: 3,166 2,179 1,256 486 189 998 2,533 3,036 1,281 3,958 2,570 3,286 24,938 2,078 59%
http://socds.huduser.org/permits/
Source: U.S. Census Bureau; U.S. Dept. of Housing & Urban Development; WTL+a, updated December 2018.
WTL +a
R e a l E s t a t e & E c o n o m i c A d v i s o r s W a s h i n g t o n , D C — P r o v i n c e t o w n , M A 2 0 2 . 8 8 5 . 9 1 2 1 3 0 1 . 5 0 2 . 4 1 7 1 7 7 4 . 5 3 8 . 6 0 7 0 48

WTL+a
Table 14 (Continued): 12-Year Housing Starts—Broward County & Selected Municipalities, 2006—2017
Change: 2006-2017
Total Annual % of Municipality 2006 2007 2008 2009 2010 2011 2012 2013 2014 2015 2016 2017 Starts Average Total
Total Starts Fort Lauderdale 1,310 672 461 38 42 46 83 983 362 128 145 1,274 5,544 462 17% Lauderdale Lakes - 2 1 12 10 10 - - - - 494 27 556 46 2% Lauderhill 163 60 9 - - - - 45 62 19 12 12 382 32 1% Oakland Park 166 259 21 25 12 40 26 29 13 9 222 161 983 82 3%
Wilton Manors 69 9 102 - - 4 4 8 6 180 18 8 408 34 1.2%
Subtotal: 1,708 1,002 594 75 64 100 113 1,065 443 336 891 1,482 7,873 656 24%
As % of County 25% 25% 27% 7% 5% 4% 3% 24% 18% 6% 22% 29%
TOTAL-Broward County: 6,716 3,933 2,164 1,049 1,168 2,444 3,556 4,470 2,462 5,452 4,105 5,034 33,414 2,785 100%
http://socds.huduser.org/permits/
Source: U.S. Census Bureau; U.S. Dept. of Housing & Urban Development; WTL+a, updated December 2018.
WTL +a
R e a l E s t a t e & E c o n o m i c A d v i s o r s W a s h i n g t o n , D C — P r o v i n c e t o w n , M A 2 0 2 . 8 8 5 . 9 1 2 1 3 0 1 . 5 0 2 . 4 1 7 1 7 7 4 . 5 3 8 . 6 0 7 0 49
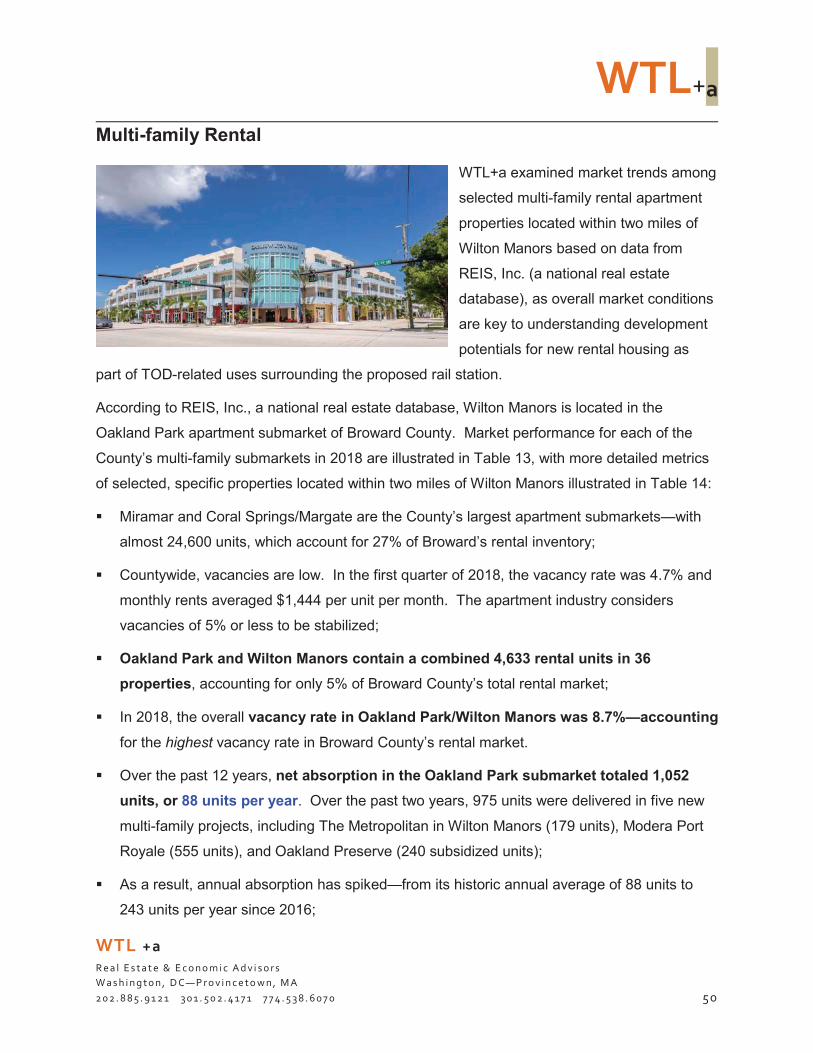
WTL+a
Multi-family Rental
WTL+a examined market trends among
selected multi-family rental apartment
properties located within two miles of
Wilton Manors based on data from
REIS, Inc. (a national real estate
database), as overall market conditions
are key to understanding development
potentials for new rental housing as
part of TOD-related uses surrounding the proposed rail station.
According to REIS, Inc., a national real estate database, Wilton Manors is located in the
Oakland Park apartment submarket of Broward County. Market performance for each of the
County’s multi-family submarkets in 2018 are illustrated in Table 13, with more detailed metrics
of selected, specific properties located within two miles of Wilton Manors illustrated in Table 14:
Miramar and Coral Springs/Margate are the County’s largest apartment submarkets—with
almost 24,600 units, which account for 27% of Broward’s rental inventory;
Countywide, vacancies are low. In the first quarter of 2018, the vacancy rate was 4.7% and
monthly rents averaged $1,444 per unit per month. The apartment industry considers
vacancies of 5% or less to be stabilized;
Oakland Park and Wilton Manors contain a combined 4,633 rental units in 36
properties, accounting for only 5% of Broward County’s total rental market;
In 2018, the overall vacancy rate in Oakland Park/Wilton Manors was 8.7%—accounting
for the highest vacancy rate in Broward County’s rental market.
Over the past 12 years, net absorption in the Oakland Park submarket totaled 1,052
units, or 88 units per year. Over the past two years, 975 units were delivered in five new
multi-family projects, including The Metropolitan in Wilton Manors (179 units), Modera Port
Royale (555 units), and Oakland Preserve (240 subsidized units);
As a result, annual absorption has spiked—from its historic annual average of 88 units to
243 units per year since 2016;
WTL +a
R e a l E s t a t e & E c o n o m i c A d v i s o r s W a s h i n g t o n , D C — P r o v i n c e t o w n , M A 2 0 2 . 8 8 5 . 9 1 2 1 3 0 1 . 5 0 2 . 4 1 7 1 7 7 4 . 5 3 8 . 6 0 7 0 50
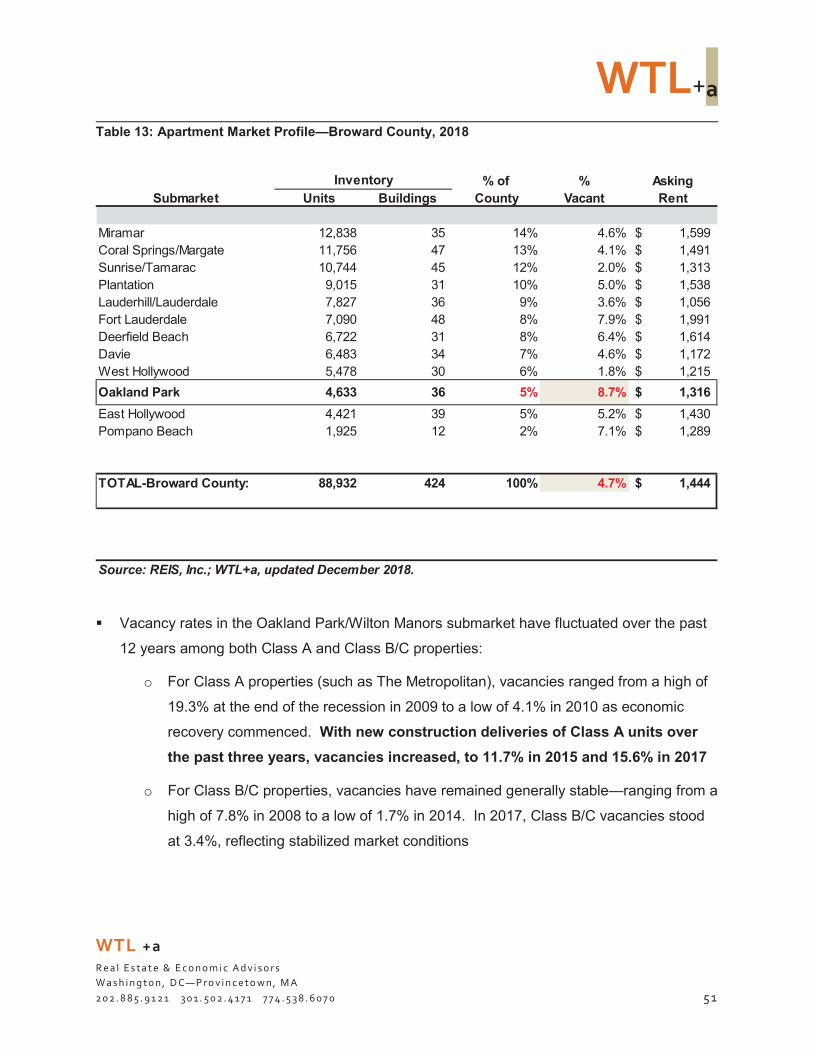
WTL+a
Table 13: Apartment Market Profile—Broward County, 2018
Inventory % of % Asking Submarket Units Buildings County Vacant Rent
Miramar 12,838 35 14% 4.6% 1,599 $ Coral Springs/Margate 11,756 47 13% 4.1% $ 1,491 Sunrise/Tamarac 10,744 45 12% 2.0% $ 1,313 Plantation 9,015 31 10% 5.0% $ 1,538 Lauderhill/Lauderdale 7,827 36 9% 3.6% $ 1,056 Fort Lauderdale 7,090 48 8% 7.9% $ 1,991 Deerfield Beach 6,722 31 8% 6.4% $ 1,614 Davie 6,483 34 7% 4.6% $ 1,172 West Hollywood 5,478 30 6% 1.8% $ 1,215
Oakland Park 4,633 36 5% 8.7% $ 1,316
East Hollywood 4,421 39 5% 5.2% $ 1,430 Pompano Beach 1,925 12 2% 7.1% $ 1,289
TOTAL-Broward County: 88,932 424 100% 4.7% $ 1,444
Source: REIS, Inc.; WTL+a, updated December 2018.
Vacancy rates in the Oakland Park/Wilton Manors submarket have fluctuated over the past
12 years among both Class A and Class B/C properties:
o For Class A properties (such as The Metropolitan), vacancies ranged from a high of
19.3% at the end of the recession in 2009 to a low of 4.1% in 2010 as economic
recovery commenced. With new construction deliveries of Class A units over
the past three years, vacancies increased, to 11.7% in 2015 and 15.6% in 2017
o For Class B/C properties, vacancies have remained generally stable—ranging from a
high of 7.8% in 2008 to a low of 1.7% in 2014. In 2017, Class B/C vacancies stood
at 3.4%, reflecting stabilized market conditions
WTL +a
R e a l E s t a t e & E c o n o m i c A d v i s o r s W a s h i n g t o n , D C — P r o v i n c e t o w n , M A 2 0 2 . 8 8 5 . 9 1 2 1 3 0 1 . 5 0 2 . 4 1 7 1 7 7 4 . 5 3 8 . 6 0 7 0 51

WTL+a
Figure 6: Wilton Manors Area Multi-Family Rental Properties Map
Based on data from REIS, Inc., a national real estate database, WTL+a prepared a detailed
profile of 14 multi-family rental properties located within two miles of Wilton Manors. Key
findings are summarized below and illustrated in Table 14:
Within one mile of Five Points, there are four properties containing 688 units. This includes
three complexes in Wilton Manors—The Metropolitan, Gables Wilton Park, and Wilton
Tower. The weighted average unit size is 816 sq. ft. in these four properties with a weighted
average rent of $1,563 per month ($1.91 per sq. ft.);
With the opening of The Metropolitan (179 units) in 2016, average annual absorption
(leasing) jumped to 128 units per year. Over the past five years, annual absorption
averaged 58 units per year among these competitive properties; and
Vacancies declined from 9.5% (as The Metropolitan was leasing up) in 2017 to 2.3% in
2018. Effectively, the multi-family market within one mile of Five Points is stabilized.
WTL +a
R e a l E s t a t e & E c o n o m i c A d v i s o r s W a s h i n g t o n , D C — P r o v i n c e t o w n , M A 2 0 2 . 8 8 5 . 9 1 2 1 3 0 1 . 5 0 2 . 4 1 7 1 7 7 4 . 5 3 8 . 6 0 7 0 52

WTL+a
Table 14: Apartment Market Profile—Wilton Manors Area
Year Built Average Per Month
Project/Location Class & Monthly Unit No. of Size Asking Rent Vacancy & Absorption Analysis
(By Distance from Five Points) Height Concession Type Units (In SF) Rent Per SF Vacant Units 2018 2017 2015 2013 Within 1-Mile Metropolitan 1220 NE 24th Street Wilton Manors
2016 A
4 floors
$ 131 Studio 1 BR 2 BR 3 BR
23 44 95 16
178
627 807
1,151 1,359 1,017
$
$
1,549 1,808 2,250 2,500 2,073
$
$
2.47 2.24 1.95 1.84 2.04
4 2.2% 46
27.8% 129
100.0% -
0.0% -
River Oaks 2929 N Dixie Highway Oakland Park
1976/2013 B/C
2 floors
$ 59 1 BR 2 BR 3 BR
135 83
-218
437 645 -516
$
$
885 1,000
-929
$
$
2.03 1.55 -
1.80
- 0.0% 1
0.5% 0.2
0.6% (0.2)
0.5% -
Gables Wilton Park 513 NE 21st Court Wilton Manors
2009/2018 A
4 floors
$ 120 Studio 1 BR
1 BR/Den 2 BR
71 8 4
60 143
768 1,031 1,145 1,410 1,063
$
$
1,535 1,695 2,095 2,323 1,897
$
$
2.00 1.64 1.83 1.65 1.79
7 4.9% -
4.9% 1
5.4% (1)
4.7% -
Wilton Tower 520 NE 20th Street Wilton Manors
1975/2018 B/C
10 floors
$ 99 1 BR 2 BR 3 BR
77 71 1
149
680 881
1,225 779
$
$
1,436 1,689 1,780 1,559
$
$
2.11 1.92 1.45 2.00
5 3.4% 2
4.7% (1)
3.7% (0.4)
3.4% -
COMPARABLES ANALYSIS (Within 1-Mile):
Total/Weighted Average $ 102 688 816 $ 1,563 $ 1.91 16 2.3% 9.5% 3.2% 2.2%
Total Unit Absorption (2012-2017): 49 128 (2) -
Average Annual 58
WTL +a
R e a l E s t a t e & E c o n o m i c A d v i s o r s W a s h i n g t o n , D C — P r o v i n c e t o w n , M A 2 0 2 . 8 8 5 . 9 1 2 1 3 0 1 . 5 0 2 . 4 1 7 1 7 7 4 . 5 3 8 . 6 0 7 0 53

WTL+a
Table 14 (Continued): Apartment Market Profile—Wilton Manors Area
Year Built Average Per Month
Project/Location Class & Monthly Unit No. of Size Asking Rent Vacancy & Absorption Analysis
(By Distance from Five Points) Height Concession Type Units (In SF) Rent Per SF Vacant Units 2018 2017 2015 2013 1 to 1.5 Miles Set Point 1972/2012 231 NE 38th Street B/C Oakland Park 2 floors
$ 78 1 BR 2 BR 3 BR
187 40
-227
610 $ 910 -663 $
1,161 $ 1,556
-1,231 $
1.90 1.71 -
1.86
4 1.8% (2)
0.9% 2
1.8% 7
4.7% -
Parkcrest 1970/2015 150 NE 38th Street B/C Oakland Park 2 floors
$ 72 1 BR 2 BR 3 BR
26 102 -128
660 $ 817 -785 $
1,020 $ 1,169
-1,139 $
1.55 1.43 -
1.45
2 1.6% 1
2.0% (1)
1.4% 1
2.3% -
Fairmount & Northdale 1975 1120 NE 9th Avenue A Fort Lauderdale 3 floors
$ 86 1 BR 2 BR 3 BR
35 35
-70
750 $ 1,474
-1,112 $
1,285 $ 2,413
-1,849 $
1.71 1.64 -
1.66
3 4.3% 3
7.9% 2
11.4% 4
17.4% -
Oasis 1970/2010 3970 N Andrews Avenue B/C Fort Lauderdale 2 floors
$ 63 Studio 1 BR 2 BR
32 102
5 139
550 $ 750 950 711 $
853 $ 1,016 1,375
991 $
1.55 1.35 1.45 1.39
8 5.8% -
5.8% (4)
2.9% 4
5.6% -
Satori 2009 1201 E Sunrise Blvd. A Fort Lauderdale 9 floors
$ 109 1 BR 2 BR 3 BR
28 222 28
278
872 $ 1,215 1,501 1,209 $
1,769 $ 2,317 2,969 2,333 $
2.03 1.91 1.98 1.93
21 7.6% (11)
3.6% 3
4.6% 2
5.2% -
COMPARABLES ANALYSIS (1-1.5 Miles):
Total/Weighted Average
Total Unit Absorption (2012-2017):
Average Annual
$ 82 842 907 $ 1,593 $ 1.76 38 4.6%
(10)
3
4.0%
2
4.4%
17
7.0%
-
WTL +a
R e a l E s t a t e & E c o n o m i c A d v i s o r s W a s h i n g t o n , D C — P r o v i n c e t o w n , M A 2 0 2 . 8 8 5 . 9 1 2 1 3 0 1 . 5 0 2 . 4 1 7 1 7 7 4 . 5 3 8 . 6 0 7 0 54

WTL+a
Table 14 (Continued): Apartment Market Profile—Wilton Manors Area
Project/Location (By Distance from Five Points)
1.5 to 2 Miles Elan/Sixteen 40 1640 E Sunrise Blvd. Fort Lauderdale
Year Built Class & Height
2014 A
7 floors
Average Monthly
Concession
$ 123
Unit Type
1 BR 2 BR 3 BR
No. of Units
56 138 65
259
Size (In SF)
809 1,378 1,566 1,302
Per Month
Asking Rent Rent Per SF
$ 2,164 $ 2.67 2,606 1.89 3,102 1.98
$ 2,635 $ 2.02
Vacant Units
18
Vacancy & Absorption Analysis
2018 2017 2015
6.9% 6.2% 21.1% (2) 39 204
2013
100.0% -
Sunrise Harbor 1030 Seminole Drive Fort Lauderdale
2000/2016 A
17 floors
$ 148 1 BR 2 BR 3 BR
149 171 27
347
906 1,670 1,928 1,362
$ 2,309 $ 2.55 3,427 2.05 6,319 3.28
$ 3,178 $ 2.33
48 13.8% (18)
8.5% (4)
7.4% (5)
6.0% -
Ora Flagler Village (Ph 3) 673 NE 3rd Avenue Fort Lauderdale
2018 A
6 floors
$ 102 Studio 1 BR 2 BR
24 67 41
132
650 767
1,139 861
$ 1,747 $ 2.69 1,950 2.54 2,809 2.47
$ 2,180 $ 2.53
26 19.7% 106
100.0% -
100.0% -
100.0% -
Ora Flagler Village (Ph 1) 673 NE 3rd Avenue Fort Lauderdale
2017 A
6 floors
$ 103 Studio 1 BR 2 BR
14 40 26 80
650 747
1,139 857
$ 1,750 $ 2.69 1,950 2.61 2,800 2.46
$ 2,196 $ 2.56
22 27.5% 4
32.5% 54
100.0% -
100.0% -
Ora Flagler Village (Ph 2) 673 NE 3rd Avenue Fort Lauderdale
2017 A
6 floors
$ 102 Studio 1 BR 2 BR
14 41 25 80
650 756
1,139 857
$ 1,750 $ 2.69 1,948 2.58 2,809 2.47
$ 2,182 $ 2.55
23 28.8% 2
31.3% 55
100.0% -
100.0% -
COMPARABLES ANALYSIS (1.5-2 Miles):
Total/Weighted Average
Total Unit Absorption (2012-2017):
Average Annual
$ 116 898 1,181 $ 2,698 $ 2.28 137 15.2%
92
145
19.6%
144
14.3%
199
6.0%
-
Source: REIS, Inc.; WTL+a, November 2018.
WTL +a
R e a l E s t a t e & E c o n o m i c A d v i s o r s W a s h i n g t o n , D C — P r o v i n c e t o w n , M A 2 0 2 . 8 8 5 . 9 1 2 1 3 0 1 . 5 0 2 . 4 1 7 1 7 7 4 . 5 3 8 . 6 0 7 0 55

WTL+a
As illustrated in Table 15, according to the REIS database for Broward County, there are
eight residential projects that are either under construction, proposed, or planned within two
miles of Wilton Manors that are expected to deliver 2,225 new units at buildout:
o There are six multi-family projects expected to deliver 2,054 units when completed,
and
o Two for-sale projects with 171 units under construction in Fort Lauderdale
We note that none of these is located in Wilton Manors. Based on a list of proposed
residential projects provided by the City, there are several new residential projects in Wilton
in various stages of the planning/entitlement process. These include: Pride Center (48
affordable units), Del Mare Estates, Village at Wilton Manors and a proposed townhouse
development. No further information on these proposed projects was available.
Table 15: Proposed Rental & For-Sale Multi-family Projects
Distance No. of Completion Project Location from WM Units Type Status Date
Middle River Terrace Fort Lauderdale 1.03 32 MF Rental Planned 688 NE 14th Court
Bayview 1040 Bayview Drive
Fort Lauderdale 1.79 100 MF Rental Proposed
Quantum Flagler Village 723 N Federal Highway
Fort Lauderdale 1.86 385 MF Rental Planned
Auberge Beach-North Tower 2200 N Ocean Blvd.
Fort Lauderdale 1.95 57 For Sale Under Construction
9/2018
Auberge Beach-South Tower 2200 N Ocean Blvd.
Fort Lauderdale 1.96 114 For Sale Under Construction
12/2018
Alta Flagler Village (Ph 2) 404 NE 7th Street
Fort Lauderdale 1.96 271 MF Rental Proposed
3001 North Ocean Apts 3001 N Ocean Blvd
Oakland Park 1.98 16 MF Rental Proposed
The Galleria at Fort Lauderdale 2300 E Sunrise Blvd
Fort Lauderdale 1.99 1,250 MF Rental Planned
TOTAL: 2,225
Source: REIS, Inc.; WTL+a, November 2018.
WTL +a
R e a l E s t a t e & E c o n o m i c A d v i s o r s W a s h i n g t o n , D C — P r o v i n c e t o w n , M A 2 0 2 . 8 8 5 . 9 1 2 1 3 0 1 . 5 0 2 . 4 1 7 1 7 7 4 . 5 3 8 . 6 0 7 0 56

WTL+a
In conclusion, the Wilton Manors housing market reflects generally stabilized market
conditions—with high occupancies, increasing values, and strong achieved monthly
rents. For example, the largest residential rental project, The Metropolitan, absorbed (leased)
174 of its 179 units between 2017 and 2018 (i.e., less than two years), achieving stabilized
occupancies (with only 2.2% vacancy) and suggesting that high-quality, institutional/investment-
grade residential product will be positively received in the marketplace. In addition, several
projects are proposed that will expand the City’s housing stock, but key metrics such as project
size, approvals/entitlements, and construction/delivery dates are unknown at this time.
WTL +a
R e a l E s t a t e & E c o n o m i c A d v i s o r s W a s h i n g t o n , D C — P r o v i n c e t o w n , M A 2 0 2 . 8 8 5 . 9 1 2 1 3 0 1 . 5 0 2 . 4 1 7 1 7 7 4 . 5 3 8 . 6 0 7 0 57

WTL+a
Hotel/Lodging
Given the community’s strong interest in attracting an investment-grade hotel to Wilton Manors
to support the City’s tourism/visitor market, WTL+a/RDS LLC reviewed data on market
conditions for hotel and lodging uses in this area of Broward County based on performance data
provided by STR Global, the industry leader in hotel market data.
Performance metrics from this analysis were used to determine hotel/lodging market
potentials—either as part of a TOD-related development surrounding a proposed rail station or
as part of the potential redevelopment of identified “catalyst” sites, such as potentially a portion
of the City Hall parking lot.
In larger population centers and communities with established commercial office concentrations,
hotels can serve as an important supporting amenity to corporate and business activity
generators, for tourism destinations and for nearby residential clusters. Hotel quality levels are
generally determined by the depth and sustainability of support from available market segments.
In areas with lower spending potentials or more price-sensitive consumers (such as logistics-
related markets serving truck drivers and others), market potentials may be best met by a
limited-service property (which is defined by the hotel industry to include no on-site restaurant,
and limited other amenities such as gyms, meeting/conference/event spaces, swimming pools,
spas, etc.) as opposed to higher-priced hotel categories (such as full-service business-oriented
hotels, which include all of the above amenities) or destination resort properties oriented toward
beaches/waterfronts, golf courses, etc.
As illustrated in Table 16, Broward County contains 31,402 hotel rooms in multiple submarkets
across the County. Fort Lauderdale is the largest submarket in Broward, with 14,168 rooms, or
45% of the County total. STR Global categorizes hotel properties into the following class levels:
Economy—properties in this class include EconoLodge, Day’s Inn, Extended Stay America,
Red Roof Inn and a number of smaller, non-chain affiliated properties across Broward
County. This category comprises 20% of the County’s hotel market
Midscale—hotels in this category include Best Western, Quality Inn, Sleep Inn and Wingate
by Wyndham. This category comprises 12% of the County’s hotel market
WTL +a
R e a l E s t a t e & E c o n o m i c A d v i s o r s W a s h i n g t o n , D C — P r o v i n c e t o w n , M A 2 0 2 . 8 8 5 . 9 1 2 1 3 0 1 . 5 0 2 . 4 1 7 1 7 7 4 . 5 3 8 . 6 0 7 0 58

WTL+a
Upper Midscale—properties in this category include the Comfort Inn, Fairfield Inn, Hampton
Inn and Holiday Inn Express & Suites. This category comprises 12% of the County’s hotel
market
Upscale—properties in this class include Marriott Courtyard, Hilton Garden Inn, Hyatt Place
and Residence Inn. This category comprises 20% of the County’s hotel market
Upper Upscale—properties in this class include Hyatt Regency, Marriott, Sheraton and
Wyndham. This category comprises 24% of the County’s hotel market, and
Luxury—properties in this class include the Hyde Resort & Residences and the
Margaritaville Beach Resort in Hollywood, the Ritz Carlton and the W Hotel. This category
comprises 6% of the County’s hotel market.
To understand hotel market performance and opportunities for hotel development in Wilton
Manors, WTL+a and RDS obtained hotel performance data for nine selected properties from
STR Global, the hotel industry’s leader in tracking market performance in the lodging industry.
We note that there are no investment-grade hotels in Wilton Manors. While there are
multiple independent inns and bed and breakfast properties, none of these smaller
facilities report their performance data to STR.
Hotel occupancies are a principal source of information on both business and leisure travel
markets; measures of demand for hotel development follow general industry patterns that
identify markets to determine readiness to add more room capacity. The general investment
thresholds used in capital markets to test expansion feasibility for new hotel rooms include
Average Daily Rates (ADRs) and sustained average annual room occupancies (allowing for
seasonal changes over the year in major visitor markets.
The industry benchmark identified for construction feasibility/potential expansion is a sustained
annual occupancy level between 65% and 72%. If a market/location sustains an average
annual occupancy within these levels (or higher), that location can support additional capacity
and warrant development of new hotel rooms.
WTL +a
R e a l E s t a t e & E c o n o m i c A d v i s o r s W a s h i n g t o n , D C — P r o v i n c e t o w n , M A 2 0 2 . 8 8 5 . 9 1 2 1 3 0 1 . 5 0 2 . 4 1 7 1 7 7 4 . 5 3 8 . 6 0 7 0 59

WTL+a
Table 16: Broward County Hotel Inventory, 2018
No. of Rooms by Property Class As % of Upper Upper Total Broward
Location Economy Mid-scale Mid-scale Upscale Upscale Luxury Rooms County (1) (2) (3) (4) (5) (6)
Fort Lauderdale 2,574 1,785 1,802 1,986 4,639 1,382 14,168 45.1% Hollywood 796 555 509 311 1,721 563 4,455 14.2% Dania/Dania Beach 248 69 720 1,332 - - 2,369 7.5% Plantation 284 235 284 554 513 - 1,870 6.0% Pompano Beach 769 34 196 470 219 - 1,688 5.4% Deerfield Beach 298 358 282 393 244 12 1,587 5.1% Sunrise 289 207 - 252 - - 748 2.4% Hallandale Beach 173 - 255 257 - - 685 2.2% Coral Springs 124 225 - 110 224 - 683 2.2% Miramar - 100 122 407 - - 629 2.0% Lauderdale-by-the-Sea 84 41 438 - 26 - 589 1.9% Tamarac 267 - 313 - - - 580 1.8% Pembroke Pines - - 473 - - - 473 1.5% Weston - - 128 274 - - 402 1.3% Davie 251 - 77 - - - 328 1.0% Hillsboro Beach 24 77 - - - - 101 0.3% Coconut Creek - - 47 - - - 47 0.1%
Wilton Manors (7) - - - - - - - 0.0%
TOTAL: 6,181 3,686 5,646 6,346 7,586 1,957 31,402 100% % Dist. by Class 20% 12% 18% 20% 24% 6%
(1) Examples of economy class properties include: Days Inn; Extended Stay America; Red Roof Inn; Super 8; and Travelodge. (2) Examples of mid-scale class properties include: Best Western; LaQuinta Inn; Quality Inn; Sleep Inn & Suites and Wingate By Wyndham. (3) Examples of upper mid-scale properties include: Comfort Inn; Fairfield Inn; Hampton Inn; and Holiday Inn Express & Suites. (4) Examples of upscale properties include: Marriott Courtyard; Crowne Plaza; Doubletree; Hilton Garden Inn; Hyatt Place; and Residence Inn. (5) Examples of upper upscale properties include: Hyatt Regency; Marriott; Sheraton and Wyndham. (6) Examples of luxury properties include: Conrad Fort Lauderdale; Ritz Carlton; W Hotel; Margaritaville Beach Resort; and Hyde Resort. (7) There are no hotels in Wilton Manors tracked by STR Global. Their database excludes market performance of independent inns/bed & breakfast properties.
Source: STR Global; WTL+a, November 2018.
WTL +a
R e a l E s t a t e & E c o n o m i c A d v i s o r s W a s h i n g t o n , D C — P r o v i n c e t o w n , M A 2 0 2 . 8 8 5 . 9 1 2 1 3 0 1 . 5 0 2 . 4 1 7 1 7 7 4 . 5 3 8 . 6 0 7 0 6 0

WTL+a
Table 17 illustrates key performance metrics
among selected competitive hotel properties
identified by WTL+a and RDS. We note that
the competitive set is comprised of nine
limited-service properties located outside of
Wilton Manors on several primary commercial
arterials (such as Commercial Boulevard,
Sunrise Boulevard and North Federal
Highway) or I-95 interchanges, including:
LaQuinta Inn & Suites Rodeway Inn
Days Inn Marriott Courtyard
Ramada Inn Holiday Inn Express & Suites
Best Western Travelodge
In addition, one independent property, The Link Hotel on Sunrise Boulevard, was included in the
competitive set because of its proximity to Wilton Manors.
WTL+a and RDS note that hotels located on the beachfront were excluded from this
analysis. While visitors to Wilton Manors may, in fact, stay at hotels located on the Fort
Lauderdale beachfront, those properties’ locational advantages (i.e., amenity value of a beach
location) translate into market premiums (in the form of higher average daily rates and seasonal
occupancy patterns) that a potential lodging facility in Wilton Manors is unlikely to achieve given
its inland location. Key findings from STR Global data on these competitive properties indicate
that:
The nine properties selected for this analysis include 1,050 rooms. In terms of STR class
levels, three of these properties are Economy Class, four are Midscale, one is Upper
Midscale and one is Upscale;
Occupancy levels are strong; over the past six years, average annual occupancies
ranged from 66.6% in 2012 to a peak of 75.2% in 2015, with a six-year average of
71.8%;
WTL +a
R e a l E s t a t e & E c o n o m i c A d v i s o r s W a s h i n g t o n , D C — P r o v i n c e t o w n , M A 2 0 2 . 8 8 5 . 9 1 2 1 3 0 1 . 5 0 2 . 4 1 7 1 7 7 4 . 5 3 8 . 6 0 7 0 6 1

WTL+a
Notably, for the past three years, sustained annual occupancies for these properties
have averaged 73.5%. In 2018, occupancies through August averaged 72.9%;
Other indicators of solid market performance include Average Daily Rates (ADRs) and
Revenue per Available Room (REVPAR). In both metrics, compound annual growth has
exceeded 5% per year, which is considered very strong;
As noted previously, while there are no national-chain hotels located in Wilton Manors, the
City has a number of independent inns and bed & breakfast facilities, many of which cater to
the LGBTQ market. These include Ed Lugo Resort, Inn on the Drive, Cabanas Guesthouse
& Spa, Calypso Inn, and Manor Inn. Typically, independent operators such as these do not
report their performance characteristics to STR; therefore, key metrics such as room count,
annual occupancies, or changes in performance for any of the lodging properties in Wilton
Manors are not known.
WTL +a
R e a l E s t a t e & E c o n o m i c A d v i s o r s W a s h i n g t o n , D C — P r o v i n c e t o w n , M A 2 0 2 . 8 8 5 . 9 1 2 1 3 0 1 . 5 0 2 . 4 1 7 1 7 7 4 . 5 3 8 . 6 0 7 0 6 2

WTL+a
Table 17: Market Performance of Selected Competitive Hotel Properties, 2012—2017
2012 2013 2014 2015 Performance Characteristics
Number of Rooms 926 922 922 905 Available Room Nights (Supply) 337,990 336,766 336,530 333,076 Occupied Room Nights (Demand) 225,106 235,199 248,127 250,561
Annual Occupancy (%) 66.6% 69.8% 73.7% 75.2%
Average Daily Rate $ 76.80 $ 78.80 $ 86.32 $ 92.33 $ (2) Revenue Per Available Room $ 51.15 $ 55.03 $ 62.21 $ 69.45 $
2016
1,050 378,755 272,499
71.9%
95.37 68.62
$ $
2017
1,049 383,066 280,746
73.3%
99.31 71.69
August Change: 2012-2017
2018 Average CAGR (1)
351,031 2.54% 252,040 4.52%
72.9% 71.8% 1.93%
$ 104.39 $ 88.17 5.28% $ 76.08 $ 63.31 6.98%
Year-to-Year % Growth Annual Occupancy Average Daily Rate Revenue/Available Room
---
4.9% 2.6% 7.6%
5.6% 9.5%
13.0%
2.0% 7.0%
11.6%
(4.4%) 3.3%
(1.2%)
1.9% 4.1% 4.5%
Selected Property La Quinta Inns & Suites Fort Lauderdale NE Rodeway Inn & Suites FLL Airport & Cruise Port The Link Hotel Days Inn Fort Lauderdale Oakland Park Courtyard Fort Lauderdale East Ramada Fort Lauderdale Oakland Park Holiday Inn Express & Suites FLL North/Exec Apt Best Western Fort Lauderdale I 95 Inn Travelodge Fort Lauderdale
Rooms 162 158 145 142 106 102 100 85 50
% Dist. 15.4% 15.0% 13.8% 13.5% 10.1% 9.7% 9.5% 8.1% 4.8%
Year Open Jun 1968 Jun 1980 Jan 1966 Apr 1980 Jun 1966 Oct 1964 Jun 2010 Jan 1989 Jun 1962
TOTAL ROOMS: 1,050 100%
As % of Broward County Inventory 3.3%
Source: STR Global; RDS, LLC; WTL+a, October 2018.
WTL +a
R e a l E s t a t e & E c o n o m i c A d v i s o r s W a s h i n g t o n , D C — P r o v i n c e t o w n , M A 2 0 2 . 8 8 5 . 9 1 2 1 3 0 1 . 5 0 2 . 4 1 7 1 7 7 4 . 5 3 8 . 6 0 7 0 6 3

WTL+a
In conclusion, this analysis suggests there may be sufficient demand/investment-level
performance necessary to justify the addition of new hotel rooms in the competitive
market area. However, the ability of Wilton Manors to capture this growth will be determined
largely by validating potential demand segments—such as LGBTQ visitors to special events or
demand generated by business and corporate/office growth—and conducting detailed market
and financial feasibility studies as part of due diligence.
Workplace: Office
The market analysis includes an evaluation of “workplace” uses, including multi-
tenant/speculative office and business services sectors in both Broward County and Wilton
Manors to:
Understand the City’s overall competitive position for such uses based on data from various
commercial real estate sources, in the following key market indices: total inventory,
construction deliveries, net absorption (i.e., leasing) activity, vacant stock, vacancy rates,
and rental rates;
Inform our evaluation of redevelopment opportunities for workplace uses for TOD-related
redevelopment surrounding the proposed TRCL station based on the findings of key metrics
in this profile; and
Guide the TCRPC planning team’s testing of redevelopment scenarios to ensure that uses
such as office space will physically fit and be sufficiently marketable.
Broward County
Key findings for Broward County’s office market are summarized below and based on regional
data from Cushman & Wakefield, Inc.:
WTL +a
R e a l E s t a t e & E c o n o m i c A d v i s o r s W a s h i n g t o n , D C — P r o v i n c e t o w n , M A 2 0 2 . 8 8 5 . 9 1 2 1 3 0 1 . 5 0 2 . 4 1 7 1 7 7 4 . 5 3 8 . 6 0 7 0 6 4

WTL+a
Table 18: Office Market Profile—Broward County, 2016—2018
CBD 2016
Inventory
2017 3Q/2018 % Change 2016 %
Direct & Sublet Vacancies
2017 % 3Q/2018 % % Change
Downtown Fort Lauderdale Subtotal - CBD:
West Broward
5,295,996 5,295,996
5,372,351 5,372,351
5,267,211 5,267,211
-1% -1%
541,244 541,244
10.2% 10.2%
677,743 677,743
12.6% 12.6%
737,139 737,139
14.0% 14.0%
36% 36%
Sunrise Plantation Weston Subtotal - West:
Cypress Creek/Commercial
3,163,893 3,405,589
834,005 7,403,487
3,164,819 3,298,738
836,749 7,300,306
3,051,730 2,978,021
836,749 6,866,500
-4% -13%
0% -7%
262,204 356,740 66,129
685,073
8.3% 10.5% 7.9% 9.3%
259,986 253,847 15,001
528,834
8.2% 7.7% 1.8% 7.2%
249,581 224,484 14,238
488,303
8.2% 7.5% 1.7% 7.1%
-5% -37% -78% -29%
Cypress Creek/Commercial
Subtotal - Cypress/Commercial:
Northeast Broward
6,544,336
6,544,336
6,603,951
6,603,951
6,554,651
6,554,651
0.2%
0.2%
1,365,477
1,365,477
20.9%
20.9%
1,206,769
1,206,769
18.3%
18.3%
1,190,697
1,190,697
18.2%
18.2%
-13%
-13%
Pompano Beach Deerfield Beach Subtotal - Northeast:
784,296 1,305,829 2,090,125
798,448 1,307,349 2,105,797
704,911 1,115,875 1,820,786
-10% -15% -13%
89,448 167,734 257,182
11.4% 12.8% 12.3%
71,298 88,870
160,168
8.9% 6.8% 7.6%
133,665 59,637
193,302
19.0% 5.3%
10.6%
49% -64% -25%
Hollywood/Hallandale Hollywood/Hallandale 2,533,075 2,459,110 2,377,334 -6% 251,075 9.9% 217,432 8.8% 241,801 10.2% -4%
Southwest Broward
Pembroke Pines/Cooper City Miramar Subtotal - Southwest:
892,044 1,960,252 2,852,296
850,044 2,024,683 2,874,727
851,174 2,076,606 2,927,780
-5% 6% 3%
156,717 134,705 291,422
17.6% 6.9%
10.2%
102,825 168,193 271,018
12.1% 8.3% 9.4%
93,389 203,563 296,952
11.0% 9.8%
10.1%
-40% 51% 2%
Northwest Broward Coral Springs Tamarac/Margate Subtotal - Northwest:
1,419,494 475,748
1,895,242
1,375,481 471,167
1,846,648
1,340,346 468,349
1,808,695
-6% -2% -5%
259,962 34,902
294,864
18.3% 7.3%
15.6%
218,413 45,267
263,680
15.9% 9.6%
14.3%
178,892 45,863
224,755
13.3% 9.8%
12.4%
-31% 31%
-24%
TOTAL:
Annual Change:
28,614,557 28,562,890 27,622,957 -3.5% 3,686,337 12.9% 3,325,644
(360,693)
11.6% 3,372,949
47,305
12.2% -9%
Source: Cushman & Wakefield of Florida, Inc.; WTL+a, November 2018.
WTL +a
R e a l E s t a t e & E c o n o m i c A d v i s o r s W a s h i n g t o n , D C — P r o v i n c e t o w n , M A 2 0 2 . 8 8 5 . 9 1 2 1 3 0 1 . 5 0 2 . 4 1 7 1 7 7 4 . 5 3 8 . 6 0 7 0 6 5

WTL+a
Table 18 (Continued): Office Market Profile—Broward County, 2016—2018
Years to 93% Average Asking Rents Net Absorption Stabilized Per SF (All Classes) % Change:
2016 2017 2018 Total Annual Occupancy 2016 2017 2018 2016-2018 CBD Downtown Fort Lauderdale 121,764 (101,337) (48,612) (28,185) (9,395) N/A $ 38.35 $ 40.96 $ 42.30 10% Subtotal - CBD: 121,764 (101,337) (48,612) (28,185) (9,395) N/A $ 38.35 $ 40.96 $ 42.30 10%
West Broward Sunrise 49,025 (19,641) 34,869 64,253 21,418 10.8 $ 28.78 $ 29.87 $ 29.64 3% Plantation 54,241 83,400 (6,240) 131,401 43,800 4.8 25.03 25.09 29.74 19% Weston 32,310 788 (337) 32,761 10,920 1.2 30.60 32.11 34.62 13% Subtotal - West: 135,576 64,547 28,292 228,415 76,138 6.0 $ 27.00 $ 27.64 $ 29.83 10%
Cypress Creek/Commercial Cypress Creek/Commercial 149,464 193,626 21,548 364,638 121,546 9.1 $ 23.10 $ 24.66 $ 25.43 10% Subtotal - Cypress/Commercial: 149,464 193,626 21,548 364,638 121,546 9.1 $ 23.10 $ 24.66 $ 25.43 10%
Northeast Broward Pompano Beach Deerfield Beach
36,453 34,342
10,922 39,186
(23,671) 60,273
23,704 133,801
7,901 44,600
15.7 1.2
$ 17.60 23.82
$ 21.90 25.96
$ 23.07 25.95
31% 9%
Subtotal - Northeast: 70,795 50,108 36,602 157,505 52,502 3.4 $ 21.94 $ 24.16 $ 23.96 9%
Hollywood/Hallandale Hollywood/Hallandale 33,710 11,790 (7,324) 38,176 12,725 17.7 $ 29.43 $ 30.80 $ 29.30 -0.4%
Southwest Broward Pembroke Pines/Cooper City Miramar Subtotal - Southwest:
89,582 63,932
153,514
45,798 9,585
55,383
294 5,108 5,402
135,674 78,625
214,299
67,837 39,313
107,150
1.3 4.8 2.6
$
$
29.30 28.41 26.44
$
$
31.97 27.87 29.42
$
$
33.75 34.15 34.02
15% 20% 29%
Northwest Broward Coral Springs Tamarac/Margate Subtotal - Northwest:
53,154 13,964 67,118
11,527 (11,515)
12
(17,707) (3,886)
(21,593)
46,974 (1,437) 45,537
23,487 (719)
22,769
7.1 N/A 9.2
$
$
25.12 14.94 23.91
$
$
26.17 18.90 24.92
$
$
27.92 16.82 25.65
11% 13% 7%
TOTAL: 731,941 274,129 14,315 1,020,385 340,128 9.2 $ 26.92 $ 29.24 $ 30.72 14%
Annual Change:
Source: Cushman & Wakefield of Florida, Inc.; WTL+a, November 2018.
WTL +a
R e a l E s t a t e & E c o n o m i c A d v i s o r s W a s h i n g t o n , D C — P r o v i n c e t o w n , M A 2 0 2 . 8 8 5 . 9 1 2 1 3 0 1 . 5 0 2 . 4 1 7 1 7 7 4 . 5 3 8 . 6 0 7 0 6 6

WTL+a
As illustrated in Table 18, Broward County contains 27.6 million sq. ft. of office space
distributed across the Central Business District (downtown Fort Lauderdale) and 11
suburban submarkets/locations. Countywide, there are more than 3.37 million sq. ft. of
vacant office space (including direct vacancies and sublet space), which reflects a year-
end 2018 vacancy rate of 12.2%. Vacancies increased from the 11.6% recorded at year-
end 2017;
Multiple factors have combined to strengthen overall leasing activity, including recovery from
the 2007—2009 recession, net new job growth in office-using sectors and new or expanded
businesses throughout the County. In fact, net absorption totaled 1,020,385 sq. ft.
countywide over the past three years. If this annual pace of 340,100 sq. ft. can be
sustained, it would require approximately 9.2 years to reduce the County’s vacant office
space to stabilized levels in the range of 7% vacancy (i.e., the real estate industry considers
stabilized occupancies for office buildings to be in the range of 93% to 95%). Based on
absorption trends, the County’s office market weakened significantly in 2018—with
only 14,300 sq. ft. of net absorption for the entire year. This compares to almost
732,000 sq. ft. in 2016 and 274,100 sq. ft. of net absorption in 2017;
Despite declining absorption, rents continued to increase. In fact, average asking rents
increased by 14% between 2016 and 2018—from $26.92 per sq. ft. in 2016 to $30.72 per
sq. ft. at year-end 2018; and
WTL +a
R e a l E s t a t e & E c o n o m i c A d v i s o r s W a s h i n g t o n , D C — P r o v i n c e t o w n , M A 2 0 2 . 8 8 5 . 9 1 2 1 3 0 1 . 5 0 2 . 4 1 7 1 7 7 4 . 5 3 8 . 6 0 7 0 6 7

WTL+a
The strength of the County’s suburban office market remains focused in several locations—
the Cypress Creek/Commercial Boulevard corridor, West Broward (Sunrise and Plantation)
and, to a lesser extent, in Southwest Broward (Pembroke Pines and Miramar). These
submarkets accounted for fully 90% of all countywide net absorption over the past three
years (averaging 304,800 sq. ft. per year).
Wilton Manors (Within 1-Mile of Five Points)
WTL+a conducted a more detailed analysis of office market trends in and near Wilton Manors
based on data from LoopNet (owned by CoStar, Inc., a national real estate database) and the
Broward County Property Appraiser. Data are illustrated in Table 19 and Table 20 and
summarized below:
Within one-mile of Five Points, there are almost 198,800 gross sq. ft. of office space in 22
buildings. Of this total, almost 183,500 gross sq. ft. of office space is located in Wilton
Manors in 21 buildings. Wilton Manors comprises only 0.66% of Broward County’s 27.6
million sq. ft. of office space, and is considered a tertiary office submarket;
The City’s 21 office buildings average only 8,736 sq. ft. in size—far below the typical
speculative/multi-tenant suburban office building. The largest buildings include: Moss
Construction at 2101 N. Andrews Avenue (43,900 sq. ft.), Wilton Plaza (31,225 sq. ft.) and
Manor Square (16,560 sq. ft.);
Due to incomplete market data, overall vacancy rates are available for only several
buildings. As a result, there is no accurate measurement of current or recent office
vacancies;
Similarly, incomplete market data on net absorption (leasing) precludes an accurate analysis
of the overall health of the Wilton Manors office market. In fact, absorption statistics were
available for only two of the City’s 21 office buildings. For these two buildings, net
absorption totaled only 862 sq. ft., or 172 sq. ft. per year between 2013 and 2018;
Limited Market Data Preclude an Accurate
Analysis of Wilton Manors’ Office Market
WTL +a
R e a l E s t a t e & E c o n o m i c A d v i s o r s W a s h i n g t o n , D C — P r o v i n c e t o w n , M A 2 0 2 . 8 8 5 . 9 1 2 1 3 0 1 . 5 0 2 . 4 1 7 1 7 7 4 . 5 3 8 . 6 0 7 0 6 8
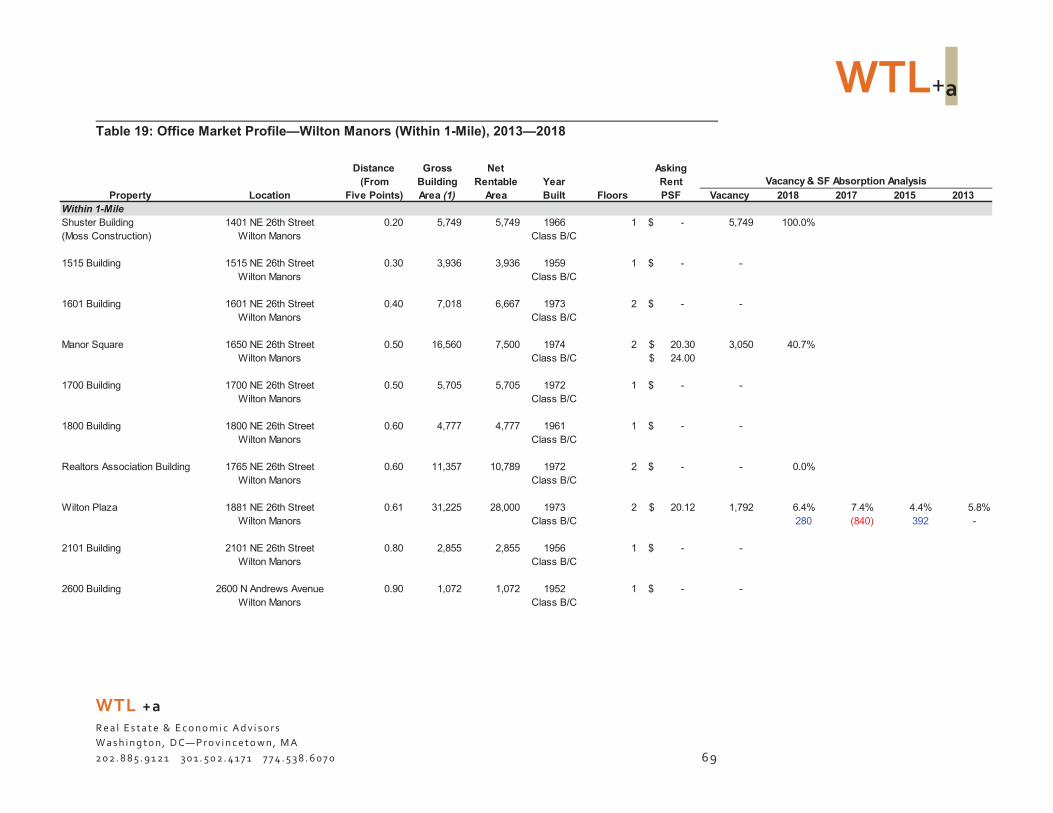
WTL+a
Table 19: Office Market Profile—Wilton Manors (Within 1-Mile), 2013—2018
Property Within 1-Mile Shuster Building (Moss Construction)
Location
1401 NE 26th Street Wilton Manors
Distance (From
Five Points)
0.20
Gross Building Area (1)
5,749
Net Rentable
Area
5,749
Year Built
1966 Class B/C
Floors
1
Asking Rent PSF
$ -
Vacancy
5,749
Vacancy & SF Absorption Analysis
2018 2017 2015
100.0%
2013
1515 Building 1515 NE 26th Street Wilton Manors
0.30 3,936 3,936 1959 Class B/C
1 $ - -
1601 Building 1601 NE 26th Street Wilton Manors
0.40 7,018 6,667 1973 Class B/C
2 $ - -
Manor Square 1650 NE 26th Street Wilton Manors
0.50 16,560 7,500 1974 Class B/C
2 $ 20.30 $ 24.00
3,050 40.7%
1700 Building 1700 NE 26th Street Wilton Manors
0.50 5,705 5,705 1972 Class B/C
1 $ - -
1800 Building 1800 NE 26th Street Wilton Manors
0.60 4,777 4,777 1961 Class B/C
1 $ - -
Realtors Association Building 1765 NE 26th Street Wilton Manors
0.60 11,357 10,789 1972 Class B/C
2 $ - - 0.0%
Wilton Plaza 1881 NE 26th Street Wilton Manors
0.61 31,225 28,000 1973 Class B/C
2 $ 20.12 1,792 6.4% 280
7.4% (840)
4.4% 392
5.8% -
2101 Building 2101 NE 26th Street Wilton Manors
0.80 2,855 2,855 1956 Class B/C
1 $ - -
2600 Building 2600 N Andrews Avenue Wilton Manors
0.90 1,072 1,072 1952 Class B/C
1 $ - -
WTL +a
R e a l E s t a t e & E c o n o m i c A d v i s o r s W a s h i n g t o n , D C — P r o v i n c e t o w n , M A 2 0 2 . 8 8 5 . 9 1 2 1 3 0 1 . 5 0 2 . 4 1 7 1 7 7 4 . 5 3 8 . 6 0 7 0 6 9

WTL+a
Table 19 (Cont.): Office Market Profile—Wilton Manors (Within 1-Mile), 2013—2018
Distance Gross Net Asking (From Building Rentable Year Rent Vacancy & SF Absorption Analysis
Property Location Five Points) Area (1) Area Built Floors PSF Vacancy 2018 2017 2015 2013 Within 1-Mile Park Plaza 120 E Oakland Park Blvd
Wilton Manors 0.95 11,557 10,880 1975/2011
Class B/C 2 $ 15.86 685 6.3%
1,008 9.9% 141
11.2% (120)
10.1% -
Middle River Office Building 2500 N Federal Highway Fort Lauderdale
0.95 15,326 15,000 1972 Class B/C
3 $ 29.44 - 0.0% -
0.0% -
0.0% -
0.0% -
2650 Building 2650 N Andrews Avenue Wilton Manors
1.00 1,493 1,493 1953 Class B/C
1 $ - -
2630 Building 2630 N Andrews Avenue Wilton Manors
1.00 1,805 1,805 1953 Class B/C
1 $ - -
2620 Building 2620 N Andrews Avenue Wilton Manors
1.00 2,301 2,301 1981 Class B/C
1 $ - -
2480 Building 2480 N Andrews Avenue Wilton Manors
1.00 2,480 2,480 1969 Class B/C
2 $ - -
2307 Building 2307 N Andrews Avenue Wilton Manors
1.10 8,353 7,935 1966 Class B/C
1 $ - -
2303 Building 2303 N Andrews Avenue Wilton Manors
1.10 4,550 4,550 1978 Class B/C
1 $ - -
2800 Building 2800 N Andrews Avenue Wilton Manors
1.10 6,649 6,317 1974 Class B/C
1 $ - -
2850 Building 2850 N Andrews Avenue Wilton Manors
1.20 9,010 8,560 1987 Class B/C
1 $ - -
2010 Building 2010 N Andrews Avenue Wilton Manors
1.30 1,108 1,108 1978 Class B/C
2 $ - -
2101 Building (Moss Construction)
2101 N Andrews Avenue Wilton Manors
1.30 43,902 39,512 1975 Class B/C
4 $ - - 0.0%
Subtotal (Within 1-Mile): 198,788 178,990 $ 21.94 11,276
Building Efficiency Factor
Total Net Absorption (Past 5 Years):
Average Annual (In SF):
183,462
0.66%
163,990
862
172
90%
1,288 (699) 272 -
WTL +a
R e a l E s t a t e & E c o n o m i c A d v i s o r s W a s h i n g t o n , D C — P r o v i n c e t o w n , M A 2 0 2 . 8 8 5 . 9 1 2 1 3 0 1 . 5 0 2 . 4 1 7 1 7 7 4 . 5 3 8 . 6 0 7 0 7 0
6.3% 1.8% 1.4% 1.5%

WTL+a
Table 20: Office Market Characteristics—Wilton Manors (1- to 2-Miles), 2013—2018
Distance Gross Net Asking (From Building Rentable Year Rent Vacancy & SF Absorption Analysis
Property Location Five Points) Area (1) Area Built Floors PSF Vacancy 2018 2017 2015 2013 1- to 2-Miles The Kennan Building 3101 N Federal Highway 1.08 74,442 72,000 1968 8 $ 27.31 - 0.0% 2.1% 15.6% 14.0%
Fort Lauderdale Class B/C 1,512 9,720 (1,152) -
Eldorado Office Building 3170 N Federal Highway 1.12 33,378 30,000 1972 2 $ 22.25 7,920 26.4% 29.4% 30.1% 30.7% Lighthouse Point Class B/C 900 210 180 -
Bank of America Building 3600 N Federal Highway 1.23 26,998 11,686 1969 3 $ 27.26 2,139 18.3% 16.8% 13.9% 11.6% Fort Lauderdale Class B/C (175) (339) (269) -
Coral Ridge Office Center 3696 N Federal Highway 1.24 37,158 33,104 1989 3 $ 14.50 1,622 4.9% 3.7% 7.8% 9.7% Aventura Class B/C (397) 1,357 629 -
Centennial Bank Building 2601 E Oakland Park Blvd 1.29 64,727 56,444 1969 6 $ 26.50 9,934 17.6% 25.3% 25.8% 36.4% Fort Lauderdale Class B/C 4,346 282 5,983 -
Oak Bay Building 2631 E Oakland Park Blvd 1.31 16,046 15,250 1968 2 $ 18.41 5,231 34.3% 32.6% 20.0% 20.2% Fort Lauderdale Class B/C (259) (1,922) 31 -
2691 Building 2691 E Oakland Park Blvd 1.40 43,424 28,860 1972 4 $ 20.64 7,677 26.6% 41.3% 39.2% 30.0% Fort Lauderdale Class B/C 4,242 (606) (2,655) -
2727 Building 2727 E Oakland Park Blvd 1.44 19,668 15,567 1974 3 $ 22.50 6,024 38.7% 29.5% 39.3% 42.2% Fort Lauderdale Class B/C (1,432) 1,526 451 -
WTL +a
R e a l E s t a t e & E c o n o m i c A d v i s o r s W a s h i n g t o n , D C — P r o v i n c e t o w n , M A 2 0 2 . 8 8 5 . 9 1 2 1 3 0 1 . 5 0 2 . 4 1 7 1 7 7 4 . 5 3 8 . 6 0 7 0 7 1

WTL+a
Table 20 (Cont.): Office Market Profile—Wilton Manors (1- to 2-Miles), 2013—2018
Distance Gross Net Asking (From Building Rentable Year Rent Vacancy & SF Absorption Analysis
Property Location Five Points) Area (1) Area Built Floors PSF Vacancy 2018 2017 2015 2013 1- to 2-Miles (Continued) 2740 Building 2740 E Oakland Park Blvd 1.46 21,745 18,826 1969 3 $ 19.50 4,405 23.4% 19.1% 25.3% 29.4%
Fort Lauderdale Class B/C (810) 1,167 772 -
Anderson East 2755 E Oakland Park Blvd 1.51 20,961 15,005 1973 3 $ 37.25 4,156 27.7% 33.6% 28.1% 32.3% Fort Lauderdale Class B/C 885 (825) 630 -
Financial West 2787 E Oakland Park Blvd 1.52 27,284 25,998 1968 4 $ 30.02 2,834 10.9% 9.8% 7.8% 5.7% Fort Lauderdale Class B/C (286) (520) (546) -
Keyes Building 1520 E Sunrise Blvd 1.55 13,580 12,728 1980 2 $ 15.04 - 0.0% 11.8% 13.7% 21.5% Fort Lauderdale Class B/C 1,502 242 993 -
Oakland Commerce Center 3115 NW 10th Terrace 1.65 45,954 22,480 1984 1 $ 16.83 3,844 17.1% 16.7% 20.9% 22.2% Fort Lauderdale Class B/C (90) 944 292 -
Intracoastal Building 3000 NE 30th Place 1.67 41,192 47,000 1973 5 $ 16.41 7,191 15.3% 14.4% 20.7% 17.5% Fort Lauderdale Class B/C (423) 2,961 (1,504) -
Galleria Professional Building 915 Middle River Drive 1.80 52,844 48,600 1957 6 $ 27.94 4,180 8.6% 6.9% 6.1% 9.7% Fort Lauderdale estimate Class B/C (826) (389) 1,750 -
WTL +a
R e a l E s t a t e & E c o n o m i c A d v i s o r s W a s h i n g t o n , D C — P r o v i n c e t o w n , M A 2 0 2 . 8 8 5 . 9 1 2 1 3 0 1 . 5 0 2 . 4 1 7 1 7 7 4 . 5 3 8 . 6 0 7 0 7 2

WTL+a
Table 20 (Cont.): Office Market Profile—Wilton Manors (1- to 2-Miles), 2013—2018
Distance Gross Net Asking (From Building Rentable Year Rent Vacancy & SF Absorption Analysis
Property Location Five Points) Area (1) Area Built Floors PSF Vacancy 2018 2017 2015 2013 1- to 2-Miles (Continued) Galleria Corporate Center 2455 E Sunrise Blvd (Office Condominium Units) Fort Lauderdale
1919 Building (3) 1915-19-25 NE 45th Street Fort Lauderdale
Subtotal (1-2 Miles):
Building Efficiency Factor
Total Net Absorption (Past 5 Years):
Average Annual (In SF):
1.82
1.86
145,000
38,089
722,490
145,000
35,000
633,548
88%
24,391
4,878
1970 Class B/C
1973 Class B/C
13
2
$
$
$
25.50
15.32
23.35
20,010
945
82,087
13.8% (17,400)
2.7% -
13.0%
(8,711)
1.8% 9,570
2.7% 175
12.5%
23,554
8.4% 3,683
3.2% 280
16.3%
9,548
10.9% -
4.0% -
17.8%
-
SUMMARY:
Total Net Absorption (Past 5 Years):
Average Annual (In SF):
921,278 812,538
25,253
5,051
93,364 11.5%
(7,423)
10.2%
22,855
13.0%
9,820
14.2%
-
(1) Gross building data from Broward County Property Appraiser.
Source: REIS, Inc.; Broward County Property Appraiser; WTL+a December 2018.
WTL +a
R e a l E s t a t e & E c o n o m i c A d v i s o r s W a s h i n g t o n , D C — P r o v i n c e t o w n , M A 2 0 2 . 8 8 5 . 9 1 2 1 3 0 1 . 5 0 2 . 4 1 7 1 7 7 4 . 5 3 8 . 6 0 7 0 7 3

WTL+a
Surrounding Wilton Manors (1- to 2-Miles of Five Points)
Between one and two miles of Five Points, the office inventory is significantly larger,
reflecting the number of office buildings located along commercial corridors such as North
Federal Highway, Sunrise Boulevard and Oakland Park Boulevard. Within this geography,
there are almost 722,500 gross sq. ft. of office space in 17 buildings, comprising a 2.6%
share of Broward County’s office inventory;
These 17 office buildings average 42,500 sq. ft. in size—still below the typical
speculative/multi-tenant suburban office building. The largest buildings include: Galleria
Corporate Center on E. Sunrise Boulevard (145,000 sq. ft.), 3101 N. Federal Highway
(74,400 sq. ft.) and Centennial Bank Building on E. Oakland Park Boulevard (64,700 sq. ft.);
WTL +a
R e a l E s t a t e & E c o n o m i c A d v i s o r s W a s h i n g t o n , D C — P r o v i n c e t o w n , M A 2 0 2 . 8 8 5 . 9 1 2 1 3 0 1 . 5 0 2 . 4 1 7 1 7 7 4 . 5 3 8 . 6 0 7 0 7 4

WTL+a
Market data for the larger area suggests that more than 82,000 sq. ft. of office space is
vacant, which translates into a current vacancy rate of 13%. Vacancy rates have fluctuated
over the past five years between 12.5% in 2017 and 17.8% in 2013. Current asking rents
average $23.35 per sq. ft.;
Market data for the larger area suggests net absorption (leasing) totaled almost 24,400 sq.
ft., or 4,870 sq. ft. per year between 2013 and 2018. At this pace, it would require more
than 15 years to absorb/lease 93% of the existing 82,000 sq. ft. of vacant space to stabilized
levels (i.e., 93% occupancy); and
Only one office building is under construction within two miles of Wilton Manors. “Beach
Hallandale” is a 70,000 sq. ft., Class A speculative/multi-tenant building under construction
at 4790 NE 4th Avenue in Hallandale
Beach, approximately 1.83 miles from Five
Points. It is expected to be completed in
2019.
In conclusion, the office market in (and
surrounding) Wilton Manors is a tertiary
market comprising generally smaller
buildings oriented to professional services
tenancies. The area’s largest office
buildings are located on commercial
corridors such as N. Federal Highway and Sunrise Boulevard, which provide strong visibility,
traffic counts and frontage critical to an office building’s overall marketability. Limited market
data on key performance metrics—such as vacancy rates and net absorption—preclude
a detailed analysis of the City’s office market. However, market performance among office
buildings located on primary arterials in the surrounding area suggest generally soft market
conditions, with higher vacancy rates and limited/nominal annual net absorption. These
conditions suggest that market opportunities for new (investment-grade) speculative/multi-
tenant office development are limited.
WTL +a
R e a l E s t a t e & E c o n o m i c A d v i s o r s W a s h i n g t o n , D C — P r o v i n c e t o w n , M A 2 0 2 . 8 8 5 . 9 1 2 1 3 0 1 . 5 0 2 . 4 1 7 1 7 7 4 . 5 3 8 . 6 0 7 0 7 5

WTL+a
General Retail
Existing retail uses in Wilton Manors represent a disproportionate amount of the city’s
commercial space as compared to similarly-sized communities. This is due, in part, to Wilton’s
lower building scale, proximity to Fort Lauderdale and this part of south Florida’s coastal
development, and the evolution of Wilton Manors into a destination for LGBTQ residents and
visitors. There is significantly more retail space in the city than the resident population
alone would support. Incremental support for the city’s retail inventory appears to be largely
attributable to the visitor market to Wilton Manors. As detailed below, there is also a high
vacancy rate in the existing retail inventory.
Although the resident population of Wilton Manors is relatively small (between 12,500 and
12,800), a substantial amount of retail/commercial space is located within its boundaries. Retail
and consumer commercial properties and uses are primarily clustered along Wilton Drive, NE
26th Street, and N. Andrews Avenue, with other commercial/retail space in the portion of Dixie
Highway that passes through the city.
This character is a combination of auto-oriented, low-scale freestanding pad structures along
major corridors such as N. Andrews Avenue, and the more pedestrian-related sections of Wilton
Road and Dixie Highway. In order to understand both the amount of retail supply in the city as
well as the mix of retail categories and vacancies, a “windshield” inventory was completed to
benchmark existing conditions and recommend future changes. The inventory also serves as
the basis for several recommended implementation policies and strategies of the plan.
The inventory of existing retail spaces is organized by category, percentage of total occupied
space and vacant space, as illustrated in Table 21. Retail categories are defined in the nine
categories described below:
Specialty Retail: Men’s, women’s and children’s apparel; shoes and accessories; jewelry;
gifts and housewares; furniture and furnishings; sports equipment and apparel; art studios
and galleries; antique/collectibles stores; used clothing and thrift shops;
Food & Beverage: Sit-down and carry-out foods; fast food restaurants; prepared foods;
bakeries; produce shops; butcher shops and fresh fish stores; candy, bakeries and ice
cream; coffee shops; bars and taverns’ wine shops; and specialty food stores (e.g.,
cheeses, olive oils, etc.);
WTL +a
R e a l E s t a t e & E c o n o m i c A d v i s o r s W a s h i n g t o n , D C — P r o v i n c e t o w n , M A 2 0 2 . 8 8 5 . 9 1 2 1 3 0 1 . 5 0 2 . 4 1 7 1 7 7 4 . 5 3 8 . 6 0 7 0 7 6

WTL+a
Consumer Services: Dry cleaning; tailoring/alternations shops; laundries/laundromats;
newsstands; pharmacies and drug stores; nail salons; hair care/barber shops; pet grooming;
professional photographers; martial arts; convenience stores (not including those located at
gas stations); security services; yoga studios; skin care; exercise studios; repair services;
delivery services (UPS, FedEx); tattoo parlors; custom product service businesses such as
house cleaning, maintenance, lawn and pool maintenance services; and pawn shops;
Grocery Stores: Full-service grocery stores (e.g., Publix Grocery store at Dixie Highway
and NE 26th Street);
Finance, Insurance, Real Estate (FIRE): Banks; ATMs; credit unions; financial services;
insurance offices and brokers; real estate sales and leasing; property brokers; and savings
institutions;
Professional Offices/Institutional Uses: Dentists; attorneys; accounting and tax services;
physicians; and non-profit organizations and public service organizations such as SAGE
Senior Action or Latinos Salud;
Automotive Uses: Gas stations; auto parts sales; automotive repair services; used car
sales; transmission and brake services, etc.;
Events, Recreation & Sports: Gyms; personal trainers; bowling alleys; cinemas; gated
performance/entertainment destinations like The Venue; night clubs focused on
entertainment; and
Vacant: Unoccupied; unleased; for sale; or empty ground-floor commercial space (not
located in office building lobbies, residential lobbies, parking access, etc.).
As illustrated in Table 21, the inventory identified just over 950,000 sq. ft. of retail/commercial
space in Wilton Manors, or 74 sq. ft. of retail space per resident. This is a remarkable
amount of retail space per capita, particularly without any major shopping malls within the city’s
boundaries. By comparison, the U.S. average is approximately 26 sq. ft. per capita. It also
indicates that there could be too much retail space in Wilton Manors today, as indicated in
the large amount of vacant retail space.
WTL +a
R e a l E s t a t e & E c o n o m i c A d v i s o r s W a s h i n g t o n , D C — P r o v i n c e t o w n , M A 2 0 2 . 8 8 5 . 9 1 2 1 3 0 1 . 5 0 2 . 4 1 7 1 7 7 4 . 5 3 8 . 6 0 7 0 7 7

WTL+a
Table 21: Wilton Manors Retail Inventory
Retail Category No. of % of Total SF by % of Ranked by SF Businesses Total Category Total
Vacant Space 55 19% 231,354 24%
Consumer Services 78 27% 196,213 21%
Food & Beverage 63 22% 131,164 14%
General & Specialty Retail 38 13% 116,316 12%
Professional Services/Institutional Offices 23 8% 96,641 10%
Automotive Sales & Services 11 4% 64,561 7%
Events, Recreation & Sports 6 2% 50,801 5%
Grocery Stores 3 1.0% 38,436 4%
Finance, Insurance & Real Estate (FIRE) 13 4% 24,560 3%
TOTAL: 290 100% 950,045 100%
Population (4/1/18 State Estimate) 12,831
Retail Space Per Capita 74
Source: Broward County Property Appraiser; RDS LLC; WTL+a, December 2018.
While it is recognized that a major portion of the sales supporting this amount of retail inventory
may be attributable to the city’s extensive visitor market, it should also be noted that, at the time
of the inventory, there were 55 vacant retail spaces in Wilton Manors totaling almost
231,400 sq. ft. of vacant space, or fully 24% of the city’s total retail/commercial supply.
This is considerably higher than the amount of vacant space found in more reasonably balanced
markets.
The real estate industry considers a normal ‘stabilized’ retail market to contain a vacancy
rate of 5% to 7%. A healthy real estate market always contains some vacant properties due to
new construction, space available for lease or for sale, business relocations or closures, or the
WTL +a
R e a l E s t a t e & E c o n o m i c A d v i s o r s W a s h i n g t o n , D C — P r o v i n c e t o w n , M A 2 0 2 . 8 8 5 . 9 1 2 1 3 0 1 . 5 0 2 . 4 1 7 1 7 7 4 . 5 3 8 . 6 0 7 0 7 8

WTL+a
existence of older building/space formats that are considered functionally or physically obsolete.
But when fully one-quarter of a city’s retail space is vacant, as in Wilton Manors that is
considered far more challenging. Other key findings of our retail inventory indicate:
We note the presence of Old Florida Seafood, a former shopping center, and the former
Piggly Wiggly grocery store located at Shoppes at Wilton, were almost completely vacant at
the time of the inventory; both sites may be redeveloped at some point, but current
conditions account for a high proportion of total vacant space in Wilton Manors;
Other blocks of vacant space are located in more recently developed mixed-use residential
projects in Wilton Manors, in which the ground-level floorplates of mid-rise condominium
towers are scaled by the dimensions of the residential units above, and can be both more
difficult to lease and less attractive to prospective tenants; and
To put the Wilton Manors retail space supply total into perspective, the 2018 U.S. estimate
of total retail space is approximately 26 sq. ft. per capita, or only about one-third of the per
capita estimate in Wilton Manors. Even at 26 sq. ft. per capita, the U.S. average is one of
the highest in the world; by comparison, average retail supply per resident in developed
European countries is about 2.6 sq. ft., or only 3.5% of the per capita estimate in Wilton
Manors.
The amount of vacant retail space in Wilton Manors at the time of the inventory is a
significant concern. Having approximately 25% of its retail supply vacant suggests a
potentially significant over-supply of space. However, we also note that there are mitigating
conditions that may explain part of the high vacancy:
A number of the commercial spaces are in single-story structures that are awkwardly
positioned, too deep for modern retail practices, or are in poor condition;
Wilton Manors’ resident consumer market is relatively small, and will require inflow from
surrounding residents to thrive; while visitor markets may account for a large share of
consumer retail spending, the categories on which visitors spend are limited—particularly for
specialty apparel, consumer services, etc. Most visitor spending will be on food & beverage
and entertainment, which is typical of vacation destinations;
WTL +a
R e a l E s t a t e & E c o n o m i c A d v i s o r s W a s h i n g t o n , D C — P r o v i n c e t o w n , M A 2 0 2 . 8 8 5 . 9 1 2 1 3 0 1 . 5 0 2 . 4 1 7 1 7 7 4 . 5 3 8 . 6 0 7 0 7 9

WTL+a
The secondary retail area along Dixie Highway south of NE 26th Street is mostly comprised
of industrial and commercial buildings not designed for retail use, although a number of
spaces have been converted. A number of these spaces are vacant;
Many of the newer spaces (typically on the ground floors of mixed-use residential buildings)
are configured based on the structural grid that is appropriate for residential units, but they
are too shallow for conventional retail; and
The length and width of Wilton Drive is not conducive to easy pedestrian movement from
one side of the street to the other, weakening the dynamic of a contiguous pedestrian-
oriented retail experience. It is anticipated that the planned “complete streets” roadway
improvements along this part of Wilton Drive (which had commenced at the time of the
inventory) will help to mitigate these adverse conditions.
In conclusion, these characteristics are, to varying degrees, manageable if the right retail
incentive programs are possible. Specific strategies to address the city’s high retail vacancy
rates and the conditions that have caused them are identified in Section 5 of this report.
WTL +a
R e a l E s t a t e & E c o n o m i c A d v i s o r s W a s h i n g t o n , D C — P r o v i n c e t o w n , M A 2 0 2 . 8 8 5 . 9 1 2 1 3 0 1 . 5 0 2 . 4 1 7 1 7 7 4 . 5 3 8 . 6 0 7 0 8 0

WTL+a
4Market Potentials
This section of the report details our analysis of real estate market potentials for four key land
uses based on the demographic profile in Section 2 and evaluation of real estate market
conditions in Section 3. It also compares the development scenarios prepared by the planning
team against overall market potentials to understand the “required” capture of market support
each use would need to achieve as part of transit-oriented (or transit-supportive) development
surrounding the proposed TRCL station area in Wilton Manors.
As presented in detail below, the market analysis focused on four core uses: housing,
workplace/office, retail and hotel/lodging.
Potential TOD Station Area Concepts
As illustrated in the concept images below, the overarching objective of the master plan is to
allow infill redevelopment to occur over time, including those blocks that surround a future
potential rail station as well as catalyst sites in key locations, such as the City Hall site, to spur
further economic investment in the City, such as Wilton Drive and the Five Points intersection.
Figure 7: Potential Catalyst & TOD Site Concepts—Five Points
WTL +a
R e a l E s t a t e & E c o n o m i c A d v i s o r s W a s h i n g t o n , D C — P r o v i n c e t o w n , M A 2 0 2 . 8 8 5 . 9 1 2 1 3 0 1 . 5 0 2 . 4 1 7 1 7 7 4 . 5 3 8 . 6 0 7 0 81
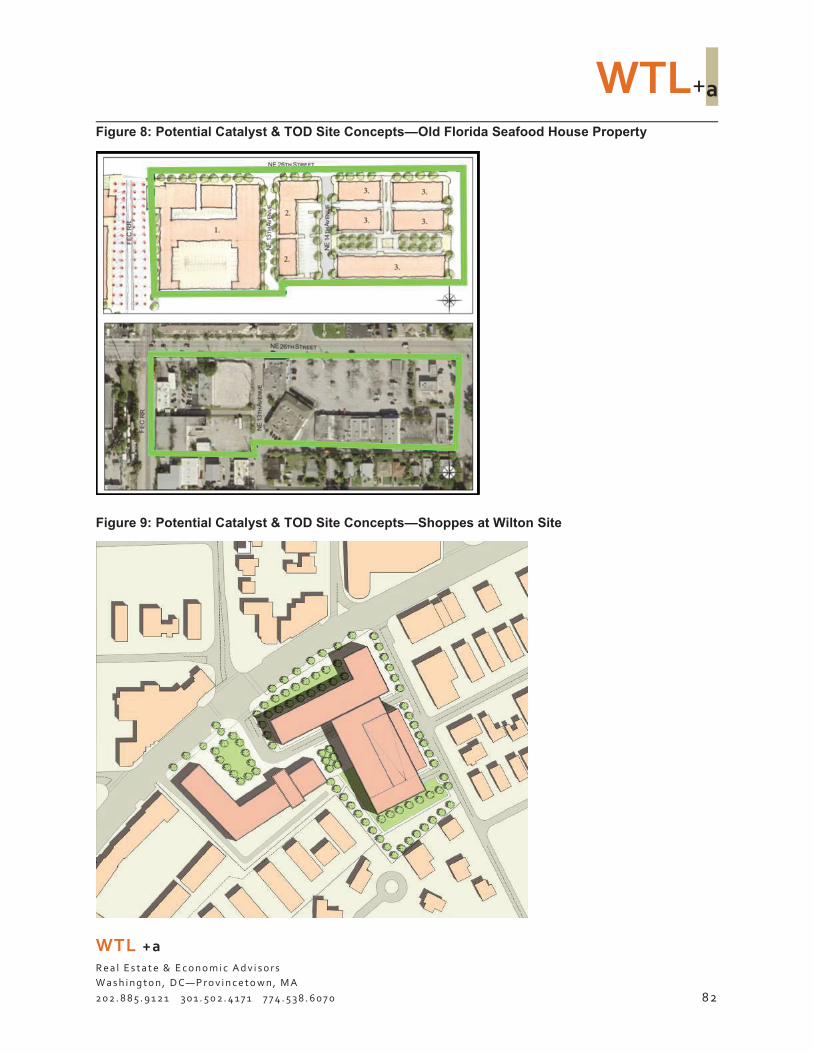
WTL+a
Figure 8: Potential Catalyst & TOD Site Concepts—Old Florida Seafood House Property
Figure 9: Potential Catalyst & TOD Site Concepts—Shoppes at Wilton Site
WTL +a
R e a l E s t a t e & E c o n o m i c A d v i s o r s W a s h i n g t o n , D C — P r o v i n c e t o w n , M A 2 0 2 . 8 8 5 . 9 1 2 1 3 0 1 . 5 0 2 . 4 1 7 1 7 7 4 . 5 3 8 . 6 0 7 0 8 2
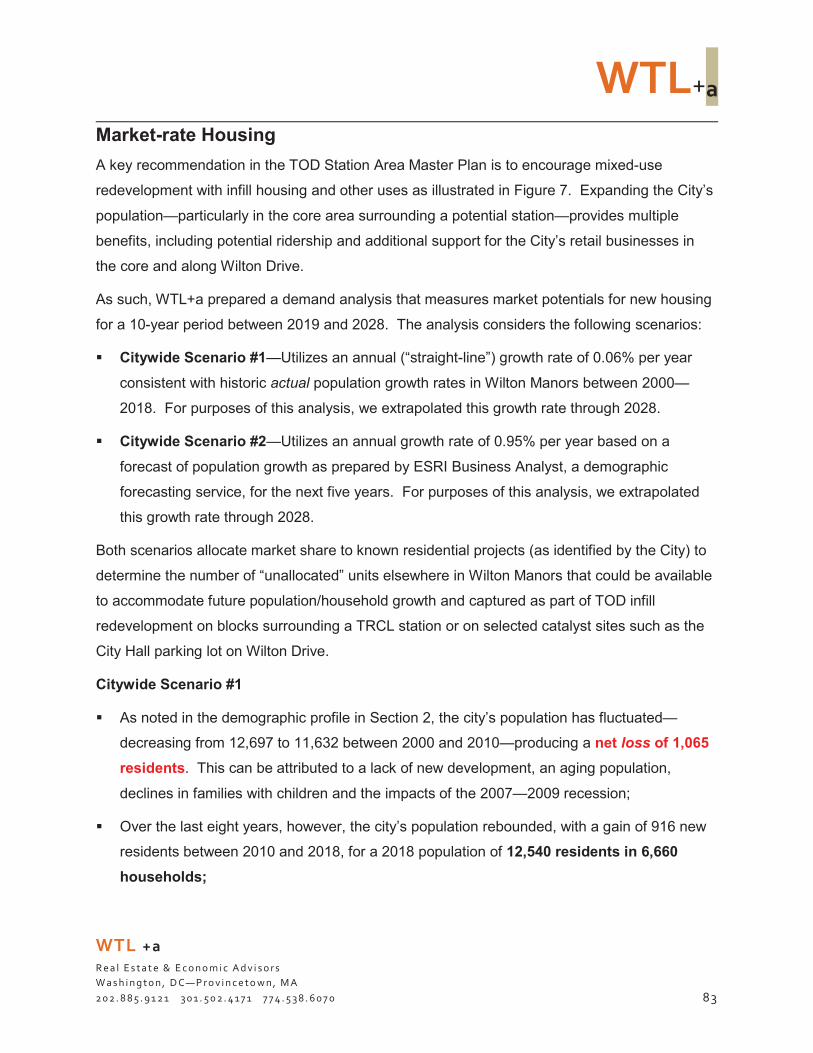
WTL+a
Market-rate Housing
A key recommendation in the TOD Station Area Master Plan is to encourage mixed-use
redevelopment with infill housing and other uses as illustrated in Figure 7. Expanding the City’s
population—particularly in the core area surrounding a potential station—provides multiple
benefits, including potential ridership and additional support for the City’s retail businesses in
the core and along Wilton Drive.
As such, WTL+a prepared a demand analysis that measures market potentials for new housing
for a 10-year period between 2019 and 2028. The analysis considers the following scenarios:
Citywide Scenario #1—Utilizes an annual (“straight-line”) growth rate of 0.06% per year
consistent with historic actual population growth rates in Wilton Manors between 2000—
2018. For purposes of this analysis, we extrapolated this growth rate through 2028.
Citywide Scenario #2—Utilizes an annual growth rate of 0.95% per year based on a
forecast of population growth as prepared by ESRI Business Analyst, a demographic
forecasting service, for the next five years. For purposes of this analysis, we extrapolated
this growth rate through 2028.
Both scenarios allocate market share to known residential projects (as identified by the City) to
determine the number of “unallocated” units elsewhere in Wilton Manors that could be available
to accommodate future population/household growth and captured as part of TOD infill
redevelopment on blocks surrounding a TRCL station or on selected catalyst sites such as the
City Hall parking lot on Wilton Drive.
Citywide Scenario #1
As noted in the demographic profile in Section 2, the city’s population has fluctuated—
decreasing from 12,697 to 11,632 between 2000 and 2010—producing a net loss of 1,065
residents. This can be attributed to a lack of new development, an aging population,
declines in families with children and the impacts of the 2007—2009 recession;
Over the last eight years, however, the city’s population rebounded, with a gain of 916 new
residents between 2010 and 2018, for a 2018 population of 12,540 residents in 6,660
households;
WTL +a
R e a l E s t a t e & E c o n o m i c A d v i s o r s W a s h i n g t o n , D C — P r o v i n c e t o w n , M A 2 0 2 . 8 8 5 . 9 1 2 1 3 0 1 . 5 0 2 . 4 1 7 1 7 7 4 . 5 3 8 . 6 0 7 0 83

WTL+a
Notably, while the city’s population declined, the number of households increased between
2000 and 2018. In fact, 791 new households were created during this 18-year period;
As illustrated in Table 22, if the pace of growth continues at this historic nominal rate of
0.06% per year, it would yield only 75 new residents in 41 new households (i.e., housing
units) assuming the city’s average household size of 1.84 remains unchanged. This would
translate into annual demand of only four units per year. By comparison, actual new
housing starts in Wilton Manors between 2001 and 2017 averaged 28 units per year; and
The next step allocates future growth in population/households to known residential projects
citywide that are either under construction or planned (i.e., entitled). According to data
provided by the City, these projects are expected to include: Del Mare Estates, an unknown
townhouse development, Village at Wilton Manors and Pride Center. The only known
project with an announced unit count is Pride Center, which is expected to deliver 48 units of
affordable housing; and
Table 22: Housing Potentials—Scenario #1, 2019—2028
Forecasts (1) Average 2028 Population Household Housing
Municipality 2019 2028 Change Size (2) Units Scenario 1: Straight-line Forecast Average Annual Growth Rate (2000-2018) 0.06% Current & Future Population 12,831 12,906 75 1.84 41 Allocation to Known Residential Projects:
Del Mare Estates -Townhouse Development -Village at Wilton Manors -Pride Center (Affordable Units) 48
Subtotal - Allocated Units: 48
Scenario 1 - Unallocated Units: (7)
(1) Scenario #1 assumes that Wilton Manors continues its nominal population loss as occurred between 2000 and 2018 (i.e., straight-line forecast) based on official state population estimates.
(2) In order to convert 2028 population growth into housing units, the analysis assumes that average household size remains the same as it was in 2018 (1.84 persons per household).
(3) Scenario #2 utilizes the 2018-2023 population growth forecasts prepared by ESRI and applies them in five-year increments through 2028. It also assumes no change in average household size.
Source: University of Florida Bureau of Business & Economic Research; ESRI Business Analyst; WTL+a, December 2018.
WTL +a
R e a l E s t a t e & E c o n o m i c A d v i s o r s W a s h i n g t o n , D C — P r o v i n c e t o w n , M A 2 0 2 . 8 8 5 . 9 1 2 1 3 0 1 . 5 0 2 . 4 1 7 1 7 7 4 . 5 3 8 . 6 0 7 0 8 4

WTL+a
As a result, this analysis suggests limited market demand for new housing if the city’s
historic pace of growth between 2000 and 2018 continues, suggesting that any new
housing as part of infill TOD redevelopment would have to be supported by an
“induced” market.
Citywide Scenario #2
Scenario #2 utilizes the 2018—2023 growth rate as estimated by ESRI Business Analyst of
0.95% per year, and extrapolates that growth over the 10-year forecast period;
As illustrated in Table 23, if the city successfully grows at a higher, sustained annual rate of
0.95% per year, it would yield over 1,270 new residents in 691 new households (housing
units), which would translate into annual demand of almost 70 units per year;
Table 23: Housing Potentials—Scenario #2, 2019—2028
Forecasts (1) Average 2028 Population Household Housing
Municipality 2019 2028 Change Size (2) Units Scenario 2: Alternative Forecast (3) Average Annual Forecast Growth Rate (2018-2023) 0.95% Current & Future Population
2018-2023 (5 Years) 12,831 13,452 621 1.84 337 2023-2028 13,452 14,102 651 1.84 354
10-Year Forecast: 691 Allocation to Known Residential Projects:
From List Above 48 Subtotal - Allocated Units: 48
Scenario 2 - Unallocated Units:
(1) Scenario #1 assumes that Wilton Manors continues its nominal population loss as occurred between 2000 and 2018 (i.e., straight-line forecast) based on official state population estimates.
(2) In order to convert 2028 population growth into housing units, the analysis assumes that average household size remains the same as it was in 2018 (1.84 persons per household).
(3) Scenario #2 utilizes the 2018-2023 population growth forecasts prepared by ESRI and applies them in five-year increments through 2028. It also assumes no change in average household size.
Source: University of Florida Bureau of Business & Economic Research; ESRI Business Analyst; WTL+a, December 2018.
Like Scenario #1, future growth in Scenario #2 was allocated to these same four
projects (i.e., Pride Center, with 48 known planned units), thereby leaving
“unallocated” demand for approximately 640 units citywide. As such, the higher growth
rate in Scenario #2 would significantly strengthen opportunities for new TOD-related housing
WTL +a
R e a l E s t a t e & E c o n o m i c A d v i s o r s W a s h i n g t o n , D C — P r o v i n c e t o w n , M A 2 0 2 . 8 8 5 . 9 1 2 1 3 0 1 . 5 0 2 . 4 1 7 1 7 7 4 . 5 3 8 . 6 0 7 0
643
85

WTL+a
in downtown Wilton. The analysis in both scenarios assumes that developable sites are
readily available, full entitlements are in-place and construction financing is secured to
support infill TOD redevelopment with new housing.
In addition, as noted previously in Section 3 (Table 11), the city has a number of “true vacant”
housing units. True vacancy is defined as unoccupied units available for rent but excludes units
that are unoccupied because they are for sale or are seasonally-occupied units. According to
the 2016 American Community Survey (ACS), Wilton Manors has approximately 561 “truly
vacant” units, which reflects a vacancy rate of 7.5%. While the physical and/or functional
obsolescence of these units is unknown, some portion of these vacant units are assumed to be
habitable and may serve to reduce demand for new construction that are also affected by such
variables as the availability of financing.
Workplace/Office
Knowledge-based industries like finance, software, business and management consulting
services, market and communications, professional/business services such as accountants,
legal and medical and other similar businesses house most of their employees in commercial
office buildings.
The first step in measuring support for new multi-tenant/speculative office space as part of TOD
infill redevelopment in Wilton Manors examines market potentials for office use in Broward
County, and allocates demand to the city. The analysis translates employment forecasts (for
2017—2025) among specific industry sectors in Broward County (as prepared by the Florida
Department of Economic Opportunity/DEO), into demand for office space by applying an
occupancy factor (of occupied space per employee) and estimates the proportion of employees
in each sector who are office workers. We note that DEO employment forecasts are issued only
in eight-year periods.
The analysis also considers demand generated by other market factors, such as vacancy
adjustments, part-time/self-employed individuals (who may or may not occupy multi-tenant
office space), and cumulative replacement; these estimates either increase or reduce future
demand for office space. Cumulative replacement, for example, considers tenants that move
when a building is removed from the inventory due to physical and/or functional obsolescence.
WTL +a
R e a l E s t a t e & E c o n o m i c A d v i s o r s W a s h i n g t o n , D C — P r o v i n c e t o w n , M A 2 0 2 . 8 8 5 . 9 1 2 1 3 0 1 . 5 0 2 . 4 1 7 1 7 7 4 . 5 3 8 . 6 0 7 0 86
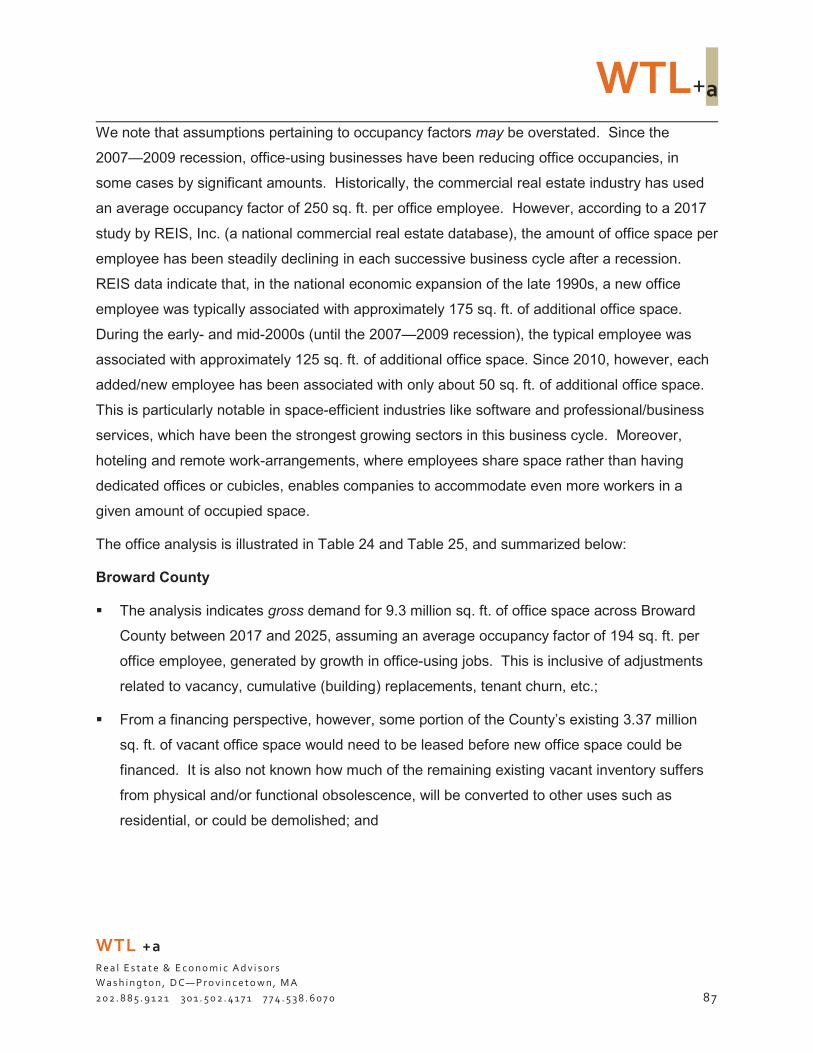
WTL+a
We note that assumptions pertaining to occupancy factors may be overstated. Since the
2007—2009 recession, office-using businesses have been reducing office occupancies, in
some cases by significant amounts. Historically, the commercial real estate industry has used
an average occupancy factor of 250 sq. ft. per office employee. However, according to a 2017
study by REIS, Inc. (a national commercial real estate database), the amount of office space per
employee has been steadily declining in each successive business cycle after a recession.
REIS data indicate that, in the national economic expansion of the late 1990s, a new office
employee was typically associated with approximately 175 sq. ft. of additional office space.
During the early- and mid-2000s (until the 2007—2009 recession), the typical employee was
associated with approximately 125 sq. ft. of additional office space. Since 2010, however, each
added/new employee has been associated with only about 50 sq. ft. of additional office space.
This is particularly notable in space-efficient industries like software and professional/business
services, which have been the strongest growing sectors in this business cycle. Moreover,
hoteling and remote work-arrangements, where employees share space rather than having
dedicated offices or cubicles, enables companies to accommodate even more workers in a
given amount of occupied space.
The office analysis is illustrated in Table 24 and Table 25, and summarized below:
Broward County
The analysis indicates gross demand for 9.3 million sq. ft. of office space across Broward
County between 2017 and 2025, assuming an average occupancy factor of 194 sq. ft. per
office employee, generated by growth in office-using jobs. This is inclusive of adjustments
related to vacancy, cumulative (building) replacements, tenant churn, etc.;
From a financing perspective, however, some portion of the County’s existing 3.37 million
sq. ft. of vacant office space would need to be leased before new office space could be
financed. It is also not known how much of the remaining existing vacant inventory suffers
from physical and/or functional obsolescence, will be converted to other uses such as
residential, or could be demolished; and
WTL +a
R e a l E s t a t e & E c o n o m i c A d v i s o r s W a s h i n g t o n , D C — P r o v i n c e t o w n , M A 2 0 2 . 8 8 5 . 9 1 2 1 3 0 1 . 5 0 2 . 4 1 7 1 7 7 4 . 5 3 8 . 6 0 7 0 8 7

WTL+a
Table 24: Workplace/Office Potentials—Broward County, 2017—2025
New Jobs % Office- SF Occupancy 2025 Demand Industry Sector 2017-2025 Using Factor (In SF)
Broward County Agriculture & Mining (4) 10% 150 (100)
6,306 15% 175 165,500 Construction Manufacturing 830 10% 200 16,600 Transportation & Utilities 2,552 20% 175 89,300 Wholesale & Retail Trade
Wholesale 2,896 10% 150 43,400 Retail 9,721 10% 150 145,800
Information 843 65% 175 95,900 Financial Activities 5,958 75% 200 893,700 Services
Professional, Scientific & Technical Services 24,207 85% 250 5,144,000 Education & Health Services 16,844 25% 200 842,200 Leisure & Hospitality 9,158 30% 150 412,100 Other Services (Except Government) 3,846 25% 175 168,300
Government 6,867 45% 150 463,500 Self-Employed 5,844 15% 200 175,300 Total/Weighted Average: 95,868 42% 194 8,655,500
+ Vacancy Adjustment @ 2.5% (1) 216,400 + Cumulative Replacement Demand 5.0% (2) 432,800
2025 Gross Demand - Broward County: 9,304,700 Existing Vacant Office Space 3,372,949
- Lease-up Required @ 50% (1,686,475) (3) (1,686,475) Remaining Vacant Space: 1,686,475 % Vacant 6.1%
2025 Net Demand: 7,618,200
(1) This allows for a 2.5% "frictional" vacancy rate in new office space delivered to the market (i.e., this accounts for tenant movement to new space).
(2) This represents new space required by existing businesses to replace obsolete or otherwise unusable office space. This is assumed to represent 5% of total demand.
(3) From a financing perspective, some portion of existing vacant office space in Broward County will need to be leased before financing of new construction is viable. The analysis assumes that 50% of existing vacant office space is leased, thereby reducing the overall vacancy rate to approximately 6%.
Source: Florida Dept. of Economic Opportunity; Cushman & Wakefield of Florida, Inc.; WTL +a, December 2018.
For purposes of this analysis, WTL+a conservatively assumes that fully 50% of Broward
County’s vacant office inventory (approximately 1.68 million sq. ft.) is leased before
financing is provided for new office construction. This serves to reduce the County’s office
WTL +a
R e a l E s t a t e & E c o n o m i c A d v i s o r s W a s h i n g t o n , D C — P r o v i n c e t o w n , M A 2 0 2 . 8 8 5 . 9 1 2 1 3 0 1 . 5 0 2 . 4 1 7 1 7 7 4 . 5 3 8 . 6 0 7 0 8 8

WTL+a
vacancy rate (to roughly 6.1% from current levels), and lowers demand generated by job
growth in office-using sectors to approximately 7.6 million sq. ft. of net new space by
2025.
Wilton Manors
The next step in the analysis is illustrated in Table 25 and Table 26. WTL+a prepared two
scenarios to estimate office development potentials in Wilton Manors. The first scenario
estimates opportunities for new office development based on the city’s current share of
employment and the second evaluates office potentials based on the city’s share of office
inventory.
Citywide Scenario #1: Fair Share of Employment
With an estimated 6,220 employees working in Wilton Manors, the city’s share of Broward
County’s total jobs is 0.70%;
Under this “fair share” analysis, Wilton Manors would continue to capture 0.70% of future
countywide job growth, or approximately 670 new employees, by 2025. Assuming similar
proportions of office-using jobs and occupancy factors translates into gross demand for
roughly 54,500 sq. ft. of office space over the next eight years; and
Key unknowns in this analysis include existing vacant space and any allocation to planned
new projects containing office space.
WTL +a
R e a l E s t a t e & E c o n o m i c A d v i s o r s W a s h i n g t o n , D C — P r o v i n c e t o w n , M A 2 0 2 . 8 8 5 . 9 1 2 1 3 0 1 . 5 0 2 . 4 1 7 1 7 7 4 . 5 3 8 . 6 0 7 0 89
WTL+a
Table 25: Office Potentials Scenario #1—Wilton Manors, 2017—2025
2025 Demand (In SF)
Scenario 1: Fair Share Analysis Based on Employment Total Employment 6,222
As % of Broward County (4) 0.70%
Office-using Jobs: 2017-2025 Employment Growth (If Fair Share Maintained) 669 % Office-using Jobs 42%
Total Office-using Jobs: 281
Demand for Office Space SF Occupancy Factor 194
2025 Gross Demand - Citywide: 54,535
Key Unknowns Existing Vacant Office Space -Allocation to Known/Future Office Projects -
2025 Net Demand - Citywide (Rounded): 54,500
(4) This reflects the City's 2017 share of all jobs in Broward County. The analysis assumes that the City maintains its "fair share" of the County's total employment base during the forecast period.
Source: Florida Dept. of Economic Opportunity; Broward County Property Appraiser; Cushman & Wakefield LLC; WTL+a, December 2018.
Citywide Scenario #2: Fair Share of Office Inventory
According to multiple sources (including the Broward County Property Appraiser, REIS, Inc.
and a windshield inventory), Wilton Manors contains an estimated office inventory of
198,800 sq. ft. located within one-mile of Five Points. This inventory is illustrated in Table
19 and Table 20 in Section 3. As a result, the city’s share of Broward County’s 27.6 million
sq. ft. of office inventory is 0.72%;
Under this “fair share” analysis, Wilton Manors would continue to capture 0.72% of future
countywide office space, generating gross demand for approximately 54,800 sq. ft., by
2025, based on demand generated by office-using employment growth in Broward County;
and
Similar to the first scenario, key unknowns in this analysis include existing vacant space and
any allocation to planned new projects containing office space.
WTL +a
R e a l E s t a t e & E c o n o m i c A d v i s o r s W a s h i n g t o n , D C — P r o v i n c e t o w n , M A 2 0 2 . 8 8 5 . 9 1 2 1 3 0 1 . 5 0 2 . 4 1 7 1 7 7 4 . 5 3 8 . 6 0 7 0 9 0

WTL+a
Table 26: Office Potentials Scenario #2—Wilton Manors, 2017—2025
2025 Demand (In SF)
Scenario 2: Fair Share Analysis Based on Space (SF) Existing Office Space
Broward County 27,622,957 City of Wilton Manors (Estimate) 198,788 As % of Broward County 0.72%
2025 Demand for Office Space Broward County 7,618,200 City of Wilton Manors Fair Share 0.72%
2025 Gross Demand - Citywide: 54,824
Key Unknowns Existing Vacant Office Space -Allocation to Known/Future Office Projects -
2025 Net Demand - Citywide: 54,800
(4) This reflects the City's 2017 share of all jobs in Broward County. The analysis assumes that the City maintains its "fair share" of the County's total employment base during the forecast period.
Source: Florida Dept. of Economic Opportunity; Broward County Property Appraiser; Cushman & Wakefield LLC; WTL+a, December 2018.
As illustrated in Table 19 in Section 3, data on market trends among the 19 office buildings
located within one-mile of Five Points is limited. With 198,800 sq. ft. of office space, partial or
limited data preclude an accurate understanding of key metrics such as existing vacant
space and annual net absorption. As a result, it is unknown whether the city’s office
market meets current financing thresholds for construction of new office buildings.
Moreover, current rent levels (based on limited data from five of 19 properties) suggests
average rents in the range of $21 per sq. ft., which may not be sufficient to support new
construction. Minimum required rents can be determined by preparing a financial feasibility
analysis of a prototype new office building, taking into consideration construction costs, land
acquisition, the provision of on-site parking and other factors affecting threshold office rents.
As a result, this suggests that consideration of public policies tailored to offset construction cost
premiums with the use of regulatory and/or financial incentives, such as the provision of
WTL +a
R e a l E s t a t e & E c o n o m i c A d v i s o r s W a s h i n g t o n , D C — P r o v i n c e t o w n , M A 2 0 2 . 8 8 5 . 9 1 2 1 3 0 1 . 5 0 2 . 4 1 7 1 7 7 4 . 5 3 8 . 6 0 7 0 9 1

WTL+a
adequate parking for office/professional and business service tenants that enhance the
marketability of downtown Wilton Manors as a tertiary office location in Broward County oriented
to small professional and business services tenancies.
Office Market Potentials in Wilton Manors:
Up to 55,000 SF of Demand by 2025 but Financial Feasibility Unknown
Hotel/Lodging
At the time of the market study and planning process for the TOD master plan, the City of Wilton
Manors had commissioned a hotel analysis for the study area. That study, completed in early
2019 by HVS Hospitality Consulting of Miami, followed the same analytical approach used by
WTL+a and RDS LLC in our analysis, basing hotel demand potentials on comparable hotel
properties in the area, evaluating market trends, and determining if there is sufficient opportunity
to add another hotel to the competitive market. The HVS study, which was provided by the city
for our review, considered potential sites on Wilton Drive, NE 26th Street and N. Andrews
Avenue, which serve as the city’s three commercial corridors.
Hotels are categorized in the industry by levels of investment, services, and relative concepts
across the spectrum from budget/economy through luxury products. The HVS study correctly
identified five hotels in the competitive market which would be considered comparable or
competitive with a potential hotel in Wilton Manors. The properties used as market metrics in
the HVS report included both primary and secondary competition:
Primary Competition
Courtyard by Marriott East in Lauderdale-by-the-Sea
The Hampton Inn Downtown Las Olas
Holiday Inn Express & Suites Executive Airport
Secondary Competition
The Doubletree by Hilton at Gallery One
WTL +a
R e a l E s t a t e & E c o n o m i c A d v i s o r s W a s h i n g t o n , D C — P r o v i n c e t o w n , M A 2 0 2 . 8 8 5 . 9 1 2 1 3 0 1 . 5 0 2 . 4 1 7 1 7 7 4 . 5 3 8 . 6 0 7 0 9 2

WTL+a
The Residence Inn Intracoastal Il Lugano
Three of the five competitive hotels have room counts similar to what a smaller lodging facility in
Wilton Manors could have, ranging from 100 to 106 rooms each. Both the Hampton Inn and
Doubletree have 156 and 231 rooms, respectively. These five competitive properties contain a
total of almost 700 rooms. Both of the larger properties are located in more urban and
established market locations; hotels of this size would be considered more difficult to finance in
a tertiary location in Wilton Manors. We note that the city’s existing supply of lodging
properties is comprised solely of guest houses, small inns and Airbnb facilities; in fact,
none of these properties are included in local inventory data or report their performance
data to STR.
Hospitality/hotel market analyses almost always use baseline data prepared by the lodging
industry’s standard for market performance, STR Global, which produces Trend Reports that
track market performance and other key metrics of the competitive hotel supply. Using
information and trend lines for average annual room occupancy, revenues per available room
(known as RevPAR) and average achieved room rates (also known as Average Daily Rates, or
ADRs), the economic and financial requirements to attract investment capital to finance hotels
can be measured to determine if specific projects meet or exceed investment thresholds.
The accepted breakpoint for economic viability is average annual occupancy over at
least three to five years ranging between 65% and 72%. In other words, between two-thirds
and almost three-fourths of all hotel rooms in the competitive supply are occupied on an annual
basis, and over successive years. This consistency (or growth) assures the investment
community that a new hotel can perform at sustained performance levels and provide an
acceptable return-on-investment. The STR data used by HVS tracked hotel supply and demand
over a 10-year period (2008 through 2017), with partial-year data through October 2018. In
addition, increasing RevPAR and average achieved room rates also offer indications of the
sustainability of the lodging market in this part of Broward County.
Based on the STR data, HVS indicated that occupancies for the competitive set were 76.5%
in 2016 and 75.6% in 2017, and that overall demand and ADRs have resulted in an increase in
RevPAR of 4.4% compound annual growth during the study period. These trends suggest that
a hotel would be market-supportable in Wilton Manors. As might be expected, occupancy and
ADR peaks during the winter season from mid-December through March. Although occupancy
WTL +a
R e a l E s t a t e & E c o n o m i c A d v i s o r s W a s h i n g t o n , D C — P r o v i n c e t o w n , M A 2 0 2 . 8 8 5 . 9 1 2 1 3 0 1 . 5 0 2 . 4 1 7 1 7 7 4 . 5 3 8 . 6 0 7 0 9 3

WTL+a
levels are at the upper-end of industry standard ‘thresholds for financing, the future pipeline of
new hotel supply must also be considered as it can have profound effects on overall
occupancies (at least during the immediate years). Expansion of competitive supply near Wilton
Manors counterbalances market strength among the existing competitive supply. Moreover, the
magnitude of pending additional rooms should be considered in measuring overall market
viability as much as the strength of existing performance. Of course, we recognize that Florida
is a major tourism destination, and its hotel market continues to grow. However, attractions that
support many new hotels (e.g., beach proximity, golf resorts, location near vibrant city centers,
theme parks in Orlando, fishing and other outdoor recreation) also affect viability. Importantly,
Wilton Manors is not a ‘beach hotel location’. Its other destination characteristics should
be weighed against competing areas to determine if a hotel can sustain high
occupancies while facing increasing competition.
As context for forecasts of market potentials, the HVS study also documented additions of new
lodging properties in the competitive market, either recently opened or to be completed by 2023.
HVS noted that these new properties will add fully 649 new rooms to area supply, and include
the following:
Fairfield Inn & Suites—108 rooms; recently opened
Tru by Hilton—112 rooms
Hilton Home2 Suites—106 rooms
The Tribute Portfolio—209 rooms, which will be co-branded with
Element Hotel—114 rooms in downtown Fr. Lauderdale
In addition, a Starwood/Marriott aloft Hotel is also proposed for a location in Fort Lauderdale.
Typically, aloft properties contain 110 to 120 rooms, but the final room count is not yet
determined. Excluding this proposed aloft, these new properties (although not expected to
directly compete with a more limited-service branded hotel in Wilton Manors), are expected to
almost double the number of rooms among competitive properties. HVS rightly noted this
additional increment of growth as cautionary for the timing of any new hotel in Wilton Manors.
WTL+a and RDS LLC agree with the findings of the HVS study of hotel potentials in
Wilton Manors. Notably, a hotel would be feasible in Wilton Manors, but its location,
WTL +a
R e a l E s t a t e & E c o n o m i c A d v i s o r s W a s h i n g t o n , D C — P r o v i n c e t o w n , M A 2 0 2 . 8 8 5 . 9 1 2 1 3 0 1 . 5 0 2 . 4 1 7 1 7 7 4 . 5 3 8 . 6 0 7 0 9 4
WTL+a
price points, branding, and timing will influence the overall financial performance of the
project. Furthermore, WTL+a and RDS LLC:
Agree that a mid-scale hotel brand (such as those identified in the HVS study, including
Moxy by Marriott, Avid Hotels by Intercontinental Hotels Group and VIB by Best Western)
can work based on recent and current market performance of competitive properties;
Agree with the HVS recommendation that the site should be located on Wilton Drive, as
opposed to NE 26th Street or N. Andrews Avenue; and
Recommend that a hotel of 80 to 110 rooms be developed and that it should be
affiliated with a brand (both for the availability of central reservations systems and to
capitalize on hotel loyalty programs).
Because the hotel study was underway during the TOD master planning process, HVS did not
have access to the TOD planning recommendations for a specific hotel site. WTL+a and RDS
LLC support the potential location of a new hotel as part of redevelopment of a portion of
the City Hall site if the city chooses to entertain redevelopment of this site,. A potential location
at Wilton Drive and NE 21st Court would provide excellent visibility to travelers, be adjacent to
public event sites, and highly visible for destination events such as the annual Stonewall Parade
and the Wicked Manors Halloween parade and street party along Wilton Drive. The potential
site is also central to the Wilton Drive nightlife district and to The Venue, which reportedly draws
tens of thousands of patrons to weddings, parties, performances and other events throughout
the year. As we understand, The Venue sends an undetermined number of overnight guests to
hotels outside the city because there are no hotels in Wilton Manors.
Perhaps most compelling, the City of Wilton Manors already owns the City Hall property.
Currently in use as a surface parking lot for visitors to City Hall and adjacent recreation
activities, development of a hotel in this location could provide multiple sources of additional (net
new) tax revenues to the City as well as revenues generated by a long-term ground lease or a
direct land sale. The City should also consider enacting a ‘bed tax’ for the proposed hotel to
provide an ongoing, dedicated revenue stream for tourism and marketing. If timing/delivery of
a new hotel is adversely affected by development or land acquisition costs, the City
should consider a land ‘write-down’ or discount, to reduce the cost of entry to investors.
This would serve to accelerate financial viability of their initial capital investment, but the long-
WTL +a
R e a l E s t a t e & E c o n o m i c A d v i s o r s W a s h i n g t o n , D C — P r o v i n c e t o w n , M A 2 0 2 . 8 8 5 . 9 1 2 1 3 0 1 . 5 0 2 . 4 1 7 1 7 7 4 . 5 3 8 . 6 0 7 0 9 5

WTL+a
term sustainability of the hotel’s business model and its position in the competitive market
should be the primary governing factors in determining economic viability. For more detail on
the HVS study’s research methodology, market data and analysis and recommendations,
please see the full report.
A new branded, national flag hotel in the city’s commercial district on Wilton Drive would be a
positive resource for the community and provide additional amenities for visitors and tourists.
Specific amenities, including a (rooftop) swimming pool, hotel restaurant and bar, and outdoor
gathering place would contribute significantly more to the quality-of-life of Wilton Drive than
does the existing public parking lot. Moreover, a new hotel would activate this portion of Wilton
Drive. In addition to a potential hotel on the City Hall site, there are other uses that could be
considered, such a residential, as part of an infill development strategy that would further
enhance tax and other revenues generated by the hotel to the City of Wilton Manors.
General Retail
The traditional sources of demand in retail districts come from three sources; resident spending
(local and from the surrounding areas), spending by members of the local workforce, and
tourist/visitor spending. Because Wilton Manors is not a major office/workplace concentration,
impacts of workforce spending are relatively low within the context of the other retail consumer
categories. Spending potentials by residents and the visitor market are the primary sources of
demand for retail in Wilton Manors. Each is described below.
Retail and the Resident Market
According to the official State of Florida estimate (4/1/18), Wilton Manors’ resident population is
estimated at 12,831 residents. ESRI Business Analyst estimates that there are 6,667
households. Using data from the University of Florida Bureau of Business and Economic
Research (BEBR) and state sales tax records from the Department of Revenue (DOR), the
Half-Cent Sales Tax distribution for Wilton Manors for fiscal year 2018 was almost
$847,500; this suggests overall retail sales of $169.5 million for the municipality.
However, RDS and WTL+a note that, since all retail products and services are not subject to
sales taxes in Florida, the estimated total sales according to the U.S. Census of Retail Trade
offers a broader and more comprehensive view of ALL sales in Wilton Manors. According to the
WTL +a
R e a l E s t a t e & E c o n o m i c A d v i s o r s W a s h i n g t o n , D C — P r o v i n c e t o w n , M A 2 0 2 . 8 8 5 . 9 1 2 1 3 0 1 . 5 0 2 . 4 1 7 1 7 7 4 . 5 3 8 . 6 0 7 0 9 6

WTL+a
U.S. Census of Retail Trade, total (taxable and non-taxable) retail sales equate to $196.1
million per year in Wilton Manors.
Due to the proximity and scale of the competitive retail supply surrounding Wilton Manors (e.g.,
the commercial corridors of Sunrise Boulevard, N. Federal Highway and Oakland Park
Boulevard), RDS has assumed that roughly two-thirds (65%) of total sales by Wilton Manors
residents will be made in Wilton Manors’ retail stores and businesses, or $127.4 million per
year. It was further assumed that remaining resident-based spending will be made in other
locations outside of the city. Therefore, the difference—roughly $68.6 million annually—would
be made by other market segments. In Wilton Manors, it is reasonable to assume the LGBTQ
visitor market would generate the lion’s share of this additional retail spending. Based on our
detailed analysis below, this is estimated to range from $51.2 to $80.6 million per year in retail
sales; this range reflects various “capture rates” from Broward County’s total estimated LGBTQ
visitor market.
While it is recognized that all retail sales in Wilton Manors are not attributable to its residents
alone, it is also useful to compare estimated sales per resident and per household to other
Florida municipalities of similar population. WTL+a and RDS identified eight Florida locations
whose populations are similar to Wilton Manors, as illustrated in Table 27. For purposes of
visitor sales analysis, Key West, with a population nearly double that of Wilton Manors, was
included as a test of the impacts of visitor spending, particularly as a Florida comparable for
spending based on LGBTQ visitor expenditures.
We also recognize that other variables exist between these ‘comparable’ communities and
Wilton Manors, with differences in:
The total amount of available existing supply and mix of retail uses (e.g., selected
communities with similar populations are very different in commercial offerings. In some
cases, this includes communities with less retail space but additional light industrial and/or
wholesale retail trade users. Wholesale trade sales tends to skew overall retail sales and
should be discounted when examining household retail sales. More industrial space would
lower sales productivities because there are fewer opportunities for residents to spend;
Differences in average household incomes (as higher-income households have more
disposable income to spend on retail goods and services);
WTL +a
R e a l E s t a t e & E c o n o m i c A d v i s o r s W a s h i n g t o n , D C — P r o v i n c e t o w n , M A 2 0 2 . 8 8 5 . 9 1 2 1 3 0 1 . 5 0 2 . 4 1 7 1 7 7 4 . 5 3 8 . 6 0 7 0 9 7

WTL+a
Different competitive contexts (i.e., some communities have major concentrations of retail in
malls and commercial corridors in adjacent municipalities and unincorporated areas, where
others do not). These differences can also account for variations in likely inflow sales
generated by residents and visitors in surrounding communities, or loss of resident and
visitor-based sales to other areas (also known as retail sales leakage); and
Annual tourism/visitor totals vary significantly between similarly-sized communities across
the state, depending on location, number and type of visitor attractions/destinations, or
geographic locations and characteristics. The smaller resident population and much greater
number of visitors to Key West is an example of this condition.
While differences occur based on the variables identified above, estimated retail sales per
household is the standard for comparison, while also addressing relative differences in spending
by other market segments. For example, among the eight similarly-sized communities, Wilton
Manors’ population and spending per household most closely parallels patterns in Gulfport in
Pinellas County. Other jurisdictions have similar populations but have higher estimated
spending per household.
The findings in Table 27 below also raise several questions about retail spending projections
and disposable incomes. For example, Key Biscayne is almost identical to Wilton Manors in
population but has an average household income more than twice as high as Wilton. Yet
despite this difference, average annual household retail spending among Key Biscayne
households is only 1.6 times that of Wilton Manors. This difference can be attributed to the fact
that Key Biscayne has less retail space on the island than Wilton Manors; that is, residents
spend less there because there are fewer places to spend money, even with significant
disposable income.
WTL +a
R e a l E s t a t e & E c o n o m i c A d v i s o r s W a s h i n g t o n , D C — P r o v i n c e t o w n , M A 2 0 2 . 8 8 5 . 9 1 2 1 3 0 1 . 5 0 2 . 4 1 7 1 7 7 4 . 5 3 8 . 6 0 7 0 9 8

WTL+a
Table 27: Half-cent Sales Tax & Estimated Retail Sales in Comparable Communities, 2018
Estimated Spending/HH
Estimated FY2018 Half- Estimated Estimated Average Based on County Municipality Population Cent Sales Tax Retail Sales Sales/Resident HH Income Households Sales Tax
Broward Wilton Manors 12,831 847,474 $ 169,494,800 $ 13,210 $ 79,260 $ 6,667 25,423 $
West Park 14,895 $ 1,005,584 $ 201,116,800 $ 13,502 $ 54,294 4,495 $ 44,742
Miami-Dade Key Biscayne 12,887 $ 1,001,062 $ 200,212,400 $ 15,536 $ 171,933 4,928 $ 40,628
South Miami City 12,664 $ 1,011,164 $ 202,232,800 $ 15,969 $ 102,916 5,130 $ 39,422
Palm Beach Lantana 11,397 $ 873,689 $ 174,737,800 $ 15,332 $ 75,829 4,376 $ 39,931
North Palm Beach 12,596 $ 997,500 $ 199,500,000 $ 15,838 $ 100,227 6,536 $ 30,523
Pinellas Gulfport 12,554 $ 801,856 $ 160,371,200 $ 12,775 $ 66,204 6,293 $ 25,484
Oldsmar 14,489 $ 926,546 $ 185,309,200 $ 12,790 $ 84,539 5,517 $ 33,589
Monroe Key West 24,509 $ 4,851,324 $ 970,264,800 $ 39,588 $ 85,811 11,235 $ 86,361
Source: Florida Department of Revenue; University of Florida Bureau of Business & Economic Research (BEBR); ESRI Business Analyst; RDS LLC; WTL+a, January 2019.
WTL +a
R e a l E s t a t e & E c o n o m i c A d v i s o r s W a s h i n g t o n , D C — P r o v i n c e t o w n , M A 2 0 2 . 8 8 5 . 9 1 2 1 3 0 1 . 5 0 2 . 4 1 7 1 7 7 4 . 5 3 8 . 6 0 7 0 9 9

WTL+a
In another contrast, although the population of Key West is nearly double that of Wilton Manors,
estimated average spending per household is 3.4 times higher in Key West than in Wilton
Manors. This difference can be attributed to the fact that the number of tourists who visit Key
West each year is significant.
While the resident-based sales comparison provides a baseline for analysis, a more compelling
comparison is to contrast estimated spending power based on national patterns against
spending levels based on household incomes in these selected communities. By comparing
estimated spending based on sales tax against actual household retail spending, it is possible to
extract the portion of resident-based sales from total sales indicated by sales tax collections.
The difference between these two metrics represents retail sales made to non-resident
consumers, which are dominated by visitors and tourists. This analysis is presented in
Table 28 below:
Table 28: Half-cent & Estimated Retail Sales Attributable to Other Sources, 2018
Estimated Estimated Estimated Spending/HH Actual Spending Sales Taxes
(Based on Spending/HH Attributable to Attributable to County Municipality Sales Tax) (ESRI) Other Sources % of Total Other Sources
Broward Wilton Manors 25,423 $ 18,251 $ 7,172 $ 28.2% 47,813,050 $
West Park $ 44,742 $ 12,708 $ 32,034 71.6% $ 143,994,655
Miami-Dade Key Biscayne $ 40,628
South Miami City $ 39,422 $ 23,090 $ 16,332 41.4% $ 83,781,818
Palm Beach Lantana $ 39,931
North Palm Beach $ 30,523 $ 22,852 $ 7,671 25.1% $ 50,140,047
Pinellas Gulfport $ 25,484 $ 15,490 $ 9,994 39.2% $ 62,889,735
Oldsmar $ 33,589
Monroe Key West $ 86,361 $ 19,807 $ 66,554 77.1% $ 747,729,110
Source: Florida Department of Revenue; University of Florida Bureau of Business & Economic Research (BEBR); ESRI Business Analyst; RDS LLC; WTL+a, January 2019.
For purposes of this analysis, three cities were excluded from the review:
WTL +a
R e a l E s t a t e & E c o n o m i c A d v i s o r s W a s h i n g t o n , D C — P r o v i n c e t o w n , M A 2 0 2 . 8 8 5 . 9 1 2 1 3 0 1 . 5 0 2 . 4 1 7 1 7 7 4 . 5 3 8 . 6 0 7 0 10 0
WTL+a
Key Biscayne—because existing retail supply is very limited and there is an 870-room Ritz
Carlton resort located on the island, the development pattern is very different from Wilton
Manors
Lantana—which does not have either a commercial district or densities similar to Wilton
Manors
Oldsmar—because its location on the Gulf Coast in Pinellas County is largely based on
commercial strip and pad retail development patterns and does not have a cohesive
commercial core similar to Wilton Drive
In all three of these communities excluded from this analysis, the commercial districts are
different enough in size or retail character to not be comparable to Wilton Manors.
Another metric affecting retail market demand includes current achieved rents for retail
space. In the retail industry, store rents are a function of sales and, as an industry standard,
retail rents generally represent between 8% and 12% of gross sales in stabilized markets.
Lower rents generally apply to aging/less functional retail spaces, while higher rents correspond
with stronger/more visible locations and/or higher levels of tenant ‘fitout’ or equipment (such as
a restaurant space with special venting and plumbing). According to Loopnet, Inc. and other
industry sources:
Current available retail spaces in Wilton Manors have ‘asking’ rents that range from $15 per
sq. ft. per year up to $40 per sq. ft. per year
Other retail property rents fall in the range of $33 to $38 per sq. ft.
Lower rents noted above reflect an industrial space with limited improvements and a newer,
but undersized retail space in a mixed-use residential building
More typical middle range retail rents of $20 to $30 per sq. ft. are for visible in-line spaces
along Wilton Drive and NW 26th Street
As an example of how these rents relate to required sales, a 1,000 sq. ft. space would pay
$15,000 per year on a triple net basis, or $1,250 per month plus taxes and utilities. Using an
industry average of 10% rent-to-sales, the prototypical retail tenant would have to generate
$12,500 in gross monthly sales in order to financially justify the achieved rent.
WTL +a
R e a l E s t a t e & E c o n o m i c A d v i s o r s W a s h i n g t o n , D C — P r o v i n c e t o w n , M A 2 0 2 . 8 8 5 . 9 1 2 1 3 0 1 . 5 0 2 . 4 1 7 1 7 7 4 . 5 3 8 . 6 0 7 0 10 1

WTL+a
The retail industry typically requires average annual sales of $200 to $350 per sq. ft. to
justify landlord reinvestment and reasonable improvements and to provide sufficient
minimum profit for retail operators. Because of the costs of specialized equipment, venting
and exhaust, refrigerated storage etc., food and beverage spaces are more costly to build,
frequently requiring annual sales productivities closer to $400 per sq. ft. By contrast, average
retail sales productivities in Wilton Manors are illustrated in Table 29 below. Key findings
indicate that:
Estimated fiscal year 2018 retail sales in Wilton Manors (based on the 2018 Half-cent Sales
Tax) totaled $169.5 million, not including sales for goods and services not subject to sales
taxes (prescription medicines, medical equipment, common household remedies and
products such as bandages, infant food and supplies, Bibles/hymn and prayer books, flags,
seeds and fertilizers, plants providing food to humans, most categories of grocery products,
and baked goods from locations without eating facilities. Selected items are all considered
taxable such as candy, cosmetics and non-prescription glasses and sunglasses);
If taxable retail sales are compared to the citywide inventory of 950,045 gross sq. ft.
(including both vacant and occupied retail space), it equates to all-in sales of $178 per sq.
ft.—which is below industry requirements
If current vacant space is excluded, taxable retail sales equate to $236 per sq. ft.—on par
with industry requirements:
Table 29: Actual Taxable Retail Sales & Performance Metrics—Wilton Manors, 2018
2018 Half-cent Implied Total Sales Actual & Required Sales Tax Sales-All Total Retail Productivity
Sales Distribution Consumers Space (SF) Per SF
Including Vacant Space $ 847,474 $ 169,494,800 950,045 $ 178.41
Excluding Vacant Space $ 847,474 $ 169,494,800 718,691 $ 235.84
Source: Florida Department of Revenue; University of Florida Bureau of Business & Economic Research (BEBR); RDS LLC; WTL+a, January 2019.
WTL +a
R e a l E s t a t e & E c o n o m i c A d v i s o r s W a s h i n g t o n , D C — P r o v i n c e t o w n , M A 2 0 2 . 8 8 5 . 9 1 2 1 3 0 1 . 5 0 2 . 4 1 7 1 7 7 4 . 5 3 8 . 6 0 7 0 10 2

WTL+a
It should be noted that non-taxable retail products represent a substantial portion of total
household spending, particularly the greater proportion of grocery store products not subject to
sales tax. For this reason, RDS and WTL+a used average resident spending totals based on
the U.S. Census of Retail Trade, a resource that would include product purchases not taxable in
Florida. As noted previously, Wilton Manors’ total sales (including expenditures by both
residents and visitors) totaled $196.1 million per year in 2018.
Of course, there are many reasons beyond available sales that can cause retail vacancies. In
addition to design and functional differences in existing space, property owners may also
maintain vacant retail as a means to prepare multi-tenant properties for sale, as vacancies at
sale do not require lease buy-outs. It is not known if, or how much of the existing vacant space
in Wilton Manors may fall under this ‘strategic vacancy’ classification.
Using a resident-based analysis, it is apparent that Wilton Manors has more retail space than
its resident population alone can sustain; like other Florida communities, it also relies on
visitor/tourist-based spending to support local food & beverage. Wilton Manors has developed a
niche in the Florida marketplace in attracting LGBTQ visitors over many years and is a
recognized ‘gay travel’ destination because of its gay-friendly culture and broader tolerance.
The LGBTQ community is an important retail market and critical to ongoing growth and
sustained retail activity but is also almost completely undocumented in terms of actual
spending.
The LGBTQ Visitor Market
One of the differentiating conditions in Wilton Manors is its specialized tourism market. As is the
case in many south Florida communities, Wilton Manors also receives a portion of the regional
tourism market, and the city particularly benefits from its evolution as a destination for the
LGBTQ visitor submarket, attracted by the safe and gay-friendly atmosphere of the town. Two
annual events, The Stonewall Festival (held each June during Pride Month) and Wicked Manors
(held at Halloween) are recognized as major destination events for gay visitors.
In terms of economic impact and spending by category, Fishkind & Associates conducted a
study of the economic impacts of the one-day Stonewall Pride Festival and Parade, which
suggested that attendance at the 2017 event totaled 33,700 persons. A survey was
conducted to determine the point-of-origin of visitors (including those who came to the event
WTL +a
R e a l E s t a t e & E c o n o m i c A d v i s o r s W a s h i n g t o n , D C — P r o v i n c e t o w n , M A 2 0 2 . 8 8 5 . 9 1 2 1 3 0 1 . 5 0 2 . 4 1 7 1 7 7 4 . 5 3 8 . 6 0 7 0 10 3

WTL+a
from Broward County and visitors from outside Wilton Manors/Broward County). Of the
estimated 33,700 who attended the parade and festival, 75% (or about 25,300 persons) were
from Broward County and 25% (or about 8,400 persons) attended from outside the area.
Total direct (estimated actual spending) and indirect (multiplier effect of direct spending
through other resulting business activity) was estimated to total just over $2 million. In
addition to the Stonewall Parade and Festival and the Wicked Manors celebration at Halloween,
Wilton Manors’ proximity to the Port of Fort Lauderdale also provides a link to gay-friendly cruise
ship passengers who come to the area before/after their cruises.
Anecdotally, it has been stated that Broward County/Fort Lauderdale/Wilton Manors is a major
destination for the gay travel market. However, RDS LLC and WTL+a were unable to find
economic data on the Wicked Manors Halloween event. The annual Wicked Manors Halloween
parade and celebration is a destination event drawing large numbers of LGBTQ and other
visitors to Wilton Manors each October. While there is apparently no empirical data
documenting attendance at the Wicked Manors event, it was assumed that attendance is equal
to estimates for the Stonewall event, as identified in the economic impact study prepared by
Fishkind & Associates, Inc. As a result, both events were included in an estimate of annual
LGBTQ visitors, totaling 67,400 visitors to these two events alone.
In fact, given the large number of LGBTQ visitors to the area, it was surprising how little
actual data exists about the gay travel submarket in Broward County. Clearly the
Convention & Visitor Bureau’s marketing efforts have increased the scale of the gay travel
market, and Wilton Manors also has a number of private guest houses and other non-hotel
lodging facilities located near downtown/Wilton Drive. However, there is no commercial-
branded hotel located in Wilton Manors; hotel market potentials are documented elsewhere in
this report.
RDS also found that there is surprisingly little information about actual spending for the
LGBTQ market niche either in Florida or nationally; these data gaps make it difficult to
project estimated visitor spending from Wilton Manors’ well-established LGBTQ consumer
markets. Strategies to address and document these data gaps are included as part of
recommended implementation strategies in Section 5 of this report. As single-day events, the
Stonewall Parade and Festival presents a possible basis for future spending, both during
Wicked Manors and for the general LGBTQ travel market.
WTL +a
R e a l E s t a t e & E c o n o m i c A d v i s o r s W a s h i n g t o n , D C — P r o v i n c e t o w n , M A 2 0 2 . 8 8 5 . 9 1 2 1 3 0 1 . 5 0 2 . 4 1 7 1 7 7 4 . 5 3 8 . 6 0 7 0 10 4

WTL+a
The gay travel market is a major growth area for the U.S. tourism industry nationally, but
as mentioned above, is (surprisingly) not well-documented. As noted below, a specialized
marketing organization in San Francisco has conducted a number of surveys of gay travel
consumers and has produced data over the past 15 years on travel preferences, priorities, and
frequency of travel (but not by destination locations). Unfortunately, these survey summaries
have provided very little specific data on typical expenditure levels or the amounts spent by
categories (i.e., food & beverage, lodging, travel costs, retail, entertainment).
Wilton Manors is frequently mentioned as a gay travel destination along with other locations
such as Provincetown, MA; Palm Springs, CA; San Francisco; and Florida’s Key West. A major
source of attitudinal and behavioral preferences is Community Marketing Inc. (CMI), a San
Francisco company that has conducted a series of national surveys of LGBTQ travel consumers
to provide a statistically-valid representation of gay travel preferences/priorities for over 25
years. CMI’s surveys are conducted in several different formats: online surveys; in-depth
interviews; focus groups (both on-line and in-person); and advisory boards. The company is
considered the most broadly-based source of data on LGBTQ travel opinions and preferences.
The most recent CMI study was based on data collected in late 2017 and included a 10-minute
on-line survey in October of that year. Data was collected from 3,703 self- identified members
of the LGBTQ community. Of the respondents, 88% were from a random sample of the
Community Marketing & Insights LGBTQ research panel, an organization that has been built
over 25 years with the partnership of over 300 LGBTQ media, organizations and events. The
other 12% of respondents contributed through email and social media channels.
To represent a viable cross-section of ages in the survey (in which respondents were eligible for
prize drawings of money or Amazon credit), weighted results were calculated based on the
following:
Millennials (born between 1982 and 1998) comprised 33% of the total
Generation X (born between 1965-1980) comprised 33%
Baby Boomers (born between 1946 and 1964)
In terms of gender representation:
Gay and bisexual men accounted for 47.5% of the total
WTL +a
R e a l E s t a t e & E c o n o m i c A d v i s o r s W a s h i n g t o n , D C — P r o v i n c e t o w n , M A 2 0 2 . 8 8 5 . 9 1 2 1 3 0 1 . 5 0 2 . 4 1 7 1 7 7 4 . 5 3 8 . 6 0 7 0 10 5

WTL+a
Lesbian and bisexual women accounted for 47.5% of the total
Gender expansive respondents (transgender; trans woman; trans man; non-binary gender
identity; genderqueer; and gender fluid)
In actual responses, 63% were gay and bisexual men; another 31% were lesbians and bisexual
women; respondents who classified themselves as gender expansive and ‘other’ constituted the
remaining 9%. Key findings of the 2017 survey are detailed below:
Average Household Income—the LGBTQ market is affluent, with 25% earning less than
$50,000 per year 30% of respondents had incomes between $50,000 and $99,999; 18%
had household incomes of $100,000 to $149,999; and 21% had incomes of over
$150,000. A total of 7% of those surveyed “preferred not to answer”. By comparison,
average annual household income in the U.S. in 2017 was $59,309. Higher average
household incomes allow the LGBTQ market to afford frequent travel.
Relationship Status—approximately 31% of respondents described themselves as single;
34% were married; 15% were in a relationship and living with a partner; 10% were in a
relationship but not living with a partner; 3% are engaged to be married; and 2% were in a
civil union or domestic partnership; 2% were divorced; 2% were widows or widowers; and
other was 1%.
Age—respondents were generally well-distributed across age ranges, with 5% between
ages 18 and 24; 7% between ages 65-69, and 6% over age 65. Other age groups (in 5-year
increments) were between 10% and 12% of the total.
Travel in the Past Year—when asked about travel in the past year, the average number of
leisure/vacation trips was 3.2, although 50% of respondents had taken three or more trips,
and almost a fifth (18%) had taken six or more leisure trips in 2016.
Flights & Nights—LGBTQ travelers took an average of 3.7 round-trip flights and stayed in
paid accommodations for an average of 10.5 nights over the year.
Marriage & Honeymoons—among respondents, 12% indicated marriage in the past 12
months. Europe and beach vacation destinations are the most popular trips for these
respondents, with 7% of respondents visiting Florida, and 6% taking a cruise.
WTL +a
R e a l E s t a t e & E c o n o m i c A d v i s o r s W a s h i n g t o n , D C — P r o v i n c e t o w n , M A 2 0 2 . 8 8 5 . 9 1 2 1 3 0 1 . 5 0 2 . 4 1 7 1 7 7 4 . 5 3 8 . 6 0 7 0 10 6

WTL+a
LGBTQ-Family Friendly Destinations—these destinations are preferred, although families
with younger children overwhelmingly favored child-friendly destinations. 85% of LGBTQ
parents with children under age 18 have traveled with their children, for an average of 2.2
trips over the year. Child-friendly destination preferences included Urban or City Vacations
(55%); Visit Family as reason for travel (55%); and Beach or Beach Town (54%).
Relative Spending Levels—for travel in the past year, an average of 4% were
characterized as Luxury Travelers; 32% described themselves as Moderate Price traveler
with “a little luxury”; 24% were classified as Moderate-Price travel; Budget traveler (with an
occasional splurge) equaled 29%; and Budget/Economy traveler comprised 11% of the
overall respondents. Spender definition allocations shifted by age group and gender.
These spender classification proportions have remained consistent over the years.
Domestic/International Travel—77% of those surveyed have valid Passports, but only
53% had traveled internationally during 2016.
Cruise Travel—13% of all travelers had taken a cruise with at least one night at sea during
2016.
Destination Attributes—45% of respondents chose travel destinations that are LGBTQ-
friendly (50% of men, 38% of women); 37% chose places known for food & beverage or for
being ‘relaxing’.
Hotel Brand Loyalty—loyalty to a hotel brand’s membership program ranked fourth as a
motivator in the hotel selection process, while location and value ranked second as
priorities.
Top U.S. Destinations—among gay and bisexual men, Fort Lauderdale/Wilton Manors
ranked fifth as a destination for leisure or business travel and staying in a hotel,
sharing fifth place with Washington, DC and Chicago (drawing a total of 14% to 15% of all
travelers). New York City was the top destination (22%), followed by Las Vegas, Los
Angeles and San Francisco (16% to 19% each). Miami and Palm Springs ranked eighth
(12% to 13%). Other top Florida destinations were Key West/Florida Keys and Tampa/St.
Petersburg (7% to 9%). Among lesbian and bisexual women, Fort Lauderdale and the
Florida Keys were ranked 12th.
WTL +a
R e a l E s t a t e & E c o n o m i c A d v i s o r s W a s h i n g t o n , D C — P r o v i n c e t o w n , M A 2 0 2 . 8 8 5 . 9 1 2 1 3 0 1 . 5 0 2 . 4 1 7 1 7 7 4 . 5 3 8 . 6 0 7 0 10 7

WTL+a
The importance of the local LGBTQ travel market in Wilton Manors is very significant, but
it is surprising how little specific spending and visitor/tourist information is collected and
documented on this critical market. In fact, extensive research conducted by RDS LLC failed
to find comparative or specific spending data. As a result, in order to understand the
relationship between total spending, potential visitor spending and supportable retail space, we
utilized two methodologies. The first compared retail spending across similarly-sized
communities in Florida with a comparison of the 2018 Half-cent Sales Tax for nine communities
in five counties. As illustrated previously in Table 29 and Table 30, we estimated the portion of
total taxable retail sales which are likely attributable to non-resident submarkets.
However, we also note that total sales estimates based on the Half-Cent Sales Tax do not
include sales of non-taxable goods and products, particularly most categories of grocery store
sales. In order to properly consider these additional sales, RDS and WTL+a utilized annual
estimated sales according to the U.S. Census of Retail Trade/Claritas, Inc.; in Wilton Manors,
this taxable and non-taxable retail sales totaled over $196 million in 2017 by all consumers
(residents and visitors combined). The analysis then explored likely spending by LGBTQ
visitors to Wilton Manors based on 2018 VISITFlorida reports (which utilize 2016 visitor survey
data).
In order to develop an estimate of annual LGBTQ visitor spending in Wilton Manors, we
considered two categories of data assumptions. The first assumption estimates total annual
visitors who identify as LGBTQ, and bases that estimate on research from certifiable sources.
The approach to address this question utilized data from annual visitation to Broward County as
tracked by VISITFlorida and the Broward County Convention & Visitors Bureau in their surveys
of hotel occupancies, tourists and visitor groups, and other sources.
The second data assumption utilizes expenditure information collected by VISITFlorida for
visitor spending (by retail category). This data is based on 2018 VISITFlorida reports,
incorporating spending summaries from 2016 visitor data (the most current information
available). As illustrated in Table 30 below, there were 112.4 million visitors to Florida in 2016.
Of this total, VISITFlorida reports that 12.27 million (10.9%) came to Broward County.
To determine the proportion of total visitors to Broward County who classify as LGBTQ (and
therefore potential visitors to Wilton Manors), a range of 5% to 10% was applied to total
visitation. This range is based on multiple surveys over many years of the U.S. population that
WTL +a
R e a l E s t a t e & E c o n o m i c A d v i s o r s W a s h i n g t o n , D C — P r o v i n c e t o w n , M A 2 0 2 . 8 8 5 . 9 1 2 1 3 0 1 . 5 0 2 . 4 1 7 1 7 7 4 . 5 3 8 . 6 0 7 0 10 8

WTL+a
identifies as LGBTQ—from the Kinsey surveys of the 1950s to more recent U.S. Census data.
When these same proportions are applied to Broward County’s annual 2016 visitation, the
number of LGBTQ visitors to Broward County was estimated at 899,800 in 2016 (i.e., a
7.5% midpoint of the estimated 5% to 10% of the population that identifies as LGBTQ), or
51,000 to just over 100,000 LGBTQ visitors per month.
In advance of a LGBTQ-specific visitor analysis, a methodology has been developed to provide
a baseline estimate of LGBTQ visitation and spending in Wilton Manors. Utilizing verifiable
retail sales tax data from the Florida Department of Revenue (DOR) and spending patterns as
extracted from 2016 VISITFlorida data (latest data available), it appears that approximately
10% to 20% of all Broward LGBTQ visitors visit Wilton Manors on a daily/weekly/monthly (non-
event) basis throughout the year. Using this range, RDS and WTL+a estimate that Wilton
Manors receives between 157,000 and 247,000 LGBTQ visitors annually (this includes
visitors to the Stonewall and Wicked Manors one-day festivals). We note that the addition of a
branded hotel on Wilton Drive could potentially increase annual overnight visitation and total
LGBTQ-attributable sales, as total spending correlates with average length-of-stay.
While other anecdotal estimates of LGBTQ visitation to Wilton Manors suggest higher totals,
this methodology has attempted to document a visitor count based on more complex data
sources. These estimates should be considered conservative and will necessitate further
testing and documentation as a result of suggested future research on LGBTQ visitors as
described in the implementation recommendations in Section 5.
The next step in the analysis seeks to understand potential LGBTQ visitor spending in Wilton
Manors. Therefore, average spending (by retail category) and trip length-of-stay were applied
using 2016 VISITFlorida survey data. Visitor spending varies according to regionally-adjusted
data collected within the eight “vacation districts” identified by VISITFlorida. Wilton Manors is
located within the Southeast Vacation Region, which includes Palm Beach, Broward, Miami-
Dade, and Monroe Counties (Key West). For domestic (U.S.-based) travelers, the Southeast
Vacation Region is the second most-visited region in the state, capturing fully 18% of total
Florida visitation. Only the Central Vacation District, which includes Orlando and the
surrounding area, captures a greater proportion of visitors to Florida (36%). Notably, the
Southeast district also has the highest proportion of single travelers as well as the highest
spending on nightlife/entertainment among the state’s eight vacation regions.
WTL +a
R e a l E s t a t e & E c o n o m i c A d v i s o r s W a s h i n g t o n , D C — P r o v i n c e t o w n , M A 2 0 2 . 8 8 5 . 9 1 2 1 3 0 1 . 5 0 2 . 4 1 7 1 7 7 4 . 5 3 8 . 6 0 7 0 10 9

WTL+a
Table 30: LGBTQ Visitation Analysis
2016 2017 2018
Total Visitors to Florida 112,400,000 118,800,000 121,600,000
Average Per Month Average Per Week Average Per Day
9,366,667 2,161,538
307,945
9,900,000 2,284,615
325,479
10,133,333 2,338,462
333,151
Total Visitors to Broward County As % of State
12,270,000 10.9%
12,800,00010.8%
Average Per Month Average Per Week Average Per Day
1,022,500 235,962 33,616
1,066,667 246,154 35,068
Total LGBTQ Visitors to Broward County (Using 2016 Visitor Estimates) Based on % Estimates of Population 5% 7% 10%
Average Per Month Average Per Week Average Per Day
51,125 11,798 1,681
71,575 16,517 2,353
102,250 23,596 3,362
Avg. Ann'l LGBTQ Visitors to Broward 899,800
Average of 5% - 10% Range Per Month Average of 5% - 10% Range Per Week Average of 5% - 10% Range Per Day
74,983 17,304 2,465
Estimated Capture of LGBTQ Visitors to Wilton Manors 10% 15% 20%
Estimated Annual Total + Visitors to Wilton Manors Events (1) TOTAL-Annual LGBTQ Visitors:
89,980 67,000
156,980
134,970 67,000
201,970
179,960 67,000
246,960
Average Per Month Average Per Week Average Per Day
13,082 3,019
430
16,831 3,884
553
20,580 4,749
677
(1) Based on total visitors to Stonewall Festival (33,500) and Wicked Manors (33,500). Both are one day events. Visitor counts to the Stonewall Festival are estimates from the 2017 Fishkind & Associates August 2017 economic impact analysis.
Source: VISITFlorida, 2018 Reports; RDS LLC; WTL+a, March 2019.
WTL +a
R e a l E s t a t e & E c o n o m i c A d v i s o r s W a s h i n g t o n , D C — P r o v i n c e t o w n , M A 2 0 2 . 8 8 5 . 9 1 2 1 3 0 1 . 5 0 2 . 4 1 7 1 7 7 4 . 5 3 8 . 6 0 7 0 11 0

WTL+a
For purposes of estimating visitor spending in Wilton Manors, four daily spending categories
were selected, and average daily spending from 2016 data was inflated to 2018 dollars. These
metrics are necessary to determine the amount of supportable retail space generated by
LGBTQ tourism to Wilton Manors. Daily spending among the four primary spending categories
is illustrated in Table 31.
Although there is not currently a branded chain-affiliated hotel located in Wilton Manors and
occupancy and room rate data for the city’s guest houses was not available, average daily
lodging expenditures (including additional charges for room service, Internet, parking, etc.) was
included in the analysis to demonstrate both additional spending for hotels and the share of
overall spending (not including transportation costs to travel to Florida) represented by
hotel/lodging expenses.
As illustrated, total spending per visitor during their stay (not including lodging or
transportation costs) is $326.33, with about 46% (or more than $149) of the total spent on
Food & Beverage, 26% spent on Entertainment & Recreation, 23% spent on Shopping and
5.6% spent on Consumer Services. Depending on the capture rate from all visitors to Broward
County, the 157,000 to 247,000 LGBTQ visitors to Wilton Manors spent between $51.2
million and $80.6 million on these four retail categories in 2018.
To test this estimate, we reiterate that total annual taxable and non-taxable retail sales in Wilton
Manors is $196 million according to the U.S. Census of Retail Trade/Claritas, Inc. As noted
previously, RDS assumed that roughly two-thirds (65%) of total sales by Wilton Manors
residents will be made in Wilton Manors’ retail stores and businesses, or $127.4 million per
year. It was further assumed that remaining resident-based spending will be made in other
locations outside of the city. Therefore, the difference—roughly $68.6 million annually—would
be made by other market segments. This estimate is bracketed by the estimated range of
LGBTQ visitor spending identified above.
The final step in this analysis seeks to determine the amount of supportable retail space
generated by LGBTQ visitor spending in Wilton Manors. As detailed below, in this analysis total
estimated sales (by category) are divided by required annual sales productivities necessary to
warrant property owner investment and provide acceptable investment returns.
WTL +a
R e a l E s t a t e & E c o n o m i c A d v i s o r s W a s h i n g t o n , D C — P r o v i n c e t o w n , M A 2 0 2 . 8 8 5 . 9 1 2 1 3 0 1 . 5 0 2 . 4 1 7 1 7 7 4 . 5 3 8 . 6 0 7 0 11 1

WTL+a
Table 31: Estimated Annual Spending by LGBTQ Visitors to Wilton Manors
Estimated Daily Spending Per Visitor (By Category) (1) Estimated Estimated Total
Capture LGBTQ Visitors Event LGBTQ Food & Entertainment & Consumer Total Daily Lodging & Rate @ to WM Visitors (2016) Visitors to WM Beverage Recreation Shopping Services Spending (2) Lodging Exp.
Annual LGBTQ Visitors to Broward County 899,800 $ 149.42 $ 84.87 $ 73.71 $ 18.33 $ 326.33 $ 262.58
10% 89,980 67,000 156,980
Estimated Annual Sales (By Category)
$ 23,455,728 $ 13,322,853 $ 11,571,492 $ 2,877,236 $ 51,227,309 $ 41,219,532
15% 134,970 67,000 201,970 $ 30,178,069 $ 17,141,143 $ 14,887,848 $ 3,701,843 $ 65,908,904 $ 53,032,927
20% 179,960 67,000 246,960 $ 36,900,411 $ 20,959,433 $ 18,204,203 $ 4,526,450 $ 80,590,498 $ 64,846,322
(1) Visitor spending based on 2016 visitor surveys from VisitFlorida, increased by 2.5% per year (Consumer Price Index) to 2018. (2) Total daily spending excluding lodging and transportation.
Source: VisitFlorida 2018 Reports; Fishkind & Associates, Inc.; RDS LLC; WTL+a, March 2019.
WTL +a
R e a l E s t a t e & E c o n o m i c A d v i s o r s W a s h i n g t o n , D C — P r o v i n c e t o w n , M A 2 0 2 . 8 8 5 . 9 1 2 1 3 0 1 . 5 0 2 . 4 1 7 1 7 7 4 . 5 3 8 . 6 0 7 0 11 2
WTL+a
Table 32 illustrates the amount of supportable retail space in Wilton Manors, by merchandise
category, for each of the potential LGBTQ visitor capture rates. This was then compared to the
existing total retail space for each category based on the September 2018 RDS inventory of
total retail space in Wilton Manors.
The analysis suggests that:
LGBTQ visitor spending supports 138,000 to 217,000 sq. ft. of retail space (i.e., less
than half of the 494,500 sq. ft. of Wilton’s existing retail space in these four
categories)
At the highest capture rate (20%), LGBTQ visitor spending supports approximately 70%
of Wilton Manors’ Food & Beverage businesses, generates net positive market support
for entertainment and recreation, and supports approximately 45% of all retail businesses
Given the relatively small resident population of Wilton Manors, this finding reinforces both
the value of the gay-friendly character of Wilton Manors, as well as the importance of
sustaining (and potentially increasing) the volume of LGBTQ visitors, and
Without immediate/direct access to the beaches, the lack of a hotel and stronger specialty
retail concentrations in surrounding communities, Wilton Manors needs to implement
proactive strategies to keep LGBTQ visitors to strengthen the city’s economic base.
WTL +a
R e a l E s t a t e & E c o n o m i c A d v i s o r s W a s h i n g t o n , D C — P r o v i n c e t o w n , M A 2 0 2 . 8 8 5 . 9 1 2 1 3 0 1 . 5 0 2 . 4 1 7 1 7 7 4 . 5 3 8 . 6 0 7 0 113

WTL+a
Table 32: Estimated LGBTQ Visitor-Supported Retail Space
Average Annual Retail Sales Productivity (Per SF)
$ 400 $ 350 $ 350 $ 350 Total
Food & Entertainment Consumer Supportable Capture Rate @ Beverage & Recreation Shopping Services Space (SF)
10% 58,639 38,065 33,061 8,221 137,987
15% 75,445 48,975 42,537 10,577 177,533
20% 92,251 59,884 52,012 12,933 217,080 % Distribution 42% 28% 24% 6% 100%
Existing Space 131,164 50,801 116,316 196,213 494,494
% of Total SF 70% 118% 45% 7% 44%
Source: Broward County Property Appraiser; RDS LLC; WTL+a, March 2019.
WTL +a
R e a l E s t a t e & E c o n o m i c A d v i s o r s W a s h i n g t o n , D C — P r o v i n c e t o w n , M A 2 0 2 . 8 8 5 . 9 1 2 1 3 0 1 . 5 0 2 . 4 1 7 1 7 7 4 . 5 3 8 . 6 0 7 0 11 4

WTL+a
5Preliminary Implementation Strategies
Wilton Manors’ unique market position in Broward County reinforces the need to sustain
attractions such as The Venue, the cluster of food & beverage and entertainment locations
(such as the Wilton Drive corridor), and to strategically manage and increase the services and
dining options serving both resident and visitor markets. We note that, in 2015, the City of
Wilton Manors passed a referendum authorizing creation of the Wilton Drive Improvement
District (WDID), and subsequently designated an annual assessment from 58 properties along
Wilton Drive for a total up to $100,000 per year. The Improvement Association meets regularly
and has provided financial support for administrative, promotional and other activities to benefit
Wilton Drive. There is also a Wilton Drive Business Association, although the two groups are
not formally aligned for planning and implementation.
While this is a major (and positive) step toward revitalization of key commercial districts or
corridors in Wilton Manors, RDS and WTL+a recommend that a more comprehensive approach
be implemented and funded, and the efforts of the Improvement District and the Business
Association, the City and other stakeholders should be coordinated through creation of a full-
time staff structure for downtown revitalization. In addition, we also recommend the geography
be expanded to incorporate commercial locations along N. Andrews Avenue, Old Dixie
Highway, and NW 26th Street. While Wilton Drive is the commercial heart of the city and the
focus of most activities, the secondary commercial areas should also be included so that all
commercial redevelopment is addressed through a central resource and staff.
Experience with commercial district management programs across the country suggests that
they are most often funded, either fully or on a matching basis, by local government. This
includes district capital investments and infrastructure, management and coordination; and
intersecting interests of both the public and private sectors. Without having dedicated staffing to
provide proactive day-to-day coordination and management, we suggest the full opportunity to
reduce vacancies and increase sales will not be reached.
WTL +a
R e a l E s t a t e & E c o n o m i c A d v i s o r s W a s h i n g t o n , D C — P r o v i n c e t o w n , M A 2 0 2 . 8 8 5 . 9 1 2 1 3 0 1 . 5 0 2 . 4 1 7 1 7 7 4 . 5 3 8 . 6 0 7 0 11 5

WTL+a
It is recognized the City of Wilton Manors has a small resident population and serves many
community needs for infrastructure and social services from a relatively small tax base. Without
the typical Florida revenue source of hotel/motel (transient occupancy) taxes (used in every
major tourism destination in the state to fund marketing and other services benefitting
established visitor markets), an alternative as detailed below is suggested to fund a commercial
district management program. If, in addition to the Wilton Drive Improvement District, a district
management program can be re-established and a dedicated staff hired, a number of other
critical organizational, marketing, design and economic development programs can be
considered and implemented.
As a result, the following preliminary implementation strategies are organized into three major
topical areas: Commercial District Management, Data Collection and Documentation and
Public Policies and Planning. Each part begins with specific recommendations, with the
rationale for the recommendations presented in the text which follows each suggestion.
Commercial District Management
Recommendation #1:
Expand Funding for the Wilton Drive Improvement District (WDID)
Consider implementing an expansion of the existing boundaries of the Wilton Drive
Improvement District. This would serve to increase the amount of the annual special
assessment generated to fund additional commercial management activities.
Currently, the WDID comprises 56 properties and generates gross annual funding of
$100,000 (2017 budget), and $96,000 after a 4% collection allowance. This funding is used
for special events and promotional activities and provides contractual services in ‘clean and
green’ activities
Expanding the boundaries of the district would generate additional funding critical to
reestablish a commercial district management office as identified in Recommendation
#2 below
The City’s Ordinance establishing the WDID also grants it the power to finance,
construct, operate and maintain certain public infrastructure improvements.
Boundary expansion and funding could potentially be used for public realm
WTL +a
R e a l E s t a t e & E c o n o m i c A d v i s o r s W a s h i n g t o n , D C — P r o v i n c e t o w n , M A 2 0 2 . 8 8 5 . 9 1 2 1 3 0 1 . 5 0 2 . 4 1 7 1 7 7 4 . 5 3 8 . 6 0 7 0 116

WTL+a
improvements as identified in the plan to enhance the overall marketability of Wilton
Drive and the surrounding commercial district
Recommendation #2:
Use Additional Revenues for Ongoing Funding to Reestablish a Commercial District
Management Office
Combine a Main Street program and Night Manager roles as explained below
Work with current partners and new initiatives between the City and the private sector
to provide event planning and management coordination
Serve as the liaison between public and private sectors on downtown Wilton Manors
issues
Provide organizational support to sustain the retail mix and focus on reducing the
amount of vacant commercial/retail space
In areas with older commercial buildings, locally-owned businesses, and a strong reputation for
nighttime entertainment, two complementary approaches to commercial management are
suggested. The first is a ‘Main Street ‘-type management approach that addresses a series of
downtown area needs. Created over 40 years ago, the Main Street program is a national effort
to coordinate and provide management and design assistance to older commercial districts
across the U.S. There are currently 40 states providing state-administered programs in over
3,400 communities. The Florida Main Street program is directed through the Florida Division of
Historical Resources, and has 32 accredited Main Street communities, three ‘apprentice’
communities and 12 as-yet unaccredited towns participating. The Main Street Approach ©
offers a programmatic structure for local managers, and requires action in four areas of
improvement:
Organization—Work with property owners, business owners, City government and local
institutions to coordinate efforts to benefit the downtown area, create/sustain businesses
and jobs, increase sales and strengthen the tax base
Promotion—Use events such as Wicked Manors, the Stonewall Festival, entertainment,
and recreational programs and targeted marketing to encourage visitation, community
identity/pride and celebrate the positive aspects of successful commercial districts
WTL +a
R e a l E s t a t e & E c o n o m i c A d v i s o r s W a s h i n g t o n , D C — P r o v i n c e t o w n , M A 2 0 2 . 8 8 5 . 9 1 2 1 3 0 1 . 5 0 2 . 4 1 7 1 7 7 4 . 5 3 8 . 6 0 7 0 117

WTL+a
Design—Provide technical assistance for better storefront and sign design, better displays,
building maintenance, and streetscape improvements to keep commercial districts attractive
and desirable as places to spend time, shop, dine, and invest; and
Economic Sustainability—Work with City planning and economic development staffs over
the longer-term to integrate new retail businesses, housing, hotels and office uses to
strengthen the economic base of the city. By integrating appropriate urban and building
design elements, economic sustainability is combined with the community’s evolving
character, but without losing its identity and history.
The Main Street program is based on a flexible, well-established approach to community
revitalization that is both focused on the commercial district and inclusive of broader community
development goals, such as providing more housing at all price levels, filling vacancies and
attracting new businesses and services. This idea is entirely complementary to the approach
and objectives of the Wilton Drive Improvement District, but it also broadens its approach and
organizes its marketing and other activities into a more comprehensive strategy.
Because the program is directed by the National Main Street Center/Main Street America in
Chicago, the approach and participation are managed through state programs, such as the
Florida Main Street Program in Tallahassee. Establishing a program requires localities to fund
paid staff positions, who function as ‘managers’ of the downtown area, and serve as a bridge
between the public and private sectors to jointly revitalize the area, both in the public and private
property realms.
For this reason, it is suggested that the local retail sales tax be slightly increased to fund the
management program in addition to the Improvement District assessment. While the $100,000
per year is a significant sum, Wilton Manors will be able to achieve even more through full-time
staff management, accountable to the City and to its own Board. The Board should include
representatives from the Improvement District as well as the Business Association (both of
which can continue as separate entities, if they wish) but centrally coordinated through
commercial district management staff.
WTL +a
R e a l E s t a t e & E c o n o m i c A d v i s o r s W a s h i n g t o n , D C — P r o v i n c e t o w n , M A 2 0 2 . 8 8 5 . 9 1 2 1 3 0 1 . 5 0 2 . 4 1 7 1 7 7 4 . 5 3 8 . 6 0 7 0 11 8

WTL+a
Recommendation #3:
Explore Integrating Nightlife District Management Programs with Overall Downtown
Revitalization Strategies
Create “Night Manager” as central point of contact for business operators,
commercial property owners, tourism/marketing coordination, & police
As the Wilton Drive Improvement District matures, the City may also want to incorporate a
newer variation on commercial district management, the “Night Manager”. Because Wilton
Manors is recognized as a regional nightlife destination because of The Venue and numerous
bars and clubs (particularly on Wilton Drive), the downtown area also generates considerable
economic activity during evening/early morning hours. Active nightlife areas create other types
of management issues, including public safety, crowd management, special policing practices,
after-hours parking management, events, transportation and the like, during a time of day when
many public services are not traditionally available. Similar to a Main Street manager’s role, the
Night Manager provides a central point of contact for business operators, property owners,
tourism development and marketing, and the local police between ‘happy hours’ and late-night
business closings. Because of the nightlife component of the commercial district in Wilton
Manors, this role should also be considered, potentially as a part-time position within the WDID
management program.
Data Collection/Documentation
Wilton Manors is in a unique position to better understand the results of fostering its LGBTQ
market and other visitors as the basis for documenting economic impacts on visitor spending,
the local lodging market, commercial revitalization efforts and reducing the number of vacant
commercial/retail spaces. Part of the challenge for reducing retail vacancies is to recognize that
many spaces are empty because they are either oddly configured (i.e., too narrow; too deep;
too small; contain insufficient back-of-house space) or provide limited or no parking. Our
September 2018 retail inventory identified the locations of vacant retail space. This baseline
data can be maintained and updated by the commercial district manager’s office, and it
identifies specific properties for business recruitment, property owner research and
coordination, targeting of incentives, or new planning initiatives.
WTL +a
R e a l E s t a t e & E c o n o m i c A d v i s o r s W a s h i n g t o n , D C — P r o v i n c e t o w n , M A 2 0 2 . 8 8 5 . 9 1 2 1 3 0 1 . 5 0 2 . 4 1 7 1 7 7 4 . 5 3 8 . 6 0 7 0 119
WTL+a
Recommendation #4:
Create & Conduct Annual Lodging Survey
Track locally owned guest houses, rooms & occupied room-nights per year
Provide the City with annual monitoring data of tourism, per capita visitor
expenditures & visitor spending
The recent hotel analysis completed by HVS on behalf of the City identified market potentials to
add a 100-room hotel to the downtown area in 2023, but also pointed out limited data on the
city’s existing lodging facilities in guest houses, inns and other lodging alternatives. In order to
understand how the tourism market is affected by available lodging (or lack thereof), a new
database of lodging facilities in Wilton Manors should be created as the basis of understanding
the economic importance of the lodging market on the city’s economy and to document key
metrics (such as room counts) to guide initiatives that enhance the visitor market in Wilton
Manors.
Recommendation #5:
Identify & Form Partnerships with Local Sources & CVB to Collect Visitor Data
Conduct & analyze consumer surveys
Document the impacts of events such as the Stonewall Festival and Wicked Manors
over multiple years
Collect & evaluate visitor data (average length of stay, occupied room-nights in local
guest houses/inns)
Track/count visitors from outside Wilton Manors to events at The Venue, Wicked
Manors Parade and festival, and any new events created to draw participation &
spending from the Southeast vacation region
There is little, if any, documentation on the number of visitors to Wilton Manors; the share of
visitors who come as part of a trip to Broward County/South Florida; their length-of-stay in
Wilton Manors; or how much they spend when they visit. In a location where an estimated 44%
of commercial/retail space is supported by the visitor market, these metrics will become more
critical over time.
WTL +a
R e a l E s t a t e & E c o n o m i c A d v i s o r s W a s h i n g t o n , D C — P r o v i n c e t o w n , M A 2 0 2 . 8 8 5 . 9 1 2 1 3 0 1 . 5 0 2 . 4 1 7 1 7 7 4 . 5 3 8 . 6 0 7 0 1 20

WTL+a
Whether staffed or located within the Wilton Drive Improvement District, City Hall, a local
Tourism Development Council (TDC), or in partnership with the Greater Fort Lauderdale
Convention & Visitors Bureau (for targeted surveys and visitor research, especially through their
innovative LGBTQ office), it will be an important measure of Wilton Manors’ competitive position
to identify and document its visitor market segments.
Recommendation #6:
Work with Local Entertainment Venues on Visitor Trends
Determine actual attendance at local charity & corporate events, performances,
weddings and receptions & other event categories in Wilton Manors
Monitor non-resident spending & economic impacts on the community
Complete a survey-based analysis of the Wicked Manors Halloween parade & festival
as a parallel to the Stonewall Festival impact analysis to determine attendance,
spending, origin of visitation & other data
Visitors can also be from nearby/other locations in or near Broward County, particularly for
nighttime entertainment. Anecdotally, stakeholders suggested that parties, events, and
concerts at locations like The Venue attract “tens of thousands” of visitors from nearby
communities surrounding Wilton Manors. To understand the economic impacts of this category
of ‘visitor’, it will be useful to implement this recommendation.
Recommendation #7:
Develop Real Property Information Network
Establish real estate network with local commercial property owners & brokers
Focus on pending commercial vacancies, interested retail tenants & potential tenant
relocations/closings
Vacancies and rental rates are strong barometers of commercial/retail real estate market
performance. Because Wilton Manors has a high vacancy rate (almost 25%) among its 950,000
sq. ft. of commercial/retail inventory, this strategy recommends working with local and area
commercial brokers to learn which spaces are more difficult to lease (and why tenants are
resistant), determine achieved lease rates (or low/high ranges of lease rates), and which
WTL +a
R e a l E s t a t e & E c o n o m i c A d v i s o r s W a s h i n g t o n , D C — P r o v i n c e t o w n , M A 2 0 2 . 8 8 5 . 9 1 2 1 3 0 1 . 5 0 2 . 4 1 7 1 7 7 4 . 5 3 8 . 6 0 7 0 1 21

WTL+a
tenants are looking for space. In addition, this recommendation focuses on developing a
network to know which spaces are becoming available in advance of a tenant relocation or
closing. Work would include outreach with local brokers to understand reasons for vacant
spaces—older structures, deferred maintenance, rents are too high for achievable sales,
disinterested/unmotivated property owners, undercapitalized businesses, etc.
Recommendation #8:
Consider Creating & Funding Small, Privately-Financed Revolving Loan Fund
Provide matching public funds for façade and commercial sign improvements,
building maintenance, or code compliance improvements
Access to capital for business start-ups, small-scale improvements, or targeted building
maintenance actions is frequently a problem in smaller commercial districts like Wilton Manors.
If this is found to be an issue, consider potential sources of funds (public or private) to capitalize
creation of a revolving fund, a dedicated source of low-interest loan funds for property owners to
improve their buildings and/or tenants seeking to make improvements in their leased spaces.
These funds are frequently applied to lower-cost façade improvements and new signs, subject
to use of appropriate/approved design guidelines.
Public Policies & Planning
Because the City of Wilton Manors is ‘landlocked’ by surrounding jurisdictions, there is no new
real property available for annexation. In fact, the City reportedly owns property in a different
jurisdiction for City Facilities storage because no additional land is available. The City also
holds key parcels at the City’s Public Services Department property adjoining N. Dixie Highway
and the SFRTA rail line and around the City Hall campus on Wilton Drive. Both of these sites
could potentially be reconfigured in ways that increase efficiency of their respective
programmatic layouts and provide sub-parcels to generate net new revenues to the City either
through fee-simple sales or long-term ground leases. RDS and WTL+a would not
recommend direct sales of either of these sites as a first priority because there is so little
developable land available elsewhere in Wilton Manors.
WTL +a
R e a l E s t a t e & E c o n o m i c A d v i s o r s W a s h i n g t o n , D C — P r o v i n c e t o w n , M A 2 0 2 . 8 8 5 . 9 1 2 1 3 0 1 . 5 0 2 . 4 1 7 1 7 7 4 . 5 3 8 . 6 0 7 0 1 22

WTL+a
Recommendation #9:
Optimize Public Value on Key Public Sites—City Hall & Public Facilities
Implement mixed-use redevelopment program on surface parking lots
Add structured parking and new land uses at higher densities to generate net new ad
valorem tax revenues & other public benefits
There is potential to incorporate commercial development on portions of the City Hall site as
well as ‘edge’ commercial parcels at key intersections at the Public Services site. These sites
could include in these planning concepts, mixed-use and commercial development, a hotel and
amenities, structured parking and maintain recreational uses. . As a source of revenue for the
City, selected (and carefully analyzed so as not to compromise existing and future public
space/use demands) sub-parcels should be considered for commercial and mixed-use
redevelopment, affordable housing, hospitality/amenities, and outdoor events space. Publicly
owned surface parking lots are not the highest or best land use for Wilton Manors and should be
viewed as opportunities to optimize public benefits.
Recommendation #10:
Explore Feasibility & Deal Structure to Develop New Hotel
Undertake detailed feasibility studies to determine strategy to development new hotel
Consider various disposition strategies, including fee simple sale, ground lease,
public/private partnership, etc.
Evaluate redevelopment potential of City Hall property with consideration of
recreational and parking uses, City government needs, & ability to minimize the
‘activation gap’ on its respective side of Wilton Drive
The value of adding a new hotel to the downtown area of Wilton Manors would be evident in
several ways. As noted previously, total visitor spending correlates directly to the length of time
spent at a destination. The current mix of guest houses and small inns in Wilton Manors
provides some lodging, but many leisure travelers prefer to stay in hotels with established
loyalty programs, full services, and amenities. In addition, a national chain-affiliated hotel
provides a centralized reservations system, which expands market awareness of the property.
WTL +a
R e a l E s t a t e & E c o n o m i c A d v i s o r s W a s h i n g t o n , D C — P r o v i n c e t o w n , M A 2 0 2 . 8 8 5 . 9 1 2 1 3 0 1 . 5 0 2 . 4 1 7 1 7 7 4 . 5 3 8 . 6 0 7 0 1 23

WTL+a
Hotel guests spend outside the hotel on food & beverage, retail shopping (assuming the product
mix matches their needs), and entertainment/recreation.
In order to add a small (80- to 120-rooms is typical for a limited- or select-service property) hotel
and its associated amenities (swimming pool, dining/bar, limited meeting/event space and
parking), it will most likely be necessary to provide structured parking, rather than maintaining
the large surface parking lot at City Hall. The hotel would also benefit from flexibility in building
height considerations. Local resistance to increasing building heights in Wilton Manors will
require extensive public discussions of the advantages and disadvantages, but variations from
existing zoning regulations such as densities and building heights may be a requirement set
forth by potential developers/bidders in response to a City-issued Request for Proposals (RFP)
for mixed-use development on any publicly-owned site such as the City Hall campus.
WTL +a
R e a l E s t a t e & E c o n o m i c A d v i s o r s W a s h i n g t o n , D C — P r o v i n c e t o w n , M A 2 0 2 . 8 8 5 . 9 1 2 1 3 0 1 . 5 0 2 . 4 1 7 1 7 7 4 . 5 3 8 . 6 0 7 0 1 24


