Embed Size (px)
Citation preview
Atmospheric Sciences 321 Science of Climate
Lecture 28: Human-Induced Climate Change:
Chapter 12: Part 3

Community Business Current Topic is Chapter 12, Anthropogenic Climate Change
Homework Due Today
� Last Lecture Today
� Final Wednesday June 10, 2:30-4:20
� Study sheet on Lecture Page
� Questions?

Time to do online Course Evaluation
� here open now as of June 1, 2015,
� Closes June 8, so please take time to provide feedback.
� https://uw.iasystem.org/survey/143803
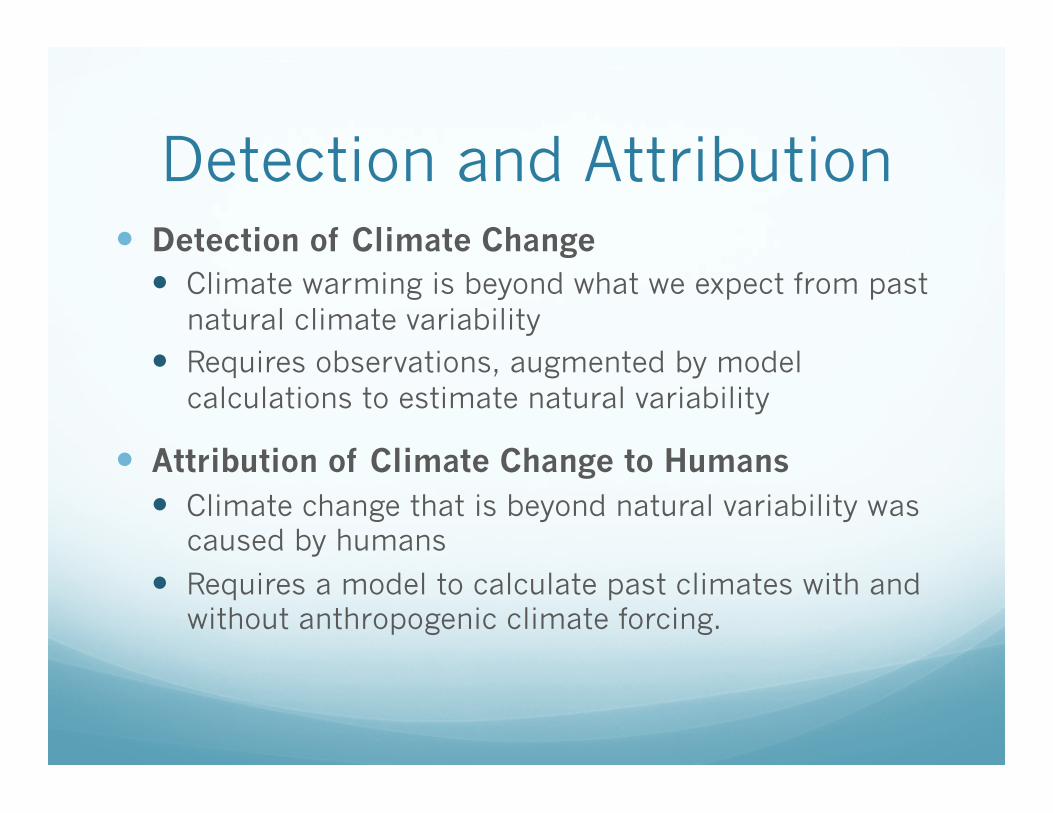
Detection and Attribution � Detection of Climate Change
� Climate warming is beyond what we expect from past natural climate variability
� Requires observations, augmented by model calculations to estimate natural variability
� Attribution of Climate Change to Humans � Climate change that is beyond natural variability was
caused by humans
� Requires a model to calculate past climates with and without anthropogenic climate forcing.
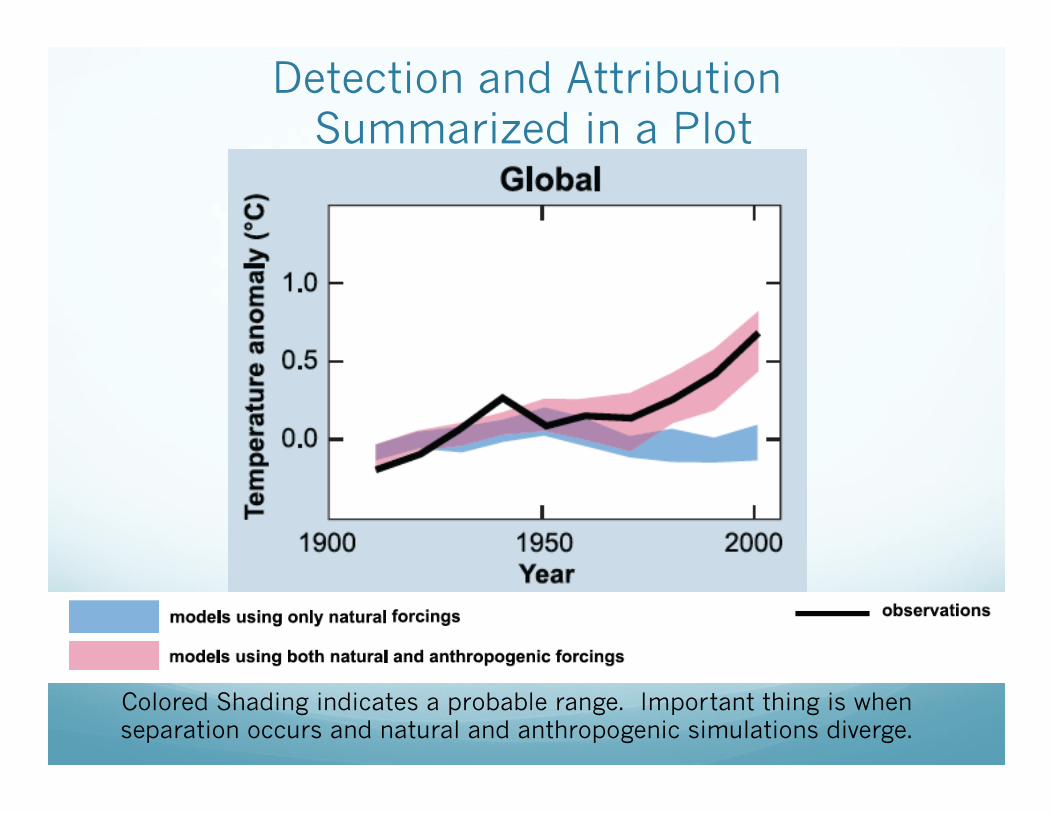
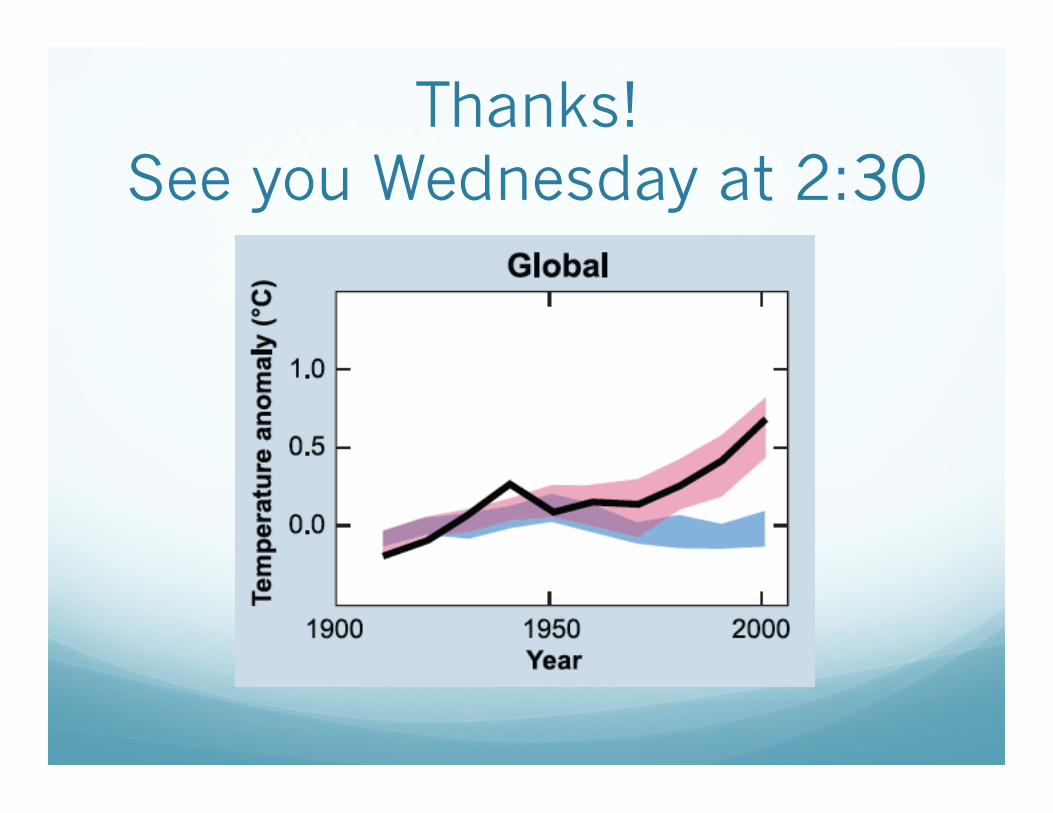
Detection and Attribution Summarized in a Plot
Colored Shading indicates a probable range. Important thing is when separation occurs and natural and anthropogenic simulations diverge.
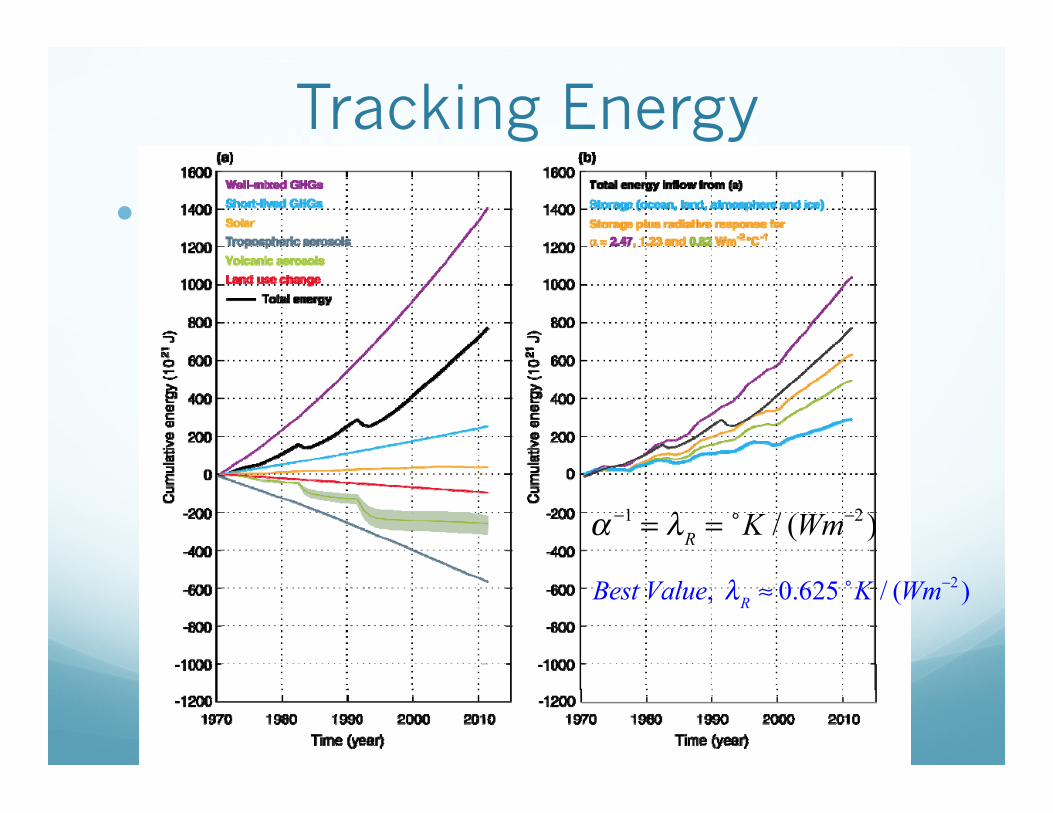
Tracking Energy
� What do we estimate has influenced the energy input to the system.
α−1 = λR = ˚K / (Wm−2 )
Best Value, λR ≈ 0.625 ˚K / (Wm−2 )
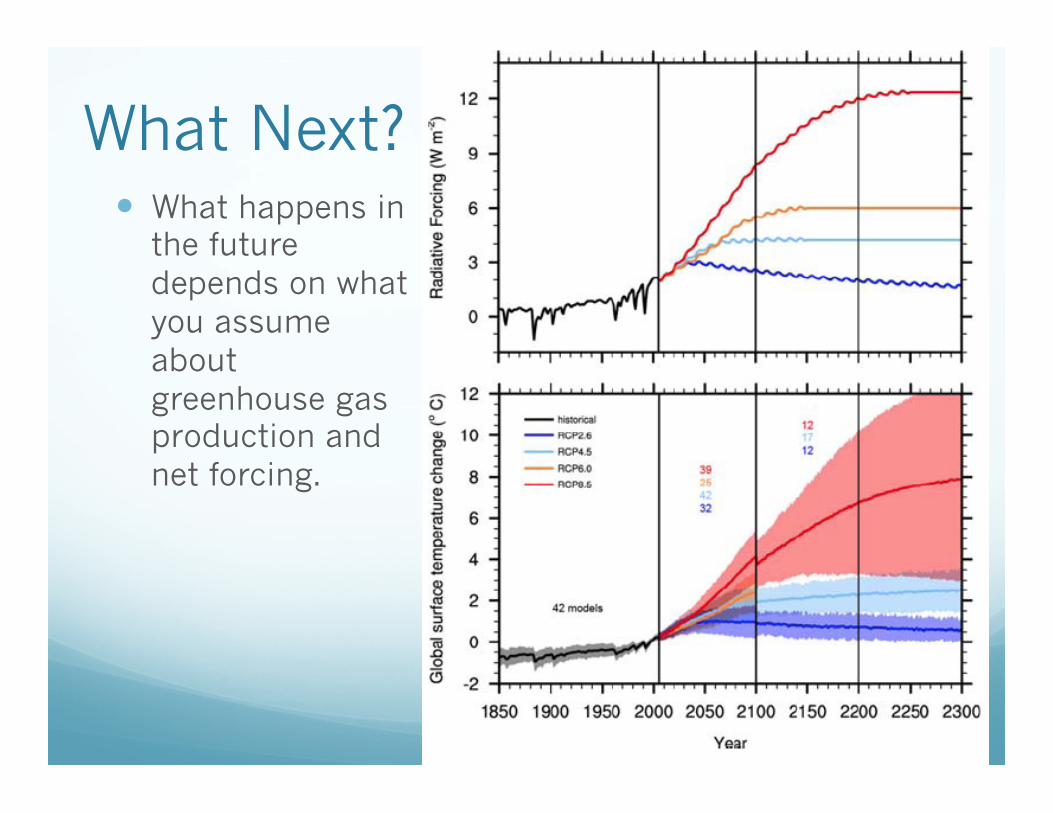
What Next? � What happens in
the future depends on what you assume about greenhouse gas production and net forcing.
It warms up: Then what? � We’ve said that according to the basic physics
expressed in the Clausius-Clapeyron equation relating saturation vapor pressure to temperature that the saturation vapor pressure increases 7% per ˚C of warming.
� Does that mean that evaporation and precipitation will also increase by 7% per degree, and so if we warm up by 3˚C by the end of the century, average precipitation will be up by 21%?
� Not in the global mean because of the Atmospheric Energy Budget constraint.
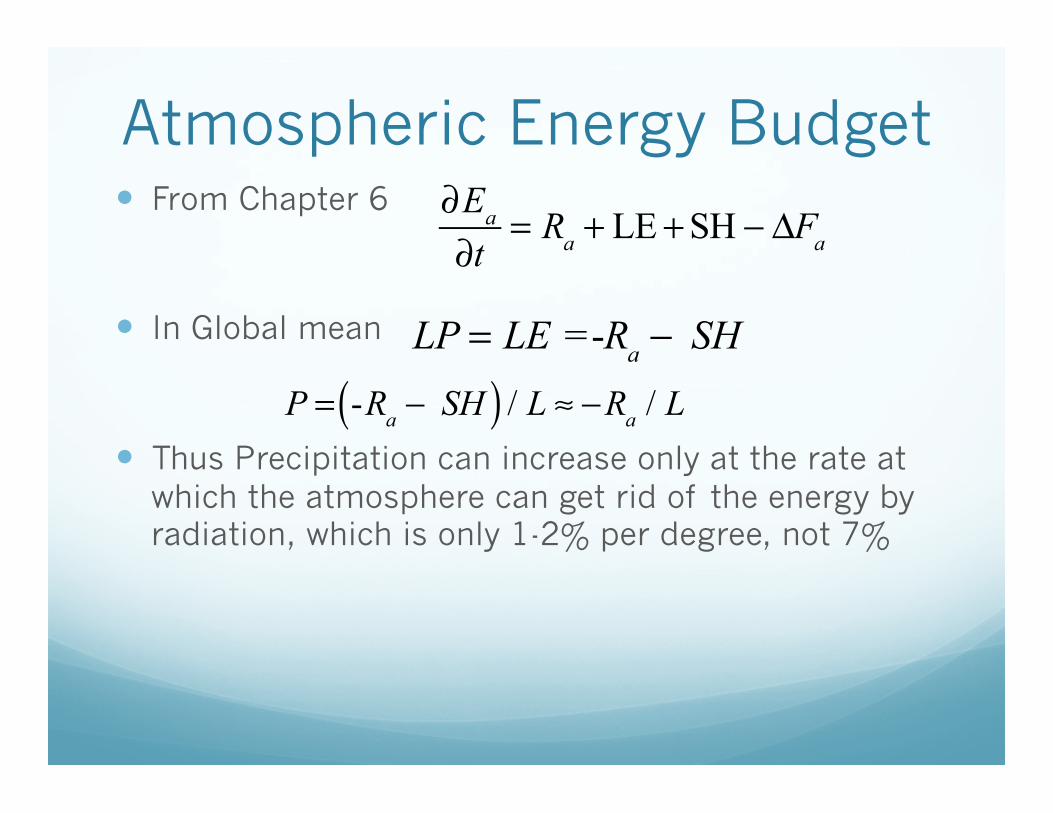
Atmospheric Energy Budget � From Chapter 6
� In Global mean
� Thus Precipitation can increase only at the rate at which the atmosphere can get rid of the energy by radiation, which is only 1-2% per degree, not 7%
∂Ea
∂t= Ra + LE +SH − ΔFa
LP = LE =-Ra − SH
P = -Ra − SH( ) / L ≈ −Ra / L
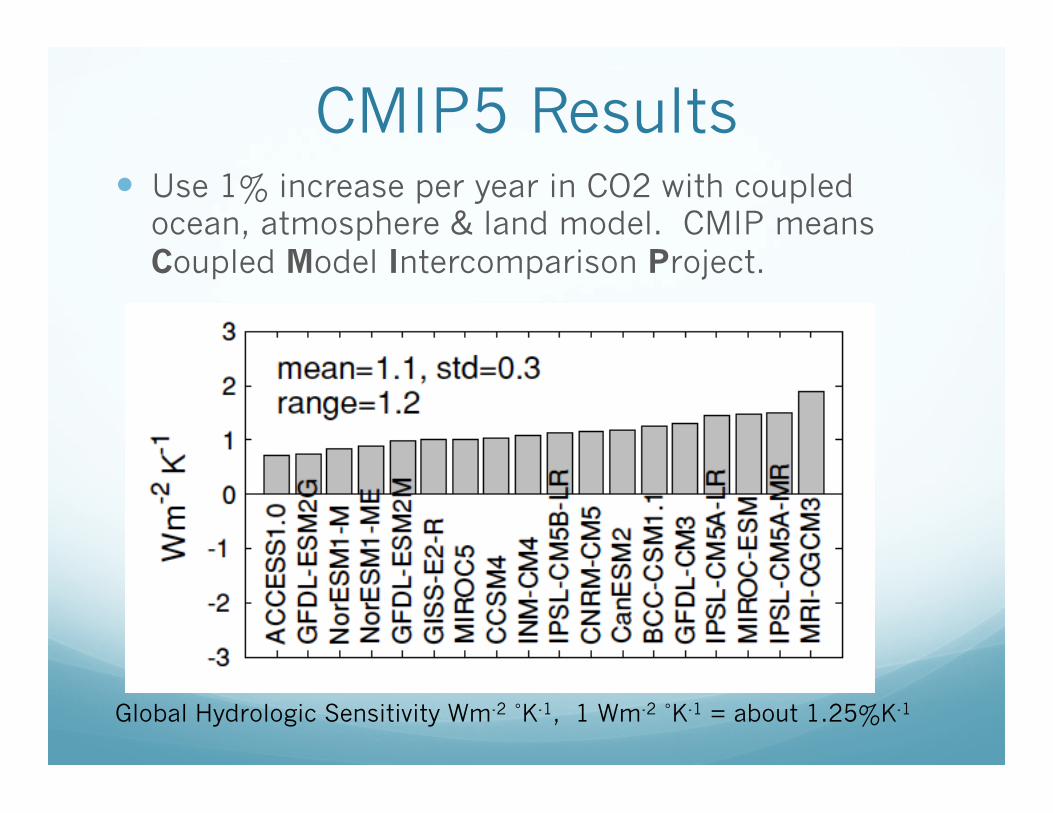
CMIP5 Results � Use 1% increase per year in CO2 with coupled
ocean, atmosphere & land model. CMIP means Coupled Model Intercomparison Project.
Global Hydrologic Sensitivity Wm-2 ˚K-1, 1 Wm-2 ˚K-1 = about 1.25%K-1
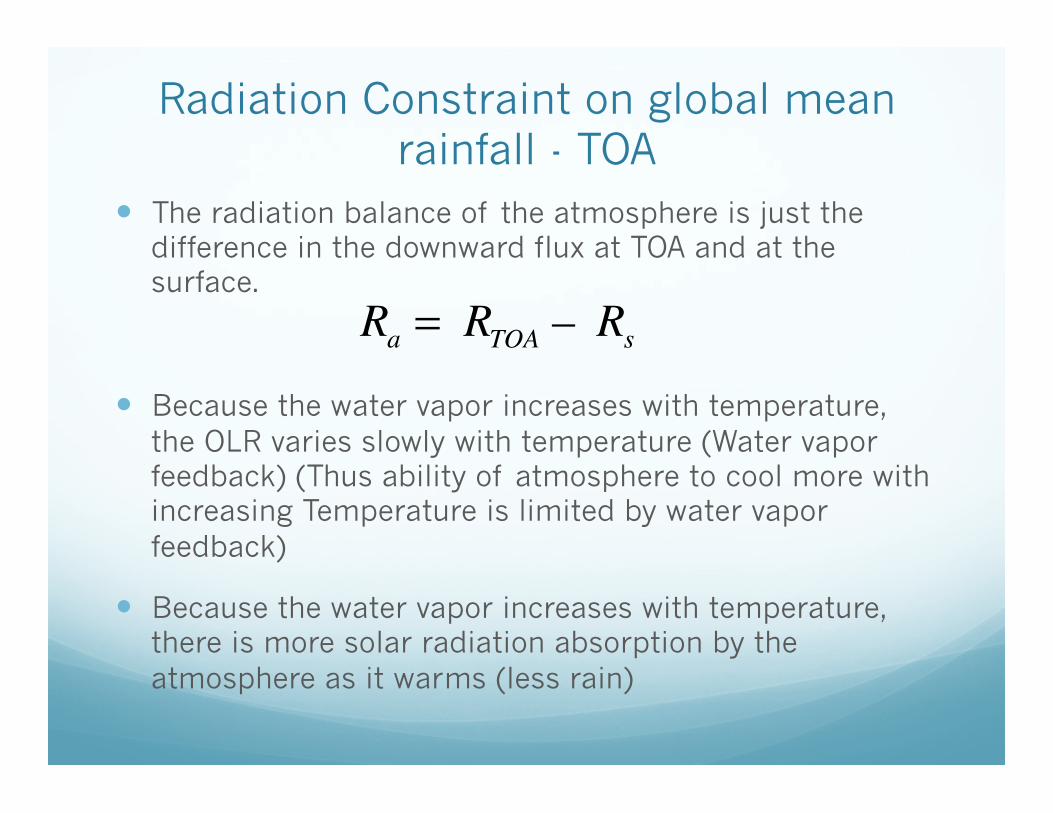
Radiation Constraint on global mean rainfall - TOA
� The radiation balance of the atmosphere is just the difference in the downward flux at TOA and at the surface.
� Because the water vapor increases with temperature, the OLR varies slowly with temperature (Water vapor feedback) (Thus ability of atmosphere to cool more with increasing Temperature is limited by water vapor feedback)
� Because the water vapor increases with temperature, there is more solar radiation absorption by the atmosphere as it warms (less rain)
Ra = RTOA – Rs
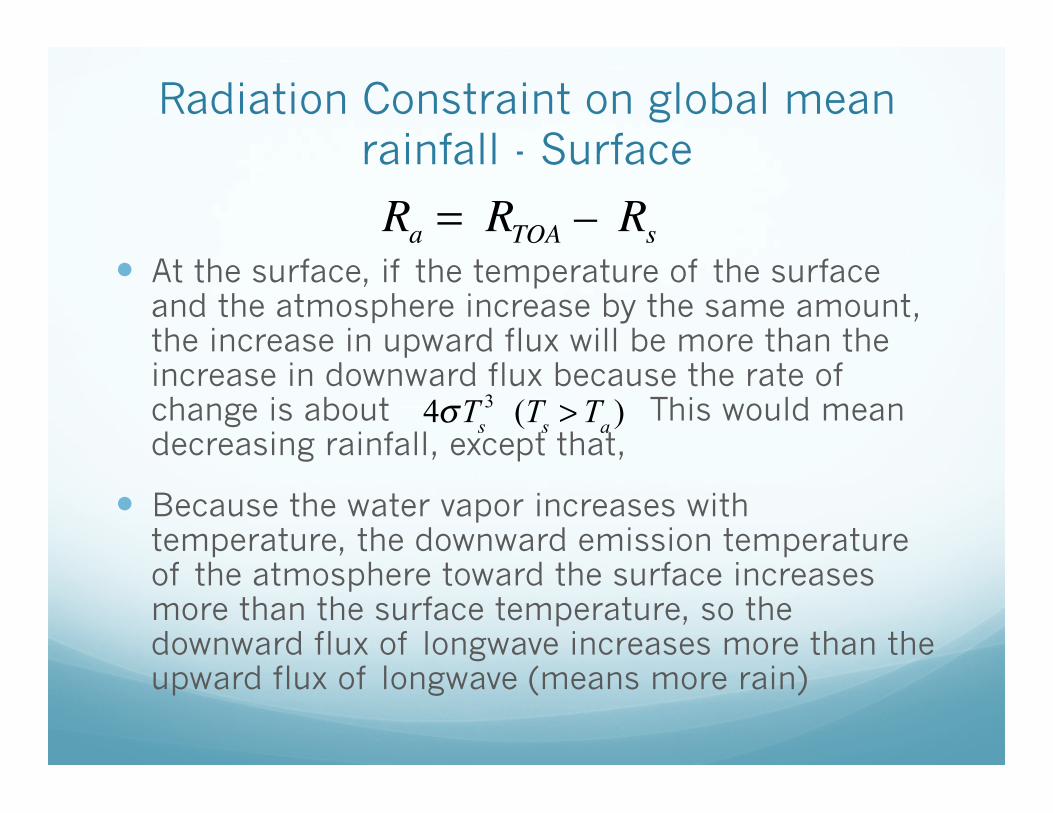
Radiation Constraint on global mean rainfall - Surface
� At the surface, if the temperature of the surface and the atmosphere increase by the same amount, the increase in upward flux will be more than the increase in downward flux because the rate of change is about This would mean decreasing rainfall, except that,
� Because the water vapor increases with temperature, the downward emission temperature of the atmosphere toward the surface increases more than the surface temperature, so the downward flux of longwave increases more than the upward flux of longwave (means more rain)
Ra = RTOA – Rs
4σTs3 (Ts > Ta )
Effect of CO2
� Adding CO2 provides a greenhouse effect that prevents radiation from escaping to space from TOA, this causes a reduction in the OLR for the same temperature.
� Thus CO2, acting by itself, will reduce rainfall (precipitation), until the climate warms up a bit.
� All this means that the global mean precipitation rate only increases about 1-2% per Kelvin of global mean warming
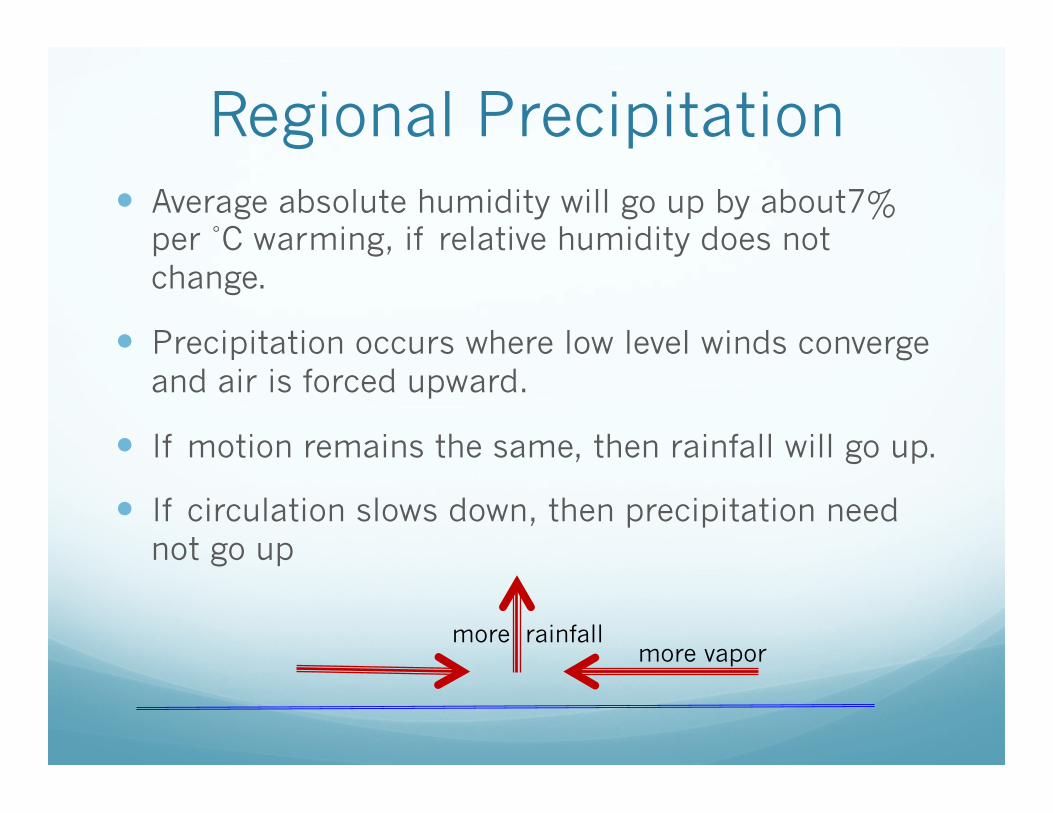
Regional Precipitation � Average absolute humidity will go up by about7%
per ˚C warming, if relative humidity does not change.
� Precipitation occurs where low level winds converge and air is forced upward.
� If motion remains the same, then rainfall will go up.
� If circulation slows down, then precipitation need not go up
more vapor more rainfall
Model Result � Models do some combination of increased
precipitation intensity and a slowed down large scale circulation.
� This gives a modest increase in total precipitation and a shift toward higher daily rates of precipitation.
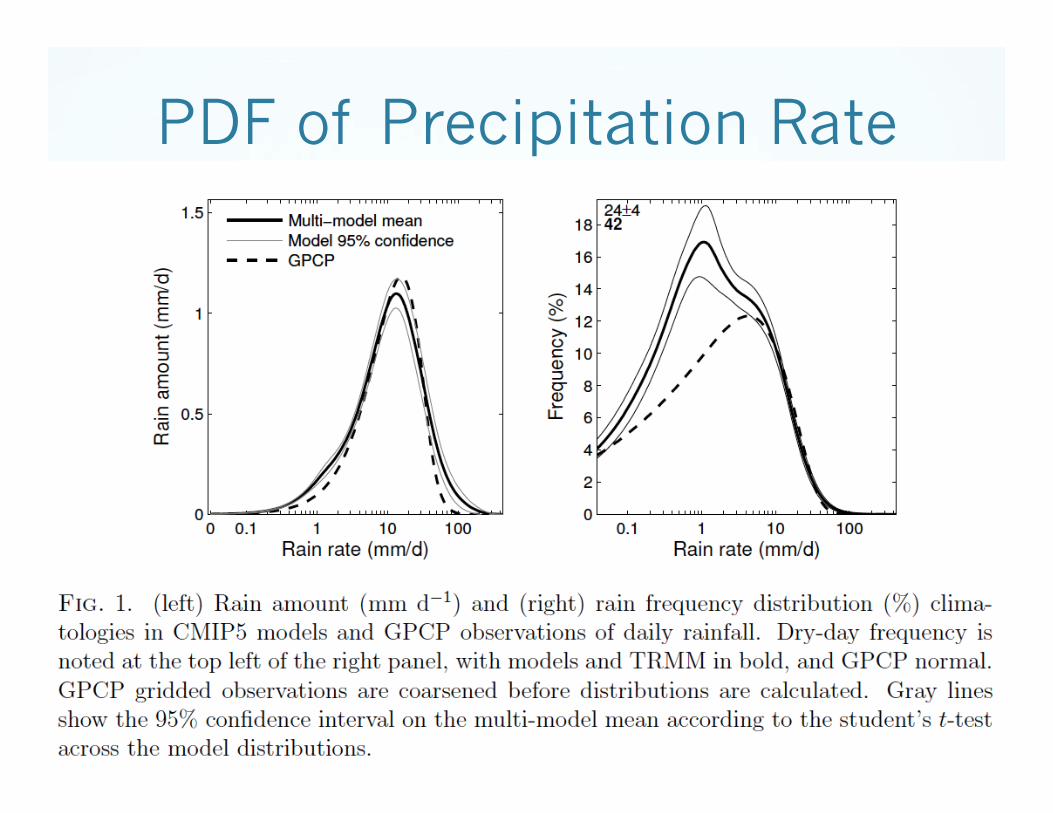
PDF of Precipitation Rate
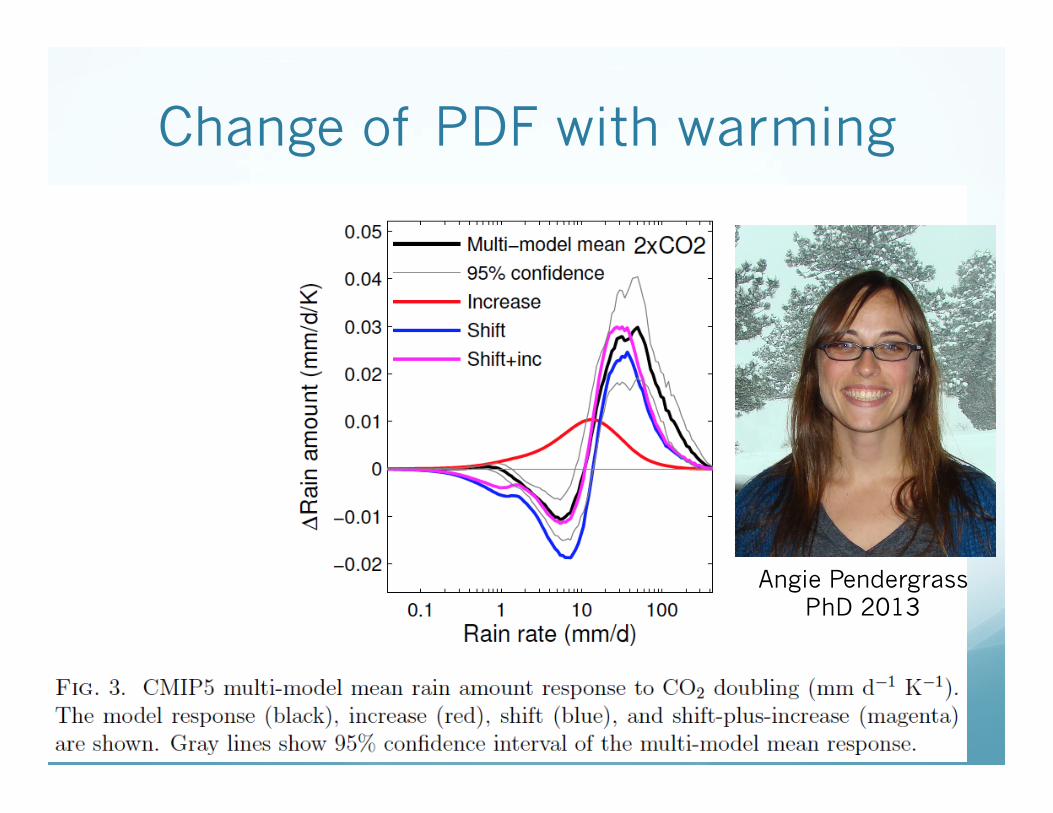
Change of PDF with warming
Angie Pendergrass PhD 2013
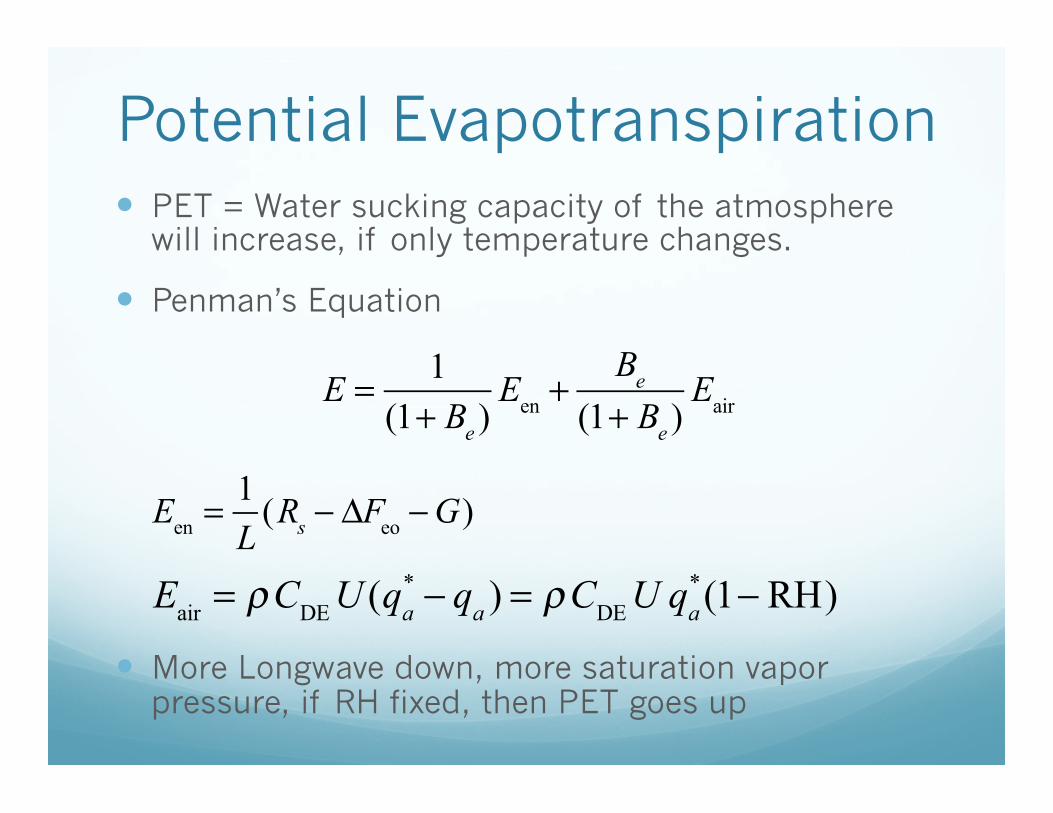
Potential Evapotranspiration � PET = Water sucking capacity of the atmosphere
will increase, if only temperature changes.
� Penman’s Equation
� More Longwave down, more saturation vapor pressure, if RH fixed, then PET goes up
E = 1
(1+ Be )Een +
Be
(1+ Be )Eair
Een =
1L
(Rs − ΔFeo −G)
Eair = ρCDE U (qa* − qa ) = ρCDE U qa
*(1− RH)
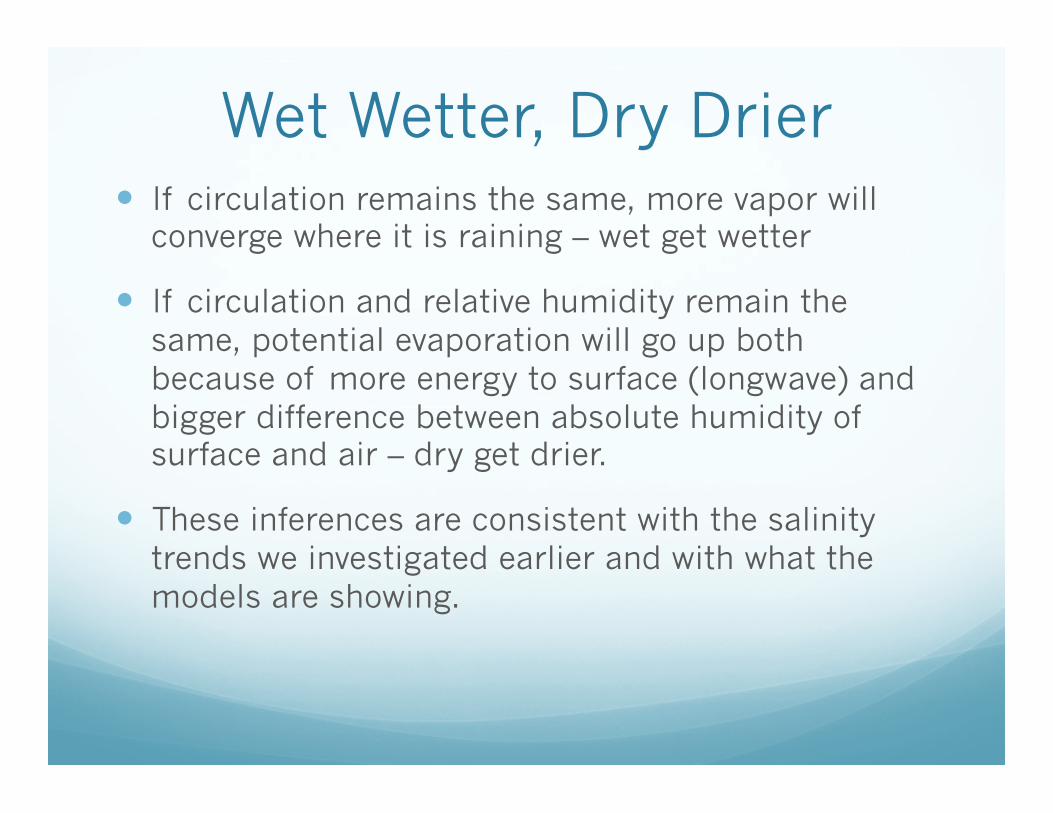
Wet Wetter, Dry Drier � If circulation remains the same, more vapor will
converge where it is raining – wet get wetter
� If circulation and relative humidity remain the same, potential evaporation will go up both because of more energy to surface (longwave) and bigger difference between absolute humidity of surface and air – dry get drier.
� These inferences are consistent with the salinity trends we investigated earlier and with what the models are showing.
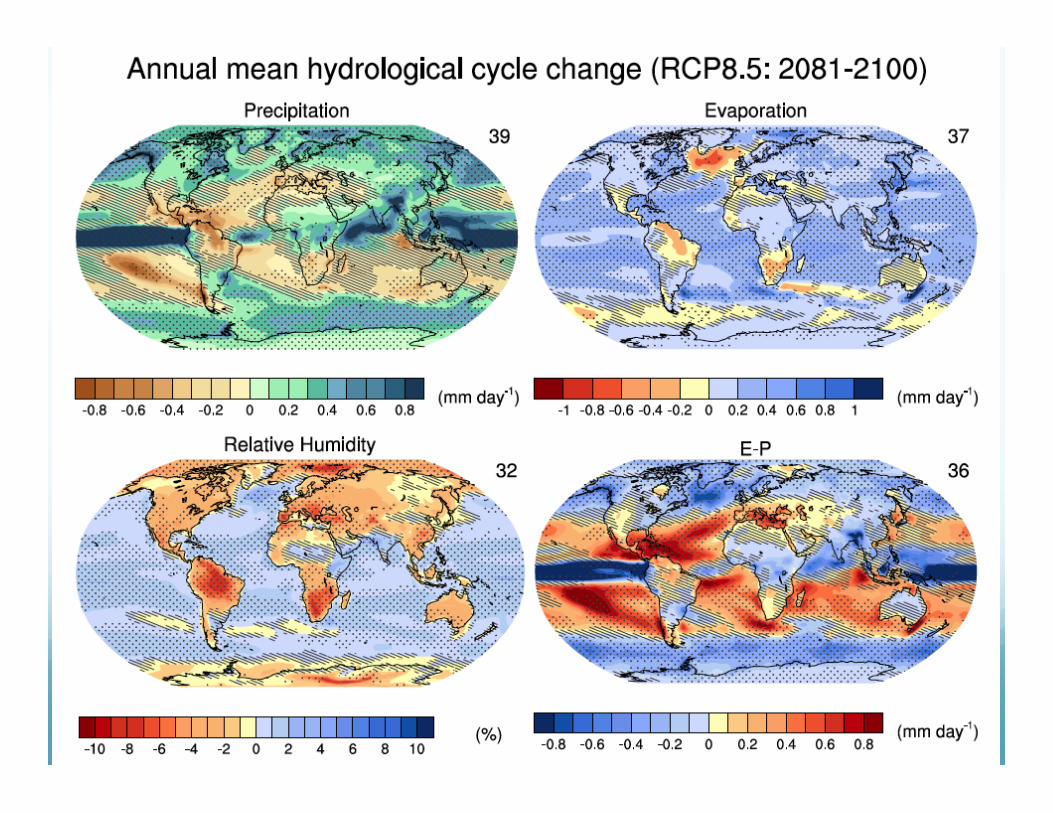
Hydrologic Cycle Predictions
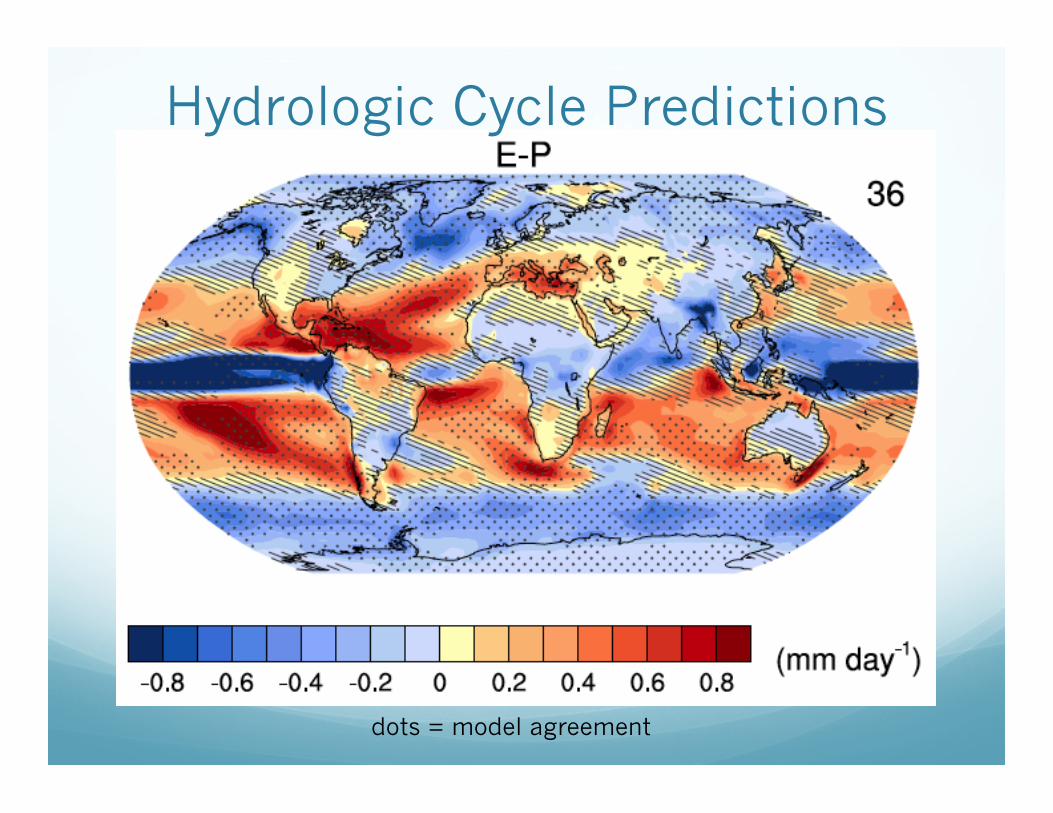
dots = model agreement
Hydrologic Cycle Predictions
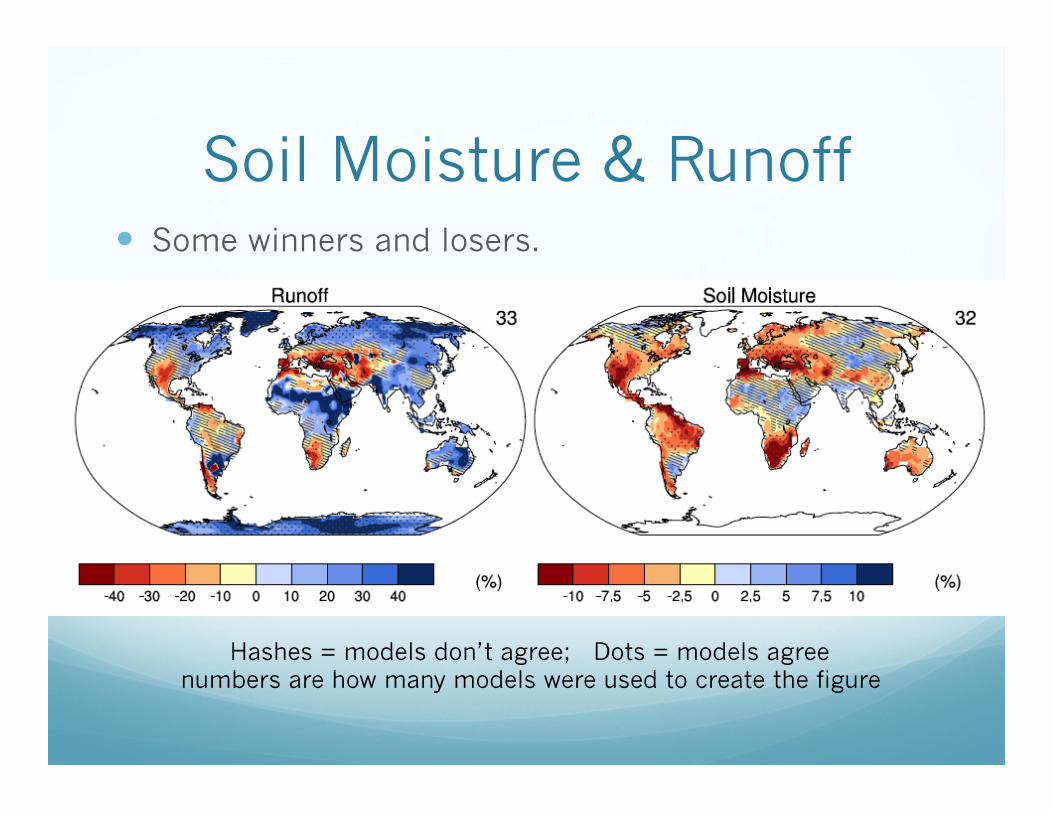
Soil Moisture & Runoff � Some winners and losers.
Hashes = models don’t agree; Dots = models agree numbers are how many models were used to create the figure
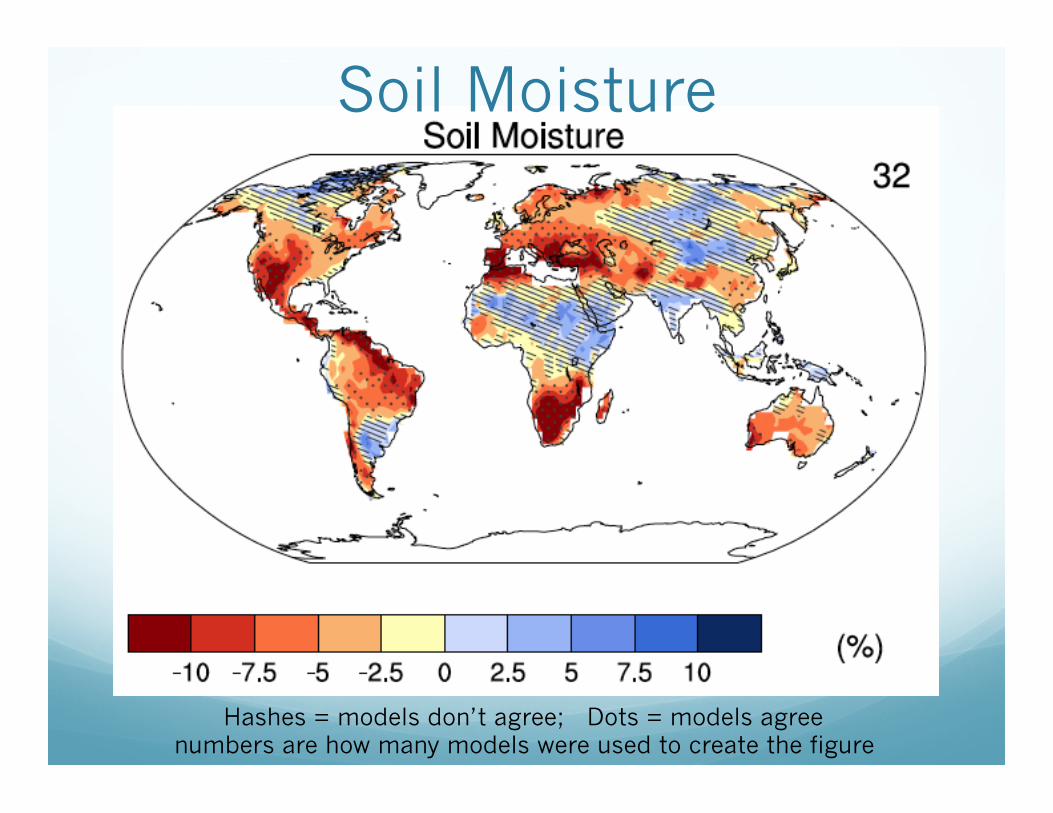
� Some winners and losers.
Hashes = models don’t agree; Dots = models agree numbers are how many models were used to create the figure
Soil Moisture
Structure of Change
� Polar and land amplification of warming
� Less warming of Oceans
� Less warming in North Atlantic – slowing of Atlantic Meridional Overturning Circulation
� Equatorial and polar amplification of precipitation � ±12% per ˚C in tropics and subtropic – extreme
wet=wetter, dry=drier.
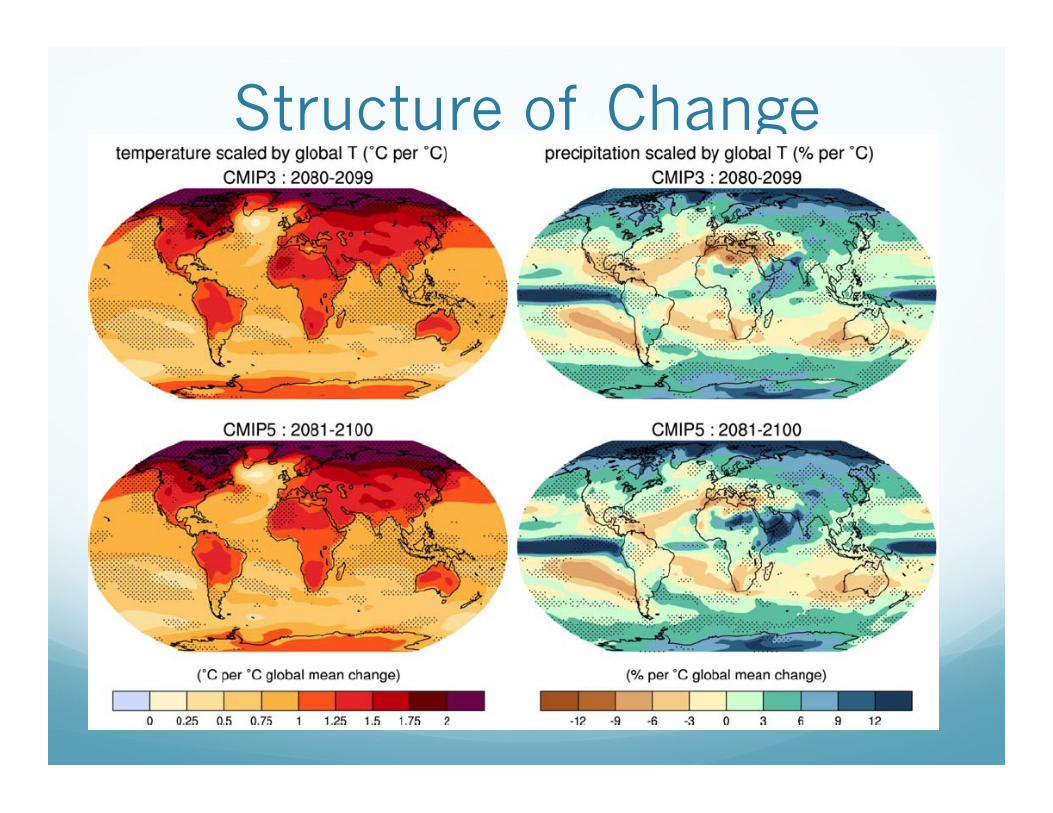
Structure of Change
� Polar and land amplification of warming
� Equatorial and polar amplification of precipitation
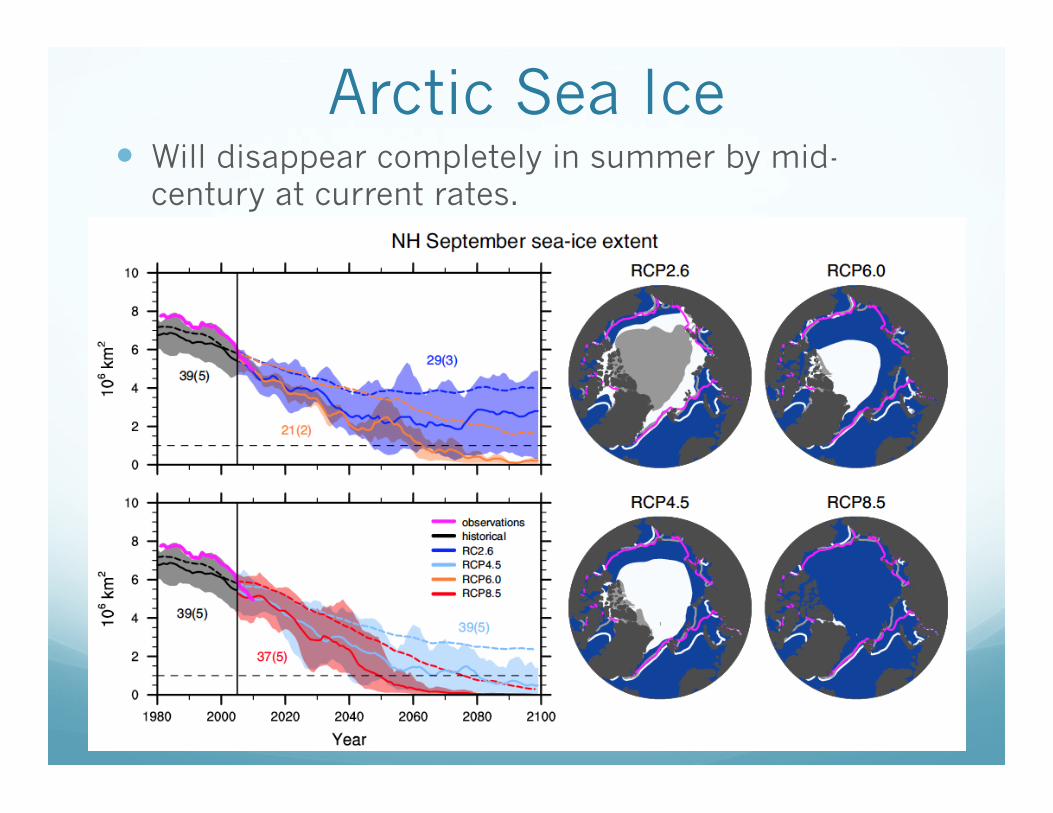
Arctic Sea Ice � Will disappear completely in summer by mid-
century at current rates.
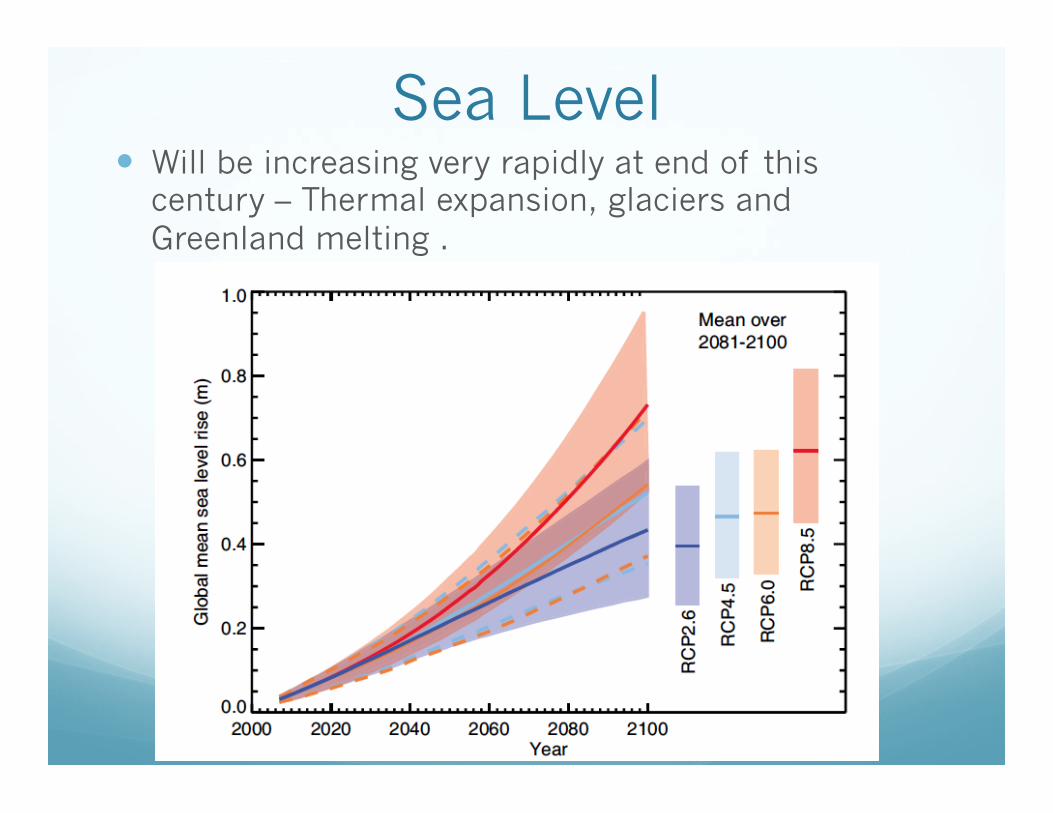
Sea Level � Will be increasing very rapidly at end of this
century – Thermal expansion, glaciers and Greenland melting .
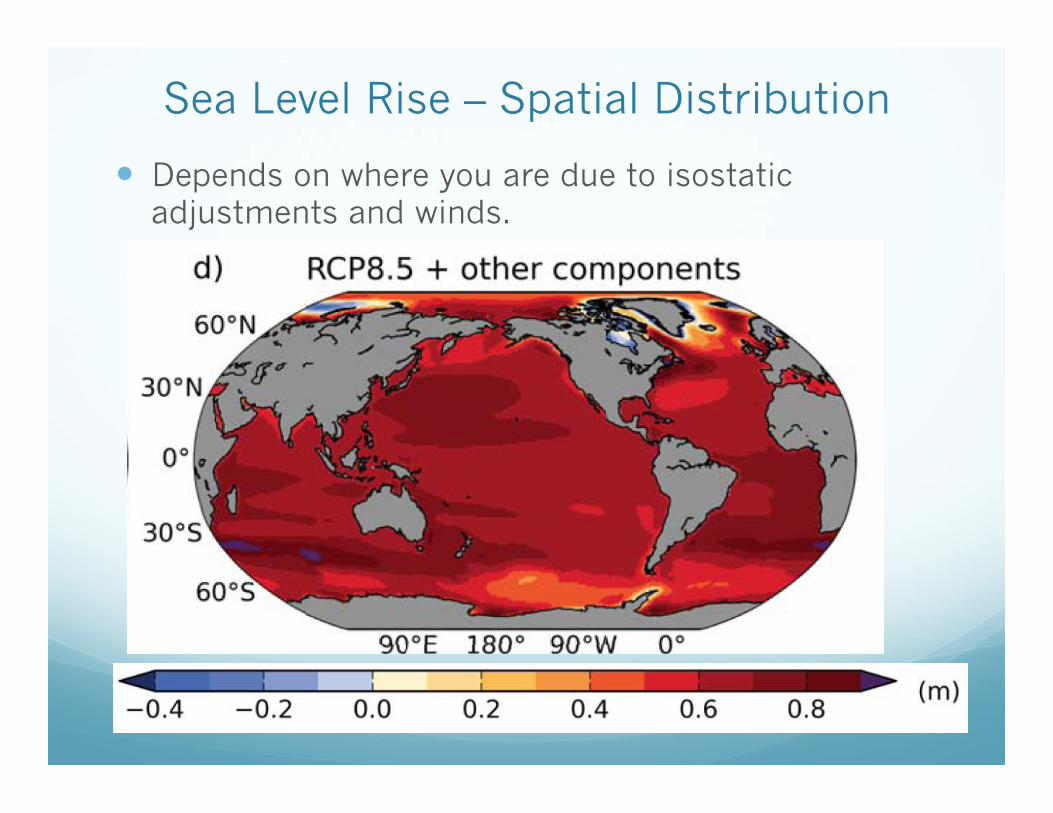
Sea Level Rise – Spatial Distribution
� Depends on where you are due to isostatic adjustments and winds.
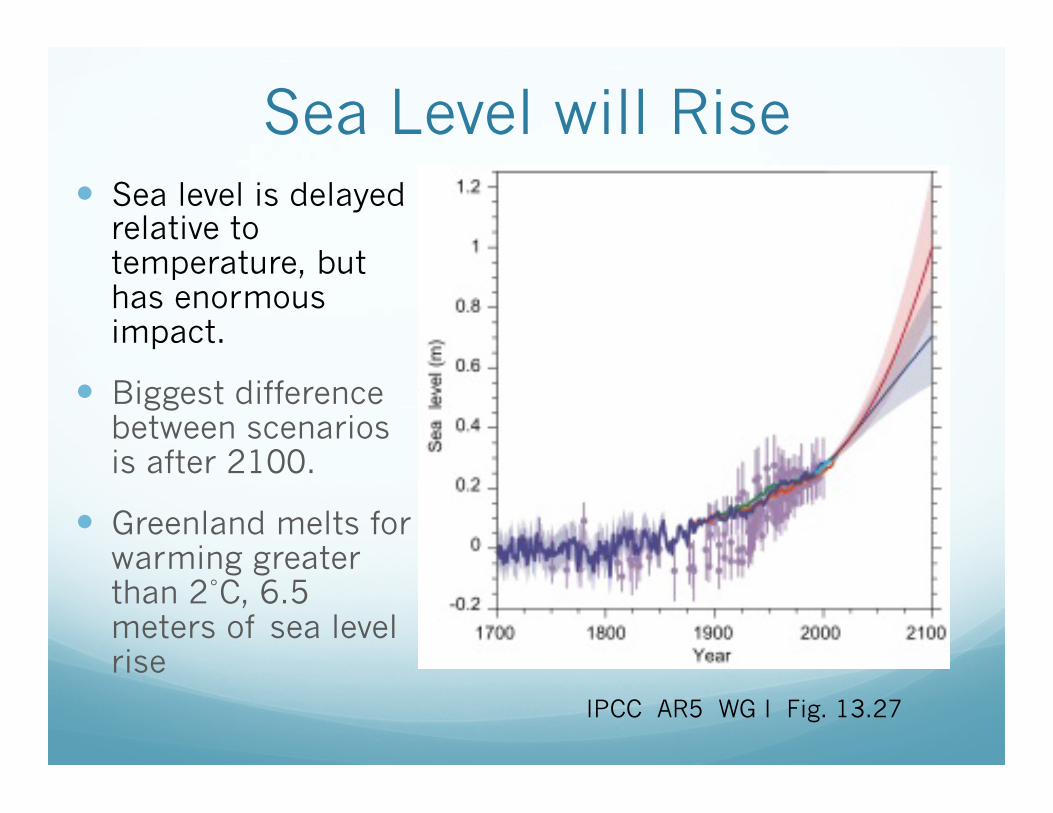
Sea Level will Rise � Sea level is delayed
relative to temperature, but has enormous impact.
� Biggest difference between scenarios is after 2100.
� Greenland melts for warming greater than 2˚C, 6.5 meters of sea level rise
IPCC AR5 WG I Fig. 13.27
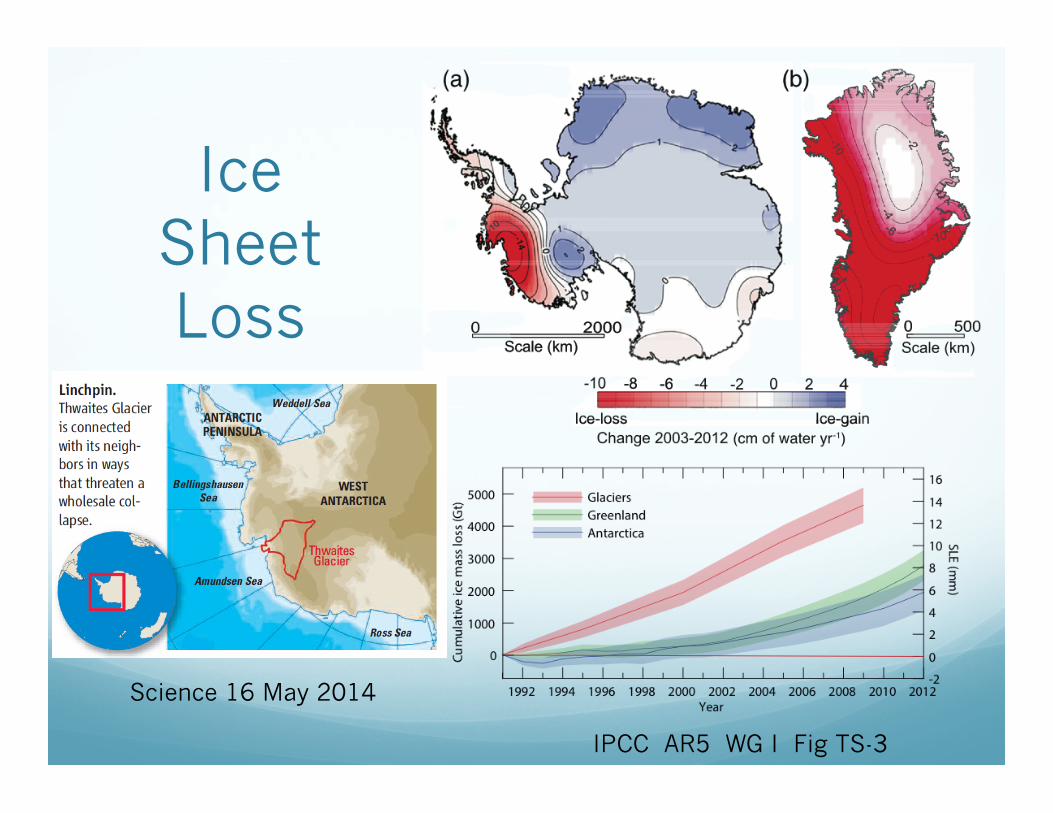
Ice Sheet Loss
IPCC AR5 WG I Fig TS-3
Science 16 May 2014
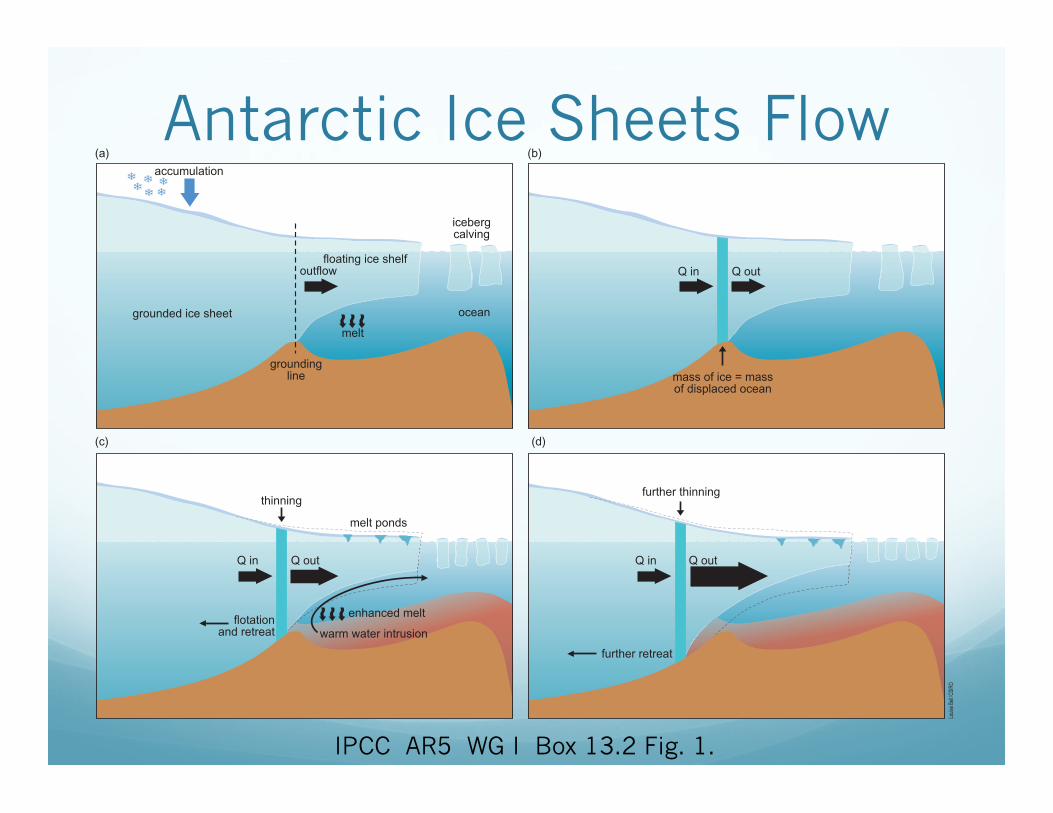
Antarctic Ice Sheets Flow � West
Antarctic Ice Sheet is about 8 meters of sea level.
IPCC AR5 WG I Box 13.2 Fig. 1.
Summary � Global warming is here
� Global mean precipitation and evaporation will change only modestly, 2%˚C-1, but wet will get wetter, dry will get drier ±12%˚C-1.
� Poles will get warmer and wetter.
� Next week: Final Examination!
Final Examination � 10 multiple choice questions – 50 pts
� 3 short answer – 30 pts
� 4 problem solving 100 pts
� 180 pts total
� Should finish in about a hour
Things to know � Stable isotopes and climate inferences
� Orbital parameter theory
� Transient climate response
� Angular momentum problem
� Radiative – convective equilibrium
� Stratospheric energy balance – radiation
� Greenhouse-gas-induced warming
Thanks! See you Wednesday at 2:30


