Embed Size (px)
Citation preview

Climate Risk Profile Somalia
This profile provides an overview of projected climate parameters and related impacts on different sectors in Somalia until 2080 under different climate change scenarios provided by the IPCC1 (called Representative Concentration Pathways, RCPs). RCP2.6 represents the low emissions scenario in line with the Paris Agreement; RCP6.0 represents a medium to high emissions scenario. Model projections do not account for effects of future socio economic impacts.
Agricultural yields: Projections for crop yields show high uncertainties. Cowpeas show a positive trend in yields. Rice yields are projected to improve, although the level of increase is highly uncertain. Future projections of millet, sorghum and maize show high inter-annual variability and no clear trend in yields can be derived.
Infrastructure: Although the projections indicate the future exposure of major roads and urban areas to flooding to be rather small, no reliable estimations on the future impacts of river floods can be made and this data should not be used for long-term planning.
GDP: Exposure of the Somalian GDP to heatwaves is very likely to strongly increase under both GHG emissions scenarios. Median model projections for RCP2.6 show an increase from 8.3 % in 2000 to 17.1 % in 2030, 19.4 % in 2050 and 22.7 % in 2080, whereas under RCP6.0, exposure is pro-jected to reach 19.0 % by 2030 and 23.7 % by 2050 and 2080.
Temperature: Depending on the scenario, t emperature in Somalia is projected to very likely rise between 1.4 – 1.9 °C by 2030, 1.5 – 2.3 °C by 2050 and 1.4 – 3.4 °C by 2080 compared to pre-industrial levels, with coastal regions being less affected than the rest of the country. The annual number of very hot days (with daily maxi-mum temperature above 35 °C) is projected to increase with high certainty all over Somalia with central Somalia being particularly affected.
Precipitation: Overall, precipitation over Somalia will very likely increase in the long run (until 2080). However, the models show quite some variance in their projections, particularly in regards to how strong and reliable this trend will be. What the models agree on is that there will very likely be high inter-annual variability in the amount of precipitation, meaning that there will be both wetter and drier years. Future Projections regarding heavy precipi-tation events are also highly uncertain, as the underlying models project very high ranges of change.
Sea level rise: The sea level is projected to rise with high certainty under both future emission scenarios. The median climate models project a sea level rise of 12 cm until 2030, 20 cm until 2050 and 36 cm until 2080 under RCP2.6, as compared to the year 2000. Under RCP6.0, the sea level is projected to rise by 11 cm until 2030, 21 cm until 2050 and 42 cm until 2080, according to the multi- model median.
Water availability: Projections of water availability in Somalia are highly uncertain under both GHG emissions scenarios. Without considering population growth, models show a slight increase in line with future precipitation pro-jections. Considering projected population growth, overall per capita water availability can be expected to half by 2080 under both emission scenarios, though uncertainty around current and projected available water volumes is extremely high. Based on this data, it is most prudent to plan for increasing uncertainty in regard to future water availability.
Summary
Ecosystems: While there is high model agreement for the projections of species richness in northern and southern Somalia, model agreement for central Somalia is very low. Models project an increase in species richness in the moun-tainous northern Somalia. However, in most other parts of the country, the number of species will decrease. Model agreement on changes in tree cover is very low, implying high uncertainty of future changes. Hence, no reliable infor-mation can be drawn from these projections.
Health: Rising temperatures and the strong increase in very hot days will very likely result in an increased exposure to heatwaves in Somalia. Heat-related mortality will very likely increase to between 2.7 and 3.3 deaths per 100 000 people/year until 2030, and then drastically increase to between 3.6 and 11.4 deaths per 100 000 people/year until 2080, depending on the emissions scenario.
1 For a shorter summary of the information presented in this risk profile, please see Summary for Policymakers https://weatheringrisk.org/en/publication/Climate-Risk-Profile-Somalia
2 The symbol displayed here are to indicate the projections which are subject to high levels of uncertainty. These projections must be interpreted cautiously. For further explanations on uncertainties and how to deal with them, please see the text box “Uncertainties in climate change projections” on page 5.
2

2
Quality of life indicators
Concerns about the effects of climate change are rising, includ-ing increasing temperatures, changes in precipitation patterns, water availability and the occurrence of extreme weather events. Recurrent floods and droughts in recent years have contributed to sharp declines in livestock and crop production [4] [8] [10]. Climate change impacts, along with unregulated and unsustainable water and land use practices (e.g., deforestation for charcoal production and overgrazing) are exacerbating pressures on already scarce arable land and water resources.
The outbreak of the civil war in 1991 and the subsequent three decades of violent conflicts made Somalia one of the most fragile and vulnerable states in the world and negatively impacted politi-cal and socio-economic development [11].3 Hundreds of thousands of people have fled Somalia, with 750 000 Somali refugees current-ly residing in neighbouring countries [12]. The prevailing conflict and the absence of functioning state institutions, in combination with severe drought and flood events, caused massive humani-tarian crises in 2007 and 2011. Recurrent droughts continue to aggravate fragility risks by causing crop failures, food instability, losses of livelihoods and large-scale internal displacement.4 In 2020, the country experienced a record high of 2.6 million inter-nally displaced people (IDP), of which 919 000 were displaced due to flooding [13]. The loss of livelihoods has increased the influx of people towards urban centres, such as Mogadishu, but also to smaller cities, such as Boosaaso and Baidao, from which tensions and local conflicts over land tenure and urban property emerged [14]. Insurgent groups like the Islamist Al-Shabaab militia take advantage of the lack of social cohesion and security in IDP camp-sites, which have become significant recruitment grounds [15].
The Federal Republic of Somalia is located in the very east of the Horn of Africa, bordering Djibouti to the northwest, Ethiopia to the west and Kenya to the southwest. With the Gulf of Aden to the north and the Indian Ocean to the east, Somalia possesses the longest coastline of all African states (3 025 km) [1]. Home to a population of 15.4 million (2019) and with an annual demogra-phic growth rate of 2.9 %, Somalia belongs to the fastest growing countries worldwide [2]. However, population distribution greatly varies throughout the country: Most people live in and around the cities of Mogadishu, Marka, Boorama, Hargeysa and Baidoa. The northeast and central regions, as well as regions along the Kenyan border are the least densely populated [1]. Somalia is undergoing a rapid urbanisation process with 6.38 million people currently living in urban areas and an additional 4 million expected by 2025 [3].
The country ranks at the very bottom of low-income countries. GDP per capita amounts to 320 USD [2]. 86 % of the population lives below the 1.90 USD poverty line [4]. In 2018, 5.7 million people were affected by food insecurity [5]. Somalia’s economy is dominated by the agricultural sector, which contributed 60.2 % to the country’s GDP in 2013, followed by the services sector and the industry with 32.5 % and 7.4 %, respectively [1]. Gold and livestock, particularly sheep and goats, are Somalia’s key export products [6]. In 2019, 80 % of the population were employed in the agricultural sector, which underlines the heavy reliance on agriculture for food security and livelihoods [4]. Most Somalis engage in pastoralism and the trade of livestock. Of the total agricultural land com-prising 70.3 % of the country, permanent pastures take up 68.5 %, while only 1.8 % is arable land [1]. Agricultural production mostly takes place in southern Somalia. Important staple crops include maize, cowpeas and sorghum, in addition to tomatoes and fresh fruit [7] [8]. Cultivated areas are predominantly rainfed. In 2012, only 32.5 % of the estimated irrigation potential of 240 000 ha was equipped for irrigation [7]. Local crop production is highly deficient, providing only 22 % of per capita cereal demand [9].
3 In 2019, the Fragile States Index ranked Somalia as the second most fragile state in the world [11]. 4 Since renewal of its mandate by the UN Security Council resolution (2408) on Somalia in 2018, the United Nations Assistance Mission to Somalia (UNSOM)
has been one of the first political missions worldwide to have recognized the association between climate change and security [41] [42] . 5 Somalia is not listed in the UNDP Human Development Index [16]. 6 Summarises a country‘s vulnerability to climate change and other global challenges in combination with its readiness to improve resilience.7 Poverty headcount ratio for the year 2015 adjusted to 2011 levels of Purchasing Power Parity (PPP). PPP is used to compare different currencies by taking
into account national differences in cost of living and inflation.
General context
Human Develop-ment Index (HDI)
ND-GAIN Vulnera-bility Index 2018
GINI Coefficient 2017
GDP per capita 2020 (current USD)
Poverty headcount ratio 2011
Stunting rate (under the age of 5) 2020
n.a.5 27.7179 out of 1816
(0 = low, 100 = high)
36.8(0 – 100;
100 = perfect inequality)
309 USD 68.6 % (at 1.90 USD per day,
2011 PPP 7)
27.4 %
[4] [16] [17] [18]

3
Topography and environment
8 It should be noted that there are different classifications of agro-ecological zones in Somalia. We focussed on a commonly used classification of four AEZs.
© sntes / shutterstock
Somalia’s topography is characterised by mountainous terrain in the north, with plateaus rising between 900 to 2 100 m (above sea level), reaching a maximum elevation of 2 408 m in the very north at Buhara Simid Cad (Figure 1). Southwards, the mountains descend to mostly flat plateaus, with an average altitude of less than 180 m above sea level [1].
Somalia has a semi-arid to arid climate. Precipitation varies greatly between regions and throughout the year. The country can be divided into different agro-ecological zones, including Desert, Arid/Sahel, Semi-Arid and Highlands (of mid-altitude and high altitude) [19].8 Each of these zones is characterised by specif-ic temperature and moisture regimes and, consequently, specific patterns of crop production and pastoral activities. Somalia has two main rainy seasons: the major Gu rains from April to June and the minor Deyr rains from October to November. Between these rainy seasons, the Jilaal and the Haggai dry season occur from December to March and July to August, respectively. Given
Somalia’s predominantly dry climate, water is a scarce resource. Much of the north and northeast of Somalia depends on shallow and increasingly saline groundwater resources [20]. Somalia’s two main rivers, the Juba and Shabelle rivers, both emerging in the Ethiopian Highlands, supply southern Somalia with surface water and floodplains and thus also with fertile soils for agri-cultural production [21]. However, due to poor rains during the rainy seasons both in the Ethiopian Highlands and in Somalia, the Shabelle River dried out three times between 2016 and 2018 [21] [22]. Increased dam-building activities in Ethiopia could further affect the flow regime, reducing water resources and increasing flood intensities. The construction of dams poses a risk to future conflict over transboundary water resource management. Furthermore, over the past two decades, degradation of natural resources and deforestation, particularly driven by charcoal production and overgrazing, have rapidly increased Somalia’s vulnerability to drought and desertification [23].

4
Figure 1: Topographical map of Somalia with existing precipitation regimes.10
9 The El Niño-Southern Oscillation is an irregular climate phenomenon through which variation in winds and sea surface temperatures occurs in the central and eastern tropical Pacific Ocean. Such changes in water and atmospheric circulation result in changing regional weather systems. The ENSO consists of three phases: The neutral state, as well as El Niño and La Niña events, which occur every 3-7 years. El Niño events bring heavy rainfall and flooding to Somalia. La Niña events have the opposite effect, bringing decreases in rainfall /droughts.
10 The climate graphs display temperature and precipitation values which are averaged over an area of approximately 50x50 km. Especially in areas with larger differences in elevation, the climate within this grid size may vary. Bimodal precipitation regimes in this context describe precipitation regimes with two rainy seasons, separated by a drought season.
Present climate
Mean temperatures in Somalia are amongst the highest world wide. Given the countries’ proximity to the equator, hot conditions prevail throughout the year, in particular in the southwest near the border to Ethiopia, where annual mean temperatures surpass 29 °C. Cold Ocean currents bring slightly cooler temperatures along the southern coast. Due to the varying altitudes, the greatest range in climate occurs in the mountainous north of Somalia, where annual mean temperatures can partially drop to 22 °C.
Annual precipitation in the hot and arid northern area mostly amounts to under 250 mm and decrease to less than 100 mm in the very northeast. The central plateau receives between 200 and 300 mm of precipitation, while it increases southwards to around 400 to 500 mm of rainfall annually. Sou-thwestern and northwestern regions receive the most precipitation, with an average between 500 and 700 mm. ENSO (El Niño-Southern Oscillation) events9 are largely influencing the inter-annual precipitation variability, providing more precipitation and flooding during the El Niño periods, and droughts during La Niña events [25].

5
Uncertainties in climate change projections
It is important to acknowledge that uncertainties are an integral part of climate change projections. Uncertainties arise from a variety of factors, including natural variabilities, uncertainties in GHG emissions scenarios and differences in the models used [43]. Consequently, no future (climate change) projection comes without some level of uncertainty. The levels of (un)certainties, however, differ. In order to incor-porate such uncertainties, we present the results of ten different global models. To indicate the (un)certainty of the projections we consider model agreement. The more these models agree the higher the certainty, the more they disagree the lower the certainty. For example, if different models project a similar result under the same scenario, the projected changes demonstrate low levels of uncertainty, however, if they project very different changes (in terms of range and even direction) under the same scenario, then the projections are uncertain.
Line plots and map plots depict uncertainty differently and cannot be compared: The line plots indicate the level of certainty through the shaded areas, depicting the likely (central 66 %) and very likely (central 90 %) range of all model projections (see section “How to read the plots”). Generally, the smaller the shaded areas, the more certain the projections (for an example of a relatively certain projection, see Figure 5, while for an example of a highly uncertain projection, see Figure 8). The map plots depict the level of certainty through the presence or absence of dots (see section “How to read the plots”). If dots are present, at least 75 % of all models agree on the direction of change or in other words an increasing or a decreasing trend (for an example, see Figure 3). If the dots are absent in a specific region or scenario, then model agreement within this specific region and scenario is below 75 % (for an example, see Figure 25).
To simplify the interpretation of the projections, all line plots and map plots that are subject to high levels of uncertainty are marked with a symbol ( ). This does not imply that these plots have no informational value, but rather draws attention to the limitations of such projections for future planning. Consequently, they should be very carefully interpreted when they are used for planning measures. In the case of high uncertainty, additional information will be provided on how to interpret the data.
How to read the plots
The maps and plots included in this section provide an overview of projected climate change parameters and related sector specific im-pacts in Somalia until 2080 under two different climate change scenarios (RCPs): RCP2.6 represents the low emissions scenario consistent with the Paris Agreement target, and RCP6.0 represents a medium to high emissions scenario. Projections are provided until the year 2080, with each year showing the mean value of a 31-year period.
The line plots show climate impact projections averaged over the whole country, with the blue color representing the RCP2.6 scenario, and the red color representing the RCP6.0 scenario. While the lines depict the best estimate (representing the multi-model median of 10 climate models), the shaded areas represent the likely range (strongly shaded area) and the very likely range (lightly shaded area), indicating the range of model agreement of at least 66 and 90 % of all model projections, respectively.
How to read the line plots historical RCP2.6 RCP6.0
best estimate likely range (central 66 %) very likely range (central 90 %)
The map plots display regionally explicit climate information under RCP2.6 and RCP6.0, in a spatial resolution of approximately 50 x 50 km. While the leftmost column represents the baseline period as found in the model data, the other three columns represent future projections in comparison to that baseline period. The color values depict the multi-model median of the underlying models at each grid cell. The presence of a dot means that at least 75 % of the models agree on the sign of change depicted for the specific grid cell and scenario (i.e. whether an increase or a decrease can be expected). Conversely, the absence of a dot represents the lack of model agreement on the predicted change.

6
Temperature
As a result of increasing greenhouse gas (GHG) concentrations, air temperature over Somalia is very likely to rise by 1.4 to 3.4°C by 2080 relative to the year 1876, depending on the future GHG emissions scenario (Figure 2). Compared to pre-industrial levels, the median climate model temperature shows an increase of approximately 1.6 °C in 2030, 1.8 °C in 2050 and 1.9 °C in 2080 under the low emissions scenario RCP2.6. Under the medium to high emissions scenario RCP6.0, median climate model tem-perature will increase by 1.5 °C in 2030, 2 °C in 2050 and 2.8 °C in 2080.
Air temperature is projected to rise with high certainty all over Somalia (Figure 3). Under the low emissions scenario RCP2.6, projected increases in air temperature will very likely affect the whole country, with the exception of coastal regions, which will be slightly less affected. Compared to the year 2000,12 tempera-tures will rise by between 0.7 °C (in most coastal areas) and 0.9 °C (rest of the country) until 2030. Until 2080, models project a rise of between 0.9 °C and 1.2 °C, depending on the region. Under the medium to high emissions scenario RCP6.0, temperature changes until 2030 will develop similarly to the projections under RCP2.6, rising by between 0.6 °C (in most coastal areas) and 0.9 °C (rest of the country), compared to the year 2000. The long-term pro-jections under RCP6.0, however, suggest significantly stronger increases in temperature, rising by up to 2.4 °C until 2080, which is twice as high as under the RCP2.6. Also regional variability will be much higher under RCP6.0, as coastal regions will be much less affected than the interior of the country.
Part A: Projected climatic changes
2010 2030 2050 2070
Year
1.0
1.5
2.0
2.5
3.0
3.5
Air temperature change (°C)
Figure 2: Air temperature projections for Somalia for different GHG emissions scenarios.11
11 Changes are expressed relative to year 1876 temperature levels using the multi-model median temperature change from 1876 to 2000 as a proxy for the observed historical warming over that time period.
12 While the line plot on air temperature change (Figure 2) compares future developments with temperature changes between 1876 to 2000, this map plots (Figure 3) provides projected air temperature changes relative to the year 2000. Hence, projections of those plots are not comparable.
RCP2.6
2000
22 24 26 28
Air temperature (°C)
2030
0.5 1.0 1.5 2.0
Difference to year 2000
2050 2080
RCP6.0
Figure 3: Air temperature projections for Somalia for different GHG emissions scenarios (regional variations).

7
Sea level rise
As a result of the increase of the global average temperature, the sea level at the Somalian coasts is projected to rise with high certainty (Figure 5). Until 2050, projections under both emissions scenarios suggest similar changes: The median climate model projects a sea level rise by 12 cm until 2030 and 20 cm until 2050 under RCP2.6, and 11 cm until 2030 and 21 cm until 2050 under RCP6.0. Until 2080, sea levels will continue to rise, though this increase will be higher under RCP6.0 than under RCP2.6, amount-ing to 42 and 36 cm, respectively, in comparison to levels in the year 2000. However, uncertainty about the level of increase in sea level rise grows the further one looks into the future.
The projected sea level rise threatens the livelihoods of coastal communities, particularly in southern Somalia,14 including the country’s capital Mogadishu, and may cause saline intrusion in coastal waterways and groundwater reservoirs, rendering water unusable [27].
Very hot days
In line with rising mean annual temperatures, the annual number of very hot days (days with daily maximum temperature above 35° C) is projected to rise with high certainty all over Somalia (Figure 4). Central Somalia will be particularly affected. Under RCP2.6, the projected annual number of very hot days will rise by between 20 and almost 70 more very hot days until 2030, com-pared to the year 2000. Central Somalia, particularly Galmudug and parts of Hirshabelle, will be affected most strongly, while in the very north, the number of very hot days will remain relatively stable. Projections for 2050 and 2080 differ slightly from the 2030 projections, with parts of Galmudug reaching up to 77 and 78 more very hot days until 2050 and 2080, respectively. Under RCP6.0, the number of very hot days is projected to strongly increase until 2080, though projections vary considerably, depending on the region. In some parts, it will significantly increase. In central Somalia, for example, this increase amounts to up to 93 addition-al very hot days in 2050 and 152 additional very hot days in 2080, in comparison to the year 2000.
Higher heat stress poses a risk to the population’s ability to work and live.13 The projections on the population’s exposure to heatwaves and heat-related mortalities (Figures 26 and 27) illustrate the consequences of the projected temperature changes in Somalia. These climate change impacts will particularly affect urban settings, as cities tend to be hotter than rural areas due to the so- called urban heat island effect [26].
13 Physical labor becomes difficult to impossible when wet bulb temperatures exceed 31°C, and heat stress can be fatal to humans when wet-bulb temperatures exceed 35°C for six hours or more. Wet-bulb temperatures are air temperatures under conditions of 100 % humidity [40].
14 Though the sea level will rise all along the Somali coastline, southern Somalia will be particularly sensitive to sea level rise, due to low coastal elevation, population density and decreasing vegetation covers, among other factors [27].
RCP2.6
2000
140 160 180 200 220 240
Very hot days (number/year)
2030
20 40 60 80 100 120 140
Difference to year 2000
2050 2080
RCP6.0
Figure 4: Projections of the annual number of very hot days (daily maximum temperature above 35 °C) for Somalia for different GHG emissions scenarios (regional variations).
Figure 5: Projections for sea level rise off the coast of Somalia for different GHG emissions scenarios, relative to the year 2000.
2010 2030 2050 2070
Year
0
10
20
30
40
50
60
Sea level change (cm)

8
Precipitation
Overall, precipitation will very likely increase over Somalia in the long run (until 2080), with a much stronger and more continuous increase under RCP6.0 than under RCP2.6 (Figure 6). However, the models show a lot of variance in their projections, in particular in relation to how strong and reliable this trend will be. What the models agree on is that there will very likely be high inter-annual variability in the amount of precipitation, meaning that there will be both, wetter and drier years.
Precipitation projections show a high uncertainty and differ significantly in both the degree of change and the level of certainty around those changes, depending on the underlying scenario and the different timeframes. Under RCP2.6, projected changes, as compared to the year 2000, will range between -1.1 to 12.5 mm/ year by 2030. Until 2045, precipitation changes will drop to between -5.6 and 11.7 mm/year. Thereafter, they will in crease again to between 11.2 to 20.6 mm/year by 2080, as compared to the year 2000 (very likely range). Under RCP6.0, changes in precipitation will range between -13,9 to 15.6 mm/year until 2030. By 2070, precipitation rates are projected to increase by 23.5 to 50.6 mm/year by 2070, and by 14 to 67.3 mm/year until 2080, as compared to the year 2000 (very likely range).
The projected long-term increase in mean annual precipitation should be interpreted with caution, since the high inter- annual precipitation variation and projections of heavy precipitation events (Figures 6 and 8) suggest that rainfall will become less regular and more intense. This means that increasing overall precipitation might not translate into more water availability as the additional water resources from precipitation can be expected to run off at the surface, thereby increasing the risk of soil erosion and flooding, rather than infiltrating into the soils.
The certainty of geographically explicit projections of annual mean precipitation over Somalia vary depending on the time frames and the underlying emission scenarios. There is a high uncertainty regarding the mean annual precipitation projections under RCP2.6 in many regions. Particularly in many parts of southern Somalia and around Sool and Nugaal (northern Somalia), annual mean precipi tation projections are subject to high modelling uncertainty (depicted by the absence of dots within the plots) and hence need to be interpreted with great caution. Model projec-tions under RCP6.0 are less uncertain than under RCP2.6, but
nevertheless show significant uncertainty, particularly in the short- to medium- term projections. There is no clear regional trend in the projections until 2030, compared to the year 2000. Until 2050, precipitation will rise all over the country, except for the very south. This trend will intensify until 2080, with precip-itation rising by up to 59 % in northern Somalia and decreasing by up to 12 % in the very south. The strong rise in precipitation will particularly affect Pundland and northern Galmudug. Given such high uncertainties, precipitation projections need to be assessed carefully.
2010 2030 2050 2070
Year
20
0
20
40
60
Precipitation change (mm/year)
historical
RCP2.6
RCP6.0
best estimate
likely range
very likely range
Figure 6: Annual mean precipitation projectionsfor Somalia for different GHG emissions scenarios, relative to the year 2000.
RCP2.6
2000
100 200 300 400 500 600 700
Precipitation (mm/year)
2030
40 20 0 20 40
Difference to year 2000 (%)
2050 2080
RCP6.0
Figure 7: Annual mean precipitation projections for different regions of Somalia for different GHG emissions scenarios (regional variations).

9
Heavy precipitation events
In response to a warming atmosphere, the water vapour holding capacity increases and thus heavy precipitation events are expected to become more intense in many parts of the world. At the same time, the number of days with heavy precipitation events is expected to increase [28].
In 2000, Somalia experienced around 7.7 heavy precipitation events per year. Future projections are highly uncertain, as the under-lying models project different levels of change and partially even different directions of change under both scenarios, with some models projecting an increase and others projecting a decrease in future heavy precipitation days. In consequence, while an overall increase in heavy precipitation days can be expected under RCP6.0 in the long run, no such overall trend can be derived under RCP2.6. The projected number of days with heavy precipitation fluctuates between 7.5 and 11 until 2080 under RCP2.6 (very likely range). Under RCP6.0, models project an overall increase in annual heavy precipitation days, which are projected to rise to between 7.5 and 12.2 in 2080 (very likely range). Long-term planning must consider the uncertainties related to this expected increase.
Geographically explicit projections of the models under both scenarios are highly uncertain in many regions. Generally, they show an increasing trend of heavy precipitation events in northern Somalia, and a decreasing trend in southern Somalia under both GHG emissions scenarios. Those trends are in line with regionally differentiated precipitation projections (see Figure 7). However, model agreement under both scenarios is low in many regions, which is why such projections need to be assessed carefully.
Figure 8: Projections of the number of days with heavy precipitation over Somalia for different GHG emissions scenarios, relative to the year 2000.
2010 2030 2050 2070
Year
7
8
9
10
11
12
Heavy precipitation
days (num
ber/year)
historical
RCP2.6
RCP6.0
best estimate
likely range
very likely range
RCP2.6
2000
6.5 7.0 7.5 8.0 8.5 9.0
Heavy precipitation
days (number/year)
2030
4 2 0 2 4
Difference to year 2000
2050 2080
RCP6.0
Figure 9: Projections of the number of days with heavy precipitation for different GHG emissions scenarios (regional variations).
© Stanley Dullea / shutterstock

10
Soil moisture
Soil moisture is an important indicator for drought conditions. In addition to soil parameters, it depends on both precipitation and evapotranspiration and therefore, also on temperature, as higher temperatures translate to higher potential evapotranspiration.
High modelling uncertainty makes it difficult to identify a clear trend for soil moisture changes in Somalia, as different models project different directions of change. Median annual mean top 1-m soil moisture projections for Somalia indicate almost no change under RCP2.6, and only a slight long-term increase under RCP6.0 compared to the year 2000 (Figure 10). However, while one model projects a slight decrease in soil moisture, two models project a slight increase, and one a strong increase in soil moisture under both scenarios. These diverging trends translate into a high range of projected changes until 2080 (between -3.9 to 9.5 % under RCP2.6 and between -3.7 to 20 % under RCP6.0 in the very likely range). Long-term planning must consider the high uncer-tainty about the direction of change.
Potential evapotranspiration
While median hydrology projections for Somalia indicate a slight rise in potential evapotranspiration15 under RCP2.6, and a stronger rise under RCP6.0., as compared to the year 2000 levels (Figure 11), the range of projected changes is high: Under RCP2.6, different models project different directions of change: One model shows a slight decrease whereas the other mod-els agree on a continuous rise in evapotranspiration until 2080. Consequently, the projections vary between -1.1 and 7 % until 2080 (very likely range). Model results under RCP6.0 agree on increasing potential evapotranspiration rates, though with a high range of possible increases (between 1 % and 14.9 % by 2080, very likely range). Long-term planning must take into account the great uncertainty relating to changes in potential evapotranspiration.
Potential evapotranspiration rates are projected to slightly increase all over Somalia as compared to the year 2000, with com-paringly stronger increases in northern Somalia under RCP2.6, and relatively strong increases in northern and southern Somalia under RCP6.0. Under the lower emissions scenario RCP2.6, potential evapotran-spiration is projected to rise by between 1 % to up to 3 % in 2030. Projections for southern Somalia, however are very uncertain, as not all models agree on a projected increase (as shown by the absence of dots). The certainty in northern Somalia is higher and projected to rise by up to 3.8 % (by 2050) and 3.9 % (by 2080), as
compared to the year 2000. Model agreement for potential evap-oration projections is higher under RCP6.0. Potential evapotran-spiration is projected to intensify by between 0.8 % and 3.9 % until 2030, and will further increase by between 3.7 % and 7.5 % until 2080, compared to the year 2000. In north-western and southern Somalia, evapotranspiration rates are projected to rise the most.
Figure 10: Soil moisture projections for Somalia for different GHG emissions scenarios, relative to the year 2000.
Figure 12: Potential evapotranspiration projections for Somalia for different GHG emissions scenarios (regional variations).
2010 2030 2050 2070
Year
10
5
0
5
10
15
20
Soil moisture change (%)
historical
RCP2.6
RCP6.0
best estimate
likely range
very likely range
Figure 11: Potential evapo-transpiration projections for Somalia for different GHG emissions scenarios, relative to the year 2000.
2010 2030 2050 2070
Year
0
2
4
6
8
10
12
14
Potential evapotranspiration
change (%)
historical
RCP2.6
RCP6.0
best estimate
likely range
very likely range
15 Potential evapotranspiration is the amount of water that would be evaporated and transpired if sufficient water was available at and below the land surface. Since warmer air can hold more water vapour, it is expected that global warming will increase potential evapotranspiration in most regions of the world.
RCP2.6
2000
2000 2200 2400 2600 2800
Potential evapotranspiration (mm/year)
2030
1 2 3 4 5 6 7
Difference to year 2000 (%)
2050 2080
RCP6.0

11
16 Shared Socio-economic Pathways (SSPs) outline a narrative of potential global futures, including estimates of broad characteristics such as country-level population, GDP growth, or rates of urbanization. Five different SSPs outline future realities according to a combination of high and low future socio-economic challenges for mitigation and adaptation. SSP2 represents the “middle of the road”-pathway.
Part B: Sector-specific climate change risk assessment
Water resources
Projections of water availability in Somalia are highly uncertain under both GHG emissions scenarios. Assuming a constant popu-lation level, multi-model median projections show high inter- annual variability, i.e., some years with more and some years with less water, but overall a small rise in per capita water availability in the country. These projections are in line with projections of future precipitation changes (Figure 7). However, the very likely range of water resources is extremely high for both, historical simulations and future projectons: Per capita water resources amounted to between 451 and 6 091 m3 per year (multi model median of 2 414 m3) around the year 2000. Without population change (A), they will amount to between 542 and 6 453 m3 per year (multi-model median of 2 789 m3) until 2080 under RCP2.6. Under RCP6.0, per capita water availability will very likely slightly increase to between 1 078 and 7 760 m3 (multi-model median of 3 382 m3) until 2080 (Figure 13A).
When accounting for population growth according to SSP2 projections (B),16 per capita water availability for Somalia will very likely decline to between 219 and 2 625 m³ (multi-model median of 1 136 m³) under RCP2.6 and to between 437 and 3 161 m³ (multi- model median of 1 512 m³) under RCP6.0 until 2080 (Figure 13B). Even though this decline in the models is driven by the expected population growth instead of by climate change, it highlights the need for strengthening water govern-ance and the sustainable management of water resources.
In line with regional precipitation projections, geographically explicit projections of future water availability from precip-itation are highly uncertain and strongly vary depending on the region and scenario. Overall projections show a declining trend for southern Somalia and an increasing trend for northern Somalia under RCP2.6, and a general increase of water availability under RCP6.0, except for the very south. (Figure 14). However, the model agreement for most regions is very low. Based on this data, it is most prudent to plan for increasing uncertainty in regard to future water availability.
2010 2030 2050 2070
Year
1000
2000
3000
4000
5000
6000
7000
Water availability (m3/cap/year)
(A) without population
change
historical
RCP2.6
RCP6.0
best estimate
likely range
very likely range
2010 2030 2050 2070
Year
1000
2000
3000
4000
5000
6000
7000
(B) with population
change
Figure 13: Projections of water availability from precipitation per capita and year with (A) national population held constant at year 2000 level and (B) changing population in line with SSP2 projections for different GHG emissions scenarios.
RCP2.6
2000
0.05 0.10 0.15 0.20 0.25
Runoff (mm/day)
2030
100 50 0 50 100
Difference to year 2000 (%)
2050 2080
RCP6.0
Figure 14: Water availability from precipitation (runoff) projections for different GHG emissions scenarios (regional variations).
© HelloRF Zcool / shutterstock
12
Agriculture
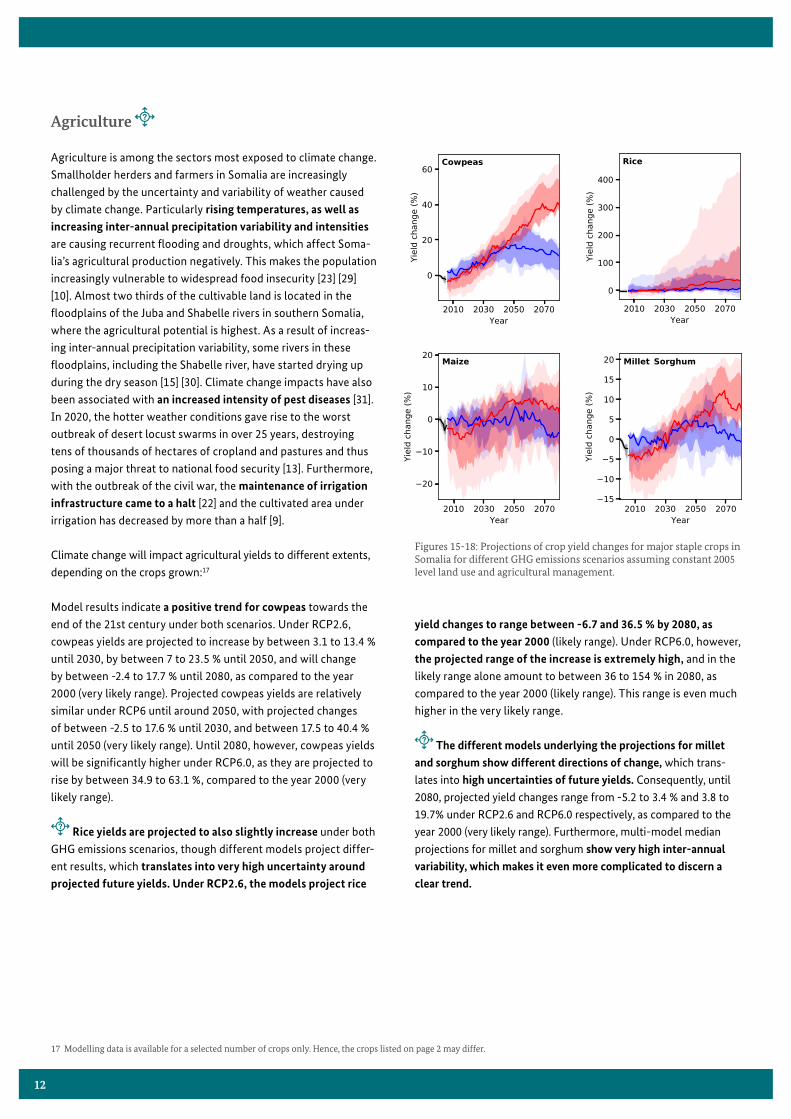
Agriculture is among the sectors most exposed to climate change. Smallholder herders and farmers in Somalia are increasingly challenged by the uncertainty and variability of weather caused by climate change. Particularly rising temperatures, as well as increasing inter-annual precipitation variability and intensities are causing recurrent flooding and droughts, which affect Soma-lia’s agricultural production negatively. This makes the population increasingly vulnerable to widespread food insecurity [23] [29] [10]. Almost two thirds of the cultivable land is located in the floodplains of the Juba and Shabelle rivers in southern Somalia, where the agricultural potential is highest. As a result of increas-ing inter-annual precipitation variability, some rivers in these floodplains, including the Shabelle river, have started drying up during the dry season [15] [30]. Climate change impacts have also been associated with an increased intensity of pest diseases [31]. In 2020, the hotter weather conditions gave rise to the worst outbreak of desert locust swarms in over 25 years, destroying tens of thousands of hectares of cropland and pastures and thus posing a major threat to national food security [13]. Furthermore, with the outbreak of the civil war, the maintenance of irrigation infrastructure came to a halt [22] and the cultivated area under irrigation has decreased by more than a half [9].
Climate change will impact agricultural yields to different extents, depending on the crops grown:17
Model results indicate a positive trend for cowpeas towards the end of the 21st century under both scenarios. Under RCP2.6, cowpeas yields are projected to increase by between 3.1 to 13.4 % until 2030, by between 7 to 23.5 % until 2050, and will change by between -2.4 to 17.7 % until 2080, as compared to the year 2000 (very likely range). Projected cowpeas yields are relatively similar under RCP6 until around 2050, with projected changes of between -2.5 to 17.6 % until 2030, and between 17.5 to 40.4 % until 2050 (very likely range). Until 2080, however, cowpeas yields will be significantly higher under RCP6.0, as they are projected to rise by between 34.9 to 63.1 %, compared to the year 2000 (very likely range).
Rice yields are projected to also slightly increase under both GHG emissions scenarios, though different models project differ-ent results, which translates into very high uncertainty around projected future yields. Under RCP2.6, the models project rice
yield changes to range between -6.7 and 36.5 % by 2080, as compared to the year 2000 (likely range). Under RCP6.0, however, the projected range of the increase is extremely high, and in the likely range alone amount to between 36 to 154 % in 2080, as compared to the year 2000 (likely range). This range is even much higher in the very likely range.
The different models underlying the projections for millet and sorghum show different directions of change, which trans-lates into high uncertainties of future yields. Consequently, until 2080, projected yield changes range from -5.2 to 3.4 % and 3.8 to 19.7% under RCP2.6 and RCP6.0 respectively, as compared to the year 2000 (very likely range). Furthermore, multi-model median projections for millet and sorghum show very high inter-annual variability, which makes it even more complicated to discern a clear trend.
Figures 15-18: Projections of crop yield changes for major staple crops in Somalia for different GHG emissions scenarios assuming constant 2005 level land use and agricultural management.
17 Modelling data is available for a selected number of crops only. Hence, the crops listed on page 2 may differ.
2010 2030 2050 2070
Year
0
20
40
60
Yield change (%)
Cowpeas
2010 2030 2050 2070
Year
0
100
200
300
400
Yield change (%)
Rice
2010 2030 2050 2070
Year
20
10
0
10
20
Yield change (%)
Maize

13
Overall, projected changes in maize yields will be rather small, but are also subject to high modelling uncertainty, as the models suggest both high inter-annual variabilities and also different directions of change. This translates into high ranges in projected changes, that might result in both, an increase or a decrease of future maize yields. Projections range between -10.2 to 7 % under RCP2.6 and between -16.9 to 15.7 % under RCP6.0 until 2080 (very likely range) (Figures 15 – 18).
The high modelling uncertainty around rice and maize pro-jections become also apparent from the geographically explicit projections which are highly uncertain in most regions and under most scenarios (Figures 19 and 20). While projections indicate an overall increase of maize and rice yields in northern and central Somalia, yields are projected to slightly decrease in southern Somalia.
Projected changes in maize yields (Figure 19) range between -16 to 39 % by 2030, and between -15 to 80 % by 2080, as compared to the year 2000, depending on the scenario. The models indicate increasing maize yields in northern and central Somalia, and slight decreases in southern Somalia. This trend intensifies under RCP6.0. These changes align with annual precipitation projec-tions (see Figure 6), as maize cultivation is predominantly rainfed in Somalia [32]. However, as stated above, model agreement, particularly in southern Somalia is very low across all time frames.
Rice yield projections are also highly uncertain and vary across the country and the underlying GHG emissions scenario. Under RCP2.6, projections indicate an increase in northern and central Somalia (increasing by up to 148 %) and a decrease in southern Somalia (decreasing by up to 25 %) until 2080. Under RCP6.0, overall rice yields are projected to rise, though with very high regional variations, ranging by between at least 12 % and up to 441 % until 2080, compared to the year 2000. Given the high uncertainties, the crop yield projections displayed in this climate risk profiles must be evaluated very carefully when they are used for planning measures.
As outlined earlier, pastoralism and the trade of livestock are major livelihood strategies in Somalia. Climate impacts, including increasing temperatures and inter-annual precipitation variability, associated with water scarcity and recurrent droughts, already result in a loss of water points and grazing areas. Land degradation and desertification are further exacerbating the increasing resource scarcities. These changes, along with other
socio- economic and political factors, strongly impact traditional mobility patterns and intensify the competition and conflict over access to resources amongst farmers and herders. Furthermore, pastoralists increasingly experience climate-induced economic losses, which can exacerbate existing community tensions and fuel recruitment into armed opposition groups [15]. Within this Climate Risk Profile, future climate change impacts on pastoral-ism cannot be mapped, since the underlying models do not take livestock data into account. Nevertheless, policy-makers should consider future climate change implications for pastoralism.
RCP2.6
2000
0.5 1.0 1.5 2.0 2.5 3.0 3.5
Yield (t/ha/year)
2030
400 300 200 100 0 100 200 300 400
Difference to year 2000 (%)
2050 2080
RCP6.0
Figure 19: Projections of maize yield changes for Somalia for different GHG emissions scenarios assuming constant land use and agricultural management (regional variations).
Figure 20: Projections of rice yield changes for Somalia for different GHG emissions scenarios assuming constant land use and agricultural management (regional variations).

14
Infrastructure
Climate change is expected to affect Somalia’s infrastructure through extreme weather events, such as floods and heatwaves. High precipitation amounts can lead to flooding of transport infrastructure including roads and airports, while high temper-atures can cause roads, bridges and protective structures to develop cracks and degrade more quickly. This will lead to higher maintenance and replacement costs. Transport infrastructure is vulnerable to extreme weather events, yet essential for people’s livelihoods. Roads serve communities to trade goods and access healthcare, education, credit and other services. During the long period of civil war, Somalia’s infrastructure, including roads and bridges, as well as airports and seaports, has seen a lack of main-tenance and much of the infrastructure has been destroyed. Of the 4 124 km of Somalia’s main roads, only 2 860 km are paved and 90 % of them have been classified as being in poor condition. The majority of roads consists of earth or gravel [33]. Particularly during the rainy seasons and flood events, entire road sections become impassable, restricting access to markets and hindering economic growth [13] [34].
Extreme weather events will also have devastating effects on human settlements and economic production sites, especially
© Free Wind 2014 / shutterstock
in urban areas with high population densities like Mogadishu. Informal settlements are particularly vulnerable to extreme weather events: Makeshift homes are often built in unstable ge-ographical locations including steep slopes or riverbanks, where flooding can lead to loss of housing, contamination of water, injury or death. Dwellers usually have low adaptive capacities in responding to such events due to high levels of poverty and a lack of risk-reducing infrastructures. In July 2020, seasonal flooding resulted in the displacement of nearly 342 000 people, inundating 294 villages and destroying between 15 000 and 20 000 ha of crops, mainly along the Juba and Shabelle River valleys [13].
Although the risk of infrastructure damage is likely to worsen, predictions on the specific location and the extent of exposure are difficult to make. For example, projections of river flood events are subject to substantial modelling uncertainty, largely due to the uncertainty of precipitation projections and its spatial distribution, affecting flood occurrence (Figures 7 and 8). The high uncertainties around the river flood projections translate into high uncertainties of future exposure of infrastructure (major roads and urban land areas) to floods in Somalia (Figures 21 and 22).

15
In 2000, 1 % of Somalia’s major roads were exposed to river floods at least once a year. Median projections show only slight changes in the exposure of major roads to river floods, with a small increase under RCP6.0. However, the uncertainty of these projections is high as different models project different results: One model suggests an increase to more than 4 %, one a slight overall decrease and and two models project a slight increase in the exposure of major roads to flooding. As a result, the projected exposure of major roads to river floods ranges between 0.5 and 3.5 % until 2080 under RCP2.6, and between 0.7 and 4.2 % by 2080 under RCP6.0 (very likely range).
Similarly, the uncertainty of the urban land exposure to flooding is high. The multi-model median suggests a very slight increase under both scenarios. However, the different models underlying these projections arrive at different results, where one model projects no change and one an increase to up to 7 % until 2080 under RCP6.0 (very likely range).
This means that although the projections indicate that the future exposure of major roads and urban areas to flooding is rather small, no reliable estimations on the future impacts of river floods can be made and this data should not be used for long-term planning.
Based on the very certain temperature projections, the expo-sure of the Somalian GDP to heatwaves is very likely going to significantly increase under both GHG emissions scenarios. Median model projections under RCP2.6 suggest an increase from 8.3 % in 2000 to 17.1 % in 2030, 19.4 % in 2050 and 22.7 % in 2080, whereas under RCP6.0, exposure is projected to reach 19 % by 2030 and 23.7 % by 2050 and 2080.
2010 2030 2050 2070
Year
0.5
1.0
1.5
2.0
2.5
3.0
3.5
4.0
Exposure of major roads
to floods (% of national total)
2010 2030 2050 2070
Year
0
1
2
3
4
5
6
7
Exposure of urban land area
to floods (% of national total)
2010 2030 2050 2070
Year
5
10
15
20
25
30
Exposure of GDP
to heatwaves (% of national total)
Figure 21: Projections of major roads exposed to river floods at least once a year for Somalia for different GHG emissions scenarios.
Figure 22: Projections of urban land area exposed to river floods at least once a year for Somalia for different GHG emissions scenarios.
Figure 23: Exposure of GDP in Somalia to heatwaves for different GHG emissions scenarios.

16
Ecosystems
Climate change is expected to have a significant influence on ecosystems, even though the magnitude and direction of these changes are very uncertain. Due to the rising temperatures, increased frequency and intensity of extreme events and shorter growing periods, wetlands and riverine systems are increasingly at risk of being converted to other ecosystems with plant pop-ulations being displaced and animals losing their habitats. Rising temperatures and changing rainfall patterns can also influence succession in forest systems while concurrently and simultane-ously increasing the risk of invasive species, all of which affect ecosystems. In addition, reduced agricultural productivity and population growth might lead to further agricultural expansion, increasing deforestation, land degradation and forest fires, all of which will adversly affect biodiversity [35].
Projections of species richness (including amphibians, birds and mammals) and tree cover for Somalia are shown in Figures 24 and 25 respectively. While there is a high model agreement for species richness in northern and southern Somalia, the agree-ment for central Somalia is low. Changes in species richness vary across the country. Under both emissions scenarios, it is projected to increase in the very northern mountainous regions of Somalia. While this growth is overall relatively small, in the most affected regions, species richness is expected to increase by up to 140 % (Figure 24). In contrast, in most other parts of the country the number of species will decrease by up to 17 % by 2080, compared to the year 2010.
The projections of changes in tree cover (Figure 25) are very uncertain. Under RCP2.6, no reliable estimates on how climate change might affect tree cover can be derived, as the underlying models do not agree on the direction of change. This also applies to the short to medium-term projections under RCP6.0. Projec-tions for 2080 are more certain and agree on a slight increase in tree cover which might increase by up to 24 %, as compared to the year 2020.
Although these projections depict an overall positive devel-opment in the regions where model agreement is high, it is important to keep in mind that the model projections exclude any impacts on biodiversity loss from human activities, such as land use, which have been responsible for significant losses of global biodiversity in the past, and which are expected to remain its main driver in the future [37]. For example, unregu-lated logging, particularly for charcoal production, is leading to
more deforestation and land degradation. As a result, the already low national forest area shrinked from 8.28 million ha in 1990 to 5.98 million ha in 2020 [2]. Given Somalia’s rapid population growth, the profitability of charcoal production, a lack of alter-native income opportunities (particularly among IDPs), and the country’s high dependency on firewood and charcoal for energy provision, this trend is likely to continue and will negatively impact both, animal and plant biodiversity [38].
RCP2.6
2010
25 50 75 100 125 150 175 200
Number of species
2030
7.5 5.0 2.5 0.0 2.5 5.0 7.5
Difference to year 2010 (%)
2050 2080
RCP6.0
RCP2.6
2020
10 20 30 40 50
Tree cover (%)
2030
20 10 0 10 20
Difference to year 2020
2050 2080
RCP6.0
Figure 24: Projections of the aggregate number of amphibian, bird and mammal species for Somalia for different GHG emissions scenarios (regional variations).
Figure 25: Tree cover projections for Somalia for different GHG emissions scenarios (regional variations).

17
Human health
Climate change threatens the health and sanitation sector through more frequent incidences of floods, heatwaves, droughts and storms. Decades of civil war and instability mean that Somalia’s health system suffers from a lack of resources and adequate data. Morbidity and mortality trends have not gone down for years [39]. Amongst the key health challenges in Somalia are water-borne diseases such as diarrhoea, acute respiratory infections (ARI), malaria, malnutrition, tuberculosis, and other vaccine-preventable diseases [39]. The COVID-19 pandemic is currently exacerbating these health challenges, and climate change could further add to this through negative impacts on food and water supply, thereby heightening the risk of malnutrition, hunger and death by famine.
Food insecurity is one of the largest health challenges in Somalia. Between 2012 and 2018, around 1.5 million people were recurrently food insecure. An additional 1.5 million people suf-fered acute food insecurity due to the impacts of extreme events such as droughts and floods [5]. The stunting rate of children under the age of 5 is currently 27.8 % [39]. Food insecurity is par-ticularly high amongst rural communities and IDP’s [5].
The projected rising temperatures (Figures 2 and 3) will very likely result in more frequent and higher exposure to heatwaves in Somalia, which will increase heat-related mortality (Figure 27). Under RCP 2.6, the population affected by at least one heatwave per year is projected to increase to 21.1 % in 2030. Projections under RCP6.0 do not differ substantially and suggest to increase to 20.6 % until 2030. However, modelling uncertainties increase from 2030 onwards, and project to affect between 15 and 34 % of the national population under RCP2.6 and between 17 and 40 % under RCP6.0 until 2080 (very likely range).
Heat-related mortality will very likely rise following the projected increase in the numbers of very hot days (Figure 4). Under RCP2.6, heat-related mortality is projected to intensify from 1.3 deaths in 2000, to 3.2 deaths per 100 000 people per year until 2030 and to 3.6 deaths per 100 000 people per year until 2080 with high certainty (multi-model median). Under RCP6.0, heat-related mortality can be expected to be significantly higher, though the range of projected changes is much larger than under RCP2.6. While projections range between 5.8 and 11.4 deaths per 100 000 people per year until 2080 (very likely range), the multi-model median projects 10 deaths per 100 000 people per year until 2080. This would translate to an increase by a factor of almost 8 towards the end of the century, and provided that no adaptation to hotter conditions will take place.
2010 2030 2050 2070
Year
10
15
20
25
30
35
40
Exposure of population
to heatwaves (% of national total)
2010 2030 2050 2070
Year
2
4
6
8
10
12
Heat-related mortality
(deaths/100000 people/year)
Figure 26: Projections of population exposure to heatwaves at least once a year for Somalia for different GHG emissions scenarios.
Figure 27: Projections of heat-related mortality for Somalia for different GHG emissions scenarios assuming no adaptation to increased heat.

18
[1] Central Intelligence Unit (CIA), “Somalia,” CIA World Factbook, 2021. [Online]. Available: https://www.cia.gov/the-world-factbook/ countries/somalia/. [Accessed 5 May 2021].
[2] World Bank, “World Bank Open Data,” 2021. [Online]. Available: https://data.worldbank.org/. [Accessed 22 May 2021].
[3] UNHABITAT, “Somalia,” UNHABITAT, 2021. [Online]. Available: https://unhabitat.org/somalia. [Accessed 1 June 2021].
[4] World Bank, “World Development Indicators,” 2021. [Online]. Available: https://databank.worldbank.org/source/world- development-indicators. [Accessed 22 May 2021].
[5] World Food Programme, “Somalia,” 2021. [Online]. Available: https://www.wfp.org/countries/somalia. [Accessed 1 June 2021].
[6] Observatory of Economic Complexity (OEC), “Somalia,” 2021. [Online]. Available: https://oec.world/en/profile/country/som?yearSelector1
=exportGrowthYear25. [Accessed 1 June 2021].[7] FAOSTAST, “Crops in Somalia (by Area Harvested),” 2021. [Online].
Available: http://www.fao.org/faostat/en/#data/QC. [Accessed 30 April 2021].
[8] Food and Agriculture Organization (FAO), “Country Profiles. Somalia,” 2021. [Online]. Available: http://www.fao.org/countryprofiles/index/en/?iso3=SOM. [Accessed 1 June 2021].
[9] Food and Agriculture Organization (FAO) , “Aquastat,” 2021. [Online]. Available: http://www.fao.org/aquastat/statistics/query/index.html;j-sessionid=FC5E1485E1FA9352ADFAFB3CC82C67A0. [Accessed 1 June 2021].
[10] Thalheimer, L, Gaupp, F., Webersik, C. , “Compound vulnerabilities exacerbate systemic risks,” Research Square, p. 23, 2021.
[11] The Fund for Peace, “Fragile State Index Somalia,” 2021. [Online]. Available: https://fragilestatesindex.org/country-data/. [Accessed 22 May 2021].
[12] UNHCR, “Somalia Refugee Crisis Explained,” 7 Januar 2020. [Online]. Available: https://www.unrefugees.org/news/somalia-refugee- crisis-explained/. [Accessed 4 May 2021].
[13] UNOCHA, “Humanitarian Needs Overview Somalia,” 9 March 2021. [Online]. Available: https://reliefweb.int/sites/reliefweb.int/files/ resources/20200903_HNO_Somalia.pdf. [Accessed 22 May 2021].
[14] Bakonyi, J. , Chonka, P. , “War and city-making in Somalia: Property, power and disposable lives,” Political Geography, vol. 73, pp. 82-91, 2019.
[15] Ekloew, W., Krampe, F., “Climate-Related Security Risks and Peacebuilding in Somalia. SIPRI Policy Paper,” Stockholm International Peace Research Institute (SIPRI), Solna, 2019.
[16] UNDP, “Human Development Index,” UNDP, 2012. [Online]. Available: https://gain.nd.edu/our-work/country-index/rankings/. [Accessed 22 May 2021].
[17] Notre Dame Global Adaptation Initiative, “Somalia,” 2018. [Online]. Available: https://gain.nd.edu/our-work/country-index/rankings/. [Accessed 20 April 2021].
[18] Directorate of National Statistics, “The Somali Health and Demographic Survey,” Federal Government of Somalia, 2020.
[19] International Institute of Tropical Agriculture, “Agroecological Zones,” 2021. [Online]. Available: https://csi.maps.arcgis.com/apps/MapSeries/index.html?appid=7539d22ab46147ce9888589aea4b1a11. [Accessed 30 May 2021].
[20] Federal Republic of Somalia, “National Adaptation Programme of Action on Climate Change (NAPA),” Federal Republic of Somalia, 2013.
[21] Somalia Water and Land Information Management, “The Juba and Shabelle rivers and their importance to Somalia,” Food and Agriculture Organization (FAO), 2021. [Online]. Available: https://www.faoswalim.org/article/juba-and-shabelle-rivers-and-their-importance-somalia.[Accessed 3 May 2021].
[22] World Bank & Food and Agriculture Organization, “Rebuild-ing resiliend and sustainable agriculture in Somalia. Volume I,” International Bank for Reconstruction and Development/The World Bank and the Food and Agriculture Organization of the United Nations, 2018.
[23] United Nations Development Programme (UNDP) & Government of Somalia, “Somalia drought impacts and needs assessment and recovery and resilience framework,” International Bank for Reconstruction and Development/The World Bank and the Food and Agriculture Organization, 2021.
[24] Lange, S., “EartH2Observe, WFDEI and ERA-Interim Data Merged and Bias-Corrected for ISIMIP (EWEMBI).,” GFZ Data Service, Potsdam, 2016.
[25] Ministry of National Resources, “National Adaptation Programme of Action on Climate Change (NAPA),” Federal Republic of Somalia, 2013.
[26] Andrews, O., Le Quéré, C., Kjellstrom, T., Lemke, B., Haines, A., “Implications for workability and survivability in populations exposed to extreme heat under climate change: a modelling study,” The Lancet. Planetary Health, vol. 2, no. 1, pp. E540-E547, 2018.
[27] El-Shahat, S., El-Zafarany, A. M., El Seoud, T.A. & Ghoniem, S.A., “Vulnerability assessment of African coasts to sea level rise using GIS and remote sensing,” Environmentl, Development and Sustainability, vol. 23, pp. 2827-2845, 2021.
[28] Masson-Delmotte, V., P. Zhai, A. Pirani, S.L.; Connors, C. Péan, S. Berger, N. Caud, Y. Chen, L. Goldfarb, M.I. Gomis, M. Huang, K. Leitzell, E. Lonnoy, J.B.R, “Climate Change 2021: Contribu-tion of Working Group I to the Sixth Assessment Report of the Intergovernmental Panel on Climate Change,” IPCC, Cambridge, 2021.
[29] Warsame, A., Sheik-Ali, I., “Climate change and crop production nexus in Somalia: an empirical evidence from ARDL technique,” Environmental Science and Pollution Research, vol. 28, pp. 19838-19850, 2021.
[30] Somalia Water and Land information management (SWALIM), “The Dry River Beds of Shabelle River,” Food and Agriculture Organiza-tion, 21 March 2018. [Online]. Available: www.faoswalim.org/article/ dry-river-beds-shabelle-river-0. [Accessed 30 June 2021].
[31] Salih, A., Baraibar, M., Mwangi, K., Artan, G, “Climate change and locust outbreak in East Africa,” Nature Climate Change, vol. 10, pp. 548-585, 2020.
[32] Siad, S., Ismaan, H. , “Factors Constraining Small Scale Rice Production in Jowhar District, Hirshabelle State, Somalia,” Journal of Agriculture and Veterinary Science, vol. 13, no. 4, pp. 2319-2372, 2020.
[33] Asian Development Bank (ADB), “Somalia - Road Infrastructure Programme - Appraisal Report,” ADB, 2019.
[34] World Food Programme (WFP), “Somalia Logistics Infrastructure,” 2013. [Online]. Available: https://dlca.logcluster.org/display/public/DLCA/2+Somalia+Logistics+Infrastructure. [Accessed 24 May 2021].
[35] Shanahan, T.M., Hughen, K.A., McKay, N., Overpeck, J.T., Scholz, C.A., Gosling, W.D., Miller, S.S., Peck, J.A., Wing, J.W., Heil, C.W., “CO2 and fire influence tropical ecosystem stability in response to climate change,” Nature Scientific Reports, vol. 18, no. 6, pp. 1-8, 2016.
[36] Global Forest Watch, “Somalia,” 2021. [Online]. Available: https://www.globalforestwatch.org/dashboards/country/SOM/? category=
summary&location=WyJjb3VudHJ5IiwiU09NIl0%3D&map=eyJ j ZW50ZXIiOnsibGF0Ijo1LjIwOTk3MDkwODYwODY3NjUsImxu ZyI6NDYuMTk5MzI3NDY1MDEzNTd9LCJ6b29tIjo0LjM4Nz Q2OTQw MzgyMTQ2MiwiY2FuQm91bmQiOmZhbHNlLCJk.
[Accessed 17 11 2021].[37] IPBES, “Report of the Plenary of the Intergovernmental Science-
Policy Platform on Biodiversity and Ecosystem Services on the work of its seventh session,” IPBES, Bonn, 2019.
References

19
[38] Thulstrup, A, Habimana, D., Joshi, I. and Oduori, S. , “Uncovering the challenges of domestic energy access in the context of weather and climate extremes in Somalia,” Weather and Climate Extremes, vol. 27, no. 100185, 2020.
[39] Federal government of Somalia, “The Somali Health and Demographic Survey,” Directorate of National Statistics, 2020.
[40] Buzan, J., Huber, M. , “Moist Heat Stress on a Hotter Earth,” Annual Reviews of Earth and Planetary Sciemces, vol. 48, pp. 623-655, 2020.
[41] Hodder, C., “Climate change and security in the United Nations Assistance Mission to Somalia,” Climate Doiplomacy, 26 August 2021. [Online]. Available: https://climate-diplomacy.org/magazine/conflict/climate-change-and-security-united-nations-assistance-mission- somalia. [Accessed 23 November 2021].
[42] United Nations Assistance Mission in Somalia (UNSOM) , “Man-date UNSOM,” UNSOM, 2021. [Online]. Available: https://unsom. unmissions.org/mandate. [Accessed 23 November 2021].
[43] Chen, D., M. Rojas, B. H. Samset, K. Cobb, A. Diongue Niang, P. Edwards, S. Emori, S. H. Faria, E. Hawkins, P. Hope, P. Huybrechts, M. Meinshausen, S. K. Mustafa, G. K. Plattner, A. M. Tréguier, “Framing, Context, and Methods. In: Climate Change 2021: The Physical Science Basis. Contribution of Working Group I to the Sixth Assessment Report of the Intergovernmental Panel on Climate Change.,” IPCC, 2021.
Imprint
Supported by
The risk profile is based on data and analyses generated as part of the Inter-Sectoral Impact Model Intercomparison Project (ISIMIP), which is gratefully acknowledged. ISIMIP provides a comprehensive and consistent picture of the world under different climate change scenarios. It synthesises the results of various global and regional impact models to better understand how climate change impacts affect different sectors such as wa-ter, agriculture or health and how impacts in different sectors interact and amplify each other. Background information about the figures and analyses presented in this profile is available in the Climate Risk Profile – Supplemental Information.
Published by:Potsdam Institute for Climate Impact Research (PIK) e.V.Telegraphenberg A 31 14473 Potsdam, Germany http://www.pik-potsdam.de
adelphi research gemeinnützige GmbH Alt-Moabit 91, 10559 Berlin +49 (030) 8900068-0 [email protected]://www.adelphi.de/en
License:For the texts in this publication, the publishers grant a license under the terms of Creative Commons Attribution- NoDerivatives 4.0 International. You may reproduce and share the licensed material if you name adelphi as follows: ‘© adelphi, PIK, CC-BY ND 4.0’. Photographs and graphics are not covered by this license. In case of doubt please contact adelphi prior to reusing the material.
Scientific coordination: Lisa Binder (PIK), [email protected]
Main authors: Lisa Binder (PIK), [email protected] Šedová (PIK), [email protected] Rüttinger (adelphi), [email protected]
Contributors: Julia Tomalka (PIK)Stephanie Gleixner (PIK)Ylva Hauf (PIK)Stefan Lange (PIK)Christoph Gornott (PIK)Sibylla Neer (GIZ)Naima Lipka (GIZ)Alina Viehoff (adelphi)Michael Hornsby (adelphi)Johanna Dieffenbacher (adelphi)
Date: February 2022© Potsdam Institute for Climate Impact Research, adelphi 2022