Embed Size (px)
Citation preview
I
\
Table of Contents
LIST OF FIGURES .................................................................................................................................... III
FOREWORD AND ACKNOWLEDGEl\IENTS ..................................................................................... IV
EXECUTIVE SU!VIi\'IARY ........................................................................................................................ VI
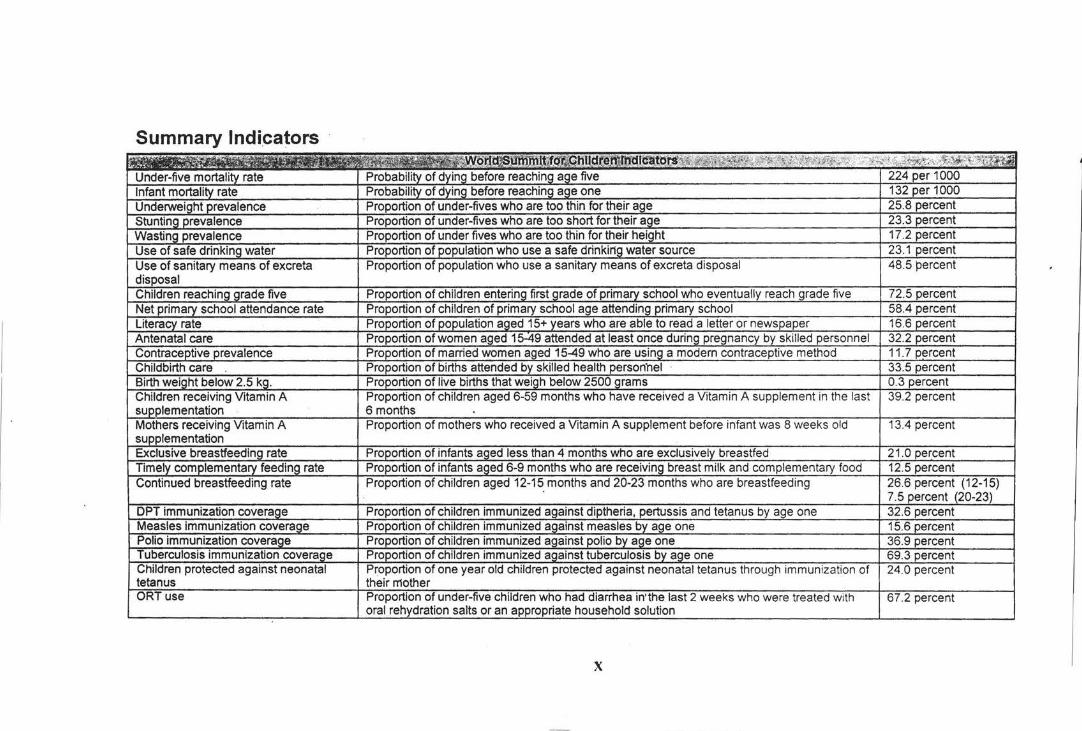
St::\11\tARY 1:'-JDICATORS ...................................................................................................................... XI
I. INTRODUCTION ..................................................................................................................................... I
BACI\.GROUND OF TilE SURVEY .......................................... ............. .. ........... ....... .. ...................................... I SOMALIA BACKGROUND ...................................................................................................... ....... ... .... .. ....... I
CO:'\STRAINTS WHICH \!liGHT IIA \/E AFFECTED THE l'\'11CS RESULTS ........................................... ................. 4
SURVEY OBJECTIVES ............................... .............................................................................................. ..... 4
II. SUR\'EY l\IETIIODOLOGY ................................................................................................................. 5
SAMPLE DESIGN .......................................................................................................................................... 5 QUESTIONNAIRES .............................. ................................. ......................................................................... 5 FIELDWORK AND PROCESSING ........................................... ............... . ......................................................... 6
Ill. SAMPLE CHARACTERISTICS AND DATA QUALITY ................................................................ 6
RESPONSE RATES ........................................................................................................................................ 6 AGE DISTRIBUTION AND l\11SSING DATA .................................................................................................... 7 CHARACTERISTICS OF THE HOUSEHOLD POPULATION ................................................................................ 7
IV. RESULTS ............................................................................................................................................... 8
A. INFANT AND UNDER-FIVE MORTALITY ................. ................................................................................. 8 B. EDUCA T!Ol'\ ............................................................................................................................................. 9
Early childhood education ............................................................................................................. ........ 9 Basic education .. .. ...................................................................................................... ............................ 9 Literacy .............. ............................................................... .. ................................................................. 10
C. WATERANDSANITATION ..................................................................................................................... lO Use of drinking water ........................................................................................................................... I 0 Use of sanitation ........... ........... .. .......................................................................................................... 11
D. CHILD MALNUTRITION .................................................................................................. ; ...................... II Nutritional status ................................................................................................... ........... ..... ~ ............. II Breastfeeding .................................. ..................................................................................................... /2 Salt iodization ...................................................................................................................................... 12 Vitatnin A supplententation ................. - ............................................................................................... 12 Low birth weight ....................................................................... ........................................................... /3
E. CHILD HEALTH ............................................ : ........................................................................................ 13 lnununi:::aUon coverage .. ...... ................................................................................................................ /3 Diarrhea .............................................................................................................................................. 15 Acute respiratory infection .................................................................................................................. 15 fMC/ initiative ...................................................................................................................................... /5 Malaria ... .... ......................... ........... ..................................................................................................... 16
F. HlV/AlDS ............................................................................................................................................ I7 AIDS hlo~~ledge ................................................................................................................................... /7 AIDS testing .......................... .......... ......................................... .. .......................................................... 19
G. REPRODUCTIVE HEALTH ...................................................................................................................... 20
Contraception ............................................................ ... ..................... ........... ... .. ............. .... ...... ........... 20 Prenatal care .... ...... .. ............... ...... .... ..... ...... ...... ....... ..... ............. ...................... ... .............. .. .. .. ....... .... 20 Assistance at delivery. ........... .. ........... ... ...... ............. ... ....... ... .... .... ............. ... ................ .... ..... ... ... ....... . 2 I
H. CHILD RIGHTS .... ...................................................... ... ...... ..... ... ....... ..... ... ................... .. ........... ... ...... ... 21 Birth registration ............... ...... ... .... ... ...... ... .. ..... ................................. ...... .. ....... .. ... ... ......... ..... ...... ... ... 2 I Orphanhood and living arrangements of children .... .. ................. ............. ........ ... .... ..... ........ .. .... ... ...... 22 Child labor ............ .. ... ......... ... .... ... ..... ...... ..................... ..... .... ...... ...................... ... .... .. ... .... ..... ..... .. ..... . 22
APPENDIX A: SAMPLE DESIGN 24
APPENDIX 8 : LIST OF PERSONNEL INVOLVED IN THE SOMALIA MICS 25
APPENDIX C: QUESTIONNAIRES 29
II I
(
List of Figures
Figure 1: Single year age distribution of the household population by sex, Somalia. 1999 .. ... ..... . 7 Figure 2: Estimates of infant and under five mortality based on indirect estimation. Somalia, 1999
.................... ......... ........ .. ....... ................ ........ ......................................... .. ...... ........... .. ....... 9 Figure 3: Percentage of children of primary school age attending primary school. Somalia, 1999
...................... .............. ... ............... ............... ......... ......... .. ................. ...... .... .... .... ...... ........ 10 Figure 4: Percentage of children aged 12-23 months who received immunizations by age 12
months, Sotnalia, 1999 ................... ....... .................................. .. ............... .. ....... ................. 14 Figure 5: Percentage of women aged 15-49 who have sufficient knowledge of HIV/AJDS
transmission by level of education, Somalia, 1999 ........... .. ....... ......... ....... ......... .. ....... .. ...... 19 Figure 6: Percent distribution of women with a birth in the last year by type of personnel
delivering antenatal care, Somalia, 1999 ................................. ........................... ................ 21
III
Foreword and Acknowledgements
This report and the survey data on which it draws was made possible by the participation of many individuals in UNICEF Somalia, in particular the UNICEF Hargeisa, Bossasso and Bidoa Offices, and in the Ministry of Health and Labour in Somali/and, Ministry of Social Affairs and Education in Punt/and, and by the financial support of UNICEF Somalia. The survey was managed by Deqa Ibrahim Abdi-Musa (Assistant Project Officer Monitoring and Evaluation, UNICEF Hargeisa Office), Ibrahim Abdi Shire (Assistant Project Officer Monitoring and Evaluation, UNICEF Bossasso Office), and Awil Bashir Ahmed (Assistant Project Officer Monitoring and Evaluation, UNICEF Baidoa Office). In the coordination of the field work they were assisted by Dr. Abdirahman Abdillahi, Mr. Khalif Hasan Faran, Mr. Aden Abdirhaman, Dr. Ahmed Legale, Dr. Ahmed Hassan Osman, Mr. Abdirahman Sh. Khalif Mohamed, and by Mohamed Sheikh Abdullahi (Programme Assistant, UNICEF Hargeisa).
Much of the data analysis, and the preparation of the first draft survey rep011 was undertaken by Eban Tehan, consultant to UNICEF Somalia. He was assisted by Teshome Ayehu, consultant, who undertook the training for the data entry and cleaning. The overall management of the survey was carried out by Marcoluigi Corsi (Monitoring and Evaluation Officer, UNICEF Somalia) who also carried out the finalisation of the survey report. Helpful suggestions, contributions and support to the entire survey process were provided by the following UNICEF technical advisors: Mahesh Patel (Regional Monitoring and Evaluation Officer, UNICEF ESARO), Kate Spring (MICS ESARO focal point), Manuel Fontaine (Programme Coordinator, UNICEF Somalia).
A number of constraints posed a major challenge to the assessment given the Somalia situation. Some of the data might be subject to certain limitations and might not fully reflect the reality on the ground. However, analysis of the avai I able data has permitted the preparation of a report that portrays the main features of and problems facing the fulfillment of children's rights in Somalia during the 21st centuary.
Finally, I would like to thank those whose names may not appear in the this report, but who gave their time in providing logistical support to the survey, and collecting the data. Without their diligent a!ld hard work the survey would not have been possible.
1nc ~~l--
ese tive CEF Somalia
Nairobi, 3 January 2001
-IV
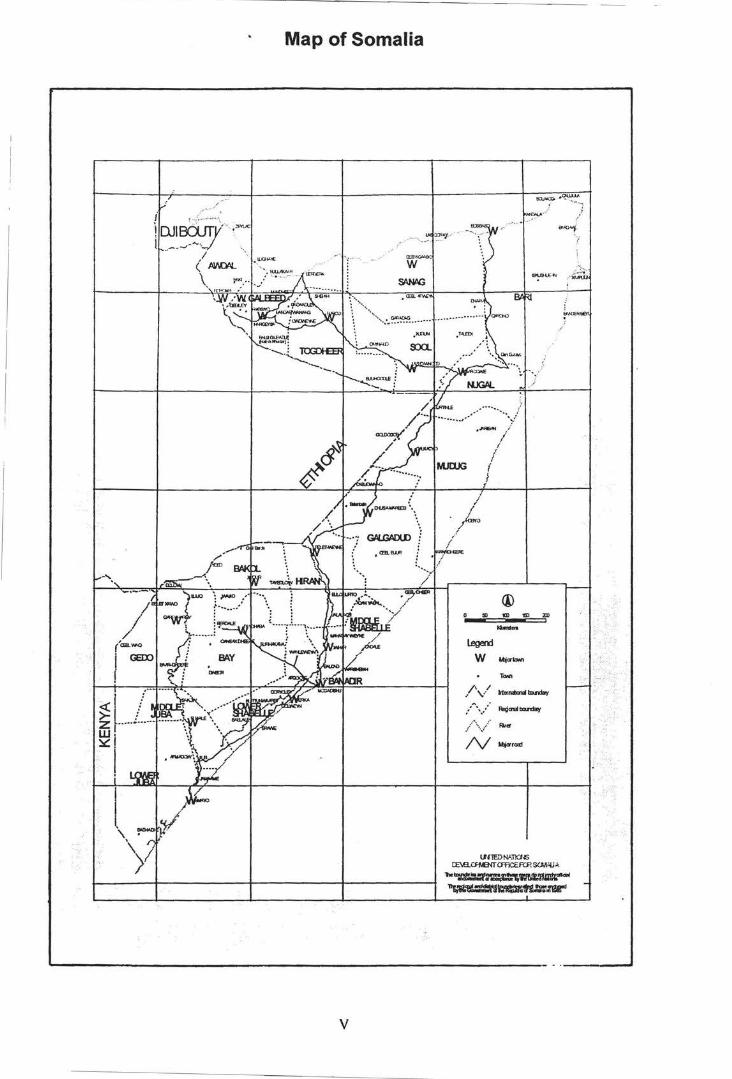
Map of Somalia
II /
(em.""'
I GEOO
v
s:J.J w:;- "~'-; j j
I fo
I
(1)
"' ID ,., :m
-.. ... l.egerd
w Mjaloon
,..,.. / ' / ' , ... -bud!ly
... / Rog..a lxln:loy
./ .. ~\ ..... ./ Rf«
N M;arood
!NiEDWJJCNS CE\!l.CR.elr CFMCEFCP. SCM:.UA
b-==::1':-.:=t:\~ ... ~,,,,.,t.=:rn:c!U.W:011"'
Executive Summary
The 2000 Somalia Multiple Indicator Cluster Survey (MICS) is a nationally representative survey of households, women, and children. The main objectives of the survey are to provide up-to-date information for assessing the situati"on of children and women in Somalia at the end of the decade and to furnish data needed for monitoring progress toward goals established at the World Summit for Children and as a basis for future action.
Infant and Under Five Mortality • Distortions in the MICS data on deaths among children preclude obtaining estimates of very
recent mortality rates. The data suggest that the infant mortality rate was 132 per I 000 and the under five-mortality rate was 224 per I 000 around January 1997.
Education • Slightly more than fifty eight percent of children of primary school age in Somalia are
attending primary school. School attendance in the North/West zone is considerably higher than in the rest of the country at 87 percent. At the national level, there is a slight difference between male and female primary school attendance (slightly more than 60 for male and 55 for female).
• Almost two thirds of children who enter the first grade of primary school eventually reach grade five.
• Only 16 percent of the population over age 15 years is literate. The percentage literate declines from 33 percent among those aged 15-34 to 2 percent among the population aged 65 and older.
Water and Sanitation • Twenty three percent of the population has access to safe drinking water - 31 percent in
urban areas, 18 percent in rural areas, and about 11 percent among nomadic group. The situation in the Central/South is considerably worse than in other zones; only 17 percent of the population in this zone gets its drinking water from a safe source.
• Forty eight percent of the population of Somalia is living in households with sanitary means of excreta disposal.
Child Malnutrition • Slightly more than twenty five percent (25) of children under age five in Somalia are
underweight or too thin for their age. Twenty three percent of children are stunted or too short for their age and seventeen percent are wasted or too thin for their height.
• Children whose mothers have secondary or higher education are the least likely to be underweight and stunted compared to children of mothers with less education.
Breastfeeding • Twenty one percent of children aged under four months are exclusively breastfed, a level
considerably low. At age 6-9 months, slightly more than 12 percent of children are receiving breast milk and solid or semi-solid foods.
Salt Iodization • For households where salt was tested, less than 1 percent had salt with less than 15 parts per
million of iodine and again less than I percent had salt with more than 15 ppm.
VI
Vitamin A Supplementation • Within the six months prior to the MICS, 39 percent of children aged 6-59 months received a
high dose Vitamin A supplement. Whilst about I percent was not sure when received any dose of Vitamin A, approximately 4 percent received one supplement in the period prior to that time.
• The mother's level of education does not seem to be related to the likelihood of Vitamin A supplementation. There is no significant difference between the percentage of children receiving a supplement in the last six months whose mothers have no education and the percentage of children of mothers with secondary or higher education.
• Only about I 3 percent of mothers with a birth in the year before the MICS received a Vitamin A supplement within eight weeks ofthe birth
Low Birth weight • Births in urban areas are more likely to be weighed (7 percent) than those occurring in either
rural (2 percent) or in nomadic populations (1 percent). Birth of children who weigh below 2500 grams are more likely to occur for women in the North/East zone (0.6 percent).
Immunization Coverage • Seventy percent of children aged 12-23 months received a BCG vaccination by the age of 12
months and the first dose of DPT was given to 57 percent. The percentage declines for subsequent doses ofDPT to 45 percent for the second dose, and 33 percent for the third dose.
• Fifty seven percent of children received Polio I by age 12 months and this declines to 37 percent by the third dose.
• The coverage for measles vaccine is lower than for the other vaccines at 16 percent, primarily because only about 16 percent of children get the vaccine before their first birthday. ,
• Only about 10 percent of children had all eight recommended vaccinations in the first 12 months of life.
• Male and female children are vaccinated at roughly the same rate. • Vaccination coverage is highest among children whose mothers have primary education. The
education differences are greatest for the third doses of DPT and Polio, suggesting that drop out rates are higher among children with less educated mothers.
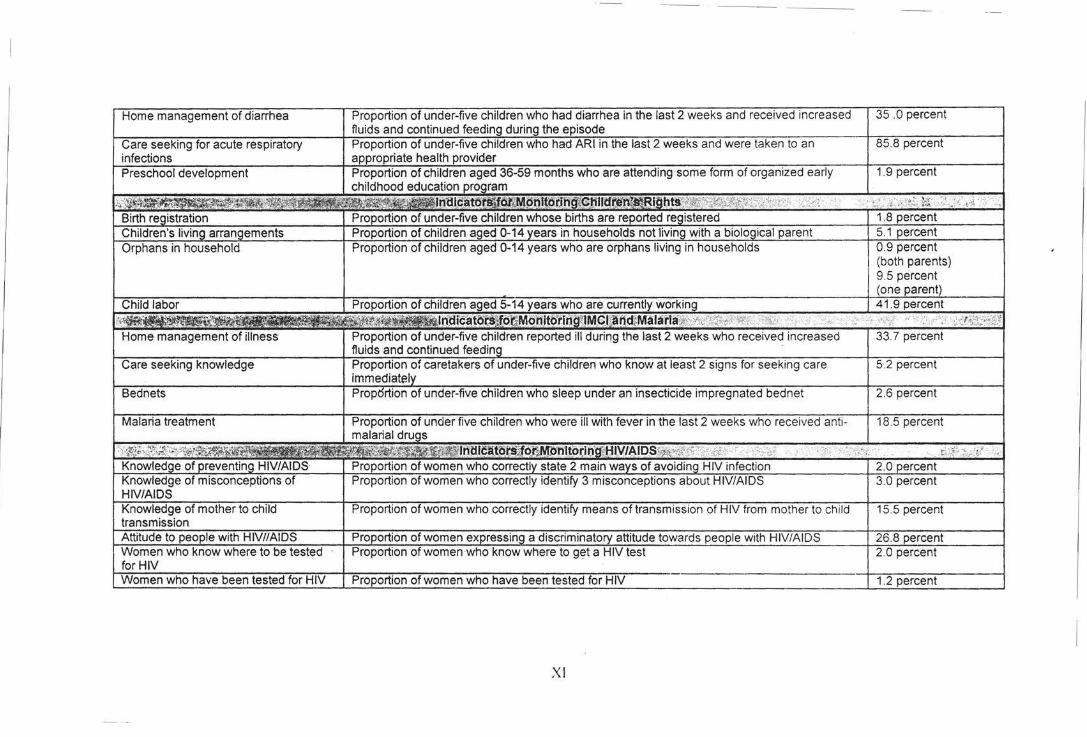
Diarrhe(l • Approximately six in ten children with diarrhea received one or more of the recommended
home treatments (i.e., were treated with ORS or RHF). • None of children with diarrhea received increased fluids and continued eating as
recommended.
Acute Respiratory Infection • About two percent of under five children had an acute respiratory infection in the two weeks
prior to the survey. Approximately 85 percent of these children were taken to an appropriate health provider.
IMCI Initiative • Among under five children who were reported to have had diarrhea or some other illness in
the two weeks preceding the MICS, 35 percent received increased fluids and continued eating as recommended under the IMCI programme.
• Only 5 percent of caretakers knows at least two of the signs that a child should be taken immediately to a health facility.
VII
Malaria • About fifteen percent of under five children slept under a bed net the night prior to the survey
interview. However, only 2 percent of the bednets used are impregnated with insecticide. • About 66 percent of children with a fever in the two weeks prior to the MICS interview were
given Paracetamol to treat the fever and 18 percent were given Chloroquine. A relatively large percentage of children ( 14 percent) were given some other medicine.
HIVIAIDS • Only slightly more than I percent of women aged 15-49 know two of the main ways to
prevent HIV transmission - having only one uninfected sex partner, using a condom every time, and abstaining from sex.
• Only 3 percent of women correctly identified three misconceptions about HIV transmissionthat HIV can be transmitted through supernatural means, that it can be transmitted through mosquito bites, and that a healthy looking person cannot be infected. The percentage who know where to get tested for HIV increases with the level of education
• Only 2 percent. of women of reproductive age in Somalia know a place to get tested for AIDS and only 1 percent have been tested.
• Apparently only 2 percent of the women aged 15-49 in Somalia can be considered having sufficient knowledge ofHIV transmission.
Contraception • Current use of modem contraception was reported by almost 12 percent of married women
whilst 88 percent reported to use traditional methods. The most popular method is .the "lactation amenorrhoea" (LAM) followed by diaphragm/jelly/foam, which accounts for almost 10 percent of married women.
Prenatal Care • Only 24 percent women with recent births in Somalia are protected against neonatal tetanus.
Almost 22 percent of these women received two or more doses of tetanus toxoid within the last three years. ·
• About 47 percent ofwomen in Somalia receive some type of prenatal care and slightly more than 32 percent receive antenatal care from skilled personnel (doctor, nurse, midwife).
Assistance at Delivery • A doctor, nurse, or midwife delivered about 30 percent of births occurring in the year prior to
the MICS survey. This percentage is highest in the North/East zone at 49 percent and lowest in the North/West and Central/South zones at 27 percent.
Birth Registration • Birth registration is virtually not existing in Somalia. The births of about 2 percent of children
under five years have been registered. There are no significant variations in birth registration across sex, age, or education categories.
Orphanhood and Living Arrangements of Children • Overall, three in every four children aged 0-14 are living with both parents. Children who are
not living with a biological parent comprise 5 percent and children who have one or both parents dead amount to 9 percent of all children aged 0-14.
• There are no significant differences among urban, rural and nomadic population. However, the percentage of male children living with both parents is quite higher if compared to the female children in the same age group.
VIII
Child Labor • Slightly more than 36 percent of children aged 5-14 years engage in paid work. About twice
as many - 63 percent - participate in unpaid work for someone other than a household member.
• Slightly over 51 percent of the children engage in domestic tasks, such as cooking, fetchin g water, and caring for other children, for less than four hours a days while 48 percent spend more than four hours a day on such tasks .
I\
Summary Indicators
X
35 .0 percent
85. percent
XI
I. Introduction
Background of the Survey
The purpose of the End-Decade MICS survey was to assess progress for children and women at enddecade through the use of household surveys. The Plan of Action also called for the establishment of mechanisms for monitoring progress toward the goals and objectives set for the year 2000. Toward this end, UNICEF has developed a core set of 75 indicators of specific aspects of the situation of children in coordination with other international organizations. A MICS survey was conducted in 1995 to measure progress at mid-decade. The 2000 Somalia MICS survey has been implemented to provide end-decade information on many of the indicators. It provides a systematic approach to carrying out a household survey to fill gaps in the data necessary for reporting on the situation of children and women at the end of millennium, and for laying down a base from which to measure change in the next decade and beyond.
The end-decade assessment derives its primary focus from the World Summit for Children (WSC), held in New York in September 1990, at which 71 Heads of State and government and 88 senior officials from countries around the world pledged themselves to a Declaration and Plan of Action for Children. That commitment has now been made by 158 Heads of State, and countries around the world have proceeded to develop their own National Programmes of Action for children. Today these National Programmes of Action encompass 9 out of every 10 children on earth.
The governments that signed the WSC Declaration and Plan of Action for Children also committed themselves to monitoring progress towards the goals and objectives set for the year 2000. The Plan of Action called for each country to "establish appropriate mechanisms for the regular and timely collection, analysis and publication of data required to monitor social indicators related to the wellbeing of children. Many governments have taken substantial steps to do this in their own National Programmes of Action. Measurement of these indicators is an essential part of the process, both for providing information for action and for assessing change.
Somalia does not appear in the list of those Governments being one of the only two Countries in the world not having ratified the Convention on the Rights of the Child. However, UNICEF in collaboration with the Ministry of Planning from "Somaliland", the Ministry of Social Affairs from "Puntland", and local authorities, local and international NGOs from the central and southern Somalia carried out the survey, which is now the most comprehensive survey available for all the country.
Therefore, in a situation of data scarcity, the results of the survey assume a relevant importance not just for monitoring progress towards the goals and objectives set for the year 2000 but also for the planning and programming of all the actors working in Somalia.
Funding was provided by the Somalia UNICEF office.
Somalia Background
-Geography
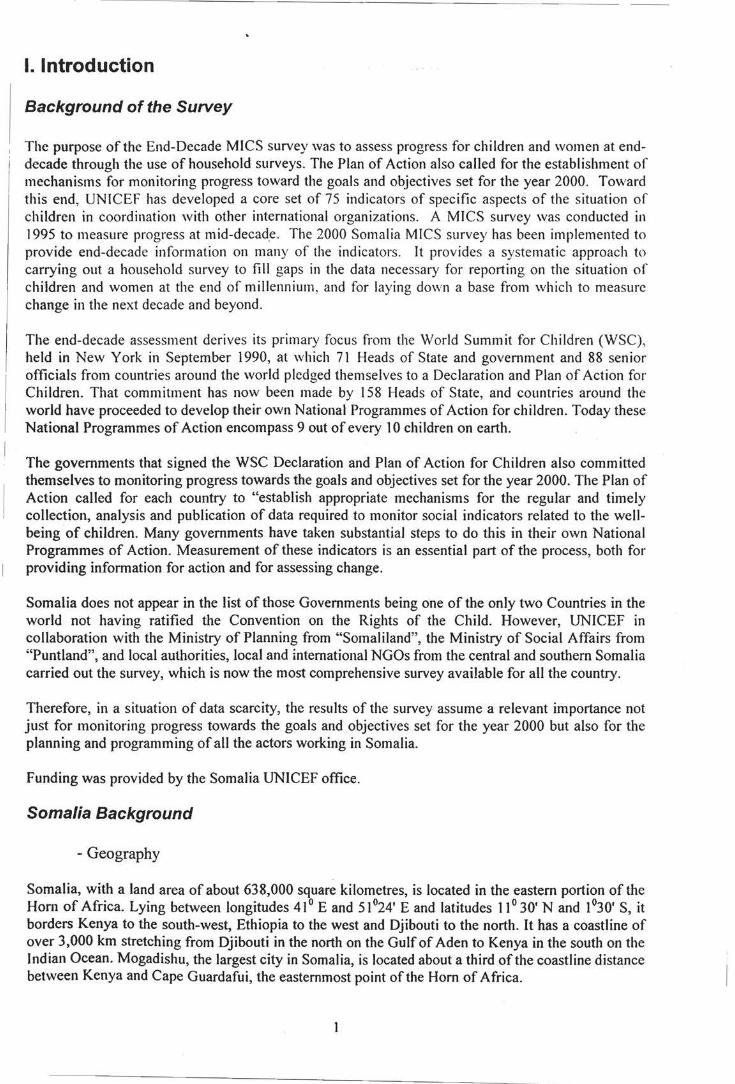
Somalia, with a land area of about 638,000 square kilometres, is located in the eastern portion of the Hom of Africa. Lying between longitudes 41° E and 51 °24' E and latitudes 11° 30' N and I 030' S, it borders Kenya to the south-west, Ethiopia to the west and Djibouti to the north. It has a coastline of over 3,000 km stretching from Djibouti in the north on the Gulf of Aden to Kenya in the south on the Indian Ocean. Mogadishu, the largest city in Somalia, is located about a third of the coastline distance between Kenya and Cape Guardafui, the easternmost point of the Horn of Africa.
The highest altitudes in Somalia are found in the northern and north-eastern regions, which comprise about a third of the country's land area. These regions are characterised by (a) a narrow coastal strip (<500 m above sea level) on the Gulf of Aden; and (b) plateaux and mountains (mostly 500-2000 m high) that are an extension of the much higher Ethiopian highlands. The larger and most populous part of the country, central and southern Somalia, comprises extensive lowlands (0-200 m and widest towards the Kenya border and along the river valleys of the Juba and the Shebelle), plains in the 200-500 m range and plateaux with an altitude of 500-1000 m. The Juba and Shebelle rivers, originating from the wet Ethiopian highlands, although often subject to disastrous flooding, are important sources of water and their valleys comprise the most fertile land in the country.
Rainfall and temperature vary considerably from region to region and from season to season. High temperatures (often > 30°C) are characteristic of most of Somalia. However, in the northern regions, high altitude contributes to lower temperatures ranging from local frosts (in the highest areas) to about 25°C during winter in the northern hemisphere. Rainfall (received during two rainy seasons -April/May and October to December) is unreliable and sparse1
• Few areas receive more than 500 mm annually and most have considerably less. High temperatures over most of Somalia lead to high evapotranspiration, thus rendering the rainfall inadequate for crop cultivation in many areas.
- Demography
As no recent census has been conducted2, the total population of Somalia is subject to several
estimates exhibiting considerable variations. Largely on the advice of a study conducted by UNFPA consultant in December 199t, UNDOS makes the following estimates: 1995 - 6.26 million (m); 1997 - 6.59 m; 1999 - 7,14 m and 2000- 7.43 m. An average annual growth rate of 2.76% for the period 1995 to 2000 is estimated. Although two decades of violent disturbances have led to major changes in the location of human settlement, the population can be classified into three categories: nomadic pastoralist, sedentary rural and urban.
Regional breakdowns are also particularly uncertain and the most reliable ones are those calculated by UNFPA, which might not take account adequately of internal displacement with corresponding reductions in Southern and parts of Central zones. In general, Somalia is very sparsely populated, with a population density for the country as a whole of fewer than ·1 0 persons per square kilometer. If the urban population is excluded (about 25 per cent) the rural population density is about seven persons per square kilometer overall, and fewer than five in the low-rainfall nomadic areas. These are among the lowest densities in the world. Average household size is estimated at about six, while average fertility is 6.76
-Economic features
With an estimated GNP per capita of US $176 in 1997, Somalia is among the five poorest countries in the world (Nair and Abdulla, 1998t. The economy is agro-based with the following major activities (a) rearing of livestock (cattle, goats, sheep, and camels); (b) production of cash crops (e.g. bananas
On an average rains fail once every five years, leading to recurrent droughts and periods of hardship.
2 Since 1975 there has not been a population census. The handling of demographic data in Somalia has been subject to controversy. For instance (a) rigging is claimed to have been a serious problem in the 1975 census; and (b) public estimates of population (particularly as their relate to aid) after 1975 have been suspect.
Report on the consu/tancy mission on population statistics of Somalia, UNDOS, December 1997. 4 However, some studies on Somalia caution that analyses of the economy suffer from lack of accurate data, often leading to serious underestimates of the income of Somali households.
2
\ I
1 l
l i
and other horticultural produce) larg~ly under irrigation in the river valleys of the Juba and Shebelle; and (c) cultivation of subsistence crops (sorghum, millet, maize, pulses and vegetables). Also important is exploitation of natural environment (e.g. aromatic gum-harvesting and fishing am.ong some coastal inhabitants). A thriving export trade, particularly of livestock and livestock products to Middle East countries and bananas to the European Union, is the most important foreign exchange earner. Among imports into Somalia are petroleum products, manufactured goods, khat (a mildly narcotic drug grown in Kenya, Ethiopia and parts of the Middle East) and food commodities such as wheat flour, rice, pasta, sugar and oil seed which constitute an important part of the Somali diet. Somalia has a strong internal trading system based on a thriving entrepreneurial sector that deals in services and goods (both local and imported). Remittances from Somalis living abroad, estimated at $190 million in 1997 (Development Solutions for Africa, 1998:9), constitute an important part ofthe economy.
Serious imbalances in the Somali economy are observable. Since the 1960s the value of exports has covered a decreasing proportion of the value of imports, with the resulting deficit being covered by external loans and grant aid5
• Contemporaneously, there has been a steady decline in per capita food production, leading to increased dependence on food imports and food aid. These untoward developments, which partly reflect a weak economic base of a semi-arid country at independence (Hempstone, 1961 ), are manifestations of rapid population growth, pricing policies that have created disincentives among staple food crop farmers, increased proportion of irrigable land set aside for cash crops, inefficient distribution and marketing infrastructures, negative effects of war and civil upheavals (UNDP, 1998). Consequences of the economic downturn include (a) a widening gap between the 'haves' and 'have nots'; (b) emergence of a small class of merchants as socially the most influential group, in contrast to an increasing proportion of the population living on the fringes of deprivation (e.g. impoverished subsistence farmers, internally displaced persons (IDPs), single-parent families particularly those headed by women, and unemployed and underemployed urban dwellers); and (c) growing dependency on external resources for the provision of basic needs such as food and social services.
- Governance
In 1960 the two independent former colonial territories - British Somaliland in the northwest and Italian Somalia in the eastern, central and southern zones- merged to form the Republic of Somalia. In spite of attempts by the new leaders to rally the populace around the creation of a modem and developing "Greater Somalia" (incorporating territories inhabited by Somalis in neighbouring countries), the democratically elected government was weakened by the propensity among the ruling elite to organise governance largely on clan-based relationships (Markakis, 1987; Mohammed, 1999). Following a coup d'etat in 1969, Siyaad Barre took over as president but failed to address this propensity. He resorted to maintaining his position by (a) use of strong-arm tactics, including bribery and widespread abuse of human rights; and (b) encouraging disputes and tensions among other clans, while confining most appointments in key public positions and allocations of lucrative economic opportunities to members of his Darood-Marehan clan. The resulting divisions within the Somali society were exacerbated by defeat in the 1977-78 Ogaden war with Ethiopia. Increasing in tempo in the course of the 1980s opposition to the regime, taking the fonn of civil war, eventually led to the overthrow of Barre in January 1991. However, Somali society had been so polarised -to a large extent along lineage lines - that the overthrow of Barre was not seized upon as a starting point for establishing a more accountable Somalia-wide government.
Civil war was inevitable in the face of (a) competition between the faction leaders (often with selfserving external support) fom1erly allied against Barre; {b) the tendency for Somali clans to segment into smaller units; (c) proliferation of firearms; and (d) despoiling of the machinery of government (including flight of public officers and destruction of buildings, equipment and official documents) in
Export earnings were seriously reduced by a Saudi Arabian ban on the imports of Somali livestock in February 1998 (UNDP, 1998:61). The ban was lifted in June 1999.
3
' i
the course of the struggle for the "'verthrow of Barre (Compagnon, 1998). In May 1991 northwest Somalia declared itself to be the independent Republic of Somaliland (RS), but for the next 4 years RS suffered from fighting between factions of the dominant lsaaq clan and between them and other clans in the zone. Currently, while a measure of communal reconciliation has been achieved in RS and in the northeast zone (predominantly inhabited by the Darood-Harti clan). in the central and southern zones disunity is extant, with fighting continuing among factions of the Hawiye clan and those of other clans such as the Darood-Ogadeen, Darood-Marehan and Rahanweyn.
Among the consequences of civil upheaval in Somalia, three stand out. First. a Somalia-wide government has ceased to exist, negating the systematic collection of public revenue in most areas. Thus there is little or no support for economic and social development from local public resources. Second, a large propot1ion of the Somali population has been impoverished and forced to move to new areas, either as refugees in neighbouring countries or I DPs. Some of the basic needs of refugees and IDPs are being met through resources from the international donor community. but this tends to facilitate dependency. Third, civil war has led to the creation of armed militias and bands that are a constant threat to the security of the populace. But because these anned groups rely on the gun for their livelihood, they are difficult to disarm, although this is a necessary step towards rebuilding a country-wide civilian government.
Constraints which might have affected the MICS results
Cognisance should be made ofthe possibility that some ofthe data used as the basis of the assessment report may be prone to reliability and validity problems. Pertinent to this are the following observations:
(a) Insecurity and weak administration structures in some areas may have led to under-reporting, resulting in incomplete data sets for some of the factors surveyed.
(b) Beginning in the pre-1991 period, deliberate concealment and/or inflation of information has been a major issue largely due to a perception by some respondents that data collection under the auspices of donors invariably influences the level of future aid.
(c) Due to the low level of education among Somali population and in particular among women, the sample size for women with secondary education is very small. Therefore, interpretation of data for women with secondary and higher education has to be taken with precaution.
Survey Objectives
The 2000 Soma.lia Multiple Indicator Cluster Survey has as its primary objectives:
• To provide up-to-date information for assessing the situation of children and women in Somalia at the end of the decade and for looking forward to the next decade; ·
• To furnish data needed for monitoring progress toward goals established at the World Summit for Children and a basis for future action;
• To contribute to the improvement of data and monitoring systems in Somalia and to strengthen technical expertise in the design, implementation, and analysis of such systems.
4
\ .; ·;=
c
II. Survey Methodology'
Sample Design
The Somalia Multiple Indicator Cluster Survey (MICS) was conducted as a household survey. with the household6 as the basic sampling unit.
The sample for the MICS-2000 was designed to provide estimates of health indicators at the national level, for urban, rural and nomadic areas, and in three zones: Northwestern zone, Northeastern zone, and Central-southern zone.
The design of the survey took into account the survey objectives and cost factors. Based on this, the sample size was calculated using a 3/5 percent error margin at which reasonable survey results could be produced. A spread sheet model was used to calculate the sample sizes. Values for the estimated prevalence of key indicators at the levels expected in the population were incorporated. Based on this spreadsheet model, a total of 4,400 households were calculated.
The MICS-2000 is a stratified, self-weighting, nationally representative sample of households chosen from 100 clusters. The sampling approach applied was a two stage stratified. The first stage of sampling consisted of selecting clusters in the three zones. Clusters were stratified into urban, rural and nomadic. The second stage of sampling consisted of the actual selection of households from the clusters by applying a systematic sampling with probability proportional to size (PPS). A cluster consisted of 44 households. Therefore from the total of I 00 clusters, a resulting total of 4,400 households were selected for nationally.
Full technical details of the sample are included in Appendix A.
Questionnaires
The questionnaires for the Somalia MICS were based on the MICS Model Questionnaire with few modifications and additions. A hous.ehold questionnaire was administered in each household, which collected various information on household members including sex, age, literacy, marital status, and orphanhood status. The household questionnaire also includes education, child labor, water and sanitation, and salt iodization modules. In addition to a household questionnaire, questionnaires were administered in each household for women age 15-49 and children under age five. For children, the questionnaire was administered to the mother or caretaker of the child. The questionnaire for women contains the following modules:
Child mortality Tetanus toxoid Maternal and newborn health Contraceptive use HIV/AIDS.
The questionnaire for children under age five includes modules on:
Birth registration and early learning Vitamin A Breastfeeding Care of Illness Malaria
6 A household is defined in the Multiple Indicator Cluster Survey as a group of persons who live and eat together.
5
Immunization Anthropometry.
From the MICS model English version, the questionnaires were translated into Somali and back translated into English. The questionnaires were pretested during the month of November 1999. Based on the results of the pretest, modifications were made to the wording and translation of the questionnaires. For the full questionnaires, see Appendix B.
Fieldwork and Processing
Given the political situation in Somalia, it was not possible to conduct the training in one central location. so training for the MlCS 2000 survey was conducted in four different locatil1ns: llargeisa in the N01thwestern zone ("Somali land''), Bosasso in the N01theastcrn zone ("Puntland .. ). Baidoa and Mogadishu in the Central and Southern zone. A total of 122 trainees mainly pooled for the Ministries of Health, Planning and Social Affairs from ·'Somaliland" and "Puntland", and international and local NGOs for the Central/Southern zone were trained for a period of ten days, 21 as supervisor, 86 as field editors and as interviewers, and 15 as team leaders.
The training for the enumerators consisted mostly of lectures on how to handle an interview, how to fill in the questionnaires (household, women, and children under 5) and mock interviews between participants. Close to the end of the training period, participants conducted field practice interviews in the communities in the three towns using the questionnaires. Trainees whose performance was rated as superior were selected as supervisors and received additional training on supervisor's responsibilities, how to prepare, organize and supervise the fieldwork, how to maintain the fieldwork control sheet, how to monitor interviewers' performance, and how to edit questionnaires.
The fieldwqrk for the MICS 2000 was carried out by a total of 19 teams. Fieldwork in all three zones was completed in 4 weeks.
All the questionnaires from the North/West and North/East zones were returned to Hargeisa and Bossaso and those from the CS zone were transferred to Nairobi for data processing. This process consisted of data entry, verification, archiving of raw data, secondary editing, archiving of final data file, and creation of variables, tabulation, and consistency checks. The data entry and data editing templates were written in Microsoft ACCESS by the Data Management and Information Unit UNDOS, Nairobi.
A total of 12 data entry clerks were trained on the use of the templates and performed the data entry operations: 3 in Hargeisa, 3 in Bossaso and 6 in Nairobi. One consultant was employed as supervisor and monitor data entry operations. This consultant also performed the duties of data cleaning, editing and conversion from Microsoft ACCESS into SPSS version 9 forn1at.
Preliminary frequency and cross tabulation were performed by the consultant and further cross tabulations were conducted by a second consultant, using SPSS syntaxes written by Micro International after having attended the MICS 2000 workshop in Abidjan organized by UNICEF WCARO. Results from the two cross tabulation operations were compared and synchronized by the second consultant.
Ill. Sample Characteristics and Data Quality
Response Rates .
Of the 4,400 households selected for the Somalia MICS sample, 4,217 were found to be occupied (Table 1 ). Of these, 4,170 were successfully interviewed for a household response rate of 99 percent.
6
i i i I
The response rate was almost the same in rural areas (99 percent), in urban (98 percent) and nomadic areas (99 percent). In the interviewed households, 5,278 eligible women aged 15-49 were identified. Of these, 5,218 were successfully interviewed, yielding a response rate of 99 percent. In addition, 4.178 children under age five were listed in the household questionnaire. Of these, questionnaires were completed for 4. 103 children for a response rate of98 percent.
Age Distribution and Missing Data
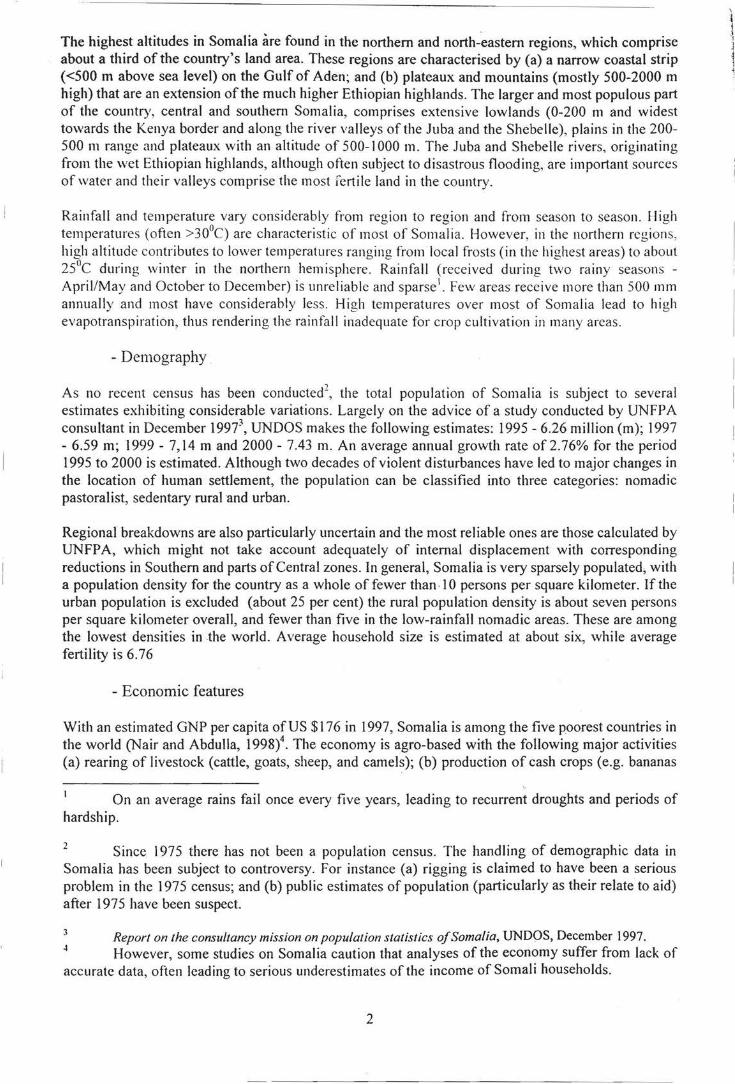
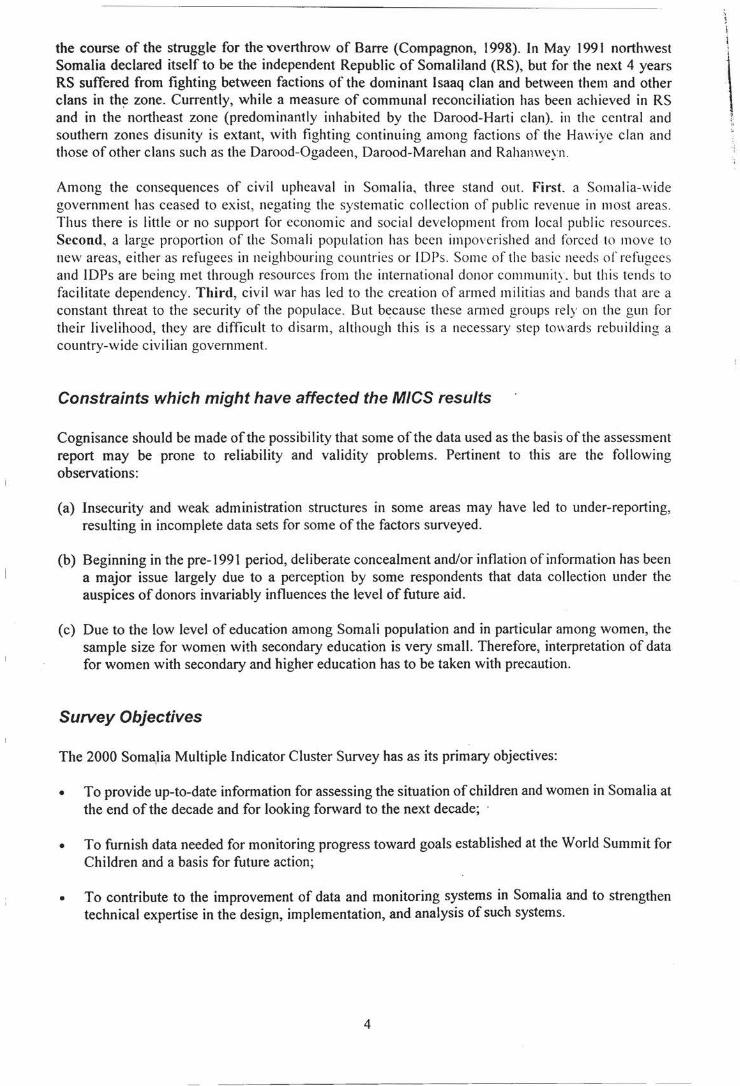
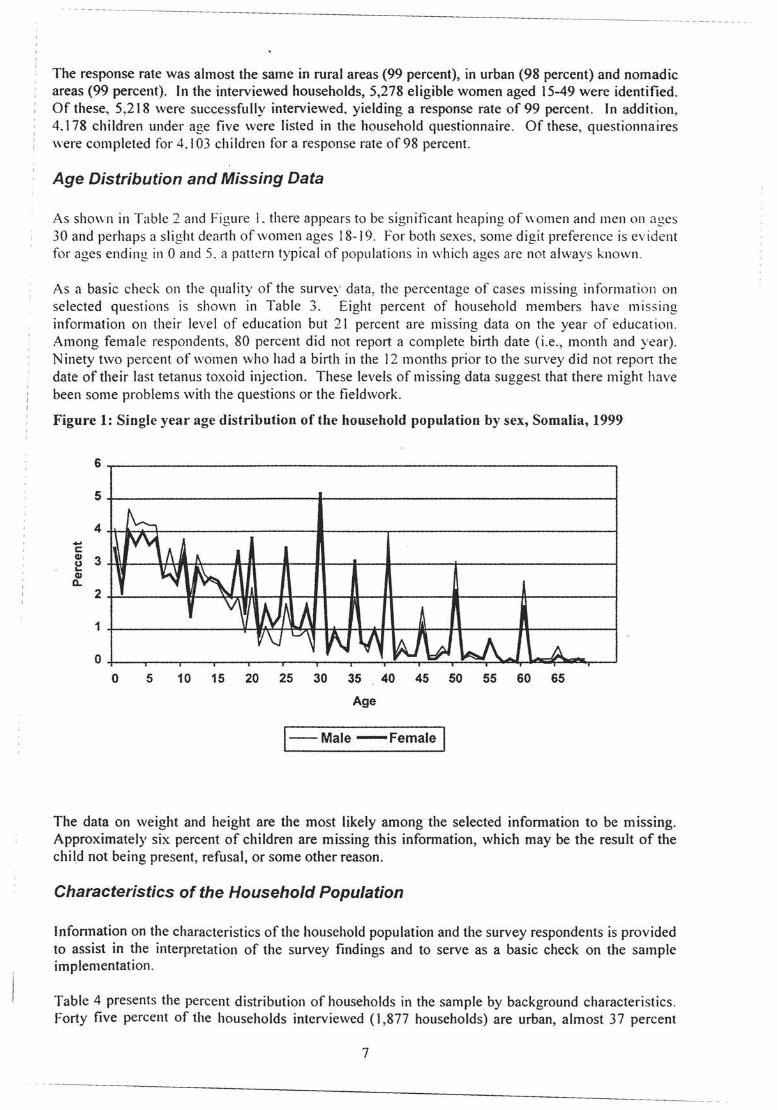
As shown in Table 2 and Figure L there appears to be significant heaping of women and men on ages 30 and perhaps a slight dear1h of women ages 18-19. For both sexes, some digit preference is evident for ages ending in 0 and 5, a pattern typical of populations in which ages are not always known.
As a basic check on the quality of the survey data, the percentage of cases missing information on selected questions is shown in Table 3. Eight percent of household members have missing information on their level of education but 21 percent are missing data on the year of education . Among female respondents, 80 percent did not report a complete birth date (i.e., month and year). Ninety two percent of women who had a birth in the 12 months prior to the survey did not report the date of their last tetanus toxoid injection. These levels of missing data suggest that there might have been some problems with the questions or the fieldwork.
Figure 1: Single year age distribution of the household population by sex, Somalia, 1999
6
5
4 .... c e 3 G)
c. 2
1
0
~ rv\1
0 5
A II.
~ ~ lJ 'v r, N A)
r/\j 1../ if\Jl.A ~ ~ kJ\...J l ~ 10 15 20 25 30 35 40 45 50 55 60 65
Age
I--Male -Female I
The data on weight and height are the most likely among the selected information to be missing. Approximately six percent of children are missing this information, which may be the result of the child not being present, refusal, or some other reason.
Characteristics of the Household Population
lnfonnation on the characteristics of the household population and the survey respondents is provided to assist in the interpretation of the survey findings and to serve as a basic check on the sample implementation.
Table 4 presents the percent distribution of households in the sample by background characteristics. forty five percent of the households interviewed (I ,877 households) are urban, almost 37 percent
7
--------------------- - - --- - -.
(1,539 households) are rural, and' IS percent (754) are nomadic. The Central/Southern zone comprises the largest of the three zones with 50 percent of households whereas North/East and North/West follow with 25 percent each. Most of the households have between four and five members. Sixty two percent of the households contain at least one child under age five and 92 percent contain at least one woman age 15-49.
Table 5 shows the characteristics of female respondents aged 15-49 g1vmg a very frightening situation. Women age 15-19 comprise the greatest percentage of the sample at 24 percent. This percentage declines steadily across age groups until age 45-49 where it is 4.1 percent. Approximately 66 percent of women in the sample are married and 79 percent have ever had a birth. The majority of women have not had any kind of education level while only 5 percent have had secondary education.
Table 6 shows the characteristics of children under age five. Fifty three percent of the children are male and 47 percent are female. It is interesting to note the pattern for the 12-23 months if compared with the 0-11 and the 24-36 months. Approximately 75 percent of mothers of children under age five have no education. Note that, for children whose mothers did not live in the household, the education of the child's caretaker is used. There are slightly more children aged under six months than aged 6-11 months.
IV. Results
A. Infant and Under-Five Mortality
The infant mortality rate is the probability of dying before the first birthday. The under five mortality rate is the probability of dying before the fifth birthday. In MICS, infant and under five mortality rates are calculated based on an indirect estimation technique (the Brass method). The data used in the estimation are: the mean number of children ever born for five year age groups of women from age 15 to 49, and the proportion ofthese children who are dead, also for five year age groups of women. The technique converts these data into probabilities of dying by taking account of both the mortality risks to which children are exposed and their length of exposure to the risk of dying.
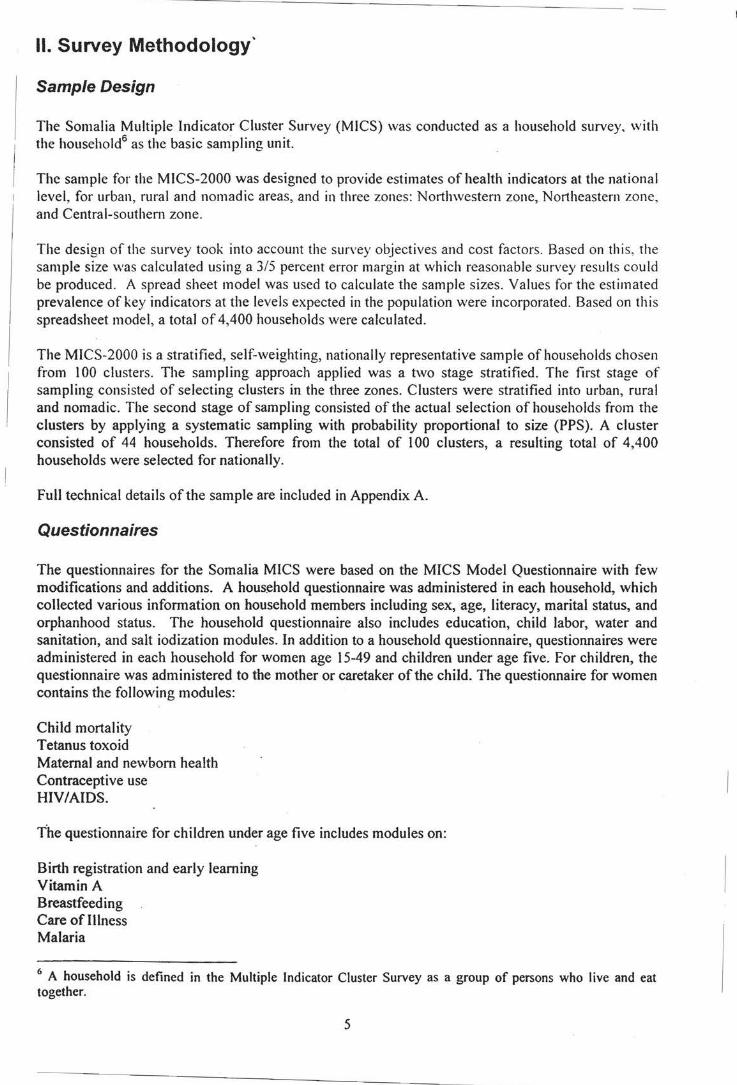
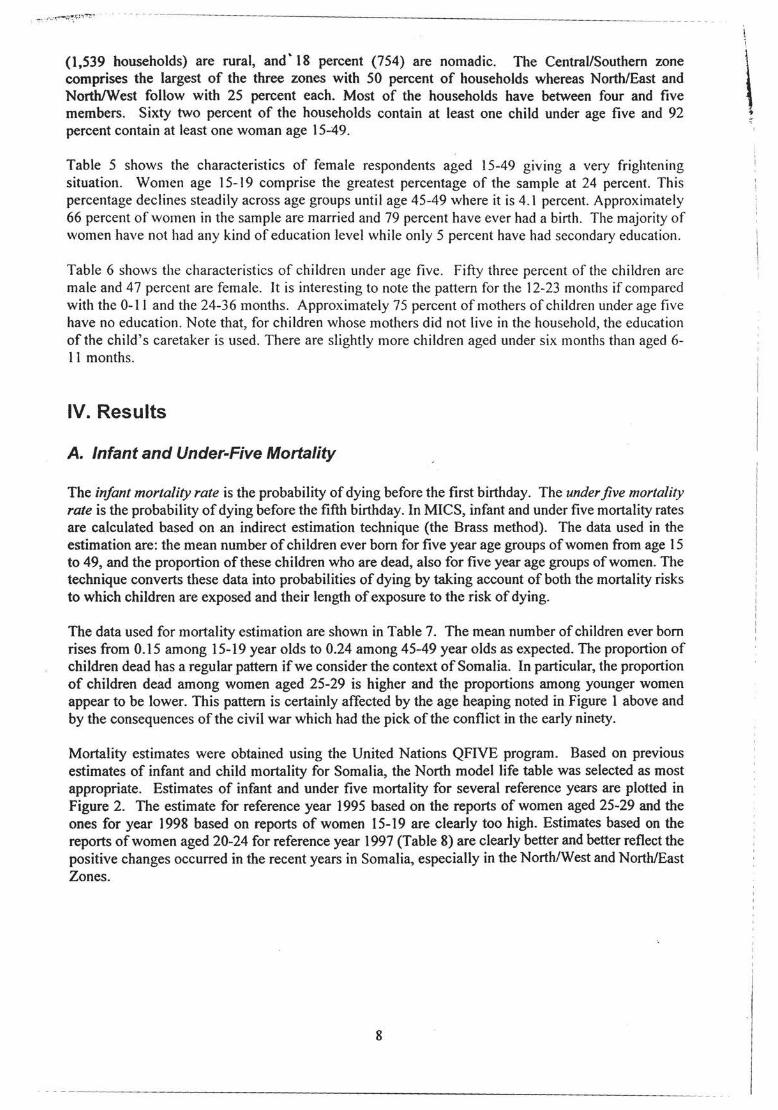
The data used for mortality estimation are shown in Table 7. The mean number of children ever born rises from 0.15 among 15-19 year olds to 0.24 among 45-49 year olds as expected. The proportion of children dead has a regular pattern if we consider the context of Somalia. In particular, the proportion of children dead among women aged 25-29 is higher and the proportions among younger women appear to be lower. This pattern is certainly affected by the age heaping noted in Figure 1 above and by the consequences of the civil war which had the pick of the conflict in the early ninety.
Mortality estimates were obtained using the United Nations QFIVE program. Based on previous estimates of infant and child mortality for Somalia, the North model life table was selected as most appropriate. Estimates of infant and under five mortality for several reference years are plotted in Figure 2. The estimate for reference year 1995 based on the reports of women aged 25-29 and the ones for year 1998 based on reports of women 15-19 are clearly too high. Estimates based on the reports of women aged 20-24 for reference year 1997 (Table 8) are clearly better and better reflect the positive changes occurred in the recent years in Somalia, especially in the North/West and North/East Zones.
8
\ .,
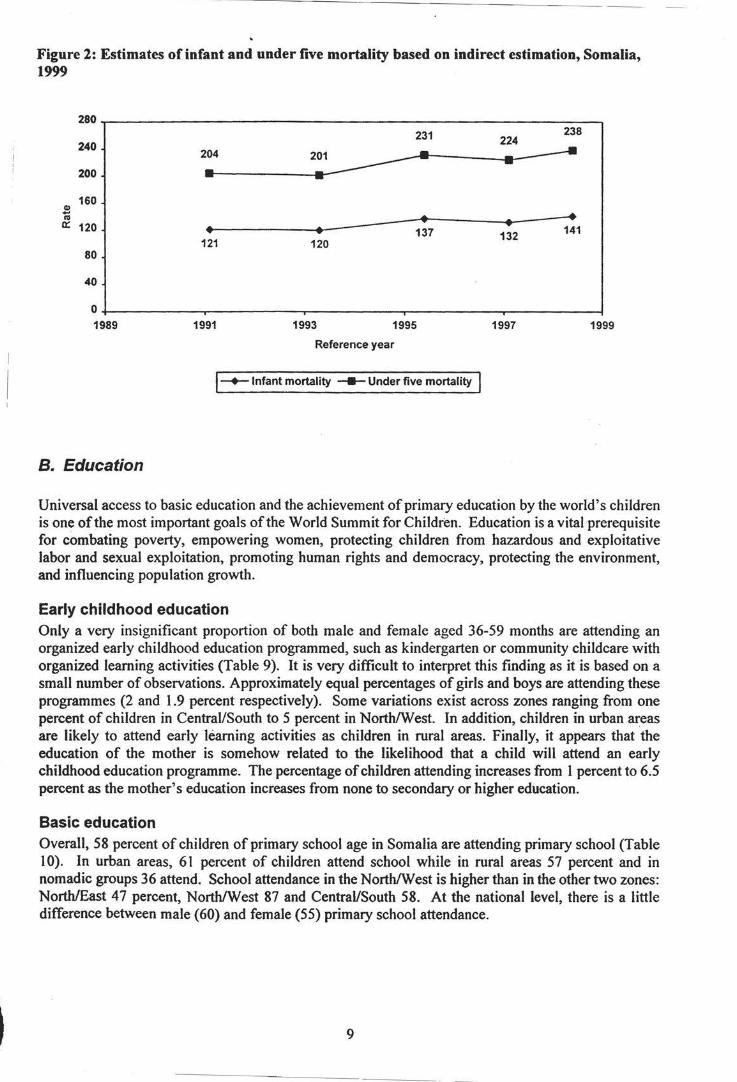
Figure 2: Estimates of infant and under five mortality based on indirect estimation, Somalia, 1999
280
240
200
160 CD -"' a:: 120
80
40
0 1989
B. Education
204
• 121
1991
• 120
231
• 137
1993 1995
Reference year
!-+-Infant mortality ----Under five mortality I
238 224
• 141 132
1997 1999
Universal access to basic education and the achievement of primary education by the world's children is one of the most important goals of the World Summit for Children. Education is a vital prerequisite for combating poverty, empowering women, protecting children from hazardous and exploitative labor and sexual exploitation, promoting human rights and democracy, protecting the environment, and influencing population growth.
Early childhood education Only a very insignificant proportion of both male and female aged 36-59 months are attending an organized early childhood education programmed, such as kindergarten or community childcare with organized learning activities (Table 9). It is very difficult to interpret this finding as it is based on a small number of observations. Approximately equal percentages of girls and boys are attending these programmes (2 and 1.9 percent respectively). Some variations exist across zones ranging from one percent of children in Central/South to 5 percent in North/West. In addition, children in urban areas are likely to attend early learning activities as children in rural areas. Finally, it appears that the education of the mother is somehow related to the likelihood that a child will attend an early childhood education programme. The percentage of children attending increases from 1 percent to 6.5 percent as the mother's education increases from none to secondary or higher education.
Basic education Overall, 58 percent of children of primary school age in Somalia are attending primary school (Table 1 0). In urban areas, 61 percent of children attend school while in rural areas 57 percent and in nomadic groups 36 attend. School attendance in the North/West is higher than in the other two zones: North/East 47 percent, North/West 87 and Central/South 58. At the national level, there is a little difference between male (60) and female (55) primary school attendance.
9
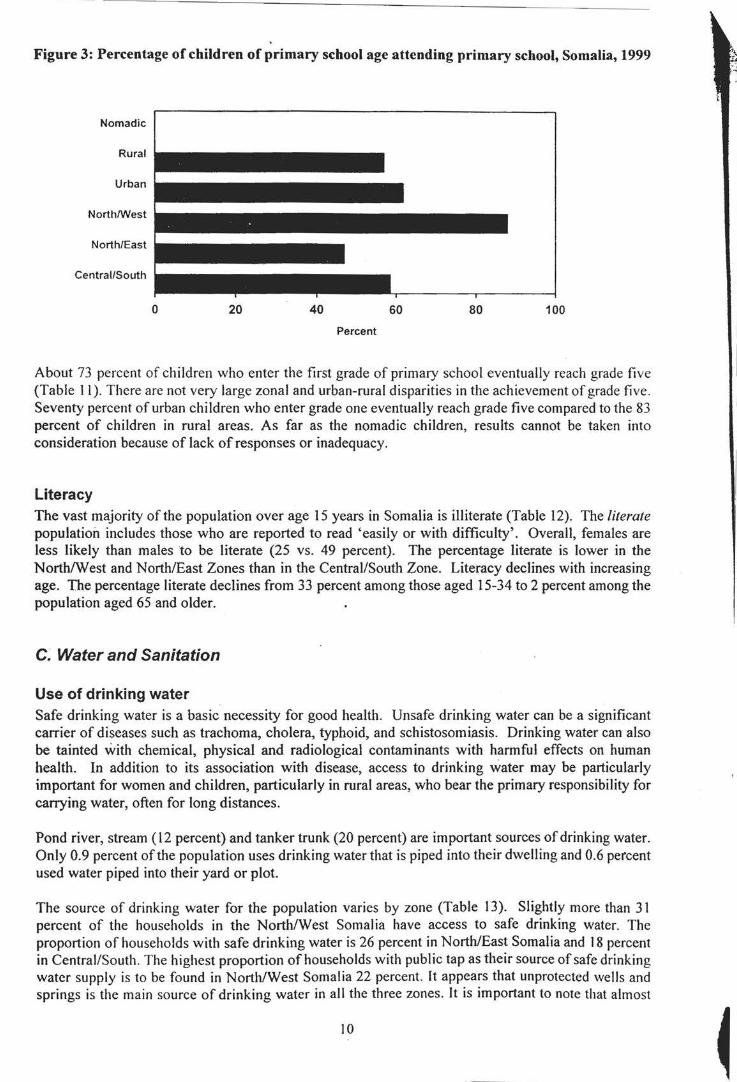
Figure 3: Percentage of children of primary school age attending primary school, Somalia, 1999
Nomadic
Rural
Urban
North/West
North/East
Central/South
0 20 40 60 80 100
Percent
About 73 percent of children who enter the first grade of primary school eventually reach grade five (Table 11 ). There are not very large zonal and urban-rural disparities in the achievement of grade five. Seventy percent of urban children who enter grade one eventually reach grade five compared to the 83 percent of children in rural areas. As far as the nomadic children, results cannot be taken into consideration because of lack of responses or inadequacy.
Literacy The vast majority of the population over age 15 years in Somalia is illiterate (Table 12). The literate population includes those who are reported to read 'easily or with difficulty'. Overall, females are less likely than males to be literate (25 vs. 49 percent). The percentage literate is lower in the North/West and North/East Zones than in the Central/South Zone. Literacy declines with increasing age. The percentage literate declines from 33 percent among those aged 15-34 to 2 percent among the population aged 65 and older.
C. Water and Sanitation
Use of drinking water Safe drinking water is a basic necessity for good health. Unsafe drinking water can be a significant carrier of diseases such as trachoma, cholera, typhoid, and schistosomiasis. Drinking water can also be tainted with chemical, physical and radiological contaminants with harmful effects on human health. In addition to its association with disease, access to drinking water may be particularly important for women and children, particularly in rural areas, who bear the primary responsibility for carrying water, often for long distances.
Pond river, stream ( 12 percent) and tanker trunk (20 percent) are important sources of drinking water. Only 0.9 percent of the population uses drinking water that is piped into their dwelling and 0.6 percent used water piped into their yard or plot.
The source of drinking water for the population varies by zone (Table 13). Slightly more than 31 percent of the households in the North/West Somalia have access to safe drinking water. The proportion of households with safe drinking water is 26 percent in North/East Somalia and 18 percent in Central/South. The highest proportion of households with public tap as their source of safe drinking water supply is to be found in North/West Somalia 22 percent. It appears that unprotected wells and springs is the main source of drinking water in all the three zones. It is important to note that almost
10
13 percent of population use as mhin source of drinking water barakar (defined as other in the Table 13) that is a traditional resevoir for water catchment.
As expected, a larger proportion of households in urban areas have easy access to safe drinking water compared to households in rural and nomadic areas (31 percent for urban, 18 percent for rural and 11 percent for nomadic). It is surprising to note the very low proportion of households in urban areas that reported having water piped into the household (only 2 percent). More households in rural areas use rainwater (9 percent) than elsewhere (I percent of households for urban and 4 for nomadic households). Overall, only 23 percent of households in Somalia have access to safe drinking water. Table 13 describes the sources of safe drinking water for households in Somalia.
Use of sanitation Inadequate disposal of human excreta and personal hygiene is associated with a range of diseases including diarrheal diseases and polio. Sanitary means of excreta disposal include: flush toilets connected to sewage systems or septic tanks, other flush toilets, improved pit latrines, and traditional pit latrines. F011y eight percent of the population of Somalia is living in households with sanitary means of excreta disposal (Table 14 ). This percentage is 83 in urban areas, 25 percent in rural areas and, slightly more than 2 percent among nomadic population. It appears that the Central and Southern zone has a higher proportion of population with access to sanitary means of excreta disposal (51 percent versus 4 7 percent in North/West zone and 41 percent for North/East zone). The North/East zone has the highest proportion of households without any sanitary means of excreta disposal (58 percent) and the Central/Southern has the least proportion of households without any sanitary toilet facilities (49 percent), while the North/West zone reported lack of excreta disposal in ~2 percent of the households.
D. Child Malnutrition
Nutritional status Children's nutritional status is a reflection of their overall health. When children have access to an adequate food supply, are not exposed to repeated illness, and are well cared for, they reach their growth potential and are considered well nourished.
In a well-nourished population, there is a standard distribution of height and weight for children under age five. Undernourishment in a population can be gauged by comparing children to this standard distribution. The standard or reference population used here is the NCHS standard, which is recommended for use by UNICEF and the World Health Organization. Each of the three nutritional status indicators are expressed in standard deviation units (z-scores) from the median ofthis reference population.
Weight for age is a measure of both acute and chronic malnutrition. Children whose weight for age is more than two standard deviations below the median of the reference population are considered moderately or severely underweight while those whose weight for age is more than three standard deviations below the median are classified as severely underweight.
Height for age is a measure of linear growth. Children whose height for age is more than two standard deviations below the median of the reference population are considered short for their age and are classified as moderately or severely stunted. Those whose height for age is more than three standard deviations below the median are classified as severely stunted. Stunting is a reflection of chronic malnutrition as a result of failure to receive adequate nutrition over a long period and recurrent or chronic illness.
Finally, children whose weight for height is more than two standard deviations below the median of the reference population are classified as moderately or severely wasted while those who fall more
II
than three standard deviations belo'r the median are severely wasted. Wasting is usually the result of a recent nutritional deficiency. The indicator may exhibit significant seasonal shifts associated with changes in the availability of food or disease prevalence.
Slightly more than one in every four children (26 percent) under age five in Somalia are under weight (weight for age) while almost seven percent are classified as severely underweight (Table I 5). Twenty three percent of children are stunted or too short for their age and seventeen percent are wasted or too thin for their height.
Children in Central and South are more likely to be underweight, stunted and wasted than other children in Nort/East and North/West zones. There is a slight but insignificant gender difference with respect to child nutritional status in Somalia. Boys are more likely to be stunted and wasted than girls. The pattern reveals that overall malnutrition in some parts Somalia among the most vulnerable population is higher than 15 percent, cut-off point required for food emergency.
Breastfeeding Breastfeeding for the first few years of life protects children from infection, provides an ideal source of nutrients, and is economical and safe·. However, many mothers stop breastfeeding too soon, and there are often pressures to switch to infant formula, which can contribute to growth faltering and micronutrient malnutrition and is unsafe if clean water is not readily available. The World Summit for Children goal states that children should be exclusively breastfed for four to six months, and that breastfeeding should continue with complementary food, well into the second year of life. Many countries have adopted the recommendation of exclusive breastfeeding for about six months.
In Table 16, breastfeeding status is based on women's reports of children's consumption in the 24 hours prior to the interview. Exclusive breastfeeding refers to children who receive only breast milk and vitamins, mineral supplements, or medicine. Complementa1y feeding refers to children who receive breast milk and solid or semi-solid food. The last two columns of the table include children who are continuing to be breastfed at one and at two years of age. Percentages according to zone and mother's education are not shown due to small sample sizes. For the same reason, the sex and urbanrural-nomadic residence breakdowns should be interpreted with caution.
Twenty one percent of children aged less than four months are exclusively breastfed, a level considerably low. At age 6-9 months, 12 percent of children are receiving breast milk and solid or semi-solid foods. By age 12-15 months, 26 percent of children are still being breastfed and by age 20-23 months, only slightly more than 7 percent are still breastfed.
Salt iodization Deficiency of iodine in the diet is the world's single greatest cause of preventable mental retardation and can lower the ,average intelligence quotient (IQ) of a population by as much as thirteen points. Salt iodization is an effective, low-cost way of preventing iodine deficiency disorders (IDD). Adequately iodized salt contains 15 ppm (parts per million) of iodine or more. In MICS, interviewers tested household salt for iodine levels by means of a testing kit.
This module encountered some difficulties because by the time the fieldwork started the salt test kits were not yet arrived. Therefore, the Table 17 shows a very low percentage.
Vitamin A supplementation Vitamin A deficiency (VAD) impairs children's immune systems, increasing their chances of dying of common childhood diseases and undermines the health of pregnant and lactating women. It can also cause eye damage and blindness in children. Yet it can be easily prevented by vitamin A supplementation or food fortification. UNICEF and WHO recommend that all countries with an
12
~ ., .J ... ' .•
under five mortality rate exceeding·70 per I 000 live births, or where vitamin A deficiency is a public health problem, should put in place a programme for control of vitamin A deficiency.
Within the six months prior to the MICS, slightly more than 39 percent of children aged 6-59 months received the high dose Vitamin A supplement (Table 18). Approximately 4 percent did not receive the supplement in the last 6 months but did receive one prior to that time. About 2 percent of children received a Vitamin A supplement at some time in the past but their mother/caretaker was unable to specify when. Vitamin A supplementation coverage is lower in the Central/South than in other zones.
The age pattern of Vitamin A supplementation shows that supplementation in the last six months goes from 30 percent among children aged 6-11 months to 43 percent among children aged 24-35 months and then declines steadily with age to less than 39 percent among the oldest children.
It seems that there is a relationship between the mother' s level of education and the likelihood of Vitamin A supplementation if we consider that supplementation in the last six months goes from 3 7 percent among mothers/caretakers with none education to almost 46 percent among mothers/caretakers with secondary and higher education.
Low birth weight Infants who weigh less than 2500 grams (2.5 kg.) at birth are categorized as low birth weight babies. Since many infants are not weighed at birth and those who are weighed may be a biased sample of all births, reported birth weight cannot be used to estimate the prevalence of low birthweight among all children. Therefore, the percentage of births weighing below 2500 grams is estimated from two items in the questionnaire: the mother's assessment of the child's size at birth (i.e., very small, smaller than average, average, larger than average, very large) and the mother's recall of the child's weight or the weight as recorded on a health card if the child was weighed at birth. Only five percent of births in the Somalia MICS were weighed at birth.
First, the two items are cross-tabulated for those children who were weighed at birth to obtain the proportion of births in each category of size who weighed less than 2500 grams. This proportion is then multiplied by the total number of children falling in the size category to obtain the estimated number of children in each size category who were of low birth weight. The numbers for each size category are summed to obtain the total number of low birth weight children. This number is divided by the total number of live births to obtain the percentage with low birth weight.
In Somalia,- less than I percent of infants are estimated to weigh less than 2500 grams at birth (Table 20). It appears that mothers who have secondary or above level of education are more likely to have their babies weighed at birth than their counterparts with either lower or no education (14% versus 8% and 3%, respectively). However, one has to be cautious in interpreting the relationship between mothers' education ,and low birth weight. Although there is a big difference; the sample size for women with secondary education is very small.
E. Child Health
Immunization coverage According to UNICEF and WHO guidelines, a child should receive a BCG vaccination to protect against tuberculosis, three doses of OPT to protect against diptheria, pertussis, and tetanus, three doses of polio vaccine, and a measles vaccination by the age of 12 months. In MICS, mothers were asked to provide vaccination cards for children under the age of five. Interviewers copied vaccination information from the cards onto the MICS questionnaire. Mothers were also probed to report any vaccinations the child received that did not appear on the card. Overall, only slightly more than 9.3 percent of children had health cards. If the child did not have a card, the mother was read a short
l3
description of each vaccine and asked to recall whether or not the child had received it and, for DPT and Polio, how many times.
Table 21 shows the percentage of children aged 12 to 23 months who received each of the vaccinations. The denominator for the table is comprised of children aged 12-23 months so that only children who are old enough to be fully vaccinated are counted. In the top panel, the numerator includes all children who were vaccinated at any time before the survey according to the vaccination card or the mother's report. In the bottom panel, only those who were vaccinated before their first birthday are included. For children without vaccination cards, the proportion of vaccinations given before the first birthday is assumed to be the same as for children with vaccination cards.
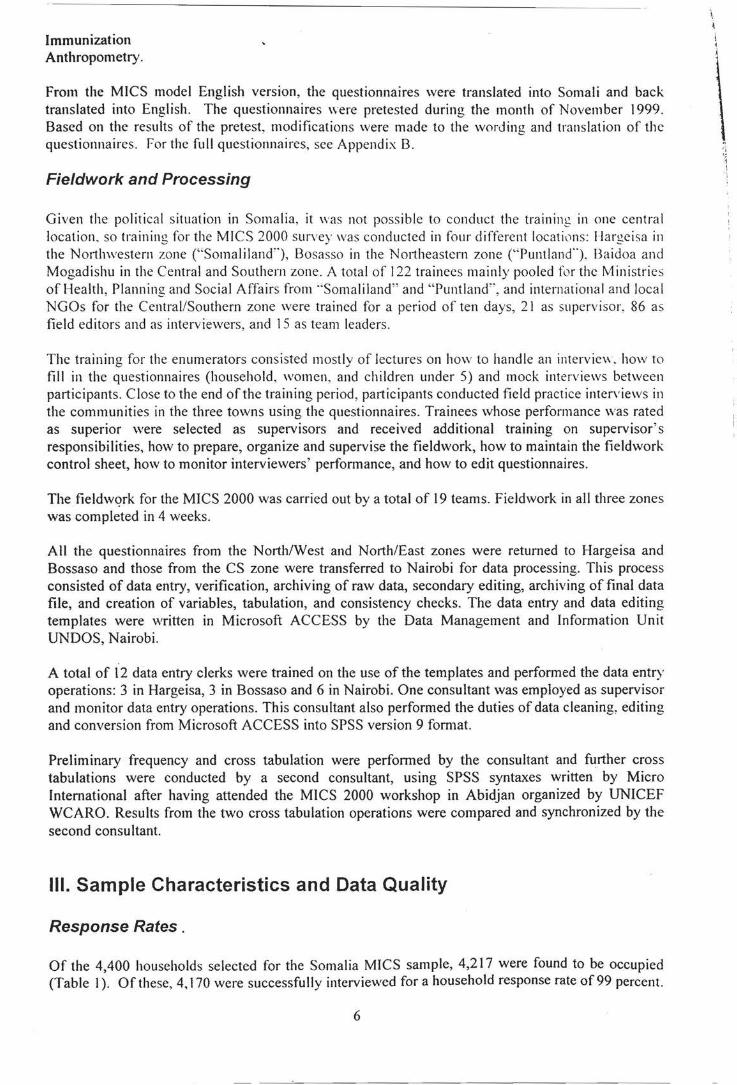
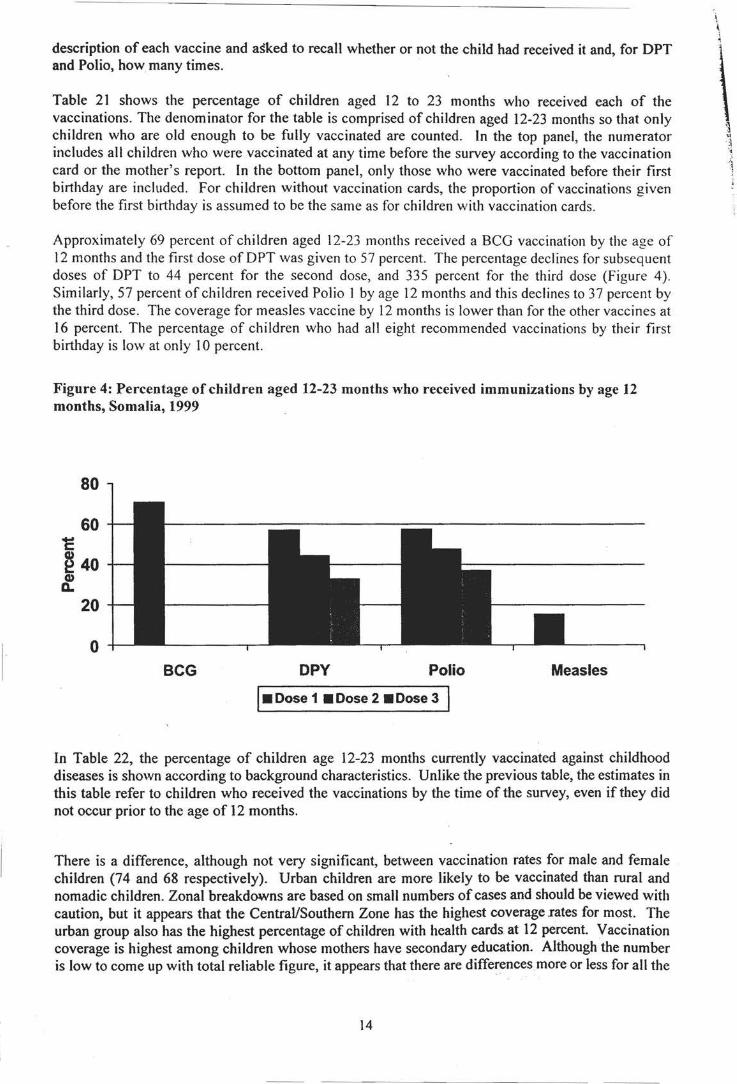
Approximately 69 percent of children aged 12-23 months received a BCG vaccination by the age of 12 months and the first dose of OPT was given to 57 percent. The percentage declines for subsequent doses of OPT to 44 percent for the second dose, and 335 percent for the third dose (Figure 4). Similarly, 57 percent of children received Polio I by age 12 months and this declines to 37 percent by the third dose. The coverage for measles vaccine by 12 months is lower than for the other vaccines at 16 percent. The percentage of children who had all eight recommended vaccinations by their first birthday is low at only I 0 percent.
Figure 4: Percentage of children aged 12-23 months who received immunizations by age 12 months, Somalia, 1999
80
60 1: ~ 40 Q) a.
20
0 BCG DPY Polio Measles
I• Dose 1 • Dose 2 • Dose 3
In Table 22, the percentage of children age 12-23 months currently vaccinated against childhood diseases is shown according to background characteristics. Unlike the previous table, the estimates in this table refer to children who received the vaccinations by the time of the survey, even if they did not occur prior to the age of 12 months.
There is a difference, although not very significant, between vaccination rates for male and female children (74 and 68 respectively). Urban children are more likely to be vaccinated than rural and nomadic children. Zonal breakdowns are based on small numbers of cases and should be viewed with caution, but it appears that the Central/Southern Zone has the highest coverage Iates for most. The urban group also has the highest percentage of children with health cards. at 12 percent. Vaccination coverage is highest among children whose mothers have secondary education. Although the number is low to come up with total reliable figure, it appears that there are differences more or less for all the
14
doses of DPT and Polio suggesting that drop out rates are higher among children with less educated mothers.
Diarrhea Dehydration caused by diarrhea is a major cause of mortality among children in Somalia. Home management of diarrhea - either through oral rehydration salts (ORS) or a recommended home fluid (RHF) - can prevent many of these deaths. Preventing dehydration and malnutrition by increasing fluid intake and continuing to feed the child are also important strategies for managing diarrhea.
In the MICS questionnaire, mothers (or caretakers) were asked to report whether their child had had diarrhea in the two weeks prior to the survey. If so, the mother was asked a series of questions about what the child had to drink and eat during the episode and whether this was more or less than the child usually ate and drank. Overall, almost 24 percent of under five children had diarrhea in the two weeks preceding the survey (Table 23). There is not much difference in prevalence of diarrhoea by either zone or population groups, although children in the North/West zone recorded the lowest prevalence ( 17 percent compared to 25 percent in Central/South and 27 North/East). It is interesting to note as this pattern follows the same pattern of the access to safe drinking water. The prevalence of diarrohea decreases with age, peaks at 12 -23 months, and drops at older age.
Table 23 also shows the percentage of children receiving various types of recommended liquids during the episode of diarrhea. Since mothers were able to name more than one type of liquid, the percentages do not necessarily add to 100. On the whole, 24 percent of the Somali mothers treat children with diarrohea by feeding with breast milk. Children under age 12 months are especially likely to have received breast milk. About 8 percent of children received gruel and nearly 30 percent received ORS. Children of mothers with secondary education appear to be more likely than other children to receive ORS, but less likely to receive gruel. Approximately 6 in ten children with diarrhea received one or more of the recommended home treatments (i.e., were treated with ORS or RHF).
Children with diarrhoea tend to eat much less food or none at all (64 percent), while slightly more than 14 percent tend to drink just about the same or less (Table 24). Overall, only 35 percent of children with diarrhea episodes received increased fluids and continued eating.
Acute respiratory infection Acute lower respiratory infections, particularly pneumonia, are one of the leading causes of child deaths in Somalia. In the MICS questionnaire, children with acute respiratory infection are defined as those who had an illness with a cough accompanied by rapid or difficult breathing and whose symptoms were due to a problem in the chest, or both a problem in the chest and a blocked nose, or whose mother did not know the source of the problem. About two percent of under five children had an acute respiratory infection in the two weeks prior to the survey according to these criteria (Table 25). There are no significant differences in the prevalence of ARI between zones and even between population groups. Prevalence rates are also constant, at almost 2 percent in all age groups, but slightly lower in the 0 - II months age band. The pattern of prevalence of ARI in children under-five years is not clear when comparing between mother's education levels and this is might be because the incidence is too low to make this much use. Only 13 percent of 1he male children with ARI were treated in hospitals compared to only 3 among female children. Private physicians (31 percent), health centers (19 percent) and MCH clinics appear to be the most preferred places for the treatment of children with ARI.
IMCI Initiative The Integrated Management of Childhood Illnesses (IMCI) is a programme developed by UNICEF and WHO that combines strategies for control and treatment of five major killers of children- acute lower respiratory tract infections, diarrheal dehydration, measles, malaria, and malnutrition. The
15
programme focuses on the improvement of case management skills by health workers, improvement ofthe health system, and improvement of family and community practices in the prevention and early management of childhood illnesses. Appropriate home management of illness is one component of • lMCI. The approach teaches mothers that appropriate home management of diarrhea or any other illness requires giving more fluids and continuing to feed sick children as they are normally fed.
Table 26 presents information on the drinking and eating behavior of sick children. Almost 34 percent of children were reported to have had diarrhea or some other illness in the two weeks preceding the survey. Of these, almost none drank more liquids during the illness and only 33 percent continued eating (i.e., ate somewhat less, the same, or more). Overall, it appears that about 34 percent of ill children received increased fluids and continued eating as recommended under the IMCI programme.
Promoting knowledge among caretakers about when it is appropriate to seek care for ill children is another important component of the IMCI programme. In the Somalia MICS, mothers or caretakers of children were asked to name all of the symptoms that would cause them to take a child to a health facility right away. The most common response, given by slightly more than 13 percent of mothers, was that they would take their child to a health facility right away if he/she developed a fever (Table 27). Seven percent said that the child becoming sicker would cause them to take the child to a health facility and about 3 percent mentioned difficulty breathing. Between 3 and 4 percent of mothers cited an inability to breath and fast breathing. About 2 percent mentioned blood in stools as reasons for taking a child to a health facility right away.
It appears that among the zones, mothers in the Central/South are more likely than mothers in other zones to know the signs for seeking care immediately. Apparently, only 5 percent of the caretakers could recognise at least two correct signs of ill health for seeking immediate care.
Malaria Malaria is a leading cause of death of children under age five in Somalia. It also contributes to anemia in children and is a common cause of school absenteeism. Preventive measures, especially the use of mosquito nets treated with insecticide, can dramatically reduce malaria mortality rates among children. In areas where malaria is common, international recommendations suggest treating any fever in children as if it were malaria and immediately giving the child a full course of recommended antimalarial tablets. Children with severe malaria symptoms, such as fever or convulsions, should be taken to a health facility. Also, children recovering from malaria should be given extra liquids and food and should continue breastfeeding.
The MICS questionnaire incorporates questions on the use ofbednets among children. In the Somalia MICS, these questions were asked not only in those areas considered of highest malaria risk. Sixteen percent of under five children slept under a bednet the night prior to the survey interview (Table 28). This percentage declines steadily with age. Moreover, most of the bednets are not treated with insecticide, however. Overall, only about three percent of the bednets used are impregnated with insecticide.
Questions on the prevalence and treatment of fever were asked for all children under age five. Seventeen percent of under five children were ill with fever in the two weeks prior to the MICS (Table 29). The prevalence of fever reaches 20 percent of all children aged 36-47 months then starts declining for children aged 48-59 months. It is interesting to note the malaria pattern if correlated to the mother's education. In fact, it appears that fever is less common among children whose mothers have none education than among children of more educated mothers but this has certainly been affected by the low number of children whose mother falls in those category. There is a slight difference in fever prevalence between North/East (23 percent) and Central/South ( 19 percent) zones, while more differences are found between North/East and North/West (9 percent) but this could be related to the lower number of children for the latter Zone.
16
Mothers were asked to report all of the medicines given to a child during their illness, both any medicine given at home and medicines given or prescribed at a health facility. Approximately two third of children were given Paracetamol and 18 percent were given Chloroquine while 14 percent were given other drugs. Only 18 percent of all those with fever received an appropriate anti-malaria drug. Overall, some differences were found among zones and population groups for children with fever in terms of appropriateness of drugs received.
F. HIV/A/DS
AIDS knowledge One of the most important strategies for reducing the rate of HIV I AIDS infection is the promotion of accurate knowledge of how AIDS is transmitted and how to prevent transmission. Among women aged 15-49 in Somalia, 36 percent have ever heard of AIDS (Table 30). This percentage is higher in North/West zone (57 percent) and lower among nomadic population (13 percent).
Since the preparation of the MICS manual the official indicator has changed. "Abstinence" is an extremely important prevention option for young people. However, research in many settings shows that it is rarely used as a primary HIV prevention method among adults who are already sexual active. In addition, people who know that HIV is sexually transmitted are highly likely to know that not having sex can reduce the risk of transmission. Negative responses on this item are more likely to result from people believing that abstinence is not feasible than from believing that abstinence does not provide effective protection. Consequently for the adult population "adequate knowledge of HIV/AIDS" includes only two ways: "having only one faithful uninfected partners".
However, for adolescents ( l 5-19) the question about "abstinence" continues to be important. Therefore it was recommended to calculate and tabulate in a separate table (T30a: Adolescents Table) for this age group the indicator "correct knowledge of three main ways of preventing HIV I AIDs~(including- ABSTINENCE). The information is presented by single year of age (15, 16, 17, 18,19 and 15-19).
Women in the MICS were read several statements about means ofHIVIAIDS transmission and asked to state whether they believed the statements were true. Almost 10 percent believe that having only one uninfected sex partner can prevent HIV transmission. Almost 3 percent believe that using a condom every time one has sex can prevent HIV. Overall, 2 percent knew the two ways and only 12 percent were aware of at least one of the means of preventing transmission.
As far as the adolescents group, 7 percent believe that having only one uninfected sex partner can prevent HIV transmission. Less than 2 percent believe that using a condom every time one has sex can prevent HIV and less than 6 percent believe that abstaining from , sex can prevent HIV transmission. Overall, less than 2 percent knew all three ways and only 8 percent were aware of at least one ofthe means of preventing transmission.
Accurate knowledge of the means of HIV I AIDS transmission is substantially less among women in the Central/South than among other women. Also, education is a very important factor in AIDS knowledge. It appears that the higher one's education level is, the more knowledgeable slhe will be. The findings here indicate that women with higher level of education (11 percent for secondary and higher) are better than their counterparts with lower levels of education (5 percent for primary and almost I percent for none). However, this finding has to be interpreted with caution because of the low number of women in primary and secondary and higher education categories.
The percentages showing "doesn't know any way" and "knows at least one way" are aggregates calculated from the entire sample rather than within each zone, population group, age group and
17
education level, separately. In conclusion, there is a dire lack of knowledge of any way of prevention across every group and zone.
Differences across age groups are not particularly large; the percentage of women who know the two main means arises from slightly more than 2 percent among 20-24 year olds to slightly more than 2 percent among 30-34 year olds to start declining again to I percent among 40-44 years old.
Among the adolescents group the knowledge of the three main ways ofHIV transmission arises from less that 1 percent among the 15 years old to 2 percent among the 18 years old to decline to almost 1 percent among the 19 years old.
Almost 10 percent of women correctly stated that AIDS cannot be transmitted by supernatural means whereas slightly more than 9 percent stated that AIDS can't be spread by mosquito bites (Table 31 ). Only 15 percent of women correctly believe that a healthy looking person can be infected. Women in the Central/South are more likely to believe misconceptions about AIDS transmission than other women. Women in the North/West zone are most likely to recognize all three misconceptions.
Almost 20 percent of women in Somalia know that AIDS can be transmitted from mother to child (Table 32). When asked specifically about the mechanisms through which mother to child transmission can take place, 19 percent said that transmission during pregnancy was possible, 18 percent said that transmission at delivery was possible, and 18 percent agreed that AIDS can be transmitted through breast milk. Slightly less than 15 percent of women knew all three modes of transmission.
The MICS survey also attempted to measure discriminatory attitudes towards people living with HIV/AIDS. To this end, respondents were asked whether they agreed with two questions. The first asked whether a teacher who has the AIDS virus but is not sick should be allowed to continue teaching in school. The second question asked whether the respondent would buy food from a shopkeeper or food seller who the respondent knew to be infected with AIDS. The results are presented in Table 33.
More than 25 percent of the respondents believe that a teacher with HIV/AIDS should not be allowed to work. This percentage is highest in the North/West zone at 46 percent and lowest in the Central/South at 15 percent. Urban women and those with secondary or higher education are more likely to express this discriminatory attitude than rural and nomadic women and those with no or primary education. However, as far as the education pattern is concerned the findings have to be again interpreted with caution because of the low number of women in primary and secondary and higher education categories. Almost 27 percent of women would not buy food from a person infected with AIDS. This measure does not show a different zonal pattern than the first question. Women in the North/West are the most likely and women in the North/East zone are the second most likely to express a discriminatory attitude on this question. Overall, almost 27 percent of women agree with at least one of the discriminatory statements.
Table 34 summarizes information from two previous tables on AIDS knowledge (Tables 30 and 31 ). The second column shows the percentage of women who know all three means of preventing HIV transmission - having one faithful uninfected partner, using a condom every time, and abstaining from sex. Only 2 percent of women know all three ways. The third column of the table shows the percentage of women who correctly identified all three misconceptions about HIV transmission- that HIV can be transmitted through supernatural means, that it can be transmitted through mosquito bites, and that a healthy looking person cannot be infected. Only 3 percent of the women correctly identified these misconceptions. Finally, the fourth column of the table shows the percentage of women who have 'sufficient knowledge' ofHIV/AIDS transmission. These are women who know all three ways of preventing HIV transmission and correctly identified all three misconceptions: less than 2 percent of the women aged 15-49 falls into this category.
18
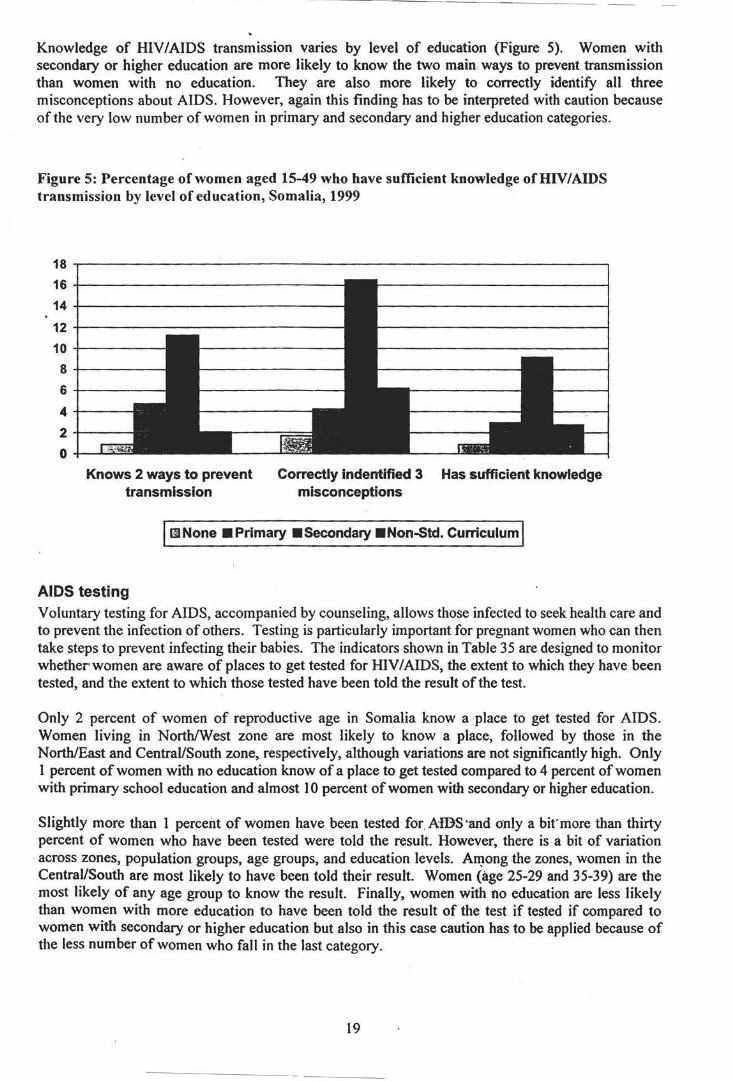
Knowledge of HIV/AIDS transmission varies by level of education (Figure 5). Women with secondary or higher education are more likely to know the two main. ways to prevent transmission than women with no education. They are also more likely to correctly identify all three misconceptions about AIDS. However, again this finding has to be interpreted with caution because of the very low number of women in primary and secondary and higher education categories.
Figure 5: Percentage of women aged 15-49 who have sufficient knowledge ofHIV/AIDS transmission by level of education, Somalia, 1999
18 ~---------------------------------------------------------.
16+-----------------------------
14 +----------------12 +----------------10+-----8+-----
6+-----
4-+---
2+---
0 -+-......... *"=
Knows 2 ways to prevent transmission
Correctly indentified 3 Has sufficient knowledge misconceptions
IGINone •Primary •Secondary •Non-5td. Curriculum I
AIDS testing Voluntary testing for AIDS, accompanied by counseling, allows those infected to seek health care and to prevent the infection of others. Testing is particularly important for pregnant women who can then take steps to prevent infecting their babies. The indicators shown in Table 35 are designed to monitor whether women are aware of places to get tested for HIV I AIDS, the extent to which they have been tested, and the extent to which those tested have been told the result of the test.
Only 2 percent of women of reproductive age in Somalia know a place to get tested for AIDS. Women living in North/West zone are most likely to know a place, followed by those in the North/East and Central/South zone, respectively, although variations are not significantly high. Only I percent of women with no education know of a place to get tested compared to 4 percent of women with primary school education and almost I 0 percent of women with secondary or higher education.
Slightly more than 1 percent of women have been tested for. A-IDS·and only a bit'more than thirty percent of women who have been tested were told the result. However, there is a bit of variation across zones, population groups, age groups, and education levels. A~ong the zones, women in the Central/South are most likely to have been told their result. Women (age 25-29 and 35-39) are the most likely of any age group to know the result. Finally, women with no education are less likely than women with more education to have been told the result of the test if tested if compared to women with secondary or higher education but also in this case caution has to be applied because of the less number of women who fall in the last category.
19
In conclusion we could certainly sa)( that the knowledge of HIV/AIDS in Somalia is quite poor. Although the HIV /AIDS prevalence in Somalia still remains relatively low, however, the high prevalence of the disease in the surrounding countries, Djibouti, Ethiopia and Kenya, the increase in the number of returnees in the north from refugee camps in Ethiopia and Djibouti, and the very high prevalence of tuberculosis (TB) and STDs (30 percent among women attending antenatal clinics in Somali land) represent very serious risk factors for the spread of HIV I AIDS if coupled with the MICS findings.
These elements make observers fear the rapid development of a new tragic crisis in Somalia while noting that opportunities for emergency action are real.
G. Reproductive Health
Contraception
Current use of modern method of contraception was reported by almost 12 percent of man·ied women (Table 36). The most popular traditional method of contraception is the Lactation amenorrhoea (LAM), which is used by 8 in ten married women in Somalia.
Although no significant variations were found, modern contraceptive prevalence seems to be highest in the North/West zone at 9 percent and 8 percent in the North/East zone. In the Central/South, modern contraceptive use seems to be rare; only 3 percent of married women reported using modem method. Adolescents are more likely to use modern contraception than older women are. About 14 percent of married women aged 15-19 currently use a method of modern contraception compared to II percent of 20-24 year olds and 9 percent of older women.
It does not seem that women's education level is strongly associated with contraceptive prevalence. The percentage of women using moden method of contraception goes from almost 2 percent among those with no education to 8 percent among women with primary education, and to almost 11 percent among women with secondary education. This result has been certainly affected by the small number of women who falls in the last two categories.
Prenatal care Quality prenatal care can contribute to the prevention of maternal mortality by detecting and managing potential complications and risk factors, including pre-eclampsia, . anemia, and sexually transmitted diseases. Antenatal care also provides opportunities for women to learn the danger signs of pregnancY: and delivery, to be immunized against tetanus, to learn about infant care, and be treated for existing conditions, such as malaria and anemia ..
Tetanus toxoid injections are g1ven to women during pregnancy to protect infants from neonatal tetanus, a· major cause of infant death that is 'due primarily to unsanitary conditions during childbirth. Two doses of tetanus· toxoid during pregnancy offer full protection. However, if a woman was vaccinated during a previous pregnancy, she may only need a booster to give full protection. Five doses are thought to provide lifetime protection.
Gnly 24 percent of women with recent births in Somalia are protected against neonatal tetanus (Table 3 7). The vast majority of these women received two or more doses of tetanus toxoid within the last three years. Among Zones, women living in the Central/South are most likely to be protected (32 percent) while those living in the North/East are the least likely to be protected (17 percent). Note, however, that the regional estimates are based on small numbers of cases and should be interpreted with caution. Women with secondary and higher education are more likely to be protected against tetanus than those with no education.
20
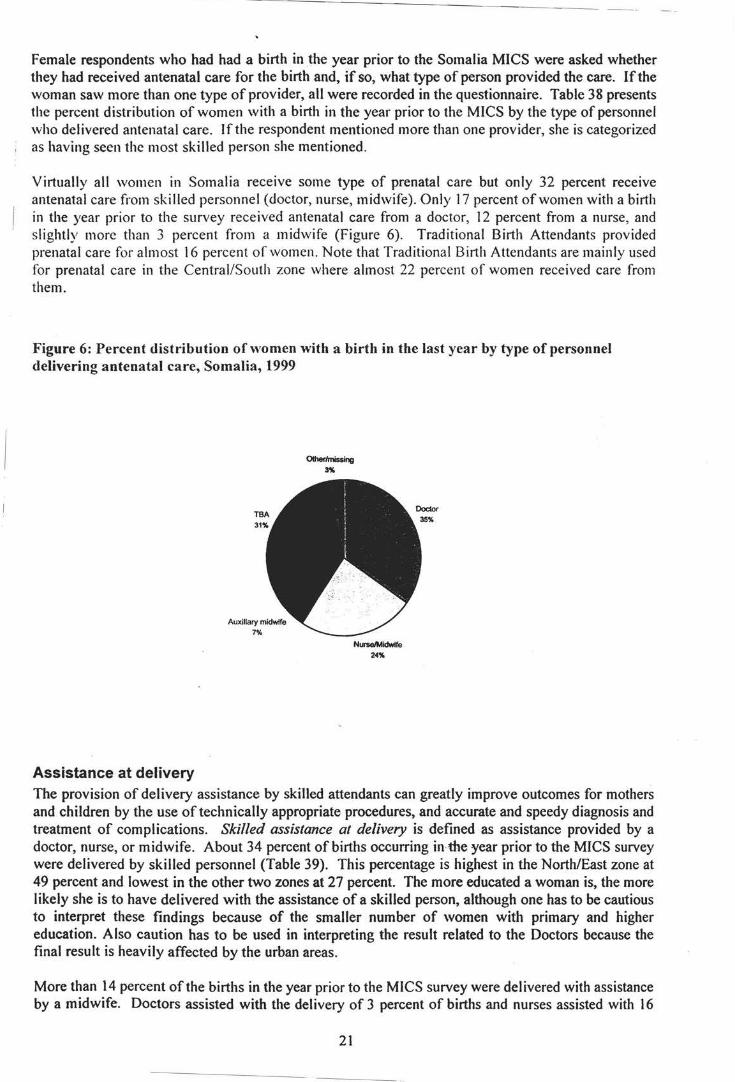
-- -----------------------------
Female respondents who had had a birth in the year prior to the Somalia MICS were asked whether they had received antenatal care for the birth and, if so, what type of person provided the care. If the woman saw more than one type of provider, all were recorded in the questionnaire. Table 38 presents the percent distribution of women with a birth in the year prior to the MICS by the type of personnel who delivered antenatal care. If the respondent mentioned more than one provider, she is categorized
, as having seen the most skilled person she mentioned.
Virtually all women in Somalia receive some type of prenatal care but only 32 percent receive antenatal care from skilled personnel (doctor, nurse, midwife). Only 17 percent of women with a birth in the year prior to the survey received antenatal care from a doctor, 12 percent from a nurse, and slightly more than 3 percent from a midwife (Figure 6). Traditional Birth Attendants provided prenatal care for almost 16 percent of women. Note that Traditional Birth Attendants are mainly used for prenatal care in the Central/South zone where almost 22 percent of women received care from them.
Figure 6: Percent distribution of women with a birth in the last year by type of personnel delivering antenatal care, Somalia, 1999
Assistance at delivery
Nurse/Midwife 24%
The provision of delivery assistance by skilled attendants can greatly improve outcomes for mothers and children by the use of technically appropriate procedures, and accurate and speedy diagnosis and treatment of complications. Skilled assistance at delivery is defined as assistance provided by a doctor, nurse, or midwife. About 34 percent of births occurring in the year prior to the MJCS survey were delivered by skilled personnel (Table 39). This percentage is highest in the North/East zone at 49 percent and lowest in the other two zones at 27 percent. The more educated a woman is, the more likely she is to have delivered with the assistance of a skilled person, although one has to be cautious to interpret these findings because of the smaller number of women with primary and higher education. Also caution has to be used in interpreting the result related to the Doctors because the final result is heavily affected by the urban areas.
More than 14 percent of the births in the year prior to the MICS survey were delivered with assistance by a midwife. Doctors assisted with the delivery of 3 percent of births and nurses assisted with 16
21
----------------------------------------------------------------- - ----
percent. Overall, Traditional Birth Assistant delivered about 56 percent of births. The only real difference among zones is noted in births delivered by auxiliary midwife category which are more likely to occur in North/East (25 percent) than in North/West (12 percent) and Central/South zones (I 0 percent).
H. Child Rights
Birth registration The International Convention on the Rights of the Child states that every child has the right to a name and a nationality and the right to protection from being deprived of his or her identity. Birth registration is a fundamental means of securing these rights for children. The findings showed in the Table 40 have to be interpreted with caution because there has not been any form of birth registrati on system in Somalia since the civil war; that is why we are dealing with extremely low figures and the births of only 2 percent of children under five years in the Country have been registered. There are no significant variations in birth registration across sex, age, or education categories. Ho\\ ever, it is very interesting to note that a relatively large proportion of mothers do not know iftheir child's birth was registered. Among those whose births are not registered, cost, travel distance, and lack of knowledge do not appear to be the main reasons.
Orphanhood and living arrangements of children Children who are orphaned or living away from their parents may be at increased risk of impoverishment, discrimination, denial of property rights and rights to inheritance, various forms of abuse, neglect, and exploitation of their labor or sexuality. Monitoring the level of orphanhood and the living arrangements of children assists in identifying those who may be at risk and in tracking changes over time.
In Somalia, 75 percent of children aged 0-14 are living with both parents (Table 41). A substantial percentage - 7 percent - is living with their mother only although their father is alive. About 3 percent are living with neither parent although both parents are alive. Children who are not living with a biological parent comprise 5 percent and children who have one or both parents dead amount to slightly more than 9 percent of all children aged 0-14. Older children are more likely to live away without their biological parents than younger children. While only 3 percent of children under age five are not living with a biological parent, 8 percent of children aged I 0-14 do so. The situation of children does not differ across the three zones.
Child labor It is important to monitor the extent to which children work and the type of work in which they participate for several reasons. Children who are working are less likely to attend school and more likely to drop out. This pattern can trap children in a cycle of poverty and disadvantage. Working conditions for children are often unregulated with few safeguards against potential abuse. In addition, many types of work are intrinsically hazardous and others present less obvious hazards to children, such as carrying heavy weights and scavenging in garbage dumps.
In Somalia, the MICS survey estimates that less 36 percent of children aged 5-14 years engage in paid work (Table 42). About 63 percent participate in unpaid work for someone other than a household member.
'Domestic work' is defined as cooKing, shopping, cleaning, washing clothes, fetching water, and caring for children. Slightly more than half of children do these tasks for less than four hours a days while 48 percent spend more than four hours a day on such tasks. Overall, girls are more likely than boys to do domestic work. It appears that variations across zones are slightly greatest in the percentage of children who engage in more than four hours of domestic work a day. This percentage ranges from 44 percent in the Central/South zone to 51 percent in the North/East, to 55 percent in the North/West.
22
Children who have done any paid or unpaid work for someone who is not a member of the household or who did more than four hours of housekeeping chores in the household--or· who did other family··, work are considered to be 'currently working'. Overall, 42 percent of children are classified as currently working. There is difference between boys and girls (37 percent of boys and 49 percent of girls). At zonal level, the percentage of children working is lowest in the North/West at 38 percent and highest in the Central/South at 46 percent. Nomadic children are far more likely to work than urban children.
23
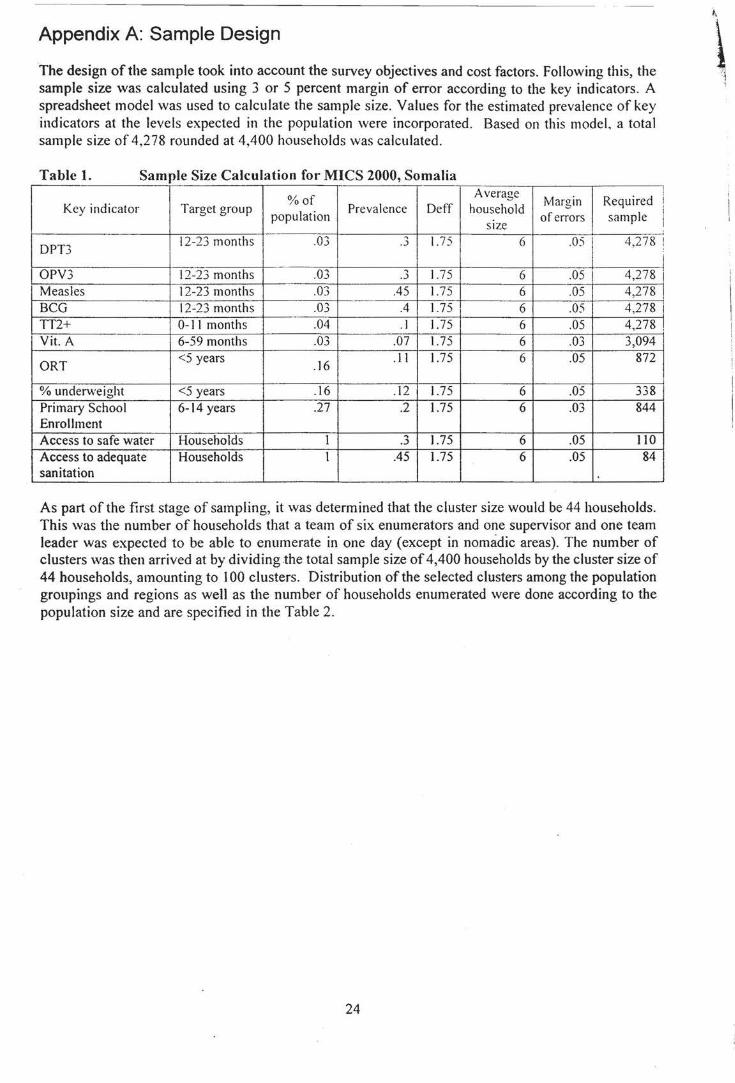
Appendix A: Sample Design
The design of the sample took into account the survey objectives and cost factors. Following this, the sample size was calculated using 3 or 5 percent margin of error according to the key indicators. A spreadsheet model was used to calculate the sample size. Values for the estimated prevalence of key indicators at the levels expected in the population were incorporated. Based on this model, a total sample size of 4,278 rounded at 4,400 households was calculated.
Table L Sample Size Calculation for MICS 2000, Somalia
%of Average
Margin Required Key indicator Target group
population Prevalence Deff household
of errors sample SIZe
i ! I
DPT3 12-23 months .03 .3 1.75 6 .05 4,278 !
i OPV3 12-23 months .03 .3 1.75 6 .05 4,278 i Measles 12-23 months .03 .45 1.75 6 .05 4,278 ' BCG 12-23 months .03 .4 1.75 6 .05 4,278 i TT2+ 0-11 months .04 . I 1.75 6 .05 4,278 !
Yit. A 6-59 months .03 .07 1.75 6 .03 3,094 I
ORT <5 years
.16 .II 1.75 6 .05 872
% underweight <5 years . 16 .12 1.75 6 .05 338 Primary School 6-14 years .27 .2 1.75 6 .03 844 Enrollment Access to safe water Households 1 .... 1.75 6 .05 110 .~
Access to adequate Households I .45 1.75 6 .05 84 sanitation
As part of the first stage of sampling, it was determined that the cluster size would be 44 households. This was the number of households that a team of six enumerators and one supervisor and one team leader was expected to be able to enumerate in one day (except in nomadic areas). The number of clusters was then arrived at by dividing .the total sample size of 4,400 households by the cluster size of 44 households, amounting to I 00 clusters. Distribution of the selected clusters among the population groupings and regions as well as the number of households enumerated were done according to the population size and are specified in the Table 2.
24
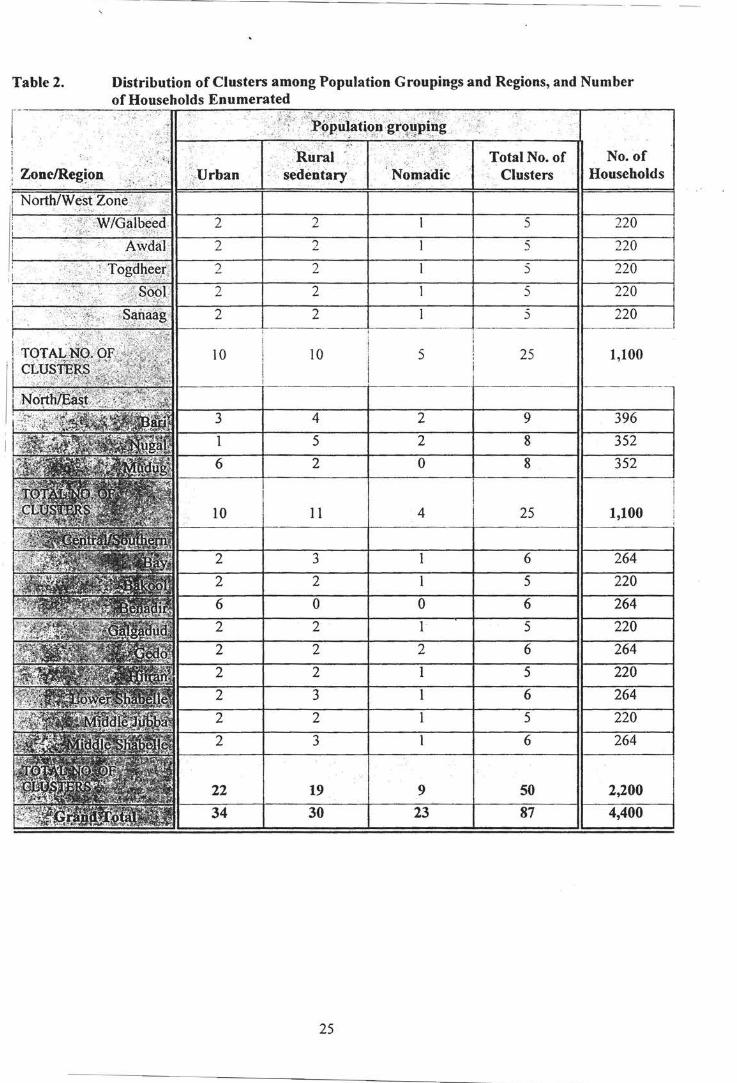
Table 2. Distribution of Clusters among Population Groupings and Regions, and Number of Households Enumerated
No. of ''.:0 Clusters Households
5 22
5 22
2 5 220
2 5 220
2 5 220
10 5 25 1,100
1,100
1 5 220
0 0 6 264 2 5
2
6 264
2 5 220
3 6 264
22 19 9 50 2,200 34 30 23 87 4,400
25
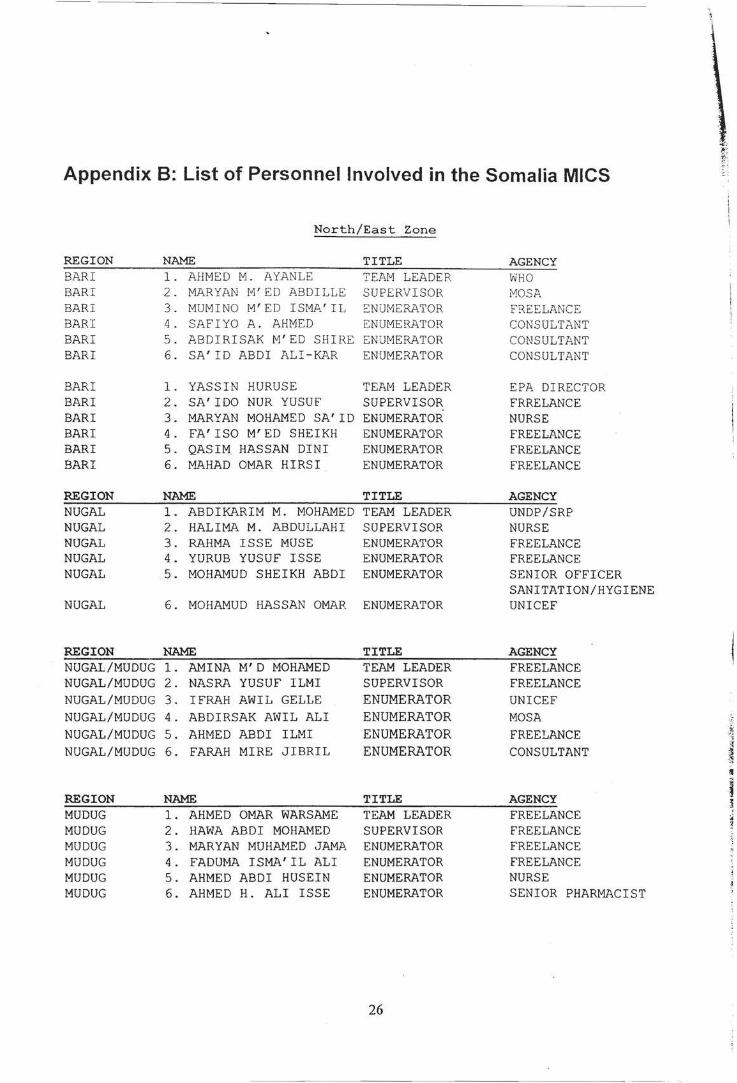
·~
Appendix 8: List of Personnel Involved in the Somalia MICS r
North/East Zone
REGION NAME TITLE AGENCY BARI 1. AHMED M. AYANLE TEAM LEADER WHO BARI 2 . MARY AN M'ED ABDILLE SUPERVISOR MOSA BARI 3. MUMINO M'ED ISMA'IL ENUMERATOR FREE LANCE BARI 4. SAFIYO A. AHMED ENUMERATOR CONS ULTANT BARI 5. ABDIRISAK M'ED SHIRE ENUMERATOR CONSULTANT BARI 6. SA'ID ABDI ALI-KAR ENUMERATOR CONSULTANT
BARI 1. YASSIN HURUSE TEAM LEADER EPA DIRECTOR BARI 2. SA'IDO NUR YUSUF SUPERVISOR FRRELANCE BARI 3. MARY AN MOHAMED SA'ID ENUMERATOR NURSE BARI 4. FA'ISO M'ED SHEIKH ENUMERATOR FREELANCE BARI 5. QASIM HASSAN DINI ENUMERATOR FREELANCE BARI 6. tv! .A HAD OMAR HIRSI ENUMERATOR FREELANCE
REGION NAME TITLE AGENCY NUGAL 1. ABDIKARIM M. MOHAMED TEAM LEADER UNDP/SRP NUGAL 2. HALIMA M. ABDULLAH I SUPERVISOR NURSE NUGAL 3. RAHMA ISSE MUSE ENUMERATOR FREELANCE NUGAL 4. YURUB YUSUF ISSE ENUMERATOR FREELANCE NUGAL 5. MOHAMUD SHEIKH ABDI ENUMERATOR SENIOR OFFICER
SANITATION/HYGIENE NUGAL 6. MOHAMUD HASSAN OMAR ENUMERATOR UNICEF
REGION NAME TITLE AGENCY NUGAL/MUDUG 1. AM INA M'D MOHAMED TEAM LEADER FREELANCE NUGAL/MUDUG 2. NASRA YUSUF ILMI SUPERVISOR FREELANCE NUGAL/MUDUG 3. IFRAH AWIL GELLE ENUMERATOR UNICEF NUGAL/MUDUG 4. ABDIRSAK AWIL ALI ENUMERATOR MOSA NUGAL/MUDUG 5. AHMED ABDI ILMI ENUMERATOR FREELANCE ~
" ~ NUGAL/MUDUG 6. FARAH MIRE JIBRIL ENUMERATOR CONSULTANT ~
~
II ,-:11
" REGION NAME TITLE AGENCY
·~ t .
MUDUG 1. AHMED OMAR WARSAME TEAM LEADER FREELANCE MUDUG 2. HAWA ABDI MOHAMED SUPERVISOR FREELANCE MUDUG 3. MARYAN MOHAMED JAMA ENUMERATOR FREELANCE MUDUG 4. FADUMA ISMA'IL ALI ENUMERATOR FREELANCE MUDUG 5. AHMED ABDI HUSEIN ENUMERATOR NURSE MUDUG 6. AHMED H. ALI ISSE ENUMERATOR SENIOR PHARMACIST
26
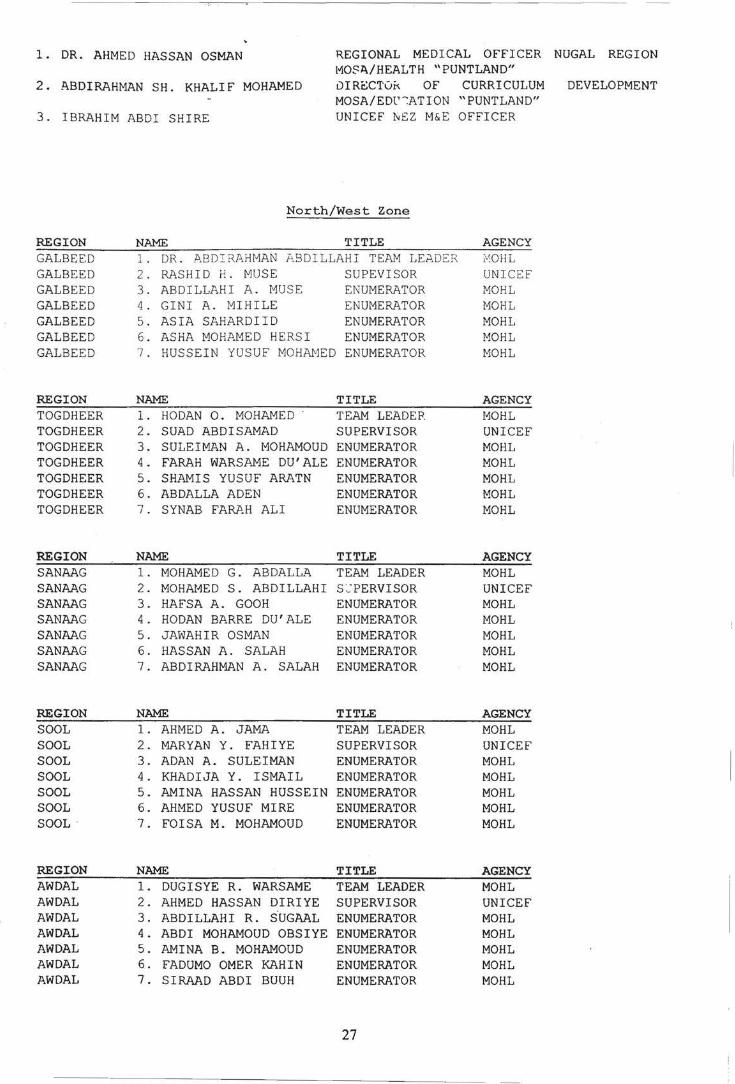
1. DR. AHMED HASSAN OSMAN REGIONAL MEDICAL OFFICER NUGAL REGION l-10-S~/HEALTH "PUNTLAND"
2. ABDIRAHMAN SH. KHALIF MOHAMED DIRECT0~ OF CURRICULUM DEVELOPMENT MOSA/ED~~ATION "PUNTLAND"
3. IBRAHIM ABDI SHIRE UNICEF NS Z M&E OFFICER
REGION GALBEED GALBEED GALBEE D GALBEED GALBEED GALBEED GALBEED
REGION TOGDHEER TOGDHEER TOGDHEER TOGDHEER TOGDHEER TOGDHEER TOGDHEER
REGION SANAAG SANAAG SANAAG SANAAG SANAAG SANAAG SANAAG
REGION SOOL SOOL SOOL SOOL SOOL SOOL SOOL ·
REGION AWDAL AWDAL AWDAL AWDAL AWDAL AWDAL AWDAL
North/West Zone
NAME TITLE 1 . DR. Jl.B DIRAHtvJAN ?.SD ILLAHI TEAM LEt:WE R 2 . RASHID H. MU SE SUPEVI SOR 3 . AB DILLAH I A. MUSE 4. GI NI A. MI HI LE 5 . ASIA SAHARDIID 6 . ASHA MOH AMED HE RS I
ENUMERATOR EN UMERATOR ENUMERATOR ENUMERATOR
7 . HUSSEIN YUS UF MOHA!'1ED ENUMERATOR
NAME 1. HODAN 0. MOHAMED 2. SUAD ABDISAMAD
TITLE TEAM LEADEF. SUPERVISOR
3. SULEIMAN A. MOHAMOUD ENUMERATOR 4 . FARAH WARSAME DU'ALE ENUMERATOR 5. SHAMIS YUSUF ARATN ENUMERATOR 6. ABDALLA ADEN 7. SYNAB FARP.H ALI
ENUMERATOR ENUMERATOR
NAME TITLE 1. MOHAMED G. ABDALLA TEAM LEADER 2. MOHNvJED S. ABDILLAHI S: PERVISOR 3. HAFSA A. GOOH ENUMERATOR 4. HODAN BARRE DU'ALE ENUMERATOR 5. JAWAHIR OSMAN ENUMERATOR 6. HASSAN A. SALAH ENUMERATOR 7. ABDIRAHMAN A. SALAH ENUMERATOR
NAME TITLE 1. AHMED A. Jru-1A TEAM LEADER 2. MARYAN Y. FAHIYE SUPERVISOR 3. ADAN A. SULEIMAN ENUMERATOR 4. KHADIJA Y. ISMAIL ENUMERATOR 5. AMINA HASSAN HUSSEIN ENUMERATOR 6. AHMED YUSUF MIRE ENUMERATOR 7. FOISA M. MOHAMOUD ENUMERATOR
NAME TITLE 1. DUGISYE R. WARSAME TEAM LEADER 2. AHMED HASSAN DIRIYE SUPERVISOR 3. ABDILLAHI R. SUGAAL ENUMERATOR 4. ABDI MOHAMOUD OBSIYE ENUMERATOR 5. AMINA B. MOHAMOUD ENUMERATOR 6. FADUMO OMER KAHIN ENUMERATOR 7. SIRAAD ABDI BUUH ENUMERATOR
27
AGENCY c'10HL UN ICEF MOH L MOHL MOHL MOH L MOHL
AGENCY !-10HL UNICEF MOHL MOHL MOHL MOHL MOHL
AGENCY MOHL UNICEF MOHL MOHL MOHL MOHL MOHL
AGENCY MOHL UNICEF MOHL MOHL MOHL MOHL MOHL
AGENCY MOHL UNICEF MOHL MOHL MOHL MOHL MOHL
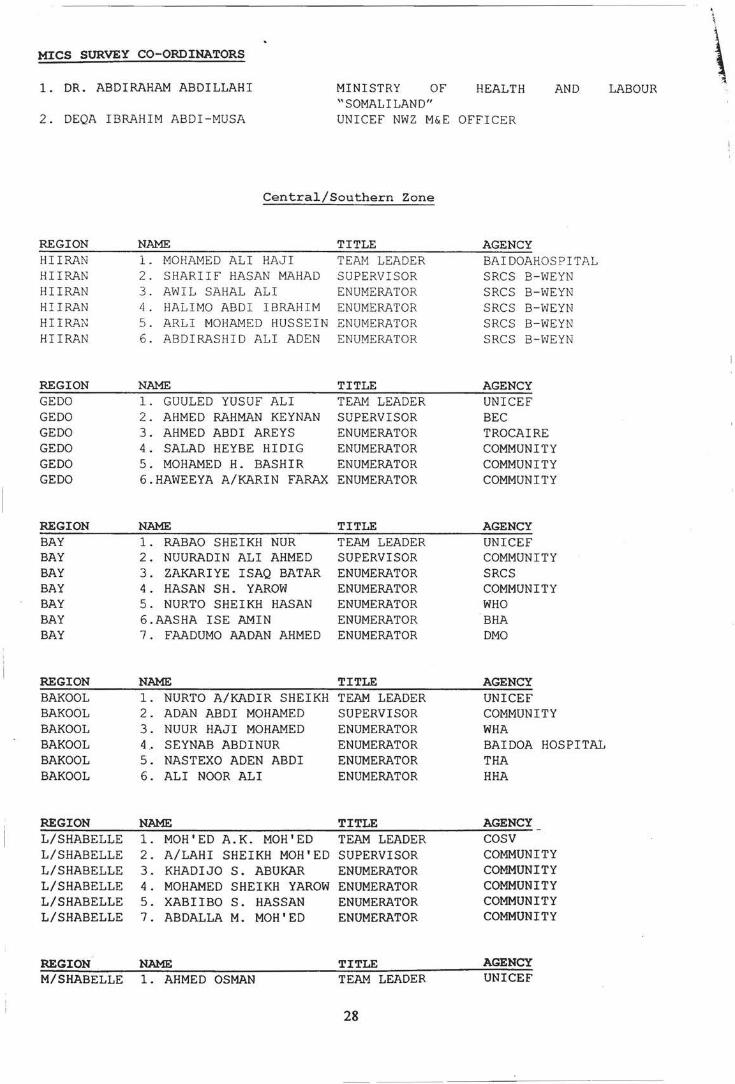
MICS SURVEY CO-ORDINATORS
1. DR. ABDIRAHAM ABDILLAHI MINISTRY OF HEALTH AND "SOMALI LAND"
2. DEQA IBRAHIM ABDI-MUSA UNICEF NWZ M&E OFFICER
REGION HIIRAN HIIRAN HIIRAN HIIRAN HIIR..i\N HIIRAN
REGION GEDO GEDO GEDO GEDO GEDO GEDO
REGION BAY BAY BAY BAY BAY BAY BAY
REGION BAKOOL BAKOOL BAKOOL BAKOOL BAKOOL BAKOOL
REGION L/SHABELLE L/SHABELLE L/SHABELLE L/SHABELLE L/SHABELLE L/SHABELLE
Central/Southern Zone
NAME TITLE 1. MOHAMED ALI HAJI TEAM LEADER 2 . SHARIIF HASAN MAHAD SUPERVISOR 3 . AWIL SAHAL ALI ENUMERATOR 4. HALIMO ABDI IBRAHIM ENUMERATOR 5. ARLI MOHAMED HUSSEIN ENUMERATOR 6. ABDIRASHID ALI ADEN ENUMERATOR
NAME TITLE 1. GUULED YUSUF ALI TEAM LEADER 2. AHMED RAHMAN KEYNAN SUPERVISOR 3. AHMED ABDI AREYS ENUMERATOR 4. SALAD HEYBE HIDIG ENUMERATOR 5. MOHAMED H. BASHIR ENUMERATOR 6.HAWEEYA A/KARIN FARAX ENUMERATOR
NAME TITLE 1. RABAO SHEIKH NUR TEAM LEADER 2. NUURADIN ALI AHMED SUPERVISOR 3. ZAKARIYE ISAQ BATAR ENUMERATOR 4. HASAN SH. YAROW ENUMERATOR 5. NURTO SHEIKH HASAN ENUMERATOR 6.AASHA ISE AMIN ENUMERATOR 7. FAADUMO AADAN AHMED ENUMERATOR
NAME TITLE 1. NURTO A/KADIR SHEIKH TEAM LEADER 2. ADAN ABDI MOHAMED SUPERVISOR 3. NUUR HAJI MOHAMED ENUMERATOR 4. SEYNAB ABDINUR 5. NASTEXO ADEN ABDI 6. ALI NOOR ALI
ENUMERATOR ENUMERATOR ENUMERATOR
NAME TITLE 1. MOH'ED A.K. MOH'ED TEAM LEADER 2. A/LAHI SHEIKH MOH'ED SUPERVISOR 3. KHADIJO S. ABUKAR ENUMERATOR 4. MOHAMED SHEIKH YAROW ENUMERATOR 5. XABIIBO S. HASSAN ENUMERATOR 7. ABDALLA M. MOH'ED ENUMERATOR
REGION NAME TITLE M/SHABELLE 1. AHMED OSMAN TEAM LEADER
28
AGENCY BAIDOAHOSPITAL SRCS 8-WEYN SRCS B-WEYN SRCS B-WEYN SRCS B-WEYN SRCS 8-WEYN
AGENCY UNICEF BEC TROCAIRE COMMUNITY COMMUNITY COMMUNITY
AGENCY UNICEF COMMUNITY SRCS COMMUNITY WHO BHA DMO
AGENCY UNICEF COMMUNITY WHA BAIDOA HOSPITAL THA HHA
AGENCY cosv COMMUNITY COMMUNITY COMMUNITY COMMUNITY COMMUNITY
AGENCY UNICEF
\ LABOUR
..
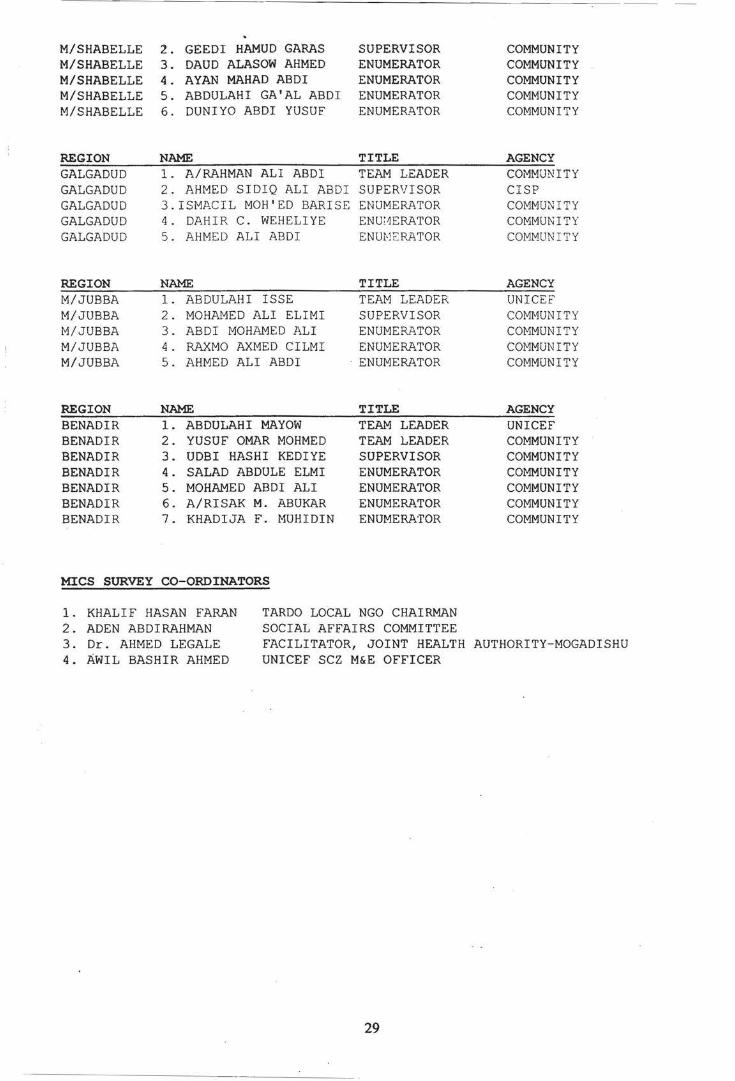
M/SHABELLE 2. GEEDI HAMUD GARAS SUPERVISOR M/SHABELLE 3. DAUD ALASOW AHMED ENUMERATOR M/SHABELLE 4. AYAN MAHAD ABDI ENUMERATOR M/SHABELLE 5. ABDULAHI GA'AL ABDI ENUMERATOR M/SHABELLE 6. DUNIYO ABDI YUSUF ENUMER.Z\TOR
REGION NAME TITLE GALGADUD 1. A/RAHMAN ALI ABDI TEAM LEADER GALGADUD 2. AHMED SIDIQ ALI ABDI SUPERVISOR GALGADUD 3.ISMACIL MOH'ED BARI SE ENUMERATOR GALGADUD 4. DAHIR C. WEHELIYE ENUc1ERATOR GALGADUD 5. AHMED ALI ABDI ENUt-1 t: RATOR
REGION NAME TITLE M/JUBBA 1. ABDULAHI ISSE TEAM LEADER M/JUBBA 2. MOHAMED ALI ELIMI SUPERVISOR M/JUBBA 3. ABDI MOHAMED ALI ENUMER.Z\TOR M/JUBBA 4. RAXMO AXMED CILMI ENUI'lERATOR M/JUBBA 5. AHMED ALI ABDI · ENUMERATOR
REGION NAME TITLE BENADIR 1. ABDULAHI MAY OW TEAM LEADER BENADIR 2. YUSUF OMAR MOHMED TEAM LEADER BENADIR 3. UDBI HASHI KEDIYE SUPERVISOR BENADIR 4. SALAD ABDULE ELMI ENUMERATOR BENADIR 5. MOHAMED ABDI ALI ENUMERATOR BENADIR 6. A/RISAK M. ABUKAR ENUMERATOR BENADIR 7. KHADIJA F. MUHIDIN ENUMERATOR
MICS SURVEY CO-ORDINATORS
1. KHALIF HASAN FARAN 2. ADEN ABDIRAHMAN
TARDO LOCAL NGO CHAIRMAN SOCIAL AFFAIRS COMMITTEE
COMMUNITY COMMUNITY COMMUNITY COMMUNITY COMMUNITY
AGENCY COMMUNITY CISP COMMUNI TY COMMUNIT Y COMMUN I TY
AGENCY UNICEF COMMUN IT Y COMMUNITY COMMUNITY COMMUNITY
AGENCY UNICEF COMMUNITY COMMUNITY COMMUNITY COMMUNITY COMMUNITY COMMUNITY
3. Dr. AHMED LEGALE 4. AWIL BASHIR AHMED
FACILITATOR, JOINT HEALTH AUTHORITY-MOGADISHU UNICEF SCZ M&E OFFICER
29
Appendix C: Questionnaires
END-DECADE
MULTIPLE INDICATOR CLUSTER SURVEY
MODEL QUESTIONNAIRE
30
FLOW OF MODULES
Note: ·Age· refers to 'age at last bit1hday· and a dash (-)denotes ·up to and including age X' .
Household questionnaire Household information panel Household I isting form (all residents) and orphanh~)l'd quest i1.)ns { bi11h to 1-l) Education module: educational attainment (age 5 ()r t'\Cr). school attendance (age 5-1/) Child labour module (age 5-1-l*) \Vater and sanitation module (all households) Salt iodization module (all hatiseholds) * l jJper limit beyond age i./mar he ser by indi,·iduol coiiii!JT
Questionnaire for individual women (women of n~productive age. 15--19) Women·s information panel (all eligible ''omen. !5--l9) Child mortality module (all eligible \\Omen) Tetanus toxoid module (all mothers'' ith last birth \\ ithin last year) Maternal and newborn health module (all mothers \\ith last birth "ithin last year) Contraceptive use module (currently married women. 15--l9) 1-HV/AIDS module (all women. 15-49)
Questionnaire for children under five Birth registration and early learning module Vitamin A module Breastfeeding module Care of illness module Malaria module (for high-risk areas) Immunization module Anthropometry module
DESIGN FEATURES
Changes in font are used to indicate the various components of the questionnaire. Questions that the interviewer will be asking appear in small capital letters in Aria! font (QUESTIONS VERBALIZED BY
INTERVIEWERS), to distinguish them from responses and general instructions. With the exception of skip instructions, general instructions to the interviewer are provided in italics, Times New Roman font (instructions to interviewers). Skip instructions are provided in a 'skip column' in Aria! (¢Q.6) and at the end of modules in bold capitals, Times New Roman (GO TO NEXT MODULE). For purposes of saving space, DK is used to abbreviate "doesn't know" and HH is sometimes used to abbreviate "household". The questionnaires that follow are not intended to be completely selfexplanatory; detailed instructions for the interviewer are provided in Appendix One.
Throughout this model questionnaire, two asterisks(**) and bold italics, Arial (note for country adaptation) indicate where country adaptation may be necessary. See adaptation notes in the Instructions for Interviewers, Appendix One. Each country should tailor identification information (including indicators of household socioeconomic status in the Household Information Panel) and the interviewer's introduction as appropriate. The introduction should assure respondents that answers will remain confidential. A pre-test will be necessary to estimate the time it takes to administer the questionnaire.
31
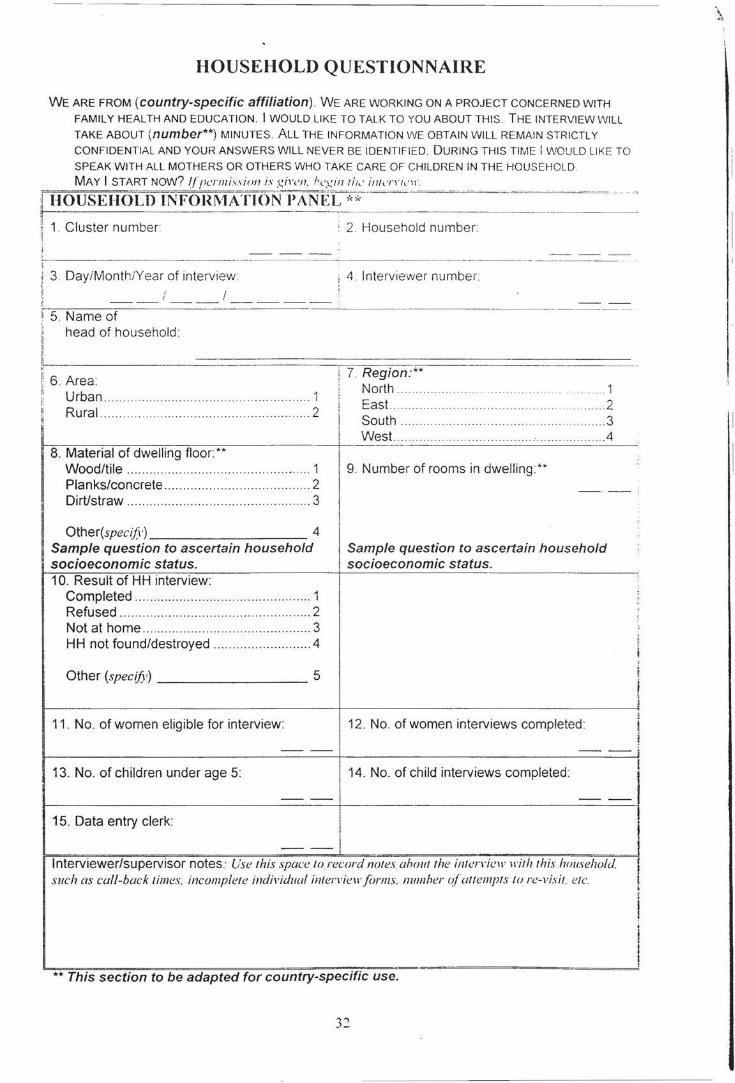
HOUSEHOLD QUESTIONNAIRE
WE ARE FROM (country-specific affiliation). WE ARE WORKING ON A PROJECT CONCERNED WITH
FAMILY HEALTH AND EDUCATION. I WOULD LIKE TO TALK TO YOU ABOUT THIS. THE INTERVIEW WILL
TAKE ABOUT (number**) MINUTES. ALL THE INFORMATION WE OBTAIN WILL REMAIN STRICTLY
CONFIDENTIAL AND YOUR ANSWERS WILL NEVER BE IDENTIFIED. DURING THIS TIME I WOULD LIKE TO
SPEAK WITH ALL MOTHERS OR OTHERS WHO TAKE CARE OF CHILDREN IN THE HOUSEHOLD.
MAY I START Now? !fpermi.,sion is giren. hcgint!Jc inlcJTit''' · ;f HOUSEHOLD INFOnl\'tA;fiON-PANEL--* * ~:=~~-~~=~~"=~~=~- ..... --- --
11 - ---
~ 1. Cluster number : 2. Household number :1
i :·;-I - ----- --·- -- ---~-~---·---~--~-------·----·· ·---------- ..
;j 3 . DayiMonth!Year of interview i: ,; :; ! ~
i ----'I 5. Name of
head of household
II
~ 1, 6 . Area: ~ Urban ...... ..... .... ...... ... . 1 p,
1 Rural .... ...... .. ... .... ... ... .......... ... ...... ......... . 2
8. Material of dwelling floor:** Wood/tile ............................ . ..... ..... ......... 1 Planks/concrete ................ : ... .......... ......... 2 Dirt/straw ............... ............... ... .. ... .. .... . .. 3
Other(spec£6-) 4 Sample question to ascertain household socioeconomic status. 10. Result of HH interview:
Completed ............................................... 1 Refused .............. .. .. ... .. ... ... .... ... .. ...... ....... 2 Not at home ...................... ............ .... ....... 3 HH not found/destroyed ......................... .4
Other (specify) 5
11 . No. of women eligible for interview:
i 4 . Interviewer number I
i 7. Region:** North ... .. . .. ...... .... . .. .... ........ .. . East... . . .. ... ... .. . ... ...... . .... . 2 South ..... ....... ... .......... .... .... .... .... .. .... .. 3
I West ... .. . ...... ... ... ............ ............. . ...... . .4
9 . Number of rooms in dwelling:**
- -
I
Sample question to ascertain household socioeconomic status.
12. No. of women interviews completed:
'
'
' : i
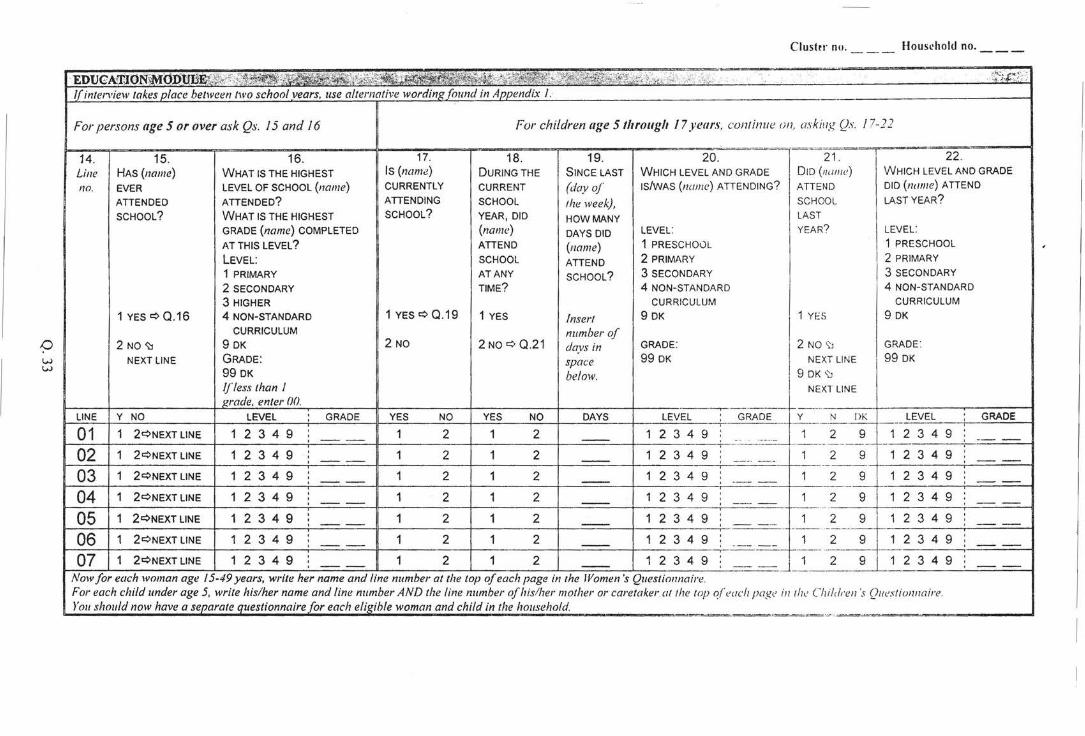
w w
Clustu· no. __ _ Housrhold no. __ _
-EDlJCA1l!I0l"c¥ivf~ -,L •. '~ •"'C :_,, ·";';;t.Si. , . . .. 'i'.ii~_:'/' '· . . ·· -,.:: .' ;•' ::: ,,..,( _< .::., . . . :--.,_.' _·_;_; . - ·.. .
{( inte• ... •iew tak_es place ue vet two school years, use alteuw'he ~'WUJTnA;;i)iiid"ixT
For persons age 5 or over ask Qs. 15 and 16 For children age 5 through 17 years, continue on, askif lg Qs. 17-22
14. 15. 16. 17. 18. 19. 20. 21 . 22 . Line HAS (name) WHAT IS THE HIGHEST Is (name) DURING THE SINCE LAST WHICH LEVEL AND GRADE D ID (nome) WHICH LEVEL AND GRADE
no. EVER LEVEL OF SCHOOL (name) CURRENTLY CURRENT (day of IS/WAS (na111 e) ATTENDING? ATTEND DID (name) ATTEND
ATTENDED ATTENDED? ATTENDING SCHOOL the week), SCHOOL LAST YEAR?
SCHOOL? WHAT IS THE HIGHEST SCHOOL? YEAR, DID HOW MANY LAST
GRADE (name) COMPLETED (name) DAYS DID LEVEL: YEAR? LEVEL:
AT THIS LEVEL? ATTEND (name) 1 PRESCHOOL 1 PRESCHOOL
LEVEL: SCHOOL ATTEND 2 PRIMARY 2 PRIMARY
1 PRIMARY AT ANY SCHOOL? 3 SECONDARY 3 SECONDARY
2 SECONDARY TIME? 4 NON-STANDARD 4 NON-STANDARD
3 HIGHER CURRICULUM CURRICULUM
1 YES¢ 0.16 4 NON-STANDARD 1 YES¢ 0 .19 1 YES Insert 9 DK 1 YE S 9 DK
CURRICULUM number of 2 NO~ 9 OK 2 NO 2 NO¢ 0 .21 days in GRADE: 2 NO '\'1 GRADE:
NEXT LINE GRADE : space 99 DK NEXT LINE 99 OK
99 OK below. I 9 DK ':J
lfless than I NEXT LINE wade, enter 00.
LINE Y NO LEVEL GRADE YES NO YES Nc> DAYS _L~VEI._ Qf'fiQI: Y_ N DK LEVEL GRADE
01 1 2¢NEXT LINE 1 2 3 4 9 1 2 1 2 1 2 3 4 9 1 2 9 1 2 3 4 9 -- -- - - ----·-- -·----
02 1 2¢NEXTLINE 1 2 3 4 9 1 2 1 2 1 2 3 4 9 1 2 9 1 2 3 4 9 - .. --
03 1 2¢NEXTLINE 1 2 3 4 9 1 2 1 2 1 2 3 4 9 1 2 9 1 2 3 4 9 -- -- ·-- -04 1 2¢NEXT LINE 1 2 3 4 9 1 2 1 2 1 2 3 4 9 1 2 9 1 2 3 4 9 -- - --05 1 2¢NEXTLINE 1 2 3 4 9 1 2 1 2 1 2 3 4 9 1 2 9 1 2 3 4 9 -- --06 1 2¢NEXT LINE 1 2 3 4 9 1 2 1 2 1 2 3 4 9
. 1 2 9 1 2 3 4 9 . - -- --
07 1 2¢NEXT LINE 1 2 3 4 9 1 2 1 2 1 2 3 4 9 : 1 2 9 1 2 3 4 9 -- -- - -
Now for each woman age 15-49 years, write her name andline number the top ~Ch page in the Women's Questionnaire. For each child under age 5, write his/her name and line numbe1· AND the line number of his/her mother or caretaker at the top o,(<'ach page in th<' Children's Qu<'sliomwire. )' ou should now have a J"J ,w ....... questionnaire .for each eli.«ihle woman and child in the household.
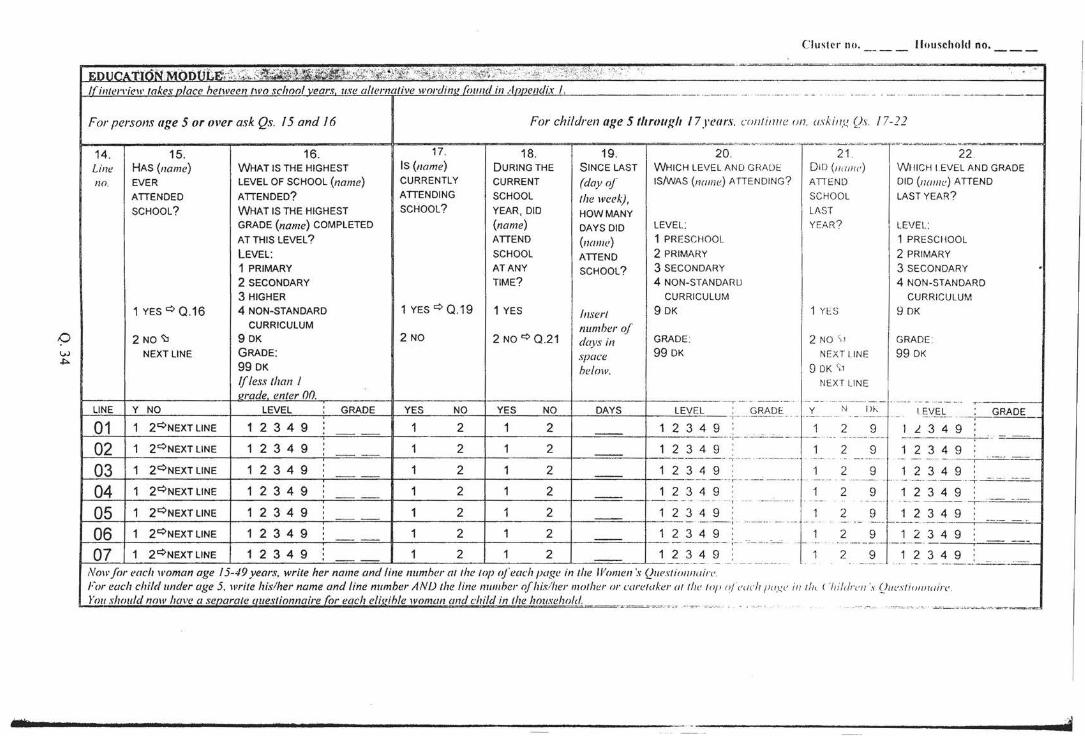
Cluster no. Jluusehold no.
EDUCA' aON;MODULEr\;7,\:J;... .. --.. . ~s.~l;'¢E'.r. 'ct~1.1(:4~t~i' ::%:,'4t j0C,•';<.~~~- '· ::;~~~i~'{~.~t~:f '\ ;·' .. . .. I( inlel'l'iew take!.UJiacr_ two school vears. use nllm·" •ive wordinl! fr1t11td in ·' nnl'luli,.- I. -- · -· ----- - -- --- ··-· - - - ·- ·· --- -- - - ------· -· - -- -- ----- -- ---
For persons age 5 or over ask Qs. 15 and 16 For children age 5 1/trollf.:lt 17years. cnnl intte on. osk in:.!. Qs. 17-22
14. 15. 16. 17. 18. 19. 20. 21' 22 . Line HAS (name) WHAT IS THE HIGHEST IS (name) DURING THE SINCE LAST WHICH LEVEL AND GRADE DID (11 011 1£' ) WHICH I.EVEL AND GRADE
no. EVER LEVEL OF SCHOOL (name) CURRENTLY CURRENT (day of IS/wAS (name) ATIENDING ? A TIE NO DID (name) ATTEND
ATTENDED ATTENDED? ATTENDING SCHOOL the week) , SCHOOL LAST YEAR?
SCHOOL? WHAT IS THE HIGHEST SCHOOL? YEAR, DID HOW MANY LAST
GRADE (name) COMPLETED (name) DAYS DID LEVEL: YEAR? LEVEL:
AT THIS LEVEL? ATTEND (name} 1 PRESCHOOL 1 PRESCHOOL
LEVEL: SCHOOL ATTEND 2 PRIMARY 2 PRIMARY
1 PRIMARY AT ANY SCHOOL? 3 SECONDARY 3 SECONDARY . 2 SECONDARY TIME? 4 NON-STANDARIJ 4 NON-STANDARD
3 HIGHER CURRICULUM CURRICULUM
1 YES q Q.16 4 NON-STANDARD 1 YES q Q.19 1 YES Insert 9 OK 1 YES 9 OK CURRICULUM number of
2 NO~ 9 OK 2 NO 2 NO q Q .21 days in GRADE : 2 NO \ 1 GRADE :
NEXT LINE GRADE: space 99 OK NE XT LINE 99 OK 99 OK he/ow. 9 DK \'1 If less than 1 NEXT LI NE erade. enter nn. 1--- -- ----- - -- ·---- ----,- ------- - - -· ·· ----- - -- - ···--·- ---
LINE; Y_NO LEVEL GRADE YES NO YES NO DAYS LEVEL GRADE y N 1> 1-.: l g_yg__ GRADE - ;··-· ···--- -- ----- . .. ---------- ·-· -- - --- - -- ---01 1 2qNEXTLINE 1 2 3 4 9 1 2 1 2 1 2 3 4 9 1 2 9 1 l. 3 4 9 ---:-- ----·· ----"---- r- ·- - ---- - ------·-- ·· ------------ - ·-
02 1 2qNEXTLINE 1 2 3 4 9 1 2 1 2 1 2 3 4 9 : 1 2 9 1 2 3 4 9 ·-;-··- --------- ---- - ----- -- --- -- ·· - ·· --- ----
OJ 1 2qNEXTLINE 1 2 3 4 9 '
1 2 1 2 1 2 3 4 9 1 2 9 1 2 3 4 9 ---- - ---,------ ---- ---- - .. -- ----- ---------- --- ···- --- ·--
04 1 2qNEXT LINE 1 2 3 4 9 1 2 1 2 1 2 3 4 9 1 2 9 1 2 3 4 9 ---- ·········· .. .. , -- --------·-· · . -- - ------ · · --- -- - - -
05 1 2qNEXTLINE 1 2 3 4 9 ' 1 2 1 2 1 2 3 4 9 1 2 9 1 2 3 4 9 ' - -- ---- .. , - -·---- - -- - - ---- :-- - --- -~-
06 1 2qNEXTLINE 1 2 3 4 9 1 2 1 2 1 2 3 4 9 1 2 9 1 2 3 4 9 - : -.- 'C-.CC .• 7--'C . .. ---- . ' ---·- -· -----1-- -- --- - ·
07 1 2qNEXTLINE 1 2 3 4 9 1 2 1 2 1 2 3 4 9 1 2 9 1 2 3 4 9 -- -- - -- .. ------ -·-· ---- --- - ---- - - --- -·-- = Now for eaclt woman age 15-49 years, write her name and line numher (//!he top ofeach page in tlte Women ·.,. (}uestiollllairc. For each child under age 5, write his/her name and line number ANIJ the line number of his/her mother or careluker a/ the tor• o/eucl! fi u.t:e iu til< I 'lu/dreu 's (ht (•s ti"ullu irc
roushou/d now have a '" ·n. (or each eli.l!ihle woman and child in the t. ·'· ·'· ' _ ·~ --~--- ""···"-- , . _ , -.. ·. -· ····- -- -·----~ ·- _._
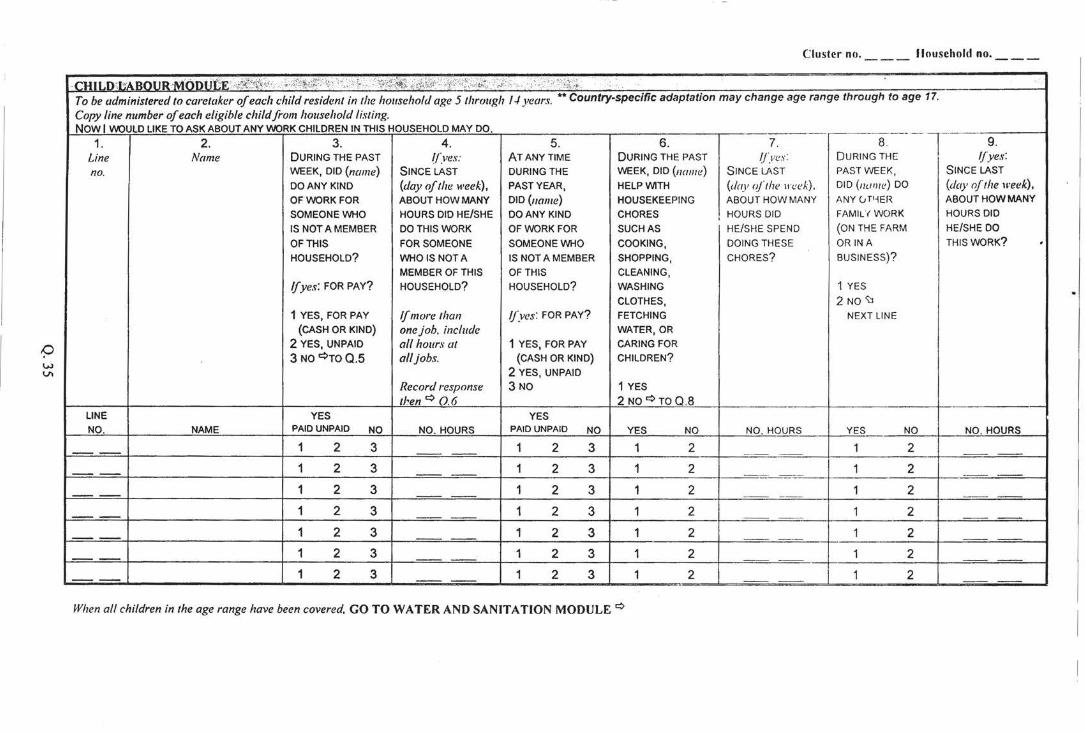
Cluster no. llousehold no.
· CHILO:bABOUR·-MOOI;""'fi' ·,if>?:¢0~\'·: >>!<r"<:,.,;:f<; '. '{i\~~~ Fi~\i.it -' ~'f< '<;)>').~~','. :,-~}/t. • _ C: ; 1 ;\'i•)i;;~:. .. :.
To be administered to caretaker of each child resident in the household age 5 through 1-1 years. •• Country-specific adaptation may change age range through to age 17.
Copy line number of each eligible child from household listing. NOW I WOULD LIKE TO ASK ABOUT ANY WORK CHILDREN IN THIS HOUSEHOLD MAY DO. - -- ----1--1. 2. 3. 4. 5. 6. 7. 8 . 9.
Line Name DURING THE PAST ((ves: AT ANYTIME DURING THE PAST 1/_ves: DURING THE ljyes:
no. WEEK, DID (name) SINCE LAST DURING THE WEEK, DID (name) SINCE LAST PAST WEEK, SINCE LAST
DO ANY KIND (day of the week), PAST YEAR, HELP WITH (day oft he \reek), DID (nunte) DO (day oftlte week), OF WORK FOR ABOUT HOW MANY DID (name} HOUSEKEEPING ABOUT HOW MANY ANY CJT 1~EH ABOUT HOW MANY
SOMEONE WHO HOURS DID HE/SHE DO ANY KIND CHORES I HOURS DID FAMIUWORK HOURS DID
IS NOT A MEMBER DO THIS WORK OF WORK FOR SUCH AS HE/SHE SPEND (ON THE FARM HE/SHE DO
OF THIS FOR SOMEONE SOMEONE WHO COOKING, DOING THESE ORIN A THIS WORK? ' HOUSEHOLD? WHO IS NOTA IS NOT A MEMBER SHOPPING, CHORES? BUSINESS)?
MEMBER OF THIS OF THIS CLEANING,
If yes: FOR PAY? HOUSEHOLD? HOUSEHOLD? WASHING 1 YES
CLOTHES, 2 NO '\J 1 YES, FOR PAY If more than /j~ves: FOR PAY? FETCHING NEXT LINE
(CASH OR KIND} onejoh, include WATER, OR
2 YES, UNPAID all hours at 1 YES, FOR PAY CARING FOR
3 NO~TOQ.5 all jobs. (CASH OR KIND) CHILDREN?
2 YES, UNPAID
Record response 3 NO 1 YES
then~ 0.6 2NO~TOQ .8 LINE YES YES NO. NAME PAID UNPAID NO NO. HOURS PAID UNPAID NO YES NO NO. HOURS YES NO NO. HOURS
1 2 3 1 2 3 1 2 1 2
1 2 3 1 2 3 1 2 1 2
1 2 3 1 2 3 1 2 1 2 --1 2 3 1 2 3 1 2 1 2
1 2 3 1 2 3 1 2 1 2
1 2 3 1 2 3 1 2 1 2
1 2 3 1 2 3 1 2 1 2 ..
When all children in the age range have been covered, GO TO WATER AND SANITATION MODULE ~
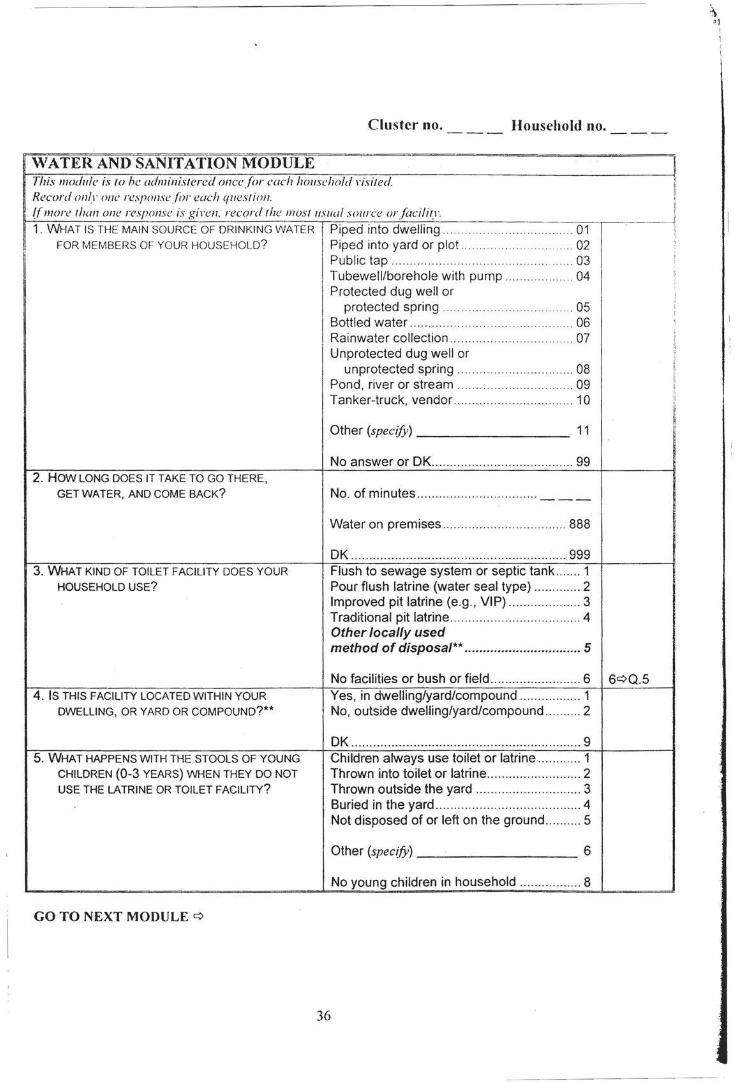
Cluster no. Household no.
\VATER AND SANITATION MODULE i This module is to he administered once for each household l'isited Record only one response (or each question. ff more than one response is gi1·en. record the IIJOslusual source or facility. ~~~--------~----~---------------.~--~~~~~----------------~--~~--~:
1. WHAT IS THE MAIN SOURCE OF DRINKING WATER Piped into dwelling .. . ....... ... .. ... .... ... ... 01 FOR MEMBERS OF YOUR HOUSEHOLD? Piped into yard or plot . ... ... .. .......... ... . 02
2. HOW LONG DOES IT TAKE TO GO THERE, GET WATER, AND COME BACK?
3. WHAT KIND OF TOILET FACILITY DOES YOUR HOUSEHOLD USE?
4 . IS THIS FACILITY LOCATED WITHIN YOUR DWELLING, OR YARD OR COMPOUND?**
5. WHAT HAPPENS WITH THE STOOLS OF YOUNG CHILDREN (0-3 YEARS) WHEN THEY DO NOT USE THE lATRINE OR TOILET FACILITY?
GO TO NEXT MODULE ¢
Public tap .. ... .... ..... .. .. . . ..... .. .... ... .... 03 Tubewell/borehole with pump .... .. ......... ... 04 Protected dug well or
protected spring . . . . . . ... ... ... ... . ... .. ... . . . 05 Bottled water ............... .. ... .. ...... ... .. .... .... 06 Rainwater collection .... .... .. ... ..... ..... ... ... . .. 07 Unprotected dug well or
unprotected spring .. .... ....... .... .. ... .. .. .. .... 08 Pond, river or stream ...... .. . .. .... ... . .. ... ... 09 Tanker-truck, vendor ........ .... .... .. .. ...... ....... 10
Other (specify) --------- 11
Water on premises ...... .... ... ..... ..... .. .... .. ... 888
OK ........... ..... ..... .... ..... .. .... .. ...... ...... ...... ... 999 Flush to sewage system or septic tank ..... .. 1 Pour flush latrine (water seal type) .. ........... 2 Improved pit latrine (e.g., VIP) ..... ..... ......... . 3 Traditional pit latrine ............ .. ..... ... ..... ......... 4 Other locally used method of disposal** ................................ 5
No facilities or bush or field .. .. .... ... .............. 6 6¢0.5 Yes, in dwelling/yard/compound .... ... .... ...... 1 No, outside dwelling/yard/compound ...... .. .. 2
DK .. .... ..... ............... .. ... .. .... ..... ... ..... .. .... .... ... 9 Children always use toilet or latrine ... ....... .. 1 Thrown into toilet or latrine .... .. .... ..... ... ..... .. . 2 Thrown outside the yard ...... ...... .. .... ... ...... .. 3 Buried in the yard ..... ... .. ....... ....... ... ..... .. ...... 4 Not disposed of or left on the ground .. ... .... . 5
Other (specify)--------- 6
No young children in household ..... .. ... ..... .. 8
36
\ . I ]
I 1
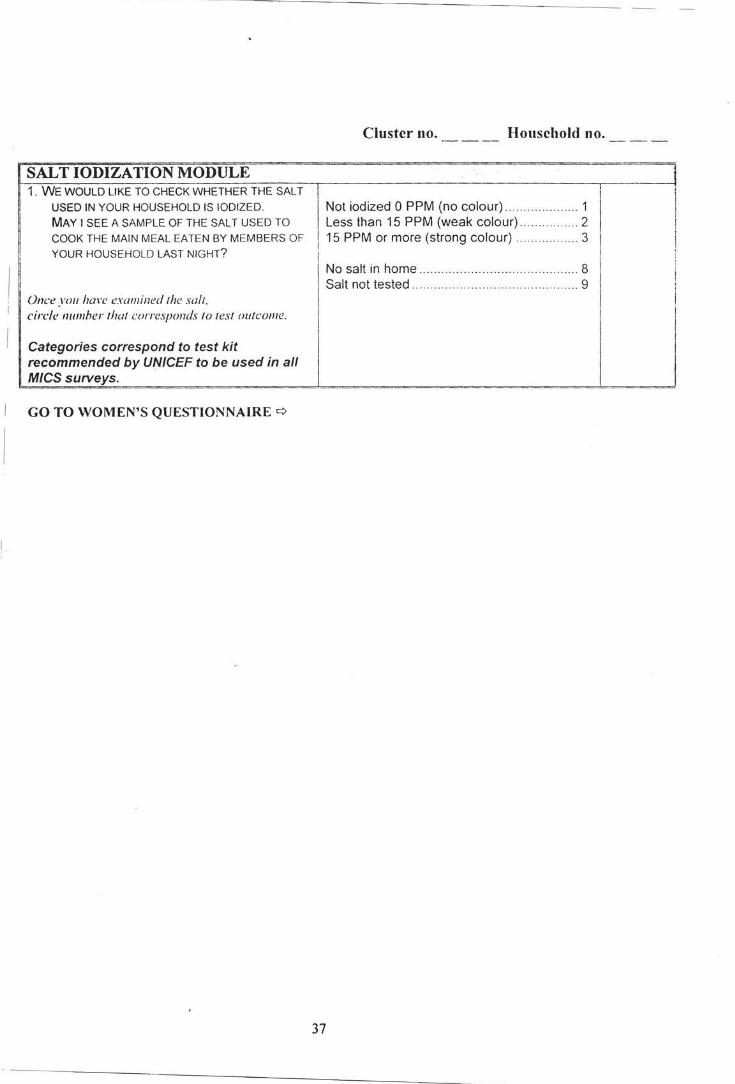
SALT IODIZATION MODULE 1. WE WOULD LIKE TO CHECK WHETHER THE SALT
USED IN YOUR HOUSEHOLD IS IODIZED.
MAY I SEE A SAMPLE OF THE SALT USED TO
COOK THE MAIN MEAL EATEN BY MEMBERS OF
YOUR HOUSEHOLD LAST NIGHT?
Once you han• examined the salt. circle numher that corresponds to test outcome.
Categories correspond to test kit recommended by UNICEF to be used in all M/CS SUIVeys.
GO TO WOMEN'S QUESTIONNAIRE ¢
Cluster no. Household no.
Not iodized 0 PPM (no colour) .. .. ........ .. ... ... 1 Less than 15 PPM (weak colour) .. ...... ... .... 2
! 15 PPM or more (strong colour) ...... ........... 3
I No salt in home . . . . . . . . . . . . . . . . . . . . . . . ... ... .. .. . 8 j Salt not tested . . . . . . . . . . . . . . . . . . . . . . . . . . . . g
37
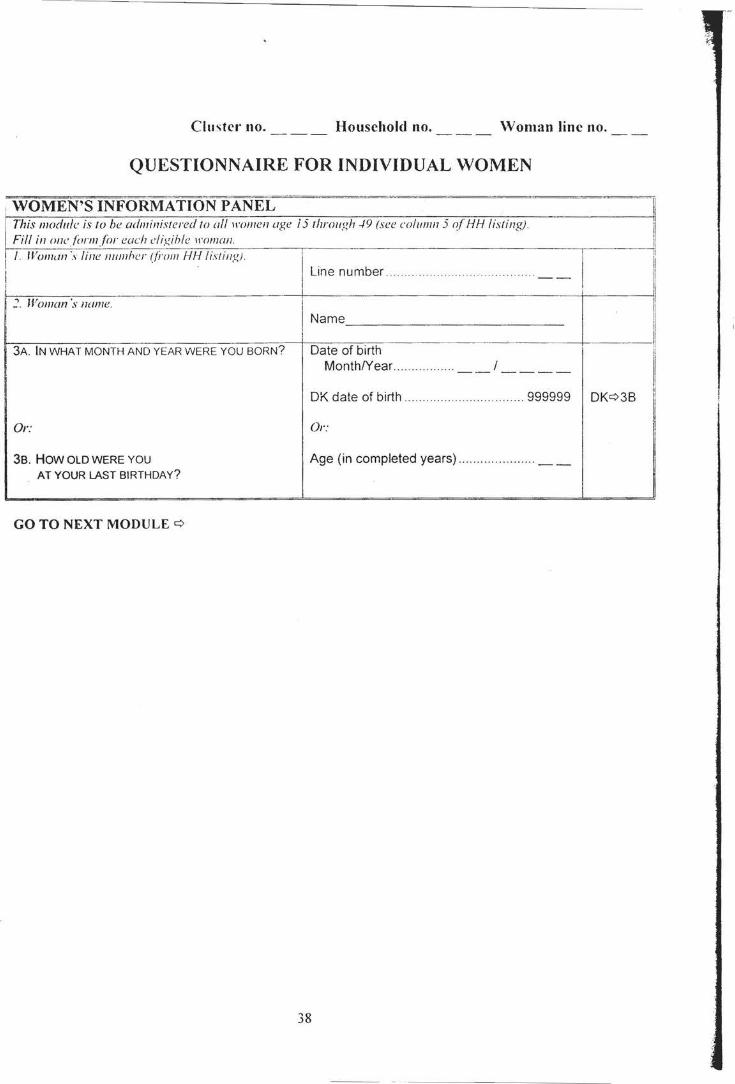
Cluster no. Household no. Woman line no.
QUESTIONNAIRE FOR INDIVIDUAL WOMEN
I \VOMEN'S INFORMATION PANEL i .
This module is to be administered to all \\'omen age i 5 through -1 9 (see column 5 of HH listing) . Fill i11 one f iwmfor each elig ible 1roman. / . Woman 's line numher (ji·om Hf-llistin i!,J. I . . ,
II
-----,~-L-. - - -b- - - - - - --- - -.----- ;!
I 1ne num er _ . . . . . . . . . . . . . . ... ..... . .. . . ·· ··· · ·· --II
I
j
I I
:;_ H' oman's name.
li Name j!
3A. IN WHAT MONTH AND YEAR WERE YOU BORN? Date of birth il
'll
Month/Year ... .. .. .. .... .. .. -- I ----I
OK date of birth ............ .. .... ... .. ... .. . 999999 OK¢38
Or: Or: I
38. HOW OLD WERE YOU Age (in completed years) .... .. .. .. .. ... .. .. .. __ AT YOUR LAST BIRTHDAY?
GO TO NEXT MODULE ¢
38
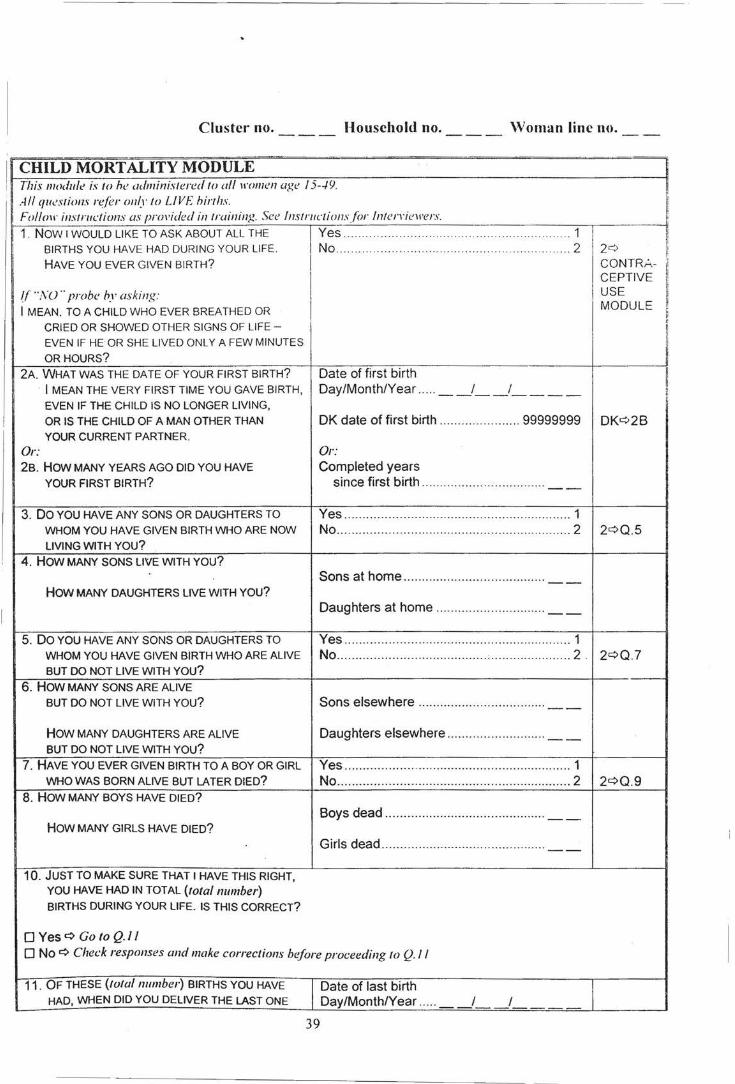
Cluster no. Household no. \Voman line no.
CHILD MORTALITY MODULE I
This module is to he administered to ai/Jl'OIIIen a~e 15--19. I All qu<-'stions ref"er only to LIVE hirths. Follmr imrructions as provided in/raining. See lnstructionsforlnterriewers. I!
1 . NOW I WOULD LIKE TO ASK ABOUT ALL THE Yes _____ ___ _______ ____ ________ ......... .. ..... ... . ...... ... . 1 ----1 I BIRTHS YOU HAVE HAD DURING YOUR LIFE. No ........ ... ..... ....... .... .. ..... .. .... . .. . ... ... .. .. . .... .. 2 2¢ ]!
HAVE YOU EVER GIVEN BIRTH? CONTRA- 'I
I' CEPTIVE I!
!l 'AU .. probe hy asking: USE ~ I MEAN. TO A CHILD WHO EVER BREATHED OR MODULE r ,,
CRIED OR SHOWED OTHER SIGNS OF LIFE- " II 'i
EVEN IF HE OR SHE LIVED ONLY A FEW MINUTES I
OR HOURS? i 2A. WHAT WAS THE DATE OF YOUR FIRST BIRTH? Date of first birth I!
I MEAN THE VERY FIRST TIME YOU GAVE BIRTH, Day/Month/Year ... .. __ / __ / ____ ~ ' EVEN IF THE CHILD IS NO LONGER LIVING,
OR IS THE CHILD OF A MAN OTHER THAN OK date of first birth ..... ..... ... ......... 99999999 DKc:>2B YOUR CURRENT PARTNER.
Or: Or: 2B. HOW MANY YEARS AGO DID YOU HAVE Completed years
YOUR FIRST BIRTH? since first birth .... ..... .... ....... ... ..... .... .. --
3. 00 YOU HAVE ANY SONS OR DAUGHTERS TO Yes ...... .. .... .. ...... ... .. ..... ..... ......... .... ..... ...... ... 1
WHOM YOU HAVE GIVEN BIRTH WHO ARE NOW No .. ........... .......... .... ...... ... .................... ..... ... 2 2¢0.5
LIVING WITH YOU?
4. HOW MANY SONS LIVE WITH YOU? Sons at home ...... ..... ... .... ....... ... ... ...... .. --
HOW MANY DAUGHTERS LIVE WITH YOU?
I Daughters at home ..... .... ......... ............ __
I
5. 00 YOU HAVE ANY SONS OR DAUGHTERS TO Yes .......... .. ....... .. .................... ... .. .... .. ... .. ..... 1
WHOM YOU HAVE GIVEN BIRTH WHO ARE ALIVE No .... ........ ........ ----- ------- ······ ···'·· ···- ---- --- ------ ---2 . 2¢0.7
BUT DO NOT LIVE WITH YOU? --6. HOW MANY SONS ARE ALIVE
BUT DO NOT LIVE WITH YOU? Sons elsewhere ... .......... .. ... ... .... .. ... ..... --HOW MANY DAUGHTERS ARE ALIVE Daughters elsewhere ................ .. ......... __
BUT DO NOT LIVE WITH YOU?
7. HAVE YOU EVER GIVEN BIRTH TO A BOY OR GIRL Yes ......... .... ....... ........... ..... ...... ... .... ..... .. ...... 1
WHO WAS BORN ALIVE BUT LATER DIED? No ..... ...... . ... ...... ....... ..... .. ....... ... .. ................. 2 2¢0.9
8. HOW MANY BOYS HAVE DIED?
Boys dead ......... .... ........ .. ......... ... ........ . __ HOW MANY GIRLS HAVE DIED?
Girls dead ... ... ..... .. ... .......... ...... ..... ..... ... --
10. JUST TO MAKE SURE THAT I HAVE THIS RIGHT, YOU HAVE HAD IN TOTAL (total number) BIRTHS DURING YOUR LIFE. IS THIS CORRECT?
0 Yes¢ Go to Q./1 0 No ¢ Check responses and make corrections before proceeding to Q./1
11. OF THESE (Iota/number) BIRTHS YOU HAVE Date of last birth HAD, WHEN DID YOU DELIVER THE LAST ONE Day/Month/Year ... .. I I
39
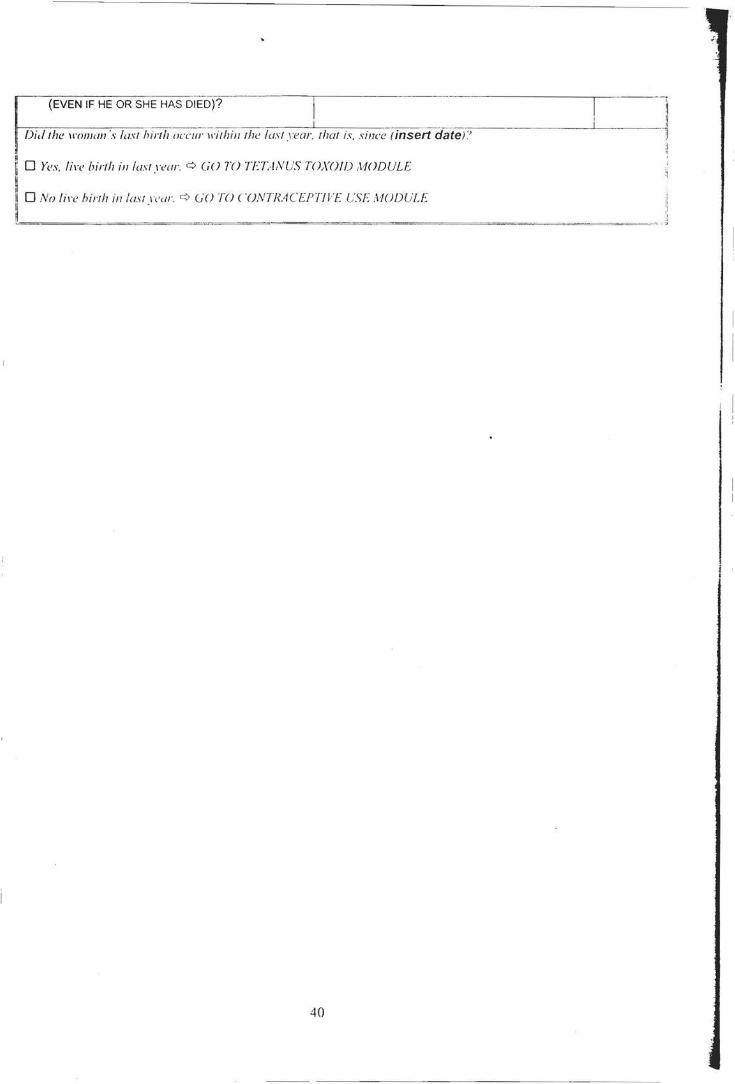
r---~~~~~~~~~~~~------------.--------------------------------------.--------, (EVEN IF HE OR SHE HAS DIED)? ~
Did the \1'()11/WI 's last hirth occur ll'ithill I he last year. I hat is. SiiiCC rinsert dater'
n ~ 0 Yes, lire birth in last year. c:> GO TO TETANUS TOXOID MODULE
~ 0 No lin! hirlh in lmll·car. c:> (j(){() CONTRACEPTIVE i.)SE ;=\l=O=D=i.=i=l-=E------=--== ----=== =
40
_jl :1
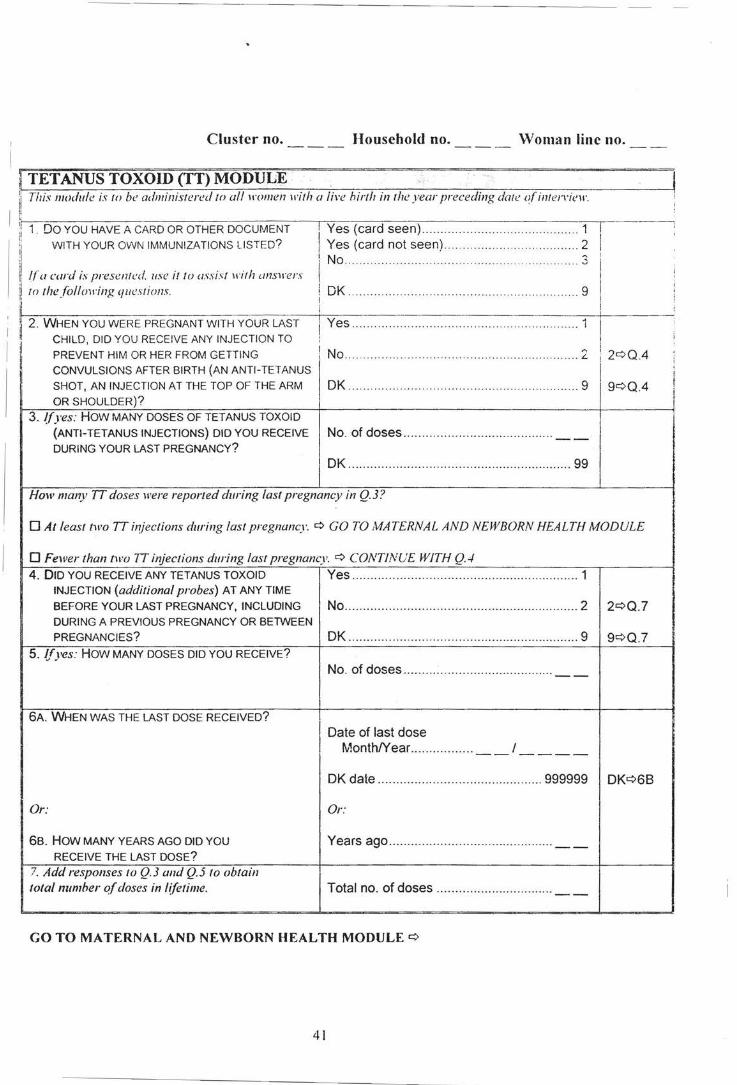
Cluster no. Household no. Woman line no.
~ TETANUS TOXOID (TT) MODULE • · . . .. ··•·••· _.· · ···· · ~ This module is to be administered to all1romen with a live hirlh in the year preceding dati! o(inten ·iew
:rr-oo YOU HAVE A CARD OR OTHER DOCUMENT 1 Yes (card seen) ..... ... .. .... ...... ... . 1 j! WITH YOUR OWN IMMUNIZATIONS USTED? i Yes (card not seen).. ...... .. ... .. . 2
~ !(a card is presented use it lo assist with ans1rers i No ....... ·· ··· ·· ········· ... ······ ··· · '
~ to the fo/lmring questions. ! DK . ... .......... . ...... .. . .. .. .. ........ ...... .... ...... .. .. 9 !I • - I
i
! Yes .............. ............. .. ... ..... .. .. .. ....... ..... .. ..... 1
1 No .... ....... ..... ......... .... .. .. .. .... .. .. .. .... ... ..... . .... L
' ~ 2. WHEN YOU WERE PREGNANT WITH YOUR LAST
~ CHILD, DID YOU RECEIVE ANY INJECTION TO
fJ PREVENT HIM OR HER FROM GETTING
~ CONVULSIONS AFTER BIRTH (AN ANTI-TETANUS I SHOT, AN INJECTION AT THE TOP OF THE ARM .. .... ..... .. .. ......... .... .. ..... ...... .............. ........ 9qQ.4 r
OR SHOULDER)?
OK 9
3. ~(yes: HOW MANY DOSES OF TETANUS TOXOID
(ANTI-TETANUS INJECTIONS) DID YOU RECEIVE No. of doses .. ..... .............. ... . ..... ..... ... ... --DURING YOUR LAST PREGNANCY?
OK .. .... .. .... .. .......... .... ... ........ ..... .. .... ........... 99
How many 7T doses were reporled during last pregnancy in Q.3?
0 At least two 7T il?jections during last pregnancy. q GO TO MATERNAL AND NEWBORN HEALTH MODULE
0 Fewer than two 7T injections during last pregnancy. q CONTINUE WITH Q.4 4. DID YOU RECEIVE ANY TETANUS TOXOID Yes .......... ............ .... .. ... ..... .. ..... ..... .. ....... ... .. 1
INJECTION (additional probes) AT ANY TIME
BEFORE YOUR LAST PREGNANCY, INCLUDING No ....................... ........... ... ... ..... ........... ... ... .. 2 2qQ.7
DURING A PREVIOUS PREGNANCY OR BETWEEN PREGNANCIES? DK ...... .. ... .. ............................... ................... 9 9qQ.7
5. Jfyes: HOW MANY DOSES DID YOU RECEIVE?
No. of doses ....... ..... .. ................ .. ........ . --
6A. WHEN WAS THE LAST DOSE RECEIVED?
I Date of last dose
MonthNear ..... ... ... ... ... I -- ----OK date .............. ..... .. ................. .... ... 999999 DKq6B
Or: Or:
68. HOW MANY YEARS AGO DID YOU Years ago ... ... ...... ..... ... .. ....................... __
RECEIVE THE LAST DOSE?
7. Add responses to Q.3 and Q.5 to obtain tota/numher of doses in l((etime. Total no. of doses ................ ... .. ..... ..... . --
GO TO MATERNAL AND NEWBORN HEALTH MODULE q
41
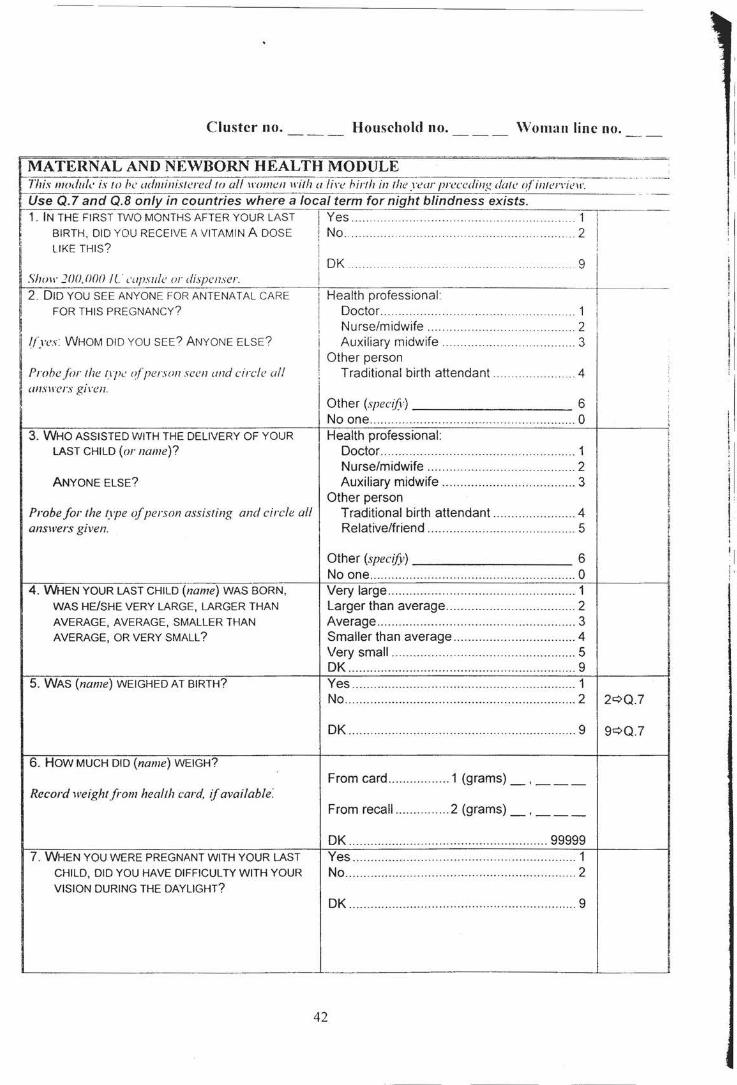
Cluster no. Household no. \Voman line no.
~~~~~~~~~~~~~~~~~~~~~~~====~~======~======-=-=···~
MATERNAL AND NEWBORN HEALTH MODULE fhis module is to be administered to ai/H·ome11 1rith a !i1·e hirth in the year preceding date o/'interrinr. Use Q. 7 and Q.B only in countries where a local term for night blindness exists. 1. IN THE FIRST TWO MONTHS AFTER YOUR LAST Yes .. . .. 1
BIRTH, DID YOU RECEIVE A VITAMIN A DOSE No. . 2 I LIKE THIS? i
OK ... ... .. .. .. .. .... .... ... .. .. . 9 I Slum ]00,000 IL' c'apsule or dispenser. 2. DID YOU SEE ANYONE FOR ANTENATAL CARE
FOR THIS PREGNANCY? He~~~~~;ofessional .. . .. . ~---
Nurse/midwife ............................ ...... .. .... 2 !(yes: WHOM DID YOU SEE? ANYONE ELSE?
ProhejiJr the f\}J.: o!person seen and circle all WISl\'CrS gi1·en.
Auxiliary midwife .. . ...... .. ... . . ... 3 Other person
Traditional birth attendant 4
Other (specif)) 6 No one ......... ......... ....... ..... .............. ...... ....... 0
3. WHO ASSISTED WITH THE DELIVERY OF YOUR Health professional : LAST CHILD (or name)? Doctor ...................................................... 1
Nurse/midwife ...... ... ................................ 2 ANYONE ELSE? Auxiliary midwife .. ................................... 3
Other person Probe for the 1,1pe of person assisting and circle all Traditional birth attendant ......... ... .. ......... 4 answers given. Relative/friend ............ ........... .. .... .. .. ... .... 5
4. WHEN YOUR LAST CHILD (name) WAS BORN,
WAS HE/SHE VERY LARGE, LARGER THAN AVERAGE, AVERAGE, SMALLER THAN AVERAGE, OR VERY SMALL?
5. WAS (name) WEIGHED AT BIRTH?
6. HOW MUCH DID (name) WEIGH?
Record weight from health card, 1j available:
7. WHEN YOU WERE PREGNANT WITH YOUR LAST CHILD, DID YOU HAVE DIFFICULTY WITH YOUR VISION DURING THE DAYLIGHT?
Other (specify) 6 No one ................................................ ......... 0 Very large ....................................... .... ......... 1 Larger than average ...... ... .. ......... ....... ......... 2 Average ..... .. .......... ..... .... ............ .. .. ... .......... 3 Smaller than average ...... ........... ........ ......... 4 Very small ................................................... 5 OK ..... ................................................ .......... 9 Yes ........................... ..... .... .... ....... ...... ........ . 1 No .......................... .... ........ .. ...... .. ................ 2 2¢0.7
OK ............................ .... ............................... 9 9¢Q.7
From card .... ............. 1 (grams)_, __ _
From recall ...... .. ....... 2 (grams)_, __ _
OK ................................... .......... ... ....... 99999 Yes ............... ... .. ................. .. ....................... 1 No ....... ............... .. ... .......... ... ................. ..... .. 2
OK .... ...... ..................................................... 9
42
i
;
' I
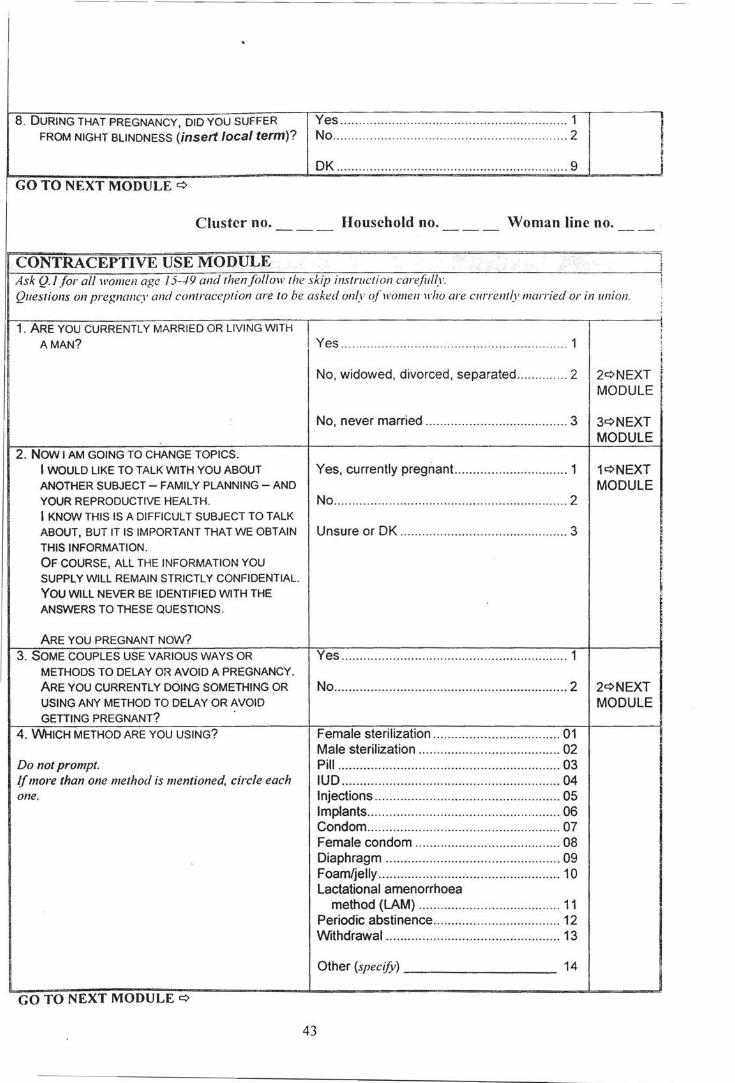
-- --· - - --- - - --- - - --- - - --- - - - - - - - - - -
8. DURING THAT PREGNANCY, DID YOU SUFFER FROM NIGHT BLINDNESS (insert local term)?
GO TO NEXT MODULE c::>
Yes ....... .. ..... .... .... ... ... ...... ....... ................... .. 1 No ... .... ... .... ... ..... .. .............. .. ............. .. ......... 2
OK ....... ........ .. ........... ..... .. .... ..... .. .... ..... .... .. .. 9
Cluster no. Household no. Woman line no.
CONTRACEPTIVEUSE MODULE Ask Q.l for all women age 15--19 and then follow the skip instmction carefully Questions on pregnancy and contraception are to be asked only of women 1rho are currently married or in union.
1. ARE YOU CURRENTLY MARRIED OR LIVING WITH AMAN? Yes ............... .. ............................................. 1
No, widowed, divorced, separated .............. 2 2c::>NEXT MODULE
No, never married .... ..... ... .. ............. ............ 3 3c::>NEXT
2. NOW I AM GOING TO CHANGE TOPICS. I WOULD LIKE TO TALK WITH YOU ABOUT Yes, currently pregnant.. ............................. 1 ANOTHER SUBJECT- FAMILY PLANNING- AND YOUR REPRODUCTIVE HEALTH. No ... ................... .. ............................ ............ 2 I KNOW THIS IS A DIFFICULT SUBJECT TO TALK ABOUT, BUT IT IS IMPORTANT THAT WE OBTAIN Unsure or OK ....................... ........... ............ 3 THIS INFORMATION. OF COURSE, ALL THE INFORMATION YOU SUPPLY WILL REMAIN STRICTLY CONFIDENTIAL. YOU WILL NEVER BE IDENTIFIED WITH THE ANSWERS TO THESE QUESTIONS.
ARE YOU PREGNANT NOw? Yes ...... ... .. ..... ........... ....... .... ........... .. ........... 1
MODULE
1c::>NEXT MODULE
3. SOME COUPLES USE VARIOUS WAYS OR METHODS TO DELAY OR AVOID A PREGNANCY. ARE YOU CURRENTLY DOING SOMETHING OR USING ANY METHOD TO DELAY OR AVOID GETTING PREGNANT?
No ....... ......................... ........... .... ..... ... ......... 2 2c::>NEXT
4. WHICH METHOD ARE YOU USING?
Do not prompt. If more than one method is mentioned, circle each one.
GO TO NEXT MODULE c::>
43
MODULE
Female sterilization .. .. ....................... .. ... ... 01 Male sterilization ........ ........ .... ................ ... 02 Pill ............................................................. 03 IUD .......................................... .... .... .... ... ... 04 Injections ......... ............ .... .. .... ... .. .... .... ....... 05 Implants ..... .... ........... ... ................... ... ........ 06 Condom .............. .......... .... .... .................. .. . 07 Female condom ........................................ 08 Diaphragm ............. ... ...... ....... .. ................. 09 Foam/jelly ........... ... .... ... ............................. 10 Lactational amenorrhoea
method (LAM) .................................... .. . 11 Periodic abstinence ......................... .......... 12 Withdrawal ........ ........ .............. .... .... .. ........ 13
Other (specify)--------- 14
I I
! i ! j,
!
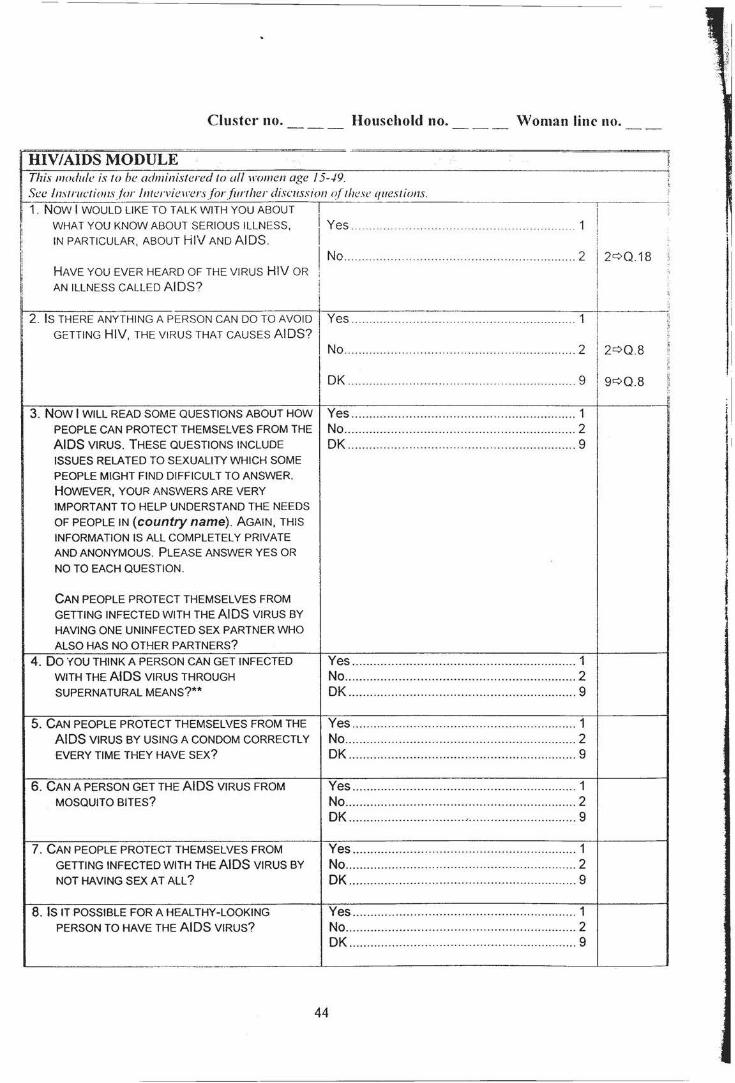
Cluster no. Household no.
HIV/AIDS MODULE This module is to be administered to all women age 15--./9. See lnstructions/(Jr lntcrvieJFersfor{ztrther discmsion o{lhese questions. 1. NOW I WOULD LIKE TO TALK WITH YOU ABOUT
WHAT YOU KNOW ABOUT SERIOUS ILLNESS, IN PARTICULAR, ABOUT HI\/ AND AIDS.
HAVE YOU EVER HEARD OF THE VIRUS HIV OR
J Yes ..
I No .. !
Woman line no.
.... 1
.. 2 12¢0.18
I I AN ILLNESS CALLED AIDS? .
I ------------~~~--------------------~------[ 2. lsz~T~7~GA~~~H~NH~ :~:s~:A~~:~~ETso~~~~ I Yes .......................... ...... ....... ..................... 1
c
I No ........................................ .. ....... ......... ...... 2 2¢Q.8 r
I j: ;.
DK ................ ................................ ............... 9 9¢Q.8 ~ !: ~
3. NOW I WILL READ SOME QUESTIONS ABOUT HOW Yes .............................................................. 1 PEOPLE CAN PROTECT THEMSELVES FROM THE No ................................................................ 2 AIDS VIRUS. THESE QUESTIONS INCLUDE OK ............................................................... 9 ISSUES RELATED TO SEXUALITY WHICH SOME PEOPLE MIGHT FIND DIFFICULT TO ANSWER. HOWEVER, YOUR ANSWERS ARE VERY IMPORTANT TO HELP UNDERSTAND THE NEEDS
OF PEOPLE IN (country name). AGAIN, THIS INFORMATION IS ALL COMPLETELY PRIVATE AND ANONYMOUS. PLEASE ANSWER YES OR
NO TO EACH QUESTION.
CAN PEOPLE PROTECT THEMSELVES FROM GETTING INFECTED WITH THE AIDS VIRUS BY HAVING ONE UNINFECTED SEX PARTNER WHO
ALSO HAS NO OTHER PARTNERS?
4. 00 YOU THINK A PERSON CAN GET INFECTED Yes ............................................ .. ................ 1 WITH THE AIDS VIRUS THROUGH No ....................... ......................................... 2 SUPERNATURAL MEANS?** DK ............................. .................................. 9
5. CAN PEOPLE PROTECT THEMSELVES FROM THE Yes .............................................................. 1 AIDS VIRUS BY USING A CONDOM CORRECTLY No .............. .................................... .. ............ 2 EVERY TIME THEY HAVE SEX? DK ...................................... ......................... 9
6. CAN A PERSON GET THE AIDS VIRUS FROM Yes .............................................................. 1 MOSQUITO BITES? No ........................ ........................................ 2
DK ................................ .- .............................. 9
7. CAN PEOPLE PROTECT THEMSELVES FROM Yes ............................... ....... ........................ 1 GETTING INFECTED WITH THE AIDS VIRUS BY No ................................................................ 2 NOT HAVING SEX AT ALL? OK ............................................................... 9
8. IS IT POSSIBLE FOR A HEAL THY -LOOKING Yes ...................................... .. ...... ................ 1 PERSON TO HAVE THE AIDS VIRUS? No ........................................ ........................ 2
DK .......................................... .. ................... 9
44
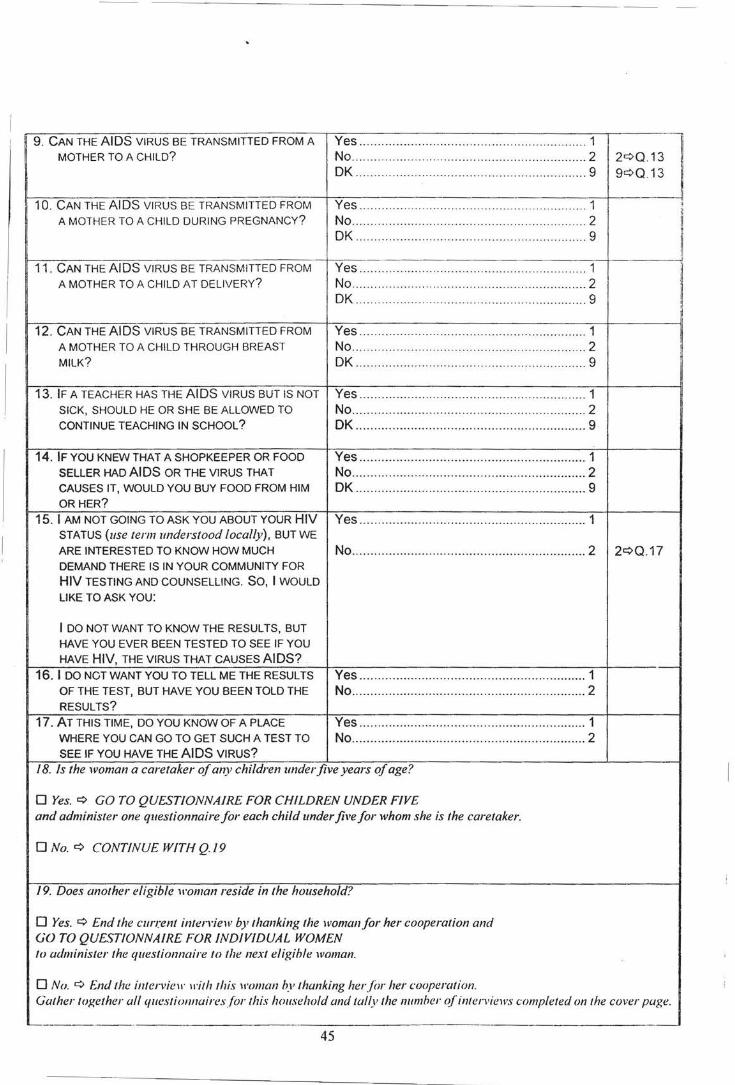
------- - - - - --- - ---- - - - ---· --
9. CAN THE AIDS VIRUS BE TRANSMITTED FROM A Yes .. ... .. ... ... ... ... ...... .................... ................. 1
I MOTHER TO A CHILD? No .... ... .. ... ..... ...... ...... ................... ...... .... ...... 2 2¢0.13
DK .......................... ..... ......................... ....... 9 9¢0.13
·I 10. CAN THE AIDS VIRUS BE TRANSMITTED FROM Yes ............. ... .. .. .... ......... .. ......... .. .... ... .. ....... 1 " ,,
A MOTHER TO A CHILD DURING PREGNANCY? No .................... .. ..... .. ........ .... ..... ... .......... ..... 2 ,, !I
OK .................................. .... .. ...... ..... .... .. ... .. . 9 li
!I 11 . CAN THE AIDS VIRUS BE TRANSMITTED FROM Yes ..... .............. .. ...... ...... .... ... ... ..... .. ... .. ....... 1
! A MOTHER TO A CHILD AT DELIVERY? No .............................. .. ... ... .... .. ...... ... ........... 2 OK .... ... ... .. ................. .......... .... .................... 9 ~
12. CAN THE AIDS VIRUS BE TRANSMITTED FROM Yes ........ ...... .. ............. ... ... .. ......... .. .......... ... . 1 A MOTHER TO A CHILD THROUGH BREAST No ........ ........ .. .... ................ ........ .................. 2 I
MILK? OK ............................................................... 9
13. IF A TEACHER HAS THE AIDS VIRUS BUT IS NOT Yes .. .. ... .... .... .. .. ........... .. ..... ... ...... .... .... ..... ... 1 SICK, SHOULD HE OR SHE BE ALLOWED TO No ........ ..... .... ....... ... ... ......... ......................... 2 CONTINUE TEACHING IN SCHOOL? OK ......... .. .............. .. .... .. ......... .... ................. 9
14. IF YOU KNEW THAT A SHOPKEEPER OR FOOD Yes ........................... ... ................................ 1 SELLER HAD AIDS OR THE VIRUS THAT No .............. ............. ....... .. .. ..... ..... ............. ... 2 CAUSES IT, WOULD YOU BUY FOOD FROM HIM OK .............. .. .... .. .......... .. .. .... ....................... 9 OR HER?
15. I AM NOT GOING TO ASK YOU ABOUT YOUR HIV Yes ........................... ... .. .... .......................... 1 STATUS (use term understood locally), BUT WE
ARE INTERESTED TO KNOW HOW MUCH No ....... ... ...... .. .... .. ................... ...... ..... ... ... .... 2 2¢0.17 DEMAND THERE IS IN YOUR COMMUNITY FOR HIV TESTING AND COUNSELLING. SO, I WOULD
LIKE TO ASK YOU:
I DO NOT WANT TO KNOW THE RESULTS, BUT HAVE YOU EVER BEEN TESTED TO SEE IF YOU
HAVE HIV, THE VIRUS THAT CAUSES AIDS?
16. I DO NOT WANT YOU TO TELL ME THE RESULTS Yes ... .... .... .... ..................... ......... ....... .. ........ 1 OF THE TEST, BUT HAVE YOU BEEN TOLD THE No ......... ... ............... .. ....... ... ............... .......... 2 RESULTS?
17. AT THIS TIME, DO YOU KNOW OF A PLACE Yes ... ..... ...... ................ ...... ... .... ...... .. .... .. ..... 1 WHERE YOU CAN GO TO GET SUCH A TEST TO No ................................... ... .......................... 2 SEE IF YOU HAVE THE AIDS VIRUS?
18. Is the woman a caretaker of any children underfive years of age?
0 Yes. ¢ GO TO QUESTIONNAIRE FOR CHILDREN UNDER FIVE and administer one questionnaire for each child under five for whom she is the caretaker.
ONo.¢ CONTINUE WITH Q./9
/9. Does another eligible woman reside in the household?
0 Yes. ¢ End the current interriew by thanking the woman for her cooperation and GO TO QUESTIONNAIRE FOR INDIVIDUAL WOMEN to administer the questionnaire to the next eligible woman.
0 No. ¢ End the i111ervie11· ll'ilh this ll'oman by thanking her for her cooperation. Gatherlogether all queslionnairesforlhis household and tally !he number (?linlerviews completed on !he cover page.
~--------- .
45
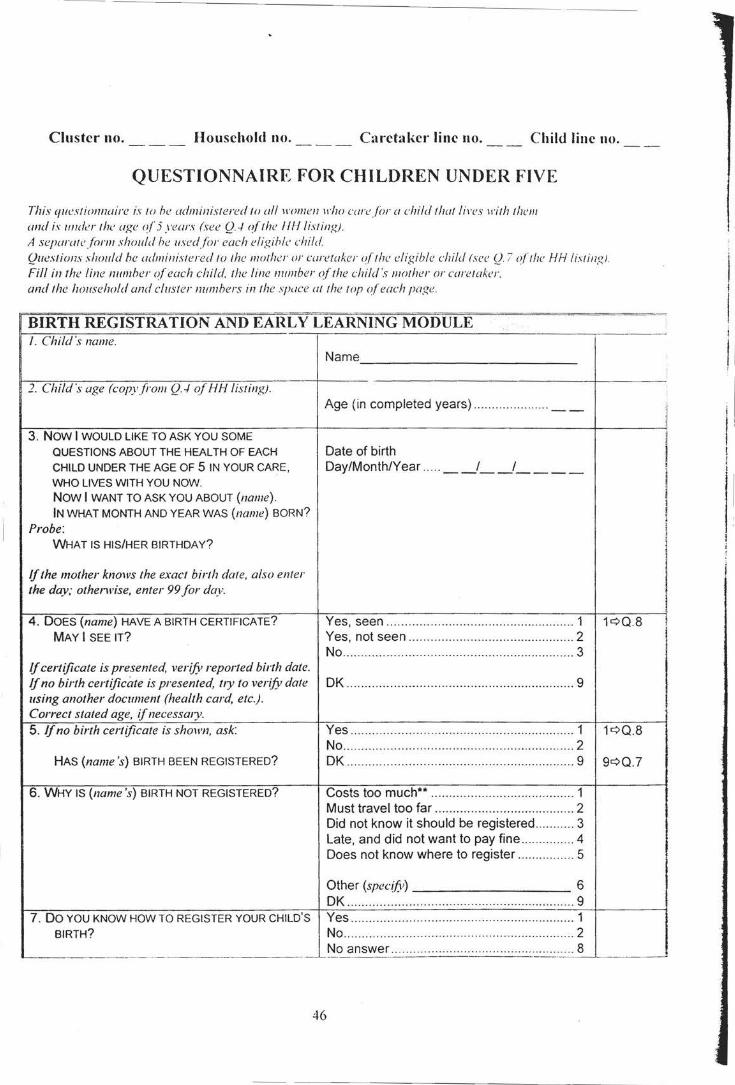
Cluster no. Household no. Caretaker line no. Child line no.
QUESTIONNAIRE FOR CHILDREN UNDER FIVE
This qut:stiomwire is to he administered to all H·omen 1rho curt:j(w a child thatlil'('S 1rith !hem and is under !he age of'5 years (1·ee Q.-1 oft he 111/lisling) . A separatefonn should he used.for each eligihl(' child Questions should he adminislered to the mother or caretaker o(lhe eligible child (see Q. 7 of' the HH listing! . Fill in the line number o{each child. !he line number o{lhe child 's mother or caretaker. and the household and clus/er mtmhers in the space a/ the top o{each page.
BIRTH REGISTRATION AND EARLY LEARNING MODULE I. Child's name.
Name
2. Child's age (copy from Q.-1 ol HH lisling). Age (in completed years) ..................... __
3. NOW I WOULD LIKE TO ASK YOU SOME QUESTIONS ABOUT THE HEALTH OF EACH Date of birth CHILD UNDER THE AGE OF 5 IN YOUR CARE, Day/Month/Year ..... _ _/ __ ! ____ WHO LIVES WITH YOU NOW. NOW I WANT TO ASK YOU ABOUT (name). IN WHAT MONTH AND YEAR WAS (name) BORN?
Probe: WHAT IS HIS/HER BIRTHDAY?
If the mother knows the exact birth date, also enter the day; othen1•ise, enter 99 for day.
4. DOES (name) HAVE A BIRTH CERTIFICATE? Yes, seen ............................................ .. ...... 1 1¢Q.8 MAY I SEE IT? Yes, not seen ............. .. ............................... 2
No ............................................................ .. .. 3 If certificate is presented, verify reported birth date. If no birth certificate is presented, tty to verify date DK .................................... ... ........................ 9 using another document (health card, etc.). Correct stated age, ifnecesswy. 5. If no birth certificate is shown, ask: Yes .... .... .... ..... ............. ...... ..... .. ... .. .............. 1 1¢Q.8
No .................... ............ .... .. .......................... 2 HAS (name's) BIRTH BEEN REGISTERED? DK ............................. .. .......... .. .... .......... .... .. 9 9¢Q.7
6. WHY IS (name's) BIRTH NOT REGISTERED? Costs too muchu ........ .... ............................ 1 Must travel too far .. .................. .......... ......... 2 Did not know it should be registered ......... .. 3 Late, and did not want to pay fine ............... 4 Does not know where to register ................ 5
Other (specify) 6 OK ............................................................... 9
7. DO YOU KNOW HOW TO REGISTER YOUR CHILD'S Yes .... .. ..... .. ... .... .......................................... 1 BIRTH? No ............................ .. ......................... ......... 2
No answer ................................................... 8 - ----·-- · --~- ·-·
46
·I
I
II II j I
II I
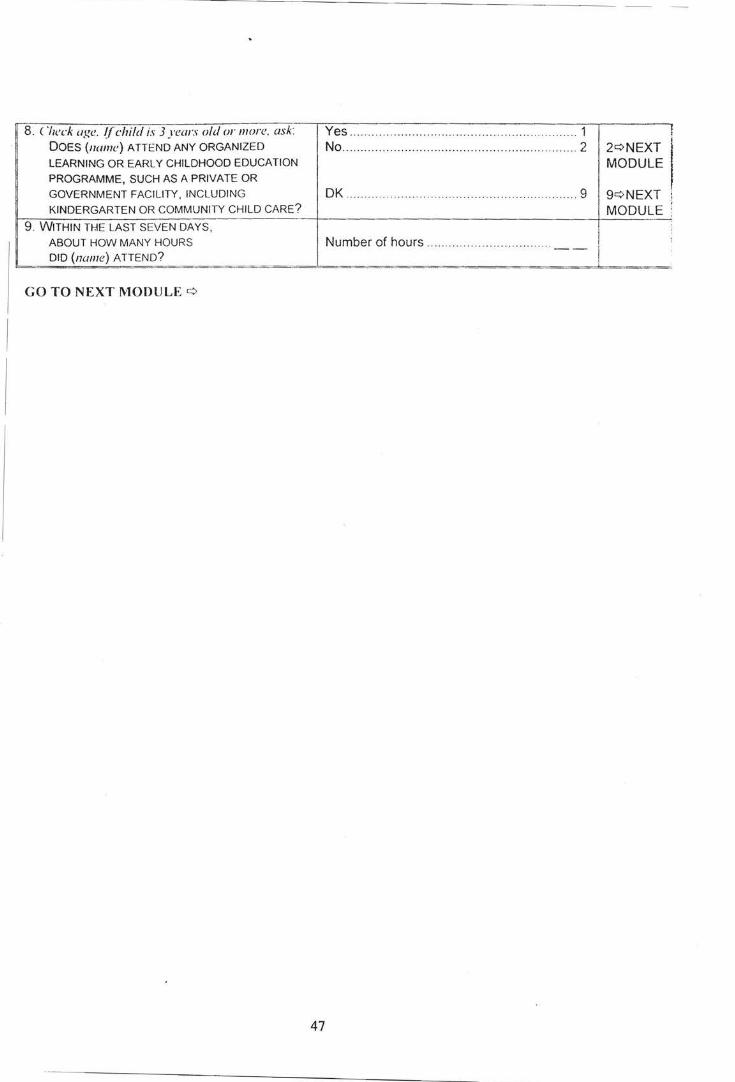
8. ('heck age. llchild is 3 years old or more. ask: Yes .. .. .. .. ...... .. .... .... .. .. .. .... .... ....... .. .... ....... ... . 1 ! i.
DOES (11ame) ATTEND ANY ORGANIZED No ..... ....... .. .. ... .. .. ............ ..... .... ....... . .. . ........ . 2 2¢NEXT LEARNING OR EARLY CHILDHOOD EDUCATION MODULE PROGRAMME, SUCH AS A PRIVATE OR GOVERNMENT FACILITY, INCLUDING OK ...... ... ..... .... .......... .. ... .. .. .. ..... ... .. .. .. ... .. .. .. . 9 9 ¢ NEXT ;
' KINDERGARTEN OR COMMUNITY CHILD CARE?
f
MODULE
9. WITHIN THE LAST SEVEN DAYS, ABOUT HOW MANY HOURS Number of hours ;
.. ..... . . · ·· · ·· · ··· · ········ · .. --DID (name) ATTEND?
GO TO NEXT MODULE c::>
47
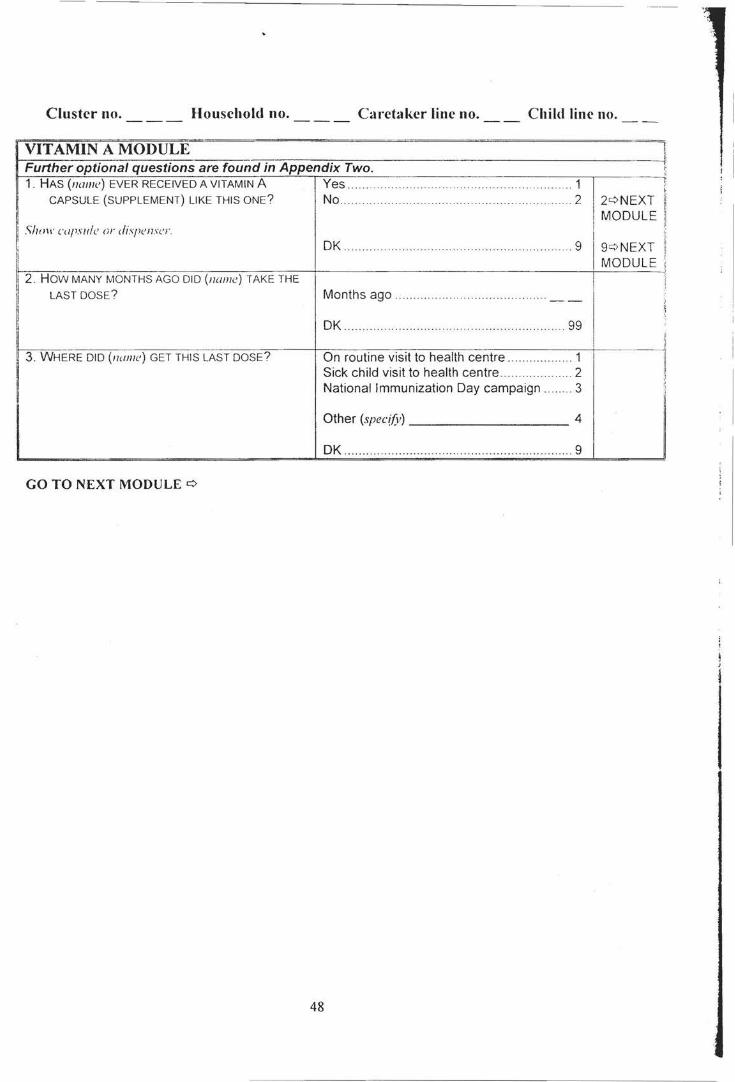
Cluster no. Household no. Caretaker line no. Child line no.
VITAMIN A MODULE ~· -----j!
Further optional questions are found in Appendix Two. ,.
1. HAS (name) EVER RECEIVED A VITAMIN A Yes '' 1 -------,.
" " . . . .. . . . . . .. . ... ··· ··· · .... . ... ··· · · ···· ·· ·· " i: CAPSULE (SUPPLEMENT) LIKE THIS ONE? No ..... ...... ... ..... .. ... .... .. ...... .. ... .... .. .... .. .... .. '' " 2 2¢ NEXT H
I! I MODULE ll
Shmr C<if'SIIIe or dispenser. I~
I
I
OK .9 9q NEXT li I ······ ···· · · · ······ ·· ··· ·· · · ···· ·· · · · ······ ·· · · ·· ········· '! ! MODULE
:·
!i 2 . HOW MANY MONTHS AGO DID (name ) TAKE THE
:! LAST DOSE? Months ago ····· ······ ····· ······ ··· ·· ···· ······· ···· -- :!
[i
i OK .. .. ..... . ... ..... ..... .. .... . .. .. . . ...... . . . ....... .99 I' _ __ j
3. WHERE DID (name) GET THIS LAST DOSE? On routine visit to health centre .......... " ' ' ' . 1 ~ Sick child visit to health centre .. ....... . 2 i! ....... . ~I
National Immunization Day campaign . 3 i: I
.... .. ::
I Other (spec[{y) 4
DK .. .. .. ......... ... ............ ............. .. ......... ......... 9
GO TO NEXT MODULE ¢
48
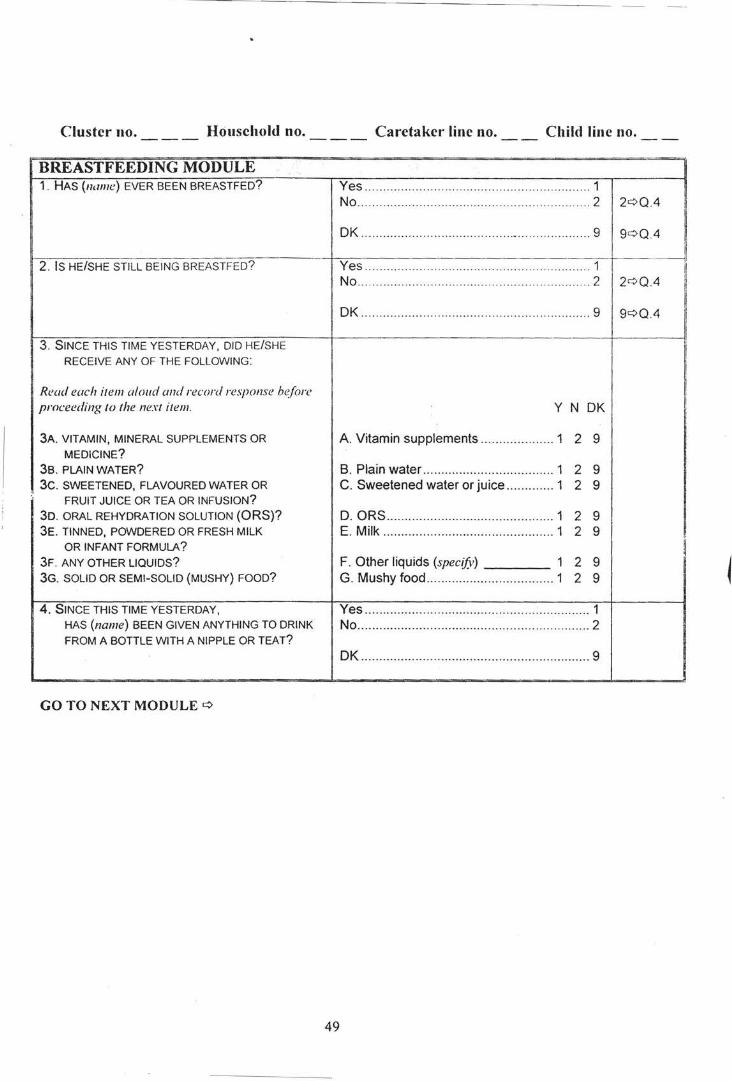
Cluster no. Household no. Caretaker line no. Child line no.
BREASTFEEDING MODULE 1. HAS (name) EVER BEEN BREASTFED? Yes .. ..... .... ... .. ...... .. ............ ........ .......... ........ 1
No .. ... ........ ..... .... ... ...... .. .. .. .... .... ..... .. .... . ..... 2 2¢ 04
I DK ... .. .... ... .... ..... ... .. .... .. .. ... ... .. -...... . . . . . ... . . .. 9 9¢ 0 .4 I
-- -1 2. IS HE/SHE STILL BEING BREASTFED? Yes .. .. ... .... .. .. .... .... ...... ...... ... .. .. .... . .... ... .... ... . 1 .,
No .. .... ....... ....... .... ... ... ... ... .... ... .. ... ......... .. .... . 2 2¢ 0.4 !I I
DK .... ......... .. .. ... ..... .. ...... ... ... ..... ... ... .. ... ...... .. 9 9¢0.4
3. SINCE THIS TIME YESTERDAY, DID HE/SHE RECEIVE ANY OF THE FOLLOWING:
Read each item aloud and record response before proceeding to the next item. y N DK
3A. VITAMIN, MINERAL SUPPLEMENTS OR A. Vitamin supplements .. .... .. ...... .. .... 1 2 9 MEDICINE?
3B . PLAIN WATER? B. Plain water .. .. .. ....... .. .. .. .. ... ..... ... .. .. 1 2 9 3C. SWEETENED, FLAVOURED WATER OR C. Sweetened water or juice .. .. .. .. .. ... 1 2 9
FRUIT JUICE OR TEA OR INFUSION? 3D. ORAL REHYDRATION SOLUTION (ORS)? D. ORS .......... .. ........... .. .................. .. . 1 2 9 3E. TINNED, POWDERED OR FRESH MILK E. Milk ... ... .. ... ....... .. .. .. .. .... .. .. .. .. .. .. .. .. . 1 2 9
OR INFANT FORMULA? i 3F. ANY OTHER LIQUIDS? F. Other liquids (specify) 1 2 9 3G. SOLID OR SEMI-SOLID (MUSHY) FOOD? G. Mushy food .. .. .. ....... .. ........ .. ........ .. 1 2 9
4. SINCE THIS TIME YESTERDAY, Yes ...... .. .. ......... ........ ... ... ...... ........ ..... ....... ... 1 HAS (name) BEEN GIVEN ANYTHING TO DRINK No ....... ... ....... .. ....... .. ..... .. .. .. .. ...... ... .. .. ... .. ..... 2 FROM A BOTTLE WITH A NIPPLE OR TEAT?
OK ... ... ......... .. ....... .. .. ... .... .. ... .... .. ..... ...... .. ... . 9
GO TO NEXT MODULE ¢
49
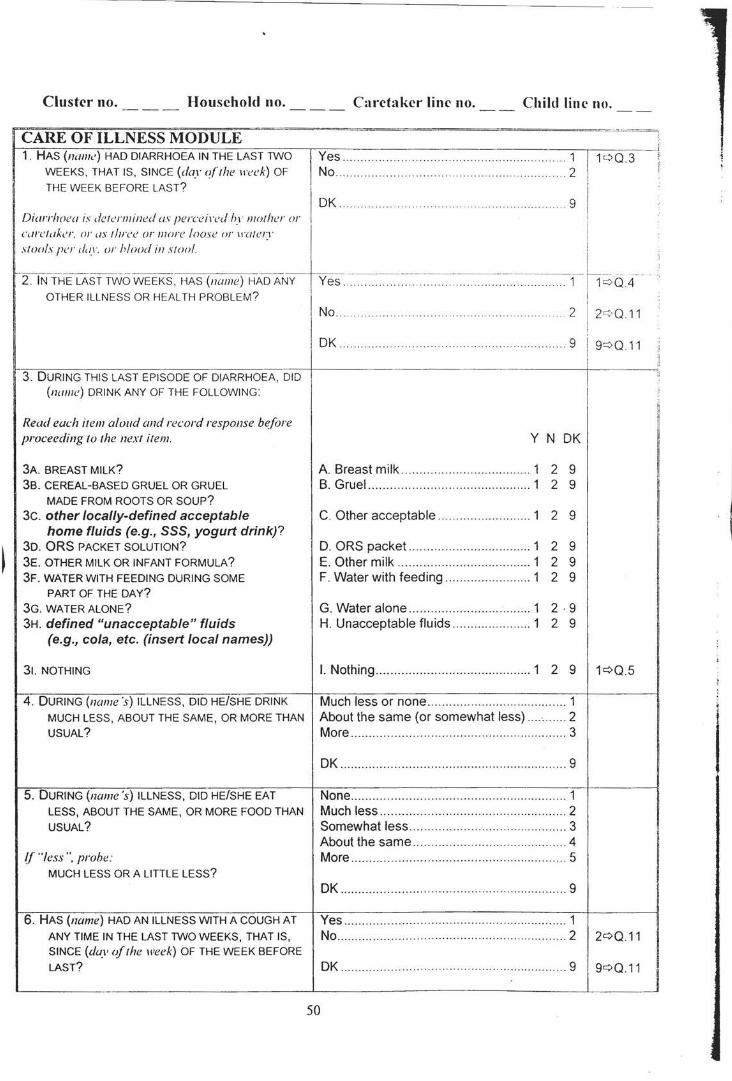
Cluster no. Household no.
CARE OF ILLNESS MODULE 1. HAS (name) HAD DIARRHOEA IN THE LAST 1WO
WEEKS, THAT IS, SINCE (day o(lhe 1reek) OF
THE WEEK BEFORE LAST?
Diarrhoea is dercrmined as percein'd h_1 · morher or caretaker. or us rflree or more loose or IIDfeiT .\fools f1Cr du1 ·. or hlood in stool.
--- - ----- - -------- - - - - -- ---,---·---;-- - - -- - -2. IN THE LAST TWO WEEKS , HAS (name) HAD ANY
OTHER ILLNESS OR HEALTH PROBLEM?
3. DURING THIS LAST EPISODE OF DIARRHOEA, DID (name) DRINK ANY OF THE FOLLOWING:
Read each item aloud and record response before proceeding to the next item.
3A. BREAST MILK?
3B. CEREAL-BASED GRUEL OR GRUEL
MADE FROM ROOTS OR SOUP? 3c. other locally-defined acceptable
home fluids (e.g., SSS, yogurt drink)? 3D. ORS PACKET SOLUTION?
3E. OTHER MILK OR INFANT FORMULA?
3F. WATER WITH FEEDING DURING SOME
PART OF THE DAY?
3G. WATER ALONE?
3H. defined "unacceptable" fluids (e.g., cola, etc. (insert local names))
31. NOTHING
4. DURING (name's) ILLNESS, DID HE/SHE DRINK
MUCH LESS, ABOUT THE SAME, OR MORE THAN
USUAL?
5. DURING (name's) ILLNESS, DID HE/SHE EAT
LESS, ABOUT THE SAME, OR MORE FOOD THAN
USUAL?
(f "less", probe: MUCH LESS OR A LITTLE LESS?
6. HAS (name) HAD AN ILLNESS WITH A COUGH AT
ANY TIME IN THE LAST 1WO WEEKS, THAT IS, SINCE (duy of the week) OF THE WEEK BEFORE
LAST?
Caretaker line no. Child line no.
Yes .......... ... ........ .... .. ........... ...... . ... .. .. 1 1¢03 No..... ..... ... ... ... .. .. ... . .. ...... . .... ... . 2
OK ... ... ... .. ... .... .. ...... .. .. . .. ..... ..... .... . 9
I I
-----··--- --·------------ - --·- --- - - - - - --------- --- '-- - - -Yes . . ..... .. .... .. ... ....... ........ ... ... ... ........ 1 1 1¢04
No . . ... ..... .. ... .. ..... ............. .... ..... .... ... .... .. . 2 J 2c:>O 11 i
OK .. ... .. .... ..... ....... .. ..... .. .. ... ... ... ... ........ 9 1 9¢ 011
Y N OK
A. Breast milk .... .... .. ....... .. ....... .. ..... ... 1 2 9 B. Gruel. ... .......... .. ....... .......... ....... ..... 1 2 9
C. Other acceptable .... ....... ......... ... .. . 1 2 9
D. ORS packet .. .... ... ......... .... ...... .. .. .. 1 2 9 E. Other milk ...... .. ....... ... .. .. .... ... ... ..... 1 2 9 F. Water with feeding ....... ....... .. .... .... 1 2 9
G. Water alone .................................. 1 2 · 9 H. Unacceptable fluids ...... ... ........ ..... 1 2 9
I. Nothing .. ..... .... ....... .. .......... .. .... .. ..... 1 2 9 1¢0.5
Much less or none ... ...... ... ......... .. ... ... ... .... ... 1 About the same (or somewhat less) ... ... .. ... 2 More ........ .. .......... .......................... ....... ... .... 3
DK ........... .. .................. ... .... .......... .. ...... .. .. .. . 9 I None .... ... .. ... .. ... .... .. ...... .. .. .... ...... ....... ...... .... 1 Much less ............ .... .. .... .. .......... .. ......... ... .... 2 Somewhat less .. ....... .... ..... ....... ..... ....... ..... .. 3 About the same ... ..... .. ...... ...... .. ... ....... ....... . 4 More ........ ... ........ .. ... ..... ........ .... .. .......... .. .. ... 5
DK ... ... .... .. ....... ... .. .. ..... ..... ... ...... .... .............. 9
Yes ... ..... ... ... .......... ......... ..... .... .... ......... .. .. ... 1 No ............. .. .............. .... ........ ... ............ .. ...... 2 2¢011
OK .. ..... .... .. .. .... .. .... .. .... ... .... ......... ... ... ... ...... 9 9¢0.11
50
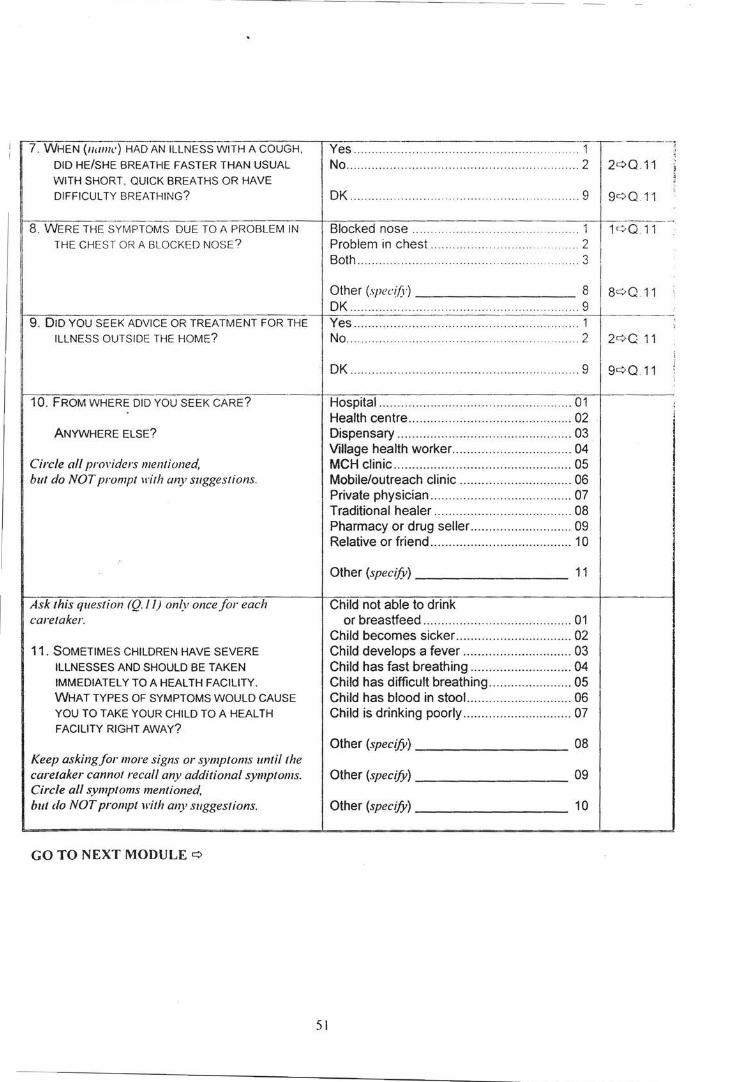
----=7-. W~7H_E_N_(.,-11_a_n_u·-=-) _H_A_D_A_N_I-LL_N_E_S_S_W- IT_H_A_C_O_U_G_H_, ---.-:Y--,-e_s ____ .-.. -.. --. _-__ -_-_-__ -_ .-. _-_. -_ .. -. _-__ -_ .-.. _-_ .-.. -. _-_ .-.. -.. -... -.. -.. -.. -.. . -.. -.. -1--,------~
DID HE/SHE BREATHE FASTER THAN USUAL No .. ... .... ... ..... ... ... .... ...... .......... .. .. .. ..... .......... 2 2c:>Q.11 ! WITH SHORT, QUICK BREATHS OR HAVE j
DIFFICULTY BREATHING? OK .... .... .. ....... .. ...... .. ........ ....... . . .... ...... 9 9c:> Q 11
IJ--:;;:-:--:;-;------ ----------:--- --t-:::-:--:---;---------------:--t--:-·---·--8. WERE THE SYMPTOMS DUE TO A PROBLEM IN Blocked nose ........................ .. ... ......... 1 1 c:> Q 11
THE CHEST OR A BLOCKED NOSE? Problem in chest.. ..... . . . . . . . . .. . . .... 2 Both.. ..... .......... .. ... . . ....... .. ..... .. .. .... 3
Other (specifj·) 8 8c:> Q 11 OK ....... ... ... ... ...... .......... .. .... .. .. .. ... ............. 9
~-=------------------~~-----------------t-------9. DID YOU SEEK ADVICE OR TREATMENT FOR THE Yes .. .. .. ....... .. .... ... .. ..... ...... .... .. .. .. .. .... ..... ...... 1 ILLNESS OUTSIDE THE HOME? No ....... .. .. ......... ...... ......... .. ..... .. .. .. .... .. ... ... .... 2
10. FROM WHERE DID YOU SEEK CARE?
ANYWHERE ELSE?
Circle all providers mentioned, but do NOT prompt with any suggestions.
Ask this question (Q./1) on(v once for each caretaker.
11. SOMETIMES CHILDREN HAVE SEVERE ILLNESSES AND SHOULD BE TAKEN IMMEDIATELY TO A HEALTH FACILITY. WHAT TYPES OF SYMPTOMS WOULD CAUSE YOU TO TAKE YOUR CHILD TO A HEALTH FACILITY RIGHT AWAY?
Keep asking for more signs or symptoms until the caretaker cannot recall any additional symptoms. Circle all symptoms mentioned, but do NOT prompt with any suggestions.
GO TO NEXT MODULE c:>
OK .... .......... .. ....... .... .. ....... ........................... 9
Hospital .. ... .. .. ......... .. .......... .. .... .. ......... .. .... 01 Health centre .. ... .. .. .. ... ....... .. ........ .............. 02 Dispensary ................................................ 03 Village health worker... ...... .. .... .................. 04 MCH clinic .. .............. ............ .. ................... 05 Mobile/outreach clinic .. .......... ............... .. .. 06 Private physician ....................................... 07 Traditional healer ............. .. ........ ..... .... .. .... 08 Pharmacy or drug seller ............................ 09 Relative or friend ....................................... 1 0
Other (specify) --------- 11
Child not able to drink or breastfeed ........ ..... .................. .. ... .. .. . 01
Child becomes sicker .............. ... ............... 02 Child develops a fever ................. .. ........... 03 Child has fast breathing ............................ 04 Child has difficult breathing ................. ... ... 05 Child has blood in stool. ............................ 06 Child is drinking poorly ...... ................... ... .. 07
Other (specify) --------- 08
Other (specify) --------- 09
Other (specify)--------- 10
51
2c:> Q 11
9c:>Q 11
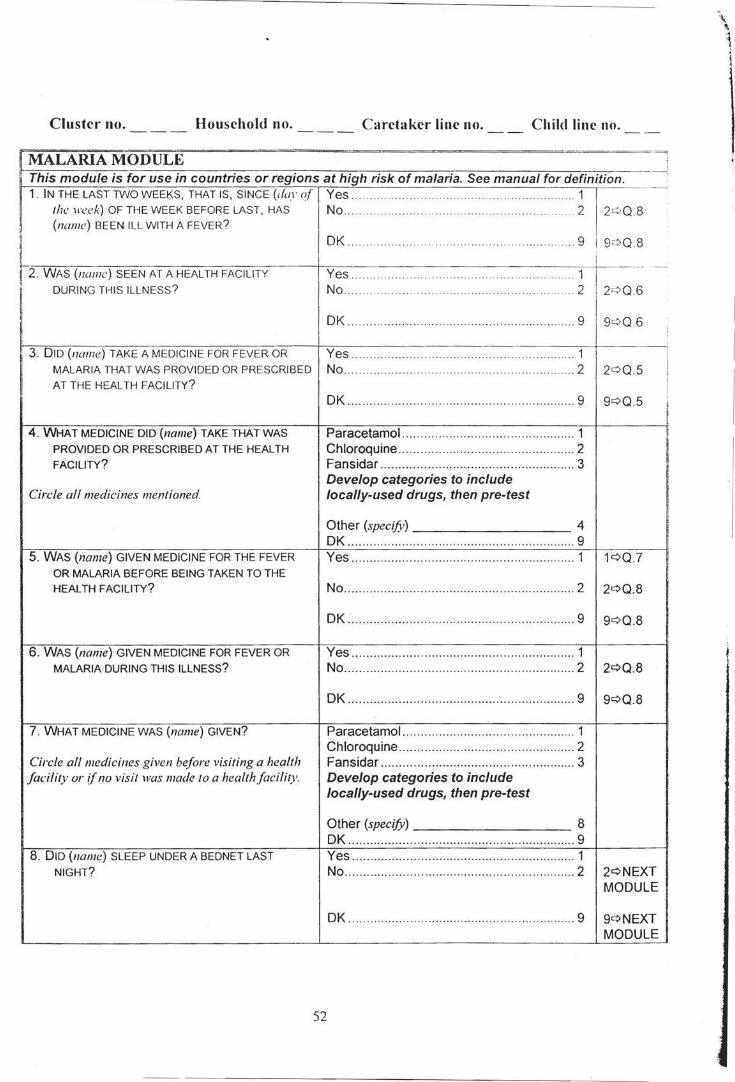
Cluster no. Household no. Caretaker line no. Child line no.
I MALARIA MODULE ! This module is for use in countries or regions at high risk of malaria. See manual for definition. -- ---: 1. IN THE LAST TWO WEEKS , THAT IS, SINCE (day of Yes .......... 1 - -- ~
the 11-cc:k) OF THE WEEK BEFORE LAST, HAS No... .. .. .. .. . .... ... 2 2C:,Q 8
I
~ I!
(name) BEEN ILL WITH A FEVER?
r2 WAS (name) SEEN AT A HEALTH FACILITY
I DURING THIS ILLNESS?
3. DID (name) TAKE A MEDICINE FOR FEVER OR
MALARIA THAT WAS PROVIDED OR PRESCRIBED
AT THE HEALTH FACILITY?
4. WHAT MEDICINE DID (name) TAKE THAT WAS
PROVIDED OR PRESCRIBED AT THE HEALTH
FACILITY?
Circle all medicines mentioned.
5. WAS (name) GIVEN MEDICINE FOR THE FEVER
OR MALARIA BEFORE BEING TAKEN TO THE
HEALTH FACILITY?
6. WAS (name) GIVEN MEDICINE FOR FEVER OR
MALARIA DURING THIS ILLNESS?
7. WHAT MEDICINE WAS (name) GIVEN?
Circle all medicines given before visiting a health facility or (f no visit was made to a health .facility.
8. DID (name) SLEEP UNDER A BEDNET LAST
NIGHT?
OK
Yes .. No ...... .... ........ ... .
OK . ... ...... .... .... ....... .
.9
1 2
. ... 9
Yes ..... ... ..... .. .. ..... ..... .... .... ...... ..... .. .. 1 No ................ .. .... ... .... .. ......... .... ........ ..... .. ... . 2
OK .......... .. ....... .... ... ..... ................................ 9
Paracetamol ...... .. .................. .......... ........ .... 1 Chloroquine ................. ............. .... .. ............. 2 Fansidar ............................ ........... ............... 3 Develop categories to include locally-used drugs, then pre-test
Other (specify) 4 DK ..................... .. ... .. .................... .... ........... 9 Yes ... ..... .. ... ....... .. ............. ... ... ... .. .. .............. 1 1qQ_7
52
No .... ..... .......... .... ........ ..... ...................... .. .... 2 2QQ.8
OK ... ....... .. .......... ...... .. .. ... ............ .. .. ............ 9 gqQ.8
Yes .... ....... .. ........... ........ ........... ..... ....... ....... 1 No ................................................................ 2 2QQ.8
OK .... ... ............ .. ............. .... .......... .. ...... ....... 9 9qQ.8
Paracetamol ... ..... ...... ...... ............. ... ...... .. .... 1 Chloroquine ................. ....... ... ................. ..... 2 Fansidar .. .. ..... ........ .. ..... ........ .. ..... .... .... ....... 3 Develop categories to include locally-used drugs, then pre-test
Other (specify) 8 OK ... ... ................................................ .. ... .... 9 Yes .............. .. ........ ..... ... .............................. 1 No .... ... ..... ... ..... .. ... ... ...... ... ..... .. ...... ... ..... .. .... 2 2qNEXT
MODULE
OK .... ........................ ......... .. .. ......... ...... .. .... 9 9qNEXT MODULE
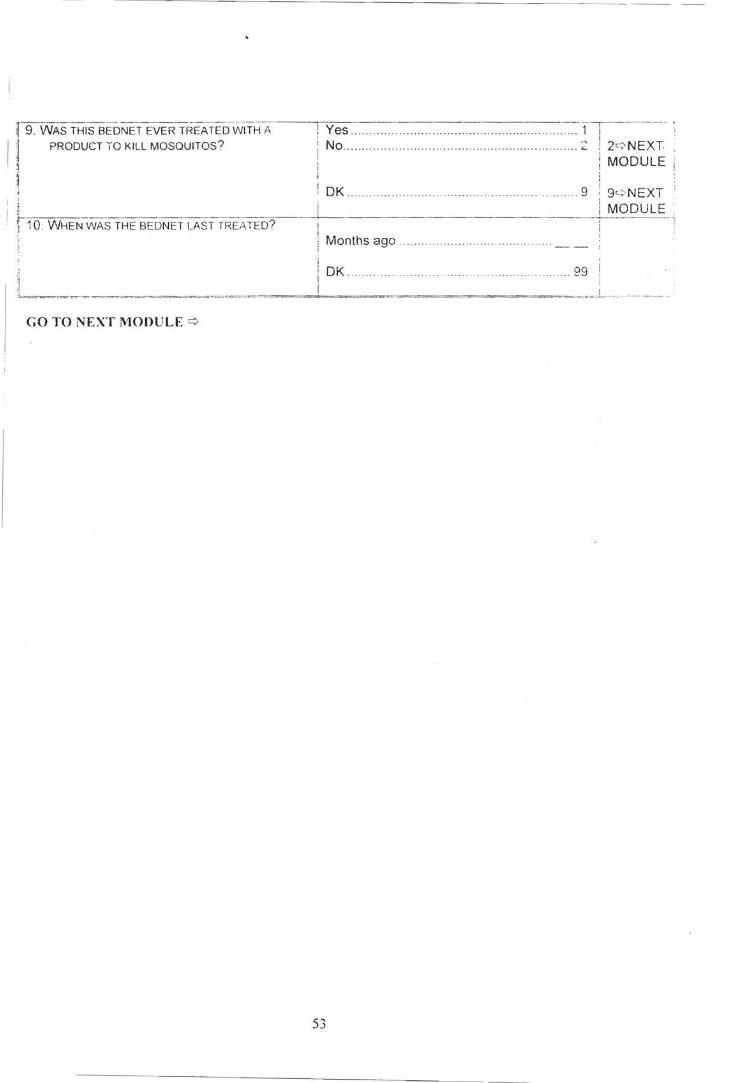
r 9. wA.s THISBEDNET EVER TREATED WITH ,\
I ~ PRODUCT TO KILL MOSQUITOS?
- -----,--- ----- . Yes ............... ...... ... ... .. .... .......... ..... .. . ... 1 1
No ....... .. ... ... ... .... .... ....... ..... .... ... ................ .. :: l 2 r:-->NEXT. MODULE
ji
I! -i OK .......... . .9 9L> NEXT
I ~! MODULE . r ·-:-'1 ::-0-:-\!1-:-:1:-HE-N WAS THE BEDNET LAST TREATED?
Months ago
OK. 99
_ . .,._,,._L ... . .. .
GO TO NEXT MODULE c:>
53
------ ------- - -----

Cluster no. Household no. Carctakc•·linc no. Child lim· no.
~ IMMUNIZA T~ON MODULE : --------------~--------- _----~-:--- ~---- ~--- _____ _____ -~~~-~--][ j 1! an ill11111111i:alion card is Ul'(ti!ahle. copy the dates in l)s.:-5/ill- euch npe o(immiiiJi:u/iul : -,-.·llr.t,\1 ·Ill the ,·,1/'(f
· IJs. --15 ure/ill' n:conliug ,-uccinalions thul ure not recorded <ill/he ,·urd fJs. --15 ,,-i/i ouit /;, · _;,;..,,/Hill'// u ,·,;r.l is IIIJ/ li\'W'Ioble OR ill cases \l'hen u curd is w·uiluhle iltlf /h,• child H'l/.1' ,i/so gil·<'ll ,-uccinution' '' ;,,c-iJ 11·, · rc• no/ r,·,-,,r,!,-,; un !he curd
:r ~. IS THERE A VACCINATION RECORD FOR· ·r,;;;-;;~c)'?i"Yes~ . ~: :· ~:: .. ~~-:-.. -__ - _-_ - __ - --~- 1 i
No .2 2<-0.7
OK 9 9 ::::> 0.7
'--;c;--- - - ---- --- ------- -------- - -- - --- ------- - ------ -- ··-------- ------ ----- ------ ------- ------- --------- - 1----- ----- - -- -Copy datn of'u/1 \'uccinutions_fi·Oinlhe curd: ' Date of Immunization i
I DAY MONTH YEAR ---i
i·
I I I I I I '
2. BCG BCG I ! ' I• ' i' ; ! I ' I I
i I 3A. OPVO OPVO ' i 'I I
I
3B. OPV1 OPV1 !
3c. OPV2 OPV2
3D. OPV3 OPV3
4A. OPT1 DPT1 I
4B. OPT2 OPT2
4c. OPT3 DPT3
5. MEASLES MEASLES
6. IN ADDITION TO THE DOSES SHOWN ON THIS CARD, DID (name) RECEIVE ANY OTHER Yes .............................................................. 1 1<=>0.8 VACCINATIONS- INCLUDING VACCINATIONS RECEIVED IN A NATIONAL IMMUNIZATION DAY? No ..................................... ...... ................. ... . 2 2<=>0.16
This question and Qs. 7-15 refer only to doses not OK _______ .... ............. .. .... .. ................. .......... 7 ... 9 9<=>0.16 already recorded on the card
7. I WILL NOW ASK YOU SOME QUESTIONS ABOUT ANY VACCINATIONS (name) RECEIVED TO
PREVENT HIM/HER FROM GETTING DISEASES,
INCLUDING VACCINATIONS RECEIVED IN A NATIONAL IMMUNIZATION DAY CAMPAIGN.
8. HAS (name) EVER BEEN GIVEN A BCG Yes .... ... .. ------·-------·····---- -- -· -----·· --·--··--- --------- 1 VACCINATION AGAINST TUBERCULOSIS- THAT No ................................................................ 2 IS, AN INJECTION IN THE LEFT SHOULDER THAT
CAUSED A SCAR? DK .. ... ........ ... ....... ... .................................. ... 9
9. Check leji shoulder (most common site) for BCG Scar present... .... ...... ..... .... .. .... ....... ........ ... .. 1 scar. Scar absent.. ............................................... 2
Unable to examine/cannot tell ................... 9
54
' I i I I
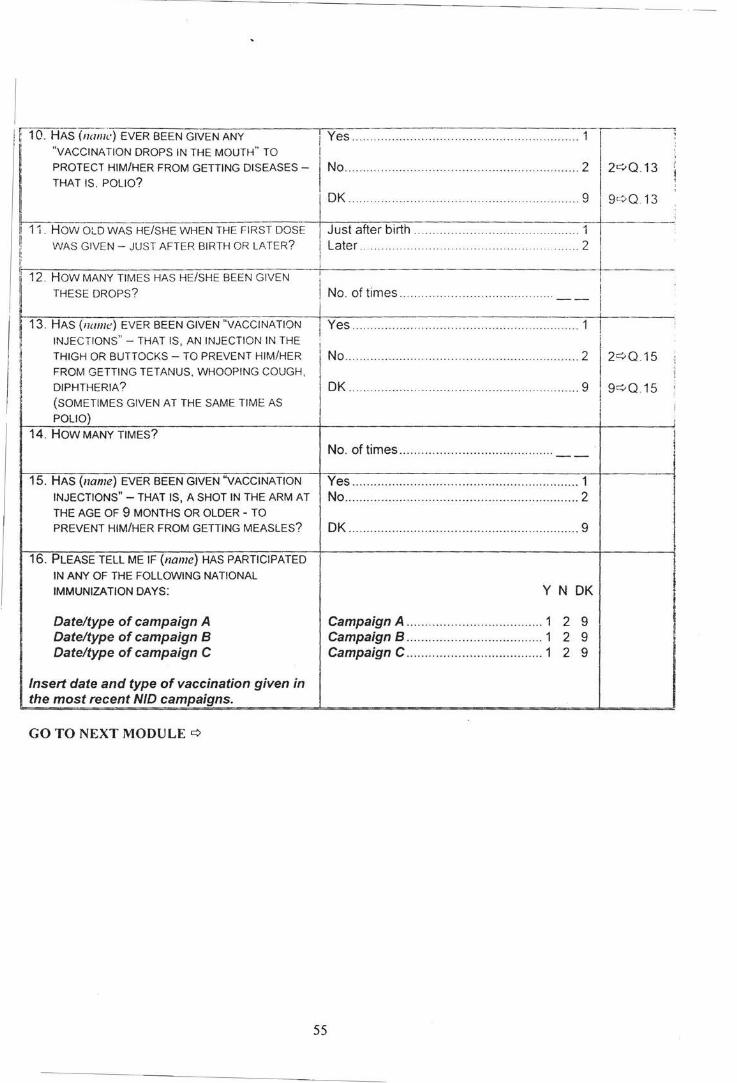
------------~-------------------------- --
no:HAS (na7;1~·) EVER BEEN GIVEN ANY
"VACCINATION DROPS IN THE MOUTH" TO
PROTECT HIM/HER FROM GETTING DISEASES -
THAT IS. POLIO?
I Yes ............................... . ....... .. .. .. .. .. ....... 1
No ...... ........ .. ..... .. .. ........ . ..... . ...... . .... .. ........... 2
I OK ............................. ....... .... .. ... ....... ... .. . 9
2c:.>Q 13
9c.:> Q 13
11 . How OLD WAS HE/SHE WHEN THE FIRST DOSE I Just after birth . ..... . . .. ................ .. ... 1 j
~~~~W-A_S_G_l_V_EN __ -_J_u_s_T_A_F_T_E~R~B-IR~T~H~O~R~LA~T~E~R~?---T,!-l-a-te_r_._· ________ .. _ . . _ .. _ .. _ .. . _ .. _ .. _ . . _ .. _ .. _ .. _ ... _ .. _ .. _ .. _ .. _ ... _._ .. _2_1' ------12. HOW MANY TIMES HAS HE/SHE BEEN GIVEN +-
THESE DROPS? I No. of times . . . .. ... . .. .. . . . . . .. . .. . .. . . .. . . . . . . . . . .. I
I ~i 13. HAS (name:) EVER BEEN GIVEN "VACCINATION
INJECTIONS"- THAT IS, AN INJECTION IN THE
TH GH OR BUTTOCKS TO PREVENT HIM/HER ' I -I
FROM GETTING TETANUS, WHOOPING COUGH, ·I ~ DIPHTHERIA? ~ (SOMETIMES GIVEN AT THE SAME TIME AS
POLIO)
14. HOW MANY TIMES?
15. HAS (name) EVER BEEN GIVEN "VACCINATION
INJECTIONS"- THAT IS, A SHOT IN THE ARM AT
THE AGE OF 9 MONTHS OR OLDER - TO
PREVENT HIM/HER FROM GETTING MEASLES?
16. PLEASE TELL ME IF (name) HAS PARTICIPATED
IN ANY OF THE FOLLOWING NATIONAL
IMMUNIZATION DAYS:
Date/type of campaign A Date/type of campaign B Date/type of campaign C
Insert date and type of vaccination given in the most recent NID campaigns.
GO TO NEXT MODULE¢
1 Yes ..... ..... . ...... ..... . . .. .. .. .. ................... ..... . 1
i ' N 0 ..................... . .. .... .. ......................... . . .......
OK .................... ...... .. ... ... .. ... ...... ... .. ..... ...... 9
No. of times .. .. ..... .. .. . .. . .. ... . ..... . ....... ...... --
Yes ....... .............. ......... .... ............... ............. 1 No ......... ......... ...... ................ .... .. . ................. 2
OK ........................ ............................. ..... ... .. 9
y N OK
Campaign A ................... .. ................ 1 2 9 Campaign B ..................................... 1 2 9 Campaign C ..................................... 1 2 9
55
I I I
""' l l
9¢Q 15 i ;
l '
i
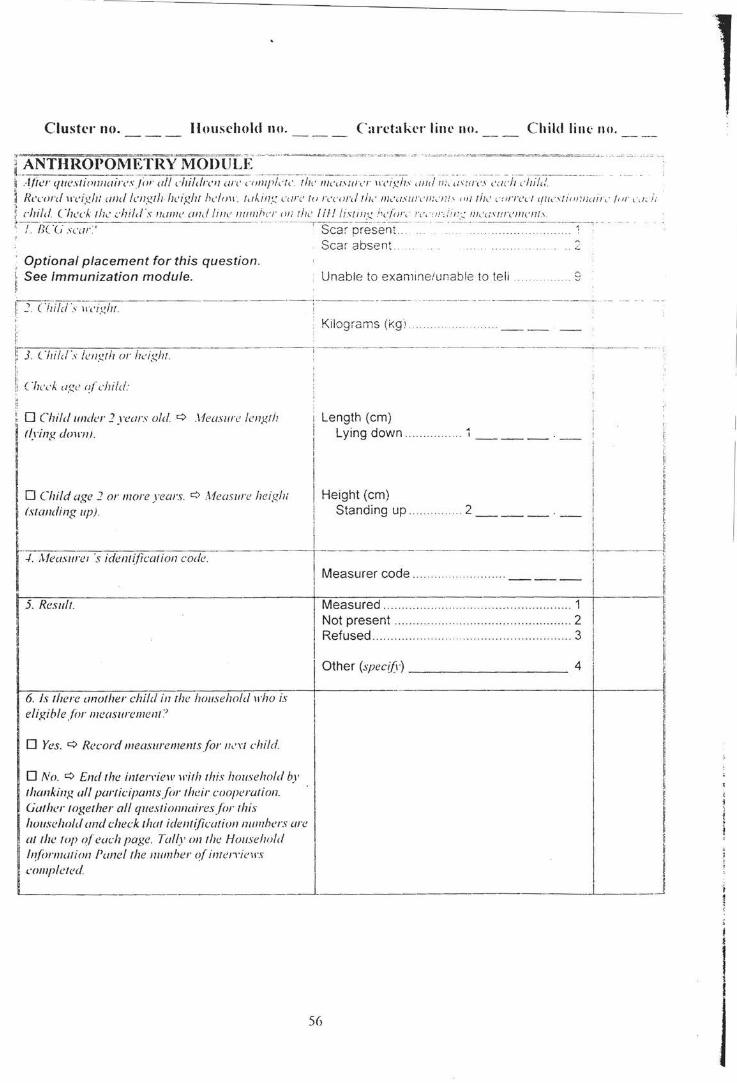
Clush.'r no. Household no. Caretaker line no. Child line no.
[~NT~R~P~!~!!~f~o~~~J~E,· ~ =·- ==~==~~~~~-~ ~~--~-~-= -~-- -~· ·-··=~··-·~ ··=~ · ........ ~-~~=-~- ~-~-~-~- · ·· p .·llicr cfiiL'stionnairesJi,- ull d1ildrc11 on· ,."lllf'l,·t,· the llh'<l'ilrc·r "·eigh' und n;, ,:,urcs ,·,wh ,·hilt/. ~ Record 11·eigh: unci length height hl'ln1\ ·. tuhin:.; ,·<Ire tu r,·cord tih' /Jh'USIII'c'IJ:."Iif .' '"' tiJ,· ,·ui'I'Cc/ <fllc'.\'fiunnuir,· /or ,·, 1,.;,. :. :: child Check the child's 11<//lle and line 11111/lhcr on t/,,. Ill! lisunc: hdiw, · r,•, " n i! n:.: !!h '<ISI!!'('IIIC/11' . ~~7~/](""(; scar' ·- ·-- · - · -- ---·-scar -p~sent- . - . --· · - ·--·---- ------ -1-o·
Optional placement for this question. See Immunization module.
Scar absent . .::
Unable to examine/unable to teli . . . 9
I! J. c·hjfd's ~~-::igh1. --------~-------------~---- ~ -----·-- -~---
I !: ·-:3:--. -(-:-:.,,..,, i71 ,-:/,.-,s-l,....e-n_g_t l-:-7-o_r_l:--h-' i-g-:-h-1.---
i I; 1! C 'heck ugc o(child:
0 Child under 2 years old 9 ,\feasure length flying dmm) .
0 Child age 2 or more )·ears. 9 Measure heigh; (standing up).
r./ Mea., am ·_, idem;jiwNoa code
5. Result.
I
6. Is there another child in the household 1rho is eligible .frw measurement:'
0 Yes. 9 Record measurememsfor lh'Yl child.
0 No. 9 End the inteiTiew with this household by thanking all partictjJallls{or their cooperation. Gather together all queslionnairesfor !his house/wid and check that ident(ficatiol1111111lhers are at I he I op of each page. Tally on the Household ln/(ml/ation f'aneflhe numher ofimerrinrs completed.
Kilograms (kg·!
Length (em) Lying down.
Height (em) Standing up.
Measurer code ...
Measured ..... ........ . ..
Not present ............. .
.... 2 ___ -
.. ................................ 1 ....... ........ ... ....... .. ...... 2
Refused .. .. ..... ............ .................................. 3
Other (specifl') 4
-
I
56
I I I i i I :i +-----J . '· I ::
il
il ,I li
! ~ !: i ~ !
I I
i I i
•I iJ
i I I I !
! I I!
I .I
I!
I! !i Ji
~ J
;
I I
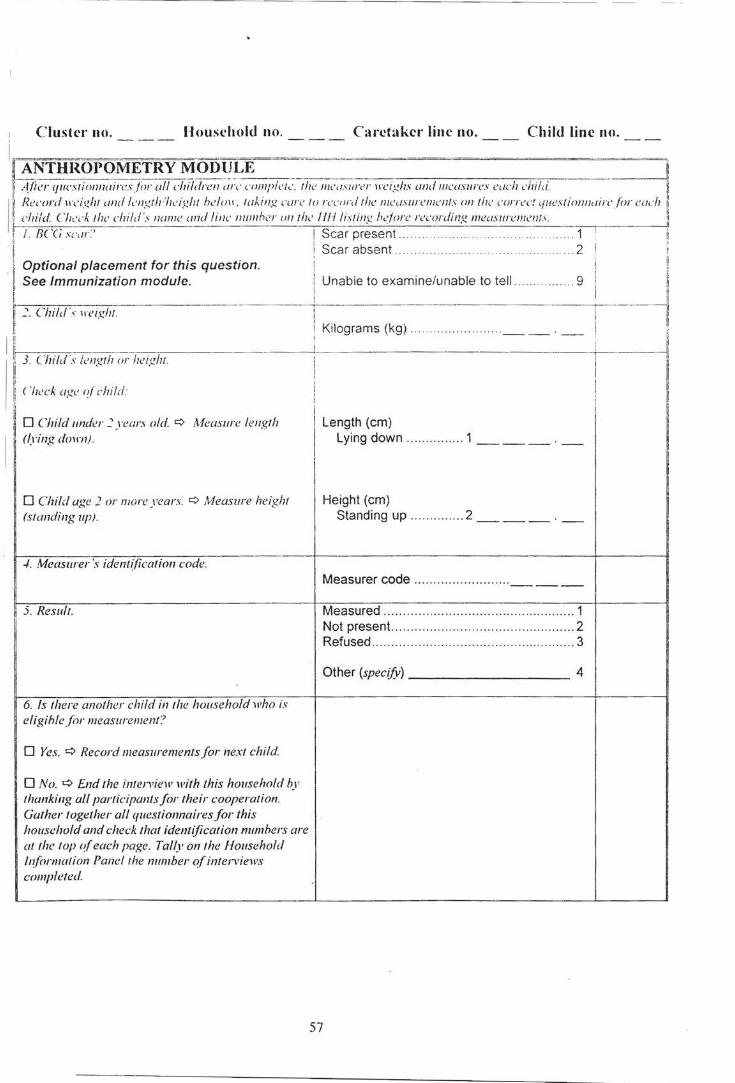
---- --- - - --- --- --- ----- --- - --
, Cluster no. ___ Housdwld no. ___ Caretaker line no. Child line no.
i r~~~~,~~.~~~~~ ~;~~~~,W,"""C~JU;;;:;,""'' ' "''·'"' """ "'""·""''·' '"'" '""" . . . --.--l! I
~ Record ll'c'I.dlf und length·flc·Ight h!!lo11 . taklllg care to rn·n-rd rhe measurements 011 the correc! <fli <!SIJOIIII<IIrcjor eod1 1!.
I: child._ ~·h,·,·k;he chif,!'s name and line numhcr nn the II/I listing h.:forc recording mcusurenlcllls. 1
___j I /. IJ( (, sc,/r. I Scar present... ..... . . . . .. . . . . . . . . . . . ..... ...... 1 : ll I , i:
I< Scar absent . .. . . .. .. . .. .. . . . .. ... 2 1
, ~ Optional placement for this question. ~ [! See Immunization module. Unabie to examine/unable to tell .... .. .... 9 J1
i: ~ ~~ I! ~- Child·\. 11 eigllt ! li
I i; Kilograms (kg) .. . . ... .... . __ . _
1 :~~~~-~~---~~--------~ 11 J. Child ·s ic!ngth or height.
l' !i·. ('heck age of child· F ,I i
~ 0 Child under~ years old. q Measure length I Length (em) I
(lying dmm). I
Lying down ............... 1 ___ . --I I
I
0 Child age 2 or more years. q Measure height Height (em) I
(slanding up) . Standing up .... .......... 2 ___ . _
./. Measurer's identification code. Measurer code .. ... ........ .. ....... ...
I ------5. Result. Measured .... ... ..... .. .. ...... .. .......................... 1
Not present. ............................................... 2 Refused ..................................................... 3
Other (specify) 4
6. Is !here another child in the household who is eligihlefor measurement?
0 Yes. q Record measuremenJsfor next child.
0 No. 9 End the inten,iew with this household hy thanking all participants for their cooperation. Gather together all questionnaires for this household and check that identification numbers are at the top of each page. Tally on the Household l!?formation Pane/the number of interviews completed
57
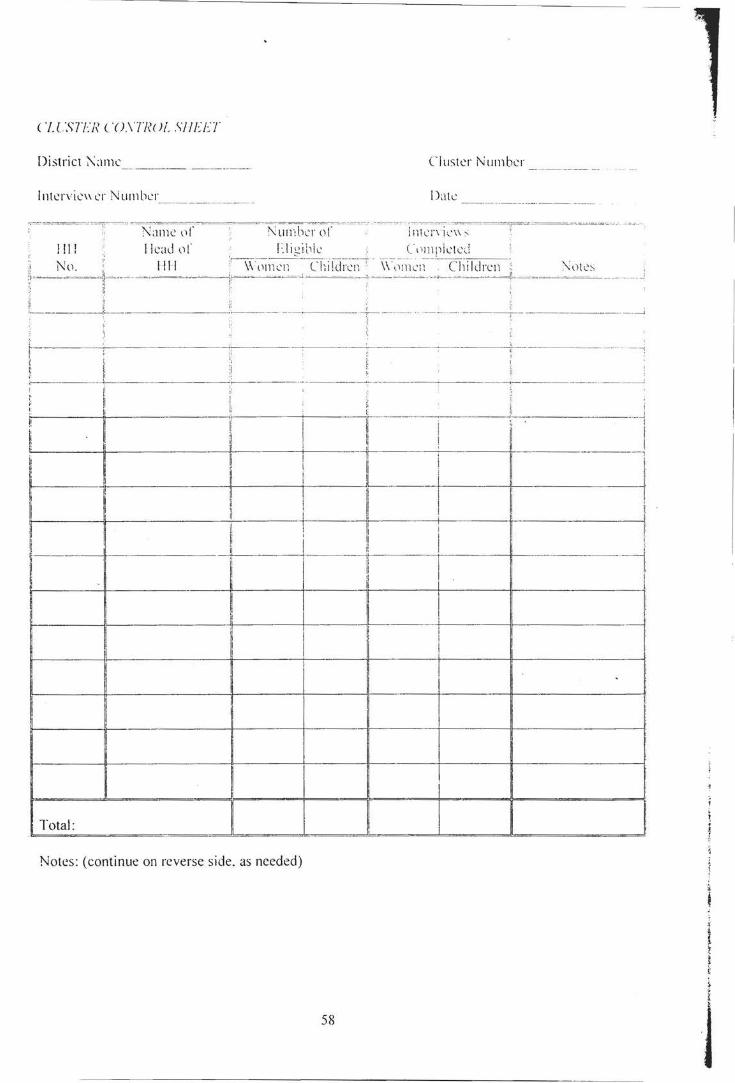
C I C".'i?FN ( '( J.\TW Jf_ .\II UJ
District ?\amc Cluster Number
lntervic'' cr Number Date
:="~~~~"-,.~" - NalllC (lr Number or -~~~" -~-,~~ i7l!~;-,~~~-~~~---;;--~=-~==-~ ~-
lll! !lead t)!' Elic:ibk (<llnpktcd 1 . ...... --- - -- -- -- - ----- --------- - --
Nll. • I Ill ,,-,~ -,~i1en --Chii(ii~c~;~ - \\ ·,lm cn Children :' :\,Hcs •• k :. -· - ... -- ..... .. :.. " ~-~~---~'~--- - --·,~-~ "~-'~-.. --~ ~!...---- "--·-··-· -~~- ' ::'·=~->-~~~-~~1-=--"- -"-~~-====-~-~~-r~------'-----~~.:...'---
L _______ J -------~------- ---------------~,-------- - - - · -- --- ----- - - ------,:- ------------~------<
'i
1-- ---,------- ---+----- ----,----- -- -- · I'
li . .______
I' il li i
----~i-----------------:- ·- -- --~~--------- ------
l! I
I. r _'----------- -~
1"----lt-------' ------1f--------+----1~ - ,
~ i! I l I ;:
n ij t' ~ ! ! ----~--~---_-l _____ -!f-----------;~!---- ---~~-------rl------t--- ~
I l I
~-------~---------"~----+----~r. _____ ,_ ____ ~~------------4'
Total:
~ II I
Notes: (continue on reverse side, as needed)
58
l t 1'
l
~
1
J
-----~---~----- -· -
LIST OF TABLES
APPENDIX D LIST OF TABLES
Table 1: Number of households and women, and response rates, Somalia, 1999 ............................ .. ...... .. ................. .... ..... 3 Table 2: Single year age distribution of household population by sex, Somalia, 1999 .......................... ..... ......... ................. 4 Table 3: Percentage of cases with missing information, Somalia, 1999 .......................................................... ....................... 5 Table 4: Percent distribution of households by background characteristics, Somalia, 1999 ............................................... 6 Table 5: Percent distribution of women 15~49 by background characteristics, Somalia, 1999 ........... ................................. 7 Table 6: Percent distribution of children under five by background characteristics, Somalia, 1999 ................................... 8 Table 7: Mean number of children ever born (CEB) and proportion dead by mother's age, Somalia, 1999 ........................ 9 Table 8: Infant and under-five mortality rates, Somalia, 1999 ............................................................................................... 10 Table 9: Percentage of children aged 36-59 months who are attending some form of organized early childhood education programme, Somalia, 1999 ..................................................................................................................................... 11 Table 10: Percentage of children of primary school age attending primary school, Somalia, 1999 ................................... 12 Table 11: Percentage of children entering first grade of primary school who eventually reach grade 5, Somalia, 1999. 13 Table 12: Percentage of the population aged 15 years and older that is literate, Somalia, 1999 .............................. .......... 14 Table 13: Percentage of the population with access to safe drinking water, Somalia, 1999 ............................................... 15 Table 14: Percentage of the population with access to sanitary means of excreta disposal, Somalia, 1999 .................... 16 Tabl.e 15: Percentage of under-five children who are severely or moderately undernourished, Somalia, 1999 ............. ... 17 Table 16: Percent of living children by breastfeeding status, Somalia, 1999 ................................... .... ................ ................ 18 Table 17: Percentage of households consuming adequately iodized salt, Somalia, 1999 ................................................. 19 Table 18: Percent distribution of children aged 6-59 months by whether they have received a high dose of Vitamin A supplement in the last 6 months, Somalia, 1999 .................................................................................................... ............... 20 Table 19: Percentage of women with a birth in the last 12 months by whether they received a high dose of Vitamin A supplement before the infant was 8 weeks old, Somalia, 1999 ................................................................. ............................ 21 Table 20: Percentage of live births in the last 12 months that weighed below 2500 grams at birth, Somalia, 1999 .......... 22 Table 21: Percentage of children age 12-23 months immunized against childhood diseases at any time before the survey and before the first birthday, Somalia, 1999 ............................................................................................................... 23 Table 22: Percentage of children age 12-23 months currently vaccinated against childhood diseases, Somalia, 1999 .. 24
. Table 23: Percentage of under-five children with diarrhea in the last two weeks and treatment with ORS and ORT, Somalia, 1999 ............................................................................................................................................................................ 25 Table 24: Percentage of under-five children with diarrhea in the last two weeks who took increased fluids and continued to feed during the episode, Somalia, 1999 ...................................................................................................... ..... . 26 Table 25: Percentage of under-five children with acute respiratory infection in the last two weeks and treatment by health providers, Somalia, 1999 ................................................................................................ ............. ........ ................... ...... 27
- -········· ·· ·' .. .... ,~-----.. --------------------- - ...
--- -------
Table 26: Percentage of children 0-59 months of age reported ill during the last two weeks who received increased fluids and continued-feeding, Somalia, 1999 .......................................................................................................................... 28 Table 27: Percentage of caretakers of children 0-59 months who know at least 2 signs for seeking care immediately, Somalia, 1999 ............................................................................................................................................................................ 29 Table 28: Percentage of children 0-59 months of age who slept under an insecticide-impregnated bednet during the previous night, Somalia, 1999 ................................................................................................................................................. 30 Table 29: Percentage of children 0-59 months of age who were ill with fever in the last two weeks who received anti-malaria drugs, Somalia, 1999 ................................................................................................................................................... 31 Table 30: Percentage of women aged 15-49 who know the main ways of preventing HIV/AIDS transmission, Somalia, 1999 ........................................................................................................................................................................................... 32 Table 30a: Percentage of women aged 15-19 who know the main ways of preventing HIV/AIDS transmission, Somalia, 1999 ........................................................................................................................................................................................... 33 Table 31: Percentage of women aged 15-49 who correctly identify misconceptions about HIV/AIDS, Somalia, 1999 ...... 34 Table 32: Percentage of women aged 15-49 who correctly identify means of HIV transmission from mother to child, Somalia, 1999 ............................................................................................................................................................................ 35 Table 33: Percentage of women aged 15-49 who express a discriminatory attitude toward people with HIV/AIOS, Somalia, 1999 .................................................................... · ........................................................................................................ 36 Table 34: Percentage of women aged 15-49 who have sufficient knowledge of HIV/AIOS transmission, Somalia, 1999 . 37 Table 35: Percentage of women aged 15-49 who know where to get an AIDS test and who have been tested, Somalia, 1999 .............. : ............................................................................................................................................................................ 38 Table 36: Percentage of married or in union women aged 15-49 who are using (or whose partner is using) a contraceptive method, Somalia, 1999 ..................................................................................................................................... 39 Table 37: Percentage of mothers with a birth in the last 12 months protected against neonatal tetanus, Somalia, 1999 40 Table 38: Percent distribution of women age 15-49 with a birth in the last year by type of personnel delivering antenatal care, Somalia, 1999 ................................................................................................................................................................... 41 Table 39: Percent distribution of women age 15-49 with a birth in the last year by type of personnel assisting at delivery, Somalia, 1999 ............................................................................................................................................................ 42 Table 40: Percent distribution of childr~n aged 0-59 months by whether birth is registered and reasons for non-registration, Somalia, 1999 ...................................................................................................................................................... 43 Table 41: Percentage of children 0-14_years of age in households not living with a biological parent, Somalia, 1999 .... 44 Table 42: Percentage of children 5-14 years of age who are currently working, Somalia, 1999 ......................................... 45
2
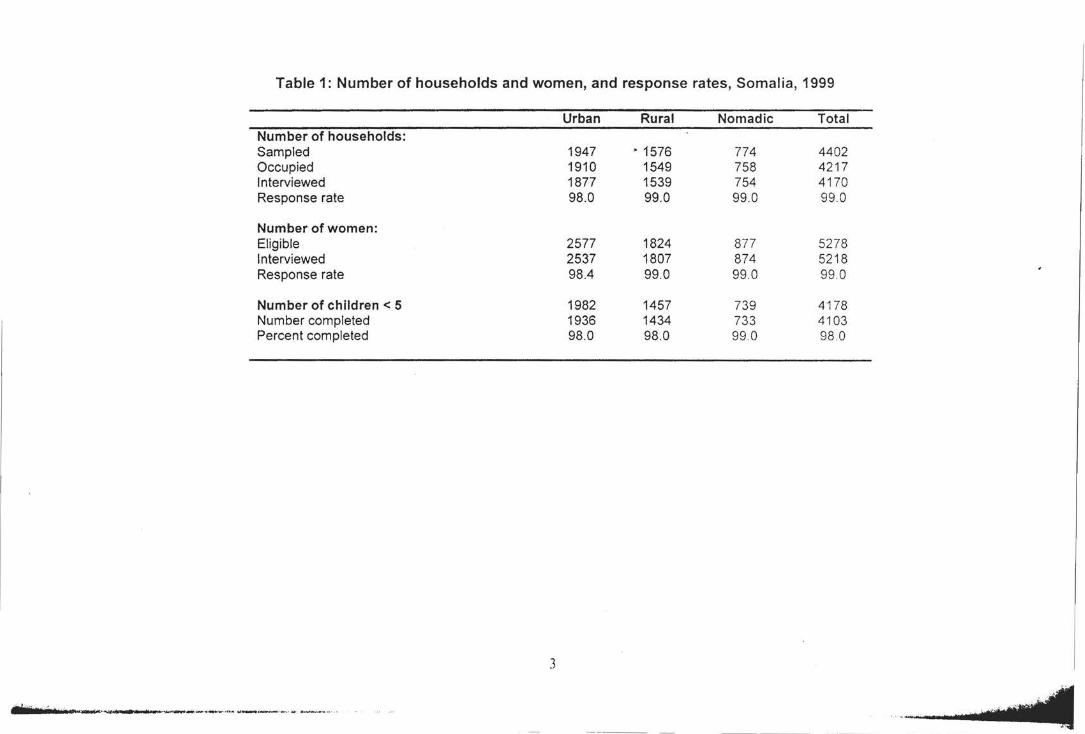
Table 1: Number of households and women, and response rates, Somalia, 1999
Urban Rural Nomadic Total Number of households: Sampled 1947 • 1576 774 4402 Occupied 1910 1549 758 4217 Interviewed 1877 1539 754 4170 Response rate 98.0 99.0 99.0 99.0
Number of women: Eligible 2577 1824 877 5278 Interviewed 2537 1807 874 5218 Response rate 98.4 99.0 99.0 99 .0
Number of children < 5 1982 1457 739 4178 Number completed 1936 1434 733 4103 Percent completed 98.0 98.0 99.0 98 .0
3
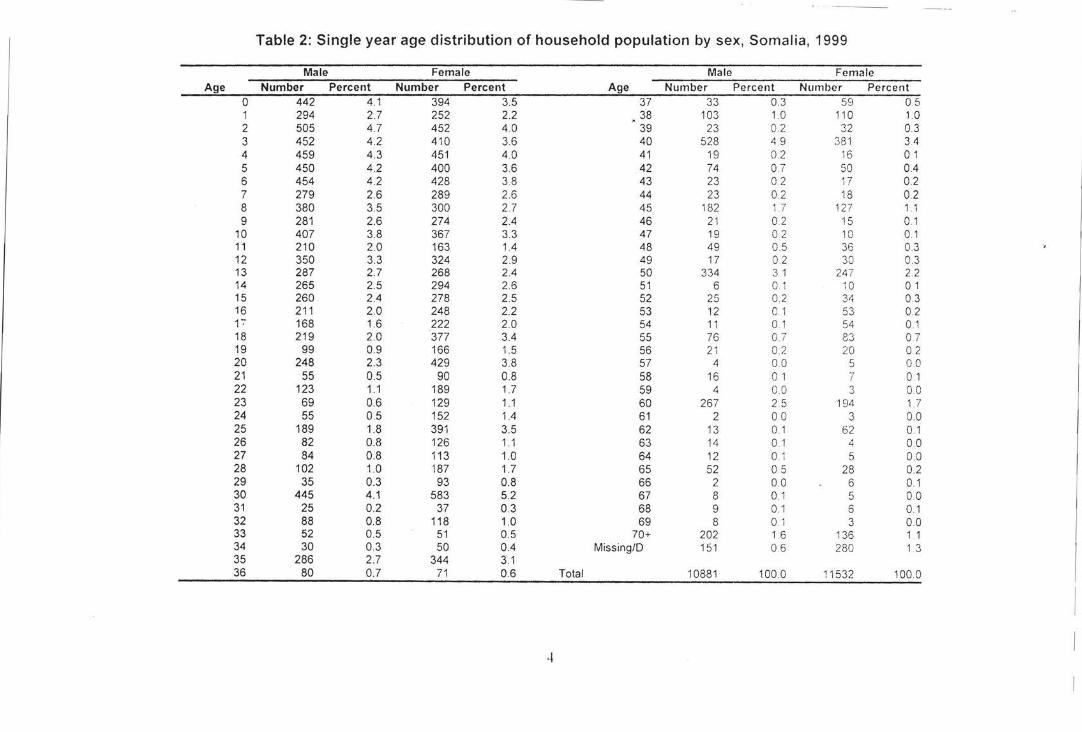
-----
Table 2: Single year age distribution of household population by sex, Somalia, 1999
Male Female Male Female Age Number Percent Number Percent Age Number Percent Number Percent
0 442 4.1 394 3.5 37 33 0.3 59 0.5 1 294 2.7 252 2.2 38 103 1.0 110 1.0 2 505 4.7 452 4.0 39 23 0.2 32 0.3 3 452 4.2 410 3.6 40 528 4.9 381 3.4 4 459 4.3 451 4.0 41 19 0.2 16 0.1 5 450 4.2 400 3.6 42 74 0.7 50 0.4 6 454 4.2 428 3.8 43 23 0.2 17 02 7 279 2.6 289 2.6 44 23 0. 2 18 0.2 8 380 3.5 300 2.7 45 182 1.7 127 1.1 9 281 2.6 274 2.4 46 21 0.2 15 0.1
10 407 3.8 367 3.3 47 19 0 2 10 0.1 11 210 2.0 163 1.4 48 49 0.5 36 0.3 12 350 3.3 324 2.9 49 17 0 2 30 0.3 13 287 2.7 268 2.4 50 334 3 1 247 2.2 14 265 2.5 294 2.6 51 6 0.1 10 0 1 15 260 2.4 278 2.5 52 25 0.2 34 0.3 16 211 2.0 248 2.2 53 12 0.1 53 0.2 F 168 1.6 222 2.0 54 11 0. 1 54 0.1 18 219 2.0 377 3.4 55 76 0. 7 83 0.7 19 99 0.9 166 1.5 56 21 02 20 0.2 20 248 2.3 429 3.8 57 4 00 5 00 21 55 0.5 90 0.8 58 16 0 1 7 0.1 22 123 1.1 189 1.7 59 4 0 0 3 00 23 69 0.6 129 1.1 60 267 2.5 194 1.7 24 55 0.5 152 1.4 61 2 00 3 0. 0 25 189 1.8 391 3.5 62 13 0.1 62 0.1 26 82 0.8 126 1 .1 63 14 0.1 4 00 27 84 0.8 113 1.0 64 12 0.1 5 0.0 28 102 1.0 187 1.7 65 52 0.5 28 0.2 29 35 0.3 93 0.8 66 2 00 6 0.1 30 445 4.1 583 5.2 67 8 0.1 5 00 31 25 0.2 37 0.3 68 9 0.1 6 0.1 32 88 0.8 118 1.0 69 8 0.1 3 0.0 33 52 0.5 51 0.5 70+ 202 1.6 136 1 1 34 30 0.3 50 0.4 Missing/D 151 0.6 280 1.3 35 286 2.7 344 3.1 36 80 0.7 71 0.6 Total 10881 100.0 11532 1000
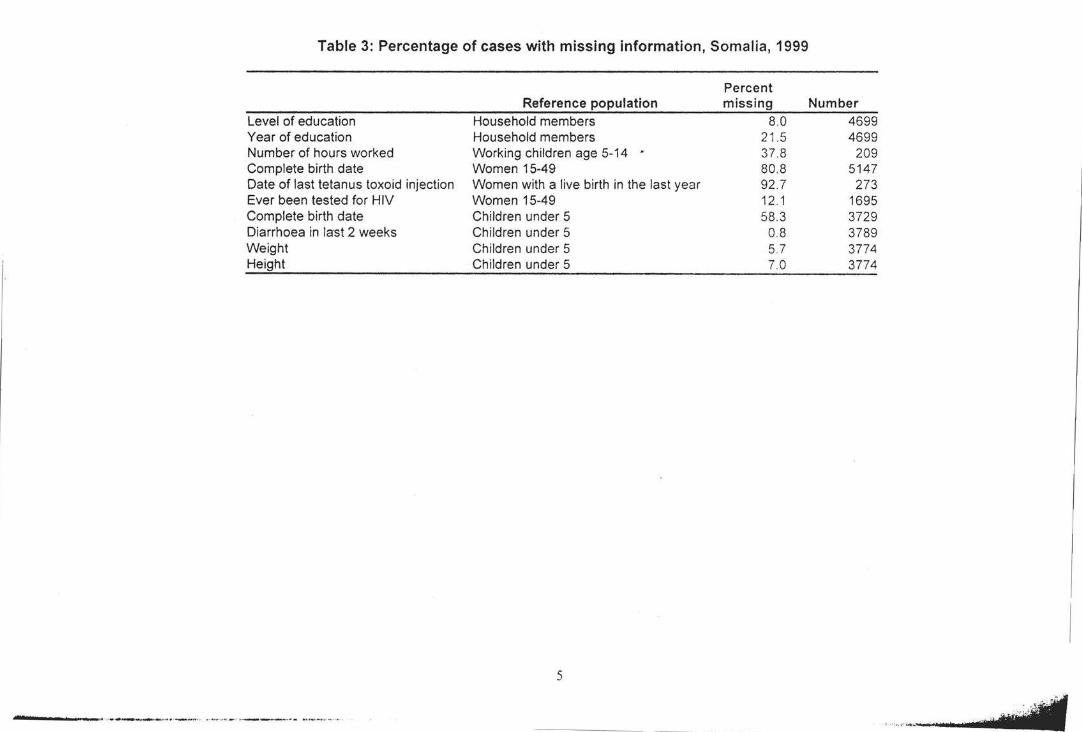
Table 3: Percentage of cases with missing information, Somalia, 1999
Level of education Year of education Number of hours worked Complete birth date Date of last tetanus toxoid injection Ever been tested for HIV Complete birth date Diarrhoea in last 2 weeks Weight Height
-----• • -, ................... - .... .. . _ .......... , •• , ....... _ , • • ____ ft .. ........ , _ ,. _ _ •••• ••
Reference population Household members Household members Working children age 5-14 • Women 15-49 Women with a live birth in the last year Women 15-49 Children under 5 Children under 5 Children under 5 Children under 5
5
Percent missing
8.0 21.5 37 .8 80.8 92 .7 12 .1 58.3
0.8 5.7 7.0
Number 4699 4699
209 5147
273 1695 3729 3789 3774 3774
,.,,•.oicl(
~~~--------------
-· ···> ..
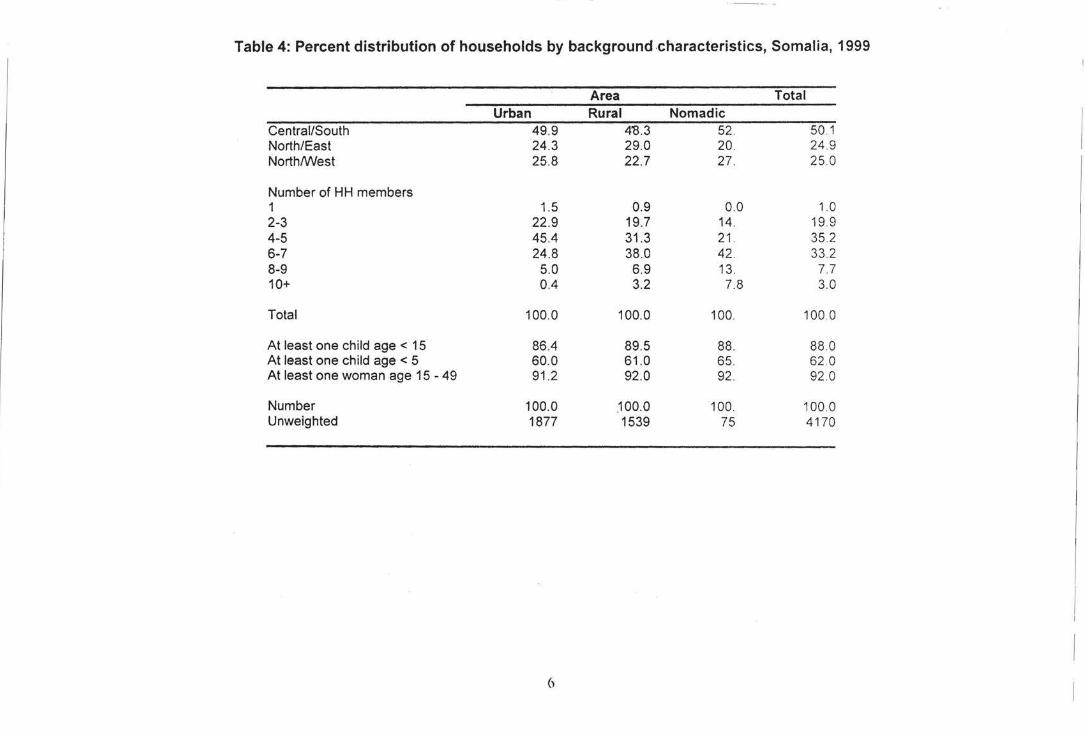
Table 4: Percent distribution of households by background .characteristics, Somalia, 1999
Area Total Urban Rural Nomadic
Central/South 49.9 4'8 .3 52. 50.1 North/East 24.3 29.0 20. 24 .9 North/West 25.8 22.7 27. 25.0
Number of HH members 1 1.5 0.9 0.0 1.0 2-3 22.9 19.7 14. 19.9 4-5 45.4 31.3 21. 35.2 6-7 24.8 38.0 42. 33.2 8-9 5.0 6.9 13. 7.7 10+ 0.4 3.2 7.8 3.0
Total 100.0 100.0 100. 100.0
At least one child age < 15 86.4 89.5 88. 88.0 At least one child age < 5 60.0 61.0 65. 62 .0 At least one woman age 15 - 49 91 .2 92.0 92. 92 .0
Number 100.0 .100.0 100. 100.0 Unweighted 1877 1539 75 4170
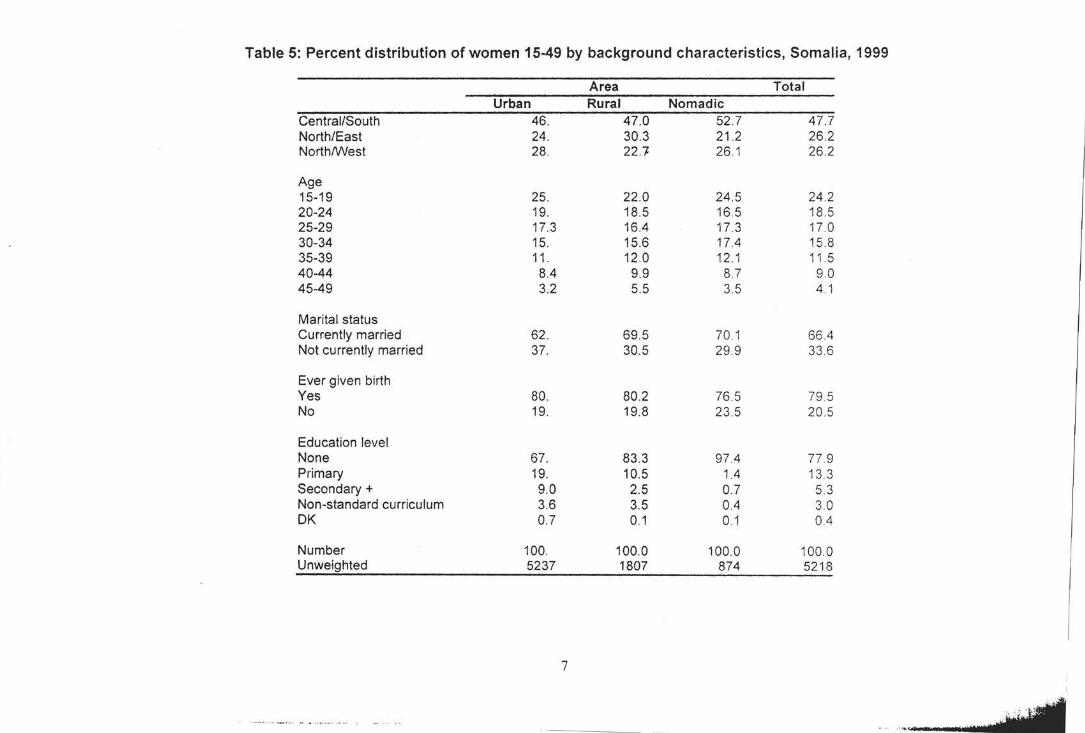
Table 5: Percent distribution of women 15-49 by background characteristics, Somalia, 1999
Area Total Urban Rural Nomadic
Central/South 46. 47.0 52.7 47.7 North/East 24. 30.3 21 .2 26.2 North/West 28. 22.'7 26 .1 26 .2
Age 15-19 25. 22.0 24.5 24 .2 20-24 19. 18.5 16.5 18.5 25-29 17.3 16.4 17.3 17 .0 30-34 15. 15.6 17.4 15.8 35-39 11 . 12.0 12.1 11 .5 40-44 8.4 9.9 8.7 9.0 45-49 3.2 5.5 3.5 4.1
Marital status Currently married 62 . 69.5 70.1 66.4 Not currently married 37. 30.5 29.9 33 .6
Ever given birth Yes 80. 80.2 76.5 79 5 No 19. 19.8 23 .5 20 .5
Education level None 67. 83.3 97.4 77.9 Primary 19. 10.5 1.4 13.3 Secondary+ 9.0 2.5 0.7 5.3 Non-standard curriculum 3.6 3.5 0.4 3.0 OK 0.7 0.1 0.1 0.4
Number 100. 100.0 100.0 100.0 Unweighted 5237 1807 874 5218
7
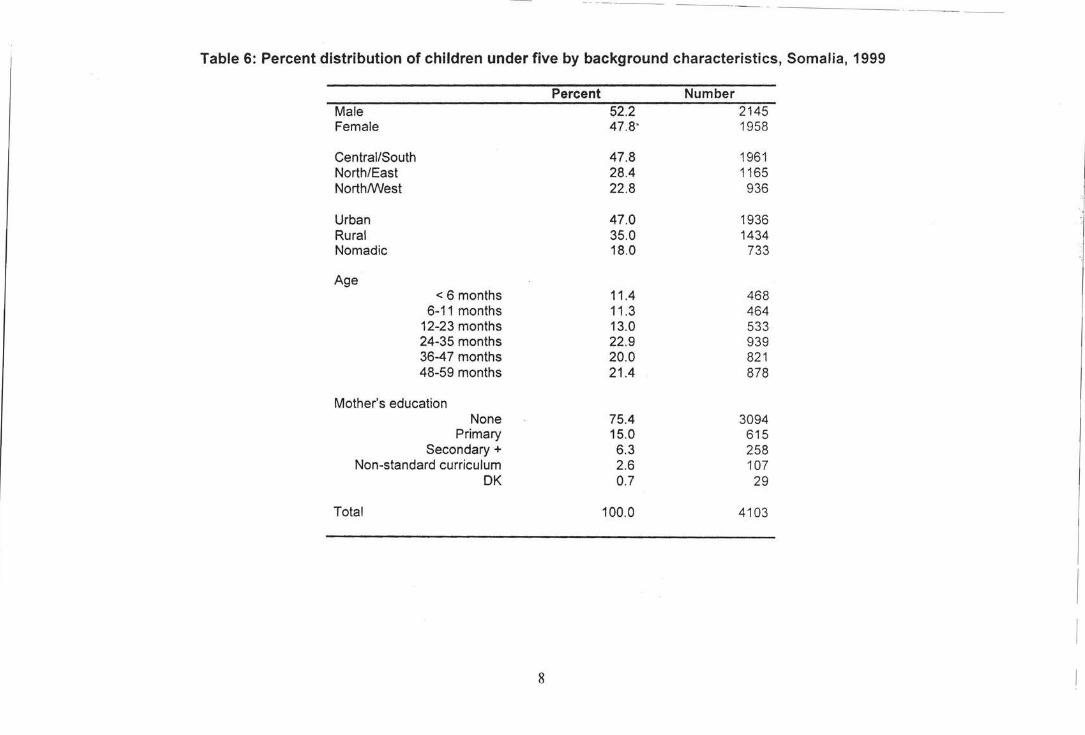
Table 6: Percent distribution of children under five by background characteristics, Somalia, 1999
Percent Number Male 52.2 2145 Female 47.8' 1958
Central/South 47.8 1961 North/East 28.4 1165 North/West 22.8 936
Urban 47.0 1936 Rural 35.0 1434 Nomadic 18.0 733
Age < 6 months 11.4 468
6-11 months 11 .3 464 12-23 months 13.0 533 24-35 months 22.9 939 36-4 7 months 20.0 821 48-59 months 21.4 878
Mother's education None 75.4 3094
Primary 15.0 615 Secondary+ 6.3 258
Non-standard curriculum 2.6 107 OK 0.7 29
Total 100.0 4103
8
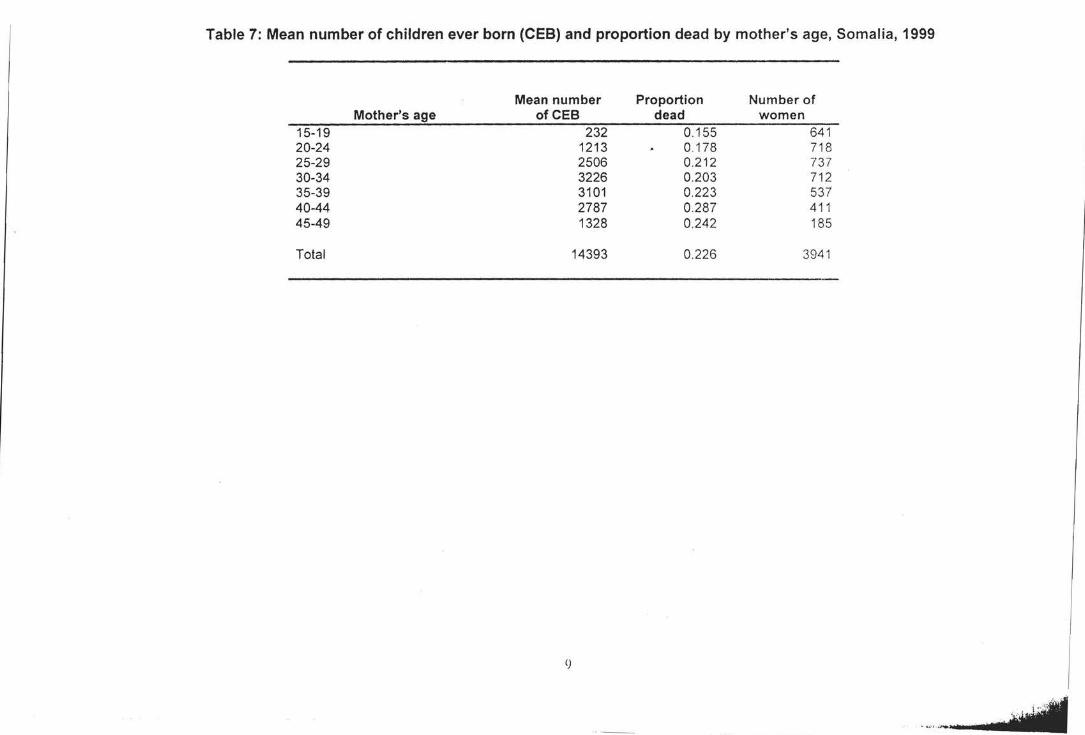
Table 7: Mean number of children ever born (CEB) and proportion dead by mother's age, Somalia, 1999
Mean number Proportion Number of Mother's age ofCEB dead women
15-19 232 0.155 641 20-24 1213 0.178 718 25-29 2506 0.212 737 30-34 3226 0.203 712 35-39 3101 0.223 537 40-44 2787 0.287 411 45-49 1328 0.242 185
Total 14393 0.226 3941
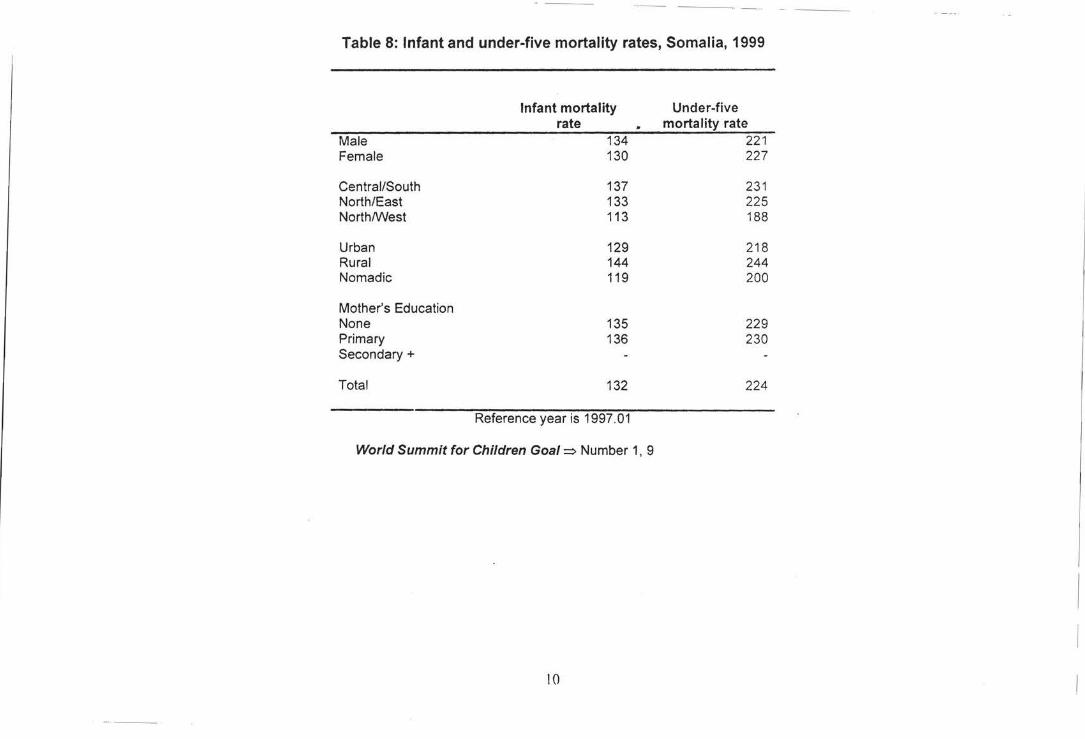
Table 8: Infant and under-five mortality rates, Somalia, 1999
Infant mortality Under-five rate mortality rate
Male 134 221 Female 130 227
Central/South 137 231 North/East 133 225 North/West 113 188
Urban 129 218 Rural 144 244 Nomadic 119 200
Mother's Education None 135 229 Primary 136 230 Secondary+
Total 132 224
Reference year is 1997.01
World Summit for Children Goal=> Number 1, 9
10
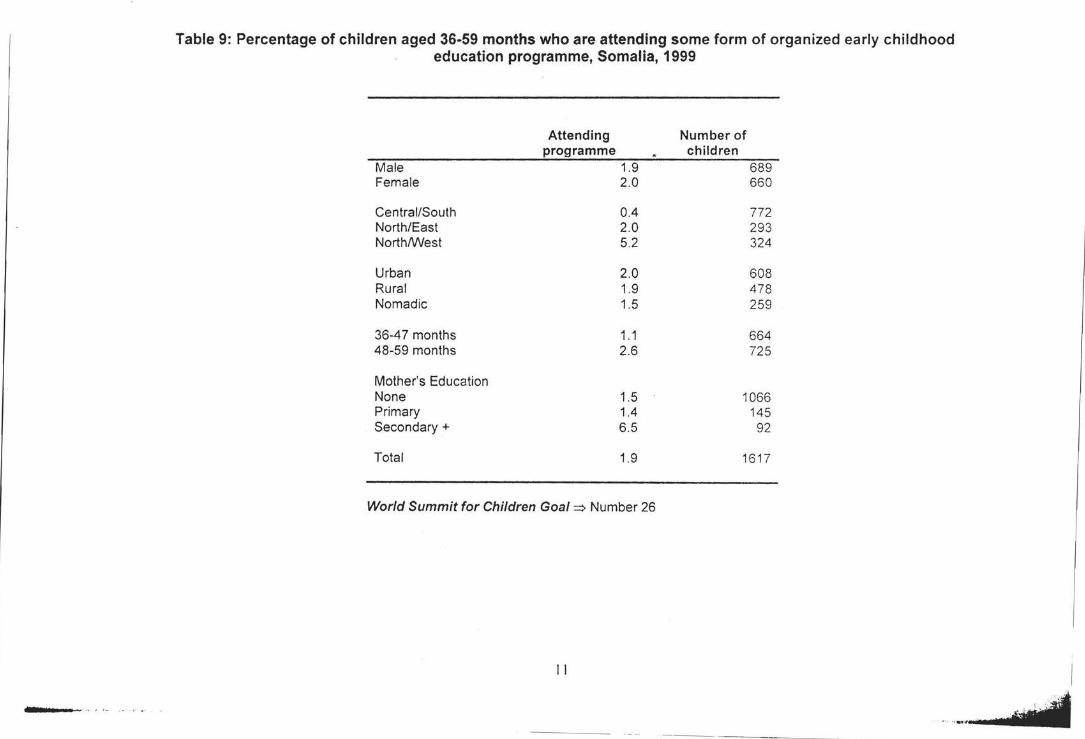
----··· ·-·-·· ··.
Table 9: Percentage of children aged 36-59 months who are attending some form of organized early childhood education programme, Somalia, 1999
Attending Number of programme children
Male 1.9 689 Female 2.0 660
Central/South 0.4 772 North/East 2.0 293 North/West 5.2 324
Urban 2.0 608 Rural 1.9 478 Nomadic 1.5 259
36-47 months 1.1 664 48-59 months 2.6 725
Mother's Education None 1.5 1066 Primary 1.4 145 Secondary+ 6.5 92
Total 1.9 1617
World Summit for Children Goal ~ Number 26
II
------------------------ ---- - -----
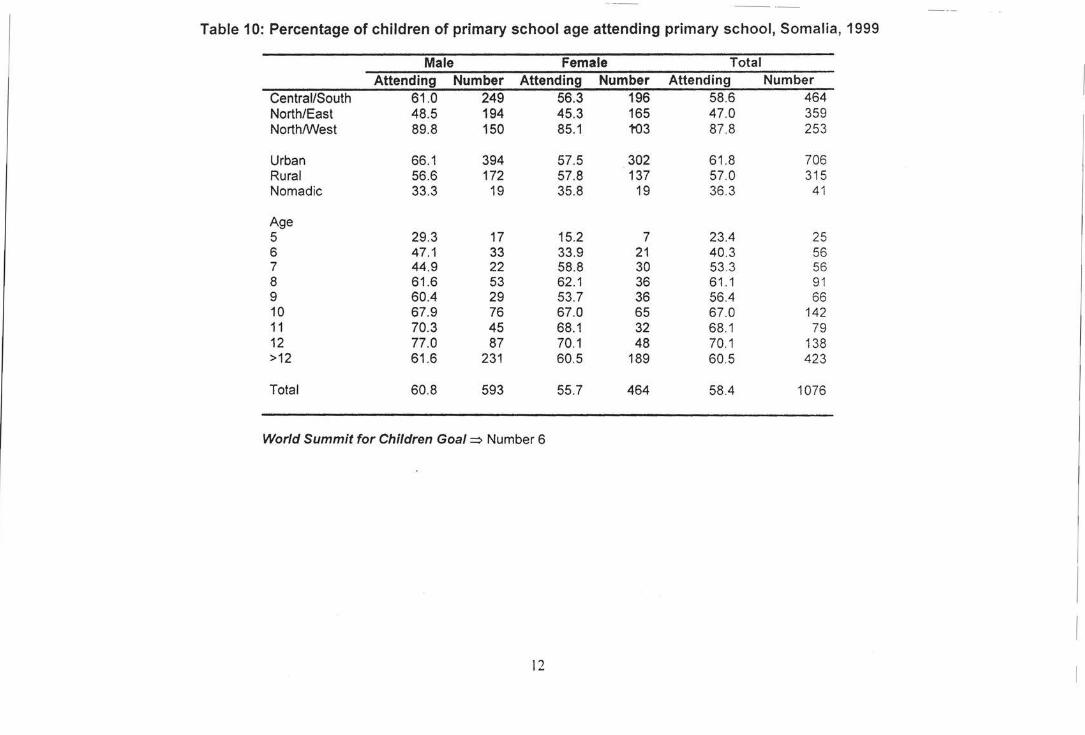
-- ~-
Table 10: Percentage of children of primary school age attending primary school, Somalia, 1999
Male Female Total Attending Number Attending Number Attending Number
Central/South 61 .0 249 56.3 196 58.6 464 North/East 48.5 194 45.3 165 47.0 359 North/West 89.8 150 85.1 1'03 87.8 253
Urban 66.1 394 57.5 302 61.8 706 Rural 56.6 172 57.8 137 57.0 315 Nomadic 33.3 19 35.8 19 36 .3 41
Age 5 29.3 17 15.2 7 23.4 25 6 47.1 33 33.9 21 40.3 56 7 44.9 22 58.8 30 53.3 56 8 61 .6 53 62.1 36 61 .1 91 9 60.4 29 53.7 36 56.4 66 10 67.9 76 67.0 65 67.0 142 11 70.3 45 68.1 32 68.1 79 12 77.0 87 70.1 48 70.1 138 >12 61 .6 231 60.5 189 60.5 423
Total 60.8 593 55.7 464 58.4 1076
World Summit for Children Goal~ Number 6
12
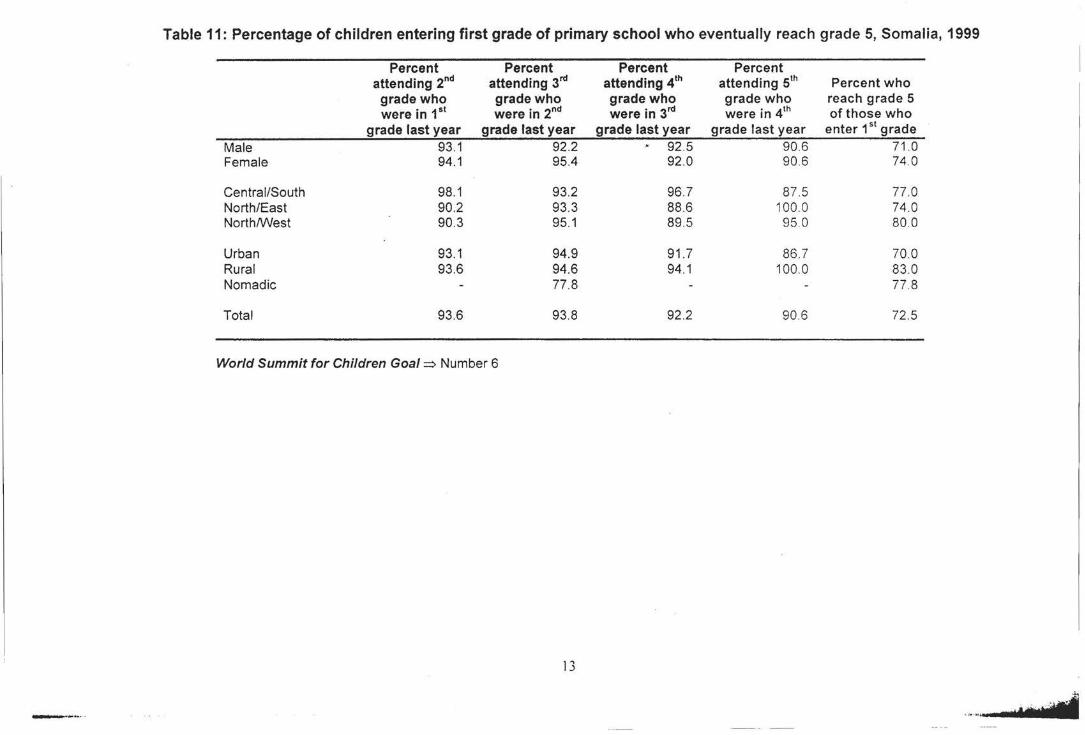
Table 11: Percentage of children entering first grade of primary school who eventually reach grade 5, Somalia, 1999
Percent Percent Percent Percent attending 2nd attending 3rd attending 4th attending sth Percent who
grade who grade who grade who grade who reach grade 5 were in 1st were in 2nd were in 3'd were in 4th of those who
grade last year grade last year grade last year grade last year enter 1st grade
Male 93.1 92.2 92.5 90.6 71.0 Female 94.1 95.4 92.0 90 .6 74.0
Central/South 98.1 93.2 96.7 87. 5 77 .0 North/East 90.2 93.3 88.6 100 0 74 .0 North/West 90.3 95.1 89.5 95 0 80 .0
Urban 93.1 94.9 91 .7 86.7 70.0 Rural 93.6 94.6 94.1 100.0 83 .0 Nomadic 77 .8 77. 8
Total 93.6 93.8 92.2 90.6 72.5
World Summit for Children Goal~ Number 6
13
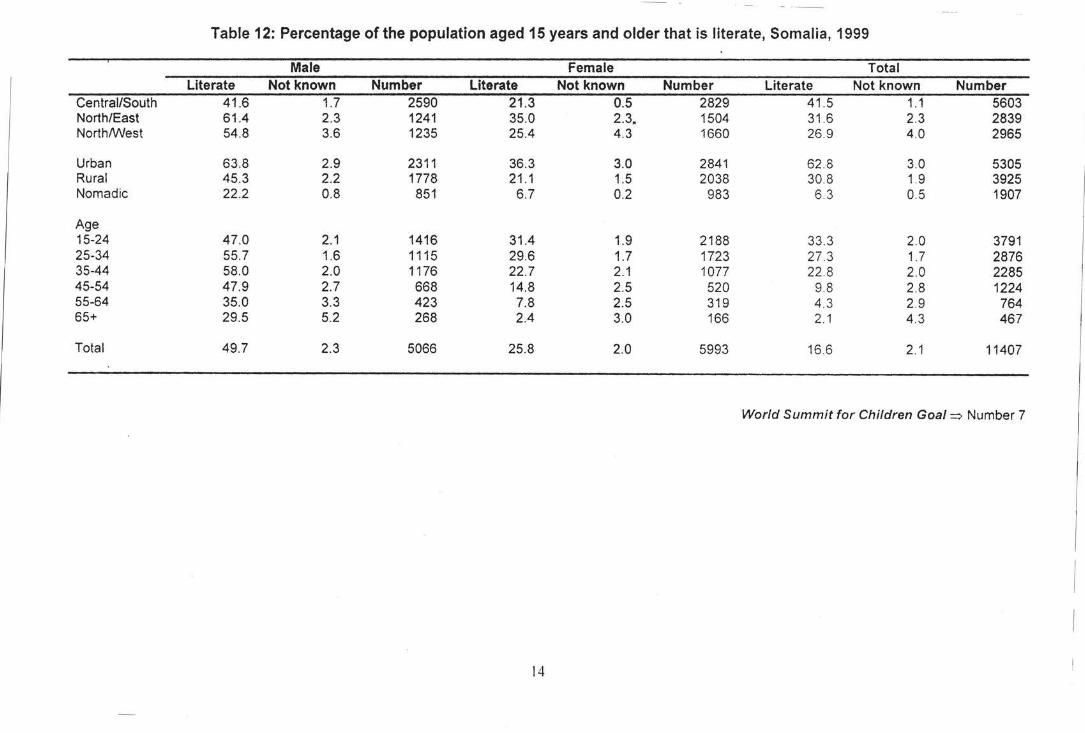
-·- -·-
Table 12: Percentage of the population aged 15 years and older that is literate, Somalia, 1999
Male Female Total Literate Not known Number Literate Not known Number Literate Not known Number
Central/South 41 .6 1.7 2590 21.3 0.5 2829 41 .5 1.1 5603 North/East 61.4 2.3 1241 35.0 2.3. 1504 31 .6 2.3 2839 North/West 54.8 3.6 1235 25.4 4.3 1660 26.9 4.0 2965
Urban 63.8 2.9 2311 36.3 3.0 2841 62 .8 3.0 5305 Rural 45.3 2.2 1778 21 .1 1.5 2038 30.8 1.9 3925 Nomadic 22.2 0.8 851 6.7 0.2 983 6.3 0.5 1907
Age 15-24 47.0 2.1 1416 31.4 1.9 2188 33.3 2.0 3791 25-34 55.7 1.6 1115 29.6 1.7 1723 27 .3 1.7 2876 35-44 58.0 2.0 1176 22.7 2.1 1077 22 .8 2.0 2285 45-54 47.9 2.7 668 14.8 2.5 520 9.8 2.8 1224 55-64 35.0 3.3 423 7.8 2.5 319 4.3 2.9 764 65+ 29.5 5.2 268 2.4 3.0 166 2.1 4.3 467
Total 49.7 2.3 5066 25.8 2.0 5993 16.6 2.1 11407
World Summit for Children Goal~ Number 7
14
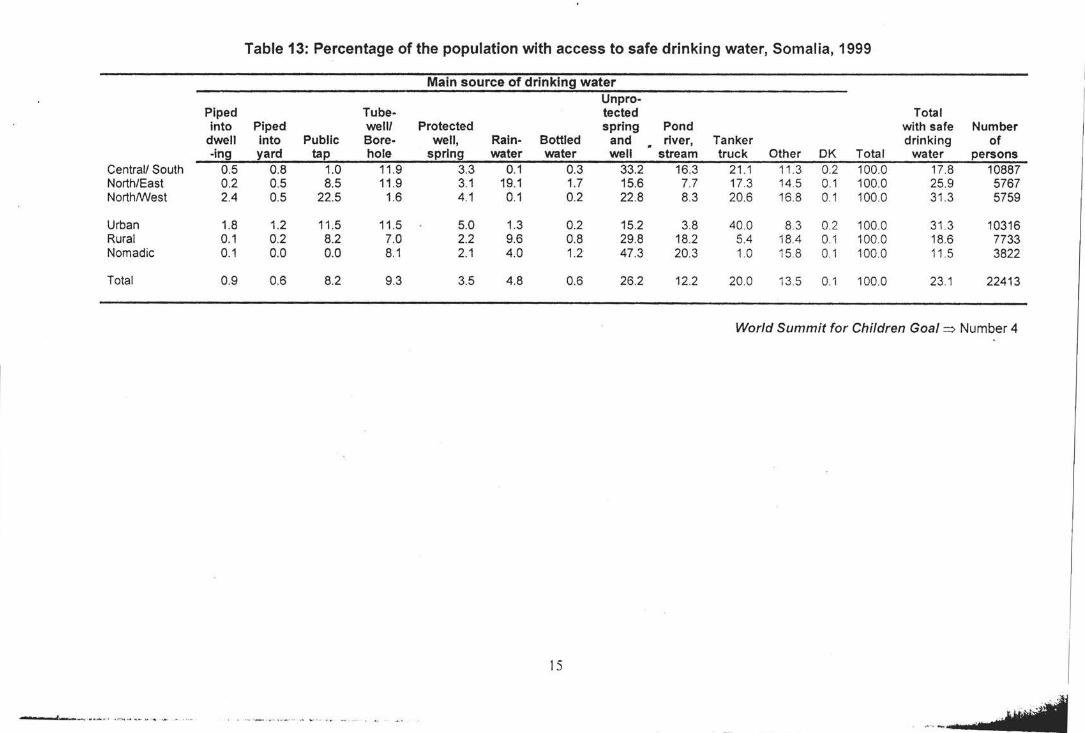
Table 13: Percentage of the population with access to safe drinking water, Somalia, 1999
Main source of drinking water Unpro-
Piped Tube- tected Total into Piped well/ Protected spring Pond with safe Number
dwell into Public Bore- well, Rain- Bottled and river, Tanker drinking of -ing yard tap hole spring water water well stream truck Other OK Total water persons
Central/ South 0.5 0.8 1.0 11.9 3.3 0.1 0.3 33.2 16.3 21 .1 11 .3 0.2 100.0 17.8 10887 North/East 0.2 0.5 8.5 11.9 3.1 19.1 1.7 15.6 7.7 17.3 14.5 0.1 100.0 25.9 5767 North/West 2.4 0.5 22.5 1.6 4.1 0.1 0.2 22.8 8.3 20.6 16.8 0.1 100.0 31 .3 5759
Urban 1.8 1.2 11 .5 11.5 5.0 1.3 0.2 15.2 3.8 40.0 8.3 0.2 100.0 31.3 10316 Rural 0.1 0.2 8.2 7.0 2.2 9.6 0.8 29.8 18.2 5.4 18.4 0.1 100 0 18.6 7733 Nomadic 0.1 0.0 0.0 8.1 2.1 4.0 1.2 47 .3 20.3 1.0 15.8 0.1 100.0 11 .5 3822
Total 0.9 0.6 8.2 9.3 3.5 4.8 0.6 26.2 12.2 20.0 13.5 0.1 100.0 23 .1 22413
World Summit for Children Goal => Number 4
IS
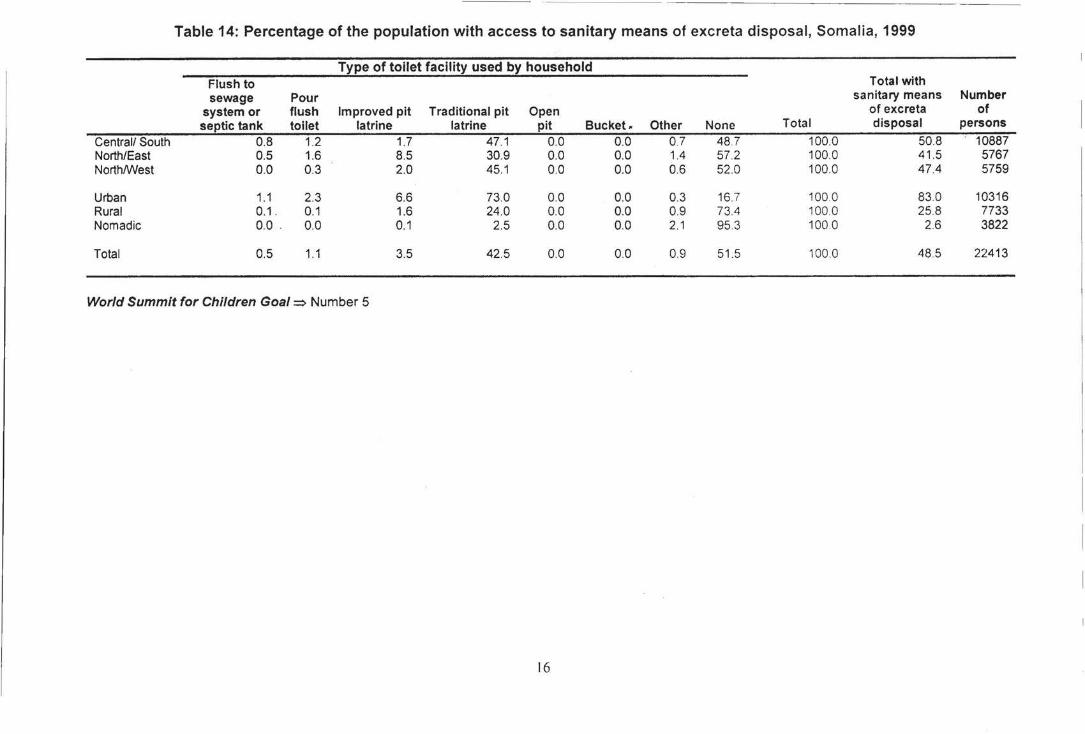
Table 14: Percentage of the population with access to sanitary means of excreta disposal, Somalia, 1999
Type of toilet facility used by household Flush to Total with sewage Pour sanitary means Number
system or flush Improved pit Traditional pit Open of excreta of septic tank toilet latrine latrine pit Bucket. Other None Total disposal persons
Central/ South 0.8 1.2 1.7 47.1 0.0 0.0 0.7 48 .7 100.0 50.8 10887 North/East 0.5 1.6 8.5 30.9 0.0 0.0 1.4 57.2 100.0 41.5 5767 North/West 0.0 0.3 2.0 45.1 0.0 0.0 0.6 52.0 100.0 47.4 5759
Urban 1.1 2.3 6.6 73.0 0.0 0.0 0.3 16.7 100.0 83.0 10316 Rural 0.1 . 0.1 1.6 24.0 0.0 0.0 0.9 73.4 100.0 25.8 7733 Nomadic 0.0 . 0.0 0.1 2.5 0.0 0.0 2.1 95.3 100.0 2.6 3822
Total 0.5 1.1 3.5 42.5 0.0 0.0 0.9 51.5 100 0 48.5 22413
World Summit for Children Goal~ Number 5
16
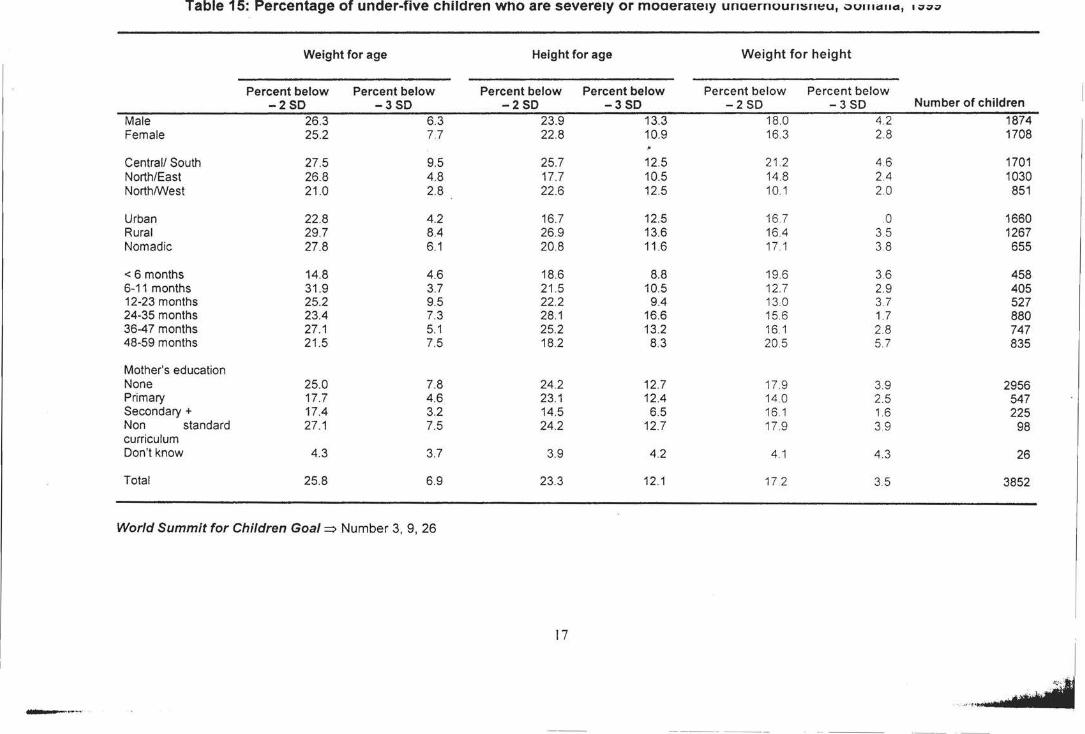
Table 15: Percentage of under-five children who are severely or moaerateay unaernoummt:u, vumcrua, • vvv
Weight for age Height for age Weight for height
Percent below Percent below Percent below Percent below Percent below Percent below -2SD -3SD -250 -3SD -2 so -3 so Number of children
Male 26.3 6.3 23.9 13.3 18.0 4.2 1874 Female 25.2 77 22.8 10.9 16.3 2.8 1708
Central/ South 27.5 9.5 25.7 12.5 21.2 4.6 1701 North/East 26.8 4.8 17.7 10.5 14.8 2.4 1030 North/West 21.0 2.8 22.6 12.5 10.1 2.0 851
Urban 22.8 4.2 16.7 12.5 16.7 0 1660 Rural 29.7 8.4 26.9 13.6 16.4 3.5 1267 Nomadic 27.8 6.1 20.8 11.6 17.1 3.8 655
< 6 months 14.8 4.6 18.6 8.8 19.6 3.6 458 6-11 months 31.9 3.7 21 .5 10.5 12.7 2.9 405 12-23 months 25.2 9.5 22.2 94 130 37 527 24-35 months 23.4 7.3 28.1 16.6 15.6 1.7 880 36-47 months 27.1 5.1 25.2 13.2 16.1 2.8 747 48-59 months 21 .5 7.5 18.2 8.3 20.5 5.7 835
Mother's education None 25.0 7.8 24.2 12.7 17.9 3.9 2956 Primary 17.7 4.6 23.1 12.4 14.0 2.5 547 Secondary+ 17.4 3.2 14.5 6.5 16.1 1.6 225 Non standard 27.1 7.5 24.2 12.7 17.9 3.9 98 curriculum Don't know 4.3 3.7 3.9 4.2 4.1 4.3 26
Total 25.8 6.9 23.3 12.1 17.2 3.5 3852
World Summit for Children Goal=> Number 3, 9, 26
17
-·-~··
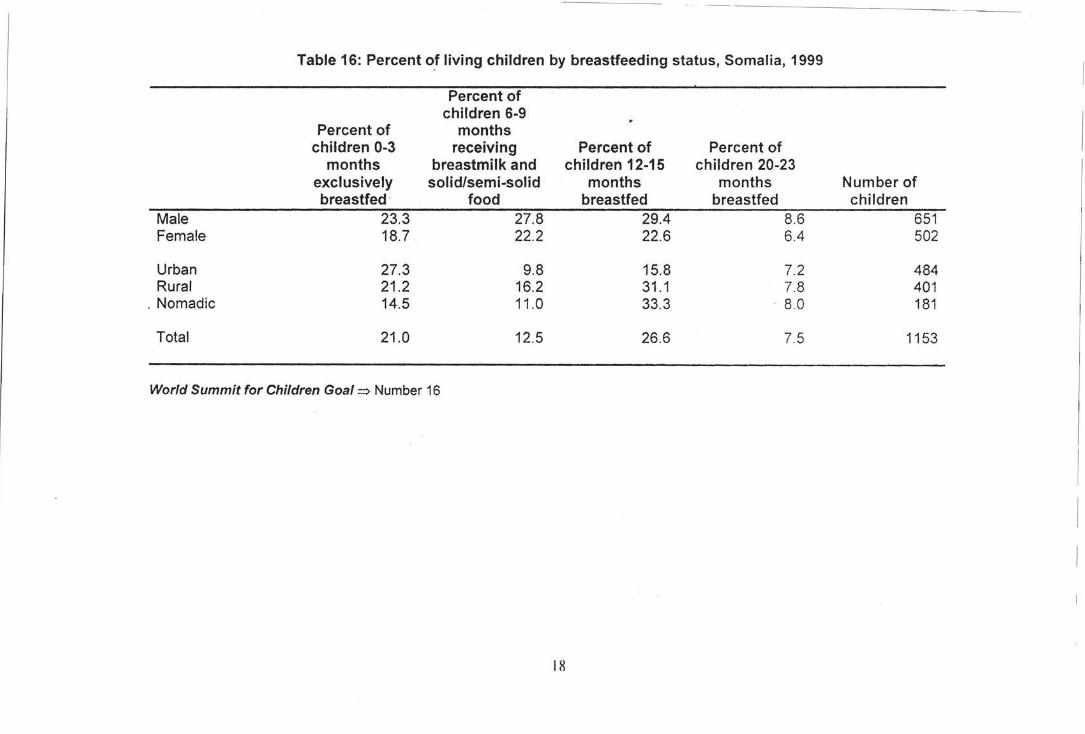
Table 16: Percent o.f living children by breastfeeding status, Somalia, 1999
Percent of children 6-9
Percent of months children 0-3 receiving Percent of Percent of
months breastmilk and children 12-15 children 20-23 exclusively solid/semi-solid months months Number of breastfed · food breastfed breastfed children
Male 23.3 27.8 29.4 8.6 651 Female 18.7 22.2 22.6 6.4 502
Urban 27.3 9.8 15.8 7.2 484 Rural 21.2 16.2 31 .1 7.8 401
. Nomadic 14.5 11.0 33.3 . 8.0 181
Total 21.0 12.5 26.6 7.5 1153
World Summit for Children Goal=> Number 16
18
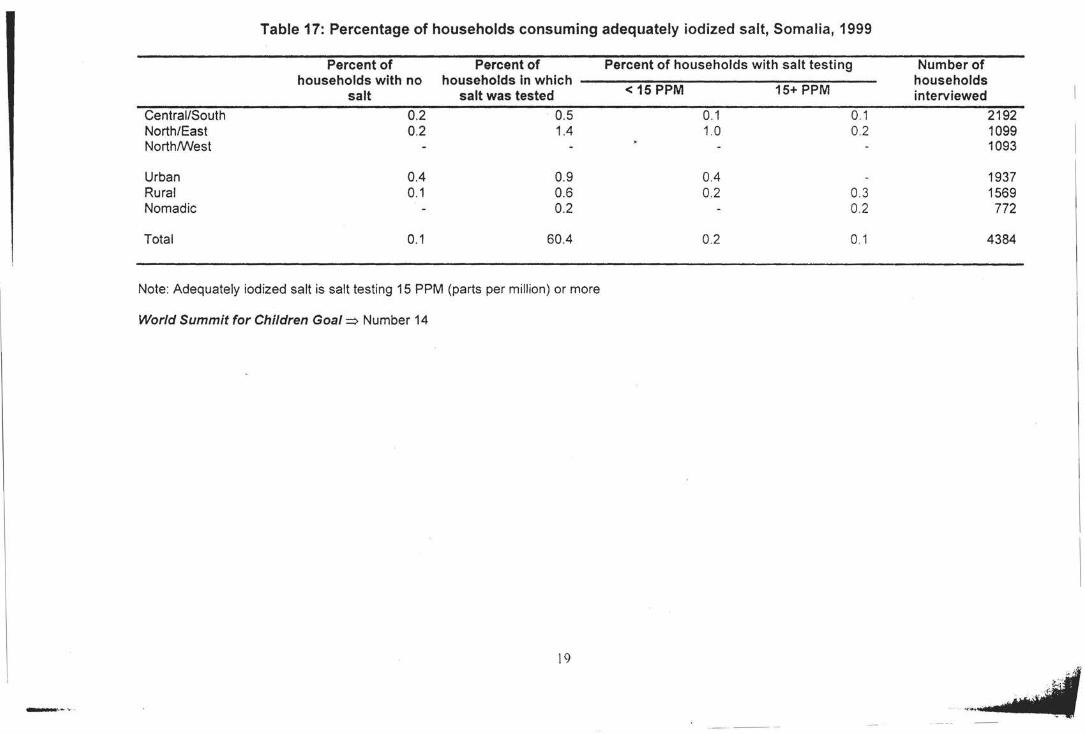
Table 17: Percentage of households consuming adequately iodized salt, Somalia, 1999
Percent of Percent of Percent of households with salt testing Number of households with no households in which households
salt salt was tested < 15 PPM 15+ PPM interviewed
Central/South 0.2 0.5 0.1 0.1 2192 North/East 0.2 1.4 1.0 0.2 1099 North/West 1093
Urban 0.4 0.9 0.4 1937 Rural 0.1 0.6 0.2 0.3 1569 Nomadic 0.2 0.2 772
Total 0.1 60.4 0.2 0.1 4384
Note: Adequately iodized salt is salt testing 15 PPM (parts per million) or more
World Summit for Children Goal=> Number 14
\9
- ·-··-·
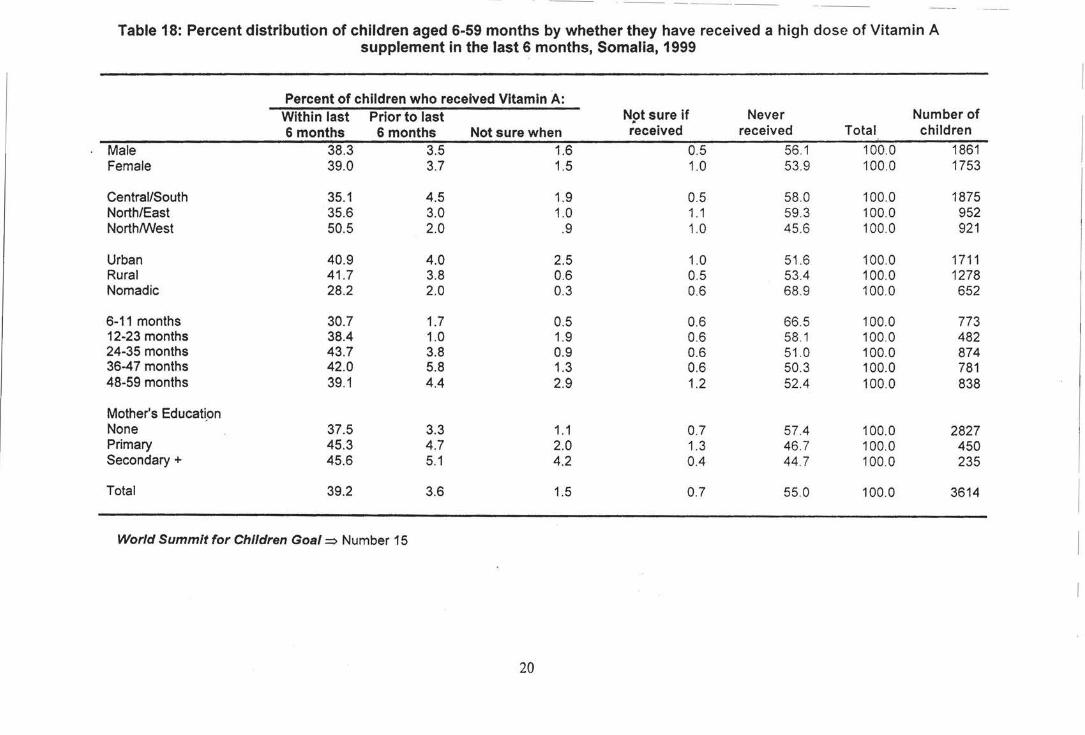
· ·-- - -------·
Table 18: Percent distribution of children aged 6-59 months by whether they have received a high dose of Vitamin A supplement in the last 6 months, Somalia, 1999
Percent of children who received Vitamin A: Within last Prior to last N9t sure if Never Number of 6 months 6 months Not sure when received received Total children
Male 38.3 3.5 1.6 0.5 56.1 100.0 1861 Female 39.0 3.7 1.5 1.0 53.9 100.0 1753
Central/South 35.1 4.5 1.9 0.5 58 .0 100.0 1875 North/East 35.6 3.0 1.0 1.1 59.3 100.0 952 North/West 50.5 2.0 .9 1.0 45 .6 100.0 921
Urban 40.9 4.0 2.5 1.0 51 .6 100.0 1711 Rural 41.7 3.8 0.6 0.5 53.4 100.0 1278 Nomadic 28.2 2.0 0.3 0.6 68.9 100.0 652
6-11 months 30.7 1.7 0.5 0.6 66.5 100.0 773 12-23 months 38.4 1.0 1.9 0.6 58.1 100.0 482 24-35 months 43.7 3.8 0.9 0.6 51 .0 100.0 874 36-47 months 42.0 5.8 1.3 0.6 50.3 100.0 781 48-59 months 39.1 4.4 2.9 1.2 52.4 100.0 838
Mother's Educati_on None 37.5 3.3 1.1 0.7 57.4 100.0 2827 Primary 45.3 4.7 2.0 1.3 46 .7 100.0 450 Secondary+ 45.6 5.1 4.2 0.4 44.7 100.0 235
Total 39.2 3.6 1.5 0.7 55.0 100.0 3614
World Summit for Children Goal==> Number 15
20
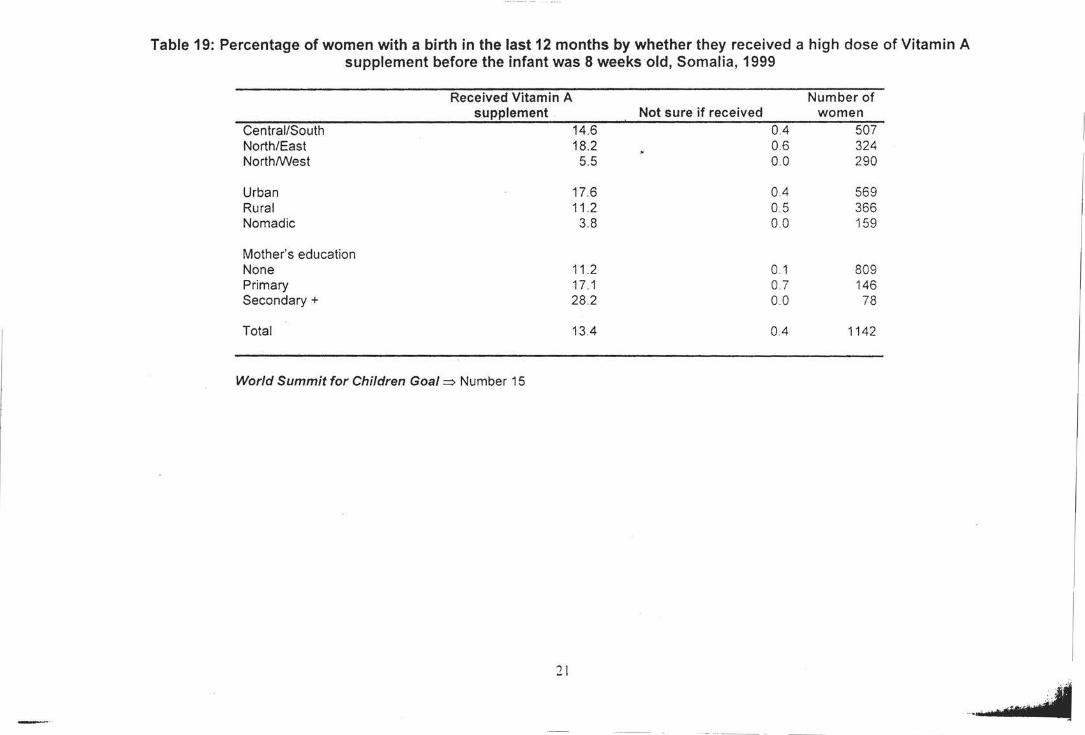
Table 19: Percentage of women with a birth in the last 12 months by whether they received a high dose of Vitamin A supplement before the infant was 8 weeks old, Somalia, 1999
Received Vitamin A Number of supplement Not sure if received women
Central/South 14.6 0.4 507 North/East 18.2 0.6 324 North/West 5.5 0.0 290
Urban 17.6 0.4 569 Rural 11 .2 0.5 366 Nomadic 3.8 0.0 159
Mother's education None 11.2 0.1 809 Primary 17.1 0.7 146 Secondary+ 28.2 00 78
Total 13.4 0.4 1142
World Summit for Children Goal => Number 15
21
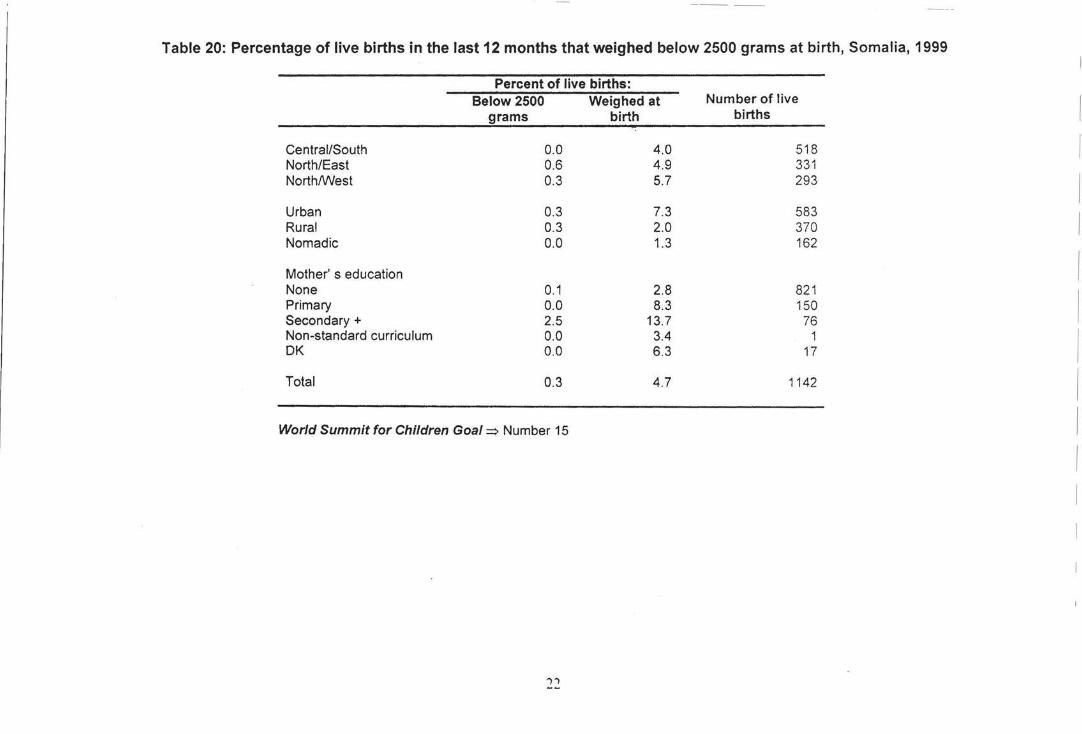
Table 20: Percentage of live births in the last 12 months that weighed below 2500 grams at birth, Somalia, 1999
Percent of live births: Below 2500 Weighed at Number of live
I grams birth births
Central/South 0.0 4.0 518 I North/East 0.6 4.9 331 North/West 0.3 5.7 293
I Urban 0.3 7.3 583
I Rural 0.3 2.0 370 Nomadic 0.0 1.3 162
Mother' s education I None 0.1 2.8 821
I Primary 0.0 8.3 150 Secondary+ 2.5 13.7 76 Non-standard curriculum 0.0 3.4 1
I DK 0.0 6.3 17
Total 0.3 4.7 1142 I World Summit for Children Goal=> Number 15 I
I
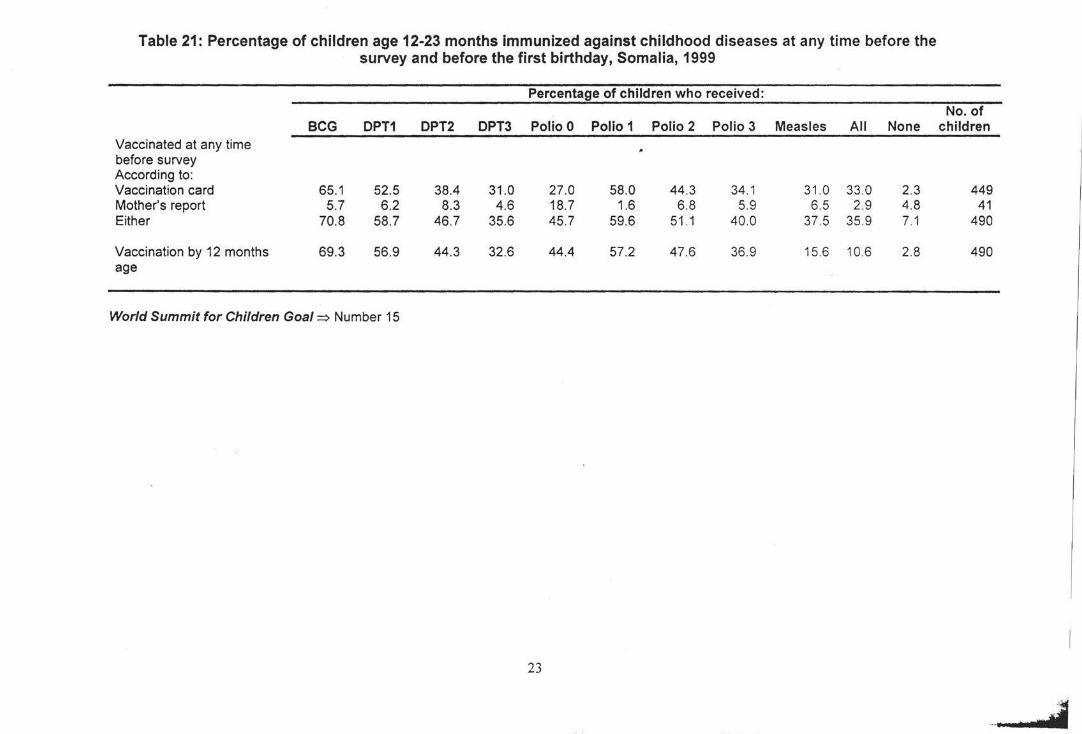
Table 21: Percentage of children age 12-23 months immunized against childhood diseases at any time before the survey and before the first birthday, Somalia, 1999
Percentage of children who received:
BCG DPT1 DPT2 DPT3 Polio 0 Polio 1 Polio 2 Polio 3 Measles All None Vaccinated at any time before survey According to: Vaccination card 65.1 52.5 38.4 31.0 27.0 58.0 44.3 34.1 31 .0 33 .0 2.3 Mother's report 5.7 6.2 8.3 4.6 18.7 1.6 6 .8 5.9 6.5 2.9 4.8 Either 70.8 58.7 46.7 35.6 45.7 59.6 51 .1 40.0 37 .5 35 .9 7.1
Vaccination by 12 months 69.3 56.9 44.3 32.6 44.4 57.2 47.6 36.9 15.6 10.6 2.8 age
World Summit for Children Goal~ Number 15
23
No. of children
449 41
490
490
··---· .,.,. ... , .•...
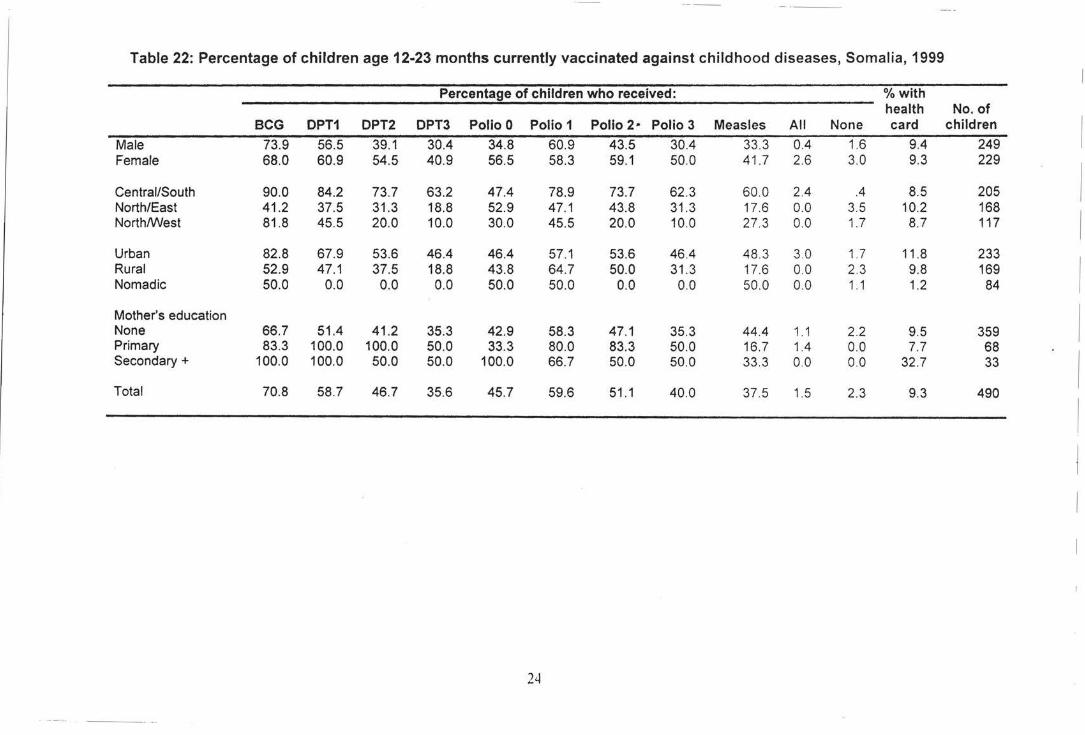
Table 22: Percentage of children age 12-23 months currently vaccinated against childhood diseases, Somalia, 1999
Percentage of children who received: %with health No. of
BCG DPT1 DPT2 DPT3 Polio 0 Polio 1 Polio 2· Polio 3 Measles All None card children I Male 73.9 56.5 39.1 30.4 34.8 60.9 43.5 30.4 33.3 0.4 1.6 9.4 249
Female 68.0 60.9 54.5 40.9 56.5 58.3 59.1 50.0 41.7 2.6 3.0 9.3 229
I Central/South 90.0 84.2 73.7 63.2 47.4 78.9 73.7 62.3 60.0 2.4 .4 8.5 205 North/East 41 .2 37.5 31.3 18.8 52.9 47.1 43.8 31 .3 17.6 0.0 3.5 10.2 168
I North/West 81.8 45.5 20.0 10.0 30.0 45.5 20.0 10.0 27.3 0.0 1.7 8.7 117
Urban 82.8 67.9 53.6 46.4 46.4 57.1 53.6 46.4 48.3 3.0 1.7 11 .8 233
I Rural 52.9 47.1 37.5 18.8 43.8 64.7 50.0 31 .3 17.6 0.0 2.3 9.8 169 Nomadic 50.0 0.0 0.0 0.0 50.0 50.0 0.0 0.0 50.0 0.0 1 . 1 1.2 84
Mother's education
I None 66.7 51.4 41 .2 35.3 42.9 58.3 47.1 35.3 44.4 1.1 2.2 9.5 359 Primary 83.3 100.0 100.0 50.0 33.3 80.0 83.3 50.0 16.7 1.4 0.0 7.7 68 Secondary+ 100.0 100.0 50.0 50.0 100.0 66.7 50.0 50.0 33 .3 0.0 0.0 32.7 33
I Total 70.8 58.7 46.7 35.6 45.7 59.6 51 .1 40.0 37.5 1.5 2.3 9.3 490
I
i
24
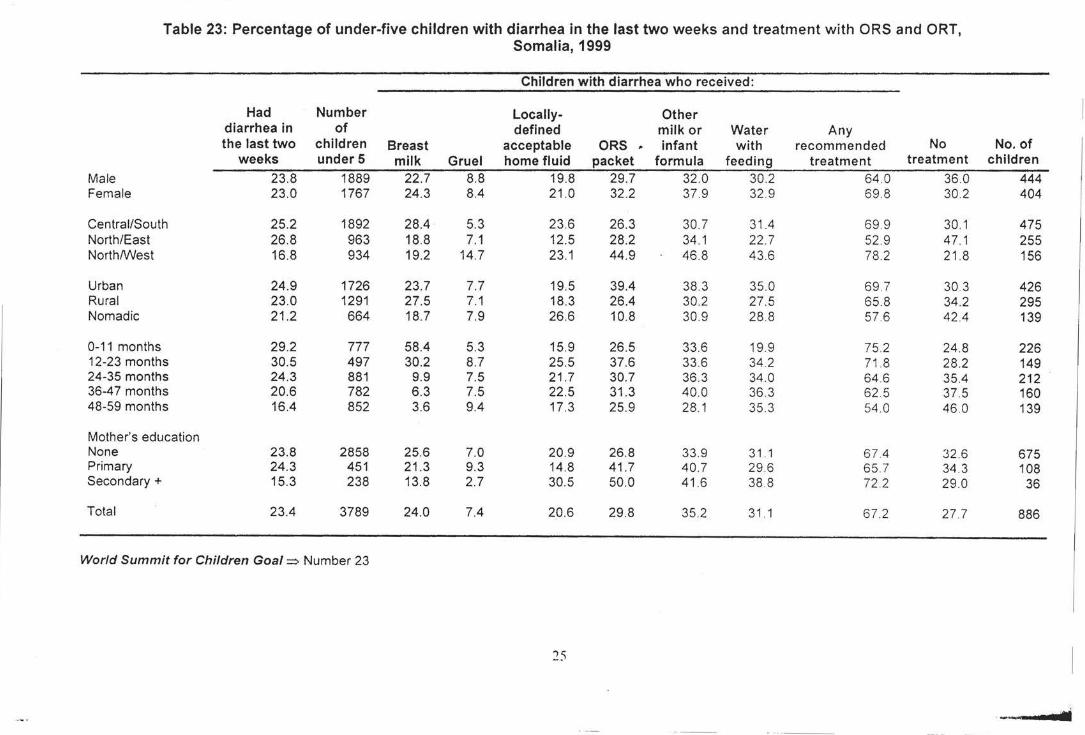
---·-----· ·-··- - ---··
Table 23: Percentage of under-five children with diarrhea in the last two weeks and treatment with ORS and ORT, Somalia, 1999
Children with diarrhea who received:
Had Number Locally- Other diarrhea in of defined milk or Water Any the last two children Breast acceptable ORS ,. infant with recommended No No. of
weeks under5 milk Gruel home fluid packet formula feeding treatment treatment children Male 23.8 1889 22.7 8.8 19.8 29.7 32.0 30.2 64 .0 36 .0 444 Female 23 .0 1767 24.3 8.4 21 .0 32.2 37.9 32.9 69 .8 30 .2 404
Central/South 25.2 1892 28.4 5.3 23.6 26.3 30.7 31.4 69.9 30.1 475 North/East 26.8 963 18.8 7.1 12.5 28.2 34.1 22.7 52 .9 47 .1 255 North/West 16.8 934 19.2 14.7 23.1 44.9 46.8 43.6 78.2 21 .8 156
Urban 24.9 1726 23.7 7.7 19.5 39.4 38 .3 35 .0 69 .7 30 .3 426 Rural 23.0 1291 27.5 7.1 18.3 26.4 30.2 27.5 65.8 34 .2 295 Nomadic 21 .2 664 18.7 7.9 26.6 10.8 30.9 28.8 57.6 42.4 139
0-11 months 29.2 777 58.4 5.3 15.9 26.5 33.6 19.9 75.2 24.8 226 12-23 months 30.5 497 30.2 8.7 25.5 37.6 33 .6 34 .2 71 .8 28.2 149 24-35 months 24.3 881 9.9 7.5 21.7 30.7 36.3 34.0 64 .6 35.4 212 36-47 months 20.6 782 6.3 7.5 22.5 31.3 40.0 36.3 62.5 37.5 160 48-59 months 16.4 852 3.6 9.4 17.3 25.9 28.1 35.3 54.0 46.0 139
Mother's education None 23.8 2858 25.6 7.0 20.9 26.8 33.9 31 .1 67 .4 32.6 675 Primary 24.3 451 21 .3 9.3 14.8 41.7 40.7 29.6 65.7 34 .3 108 Secondary+ 15.3 238 13.8 2.7 30.5 50.0 41.6 38 .8 72 .2 29.0 36
Total 23.4 3789 24.0 7.4 20.6 29.8 35.2 31.1 67.2 27 .7 886
World Summit for Children Goal=> Number 23
25
__ ....,..
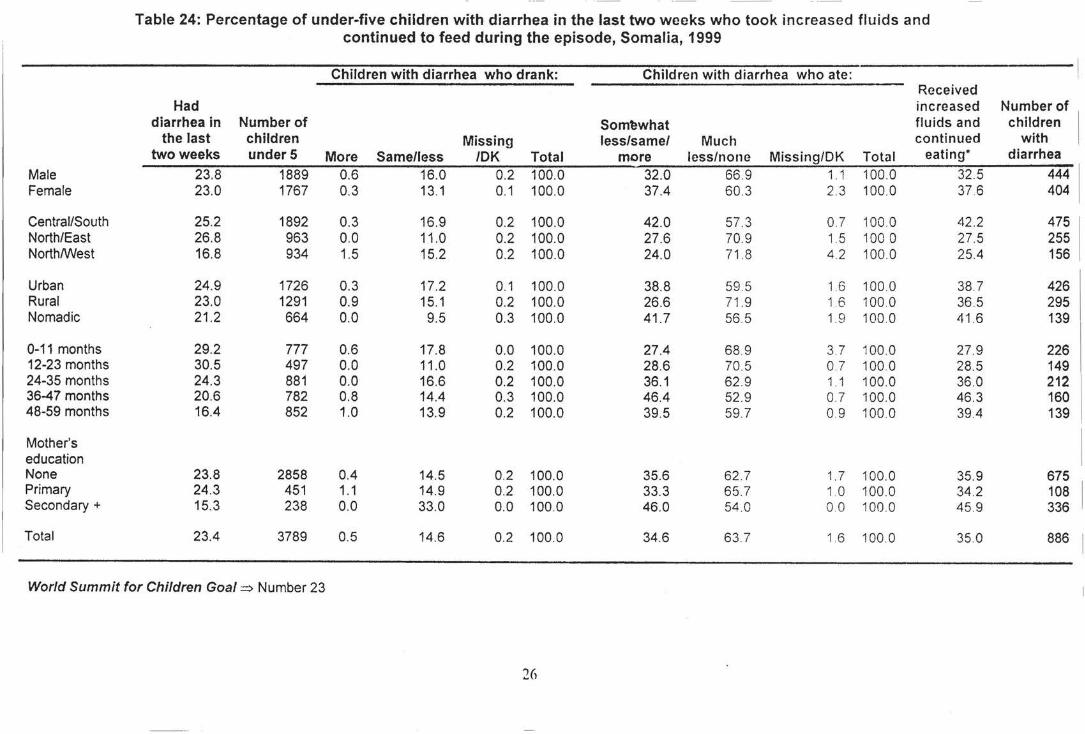
- --
Table 24: Percentage of under-five children with diarrhea in the last two weeks who took increased fluids and continued to feed during the episode, Somalia, 1999
Children with diarrhea who drank: Children with diarrhea who ate: Received
Had increased Number of diarrhea in Number of Som~what fluids and children I
the last children Missing less/same/ Much continued with , two weeks under5 More Same/less /OK Total more less/none Missing/DK Total eating* diarrhea
Male 23.8 1889 0.6 16.0 0.2 100.0 32.0 66.9 1.1 100.0 32.5 444 Female 23.0 1767 0.3 13.1 0.1 100.0 37.4 60 .3 2.3 100.0 37 6 404
Central/South 25.2 1892 0.3 16.9 0.2 100.0 42.0 57.3 0.7 100 0 42.2 475 North/East 26.8 963 0.0 11 .0 0.2 100.0 27.6 70.9 1.5 100 0 27.5 255 North/West 16.8 934 1.5 15.2 0.2 100.0 24.0 71.8 4.2 100.0 25.4 156
Urban 24.9 1726 0.3 17.2 0.1 100.0 38.8 59.5 1.6 100.0 38.7 426 Rural 23.0 1291 0.9 15.1 0.2 100.0 26.6 71.9 1.6 100 0 36.5 295 Nomadic 21 .2 664 0.0 9.5 0.3 100.0 41.7 56.5 1.9 100.0 41.6 139
0-11 months 29.2 777 0.6 17.8 0.0 100.0 27.4 68.9 3.7 100.0 27.9 226 12-23 months 30.5 497 0.0 11 .0 0.2 100.0 28.6 70.5 0.7 100.0 28.5 149 24-35 months 24.3 881 0.0 16.6 0.2 100.0 36.1 62.9 1 . 1 100.0 36.0 212 36-47 months 20.6 782 0.8 14.4 0.3 100.0 46.4 52.9 0.7 100.0 46.3 160 48-59 months 16.4 852 1.0 13.9 0.2 100.0 39.5 59.7 0.9 100.0 39.4 139
Mother's education None 23.8 2858 0.4 14.5 0.2 100.0 35.6 62.7 1. 7 100.0 35.9 675 Primary 24.3 451 1.1 14.9 0.2 100.0 33.3 65.7 1 0 100.0 34.2 108 Secondary+ 15.3 238 0.0 33.0 0.0 100.0 46.0 54 .0 00 100.0 45 .9 336
Total 23.4 3789 0.5 14.6 0.2 100.0 34.6 63 .7 1.6 100.0 35 .0 886
World Summit for Children Goal=> Number 23
26
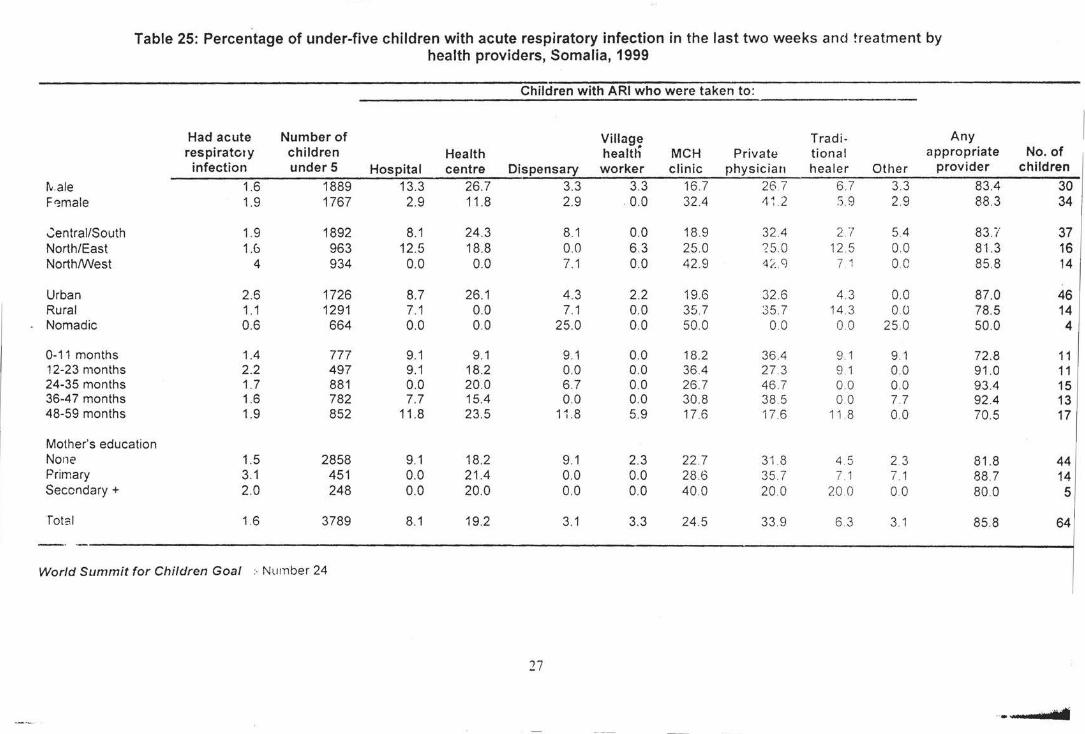
Table 25: Percentage of under-five children with acute respiratory infection in the last two weeks and treatment by health providers, Somalia, 1999
Children with ARI who were taken to:
Had acute Number of Village Tradi- Any respiratory children Health heal til MCH Private tiona! appropriate No. of infection under5 Hospital centre Dispensary worker clinic physician healer Other provider children
tv .ale 1.6 1889 13.3 26.7 3.3 3.3 16.7 26 7 6.7 3.3 83.4 30 F<:male 1.9 1767 2.9 11 .8 2.9 0.0 32.4 4~ 2 S.9 2.9 88.3 34
.::entrai/South 1.9 1892 8.1 24.3 8.1 0.0 18.9 32.4 207 5.4 83.i' 37 North/East 1.6 963 12.5 18.8 0.0 6.3 25.0 ?5.0 12 5 0.0 81.3 16 North/VVest 4 934 0.0 0.0 7.1 0.0 42.9 -4/. g 7 1 00 85.8 14
Urban 2.6 1726 8.7 26.1 4.3 2.2 19.6 32.6 4.3 0.0 87.0 46 Rural 1.1 1291 7.1 0.0 7.1 0.0 35.7 35.7 14.3 00 78.5 14 Nomadic 0.6 664 0.0 0.0 25.0 0.0 50.0 00 00 25 .0 50.0 4
0-11 months 1.4 777 9.1 9.1 9.1 0.0 18.2 36.4 9.1 9.1 72 .8 11 12-23 months 2.2 497 9.1 18.2 0.0 0.0 36.4 27.3 9 .1 0.0 91.0 11 24-35 months 1.7 881 0.0 20.0 6.7 0.0 26.7 46.7 00 0.0 93.4 15 36-4 7 months 1.6 782 7.7 15.4 0.0 0.0 30.8 38 .5 00 7.7 92.4 13 48-59 months 1.9 852 11.8 23.5 11 .8 5.9 17.6 17.6 11 8 0.0 70.5 17
Mother's education None 1.5 2858 9.1 18.2 9.1 2.3 22.7 31.8 4.5 2 3 81.8 44 Primary 3.1 451 0.0 21.4 0.0 0.0 28 .6 35.7 7 1 7.1 88.7 14 Secondary+ 2.0 248 0.0 20.0 0.0 0.0 40.0 20.0 20 0 00 80.0 5
rots I 1.6 3789 8.1 19.2 3.1 3.3 24.5 33.9 6 3 3.1 85.8 64
World Summit for Children Goal :-Number 24
27
.. . . F ....
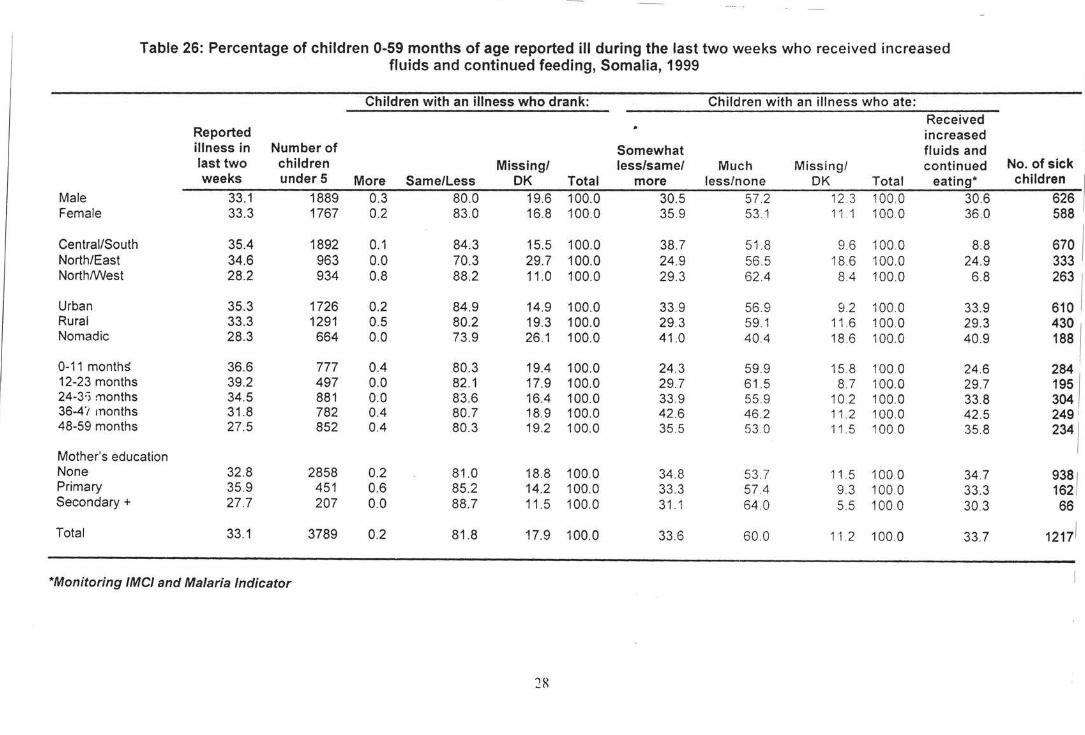
Table 26: Percentage of children 0-59 months of age reported ill during the last two weeks who received increased fluids and continued feeding, Somalia, 1999
Children with an illness who drank: Children with an illness who ate: Received
Reported increased illness in Number of Somewhat fluids and last two children Missing/ less/same/ Much Missing/ continued No. of sick weeks under5 More Same/Less OK Total more less/none DK Total eating* children
Male 33.1 1889 0.3 80.0 19.6 100.0 30.5 57 .2 12.3 100 0 30.6 626 Female 33.3 1767 0.2 83.0 16.8 100.0 35.9 53.1 11 . 1 100 0 36.0 588
Central/South 35.4 1892 0.1 84.3 15.5 100.0 38.7 51.8 9.6 100 0 8.8 670 1 North/East 34.6 963 0.0 70.3 29.7 100.0 24.9 56.5 18.6 100.0 24.9 333 North/West 28.2 934 0.8 88.2 11 .0 100.0 29.3 62.4 8.4 100.0 6.8 263 1
Urban 35.3 1726 0.2 84.9 14.9 100.0 33.9 56.9 9.2 100.0 33.9 610 Rural 33.3 1291 0.5 80.2 19.3 100.0 29.3 59.1 11.6 100.0 29.3
430 I Nomadic 28.3 664 0.0 73.9 26.1 100.0 41.0 40.4 18.6 100.0 40.9 188
0-11 monthS 36.6 777 0.4 80.3 19.4 100.0 I
24.3 59.9 15.8 100.0 24.6 284 12-23 months 39.2 497 0.0 82.1 17.9 100.0 29.7 61.5 8.7 100 0 29.7 195 24-3·) months 34.5 881 0.0 83.6 16.4 100.0 33.9 55.9 10.2 100.0 33.8 304 36-4'i months 31.8 782 0.4 80.7 18.9 100.0 42.6 46 .2 11.2 100 0 42.5 249 48-59 months 27.5 852 0.4 80.3 19.2 100.0 35.5 53 .0 11.5 100 0 35.8 234 1
Mother's education None 32.8 2858 0.2 81.0 18.8 100.0 34.8 53.7 11.5 100 0 34.7 938 1 Primary 35.9 451 0.6 85.2 14.2 100.0 33.3 57.4 9.3 100 0 33.3 162 Secondary+ 27.7 207 0.0 88.7 11.5 100.0 31.1 64 .0 5.5 100 0 30.3 66
Total 33.1 3789 0.2 81.8 17.9 100.0 33.6 60 .0 11.2 100.0 33.7 12171
*Monitoring fMC/ and Malaria Indicator
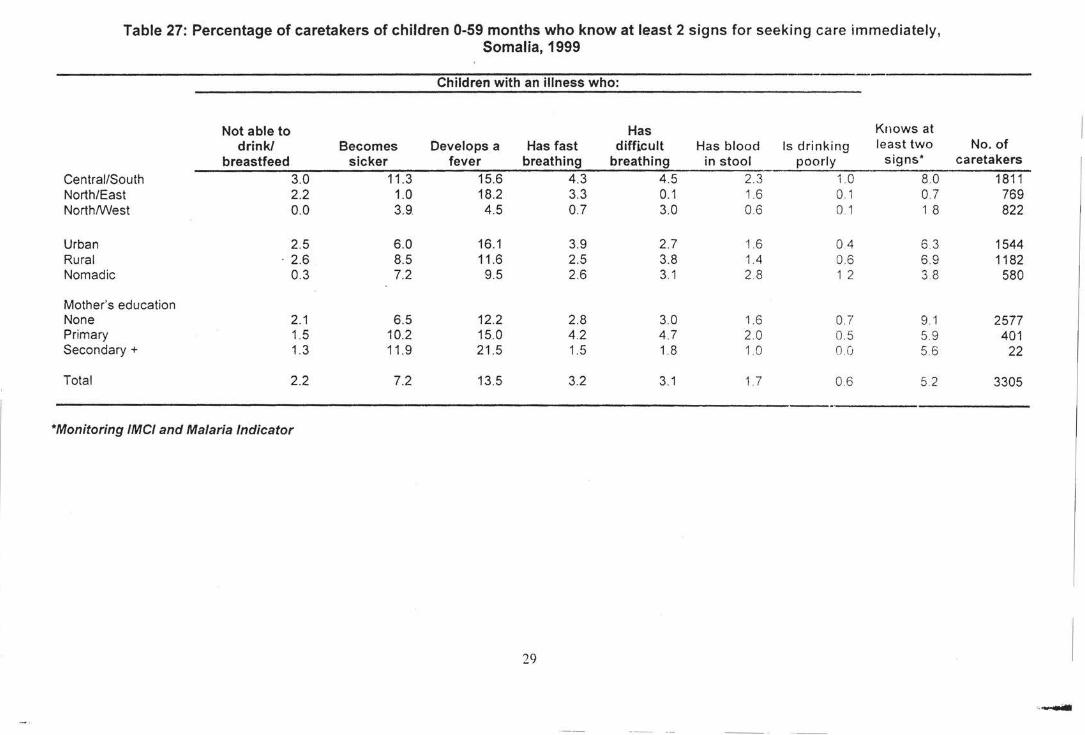
Table 27: Percentage of caretakers of children 0-59 months who know at least 2 signs for seeking care immediately, Somalia, 1999
Children with an illness who:
Not able to Has Knows at drink/ Becomes Develops a Has fast difficult Has blood Is drinking least two
breastfeed sicker fever breathing breathing in stool poorly signs*
Central/South 3.0 11 .3 15.6 4.3 4.5 2.3 1.0 8.0 North/East 2.2 1.0 18.2 3.3 0.1 1.6 0 1 0.7 NorthNVest 0.0 3.9 4.5 0.7 3.0 0.6 0 1 1 8
Urban 2.5 6.0 16.1 3.9 2.7 1.6 0.4 63 Rural . 2.6 8.5 11 .6 2.5 3.8 1.4 0.6 6.9 Nomadic 0.3 7.2 9.5 2.6 3.1 2.8 1 2 3 8
Mother's education None 2.1 6.5 12.2 2.8 3.0 1.6 0. 7 9.1 Primary 1.5 10.2 15.0 4.2 4.7 2.0 0.5 5.9 Secondary+ 1.3 11 .9 21 .5 1.5 1.8 1.0 OJ; 56
Total 2.2 7.2 13.5 3.2 3.1 1. 7 0.6 5.2
*Monitoring fMC/ and Malaria Indicator
29
No. of caretakers
1811 769 822
1544 1182
580
2577 401
22
3305
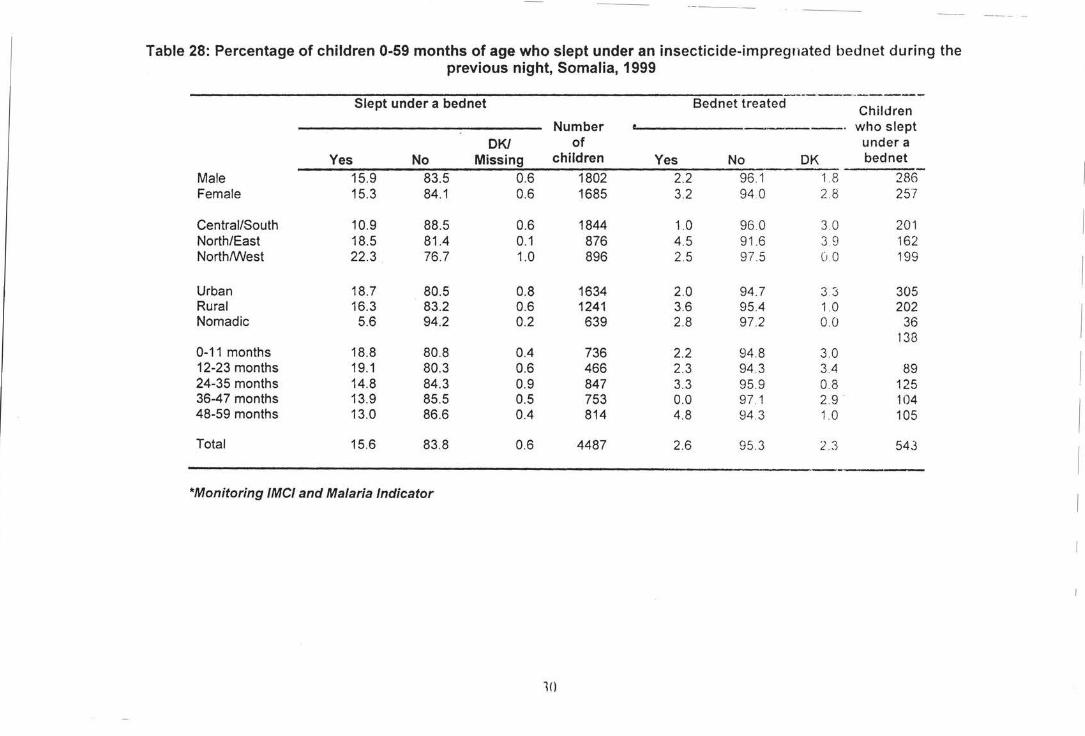
-----
Table 28: Percentage of children 0-59 months of age who slept under an insecticide-impregnated bednet during the previous night, Somalia, 1999
---·-------Slept under a bednet Bednet treated Children Number who slept
OK/ of under a Yes No Missing children Yes No OK bed net
I Male 15.9 83.5 0.6 1802 2.2 96.1 1.8 286 Female 15.3 84.1 0.6 1685 3.2 94 .0 2.8 257
Central/South 10.9 88.5 0.6 1844 1.0 96 .0 3.0 201 I North/East 18.5 81.4 0.1 876 4.5 91 .6 3 9 162 North/West 22.3 76.7 1.0 896 2.5 97.5 (J 0 199
I Urban 18.7 80.5 0.8 1634 2.0 94 .7 3 3 305 Rural 16.3 83.2 0.6 1241 3.6 95.4 1.0 202
I Nomadic 5.6 94.2 0.2 639 2.8 97.2 0.0 36 138
0-11 months 18.8 80.8 0.4 736 2.2 94 .8 3.0
I 12-23 months 19.1 80.3 0.6 466 2.3 94.3 3.4 89 24-35 months 14.8 84.3 0.9 847 3.3 95.9 0.8 125 36-47 months 13.9 85.5 0.5 753 0.0 97 .1 2. 9 104
I 48-59 months 13.0 86.6 0.4 814 4.8 94.3 1.0 105
Total 15.6 83 .8 0.6 4487 2.6 95.3 2.3 543
I ----*Monitoring fMC/ and Malaria Indicator
10
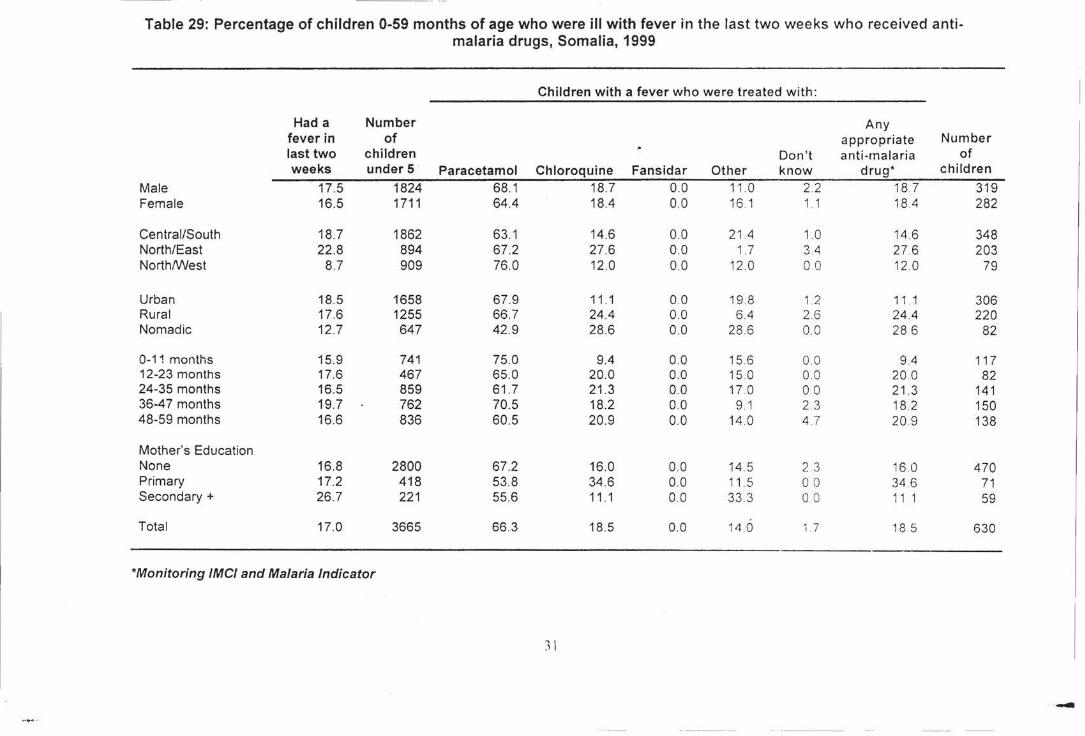
Table 29: Percentage of children 0-59 months of age who were ill with fever in the last two weeks who received anti-malaria drugs, Somalia, 1999
Children with a fever who were treated with:
Had a Number Any fever in of appropriate Number last two children Don't anti -malaria of weeks under 5 Paracetamol Chloroquine Fansidar Other know drug* children
Male 17.5 1824 68.1 18.7 0.0 11.0 2.2 18.7 319 Female 16.5 1711 64.4 18.4 00 16 1 1 . 1 18.4 282
Central/South 18.7 1862 63.1 14.6 0.0 21.4 1.0 14.6 348 North/East 22.8 894 67 .2 27.6 0.0 1.7 3.4 27 .6 203 North/West 8.7 909 76.0 12.0 0.0 12 .0 00 12 .0 79
Urban 18.5 1658 67.9 11 .1 00 19.8 1 2 11 1 306 Rural 17.6 1255 66.7 24.4 0.0 6.4 2.6 24.4 220 Nomadic 12.7 647 42.9 28.6 0.0 28.6 00 28 6 82
0-11 months 15.9 741 75.0 9.4 0.0 15.6 00 9.4 117 12-23 months 17.6 467 65.0 20.0 0.0 15.0 00 20.0 82 24-35 months 16.5 859 61 .7 21.3 0.0 17.0 00 21 .3 141 36-4 7 months 19.7 762 70.5 18.2 0.0 9.1 2.3 18.2 150 48-59 months 16.6 836 60.5 20.9 0.0 14.0 47 20 9 138
Mother's Education None 16.8 2800 67.2 16.0 0.0 14.5 2 3 16.0 470 Primary 17.2 418 53.8 34.6 00 11.5 0 0 34.6 71 Secondary+ 26.7 221 55.6 11 .1 00 33 .3 0 0 11 1 59
Total 17.0 3665 66.3 18.5 0.0 14.0 1.7 18.5 630
*Monitoring IMCI and Malaria Indicator
) l
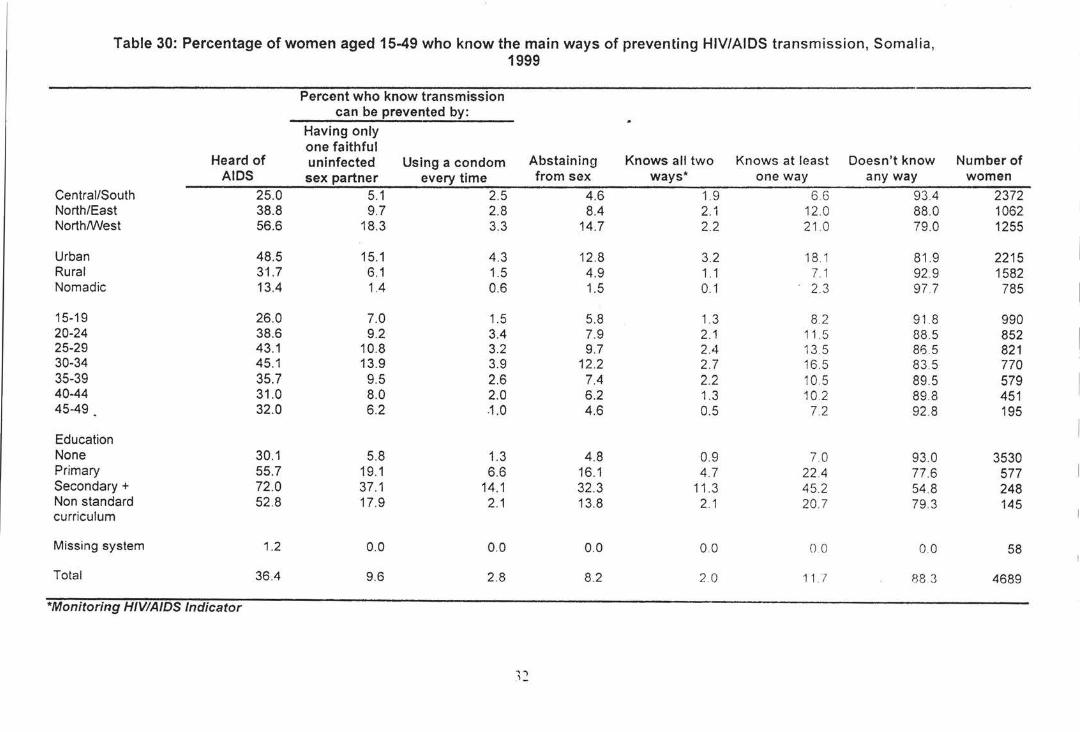
Table 30: Percentage of women aged 15-49 who know the main ways of preventing HIV/AIDS transmission, Somalia,
Percent who know transmission can be prevented by:
Having only one faithful
Heard of uninfected Using a condom AIDS sex partner every time
Central/South 25.0 5.1 2.5 North/East 38.8 9.7 2.8 North/West 56.6 18.3 3.3
Urban 48.5 15.1 4.3 Rural 3'1.7 6.1 1.5 Nomadic 13.4 1.4 0.6
15-19 26.0 7.0 1.5 20-24 38.6 9.2 3.4 25-29 43.1 10.8 3.2 30-34 45.1 13.9 3.9 35-39 35.7 9.5 2.6 40-44 31.0 8.0 2.0 45-49 32.0 6.2 .1.0
Education None 30.1 5.8 1.3 Primary 55.7 19.1 6.6 Secondary+ 72.0 37.1 14.1 Non standard 52.8 17.9 2.1 curriculum
Missing system 1.2 0.0 0.0
Total 36.4 9.6 2.8
*Monitoring HJVIAIDS Indicator
1999
"'') ,_
Abstaining from sex
4.6 8.4
14.7
12.8 4.9 1.5
5.8 7.9 9.7
12.2 7.4 6.2 4.6
4.8 16.1 32.3 13.8
0.0
8.2
Knows all two ways*
1.9 2.1 2.2
3.2 1.1 0.1
1.3 2.1 2.4 2.7 2.2 1.3 0.5
0.9 4.7
11.3 2.1
00
2 .0
Knows at least Doesn't know one way any way
66 93.4 12.0 88.0 21 .0 79.0
18 1 81.9 7.1 92.9 2.3 97 7
8.2 91.8 11 .5 88.5 13.5 86.5 16.5 83 5 10.5 89.5 10.2 89.8 7.2 92 .8
70 93.0 22.4 77.6 45.2 54.8 20.7 79.3
00 00
11 l 88.3
Number of women
2372 1062 1255
2215 1582 785
990 852 821 770 579 451 195
3530 577 248 145
58
4689
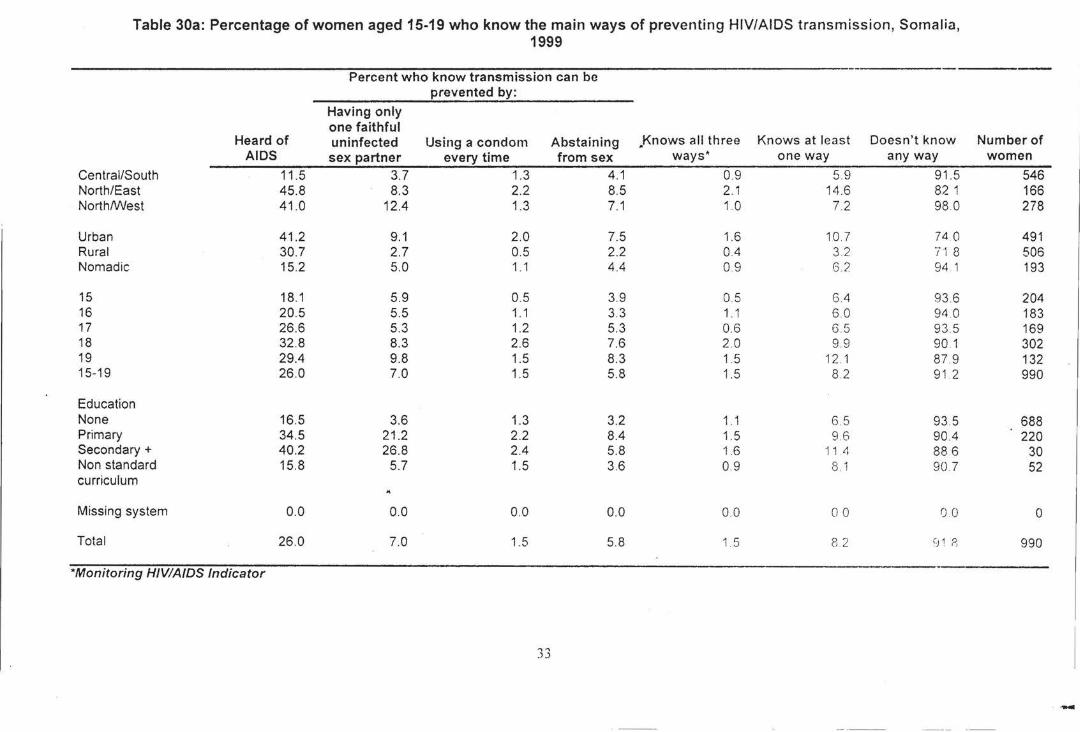
Table 30a: Percentage of women aged 15-19 who know the main ways of preventing HIV/AIDS transmission, Somalia, 1999
Percent who know transmission can be prevented by:
Having only one faithful
Heard of uninfected Using a condom Abstaining .Knows all three Knows at least Doesn't know Number of AIDS sex partner every time from sex ways• one way any way women
Central/South 11.5 3.7 1.3 4.1 0.9 5.9 91 .5 546 North/East 45.8 8.3 2.2 8.5 2.1 14 .6 82 1 166 North/West 41 .0 12.4 1.3 7.1 1.0 7.2 98.0 278
Urban 41.2 9.1 2.0 7.5 1.6 10.7 74 0 491 Rural 30.7 2.7 0.5 2.2 0.4 3.2. 71 8 506 Nomadic 15.2 5.0 1.1 4.4 0.9 6.2 94 1 193
15 18.1 5.9 0.5 3.9 0.5 6.4 93.6 204 16 20.5 5.5 1.1 3.3 1 . 1 6.0 94 .0 183 17 26.6 5.3 1.2 5.3 0.6 6.5 93 .5 169 18 32.8 8.3 2.6 7.6 2.0 9.9 90 1 302 19 29.4 9.8 1.5 8.3 1.5 12 1 87.9 132 15-19 26.0 7.0 1.5 5.8 1.5 8.2 91 .2 990
Education None 16.5 3.6 1.3 3.2 1 . 1 6 5 93.5 688 Primary 34.5 21 .2 2.2 8.4 1.5 9.6 904 220 Secondary+ 40.2 26.8 2.4 5.8 1.6 11.4 88 6 30 Non standard 15.8 5.7 1.5 3.6 0.9 8.1 90 7 52 curriculum
Missing system 0.0 0.0 0.0 0.0 00 00 00 0
Total 26.0 7.0 1.5 5.8 1 5 8.2 ~J 1 8 990
*Monitoring HIV/AJDS Indicator
-
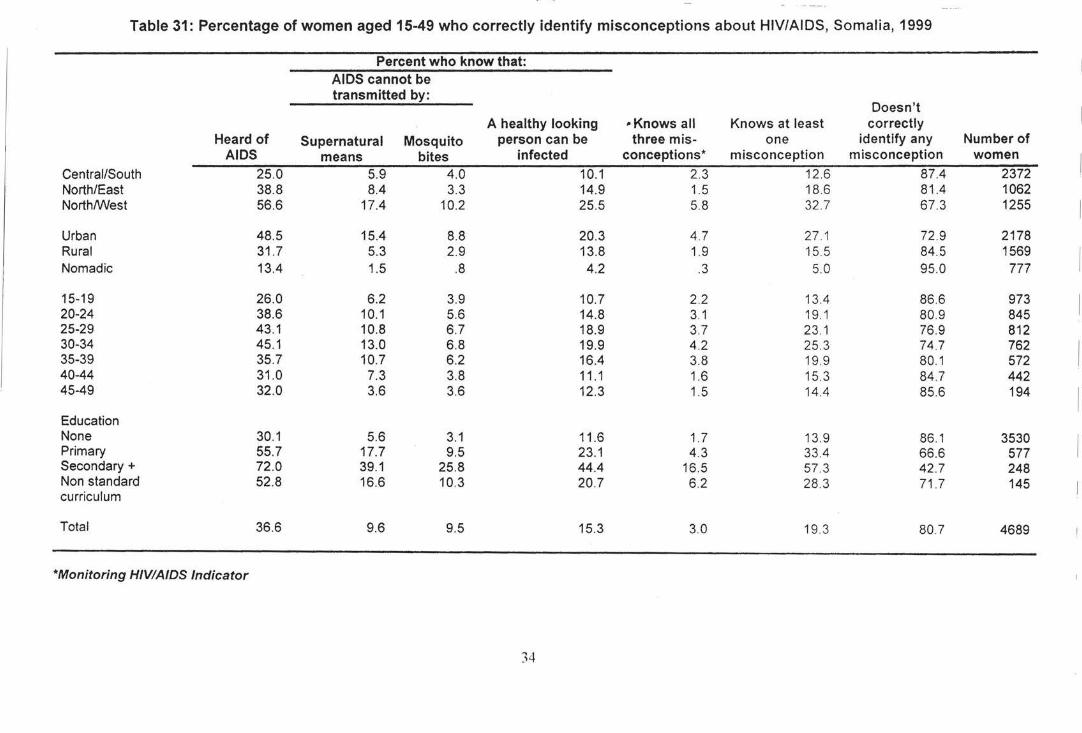
Table 31: Percentage of women aged 15-49 who correctly identify misconceptions about HIV/AIDS, Somalia, 1999
Percent who know that: AIDS cannot be transmitted by:
Doesn't A healthy looking -Knows all Knows at least correctly
Heard of Supernatural Mosquito person can be three mis- one identify any Number of AIDS means bites infected conceptions* misconception misconception women
Central/South 25.0 5.9 4.0 10.1 2.3 12.6 87.4 2372 North/East 38.8 8.4 3.3 14.9 1.5 18.6 81.4 1062 North/West 56.6 17.4 10.2 25.5 5.8 32 .7 67.3 1255
Urban 48.5 15.4 8.8 20.3 4.7 27 .1 72.9 2178 Rural 31 .7 5.3 2.9 13.8 1.9 15.5 84.5 1569 Nomadic 13.4 1.5 .8 4.2 .3 5.0 95.0 777
15-19 26.0 6.2 3.9 10.7 2.2 13.4 86.6 973 20-24 38.6 10.1 5.6 14.8 3.1 19.1 80.9 845 25-29 43.1 10.8 6.7 18.9 3.7 23 .1 76.9 812 30-34 45.1 13.0 6.8 19.9 4.2 25 .3 74.7 762 35-39 35.7 10.7 6.2 16.4 3.8 19.9 80.1 572 40-44 31 .0 7.3 3.8 11.1 1.6 15.3 84.7 442 45-49 32.0 3.6 3.6 12.3 1.5 14.4 85.6 194
Education None 30.1 5.6 3.1 11 .6 1.7 13.9 86.1 3530 Primary 55.7 17.7 9.5 23.1 4.3 33.4 66.6 577 Secondary+ 72.0 39.1 25.8 44.4 16.5 57.3 42.7 248 Non standard 52.8 16.6 10.3 20.7 6.2 28 .3 71 .7 145 curriculum
Total 36.6 9.6 9.5 15.3 3.0 19.3 80 7 4689
*Monitoring HIV/AIDS Indicator
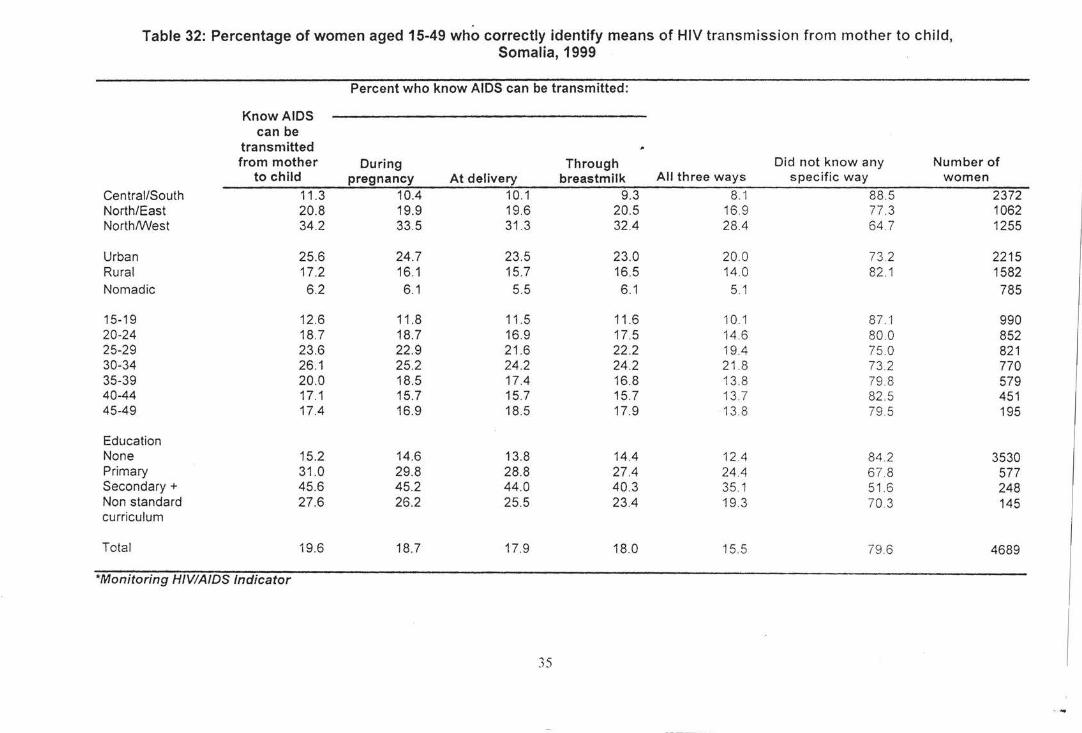
Table 32: Percentage of women aged 15-49 who correctly identify means of HIV transmission from mother to child, Somalia, 1999
Percent who know AIDS can be transmitted:
Know AIDS can be
transmitted from mother During Through Did not know any Number of
to child pregnancy At delivery breastmilk All three ways specific way women
Central/South 11.3 10.4 10.1 9.3 8.1 88.5 2372 North/East 20.8 19.9 19.6 20.5 16.9 77 .3 1062 North/West 34.2 33.5 31 .3 32.4 28.4 64.7 1255
Urban 25.6 24.7 23.5 23.0 20.0 73 2 2215 Rural 17.2 16.1 15.7 16.5 14.0 82 .1 1582 Nomadic 6.2 6.1 5.5 6.1 5.1 785
15-19 12.6 11.8 11.5 11 .6 10.1 87."1 990 20-24 18.7 18.7 16.9 17.5 14 .6 80 .0 852 25-29 23.6 22.9 21 .6 22.2 19.4 75.0 821 30-34 26.1 25.2 24.2 24.2 21 .8 73 .2 770 35-39 20.0 18.5 17.4 16.8 13.8 79 8 579 40-44 17.1 15.7 15.7 15.7 13.7 82 .5 451 45-49 17.4 16.9 18.5 17.9 13.8 79.5 195
Education None 15.2 14.6 13.8 14.4 12.4 84 .2 3530 Primary 31.0 29.8 28.8 27.4 24.4 67 .8 577 Secondary+ 45.6 45.2 44.0 40.3 35.1 51 .6 248 Non standard 27.6 26.2 25.5 23.4 19.3 70.3 145 curriculum
Total 19.6 18.7 17.9 18.0 15.5 79.6 4689
*Monitoring HIVIAIDS Indicator
35
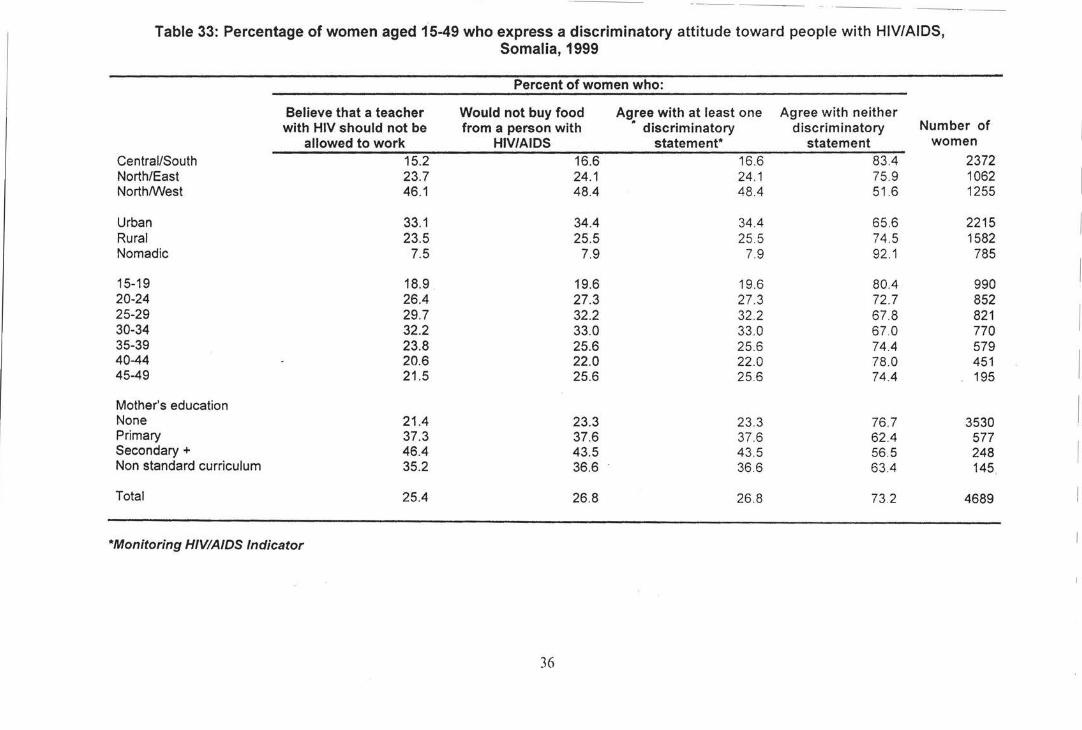
- -------
Table 33: Percentage of women aged 15-49 who express a discriminatory attitude toward people with HIV/AIDS, Somalia, 1999
Percent of women who:
Believe that a teacher Would not buy food Agree with at least one Agree with neither with HIV should not be from a person with • discriminatory discriminatory Number of
allowed to work HIV/AIDS statement* statement women
Central/South 15.2 16.6 16.6 83.4 2372 North/East 23.7 24.1 24.1 75 _9 1062 North/West 46.1 48.4 48.4 51.6 1255
Urban 33.1 34.4 34.4 65.6 2215 Rural 23.5 25.5 25 _5 74.5 1582 Nomadic 7.5 7.9 7.9 92.1 785
15-19 18.9 19.6 19.6 80.4 990 20-24 26.4 27.3 27.3 72.7 852 25-29 29.7 32.2 32.2 67.8 821 30-34 32.2 33.0 33.0 67.0 770 35-39 23.8 25.6 25.6 74.4 579 40-44 20.6 22.0 22.0 78.0 451 45-49 21 .5 25.6 25.6 74_4 195
Mother's education None 21.4 23.3 23.3 76.7 3530 Primary 37.3 37.6 37.6 62.4 577 Secondary+ 46.4 43.5 43.5 56.5 248 Non standard curriculum 35.2 36.6 36.6 63.4 145
Total 25.4 26.8 26.8 73 _2 4689
*Monitoring HIVIAIDS Indicator
36
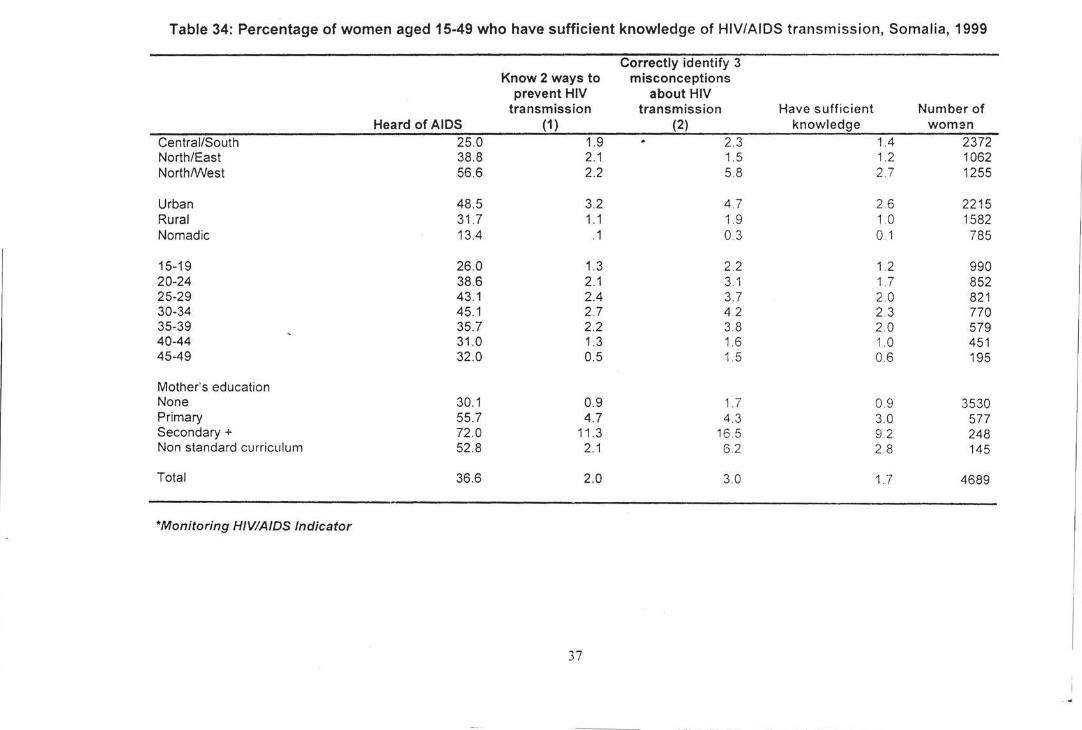
Table 34: Percentage of women aged 15-49 who have sufficient knowledge of HIV/AIDS transmission, Somalia, 1999
Correctly identify 3 Know 2 ways to misconceptions
prevent HIV about HIV transmission transmission Have sufficient Number of
Heard of AIDS (1) (2) knowledge woman Central/South 25.0 1.9 2.3 1.4 2372 North/East 38.8 2.1 1.5 1.2 1062 North/West 56.6 2.2 5.8 2.7 1255
Urban 48.5 3.2 4.7 2.6 2215 Rural 31 .7 1.1 1.9 1 0 1582 Nomadic 13.4 .1 03 0.1 785
15-19 26.0 1.3 2.2 1.2 990 20-24 38.6 2.1 3.1 1.7 852 25-29 43.1 2.4 3.7 2.0 821 30-34 45.1 2.7 4.2 2.3 770 35-39 35.7 2.2 3.8 2.0 579 40-44 31.0 1.3 1.6 1.0 451 45-49 32.0 0.5 1.5 0.6 195
Mother's education None 30.1 0.9 1. 7 0.9 3530 Primary 55.7 4.7 4.3 3.0 577 Secondary+ 72 .0 11 .3 16.5 92 248 Non standard curriculum 52.8 2.1 6.2 2 8 145
Total 36.6 2.0 3.0 1.7 4689
*Monitoring HIV/A/DS Indicator
37
...
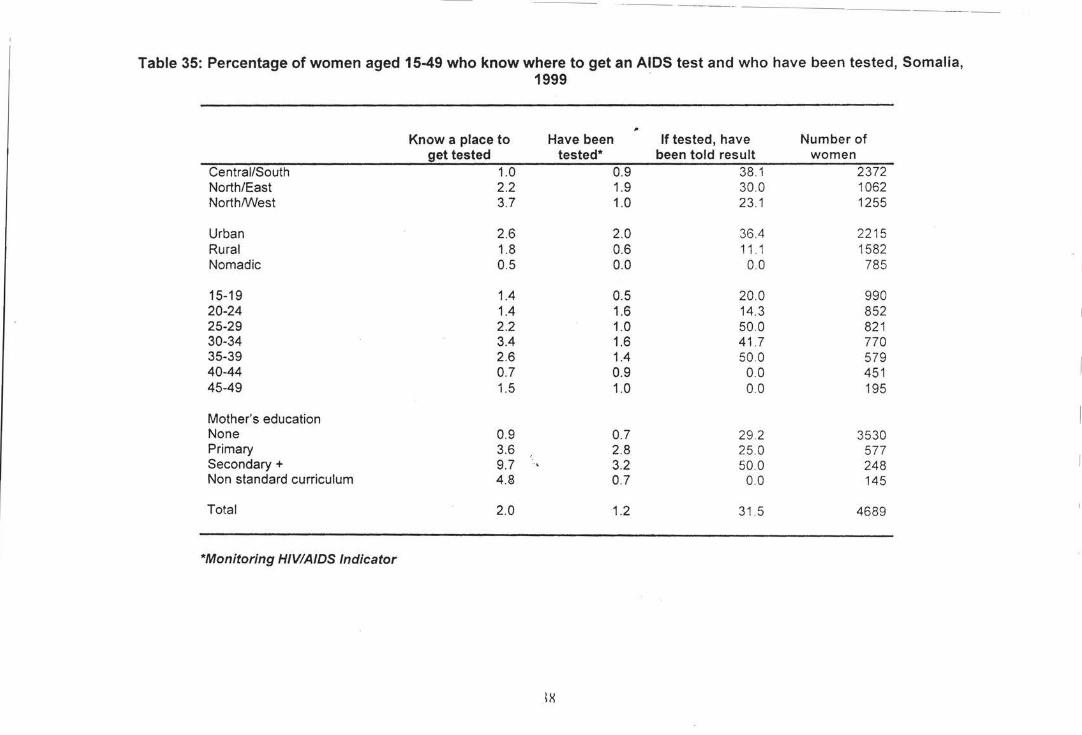
--- - -- ---------- --- -
Table 35: Percentage of women aged 15-49 who know where to get an AIDS test and who have been tested, Somalia, 1999 -
Know a place to Have been If tested, have Number of get tested tested* been told result women
Central/South 1.0 0.9 38.1 2372 North/East 2.2 1.9 30.0 1062 North/V\Iest 3.7 1.0 23.1 1255
Urban 2.6 2.0 36.4 2215 Rural 1.8 0.6 11 1 1582 Nomadic 0.5 0.0 00 785
15-19 1.4 0.5 20.0 990 20-24 1.4 1.6 14.3 852 25-29 2.2 1.0 50.0 821 30-34 3.4 1.6 41.7 770 35-39 2.6 1.4 50.0 579 40-44 0.7 0.9 0.0 451 45-49 1.5 1.0 0.0 195
Mother's education None 0.9 0.7 29 .2 3530 Primary 3.6 2.8 25.0 577 Secondary+ 9.7 3.2 50.0 248 Non standard curriculum 4.8 0.7 0.0 145
Total 2.0 1.2 31 .5 4689
*Monitoring HIVIA/DS Indicator
IX
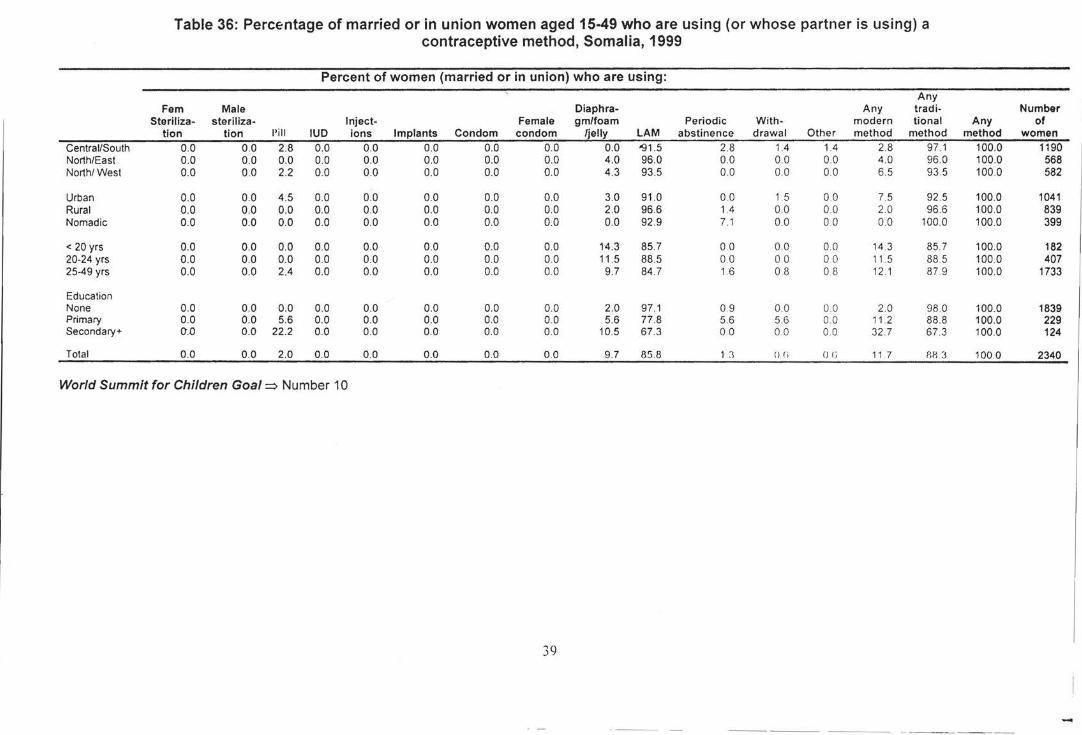
Table 36: Percentage of married or in union women aged 15-49 who are using (or whose partner is using) a contraceptive method, Somalia, 1999
Percent of women (married or in union) who are using: Any
Fem Male Diaphra- Any trad i- Number Steriliza- steriliza- Inject- Female gm/foam Periodic With - modern tiona I Any of
tlon tion I' ill IUD ions Implants Condom condom /jelly LAM abstinence drawal Other method method method women
Central/South 0.0 0.0 2.8 0.0 0.0 0.0 0.0 0.0 0.0 '91 .5 2.8 1.4 1.4 2.8 97 .1 100.0 1190 North/East 0.0 0.0 0.0 0.0 0.0 0.0 0.0 0.0 4.0 96.0 0.0 0.0 0.0 4.0 96.0 100.0 568 North/West 0.0 0.0 2.2 0.0 0.0 0.0 0.0 0.0 4.3 93.5 0.0 0.0 0.0 6. 5 93.5 100.0 582
Urban 0.0 0.0 4.5 0.0 0.0 0.0 0.0 0.0 3.0 91 .0 0.0 1.5 0.0 7.5 92 .5 100.0 1041 Rural 0.0 0.0 0.0 0.0 0.0 0.0 0.0 0.0 2.0 96.6 1.4 0.0 00 2.0 96.6 100.0 839 Nomadic 0.0 0.0 0.0 0.0 0.0 0.0 0.0 0.0 0.0 92 .9 7.1 0.0 0.0 0.0 100.0 100.0 399
< 20 yrs 0.0 0.0 0.0 0.0 0.0 0.0 0.0 0.0 14.3 85.7 00 0.0 0 0 14.3 85.7 100.0 182 20-24 yrs 0.0 0.0 0.0 0.0 0.0 0.0 0.0 00 11 .5 88.5 0.0 0 0 0.0 11. 5 88.5 100.0 407 25-49 yrs 0.0 0.0 2.4 0.0 0.0 0.0 0.0 0.0 9.7 84.7 1.6 0.8 0.8 12.1 87.9 100.0 1733
Education None 0.0 0.0 0.0 0.0 0.0 0.0 0.0 0.0 2.0 97.1 0.9 0.0 00 2.0 98 .0 100.0 1839 Primary 0.0 0.0 5.6 0.0 0.0 0.0 0.0 0.0 5.6 77.8 5.6 5.6 00 11.2 88.8 100.0 229 Secondary+ 0.0 0.0 22.2 0.0 0.0 0.0 0.0 00 10.5 67.3 0.0 00 0 0 32.7 67.3 100.0 124
Total 0.0 0.0 2.0 0.0 0.0 0.0 0.0 0.0 9.7 85 .8 Ll () () () ( j 11.7 HIU 100.0 2340
World Summit for Children Goal=> Number 10
39
---- ·---
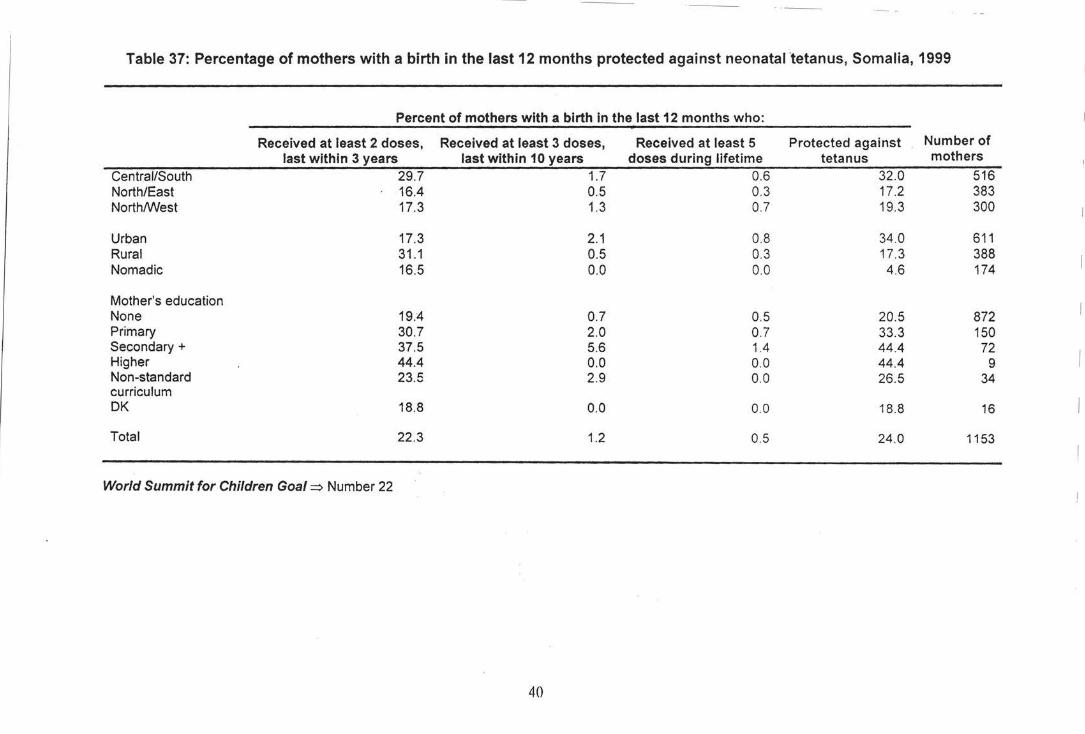
Table 37: Percentage of mothers with a birth in the last 12 months protected against neonatal 'tetanus, Somalia, 1999
Percent of mothers with a birth In the last 12 months who:
Received at least 2 doses, Received at least 3 doses, Received at least 5 Protected against Number of last within 3 years last within 10 years doses during lifetime tetanus mothers
Central/South 29.7 1.7 0.6 32.0 516 North/East 16.4 0.5 0.3 17.2 383 NorthM'est 17.3 1.3 0.7 19.3 300
Urban 17.3 2.1 0.8 34 .0 611 Rural 31.1 0.5 0.3 17.3 388 Nomadic 16.5 0.0 0.0 4.6 174
Mother's education None 19.4 0.7 0.5 20.5 872 Primary 30.7 2.0 0.7 33.3 150 Secondary+ 37.5 5.6 1.4 44.4 72 Higher 44.4 0.0 0.0 44.4 9 Non-standard 23.5 2.9 0.0 26.5 34 curriculum DK 18.8 0.0 0.0 18.8 16
Total 22.3 1.2 0.5 24.0 1153
World Summit for Children Goal~ Number 22
40
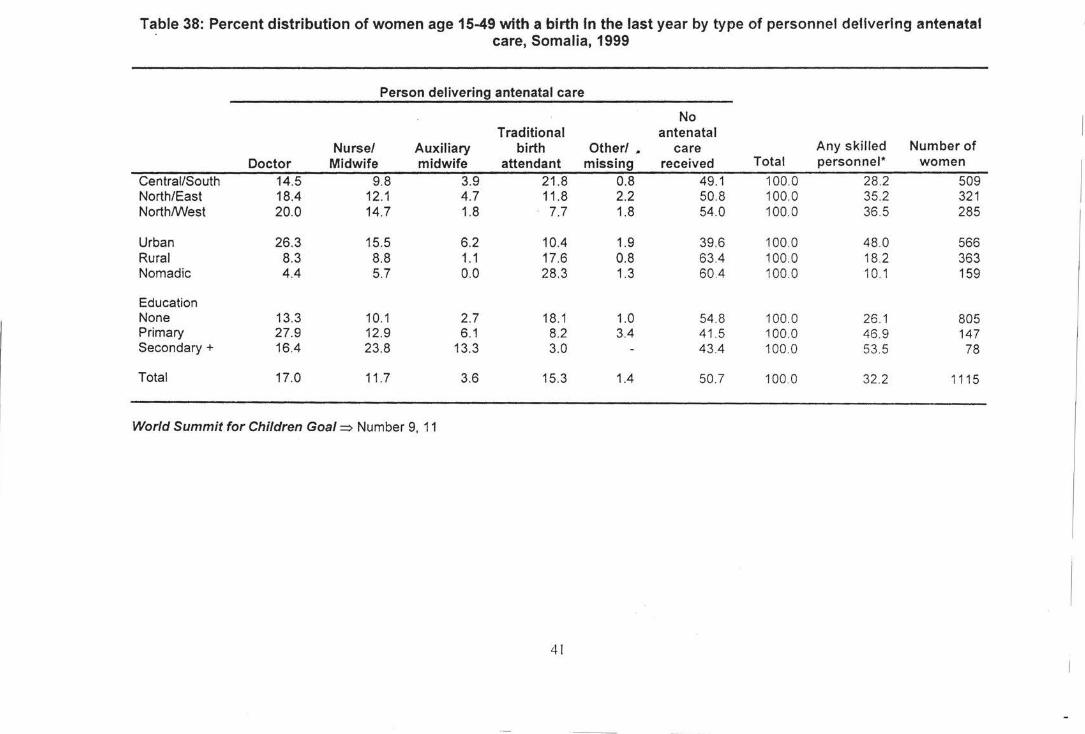
Table 38: Percent distribution of women age 15-49 with a birth In the last year by type of personnel delivering antenatal care, Somalia, 1999
Person delivering antenatal care
No Traditional antenatal
Nurse/ Auxiliary birth Other/ _ care Any skilled Number of Doctor Midwife midwife attendant missing received Total personnel* women
Central/South 14.5 9.8 3.9 21 .8 0.8 49.1 100.0 28.2 509 North/East 18.4 12.1 4.7 11 .8 2.2 50.8 100.0 35.2 321 North/West 20.0 14.7 1.8 7.7 1.8 54.0 100.0 36 .5 285
Urban 26.3 15.5 6.2 10.4 1.9 39.6 100.0 48.0 566 Rural 8.3 8.8 1.1 17.6 0.8 63.4 100.0 18.2 363 Nomadic 4.4 5.7 0.0 28.3 1.3 604 100.0 10.1 159
Education None 13.3 10.1 2.7 18.1 1.0 54.8 100.0 26 .1 805 Primary 27.9 12.9 6.1 8.2 3.4 41 .5 100.0 46.9 147 Secondary+ 164 23.8 13.3 3.0 43.4 100.0 53 .5 78
Total 17.0 11 .7 3.6 15.3 1.4 50.7 100.0 32.2 1115
World Summit for Children Goal=> Number 9, 11
4!
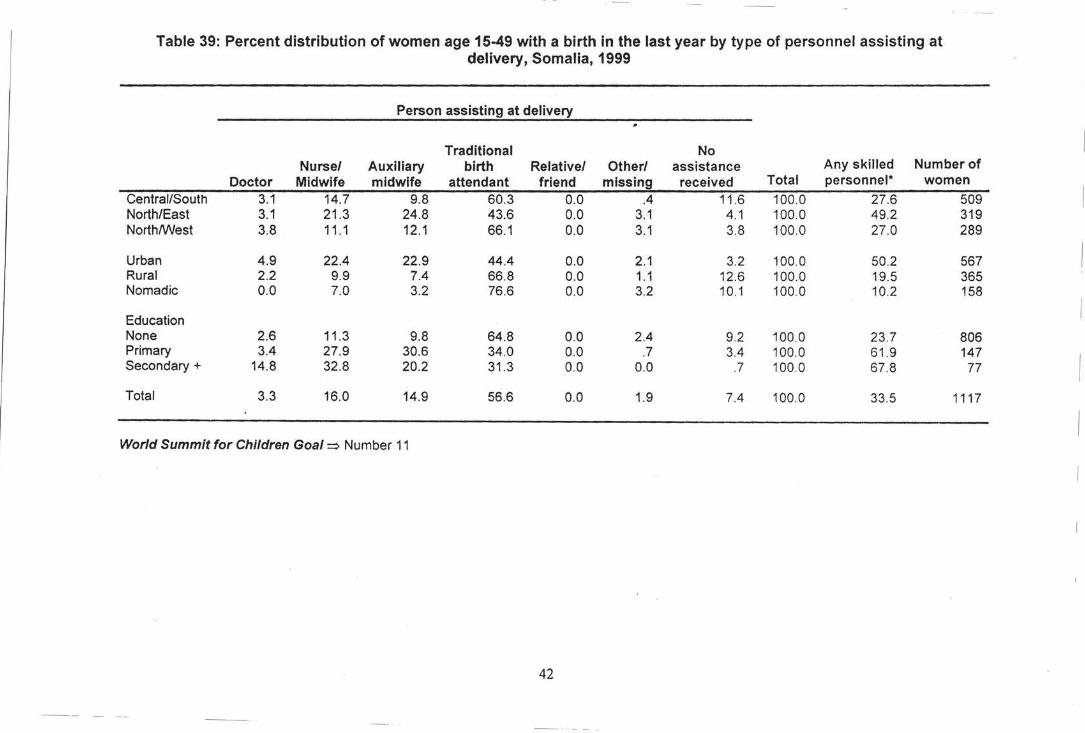
Table 39: Percent distribution of women age 15-49 with a birth in the last year by type of personnel assisting at delivery, Somalia, 1999
Person assisting at delivery
Traditional No Nurse/ Auxiliary birth Relative/ Other/ assistance Any skilled Number of
Doctor Midwife midwife attendant friend missing received Total personnel* women
Central/South 3.1 14.7 9.8 60.3 0.0 .4 11.6 100.0 27.6 509 North/East 3.1 21.3 24.8 43.6 0.0 3.1 4.1 100.0 49.2 319 North/West 3.8 11 .1 12.1 66.1 0.0 3.1 3.8 100.0 27.0 289
Urban 4.9 22.4 22.9 44.4 0.0 2.1 3.2 100.0 50.2 567 Rural 2.2 9.9 7.4 66.8 0.0 1.1 12.6 100.0 19.5 365 Nomadic 0.0 7.0 3.2 76.6 0.0 3.2 10.1 100.0 10.2 158
Education None 2.6 11 .3 9.8 64.8 0.0 2.4 9.2 100.0 23.7 806 Primary 3.4 27.9 30.6 34.0 0.0 .7 3.4 100.0 61 .9 147 Secondary+ 14.8 32.8 20.2 31 .3 0.0 0.0 .7 100.0 67.8 77
Total 3.3 16.0 14.9 56.6 0.0 1.9 7.4 100.0 33.5 1117
World Summit for Children Goal~ Number 11
42
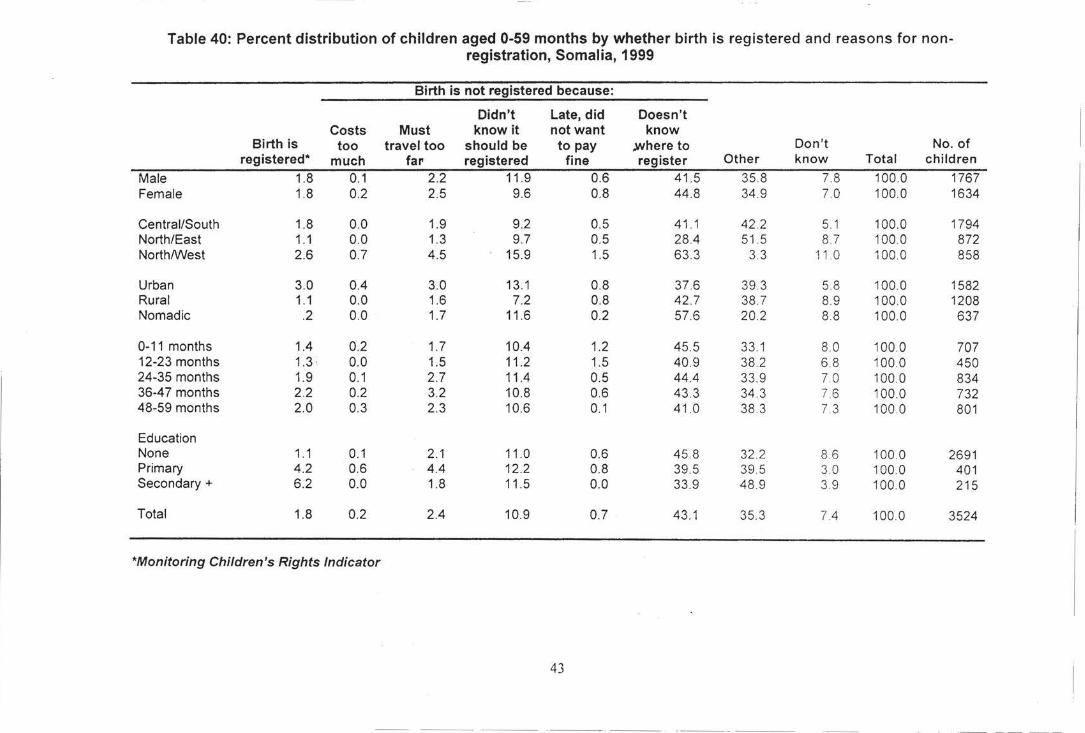
Table 40: Percent distribution of children aged 0-59 months by whether birth is registered and reasons for non-registration, Somalia, 1999
Birth is not registered because:
Didn't Late, did Doesn 't Costs Must know it not want know
Birth is too travel too should be to pay .where to Don't No. of registered* much far registered fine register Other know Total children
Male 1.8 0.1 2.2 11 .9 0.6 41 .5 35.8 7.8 100.0 1767 Female 1.8 0.2 2.5 9.6 0.8 44.8 34.9 7. 0 100.0 1634
Central/South 1.8 0.0 1.9 9.2 0.5 41.1 42 .2 5.1 100.0 1794 North/East 1.1 0.0 1.3 9.7 0.5 28.4 51 5 8.7 100 0 872 North/West 2.6 0.7 4.5 15.9 1.5 63 .3 3.3 11 .0 100 0 858
Urban 3.0 0.4 3.0 13.1 0.8 37 .6 39.3 5.8 100.0 1582 Rural 1.1 0.0 1.6 7.2 0.8 42 .7 38 .7 8.9 100.0 1208 Nomadic .2 0.0 1.7 11.6 0.2 57.6 20.2 8.8 100.0 637
0-11 months 1.4 0.2 1.7 10.4 1.2 45 .5 33.1 8. 0 100 0 707 12-23 months 1.3 . 0.0 1.5 11 .2 1.5 40.9 38 .2 6.8 100 0 450 24-35 months 1.9 0.1 2.7 11.4 0.5 44.4 33. 9 70 100.0 834 36-47 months 2.2 0.2 3.2 10.8 0.6 43.3 34 .3 7.6 100 0 732 48-59 months 2.0 0.3 2.3 10.6 0.1 41 .0 38 3 7.3 1000 801
Education None 1.1 0.1 2.1 11.0 0.6 45.8 32. 2 8.6 100.0 2691 Primary 4.2 0.6 4.4 12.2 0.8 39.5 39 5 3.0 100 0 401 Secondary+ 6.2 0.0 1.8 11.5 0.0 33.9 48 .9 3.9 100.0 215
Total 1.8 0.2 2.4 10.9 0.7 43.1 35.3 7.4 100.0 3524
*Monitoring Children's Rights Indicator
43
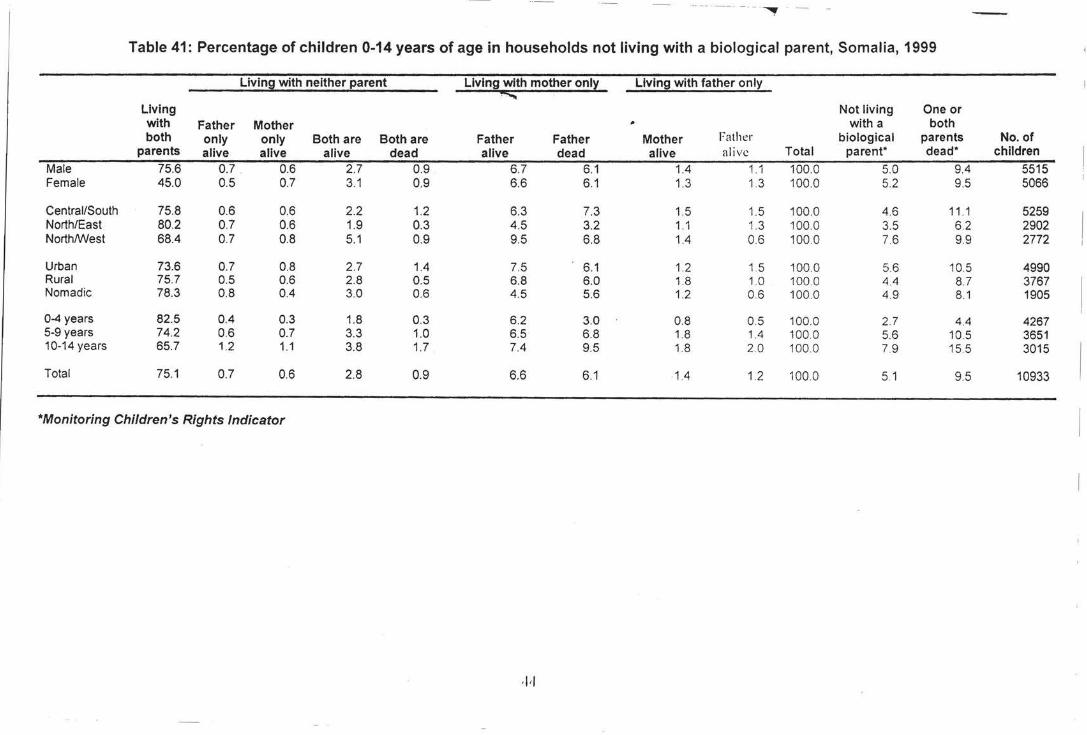
·-- -- -- - · · - ~
Table 41: Percentage of children 0-14 years of age in households not living with a biological parent, Somalia, 1999
Living with neither parent Llvin9 with mother onl~ Living with father only
""""" Living Not living One or with Father Mother with a both both only only Both are Both are Father Father Mother Father biological parents No. of
parents alive alive alive dead alive dead alive alive Total parent• dead• children Male 75.6 0.7 0.6 2.7 0.9 6.7 6.1 1.4 1.1 100.0 5.0 9.4 5515 Female 45.0 0.5 0.7 3.1 0.9 6.6 6.1 1.3 1.3 100.0 5.2 9.5 5066
Central/South 75.8 0.6 0.6 2.2 1.2 6.3 7.3 1.5 1_5 100.0 4_6 11 .1 5259 North/East 80.2 0.7 0.6 1.9 0.3 4.5 3.2 1.1 1.3 100.0 3.5 6.2 2902 NorthfvVest 68.4 0.7 0.8 5.1 0.9 9.5 6.8 1.4 0_6 100.0 7.6 99 2772
Urban 73.6 0.7 0.8 2.7 1.4 7.5 6.1 1.2 1.5 100 0 5.6 10.5 4990 Rural 75.7 0.5 0.6 2.8 0.5 6.8 6.0 1.8 1_0 100.0 4.4 8.7 3767 Nomadic 78.3 0.8 0.4 3.0 0.6 4.5 5.6 1.2 0.6 100.0 4.9 8.1 1905
0-4 years 82.5 0.4 0.3 1.8 0.3 6.2 3.0 0.8 0_5 100.0 2.7 4_4 4267 5-9 years 74.2 0.6 0.7 3.3 1.0 6.5 6.8 1.8 1.4 100_0 5.6 10.5 3651 10-14 years 65.7 1.2 1.1 3.8 1.7 7.4 9.5 1.8 2.0 100.0 7.9 15.5 3015
Total 75.1 0.7 0.6 2.8 0.9 6.6 6.1 1.4 1.2 100.0 5.1 9.5 10933
*Monitoring Children's Rights Indicator
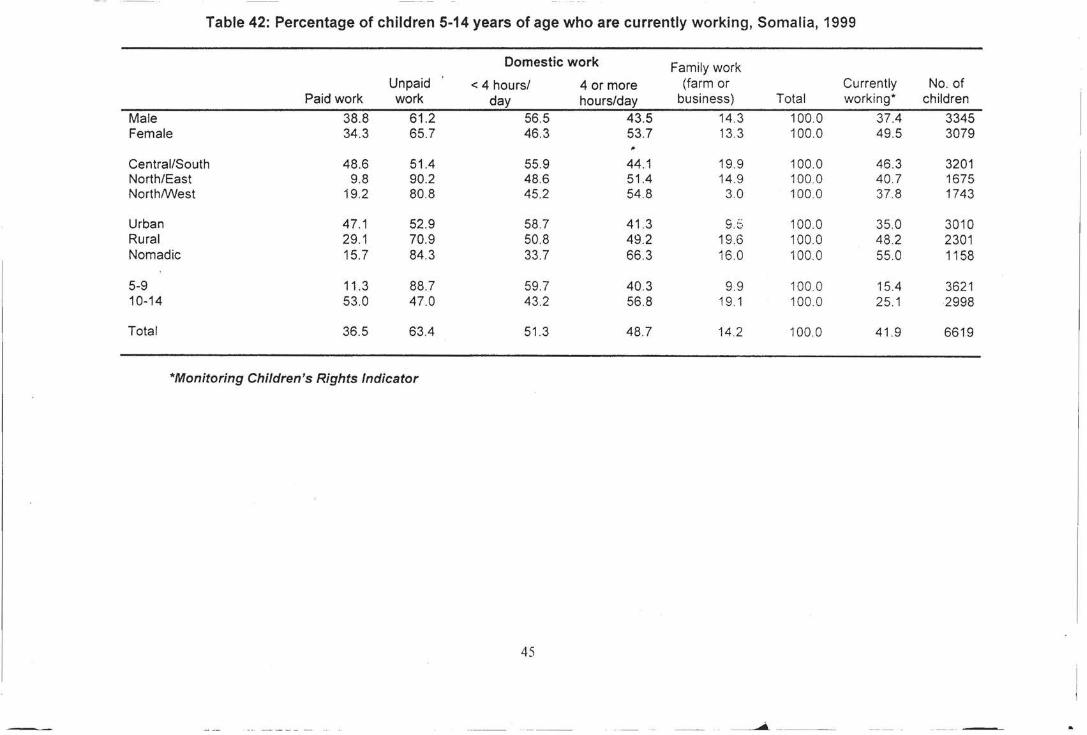
Table 42: Percentage of children 5-14 years of age who are currently working, Somalia, 1999
Domestic work Family work Unpaid < 4 hours/ 4 or more (farm or Currently No. of
Paid work work day hours/day business) Total working* children
Male 38.8 61 .2 56.5 43.5 14.3 100.0 37.4 3345 Female 34.3 65.7 46.3 53.7 13.3 100.0 49.5 3079
Central/South 48.6 51.4 55.9 44.1 19.9 100.0 46.3 3201 North/East 9.8 90.2 48.6 51.4 14.9 100.0 40.7 1675 NorthtVVest 19.2 80.8 45.2 54 .8 3.0 100 0 37.8 1743
Urban 47.1 52.9 58.7 41.3 9 ;c .-.) 100.0 35.0 3010
Rural 29.1 70.9 50.8 49.2 19.6 100.0 48.2 2301 Nomadic 15.7 84.3 33.7 66.3 16.0 100.0 55.0 1158
5-9 11 .3 88.7 59.7 40.3 9.9 100.0 15.4 3621 10-14 53.0 47.0 43.2 56.8 19.1 100.0 25.1 2998
Total 36.5 63.4 51.3 48.7 14.2 100.0 41.9 6619
*Monitoring Children's Rights Indicator
45