Embed Size (px)
Citation preview
CNIDARIAN ZOOPLANKTON DISTRIBUTION ACROSS GEOGRAPHICAL, VERTICAL, BIOTIC
AND ABIOTIC GRADIENTS IN THE MEDITERRANEAN SEA
Golo, R; Damian, A; Fuentes, V; Tilves, U; Acevedo, M; Canepa, A; Ziveri, P
Introduction Aims M&M Results Discussion Conclusion
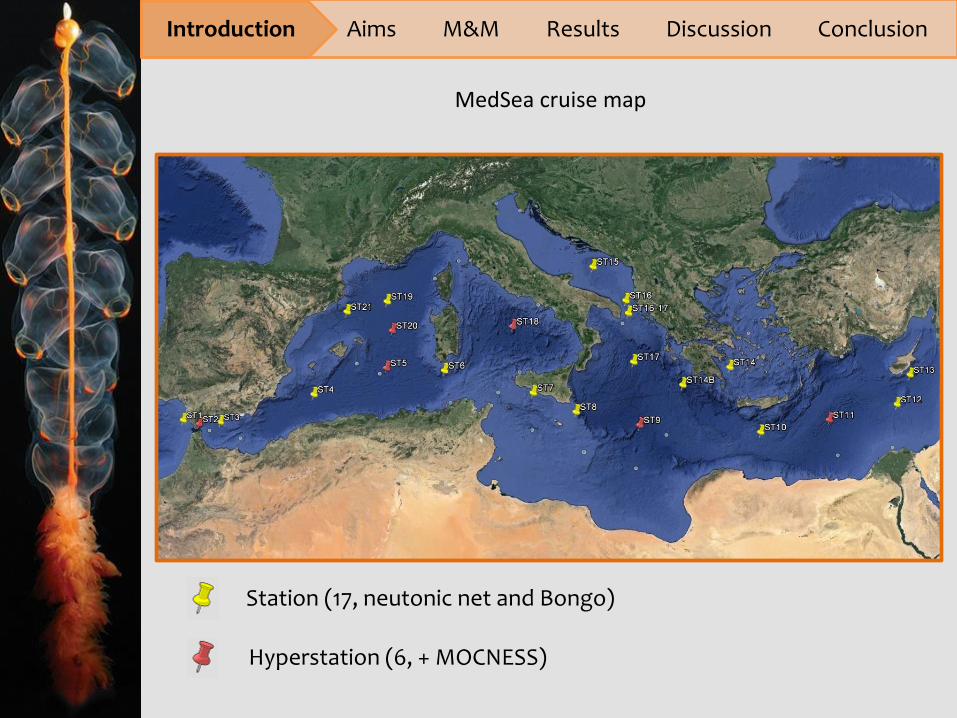
MedSea cruise map
Station (17, neutonic net and Bongo)
Hyperstation (6, + MOCNESS)
Introduction Aims M&M Results Discussion Conclusion
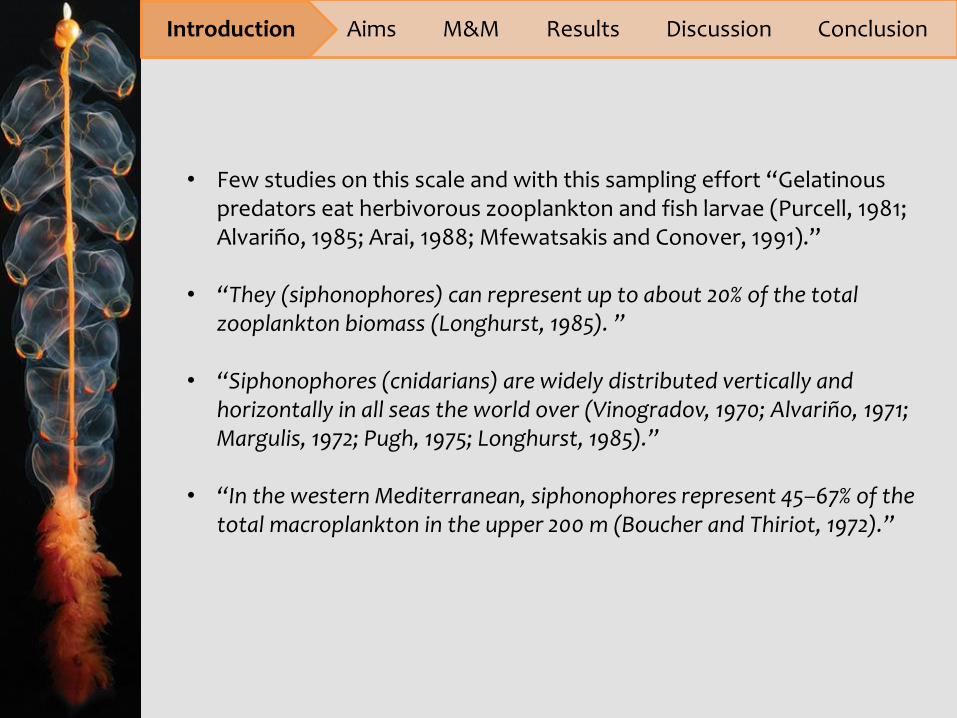
• Few studies on this scale and with this sampling effort “Gelatinous predators eat herbivorous zooplankton and fish larvae (Purcell, 1981; Alvariño, 1985; Arai, 1988; Mfewatsakis and Conover, 1991).”
• “They (siphonophores) can represent up to about 20% of the total zooplankton biomass (Longhurst, 1985). ”
• “Siphonophores (cnidarians) are widely distributed vertically and horizontally in all seas the world over (Vinogradov, 1970; Alvariño, 1971; Margulis, 1972; Pugh, 1975; Longhurst, 1985).”
• “In the western Mediterranean, siphonophores represent 45–67% of the
total macroplankton in the upper 200 m (Boucher and Thiriot, 1972).”
1. Determine the distribution and abundance of jellyfish in Mediterranean sea during May 2013
2. Determine the vertical distribution of jellyfish in the water column during May 2013
Introduction Aims M&M Results Discussion Conclusion
Introduction Aims M&M Results Discussion Conclusion
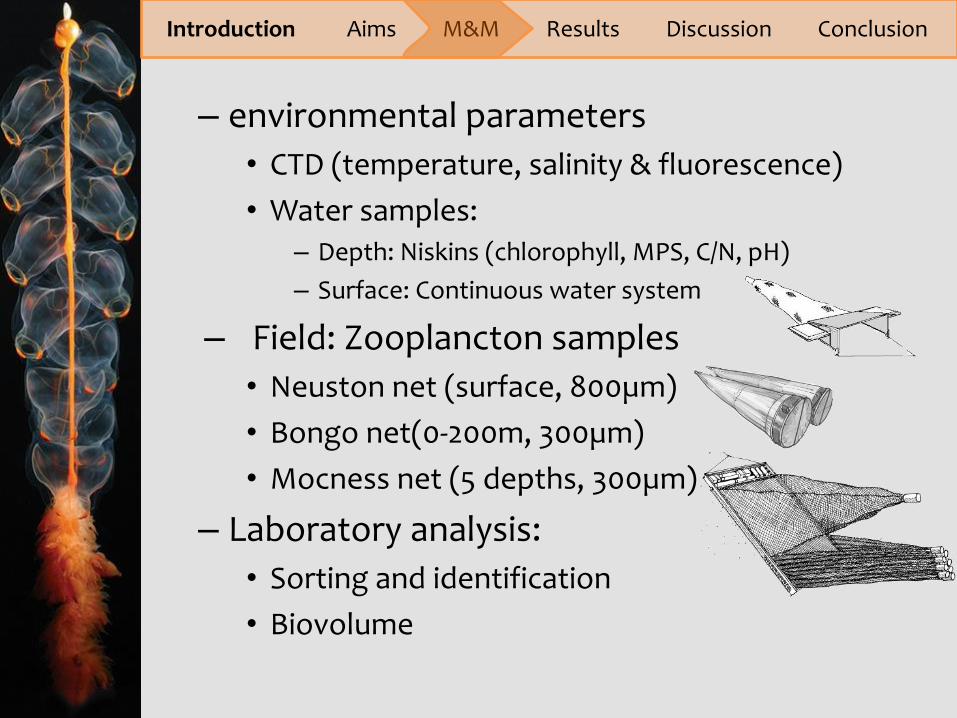
– environmental parameters
• CTD (temperature, salinity & fluorescence)
• Water samples: – Depth: Niskins (chlorophyll, MPS, C/N, pH)
– Surface: Continuous water system
– Field: Zooplancton samples
• Neuston net (surface, 800µm)
• Bongo net(0-200m, 300µm)
• Mocness net (5 depths, 300µm)
– Laboratory analysis:
• Sorting and identification
• Biovolume
Introduction Aims M&M Results Discussion Conclusion
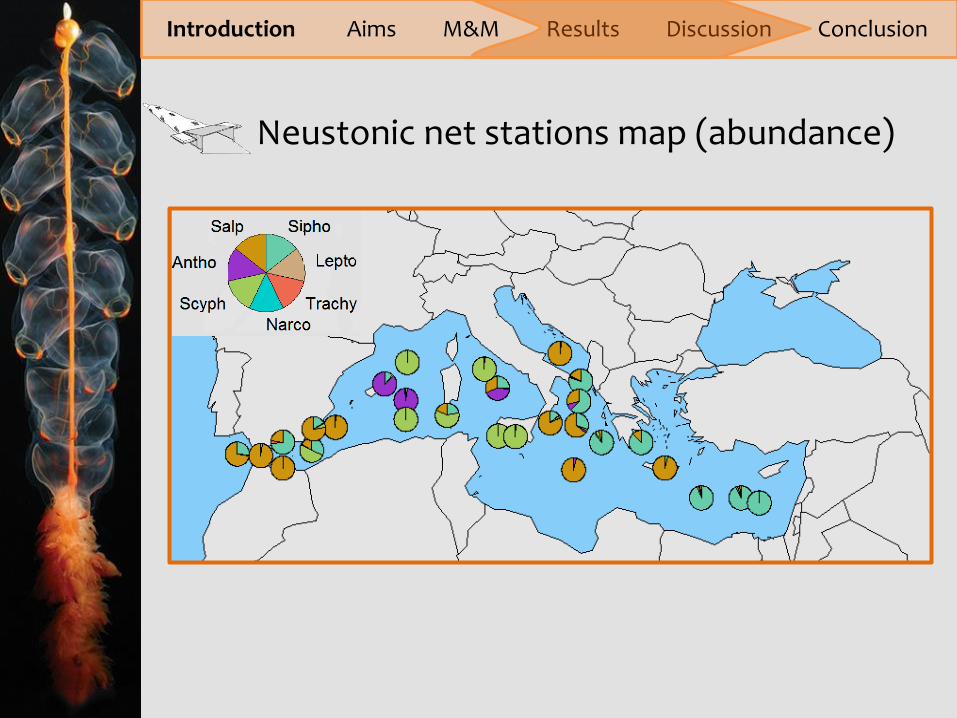
Neustonic net stations map (abundance)
Introduction Aims M&M Results Discussion Conclusion
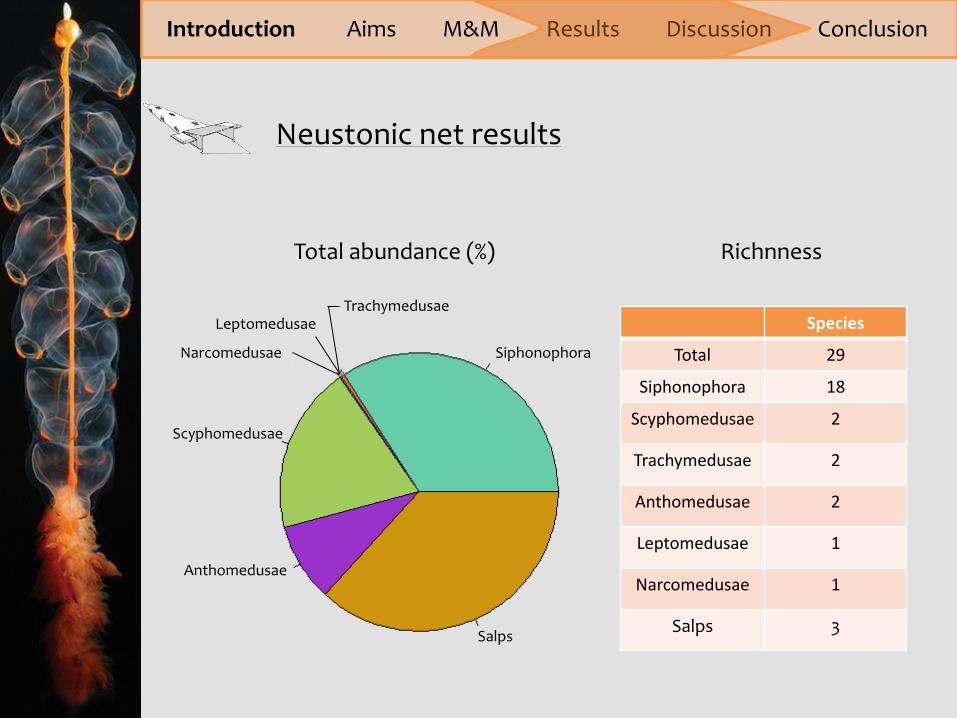
Total abundance (%)
Siphonophora
Salps
Leptomedusae Trachymedusae
Scyphomedusae
Anthomedusae
Narcomedusae
Species
Total 29
Siphonophora 18
Scyphomedusae 2
Trachymedusae 2
Anthomedusae 2
Leptomedusae 1
Narcomedusae 1
Salps 3
Richnness
Neustonic net results
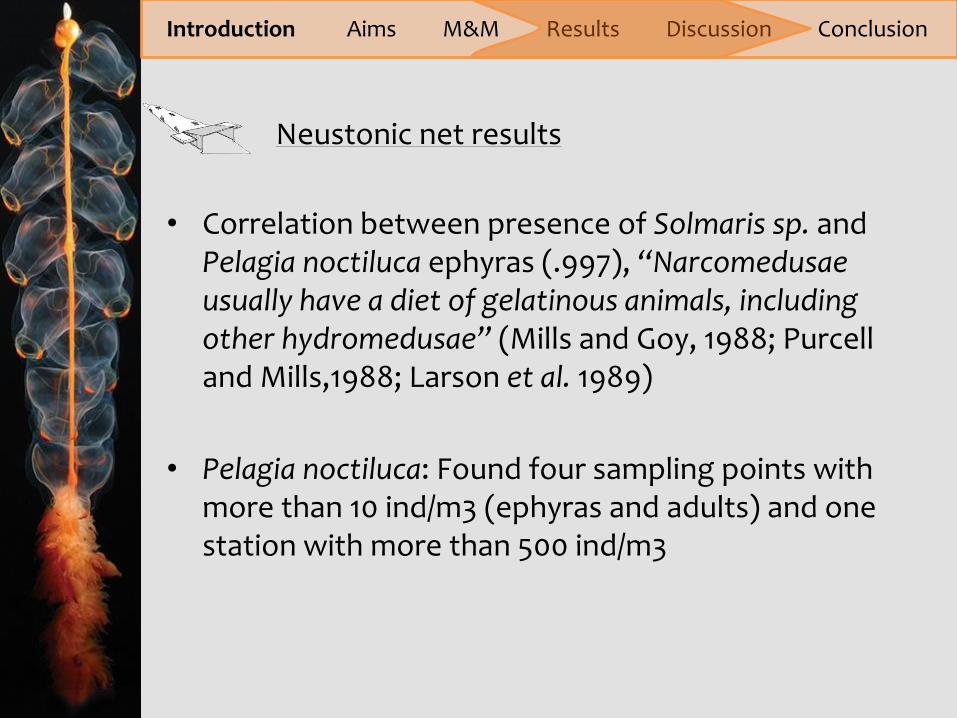
• Correlation between presence of Solmaris sp. and
Pelagia noctiluca ephyras (.997), “Narcomedusae usually have a diet of gelatinous animals, including other hydromedusae” (Mills and Goy, 1988; Purcell and Mills,1988; Larson et al. 1989)
• Pelagia noctiluca: Found four sampling points with more than 10 ind/m3 (ephyras and adults) and one station with more than 500 ind/m3
Introduction Aims M&M Results Discussion Conclusion
Neustonic net results
Introduction Aims M&M Results Discussion Conclusion
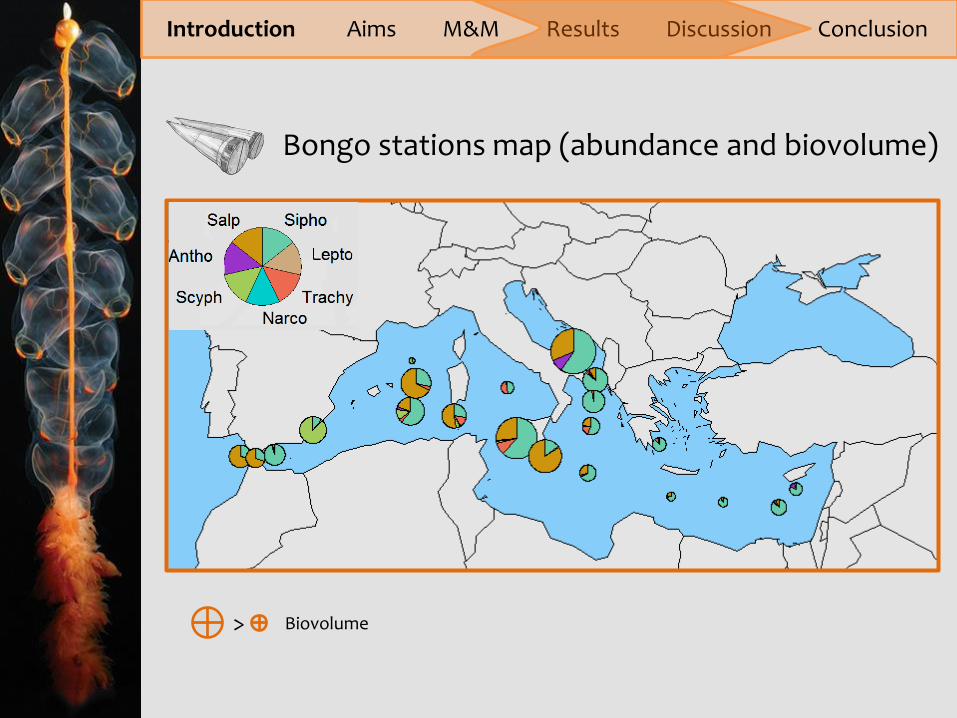
Bongo stations map (abundance and biovolume)
> Biovolume
Introduction Aims M&M Results Discussion Conclusion
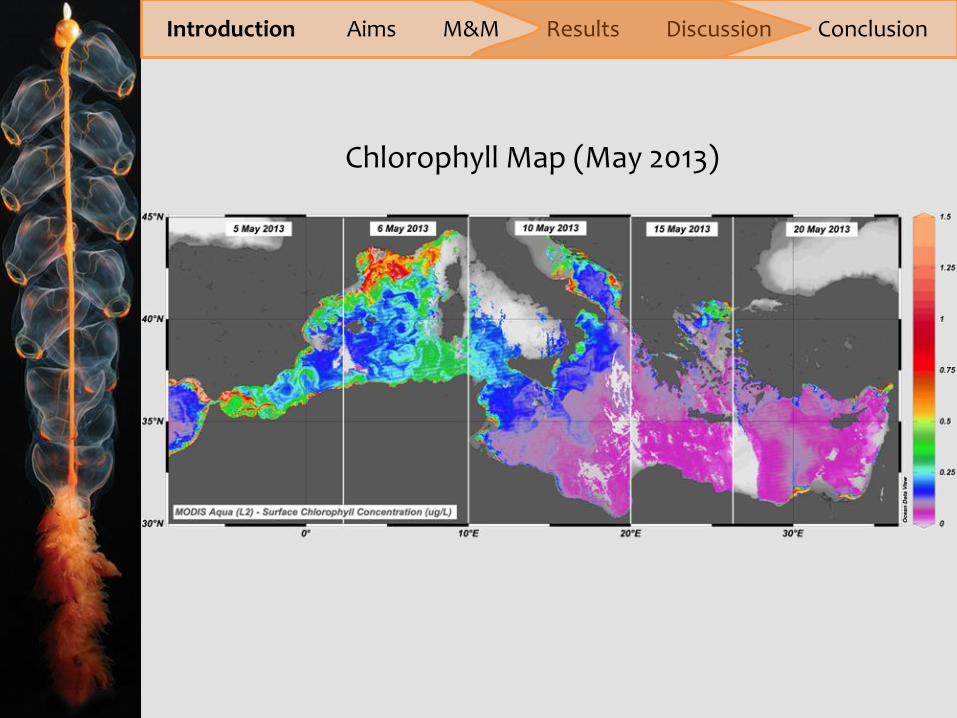
Chlorophyll Map (May 2013)
Introduction Aims M&M Results Discussion Conclusion
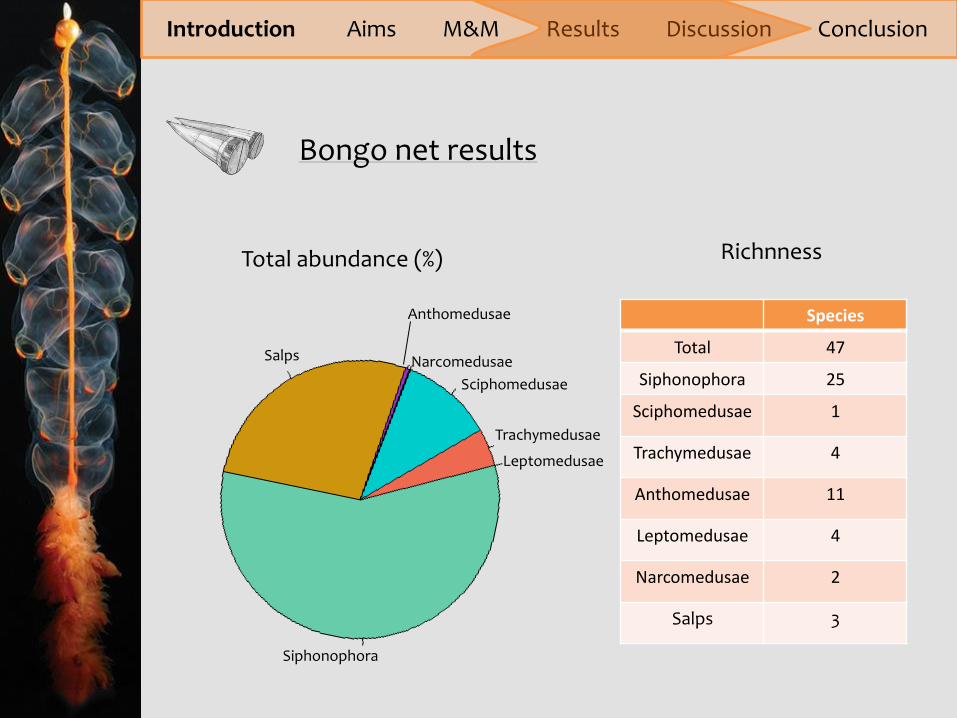
Species
Total 47
Siphonophora 25
Sciphomedusae 1
Trachymedusae 4
Anthomedusae 11
Leptomedusae 4
Narcomedusae 2
Salps 3
Siphonophora
Salps
Leptomedusae
Trachymedusae
Sciphomedusae
Anthomedusae
Narcomedusae
Total abundance (%) Richnness
Bongo net results
Introduction Aims M&M Results Discussion Conclusion
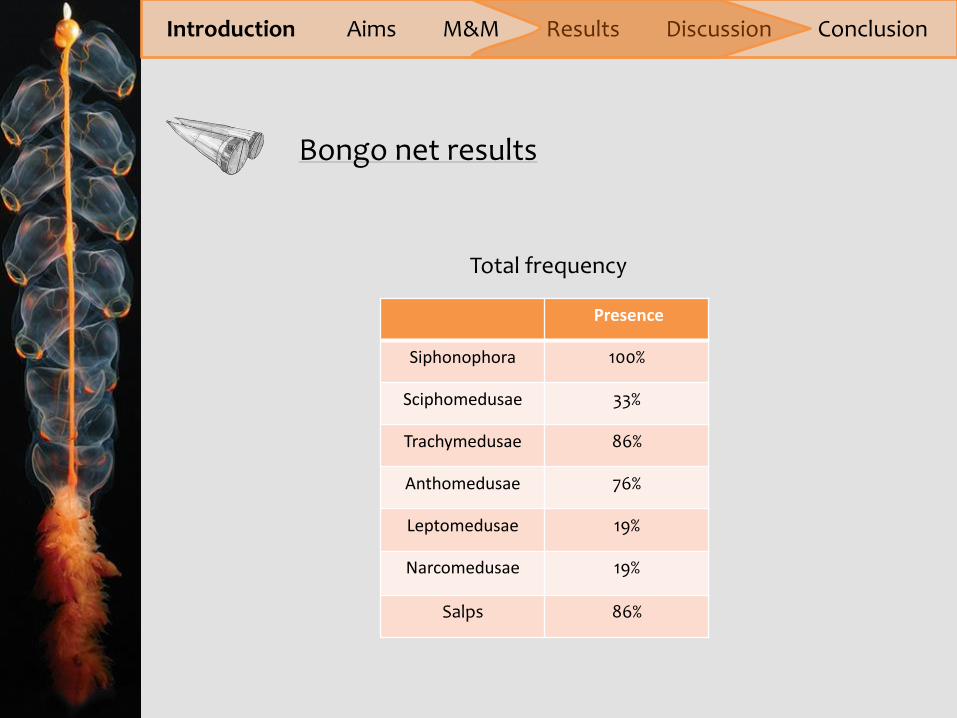
Total frequency
Presence
Siphonophora 100%
Sciphomedusae 33%
Trachymedusae 86%
Anthomedusae 76%
Leptomedusae 19%
Narcomedusae 19%
Salps 86%
Bongo net results
Introduction Aims M&M Results Discussion Conclusion
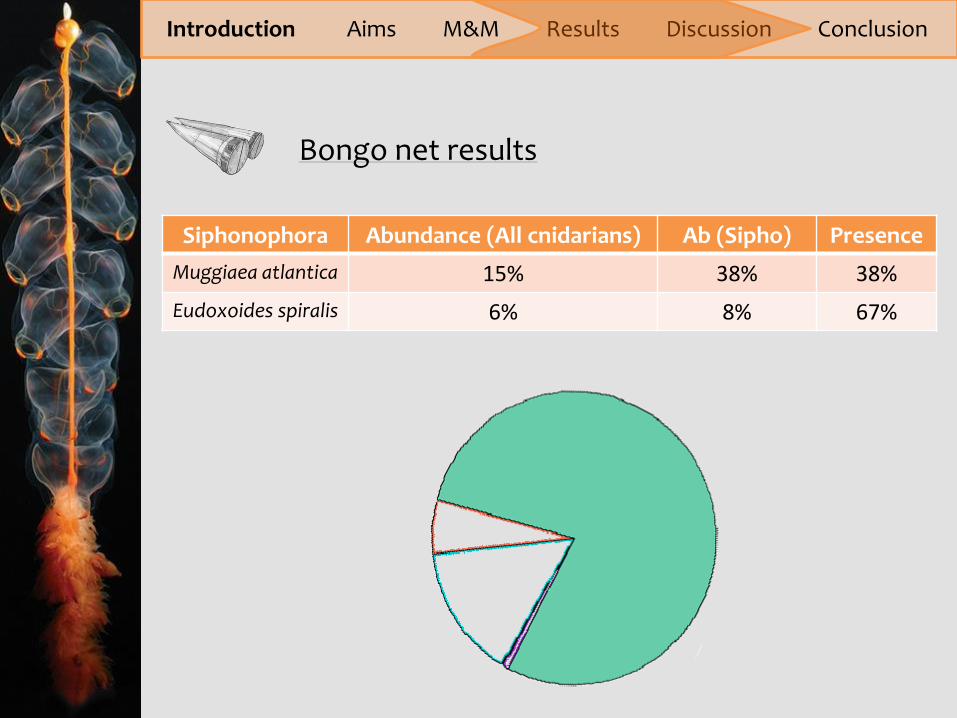
Siphonophora Abundance (All cnidarians) Ab (Sipho) Presence
Muggiaea atlantica 15% 38% 38%
Eudoxoides spiralis 6% 8% 67%
Bongo net results
Introduction Aims M&M Results Discussion Conclusion
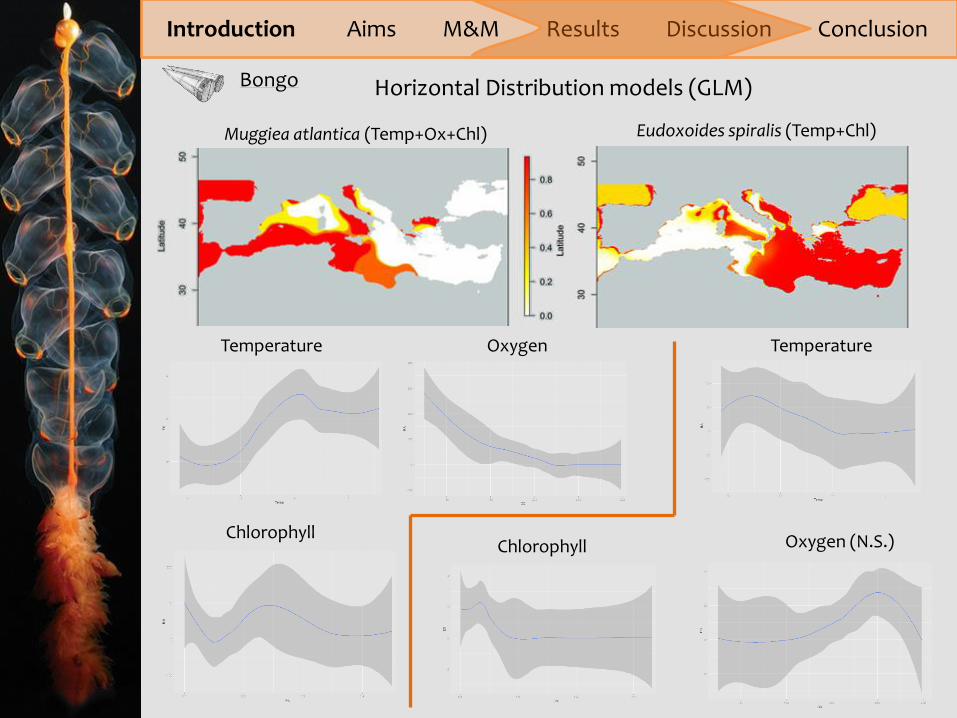
Temperature
Horizontal Distribution models (GLM)
Muggiea atlantica (Temp+Ox+Chl) Eudoxoides spiralis (Temp+Chl)
Temperature
Chlorophyll
Oxygen
Chlorophyll
Bongo
Oxygen (N.S.)
Introduction Aims M&M Results Discussion Conclusion
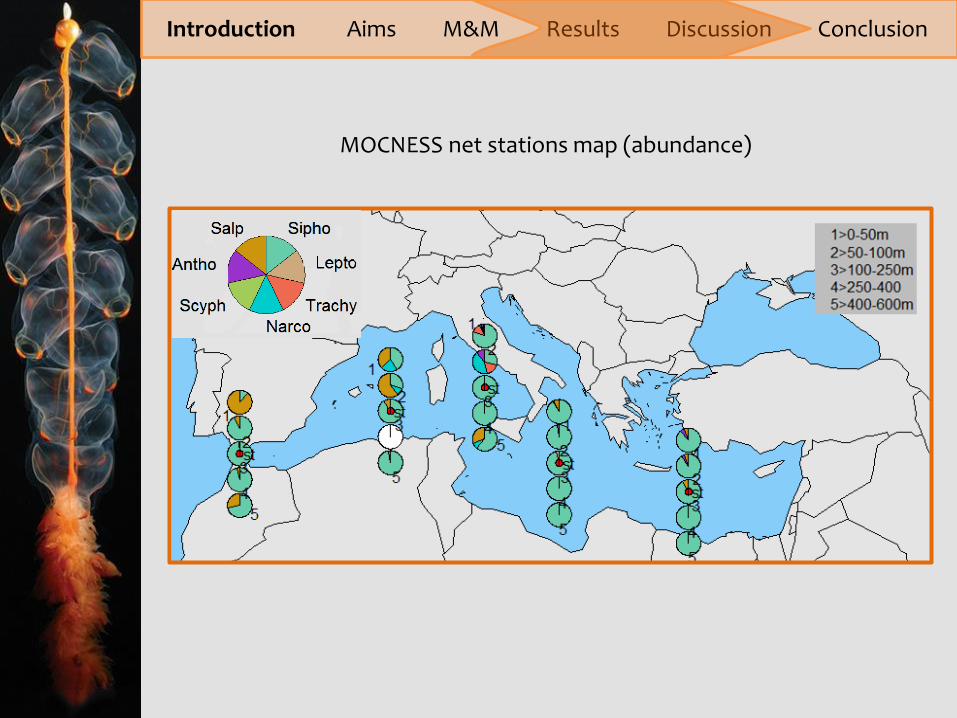
MOCNESS net stations map (abundance)
Introduction Aims M&M Results Discussion Conclusion
Siphonophora
Leptomedusae
Salps
Trachymedusae
Scyphomedusae
Anthomedusae
Narcomedusae
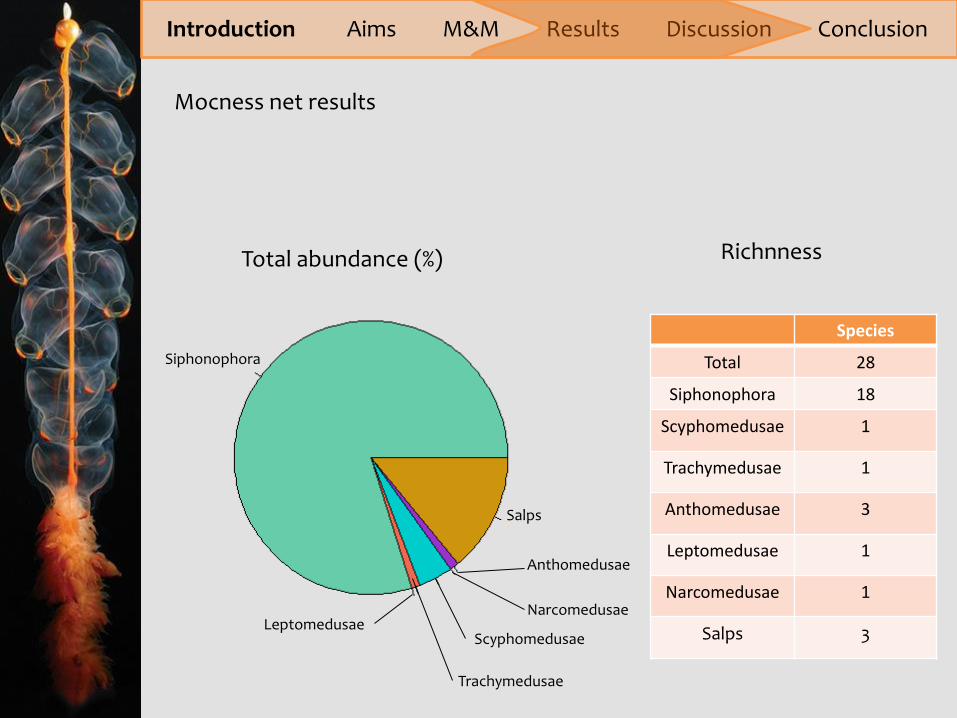
Species
Total 28
Siphonophora 18
Scyphomedusae 1
Trachymedusae 1
Anthomedusae 3
Leptomedusae 1
Narcomedusae 1
Salps 3
Mocness net results
Total abundance (%) Richnness
Introduction Aims M&M Results Discussion Conclusion
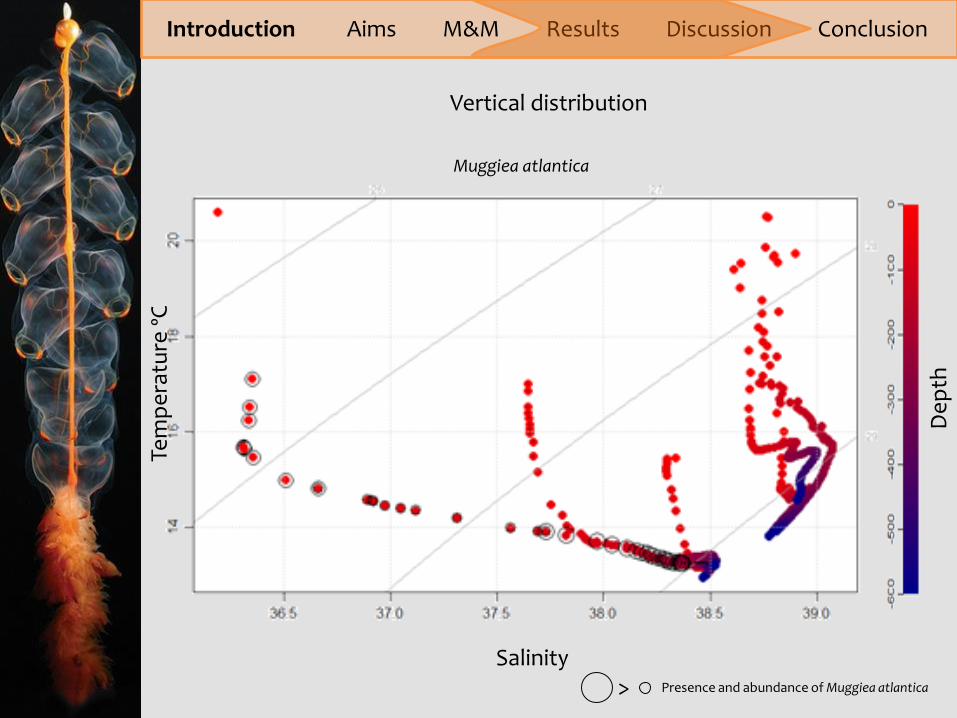
Vertical distribution
Muggiea atlantica
Salinity
De
pth
Tem
pe
ratu
re º
C
Presence and abundance of Muggiea atlantica >
Introduction Aims M&M Results Discussion Conclusion
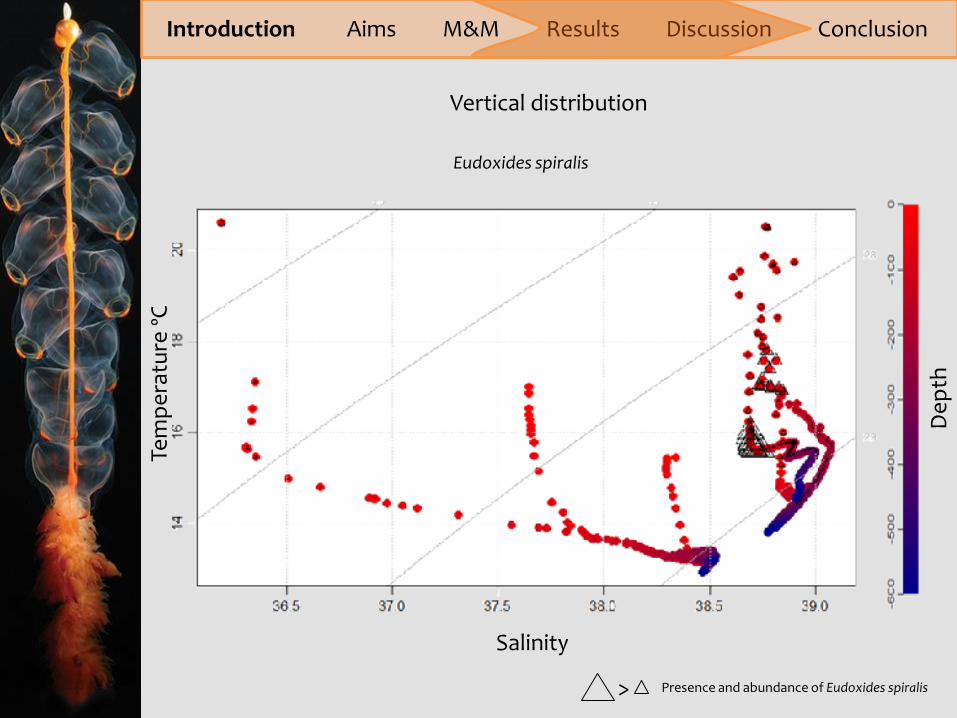
Vertical distribution
Eudoxides spiralis
Salinity
De
pth
Tem
pe
ratu
re º
C
Presence and abundance of Eudoxides spiralis >
Introduction Aims M&M Results Discussion Conclusion
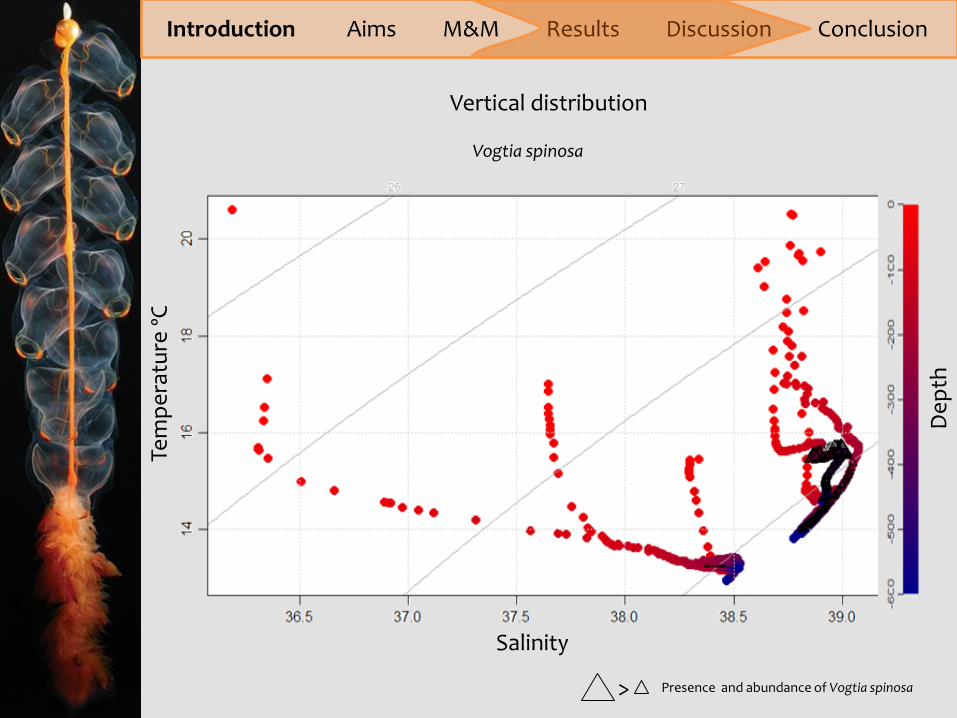
Vogtia spinosa
Vertical distribution
Salinity
De
pth
Tem
pe
ratu
re º
C
Presence and abundance of Vogtia spinosa >
Introduction Aims M&M Results Discussion Conclusion
• In the three types of sampling (different nets) siphonophores dominate, but dominance is shared (salps) when we use neustonic net. Represent over 60% of cnidarians in samples taken by Bongo and MOCNESS
• Vertically dominance of siphonophores is even more exaggerated, many environments dominated by different sp. The first meters salps dominate, especially in western Med.
• Pelagia noctiluca appears in big aggregations (“Blooms”) in western, possible effects on fisheries and tourism if it comes at the cost.
• Difference between eastern and western Mediterranean, both in composition sp. and biovolum. (Muggiea atlantica vs. Eudoxoides spiralis)
Thanks!
“Siphonophores are recognised as voracious predators which could have a major impact on
the structure and dynamics of the zooplankton” (Alldredge, 1984; Mackie et al.,
1987; Matsakis and Conover, 1991).


