Embed Size (px)
Citation preview

An Invitation to Monitor Georgia’s Coastal Wetlands
www.shellfish.uga.edu

2
By Mary Sweeney-Reeves, Dr. Alan Power, & Ellie Covington
First Printing 2003, Second Printing 2006, Copyright University of Georgia
“This book was prepared by Mary Sweeney-Reeves, Dr. Alan Power, and Ellie Covington under an award from the Office of Ocean and Coastal Resource Management, National Oceanic and Atmospheric Administration. The statements, findings, conclusions, and recommendations are those of the authors and do not necessarily reflect the
views of OCRM and NOAA.”

3
Acknowledgements
Funding for the development of the Coastal Georgia Adopt-A-Wetland Program was
provided by a NOAA Coastal Incentive Grant, awarded under the Georgia Department of
Natural Resources Coastal Zone Management Program (UGA Grant # 27 31 RE 337130).
The Coastal Georgia Adopt-A-Wetland Program owes much of its success to the support,
experience, and contributions of the following individuals:
Dr. Randal Walker, Marie Scoggins, Dodie Thompson, Edith Schmidt, John Crawford, Dr.
Mare Timmons, Marcy Mitchell, Pete Schlein, Sue Finkle, Jenny Makosky, Natasha
Wampler, Molly Russell, Rebecca Green, and Jeanette Henderson (University of Georgia
Marine Extension Service); Courtney Power (Chatham County Savannah Metropolitan
Planning Commission); Dr. Joe Richardson (Savannah State University); Dr. Chandra
Franklin (Savannah State University); Dr. Dionne Hoskins (NOAA); Dr. Charles Belin
(Armstrong Atlantic University); Dr. Merryl Alber (University of Georgia); (Dr. Mac Rawson
(Georgia Sea Grant College Program); Harold Harbert, Kim Morris-Zarneke, and Michele
Droszcz (Georgia Adopt-A-Stream); Dorset Hurley and Aimee Gaddis (Sapelo Island
National Estuarine Research Reserve); Dr. Charra Sweeney-Reeves (All About Pets); Captain
Judy Helmey (Miss Judy Charters); Jan Mackinnon and Jill Huntington (Georgia Department
of Natural Resources).
We gratefully acknowledge the contribution of the following illustrators for allowing us to
reproduce their work in this handbook: Josette Gourley, Rebecca Green, Will Hon, Carol
Johnson, Mallory Pierce (by permission of Dover Publications, Inc.), Dr. Alan Power, Karen
Roeder, Edith Schmidt, and Dr. Mare Timmons. Fresh water insects (damselfly, dragonfly,
midge larva) are from Georgia Adopt-A-Stream manual.
Finally, we are extremely grateful to all our volunteers for embracing the program and for all
the good work they are doing throughout the wetlands of coastal Georgia.

The Marshes of Glynn By Sidney Lanier
Glooms of the live-oaks, beautiful-braided and woven With intricate shades of the vines that myriad-cloven
Clamber the forks of the multiform boughs, —
Emerald twilights, — Virginal shy lights,
Wrought of the leaves to allure to the whisper of vows, When lovers pace timidly down through the green colonnades
Of the dim sweet woods, of the dear dark woods,
Of the heavenly woods and glades,
That run to the radiant margin sand-beach within
The wide sea-marshes of Glynn; —
Beautiful glooms, soft dusks in the noon-day fire, — Wildwood privacies, closets of lone desire,
Chamber from chamber parted with wavering arras of leaves, — Pure with a sense of the passing of saints through the wood,
Cool for the dutiful weighing of ill with good; —
O braided dusks of the oat and woven shades of the vine, While the riotous noon-day sun of the June-day long did shine
Ye held me fast in your heart and I held you fast in mine; But now when the noon is no more, and riot is rest,
And the slant yellow beam down the wood-aisle doth seem Like a lane into heaven that leads from a dream, —
Ay, now when my soul all day hath drunken the soul of the oak, And my heart is at ease from men, and the wearisome sound of the stroke
Of the scythe of time and trowel of trade is low,
And belief overmasters doubt, and I know that I know, And my spirit is grown to a lordly great compass within,
That the length and the breadth and the sweep of the marshes of Glynn
Will work me no fear like the fear they have wrought me of yore When length was fatigue, and when breadth was but bitterness sore,
And when terror and shrinking and dreary unnamable pain Drew over me out of the merciless miles of the plain, —
Oh now, unafraid, I am fain to face
The vast sweet visage of space.
To the edge of the wood I am drawn, I am drawn,

5
Where the gray beach glimmering runs, as a belt of the dawn,
For a mete and a mark To the forest-dark: —
So:
Affable live-oak, leaning low, — Thus—with your favor—soft, with a reverent hand, (Not lightly touching your person, Lord of the land!)
Bending your beauty aside, with a step I stand On the firm-packed sand
Free
By a world of marsh that borders a world of sea.
Sinuous southward and sinuous northward the shimmering band
Of the sand-beach fastens the fringe of the marsh to the folds of the sand.
Inward and outward to northward and southward the beach-lines linger and curl
As a silver-wrought garment that clings to and follows the firm sweet limbs of a girl.
Vanishing, swerving, evermore curving again into sight, Softly the sand-beach wavers away to a dim gray looping of light.
And what if behind me to westward the wall of the woods stands high? The world lies east: how ample, the marsh and the sea and the sky! A league and a league of marsh-grass, waist-high, broad in the blade,
Green, and all of a height, and unflecked with a light or a shade, Stretch leisurely off, in a pleasant plain,
To the terminal blue of the main. Oh, what is abroad in the marsh and the terminal sea?
Somehow my soul seems suddenly free
From the weighing of fate and the sad discussion of sin,
By the length and the breadth and the sweep of the marshes of Glynn
Ye marshes, how candid and simple and nothing-withholding and free Ye publish yourselves to the sky and offer yourselves to the sea! Tolerant plains, that suffer the sea and the rains and the sun,
Ye spread and span like the catholic man who hath mightily won God out of knowledge and good out of infinite pain
And sight out of blindness and purity out of a stain.
As the marsh-hen secretly builds on the watery sod, Behold I will build me a nest on the greatness of God: I will fly in the greatness of God as the marsh-hen flies

6
In the freedom that fills all the space ‘twixt the marsh and the skies: By so many roots as the marsh-grass sends in the sod I will heartily lay me a-hold on the greatness of God:
Oh, like to the greatness of God is the greatness within The range of the marshes, the liberal marshes of Glynn
And the sea lends large, as the marsh: lo, out of his plenty the sea
Pours fast: full soon the time of the flood-tide must be: Look how the grace of the sea doth go
About and about through the intricate channels that flow
Here and there, Everywhere,
Till his waters have flooded the uttermost creeks and the low-lying lanes,
And the marsh is mesed with a million veins, That like as with rosy and silvery essences flow
In the rose-and-silver evening glow.
Farewell, my lord Sun!
The creeks overflow: a thousand rivulets run ‘Twixt the roots of the sod; the blades of the marsh-grass stir;
Passeth a hurrying sound of wings that westward whirr; Passeth, and all is still; and the currents cease to run;
And the sea and the marsh are one.
How still the plains of the waters be! The tide is in his ecstasy.
The tide is at his highest height:
And it is night. And now from the Vast of the Lord will the waters of sleep
Roll in on the souls of men, But who will reveal to our waking ken
The forms that swim and the shapes that creep
Under the waters of sleep? And I would I could know what swimmeth below with the tide comes in
On the length and the breadth of the marvellous marshes of Glynn.
Baltimore, 1878

7
Table of Contents PAGE NUMBER
Acknowledgements…………………………………………………………………...3 Poem: The Marshes of Glynn…………………………….………………………….4
Ch. 1 Introduction…………………...……………………………….…………...…….10 How To Get Started………………………………………………11
What Will My Data Be Used For?…………………………………13
Safety Issues………………………………………………………14
Coastal Wetland Habitats…………………………………………17
The Salt Marsh…………………………………………17
The Beach……….……………………………………..22
Ch. 2 Wetland Registration, Watershed Survey and Map Assessment.……...28 CGAAW Registration Form……………………………………29
CGAAW Watershed Survey & Map Assessment………………31
How to Determine Your Latitude & Longitude……..…………35
Ch. 3 Visual Monitoring……………………...…………….…………………………36
Visual Monitoring Protocol………..……………………………37
Water Appearance……………………….….….………37
Photo Documentation…………………………………37
Impaired Habitat Indicators……………………………38
Wetland Condition Appearance…..…….………………38
Soil Survey………..……………………………………39
Visual Survey Worksheets………………………………………41
Ch. 4 Biological Monitoring……………………………………………….…………41
Biomonitoring……………..……………..……………………42
Diversity of Organisms in Estuarine Communities…………….43

8
Population Growth and Carrying Capacity……..….…..43
Density-Dependent vs Density-Independent Factors…45
Comparison of r and K Selected Species…………...….45
Diversity in a Salt Marsh………………………...……..46
Diversity of Estuarine Mud Flats……………....………47
Diversity of an Oyster Reef……………...…………….48
How is Diversity Measured?.................................................49
Invasive Species Monitoring…….……..………………………50
Monitoring Protocol…..……………...….….…………………53
Saltmarsh Bioassessment………..……..………………………53
D-Net Survey…………………………………………53
Box Survey……………………………………………54
Hester-Dendy Survey……………….…………………55
Beach Bioassessment…………….………………………..……57
Hester-Dendy Survey…………………………………57
Seine Survey…………….……...……………………...57
Dune Measurement……………….…..………………58
Biological Survey Worksheets…………….………..………...…59
Ch. 5 Physical/Chemical Monitoring………………………………………………67
Physical/Chemical Parameters……….….….……….…………68
Temperature ……………………………………….…70
pH………………………………………………….....71
Soild & Sediment pH……………………………….…73
Dissolved Oxygen …………………………………….73
Salinity………………………………………………....75
Settleable Solids………………………………………..77
Turbidity…………………………………………..…..77
Physical/Chemical Monitoring Protocol…..….….….….………76
Physical/Chemical Survey Worksheets……....…………………81
Ch. 6 Problems in Your Adopted Wetland?…………...…………………………. 82
Dead or Dying Marsh……………………………….…………83

9
Major Pollution Event………………………………….………89
GCRC Marsh Die-Back Monitoring Protocol…………..………89
Marsh Restoration……………………………………...………90
GCRC Monitoring Worksheet……..………………....…………91
Who To Call List…….…………..………………….……...……92
Bibliography………………………………………………………………….……………93
Appendices
Macroinvertebrate Identification Key………………………..……………97
Plant Identification Key………………………………...………..………112
Fish Identification Key….……………….……..………………………...126
Evaluation Form…………….……………………….……………..……135
Useful Websites……………….…………….……..……………………..136
Useful Books on Coastal Wetlands………….……….….….….…………138
Common Mollusks of Georgia………….……………………..…………140
Other Common Marine Organisms of Georgia……………..……………143
Common Fishes of Georgia…………...….….…..……………………….145
Aquatic Introduced Species in Georgia…………………………………..149

10
Chapter One
Introduction
Saltmarsh Aerial, Coastal Georgia (Lee Sutton, MAREX)
Cumberland Beach (Alan Power, MAREX)
How to Get Started How Will My Data Be Used? Safety Issues Coastal Wetland Habitats

11
Introduction
Welcome to the Coastal Georgia Adopt-A-Wetland (CGAAW) program! This is a hands-on
education program that promotes wetland conservation through volunteer monitoring. Wetlands are
valuable coastal resources, playing an important role in water quality, sediment retention, flood control, and
wildlife habitat. This program is designed to complement the Georgia Adopt-A-Stream program, which is
coordinated by the Department of Natural Resources Environmental Protection Division. Essentially, the
Adopt-A-Wetland program is the marine counterpart of the Adopt-A-Stream program, and shares the same
goals, namely to:
1) increase public awareness of the state's nonpoint source pollution and water quality issues
2) provide citizens with the tools and training to evaluate and protect their local waterways
3) educate the public on the importance of wetlands
4) collect quality baseline data and determine the health of our coastal wetlands.
How to Get Started
This manual contains all the information you will need to begin monitoring your adopted wetland.
Our volunteer groups include school classes 5th grade and up, civic organizations, individuals, families,
neighbors, friends, clubs, and companies. The first step is to attend a hands-on training workshop where
instruction will be provided on water quality monitoring and/or the biological-sampling methods used to
determine wetland habitat health. Free training workshops are provided at regular intervals in Savannah and
on an as needed basis for those in other areas of coastal Georgia who cannot travel. Visit
www.shellfish.uga.edu to view upcoming training workshops. Volunteers who attend a workshop and pass a
QA/QC (Quality Assurance/Quality Control) test will be considered QA/QC data collectors for one year.
All the supplies your monitoring group will need to collect data for an annual period are provided on a loan

12
basis. After an individual is certified in monitoring, a site must be chosen for adoption and registered. A
watershed survey and map assessment must also be completed for this particular site on an annual basis.
The watershed survey and map assessment is a simple checklist of land uses and activities that influence your
wetland site. If you have questions or need help to complete the survey, call your AAW coordinator at 912-
598-2348. It is also necessary to obtain a map of the wetland you are choosing to adopt. This can be
accomplished via the internet (www.topozone.com), through your local AAW coordinator, or the USGS.
There are many levels of monitoring available, ranging from basic visual surveys, which are
conducted four times per year, to monthly water testing. Depending on your level of involvement,
monitoring may consist of one or several of the following:
Visual Monitoring: Participants conduct a simple visual survey four times per year,
consisting of observations of the plants, soil conditions, and water conditions.
Biological Monitoring: Biomonitoring determines the types and abundance of
macroinvertebrates and plants that live in wetland areas. The diversity of species present helps us to assess
water quality and habitat health. Healthy ecosystems usually contain great diversity and stressed habitats
support less species with a greater number of individuals. This is also conducted quarterly.
Physical/Chemical Monitoring: This involves the monthly collection of information
about specific water quality parameters (e.g. temperature, pH, dissolved oxygen, salinity, turbidity, and
settleable solids). This is conducted on a monthly basis.
Habitat Enhancement Projects: These projects are designed to improve the health of
your site. Examples of habitat enhancement projects include planting buffers, marsh restoration, oyster

13
recycling, and regular litter pick-ups. Keeping your wetland clean can be one of the most effective ways of
improving wetland health.
All levels of monitoring provide very important information concerning the health of coastal
wetlands, and their protection. It is your decision as to which activities you will perform at your adopted site.
This should be decided based upon your group’s abilities and resources. Typically, groups start out with the
chemical/physical protocol and subsequently add the biological component.
How Will My Data Be Used?
Information acquired from the monitoring surveys will be incorporated into the University of
Georgia Marine Extension Service’s GIS (Geographic Information System) database that will centralize all
known water quality data for the coastal region. For more information on the GIS database please contact
Doug Atkinson at 706-542-1581 or email [email protected]. Your data will also be submitted to the Adopt-
A-Stream database at the State Environmental Protection Division office in Atlanta. For more information
about the Adopt-A-Stream database, please contact Allison Hughes 404 675 1635 or email
[email protected]. Each group or individual that adopts a site will be provided with an annual
report by MAREX that summarizes and interprets their respective data.
Sometimes problems arise at various wetland sites and being aware of what to look for is important
to the health of coastal wetlands. If warning signs are spotted, volunteer groups should notify the
appropriate agencies through their “Emergency Contact List”. In 2004, a wetland group (the Ogeechee
River Citizens Brigade) in Richmond Hill noticed high sedimentation and a coffee color to the water at a
normally healthy pond near their home. They reported this to the appropriate Department of Natural
Resources (DNR) office, which investigated the problem, and found that a developer was at fault. The
developer was fined and required to follow strict development guidelines while buildings were being

14
constructed. In addition to detecting problems, data collected is also used to establish baseline conditions
for waters that would not otherwise be assessed.
Safety Issues
Your safety is critical. Safety precautions need to be emphasized especially on the coast. Sudden
storms can pop up and accidents can happen. The following information has been taken from the United
States Environmental Protection Agency’s website dealing with volunteer monitoring and assessing water
quality (www.epa.gov/owow/monitoring/). Follow these tips at your adopted site:
• Always monitor with at least one partner. Let someone else know where you are, when you intend to
return, and what to do if you do not come back at the appointed time.
• Develop a safety plan. Bring your cell phone or a radio. Locate the nearest medical center and write
down directions on how to get between the center and your site(s) so that you can direct emergency
personnel. Have each member of the sampling team complete a medical form that includes emergency
contacts, insurance information, and pertinent health information such as allergies, diabetes, epilepsy, etc.
• Have a first aid kit handy. Know any important medical conditions of team members (e.g., heart
conditions or allergic reactions). It is best if at least one team member has first aid/CPR training.
• Listen to weather reports. Never go sampling if severe weather is predicted or occurs while at the site.
• Never wade in swift or rapidly rising water and watch for rip tides or currents.
• Watch for wildlife and insects such as ticks, hornets, and wasps. Know what to do for bites or stings.
• Watch for poison ivy, poison oak, sumac, and other vegetation that can cause rashes and irritation.
• Do not monitor if the site appears to be extremely polluted.
• Dress appropriately by following the advice of “Maude the Marsh Mucker” (page 16).
• If at any time you feel uncomfortable about the condition of the wetland or your surroundings, stop
monitoring and leave the site at once. Your safety is more important than the data!

15
When using chemicals:
• Know your equipment, sampling instructions, and procedures before going out into the field. Prepare
labels and clean equipment before you get started.
• Keep all equipment and chemicals away from small children. Many of the chemicals used in monitoring
are poisonous. Tape the phone number of the local poison control center to your sampling kit.
• Avoid contact between chemical reagents and skin, eye, nose, and mouth. Never use your fingers to
stopper a sample bottle (e.g., when you are shaking a solution). Wear safety goggles when performing any
chemical test or handling preservatives.
• Know chemical cleanup and disposal procedures. Wipe up all spills when they occur. Return all unused
chemicals to your program coordinator for safe disposal. Close all containers tightly after use. Don’t switch
caps.
• Know how to use and store chemicals. Do not expose chemicals or equipment to temperature extremes
or long-term direct sunshine.
• Be sure you have emergency telephone numbers and medical information with you at the field site
for everyone participating in fieldwork (including the leader) in case there is an emergency.
First Aid Kit The minimum first aid kit should contain the following items: • Telephone numbers of emergency personnel such as the police and an ambulance service. • Several band-aids for minor cuts. • Antibacterial or alcohol wipes. • First aid creme or ointment. • Several gauze pads 3 or 4 inches square for deep wounds with excessive bleeding. • Acetaminophen for relieving pain and reducing fever. • A needle for removing splinters. • A first aid manual which outlines diagnosis and treatment procedures. • A single-edged razor blade for minor surgery, cutting tape to size, and shaving areas before taping. • A 2-inch roll of gauze bandage for large cuts. • A triangular bandage for large wounds. • A large compress bandage to hold dressings in place. • A 3-inch wide elastic bandage for sprains and applying pressure to bleeding wounds. • If a participant is sensitive to bee stings, include their doctor-prescribed antihistamine.

16
Be Prepared Like Maude the Marsh Mucker!

17
Coastal Wetland Habitats
The Salt Marsh
Georgia and South Carolina combined contains one third of the total amount of salt marsh on the
East Coast. Georgia’s coastline is approximately 100 miles. The salt marsh is a unique habitat that occurs
between the barrier islands and the mainland, and is characterized by expansive grasslands, mudflats, and
meandering tidal creeks. In coastal Georgia we have a large tidal range of 6-9 ft. Twice per day, tidal creeks
flood and ebb, nourishing the salt marsh environment. Salt marshes are valuable because they protect the
mainland by absorbing the impact of storms. Salt marshes also help in filtering out harmful pollutants that
occur from one source (point pollution), or from many sources (nonpoint source pollution) (Mitsch and
Gosselink, 1986). People often ask how a wetland can absorb toxins. A chemical or pollutant is absorbed
into the mud but also is absorbed through the pores of smooth cordgrass (Spartina alterniflora) and stored for
a period of time within the plants body! (Long, and Mason, 1983).
Salt marshes and tidal creeks are important nursery grounds, providing a habitat for larval fish and
shellfish such as mullet, silverside, sea bass, oysters and mussels. In addition, this productive and nutrient
laden environment provides much needed organic matter for bacteria to carryout important transformations
Saltmarsh on Tybee and Cumberland Islands (Alan Power, MAREX).

18
of naturally occurring chemical compounds into valuable nutrients (Johnson et al., 1974) that act as fertilizers
for phytoplankton (free floating unicellular plants). Many organisms depend on phytoplankton, from the
microscopic zooplankton to the larger filter feeding animals including sea squirts, barnacles, clams, and
mussels.
Oysters are another filter feeder and one of the most prominent members of the salt marsh
community. They are in fact described as “keystone” species, which means they are critical in maintaining
the health of this ecosystem. After spawning, oysters begin their lives in the water column as free-floating
larvae. When oysters settle and attach to a hard surface they metamorphose into an immobile organism
called a spat. The spat or small oysters will often grow in clusters on other oysters, in tidal creeks, on jetties,
and on pilings or docks. When oysters grow in clumps along tidal creeks they are called oyster bars or oyster
Oyster Reef, Wilmington Island (Alan Power, MAREX)

19
reefs (O’Beirn et al., 1994). If you closely examine the crevices of an oyster reef you will find a myriad of
organisms, such as, mussels, crabs, fish, polychaete worms and amphipods. Oyster reefs are called “Essential
Fish Habitat” which means that many commercially and ecologically important species depend on the reef
habitat to successfully reproduce and survive. Oysters filter food particles such as plankton and detritus
from the water. Oysters are excellent at removing toxins, metals, nutrients, and harmful bacteria, thus
improving water quality. As these amazing mollusks feed, one healthy oyster can pump up to 5 liters or 1.3
gallons of seawater through its body in one hour. The more oysters we have in our creeks and estuaries, the
cleaner our waters. Oyster reefs also protect the marsh from being eroded by waves and boat wakes by
absorbing the energy of these waves before they can wash away the mud from around the roots of the
Spartina grass.
Other common organisms found in the salt marsh and associated mud flats are fiddler crabs, mud
snails, periwinkles, blue crabs, quahogs, shrimp, whelks, insects, killifish, mummichogs, wading birds,
waterfowl, and shore birds (Wiegert, and Freeman, 1990).
Egrets, Tybee Island (Mary Sweeney Reeves, MAREX)

20
The salt marsh can be divided into several zones. The low and high marsh zones will be our primary
focus. The low marsh is lowest in elevation and closer to the tidal creek and is the area that is flushed daily
with water during high tide. Smooth Cordgrass (Spartina alterniflora) grows highest in areas that are closest to
creeks because of the frequent flushing of water when the tide floods. Plants that grow in the area furthest
from the tidal creek and at a higher elevation are classified as high marsh plants. Plants in this zone are
Glasswort (Salicornia sp.), Saltwort (Batis maritimea) Salt Grass (Distichlis spicata), Needle Rush (Juncus
roemerianus), Saltmeadow Cordgrass (Spartina patens), Sea Oxeye Daisy (Borrichia frutescens), Marsh Elder (Iva
frutescens) and Eastern Red Cedar (Juniperus virginiana). Because inundation of water occurs less often in the
high marsh, salt tends to accumulate in the soil, thus stunting the growth of Spartina alterniflora (Wiegert and
Freeman, 1990). There are other regions of the marsh where salt tends to accumulate. These regions are
known as salt pans. Here the concentration of salt in the soil is so high nothing will grow (Johnson et al.,
1974).
Surprisingly, a large percentage of the mud and clays in our coastal marshes come from areas inland.
This clay source, also known as the red clay Georgia is famous for, is located in the fields of the southern
piedmont. If we traced the travels of a red clay particle from the southern piedmont to the coast, the clay
particle would have a long adventurous trip.
Salt Marsh Zones

21
The clay particle begins inland as a part of a stream bank. Heavy rains will wash out the bank of the
creek causing the clay to erode away. Over many years the clay/water particle will venture down fresh water
rivers as suspended material, and eventually enter into brackish water (a mixture of fresh and salt water)
found in estuaries. While in fresh water, clay, which has a negative charge, will naturally repel other clay
particles. There are many types of salts found in coastal waters (e.g. sodium, chloride, magnesium, calcium,
potassium, sulfate, bromide and bicarbonates). These salts have negative or positive charges called ions. A
positively charged salt will react and cancel the negative charge of a clay particle. Therefore, when clay
particles flow into more saline waters they will bind to other clays and eventually this “particle-group”
(flocculate) will grow heavy, sink to the bottom, and become an important part of our marsh ecosystem.
The silts and clays fall out of suspension onto the leeward side or protected side of the islands.
Notice while visiting any coastal Georgia Islands that salt marsh formation generally occurs on the western
side of the island. The clays and sediments then build up mounds and piles that stick up above high tide
lines. Smooth Cord Grass (Spartina alterniflora) eventually colonizes these areas. The accumulated mud with
marsh grass begins its evolution into an ecosystem known as the salt marsh. Processes of sediment build up
(accretion) or sediment washing away (erosion) help shape the salt marshes of Coastal Georgia.
Coastal Sediment Deposition (Mary Richards, Skio)

22
In the salt marsh, the mud is no longer red, instead it is black; this is due to a lack of oxygen in the
soil and a chemical process called reduction. Reduction involves naturally occurring anaerobic bacteria which
are present in the mud. The bacteria have the capability to break down one common seawater salt ion called
sulfate (SO4) by using the oxygen and changing the sulfate into hydrogen sulfide (H2S). This process is how
the anaerobic bacteria utilize oxygen during a process called respiration. All things must respire in order to
live. The rotten egg aroma prevalent in coastal marshes during low tide is the hydrogen sulfide produced
through this reaction.
The key to the importance of the marsh as an ecosystem lies in the plants that live and die there and
the bacteria associated with the mud. One important function of the marsh grass is to help hold the mud
together and to provide organic matter (detritus) to the coastal ecosystems. The bacteria in the mud and in
the marsh utilize the detritus, the naturally occurring chemical compounds, and nutrients such as nitrogen in
the water and recycle them to another form. Nutrients such as nitrogen help with fertilizing the plants and
algae keeping the marsh system balanced and fruitful.
The Coastal Marshlands Protection Act provides the Georgia Department of Natural Resource’s
Coastal Resources Division with the authority to protect tidal wetlands. For more information on the
Marshland Protection Act contact the Coastal Resources Division of Georgia DNR (912) 264-7218 or visit
the website (http://crd.dnr.state.ga.us/content/displaycontent.asp?txtDocument=85). Fourteen plants
recognized in the Marshlands Protection Act are used by the Georgia DNR to delineate jurisdictional tidal
wetlands from upland areas (http://crd.dnr.state.ga.us/content/displaycontent.asp?txtDocument=317).
The Beach
Georgia’s thirteen major barrier islands contain about 90 miles of sandy beaches. The beach is
another coastal “wetland” you may choose to monitor. Beaches are continually being shaped and changed by
ocean currents, waves and wind. Coastal development, dredging, beach renourishment, and other human
impacts also play a role in shaping our beaches and dunes. The beach may be divided into three zones; shore

23
by the water’s edge, the wrack line where decaying marsh grass and other organic matter builds up, and the
sand dunes which are mounds of sand held together by grasses and other plants.
Dune formation is a process dependent on the transport of dead marsh grass (Spartina alterniflora)
from the marsh to the upper beach area or wrack line. The dead marsh grass deposited at the wrack line
Cumberland Island Dunes (Alan Power, MAREX)

24
traps sand as it is deposited by wind and water. The mixture of the dead grass, sand, and moisture creates a
soil mixture rich with organic matter; suitable for plant growth. Seeds from salt tolerant plants are deposited
along the wrack line and upper beach where they establish roots. The plants grow trapping beach sand thus
forming a primary dune. In Georgia, Sea Oats (Uniola paniculata) are the most important species because they
are mostly responsible for the creation of the primary dunes. Sea Oats tolerate salty water, windy conditions,
and have the ability to thrive in harsh conditions. Sea Oats build small sand dunes by trapping sand with the
expanding rhizomes thus stabilizing loose sandy soil. These grasses are so valuable to Georgia that if anyone
harms them on any of the coastal beach dunes they will be fined heavily.
As the primary dune gets larger, it will either decrease in size from natural or man made processes
(erosion) or increase in size (accretion) (Johnson et al., 1974). More plants will colonize and the dune will
eventually form a more diverse plant community and become a dune meadow, with plants such as Pennywort
(Hydrocotyl bonariensis), Yucca (Yucca aloifolia), Camphorweed (Heterotheca subaxillaris), and Dune Primrose
(Oenothera humifusa). In addition the dune system helps in providing a buffer for the mainland from the ocean
winds and storms. By monitoring the size of dunes and the types of plants that grow in the dunes, you can
record the rate of erosion/accretion over time.
Backshore Vegetation, Cumberland Island (Alan Power, MAREX)

25
Some of the animals commonly observed at the beach include ghost crabs, gulls, hermit crabs,
jellyfish, mole crabs, sea-whips, olive shells, whelk egg strings, sand dollars, horseshoe crabs, sponges,
dolphins, and various fish including bass, trout and catfish.
In addition, five species of sea turtles are found in Georgia’s waters. Between May and August the
threatened loggerhead sea turtle, and at times the leatherback sea turtle swims toward the coastal islands and
beaches. These turtles leave the water and dig a nest on the beach to lay 100-150 eggs.
Ghost Crab, Wassaw Island (Alan Power, MAREX)
Turtle, Offshore Georgia (Mary Richards, Skio)

26
State and Federal laws protect all species of sea turtles, principally through the Endangered Species Act.
The Department of Natural Resource’s Nongame-Endangered Wildlife Program coordinates sea turtle
conservation efforts along the coast. They would like for the general public to assist by reporting all
sightings to (478) 994-1438. To report a dead or injured turtle, or sea turtle harassment, call (800) 2-SAVE-
ME. If the sea turtle is tagged please include the tag color and number in the report if possible. For more
information, please visit the website http://georgiawildlife.dnr.state.ga.us/ and click on non-game plants
and animals. They also offer the following tips:
• Never disturb a sea turtle that is crawling to or from the sea
• Observe nesting females only from a distance
• Never attempt to ride a sea turtle
• Do not shine lights in a sea turtle’s eyes or take flash photography
• Avoid or reduce beach lighting at night
The coastal sand dunes, beaches, sandbars, and shoals comprise a vital natural resource system,
known as the sandsharing system. This system acts as a buffer to protect personal property and natural
resources from the damaging effects of floods, winds, tides, and erosion. The Shore Protection Act is
the primary legal authority for protection and management of Georgia's sandsharing system. Its
jurisdiction includes the submerged shoreline lands out to the three mile limit of State ownership, the
sand beaches to ordinary high water mark, and the "dynamic dune field", which is defined as the
dynamic area of the beach and sand dunes. The ocean boundary of the dynamic dune field extends to
the ordinary high water mark, and the landward boundary of the dynamic dune field is the first
occurrence of either a live native tree 20 feet in height or greater, or a structure existing on July 1, 1979.
This law protects the sea oats and dunes, and it is illegal to disturb them. For more information, contact
the Ecological Services Section of the Georgia Department of Natural Resources at (912) 264-7218 or
visit the following website http://crd.dnr.state.ga.us/content/displaycontent.asp?txtDocument=84.

Please Do Not Collect
Live Sand Dollars
Scientific name: Mellita isometraCommon name: Five-slotted Sand Dollar or Keyhole UrchinPhylum: Echinodermata which means “spiny skinned ”.Size: Round, flat, & growing to about 100 mm in diameter.Color (living): Purple & velvety due to tiny spines & tube feet that are used in respiration, feeding & movement.Color (non-living): White test (shell), without spines and tube feet.Habitat: Found primarily on the beach margin and thus susceptible to collection pressures. Diet: Microscopic diatoms and detritus. Reproduction: Gametes are released into the water where the larvae swim for a period before metamorphosing.Association: Small crabs (Dissodactylus mellitae) are ectosymbionts (i.e. they live on the surface of sand dollars). Predators: Fish, crabs, whelks, seastars, birds.Other Threats: Storms, high temperatures during low tide, and low food abundance during the summer months.Human Threats: Pollution, dredging, beach renourishment, trawling fisheries, and the ornamental trade.
Most visitors to the beach do not realize that taking live sand dollars threatens the species and is in fact illegal in many parts of the United States. Unfortunately, most are taken by beachgoers during the summer
months when sand dollars are reproducing. So many sand dollars have been taken from Tybee Beach that the average size has decreased in comparison to populations on Georgia’s other barrier islands.
If you plan on beachcombing, please help to conserve local populations by only collecting white shells.

Chapter Two
Wetland Registration, Watershed Survey & Map Assessment
Registration Form
Watershed Survey & Map Assessment
How to Determine Your Latitude & Longitude

29
Coastal Georgia Adopt-A-Wetland Registration Form University of Georgia MAREX Adopt-A-Wetland Program 20 Ocean Science Circle Savannah, GA 31411-1011 Complete the following form for each wetland you monitor and return to the above address. We will also file a copy with the GA Environmental Protection Division office in order to include your efforts in the statewide database. This form is to register a (circle one or more than one if necessary (e.g. tidal creek and marsh):
SALTMARSH BEACH RIVER ESTUARY Latitude: _____________________ Longitude: _____________________ Group Name: _______________________________________________________ Official Name of Site You Are Monitoring: _________________________________ Level of Monitoring (Circle One/More): Chemical Biological Visual Lead Coordinator/Contact: ___________________ Today’s Date: _________ Complete Mailing Address: _____________________________________________ Phone Number(s): _______________ E-mail Address: _______________________ For Official Use Only Group has biological kit Group has chemical kit

30
1. Describe the location of your monitoring site (i.e. 30 feet downstream of Johnny
Mercer Blvd. crossing Betz Creek on Wilmington Island). 2. What is the name of your monitoring group? (i.e. Scout Troop 101, Friends of
Hayworth Park, Dukes Creek Ducklings)? 3. What are the goals you hope to accomplish with the Adopt-A-Wetland program? 4. What equipment or supplies do you need to achieve your goals? 5. Where will you send the data you collect? 6. Name the QA/QC data collectors in your group.
AAW Registration Form page 2

31
COASTAL GEORGIA ADOPT-A-WETLAND Watershed Survey and Map Assessment
University of Georgia MAREX Adopt-A-Wetland Program 20 Ocean Science Circle Savannah, GA 31411-1011 To be conducted at least once a year and returned to the above address. Adopt-A-Wetland Group Name: ______________________________________________ Investigator(s):____________________________________________________________________________________________________________________________________________________________________________________________________________________________________________________________________________________ Water Body Name: ______________________ County(ies):_____________________ Picture/photo documentation? Yes No Date: _____________________ Time: _______________________ I. CREATE A MAP OF YOUR WETLAND You can download a map from www.topozone.com. See instructions on page 35. II. LAND USES/ACTIVITIES AND IMPERVIOUS COVER a. Comments on general waterbody and watershed characteristics: (e.g. date and size of fish kills, increased rate of erosion evident, litter most evident after storms). Fish kills should be immediately reported to DNR Wildlife Resources Division. b. Summarize notable changes that have taken place since last year (if this is your second year conducting the Watershed Survey). c. Identify land uses and activities near your monitoring site, which have the highest potential to impact water bodies:

32
Check all boxes that apply, describe the location of the activity(ies) under the Notes on Location & Frequency of Activities and also mark the locations on your map. If you do not know some of the information below, write DK under Notes. Land Disturbance Notes on Location & Frequency of Activity
Erosion caused by land _____________________________________ development or construction Docks, piers, jetties _____________________________________ Large or extensive gullies _____________________________________ Unpaved roads near or crossing streams _____________________________________
Commercial forestry activities including _____________________________________ harvesting and site-preparation Extensive areas of creek bank failure or _____________________________________ channel enlargement Agricultural Activities
Croplands _____________________________________ Pastures with cattle access to water bodies _____________________________________ Confined animal (cattle or swine) feeding _____________________________________ operations and concentration of animals Animal waste stabilizations ponds _____________________________________ Poultry houses _____________________________________ Highways and Parking Areas
Shopping center & commercial areas _____________________________________ Interstate highways and interchanges _____________________________________ Major highways and arterial streets _____________________________________ Other extensive vehicle parking areas _____________________________________ Mining
Quarry ______________________________________

33
Leisure Activities
Golf course _____________________________________ Marina’s _____________________________________ Recreational Fishing _____________________________________ Boating/Jet skis _____________________________________ Swimming _____________________________________ Other _____________________________________ Transportation and Vehicle Services
Truck/car cleaning services _____________________________________ Automobile repair facilities _____________________________________ Auto dealers _____________________________________ Rail or container transfer yards _____________________________________ Shipping or fishing port _____________________________________ Marinas with boat fuel/repair/painting _____________________________________
Business & Industry, General
Exterior storage or material exchange _____________________________________ Activities with poor housekeeping _____________________________________ practices indicated by stains leading to creek or storm drains or on-site disposal of waste materials Heavy industries such as textiles & carpet, _____________________________________ pulp & paper, metal & vehicle production Dry cleaners or outside chemical storage _____________________________________ Special Issues
Fertilizer production plants _____________________________________
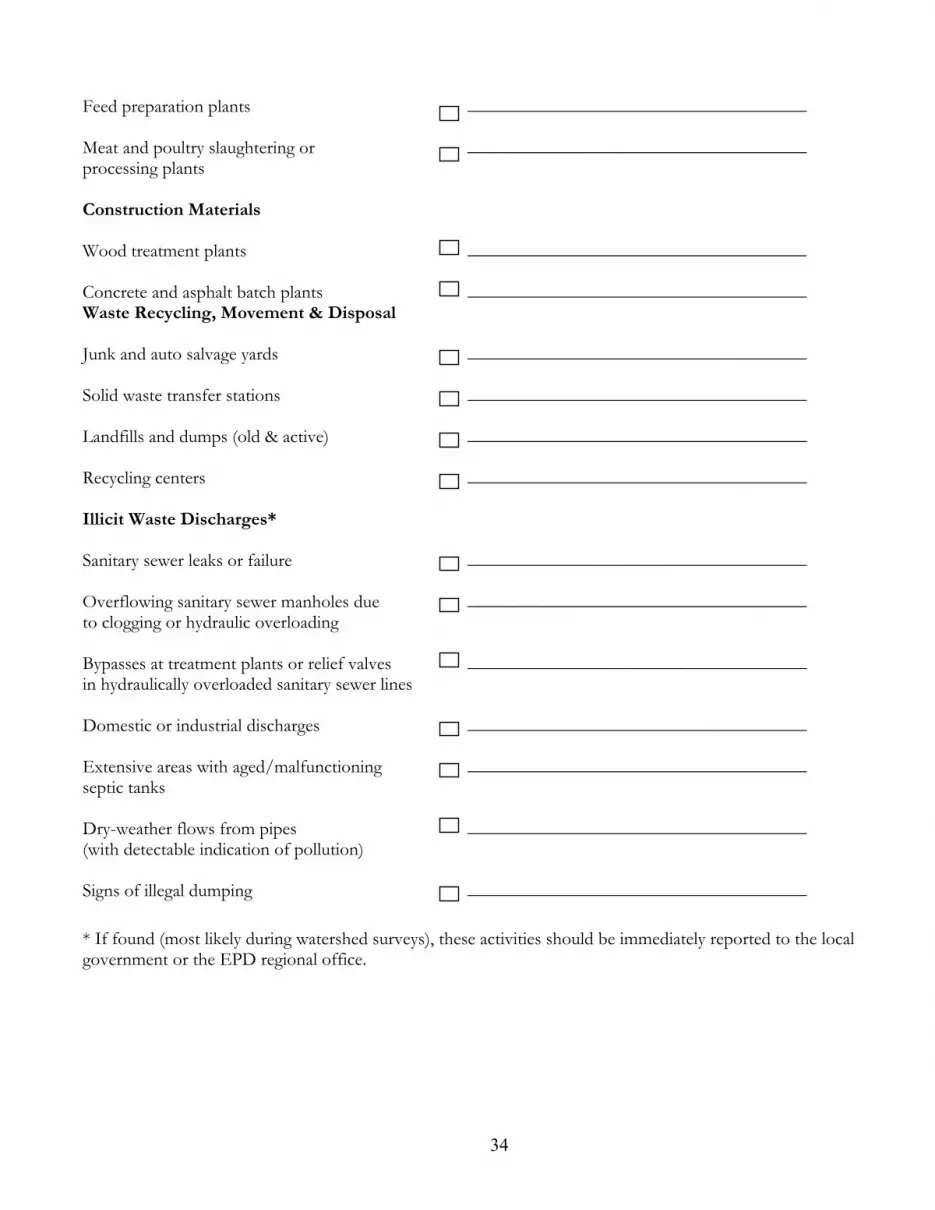
34
Feed preparation plants _____________________________________ Meat and poultry slaughtering or _____________________________________ processing plants Construction Materials
Wood treatment plants _____________________________________ Concrete and asphalt batch plants _____________________________________ Waste Recycling, Movement & Disposal
Junk and auto salvage yards _____________________________________ Solid waste transfer stations _____________________________________ Landfills and dumps (old & active) _____________________________________ Recycling centers _____________________________________
Illicit Waste Discharges* Sanitary sewer leaks or failure _____________________________________ Overflowing sanitary sewer manholes due _____________________________________ to clogging or hydraulic overloading Bypasses at treatment plants or relief valves _____________________________________ in hydraulically overloaded sanitary sewer lines Domestic or industrial discharges _____________________________________ Extensive areas with aged/malfunctioning _____________________________________ septic tanks Dry-weather flows from pipes _____________________________________ (with detectable indication of pollution) Signs of illegal dumping _____________________________________ * If found (most likely during watershed surveys), these activities should be immediately reported to the local government or the EPD regional office.

35
How to Determine Your Latitude and Longitude
You will need to know how to determine the latitude and longitude of your site so that others can
find the exact location. To locate the coordinates, you will need to work with a topographic map and have
access to the web. The best-quality maps we have found on the web are available at www.topozone.com.
Scroll down to the bottom of the screen and type the official name of your waterbody in the area designated
“Place Name.” If you are working with an unnamed tributary to a larger stream, type in the name of the
larger stream. Select your state (GA) on the pull-down menu, and click “Search.” This should bring up a list
of all sites with that name. Select your site by clicking on the link, which will take you to a topographic map
of the area. Locate your exact data collection point as closely as possible and click on it, using the green
arrows at the edges of the map to change the view if necessary. A small red mark should appear where you
click, allowing you to keep track of your site. Now go to the top of the map and click on the 1:100,000 scale
option, which will zoom in on the red mark. Adjust its position if necessary. At the bottom of the map, three
coordinate format options will appear. Select the one labeled “DD.DDDD” for decimal degrees. The latitude
and longitude of your site and the name of the quadrangle will appear above the map. Print this map for your
records, noting the scale, coordinates, quadrangle, and date of production, which may be obtained by clicking
“map/photo” in the upper right corner of the screen. Send a copy of this map to your Adopt-A-Wetland
coordinator.

36
Chapter Three
Visual Monitoring
Monitoring Protocol Visual Survey Worksheets
Visual Survey, Skidaway Island (Alan Power, MAREX)

37
Visual Monitoring
Visual Monitoring represents the first level of activity in Coastal Georgia’s Adopt-A-Wetland
volunteer monitoring program. The activities are basic but are also very important. As you become the
“Wetland Watcher”, it is through your eyes that we can see problems that may occur in our valuable coastal
wetlands. Visual surveys are usually performed four times per year in a healthy wetland. However, when
monitoring a dead marsh site, we encourage you to perform the survey once per month. Remember to
always conduct the visual survey at the same stage of the tidal cycle each time.
Monitoring Protocol
This protocol provides directions on performing a visual survey. Use the worksheet on pages 39-40
to record important information about vegetation, soils and hydrology in your wetland.
Water Appearance
Fill a clean, clear container with water from your adopted wetland site. Hold the container up to the
sun and determine the color. Odor should also be easy to detect from the container, and sometimes you will
not notice an odor at all.
Photo Documentation
When monitoring a healthy wetland you should take a photograph of your site four times per year.
However, since changes may occur rapidly, please include a photo each month when monitoring a marsh that
appears stressed. Please try to take the photo at the same spot each time (you may want to mark the site). If
possible also take the photograph at the same tidal cycle (i.e. low or high tide).

38
Impaired Habitat Indicators
Sometimes human activities nearby will adversely affect a wetland. Check all the boxes in the
impaired habitat indicator section of your survey sheet that apply to your site.
Wetland Condition/Appearance
In this context, wetland condition refers to the health of specific plants that grow in the wetland.
Marsh grass and other plants naturally go through seasonal changes. The general pattern is that the marsh
grass turns brown in the winter but greens with new growth during the spring and fall. We expect browning
in the winter, however if the color stays brown all year round we may have reason to become concerned.
Also pay close attention to an abundance or absence of organisms (snails, crabs, or fish).
Soil Survey
The presence of large areas without plants (except for salt pans) may be a warning sign that
something is not right. These areas of the marsh will consist mostly of mud. If possible mark the perimeter
of the muddy area with PVC, sticks, or flags. Each time you monitor your site note whether the muddy area
without plants is increasing or decreasing. Dip your finger into the mud or scrape the surface of the sediment
in your marsh and observe characteristics of the sediment/mud. Check all the appropriate boxes on your
survey sheet.
Visual Survey, Ossabaw Island (Ellie Covington, MAREX)

39
Adopt-A-Wetland Visual Survey AAW Group Name _____________________________ County __________________
Group ID Number_____________________ Site ID Number__________________
Investigators_____________________________________________________________
Wetland Name____________________Date _________________Time _____________
Picture/Photo Documentation? Yes No
Amount of Rain __________________ Inches in Last __________________ Hours/Days
Heavy Rain Steady Rain Intermittent Rain
Present Conditions: Heavy Rain Steady Rain Intermittent Rain
Partly Cloudy Overcast Clear/Sunny
Site Description: (e.g. Salt Marsh, Beach, Estuary) ________________________________
Is Waterway Influenced by Tides? Yes No
If Yes, Tide was: High Outgoing Low Incoming
Water Surface: Calm Ripples Waves Whitecaps
Impaired Habitat Indicators: Foam Bubbles Oil Scum
Dead Organisms________________ Erosion_______________________
Trash Present__________________ Vegetative Debris________________
Dumping_____________________ Excessive Algae_________________
Dredging_____________________ Dock/ Pier Present______________
Artificial Water Control (groin, jetty, dyke, etc)________________________
Water Color: Clear Muddy Milky Gray Green
Brown Tan Other_________________________
Odor: Gas Oil Chlorine Rotten Eggs
Sewage Chemical Other_________________________

40
Wetland Condition/Appearance:
Marsh Grass Green Marsh Grass Brown Other____________________
Marsh Surface Mostly Mud/ If so is mud area increasing or decreasing? __________________
Invertebrate Survey:
Many White Snails (Periwinkles) Many Black Snails (Mudsnails)
Few Periwinkles Few Mud Snails Dead Fish Present
Dead Blue Crabs Present Other Dead Organisms______________________
Fiddler Crabs Present Fiddler Crabs Absent Crab holes present, #_______
Ribbed Mussels Present Ribbed Mussels Absent Dead Ribbed Mussels
Mud/Soil Survey:
Black on Surface Reddish Brown Color Brown on Surface
Black Surface Streaks Mostly Brown Color Green on Surface
Other ____________________________________________________
Mud Moisture Content:
Totally Dry Wet Damp
Mud Texture: Clay/Mud (sticks to finger) Sand (larger particles, not stick to finger)
Additional Comments/Observations:
Submit Form To: Adopt-A-Wetland Program ● University of Georgia Marine Extension Service ● 20 Ocean Science Circle ● Savannah ● GA 31411 ● Fax: (912) 598-2399 ● [email protected]

41
Chapter Four
Biological Monitoring
Mucking, Skidaway Island (Alan Power, MAREX)
Biomonitoring Diversity of Organisms in Estuaries Invasive Species Biological Monitoring Protocol Biological Survey Worksheets

42
Biological Monitoring
Biomonitoring provides information on changes in the plant and animal communities that may occur
in our wetlands. Any changes to these environments will be reflected in the quantity/quality of plants or the
types of animals present. There are various biological survey methods available to monitor your adopted site
depending on the type of site you may have. After becoming quality assurance/quality control (QA/QC)
certified, your group will be given all the necessary equipment to conduct the biological surveys.
Biomonitoring
Our monitoring protocol concentrates on macroinvertebrate (large visible animals without a
backbone) and vegetative sampling. Some common types of macroinvertebrates, include oysters, mussels,
snails, crabs, and worms. Some common plants, which may be found at your site, include smooth cordgrass,
needle rush, sea oxeye daisy, sea lavender, and sea oats. Macroinvertebrates and wetland plants are good
indicators of wetland quality because:
• They are affected by the physical, chemical and
biological conditions of the wetland.
• They cannot escape pollution and show effects of
short and long-term pollution events.
• They are an important part of the food web,
representing a broad range of trophic levels.
• They are relatively easy to collect and identify with inexpensive materials.
Marsh Periwinkle (Becci Curry, St. Mary’s Elementary)

43
Diversity of Organisms in Estuarine Communities
Biodiversity is a measure of the diversity or the number of species occurring in a community. A
community is a naturally occurring group of different species of organisms that live together and interact as a
unit. A salt marsh community may contain animals such as the fiddler crab, periwinkles, coffee bean snails,
marsh clams, mussels, mud crabs, and stone crabs. Species diversity depends on species richness and species
evenness. Species richness is the number of species present, while evenness refers to the distribution of
individuals among the species (i.e. if all species are equally abundant then evenness is high).
A high diversity would mean that there are many equally abundant species whereas a low diversity
would indicate few equally abundant species or many species with an unequal abundance. However, there are
other factors, which affect the numbers of species in coastal and marine habitats. General animal population
dynamics influenced by environmental factors and species strategies are inherent in nature. We have broken
down some of these population factors and the effects on the diversity of the coastal communities.
General Population Growth and Carrying Capacity in Natural Communities
The population growth of a species relates to an organisms reproductive potential and environmental
factors within the habitat. Typically, population growth occurs in an S or sigmoid curve. To illustrate this
curve we present the following example using an algal reproduction graph (page 44) which has been adapted
from Wilson and Bossert (1971). Monthly algae cell densities and/or seasonal algal population growth (y
axis) in a tidal pool or creek are plotted over the course of a year (x axis). There are several steps to the
typical S growth curve. Between January and April when nutrients are limited and the temperatures are low
there is little to no algae cell production. During the spring warming temperatures and an increase in nutrient
loading causes the algal population to increase. This growth period is labeled “exponential growth” or (r) in
the graph. Typically, during the summer, there is an increase in nutrients including the nitrates and
phosphates from lawn fertilizers, golf courses, and farms (also known as non-point source pollution). The
abundance of these nutrients will cause algae to reproduce rapidly followed by a slowing trend and a “leveling

44
off” when the population approaches its carrying capacity (K). Carrying capacity occurs when nutrients are at
optimum levels and death equals algal production.
0
500,000
1,000,000
1,500,000
2,000,000
2,500,000
3,000,000
J F M A M J J A S O N D
Month
# A
lgal
Cel
ls/m
l
Carrying Capacity (K)
No Growth
Exponential Growth (r)
Figure Legend: Graph illustrating a Sigmoid (S) population growth curve by describing algae population growth (monthly algal cell count per milliliter) over the course of a year in estuarine systems.
As depicted in the example above, the letters r and K represent the components of a population
growth curve derived by a formula. In order to understand population dynamics we must break apart the
building blocks of the population curve and plug in the r and K values. The logistic equation for the Sigmoid
or S population curve as defined by Wilson and Bossert (1971) is:
rN(K-N) defined as: N = number of individuals K t = units of time r = constant rate of population increase (births greater than deaths)
K = Carrying capacity of the environment.

45
Density-Dependent versus Density-Independent Factors
Other factors can enter the population equation in natural environments or in biological
communities. The growth of an animal population strives to reach stability or carrying capacity (K).
However, in natural systems populations encounter forces (known as density-dependent or density-
independent factors) which will affect density and growth. Density-dependent factors are internal forces that
operate within the population. For example, infections, diseases, or stress related health problems can occur
within an oyster population. In another instance, too many individuals of a species will cause lack of space,
and low resources creating competition and/or stress within the population. These problems (density-
dependent forces) occur only when the density of a population reaches a critical level (Hickman et. al. 1984).
Density-independent factors occur outside of the population, examples include drastic changes that
are environmental in nature. For instance extreme weather changes, unusually cold weather, hurricanes or
drought conditions are examples of density independent forces acting against a population. One example of
a density independent factor on the coast was the severe drought causing a gradual increase in salinity from
1998-2004. High salinities caused soil salinities to increase resulting in large areas of marsh die-off from
2002-2004. Since heavier rains commenced in 2004 the coastal Georgia salt marshes have recovered.
Comparison of r and K Selected Species
Biologists have categorized animals on adaptations they have developed to deal with density-
independent or density-dependent situations that arise and effect populations. K-selected species are animals
or species whose populations can survive controls that are density-dependent in nature. Conversely, r-
selected species are animal populations that have developed adaptations that are density-independent in
nature (Hickman et. al. 1984). Density-dependent or density-independent factors will effect all populations.

46
In the table below, notice the general characteristics of r-strategy species and K-strategy species.
r-selected species K-selected species
Mature rapidly Mature slowly
Short lived Long lived
Many offspring Few offspring
Little to no care at birth Care for young at birth
Considered pests due to high densities May become threatened or endangered
Opportunistic Have stabilized populations
Few juveniles become adults Young usually reach maturity
Small size Large size
Examples: fiddler crabs, frogs Whales, birds
If we imagine a scale with r-species on one end and K species on the other many animals would fall
on either end of the scale. However, many animal species can show traits of both r-selected strategies and K-
selected strategies causing them to fall in between r or K on the scale (adapted from continuum concept in
Hickman et. al. 1984). In the example below turtles and whelks are relatively long-lived, offer little care for
their many offspring, and few young reach maturity.
r-selected mixed r and K selected K-selected
mud snails sea turtles whales
skeleton shrimp whelks dolphins
fiddler crabs
Diversity in a Salt Marsh
Estuaries and salt marshes are the transition zone between fresh and salt water. The composition of
plants and animals in the marsh depends on various environmental conditions such as salinity, temperature,
tidal fluctuations, dissolved oxygen levels, turbidity, depth, substrate, and pollution.
If we dissected and examined the diversity of a salt marsh, we would find various communities and
habitats. For instance, salinity, flooding, and anaerobic soil conditions affect the plant communities within
the marsh. Smooth cord grass (Spartina alterniflora) is most adapted to these harsh environmental conditions,

47
so this species is the most common. Areas of high marsh and brackish water also give rise to the Black
Needle rush (Juncus roemerianus). In areas where water sits for a long period, and evaporation rate is high a
layer of salt accumulates on the soil. This area (known as a salt pan) is where no plants can grow to due very
high soil salinities. In some zones of the high marsh, the salinities are too high to support growth of Smooth
Cord grass. Other plant species that can tolerate the higher salinities in these areas of the marsh include
glasswort (Salicornia spp.) and salt grass (Distichilis spicata).
Similar elevation zones within the salt marsh exist for animal communities. The higher elevations of
the marsh (near marsh edge) support shrubs, trees, providing cover for sparrows, marsh wrens, and marsh
hawks. Additionally, the higher elevations of the marsh are the location of the “wrack line” where piles of
dead marsh grass accumulate and where spiders and amphipods reside.
The muddy marsh bottom supports algae consumed by the coffee bean snail (Melampus bidentatus) and
olive nerite (Neritina usnea). Other muddy marsh bottom inhabitants include the mud snails (Nassarius
obsoletus), fiddler crabs (Uca spp.), mud crabs (Rhithropanopeus harrisii), various species of tanaids, isopods,
oligochaetes, polychaetes and worms (Capitella capitata, Neanthes succinea and Streblospio benedicti). Most of these
species feed on sediment/detritus plus associated bacteria and protozoans. Bivalves on the marsh floor,
which filter feed algae, bacteria, include the ribbed mussel (Geukensia demissa), Carolina marsh clam (Polymesoda
caroliniana) and the Florida marsh clam (Cyrenoida floridana).
Few species (but high abundance of animals in each species) live in the salt marsh. However, species
composition can fluctuate with the seasons. Generally, peak densities of marsh fauna occur in the spring or
fall, with lowest animal density occurring during the summer due to predation and competition. Typically,
biodiversity is low in the salt marsh and animal populations are usually r-selected species.
Diversity of Estuarine Mud Flats
One of the unique areas to visit in coastal Georgia is a mud flat. Mud flats are another habitat
supporting populations and communities of estuarine invertebrates and fish. They are located at the edges of

48
the salt marsh between the tidal creeks and rivers most of these areas are made of varying combinations of
clays, silts, or sand. There are few species located in this zone, but the numbers of animals present in the
mud are high. Polychaetes and mud snails are generally the main organism found in the mud. However,
there are various assortments of predators also found usually at high tide such as blue crabs (Callinectes
sapidus), grass shrimp (Palaemonetes pugio), penaed shrimp (Penaeus aztecus, P. setiferus) silversides (Menidia spp)
and killifish (Fundulus spp). As the tide recedes before a low tide, many fish (e.g. skates, rays, and flat fish
such as flounders, small sharks, and red drum) will congregate on the shallow waters of a mud flat feeding on
many of the animals in the area. Additional species found on a typical coastal Georgia mud flat include:
Spiophanes bombyx (mud worm); Scolecolepides viridis (mud worm); Oxyurostylis smithi (Sharp-Tailed Cumacean);
Solen viridis (Little Green Razor Clam); and Pinnixa cf. chaetopterana (commensal crab).
Distribution and numbers do vary during the seasons with the lowest numbers or organisms
occurring during the summer possibly due to high predation and high water temperatures with normally
associated low oxygen levels (Hackney et. al. 1992).
Diversity of an Oyster Reef
Oyster reefs in coastal Georgia are common however; they were even more prevalent in the early 19th
century. Over fishing, disease, and poor water quality have taken a tremendous toll on the oyster population.
Oyster reefs in Georgia are located along tidal creeks and in estuarine rivers where they grow best between
the high and low tide line (intertidally). The common species is the eastern oyster/American oyster
(Crassostrea virginica). Oyster reefs support a myriad of species and can be quite a diverse community
supporting from 20 to up to 300 different species. Oyster reefs and associated species provide major food
sources for numerous invertebrate and fish species making it a valuable habitat to estuarine communities.
For this reason oysters are termed “keystone species”.
Common species on an oyster reef include several species of mud crabs (Panopeus obesus, P. simpsoni,
and Eurypanopeus depressus) which feed on oysters and small crustaceans. Filter feeders such as the hooked

49
mussel and ribbed mussel are usually attached to oyster shells. Several species of worms are present between
shell crannies of the oyster reef, the most common worm being Neanthes succine. However, other worms that
are present in this habitat include Polydora websteri, Heteromastus filiformis and Streblospio benedicti. Fish are often
found in oyster reef communities some of these include gobies (Gobiosoma spp.), blennies (Chasmodes spp,
Hypleurochilus spp., Hypsoblennius spp), skilletfish (Gobiesox strumosus), and toadfish (Opsanus spp). Predators
include whelks, flatworms, crabs, skates, rays, black drum, and the American oystercatcher (Hackney et. al.
1992). The oyster reef community and the associated species are major food sources making it a valuable
habitat to estuarine communities.
How is Diversity Measured?
A diversity index is often calculated to describe the diversity of animals present in a community.
These indices typically concern the measure of order or disorder within the ecosystem.
The way it works is we ask the question: How difficult would it be to predict the species of the next
individual collected from the community? The degree of uncertainty associated with this prediction is a
measurement of diversity. If we feel confident in naming the next species we sample the uncertainty number
or diversity index is low (i.e. there are so few species present that it would be relatively easy to predict the
next species sampled). When the diversity index value is high, the uncertainty value is high, making it more
difficult to predict the next species collected (i.e. there are so many different species present that the odds of
guessing the next one collected are very low). One of the simplest and most widely used diversity indices is
the “Shannon-Wiener Index” (H’) which takes species richness (number of species present) and species
evenness (relative abundance of each species present) into consideration. An example of how to calculate
this index is provided on page 64. The Shannon-Wiener index formula (Smith and Smith, 2003) is:
H’= - ∑ Pi ln Pi OR = - sum of [(Pi)(Natural Log)(Pi)] for each species present i=1 Where Pi is the relative abundance of each species = ni/N ni = number of individuals in species i N = total number of individuals in all species S = number of species.

50
Invasive Species
Invasive species are organisms that live outside of their native range and have a detrimental effect on
natural ecosystems, economies and human health. Some of the more commonly known aquatic invasive
species in recent times include the zebra mussel, the green porcelain crab, and the Atlantic lion fish.
Invasives usually proliferate very aggressively and can often displace native species and introduce new
diseases. Usually the introduction of an invasive species is accidental; such as, the discharge of ballast water
containing larval stages of invasive species from large ships near coastal waters, or accidental transport of
invasive species from an improperly cleaned boat hull or bilge water from another region. However, in the
southeastern U.S. region the release of ornamental fish from home aquaria is becoming a very common
pathway.
The green mussel (Perna viridis) is native to tropical and subtropical waters of the Indo-Pacific, from
the Persian Gulf to S.W. Pacific; and from southern Japan to Papa New Guinea. The first green mussel in
the United States was reported in Tampa Bay in 1999. It is believed that larvae were released from ballast
water in cargo ships. In early 2003, a separate introduction occurred on the East Coast specifically near St.
Augustine, possibly from beach renourishment equipment that had been shipped from the Tampa region.
During the spring of 2003 the Georgia Department of Natural Resources observed green mussels on
offshore buoys marking artificial reefs. The first inshore specimen in Georgia was found in Brunswick during
the fall of 2003. Since then they have been discovered throughout coastal Georgia, as far north as the
Savannah River and also at the south end of Tybee Island (Power et al., 2004).
In coastal Georgia green mussels are usually found in late summer and early fall, and thrive in sub-tidal
depths (below the high and low tide line) but can also be found in the low intertidal zone, such as on the jetties
at Tybee Island. The intertidal green mussel population does not survive over winter in Georgia because it
appears to be at its northern most water temperature tolerance. However, the mussels living in the inshore
sub-tidal zones and offshore on the artificial reefs have survived and will continue to re-seed inshore areas.
Green mussels have the potential to be the salt water’s counterpart of the zebra mussel. The zebra mussel

51
occurs in freshwater throughout much of the United States, but is not yet found in Georgia. The zebra mussel
is responsible for clogging industrial pipes and fouling boat hulls and has also caused ecological problems.
One zebra mussel can filter 1 quart per day. With mussel densities in the millions, they can filter an entire lake
in a single day. The zebra mussel has displaced native clams and even colonized and grown on the backs of
crayfishes and the shells of turtles. There is no official method of controlling zebra mussels except physically
scraping surfaces or replacing pipes.
If the green mussel population increased, they could compete with and displace other native filter
feeders such as oysters and native mussels. Green mussels commonly mature in 2-3 months and can spawn
all year long in Thailand. After spawning, the larvae drift in the water column for up to two weeks before
metamorphosing and settling onto hard surface. They have been reported to reach up to 11 inches in length
and can live for up to three years. Green mussels are so prolific in certain areas they reach densities of 35,000
m2 depriving other marine organisms of adequate food and oxygen.
If we have a mild winter, green mussel populations may increase, become established, and thrive here
in the future. We are tracking green mussels to determine their prevalence in the coastal Georgia area. If you
see a green mussel please call the University of Georgia Marine Extension Service at 912-598-2348.
Green Mussels, Perna viridis (Alan Power, MAREX)

52
Have You Seen Me?
Photo Credit: Dr. Richard Gleeson Guana Tolomato Matanzas National Estuarine Research Reserve
The green mussel Perna viridis is an invasive species from the Indo Pacific region. It was introduced to Georgia during 2003. If found please record as much of the following information as possible and send to:
Dr. Alan Power
University of Georgia Marine Extension Service 20 Ocean Science Circle, Savannah, GA 31411
Telephone: (912) 598 2348; Fax: (912) 598 2399; Email: [email protected] Date: _________________________________________________________ Location (GPS if available): ________________________________________Number of Living/Dead Mussels: ___________________________________Attached to: ____________________________________________________Approximate Depth: _____________________________________________ Water Temperature & Salinity: ______________________________________Shell Length(s): _________________________________________________ _________________________________________________ _________________________________________________ _________________________________________________ Collectors Name & Contact: _______________________________________ _______________________________________ _______________________________________ _______________________________________ _______________________________________
The University of Georgia Marine Extension Service

53
Monitoring Protocol
1. Salt Marsh Bioassessment
If choosing a marsh site, please select technique A, B, or C but if you would like you can do more than one.
A. D-Net Survey (every 3 months)
Based on methods described in: Biomonitoring and Management of North American Freshwater Wetlands
(Rader et al., 2001).
What you will need:
1. long rope and 2 PVC poles
2. yard stick or meter stick (1)
3. Adopt-A-Wetland Manual
4. buckets (2-3)
5. dishes or pans to sort the organisms
6. D-Net
i) Set up the transect during a high tide in the high marsh or marsh border. A total of 5 survey stations
should be selected for each transect. Calculate your total distance from high to low marsh and divide by 5 to
determine the distance between survey stations. Remember to enter the marsh as far as you can safely go.
ii) Mark off a 1-meter section of the transect at each survey station. At each station hold the D-Net parallel
to the line of your transect. Sweep the D-Net along the sediment surface of the marsh, scraping the mud and
organic debris in the process. Perform sweeping motions 5 times along one side of the 1-meter section of
the transect. Repeat the same procedure on the direct opposite side.
Marsh Monitoring, Ossabaw Island (Ellie Covington, MAREX)

54
iii) When you finish sweep netting at each station, sort through the debris, separate, count, and identify the
organisms. Combine all of the organisms from each survey station along the transect into one sample.
Record the information on biological survey worksheets (pages 59, 62, 63).
iv) Groups can then calculate the diversity index for macroinvertebrates by completing the Biological
Diversity Index Worksheet on page 65.
v) Mark the beginning of the transect in the high marsh area with a PVC pole and always return to the same
site every 3 months for biological monitoring.
B. Box Survey (every 3 months)
Based on methods described in: A Study Approach to the Georgia Coast Profile of a Salt
Marsh. T. Schoettle. University of Georgia Marine Extension Service Publication. Study
Unit II. Supported by Georgia Sea Grant College Program (Grant # NA30AA-D-00091).
What you will need:
1. long rope and 2 PVC poles
2. yard sticks or meter sticks (5)
3. calculator
4. Adopt-A-Wetland Manual
5. buckets (2-3), and sorting pans
i) Begin in the high marsh or marsh border.
A total of 5 survey stations should be selected along a transect. Station number one should be closest to the
high marsh, followed by the other stations extending out into the marsh. Calculate your total distance from
Reef Survey, Little Cabbage Island (Anne Lindsay Frick, MAREX)

55
high to low marsh and divide by 5 to determine the distance between survey stations. Remember to enter the
marsh only as far as you can safely go.
ii) By using meter sticks or yard sticks make boxes along the transect. The box will be the area where you will
work from so be careful not to step inside and disturb the area.
iii) When at each station, sort through the debris, separate, count, and identify the organisms. Count all
organisms including clams, mussels, snails, crabs and crab holes that you find in the box. Include organisms
you find on the grass or vegetation, as long as they are in the box. Identify and combine all of the living
organisms from each box and record the data on the box survey data sheet, as it pertains to the station
number (page 62). Groups can calculate the diversity index by completing the Biological Diversity Index
Worksheet on page 65.
iv) Identify the different kinds of plants in each survey box and count the total number of individual plants of
each kind and record on Box Survey Data Sheet (e.g. 20 Spartina grasses and 23 Needle Rush) on page 62.
v) Measure the height of 15 individual Spartina grasses and calculate the average for each survey station.
Record the height information on Spartina Height Data Sheet on page 63.
C. Hester-Dendy Survey (once per month)
Based on methods described in: Standard Methods Ed. (Eaton et al., 1995).
What you will need:
1. Hester-Dendy Colonizing Plates
2. buckets (2)

56
3. pliers
4. knife for scraping plates
5. rope to suspend plates from
6. small dishes or pans to sort organisms
7. magnifying glass would be helpful
8. kitchen strainer
9. good lamp/lighting
10. Coastal Georgia Adopt-A-Wetland Manual
i) Place the colonizing plates approximately six inches to one foot
under the surface of the water (measure from the top loop of the
plates and the surface of the water).
ii) Allow the plates to suspend in the water for one month. If left in the water too long, too many organisms
will colonize which makes it difficult to sort.
iii) When the appropriate time has elapsed, retrieve the plates and take them to an area with proper lighting so
you can sort them according to groups.
iv) Use the pliers to loosen the nut on the bottom of the samplers, pull all of the plates apart and scrape both
sides of each plate. Collect all of the debris into a bucket of salt water. If the water is too dirty, sift the water
and debris through a sieve. A metal kitchen strainer with a fine mesh works well.
v) Sort all of the organisms that look alike, for example, all of the snails go in one dish/pan, crabs in another.
This process may take a while but you will improve your skills each time you collect.
Hester Dendy (Ellie Covington, MAREX)

57
vi) By using the identification guide in the back of the manual, identify organisms and record on the
biological form on page 60. Release any living organisms back into the river or tidal creek.
vii) Advanced groups can calculate the diversity index on page 65 for macroinvertebrates by completing the
Biological Diversity Index Worksheet in the manual.
viii) To re-assemble the Hester-Dendy colonizing plates: you should have 24 spacers and 14 disks; starting
from the “eye loop” (top) put 9 disks separated by 1 spacer each, separate disk 10 by 2 spacers, 11-12 disks by
3 spacers, and 13-14 by 4 spacers. When fully assembled secure with the washer and wing nut.
2. Beach Bioassessment
Please chose A, B, or C, but if you like you can do all three.
A. Hester-Dendy Survey
If there is a dock piling or similar structure you can use to suspend the Hester-Dendy plate sampler from, use
this technique by following the instructions provided above.
B. Seine Survey (every 3 months)
Seining is a commonly practiced technique wherein a net
is drawn through the water to capture the organisms.
What you will need:
1. seine
2. buckets (3)
3. Adopt-A-Wetland manual
4. yard stick (to measure depth) Beach Monitoring, Jekyll Island (Mary Sweeney Reeves MAREX)

58
i) At the beach when approaching the surf, always stay at a safe depth - preferably 3 feet. Sweep through the
shallow water with a 10-20-foot seine for approximately 2-3 minutes. Repeat this procedure 3 times.
ii) Identify fish and invertebrates by using the identification guide and record your results in the worksheets
on page 60.
iii) Groups can calculate the diversity index by using the Diversity Worksheet (page 65).
C. Dune Measurement (every 3 months)
What you will need:
1. markers (PVC pipe, surveyor flags, stakes, etc.)
2. measuring tape
3. dune data sheet
i) Mark the perimeter of the dune where elevation begins
with markers. Place markers at regular intervals along the
sides of the dune (e.g. dune length is 2 m, place markers (4)
every 50 cm). Surveyor flags, PVC pipe, or stakes work well to make your line.
ii) Measure length of dune, (parallel to the ocean) record results on worksheet (page 66), and leave markers
for future measurements.
iii) After 3 months, measure dune perimeter and see if sand movement has occurred over (accretion) or away
(erosion) from markers.
Cumberland Island Dunes (Alan Power, MAREX)

59
COASTAL GEORGIA ADOPT-A-WETLAND BIOLOGICAL MONITORING FORM
AAW Group Name _______________________ County _________________________
Group ID Number AAW-G-_____________ Site ID Number AAW-S-______________
Investigators _____________________________________________________________
________________________________________________________________________
Wetland Name __________________ Date ______________ Time _____________
Rain in Last 24 Hours? Yes/No Amount of Rain _____ Inches in Last _____ hours/days
Heavy Rain Steady Rain Intermittent Rain
Present Conditions: Heavy Rain Steady Rain Intermittent Rain
Partly Cloudy Overcast Clear/Sunny
Site Location Description (e.g. Salt Marsh, Tidal Creek, Beach) _______________________
Sampling Technique: D-Net Box Survey
Seine Hester-Dendy/How long in water?_______
Notes: ___________________________________________________________________
________________________________________________________________________
________________________________________________________________________
________________________________________________________________________
Submit Form To: Adopt-A-Wetland Program ● University of Georgia Marine Extension Service ● 20 Ocean Science Circle ● Savannah ● GA 31411 ● Fax: (912) 598-2399 ● [email protected]

Coastal Adopt-A-Wetland Biological Community Sampling Form Method of collection (Please Circle One): 1. Hester-Dendy Plates 2. Seine
Phylum Mollusca Phylum Arthropoda Phylum Ecinodermata Class Gastropoda (Snails & Slugs) Class Cirrepedia (Barnacles) Class Holothuroidea (Sea Cucumbers) Oyster Drill Barnacle Sea Cucumber Mud Snail Class Malacostraca (Crabs, Shrimp) Class Asteroidea (Sea Stars) Knobbed Whelk Fiddler Crab (sand, mud, brackish sp.) Sea Star Lightning Whelk Mud Crab Class Echinoidea (Sea Urchins, Sand Dollars) Channeled Whelk Blue Crab Key Hole Urchin (Sand Dollar) Tulip Snail Hermit Crab Sea Urchin Dove Snail Stone Crab Class Ophiuroidea (Brittle Stars) Rock Snail Porcelain Crab Brittle Star Keyhole Limpet Spider Crab Phylum Annelida Nudibranch Calico Crab Class Polychaeta (Worms) Lettered Olive Speckeled Crab Worm Class Bivalvia (Mussels, Clams, Oysters) Class Merostomata (Horseshoe crabs) Class Hirudinea (Leeches) Ribbed Mussel Horseshoe Crab Leech Hooked Mussel Class Pycnogonita (Sea Spiders) Scorched Mussel Sea Spider Paper Mussel Hard Clam Phylum Cnidaria Surf Clam Class Anthozoa (Anemones) Oyster Anemone Ark Sea Whip Jacknife clam Sea Pansy Coquina Other Marsh clam Class Scyphozoa (Jellyfish) Dwarf Surf clam Jellyfish Phylum Porifera Other Class Demospongiae (Sponges) Redbeard Sponge Phylum Ctenophora Basket Sponge Class Tentaculata (Comb Jellies) Finger Sponge Comb Jellies Total Number of All Kinds: Boring Sponge Other Total Number of All Individuals:
GROUP NAME: SITE NAME: DATE:
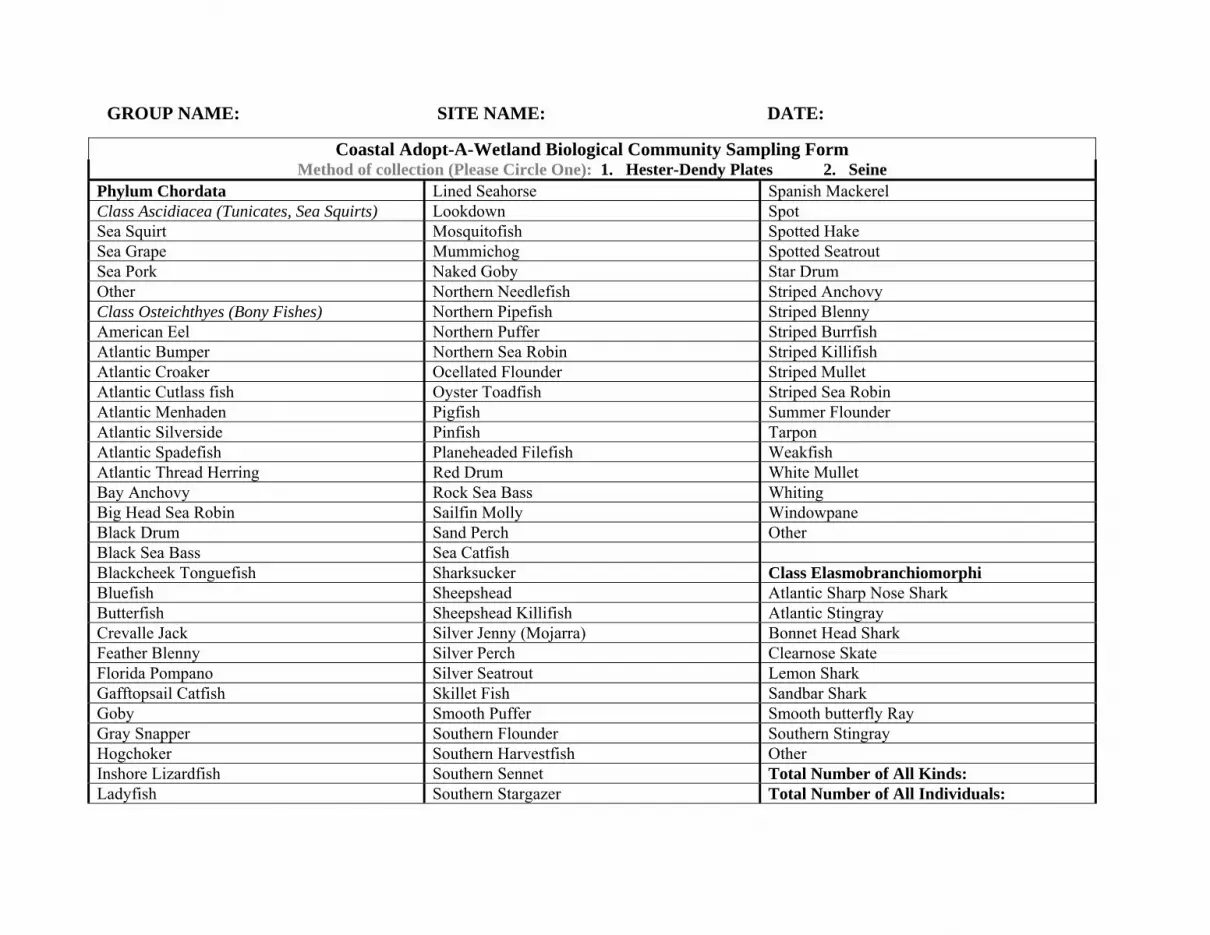
Coastal Adopt-A-Wetland Biological Community Sampling Form Method of collection (Please Circle One): 1. Hester-Dendy Plates 2. Seine
Phylum Chordata Lined Seahorse Spanish Mackerel Class Ascidiacea (Tunicates, Sea Squirts) Lookdown Spot Sea Squirt Mosquitofish Spotted Hake Sea Grape Mummichog Spotted Seatrout Sea Pork Naked Goby Star Drum Other Northern Needlefish Striped Anchovy Class Osteichthyes (Bony Fishes) Northern Pipefish Striped Blenny American Eel Northern Puffer Striped Burrfish Atlantic Bumper Northern Sea Robin Striped Killifish Atlantic Croaker Ocellated Flounder Striped Mullet Atlantic Cutlass fish Oyster Toadfish Striped Sea Robin Atlantic Menhaden Pigfish Summer Flounder Atlantic Silverside Pinfish Tarpon Atlantic Spadefish Planeheaded Filefish Weakfish Atlantic Thread Herring Red Drum White Mullet Bay Anchovy Rock Sea Bass Whiting Big Head Sea Robin Sailfin Molly Windowpane Black Drum Sand Perch Other Black Sea Bass Sea Catfish Blackcheek Tonguefish Sharksucker Class Elasmobranchiomorphi Bluefish Sheepshead Atlantic Sharp Nose Shark Butterfish Sheepshead Killifish Atlantic Stingray Crevalle Jack Silver Jenny (Mojarra) Bonnet Head Shark Feather Blenny Silver Perch Clearnose Skate Florida Pompano Silver Seatrout Lemon Shark Gafftopsail Catfish Skillet Fish Sandbar Shark Goby Smooth Puffer Smooth butterfly Ray Gray Snapper Southern Flounder Southern Stingray Hogchoker Southern Harvestfish Other Inshore Lizardfish Southern Sennet Total Number of All Kinds: Ladyfish Southern Stargazer Total Number of All Individuals:
GROUP NAME: SITE NAME: DATE:

62
Date: AAW Group Name: Length of Transect (ft or m): Identify the types and numbers of animals and plants in each survey station (for help in identification please see Macroinvertebrate and Plant Identification keys in the Appendix of this manual).
Station 1 # Station 2 # Station 3 # Station 4 # Station 5 # Atlantic Ribbed Mussel
Atlantic Ribbed Mussel
Atlantic Ribbed Mussel
Atlantic Ribbed Mussel
Atlantic Ribbed Mussel
Eastern Oyster
Eastern Oyster Eastern Oyster Eastern Oyster Eastern Oyster
Periwinkle Snail
Periwinkle Snail Periwinkle Snail Periwinkle Snail Periwinkle Snail
Mud Snail
Mud Snail Mud Snail Mud Snail Mud Snail
Coffeebean Snail
Coffeebean Snail Coffeebean Snail Coffeebean Snail Coffeebean Snail
Amphipod
Amphipod Amphipod Amphipod Amphipod
Fiddler Crabs
Fiddler Crabs Fiddler Crabs Fiddler Crabs Fiddler Crabs
Crab Holes (> ¼ inch)
Crab Holes (> ¼ inch)
Crab Holes (> ¼ inch)
Crab Holes (> ¼ inch)
Crab Holes (> ¼ inch)
Cordgrass (Spartina)
Cordgrass (Spartina)
Cordgrass (Spartina)
Cordgrass (Spartina)
Cordgrass (Spartina)
Needlerush (Juncus)
Needlerush (Juncus)
Needlerush (Juncus)
Needlerush (Juncus)
Needlerush (Juncus)
Seaweed
Seaweed
Seaweed
Seaweed
Seaweed
☺Helpful hint: If there are too many grasses in the box you can estimate the number of grasses.
Box Survey Data

63
Cordgrass (Spartina) Height Data Sheet for Box Survey
Date: AAW Group Name: Measure height of 15 Spartina plants in each survey station and choose color (green, yellow, brown) for each stem measured then calculate the average.
Optional Please estimate the number of blades of Spartina in your stations and circle the appropriate color option.
Station #1 Station #2 Station #3 Station #4 Station #5 Spartina Sample # Ht Color Ht Color Ht Color Ht Color Ht Color 1 2 3 4 5 6 7 8 9 10 11 12 13 14 15 Sum Average Height (Sum÷15)
Station 1
Station 2
Station 3
Station 4
Station 5
< 10 Green < 10 Green < 10 Green < 10 Green < 10 Green
20-50 Yellow 20-50 Yellow 20-50 Yellow 20-50 Yellow 20-50 Yellow
> 50 Brown > 50 Brown > 50 Brown > 50 Brown > 50 Brown

64
Shannon-Wiener Biological Diversity Index (H’) Worksheet
H’= - ∑ Pi ln Pi OR = - sum of [(Pi)(Natural Log)(Pi)] for each species present i=1
Where Pi is the relative abundance of each species = ni/N ni = number of individuals in species i
N = total number of individuals in all species S = number of species
A B C D E F
Species
# Individuals of all Species
Total Number of Individuals of all Species
Relative AbundanceOf Each Species
Natural log of Relative Abundances
Relative Abundances Times Their Natural log
(i) (ni) (N) (Pi) (ln Pi) (Pi ln Pi)
= sum Column A
= Column B/C
= ln Column D
= Column (D)(E) Mud Crab 2 39 0.05 -2.99 -0.15 Worn 3 39 0.08 -2.53 -0.20 Periwinkle 10 39 0.25 -1.39 -0.35 Blue Crab 23 39 0.59 -0.53 -0.31 Whelk 1 39 0.02 -3.91 -0.08
Sum of or Column F = -1.09 Multiply by -1 to make positive = Shannon-Wiener Index Diversity Index = 1.09 Diversity Scale
1 2 3 4 5
Not Diverse → Moderately Diverse → Diverse Community Not Diverse
S

65
Shannon-Wiener Biological Diversity Index (H’) Worksheet
H’= - ∑ Pi ln Pi OR = - sum of [(Pi)(Natural Log)(Pi)] for each species present i=1
Where Pi is the relative abundance of each species = ni/N ni = number of individuals in species i
N = total number of individuals in all species S = number of species
1. Circle type of monitoring: Box Survey, Colonizing plates, D-Net, and Seine 2. Habitat type (i.e. oyster reef, salt marsh): 3. Calculate the diversity index for your sample by completing the worksheet below.
A B C D E F Species
# Individuals
of Each Species Total Number of
Individuals in all SpeciesRelative Abundance
Of Each Species Natural log of
Relative Abundances Relative Abundances
Times Their Natural log (i) (ni) (N) (Pi) (ln Pi) (Pi ln Pi)
= sum Column A
= Column B/C
= ln Column D
= Column (D)(E)
Sum of Column F = ____________ Multiply by -1 to make positive = Shannon-Wiener Index Diversity Index = _____________________ Diversity Scale
1 2 3 4 5 Not Diverse → Moderately Diverse → Diverse
S

66
Dune Measurement: AAW Group Name: Date: Dune length (m): Comments/ Observations: Does your dune appear to be moving? If so, in which direction (North, South, East, West)? Is the dune eroding or accreting? Other signs of impact (footprints, trash, etc.) Any change in vegetation? Additional notes:

67
Chapter Five Physical/Chemical Monitoring
Physical/Chemical Parameters Physical/Chemical Monitoring Protocol Physical/Chemical Survey Worksheets
St. Marys Group (Becci Curry, St. Mary’s Elementary)
St. Marys Group (Mary Sweeney Reeves, MAREX)

68
Physical/Chemical Monitoring
Physical/Chemical monitoring is conducted once a month at the same location. This level of
monitoring is used to gather information about specific water quality characteristics. Regular monitoring helps
assure that your information can be compared with changes over time. In tidally influenced locations be sure
to note the direction of the tide (incoming/outgoing), and conduct sampling at the same tidal stage each
month. At extremely low tides there may not be water present for sampling so check tide charts before going
to your site. Also, chemical testing during or immediately after a rain may produce very different results than
during dry conditions. Therefore it is very important to record weather conditions. If conditions are unsafe
for any reason, DO NOT SAMPLE.
Several physical/chemical conditions may be tested at your site including temperature, pH, dissolved
oxygen (DO), salinity, turbidity, and settleable solids. After attending a training session and becoming
QA/QC certified your group will be given all necessary equipment to conduct these tests. Be sure to follow all
instructions and follow safety guidelines when conducting chemical analysis.
Physical/Chemical Parameters
Temperature
Temperature has an effect on the chemical and biological processes of an aquatic system. Temperature
will affect the dissolved oxygen levels, density of water, the distribution of organisms, and the metabolic
processes of organisms. Temperature differences between surface and bottom waters can produce vertical
currents, which will transport or mix nutrients and oxygen throughout the water column.
Changes in temperature occur with depth, these changes result from cooling and warming
temperatures during the seasons. In the warm summer months, warmer water is on the surface with cooler
water at lower depths. When temperatures begin to cool as in late autumn, the surface water becomes cool
and dense and sinks to the bottom. This mixing of the surface and bottom layers of water will cause nutrients

69
to disperse from the bottom to the surface. The dispersed surface nutrients act as fertilizers for
phytoplankton. Phytoplankton, in this case, are free-floating microscopic aquatic plants drifting in surface
areas of the water. Phytoplankton blooms usually occur in warmer temperatures during the Spring, Summer,
or Fall (Ohrel and Register, 1993).
Water temperature is also influenced by wind, storms and currents created by tides. The water
movement created by current or wind causes a higher rate of mixing within the entire water column.
Tributaries such as rivers or shallow tidal creeks, which are heated quickly, may influence temperature as they
flow into the estuary or tidal creek. Also, water temperature may be increased by discharges of water used for
cooling purposes or by runoff from heated surfaces such as roads, roofs, and parking lots. Also, cold
underground water sources (i.e. springs) and the shade provided by overhanging vegetation could lower water
temperatures in some areas.
pH
We measure the pH of water to determine if it is acidic or basic (alkaline). Chemically speaking “p” in
pH refers to the “potential” of the H+ ion. There can be a high concentration of H+ ions or a high
concentration of OH- ions. The higher concentration of H+ ions causes the sample to have a lower pH
(acidic). The higher concentration of OH- ions in a sample will cause the pH value to be basic (above 7)
(Wetzel and Likens, 2000). The pH measurements are recorded on a scale from 0 to 14, with 7.0 considered
neutral. Solutions with pH below 7.0 are considered acidic; those between 7.0 and 14.0 are considered bases.
The pH scale is logarithmic, so every one-unit change in pH represents a ten-fold change in acidity. In other
words, pH 6 is ten times more acidic than pH 7; pH 5 is one hundred times more acidic than pH 7. pH values
of some common substances:

70
PH Example
0.5 Battery Acid 2.0 Lemon Juice 5.9 Rainwater 7.0 Distilled Water 8.0 Salt Water 11.2 Ammonia 12.9 Bleach
Chemical/physical characteristics in the water or substrate can influence the pH. Monitoring the pH
of water gives us an indication of the health of our estuaries and creeks. As a thermometer is to human health,
telling us when we are sick, the pH tells us if something is unhealthy about our aquatic systems. An abnormal
pH reading indicates if the system is chemically out of balance. Additionally, the pH range of any coastal
wetland may be highly variable depending on several factors such as rainfall, plant/bacteria growth,
temperature or salinity. Salinity concentrations in waters affect the pH along the coast. The pH and salinity
follow a pattern from fresh water river input to offshore areas. Coastal areas with freshwater influence (low
salinity zones) will have a pH range of 7.0 to 7.5 and in areas of higher salinities (offshore), pH ranges between
8.0 and 8.6 (Ohrel and Register, 1993).
The buffering capabilities from carbonates and bicarbonates in the seawater will increase pH values.
Biological activity can suddenly increase or decrease water chemistries causing shifts in pH values. Rapidly
growing algae will produce oxygen and remove carbon dioxide (CO2) from the water during photosynthesis
resulting in an increase of pH. Conversely, decomposition of organic matter or respiration in plants and
animals will use up oxygen but increase CO2 levels in the water thus, lowering the pH values.
Abnormally low or high pH values can adversely affect egg hatching, stress fish and insects, or cause
fish kills (Meadows and Campbell, 1978). Other human factors influencing pH readings outside the normal
range include mine drainage sites, atmospheric deposition or industrial point discharges. Serious problems
occur in coastal waterways when the pH falls below five or increases above 9 (Ohrel and Register, 1993).
ACIDIC
BASIC
NEUTRAL

71
Soil and Sediment pH
The salt marsh is known for the acres and acres of Spartina grass which during the fall and winter,
browns and dies back just as the deciduous leaves on trees. The winter marsh browning is normal and
produces a large amount of dead grass or organic matter. The organic matter lies on the marsh floor
decomposing, during decomposition bacteria breaks down the dead grass giving off carbon dioxide (CO2).
The increased CO production lowers the pH of the sediment. Generally, the pH of sediment in estuaries, tidal
creeks, and salt marshes reflect that of the water above. In salt water the pH can be 7 to 8.5, and is generally
the same in the sediments. However, there are slight fluctuations daily due to processes such as
photosynthesis and respiration. Throughout the day algae in the sediments photosynthesizes increasing
oxygen production, which increases the pH of the soil. During the night respiration increases carbon dioxide
which shifts the pH lower. Sediment pH can fluctuate from 9 or 10 during the day time to 7 or 8 during late
evenings. Although the pH fluctuations vary according to algae densities, shade from marsh grass, and season,
the shifts may be more noticeable according to conditions of the area (Pomeroy, 1959).
Dissolved Oxygen
Dissolved oxygen (DO) is the most critical factor in determining the health of an aquatic system.
Dissolved oxygen is the measurement of the oxygen content in the water. Sources of oxygen in aquatic
systems include atmospheric diffusion, plant/algae photosynthesis, currents and wave action. Oxygen is
required for respiration in animals and plants. Oxygen is also used for decomposition of organic matter.
Shifts in DO are related to the time of day, season, and temperature. There is a higher oxygen
production during the day when algae is producing oxygen through photosynthesis. During the night when
there is no light source photosynthesis stops, but respiration continues thus shifting oxygen levels lower than
during the day.

72
Another factor that influences oxygen levels is salinity. Water with high salinity holds less oxygen than
water with lower salinity levels. In addition, temperature affects dissolved oxygen levels. Cooler water
contains more oxygen than warmer water. For instance in the cooler months the dissolved oxygen levels can
increase up to 8 or 9 ppm. Conversely, the warmer waters during the summer months cannot hold oxygen as
readily so levels decrease to 4 ppm and some areas as low as 3 ppm. An ecosystem with low oxygen levels can
be further stressed when excessive nutrients from fertilizer runoff are added into the tidal creek or estuary.
Nutrients can trigger an algal bloom which will increase oxygen temporarily, but when the algae die problems
may occur. Respiration and decomposition during the algae die-off will further deplete oxygen levels causing
stress on aquatic life. In general, low oxygen levels indicate a stressed aquatic environment. When a system is
further stressed by an input of pollutants, sewage, or organic matter, decomposition of these materials will
seriously deplete oxygen levels (Ohrel and Register, 1993).
Low oxygen levels are occurring in a “Dead Zone” at the mouth of the Mississippi River in the Gulf of
Mexico and increasing in occurrence along the eastern seaboard. These low oxygen levels worsen in the
summer, the high temperatures and depleting oxygen levels cause the dead zone to increase in size. The dead
zone is possibly a result of industries, farms, and residential areas that collectively use fertilizers. Fertilizers are
carried by inland streams, eventually washing into water-ways. Eventually the fertilizer is concentrated and
transported to the coast. As the concentration of certain fertilizers/nutrients increase on the coast, it causes an
algae bloom. A bloom is a large concentration of microscopic algae (enough that it will discolor the coastal
waters). The bloom becomes so densely packed that the algae population crashes. The algal population crash
causes a sudden burst of decomposition, which involves bacteria breaking down algal cells. The problem
arises at this point as oxygen is used in this process causing severe oxygen depletion.
☺Helpful Hint: Try to use organic and or time-release fertilizers in your garden.
These types of fertilizers cause less stress on the coastal environment.
73
Salinity
Everyone wonders why the ocean water is salty. Imagine the ocean as a “sink”, where material carried
by the creeks and rivers collects. Over time and seasons, through heavy rains and wind, the rocks and
mountains slowly wear away. Many of these small particles or minerals come from chunks of mountains and
rock. Over time, they are transported via the waterways and are deposited in the ocean or “sink”. So most of
this material dissolved in the water had its origin further inland. While looking closely at the transported
materials present in the ocean there are a combination of minerals, elements, and salts. Examples of these
elements and/or dissolved salts are chloride, sodium, sulfate, magnesium, calcium and potassium. These
dissolved salts in the water make up the total salinity concentration. Approximately 85% of the salts in
seawater comes from a combination of sodium and chloride (Na is 30.6%) and (Cl 55%) which makes up table
salt NaCl. The remaining of dissolved salt constituents include magnesium (Mg 3.7%), sulfate (S04 7.7%),
Potassium (K 1.1%), Calcium (Ca 1.2%) and Silica (Si) (Coulombe, 1992). Organisms such as those with shells
(phylum mollusca) for example, clams and snails, absorb calcium from the seawater to incorporate and build
their strong shells. Microscopic algae or diatoms absorb silica from the seawater to build their glasslike
floating bodies (Greene, 2004). The total salts or salinity is measured in parts per thousand seawater has an
overall average salinity of 35 ppt, or for every 1000 pounds of water there is 35 pounds of salt (Thurman,
1987).
Salinity concentrations increase as you go toward the ocean. You can think of salinity concentration in
zones. A freshwater river will enter the coastal area and may have little to no salinity ranging from 0.5 to 5 ppt.
The freshwater then mixes with salt water and becomes part of the estuary. An estuary is defined as a place
where salt and fresh water mix. Salinities in an estuary will vary from 5 to 18 ppt closest to the freshwater
input, to 18 to 30 ppt or higher when closer to the open ocean (Ohrel and Register, 1993).
Salinities fluctuate with weather conditions, tides, and river flow. In coastal Georgia a drought
occurred from 1998 to 2004, the decreased rainfall amounts affected the salinities which in turn stressed

74
coastal environments and habitats. During the 6 year drought period the salinities were consistently high and
in some estuaries and rivers salinities were regularly as high as the open ocean (35 ppt). Salt water is a
somewhat hostile environment for animals and plants to inhabit. High salinities often cause diseases in oysters
(MSX and dermo) (O’Beirn et al., 1994) and it is widely believed that high salinities contributed to the loss of
approximately 1000 acres of salt marsh in coastal Georgia during 2002-2004 (Georgia Coastal Resources
Division). These “dead-marsh” sites appear to be recovering now that we are no longer under drought
conditions.
Some organisms can adapt well to fluctuating salinities. They might move to other areas, burrow into
the sediment, alter their osmotic pressure by producing more or less urine, or drinking more or less fresh
water. Some organisms that can adapt to changing salinities include blue crabs, oysters, shrimp, mussels, and
mullet. Salt marsh plants must endure high salinities in the marsh soils so the few species that live in the marsh
have certain adaptations. For instance, one species that dominates the salt marsh is the Smooth Cord grass or
Spartina alterniflora. Smooth Cord grass has an adaptation (similar to desert plants) in that they can conserve
water by adjusting the osmotic vascular pressure. By maintaining a high concentrate of other organic solutes
found in marsh soils and discharging excess salts through tiny salt glands or pores located on the blades of the
leaves. In fact, if you visit a salt marsh and closely observe the smooth cord grass, you can see the salt crystals
on the leaf blade excreted by the salt glands.
A refractometer measures the physical characteristics of seawater and in this case dissolved solids or
salts. The refraction or bending light angle is measured with a refractometer. More specifically salinity in
water is determined by how light interacts with a sample when a drop is placed on a prism. Refraction is the
change in direction of a light pathway when passing through two mediums (i.e. air and water) with different
densities (Thurman, 1987).
A sample with high salinity concentrations also has high density properties which cause light to move
from water to air at a slower rate. However, this same sample also has high refraction properties or “light
75
bending abilities”, thus giving us higher salinity readings. When peering through the eye piece there are two
scales that measures salinity 1) parts per thousand (ppt) located on the right in most refractometers and 2)
density which is on the left side of the field of view. We use the ppt scale when determining the salinity of a
sample.
Settleable Solids
Settleable solids include all suspended particles in the water. These particles naturally occur in coastal
water however at times an overload of sediment/particles may cause problems in estuaries and tidal creeks.
Examples of solids entering a river or creek include sewage or erosion from development on tidal creeks or
rivers. Excess solids in water block sunlight throughout the water column prohibiting the growth of aquatic
plants and can clog fish and macroinvertebrate gills. Sediment can also carry harmful substances such as
bacteria, metals, fertilizers, and pesticides from garden runoff. Settleable solids and turbidity tests give
indications of sediment load in the water (Ohrel and Register, 1993). A settleable solids test is a quantitative
method to determine if there is an overload of sediment or other solids in the water. The settleable solids test
is not the same as turbidity because a settleable solids test only measures larger, heavier particles that settle out
in an Imhoff cone after a 45 minute time period.
Turbidity
Turbidity is a measurement of water clarity (clearness). Seasons, weather conditions, algal blooms, and
amount of suspended particles in the water can affect turbidity or water clarity. Turbidity includes all particles
in a sample. Phytoplankton, detritus, silt/clay particles, and other organic matter can affect the turbidity of
water. The higher the turbidity in the water, the less light penetrates into the lower depths causing a decrease
in phytoplankton growth. As phytoplankton densities decrease in the water column, the rate of photosynthesis
will slow causing oxygen levels to decrease (Ohrel and Register, 1993).

76
Physical/Chemical Monitoring Protocol
Temperature
Equipment: Thermometer/ water sampling bottle or bucket (optional)
Procedure:
1. Record the air temperature first by placing the thermometer in a shady area.
2. Water temperature may be taken from the water directly or from a large sample container (if done
quickly so the temperature does not change).
3. Record the information on the physical/chemical worksheet (p.81).
☺Helpful Hint: Over time, if the solution in the glass of your thermometer divides,
put it in a refrigerator for 1 hour. This will cause the alcohol solution to collect.
pH
Equipment: pH pen (sometimes will break down after using for 1 year). Please call if the pH pen you are
using is not working properly. The pH pens provided can also give the water temperature.
Procedure: To test pH in your water sample you follow these simple directions. For more
information refer to the directions that comes with the instrument or call the Adopt-A-Wetland office.
Calibrating the Ph pen
The pH pen needs to be calibrated monthly. We only use the one point calibration (only use the 7.0
buffer) for salt water. To calibrate press and hold the on/mode button until OFF on the lower display is
replaced by CAL. Immediately release the button. The display enters the calibration mode displaying
“pH 7.01 USE.” Dip the pH pen in the 7.0 pH buffer. After 1 second, the meter responds, if the
correct buffer is detected then its value is shown on the display (pH 7.0 or 7.01) and REC appears in the
lower part of the display. There is a clock illustration on the upper left of the screen. Wait until the clock

77
disappears then press the on/mode button, at this point, the buffer is accepted. After the calibration
point has been accepted the on/mode button must be pressed in order to return to the normal mode.
1. To get a pH reading from your sample, remove cap from the electrode, press “On/Mode” button
to turn on the pH pen the display screen will be visible followed by a percent indication of the
remaining battery life (E.G. % 100 Batt).
2. Dip the electrode into the sample while stirring it slowly. Measurement is taken when the stability
symbol (looks like a clock) in the top left corner of the display screen disappears.
3. Note the pH or you can press “Hold/Con” to freeze the reading. Record the pH value on your
data sheet.
4. Press “On/Mode” to turn the tester off.
5. Rinse electrode with tap water, but do not dry. Keep a damp sponge in the cap moist with the
storage solution.
Dissolved Oxygen
Equipment: Dissolved Oxygen test kit
Procedure: Also see instructions enclosed with LaMotte kit.
1. Submerse entire water collection bottle until all bubbles are out of the bottle, while bottle is still
submersed, cap it and tighten lid.
2. When adding solutions to water sample, don’t touch the tip of the chemical bottle to the water
sample.
3. Uncap bottle cap of the water sample and add 8 drops of Manganous Sulfate and 8 drops of
Alkaline Potassium Iodide.
4. Cap bottle and invert several times then do not disturb sample. Allow the precipitate to settle to
the bottom of the bottle.

78
5. When the brown precipitate has settled past the shoulder of the bottle, you are ready for the next
step. This may take up to 20 minutes.
6. Add 8 drops of Sulfuric Acid; be extra careful with this solution.
7. Cap and gently invert the bottle. The color will be an amber color, like apple juice.
8. Invert bottle until there are few to no brown particles remaining.
9. Pour mixture from bottle into the titrating tube, up to 20 milliliters then add 8 drops of starch
indicator solution.
10. Color will turn dark blue. Fill syringe up to the 0 mark with Sodium Thiosulfate, make sure you
eliminate all bubbles.
11. Slowly add 1 drop at a time and gently swirl sample; color should turn from dark blue to clear.
When sample turns clear note the level of liquid left in your syringe as your dissolved oxygen
amount (ppm) in your sample. Note: Do not add too much Sodium Thiosulfate. Discard any left
over chemicals in the waste bottle.
12. Record the information on the physical/chemical worksheet (p.81).
Water Salinity
Equipment: Refractometer
Procedure:
1. Lift lid on refractometer that protects the glass prism.
2. Place one or 2 large drops of sample onto the glass and close the lid.
3. Look through the eye piece and focus your view of the scale inside. Read the line where the blue
color meets the white color in the field of view..
4. Read the scale on the right hand side that shows parts per thousand or ppt ‰.
5. Rinse glass with tap water, blot dry with a paper towel, and store in case.

79
6. Record the information on the physical/chemical worksheet (p. 81).
7. The refractometer periodically needs to be calibrated. Call the Marine Extension Service for
questions or help (912)-598-2348.
Soil Salinity
Equipment: Refractometer
Procedure:
1. Dig a hole to a depth of 15 cm deep and allow the hole to fill with water. Note: You can use a
pvc pipe marked off at 15 cm to get water from this depth also.
2. As the water fills the hole/pvc pipe, use a small dipper or cup to retrieve a water sample.
3. Allow sediment to settle to the bottom of the cup.
4. Use a dropper to obtain a small amount of water and place water drops on the glass surface of the
refractometer.
5. Follow the directions for using the refractometer.
6. Record information on physical/chemical worksheet (p. 81).
Settleable Solids
Equipment: Imhoff cone & stand
Procedure:
1. Pour one liter of sample water into cone.
2. Let cone stand at least 45 minutes.
3. Record level of solids.
☺Helpful Hint: You only have to do the settleable solid test once and it's best to
start it first since it has to sit for 45 minutes.

80
Turbidity
Equipment: Secchi disk
Procedure:
1. Calibrate your line by first attaching the line to the Secchi disk. Mark the line every 10 cm by
using a permanent marker and measuring tape. While standing at your site (bridge, boat, or dock)
lower the Secchi disk into the water until it disappears. If possible, look for a shady spot to
increase visibility. It is important that the disk travels vertically through the water column and is
not “swung out” by the current. Attach weights if necessary to prevent current pull.
2. Raise the disk slowly up and down several times until you find the point that the disk vanishes.
Mark the spot on the line where it enters into the water.
3. Calculate the depth at which the disk disappeared. This measurement is referred to as Secchi disk
depth. If disk goes all the way to bottom of water before disappearing the Secchi depth is greater
than the water depth and should be noted on the form.
4. Record the information on the physical/chemical worksheet (p.81).

81
COASTAL GEORGIA ADOPT-A-WETLAND PHYSICAL/CHEMICAL MONITORING FORM
AAW Group Name ________________________________ County _____________________________ Group ID Number _ ____________________________ Site ID Number ____________________ Investigators _____________________________________________________________________ Wetland Name ____________________________ Date ______________ Time __________________ Site Location Description (e.g. Tidal Creek, Beach, Estuary, Salt Marsh)____________________________ Rain in Last 24 Hours? Yes/No Amount of Rain _____ Inches in Last _____ hours/days Heavy Rain Steady Rain Intermittent Rain Present Conditions: Heavy Rain Steady Rain Intermittent Rain Partly Cloudy Overcast Clear/Sunny Is Waterway Influenced by Tides? Yes/No If Yes, Tide was: High Outgoing Low Incoming Water Surface Conditions: Calm Ripples Waves White caps Impaired Habitat Indicators: Foam Bubbles Oil Scum
Dead Organisms____________ Erosion_________________ Trash Present_________________ Vegetative Debris___________ Dumping_______________ Excessive Algae_______________
Water Color: Clear Muddy Milky Gray Green Brown Tan Other_________________________________________
Odor: Gas Oil Chlorine Rotten Eggs Sewage Chemical Other_____________________________________________________
Physical and Chemical Tests
Basic Tests: Sample 1 Sample 2 Average Air Temperature __________ _________ (°C/°F) _______ (°C/°F) Water Temperature __________ _________ (°C/°F) _______ (°C/°F) Sampling Depth __________ _________ (cm) _______ (cm) pH __________ _________ (1-14) _______ (1-14) Dissolved Oxygen __________ _________ (mg/l or ppm) _______ (mg/l) Water Salinity __________ _________ (ppt) _______ (ppt) Secchi Disk Depth/ __________ _________ (cm) _______ (cm) Settleable Solids __________ _________ (ml/l) _______ (ml/l) Additional Tests, Observations and Comments:___________________________________________ ____________________________________________________________________________________________________________________________________________________________________________________________________________________________________________________________ ____________________________________________________________________________________ Submit Form To: Adopt-A-Wetland Program ● University of Georgia Marine Extension Service ●
20 Ocean Science Circle ● Savannah ● GA 31411 ● Fax: (912) 598-2399 ● [email protected]

82
Chapter Six
Problems in Your Adopted Wetland?
Dead/Dying Marsh Major Pollution Event GCRC Marsh Die Back Monitoring Marsh Restoration GCRC Monitoring Worksheet Who To Call List
Saltmarsh Aerial, Coastal Georgia (Lee Sutton, MAREX)
Marsh Die Off (Delegal Dippers)

83
Dead or Dying Marsh
By Jan MacKinnon, Georgia DNR, Coastal Resources Division (January 2006)
In March 2002 areas of dying coastal saltmarshes were reported to Coastal Resources
Division (CRD). Marsh grasses (Spartina alterniflora and Juncus roemerianus) were confirmed as dying,
resulting in open mudflats. The affected areas initially reported in Liberty County covered several
miles of creek side die-off as well as several acres of receding marsh along the Jerico River.
To date, dead and dying marsh has been reported in all six coastal counties, from the St.
Marys River in Camden County to Tybee Island in Chatham County (Fig. 1). The Division has
consulted other states that have experienced similar marsh epidemics (i.e. South Carolina,
Louisiana), but the cause(s) in Georgia have not yet been determined. Currently, it has been
estimated that 1000 acres of marsh have been affected, with the vast majority of this being in Liberty
County.
The symptoms of the affected marsh include a sequence of color changes that occur over time.
First a green/brown color combination in the grass occurs, where brown indicates stressed parts of the
plants. The marsh may transition into a brown color where all grasses in an area are affected. If the
problem continues then the marsh grass will become rigid, break off in some areas and appear as “stubble”.
After the grass dies mud will dominate the area rather than the grass.
CRD has collaborated with scientists from the Savannah State University, Sapelo Island
National Estuarine Research Reserve, Grays Reef National Marine Sanctuary, Georgia Sea Grant,
the US Army Corps of Engineers, the University of Georgia Marine Extension Service, the
University of Georgia Marine Institute, and the Skidaway Institute of Oceanography via the Georgia
Coastal Research Council (Research Council), to collect data from the dying marsh sites. Samples
have been analyzed for soil and interstitial salinities, the detection of fungi and/or abnormal bacteria,

84
and pH. Other than higher than normal salinities (and not high enough to denude the amount of
marshes lost), no abnormal readings have been detected. Also, greenhouse trials were conducted to
determine the effects of freshwater and variation in soils. To date, greenhouse sampling results have
shown no difference in the Spartina plants grown in dead and healthy marsh soils. Spartina leaves
reveal no abnormal species counts; however, root and rhizome analyses are ongoing.
Division and Research Council scientists have developed a standardized methodology for
quarterly field sampling. Also, Savannah State has established a working lab for testing vegetation
samples. Researchers will continue field sampling to monitor and evaluate changes in salinities and
vegetation.
CRD is cataloging all reports of dying marshes through aerial and on-the-ground photo
documentation as well as responding to concerned citizens. CRD has coordinated public education
efforts through press releases to the local media. In addition, we are working with the University of
Georgia Marine Extension Center to plan and implement GIS classifications in order to delineate
and track dieback areas. Scientists from the Research Council have applied for various grants to
address aspects of the marsh dieback such as monitoring, transplant experiments, and plant tissue
analysis.
The marsh die-off affects a vital area of our state and has implications for wildlife, fisheries
and water quality; navigation; and flood control. Under the Georgia Coastal Marshlands Protection
Act (O.C.G.A. 12-5-280 et seq.), the State recognizes that “the coastal marshlands of Georgia
comprise a vital natural resource system. The estuarine area…is the habitat of many species of
marine life and wildlife and, without the food supplied by the marshlands, such marine life and
wildlife cannot survive. The estuarine marshlands of coastal Georgia are among the richest providers
of nutrients in the world. Such marshlands provide a nursery for commercially and recreationally
important species of shellfish and other wildlife, provide a great buffer against flooding and erosion,

85
and help control and disseminate pollutants. The coastal marshlands provide a natural recreation
resource which has become vitally linked to the economy of Georgia’s coastal zone and to that of
the entire state. This…system is costly, if not impossible, to reconstruct or rehabilitate once
adversely affected…” The results of these investigations into the dead marsh issue have long-term
implications for the preservation of Georgia’s estuaries and the health of Georgia’s coastal economy.
Please continue to look for updates regarding the progress made on the marsh dieback issue at
www.marsci.uga.edu\coastalcouncil
Photo credits; A – Jan MacKinnon, B – Mac Rawson, C – Mac Rawson, D -.Matt Ogburn
Fig. 1: Examples of salt marsh die-off in coastal Georgia: (A) aerial photograph of a die-off area near
the Jerico River; (B) a close-up of rhizome “stubble”; (C) example of eroding area in Liberty County;
(D) area with standing water at Sapelo Island National Estuarine Research Reserve.

86
Efforts to address marsh dieback in Georgia
• In October 2002 a team from the Georgia Coastal Ecosystems Long Term Ecological
Research program sampled sites near the Jerico River in conjunction with staff of the Coastal
Resources Division of the Georgia Department of Natural Resources (CRD-DNR). There was no
evidence of increased salinity in the dieback areas, nor was it obvious that the densities of snails
and crabs were related to die-off (their report is available at
http://www.marsci.uga.edu/coastalcouncil/marshsummarylter2.pdf).
• Drs. Mary Ann Moran (UGA Dept of Marine Sciences), Steve Newell (UGA Marine
Institute) and David Porter (UGA Dept of Plant Biology) analyzed samples of affected plants for
bacterial and fungal community composition.
• Dr. Merryl Alber (UGA Dept of Marine Sciences) conducted greenhouse trials with material
collected from a dieback site and found that rhizomes from dieback areas could not re-sprout
when watered, but that healthy salt marsh plants (Spartina alterniflora) could grow in soil from both
healthy and “dead” marsh areas. In addition, Mr. Matthew Ogburn, a graduate student in M.
Alber’s laboratory, conducted a transplant study in the field with both S. alterniflora and Juncus
romerianus from May-Oct 2003. This research demonstrated that healthy plants can survive in
dieback areas as well as in reference sites. The study was done at the Sapelo Island National
Estuarine Research Reserve as well as at Melon Bluff Plantation in Liberty County.
• Dr. Chandra Franklin (Sav. State Univ., Dept of Natural Science and Mathematics) and Jan
Mackinnon (CRD-DNR) received funding from GA Sea Grant and the M.K. Pentecost Ecology
Fund to perform morphological, anatomical and cytological analyses of plants from marsh dieback

87
sites. Their results suggest that rhizomes from dieback sites are not viable, and even healthy-
looking rhizomes may be affected.
• The GCRC has established a standardized marsh monitoring protocol to monitor both
healthy and affected sites. The marsh monitoring subcommittee is working with CRD to
coordinate sampling at dieback sites along the coast. Eight sites are being monitored quarterly for
specific biological, physical and chemical parameters. Data from this effort are available on the web
at http://www.marsci.uga.edu/coastalcouncil/marsh_data2.htm.
• A SSU-UGA team also surveyed 18 dieback areas in the summer of 2003. Aside from the
vegetative dieback, they found no difference between dieback and reference sites and no obvious
relationship between severity of the dieback and potential causal factors (e.g. herbivory, elevation,
soil chemistry, salinity).
• CRD-DNR conducted regular aerial surveys of the coast from 2002 – 2005. All
photographs have been catalogued and are used to track dieback. For more information, contact
Jan Mackinnon at CRD (912) 264-7218).
• Representatives of the Marine Extension Service, NMFS Marine Sanctuary Program at
Gray’s Reef, CRD-DNR and Sapelo Island National Estuarine Research Reserve formed a remote
sensing collaboration. The group leveraged funding for the acquisition and analysis of aerial
imagery to identify areas in different stages of dieback and track vegetation patterns over time.

88
• The University of Georgia at Tifton has sampled the Jerico and Brunswick areas for the
presence of herbicides. Twenty-four compounds were analyzed in these samples. All results from
this sampling were negative.
• The GCRC organized a workshop on marsh dieback with colleagues from Louisiana, where
marsh dieback has also generated tremendous concern. The workshop was supported with funds
from Georgia Sea Grant, Louisiana Sea Grant, Georgia DNR (CRD) and Sapelo Island NERR -
Coastal Training Program, and occurred February 3-4 in Savannah. Workshop information is
available at http://www.marsci.uga.edu/coastalcouncil/dieback_workshop.htm.
• The Georgia Coastal Research Council has continued to meet periodically to coordinate field
sampling, streamline data collection, and receive feedback regarding the dieback issue. The Council
will be meeting again in August. All meetings notes and presentations are posted on the Georgia
Coastal Research Council’s web page at http://www.marsci.uga.edu/coastalcouncil
• Results to date have indicated possible drought-induced chemical changes in the soil that
could have triggered a chain of events that resulted in the death of plants in dead marsh sites.
Clogged xylem vessels (water-conducting tissue in plants) found in the rhizomes of plants from
dead marsh sites suggest the possible deposition of heavy metals such as iron. The current
working theory is that, drought induced changes in the soil increased the mobility of heavy metals
resulting in higher absorption and deposition of metals in xylem tissue causing plant death.

89
What You Can Do
We need you as the “wetland watcher” to observe the marsh and look for “browning”, “thinning”,
dying grass or muddy areas. These color changes indicate signs of stress. If your adopted wetland begins to
show signs of stress it is important to monitor the changes that occur using the following protocol:
1. Notify your Adopt-A-Wetland Coordinator (see “Who to Call List” on page 92).
2. Perform monthly chemical tests to collect water quality data near your wetland (you will need to go
through chemical training if you have not already done so).
3. Perform monthly visual surveys (refer to the Adopt-A-Wetland visual survey in this manual).
4. Photograph your marsh once a month.
5. If possible, mark the perimeter of the muddy area of the marsh. We only suggest this if the marsh is in a
safe and easy to access location.
Major Pollution Event
In the event of any major pollution (e.g. oil spills, toxic or hazardous waste spills, septic tank leaks,
fish or wildlife kills etc.) groups should notify their AAW coordinator immediately and refer to the “Who to
Call List” in this manual for the appropriate agency. AAW also has a Coastal Response Team of volunteers
who are available to assist the GA Department of Natural Resources during emergencies such as oil spills,
bird kills, phytoplankton blooms or other coastal emergencies. If you would like to sign up for the Coastal
Response Team call 912-598-2348.
Georgia Coastal Research Council (GCRC) Marsh Die-Back Monitoring
The GCRC (http://alpha.marsci.uga.edu/coastalcouncil/) has developed a marsh monitoring
protocol suitable for advanced AAW volunteers who are interested in participating in their marsh die-back
research. Should AAW volunteers decide to partake in this venture they should first collect biological and
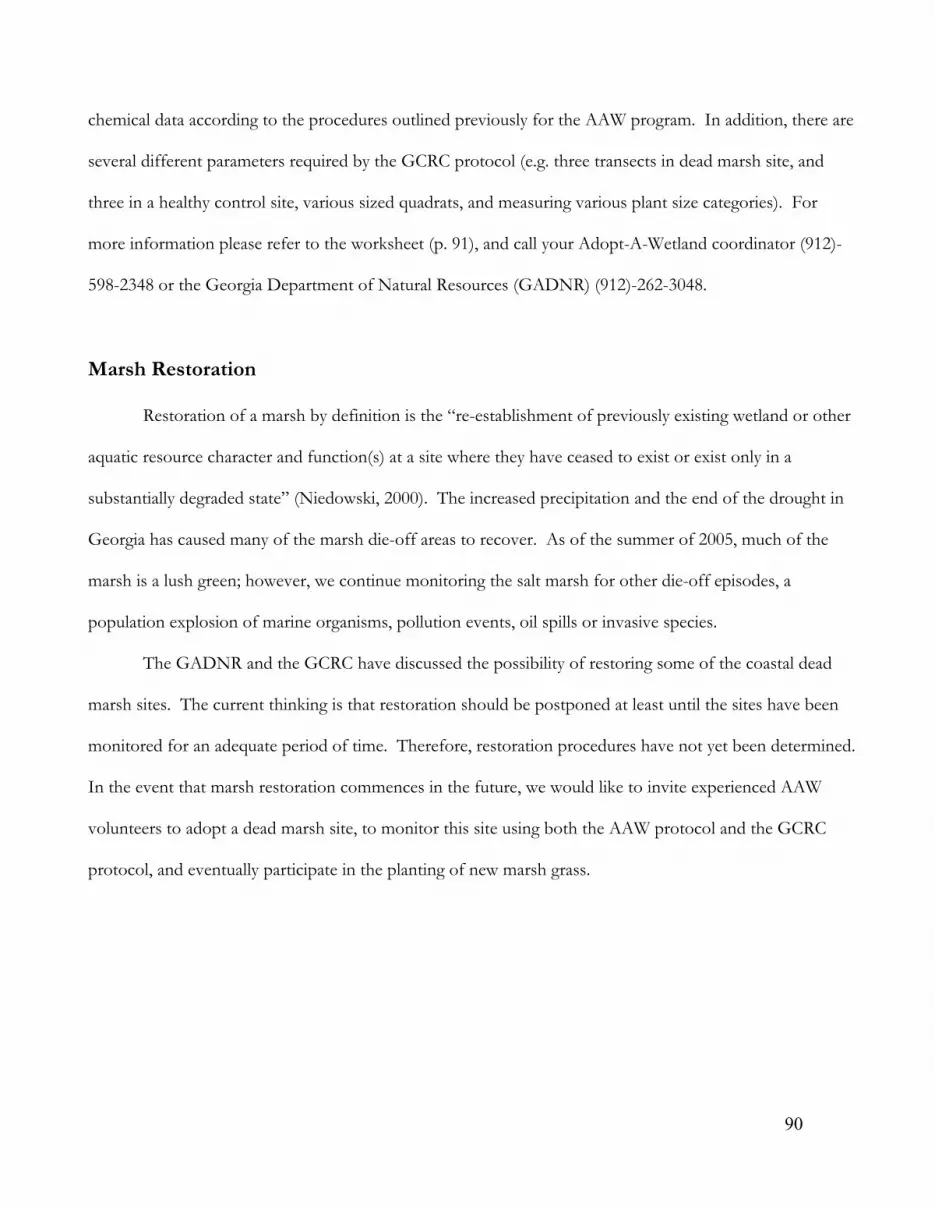
90
chemical data according to the procedures outlined previously for the AAW program. In addition, there are
several different parameters required by the GCRC protocol (e.g. three transects in dead marsh site, and
three in a healthy control site, various sized quadrats, and measuring various plant size categories). For
more information please refer to the worksheet (p. 91), and call your Adopt-A-Wetland coordinator (912)-
598-2348 or the Georgia Department of Natural Resources (GADNR) (912)-262-3048.
Marsh Restoration
Restoration of a marsh by definition is the “re-establishment of previously existing wetland or other
aquatic resource character and function(s) at a site where they have ceased to exist or exist only in a
substantially degraded state” (Niedowski, 2000). The increased precipitation and the end of the drought in
Georgia has caused many of the marsh die-off areas to recover. As of the summer of 2005, much of the
marsh is a lush green; however, we continue monitoring the salt marsh for other die-off episodes, a
population explosion of marine organisms, pollution events, oil spills or invasive species.
The GADNR and the GCRC have discussed the possibility of restoring some of the coastal dead
marsh sites. The current thinking is that restoration should be postponed at least until the sites have been
monitored for an adequate period of time. Therefore, restoration procedures have not yet been determined.
In the event that marsh restoration commences in the future, we would like to invite experienced AAW
volunteers to adopt a dead marsh site, to monitor this site using both the AAW protocol and the GCRC
protocol, and eventually participate in the planting of new marsh grass.

91
Georgia Research Council Marsh Sampling Data Sheet
Date _____________ Time _____________ Low tide at _________
Lat. & Long. (GPS coord. if avail.)_________________________________
Locality _____________________________________________________
Transect #____ Quadrat #____ Quadrat size _______ Photo # ________
Investigators _________________________________________________ VEGETATION:
Spartina Juncus # Live > 15 cm _____________ # Live > 15 cm _____________ # Live < 15 cm _____________ # Live < 15 cm _____________ # Dead stems _____________ # Dead stems _____________ Height of 5 tallest: ______ , ______ Height of 5 tallest: ______ , ______, ______ , ______ , ______ ______, ______, ______ Observations on leaf color within the quadrat (green, brown, chlorotic, purple): _____________________________________________________________ FAUNA:
Periwinkles quadrat size ______ # >10 mm ____# <10 mm ____any dead? _____
Mud snails quadrat size ______# live _______any dead? _____
Other snails quadrat size _______ type? __________ # live ____any dead? ____
Crabs quadrat size _______ # holes > 5 mm diameter ____any dead? ____
Mussels (0.5 x 0.5 m quadrat) # live _______ any dead? _______ Other observations of fauna_____________________________________ _____________________________________________________________ GENERAL:
Is there a clear transition area along this transect? [ ] Yes [ ] No
If yes, approx. how far is this quadrat from the transition zone?_______
Other observations (soil firmness, presence of sulfide, other smells, conditions): _____________________________________________________________ POREWATER: (please refer to protocol text for instructions) Soil temp ______ Salinity _______ pH _______ Eh _______ Other ____________________________
Coastal Georgia Adopt-A-Wetland “Who to Call” List

92
Program Questions Adopt A Wetland Marine Extension Service Mary Sweeny-Reeves 912-598-2348 Adopt-A-Stream Atlanta Adopt A Stream Allison Hughes 404-675-1635 Adopt-A-Stream Coastal AAS Training Center Dr. Joe Richardson 912-596-5362 AAS Chatham Coordinator Metropolitan Planning Commission Jackie Jackson 912-651-1454 GA Department of Natural Resources Emergency Operation Center (during or after hours) Most or all coastal emergencies including bird/fish kills, oil spills, pollution problems, whale/manatee/turtle sightings/harassment/deaths: 1-800-241-4113 Direct Lines to Departments/Agencies: Fish Kills/Marsh Die-off/problems during day hrs Coastal Resources Division in Brunswick 912-264-7218 Wildlife Resources Division in Richmond Hill 912-264-7212 Oil or Chemical Spills National Hot Line on all Waterways United States Coast Guard Hot Line 1-800-424-8802
Toxic or Hazardous Spills (day hrs) GA DNR Environmental Response Division Emergency Response 1-800-241-4113 Sewer/Septic Leaks (day hrs) Chatham Co. 912-651-6565 Glynn Co. 912-267-5570 Chatham Co. Health Dept. 912-356-2160 Glynn Co. Health Dept. 912-264-0298 Effingham Co. Health Dept. 912-754-6484 Underground Storage Tank Leaks (day hrs) Environmental Protection Division, Georgia Dep. Nat. Res. 912-353-3225
Erosion and Sedimentation (day hrs) Construction & Development 912-353-3225 Agriculture, US Dep. Agriculture 912-754-3812
Bibliography

93
Ballentine, T. 1991. Tideland Treasures. University of South Carolina, Columbia SC, 218 p.
Carpenter, K.E. (ed.). 2002. The living marine resources of the western Central Atlantic. Vol. 1:
Introduction, mollusks, crustaceans, hagfishes, sharks, batoid fishes, and chimaeras. FAO species
Identification Guide for Fishery Purposes and American Society of Ichthyologists and
Herpetologists Special Publication. No. 5. Rome, Food and Agriculture Organization of the United
Nations. pp. 1-600.
Carpenter, K.E. (ed.). 2002. The living marine resources of the western Central Atlantic. Vol. 2:
The Living Marine Resources of the Western Central Atlantic. Volume 2: Bony fishes part 1
(Acipenseridae to Grammatidae). FAO species Identification Guide for Fishery Purposes and
American Society of Ichthyologists and Herpetologists Special Publication. No. 5. Rome, Food
and Agriculture Organization of the United Nations. pp. 601-1374.
Carpenter, K.E. (ed.). 2002. The living marine resources of the western Central Atlantic. Vol. 3:
Bony Rishes part 2 (Opistognathidae to molidae), sea turtles and marine mammals. FAO species
Identification Guide for Fishery Purposes and American Society of Ichthyologists and
Herpetologists Special Publication. No. 5. Rome, Food and Agriculture Organization of the
United Nations. pp. 1375-2127.
Flory, J. and M. Alber. 2002. Dead Marsh Information. Georgia Coastal Research Council. 13p.
Fox, William T. 1983. At the Sea’s Edge. Prentice-Hall, Inc. Englewood Cliffs, N.J., 317 p.
Georgia Adopt-A-Stream Manuals. GA EPD 4220 International Pkwy. Suite 101 Atlanta, GA 30354.
Greene, T. F. 2004. Marine Science Marine Biology and Oceanography. Second edition. Amsco
School Publications, Inc. New York, New York. 623 pp.
Hackney C.T., M. Adams, and W.H. Martin. Biodiversity of the Southeastern U.S. 1992. John
Wiley and Sons, Inc. New York, New York, p. 615-746.

94
Hickman, C.P., L.S. Roberts, F.M. Hickman. 1984. Integrated Principles of Zoology. Seventh
edition. Times Mirror/Mosby College Publishing, St. Louis, MO.
Johnson, S., H.O. Hillestad., S.F. Shanholtzer., and G.F. Shanholtzer. 1974. An Ecological Survey of the
Coastal Region of Georgia. National Parks Service Scientific Monograph Series, No. 3, 233p.
Long, S.P. and C.F. Mason. 1983. Salt Marsh Ecology. Blackie and Son Limited,
Bishopbriggs, Glasgow. 153pp.
Meadows P.S. and J.I. Campbell . 1978. An Introduction to Marine Science. Blackie and Son Limited,
England, 176p.
Mitsch, W.J. and J.G. Gosselink. 1986. Wetlands. Van Nostrand Reinhold Co. New York, New York,
537p.
Niedowski, N.L. 2000. New York State Salt Marsh Restoration and Monitoring Guidelines. New York
State Department of Environmental Conservation, Division of Fish, Wildlife and Marine Resources.
East Setauket, NY. 135p.
O’Beirn, F., P.B. Heffernan, and R.L. Walker. Recruitment of Crassostrea virginica: A Tool for Monitoring
the Aquatic Health of the Sapelo Island National Estuarine Research Reserve. Marine Technical Report.
No. 94-2.
Ohrel, R., Jr. and K. Register. 1993 (first edition). Volunteer Estuary Monitoring: A Methods Manual, 2nd
Edition. EPA & Center for Marine Conservation. 331 p.
Pomeroy, L.R. 1959. Algal productivity in salt marshes of Georgia. Limnol. Oceanogr. 4: 386-397.
Power, A. J., R.L. Walker, K. Payne, and D. Hurley. 2004. First Occurrence of the Nonindigenous
Green Mussel, Perna viridis in Coastal Georgia, United States. Journal of Shellfish Research. 23: 741-
744.

95
Rader, R.B., D.P. Batzer, and S.A. Wissinger. 2001. Biomonitoring and Management of North American
Fresh Water Wetlands. John Wiley and Sons, N.Y.
Schoettle, T. 1983. A Field Guide to Jekyll Island. University of Georgia Marine Extension Service and
Georgia Sea Grant College Program, Athens, GA. 48 p.
Schoettle, T. 1991. A Study Approach to the Georgia Coast, Profile of a Salt Marsh. University of
Georgia Marine Extension Service Publication, Supported by the Georgia Sea Grant College Program
(Grant # NA80AA-D-00091).
Standard Methods. 1995. Ed. by. A.D. Eaton, L.S. Clesceri, and A.E. Greenberg. American Public Health
Assoc., Washington, DC, p 10-67.
Thurman, Harold V. 1987. Essentials of Oceanography. Merrill Publishing Company, Columbus, OH.,
370 p.
Wetzel, R.G. and G.E. Likens. 2000. Limnological Analyses. Springer-Verlag, New York, NY, 428 p.
Wiegert, R. and B. Freeman. 1990. Tidal Salt Marshes of the Southeast Atlantic Coast: A Community
Profile. U.S. Department of the Interior Fish and Wildlife, Washington DC, 70 p.
Wilson, E.O. and W.H. Bossert. 1971. A primer of Population Biology. Sinauer Associates, Inc.
Publishers. Stanford, Ct.

96
Appendices
Macroinvertebrate Identification Key
Plant Identification Key
Fish Identification Key
AAW Evaluation Form
Useful Websites
Useful Books on Coastal Wetlands
Common Mollusks of Georgia
Other Common Marine Invertebrates of Georgia
Common Fishes of Georgia
Invasive Aquatic Species in Georgia

97
Key to Macroinvertebrates found in Coastal Georgia
A. Soft Body Contained In A OR B. Body Not Soft/Not In Thick OR C. Thick Hard Shell Hard Shell (Phylum Mollusca) (Phylum Arthropoda or Porifera) See Page 98 Body inside of Body inside of a single shell 2 equal shells (Class Gastropoda) (Class Bivalvia) See Page 101 See Page 102
Soft Body But Not Inside Hard Shell (Phyla Annelida/Echinodermata/Cnidarian/ Ctenophora/Chordata) See Page 112-114

98
Shell-like, Oval Shaped With Plates, Attached To Debris, Pilings Or Docks (Phylum Arthropoda) See Page 105
Animals With Odd Shaped Body With Small Segmented Legs Holes (pores). Skin Is Rough And Obvious Joints (Phylum Porifera) See Page 107 (Phylum Arthropoda)
2 Pairs Of Antennae, More Class Merostomata Class Pycnogonida Class Insecta Than 3 Pairs Of Legs (Horseshoe Crabs) (Sea Spiders) One Pair Of Antennae, (Subphylum Crustacea) See Page 106 See Page 106 3 Pairs Of Legs See Page 104 See Page 106
Body Is Not Soft Or Not In Thick Hard Shell

99
Body Is Not Soft Or Not In a Thick Hard Shell (Subphylum Crustacea)
Flattened Laterally 5 Pairs Of Legs 7 Pairs Of Legs, Body Head Is Jointed, (Sideways) So It Head And Thoracic Segments Flattened. (Order Isopoda) Eyes And Antennae Looks Like The Legs Fused Together Forming Thin Shell Are Movable Are Located On One Pinchers Present In Some Order Stomatopoda Side Of Body (e.g. Crab,Shrimp, Hermit Crab, Crayfish) (e.g. Mantis Shrimp) (Order Amphipoda) See Pages 104 See Page 105

100
Soft Body Not In a Hard Shell
Soft Body, Elongated, Thin Shape, Worm-like (Phylum Annelida) See Page 108
Odd Shaped Body, Skin Rough, Some Covered In Spines, Small Opening (mouth) On Bottom Side (e.g. Sea Cucumber, Sea Star) (Phylum Echinodermata) See Page 109
Odd Shape, Skin Rough & Fleshy, Most have 2 Openings, No Stinging Cells (e.g. Sea Squirts, Sea Pork) (Phylum Chordata, Subphylum Urochordata) See Page 111
Soft Bodied, Stout Shape, Often Attached to Shell/ Dock/ Piling), Tentacles With Stinging Cells On One End (e.g. Sea Anemone, Jellyfish) (Phylum Cnidaria or Ctenophora) See Pages 110-111
OR
OR OR
Segmented Worms With Small Appendages & Antennae (Class Polychaeta)
Segmented Flat Worms With Rounded Anterior And Posterior Ends (Suckers) (Class Hirudinea)

101
Phylum Mollusca Class Gastropoda
Auger Terebra dislocata
Olive Snail Oliva sayana
Atlantic Oyster Drill Urosalpinx cinerea
Whelk Egg String
Lightning Whelk Busycon sinistrum
Knobbed Whelk Busycon carica
Channeled Whelk Busycon canaliculatum
Coffee Bean Snail Melampus bidentatus
Moon Snail Neverita duplicata
Mud Snail Ilyanassa obsoleta
Periwinkle Snail Littorina irrorata
Florida Horse Conch Pleuroploca gigantean
Rock Shell Stramonita haemastoma
True Tulip Fasciolaria tulipa

102
Phylum Mollusca Class Bivalvia
`
Northern Quahog Mercenaria mercenaria
Atlantic Bay Scallop Argopecten irradians
Southern Surf Clam Spisula ravaneli
Eastern Oyster Crassostrea virginica
Alternate Tellin Tellina alternata
Razor Clam/ Jacknife Clam Ensis directus
Disk Clam Dosinia discus Calico Scallop
Argopecten gibbus
Pen Shell Atrina rigida
Stout Tagelus Tagelus plebeius
Angel Wing Cyrtopleura costata
Carolina Marsh Clam Polymesoda caroliniana

103
Class Bivalvia Continued
Blood Ark Anadara ovalis
Giant Atlantic Cockle Dinocardium robustum
Atlantic Ribbed Mussels Geukensia demissa
American Horsemussel Modiolus americanus
Ponderous Ark Noetia ponderosa
Eared Ark Anadara notabilis
Incongrous Ark Scapharca brasiliana
Turkey WingArca zebra

104
Striped Hermit Crab Clibanarius vittatus
Lady Crab Ovalipes ocellatus
Spider Crab Libinia dubia
Wharf Crab Sesarma cinereum
Mud Crab Panopeus herbstii
Stone Crab Menippe mercenaria
Blue Crab Callinectes sapidus
Speckled Swimcrab Arenaeus cribarius
Mole Crab Emerita talpoida
Calico Crab Hepatus epheliticus
Female Male Phylum Arthropoda Subphylum Crustacea
Ghost Crab Ocypode cordimana
Green Porcelain Crab Petrolisthes armatus
Thoracic Sternites Thoracic Sternites

105
Phylum Arthropoda Subphylum Crustacea
Pink Shrimp Penaeus duorarum
Skeleton Shrimp Caprella penantis
Fragile Barnacle Chthamalus fragilis
Amphipod
Goose BarnaclesLepas anatifera
White Shrimp Litopenaeus setiferus
Brown shrimp Farfantepenaeus aztecus

106
Phylum Arthropoda Class Merostomata Class Pycnogonida
Class Insecta
Horseshoe Crab Limulus polyphemus
Pycnogonid Sea Spider
Mayfly Nymph
Damselfly Dragonfly
Midge Fly Larva

107
Phylum Porifera
Vase Sponges Scypha sp.
Redbeard Sponge Microciona prolifera
Finger Sponge Haliclona oculata

108
Phylum Annelida Class Polychaetae
Class Hirudinea
Polychaetae Worm Polychaetae Worm Head (close up)
Polychaetae worm tube
Leech

109
Phylum Echinodermata Class Ophiuroidea Class Asteroidea
Class Echinoidea Class Holothuroidea
Smooth Brittle Star Ophioderma brevispinum
Common Sea Star Asterias forbesi
Sand Dollar or Keyhole Urchin Mellita quinquiesperforata
Sea Cucumber Sclerodactyla briareus
Sea Urchin Lytechinus variegatus
Urchin Teste

110
Phylum Cnidarian
Class Anthozoa
Class Scyphozoa
Sea Pansy Renilla reniformis
Cannonball Jellyfish Stomolophus meleagris
Brown Anemone Aiptasia pallida
Moon JellyfishAurelia aurita
Sea Whip Leptogorgia virgulata
Sea Nettle Chrysaora quinquecirrha

111
Phylum Ctenophora
Class Tentaculata
Phylum Chordata
Subphylum Urochordata
Rough Sea Squirts Styela plicata
Sea Pork Aplidium constellatum
Comb Jellies

112
Keys to Plants Found in Coastal Georgia
Kingdom Plantae
Division
Magnoliophyta (Flowering Plants) Coniferophyta (Gymnosperms)
Class
Liliopsida (Monocotyledons) Magnoliopsida (Dicotyledons) Pinopsida Leaf veins parallel, Leaf veins net-like, flower parts in 3 or multiples of, flower parts in 5 or multiples of vascular stem bundles scattered vascular stem bundles circular see pages 104-105 see pages 106-107
Cabbage Palm
Sea Oxeye Daisy
Red Cedar

113
Liliopsida (Monocotyledons)
Family: Poaceae (grasses)
Broomsedge Andropogon virginicus
Salt Meadow CordgrassSpartina patens
Smooth Cordgrass Spartina alterniflora
Bitter Panic Grass Panicum amarum
Salt Grass Distichlis spicata
Sandspur Cenchrus tribuloides
Sea Oats Uniola paniculata
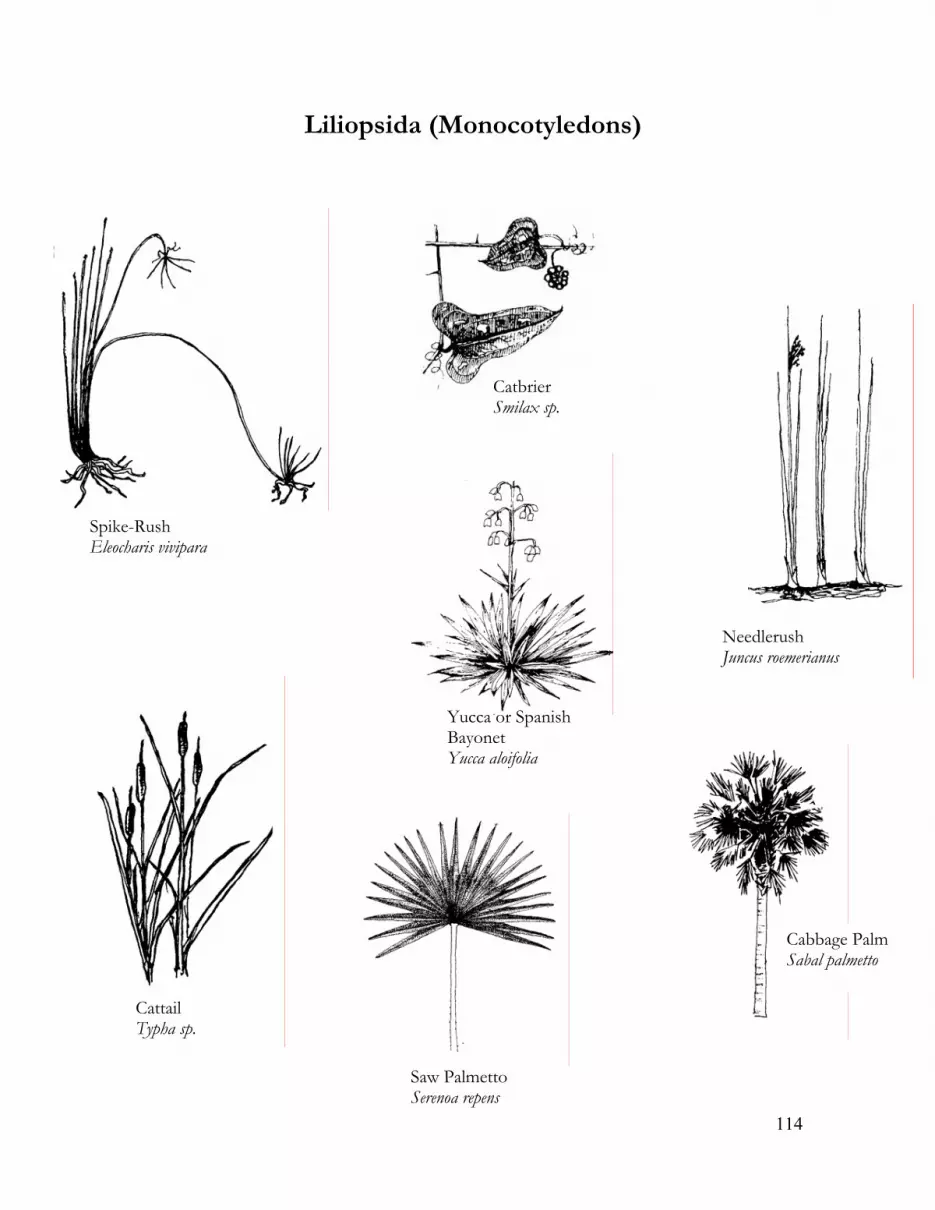
114
Liliopsida (Monocotyledons)
Cabbage Palm Sabal palmetto
Spike-Rush Eleocharis vivipara
Catbrier Smilax sp.
Yucca or Spanish Bayonet Yucca aloifolia
Needlerush Juncus roemerianus
Cattail Typha sp.
Saw Palmetto Serenoa repens

115
Magnoliopsida (Dicotyledons)
Fiddle-Leaf Morning Glory Ipomoea stolonifera
Marsh Elder Iva frutescens
Spanish Moss Tillandsia usneoides
Sea Oxeye Borrichia fruitescens
Hercules Club or Prickly Ash Xanthoxylem clava-hero
Dog Fennel Eupatorium capillifolium
Yaupon Holly Ilex vomitoria

116
Magnoliopsida (Dicotyledons)
Live Oak Quercus virginiana Glasswort
Salicornia virginica, S. bigelovii, S. europaea
Beach Croton Croton punctatus
Wax Myrtle Myrica cerifera
Russian Thistle Salsola kali
Saltwort Batis maritima

117
Wetland Vegetation By Zones
Saltmarsh
Low Marsh Zone High Marsh Zone
Marsh Border Upper Marsh Border & Transitional Zone
Beach
Upper Beach Zone Primary Dunes
Dune Meadows

118
Smooth Cord Grass: broad leaf blade, plant size varies.
Smooth Cordgrass Spartina alterniflora
Low Marsh Zone Vegetation

119
Glasswort Salicornia virginica, S. bigelovii, S. europaea
High Marsh Zone Vegetation
Salt Grass Distichlis spicata
Saltwort Batis maritima
Glasswort or Pickle weed: succulent plant with tiny bract-like leaves. Salt Grass: leaf blades in one plane, summer-fall (beach meadows). Saltwort: succulent leaf, prostrate woody stem.

120
Marsh Border
Needle Rush Juncus roemerianus
Sea Oxeye Borrichia fruitescens Marsh Aster
Aster tenuifolius
Sea Lavender Limonium carolinianum
Orach Atriplex patula
Marsh Aster: small sparsely arranged lavender or white aster flowers with yellow centers, fall. Needle Rush: long tubular leaves with sharp points, painful to walkers. Sea Oxeye: succulent leaf, yellow aster flower, spiny burr, summer. Sea Lavender: small sparsely arranged purple flowers, basal leaves, fall. Orach: similar to orach on beaches (A. arenaria) but smaller leaves.

121
Upper Marsh Border and Transition Zone
Red Cedar Juniperus virginiana
Cabbage Palm Sabal palmetto
Marsh Elder Iva frutescens
Saltcedar or Tamarisk Tamarix gallica
Groundsel-Tree Baccharis halimifolia
Red Cedar: short needles, blue berry-like cones, juniper tree. Cabbage Palm: similar to saw palmetto of the forest but pinnately. Marsh Elder: serrated leaves, tiny flowers or seeds at end of stems, leaves not as fleshy as beach elder. Groundsel-tree or Cotton Bush: irregularly-shaped leaves, cotton-like seed tufts in the fall, shrub. Saltcedar or Tamarisk: small tree or shrub, similar to red cedar but paler green and more delicate, tiny pink flowers at tips of stems, summer.

122
Orach: succulent gray-green leaf, red stem, summer Beach Croton: dusky gray-green leaves and stem, round fruit, spring Sea Rocket: succulent plant, two-section fruit, dies in summer, spring
Upper Beach Zone Vegetation
Orach Atriplex arenaria
Sea Rocket Cakile edentula
Beach Croton Croton punctatus

123
Primary Dunes
Sea Oats: seed head on tall stalk, curly leaf blade, summer-fall. Sandspur: prostrate, sharp painful burr, fall. Beach Elder: succulent leaf, woody stem, summer. Bitter Panic Grass: broad, alternate leaf blades on the stalk, summer.
Sea Oats Uniola paniculata
Bitter Panic Grass Panicum amarum
Beach Elder Iva imbricata
Sandspur Centrus tribuloides

124
Fiddle-Leaf Morning Glory Ipomoea stolonifera
Primary Dunes Continued
Railroad Vine Ipomoea pes-caprea
Sea-Purslane Sesuvium portulacastrum
Russian Thistle Salsola kali
Fiddle-Leaf Morning Glory: succulent leaf, large with flower, vine, summer-fall. Railroad Vine: large purple flower, vine, fall. Russian Thistle: succulent leaf with spine, small prickly flowers, summer.

125
Dune Meadows
Camphorweed: yellow aster flower, fall. Wild Bean: small red pea flower, slender pod, vine, summer-fall. Butterfly Pea: large purple pea flower, vine, spring-fall. Grass-Leaf Golden Aster: yellow aster flower, grass-like leaf, summer. Dune Primrose: prostrate, pink and yellow flower, spring and fall.
Butterfly Pea Centrosema virginianum Clitoria mariana
Camphorweed Heterotheca subaxillaris
Wild Bean Strophostyles umbrellata
Grass-Leaf GoldenAster Heterotheca graminifolia
Dune Primrose Oenothera humifusa

126
Georgia Fish Identification Key
ATLANTIC THREAD HERRING ATLANTIC MENHADEN Opisthonema oglinum Brevoortia tyrannus
ATLANTIC NEEDLEFISH AMERICAN HARVESTFISH Strongylura marina Peprilus paru
MOSQUITO FISH LADYFISH Gambusia affinis Elops saurus BAY ANCHOVY Anchoa mitchilli
STRIPED ANCHOVY Anchoa hepsetus
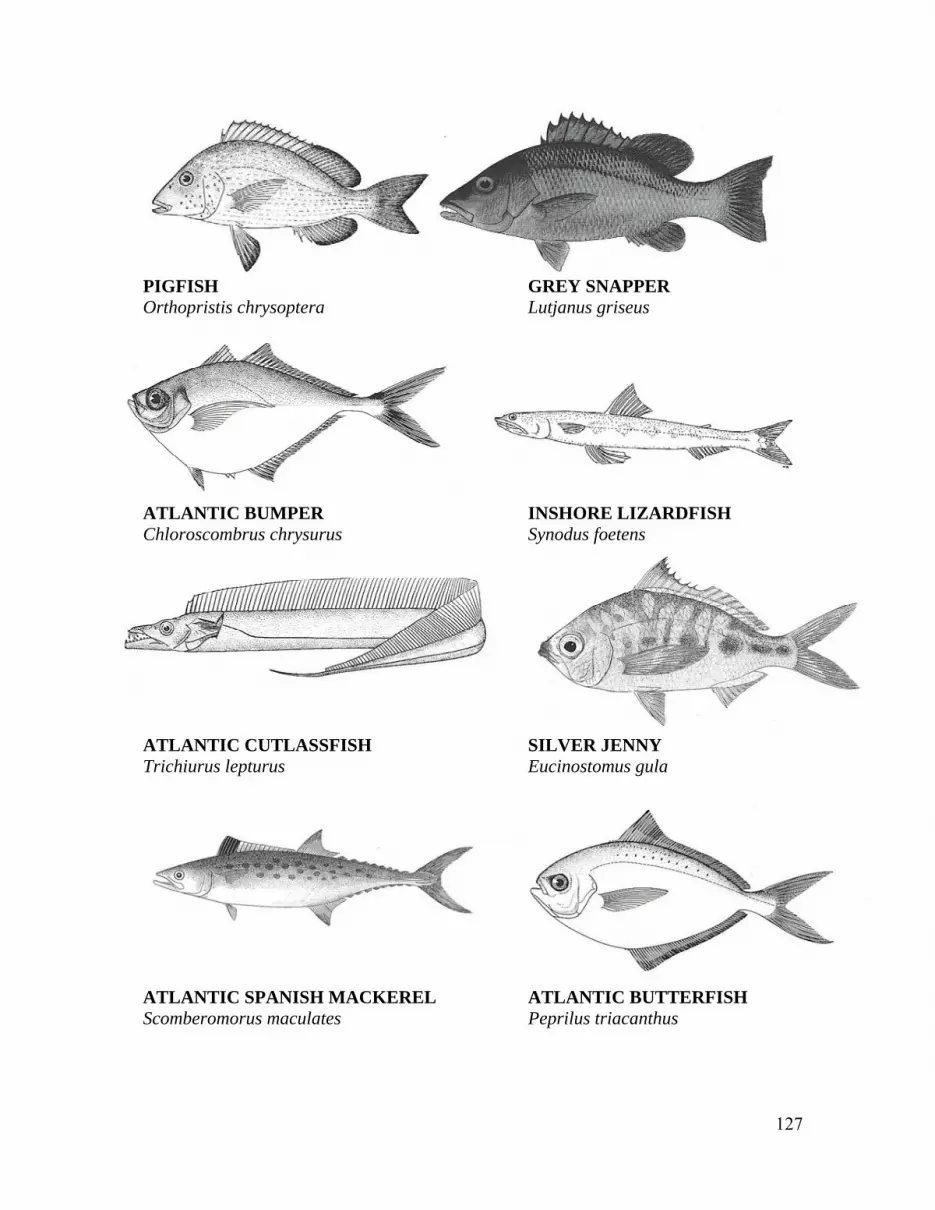
127
PIGFISH GREY SNAPPER Orthopristis chrysoptera Lutjanus griseus
ATLANTIC BUMPER INSHORE LIZARDFISH Chloroscombrus chrysurus Synodus foetens ATLANTIC CUTLASSFISH SILVER JENNY Trichiurus lepturus Eucinostomus gula
ATLANTIC SPANISH MACKEREL ATLANTIC BUTTERFISH Scomberomorus maculates Peprilus triacanthus

128
TARPON Megalops atlanticus
CREVALLE JACK Caranx hippos
LOOKDOWN Selene vomer
SILVERSIDE Menidia menidia
POMPANO Trachinotus carolinus
SPOT Leiostomus xanthurus
WHITING/KINGFISH Menticirrhus americanus
SHEEPSHEAD Archosargus probatocephalus

129
RED DRUM Sciaenops ocellata
STAR DRUM SILVER PERCH Stellifer lanceolatus Bairdiella chrysoura
BLACK SEA BASS SAND PERCH Centropristis striata Diplectrum formosum
ROCK SEA BASS Centropristis philadelphica
BLACK DRUM Pogonias cromis
OYSTER TOADFISH Opsanus tau

130
SMOOTH PUFFER Lagocephalus laevigatus
STRIPED SEAROBIN BIGHEAD SEAROBIN Prionotus evolans Prionotus tribulus
GAFFTOPSAIL SEA CATFISH HARDHEAD SEA CATFISH Bagre marinus Ariopsis felis PALESPOTTED EEL SHRIMP EEL Ophichthus ocellatus Ophichthus cruentifer
STRIPED BURRFISH Chilomycterus schoepfi
NORTHERN PUFFER Sphoeroides maculatus
NORTHERN SEAROBIN Prionotus carolinus
131
SILVER SEATROUT Cynoscion nothus
STRIPED MULLET Mugil cephalus
ATLANTIC SPADEFISH Chaetodipterus faber
SPOTTED SEATROUT Cynoscion nebulosus
WEAKFISH Cynoscion regalis
SPOTTAIL PINFISH Diplodus holbrooki
ATLANTIC CROAKER Micropogonias undulatus
REMORA Remora remora
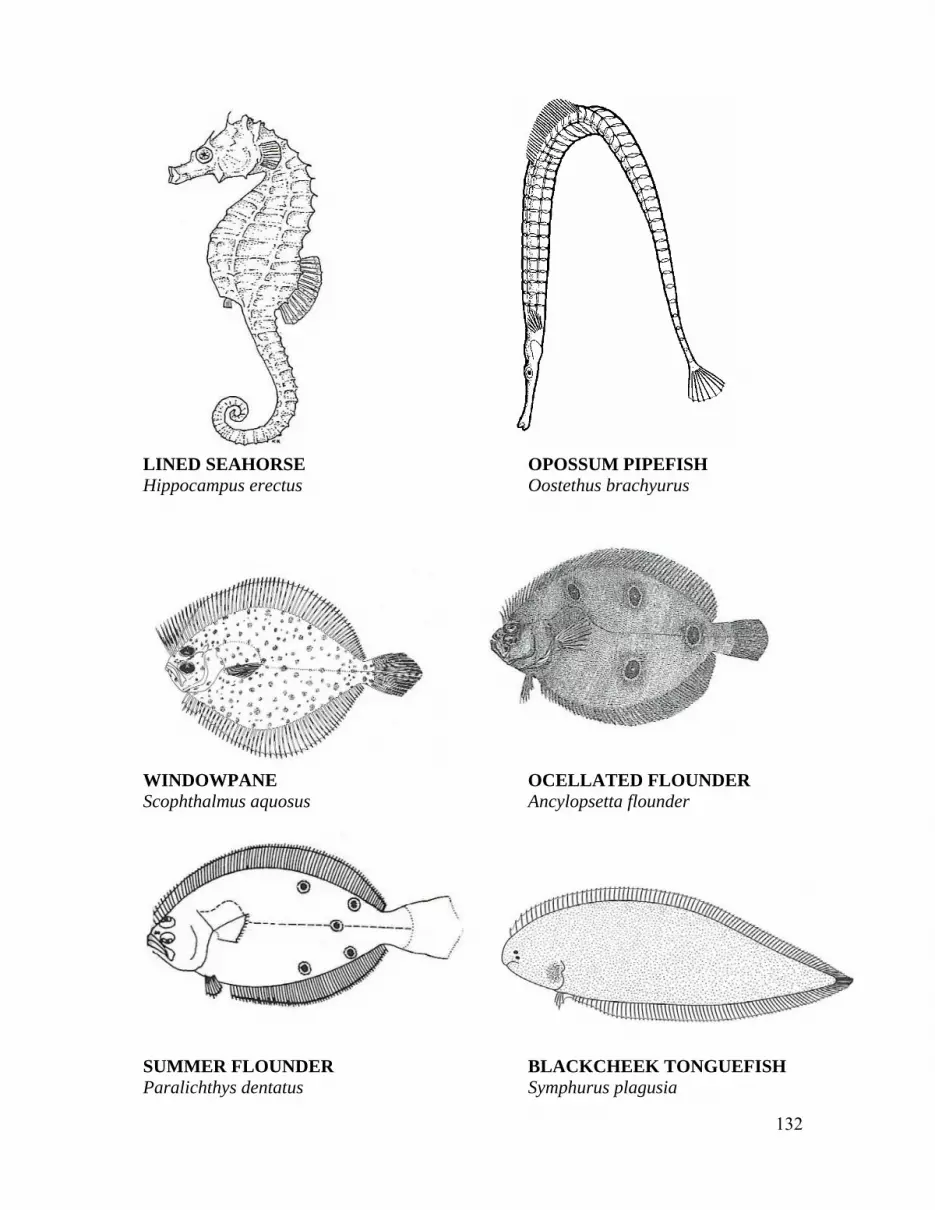
132
LINED SEAHORSE OPOSSUM PIPEFISH Hippocampus erectus Oostethus brachyurus
WINDOWPANE OCELLATED FLOUNDER Scophthalmus aquosus Ancylopsetta flounder
SUMMER FLOUNDER BLACKCHEEK TONGUEFISH Paralichthys dentatus Symphurus plagusia

133
CLEARNOSE SKATE SOUTHERN STINGRAY Raja eglanteria Dasyatis Americana
ATLANTIC STINGRAY SMOOTH BUTTERFLY RAY Dasyatis Sabina Gymnura micrura
SOUTHERN FLOUNDER Paralichthys squamilentus
HOGCHOKER Trinectes maculatus

134
SANDBAR SHARK Carcharhunus plumbeus
LEMON SHARK BONNET HEAD SHARK Negaprion brevirostris Sphyrna tiburo

135
Adopt-A-Wetland Program Evaluation
1. Is the chemical survey appropriate for your monitoring site?
2. Are the visual activities appropriate for your monitoring site?
3. Are the biological monitoring activities appropriate for your monitoring site?
4. Are any of the activities in the visual or biological survey too difficult?
5. Which directions in the manual are confusing?
6. Do you have any suggestions/comments concerning the monitoring program?
Please return evaluation to: Adopt-A-Wetland Program, UGA Marine Extension Service, 20 Ocean Science Circle, Savannah, GA 31411, Fax: (912) 598-2399, Email [email protected]

136
Useful Websites
Visit these website for good information/definitions on water chemistry topics http://wow.nrri.umn.edu/wow/under/parameters/temperature.html http://waterontheweb.org
Visit this website to find the taxonomic information for plants, fungi, and animals
http://www.itis.usda.gov
Visit this website for some good information on Georgia seashells and mollusks http://www.arches.uga.edu/~amylyne/GSC/seashellGA.html
Visit this website for lots of information on invasive species
http://www.sgnis.org Visit this web site for information on animals, plants, water quality, and watersheds
http://www.chesapeakbay.net/baybio.htm Maryland Sea Grant website
http://mdsg.umd.edu Website for Volunteer Estuary Monitoring Methods Manual
http://www.epa.gov/nep/monitor/
EPA Watershed Information http://www.epa.gov/owow/watershed
Georgia Adopt-A-Stream website
http://www.riversalive.org
Conchologists of America- Conch-Net Home Page http://www.conchologistsofamerica.org
The Academy of Natural Sciences - Research - Patrick Center - Research Programs
http://www.acnatsci.org/research
Earthguide - Earth Science Educational Resources http://earthguide.ucsd.edu
Center for Watershed Protection
http://www.cwp.org/
Marine Protected Areas - News http://depts.washington.edu/mpanews/ http://mpa.gov

137
Wetland Breaking News http://www.aswm.org/wbn
NODC Coastal Water Temperature Guide
http://www.nodc.noaa.gov/dsdt/cwtg/
Links to information on Oyster Restoration http://water.dnr.state.sc.us/marine/mrri/shellfish http://www3.csc.noaa.gov/scoysters
Savannah-Weather from WTOC-TV, Savannah, GA.
http://www.savannah-weather.com For information on the Shannon-Wiener Diversity Index
http://www.snr.missouri.edu/natr211/topics/shannon.htm
Metropolitan Planning Commission Water Resources Website http://www.thempc.org/
University of Georgia Shellfish Research Lab http://www.shellfish.uga.edu
Society of Wetland Scientists-Wetland related jobs
http://www.sws.org City of Savannah, Water and Sewer Bureau
http://www.gwpca.org/cu-info/utilities/savannah.htm Beach monitoring web site
http://crd.dnr.state.ga.us (follow link to beaches under EDU and Outreach) US Geological Survey
www.usgs.gov
EPA Wetland Fact Sheets http://www.epa.gov/owow/wetlands/facts/contents.html
EPA's Most Frequently Asked Wetland Questions
http://www.ehso.com/wetlands_information.htm

138
Useful Books on Coastal Wetlands
Aja, D. 1996. A Citizens Guide to Coastal Watershed Survey. Maine Department of
Environmental Protection, Maine. 77 p.
Bahr, L.M, and W.P. Lanier. 1981. The ecology of intertidal oyster reefs of the South
Atlantic coast: a community profile. U.S. Fish and Wildlife Service, Office of
Biological Services, Washington, D.C. FWS/OBS-81/15. 105pp.
Braccia, A. and Batzer, D.P. 2001. Invertebrates Associated with Woody Debris in a
Southeastern U.S. Forested Floodplain Wetland. Wetlands. Vol. 21, No. 1. pp. 18-31
Coulombe, D. 1992. The Sea Side Naturalist. Fireside Publishing, New York, NY, 246 p.
Fischer, W. 1978. FAO species identification sheets for fishery purposes. Western Central
Atlantic (fishing area 31). Vols. 1-7.
Gilligan, M. 1989. An illustrated field guide to the fishes of Gray’s Reef National Marine
Sanctuary. NOAA Technical Memorandum. Washington, D.C., 77p.
Heard, R.W. 1982. Guide to Common Tidal Marsh Invertebrates of the Northeastern Gulf
of Mexico. Mississippi-Alabama Sea Grant Consortium. Reinbold Lithographing and
Printing Co., Booneville, MS, 81p.
Kaplan, E.H. 1988. Peterson Field Guides, Southeastern and Caribbean Seashores.
Houghton Mifflin Co., New York, NY, 425 p.
Miner, R. 1950. Field Book of Seashore Life. Van Rees Press, New York, NY. 888 p.

139
Mitchell, M. and Stapp, W. 1992. Field Manual for Water Quality Monitoring: An
Environmental Education Program for Schools. Thomson-Shore Printers, Dexter,
Michigan. 240 p.
Niesen, T.M. 1982. The Marine Biology Coloring Book. Harper Resource, New York, NY,
115 p.
Olsen, M. Georgia’s Wetland Treasures. Georgia Department of Natural Resources,
Coastal Resources Division and U.S. Environmental Protection Agency publication,
218 p.
Pearce, M. 1999. Seashore Life Illustrations. Dover Publications, Mineola, NY. 32 p.
Robbins, C. R., and G.C. Ray. 1986. A Field Guide to Atlantic Coast Fishes. Houghton
Mifflin Company, Boston, MA., 354p.
Ruppert, E.E. and R.S. Fox. 1988. Seashore Animals of the Southeast. University of South
Carolina Press, Columbia, S.C., 428 p.
Stancioff, E. 1996. Clean Water: A Guide To Water Quality Monitoring. Maine/New
Hampshire Sea Grant Marine Advisory Program & University of Maine Cooperative
Extension, Orono, ME. 73 p.

140
Common Mollusks of Georgia Phylum: MOLLUSCA Class: GASTROPODA Family Scientific Name Common Name Acmaeidae Lottia antillarum Keyhole Limpet Calyptraeidae Crepidula aculeata (Gmelin, 1791) Spiny Slipper Crepidula fornicata (Linnaeus, 1758) Atlantic Slipper
Crepidula plana (Say, 1822) White Slipper
Columbellidae Anachis avara (Say, 1822) Greedy Dove Snail
Columbella rusticoides Common Dove Snail Dentaliidae Dentalium laqueatum (Verrill, 1885) Panelled/Reticulate Tusk Epitoniidae Epitonium angulatum (Say, 1830) Angulate Wentletrap Epitonium humphreysii (Kiener, 1838) Humphrey’s Wentletrap Epitonium rupicola (Kurtz, 1860) Brown-Band Wentletrap Fasciolariidae Fasciolaria hunteria (Perry, 1811) Banded Tulip Fasciolaria tulipa (Linnaeus, 1758) True Tulip Pleuroploca gigantea (Kiener, 1840) Florida Horse Conch Favorinidae Cratena pilata Striped Nudibranch Littorinidae Littorina irrorata (Say, 1822) Marsh Periwinkle Melampodidae Melampus bidentatus (Say, 1822) Common Marsh Snail Melongenidae Busycotypus canaliculatus(Linnaeus, 1758) Channeled Whelk Busycon carica (Gmelin, 1791) Knobbed Whelk Busycon carica kieneri (Philippi, 1848) Kiener’s Whelk Busycon sinistrum (Hollister, 1958) Lightning Whelk Busycotypus spiratus (Lamarck, 1816) Pear Whelk Muricidae Eupleura caudata (Say, 1822) Rough Oyster Drill Muricanthus fulvescens (Sowerby, 1834) Giant Eastern Murex Phyllonotus pomum (Gmelin, 1791) Apple Murex Muricidae Thais haemastoma canaliculata (Gray, 1839) Southern Oyster Drill Thais haemastoma floridana (Conrad, 1837) Florida Rock Shell Urosalpinx cinerea (Say, 1822) Atlantic Oyster Drill Nassariidae Ilyanassa obsoleta (Say, 1822) Eastern Mudsnail Nassarius trivittatus (Say, 1822) New England Nassa Naticidae Neverita duplicata (Say, 1822) Moon Snail/Shark Eye Sinum perspectivum (Say, 1831) White Baby’s Ear

141
Olividae Oliva sayana (Ravenel, 1834) Lettered Olive Olivella mutica (Link, 1807) Variable Dwarf Olive Pyramidellidae Boonea impressa (Say, 1822) Impressed Odostome Terebridae Terebra dislocata (Say, 1822) Common Eastern Augur Class: BIVALVIA Family Scientific Name Common Name Anomiidae Anomia simplex (d’Orbigny, 1842) Common Atlantic Jingle Arcidae Anadara lienosa floridana (Conrad, 1869) Cut-Ribbed Ark Anadara ovalis (Brugière, 1789) Blood Ark Anadara transversa (Say, 1822) Transverse Ark Arca zebra (Swainson, 1833) Turkey Wing Barbatia candida (Helbling, 1779) White-Bearded Ark Barbatia domingensis (Lamarck, 1819) White Miniature Ark Noetia ponderosa (Say, 1822) Ponderous Ark Cardiidae Dinocardium robustum (Lightfoot, 1786) Giant Atlantic Cockle Laevicardium laevigatum (Linnaeus, 1758) Common Egg Cockle Laevicardium mortoni (Conrad, 1830) Morton’s Egg Cockle Laevicardium pictum (Ravenel, 1861) Ravenel’s/Painted Egg Cockle Trachycardium egmontianum (Shuttleworth, 1856) Florida Prickly Cockle Chamidae Arcinella cornuta (Conrad, 1866) Florida Spiny Jewelbox Corbiculidae Polymesoda caroliniana (Bosc, 1801) Carolina Marshclam Donacidae Donax variabilis (Say, 1822) Florida Coquina Glycymerididae Glycymeris americana (DeFrance, 1829) Giant American Bittersweet Lucinidae Divaricella quadrisulcata (d’Orbigny, 1842) Cross-Hatched Lucin Linga pensylvanica (Linnaeus, 1758) Pennsylvania Lucine Mactridae Raeta plicatella (Lamarck, 1818) Channeled Duckclam Mactra fragilis (Gmelin, 1791) Fragile Surfclam Mulinia lateralis (Say, 1822) Dwarf Surf Clam Spisula raveneli (Conrad, 1831) Southern Surf Clam Rangia cuneata (Sowerby, 1831) Common Rangia Spisula solidissima Atlantic Surf Clam Myidae Sphenia antillensis (Dall & Simpson, 1901) Antillean Sphenia Mytilidae Amygdalum papyrium (Conrad, 1846) Paper Mussel Brachidontes exustus (Linnaeus, 158) Scorched Mussel Geukensia demissa (Dillwyn, 1817) Atlantic Ribbed Mussel

142
Mytilidae Ischadium recurvum (Rafinisque, 1820) Hooked Mussel Lioberus castaneus (Say, 1822) Chestnut Mussel Modiolus americanus (Leach, 1815) Tulip Mussel Ostreidae Crassostrea virginica (Gmelin, 1791) American Eastern Oyster Ostrea equestris (Say, 1834) Crested Oyster Pandoridae Pandora trilineata (Say, 1822) Say’s/Threeline Pandora Pectinidae Aequipecten muscosus (Wood, 1828) Rough Scallop Argopecten gibbus (Linnaeus, 1758) Atlantic Calico Scallop Nodipecten nodosus (Linnaeus, 1758) Lion’s Paw Pecten ziczac (Linnaeus, 1758) Zigzag Scallop Chlamys sentis (Reeve, 1853) Sentis/Scaly Scallop Pholadidae Barnea truncata (Say, 1822) Fallen Angel Wing Cyrtopleura costata (Linnaeus, 1758) Angel Wing Martesia cuneiformis (Say, 1822) Wedge Piddock Pinnidae Atrina rigida (Lightfoot, 1786) Rigid Penshell Atrina seminuda (Lamarck, 1819) Half-naked Penshell Atrina serrata (Sowerby, 1825) Saw-toothed Penshell Pteriidae Pteria colymbus (Röding, 1798) Atlantic Wing Oyster Semelidae Abra aequalis (Say, 1822) Atlantic Abra Cumingia tellinoides (Conrad, 1837) Common Cumingia Semele proficua (Pulteney, 1799) White Atlantic Semele Semele purpurascens (Gmelin, 1791) Purplish Semele Solecurtidae Tagelus divisus (Spengler, 1794) Purplish Tagelus Tagelus plebeius (Lightfoot, 1786) Stout Tagelus Solenidae Ensis directus (Conrad, 1843) Atlantic Jackknife Clam Solen viridis (Say, 1821) Green Jackknife Clam Spondylidae Spondylus americanus (Hermann, 1781) Atlantic Thorny Oyster Tellinidae Macoma balthica (Linnaeus, 1758) Baltic Macoma Macoma constricta (Bruguière, 1792) Constricted Macoma Tellina alternata (Say, 1822) Alternate Tellin Tellina listeri (Röding, 1798) Speckled Tellin Veneridae Chione intapurpurea (Conrad, 1849) Lady-in-Waiting Venus Chione latilirata (Conrad, 1841) Imperial Venus Dosinia discus (Reeve, 1850) Disk Clam Macrocallista maculata (Linnaeus, 1758) Calico Clam Macrocallista nimbosa (Lightfoot, 1786) Sunray Venus Mercenaria campèchiensis (Gmelin, 1791) Southern Quahog Mercenaria mercenaria (Linnaeus, 1758) Northern Quahog Mercenaria mercenaria (ecolocgical form notata ) Northern Quahog
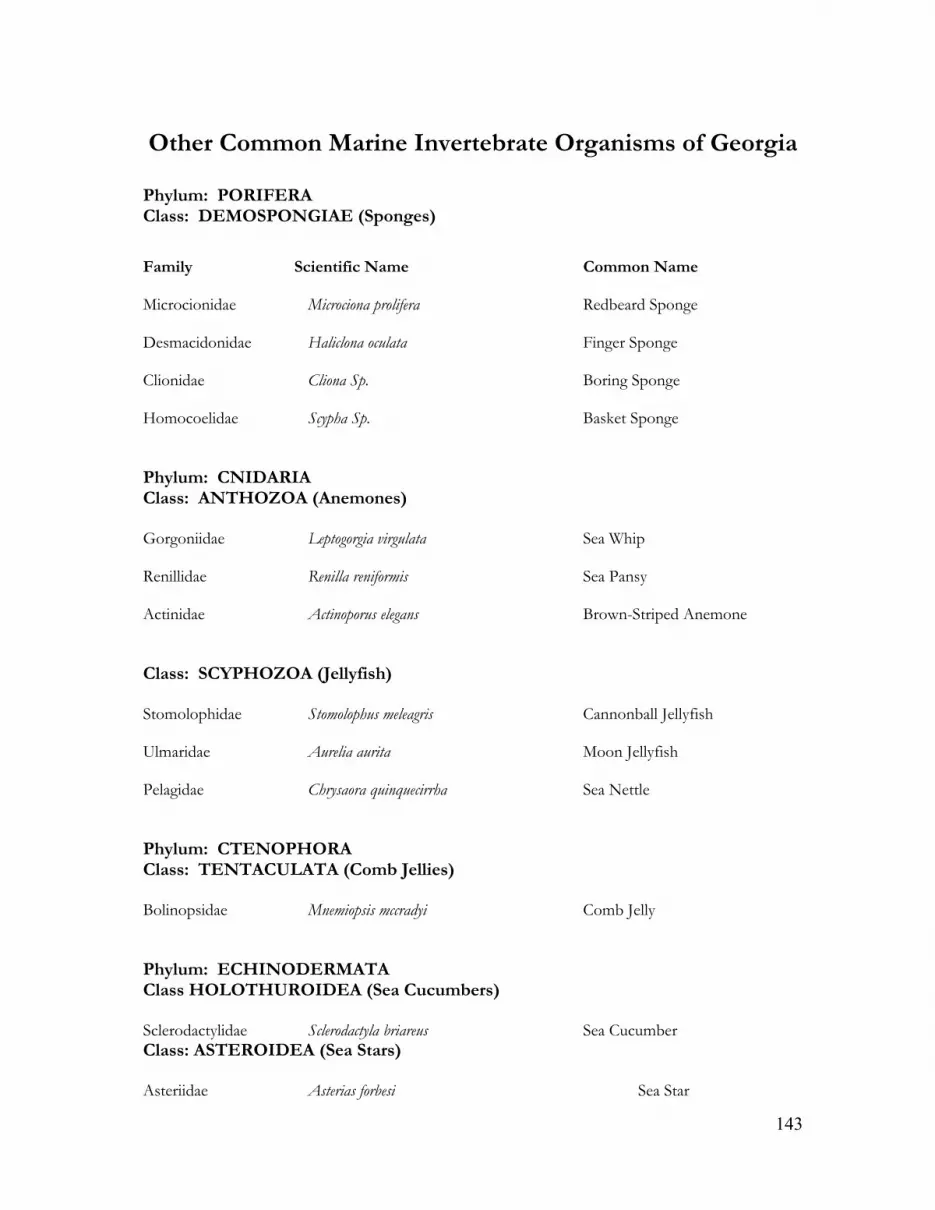
143
Other Common Marine Invertebrate Organisms of Georgia Phylum: PORIFERA Class: DEMOSPONGIAE (Sponges)
Family Scientific Name Common Name Microcionidae Microciona prolifera Redbeard Sponge Desmacidonidae Haliclona oculata Finger Sponge Clionidae Cliona Sp. Boring Sponge Homocoelidae Scypha Sp. Basket Sponge Phylum: CNIDARIA Class: ANTHOZOA (Anemones) Gorgoniidae Leptogorgia virgulata Sea Whip Renillidae Renilla reniformis Sea Pansy Actinidae Actinoporus elegans Brown-Striped Anemone Class: SCYPHOZOA (Jellyfish) Stomolophidae Stomolophus meleagris Cannonball Jellyfish Ulmaridae Aurelia aurita Moon Jellyfish Pelagidae Chrysaora quinquecirrha Sea Nettle Phylum: CTENOPHORA Class: TENTACULATA (Comb Jellies) Bolinopsidae Mnemiopsis mccradyi Comb Jelly Phylum: ECHINODERMATA Class HOLOTHUROIDEA (Sea Cucumbers) Sclerodactylidae Sclerodactyla briareus Sea Cucumber Class: ASTEROIDEA (Sea Stars) Asteriidae Asterias forbesi Sea Star

144
Phylum: ANNELIDA Class: POLYCHAETA (Worms) Nereidae Nereis succinea Southern Clam Worm Onuphidae Diopatra cuprea Plumed Worm Sabellidae Fabricia sabella Fan Worm Class: ECHINOIDEA (Sea Urchins, Sand Dollars) Mellitidae Mellita quinquiesperforata Key Hole Urchin Toxopneustidae Lytechinus variegates Sea Urchin Class: OPHUROIDEA (Brittle Stars) Ophiodermatidae Ophioderma brevispinum Smooth Brittle Star Phylum: ARTHROPODA Class: PYCNOGONITA (Sea Spiders) Tanystylidae Tanystylum orbiculare White Sea Spider Class: Cirripedia (Barnacles) Cthamalidae Chthamalus fragilis Fragile Barnacle Balanidae Balanus eburneus Ivory Barnacle Lepadidae Lepas anatifera Goose Neck Barnacle Class: MEROSTOMATA (Horseshoe crabs) Limulidae Limulus polyphemus Atlantic Horseshoe Crab Class: MALACOSTRACA (Crabs, Shrimps) Portunidae Callinectes sapidus Blue Crab Xanthidae Panopeus obesus Mud Crab Menippe mercenaria Stone Crab Rhithropanopeus harrisii White-Fingered Mud Crab Calappidae Hepatus epheliticus Dolly Varden/Calico Crab

145
Leucosiidae Persephona punctata Purse Crab Majidae Libinia emarginata Common Spider Crab Portunidae Carcinus maenas Green/Porcelain Crab Ovalipes ocellatus Lady Crab Arenaeus cribarius Speckled Crab Grapsidae Sesarma reticulatum Marsh Crab Sesarma cinereum Wharf Crab Ocypodidae Uca pugnax Mud Fiddler Crab Uca minax Brackish Fiddler Crab Ocypodidae Uca pugilator Sand Fiddler Crab Penaeidae Penaeus aztecus Brown Shrimp Penaeus duorarum Pink Shrimp Penaeus setiferus White Shrimp Hippolytidae Hippolyte sp. Grass Shrimp Squillidae Squilla empusa Mantis Shrimp Diogenidae Clibanarius vittatus Striped Hermit Crab Hippidae Emerita talpoida Mole Crab Gammaridae Gammarus palustris Scud amphipod Haustoriidae Haustorius Canadensis Digger Amphipods Caprellidae Caprella equilibra Skeleton Shrimp Phylum: CHORDATA Class: ASCIDIACEA (Tunicates, Sea Squirts) Styelidae Styela plicata Rough (pleated) Sea Squirts Molgulidae Molgula manhattensis Sea grapes Polyclinidae Aplidium constellatum Sea Pork

146
Common Fishes of Georgia Phylum: CHORDATA Class: OSTEICHTHYES (Bony Fishes) Family Scientific Name Common Name
Acipenseridae Acipenser brevirostrum Atlantic Sturgeon Lepisosteiformes Lepisosteus osseus Longnose Gar Elopidae Elops saurus Ladyfish Megalops atlanticus Tarpon Anguillidae Auguilla rostrata American Eel Ophichthidae Ophichthus gomesi Shrimp eel Ophichthus ocellatus Palespotted eel Clupeidae Opisthonema oglinum Atlantic Thread Herring Brevoortia tyrannus Atlantic Menhaden Engraulidae Anchoa hepsetus Striped Anchovy Anchoa mitchilli Bay Anchovy Ariidae Arius felis Sea Catfish Bagre marinus Gafftopsail Catfish Synodontidae Synodus foetens Inshore Lizardfish Gadidae Urophycis regia Spotted Hake Urophycis foridana Southern Hake Batrachoididae Opsanus tau Oyster Toadfish Gobiesocidae Gobiesox strumosus Skilletfish Belonidae Strongylura marina Atlantic Needlefish Cyprinodontidae Cyprinodon variegates Sheepshead minnow Fundulus majalis Striped Killifish Poeciliidae Gambusia affinis Mosquitofish Poecilia latipinna Sailfin Molly Atherinidae Menidia menidia Atlantic silverside Syngnathidae Hippocampus erectus Lined Seahorse Oostethus brachyurus Northern pipefish

147
Triglidae Prionotus carolinus Northern Sea Robin Prionotus evolans Striped Sea Robin Prionotus tribulus Big Head Sea Robin Bothidae Ancylopsetta quadrocellata Ocellated Flounder Scophthalmus aquosus Windowpane Paralichthys dentatus Summer Flounder Paralichthys squamilentus Southern Flounder Soleidae Trinectes maculates Hogchoker Symphurus plagiusa Blackcheek Tonguefish Balistidae Monacanthus hispidus Planeheaded Filefish Ostraciidae Lactophrys quadricornis Scrawled Cowfish Tetraodontidae Lagocephalus lagocephalus Smooth Puffer Sphoeroides maculates Northern Puffer Chilomycterus schoepfi Striped burrfish Percichthyidae Morone saxatilis Striped Bass Serranidae Centropristis Philadelphia Rock Sea Bass Centropristis striata Black Sea Bass Diplectrum formosum Sand Perch Mycteroperca phenax Scamp Mycteroperca microlepis Gag Pomatomidae Pomatomus saltatrix Bluefish Echeneidae Remora remora Sharksuckers Carangidae Caranx hippos Crevalle Jack Chloroscombrus chrysurus Atlantic Bumper Selene vomer Lookdown Trachinotus carolinus Florida Pompano Lutjanidae Lutjanus griseus Gray Snapper Gerreidae Eucinostomus gula Silver Jenny Haemulidae Orthopristis chrysoptera Pigfish Sparidae Archosargus probatocelphalus Sheepshead Diplodus holbroooki Pinfish Sciaenidae Bairdiella chrysoura Silver Perch Cynoscion nebulosus Spotted Seatrout Cynoscion nothus Silver Seatrout Cynoscion regalis Weakfish Sciaenidae Sciaenops ocellatus Red Drum Leiostomus xanthurus Spot

148
Larimus fasciatus Banded Drum Pogonias cromis Black Drum Menticirrhus americanus Kingfish/Whiting Menticirrhus littoralis Gulf Kinfish Micropogonias undulates Atlantic Croaker Stellifer lanceolatus Star Drum Ephippidae Chaetodipterus faber Atlantic Spadefish Chaetodontidae Chaetodon ocellatus Spotfin Butterflyfish Chaetodon sedentarius Reef Butterflyfish Pomacanthidae Holacanthus ciliaris Blue Angelfish Pomacanthus arcuatus Gray Angelfish Mugilidae Mugil cephalus Striped Mullet Mugil curema White Mullet Sphyraenidae Sphyraena picudilla Southern Sennet Uranoscopidae Astroscopus y-graecum Southern Stargazer Blenniidae Chasmodes bosquianus Striped Blenny Hyposoblennius hentz Feather Blenny Gobiidae Gobiosoma bose Naked Goby Trichiuridae Trichiurus lepturus Atlantic Cutlass fish Stromateidae Peprilus paru Southern Harvestfish Peppilus triacanthus Butterfish Scombridae Scomberomorus maculates Spanish Mackerel Class: ELASMOBRANCHIOMORPHI (Sharks, Skates) Family Scientific Name Common Name Dasyatidae Dasyatis Sabina Atlantic Stingray Dasyatis Americana Southern Stingray Gymnuridae Gymnura micrura Smooth Butterfly Ray Rajidae Raja eglanteria Clearnose Skate Sphyrnidae Sphyrna tiburo Bonnet Head Shark Carcharhinidae Negaprion brevirostris Lemon Shark Carcharhimus plumbeus Sandbar Shark

149
Introduced Aquatic Species in Georgia Group Species Common Name Amphibians-Frogs Eleutherodactylus planirostris Greenhouse Frog Amphibians-Frogs Osteopilus septentrionalis Cuban Tree Frog Coelenterates-Hydrozoans Craspedacusta sowerbyii Freshwater Jellyfish Crustaceans-Copepods Argulus japonicus Parasitic Copepod Crustaceans-Shrimp Penaeus monodon Asian Tiger Shrimp Fishes Astronotus ocellatus Oscar Mollusks-Bivalves Corbicula fluminea Asian Clam Mollusks-Bivalves Perna viridis Green Mussel Mollusks-Gastropods Pomacea sp. Applesnail Fishes Carassius auratus Goldfish Fishes Clarias batrachus Walking Catfish Fishes Ctenopharyngodon idella Grass Carp Fishes Cyprinus carpio Common Carp Fishes Leuciscus idus Ide Fishes Monopterus albus Asian Swamp Eel Fishes Oreochromis aureus Blue Tilapia Fishes Oreochromis mossambicus Mozambiqua Tilapia Fishes Oreochromis niloticus Nile Tilapia Fishes Oreochromis, Sarotherodon, Tilapia sp. Tilapia Fishes Piaractus brachypomus Pirapatinga, Red-bellied Pacu Fishes Pterois volitans Lionfish Fishes Salmo trutta Brown Trout Fishes Tinca tinca Tench Mammals Myocastor coypus Nutria Plants Alliaria petiolata Garlic Mustard Plants Alternanthera philoxeroides Alligatorweed Plants Eichhornia crassipes Water Hyacinth Plants Fallopia japonica Japanese Knotweed Plants Hydrilla verticillata Hydrilla Plants Imperata cylindrica Cogongrass Plants Murdannia keisak Asian Spiderwort Plants Myriophyllum aquaticum Parrotfeather Plants Myriophyllum spicatum Eurasian Water Milfoil Plants Phragmites australis Common Reed Plants Pistia stratiotes Water Lettuce Plants Pueraria montana Kudzu Plants Salvinia molesta Giant Salvinia Plants Triadica sebiferum Chinese Tallow Tree Source USGS (http://nas.er.usgs.gov/queries/StateSearch.asp) 08/11/05 & US Dept Agriculture (http://plants.usda.gov/) 10/18/05