Embed Size (px)
Citation preview

Wat. Res. Vol. 35, No. 10, pp. 2435–2445, 2001# 2001 Elsevier Science Ltd. All rights reserved
Printed in Great Britain0043-1354/01/$ - see front matterPII: S0043-1354(00)00524-8
COMPARISON OF THE FILTRATION CHARACTERISTICS
BETWEEN ATTACHED AND SUSPENDED GROWTH
MICROORGANISMS IN SUBMERGED MEMBRANE
BIOREACTOR
JUNGMIN LEE, WON-YOUNG AHN and CHUNG-HAK LEE*
School of Chemical Engineering, Seoul National University, Seoul 151-742, South Korea
(First received 27 April 2000; accepted in revised form 16 October 2000)
Abstract}An attached growth bioreactor was designed to minimize the effect of suspended microorgan-isms on membrane fouling in submerged membrane bioreactor. Comparison of mixed liquor fromattached and suspended growth systems was made to elucidate major factors giving rise to differentfiltration characteristics. Unexpectedly, the rate of membrane fouling of the attached growth system wasabout 7 times higher than that of the suspended growth system despite similar characteristics of solublefraction from the two reactors. Filtration performance proved to depend on the concentration of mixedliquor suspended solids (MLSS). Better filtration performance with suspended growth was explainedby the formation of dynamic membranes with suspended solids. A series of analyses such as hydraulicresistance, specific cake resistance, scanning electron microscope, and atomic force microscope were carri-ed out to elucidate the different filtration characteristics of the two systems. # 2001 Elsevier Science Ltd.All rights reserved
Key words}submerged membrane bioreactor, suspended growth, attached growth, membrane fouling,dynamic membrane
INTRODUCTION
In wastewater treatment tighter controls on dischargelimits have necessitated more elaborate and perhaps
more expensive solutions than conventional biologi-cal treatment processes. One of the possible mod-ification of conventional biological treatment
processes is the replacement of a secondary sedimen-tation tank by membrane units, which is called amembrane bioreactor (MBR). The use of MBRs in
wastewater treatment is now emerging as an attrac-tive technology with considerable advantages overconventional treatment methods (Arnot and Zahir,
1996; Chiemchaisri et al., 1993; Chiemchaisri andYamamoto, 1994). However, by their nature asfilters, membranes are prone to fouling as aconsequence of interactions between the membrane
and the mixed liquor, which reduces the filtrate fluxand increases the required membrane area (Bouh-abila et al., 1998), thereby deteriorating overall
process performance.Among theories proposed to explain flux behavior
a resistance-in-series model, which is based on the
concept that the flux decline arises from a series ofresistances, is generally used due to its ease ofquantifying the degree of fouling. The cake resistance(Rc), one of the resistances cited in this model, has
been reported as a main contributor to the totalresistance (Rt) in MBR processes (Chiemchaisri andYamamoto, 1994; Choo and Lee, 1996a,b; Chang
and Lee, 1998; Kim et al., 1998; Chang et al., 1999;Lee, 1999; Park et al., 1999). The cake layer couldconsist of a variety of components: microorganisms
and various inorganic and organic substances includ-ing extracelluar polymeric substances (EPS).A number of techniques have been explored in
order to overcome membrane fouling due to the cakeresistance (Rc). Those include backwashing, jetaeration, operation below critical flux, addition ofcoagulants, etc (Cote and Buisson, 1997; Howell,
1994; Ishida et al., 1993; Lee et al., 2000). Most of thestudies have focused on minimizing the cake forma-tion on the membrane surface, but few authors have
tried to remove one of the primary sources of cakelayer, which are the microorganisms suspended in thebioreactor. In this study, an attached growth system
was designed in order to reduce the effect ofsuspended solids on membrane fouling. Most of themicroorganisms were fixed on support media with
*Author to whom all correspondence should be addressed.
Fax: +82-2-888-1604; e-mail: [email protected]
2435
only a negligible amount of microorganisms in the
bulk. The filtration behavior and treated waterquality were examined and compared with thesuspended growth system and several analyticalmethods were applied to explain different filtration
characteristics of the two.
MATERIALS AND METHODS
Experimental setup
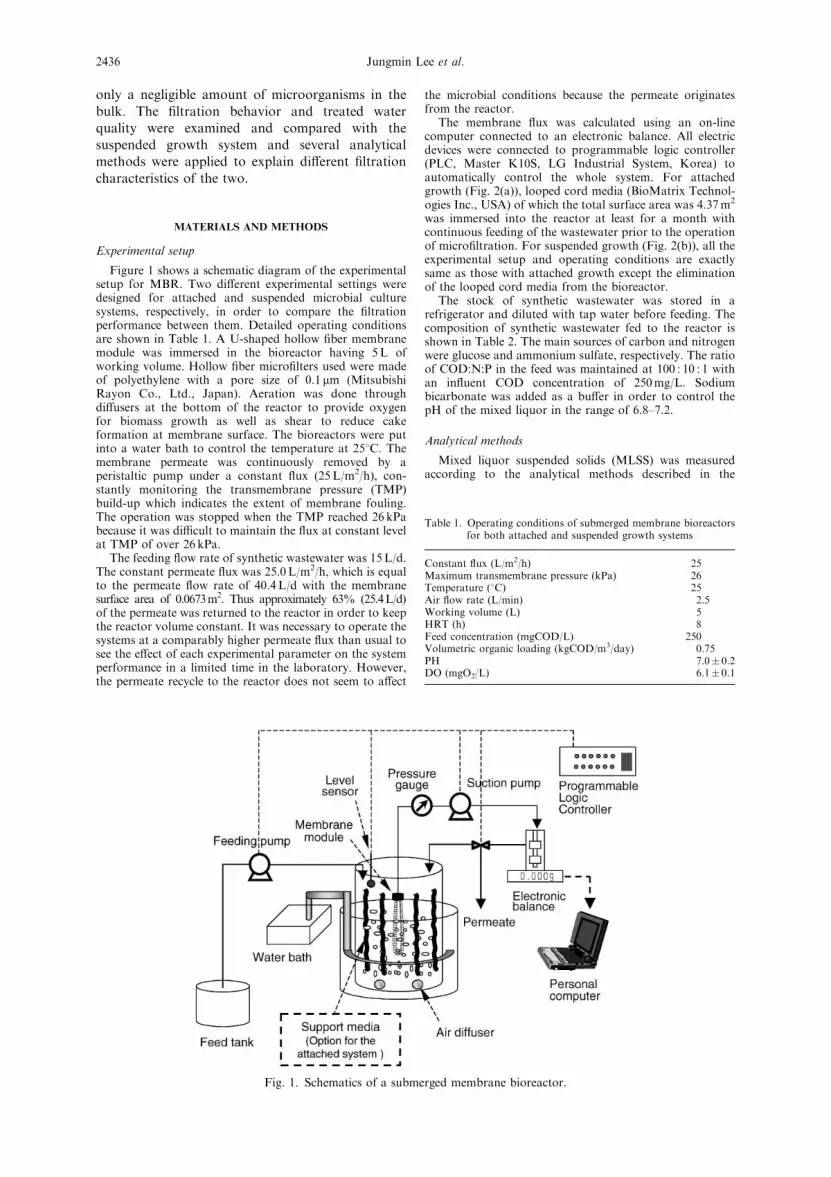
Figure 1 shows a schematic diagram of the experimentalsetup for MBR. Two different experimental settings weredesigned for attached and suspended microbial culturesystems, respectively, in order to compare the filtrationperformance between them. Detailed operating conditionsare shown in Table 1. A U-shaped hollow fiber membranemodule was immersed in the bioreactor having 5L ofworking volume. Hollow fiber microfilters used were madeof polyethylene with a pore size of 0.1 mm (MitsubishiRayon Co., Ltd., Japan). Aeration was done throughdiffusers at the bottom of the reactor to provide oxygenfor biomass growth as well as shear to reduce cakeformation at membrane surface. The bioreactors were putinto a water bath to control the temperature at 258C. Themembrane permeate was continuously removed by aperistaltic pump under a constant flux (25L/m2/h), con-stantly monitoring the transmembrane pressure (TMP)build-up which indicates the extent of membrane fouling.The operation was stopped when the TMP reached 26 kPabecause it was difficult to maintain the flux at constant levelat TMP of over 26 kPa.
The feeding flow rate of synthetic wastewater was 15L/d.The constant permeate flux was 25.0L/m2/h, which is equalto the permeate flow rate of 40.4L/d with the membranesurface area of 0.0673m2. Thus approximately 63% (25.4L/d)of the permeate was returned to the reactor in order to keepthe reactor volume constant. It was necessary to operate thesystems at a comparably higher permeate flux than usual tosee the effect of each experimental parameter on the systemperformance in a limited time in the laboratory. However,the permeate recycle to the reactor does not seem to affect
the microbial conditions because the permeate originatesfrom the reactor.
The membrane flux was calculated using an on-linecomputer connected to an electronic balance. All electricdevices were connected to programmable logic controller(PLC, Master K10S, LG Industrial System, Korea) toautomatically control the whole system. For attachedgrowth (Fig. 2(a)), looped cord media (BioMatrix Technol-ogies Inc., USA) of which the total surface area was 4.37m2
was immersed into the reactor at least for a month withcontinuous feeding of the wastewater prior to the operationof microfiltration. For suspended growth (Fig. 2(b)), all theexperimental setup and operating conditions are exactlysame as those with attached growth except the eliminationof the looped cord media from the bioreactor.
The stock of synthetic wastewater was stored in arefrigerator and diluted with tap water before feeding. Thecomposition of synthetic wastewater fed to the reactor isshown in Table 2. The main sources of carbon and nitrogenwere glucose and ammonium sulfate, respectively. The ratioof COD:N:P in the feed was maintained at 100 : 10 : 1 withan influent COD concentration of 250mg/L. Sodiumbicarbonate was added as a buffer in order to control thepH of the mixed liquor in the range of 6.8–7.2.
Analytical methods
Mixed liquor suspended solids (MLSS) was measuredaccording to the analytical methods described in the
Fig. 1. Schematics of a submerged membrane bioreactor.
Table 1. Operating conditions of submerged membrane bioreactorsfor both attached and suspended growth systems
Constant flux (L/m2/h) 25Maximum transmembrane pressure (kPa) 26Temperature (8C) 25Air flow rate (L/min) 2.5Working volume (L) 5HRT (h) 8Feed concentration (mgCOD/L) 250Volumetric organic loading (kgCOD/m3/day) 0.75PH 7.0� 0.2DO (mgO2/L) 6.1� 0.1
Jungmin Lee et al.2436

Standard methods (APHA, 1995). Mixed liquor pH wasmeasured with a pH meter (Dong woo Medical System,Korea) and dissolved oxygen with a DO meter (58, YSI,USA). Chemical oxygen demand (COD) was determined byspectrophotometric method with DR 2000 (Hach, USA)instrument and total organic carbon (TOC) by TOCanalyzer DC-180 (Rosemount, USA). Nitrate and ammo-nium concentrations were measured using ion selectiveelectrodes and an autotitrator (Orion 940, USA).
To measure the amount of attached biomass on loopedcord media, a sample of media was saturated with water atthe start of the experiment, allowed to drip dry for 3minand dried at 1058C to measure the mass of the media. Everytwo days media samples were pulled from the reactor one byone to measure any change of the amount of biomassattached.
Protein and polysaccharide were analyzed by spectro-photometric methods; Dye-binding method was applied forprotein analysis with Coomassie Brilliant Blue andBSA (bovine serum albumin) as a dye and a standard,respectively (Holme and Pect, 1983). For quantitativeanalysis of polysaccharide, the phenol–sulfuric acid methodwas used with glucose as a standard (Dubois et al., 1956).The molecular weight distribution of soluble organics wasmeasured with gel permeation chromatography (GPC,Waters, USA). Polyethyleneoxide (SE-150, Tosoh, Japan)was used as a standard. Refractive index detector (RID,Waters R401, USA) and Shodex-Ohpak KB 802, 803columns were used.
The cake layers of mixed liquor in the attached andsuspended growth systems were visualized by scanningelectron microscope (SEM) (JSM-35, JEOL, Japan) and anatomic force microscope (AFM) (Dimension 3000, DigitalInstruments).
Characterization of major components of soluble organics
The oxidation states of organic molecules vary accordingto their chemical structures. Therefore, if the oxidation stateof organic carbon is determined, rough estimation of themain substances in the sample solution could be made. IfCOD is expressed in mol O2/L and TOC in mol C/L, the‘‘average’’ oxidation state of the organic carbon present canbe obtained from equation (1) (Stumm and Morgan, 1981).
Oxidation state of organic carbon ¼ 4ðTOC� CODÞTOC
ð1Þ
In this context, soluble organics in the mixed liquor andon the membrane surface after filtration run were char-acterized by analyzing their oxidation states of organiccarbons. Soluble organics in the mixed liquor was obtainedwith the centrifugation of the mixed liquor at 2000g for10min and then second centrifugation of the supernatant at10; 000g for another 10min was given to completely removemicrobial flocs and colloidal particles. The final supernatantwas analyzed for the characterization of soluble organics inthe mixed liquor. To analyze the organic substances on themembrane surface after filtration run, the membranes wereplaced in phosphate buffer solution and sonicated for30min. The buffer solution after sonication was centrifugedin the same way as described above. The final supernatantcontaining organic solutes was analyzed in terms of CODand TOC to calculate the mean oxidation state of organiccarbon using equation (1).
Batch stirred cell filtration
In order to examine the characteristics of the cake on themembrane surface, batch filtration experiments were per-formed in dead-end filtration mode using stirred cell unit(Amicon 8200, USA). Hydrophilic PVDF (polyvinylidenedifluoride) membrane with 0.22mm pore (GVWP, MilliporeCorp.) was used. The membrane surface area was 30 cm2
and the operating pressure ranged from 10 to 110 kPa.Specific cake resistances were measured under unstirredconditions.
Fig. 2. Submerged MBR: (a) attached growth (MLSS: 100–2000mg/L, attached biomass: 2000mg/L) and(b) suspended growth (MLSS: 3000mg/L) microorganisms.
Table 2. Composition of synthetic wastewater
Composition Concentration (mg/L)
C6H12O6 114C5H8NNaO4H2O 48.7(NH4)2SO4 56.7CH3COONH4 37.7NH4Cl 5.67KH2PO4 5.00K2HPO4 7.00MgSO4�7H2O 9.02FeCl3�6H2O 0.21NaCl 6.77CaCl2�2H2O 0.60NaHCO3 150
Permeability vs. growth pattern in submerged MBR 2437

The specific cake resistance was calculated using the slopeof the plot of 1=J2 vs. t from equation (2) and thecompressibility of the cake layer was determined usingequation (3) (Chudacek and Fane, 1984)
1
J2¼ Rmm
DP
� �2
þ 2mCbaDP
t ð2Þ
a ¼ a0DPn ð3Þwhere J is the permeate flux, Rm is membrane resistance, m isthe viscosity of permeate, DP is the operating pressure, Cb isthe MLSS concentration, a is the specific cake resistance, t isfiltration time, a0 is the specific cake constant, and n is thecompressibility of the cake layer.
Resistance analysis
According to the resistance-in-series model the relation-ship between permeate flux and TMP can be given by(Choo and Lee, 1996a)
J ¼ DPmRt
ð4Þ
Rt ¼ Rm þ Rc þ Rf ð5Þwhere J is the permeate flux, DP is TMP, m is the viscosity ofthe permeate, and Rt is total membrane resistance, Rm is theintrinsic membrane resistance, Rc is the cake resistance, andRf is the fouling resistance due to irreversible adsorptionand pore plugging.
Flux and TMP data are used to calculate resistances byequation (4); filtration of pure water with new membranebefore operation gives Rm and Rt is calculated from the finalflux and TMP values at the end of the operation. Rm þ Rf
is measured after removing the cake layer by washingthe membrane with tap water after the operation followedby filtration of pure water. From these values each ofRt; Rm; Rc, and Rf can be obtained using equation (5).
RESULTS AND DISCUSSION
The performance of MBR processes were studiedusing submerged hollow fiber membranes. Suction-type of microfiltration of the mixed liquor for the
attached growth (Fig. 2(a)) and suspended growth(Fig. 2(b)) systems were carried out, respectively, inorder to compare each other in terms of filtration
characteristics and quality of treated water. Attemptswere then made to find out factors affecting differentfiltration characteristics between the two.
Treatment efficiency
The submerged MBR system was operated at HRTof 8 h along with almost complete rejection ofmicroorganisms for both systems. COD, NH4–N,
and NO3–N concentrations in the permeate were
monitored together with TMP variations during thesystem operation. In both systems, over 98%removal of COD and 95% removal of NH4–N(Table 3) were achieved with the synthetic wastewater
containing 250mgCOD/L and 20.2mgNH4–N/L,showing that the treatment efficiency was in excellentlevels irrespective of growth conditions.
Filtration characteristics
The increase rate of TMP is an important factor to
evaluate the system performance in submerged MBRbecause it is directly related to the rate of membranefouling.
The MLSS concentration in the suspended growthreactor was 3000mg/L. On the other hand, theattached growth reactor contained only 100mg/L of
MLSS while 2000mg/L of biomass were attached onthe looped cord media. It was practically impossibleto maintain MLSS concentration less than 100mg/L
even in the attached growth reactor because releaseof microorganisms off the cord media to the mixedliquor was inevitable. TMP was monitored underconstant flux condition, and the operation was
stopped when the TMP reached 26 kPa. In case ofsuspended growth system the TMP increased to26 kPa after about 140 h of operation, while it took
only 20 h for the attached growth system (Fig. 3). Inother words, the increase rate of the TMP forattached growth was surprisingly 7 times higher than
that for the suspended growth system. The attachedgrowth system was originally designed to alleviatemembrane fouling by removing the sources of cake
Fig. 3. Variations of suction pressure during the submergedMBR operation of attached growth (MLSS: 100mg/L,attached biomass: 2000mg/L) and suspended growth
(MLSS: 3000mg/L).
Table 3. COD and ammonia removal efficiency in attached and suspended growth MBR
COD (mg/L) NH4+–N (mg/L)
Influent 250 20.2 (TN 23.9)Attached growtha Suspended growthb Attached growtha Suspended growthb
Permeate 3 5 0.99 0.17% removal 99 98 95 99
aMLSS: 100mg/L, attached biomass: 2000mg/L.bMLSS: 3000mg/L.
Jungmin Lee et al.2438
layer, i.e. suspended solids and colloidal particles.
However, contrary to expectations, membrane foul-ing proceeded much faster with the attached growthsystem than with the suspended growth although thelatter had suspended solids 30 times higher than the
former.Other operating conditions being equal, the extent
of fouling was believed to vary according to the
mixed liquor composition in the bioreactor becausemembrane fouling should be the result of interactionbetween the mixed liquor and the membrane. The
components of mixed liquor may be divided into twogroups: (1) soluble fraction and (2) suspended solidsincluding biomass and other colloids. Although the
attached growth system was designed to minimize theeffect of the latter, i.e. suspended solids, on mem-brane fouling, faster membrane fouling was observedwith attached growth than that with suspended
growth. In this context, soluble fraction, not sus-pended portion was thought to be more responsiblefor the membrane fouling in MBR. Consequently,
comparison of soluble fraction of mixed liquorbetween the attached and suspended growth wasmade in order to explain such unexpected filtration
characteristics.
Comparison of soluble organic compounds in mixed
liquor
A bioreactor like an activated sludge tank containsa variety of soluble organic compounds, such as
residual influent substrate and soluble microbialproducts (SMP). The term SMP has been adoptedto define the pool of organic compounds that are
released into bulk solution from substrate metabo-lism (usually with biomass growth) and biomassdecay (Barker and Stuckey, 1999). Soluble com-
pounds have been also reported to have largerfouling ability than suspended solids due to theirinteraction with the membrane material (Bouhabila
et al., 1998; Wisniewski and Grasmick, 1998).Therefore, it might be suggested that the mixedliquors in the attached and suspended growth shouldcontain different soluble compounds from each
other, which would lead to different filtrationbehavior. Several features such as (i) molecularweight distribution, (ii) organic contents, and (iii)
oxidation state of organic carbons in the mixedliquor for both attached and suspended growthreactor were examined.
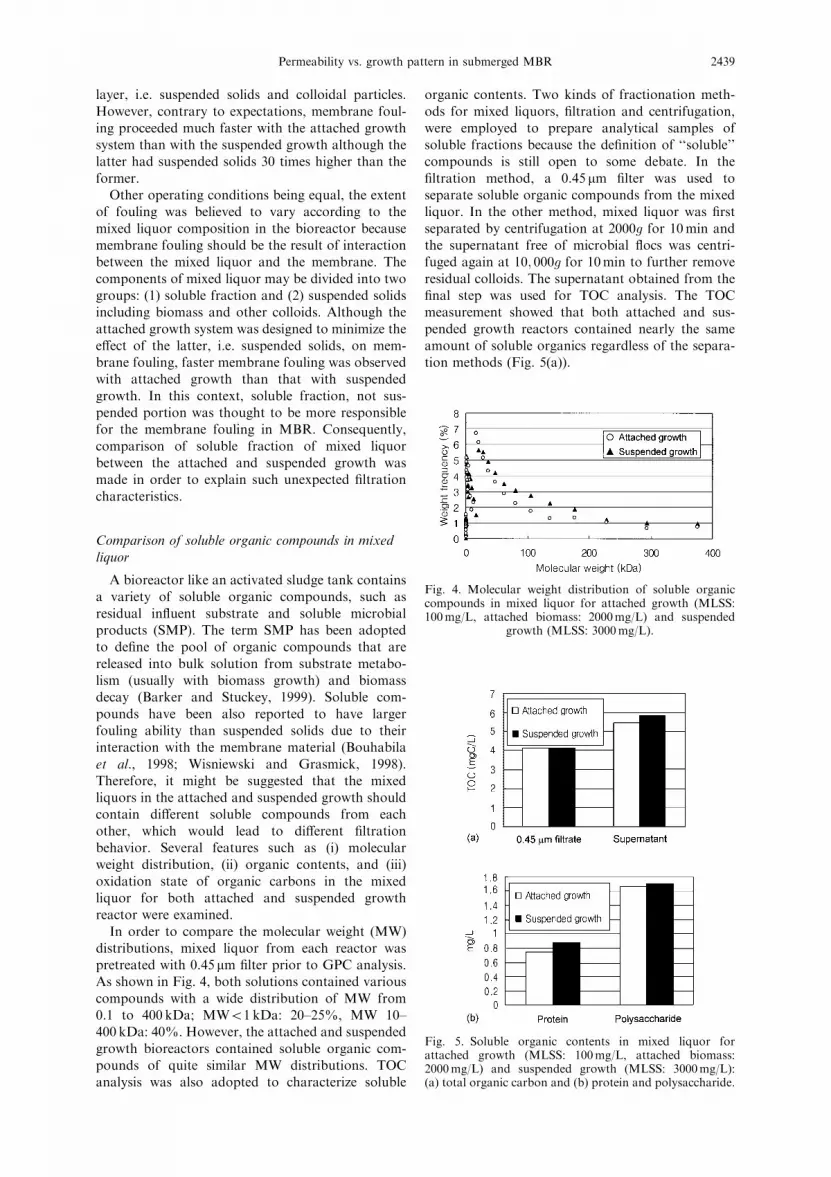
In order to compare the molecular weight (MW)distributions, mixed liquor from each reactor waspretreated with 0.45mm filter prior to GPC analysis.As shown in Fig. 4, both solutions contained various
compounds with a wide distribution of MW from0.1 to 400 kDa; MW51 kDa: 20–25%, MW 10–400 kDa: 40%. However, the attached and suspended
growth bioreactors contained soluble organic com-pounds of quite similar MW distributions. TOCanalysis was also adopted to characterize soluble
organic contents. Two kinds of fractionation meth-
ods for mixed liquors, filtration and centrifugation,were employed to prepare analytical samples ofsoluble fractions because the definition of ‘‘soluble’’compounds is still open to some debate. In the
filtration method, a 0.45 mm filter was used toseparate soluble organic compounds from the mixedliquor. In the other method, mixed liquor was first
separated by centrifugation at 2000g for 10min andthe supernatant free of microbial flocs was centri-fuged again at 10; 000g for 10min to further remove
residual colloids. The supernatant obtained from thefinal step was used for TOC analysis. The TOCmeasurement showed that both attached and sus-
pended growth reactors contained nearly the sameamount of soluble organics regardless of the separa-tion methods (Fig. 5(a)).
Fig. 4. Molecular weight distribution of soluble organiccompounds in mixed liquor for attached growth (MLSS:100mg/L, attached biomass: 2000mg/L) and suspended
growth (MLSS: 3000mg/L).
Fig. 5. Soluble organic contents in mixed liquor forattached growth (MLSS: 100mg/L, attached biomass:2000mg/L) and suspended growth (MLSS: 3000mg/L):(a) total organic carbon and (b) protein and polysaccharide.
Permeability vs. growth pattern in submerged MBR 2439

EPS are soluble organic macromolecules that are a
major fraction of soluble microbial products due tometabolism and cell autolysis (Wingender et al.,1999). The quantitative analysis of EPS was per-formed because EPS have been reported not only as
major sludge floc components keeping the floctogether in a three-dimensional matrix, but also askey membrane foulants in MBR system (Nagaoka
et al., 1996). In this study, protein and polysaccharideconcentrations were measured as they are known tobe the main constituents of EPS. Protein and
polysaccharide contents of soluble EPS in suspendedgrowth reactor were slightly larger than those in theattached growth reactor (Fig. 5(b)). However, the
difference in protein and polysaccharide quantity aswell as their absolute concentrations (less than 1.0and 1.8mg/L each) was not so significant that itcould be concluded that both systems contained
similar species and quantities of EPS though theywere in different growth conditions.From the COD and TOC measurements the
mean oxidation states of soluble organic carbons inattached and suspended growth reactors were calcu-lated based on equation (1) and summarized in
Table 4. Based on the calculated mean oxidationstates, main constituents of organic compounds wereroughly estimated according to Stumm and Morgan
(1981). The mean oxidation states of 2–3 of organicsin the mixed liquor corresponds to organic acids,suggesting that the major components for bothsystems had carbons in the form of organic acids
which might be metabolic by-products or end-products of biodegradation. By contrast, as the meanoxidation states (�0.8 to �1.2) represents proteins
and polysaccharides, they were presumed to be themajor components of organic substances accumu-lated on the membrane surface, possibly due to
their hydrophobic interactions with the membrane.Anyway, as the mean oxidation states of organicsfor both systems appeared to be almost the samein the mixed liquors as well as on the membrane
surface it could be concluded that quantitativeand qualitative characteristics of the solubleorganic fractions in the mixed liquors did not vary
according to the growth conditions. In summary,based on the series of examinations describedabove, the different filtration performance between
two systems could not be attributed to the organicfractions in the mixed liquors. Consequently, wereturned to the starting point and paid deeper
attention to the suspended fraction instead of thesoluble one.
Mixed liquor suspended solids
One of the clearest distinctions between attachedand suspended growth systems should be the MLSS
concentrations: the attached growth reactor con-tained only about 100mgMLSS/L which corre-sponded to only 3.3% of the MLSS in the
Table
4.Meanoxidationstate
oforganic
carbons
Attached
growth
reactora
Suspended
growth
reactorb
Origin
oforganics
COD
c /TOCd
Meanoxidationstate
ofcarbon
Estim
ationofmain
constituents
COD
c /TOCd
Meanoxidationstate
ofcarbon
Estim
ationofmain
constituents
Mixed
liquor
0.23
3.08
Organic
acid
0.46
2.16
Organic
acid
Mem
branesurface
after
filtrationrun
1.21
�0.84
Protein
orpolysaccharide
1.31
�1.24
Protein
orpolysaccharide
aMLSS:100mg/L,attached
biomass:2000mg/L.
bMLSS:3000mg/L.
cCOD
expressed
inmolO
2/L.
dTOC
expressed
inmolC/L.
Jungmin Lee et al.2440

suspended growth reactor (3000mgMLSS/L). It was
presumed that such difference might have broughtabout different filtration performance. In this con-text, further microfiltration experiments were carriedout changing the MLSS concentrations in both
attached and suspended growth systems in order tofind out the effect of MLSS concentration onmicrofiltration characteristics. In all experiments,
the attached growth reactor retained additional2000mg/L of biomass attached on the looped cordmedia immersed in the bioreactor. The MLSS
concentration for the attached growth changed from100 to 2000mg/L, whereas it changed from 2000 to5000mg/L for the suspended growth system. The
change in MLSS concentration was achieved byadjusting the sludge retention time (SRT) in thereactor without additional biomass input. MLSS wasincreased with increase in SRT. When MLSS reached
the intended concentration, additional 2–3 times theSRT were required to achieve stable sludge conditionprior to the filtration experiment. As shown in Fig. 6,
the rate of membrane permeability loss (e.g., therising rate of TMP) was retarded along with theincrease in MLSS concentrations regardless of
growth conditions, e.g., the higher the MLSSconcentration, the slower the rising rate of TMP.For example, in the suspended growth system it took
75 h for TMP to reach 26 kPa at the MLSS of2000mg/L, whereas it took 260 h at the MLSSof 5000mg/L. It was particularly interesting,however, that at the same MLSS concentration
of 2000mg/L, the two systems gave rise to almostthe same filtration behavior; TMP reached 26 kPaafter the almost same filtration time for both systems
(70 and 75 h for attached and suspended growthsystem, respectively). From these experimental re-sults, MLSS was thought to have been mainly
responsible for the unexpected better filtrationperformance of the suspended growth system thanthat of the attached one.
Formation of a dynamic membrane by mixed liquor
suspended solids
Suspended solids could be an important factoraffecting membrane permeability because the sus-
pended solids, mainly microbial flocs, in MBR couldform a dynamic membrane on the surface ofmembrane. The conceptual illustration of dynamic
membrane is shown in Fig. 7. Small particles likesoluble organics will deteriorate the permeability ofmembrane by directly adsorbing onto the surface or
inside the membrane pores when arriving at themembrane without any interruption (Fig. 7(a)).However, when large particles like microbial flocs
are present (Fig. 7(b)), the deposit layer of micro-organisms will accumulate on the membrane surfacewhich is known as a dynamically formed membrane(Shoji et al., 1990; Holdich and Boston, 1990).
Because low molecular weight substances or sub-micron colloidal particles could be rejected/sorbedand biodegraded by the dynamic membrane com-
posed of living microorganisms (Yamagiwa et al.,1995), the dynamic membrane would provide smallmolecules with fewer chances of interaction with
membranes and thereby alleviate the rate of mem-brane fouling. Also, the dynamic membrane may beremoved from the membrane by the tangential air–liquid flow to the membrane surface because aeration
was provided continuously in MBR. Repeatedprocesses of formation and removal of dynamicmembranes may slow down the loss of membrane
permeability. However, it may be worth noting thataeration in submerged MBR may have some negativeeffects on membrane permeability because soluble or
submicron particles can directly adsorb inside andblock the membrane pores if dynamic membrane isremoved by the tangential air–liquid flow.
Fig. 6. Filtration behaviors with varying MLSS concentra-tion in attached and suspended growth bioreactor.
Fig. 7. Conceptual illustration of membrane fouling (a)without and (b) with dynamic membrane.
Permeability vs. growth pattern in submerged MBR 2441

To prove the existence of dynamic membrane,
the SEM images of membrane surfaces were inves-tigated after filtration runs for attached and sus-pended growth systems. The membrane pores of anew membrane were clearly seen on the SEM
image (Fig. 8(a)). While the surface of the membraneused for the suspended growth (MLSS: 3000mg/L)reactor was covered with the microbial flocs and
EPS layers (Fig. 8(b)), the membrane surface used
for the attached growth (MLSS: 100mg/L, attachedbiomass: 2000mg/L) system was covered withsome slime or gel layers (Fig. 8(c)), but not sosignificantly as that of the suspended system. AFM
images provide some information on the roughnessof the cake layer in each system. As shown in Fig. 9,the cake layer in the suspended growth was
Fig. 9. AFM images of cake layer on membrane surfaces after filtration run: (a) used membrane forsuspended growth (MLSS: 3000mg/L) and (b) used membrane for attached growth (MLSS: 100mg/L,
attached biomass: 2000mg/L). a: root mean square.
Fig. 8. SEM images of cake layer on membrane surfaces after filtration run: (a) new membrane (� 5,000),(b) used membrane for suspended growth (MLSS: 3000mg/L,� 5,000), and (c) used membrane for
attached growth (MLSS: 100mg/L, attached biomass: 2000mg/L,� 5,500).
Jungmin Lee et al.2442

reconfirmed to be rougher than that in the attached
one as could be expected from the SEM images,comparing the standard deviation of the height ofeach cake layer.
Resistance analysis
In this study, the attached growth system wasoriginally designed in order to reduce the cake layer
resistance (Rc) which has been known as a majorcontributor to the total resistance (Rt) (Chiemchaisriand Yamamoto, 1994; Choo and Lee, 1996a,b;Chang and Lee, 1998; Kim et al., 1998; Chang
et al., 1999; Lee, 1999; Park et al., 1999). Resistanceanalysis was performed after filtration run in orderto confirm any changes in various resistances by
introducing attached growth system (Table 5).Rm;Rc, and Rf were measured right after the TMPreached 26 kPa. It took 20 h for attached (MLSS:
100mg/L, attached biomass: 2000mg/L) and 140 hfor suspended (MLSS: 3000mg/L) growth to reachthis TMP. In other words, the same total resistance
was obtained about 7 times faster with attachedgrowth compared with suspended growth. Smalldecrement in Rc was observed in attached growthsystem compared to suspended growth, but still Rc
held a large part of Rt. However, decrease in Rc wascompensated with an increase in fouling resistance(Rf ), which eventually led to severer loss of per-
meability in the attached growth system. Theseresults revealed that soluble or colloidal particles aswell as microorganisms in the mixed liquor could
accumulate and form a secondary dynamic mem-
brane on the surface of membrane, but without this
the internal fouling would be severer. This is thereason why the Rf value in the attached growthsystem is greater than that in the suspended one.
Properties of cake layer on membrane surface
Specific cake resistance is a parameter characteriz-ing the cake layer formed on the membrane surface
during filtration. Unstirred cell filtration was carriedout to determine the specific cake resistances of cakelayers in both attached and suspended growthsystem. The specific cake resistance (a) and the
compressibility (n) of the cake layers were analyzedby changing the operating pressure in the range of14–109 kPa and using equations (2) and (3). As
shown in Fig. 10, the specific cake resistances in theattached growth (MLSS: 100mg/L, attached bio-mass: 2000mg/L) was one order of magnitude higher
than that of mixed liquor in the suspended growth(MLSS: 3000mg/L) through all the pressures tested.The compressibility of mixed liquor for attached
(MLSS: 100mg/L, attached biomass: 2000mg/L) andsuspended (MLSS: 3000mg/L) growth were 0.79 and1.08, respectively, indicating that the mixed liquorof suspended growth was more compressible than
that of attached growth. As the cake layer in thesuspended growth system contains more microorgan-isms, it may have higher compressibility. The low
concentration of suspended microorganisms in theattached growth system could induce a lowercompressibility of the cake layer. Also the AFM
image of the cake layer of each system revealed
Table 5. Effect of growth pattern on each resistance in the submerged MBRc
Attached growtha Suspended growthb
1012/m % 1012/m %
Rm 0.49 12 0.50 12Rc 2.94 69 3.39 80Rf 0.81 19 0.35 8
Rt 4.24 100 4.24 100
aMLSS: 100mg/L, attached biomass: 2000mg/L.bMLSS: 3000mg/L.cRm; Rc, and Rf were measured right after the TMP reached 26 kPa. It took 20 h for attached and 140 h for suspended growth to obtain the
same total resistance of 4.24� 1012/m.
Fig. 10. Specific cake resistances of mixed liquors for attached and suspended growth.
Permeability vs. growth pattern in submerged MBR 2443

rougher cake layer for the suspended growth system,
which implicates loose packing of the particles andthus providing larger channels for the permeate flow(Fig. 9). These suggested that the mixed liquor ofattached growth would have a higher fouling
potential compared with that of suspended growth.However, when MLSS of 2000mg/L existed in bothattached and suspended growth reactors, little
difference in both specific cake resistance andcompressibility was observed demonstrating similarcake properties. It was a well expected result judging
from the similar filtration behavior at the sameMLSS concentration (Fig. 6).
CONCLUSIONS
In this study, two types of submerged MBR(attached and suspended growth systems) werecompared with respect to various aspects in order
to elucidate different filtration behavior from eachother. The following conclusions could be drawn:
(1) The loss of membrane permeability proceeded
more rapidly with the attached growth systemthan with the suspended one.
(2) Better filtration performance with suspended
growth was attributed to the role of dynamicmembrane formed on the membrane surface,which was confirmed by SEM and AFM images.
This conclusion was drawn based on (i) thequantitatively and qualitatively similar proper-ties of soluble organic compounds in mixed
liquors for both systems and (ii) the improve-ment of membrane permeability with increasingin MLSS concentrations regardless of growthconditions.
(3) Better filtrability with the suspended growthcould also be due to the rougher cake layerhaving smaller specific cake resistance than that
with the attached growth.
Acknowledgements}The authors would like to thank theKorean Ministry of Science & Technology for their financialsupport under Grant 98-1-01-04-A-021. Mitsubishi RayonCo. Ltd., Japan, is acknowledged for providing the hollowfiber membranes and BioMatrix Technologies Inc., USA,for the looped cord media.
REFERENCES
APHA (1995) Standards Methods for the Examination ofWater and Wastewater, 19th ed. American Public HealthAssociation, Washington DC.
Arnot T. C. and Zahir N. (1996) Membrane bioreactors asan alternative to conventional waste water treatmentprocesses. Resour. Environ. Biotechnol. 1, 145–162.
Barker D. J. and Stuckey D. C. (1999) A review of solublemicrobial products (SMP) in wastewater treatmentsystems. Water Res. 33(14), 3063–3082.
Bouhabila E. H., Ben Aim R. and Buisson H. (1998)Microfiltration of activated sludge using submerged
membrane with air bubbling (application to wastewatertreatment). Desalination 118, 315–322.
Chang I. S. and Lee C. H. (1998) Membrane filtrationcharacteristics in membrane coupled activated sludgesystem}the effect of physiological states of activatedsludge on membrane fouling. Desalination 120, 221–233.
Chang I. S., Lee C. H. and Ahn K. H. (1999) Membranefiltration characteristics in membrane coupled activatedsludge system: the effect of floc structure on membranefouling. Sep. Sci. Technol. 34(9), 1743–1758.
Chiemchaisri C. and Yamamoto K. (1994) Performance ofmembrane separation bioreactor at various temperaturesfor domestic wastewater treatment. J. Memb. Sci. 87,119–129.
Chiemchaisri C., Yamamoto K. and Vigneswaran S. (1993)Household membrane bioreactor for domestic waste-water treatment. Water Sci. Technol. 27(1), 171–178.
Choo K. H. and Lee C. H. (1996a) Membrane foulingmechanisms in the membrane-coupled anaerobic bio-reactor. Water Res. 30(8), 1771–1780.
Choo K. H. and Lee C. H. (1996b) Effect of anaerobicdigestion broth composition on membrane permeability.Water Sci. Technol. 34(9), 173–179.
Chudacek M. W. and Fane A. G. (1984) The dynamics ofpolarization in unstirred and stirred ultrafiltration.J. Memb. Sci. 21, 145–160.
Cote P. and Buisson H. (1997) Immersed membraneactivated sludge for the reuse of municiple wastewater.Desalination 113(2–3), 189–196.
Dubois M., Gilles K. A., Hamilton J. K., Rebers P. A. andSmith F. (1956) Colorimetric method for determinationof sugars and related substances. Anal. Chem. 28,350–356.
Holdich R. G. and Boston J. S. (1990) Microfiltration usinga dynamically formed membrane. Filtration Sep. May/June, 184–187.
Holme D. J. and Pect H. (1983) Analytical Biochemistry,pp. 395–396. Longman, New York.
Howell J. A. (1994) Is clean technology the future. Presentedat Engineering of membrane processes II, Il Cicocco, Italy,April 26–28.
Ishida H., Yamata Y., Tsuboi M. and Matsumura S. (1993)Kubota submerged activated sludge process (KSMAS-P)}Its application into activated sludge process withhigh concentration of MLSS. Presented at the Interna-tional Congress on Membranes and Membrane Processes(ICOM’93). Heidelberg, August 30–September 3.
Kim J. S., Lee C. H. and Chun H. D. (1998) Comparison ofultrafiltration characteristics between activated sludgeand bac sludge. Water Res. 32(11), 3443–3451.
Lee J. C. (1999) Effect of alum and zeolite addition onthe performance of the submerged membrane bio-reactor. Master Thesis, Seoul National University,Seoul, Korea.
Lee S. J., Choo K. H. and Lee C. H. (2000) Conjunctiveuse of ultrafiltration with powdered activated carbon ad-sorption for removal of synthetic and natural organicmatter. J. of Industrial and Engineering Chemistry 6(6),357–364.
Nagaoka H., Ueda S. and Miya A. (1996) Influence ofbacterial extracellular polymers on the membrane separa-tion activated sludge process. Water Sci. Technol. 34(9),165–172.
Park H., Choo K. H. and Lee C. H. (1999) Fluxenhancement with powdered activated carbon additionin the membrane anaerobic bioreactor. Sep. Sci. Technol.34(14), 2781–2792.
Shoji T., Nakajima M., Nabetani H., Ohtani T. andWatanabe A. (1990) Effect of pore size of ceramicsupport on the self-rejection characteristics of thedynamic membrane formed with water soluble proteinsin wastewater. Nippon Nogeikagaku Kaishi 62(7),1055–1060.
Jungmin Lee et al.2444

Stumm W. and Morgan J. J. (1981) Aquatic Chemistry,2nd ed., pp. 510–511. John Wiley & Sons, New York.
Wingender J., Neu T. R and Flemming H.-C. (1999)Microbial Extracellular Polymeric Substances}Charac-terization, Structure and Function. Springer, Berlin.
Wisniewski C. and Grasmick A. (1998) Floc sizedistribution in a membrane bioreactor and conseq-
uences for membrane fouling. Colloids Surf. 138,403–411.
Yamagiwa K., Oohira Y. and Ohkawa A. (1995) Perfor-mance evaluation of a plunging liquid jet bioreactorwith crossflow filtration for small-scale treatmentof domestic wastewater. Bioresour. Technol. 50,131–138.
Permeability vs. growth pattern in submerged MBR 2445


