Embed Size (px)
Citation preview

Membranes 2012, 2, 228-236; doi:10.3390/membranes2020228
membranes ISSN 2077-0375
www.mdpi.com/journal/membranes
Article
Comparison of Polytetrafluoroethylene Flat-Sheet Membranes with Different Pore Sizes in Application to Submerged Membrane Bioreactor
Tadashi Nittami 1,*, Tetsuo Hitomi 1, Kanji Matsumoto 1, Kazuho Nakamura 1,
Takaharu Ikeda 2, Yoshihiro Setoguchi 2 and Manabu Motoori 2
1 Department of Chemical Engineering, Yokohama National University, 79-5 Tokiwadai,
Hodogaya-ku, Yokohama 240-8501, Japan; E-Mails: [email protected] (T.H.);
[email protected] (K.M.); [email protected] (K.N.) 2 Corporate Research Division, Nippon Valqua Industries, Ltd., 2-2-2 Oyamagaoka, Machida,
Tokyo 194-0215, Japan; E-Mails: [email protected] (T.I.); [email protected] (Y.S.);
[email protected] (M.M.)
* Author to whom correspondence should be addressed; E-Mail: [email protected];
Tel./Fax: +81-45-339-4006.
Received: 24 April 2012; in revised form: 25 May 2012 / Accepted: 29 May 2012 /
Published: 1 June 2012
Abstract: This study focused on phase separation of activated sludge mixed liquor by
flat-sheet membranes of polytetrafluoroethylene (PTFE). A 20 liter working volume
lab-scale MBR incorporating immersed PTFE flat-sheet membrane modules with different
pore sizes (0.3, 0.5 and 1.0 μm) was operated for 19 days treating a synthetic wastewater.
The experiment was interrupted twice at days 5 and 13 when the modules were removed
and cleaned physically and chemically in sequence. The pure water permeate flux of each
membrane module was measured before and after each cleaning step to calculate
membrane resistances. Results showed that fouling of membrane modules with 0.3 μm
pore size was more rapid than other membrane modules with different pore sizes (0.5 and
1.0 μm). On the other hand, it was not clear whether fouling of the 0.5 μm membrane
module was more severe than that of the 1.0 μm membrane module. This was partly because
of the membrane condition after chemical cleaning, which seemed to determine the fouling
of those modules over the next period. When irreversible resistance (Ri) i.e., differences in
membrane resistance before use and after chemical cleaning was high, the transmembrane
pressure increased quickly during the next period irrespective of membrane pore size.
OPEN ACCESS

Membranes 2012, 2 229
Keywords: activated sludge; flat-sheet membrane module; membrane bioreactors;
polytetrafluoroethylene (PTFE); wastewater treatment
1. Introduction
Membrane bioreactors (MBRs) have been used increasingly in wastewater treatment to minimize
solid phase–liquid phase separation problems often encountered in conventional activated sludge
clarifiers [1]. MBR systems also have the advantage of operating at high mixed liquid suspended solids
(MLSS) concentrations, generating a lower excess sludge production, and the treated water can be
reused [2]. In addition, biological nutrient removal (BNR) processes with MBR can be attractive
because the plant footprint is reduced from the absence of settling tanks [1]. However, membrane
fouling is a major problem in MBR systems. It affects negatively the permeability of the membrane
and results in increasing operation and maintenance costs, which has become one of the most
important factors hindering the widespread application of MBRs [3,4]. A severely fouled membrane
must be cleaned with chemical reagents [5]. Therefore, membranes for MBR application should
possess a low fouling-propensity to maintain a high permeate flux, and a high durability from exposure
to the chemicals used for cleaning them.
Membrane fouling is affected by interactions between the membrane and mixed liquor; hence
membrane characteristics, such as membrane material, pore size and hydrophobicity, are important
factors [6]. Previous experiments using polymeric membranes have revealed a close relationship
between membrane material type and fouling [5]. However, little information is available on the
impact of polymeric membrane materials on membrane fouling in MBRs [6,7]. In particular, although
polytetrafluoroethylene (PTFE) is being used increasingly for membrane construction in MBRs [6,8,9],
few studies have focused on their performance characteristics.
PTFE has several attractive features including a higher chemical resistance, heat resistance and
porosity, compared to other membrane materials like polyethylene and polyvinylidene fluoride. Thus,
the properties of flat-sheet microfiltration membranes made from PTFE were examined in this study.
Symmetrical hydrophobic PTFE flat-sheet membrane modules were used in a lab-scale submerged
MBR to understand how their pore size might influence filtration performance.
2. Experimental Section
2.1. Membrane Characteristics and Experimental MBR Set-Up
Characteristics of symmetrical hydrophobic PTFE flat-sheet membrane with three different pore
sizes (0.3, 0.5 and 1.0 μm) used here are listed in Table 1. The PTFE flat-sheet membranes were
laminated with polypropylene (PP) and then attached to both sides of the membrane modules (Figure 1).
Total membrane surface area of the membrane module was 0.029 m2 (0.12 m × 0.12 m × 2 sides). A
lab-scale MBR (L × W × H = 0.4 m × 0.1 m × 0.5 m) was configured with a 20 liter working volume of
a reactor tank incorporating four immersed PTFE flat-sheet membrane modules. The filtrate was
recovered with a roller pump with a suction mode of 9-min-on and 1-min-off and was returned into the

Membranes 2012, 2 230
reaction tank. Constant filtrate flux (1.4 ± 0.2 m d−1) was maintained by adjustment of the pump
rotation rate. The transmembrane pressure (TMP) generated by filtration was measured periodically
with pressure gages (AP-51A, Keyence, Osaka, Japan) to investigate the influence of membrane pore
size on membrane fouling. The air for washing the membrane surface was supplied continuously at
2 L min−1 from a diffuser located directly below the membrane module.
Table 1. Characteristics of the polytetrafluoroethylene (PTFE) membranes in this study.
Nominal pore size [μm]
Pore size range [μm] a
Contact angle [°]
Membrane thickness [μm]
Pore morphology
Surface porosity [%]
0.3 0.2–0.4 135 25 ± 10 symmetric 85 0.5 0.4–0.7 135 15 ± 10 symmetric 88 1.0 0.7–1.3 135 10 ± 10 symmetric 90
a Pore sizes were determined by the bubble point method according to ASTM F316-86 (1986) [10].
Figure 1. SEM images of PTFE membrane (pore size 0.5 μm) laminated with
polypropylene (PP) and its flat-sheet membrane module photo. (a) cross-section image with
filtration direction from top to bottom (1,000×); (b) surface image (5,000×); (c) membrane
module. Scale bars in Figure 1 a, b shows 50 μm and 10 μm respectively.
2.2. Synthetic Wastewater and Operational Conditions
The MBR was operated for 19 days incorporating immersed three new PTFE flat-sheet membrane
modules with pore sizes 0.3 μm, 0.5 μm and 1.0 μm (PTFE 0.3 μm, 0.5 μm and 1.0 μm (A)) and a used
PTFE membrane module with pore size 1.0 μm (PTFE 1.0 μm (B)) under room temperature (15–19 °C).
The pH was kept at 6.5–7.5 without control. A concentrated synthetic wastewater (SWW) was
prepared, which contained the following (g L−1): Glucose, 8.57; CH3COONa, 2.96; Bacto Peptone,
4.28; and KH2PO4, 0.396. The concentrated SWW was made up with milliQ water and sterilized by
autoclaving. The SWW was dosed at a constant flow of 0.286 L/day into the reactor tank with a micro
tube pump MP-3 (Eyela, Tokyo, Japan). Inoculum was obtained from a 40 L lab-scale batch reactor,
which was fed with the same SWW as above for over 10 years. The MBR tank volume was set at 18 L
at the beginning of operation and was then increased up to 20 L by adding 2 L of SWW a week. In this
study, all the filtrate was returned to the reactor tank, but 2 L of supernatant was withdrawn once a
week. Thus, the HRT was controlled at 63–70 days. SRT was uncontrolled with no wasting of the
biomass, and so the mixed liquor suspended solids (MLSS) level increased from 6500 to 8500 mg L−1.
The operation was interrupted twice at days 5 and 13 when the modules were removed from the MBR
and washed. Thus, the operational period was divided into three runs: Run 1 (day 0–5), Run 2

Membranes 2012, 2 231
(day 5–13), and Run 3 (day 13–19). Note that the membrane module PTFE 1.0 μm (B) was used
previously in the same MBR for eight days under the same operational conditions as above, except at a
different filtrate flux (0.7 ± 0.1 m d−1). It was washed physically and chemically after using as detailed
below before being used in this study.
2.3. Membrane Cleaning and Membrane Resistance Measurement
The membrane modules were washed sequentially as follows: physical cleaning by wiping surfaces
with a soft sponge and chemical cleaning by immersing modules in 2000 mg L−1 sodium hypochlorite
solution for >5 h. The pure water permeate flux of each membrane module was measured before use,
after each operation, and after each physical and chemical cleaning step, to calculate the hydraulic
resistance: R (m−1) by Equation (1). The differences in hydraulic resistance after operation and after
physical cleaning, after physical cleaning and after chemical cleaning, and before use and after
chemical cleaning, were defined as Rrp, Rrc, and Ri, respectively. The TMP (Pa) was measured with
pressure gauges (AP-51A, Keyence, Osaka, Japan). The permeate flow: J (m3 m2 h−1) was measured
periodically by collecting permeate into a measuring cylinder. The permeate viscosity: μ (Pa s) was
calculated by assigning the temperature of the activated sludge mixture: T (K) to Equation (2) [11].
TMP3600 (1)
exp 1 /1000
(2)
where A, B, C and D are 0.12571873 × 10⁻¹, −0.58064362 × 10⁻², 0.11309108 × 10⁻², and
−0.57239520 × 10⁻⁵, respectively.
2.4. Scanning Electron Microscope (SEM) Analysis
The surfaces of new PTFE membranes (pore sizes 0.3, 0.5 and 1.0 μm) were examined by SEM
(S-3400N, Hitachi High-Technologies, Japan) and their membrane modules were immersed in the
MBR under the same operational conditions as described above except for the filtrate flux
(0.7 ± 0.1 m d−1). Modules were washed physically and chemically when the TMP reached 20 kPa,
removed from the MBR after 30 days operation and then washed physically as above. These
membrane surfaces were also examined by SEM. All membrane samples were dried at 60 °C for 12 h
and then sputter-coated with Pt/Pd (80:20) before SEM observation.
2.5. Analytical Methods
The mixed liquor suspended solid (MLSS) of activated sludge mixture was measured according to
Standard Methods (1998) [12].

Membranes 2012, 2 232
3. Results and Discussion
3.1. Filtration Performance of Each Membrane Module
Figure 2 shows the changes in TMP of four membrane modules over 19 days. The increase in TMP
of membrane module PTFE 0.3 μm was more rapid than seen with the other membrane modules
(PTFE 0.5 μm and 1.0 μm (A, B)) during the first five days (Run 1). Therefore, the membrane module
PTFE 0.3 μm was removed and the MBR was operated subsequently without it. The increase of TMP
of membrane module PTFE 1.0 μm (A) was slower than seen with the membrane modules PTFE
0.5 μm and 1.0 μm (B) during Run 2, whereas membrane module PTFE 1.0 μm (B) fouled slower than
others during Run 3. Moreover, the increase of TMP of the membrane module PTFE 0.5 μm was
similar to that of the membrane module PTFE 1.0 μm (B) and (A) during Runs 2 and 3. These results
suggest that the 0.3 μm membrane had a remarkably high fouling propensity compared to the others,
although it was not clear whether fouling of the 0.5 μm membrane was more severe than that of the
1.0 μm membranes or whether the used 1.0 μm membrane (B) fouled more severely than the new
1.0 μm membrane (A).
Figure 2. Time course of transmembrane pressure (TMP) of each PTFE membrane module.
Van der Marel et al. [13] investigated the influence of membrane pore size on membrane fouling
using polymeric flat-sheet membranes with different properties from a pilot-scale MBR. They reported
that for reasons not explained, symmetric mixed cellulose ester (MCE) membranes with 0.8 μm pore
size had excellent performance criteria compared to membranes with 0.1, 1.8 and 2.7 μm pore sizes.
The MCE 0.8 μm membrane showed a much lower increase in initial membrane resistance with an
increase in flux of 5 to 100 L m−2 h−1 over 135 h operation. As mentioned above, the pore morphology
of the PTFE membranes used in this study was also symmetric. Membranes with 0.5 and 1.0 μm pore
sizes showed a similar performance to each other and an improved performance to the 0.3 μm pore size
membranes. This outcome would suggest that the optimum pore size for symmetrical membranes is
0.5–1.0 μm.

Membranes 2012, 2 233
3.2. Membrane Resistance of Each Module
The pure water permeate fluxes of each PTFE membrane module (0.5 and 1.0 μm pore size) at each
stage were measured and the hydraulic resistance: R (m−1) calculated (Figure 3). The R values are
shown as a scatter chart and the differences in R values as bar graphs in Figure 3. The R values of the
three modules showed different patterns during Run 1. This suggests that no correlation exists between
R values or their differences and increases in TMP during earlier membrane cleaning periods, since
TMP increases were very similar for all three pore sizes during Run 1 (Figure 2). However, the
R values differences and increases in TMP at the next period of membrane cleaning seemed to
correlate. The irreversible resistances, Ri, i.e., differences in membrane resistance before use and after
chemical cleaning, in membrane modules PTFE 1.0 μm (A) and (B) were clearly lower than those in
other modules after Run 1 and Run 2 respectively. As mentioned above, increases in the TMP of
membrane modules PTFE 1.0 μm (A) and (B) were slower than those seen with other modules during
Run 2 and Run 3 respectively. When Ri was high, TMP seemed to increase rapidly during the next
operational period irrespective of membrane pore size. Figure 3 also shows that differences in membrane
resistances after operation and after physical cleaning (reversible resistance by physical cleaning: Rrp)
seemed to correlate with Ri i.e., the higher the Rrp, the lower the Ri. The Rrp in membrane modules
PTFE 1.0 μm (A) and (B) were higher than those seen in the other modules during Run 1 and Run 2.
Figure 3. Hydraulic resistance: R (m−1) and its differences in each step at Run 1 and 2 in
each PTFE membrane module. Rrp, Rrc and Ri mean the differences in membrane resistance
after operation and after physical cleaning, after physical cleaning and after chemical
cleaning, and before use and after chemical cleaning respectively.
3.3. Correlation between Membrane Resistances and Transmembrane Pressure
To discuss the correlation between TMP increases and Ri and Rrp, data from Runs 2 and 3 (Figure 2)
and Runs 1 and 2 (Figure 3) were rearranged in Figure 4a–e. Figure 4a shows the correlation between
dates required to increase TMP to 25 kPa (T25) and Ri. The determination coefficient (R2) of collinear

Membranes 2012, 2 234
approximation was low (0.724), although the decrease in T25 seen with an increase of Ri was very
apparent. This suggests that Ri of the module may determine its permeate ability during its next
operation irrespective of membrane pore size although T25 values may depend not only on Ri of the
module but also on MBR operational conditions such as foulants concentration in the MBR system.
Figure 4b shows the correlation between T25 and Rrp. The R2 of collinear approximation was even
lower (0.657), although again the increase in T25 with an increase of Rrp was clearly evident. Figure 4c
also shows the relationship between Ri and Rrp. The R2 of exponential approximation (0.947) was
higher than that of collinear approximations in Figure 4a,b, and the decrease of Ri with increases in Rrp
was clear. These results suggest that the cake or gel layer formed on the surface of membrane and
which was removed by physical cleaning was preventing foulants access responsible for high Ri from
contaminating the membrane pores. This cake or gel layer may play a key role as also reported in other
dynamic MBR studies [14]. On the other hand, a low correlation was seen between T25 and reversible
resistance by chemical cleaning (Rrc) or Ri and Rrc (Figure 4d,e). The R2 of collinear approximation
between T25 and Rrc, and Ri and Rrc were 0.390 and 0.312 respectively.
Figure 4. Correlation between the TMP, Ri and Rrp. (a) correlation between dates required
for increasing TMP up to 25 kPa (T25) and Ri; (b) correlation between T25 and Rrp;
(c) correlation between Ri and Rrp; (d) correlation between T25 and Rrc; (e) correlation
between Ri and Rrc.
Membranes 2012, 2 235
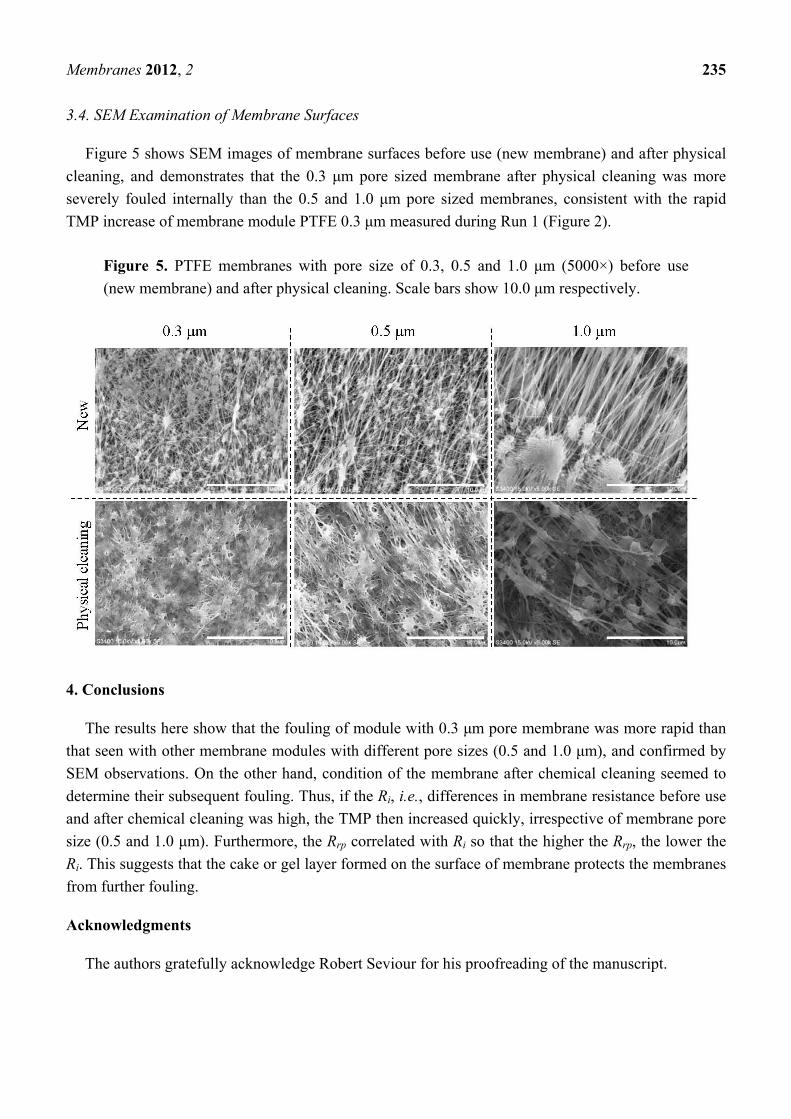
3.4. SEM Examination of Membrane Surfaces
Figure 5 shows SEM images of membrane surfaces before use (new membrane) and after physical
cleaning, and demonstrates that the 0.3 μm pore sized membrane after physical cleaning was more
severely fouled internally than the 0.5 and 1.0 μm pore sized membranes, consistent with the rapid
TMP increase of membrane module PTFE 0.3 μm measured during Run 1 (Figure 2).
Figure 5. PTFE membranes with pore size of 0.3, 0.5 and 1.0 μm (5000×) before use
(new membrane) and after physical cleaning. Scale bars show 10.0 μm respectively.
4. Conclusions
The results here show that the fouling of module with 0.3 μm pore membrane was more rapid than
that seen with other membrane modules with different pore sizes (0.5 and 1.0 μm), and confirmed by
SEM observations. On the other hand, condition of the membrane after chemical cleaning seemed to
determine their subsequent fouling. Thus, if the Ri, i.e., differences in membrane resistance before use
and after chemical cleaning was high, the TMP then increased quickly, irrespective of membrane pore
size (0.5 and 1.0 μm). Furthermore, the Rrp correlated with Ri so that the higher the Rrp, the lower the
Ri. This suggests that the cake or gel layer formed on the surface of membrane protects the membranes
from further fouling.
Acknowledgments
The authors gratefully acknowledge Robert Seviour for his proofreading of the manuscript.

Membranes 2012, 2 236
References
1. Xue, Y.; Yang, F.; Liu, S.; Fu, Z. The influence of controlling factors on the start-up and
operation for partial nitrification in membrane bioreactor. Bioresour. Technol. 2009, 100,
1055–1060.
2. Meng, F.G.; Yang, F.L.; Shi, B.Q.; Zhang, H.M. A comprehensive study on membrane fouling in
submerged membrane bioreactors operated under different aeration intensities. Sep. Purif.
Technol. 2008, 59, 91–100.
3. Le-Clech, P.; Chen, V.; Fane, T.A.G. Fouling in membranebioreactors used in wastewater
treatment. J. Membr. Sci. 2006, 284, 17–53.
4. Yang, W.; Cicek, N.; Ilg, J. State-of-the-art of membrane bioreactors: Worldwide research and
commercial applications in North America. J. Membr. Sci. 2006, 270, 201–211.
5. Yamato, N.; Kimura, K.; Miyoshi, T.; Watanabe, Y. Difference in membrane fouling in
membrane bioreactors (MBRs) caused by membrane polymer materials. J. Membr. Sci. 2006, 280,
911–919.
6. Choi, J.-H.; Ng, H.Y. Effect of membrane type and material on performance of a submerged
membrane bioreactor. Chemosphere 2008, 71, 853–859.
7. Liao, B.Q.; Bagley, D.M.; Kraemer, H.E.; Leppard, G.G.; Liss, S.N. A review of biofouling and
its control in membrane separation bioreactors. Water Environ. Res. 2004, 76, 425–436.
8. Choi, J.-H.; Park, S.-K.; Ng, H.-Y. Membrane fouling in a submerged membrane bioreactor using
track-etched and phase-inversed porous membranes. Sep. Purif. Technol. 2009, 65, 184–192.
9. Ou, S.-H.; You, S.-J.; Lee, Y.-C. Extracellular polymeric substance characteristics and fouling
formation mechanisms in submerged membrane bioreactors. Desalin. Water Treat. 2010, 18,
175–181.
10. Astm F316–86, Standard Test Methods for Pore Size Characteristics of Membrane Filters by
Bubble Point and Mean Flow Pore Test; ASTM Committee on Standards: West Conshohocken,
PA, USA, 1986.
11. Nagashima, A. Viscosity of water substance–new international formulation and its background.
J. Phys. Chem. Ref. Data 1977, 6, 1133–1166.
12. American Public Health Association (APHA). Standard Methods for the Examination of Water
and Wastewater, 20th ed.; American Public Health Association/American Water Works
Association/Water Environment Federation: Washington, DC, USA, 1998.
13. van der Marel, P.; Zwijnenburg, A.; Kemperman, A.; Wessling, M.; Temmink, H.; van der Meer, W.
Influence of membrane properties on fouling in submerged membrane bioreactors. J. Membr. Sci.
2010, 348, 66–74.
14. Fan, B.; Huang, X. Characteristics of a self-forming dynamic membrane coupled with a bioreactor
for municipal wastewater treatment. Environ. Sci. Technol. 2002, 36, 5245–5251.
© 2012 by the authors; licensee MDPI, Basel, Switzerland. This article is an open access article
distributed under the terms and conditions of the Creative Commons Attribution license
(http://creativecommons.org/licenses/by/3.0/).


