Embed Size (px)
Citation preview

Louisiana State University Louisiana State University
LSU Digital Commons LSU Digital Commons
LSU Master's Theses Graduate School
2016
Comparison of Domestic Fresh and Frozen and Imported Frozen Comparison of Domestic Fresh and Frozen and Imported Frozen
Goat Meat Goat Meat
Jeffrey Cole Denis Gregorie Louisiana State University and Agricultural and Mechanical College
Follow this and additional works at: https://digitalcommons.lsu.edu/gradschool_theses
Part of the Animal Sciences Commons
Recommended Citation Recommended Citation Gregorie, Jeffrey Cole Denis, "Comparison of Domestic Fresh and Frozen and Imported Frozen Goat Meat" (2016). LSU Master's Theses. 30. https://digitalcommons.lsu.edu/gradschool_theses/30
This Thesis is brought to you for free and open access by the Graduate School at LSU Digital Commons. It has been accepted for inclusion in LSU Master's Theses by an authorized graduate school editor of LSU Digital Commons. For more information, please contact [email protected].

Comparison of Domestic Fresh and Frozen and
Imported Frozen Goat Meat
A Thesis
Submitted to the Graduate Faculty of the
Louisiana State University and
Agricultural and Mechanical College
in partial fulfillment of the
requirements for the degree of
Master of Science
in
The School of Animal Sciences
by
Jeffrey Cole Denis Gregorie
B.S., Louisiana State University A&M, 2010
August 2016

ii
This thesis is dedicated, first, in memory of my grandparents, Robert Leslie and Charlotte Faye
Bell, who raised me and instilled in me the belief that I could accomplish anything I put my mind
to as long as I was willing to do the work necessary to accomplish my goal. Secondly, I dedicate
this thesis to my baby girl, Lisa Bell Gregorie, who has given me a renewed resolve to reach my
full potential, because only then do I know that could I expect the same from her. Finally, I dedicate
this paper to my Lord and Savior, for without him, none of this would be possible.

iii
ACKNOWLEDGMENTS
I would first like to thank my loving wife, Elizabeth Roeling Gregorie, who has
supported me in all of my endeavors dating back to my time as an undergraduate. Without your
support and knowing when to push and when to leave it alone, I would not be here today.
I would like to thank Dr. Tara Smith and Dr. Arthur Villordon for encouraging me to
finish my degree and allowing me to take the time necessary to do so.
I would like to thank all of the farm mangers of the Animal Science Department that I
gained so much knowledge from, either as an employee or during college: Randy Wright, Randy
Morell, Rebeca Lirette, the late Mike Canal, and of course Manuel Persica.
Great thanks goes to the student workers of the LSU Meat Lab that assisted with this
project: Beth Schexnayder, Brendan Terry, Carly Gillian, and especially graduate student James
Maynard whose tireless efforts and late nights allowed us to obtain this data.
I extend my gratitude to Dr. Bidner and Dr. Cruzen for taking the time to serve on my
examination committee.
Lastly, a special thanks must be given to my major professor, Dr. Ken McMillin. Dr.
McMillin has been a mentor to me since I first took his undergraduate Contemporary Issues
course nearly a decade ago. He hired me as his research associate shortly after my graduation,
which was the gateway to my current employment at the Sweet Potato Research Station. He has
had the patience to wait for me to finish this degree. I will forever be grateful for all the doors he
has opened for me.
This research was conducted under USDA Hatch project LAB94021.

iv
TABLE OF CONTENTS
ACKNOWLEDGMENTS .............................................................................................................. iii
LIST OF TABLES .......................................................................................................................... vi
LIST OF FIGURES ....................................................................................................................... vii
ABSTRACT .................................................................................................................................. viii
CHAPTER 1: INTRODUCTION ....................................................................................................1
CHAPTER 2: REVIEW OF LITERATURE ...................................................................................4
2.1 Properties of Meat ...................................................................................................................4
2.1.1 Components of Lean Meat ...............................................................................................4
2.1.2 Effects of Rigor Mortis ....................................................................................................4
2.1.3 Effects of pH ....................................................................................................................6
2.1.4 Myoglobin ........................................................................................................................7
2.1.5 Properties of Water in Meat ...........................................................................................10
2.1.6 Properties of Meat Color ................................................................................................12
2.1.7 Quantifying Color Measurements ..................................................................................14
2.1.8 Cooking ..........................................................................................................................16
2.1.9 Tenderness ......................................................................................................................17
2.2 Overview of Frozen Meat .....................................................................................................19
2.2.1 Chilling ...........................................................................................................................19
2.2.2 Freezing ..........................................................................................................................19
2.2.3 Freezing Rate..................................................................................................................20
2.2.4 Frozen Storage................................................................................................................21
2.2.5 Thawing ..........................................................................................................................22
2.2.6 Effects of Freezing on Meat Quality ..............................................................................23
2.3 Packaging Overview .............................................................................................................25
2.3.1 Oxygen-permeable Film Overwrapping.........................................................................25
2.3.2 Vacuum Packaging .........................................................................................................26
2.3.3 Modified Atmosphere Packaging ...................................................................................27
2.4 Goat, Goat Carcass, and Goat Meat Properties ....................................................................29
2.4.1 Live Goat Carcass ..........................................................................................................29
2.4.2 Carcass Traits .................................................................................................................30
2.4.3 Carcass Evaluation .........................................................................................................33
2.4.4 Goat Meat Properties ......................................................................................................37
2.4.5 Packaging and Storage Effects on Goat Meat ................................................................39
CHAPTER 3: CARCASS EVALUATION AND CARCASS YIELD DIFFERENCES ..............41
3.1 Introduction ...........................................................................................................................41
3.2 Materials and Methods..........................................................................................................42
3.2.1 Animal Use .....................................................................................................................42
3.2.2 Apparatuses ....................................................................................................................42
3.2.3 Goat Side Samples .........................................................................................................42
3.2.4 Statistical Analysis .........................................................................................................45
3.3 Results and Discussion .........................................................................................................45
3.4 Conclusion ............................................................................................................................48
v
CHAPTER 4: QUALITY DIFFERENCES AMONGST GROUPS OF GOAT LEGS ................50
4.1 Introduction ...........................................................................................................................50
4.2 Materials and Methods..........................................................................................................51
4.2.1 Apparatuses ....................................................................................................................51
4.2.2 Leg Samples ...................................................................................................................51
4.2.3 Leg CIELAB Color Measurements ...............................................................................52
4.2.4 Leg Cooking ...................................................................................................................52
4.2.5 Water Holding Capacity of Leg Sample ........................................................................53
4.2.6 Statistical Analysis .........................................................................................................53
4.3 Results and Discussion .........................................................................................................53
4.4 Conclusion ............................................................................................................................55
CHAPTER 5: LOIN AND RACK STUDY...................................................................................56
5.1 Introduction ...........................................................................................................................56
5.2 Materials and Methods..........................................................................................................57
5.2.1 Apparatuses ....................................................................................................................57
5.2.2 Gases ..............................................................................................................................58
5.2.3 Samples ..........................................................................................................................58
5.2.4 CIELAB Color Measurements .......................................................................................58
5.2.5 Packaging .......................................................................................................................59
5.2.5.1 Modified Atmosphere Packages ............................................................................59
5.2.5.2 Polyvinyl Chloride Film Overwrapping ................................................................60
5.2.5.3 Vacuum Packaging ................................................................................................60
5.2.5.4 Simulated Retail Display .......................................................................................60
5.2.6 Cooking ..........................................................................................................................61
5.2.7 Tenderness ......................................................................................................................61
5.2.8 Statistical Analysis .........................................................................................................61
5.3 Results and Discussion .........................................................................................................62
5.3.1 Group Comparison .........................................................................................................62
5.3.2 Packaging Comparison ...................................................................................................65
5.3.3 Packaging Pre and Post Comparison ..............................................................................68
5.3.4 Group Packaging Comparison .......................................................................................69
5.3.5 Group Packaging Pre and Post Comparison ..................................................................71
5.3.6 Loin and Rib Comparison ..............................................................................................76
5.4 Conclusion ............................................................................................................................77
CHAPTER 6: CONCLUSIONS ....................................................................................................79
6.1 Summary ...............................................................................................................................79
6.2 Findings ................................................................................................................................80
6.3 Implications ..........................................................................................................................81
REFERENCES ..............................................................................................................................83
VITA ..............................................................................................................................................90

vi
LIST OF TABLES
Table 1. Means and S.E.M. of carcass traits for United States domestic and
Australian imported goat carcasses .................................................................................46
Table 2. Means and S.E.M. of primal cuts as percentages of thawed side
weights without neck or kidney, pelvic, and heart fat .....................................................47
Table 3. Means and S.E.M. of primal cuts as percentages of carcass weights
without kidney, pelvic, and heart fat ...............................................................................48
Table 4. Means and standard errors on influence of storage treatment and cooking
batch on loss, relative water holding capacity, CIELAB color values,
and tenderness .................................................................................................................54
Table 5. Means and standard errors on influence of fresh domestic, frozen domestic,
and frozen Australian chops on loss, color, and tenderness ............................................64
Table 6. Means and standard errors on influence of packaging on loss, color,
and tenderness ..................................................................................................................67
Table 7. Means and standard errors on influence of packaging on CIELAB
color value changes from pre to post package .................................................................68
Table 8. Means and standard errors on differences between storage group and
package combination on loss, color, and tenderness .......................................................70
Table 9. Means and standard errors on differences between storage group
and package combination on prepackage and post package CIELAB
color values ......................................................................................................................73
Table 10. Means and standard errors on differences between loin and rib chops
on loss, color, and tenderness ........................................................................................76

vii
LIST OF FIGURES
Figure 1. Annual domestic U.S. goat slaughter (head) and imports of goat meat
(as 34-pound carcass equivalents) from 1996-2014. Percentage of
imports as total number of goats from formal facilities on the right axis .........................2
Figure 2. Schematic of the interconversions of myoglobin redox forms in fresh meat. ..................8
Figure 3. Representation of color solid for CIE L*a*b* color space ............................................15
Figure 4. Goat carcass evaluation selection classifications ..........................................................34
Figure 5. Kidney, pelvic, and heart fat scores ...............................................................................35
Figure 6. Goat subcutaneous fat cover scores ...............................................................................36
Figure 7. USDA IMPS Hotel style with an additional straight cut immediately
anterior to the femur-pelvic joint ...................................................................................44
Figure 8. Box and Whisker plot of pre and post package group combination of L* .....................74
Figure 9. Box and Whisker plot of pre and post package group combination of a* .....................74
Figure 10. Box and Whisker plot of pre and post package group combination of b* ...................75
Figure 11. Box and Whisker plot of pre and post package group combination of
hue angle ......................................................................................................................75

viii
ABSTRACT
The objective of this research was to determine differences in carcass evaluation, yield,
and meat quality from representative fresh domestic (FSD), frozen domestic (FZD), and frozen
imported Australian (FIA) goat carcass sides (n=30 from each source). The U.S. carcasses were
split into sides and the right side frozen and stored for 6 weeks. Left sides were fabricated into
standardized primal cuts. After frozen storage, right sides and FIA carcasses were thawed for 3
days at 4°C. Three experiments were conducted on the carcass traits and meat yields, quality
differences in leg cut, and differences in loin and racks across freezing and packaging treatments.
Domestic carcasses were heavier (P<0.05) with more (P<0.05) external fat, but carcass
conformation and lean flank color were not different than imported Australian goat carcasses.
Australian carcasses had less waste and higher trimmed primal loin, rack, leg, shank, and
shoulder yields as % of carcass weight than domestic sides. Freezing and thawing changed the
percentages of cuts, but FIA carcasses had higher (P<0.05) yields of lean trimmed primal cuts
and FIA legs had higher (P<0.05) drip, cook losses, and water binding, but lower (P<0.05) color
values than the FZD legs or FSD legs. With paired t-tests, FZD legs had higher (P<0.05) drip
and cook losses and lower (P<0.05) color values than FSD legs. FZD and FIA chops had higher
(P<0.05) drip and cook losses than FSD. Freezing lowered (P<0.05) color values of chops,
however, packaging with 0.5% CO increased (P<0.05) a* and chroma values of frozen meat over
that of fresh goat meat before packaging. Vacuum packaging of goat chops increased (P<0.05)
drip and chops in overwrap packaging had the lowest (P<0.05) color values. Packaging did not
(P>0.05) affect Warner-Bratzler shear values. FSD chops had higher (P<0.05) shear force values
than FZD, which were higher than FIA. Loin chops had greater (P<0.05) drip and cook losses

ix
than rib chops. Rib chops were found to have higher (P<0.05) color values both pre and post
package and lower (P<0.05) shear force values when compared to loin chops.

1
CHAPTER 1: INTRODUCTION
There has been increased demand and production of goat meat in the United States during
the last 30 years (Gillespie, Nyaupane and McMillin, 2013). This demand increase is largely due
to increases in immigration to the United States from major goat meat consuming countries.
Unfortunately, domestic producers have not been able to fill the needs of the consumers for goat
meat supplies. This has opened a path for alternative sources to fill the void.
Increased quantities of frozen goat meat are imported into the United States from
Australia and New Zealand to meet the demand for goat meat, primarily from ethnic consumers.
Imports of goat meat have increased over the past two decades with more than 19,630,658 kg
imported into the United States in 2014, a number that increased nearly 50% since 2010.
Imported goat meat, mostly frozen and from Australia, comprised more than 66% of the goat
meat consumed in the United States in 2014 that can be accounted through inspected slaughter
data (Pinkerton and McMillin, 2015). The shift from domestic production to a majority being
imported meat in supplying goat meat to U.S. consumers is illustrated in Figure 1.
In an online survey of 2,000 goat meat consumers, type of cut accounted for 68% of the
variation in respondent preferences, followed by product source, price and color that accounted
for 15%, 14% and 3% of consumer preference, respectively. This implies that the type of cuts
offered for sale is the most important attribute among goat meat consumers, with a demonstrated
preference for cuts, chops and cubes (Harrison, 2013).
Most of the goat meat from Australia is in frozen form. Freezing meat prolongs the shelf
life, but freezing and thawing processes affect the quality of the meat. Tenderness of meat as
measured by peak shear force is generally thought to decrease with freezing and thawing

2
(Leygonie and Hoffman, 2012). The percentage of water loss within carcass and cuts is also
expected to increase as a percentage within frozen carcasses (Lagerstedt et al., 2008).
Figure 1. Annual domestic U.S. goat slaughter (head) and imports of goat meat (as 34-pound
carcass equivalents) from 1996-2015. Percentage of imports as total number of goats from
formal facilities on the right axis.
There is an abundance of research of freezing and thawing on quality effects in lamb;
however, research in this area is lacking in goats. While sheep are the closest biological relative
to goats in the domestic food chain, it has been stated that goat meat is unique and is not
interchangeable with sheep or lamb meat. Thus, goat meat and goat meat products need to be
marked and appreciated by the consumer for their own specific characteristics (Swan, Exguerra
and Farouk, 1998). The only way to achieve this autonomy is by further research in goats, goat
meat, and goat marketing.
0
10
20
30
40
50
60
70
80
90
100
0
50
100
150
200
250
300
350
400
450
500
550
600
650
700
750
800
850
900
950
1,000
1,050
1,100
1,150
1,200
1,250
1,300
1,350
1990 1992 1994 1996 1998 2000 2002 2004 2006 2008 2010 2012 2014 2016
Imp
ort
s,
% o
f to
tal
Go
at
Sla
ug
hte
r o
r Im
po
rte
d C
arc
as
se
s, 1
,00
0 h
ea
d
Year
Domestic slaughter
Imports (34 lb carc equiv)
% Imports of total

3
The present study was designed to gain a comprehensive look at the quality differences
from representative frozen Australian goat carcasses and from representative United States kid
goats after both fresh and frozen storage. Goat eating consumers valued frozen domestic or
frozen imported meat less than fresh domestic goat meat (Harrison, 2013). This research was
designed to compare the carcasses, yields, and meat quality for these three types of goat meat
available in the United States.
To achieve a comprehensive look at the differences among these groups, this study
entailed three separate experiments. The experiments were conducted in two replications with
fresh domestic goat sides and frozen domestic goat sides from American goats and imported
frozen Australian goat carcasses. The experiments were evaluation of goat carcass traits and
meat yields, differences in goat leg properties, and comparison of loin and rack chops in three
different packaging treatments from fresh and frozen domestic and imported frozen goat
carcasses.
There are confounding factors that occur by not being able to examine the fresh carcasses
of the Australian goats and from not being able to control the freezing and storage of these sides.
With that in mind, this study was designed with paired domestic fresh and frozen sides that could
be compared to one another as well as to the Australian sides. This allowed for definite results
between domestic fresh and frozen goat meat to be observed. Also, comparing the domestic fresh
and frozen goat meat to frozen Australian goat meat would allow determining if Australian goat
meat characteristics are more closely related in nature to those of frozen domestic or to fresh
domestic goat meat. This would lead to testing the assumption that traits in the Australian meat
would be due to freezing and not to production or uncontrollable factors.

4
CHAPTER 2: REVIEW OF LITERATURE
2.1 Properties of Meat
2.1.1 Components of Lean Meat
The structural unit of skeletal muscle tissue is known as a muscle fiber, myofibril, or
muscle cell. Muscle fibers constitute 75-92% percent of total muscle volume with connective
tissues, blood vessels, nerve fibers, and extracellular fluid comprising the rest. Water is the fluid
medium of the body and also is associated with cellular structures, in particular, with colloid
protein molecules (Aberle et al., 2012).
After the conversion from muscle to meat, the lean meat of muscle consists of contractile
mechanisms consisting of myofibril proteins, myosin and actin, in the form of many fibrils,
fibers and fiber bundles, each encased in a light tubing or netting of connective tissue. Within
each bundle, myofibrils are surrounded by sarcoplasm (consisting of 75% water and 6%
sarcoplasmic protein) and other substances including myoglobin, salts, vitamins, and some fat,
sinews, nerves, blood vessels, etc. (Ranken, 2000).
2.1.2 Effects of Rigor Mortis
One of the most dramatic postmortem changes that occurs during the conversion of
muscle to meat is stiffening of muscles after death, the phenomenon of rigor mortis (Latin for
“stiffness of death”) (Aberle et al., 2012).
ATP complexed with Mg2+ is required for a muscle to be maintained in the relaxed state
(Aberle et al., 2012). When glycogen is inadequate to generate adenosine tri-phosphate (ATP) to
break the bonds between actin and myosin, myosin and actin can no longer be held apart and
rigor mortis begins (Lawrie, 1992). During early postmortem phases, stores of creatinine
phosphate are used for the re-phosphorylation of ADP (adenosine diphosphate) to ATP (Aberle

5
et al., 2012). Upon death of the animal, ATP in the muscle is split to ADP and AMP (adenosine
monophosphate) (Ranken, 2000). As stores of glycogen are depleted, phosphorylation of ADP
becomes insufficient to maintain the tissue in a relaxed state. As ATP becomes limited,
actomyosin bridges begin to form. As cross-bridges from, muscles contract, shortening
sarcomeres and increasing muscle tension. Stiffness observed in rigor mortis is due to formation
of theses permanent cross-bridges between actin and myosin filaments because there is no
energy left for the breakage of actomyosin bonds (Aberle et al., 2012).
The stiffness caused by this process lasts until the resolution of rigor, where muscle
stiffness decreases. This decrease in muscle stiffness is due to degradation of myofibrillar
proteins, resulting in dissolution of Z disks and loss of ultrastructural integrity, as myosin and
actin will remain bound (Aberle et al., 2012).
In chilled meat supplied for manufacturing, the process of rigor is normally completed
and no problems arise, but if the rigor resolution sequence is interrupted by cutting, chilling,
freezing or cooking, toughness may result. Freezing meat early in rigor or before rigor
commences, and when ATP is still present, may lead to “thaw rigor”, which is a strong
contraction with toughening when the meat is thawed (Ranken, 2000). In thaw rigor, contraction
is caused by sudden release of calcium into the sarcoplasm from the sarcoplasmic reticulum and
mitochondria and may cause a physical shortening of 80% of the original length of unrestrained
muscles. The sudden release of calcium is due to storage sites within the cell being damaged in
the freezing process (Aberle et al., 2012). This can be mitigated by long frozen storage or slow
thawing as ATP will slowly dissipate in the frozen state, leaving no energy for contraction
(Ranken, 2000).

6
2.1.3 Effects of pH
Post mortem changes take place at the death of the animal, changing muscle into meat.
One of the most significant changes in the conversion of muscle to meat is the lowering of
muscle pH due to the accumulation of lactic acid (Ranken, 2000; Aberle et al., 2012).
When normal metabolism and the supply of oxygen to the bloodstream cease, glycogen is
converted into lactic acid. This process is known as glycolysis and will take place until glycogen
is no longer available. The accumulation of lactic acid results in a pH fall normally from 7.2 to
5.5. (Lawrie, 1992; Ranken, 2000).
The pH is important from both the standpoint of ultimate pH and the rate of pH decline in
the prerigor to postmortem period (Faustman, 1990). Different variables can affect the rate in
which pH declines in muscle during postmortem glycolysis. Species that have a greater amount
of white muscle fibers have a more rapid decline compared to species with a greater amount of
slow twitch muscle fibers (Lawrie, 1992). Other factors, such as muscle location, may also
contribute to the rate of decline. In general, low pH values favor the oxidation of myoglobin, and
low pH accelerates the production of bound oxygen (Faustman, 1990).
Two abnormal cases of this process are known as PSE and DFD. PSE or pale, soft, and
exudative meat may occur if the pH falls very rapidly because of nervous excitement at the time
of slaughter, especially in stress-susceptible animals (Ranken, 2000). The term exudative refers
to the excess surface moisture released by the myofibrillar proteins (Faustman, 1990). For PSE,
animals must have high glycogen supplies pre slaughter which results in lower ultimate pH
values. However, the main damage is due to this value being reached quickly while the carcass
is still warm, resulting in the precipitation of soluble sarcoplasmic proteins, poor water binding
and pale color. The second case is known as DFD or dark, firm and dry meat. This is due to the
7
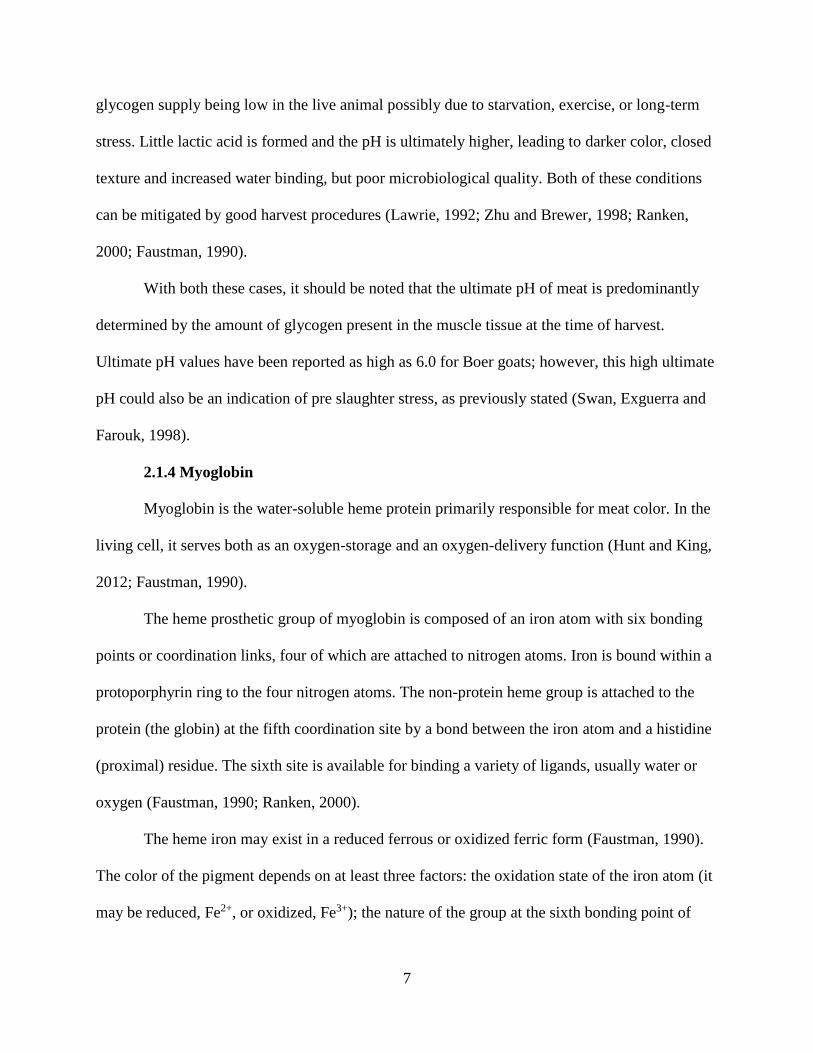
glycogen supply being low in the live animal possibly due to starvation, exercise, or long-term
stress. Little lactic acid is formed and the pH is ultimately higher, leading to darker color, closed
texture and increased water binding, but poor microbiological quality. Both of these conditions
can be mitigated by good harvest procedures (Lawrie, 1992; Zhu and Brewer, 1998; Ranken,
2000; Faustman, 1990).
With both these cases, it should be noted that the ultimate pH of meat is predominantly
determined by the amount of glycogen present in the muscle tissue at the time of harvest.
Ultimate pH values have been reported as high as 6.0 for Boer goats; however, this high ultimate
pH could also be an indication of pre slaughter stress, as previously stated (Swan, Exguerra and
Farouk, 1998).
2.1.4 Myoglobin
Myoglobin is the water-soluble heme protein primarily responsible for meat color. In the
living cell, it serves both as an oxygen-storage and an oxygen-delivery function (Hunt and King,
2012; Faustman, 1990).
The heme prosthetic group of myoglobin is composed of an iron atom with six bonding
points or coordination links, four of which are attached to nitrogen atoms. Iron is bound within a
protoporphyrin ring to the four nitrogen atoms. The non-protein heme group is attached to the
protein (the globin) at the fifth coordination site by a bond between the iron atom and a histidine
(proximal) residue. The sixth site is available for binding a variety of ligands, usually water or
oxygen (Faustman, 1990; Ranken, 2000).
The heme iron may exist in a reduced ferrous or oxidized ferric form (Faustman, 1990).
The color of the pigment depends on at least three factors: the oxidation state of the iron atom (it
may be reduced, Fe2+, or oxidized, Fe3+); the nature of the group at the sixth bonding point of

8
iron; and the state of the globin. The globin may be native, as in raw meat, or denatured, as in
cooked meat (Ranken, 2000). The ligand present at the 6th coordination site and the valance state
of iron determine the color of meat via four chemical forms of myoglobin in uncured meat,
deoxymyoglobin (DMb), oxymyoglobin (OMb), carboxymyoglobin (COMb) and metmyoglobin
(MMb); see Figure 2 (Hunt and King, 2012).
Figure 2. Schematic of the interconversions of myoglobin redox forms in fresh meat.
Ferrous heme iron, which lacks a sixth ligand, is called deoxymyoglobin. Meat in which
deoxymyoglobin is the predominant pigment form will appear purplish-red in color. When
oxygen occupies the sixth binding site of ferrous heme iron, oxymyoglobin results and is
responsible for the desirable cherry-red appearance of fresh meat. These two reduced forms of
myoglobin readily oxidize to the undesirable brownish-red metmyoglobin in which the heme
iron is converted to the ferric state and water occupies the sixth coordination position.
Metmyoglobin is incapable of binding oxygen, and thus physiologically inactive. Metmyoglobin

9
may be converted back to a physiologically active form by a process called reduction, facilitated
by enzymes known as metmyoglobin reductases (Faustman, 1990). Under extreme conditions,
the pigment may be decomposed; the heme portion becomes detached from the iron atom and
green choleglobin and colorless bile pigments are formed (Ranken, 2000).
Reduced myoglobin, oxymyoglobin, and metmyoglobin are all present in fresh meat in
equilibrium with one another. In the center of a piece of meat, there is no oxygen and the
pigment is in the purple reduced myoglobin form (the same as vacuum-packed meats). At the
surface of a piece of meat, there is a high oxygen supply and bright red oxymyoglobin is formed.
Between these two zones is a region of low oxygen concentration, which favors oxidation of
pigment to metmyoglobin. A layer of brown metmyoglobin therefore forms just below the
surface of the meat (Ranken, 2000).
The relative proportions of the three pigments depend on conditions within the meat.
Metmyoglobin cannot take up oxygen, but enzymes present in the fresh meat are capable of
reducing metmyoglobin to reduced myoglobin, which can then take up oxygen to form red
oxymyoglobin. With increased time postmortem, the substrates for these enzymes are gradually
diminished; metmyoglobin can no longer be reduced and the brown metmyoglobin layer
becomes wider until it finally becomes visible through a narrowing oxymyoglobin layer, and the
meat appears brown (Ranken, 2000).
Carboxymyoglobin is another form of myoglobin that may be formed.
Carboxymyoglobin in meat products is not new to the industry and has been allowed as a
packaging aid in the United States since 2002 (Cornforth and Hunt, 2008). Carboxymyoglobin
formation occurs when carbon monoxide attaches to the vacant 6th position of deoxymyoglobin,
producing a stable bright-red color when the environment is devoid of oxygen. Atmospheres

10
containing oxygen (albeit concentration dependent) will result in the conversion of
carboxymyoglobin to either oxymyoglobin or metmyoglobin (Cornforth, 1994).
Myoglobin concentration is variable with multiple factors including species, maturity,
sex, and movement of the specific muscle, as concentrations are different for each muscle group
(Ledward, 1992). The rate of myoglobin oxidation can also be greatly accelerated with increased
temperature; therefore, the onset of discoloration in meat may be delayed with a low temperature
stage (Faustman, 1990).
Hemoglobin, along with myoglobin, is another heme protein capable of imparting color
in meat. Hemoglobin is a tetramer of myoglobin and is a component of red blood cells. However,
in meat from properly exsanguinated carcasses, it is estimated that there is only an average of
0.3% residual blood in cuts, so hemoglobin is not a major contributor to color (Aberle et al.,
2012).
2.1.5 Properties of Water in Meat
Meat juices play important roles in conveying overall impressions of palatability to
consumers. They contain many components and assist in fragmenting and softening meat during
chewing. The absence of juiciness severely limits meat acceptability.
The main source of juiciness detected by consumers is lipids and retained water. In
combination with water retained, lipids form a broth, which is released during chewing. They
may also stimulate the production of saliva and improve apparent juiciness (Aberle et al., 2012).
The water content of lean meat or muscle is approximately 75%, distributed as 45%
attached to fibrils, 19% in sarcoplasm, and 11% in extracellular space and connective tissues. Of
this water, 5% may be chemically bound to proteins, 24% of which is held by capillary forces
and may be squeezed out under pressure; 45% is held firmly (Ranken, 2000).

11
During thawing, pressing, and cooking, the lost liquid comes from constitutive water and
from the fat that melts during heating (Vieira et al., 2009). During cooking, melted fat apparently
becomes translocated along bands of perimysium connective tissue. This uniform distribution of
lipids throughout the muscle may act as a barrier to moisture loss during cooking. Subcutaneous
fat also minimizes drying and moisture loss during dry heat roasting. In spite of influences of
fat, the major contributor to the sensation of juiciness is water remaining in cooked product
(Aberle et al., 2012).
Other factors may also affect the ability of a meat sample to retain water. Aging has been
found to improve water-binding properties, causing aged meat to be juicier than un-aged meat
(Schonfeldt et al., 1993; Aberle et al., 2012). Water losses both in drip and cooking losses are
increased by freezing and thawing, the degree of which is largely dependent on the rate of
freezing (Ranken, 2000).
Cooking losses in goats were higher on day 0 of display than any other time, likely due to
the moisture losses over display time (Kannan, Kouakou and Gelaye, 2001). This was supported
by research in beef that found overall water holding capacity is lowered with freezing
(Lagerstedt et al., 2008).
Some of the common techniques to measure and quantify the moisture of a meat product
are water holding capacity (WHC), the ability of the meat to retain the tissue water present
within its structure, and water binding capacity (WBC), the ability of meat to bind added water.
Drip is a measure of the water lost by holding a piece of meat under standard conditions. Drip
from unprocessed fresh meat is usually quite small (0-3%). Cooking loss is water, fat or jelly
which is lost from a piece of meat upon cooking. Finally, pressing loss is a procedure in which a
standard weight of sample on a filter paper is pressed between two plates, and the area of the

12
paper wetted by liquid exuded from the sample is noted. Two examples are the Grau-Hamm
press method and the Carver press method (Ranken, 2000).
2.1.6 Properties of Meat Color
The three sensory properties by which consumers judge meat quality are appearance,
texture, and flavor. The appearance of the meat product is the primary factor that influences the
purchase decision by consumers (Faustman, 1990) because the consumer puts emphasis on color
as an indicator of meat quality (Kadim and Mahgoub, 2012a).
Muscle color is related to the concentration and form of myoglobin bound to iron and pH
of the muscle (Kadim and Mahgoub, 2012a; Faustman, 1990) as previously stated. The most
important contributors to meat color are the pigments that absorb certain wavelengths of light
and reflect others (Aberle et al., 2012). Depending on the extent of blood loss from the animal,
hemoglobin, the pigment in blood, may also play a factor in the color of meat (Ranken, 2000).
Acceptable fresh meat color is short-lived, and surface discoloration is inevitable and
may be interpreted as an indication of unwholesomeness. Meat discoloration is easily defined as
a divergence from the consumer defined ideal to something less desirable, for instance, cherry-
red to brown. No single factor is responsible for meat discoloration. Meat surface discoloration
largely depends on the rate of pigment oxidation into metmyoglobin, influenced by temperature,
relative humidity, partial pressure of oxygen, light and lipid oxidation (Faustman, 1990).
The overall strategy for maximizing acceptable fresh meat color must involve delaying
pigment oxidation and/or enhancing reduction of oxidized pigments. In general, greater pigment
oxidation occurs in meat stored under light versus dark conditions, but because consumers
generally like to be able to see the product they are viewing, this is an unavoidable effect in the
displaying of meat (Faustman, 1990).

13
Factors such as species, breed, age, gender, muscle function and variation among and
within muscles can affect meat color. The color of meat may depend on the nature of the
illuminating light. The denaturing of myoglobin of meat also occurs faster at temperatures from
60°C and higher (Ranken, 2000). The color of frozen meat was found to vary with the rate of
freezing. This was attributed to the change in light reflectance as caused by small ice crystals
(Rasmussen and Olson, 1972). Red meats are darker, more brown/grey when frozen and tan
when unfrozen (Ranken, 2000). Other extreme examples such as DFD, which has previously
been discussed in relation to pH, can result in significant deviations to meat color from their
expected values. DFD results in a tighter structure, which decreases the rate of oxygen diffusion
and subsequent pigment oxygenation, and consequently decreases the amount of light reflected
from the meat. Mitochondria also survive and function better in postmortem muscle tissue at
elevated pH values, which is another contributor to darker meat (Faustman, 1990).
The brown or grey color associated with cooked meat is due to the denatured globin
hemichrome that occurs at cooking temperatures causing the iron atom to be in the ferric state
(Ranken, 2000).
In goat meat, desirable color values such as chroma decreased over display time in all
types of goat cuts tested, however, some cuts differed in amount of discoloration from one
another. Metmyoglobin formation increased in all goat cuts with increasing storage time,
increasing significantly for each of the first 8 days, but with no increases thereafter. There was a
significant negative correlation between percent of metmyoglobin and both a* and chroma
values. These relationships indicated that redness and color saturation decreased with increasing
accumulation of metmyoglobin pigment in the meat. Color concentrations can depend on which

14
cut is being viewed, as shoulder cuts, for example, can have higher a* and chroma values with
lower hue angles than those of loin or leg cuts (Kannan, Kouakou and Gelaye, 2001).
2.1.7 Quantifying Color Measurements
Data on color stability of fresh meat gives an idea about possible consumer preferences
based on the appearance of the product, but they do not necessarily indicate the safety, flavor,
nutritional, or functional aspects of the product (Zhu and Brewer, 1998)
A color as detected by the eye is the result in a combination of several factors. Any
specific color has three attributes known as hue, chroma and value. Hue describes the appearance
which one normally thinks of as a color – yellow, green, blue, or red. In reality, it describes the
wavelength of light radiation. Chroma (purity or saturation) describes the intensity of a
fundamental color with respect to the amount of white light that is mixed with it. The value of a
color is an indication of overall light reflectance (brightness) of the color (Aberle et al., 2012).
Accurate comparison of these properties of color in meat requires being able to quantify
them. If a narrow beam of white light is passed through a glass prism, it is spit into a rainbow
like band of color showing that white light is in fact a combination of all the colors of the
spectrum. An object appears colored when some wavelengths of light are selectively absorbed.
Fresh meat appears red because the surface absorbs all colors other than red wavelengths, which
are reflected (Ranken, 2000).
These aspects of color are addressed directly in the color chart-based Munsell notation
that specifies the elements of perceived color as value of lightness, (from black to white on a
scale of 0 to 10), chroma (degree of departure from gray toward pure chromatic color), and hue
(red, orange, yellow, green, etc.). In contrast, the instrumentally obtained coordinates from the
commission Internationale de l’Eclairage, CIE (L*, a*, b*) provide information on lightness

15
directly (McGuire, 1992). The development of the CIE L*a*b* color space allowed color to be
expressed in a three dimensional space (Figure 3, (Hunt and King, 2012)).
Figure 3. Representation of color solid for CIE L*a*b* color space.
Over 60% of researchers use Minolta colorimeters to instrumentally measure the values
of color (Tapp, Yancey and Apple, 2011). Minolta colorimeters can give three values CIE L*
(0=black; 100=white), a* (-60=green; +60=red), b*(-60 =blue; +60=yellow). Many researchers

16
publish CIELAB (L*, a*, b*) values, and while this gives a direct indication of lightness, the a*
and b* values are merely coordinates and do not indicate the color differences or color saturation
without further computation (McGuire, 1992). The coordinate points of a Minolta or Hunter
colorimeter pinpoint the measured color in a three-dimensional color space. However, without
further manipulation, this information does not provide an indication of hue and chroma
(McGuire, 1992). From a* and b*, chroma is calculated as (a*2 + b*2)1/2 and hue angle is
calculated as arctan (b*/a*) (McGuire, 1992).
Pertinent information that is necessary to replicate and accurately interpret instrumental
color results should include instrument type, illuminant type, aperture size, observation angle,
number of readings taken per sample, and bloom time (Tapp, Yancey and Apple, 2011).
2.1.8 Cooking
The main function of cooking is to heat, treat and kill vegetative pathogens and make a
product safe to consume (Varnam and Sutherland, 1995). Cooking is a process in which thermal
treatment causes chemical, physical, and microbial changes to occur in food, finally leading to a
palatable product (Ranken, 2000).
Many different methods of cooking can be used to ensure the safety of the product.
Desired sensory qualities of the end product are the main factor in selecting a cooking method.
Cooking methods may include hot air, steam, hot water, hot fat or oil radiant, dielectric heating,
and extrusion cooking (Varnam and Sutherland, 1995).
At the start of cooking, meat has a flaccid feel. During the cooking process, the most
obvious changes are the shrinkage in the muscle volume, with consequent loss of fluid, and the
development of a rigidity that is absent with raw meat (Vieira et al., 2009). The firming of meat
during cooking occurs as sarcoplasmic proteins are progressively precipitated from about 40°C,

17
thus meat becomes paler because of increased light scattering. The majority of the precipitation
occurs above 60°C and is complete by about 70°C. Contractile proteins myosin and actin are
denatured at about 65-70°C. When cooking to 65°C, the collagen and elastin shrink, increasing
rigidity and toughness. Cooking over 80°C, the collagen begins to hydrolyze to gelatin (Ranken
2000). The residual strength of fibers binding the muscle together contribute to toughness of
meat in addition to tension generated by the thermal shrinkage of perimysium collagen. Tensile
properties of cooked meat along the fiber axis are about ten times greater than the force required
to separate the bundles transversely (Vieira et al., 2009).
Other notable changes that take place during cooking are water loss, fat loss, and flavor
changes (Ranken, 2000; Aberle et al., 2012).
2.1.9 Tenderness
Tenderness is the most important quality attribute of whole meat (Oreskovich et al.,
1988). Texture is probably most important in determining the tenderness and eating quality of
cooked meat, and the extent of change varies considerably from muscle to muscle (Vieira et al.,
2009).
Toughening due to rigor mortis is caused by the formation of actomyosin bonds between
myosin and actin bonds that in postmortem muscle become irreversible when ATP is depleted
and are known as rigor bonds (Huff-Lonergan and Lonergan, 2005). The toughing effects caused
by this process can be somewhat negated by the aging process (Olsson, Hertzman and Tornberg,
1994). The increase in tenderness associated with post-mortem aging of meat has been attributed
to endogenous enzymes in muscle, a loss of tensile strength of the myofibrillar component of the
muscle cell, and to shortening of muscle fibers during slow versus rapid phase of rigor mortis

18
(Smith, Culp and Carpenter, 1978). Other differences can be due to sex, breed, age, species and
muscle (Lawrie, 1992; Aberle et al., 2012).
Tenderness is largely related to connective tissues that are formed mainly from fibers of
collagen and small amounts of elastin. In young animals, the connective tissue is partially
crosslinked and flexible, but with increased age, the degree of crosslinking increases, flexibility
decreases and toughness increases (Ranken, 2000). Heat may cause both tenderizing and
toughening of meat. In general, those heat-induced changes in proteins that result in coagulation
and hardening reduce tenderness. Conversely, those changes that result in greater solubilization
increase tenderness (Aberle et al., 2012). Improvement to tenderness of meat can be made
through aging, mechanical, and enzymatic methods (Aberle et al., 2012). Peak force values in
beef steaks have also shown a decline with freezing treatment and freezing time when compared
to fresh meat; however, the sensory panel found fresh meat to be more tender and juicy than
frozen meat (Lagerstedt et al., 2008; Shanks, Wulf and Maddock, 2002).
Tenderness can be a very subjective measurement; to estimate it objectively, mechanical
shear force is commonly used. Shear force required to break tissue is a convenient, objective
measurement of texture and, in general, correlates well with taste panel assessments of that
parameter (Vieira et al., 2009). Warner-Bratzler shear force (WBSF) has been shown to
accurately predict the meat tenderness rating of a consumer (Shackelfor et al., 1991; Warren and
Kastner, 1992).
Some of the research done in goats, as it relates to tenderness, has found that goat
carcasses are typically small, with little to no fat cover, and therefore carcass temperature can
decrease rapidly during postmortem chilling. This rapid decline in carcass temperature may
result in cold shortening and result in tougher meat (Kannan et al., 2006). Reducing stress prior

19
to slaughter has shown to result in more tender goat meat (Kadim and Mahgoub, 2012a). Aging
goat carcasses for more than six days can result in increased tenderness (Kadim et al., 2003).
2.2 Overview of Frozen Meat
The overall freezing process applied to meats consist of three processes 1. The actual
freezing operation, where most of the water in the food is converted into ice resulting in a hard
solid material; 2. Frozen storage; 3. Thawing, where the frozen food is more or less transformed
back into its original state. Prefreezing treatments (such as chilling), if any, should also be
viewed as an integral part of the freezing process since they have the potential to influence
product quality (Hanenian and Mittal, 2004; Fennema, 1966).
2.2.1 Chilling
Chilling can be defined as cooling material to temperatures just above the freezing point.
The rate of oxidation of the pigment to metmyoglobin increases with increasing temperature,
therefore red color is more stable at lower temperatures. At lower temperatures, the solubility of
oxygen is greater and oxygen-consuming reactions are slowed down so therefore there is greater
penetration of oxygen into the meat and the meat is redder than at higher temperatures (Ranken,
2000).
2.2.2 Freezing
The advantages of freezing meat rather than distributing it chilled are increased storage
time and a greater flexibility in inventory for retailers (Wheeler et al., 1990). This is achieved
through maintaining quality for longer periods than would be possible at higher temperatures
(Ranken, 2000).
At the most basic level, freezing can be defined as the converting of unfrozen material
into frozen material (Ranken, 2000). The commonly used types of freezing methods are

20
classified into three groups: 1. Blast freezing – freezing meat in a blast of cold air, 2. Plate
Freezing - freezing by indirect contact with a refrigerant, 3. Immersion - freezing by direct
immersion in a refrigerating medium (Tressler et al., 1968).
The main focus of this study is on blast freezing. In blast freezing systems, the products
to be frozen are spaced to allow for maximal air flow around the product, by either hanging or
being placed on metal trays/racks. The product may be either in loose form or in packages, and
cold air is blown over the foods by large fans for quicker heat removal (Rasmussen and Olson,
1972).
The quality of frozen meat depends on the specific procedures used to freeze, store, and
thaw the meat and the freezing rate can affect the quality of meat through the structural changes
that occur during freezing because of the formation of ice crystals (Smith et al., 1968).
2.2.3 Freezing Rate
Freezing rate of a food mass is the ratio between the minimum distances from the surface
to the thermal center (slowest cooling point) and the time required for the thermal center to reach
a temperature of 10°C lower than the temperature of initial ice formation at the thermal center
once the surface attains a temperature of 0°C (IIR, 1972).
A variety of terms may be used to describe a fast freezing rate: sharp, slow, rapid, quick,
and ultra-rapid (Fennema and Powrie, 1964). It has been considered for many years that foods
that are quick-frozen yield optimum quality. Quick frozen foods generally exhibit minimal
textural damage, release less thaw exudate, and undergo less chemical deterioration than those
frozen at low rates (Fennema, 1966; Fennema and Powrie, 1964). In rapid freezing, many small
crystals are formed simultaneously inside and outside the cells and distributed uniformly

21
throughout the product; water bound to myofibrils is the last to freeze (Ranken, 2000; Fennema,
1966).
Slow freezing of foods generally results in the production of large ice crystals located
exclusively in extracellular space that then grow as liquid is attracted to them. The result is large
ice crystals outside the cell and some dehydration of the cell contents (Ranken, 2000; Fennema,
1966). Slow freezing is characterized by extensive dislocation of water and consequently, the
cells have a shrunken appearance in the frozen state.
Drip loss from meat cuts upon thawing has been related to freezing rate when the surface
area to volume ratios of the cuts were large. The free water has to move to the surface before it
can drip from the meat, hence, the greater the surface area per unit volume, the less distance the
water needs to travel (Hanenian and Mittal, 2004).
2.2.4 Frozen Storage
Frozen storage, as conducted on a commercial basis, is considered to be the most
significant contributing factor to food damage in the entire freezing process. Foods in frozen
storage undergo a gradual and significant decline in quality with time (Wheeler et al., 1990;
Love, 1966; Shanks, Wulf and Maddock, 2002). Fluctuating temperatures in frozen material can
cause the ice crystals to grow; the smallest ice crystals are the first to melt and upon refreezing,
combine with larger ice crystals (Ranken, 2000).
Frozen storage time can cause an increase in muscle pH due to microorganisms and
endogenous enzymes that degrade meat proteins and produce ammonia, organic sulfides, and
amines (Devine et al., 1993; Muela et al., 2010). As frozen storage length increases, a decreasing
trend can be observed in regards to L*, a*, b*, and chroma values together with an increase in

22
hue angle. The differences are made more significant with added storage time (Vieira et al.,
2009).
Even when fast rates of freezing would result in the optimum quality retention of foods,
the effect can easily be offset by improper frozen storage or thawing. Some of the small ice
crystals present in the food tissue as a result of fast freezing may recrystallize and enlarge due to
metamorphic process, becoming more typical of those produced by slower rates of freezing
(Hanenian and Mittal, 2004).
There is a possibility of freezer burn taking place in foods during frozen storage. This
phenomenon is attributed to the sublimation of ice from the product surface, but this can be
avoided by packaging the product in a material of low permeability to water vapor (Fennema,
1966). Meat with severe freezer burn is dry and tasteless, or if oxidative rancidity has developed,
it may be viewed as bitter in flavor (Aberle et al., 2012).
2.2.5 Thawing
Thawing is also considered to be a more significant cause of quality damage than
freezing (Hanenian and Mittal, 2004). When meat thaws, ice crystals can cause physical damage
to the microstructures in meat. Thawing plays a major role in the processing of frozen meat
because the amount of exudates generated in the thawing process is one of the measures of the
quality of frozen meat (Anon and Calvelo, 1980).
Thermal conductivity of water is much smaller than that of ice; therefore, thawing is a
slower process than freezing because heat has to pass through an increasing thickness of water
instead of increasing thickness of ice. This leads to increased risk of microbial growth, as
compared to freezing, because the surface of the meat is at a higher temperature and there are
free water and nutrients for microbes on the surface of the meat (Ranken, 2000).

23
Proper precautions must be exercised during meat thawing to prevent microbial spoilage.
Such precautions would imply the necessity of reduced thawing times as well as having a
relatively cool thawing medium. A sufficient number of microorganisms invariably survive the
freezing process and the frozen storage conditions, after which they can multiply and promote
spoilage both during and after thawing. In general, thawing at temperatures ranging from room
temperature to 49°C is considered to be detrimental in inducing surface spoilage prior to the
completion of thawing (Fennema and Powrie, 1964; Fennema, 1966).
It should be noted that the color of thawed frozen meat is less stable than that of fresh
meat, and any meat that has discolored during frozen storage will remain brown after thawing
(Ranken, 2000).
One commonly used practice of thawing that has its own limitations is microwaving.
Most foods exhibit a rather high degree of heterogeneity during thawing due to a simultaneous
existence of frozen and unfrozen phases. Consequently, these distinct phases heat at quite
different rates when subjected to a dielectric field, usually resulting in localized overheating prior
to complete thawing (Fennema and Powrie, 1964).
2.2.6 Effects of Freezing on Meat Quality
It is thought that freezing reduces the meat quality and that consumers prefer meat that
has not been frozen (Lagerstedt et al., 2008).
Most physical and chemical changes occurring in foods during freezing are caused either
directly or indirectly from water to ice formation (Hanenian and Mittal, 2004). The following
factors were considered to be involved in food damage during the freezing operation: 1. Damage
pertaining to the size and location of ice crystals within the food; 2. Mechanical damage caused
by volume changes in the food structure; 3. Chemical damage resulting from the concentration of

24
non-aqueous constituents (Fennema and Powrie, 1964; Hanenian and Mittal, 2004; Sanz et al.,
1999).
Rapid freezing results in the formation of small ice crystals which cause much light
scattering, giving the meat a pale, opaque appearance. Slow-frozen meat contains large ice
crystals, which scatter less light, so that the meat has a dark, translucent appearance. These color
changes disappear on thawing (Ranken, 2000). Neither freezing method nor frozen storage time
had a significant effect on lightness (L*), but there were significant differences between fresh
and frozen treatments. This suggests L* was affected by the freezing and thawing process
(Muela et al., 2010).
Meat has a more desirable frozen color if allowed to “bloom” in air before freezing.
Metmyoglobin formation is maximal at about -12°C due to only a portion of the water being
frozen, and discoloration is greatly increased by light. It is therefore recommended that the best
storage conditions to preserve color are below -18°C and in the dark. Frozen and thawed beef
was lighter in color than fast frozen meat because of differences in thaw drip, which may have
resulted in greater light reflection and lighter color in the samples that were slowly frozen and
thawed (Farouk, Wieliczko and Merts, 2003).
Food systems undergo non-uniform changes in volume during freezing as a result of the
expansion of water into ice during the contraction of most of the other constituents.
Consequently, there will be localized areas of expansion, with a likelihood of local stresses and
mechanical damage (Fennema, 1966). When meat is frozen, the cell membranes are damaged,
which results in a lower water holding capacity and a higher cooking loss and, consequently, a
risk of less juicy meat (Wheeler et al., 1990).

25
As previously discussed, freezer burn can also be a detriment of freezing. Freezer burn
occurs when ice sublimes from unprotected areas of the meat leading to desiccation, denaturation
of proteins and oxidation of the pigments. This is in part exacerbated because moisture in
freezers is drawn towards cooling coils. To prevent this, meat should be wrapped in moisture
impermeable film (Ranken, 2000).
2.3 Packaging Overview
Fresh meat packages must provide protection from product contamination and
deterioration, product visibility, and space for label information (Aberle et al., 2012). Raw or
chilled meat will usually be displayed at retail in 1 of 3 packaging types: overwrapped, vacuum,
or modified atmosphere (MAP) (Cole, 1986). Traditional meat packaging, such as overwrapping,
uses atmospheric oxygen permeable moisture impermeable film materials to cause bloomed meat
with oxymyoglobin pigment forms. Low oxygen packaging may be vacuum packaging or MAP
with low O2. MAP and vacuum packaging may also incorporate other gases to create a controlled
atmosphere which can overcome some of the aforementioned color issues (McMillin et al.,
1999).
2.3.1 Oxygen-permeable Film Overwrapping
Polyvinylchloride (PVC) film overwrapping has historically been the most widely used
packaging of fresh meat, with PVDC (polyvinylidene chloride) films or copolymers of PVC and
PVDC more recently available. One advantage of oxygen permeable PVC is maintenance of the
bright red oxymyoglobin color, which depends on an adequate supply of oxygen. Packaging
films must, therefore, have high oxygen permeability with five liters of oxygen per m2 per day
required. Coated cellulose films and low-density polyethylenes (LDPE) have high oxygen
permeability, but low water permeability and are satisfactory (Ranken, 2000). Another advantage

26
of PVC packaging is that both the film and related equipment are relatively inexpensive and easy
to use, allowing widespread use of this method in retail stores (Cornforth and Hunt, 2008).
Most fresh meat sold in self-service stores is packaged on rigid plastic trays with a film,
such as PVC, as an overwrap. Trays provide strength to the package. Properties of overwrap are
especially important because they regulate the gaseous environment in the package. To minimize
moisture loss, the overwrap should have a low water vapor transmission rate. Fresh meat
overwraps are designed to provide an abundant amount of oxygen at the meat surface so that
there is abundant oxygen for oxymyoglobin, the bright red pigment. With good sanitation, meat
may be maintained 5-7 days (Aberle et al., 2012). When surface browning due to metmyoglobin
exceeds 40%, retail meats typically are discounted or discarded (Greene, Hsin and Zipser, 1971).
2.3.2 Vacuum Packaging
Most of the problems encountered with tray and overwrapping packaging of fresh meat
may be overcome with vacuum packaging. Composition polymer films known as laminates,
which have low water vapor and oxygen transmission rates, are used for vacuum packaging. Low
pH and absence of oxygen inhibit further bacterial growth and significantly extend the shelf life
of vacuum packaged meat up to 3 weeks (Aberle et al., 2012).
However, consumer objections to the color of such packages have inhibited wide spread
use of vacuum packaging because with no O2 present, myoglobin will be in the purple, reduced
form. The meat will retain this color for long periods in vacuum packs. Bacterial growth is
restricted under vacuum conditions, which is another advantage. The purple color is not
generally acceptable to retail consumers, but the bright red color of oxymyoglobin is restored
soon after the pack is opened (Ranken, 2000).
27
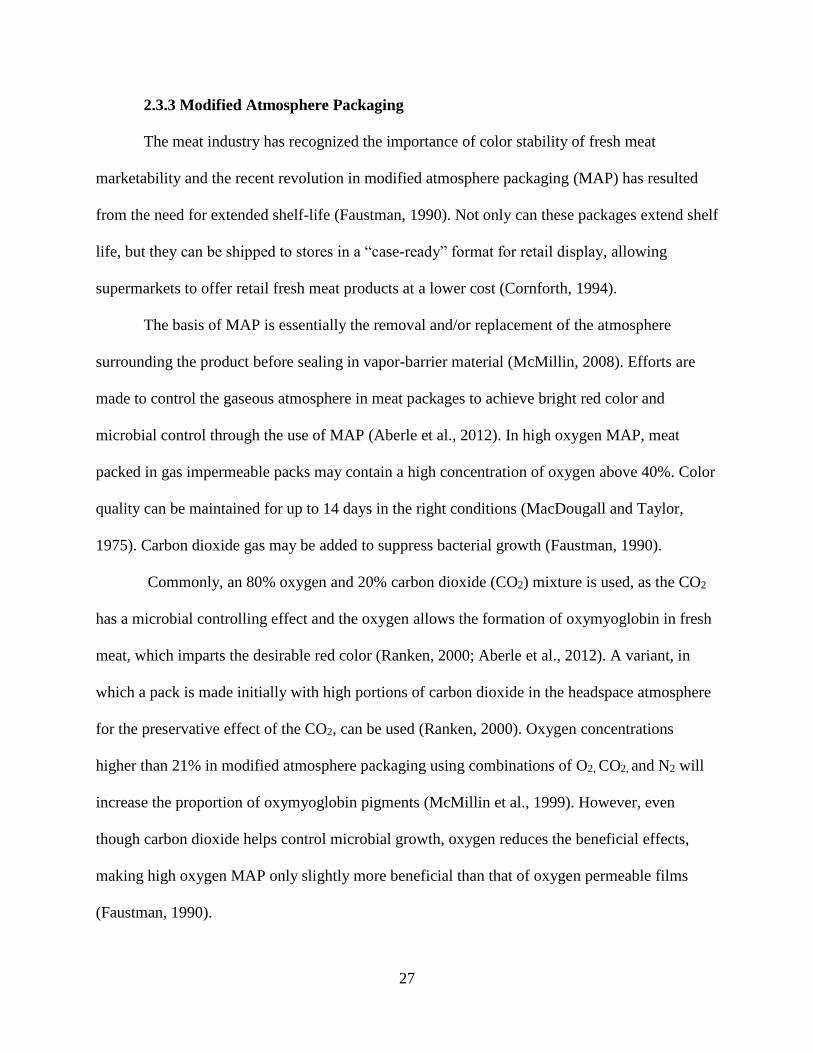
2.3.3 Modified Atmosphere Packaging
The meat industry has recognized the importance of color stability of fresh meat
marketability and the recent revolution in modified atmosphere packaging (MAP) has resulted
from the need for extended shelf-life (Faustman, 1990). Not only can these packages extend shelf
life, but they can be shipped to stores in a “case-ready” format for retail display, allowing
supermarkets to offer retail fresh meat products at a lower cost (Cornforth, 1994).
The basis of MAP is essentially the removal and/or replacement of the atmosphere
surrounding the product before sealing in vapor-barrier material (McMillin, 2008). Efforts are
made to control the gaseous atmosphere in meat packages to achieve bright red color and
microbial control through the use of MAP (Aberle et al., 2012). In high oxygen MAP, meat
packed in gas impermeable packs may contain a high concentration of oxygen above 40%. Color
quality can be maintained for up to 14 days in the right conditions (MacDougall and Taylor,
1975). Carbon dioxide gas may be added to suppress bacterial growth (Faustman, 1990).
Commonly, an 80% oxygen and 20% carbon dioxide (CO2) mixture is used, as the CO2
has a microbial controlling effect and the oxygen allows the formation of oxymyoglobin in fresh
meat, which imparts the desirable red color (Ranken, 2000; Aberle et al., 2012). A variant, in
which a pack is made initially with high portions of carbon dioxide in the headspace atmosphere
for the preservative effect of the CO2, can be used (Ranken, 2000). Oxygen concentrations
higher than 21% in modified atmosphere packaging using combinations of O2, CO2, and N2 will
increase the proportion of oxymyoglobin pigments (McMillin et al., 1999). However, even
though carbon dioxide helps control microbial growth, oxygen reduces the beneficial effects,
making high oxygen MAP only slightly more beneficial than that of oxygen permeable films
(Faustman, 1990).

28
Nitrogen (N2) has been used in place of oxygen, however, this led to meat having the
purplish color associated with vacuum packaged cuts (Aberle et al., 2012). With fresh meat to be
held in bulk, it is desirable to keep the oxygen concentration as low as possible, and preferably to
eliminate it altogether, so a combination of N2 and CO2 is commonly used (Ranken, 2000).
When compared with N2 and CO2 mixtures, meat packaged with O2 has limited distribution and
display life because color and lipid oxidation occurs within a relatively short time (Cole, 1986).
Conversely, O2 concentrations higher than 21% in modified atmosphere packaging using
combinations of O2, CO2, and N2 will increase the proportion of oxymyoglobin pigments
(McMillin et al., 1999).
The most recent meat packaging technology is anaerobic MAP with low levels (0.4%) of
carbon monoxide (CO), 20 to 30% CO2, and the remainder N2 (CO-MAP). Since 2002, CO has
been permitted as a MAP gas for use during distribution in the United States. In 2004, CO was
further permitted at low levels as a MAP gas in retail fresh meat packaging in the United States
(Cornforth and Hunt, 2008).
Packaging in CO-MAP offers several advantages over aerobic packaging with PVC or
high-oxygen MAP. A desirable red color stability associated with lower spoilage levels for as
long as 28 days, better flavor acceptability due to no oxidized flavors, no bone darkening relative
to high-oxygen, no premature browning during cooking, and increased tenderness due to less
protein oxidation in anaerobic environment and also due to longer shelf life, allowing continuous
action of endogenous tenderizing enzymes can be expected (Cornforth and Hunt, 2008).
A note on MAP gases that should be considered is that from a regulatory standpoint,
gasses are considered processing aids and not food additives and as such, their use is not listed
on the label ingredient statement (Cornforth and Hunt, 2008).

29
2.4 Goat, Goat Carcass, and Goat Meat Properties
2.4.1 Live Goat Carcass
The growth and development of goats is highly variable with genetic and environmental
influences of breed, sex, nutrition, growth-promoting agents, and climate. Goat breeds vary in
size ranging from small tropical breeds to large European breeds. The specialized meat-
producing Boer goat is the largest, reaching up to 100 kg in body weight (Warmington and
Kirton, 1990). The body compositions of goats change markedly during growth with muscle and
fat increasing and bone decreasing with the progression of maturity (Warmington and Kirton,
1990).
Fat is the most variable tissue in the carcass and increases at a rate higher than the entire
carcass, whereas muscle grows at a similar rate and bone at a lower rate (Sumarmor, Pratiwi and
Murray, 2007). This causes lean:bone, tissue:bone, and fat:lean ratios to increase as
chronological age and body weight increase (Aimerman, Domingo and Lanari, 2008).
Differences in bone and soft tissue distribution in the carcass can affect carcass conformation,
composition and the marketability of meat (Sumarmor, Pratiwi and Murray, 2007).
Some areas of the live carcass mature at different rates than others. When muscle groups
situated in the hindquarters and those in distal limbs grow at a slower rate and decrease as a
proportion of total muscle weight, this indicates that they are early maturing (Mahgoub, Kadim
and Webb, 2012).
Sex and related sex hormones also play a major role in live goat development. Male goats
often reach puberty at 4-8 months; female goats reach puberty at 7-10 months. Castration is
widely practiced as a management practice to reduce the goat male odor, aggression, and alter
the body composition (Sumarmor, Pratiwi and Murray, 2007).

30
Goats can be evaluated with live linear body measurements. These measurements are
recognized as preferable objective measurements and have been used as a predictor of goat body
composition. Age, breed, live weight and diet influence goat live body and carcass measurements
(Kadim et al., 2006).
These measurements are of great value as goats are sold on a weight basis. Therefore, the
economic value of goat carcass characteristics depends on its yield of meat as well as the cutting
and processing quality of the meat. The linear measurements reflect the proportions of the body
dimensions of the live animal to describe the changing body shape in order to predict both
animal live weight and composition. These measurements can give a good indication of the final
carcass composition (Mahgoub, Kadim and Webb, 2012).
2.4.2 Carcass Traits
Goat carcasses are thin and shallow and not as compact as in other meat-producing
animals. However, goat carcasses become thicker and more compact as carcass weight increases
(Kadim et al., 2006). The distribution of meat, bone and fat is extremely important in
determining carcass quality, value and marketability.
Goats are leaner than sheep with more fat distributed in the body cavity and less
subcutaneous fat (Mahgoub, Kadim and Webb, 2012). Goat carcasses are considerably leaner
than other livestock carcasses, chiefly because the fat tends to be concentrated around the viscera
and is separated as offal at slaughter (Owen et al., 1978). Goat carcasses usually have patch
coverage of fat less than 2-3mm and consequently, they have a high lean content (Kadim and
Mahgoub, 2012b). The greatest part of the body fat in goats is deposited in the abdomen at 40%,
followed by subcutaneous fat at 30%, intermuscular fat at 23%, and mesenteric fat at 6%
31
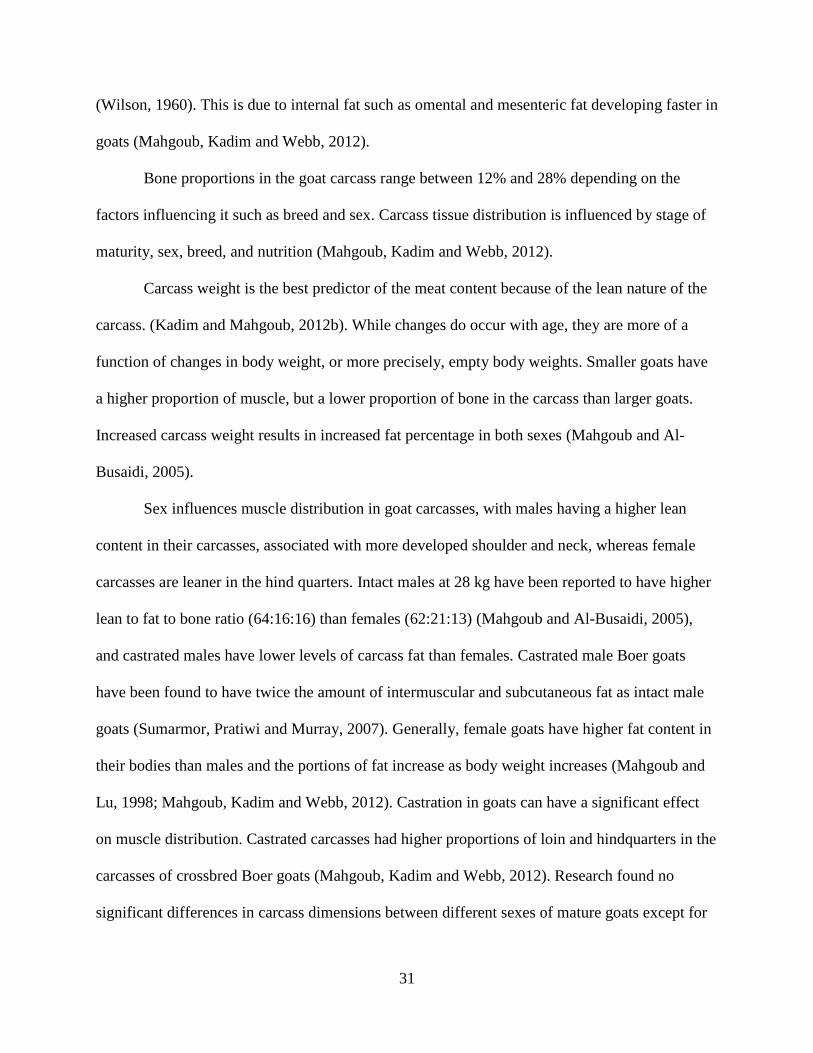
(Wilson, 1960). This is due to internal fat such as omental and mesenteric fat developing faster in
goats (Mahgoub, Kadim and Webb, 2012).
Bone proportions in the goat carcass range between 12% and 28% depending on the
factors influencing it such as breed and sex. Carcass tissue distribution is influenced by stage of
maturity, sex, breed, and nutrition (Mahgoub, Kadim and Webb, 2012).
Carcass weight is the best predictor of the meat content because of the lean nature of the
carcass. (Kadim and Mahgoub, 2012b). While changes do occur with age, they are more of a
function of changes in body weight, or more precisely, empty body weights. Smaller goats have
a higher proportion of muscle, but a lower proportion of bone in the carcass than larger goats.
Increased carcass weight results in increased fat percentage in both sexes (Mahgoub and Al-
Busaidi, 2005).
Sex influences muscle distribution in goat carcasses, with males having a higher lean
content in their carcasses, associated with more developed shoulder and neck, whereas female
carcasses are leaner in the hind quarters. Intact males at 28 kg have been reported to have higher
lean to fat to bone ratio (64:16:16) than females (62:21:13) (Mahgoub and Al-Busaidi, 2005),
and castrated males have lower levels of carcass fat than females. Castrated male Boer goats
have been found to have twice the amount of intermuscular and subcutaneous fat as intact male
goats (Sumarmor, Pratiwi and Murray, 2007). Generally, female goats have higher fat content in
their bodies than males and the portions of fat increase as body weight increases (Mahgoub and
Lu, 1998; Mahgoub, Kadim and Webb, 2012). Castration in goats can have a significant effect
on muscle distribution. Castrated carcasses had higher proportions of loin and hindquarters in the
carcasses of crossbred Boer goats (Mahgoub, Kadim and Webb, 2012). Research found no
significant differences in carcass dimensions between different sexes of mature goats except for

32
the eye muscle area, which was significantly greater in male than in female goats (Simela,
Ndlovu and Sibanda, 1999). Carcass length, chest depth, thigh circumference and eye muscle
area significantly increased with age of male goats, while fat depth over the eye muscle did not
vary with age (Simela, Ndlovu and Sibanda, 1999).
Imported feral goat carcasses from Australia had superior conformation with the same
amount of external fat, higher percentages of total primal cuts and lower percentages of total
boneless meat as carcasses from goats raised on pasture (Nuti, Pinkerton and McMillin, 2003).
Low fat cover and low fat content cause a negative effect on the storage properties of
goat carcasses with reports of 5.3% and 6.1% cold storage loss in male and female feral goats,
respectively, which is higher than that of other species (Kirton, 1970). This is largely because of
the lack of variation in subcutaneous and intermuscular fat in goat with age, due to the inherent
low priority of fat deposition in the carcass (Simela, Ndlovu and Sibanda, 1999).
Most of this loss occurs during the chilling process. The chilling process removes heat
from the carcass but also removes moisture, so the shrinkage from carcass chilling may be 3-5%
of the initial hot carcass weight (McMillin, 2010).
Dressing percentage may also have a large degree of variation. It can be rather difficult to
compare values of dressing percentages from different studies because different methods of
slaughter are applied (e.g. kidney, kidney fat, head removal). Values vary between 44% and
55%. The dressing percentage is lower for male than female goats with this difference increasing
with age (Mahgoub and Al-Busaidi, 2005). Removal of the head will result in 5-7% less
dressing percentage (McMillin, 2010). Dressing percentage rises with increasing slaughter
weight and length of feeding period. Dressing percentages of kid and yearling male and female

33
meat goats with different body conformations were relatively constant at 48-52% when the goats
were withheld from feed overnight before harvest (McMillin et al., 1998).
Having an understanding of all of the factors attributed to goat carcass characteristics has
allowed the ability to evaluate carcasses by assessing the conformation and distribution of
muscle and fat in the carcass. Carcass quality characteristics can be evaluated by assessing the
conformation of the carcass and the amount of distribution of muscle and fat in a carcass (Kadim
and Mahgoub, 2012b).
2.4.3 Carcass Evaluation
Carcasses of meat animals are often evaluated to determine the relative ratios of lean, fat,
and bone, and to provide an estimation of the palatability of the meat to be produced. Even
though there are no official USDA grades for goat carcasses as for other major livestock species,
it is useful to classify goat carcasses into groups for marketing and pricing (McMillin and
Pinkerton, 2008). Selection classifications give an indication of the ratio of muscle to fat and
bone and the relative amount of meat that may be obtained from the carcass:
Selection 1 – Goat carcasses in selection 1 have a superior meat conformation and
give the highest meat:bone ratio and lean meat yields. The carcass has thick leg
muscling, bulging outside leg muscling, full muscling along the back and through the
loin and rib, and thickness in the loin and leg junction and shoulder.
Selection 2 – Goat carcasses in selection 2 have moderate muscling, with slightly
thick and slightly bulging leg muscles, slightly full Longissimus dorsi muscling in the
loins and ribs slightly thick shoulders, and lack of muscling in the loin and leg
junction.

34
Figure 4. Goat carcass evaluation selection classifications.

35
Figure 5. Kidney, pelvic, and heart fat scores.
Selection 3 – Goat carcasses in selection 3 have deficient muscling and produce low
yields of lean meat relative to the body size and weight. The carcasses are narrow and
lack depth with moderate leg muscling, shallow rib and loin muscling, and slightly
thin shoulder muscling. The deficient muscling may contribute a shrunken
appearance of the carcass and a well-defined depression along the top of the back and
at the junction of the loin and leg.
These selection classifications are used by the Institutional Meat Purchase Specifications
for Fresh Goat (USDA, 2001) and are illustrated by Figure 4.
It should be noted that within each selection, a score of 1-99 may be assigned for added
differentiation, making a carcass evaluation of 199 the highest possible evaluation score and an
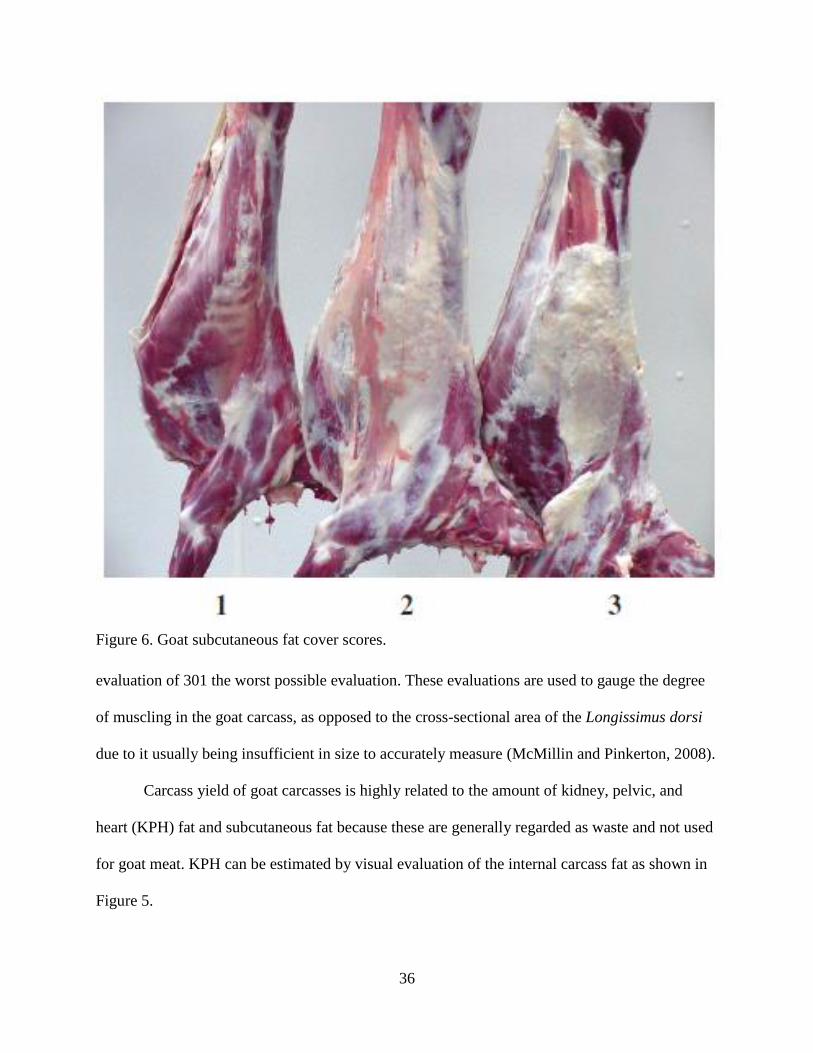
36
Figure 6. Goat subcutaneous fat cover scores.
evaluation of 301 the worst possible evaluation. These evaluations are used to gauge the degree
of muscling in the goat carcass, as opposed to the cross-sectional area of the Longissimus dorsi
due to it usually being insufficient in size to accurately measure (McMillin and Pinkerton, 2008).
Carcass yield of goat carcasses is highly related to the amount of kidney, pelvic, and
heart (KPH) fat and subcutaneous fat because these are generally regarded as waste and not used
for goat meat. KPH can be estimated by visual evaluation of the internal carcass fat as shown in
Figure 5.

37
Goats do not generally deposit fat over the Longissimus dorsi as do lambs, cattle, and
pigs. The low proportion of subcutaneous fat on goat carcasses makes subcutaneous fat thickness
measurements a poor criterion for meat yield (Webb, Casey and Simela, 2005). Because of this
low level of subcutaneous fat, fatness over the ribs and behind the shoulder is used as a relative
indicator of waste fat that will be trimmed from the carcass, which will lower meat yield. A
subjective estimation of the subcutaneous fat covering is made for goat carcasses rather than an
objective linear measurement because the fat deposition pattern is not uniform over the body,
making it difficult to accurately measure the thickness of the fat covering. The three degrees of
fat cover scores are in Figure 6 (McMillin and Pinkerton, 2008).
2.4.4 Goat Meat Properties
Many factors affect the properties of postmortem goat meat. The tenderness and color
properties of chevon have been found to be highly dependent on postmortem pH and temperature
attained by the carcasses, with fast pH decline and slow chilling improving the tenderness and
color (Simela, Ndlovu and Sibanda, 1999).
In goats, tenderness is highly influenced by crosslinking of collagen and muscle fibers,
with collagen content higher, solubility lower, muscle fibrils thicker, and bundles larger than
sheep, giving a coarse texture (Webb, Casey and Simela, 2005). These proportions of crosslinked
collagen in muscle cause a decrease in collagen solubility upon cooking, which decreases
tenderness (Warmington and Kirton, 1990). Tenderness in goat, as in other species, can be
improved through aging as Warner-Bratzler shear values were found to be less with 6 days of
aging than 1 day of aging of Longissimus, Biceps femoris, Semimembranosus, and
Semitendinosus (Kannan et al., 2003). Aging for 3 days, however, was not shown to improve

38
tenderness, whereas aging for 14 days decreased shear force of Gluteobiceps muscles from 11 kg
goat carcasses (King et al., 2004).
Factors such as age of a goat when harvested have also been found to decrease tenderness
and juiciness (Warmington and Kirton, 1990). This is supported by research that found
tenderness of muscles from yearling goats to be less than of kid goats (McMillin et al., 1998).
The aforementioned conformation score of a goat carcass also appears to be correlated to
tenderness, as the leg slices in meat from yearling goats and kid goats with low conformation
were less tender than leg meat from kid goats having medium or high conformations (Phelps et
al., 1999). As tenderness relates to sex of the animal, leg and back muscles from female goats
had lower shear force and would be expected to be more tender than the same muscles from
wethers and intact males (Johnson et al., 1995). Other factors of breed, muscle type and
processing conditions can also influence shear force and tenderness (Webb, Casey and Simela,
2005; Kannan, Kouakou and Gelaye, 2001).
After tenderness, juiciness is widely considered the second most important quality of
palatability (Aberle et al., 2012). Increased age of goat was also reported to increase drip loss,
with the meat from older animals being judged to have lower initial and sustained juiciness than
goat meat from younger animals (Schonfeldt et al., 1993). More water has been shown to be lost
from goat meat cuts through longer storage periods (Morales-delaNuez et al., 2009; Morales-
delaNuez et al., 2011).
There are multiple factors that can cause color to be less desirable in fresh goat meat. In
two-hour transportation, stress pre slaughter did not alter water-holding capacity or shear force,
but it decreased redness and chroma values in meat from young goats. Older goats were more
resistant to transportation stress, however, and showed no effect on chroma values of loin cuts

39
(Kannan et al., 2003). Diet has been shown to be able to affect the lightness (L*) of meat,
however the redness was unaffected in those studies (Lee, Kouakou and Kannan, 2008).
2.4.5 Packaging and Storage Effects on Goat Meat
Color and other shelf-life characteristics decline with increased storage time. Shoulder
cuts were the most red with the highest chroma and lowest hue. Surface discoloration of all
packaged cuts occurred within 4 to 8 days, which is similar to the case-life of other species. Leg,
shoulder/arm, and loin/rib cuts packaged in vacuum were slightly more tender than those in air-
permeable film, with lower shear force in Longissimus than in Semimembranosus and in Triceps
brachii (Kannan, Kouakou and Gelaye, 2001). Lean color score and overall appearance
decreased as surface discoloration increased during 4-day storage of goat rib chops in retail
overwrap packaging at 2°C, but there was no breed influence on these traits (Oman et al., 1999;
Kannan, Kouakou and Gelaye, 2001).
Vacuum and MAP (30:30:40 mixture of N2:O2:CO2) packaging of fresh goat meat
increased L* at 5 days of storage. After 5 days, L* in vacuum began to decrease with MAP
remaining constant (Morales-delaNuez et al., 2011). Another study found goat meat in MAP
(10:70:20 mixture of N2:O2:CO2) and vacuum packaging to be significantly lighter (higher L*)
on day 3, with meat in atmospheric air, MAP, and vacuum packaging being lighter than their
initial values on day 5. MAP and vacuum packaging also resulted in lighter meat than
atmospheric air on day 5 (Morales-delaNuez et al., 2009). Neither study found a packaging
treatment effect on the a* coordinate before 7 days, nor storage time effect on a* with storage of
3 days. At 5 days, b* coordinate was unchanged in vacuum packaging, however b* was
significantly higher in atmospheric air and both MAP gas concentrations (30:30:40 and 10:70:20
mixtures of N2:O2:CO2) by day 3. MAP and vacuum treatments had a higher percent of drip loss
40
in the packages than did atmospheric air packaging at 3 days. WHC also increased with storage
time across all packages, pointing to an inverse relationship, as meat lost more water during
storage, decreasing the ability of meat to expel water on compression (Morales-delaNuez et al.,
2009; Morales-delaNuez et al., 2011).
Longer shelf life of goat meat can be achieved with specific types of packaging. Vacuum
packaging lengthened the shelf-life 28 days compared with aerobic packaging life of 3 days
when comparing packs of minced goat meat (Babji, Murthy and Anjaneyulu, 2000). MAP also
holds promise to greatly extend shelf life (McMillin, 2008).

41
CHAPTER 3: CARCASS EVALUATION AND CARCASS YIELD
DIFFERENCES
3.1 Introduction
Carcasses of meat animals are often evaluated to determine the relative ratios of lean, fat,
and bone, and to provide an estimation of the palatability of the meat to be produced (McMillin
and Pinkerton, 2008). Carcass tissue distribution is influenced by multiple factors, such as stage
of maturity, sex, breed, and nutrition (Mahgoub, Kadim and Webb, 2012).
It has been reported that imported feral goat carcasses from Australia had superior
conformation with the same amount of external fat, higher percentages of total primal cuts, and
lower percentages of total boneless meat as carcasses from goats raised on pasture (Nuti,
Pinkerton and McMillin, 2003).
The present study was designed to evaluate carcass differences and carcass yield
differences by comparing primal cut yields from representative frozen Australian goat carcasses
and from representative United States kid goats after both fresh and frozen storage. Yields were
compared both as a percentage of side and a percentage of carcass to take thaw loss of frozen
sides into account.
With the previous research in mind, the hypotheses were that frozen United States goat
meat carcasses would have higher percentages of primal cuts than frozen Australian goat
carcasses and that United States goat carcasses would have higher conformation, fat and flank
color scores when evaluated. Finally, a negative effect on overall yield and cut yield when
comparing the frozen domestic goat meat with the fresh domestic goat meat was expected.
42
3.2 Materials and Methods
3.2.1 Animal Use
Institutional animal care and use committee approval was not obtained because all
carcasses were obtained from approved state inspection abattoirs or from licensed meat brokers.
3.2.2 Apparatuses
Butcher Boy band saw (model SA20-F, Lasar Mfg. Company, Inc. Los Angeles, Ca)
3.2.3 Goat Side Samples
Two groups of 20 kid meat goats (n=40) were purchased from local domestic sources and
two groups of 20 frozen Australian goat carcasses (n=40) were obtained from a commercial
importer. All four groups would be reduced to a uniform number of carcasses (n=15 per group)
after harvest and carcass evaluation.
Both groups of domestic kids were comprised of a variation of buckling and doelings,
mainly of Boer and Spanish breed types. The first group was sourced from a local processor who
obtained them from Texas sources. The second group produced by a Mississippi goat producer
was purchased from a Mississippi processor. After being held off feed for one day with water
always being accessible, goats were transported to the LSU abattoir for harvest. Goats were
humanely slaughtered under Louisiana state meat inspection program supervision.
After overnight chilling at 4°C, for 24 hours, carcass conformation was evaluated
independently by two trained meat scientists and estimates of the kidney, pelvic and heart fat
(KPH), flank color and fat score were recorded. All measurements were taken using standard
guidelines (McMillin and Pinkerton, 2008). After removing carcasses with spool joints, the most
uniform carcasses (n = 30) were then selected based on the carcass evaluation. Spool joints are
43
an indication of older animals due to greater conversion of cartilage to bone within the joint
(Aberle et al., 2012).
Fabrication began with the neck being removed from the carcasses using a Butcher Boy
band saw. Carcasses were split along the vertebral column into left and right sides with the band
saw. The neck and each side were weighed. The reason for removal of the neck prior to splitting
was to achieve a more uniform division between sides, as the neck can be hard to control safely
while attached to the carcass during sawing into sides. Left sides were then fabricated as fresh
domestic sides. Right sides were wrapped in multiple layers of 0.6 mil polyvinyl chloride (PVC)
barrier film before being frozen in a -33°C blast freezer and stored for 6 weeks until thawed.
Thawing occurred with the carcass hung from hooks in an open air cooler at 4°C for 72 hours.
Every effort was made to replicate the freezing conditions of the frozen Australian
carcass reported by the Australian processor. PVC was applied in the same manner as for the
Australian carcasses, with the exception that the frozen domestic sides were frozen as only sides
of a carcass which could have affected freezing rates. This confounding variable was outweighed
by the need to compare fresh and frozen sides of the same carcasses.
The kidney, pelvic and heart fat (KPH) were removed from the fresh domestic sides and
weighed. Then the sides were cut according to USDA Institutional Meat Purchase specifications
Hotel style with an additional straight cut immediately anterior to the femur-pelvic joint (as
shown in IMPS Food Service style) (USDA, 2001). The additional cut removed the sirloin
portion from the leg for a later experiment. An example of this fabrication style can be observed
in Figure 7.

44
Figure 7. USDA IMPS Hotel style with an additional straight cut immediately anterior to the
femur-pelvic joint.
The weight of each cut (loin plus sirloin, rack, leg, hind shank, rib, shoulder, and fore
shank) was obtained. The trotters along with miscellaneous bone fragments, connective tissue,
and fat trimmed from the cuts were deemed as waste.
Two groups of 20 frozen Australian goat carcasses (n=40) were obtained from a
commercial importer and transferred to a -33°C storage freezer upon receipt. After slaughter in
the Brooklyn, Victoria, Australia plant, the carcasses were chilled for approximately 8 hours
(4°C), wrapped in multiple layers of PVC with a netting over each carcass, then blast frozen for
approximately 24 hours at -30°C before being loaded into shipping containers at -21°C. Transit
time from Australia to the Philadelphia, Pennsylvania, U.S.A., port of entry was 4 weeks
(Ovenden, 2013). Sides were then shipped in a cold storage transit truck to the LSU meat
laboratory facility in Baton Rouge, LA. Sides arrived wrapped in multiple layers of PVC with
each carcass inside of a protective netting. After arriving at the LSU meat laboratory, sides were
kept in frozen storage at -33°C for an additional 2 weeks for a total of 6 weeks frozen storage.

45
Frozen imported carcasses and frozen domestic sides were hung and thawed in a storage
cooler at 4°C for 3 days. After hanging from hooks, the PVC was removed from sides and
carcasses exposing the surface of the carcass during the 3 day thawing process. After thawing,
Australian carcasses were evaluated for the same criteria as the domestic carcasses (McMillin
and Pinkerton, 2008). Following evaluation, Australian carcasses were weighed, the neck
removed and weighed, and then carcasses were split along the vertebral column into right and
left sides. Right sides were weighed and retained for the remainder of the experiment. After the
three day thawing period, domestic sides were weighed and fabricated. Fabrication for both
frozen domestic and frozen Australian occurred on the third day of thawing 6 weeks postmortem.
3.2.4 Statistical Analysis
Prior to data analysis, all weights were converted to percent of carcass and percent of side
(thawed side for frozen carcasses) for comparative purposes. Data was compared as both a
percentage of side weight and a percentage of carcass weight as the percentage of side weight
accounted for any difference in weight due to thaw loss from the frozen sides.
All data was analyzed with SAS 9.4. Weight and evaluation scores were compared for
domestic and imported carcasses using the Proc TTest function. Primal cut yield data was
analyzed with Proc GLM for comparison of group means using the Tukey function. Paired T-
tests were conducted for fresh domestic and frozen domestic sides from the same carcass. Paired
data was analyzed using the Proc Paired TTest function. Significance for all statistical analyses
was determined at P<0.05.
3.3 Results and Discussion
Means and standard error of carcass traits for United States domestic and Australian
Imported goat carcasses are in Table 1. Domestic carcasses had higher (P<0.05) mean weights

46
than the imported Australian carcasses, with Australian carcasses having a lower (P<0.05) fat
score, which indicated that the carcasses were leaner. Conformation score and flank color
between the two groups were not different (P>0.05).
Table 1. Means and S.E.M. of carcass traits for United States domestic and Australian imported
goat carcasses
Trait U.S. domestic Australian imported
Carcass weight, kg
S.E.M.1
15.49a
1.12
13.76b
1.77
Conformation score2
S.E.M.1
236.67a
7.43
243.67a
5.33
Flank color2
S.E.M.1
180.00a
6.25
178.33a
6.36
Fat score2
S.E.M.1
1.79a
0.18
1.69b
0.49
1Standard error of mean 2Values are a subjective score abMeans in the same row lacking a common superscript letter differ (P<0.05)
Means and standard error of primal cuts as percentages of fresh domestic, frozen
domestic and imported Australian thawed side weights without neck or kidney, pelvic, and heart
fat are in Table 2. There were no differences (P>0.05) in percentages of loin, rack and leg
between frozen domestic and frozen Australian goat carcasses. The percentages of rack and leg
for frozen domestic and frozen Australian were different (P<0.05) than for the fresh domestic
cuts, but there were no differences (P>0.05) in percentages of rib and fore shank among the three
groups. Australian goat carcasses had higher (P<0.05) percentages of hind shank and shoulder
than the domestic fresh and frozen carcasses. Waste was a higher (P<0.05) percentage of
domestic fresh and frozen carcasses than the Australian frozen carcasses.

47
Means and standard errors of primal cuts as percentages of carcass weights without neck
or kidney, pelvic, and heart fat are in Table 3. Primal cuts as a percentage of carcass weight were
not different (P>0.05) for rib and hind shanks. Loins, hind shanks and shoulders were a higher
(P<0.05) percentage of the thawed Australian side weights than the fresh or frozen domestic
sides. Australian frozen and domestic frozen racks were a higher (P<0.05) percentage of carcass
than fresh domestic sides. These percentages were similar to those reported previously for
domestic and imported goat carcass cut yields (Nuti, Pinkerton and McMillin, 2003). Australian
frozen and thawed sides also had less waste than domestic frozen and thawed or unfrozen goat
carcass sides.
Table 2. Means and S.E.M. of primal cuts as percentages of thawed side weights without neck or
kidney, pelvic, and heart fat
Primal cut Fresh Domestic Frozen
Domestic
Frozen
Australian
S.E.M.1
Loin 13.67a 13.75ab 14.21b 0.002
Rack 7.67a 8.53b 8.56b 0.002
Leg 20.16a 20.95b 20.42ab 0.003
Hind shank 3.50a 3.42a 3.98b 0.001
Rib 13.66a 13.05a 12.41a 0.003
Shoulder 26.77a 26.4 a 29.38b 0.003
Fore shank 4.67a 4.53a 4.29a 0.001
Waste2 9.63a 9.25a 6.41b 0.002
1Standard error is reported as the average for the combined 3 treatments 2Waste is all separable bone, connective tissue, and fat. Does not contain KPH abMeans in the same row lacking a common superscript letter differ (P<0.05)
Paired comparisons indicated that fresh domestic right sides weighed more (P<0.05) than
the fresh domestic left sides. The reason was likely not because there were true differences in side
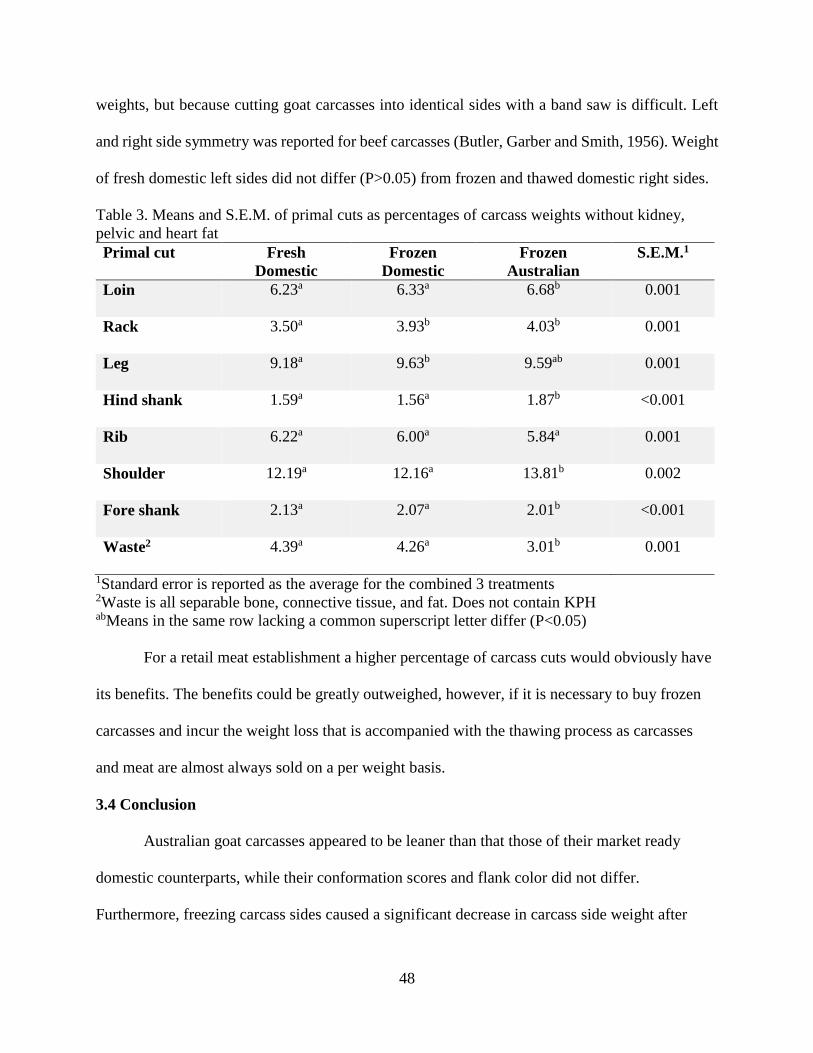
48
weights, but because cutting goat carcasses into identical sides with a band saw is difficult. Left
and right side symmetry was reported for beef carcasses (Butler, Garber and Smith, 1956). Weight
of fresh domestic left sides did not differ (P>0.05) from frozen and thawed domestic right sides.
Table 3. Means and S.E.M. of primal cuts as percentages of carcass weights without kidney,
pelvic and heart fat
Primal cut Fresh
Domestic
Frozen
Domestic
Frozen
Australian
S.E.M.1
Loin 6.23a 6.33a 6.68b 0.001
Rack 3.50a 3.93b 4.03b 0.001
Leg 9.18a 9.63b 9.59ab 0.001
Hind shank 1.59a 1.56a 1.87b <0.001
Rib 6.22a 6.00a 5.84a 0.001
Shoulder 12.19a 12.16a 13.81b 0.002
Fore shank 2.13a 2.07a 2.01b <0.001
Waste2 4.39a 4.26a 3.01b 0.001
1Standard error is reported as the average for the combined 3 treatments 2Waste is all separable bone, connective tissue, and fat. Does not contain KPH abMeans in the same row lacking a common superscript letter differ (P<0.05)
For a retail meat establishment a higher percentage of carcass cuts would obviously have
its benefits. The benefits could be greatly outweighed, however, if it is necessary to buy frozen
carcasses and incur the weight loss that is accompanied with the thawing process as carcasses
and meat are almost always sold on a per weight basis.
3.4 Conclusion
Australian goat carcasses appeared to be leaner than that those of their market ready
domestic counterparts, while their conformation scores and flank color did not differ.
Furthermore, freezing carcass sides caused a significant decrease in carcass side weight after

49
thawing. It is also observed that freezing and thawing can cause different primal cuts to change
as a percent ratio when compared to their side or to the cold carcass weight. These percentages
were similar to those reported previously for domestic and imported goat carcass cut yields
(Nuti, Pinkerton and McMillin, 2003).

50
CHAPTER 4: QUALITY DIFFERENCES AMONGST GROUPS OF GOAT
LEGS
4.1 Introduction
It has long been accepted that freezing reduces the meat quality and that consumers prefer
meat that has not been frozen (Lagerstedt et al., 2008). When meat is frozen, the cell membranes
are damaged, which results in a lower water holding capacity and a higher cooking loss and
consequently a risk of less juicy meat (Wheeler et al., 1990).
Freezing can also have an effect on the color properties of meat. Past research has shown
that L* was affected by the freezing and thawing process, pointing toward a darkening (lower
L*) of meat after the freezing and thawing process (Muela et al., 2010).
Though the later loin and rib tests in this study will examine many of these properties,
previous research has shown cooking losses were highest in leg cuts, intermediate in
shoulder/arm cuts, and lowest in loin/rib cuts (Kannan, Kouakou and Gelaye, 2001). This lower
expected yield coupled with the desire to quantify the effects of freezing on another highly
valuable cut from the goat carcasses (McMillin and Brock, 2005) is the principle reason for this
experiment.
The objective of this research was to determine differences in color, water holding
capacity (WHC) and yields of leg primal cuts from fresh domestic, frozen domestic and frozen
imported goat leg groups. The hypothesis was that fresh legs would have lower losses and water
holding capacity as a result of more free water, and more desirable overall color values than
frozen legs.

51
4.2 Materials and Methods
4.2.1 Apparatuses
Minolta Reflectance Spectrophotometer (model CM 508d, Konica Minolta, USA); Koch
smoke house (Market Master, Model 32-00-45); Carver laboratory press (Model C, Wabash, IN);
Topcon digital planimeter (Model KP-82N, Japan)
4.2.2 Leg Samples
This experiment was only performed on the first group of domestic goat (n=15) and the
first group of imported Australian carcasses (n=15). Legs (n=45) were removed for all groups
(fresh domestic, frozen domestic, frozen imported) during the carcass cutting described in the
previous chapter, yielding 15 legs from each group.
The leg sample was removed by a straight cut immediately anterior to the ball of the
femur, separating the leg from the sirloin and separating the shank from the leg with a cut above
the stifle joint (USDA, 2001). After cuts were made, legs were vacuum packaged in 5 mil
vacuum pouches (30.48 cm x 35.56 cm, Koch # 120-425) to prevent excess moisture loss and
held overnight in a 4°C cooler. The legs were removed from the package the next day.
Fresh legs were 2 days postmortem and frozen legs were 1 day removed from completion
of a three day thawing process making them 6 ½ weeks postmortem. Upon removal from the
package, a post pack weight was taken. Drip loss was then calculated as post package weight
divided by prepackage weight and then subsequently was converted to a percentage.
A 10-20g sample was taken from the surface of the Semimembranosus, and fat and
connective tissue were removed by a trained worker to make a retail style leg cut. The sample
was then set aside for later water holding capacity testing. After the sample was removed, the
legs were given 5 minutes to bloom, then color was taken from the sampled area.

52
A precooking weight was obtained. Then, legs were cooked in a smoke house to an
internal temperature of 70°C. Upon removal from the smoke house, legs were chilled overnight
in a 3°C cooler on open air racks. The following day, samples were blotted dry and cooked
weight was obtained. Water holding capacity of each leg was measured on the sample taken from
the Semimembranosus by the Carver press method.
4.2.3 Leg CIELAB Color Measurements
A reflectance spectrophotometer to measure CIELAB L* (lightness), a*
(redness/greenness) and b* (yellowness/blueness) was placed on the surface of each leg where
the sample had been removed. The instrument was calibrated against ceramic white and black
standard plates prior to each measuring session. The spectrophotometer aperture opening was
10.31 mm, illumination type D65, with optical geometry of 45° and an observer angle of 2°.
Three random readings at different locations per sample were taken along the surface of the raw
meat with the colorimeter set to record the average of three measurements and give the average
of each reading for accuracy. Prepackage and post package chroma C = (a*2 + b*2)1/2 and hue
angle HA= (arctan (a*/b*)) were calculated later in SAS 9.4.
4.2.4 Leg Cooking
The legs were cooked in three batches, grouped into five legs per batch by the numerical
order of their tag number. Cooking was done in a Koch smoke house at a temperature of 82°C
with 50% humidity. Cooking was completed when legs reached an internal temperature of 70°C.
After cooking, the samples were chilled on wire racks in a 4°C cooler for 24 hr. before post
cooked weights were obtained. The cook loss and total loss were then calculated as cook loss =
(cooked wt./precook wt.)*100 and total loss = (cooked wt./prepackage wt.)*100.

53
4.2.5 Water Holding Capacity of Leg Sample
Water holding capacity of the Semimembranosus was obtained using the Carver press
method (Sebranek, 1978). Samples of approximately 3 g were placed onto #4 filter paper
between Plexiglas plates on a Carver laboratory press and subjected to 3000 psi of pressure for 3
minutes. Tests were performed in triplicate.
The areas of moisture and the meat were traced on the filter paper and later measured
with a Topcon digital planimeter to the closest one-hundredth square inch and converted to
square cm. Water holding capacity was calculated as total area divided by meat area with lower
ratios indicating greater water holding capacity (Sebranek, 1978).
4.2.6 Statistical Analysis
Data was analyzed with SAS 9.4 Proc GLM for comparison of batch and group means
using the Tukey function. Paired T-tests were conducted for domestic fresh and frozen counter
parts. Paired data was analyzed using the Proc Paired TTest function. Significance for all
statistical analyses was determined at P<0.05.
4.3 Results and Discussion
Means and standard errors on influence of storage treatment and cooking batch on loss,
relative water holding capacity, CIELAB color values, and tenderness are in Table 4.
There was no influence of batch within group (P>0.05) for any parameter. Comparing
Tukey means indicated that frozen imported legs had higher (P<0.05) drip loss and cook loss, but
had lower (P<0.05) color values for L*, a*, b*, chroma, and hue angle than the frozen domestic
legs or fresh domestic legs. Lower (P<0.05) L* signifies darker meat while a lower (P<0.05)
chroma signifies less saturation of color. The lower (P<0.05) hue angle is normally a desirable
trait as it points to greater redness. However, with lower (P<0.05) a* (redness) values than other

54
groups, frozen Australian legs only had a lower hue angle due to lack of color saturation in b*
(yellowness). Frozen Australian legs also had a lower (P<0.05) WHC ratio than did legs in the
domestic groups, which indicates a greater relative water holding capacity, likely due to loss of
unbound water in the drip during the thawing process. This is supported by research that found
WHC increased with increased moisture loss during storage (Morales-delaNuez et al., 2009).
Table 4. Means and standard errors on influence of storage treatment and cooking batch on loss,
relative water holding capacity, CIELAB color values2, and tenderness. COOK
LOSS
DRIP
LOSS
TOTAL
LOSS
WHC L* a* b* Chroma Hue
angle
Fresh Batch 1 16.01%a 0.40%a 24.71%a 2.52a 39.33ab 20.29a 12.73a 23.97a 36.10a
Domestic Batch 2 14.50%a 0.36%a 20.86%a 2.42a 41.02a 17.25ab 11.16a 20.56ab 37.24a
Batch 3 15.54%a 0.36%a 20.71%a 2.37a 37.36ab 19.67a 11.69a 22.89a 33.80ab
All 15.02%E 0.37%E 22.09%E 2.44E 39.24E 19.07E 11.86E 22.47E 35.52E
Frozen Batch 4 15.01%a 0.94%a b 21.55%a 2.46a 34.39bc 16.67abc 10.05ab 19.48abc 34.38ab
Domestic Batch 5 13.48%a 0.79%ab 20.18%a 2.42a 35.69b 16.33abc 9.60abc 18.96abcd 33.23ab
Batch 6 13.56%a 0.99%ab 21.75%a 2.42a 34.88bc 18.36a 10.76a 21.63a 35.52a
All 14.02%E 0.91%E 21.16%E 2.43E 34.99F 17.12E 10.14F 20.03E 34.38E
Frozen Batch 7 17.43%a 1.14%ab 24.64%a 2.21a 29.03d 12.17c 6.56bc 13.84cd 30.94ab
Australian Batch 8 14.13%a 1.57%b 21.29%a 2.11a 30.41cd 13.32bc 6.55bc 14.86bcd 28.07b
Batch 9 14.56%a 1.23%ab 21.72%a 2.06a 30.32cd 11.91c 5.93c 13.31d 28.65b
All 15.37%E 1.31%F 22.55%E 2.13F 29.92G 12.47F 6.35G 14.00F 29.22F
Standard Error1 0.01 .001 0.01 0.05 0.68 0.54 0.44 0.68 0.57
1Standard error is reported as the average for the combined 3 treatments 2L* = lightness; a* = redness; b=yellowness; hue angle = tan-1(b*/a*), where lower values
indicated more redness; chroma = saturation index = (a*2+b*2)1/2. a-dMeans for batches in the same column lacking a common superscript letter differ (P<0.05) EFGMeans group (ALL) in the same column lacking a common superscript letter differ (P<0.05)
There were no differences (P>0.05) in properties between the fresh and frozen domestic
legs with the Tukey comparisons except for L* and b*. However, when comparing the fresh and
frozen domestic legs using paired t-tests, the frozen domestic legs had higher (P<0.05) drip loss

55
and cook loss. Color values for L*, a*, b*, chroma and hue angle were lower (P<0.05) than the
fresh domestic legs. The paired data of frozen domestic means and fresh domestic means showed
that the means of frozen Australian legs more closely resembled those of the frozen domestic
means. This indicates that the differences seen in frozen Australian carcasses are likely due to the
freezing and thawing process as they closely aligned with the frozen domestic sides.
The differences in loss and the differences in color between the frozen and fresh samples
are closely aligned with previous research done by Wheeler et al. (1990) and Muela et al. (2010).
Both of these differences point to the undesirable effects related to frozen goat meat.
4.4 Conclusion
It was concluded that freezing and thawing of goat legs will increase drip and cook losses
and decrease color values, resulting in less desirable characteristics than fresh domestic goat
meat. It was also observed that means of frozen Australian samples resemble the means of frozen
domestic samples more closely than those of the fresh domestic samples, leading to the
conclusion that the differences in characteristics between the fresh domestic samples and frozen
domestic samples was likely due to freezing and thawing.

56
CHAPTER 5: LOIN AND RACK STUDY
5.1 Introduction
In a 2013 survey, of the people surveyed who had purchased goat meat in the last year,
85.8% purchased cuts, 5% purchased live goats, and 9.2% purchased both. Goat eating
consumers prefer chops and cubs over whole and half carcasses (Harrison, 2013). With loin and
rib cops being considered the most valuable cuts in the carcasses (McMillin and Brock, 2005)
and more frozen imported goat meat being consumed in the United States than ever before
(Pinkerton and McMillin, 2015), an in-depth look at the effects of freezing across multiple retail
packaging types was warranted.
As previously discussed in the leg study, when meat is frozen, the cell membranes are
damaged, which results in a lower water holding capacity and a higher cooking loss, and
consequently a risk of less juicy meat (Wheeler et al., 1990). Freezing can also have an effect on
the color properties of meat. Past research has shown that L* was affected by the freezing and
thawing process, pointing toward a darkening (lower L*) of meat after the freezing and thawing
process (Muela et al., 2010)
Other research in goat meat has found packaging type and display time to have
significant effects on color values and drip loss (Morales-delaNuez et al., 2009; Morales-
delaNuez et al., 2011; Kannan, Kouakou and Gelaye, 2001).
While previous research has compared the differences in PVC, VAC and MAP (with both
70% and 30% O2) (Morales-delaNuez et al., 2009; Morales-delaNuez et al., 2011), no research
was found that examined at the effects of MAP containing carbon monoxide (CO). With carbon
monoxide becoming a more common processing aid since its legalization in 2004 (Cornforth and
Hunt, 2008), and with the desirable carboxymyoglobin effects with previously frozen meat not
57
being available in the literature, the effects MAP (0.5:19.5:80 mixture of CO:CO2:N2) were
examined.
The present study was designed to compare losses, color, and Warner-Bratzler shear force
of rib and loin chops from representative fresh domestic, frozen domestic and frozen Australian
goat carcasses across three different packaging treatments of modified atmospheric packaging
(MAP), vacuum packaging (VAC), and overwrap polyvinylchloride film (PVC). The hypotheses
were that chops from fresh domestic goat would have less loss, more desirable color, and lower
Warner-Bratzler shear force values compared to chops from frozen carcasses, and that the frozen
domestic carcasses would mimic the traits seen in the frozen Australian carcasses. It was also
thought that fresh domestic chops would have more desirable traits in all packages. Carbon
monoxide at 0.5% was used in MAP packaging to determine if the thawed chops could overcome
the discoloration due to freezing by the binding of CO with myoglobin to give a bloomed color.
5.2 Materials and Methods
5.2.1 Apparatuses
Butcher Boy band saw (model SA20-F, Lasar Mfg. Company, Inc. Los Angeles, Ca);
Extech light meter (Extech instruments, model L085074, Burlington, Vt.); Multivac tray sealer
(model T200, Kansas City, MO); Mocon Pack Check (Model 333, Mocon Inc., Minneapolis,
MN); Turbovac vacuum packaging machine (Howden Food Equipment B.V., The Netherlands);
Win Holt overwrapping packager (Win Holt Equipment Group Dallas, TX); Hotpoint broiler
oven (Hotpoint Co., div. of General Electric Company, Chicago, IL); Texture Technologies (TI-
HDi Texture Analyzer. Scarsdale, New York); Minolta Reflectance Spectrophotometer (model
CM 508d, Konica Minolta, USA)

58
5.2.2 Gases
The gas cylinders were obtained from Air Liquide Co. (Baton Rouge, LA) and certified
to be within ± 0.5% of the indicated mixture: Gas 1 – Aligal 12 80% Nitrogen, 20% CO2; Gas 2
– Aligal mixture 80% CO2, 20% CO.
5.2.3 Samples
The loin and rack were taken from each of the sides from each group (fresh domestic,
frozen domestic, frozen Australian) after retail cuts were made in the carcass experiment. Fresh
domestic loins and ribs were 24 h postmortem, while frozen loins and ribs were 6 weeks post
mortem and thawed 3 days after frozen storage. Carcass identification was maintained
throughout so that fresh and frozen domestic counterparts could be paired in later analyses.
Chops (8-mm thick) were cut from both the loins (n=6) and ribs (n=6) using the band saw with
cuts perpendicular to the vertebral column. One loin and one rib chop were randomly assigned to
3 treatments (MAP, PVC, VAC) with 1 replication of each. Each package contained one loin and
one rib chop from a carcass side for a total of 6 packages corresponding to each side.
This gave chops (n=1080), half of which were obtained from the ribs (n=540), and loins
(n=540) of the carcasses. An even number of chops were obtained from the three storage
treatment groups of fresh domestic (n=360), frozen domestic (n=360), and frozen imported
Australian (n=360) carcass sides. Chops were randomly assigned to the three packaging
treatments of PVC (n=360), VAC (n=360), MAP (n=360). When comparing group and package
interactions, there were a total of nine group x packaging treatments of chops (n=120).
5.2.4 CIELAB Color Measurements
Color and weight were taken on all chops before packaging. A Minolta Reflectance
Spectrophotometer was placed on the surface of each chop to measure CIELAB L* (lightness),

59
a* (redness), and b* (yellowness). The instrument was calibrated against ceramic white and
black standard plates prior to each measuring session. The spectrophotometer aperture opening
was 10.31mm, illumination type D65, with optical geometry of 45° and an observer angle of 2°.
Three random readings at different locations per sample were taken along the surface of the raw
meat with the colorimeter set to take each reading in triplicate for accuracy. Prepackage and post
package chroma C = (a*2 + b*2)1/2 and hue angle HA = (arctan (a*/b*)) were derived later in
SAS 9.4.
5.2.5 Packaging
The study observed the effects of three different types of packaging subjected to the same
storage conditions over the three different groups of carcass treatments for both loin and rib
chops. One loin and one rib chop were placed together in each package.
5.2.5.1 Modified Atmosphere Packages
The chops were placed on 8.47 cm x 15.24 porous soaker pads (Koch item # 1800 0124).
MAP packages were #3 APT CR Fresh Lock meat trays (crystallized polyethylene terephthalate
trays with a moisture vapor permeability of 31cc/m2/24hr and oxygen permeability of 75
cc/m2/24hr) and lidding film (Curlam, Curwood, New London, WI with a moisture permeability
of 1.5/m2/24hr at 23°C and oxygen permeability of 0.l cc/m2/24hr at 23°C) sealed on a Multivac
tray sealer. Package head space volume was ≈1330cm2. Packages were filled with Aligal 12
(80% N2, 20% CO2) and then the Aligal mixture of 80% CO2, 20% CO was injected through a
septum using a 5 cc syringe until 0.5 % CO was achieved in the package. All packages were then
checked for accuracy using a Mocon Pack Check. A piece of black electrical tape was placed
over the septum to ensure there was no gas exchange from the packages during storage.

60
5.2.5.2 Polyvinyl Chloride Film Overwrapping
The chops were placed on 8.47 cm x 15.24 porous soaker pads (Koch item # 1800 0124)
onto white 10.16 cm x 15.24 cm expanded polystyrene trays (Koch item # 1620 0548), and
overwrapped with 0.6-mil PVC oxygen permeable film (Koch item # 7500 3815) with a Win
Holt overwrapping packager.
5.2.5.3 Vacuum Packaging
The chops were vacuum packaged using a Turbovac vacuum packaging machine at
20mm vacuum in clear 20.31 cm x 30.38 cm 5mil standard barrier nylon-polyethylene pouches
(Koch item #7600 0029) with 8.47 cm x 15.24 porous soaker pads (Koch item # 1800 0124) on
one side.
5.2.5.4 Simulated Retail Display
Packages of chops were randomly placed on open air shelving for three days in a 3°C
cooler under ≈ 170 lumens of florescent light. Light intensities for all package placements were
measured using an Extech light meter. Packages were rearranged every day to minimize
differences due to location. No outside light was allowed during storage. Storage time was set at
3 day as previous research indicated that 3 days was the maximum display shelf life for overwrap
packaging before degradation of quality of the product. It was desired to have all packages
compared under acceptable uniform conditions and so the 3 day display time was selected as
representative of retail display conditions.
After removal from packages, chops were allowed 5 minutes to “re-bloom”. Color and
weight were obtained for post display package values.

61
5.2.6 Cooking
The identification of chops was maintained throughout the study with a template
containing the unique code for each individual chop. Chops were placed on an uncovered metal
baking pan (43.18 cm x 63.5 cm x 2.54 cm) and cooked in a Hotpoint broiler oven at a surface
temperature of 116°C to an internal temperature of 70°C. The broiler oven had an opening of
68.58 cm x 41.91 cm and was 59 cm deep. Samples were cooked at a distance of 17.78 cm from
the radiant heat source. There were 64 chops cooked on each tray at each time determined by
number and treatment. Five batches were cooked for each group (n=3) and replication (n=2).
Trays were rotated at half of the cooking time to account for any oven hot spots. The cooking
time and temperature were determined in preliminary tests with chops of the same dimensions as
those in the present study.
5.2.7 Tenderness
Cooked chops were chilled for 2 hours to below 10°C to obtain a more uniform core
sample on the chilled samples. One 12.7-mm diameter core was taken from the center of each
chop parallel to the longitudinal orientation of the muscle fibers (Schonfeldt et al., 1993). Each
core was sheared once with a Warner-Bratzler shear force attachment perpendicular to the
longitudinal orientation of the muscle fibers of each core. The force to shear each core was
measured using a Texture Technologies texture analyzer. The load cell was 25 kg, the crosshead
speed was 100-mm per minute, and the peak force was measured in grams.
5.2.8 Statistical Analysis
Prior to data analysis, all weights for losses were converted to percent for comparative
purposes. Loss, color and tenderness were analyzed with SAS (Version 9.4, SAS Inst. Inc., Cary,

62
NC) PROC GLM for comparison of group, pack, chop and combined group pack means using
the Tukey function. Significance for all statistical analyses was determined at P<0.05.
5.3 Results and Discussion
5.3.1 Group Comparison
Means and standard errors for the main effect of group (fresh domestic, frozen domestic
and frozen Australian) without accounting for packaging treatments and chop type on loss, color
and tenderness are in Table 5.
When comparing losses, fresh domestic chops had less (P<0.05) drip loss, cook loss and
total loss than frozen Australian and frozen domestic groups. Frozen Australian chops had less
(P<0.05) drip loss, cook loss and total loss than the frozen domestic group. Frozen domestic
chops had greater loss when compared to frozen Australian chops, which could be due to larger
thaw loss in Australian carcasses. These increased losses are likely because the cell membranes
are damaged when meat is frozen, which results in a lower water holding capacity and a higher
cooking loss, and consequently a risk of less juicy meat (Wheeler et al., 1990).
Pre-packaged fresh domestic chops had a higher (P<0.05) L*, b*, and hue angle with
lower (P<0.05) a* than frozen domestic and frozen Australian groups with a chroma that was
lower (P<0.05) than frozen domestic chops, but did not significantly differ from frozen
Australian chops. Frozen domestic chops had higher (P<0.05) L*, b*, and hue angle than frozen
Australian chops, but a* was not significantly different. Frozen domestic chops had a higher
(P<0.05) hue angle than both fresh domestic and frozen Australian chops. This would indicate
that the fresh goat chops showed less redness, as represented by the low a*, in addition to higher
hue angle, and were lighter in color, as represented by the L*, than frozen group chops. There
was less saturation of color when compared to the frozen domestic counterparts. These

63
prepackaged values are especially useful in documenting differences in groups based on storage
treatment, as packaging would not yet have an influence. Similar results on color of frozen and
fresh meat have been reported on lamb; however, that freezing treatment was done during
storage after the cut was made and not on the carcass (Brad Kim, Matilde and Rosenvold, 2011).
Post packaging measurements are averages of the three packaging treatments. Overall,
the results were similar to the prepackaging results with only a* and chroma being higher in the
fresh domestic chops, but no other color changes among the groups. Fresh domestic chops had
higher L*, a*, b*, chroma and hue angle than chops from frozen groups. Frozen domestic chops
had higher L*, b*, chroma and hue angle than frozen Australian chops, while the a* did not
significantly differ. This is the same relationship as for frozen Australian and frozen domestic
chops in the prepackaged group. The higher chroma of fresh domestic chops was directly caused
by the higher a* value, which indicated a more saturated redness for that group. Frozen storage
was previously shown to increase colorimetric parameters on L*, a*, b*, and chroma while
increasing hue angle (Vieira et al., 2009). It is important to note that this comparison of groups
did not account for packaging treatment. The fresh MAP a* treatment is largely responsible for
the higher fresh domestic group a*, as will be shown in the latter group package section.
Fresh domestic chops had the highest (P<0.05) Warner-Bratzler shear force values of all
groups, with frozen domestic chops having higher (P<0.05) shear force values than frozen
Australian chops. These findings agreed with those of Leygonie et al. (2012) that tenderness of
meat as peak force is generally thought to decrease with freezing and thawing. The more
desirable tenderness values for frozen Australian chops could be due to unstable temperature
fluctuations in the shipping process which could have led to formation of larger ice crystals
within the meat (Ranken, 2000). It should be noted that this study only measured mechanical

64
Table 5. Means and standard errors on influence of fresh domestic, frozen domestic, and frozen
Australian chops on loss, color, and tenderness.
Fresh
Domestic
Frozen
Domestic
Frozen
Australian
S.E.M.1
Loss
Drip Loss 3.05a 4.20c 4.10b 0.0009
Cook Loss 13.53a 15.92c 15.09b 0.0013
Total Loss 16.18a 19.44c 18.57b 0.0015
Pre Pack2
L* 38.85a 35.76b 33.04c 0.1218
a* 13.76a 14.63b 14.48b 0.0684
b* 9.74a 9.22b 8.16c 0.0571
Chroma 16.89a 17.34b 16.64a 0.0806
Hue angle 35.52a 32.09b 29.22c 0.1318
Post Pack2
L* 39.74a 35.83b 33.17c 0.1259
a* 15.18a 14.70b 14.61b 0.0933
b* 10.56a 9.53b 8.38c 0.0615
Chroma 18.56a 17.64b 16.88c 0.0996
Hue angle 34.95a 33.23b 28.65c 0.1662
Tenderness
WB 4628a 3936b 2938c 52.2069
1Standard error is reported as the average for the combined 3 treatments 2L* = Lightness; a* = redness; b=yellowness; Hue angle = tan-1(b*/a*), where lower values
indicated more redness; Chroma = Saturation Index = (a*2+b*2)1/2. abcMeans within the same row lacking a common superscript letter differ (P<0.05)

65
tenderness. Other research has shown that sensory panels found frozen meat tougher than
unfrozen, while the mechanical shear forces indicated the opposite effect of freezing and thawing
(Vieira et al., 2009), probably due to loss of moisture that may influence perceived tenderness.
In research conducted with beef steaks, samples from frozen cuts were found to be more
tender by mechanical testing and less tender and less juicy by a sensory panel than that of the
fresh cuts (Lagerstedt et al., 2008; Shanks, Wulf and Maddock, 2002). This is likely due to lower
expressible moisture to aid in the process of mastication, which can give the sensation of
toughness to the eater (Aberle et al., 2012).
5.3.2 Packaging Comparison
A comparison of the main effects of packaging (MAP, overwrap PVC, and vacuum)
without considering the effects of storage group and chop on loss, color, and tenderness are in
Table 6.
Vacuum packaging samples had significantly more drip loss in packages than did chops
in MAP and overwrapping, which did not differ significantly (P<0.05) from one another. This is
likely due to the vacuum packaging opening up the pores of the meat and allowing unbound
water to escape. These findings are in line with other studies comparing the effects of VAC and
MAP in beef steaks (Huang, Chung and McMillin, 2005; McMillin et al., 1994) and in lamb
(Muela et al., 2010). Cook loss was not significantly different with packaging. Total loss was
greater (P<0.05) for chops in vacuum packaging than overwrapping, but did not differ (P<0.05)
from chops in MAP, which did not differ (P<0.05) from those in overwrap packaging.
L* and b* of chops did not differ (P<0.05) with packaging treatment for any pre packed
groups. Overwrapped chops did have lower (P<0.05) a* than vacuum, which caused lower
(P<0.05) chroma and hue angle than vacuum packaging. MAP did not differ (P<0.05) from

66
either VAC or PVC for a*, chroma or hue angle of chops. The lower a* for the overwrapping
group is currently unexplained and may be a Type I error due to randomization of chops among
packaging treatments, but the numerical differences in a* values were small.
Post package, there were no (P<0.05) differences in L* of chops with packaging
treatment. Chops in MAP had a higher (P<0.05) a* than VAC and PVC with chops in VAC
having a higher (P<0.05) value than PVC. The higher a* with MAP caused chops in MAP to
have a higher (P<0.05) chroma and lower (P<0.05) hue angle than with VAC and PVC. PVC
chops had a higher hue angle than with VAC, while the chroma did not differ (P<0.05). Chops in
MAP and PVC had higher (P<0.05) b* than VAC but did not differ (P>0.05) from one another.
The higher (P<0.05) a* with MAP is a result of the carboxymyoglobin red pigment in the MAP
packaging. These results of MAP with CO are supported by fresh beef research that showed
similar color value differences of meat in CO-MAP compared with overwrapping and vacuum
packaging (Jayasingh et al., 2001). The lack of changes in L* is also in line with research which
found a minimum of 5 days to see packaging display effects on L* (Morales-delaNuez et al.,
2009; Morales-delaNuez et al., 2011).
Packaging type had no significant (P>0.05) effect on Warner-Bratzler tenderness. This
was possibly due to the short packaging duration of 3 days, as previous goat research has shown
that 3 days of aging in goat cuts is insufficient to decreased shear force values whereas shear
force may be decreased during 6 to 14 days of aging (King et al., 2004; Kannan, Kouakou and
Terrill et al., 2003). Further research giving cuts additional aging time to decrease tenderness
values would be needed to properly evaluate packaging effects on tenderness values.

67
Table 6. Means and standard errors on influence of packaging on loss, color, and tenderness.
MAP PVC VAC S.E.M.1
Loss
Drip Loss 3.51b 3.16b 4.68a 0.0009
Cook Loss 14.92a 14.98a 14.66a 0.0013
Total Loss 17.90ab 17.66b 18.63a 0.0015
Pre Pack2
L* 35.94a 35.78a 35.93a 0.1218
a* 14.47a 14.07b 14.34ab 0.0684
b* 9.15a 8.86a 9.12a 0.057
Chroma 17.16a 16.67b 17.04ab 0.0806
Hue angle 32.09a 32.09b 32.09ab 0.1318
Post Pack2
L* 36.27a 36.25a 36.22a 0.1259
a* 17.51a 13.25c 13.75b 0.0922
b* 9.59a 9.83a 9.06b 0.0615
Chroma 20.00a 16.55b 16.53b 0.0996
Hue angle 28.65c 36.67a 33.23b 0.1662
Tenderness
WB 3855a 3845a 3803a 52.2069
1Standard error is reported as the average for the combined 3 treatments 2L* = Lightness; a* = redness; b=yellowness; Hue angle = tan-1(b*/a*), where lower values
indicated more redness; Chroma = Saturation Index = (a*2+b*2)1/2. abcMeans within the same row lacking a common superscript letter differ (P<0.05)

68
5.3.3 Packaging Pre and Post Comparison
A comparison of pre and post packaging color values on chops across three different
packaging (MAP, PVC, VAC) treatments, without accounting for chop type or storage group is
in Table 7.
Table 7. Means and standard errors on influence of packaging on CIELAB color value2 changes
from pre to post package.
Pre Package Post Package
MAP PVC VAC S.E.M.1 MAP PVC VAC S.E.M.1
L* 35.94a 35.78a 35.93a 0.1218 36.27a 36.25a 36.22a 0.1259
a* 14.47b 14.07bc 14.34b 0.0684 17.51a 13.25c 13.75d 0.0922
b* 9.15b 8.86b 9.12b 0.057 9.59a 9.83a 9.06b 0.0615
Chroma 17.16b 16.67bc 17.04bc 0.0806 20.00a 16.55c 16.53c 0.0996
Hue angle 32.09c 32.09c 32.09c 0.1318 28.65d 36.67a 33.23b 0.1662
1Standard error is reported as the average for the combined 3 per pack treatments and the average
for the combined 3 post package treatments 2L* = Lightness; a* = redness; b=yellowness; Hue angle = tan-1(b*/a*), where lower values
indicated more redness; Chroma = Saturation Index = (a*2+b*2)1/2. abcMeans within the same row lacking a common superscript letter differ (P<0.05)
Prepackage L* values of chops did not significantly differ from prepackage L* values for
any treatment. Post MAP packaging chops had higher (P<0.05) a* values than prepack a* values
while post pack a* for chops in PVC and VAC were lower (P<0.05) than prepack values. Post
package b* was higher (P<0.05) for chops in MAP and PVC, while chops in VAC did not differ
(P>0.05) in b* from prepackage values. The higher post package a* values of chops in MAP
caused a higher (P<0.05) chroma and a lower hue angle when compared to prepackaged values.
Chroma of chops in PVC and VAC did not differ (P>0.05) from prepackage chroma values. PVC

69
and VAC chops post package did have higher (P<0.05) hue angles than chops prepackage, which
signifies less desirable color (Hunt and King 2012).
5.3.4 Group Packaging Comparison
A comparison of storage group (fresh domestic, frozen domestic, and frozen Australian)
carcasses combined with packaging (MAP, PVC, VAC) without accounting for the main effect
of chop type for loss, color, and tenderness is in Table 8.
Frozen domestic chops had higher drip loss than frozen Australian chops, and frozen
Australian chops had higher (P<0.05) drip loss than fresh domestic chops. On further analysis,
the cause may be due to frozen domestic VAC and frozen Australian VAC chops having higher
(P<0.05) drip loss than other storage and packaging combinations. There was no difference
(P>0.05) in drip loss between frozen domestic VAC and frozen Australian VAC chops. Fresh
domestic PVC chops had less (P<0.05) drip loss than frozen domestic chops in PVC.
Packaging had little effect on cooking loss or total loss, as all combinations closely
followed the group values for storage treatment. All prepackaging color values closely followed
the trends of the storage group as packaging treatments had not yet been implemented.
There were no differences (P>0.05) for L* of chops post packaging within any storage
group, as all fresh domestic packaging treatments had higher (P<0.05) L* values than all frozen
domestic packaging treatments, which had higher (P<0.05) values than all frozen Australian.
The post package value for a* was higher for chops in MAP packaging within each
storage group than those in PVC and VAC. Fresh domestic MAP chops had a higher (P<0.05) a*
values than frozen Australian MAP chops. The frozen domestic MAP treatment combination did
not have different (P>0.05) a* values in chops than chops in either fresh domestic MAP or

70
Table 8. Means and standard errors on differences between storage group and package
combination on loss, color, and tenderness. Fresh Domestic Frozen Domestic Frozen Australian
MAP PVC VAC MAP PVC VAC MAP PVC VAC S.E.M.1
Loss
Drip Loss 3.16bc 2.57c 3.44bc 3.70bc 3.77b 5.12a 3.67bc 3.14bc 5.50a 0.0009
Cook Loss 13.22a 13.82ab 13.59ab 16.30c 15.97c 15.48c 15.23bc 15.16bc 14.89bc 0.0013
Total Loss 15.96d 16.02dc 16.54dc 19.38ab 19.14ab 19.79a 18.35abc 17.82bcd 19.54ab 0.0015
Pre Pack2
L* 38.78a 38.73a 39.03a 35.79b 35.65b 35.84b 33.26c 32.95c 32.92c 0.1218
a* 13.79ab 13.67a 13.83ab 14.85c 14.43abc 14.6bc 14.76c 14.12abc 14.57bc 0.0684
b* 9.71a 9.68a 9.82a 9.39ab 8.96cb 9.33ab 8.35cd 7.93d 8.2d 0.057
Chroma 16.89ab 16.79ab 16.99ab 17.61a 17.02ab 17.38a 16.98ab 16.21b 16.73ab 0.0806
Hue angle 34.95a 35.52a 35.52a 32.09b 32.09b 32.66b 29.22c 29.22c 29.22c 0.1318
Post Pack2
L* 39.53a 40.05a 39.65a 35.82b 35.63b 36.03b 33.45c 33.07c 32.98c 0.1259
a* 18.16a 13.57c 13.81c 17.36ab 13.04c 13.78c 17.03b 13.13c 13.66c 0.0933
b* 10.73a 11.4a 9.56b 9.36bc 9.68b 9.57b 8.68cd 8.42d 8.05d 0.0615
Chroma 21.12a 17.76c 16.82cd 19.76b 16.28de 16.87cd 19.13b 15.62e 15.88de 0.0996
Hue angle 30.37e 40.11a 34.95c 28.07f 36.67b 34.95bc 26.93f 32.66d 30.37e 0.1662
Tenderness
WB 4604a 4666a 4615a 3941b 3900b 3967b 3020c 2968c 2825c 52.206
1Standard error is reported as the average for the combined 9 group/package treatments 2L* = Lightness; a* = redness; b=yellowness; Hue angle = tan-1(b*/a*), where lower values
indicated more redness; Chroma = Saturation Index = (a*2+b*2)1/2. a-fMeans within the same row lacking a common superscript letter differ (P<0.05).

71
frozen Australian MAP. The a* values of chops in PVC and VAC did not differ (P>0.05) within
or between any group.
The post package b* values of chops closely followed those of the storage group with the
only significant difference with group being the fresh domestic group chops. For fresh domestic
chops, VAC resulted in lower (P<0.05) values than MAP and PVC.
The distributions for chroma and hue angle resembled those of a* with chops in MAP
having higher chroma and lower hue angle than in VAC and PVC within each group. Fresh
domestic MAP chops had the highest (P<0.05) chroma and lowest (P<0.05) hue angle, with
frozen domestic and frozen Australian chops not different (P>0.05) from one another.
Packaging had no significant effect on Warner-Bratzler shear force values within storage
group, with all fresh domestic packaging treatments having higher (P<0.05) values for chops
than all frozen domestic packaging treatments, which were higher (P<0.05) than all frozen
Australian packaging treatments.
5.3.5 Group Packaging Pre and Post Comparison
A comparison of pre and post packaging color values on chops across three different
packaging (MAP, PVC, VAC) treatments combined with storage group (fresh domestic, frozen
domestic, and frozen Australian) carcasses without accounting for the main effect of chop type is
in Table 9.
L* values did not differ among chops in any storage group treatment pre or post package,
however all pre and post package fresh domestic had higher (P<0.05) L* values than all pre and
post package frozen domestic chops, which had higher L* values than all pre and post package
frozen Australian chops. This further supports that L* is affected by storage treatment only, with
no effect from packaging treatment. This corresponded with previous research with other species

72
that found freezing method and storage time had no effect on L*, but found L* to be significantly
lower in frozen treatments that fresh samples (Muela et al., 2010; Moore and Young, 1991). The
effects of treatments on L* of chops are further illustrated by Figure 8.
The fresh domestic post package MAP treatment had the highest (P<0.05) observed value
for a* and chroma in chops among all pre and post combinations. Frozen domestic and frozen
Australian post package MAP treatment a* and chroma values of chops did not (P>0.05) differ
from one another, but were higher than all other observed pre and post a* and chroma values
except for those in fresh domestic post package MAP chops. These treatment combinations were
the only a* and chroma values to differ (P<0.05) from pre to post package. This is especially
noteworthy, as frozen post package MAP treated with 0.5% CO gave a* and chroma (color
saturation) values higher than those of prepackaged fresh meat. The effects of treatments on a*
are further illustrated by Figure 9.
The only pre to post package increase (P<0.05) in b* values of chops occurred in fresh
domestic MAP and PVC. These values were higher (P<0.05) than all other treatment
combination for b*, but did not differ (P<0.05) from one another. The effects of treatments on b*
are further illustrated by Figure 10.
The post package MAP hue angle values of chops for all storage treatments were lower
(P<0.05) than their respective prepackaged values, indicating a shift towards a more desirable
red color. The post package PVC hue angle values for chops in all storage treatments and the
post package frozen domestic VAC treatment were higher (P<0.05) than their respective
prepackaged values, indicating a shift towards a less desirable red color. The effects of
treatments on hue angle are further illustrated by Figure 11.

73
Table 9. Means and standard errors on differences between storage group and package
combination on prepackage and post package CIELAB color values2.
L* a* b* Chroma Hue angle
Pre
Package
Fresh
Domestic
MAP 38.78a 13.79defg 9.71bc 16.89cde 34.95bc
PVC 38.73a 13.67cfg 9.68bc 16.79cdef 35.52bc
VAC 39.03a 13.83cdef 9.82b 16.99cde 35.52bc
Frozen
Domestic
MAP 35.79b 14.85c 9.39bcd 17.61c 32.09d
PVC 35.65b 14.43cde 8.96cde 17.02cde 32.09de
VAC 35.84b 14.6cde 9.33bcd 17.38cd 32.66d
Frozen
Australian
MAP 33.26c 14.76cd 8.35fe 16.98cde 29.22fg
PVC 32.95c 14.12cdef 7.93f 16.21cd 29.22fg
VAC 32.92c 14.57cde 8.2fe 16.73cde 29.22fg
S.E.M.1 0.1218 0.0684 0.057 0.0806 0.1318
Post
Package
Fresh
Domestic
MAP 39.53a 18.16a 10.73a 21.12a 30.37ef
PVC 40.05a 13.57efg 11.4a 17.76c 40.11a
VAC 39.65a 13.81defg 9.56bc 16.82cdef 34.95c
Frozen
Domestic
MAP 35.82b 17.36ab 9.36bcd 19.76b 28.07gh
PVC 35.63b 13.04g 9.68bc 16.28def 36.67b
VAC 36.03b 13.78defg 9.57bc 16.87cde 34.95bc
Frozen
Australian
MAP 33.45c 17.03b 8.68fed 19.13b 26.93h
PVC 33.07c 13.13fg 8.42fe 15.62f 32.66d
VAC 32.98c 13.66efg 8.05f 15.88ef 30.37ef
S.E.M.1 0.1259 0.0933 0.0615 0.0996 0.1662
1Standard error is reported as the average for the combined 9 per pack treatments and the average
for the combined 9 post package treatments 2L* = Lightness; a* = redness; b=yellowness; Hue angle = tan-1(b*/a*), where lower values
indicated more redness; Chroma = Saturation Index = (a*2+b*2)1/2. a-hMeans within the same column lacking a common superscript letter differ (P<0.05)
Post package means that are underlined significantly differ from their prepackage correspondent
value.
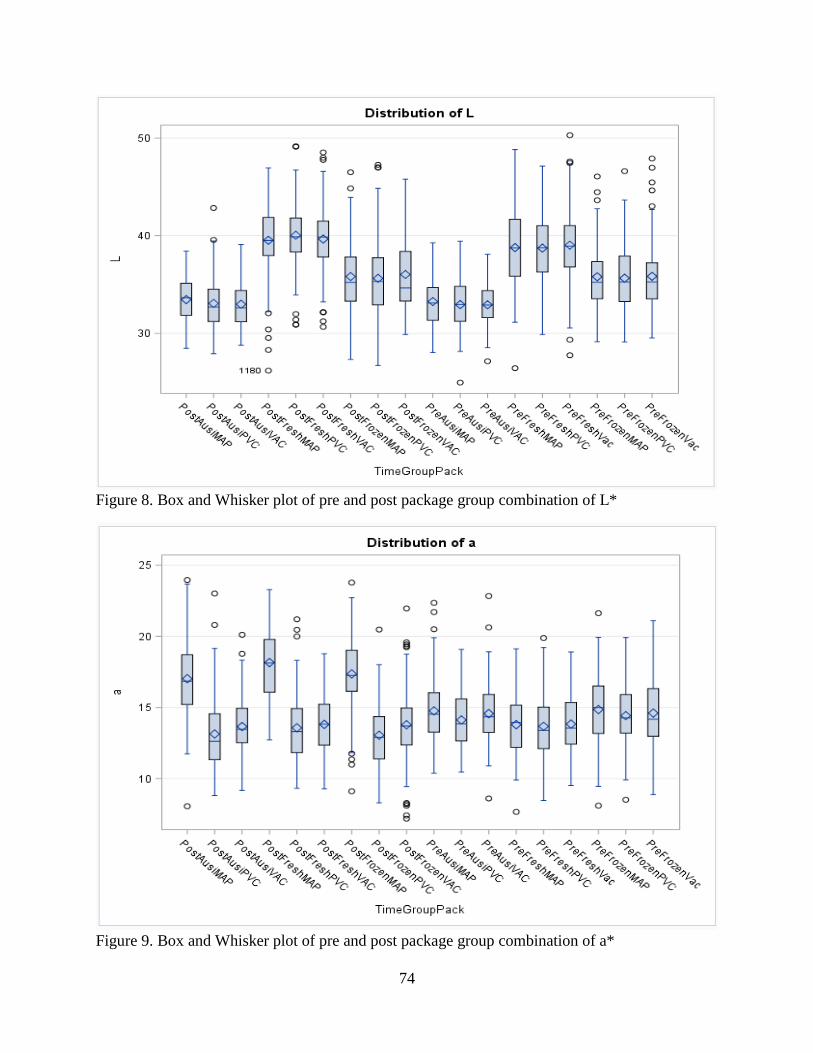
74
Figure 8. Box and Whisker plot of pre and post package group combination of L*
Figure 9. Box and Whisker plot of pre and post package group combination of a*

75
Figure 10. Box and Whisker plot of pre and post package group combination of b*
Figure 11. Box and Whisker plot of pre and post package group combination of hue angle

76
5.3.6 Loin and Rib Comparison
A comparison of rib and loin chops type as a main effect without consideration of storage
group and packaging treatment effects on loss, color, and tenderness is in Table 10.
Table 10. Means and standard errors on differences between loin and rib chops on loss, color,
and tenderness.
Loin Rib S.E.M1
Loss
Drip Loss 4.01a 3.56b 0.0009
Cook Loss 15.59a 14.11b 0.0013
Total Loss 18.96a 17.16b 0.0015
Pre Pack2
L* 35.34b 36.43a 0.1218
a* 13.98b 14.61a 0.0684
b* 8.70b 9.39a 0.0057
Chroma 16.51b 17.41a 0.0806
Hue angle 31.78b 32.67a 0.1318
Post Pack2
L* 35.59b 36.90a 0.1259
a* 14.24b 15.44a 0.0933
b* 9.04b 9.94a 0.0615
Chroma 16.95b 18.44a 0.0996
Hue angle 32.61a 32.97a 0.1662
Tenderness
WB 4286a 3382b 54.2069
1Standard error is reported as the average for the combined 3 per pack treatments and the average
for the combined 3 post package treatments 2L* = Lightness; a* = redness; b=yellowness; Hue angle = tan-1(b*/a*), where lower values
indicated more redness; Chroma = Saturation Index = (a*2+b*2)1/2. abMeans within the same row lacking a common superscript letter differ (P<0.05).
A surprising find of the study were the differences found when comparing loin and rib
chops. Loin chops had a higher (P<0.05) percentage of drip loss, cook loss and total loss than did

77
rib chops. Rib chops had higher (P<0.05) values for L*, a*, b*, and chroma for both pre and post
package values than loin chops. Hue angle for rib chops was higher (P<0.05) prepackage than
loin chops, but did not differ (P>0.05) post package. Loin chops were also less tender, having a
higher (P<0.05) shear force value than rib chops. These tenderness differences due to location of
loin or rib would be in line with research done on beef Longissimus steaks, which found similar
results (Wheeler, Shackelford and Koohmaraie, 2007; Rhee et al., 2004).
5.4 Conclusion
It was concluded that freezing and thawing of goat carcasses will increase drip loss in
packages during simulated display, and chops will have a greater cook loss even though chops
were removed from the carcasses after freezing and carcass thaw loss had occurred. Freezing
also led to less desirable color values, resulting in less desirable characteristics than fresh
domestic goat meat. Some of the losses in desirable color such as a* (redness) can be overcome
through MAP packaging with 0.5% CO, while other values such as L* seem to not be affected
by packaging, but are dependent on freezing treatment.
Vacuum packaging of goat chops increased drip loss compared to other treatments, and
PVC overwrapping had the least desirable color traits compared to other treatments and
prepackage values. Packaging had no effect on tenderness values of chops. Freezing treatment
greatly affected tenderness, however, as fresh domestic had higher shear force values than frozen
domestic, and frozen domestic had higher values than frozen Australian.
Loin chops had greater drip and cook loss than rib chops. This is possibly due to
different bone, fat, and muscle ratios, or due to a difference in water holding capacity of the
Longissimus dorsi based on location. Further research would be needed for a determination to be

78
made. Rib chops were found to have more desirable color both pre and post package than loin
chops.
Rib chops also had lower tenderness shear force values when compared to loin chops,
which is likely due to the difference in location and the way that the animal uses the particular
muscle.

79
CHAPTER 6: CONCLUSIONS
6.1 Summary
Imported frozen goat meat comprises over half of the documented goat meat available in
the United States. There is little scientific literature that discusses the effects of freezing on goat
carcasses and the quality of goat meat, especially when compared to fresh goat meat.
The objective of this research was to determine differences in carcass evaluation, yield
and meat quality from representative fresh domestic, frozen domestic and frozen imported
Australian goat carcass sides (n=30 from each source).
To achieve a comprehensive look at the differences among these groups, this study was
done in three separate experiments. The experiments were conducted with two replications of
fresh domestic goat sides and frozen domestic goat sides from goats from the United States and
imported frozen Australian goat carcasses. The experiments evaluated goat carcass traits and
meat yields, differences in goat leg properties, and comparison of loin and rib chops in three
different packaging treatments from fresh and frozen domestic and imported frozen goat
carcasses.
There are obvious confounding factors that occurred between the Australian goat
carcasses and the domestic carcasses, but this study was designed to determine if Australian
carcass traits would be more closely related to those of the frozen domestic carcasses than those
of the fresh domestic carcasses. This was the overall trend seen through the experiments, which
led to the assumption that many of the quality characterizes that were observed in the Australian
goat carcasses were due to freezing and frozen storage rather than other production practices that
were not able to be controlled.
80
6.2 Findings
Data from this study suggested that, when comparing carcass traits, Australian goat
carcasses were leaner than the market ready domestic counterparts, while their conformation
scores and flank color did not differ. Furthermore, freezing carcass sides caused a significant
decrease in carcass side weight after thawing. It was also observed that freezing and thawing
caused different primal cuts to change as a percent ratio when compared to their side weight or to
the cold carcass weight.
When comparing goat legs from the fresh domestic, frozen domestic and frozen
Australian treatments, it was concluded that freezing and thawing of goat legs increased drip and
cook losses and negatively affected desirable CIELAB color values, resulting in less desirable
characteristics of frozen and thawed meat than fresh domestic goat meat.
In the loin and rib study, where loin and rib chops from fresh domestic, frozen domestic
and frozen Australian carcasses were packaged and displayed in different packaging types, it was
concluded that freezing and thawing of goat carcasses increased drip losses in package and chops
had a greater cook loss, even though chops were removed from the carcass after freezing and
carcass thaw loss had occurred. Freezing also led to less desirable color values, resulting in
overall less desirable characteristics than fresh domestic goat meat. Some of these losses in
desirable color such as a* (redness) might be overcome through MAP packaging with 0.5% CO,
while other values such as L* seemed not to be affected by packaging, but fully dependent on
freezing treatment.
Vacuum packaging of goat chops increased drip loss compared to other treatments, and
chops in PVC overwrap packaging had the least desirable color traits compared to other
treatments and prepackage values. Surprisingly, packaging had no effect on tenderness values of

81
chops. Freezing treatment greatly affected tenderness, however, as fresh domestic chops had
higher shear force values than frozen domestic chops, and frozen domestic chops had higher
values than frozen Australian chops.
Loin chops had greater drip and cook loss than rib chops while rib chops had more
desirable color both pre and post package than loin chops.
Rib chops also had lower tenderness shear force values when compared to loin chops,
which is likely due to the difference in location and the way that the animal uses the particular
muscle.
Overall, when comparing representative young goats from fresh domestic, frozen
domestic and frozen Australian sources, a noticeable decrease in the ability of the frozen meat to
retain water across all tests was observed. This will probably be detrimental to businesses selling
thawed goat carcasses or cuts, as the drip loss will reduce the total meat weight and meat is
generally bought and sold by weight.
There was also a decrease in the desirable red color (hue), the saturation of color
(chroma), and the value (lightness) associated with meat of cuts that came from frozen and
thawed carcasses. Goat meat had lower shear force with freezing and thawing, but it is important
to note that this was only a measurement of mechanical tenderness. A consumer panel might
perceive the tenderness of the chops differently because there are other factors, such as juiciness,
that affect the perception of tenderness.
6.3 Implications
There is a need for further research in many areas addressed by this paper. Testing the
effects of different rates of freezing and effects of frozen storage duration on goat meat would be
beneficial to producers, especially those from foreign sources that require freezing to optimize

82
their production practices while ensuring the highest possible quality. While previous research
has been done in goat packaging, testing the effects over different types of MAP packaging at
different display durations should be a priority, as MAP, particularly types with carbon
monoxide, continues to comprise a greater percentage of packages in retail meat markets.
Lastly, there were obvious confounding effects between the domestic and Australian
samples that were unavoidable due to the resources available to this study. To remedy this, it is
recommended that a future study involve sampling representative fresh feral goat carcass sides in
Australia and shipping frozen sides to America under standard shipping conditions would allow
accounting for all variation that may occur due to production and processing practices.

83
REFERENCES
Aberle, E.D., J.C. Forrest, D.E. Gerrard, and E.W. Mills. 2012. "Principles of Meat Science.
Fifth Edtion." In Meat Grading and Evaluation, 322-323. Dubuque, IA: Kendall Hunt.
Aimerman, M., E. Domingo, and M.R. Lanari. 2008. "Carcass characterisitcs of Neuquen Criollo
kids in Patagonia region, Argentina." Meat Science 78: 453-457.
Anon, M.C., and A. Calvelo. 1980. "Freezing rate effects on the drip loss of frozen meat." Meat
Science 4: 1-14.
Babji, Y., T.R.K. Murthy, and A.S.R. Anjaneyulu. 2000. "Microbial and sensory quality changes
in refrigerated minced goat meat stored under vacuum and in air ." Small Ruminant
Research 36: 75-84.
Kim, B.Y.H., F. Matilde, and K. Rosenvold. 2011. "Effect of aging prior to freezing on color
stability of ovine longissimus muscle." Meat Science 88: 332-337.
Butler, O.D., M.J. Garber, and R.L. Smith. 1956. "Beef carcass composition and yield of
wholesale cuts and estimates from left and right sides." Journal of Animal Science 15:
891-895.
Cole, A.B. 1986. "Retail packaging systems for fresh red meat cuts." Reciprocal Meat
Conference Proceedings. Duncan, SC. 106-111.
Cornforth, C.P. 1994. "Color: its basis and importance." In Advances in Meat Research Vol: 9,
by T.R. Dutson A.M. Pearson, 34-79. London: Blackie Academic and Professional.
Cornforth, D., and M. Hunt. 2008. "Low-oxygen packaging of fresh meat with carbon monoxide:
meat quality, microbiology, and safety." AMSA White Paper Series (The American Meat
Science Association) 2: 1-9.
Devine, C.E., P.H. Graafhuis, P.D. Muir, and B.B. Chrystall. 1993. "The effect of growth rate
and ultimate pH on meat quality of lambs." Meat Science 35: 63-77.
Farouk, M.M, K.J. Wieliczko, and I. Merts. 2003. "Ultra-fast freezing and low storage
temperatures are not necessary to maintain the functional properties of manufacturing
beef." Meat Science 66: 171-179.
Faustman. 1990. "The biochemical basis for discoloration in fresh meat: A review." Journal of
Muscle Foods 1: 217-243.
Fennema, O. 1966. "An overall view of low temperature food preservation." Cryobiology 3: 197-
213.

84
Fennema, O., and W.D. Powrie. 1964. "Fundamentals of low-temperature food preservation."
Advanced Food Research 13: 219-347.
Gillespie, J., N. Nyaupane, and K. McMillin. 2013. "Producer perceptions of important
challenges currently facing the United States meat-goat industry." The Professional
Animal Scientist 29: 333-344.
Greene, B.H., I. Hsin, and M.W. Zipser. 1971. "Retardation of oxidative color changes in raw
gound beef." Journal of Food Protection 36: 940-942.
Hanenian, R., and G.S. Mittal. 2004. "Effect of freezing and thawing on meat quality." Journal
of Food, Agriculture & Environment 2: 74-80.
Harrison, R., J. Hill, Jeff Gillespie, Ken McMillin. 2013. "Consumers' preference for goat meat
in the United States." Proceedings of the 28th Annual Goat Field Day, Langston
University. Langston, OK. 11-12.
Huang, N.Y., P.H. Chung, and K.W. McMillin. 2005. "Retail shelf-life of pork dipped in organic
acid before modified atmosphere or vacuum packaging." Journal of Food Science 70:
382-387.
Huff-Lonergan, E., and S.M Lonergan. 2005. "Mechanisms of water-holding capacity of meat:
The role of postmortem biochemical and structual changes." Meat Science 71: 194-204.
Hunt, M., and A. King. 2012. AMSA Meat Color Measurement Guidelines. Champagn, Illinois:
American Meat Science Association.
IIR. 1972. "Recommendation for processing and handling of frozen foods." International
Institute of Refrigeration. Paris.
Jayasingh, P., D.P Cornforth, C.E. Carpenter, and D. Whittier. 2001. "Evaluation of carbon
monoxide treatment in modified atmoshpere packaging or vacuum packaging to increase
color stability of fresh beef." Meat Science 59: 317-324.
Johnson, D.D., C.H. McGowan, G. Nurse, and M.R. Anous. 1995. "Breed type and sex effects
on carcass traits, compostion and tenderness of young goats." Small Ruminant Research
17: 57-63.
Kadim, I., and O. Mahgoub. 2012a. "Nutritive value and quality characteristics of goat meat." In
Goat Meat Production and Quality, p. 305-306. Cambridge, MA: CAB international.
Kadim, I.T., and O. Mahgoub. 2012b. "Linear body measurements and carcass characteristics of
goats." In Goat meat production and quality, by 0. Mahgoub, I.T, Kadim and E.C. Webb,
277-292. Cambridge, MA: CABI.

85
Kadim, I.T., O. Mahgoub, A. Al-Kindi, W. Al-Marzooqi, and N.M. Al-Saqri. 2003. "An
evaluation of the growth, carcass and meat quality characteristics of Omani goat breeds."
Meat Science 66: 203-210.
Kadim, I.T., O. Mahgoub, D. Al-Ajmi, K.R. Al-Habsi, and E.H. Johnson. 2006. "Comparative
effects of low levels of dietary cobalt and perenteral injections of vitamin B12 on body
dimensions in different breeds of Omani goats." Small Ruminant Research 66: 244-252.
Kannan, G., B. Kouakou, and S. Gelaye. 2001. "Color changes reflecting myoglobin and lipid
oxidation in chevon cuts during refrigerated display." Small Ruminant Research 42: 67-
75.
Kannan, G., B. Kouakou, T.H. Terrill, and S. Gelaye. 2003. "Endocrine, blood metabolite, and
meat quality changes in goats as influenced by short-term, preslaughter stress." Meat
Science 66: 203-210.
Kannan, G., K.M. Gadiyaram, S. Galipalli, A. Carmicheal, B. Kouakou, T.D. Pringle, K.W.
McMillin, and S. Gelaye. 2006. "Meat quality in goats as influenced by dietary protein
and energy levels, and postmortem aging." Small Ruminant Research 42: 67-75.
Kannan., G., B. Kouakou, and S. Gelaye. 2001. "Color changes reflecting myoglobin and lipid
oxidation in chevon cuts during refrigerated display." Small Ruminant Research 42: 67-
75.
King, D.A., K.L. Voges, D.S. Hale, D.F. Waldron, C.A. Taylor, and J.W. Savell. 2004. "High
voltage electrical stimulation enhances muscle tenderness, increases aging response, and
improves muscle color from cabrito carcasses." Meat Science 68: 529-535.
Kirton, A.H. 1970. "Body and carcass composition and meat quality of the New Zealand feral
goat." New Zealand Journal of Agricultural Research 13: 167-181.
Lagerstedt, A., L. Enfalt, L. Johansson, and K. Lundstorm. 2008. "Effect of freezing on sensory
quality, shear force and water loss in beef M. longissimus dorsi." Meat Science 80: 457-
461.
Lawrie, R.A. 1992. "The chemistry of mucle-based foods." In Conversion of Muscle into Meat,
by D.A., D.E. Johnston, and M.K. Knight Ledward, 44-55. Melksham, Witshire:
Redwood Press LTD.
Ledward, D.A. 1992. "Colour of Raw and Cooked Meat." In The Chemistry of Muscle-based
Foods., by D.A. Ledward, D.E. Johnston, and M.K. Knight, p. 128-129. Melksham,
Witshire: Redwood Press.

86
Lee, J.H., B. Kouakou, and G. Kannan. 2008. "Chemical composition and quality characteristics
of chevon from goats fed three different post-weaning diets." Small Ruminant Research
75: 177-184.
Love, R.M. 1966. "The freezing of animal tissue." Cryobiology 3: 307-405.
MacDougall, D.B., and A.A. Taylor. 1975. "Color retention in fresh meat stored in oxygen- a
commercial scale trial." Journal of Food Technology 10: 339-347.
Mahgoub, O., and C.D. Lu. 1998. "Growth, body compostion and carcass tissue distribution in
goats of large and small sizes. ." Small Ruminant Research 27: 267-278.
Mahgoub, O., Kadim, I.T., and E.C. Webb. 2012. "Tissue distribution in the goat carcass." In
Goat Meat Production and Quality, by O. Mahgoub, I.T, Kadim and E.C. Webb, 231-
249. Cambridge, MA: CABI.
Mahgoub, O., Kadim, I.T., Al-Saqry, N.M., and R.M Al-Busaidi. 2005. "Potential of Omani
Jebel Akhadar goat for meat production under feedlot conditions." Small Ruminant
Research 56: 233-230.
McGuire, R.G. 1992. "Reporting of objective color measurements." HortScience 27: 1254-1253.
McMillin, K. W., and F. Pinkerton. 2008. Meat Goat Selection, Carcass Evaluation &
Fabrication Guide. Baton Rouge, LA: Publication 2951, Louisiana State University
Agricultural Center. 8 p.
McMillin, K. 2008. "Where is MAP going? A review and future potential of modified
atmosphere packaging for meat." Meat Science 80: 43-65.
McMillin, K.W. 2010 . "Meat production and quality." In Goat Science and Production, by
Sandra G. Solaiman, 255-275. Ames, Iowa: Wiley-Blackwell.
McMillin, K.W., and A.P. Brock. 2005. "Production practices and processing for value-added
goat meat." Journal of Animal Science 83: 57-58.
McMillin, K.W., N.Y. Huang, C.P. Ho, and B.S. Smith. 1994. "Beef traits with differing
fabrication times and gases in modified atmosphere packaging." 40th Int Congress of
Meat Sci and Technol Proc. Zeist Netherlands. S-IIA.10: 1-4.
McMillin, K.W., N.Y. Huang, C.P. Ho, and B.S. Smith. 1999. "Quality and shelf-life of meat in
case-ready modified atmosphere packaging." In Quality attributes of muscle foods, by Y.
Xiong, C.T. Ho and F. Shahidi, 73-93. New York: Kluwer Academic.

87
McMillin, K.W., O. Phelps, N.L. Dawkins, J.M. Fernandez, A. Howard, S.Gebrelul, G. Simon,
and K.E. Mellad. 1998. "Carcass and meat traits of goats of different live conformations,
ages, sexes, and weights." Proc. Intl. Congress Meat Science Technology 44: 268-269.
Moore, V.J., and O.A. Young. 1991. "The effects of electrical stimulation, thawing, aging, and
packaging on the color and display life of lamb chops." Meat Science 30: 131-145.
Morales-delaNuez, A., I. Morenon-Indias, A. Falcon, A. Argullo, D. Sanchez-Macias, J. Capote,
and and N. Castro. 2009. "Effects of various packaging systems on the quality
characteristics of goat meat." Journal of Animal Science 22: 428-432.
Morales-delaNuez, A.J., A. Falcon, N. Castro, H. Briggs, L.E. Hernandez-Castellano, J. Capote,
and A. Arguello. 2011. "The effects of modified atmosphere packaging on goat kid meat
quality." Journal of Applied Animal Research 39: 353-358.
Muela, E., C. Sanudo, M.M. Campo, I. Medel, and J.A. Beltran. 2010. "Effect of freezing
method and frozen storage duration on instrumental quality of lamb throughout display."
Meat Science 84: 662-669.
Nuti, L., F. Pinkerton, and K. McMillin. 2003. "Goat production and marketing in Australia and
NZ." Goat Rancher, August: 24-25, 27-28.
Olsson, U., C. Hertzman, and E. Tornberg. 1994. "The influences of low temperature, type of
muscle and electrical stimulation on the course of rigor mortis, aging and tenderness of
beef muscle." Meat Science 37: 115-131.
Oman, J.S., D.G. Waldron, D.B. Griffin, and J.W. Savell. 1999. "Effects of breed-type and
feeding regimen on goat carcass traits ." Journal of Animal Science 77: 3215-3218.
Oreskovich, D.C., F.K. Floyd, T.R. Carr, J. Novakofski, and P.J. Bechtel. 1988. "Effects of
different aging procedures on the palatability of beef." Journal of Food Quality 11: 151-
158.
Ovenden, S. 2013. Personal communication. Brooklyn, Victoria, Australia: Cedar Meat.
Owen, J.E., G.A. Norman, C.A. Pilbrooks, and N.S. Jones. 1978. "Studies on the meat
production characteristics of Botsana goats and sheep." Meat Science 2: 59-74.
Phelps, O., K.W. McMillin, S. Gebrelul, K.E. Mellad, G. Simon, N.L. Dawkins, F. Pinkerton,
and M. Windham. 1999. "Carcass traits and sensory evaluation of meat from goats of
differing breeds, ages, and conformation." Journal of Animal Science 77: 14.
Pinkerton, F., and K.W. McMillin. 2015. "Meat goat industry update 2015, Part II." Goat
Rancher, June: pp. 8, 48.

88
Ranken, M.D. 2000. Handbook of Meat Product Technology. London: Blackwell Science Ltd.
Rasmussen, C.L., and R.L. Olson. 1972. "Freezing methods as related to cost and quality." Food
Tech. 26: 42-27.
Rhee, M.S., T.L. Wheeler, S.D. Shackelford, and M. Koohmaraie. 2004. "Variation in
palatability and biochemical traits with and among eleven beef muscles." Journal of
Animal Science 82: 534-550.
Sanz, P.D., C. de Elvira, M. Martino, N. Zaritzky, L. Otero, and J.A Carrasco. 1999. "Freezing
rate simulation as an aid to reducing crystalization damage in foods." Meat Science 52:
275-278.
Schonfeldt, H.C., R.T. Naude, W. Bok, S.M. Van Heerden, and L. Sowden. 1993. "Cooking- and
juiciness-related quality characteristics of goat and sheep meat." Meat Science 34: 381-
394.
Sebranek, J.C. 1978. "Chapter 6: Emulsion Evaluation and Water Holding Capacity." In Meat
Science and Processing, 58-59. Geneva, IL: Paladin House Publishers.
Shackelfor, S.D., J.B. Morgan, H.R. Cross, and J.W. Savell. 1991. "Identification of threshold
levels for Warner-Bratzler shear force in beef top loin steaks." Journal of Muscle Foods
2: 289-296.
Shanks, B.C., D.M. Wulf, and R.J. Maddock. 2002. "The effect of freezing on Warner-Bratzler
shear force values on beef longissimus steaks across several post-mortem aging periods."
Journal of Animal Science 80: 2122-2125.
Simela, L., L.R. Ndlovu, and L.M. Sibanda. 1999. "Carcass characteristics of the marketed
Matebele goat from south-western Zimbabwe." Small Ruminant Research 32: 173-179.
Smith, C.G, G.R. Culp, and Z.L. Carpenter. 1978. "Postmortem aging of beef carcasses." Journal
of Food Science 43: 823-826.
Smith, G.C., C.W. Speath, Z.L. Carpenter, G.T. King, and K.E. Hoke. 1968. "The effects of
freezing, frozen storage conditions and degree of doneness on lamb palatability
characteristics." Journal of Food Science 33: 19-24.
Sumarmor, J., N.M.W. Pratiwi, and P.M. and Taylor, D.G. Murray. 2007. "Carcass composition
and meat quality attributes of sheep and goats under semiarid conditions." Meat Science
75: 725-736.
Swan, J.E., C.M. Exguerra, and M.M. Farouk. 1998. "Some physical, chemical and sensory
properties of chevon products from three New Zealand goat breeds." Small Ruminant
Research 28: 273-280.

89
Tapp, W.N., J.W.S. Yancey, and J.K. Apple. 2011. "How is the instrumental color of meat
measured?" Meat Science 89: 1-5.
Tressler, K.K., W.B. Van Arsde, M.J. Copley, and W.R. Woolrich. 1968. The Freezing
Preservation of Foods. The AVI Publishing Co.: Westport, CT.
USDA. 2001. Institutional Meat Purchase Specifications for Fresh Goat Series 11. Washington,
DC: USDA Agric. Marketing Service Livest. Seed Prog.
Varnam, A.H., and J.P. Sutherland. 1995. "Chapter 5: Cooked Meat and Cooked Meat Products."
In Meat and Meat Products: Technology, Chemistry, and Microbiology, 224-232 and
268-269. London: Chapman and Hall.
Vieira, C., M.T. Diaz, B. Martinez, and M.D. Garcia-Cachan. 2009. "Effect of frozen storage
conditions (temperature and length of storage) on microbiological and sensory quality of
rustic crossbred beef at different states of aging." Meat Science 83: 398-404.
Warmington, B.G., and A.H. Kirton. 1990. "Genetic and nont-genetic influences on growth and
carcass traits of goats." Small Ruminat Research 3: 147-165.
Warren, K.E., and C.L Kastner. 1992. "A comparison of dry-aged and vacuum-aged beef strip
loins." Journal of Muscle Foods 3: 151-157.
Webb, E.C., N.H. Casey, and L. Simela. 2005. "Goat meat quality." Small Ruminant Research
60: 153-166.
Wheeler, T., R.K. Miller, J.W. Savell, and H.R. Cross. 1990. "Palatability of chilled and frozen
beef steaks." Journal of Food Science 55: 301-303.
Wheeler, T., S.D. Shackelford, and M. Koohmaraie. 2007. "Beef longissimus slice shear force
measurement among steak locations and institutions." Journal of Animal Science 85:
2283-2289.
Wilson, P.N. 1960. "The effect of plane of nutrition on the growth and development of the East
African dwarf goat." Journal of Agricultural Sciences 54: 105-130.
Zhu, L.G., and M.S. Brewer. 1998. "Discoloration of fresh pork as related to muscle and display
conditions." Journal of Food Science 63: 1-5.

90
VITA
Jeffrey Cole Denis Gregorie was raised in Mangham, Louisiana by his loving
grandparents Robert and Faye Bell. He spent much of his youth on the family cotton farm and in
the woods hunting. It was there at an early age that he developed a love for agriculture and an
early familiarity with basic meat science through the harvest and processing of the game by him
and his family. He graduated from Mangham High School in 2006 and enrolled at Louisiana
State University and A&M College, receiving a bachelor’s degree in animal science in 2010. In
his time at LSU, he became a proud member of ALPHA GAMMA RHO: Alpha Epsilon chapter.
It was through his fraternity that he made many lifelong friends and met the love of his life, and
future wife. Shortly after graduation, he began work as a research associate in the animal science
department at the LSU Meat Lab. This allowed him an opportunity to pursue a secondary degree
in Meat Science.
Cole is currently a research associate at the LSU AgCenter Sweet Potato Research Station
in Chase, Louisiana. After graduation, he plans to hopefully get back to a normal work schedule,
spend more time with his precious baby girl, Lisa Bell Gregorie, and wife, Elizabeth Gregorie,
and prepare for duck season. There are currently no plans for further education as of now, but the
future is unwritten.
“There are those that look at things the way they are, and ask why? I dream of things that never
were, and ask why not?”
-Robert Kennedy