Embed Size (px)
Citation preview

Adv.SpaceResVoL 13No. 1,pp.(l)tO7—(t)129,1993 ~
Printed in Great Britain. All rights reserved. opyng
COMPARISONOFEMPIRICAL ANDTHEORETICALMODELS OFSPECIESIN THELOWER THERMOSPHERE
D. ReesandT. J.Fuller-Rowell
AtnwsphericPhysicsLaboratory, UniversityCollegeLondon,67—73RidingHouseStreet,LondonWIP 7PP, U. K.
ABSTRACT:
Sophisticated one-dimensional photochemical codes and models for calculating equilibriumconcentrations of minor species in the lower thermosphere and upper mesosphere are nowavailable. However, large-scale horizontal and vertical motions cause majorseasonal/latitudinal as well as diurnal variations of the distributions of long-lived majorand minor species. The UCL/Sheffield coupled global 3-dimensional thermosphere / ionosphere
model includes a self-consistent treatment of odd nitrogen species in ionic and neutralform, and also treats self-consistently the global background thermospheric circulation and
temperature structure. However, as yet, the 3-D models are not as sophisticated as 2-Dmodels. Thus the UCL 2-D model, which includes a more sophisticated treatment of chemicaland radiation terms, is used in combination with the 3-0 model. The 2-0 model simulatesadequately mean zonal structure and seasonal / latitudinal variations, but fails to takeaccount of diurnal variations. Solar Mesospheric Explorer data provides one detailedcomparison data set for examining the variability of nitric oxide during the solar cycle,the response to geomagnetic activity, and seasonal! latitudinal variations, This studysupports previous studies, estimating that the solar cycle variation of mean equatorialnitric oxide density, around the altitude of the peak density in the lower thermosphere(approx 110 kin) is between a factor of 3 and 4, In addition to predicted seasonal /latitudinal variations, turbulent energy dissipation of tidal, gravity and planetary wavesalso causes important compositional changes within the lower thermosphere. These may amount
to enhancements or depletions of a factor of 3 with nitric oxide, and rather less withatomic oxygen.
1. INTRODUCTION.
This paper provides a brief review of some two and three-dimensional model studies of theinter-relationships between the major and minor species of the lower thermosphere and uppermesoaphere. Several timely questions are addressed by the model simulations. Initially thedata from the Solar Nesospheric Explorer (SHE) presented by Barth [1] indicated a factor ofabout 7.5 variation of peak equatorial number density as the solar F
107 cm flux decreased
from 200 to 80 units, during the last solar cycle (1981/2 to 1985). Successive numericalstudies have indicated a variation of approximately a factor of 3 - 4 (Roble et al [2]; Rees
and Fuller-Rowell [3]; Gerard et al [4]). Recently, Gerard et al [4] have re-evaluated theSHE data presented by Barth (I], and have demonstrated that some part of the larger solaractivity variation reported earlier was likely to be an artifact due to the variable localtime and other conditions of the SHE observations. Previous studies have shown up to afactor of at least 100 variability in the density of atomic oxygen at and below the peakdensity of the species, normally observed around 105 km. It is of interest to assess howmuch of this very large reported variation could be consistent with the structure and known
physical processes occurring within the thermosphere.
The degree of possible variability of atomic oxygen number densities in the lowerthermosphere and upper mesosphere consistent with major meteorological, seasonal andgeomagnetic variability of the atmosphere can be examined by means of two and three-dimensional models. Since the simulations reported by Rees and Fuller-Rowell [3], the two-dimensional model has been upgraded by including a treatment of upwelling infra-redradiation (earth-shine), while turbulent dissipation of tidal, gravity wave and planetary
wave energy has also been included.
2. ATOMIC OXYGENAND NITRIC OXIDE: KEY MINOR CONSTITUENTS.
Atomic oxygen is created by the photodissociation of molecular oxygen within the

(1)108 D. Rees and T. J. Fuller-Rowell
is double that of 02 and N2 for the same temperature. Since recombination is very slow at
middle and upper thermospheric densities and collision rates and if diffusive equilibriumprevails, [0] becomes the major constituent above around 150 km (Banks and Kockarts [5];
CIRA 1972 [6]; NSIS 1983 and 1986 [7,8]). Given the long reconthination time, the speciescan be transported globally by mean winds. When large-scale upwelling and advection occurs,particularly at solstice, and also associated with the intense large-scale heating duringgeomagnetic storms, diffusive equilibrium no longer fully controls the vertical profiles of[0] and [N2, 02]. Under such conditions ([3]; Rees et al [9]; Rees and Fuller-Rowell [10]),the process known as wind-driven diffusion may cause large relative departures of individuallight or heavy species from diffusive equilibrium, although hydrostatic equilibrium willstill be generally observed. Relative to density values which would be expected for theappropriate kinetic temperature, N2 is strongly enhanced in regions of persistent upwellingand outflow, where atomic oxygen is strongly depleted. In regions of persistent convergence
and downwelling, the converse is true. The major direct consequences are an excess ofmolecular nitrogen at the summer pole, particularly at times of high geomagnetic activity,while the winter pole (at quiet times) and winter mid-latitudes (under more disturbedconditions) contains the highest densities of atomic oxygen and helium. These perturbations
of minor species density extend to lower thermosphere altitudes, and wind-driven diffusionis one significant cause of variability of atomic oxygen in the lower thermosphere.
Eddy diffusion can also cause vertical transport of minor species, and cam change thevertical profile of atomic oxygen and other minor constituents ([3]).
Nitric oxide is primarily created through the rea~tion of the atomic nitrogen species N(
2D)and N(4S) with molecular oxygen [5,11]. N( D) and N(4S) are produced by auroraldissociation (Rees et al [12]), by photodissociation (Richards et al [13]) and various ionchemical reactions involving N
2+ (Torr and Torr [14]).
Although nitric oxide is chemically and radiatively active, its chemical lifetime in thelower thermosphere is long enough for wind transport to be important. Its diffusion intothe mesosphere is also important, and it has been shown (Garcia and Solomon [15]) that inthe winter polar stratosphere, it also has a long effective lifetime in non-sunlit regions.
Increased production, at times of high solar activity, or associated with enhanced auroralproduction during geomagnetic storms, nay create very large lower thermospheric densities of[NO]. Given enhanced vertical transport due to turbulence, this may result in large [NO]densities in the mesosphere and even in the upper stratosphere at winter high-latitudes,where there is no solar photodestruction of nitric oxide. There are a number of major
consequences of such enhancements, affecting the chemical and radiative balance of themesosphere and thermosphere, and properties of the ionosphere.
3. THE NUMERICALMODEL.
The atmospheric model has been well-described in its three-dimensional version by Fuller-
Rowell and Rees [16-19] and in its two-dimensional version by Fuller-Rowell [20,21] and Reesand Fuller-Rowell [3].
The seasonal, latitudinal and solar activity variations of atomic oxygen density will beconsidered, as will the response to variable geomagnetic forcing at high geomagneticlatitude. Large-scale Hadley-type circulation cells are generated within the thermosphere,closing in the upper mesosphere, as the result of the solar diurnal heating variation, theseasonal / hemispheric asymmetry of solar heating, and due to geomagnetic heating, usuallyat high latitudes. These large-scale circulation systems force a partial breakdown ofdiffusive equilibrium as the result of the combination of vertical convection and horizontaladvection. The full 3-dimensional global coupled ionosphere - thermosphere UCL model willbe used for these simulations. This model and its development has been described in detailin a series of papers by Fuller-Rowell and Rees [16-19] and Fuller-Rowell et al [22-25].
A second series of simulations uses the global 2-dimensional model. Nitric oxide and other‘odd nitrogen’ compounds are included as minor species. With this model, it is possible toexamine the seasonal, latitudinal, solar activity and geomagnetic response. It is alsopossible to evaluate the transport and thermal effects of variable eddy turbulence withinthe lower thermosphere and upper mesosphere. The model takes into account the thermalradiation from nitric oxide, which has very important effects on the thermal balance, andconsequences for the mean circulation.
The two-dimensional, zonally-averaged model of the thermosphere solves the non-linearenergy, momentum, continuity and three-constituent composition equation self-consistentlyand time-dependently. The finite-difference grid covers the latitude range from the northto the south geographic pole in steps of 5 degrees latitude, and seventeen pressure levels,one scale height apart, cover altitudes from 70 km to approximately 500 km, depending onsolar activity. The model has been adapted from the high-resolution, nested-grid model ofFuller-Rowell [20], which contains a complete description of the numerical procedure, theset of equations, boundary conditions and parameterisation, required to simulate the

Lower ThermosphericTraceSpeciesModels (1)109
thermospheric neutral wind, temperature and density. The same paper also describes the
photo-chemistry, and the dissociation and recombination rate constants, included in thecomputation of the mass mixing ratio of the major species of atomic oxygen, and molecular
nitrogen and molecular oxygen.
A fur~her ad~ition has been made to the model to include the production, loss and transportof N( 0), N( 5), and NO (Nitric Oxide). The evolution of the concentrations of these minorspecies are computed in parallel and self-consistently with the development of thestructure, dynamics and energy budget of the major species. The creation of nitric oxideoccurs through the odd-nitrogen chemistry primarily through the reactions of 1,1(20) and N(
4S)with molecular oxygen. The N(2D) and N(4S) are produced by the ion chemical reactionsinvolving N
2+, and by direct dissociation of N2 by auroral particles [12] or solar radiationRichards et al [13]. The odd-nitrogen chemistry, branching ratios and rate coefficientsincluded in the model are as described in Roble and Gary [26] and Roble et al [2].
All three producti~on sources4 of atomic nitrogen are included in the zonally-averaged model.The sources of N( D) and N( 5) through the ion chemical reactions are evaluated within theUCL-Sheffield coupled thermosphere-ionosphere model [22-25]. The reference spectraappropriate for low solar activity and the ionization frequencies of the major species aretaken from Torr and Torr [14]. The solar production function thus determined is used within
the zonally-averaged code, where solution of the odd nitrogen chemistry and transportproceeds in parallel with the dynamic, energy budget and composition of the major species.
The particle precipitation source is derived from the TIROS/NOAA satellite data [27] and isused to self-consistently describe the high-latitude aurora], heating rate, ionization rate,
and molecular nitrogen dissociation [22-25], within the model. The direct particle heatingacts in addition to the Joule dissipation which together modify the global circulation
pattern. The circulation, which transports and mixes the major species, described inFuller-Rowell [20], also acts as a source of transport to the minor species. The
distribution of nitric oxide, as a strong radiative cooler (Kockarts [28]), influences thelatitudinal temperature gradient, and the global mean thermospheric temperature (Roble andEmery [293 and Roble et al [30]). The latitudinal distribution of temperature and NO, andthe global circulation pattern, is a highly coupled and interactive system of variables.
The auroral precipitation also produces ionization which enhances the ion densities abovethe quiet background levels described by Chin [31]. This additional source of ionization hasbeen included, where the auroral enhancement Is assumed to be in chemical equilibrium, and
is added to the background solar-produced values of the Chiu model by the square root of thesum of the squares. This is a less sophisticated approach than is used in the 3-0 fully-
coupled ionosphere - thermosphere model, but produces an overall result which is adequatefor the purposes of these 2-0 simulations, where we are not yet concerned with the detailsof the ionospheric predictions.
In the previous paper [3] the cause of the lower thermosphere cooling was attributed toincreased concentration of NO transported downward by the enhanced turbulent mixing. Theinfrared cooling by NO in the 5.3 ~smfundamental band was suggested by Kockarts [28] to bean important process controlling the energy budget of the thermosphere. The cool-to-spaceformulism adopted by Kockarts allowed for the infrared emission in non-local thermodynamicequilibrium but did not include resonant absorption of solar and terrestrial radiation. Aswas made clear by Kockarts, the algorithm describing the cooling process is valid only above
120 km in the Earth’s thermosphere. Below this altitude absorption from terrestrialradiation at the effective radiative temperature of the Earth, and from solar radiation,cause the radiative properties of NO to be a source rather than a sink of energy. Theseadditional processes have now been included in the model. The results of these additionsand modifications to the model are further discussed in Fuller-Rowell and Reer [32], and areused later in this paper.
Gordiets et al [33] concluded that heat dissipation by increased turbulence is important.
The specification of heat dissipation by turbulence has been parameterised using therelationship from Weinstock [34] and Lubken et al [35]:
~dis 1.23 x ~ (1)
where ~dis is the turbulent energy dissipation rate, KT is the eddy diffusion coefficient,
and Is the Brunt-Vaisala frequency.
The two-dimensional model was run with the additions described in the previous sections.These are the inclusion of “Earthshine”, direct absorption of solar infrared, and theintroduction of turbulent heat dissipation according to equation (1).
The model has also been run to simulate the consequences of an assumed sinusoidal variationof eddy turbulence as a function of latitude (maximum and minimum values at 45°N and 45°S
respectively). The assumed functional variation of the eddy diffusion coefficient with

(1)110 D. Reesand T. J. Fuller-Rowell
latitude is given by
KT’(h,9) = KT(h) ~4sin(2e) (2)
where B is the co-latitude end K.r(h) is from equation 2. The peak at 45°N corresponds to a
factor four Increase in eddy diffusion coefficient above the global mean, while at 45°S theminimum value is one quarter of the mean level.
4. RESULTS OF THE SIMULATIONS.
Global distributions with seasonal, latitudinal and geomagnetic variations.
Figure 1 shows the global distributions of temperature, mean molecular mass, atomic oxygen
density and molecular nitrogen density at 120 km of the UCL three-dimensional, time-dependent model. This simulation is for December solstice, moderately active solar (F107
185), and quiet geomagnetic activity conditions (Kp 2). The seasonal / latitudinalvariation of atomic oxygen density shows a very distinct minimum at the summer pole, and a
maximum at the winter pole. For moderately active solar (F107 185), and quietgeomagnetic activity conditions, there is a factor of about 4 variation of E-region atomicoxygen density from global minimum to global maximum. This simulation includes therepresentative effect of lower atmosphere tides introduced via lower boundary forcing
(Parish et al [36]), although this tidal forcing is not intended to simulate any specificset of atmospheric conditions.
Figure 2 shows the global distributions of temperature, mean molecular mass, atomic oxygen
density and molecular nitrogen density at 280 km of the UCL three-dimensional, time-dependent model. This simulation is for the same seasonal, solar and geomagnetic activity
conditions at Figure 1. There is a very large seasonal / latitudinal variation of atomicoxygen density. The minimum oxygen density is at the summer pole, however, the maximumvalues are displaced from the winter pole, towards high winter mid-latitudes, as a result of
high-latitude energy input. Atomic oxygen number density at 280 km varies by more than afactor of 4 from global minimum to global maximum, consistent with empirical model results(1.1515 ‘86 [8]).
Figure 3 shows the global distributions of temperature, mean molecular mass, atomic oxygen
density and molecular nitrogen density at pressure level 7 of the UCL three-dimensional,time-dependent model (E-Region, approximately 125 km). This simulation is for Decembersolstice, moderately active solar (F107 185), and moderately disturbed geomagneticactivity conditions (Kp 3). It shows that a similar, if somewhat smaller seasonal /latitudinal variation of atomic oxygen density occurs at the lower altitudes. The minimumoxygen density is again at the summer pole and, as at F-region altitudes, the maximum valuesare displaced from the winter pole, towards high winter mid-latitudes, as a result of high-latitude energy input. There is a surprisingly large variation of atomic oxygen densityfrom global minimum to global maximum, about a factor of 5, resulting from the seasonalasymmetry of solar insolation, combined with the high-latitude geomagnetic energy input.This factor of 5 atomic oxygen density variation at 125 km altitude greatly exceeds the
latitudinal / seasonal total density variation at this constant height. It is necessary torecall that the majority of species density profiles are measured with sole reference togeometric altitude, and no reference to pressure level or to total gas density.
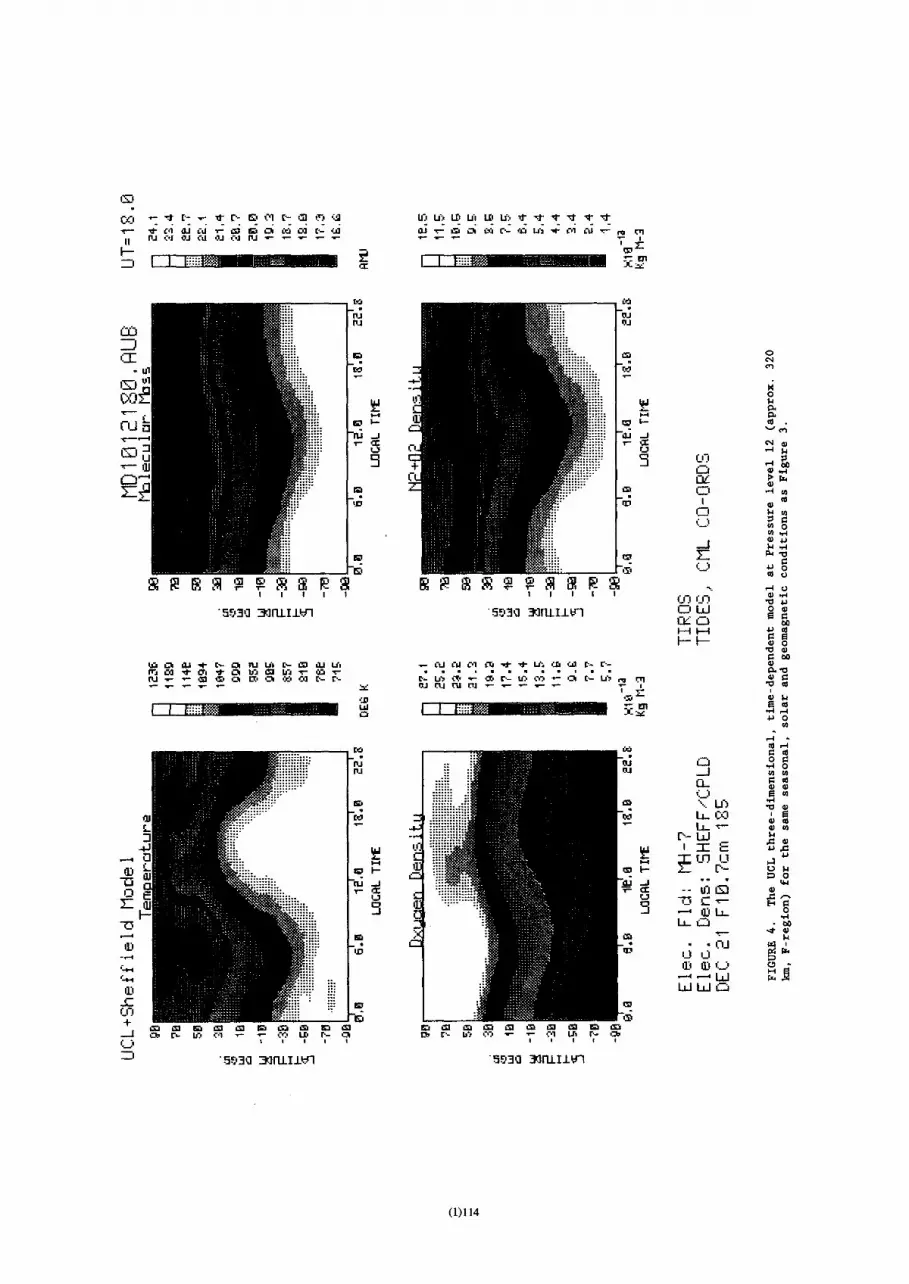
Figure 4 shows the global distributions of temperature, mean molecular mass, atomic oxygendensity and molecular nitrogen density at pressure level 12 (approx 320 km, F-region) of theUCL three-dimensional, time-dependent model. This simulation is for the same seasonal,solar and geomagnetic activity conditions at Figure 3. There is a very large seasonal /latitudinal variation of atomic oxygen density. The minimum oxygen density is at the summerpole, however, the maximum values are displaced from the winter pole, towards high winter
mid-latitudes, as a result of high-latitude energy input. Atomic oxygen number density at28 km varies by more than a factor of 4 from global minimum to global maximum, consistentwith empirical model results (l’ISIS ‘86 [8]). Note that the diurnal variation of constituentdensities on a pressure surface is quite different from that on a constant altitude surface.

u,,Jc,1u~oJ~u,,J’7t,lto (~ (C, LI, b~ U, 1 ~ ~ C’J 0) Cl t- (~- t- E~- (I, (0 (C, Li, It, Li, If. F ~
IIF— __________________ -
I I ~tt0~ ~~~hhi L~J :~
CU _______________
‘Cl ~0 ~ -0
•ul_________,z-. _____________ ~., I.,
_______ __________ ,~
1~ ~ ‘0 ~
+0: U _____
I I I I I I I I
.5~)3’] 3]ftLIJ~fl •5~]Q 33flhI.L~fl ~ ~
HF—‘C
toc.~ -* (~-~ P)(aeTjCUb)oJ ~~ ,~j (ii ‘~ Cl r ~ C— Cfl * Cd ~ 0.
e~rtj ~u ni ~u 0.1 — — — — ‘C
(LI III I i ~ j
4.1 0
-a._I ‘-.~
_________ __________ r-i~ ~9-~ ~. ~ ~ ~ ‘tE ‘~
~~fft ~ ___ ~ ~LrJu ,.1~
up— ___ ~t e.
~ :~I ~-~ I :, • —~ a • Iii r~~ Li ___: :~ U Ii
ID ~)V (5’C 0.
____________ ‘-~—W ~
________________ wwc~
L.. ‘t _____________________+ ...m ~. 9,9 ~ e~,z~ ~.9 ,rj~ .9 I~,9 9— Cb t.- IC’ (51 ‘— e’~. U’ I- ~ ~b C- U) (5) — — (51 LI. r- Ck’
5.r,,3,3 3JflhIltfl ~.)30 31ftLIi~fl

Cx) ~I’) C’l ~J . 1~’ ~ ~ u~ ~e o- C’- (.3 0) C..I 1~ .9 .m r’- U’i * 01 Cli ,~..~ 1.1
U PJ(5J0.ICU~.J01 — —.~‘ —H
~~i1L ~_iii~i~ L~H I I f~CCtf~~ __~__
_~ _____ 5:::’
I’,I ~ittt~ nj:0
“Ui Cc.’ .:tt’
e~Ju1 — .4- ____
:0:::: ~ I], ‘no. w
— :00: _J ____ “tOt:::.. e.J~J 0‘5:000: 0uuJ ~ ~ c-I ‘“:t:
U so:’ 1’ ‘:o. uscu~ 3 ~‘ :0: 9(I ~Oh.
_____ I—
0
T
- .ttttt:
I I I I I I I I I I ‘C
‘5~] 3rnJ.IJ~n ‘~Q 3~rLtIJv’1I
II) 19 0) CS 0) CS I’) r’- s.i C” SJ C”- — U’~CCI Cl C’- ~Zj * CO Al (.1 .5* ~i- 0.a
— .9 ~‘ C~ CC, CS ~) ‘9 C’— C’- * (5.1 ‘5’ C~ C’— (.) * CU — C,) .x’ ,~ 01 ‘C0.1 01
CL’ ‘5’ Ba
_________ III~~ i~ II
ID~j ~ ~ ~5’-~ ,•~ ~
___ ~. .~‘ ~
U g ?J C ~- a,
H 3 _______ -j -~uiu-~ LL~ ‘C— ~ -~ 19
tO ID OJI,.) U m us
C..-, __________________ I]) ID’C..) ~~_II~~ittt ~Ott0t ‘—. — LU a. us
_______ LU LU ~— ____ IDU’) ~ - t~~’‘:50:: ________
+ ,5* .9 ~ 19 19 .r, u~. ~ 19 ~, 19 .5* *5* .9 19 .9 19 ~l .5*
C.b C”. U) (51 — — (5) U. F’— ~ 0, C’- U) (5) — — (51 ~ F’~
(_) , I u I , I
5!)3~ 31flhI1~fl ‘~‘~ ~]rU.I.L¼r1

Cx ~
~- ~)U.U)U,**** ,5*1919CSC-(0U.U’;*C’1Cd~01
P.1 ç’Sj çiJ Cd 0.1 Cd P.1 (‘1 0.1 Cd 0.1 (5J 0.1 C.J —,H
it ~
W — ___________
1 CO ~ I— - -~
XC :‘ :~
__ c-i ~ /f’3ru~ 9_I ~
CI t’’ i::i 4.1
LL~
Ii’ ~.
~ ~irui±~i 5F)~I] 3jpj~j~r-~ c~ .2 ~I
D we.,.,
F’- Cii _. ill U) (0 CC. .9 0.1 * ~) CS 0.1 CC. * 19 CD 0.1 CC. ‘* 19 CLI Cd CCI a,N (0 (CI If, * CS Ill Cd 1” 19 19 CS •‘‘‘‘‘. a, - UII) (51 0) 01 Cl) (51 1’) Cl 0) (‘1 0.1 Cii ‘5’ U’, U’ U’, * -1- 0) CO (C, Cd Cd — ~ 01 1.1 a, “i
(V ‘5’~’
I I ~ .~ ~
ncn 0a,
a,~bO
___________ ,0
ru : -~ _j— .;“o 0...— -~ ,,j
:1 \LJ’) ~
5 :. ~ cx) a, 0
___ID! ___________:! ~
___________ __ ~
_______ ______ ID LLC.1
_________ a. 15,-ItO IDID ____ ___ WW~
u. _______ ID+ ‘I’
19 9 ID 19 19 ID it. 19 ID 19 ID 19 19 Its 9 19 .9 .9 ID .5*.~J ~ C”- U) Cl — — (5 U’ 1’— ~ 0, C’- U) C’) — — (51 If, I— ~
I , I
5930 3lflJ.IJ.’fl ‘593’] 3JRLLLfl
c~ r’~’ U3ULIiL8Ul~t1~~— *ClO,.ICd~,9ID19CC.03C’-(0
P.1 Cii 0,1 Cd 0,1 (“1 P.1 —
H , - ‘ ‘~ ~ r [-~-~-. ,. . ,,~-r
CC. CC.
p.1 V.1‘U fl-I
CLJ
‘:1 11111 ~]tti.Ui CO CO
‘4— “
co~ ::.::: L..I ‘..~
110 Z ~ 100 Z 0’
5 t):5: a,~
—I I.i..~
ID 00:,5~ (_)
-.
I I I I I I I I I I ._ , a,,,.~UJU’
‘5,93.] ~11LiLL~’1 ‘5930 3]flul.W1 P WLL~(_3 asF—Hr--IHH ‘Ca,
000to 19 0.1 * C’- 19 Iii U) C’- 19 .3,1 Liu — CU Cd Cl CC. ~1- * It, CL. CLI C- C’- a,I’CZ CS * CC. * 19 U) 19 U) ~- ‘C~ ~— •‘‘‘‘.‘‘‘‘.‘ 0. ‘0
— — ‘9 ‘5, 19 CCI 19 Of. (51 C’- C’- C’- U) (C’ — 01 C’- U) C’) — 19 C’- U) ,, 01 a, ~V.1 CU 01 01 ,~, “~ ~
(V ,5j_
.1
~.. 1ii:.t.~ C,,,,,) B usID ttOOi:,:iO \Lf’ ~a,
.00’ :1000001’ !‘~L ~it° — :::00:::::: Li..., ‘v” a, us
- [‘—LU—lJ ~]. ~ ~ ~ ‘IE ~
—~ ~ ____ ~ ~wu ~IDE- ~ 1’-
-rj ~ ~:tE~tt:, ~ ..,~ s,u ~J ‘*.~
tfi~ a,U ~C’v- ~
H ‘:oo::: 9 :..s~ IDU. .2-~ . Li..CD
—_
I IJIJ___ IDID() ~-
.00:,.. ~‘WI]) :5: .. LJJLIJCI
.0:: 5:: ID
Ci) — ::o:: ____________________
1919 ID,9 .9 ID1919 1919.919.9.9—1 Cb C”. U) Cl — — C~) 10 1’- 19 0, C’. Is) C’) — — (51 LIu F’- Cb1.-) I I I I
‘5.93’] ]fliLL~fl ‘9,93’] 33fl.LIWI

LowerThermosphericTraceSpeciesModels (1)115
Latitudinal and Vertical distributions for equinox and variations with solar and geomagneticactjyjty: Steady-State Results with uniform latitudinal distribution of turbulence.
Figure 5 shows variations of atmospheric structure and composition as a function of altitudeand latitude simulated using the two-dimensional, time-dependent model. Panel A shows thedensity distributions of atomic oxygen, nitric oxide, molecular oxygen and molecular
nitrogen. Panel B shows temperature, meridional and vertical neutral wind, and meanmolecular mass. Panel C displays nitric oxide density distribution from 100 to 160 km. forcomparison with the results obtained from SHE [1]. The conditions depicted are equinox, lowsolar (F
10 7 cm = 80) and low geomagnetic (Kp = 1) activity. There is a very weaklatitudinal’ variation of atomic oxygen density, related to high-latitude geomagnetic energyinputs. Nitric oxide density is structured by two peaks, one at low-latitudes, due to solarproduction, and the other in the auroral oval, resulting from auroral particle dissociation.
Figure 6 shows variations of atmospheric structure and composition as a function of altitudeand latitude simulated using the two-dimensional, time-dependent model. The displays are asfor Figure 5. The conditions simulated are low solar (F107 cm = 80) and moderategeomagnetic activity (Kp = 3), at equinox. There is now a weak latitudinal variation ofatomic oxygen density, with decreased density in regions of increased high-latitudegeomagnetic energy inputs. The major feature in nitric oxide density are the enhanced high-latitude peaks, resulting from increased auroral production. There is a ratio of about 3:1between low-latitude and high latitude values of nitric oxide.
Figure 7 shows variations of atmospheric structure and composition as a function of altitudeand latitude simulated using the two-dimensional model. The displays are as for Figure 5.The conditions which are simulated are low solar (F107 cm = 80) and high geomagnetic
activity (Kp =5), at equinox. The latitudinal variation is further enhanced. Atomic oxygenis further depleted, and molecular nitrogen further enhanced, in those regions whichcorrespond to the enhanced auroral energy and particle inputs. Nitric oxide densities varyby more than a factor of 4 from low to high latitudes. The broad latitude extension ofelevated nitric oxide densities correspond mainly to the extended regions of energetic
particle precipitation described by the empirical models. Harked changes of nitric oxideextend to the lower altitude limits (70 km) of the model, while significant changes ofatomic oxygen density extend below 86 km. These low-altitude disturbances are primarily dueto intense geomagnetic energy inputs within the auroral oval.
Figure 8 shows variations of atmospheric structure and composition as a function of altitudeand latitude simulated using the two-dimensional model. The displays are as for Figure 5.The conditions which are simulated are high solar activity (F107 cm — 200), and low
geomagnetic activity (Kp = 2) at equinox. There are considerable enhancements of molecularnitrogen, molecular oxygen and nitric oxide densities and a marked decrease of atomic oxygendensity within both auroral ovals. At this high level of solar activity, the low latitudevalues of nitric oxide density are considerably increased, by a factor of about 4, comparedwith those for low solar activity (F10 7 cm 80). This factor is lower than the factor of
7 - 8 reported for the same range of ~olar activity by Barth [1]. However, Gerard et al.[4] revised this observational result from SHE to a factor of about 2.5 to 3 after
considering the variations of local time of orbit and other factors, and found a factor of 3- 4 variation in [NO] density variation in their own simulations. Even at high solar
activity, the low latitude values remain below the peak auroral oval values, except for veryquiet geomagnetic conditions, Kp = 1 or lower. This indicates that except for prolongedperiods of geomagnetic quiet during periods of high solar radio and UV / EUV fluxes, highlatitude peaks, corresponding to enhanced auroral production, will still be a distinctivefeature of the global distribution of nitric oxide.
The Effects of Latitudinal Variation of Turbulent Dissipation.
The initial state of the zonally-averaged atmosphere is shown in Figure 9a and b. In Figure9a the temperature, mean molecular mass, southward and vertical wind are shown for equinox,low solar activity conditions (FlO.7 cia = 80), and for moderate geomagnetic activitycondition (Kp =2) with a latitude invariant eddy diffusion coefficient, The region from thesouth to north geographic poles over the 17 pressure levels are shown. The structure issymmetric about the equator. High latitude heating from auroral sources is included formean conditions. This causes the reversal of the poleward flow above level 9 (125 km) and
is responsible for the increasu in temperature, mean molecular mass and vertical windpoleward of 500 latitude, The distribution of the major species and NO are shown in Figure9b, The maximum of NO concentration at high latitudes is due to the dissociation of N2 byauroral precipitation sources. Some latitude structure also occurs in atomic oxygen but themajor molecular species have little latitude variation for this equinox case. Duringsolstice the latitude gradients are more pronounced due to the prevailing circulation fromthe summer to winter hemispheres.
Figure lOs and lOb show the latitude/altitude distribution of the same quantities for asimulation when a simple sinusoidal variation of eddy turbulence as a function of latitude

(1)116 D.Reesand T. J. Fuller-Rowell
LOG1O(NO) CM—3 LOG1O(O) CM—3~ ____________________
15. ________________
13. ___ ___
11 —~-----~‘ ~-=--~
.4
~ 9.
~O.-6O.-30.03O~.9O ____
LOG1O(02) CM—3 LOG1O(N2) CM—3‘1 17. :~_~~ao ‘-1—--’---
1-—I---j--~L’’~--~ -—~,j~.’ I ______
~ 15 ~TT TT~-’- ~-E~~i -T~~ii~.— 8.00_—~T
~ 13. ~~—_ 7.2 ——--—--~_.~,~ _____ _____
I I ________________ —I I . ~_—.-----———--~--------—-~——.-....~ 0.0
,,,_....,_— 9.60 ~ ________________________________________
~ 9 .—= -_______________12.0
CT) ‘‘ ‘ 12.0 - ___________________________CT) ________
~ 3 ______________ ~— 14.0
1. uul~~,1I4,4n1,,l,r, __________________________
—90. —60. —30. 0. 30. 60. 90 —90. —60. —30. 0. 30. 60. 90.
5A
TEMPERATURE MEAN MOL MASS17.15, ) 6.8 ____________-
________ 28.05. ________ ________
- -1.—’ ______~.).~S I I I I I
—90. —60. —30. 0. 30. 60. 90 —90. —60. —30. 0. 30. 60. 90.
SOUTHWARD WIND VERTICAL WIND
~ )~~~‘L’~~ ~~(‘~11, --~---4--------=-~ - )
~ I 60.90 -90-60. -30. 0. 30. ‘60,90.
ci’

(1)117LowerThermosphencTraceSpeciesModels
NITRIC OXIDE DENSITY (CM—3)EQUINOX, F10.7=z 80, LEVEL~3([<P 1)
160.1 —~
‘~150.
~14O.
~130. -
~12O. -
‘°~9O. -6ft -30. ‘ 0. 3~60. ‘90.
LATITUDE
5C
FIGURE 5. Variations of atmospheric structure and composition as a function of altitude and
latitude, simulated using the DCL two-dimensional, time-dependent model. Panel A shows thedensity distributions of atomic oxygen, nitric oxide, molecular oxygen and molecularnitrogen. Panel B shows temperature, meridional and vertical neutral wind, and meanmolecular mass. The conditions depicted are equinox, low solar (F
107 cm 80) and lowgeomagnetic activity (Kp = 1). Panel C depicts the distribution of nitric oxide between 100and 160 km, for direct comparison with the data from SME.

(1)118 D.Reesand T. J. Fuller-Rowell
LOG1O(N0) CM—3 LOG1O(O)17. ~ .~_1 ~o~’
1’’’’
15. __ _____
600 _____ .
11. ~—T~~---2-~r ~ 104/ -... 7 .—\ \i-~.” LI / / ‘, ( 7
/ .~ _~
—90. —60. —30. 0. 30. 60. 90 —90. —60. —30. 0. 30. 60. 90
LOG1O(02) CM—3 LOG1O(N2) CM—317. ~ 41 8d ‘ /j4~-7 ~ 0. ~UI
~ 15 ~-----——--—---------—-‘-~ _____
8 001 0 —“‘-——-.— 7 20 ‘~“~‘—‘-—-““—‘-s
~ 1. 3. _—__________—-————--—-—-—______--—-—-—----,_
11. :~— —‘-_ — 10.09.60 ____________________________________
(I) ‘ ‘-—‘—--—‘—‘— 12.0 — ——‘—--— -~
(I) t~,, ~
14 0
1
—90. —60. —30. 0. 30. 60. 90 —90. —60. —30. 0. 30. 60. 90.
6A
TEMPERATURE MEAN MOL MASS
(‘2 15. 1 1’
~0~3O. 0. ~6O.9O -90-60. ~ III
SOUTHWARD WIND VERTICAL WIND
17 ~~1II~Ii I L~’ ~II I I
9 ~l 0.0 0
V V
1 ~ I I I ~I I I I~ I I I~I I I9I I I I I
—90. —60. —30. 0. 30. 60. 90 —90. —60. —30. 0. 30. 60. 90
68

LowerThermosphericTraceSpeciesModels (1)119
NITRIC OXIDE DENSITY (CM--3)EQUINOX, F10.7~80, LEVEL~7([<P 3)
160.
~ 0 / / /,/ // I150. L ~ I \j ///~~~ 140. I / / ~130. / / 7/~H / / I! / /~\\~i2O.~ /~\/ / Al
< /~ I /\ ~110. L100. ‘ ./I/~½~- I—90. —60. —30. 0. 30. 60. 90.
LATITUDE
6C
FIGURE 6. Variations of atmospheric structure and composition as a function of altitude andlatitude simulated using the two -dimensional, time-dependent model. The displa; is as forFigure 5. The conditions simulated are low solar (F
107 cm 80) and moderate geomagneticactivity (Kp = 3) at equinox.

(1)120 D,Reesand T. J. Fuller-Rowell
CM—317 ~ . ‘-~ --J—1-~”-~’ I _i_i ‘
~ 15.13.
~ 6.0011. —~-~
~ J/~ ~ \\ _______________________~. / /,___ .] I ___ \ \ 108J ‘-.5
~ 0 0
~ 0~6~30.0.~.90 -96O.-3O.O.~.6~9O
LOG1O(O2) CM—3 LOG1O(N2) CM—317. I , ~IIIIf5I
I I ~ 9 60I I . ~ ________________________
(‘2 —‘~‘----—— 9.60 —““-—— _______________________________________~ 9, ‘—‘---: -
—.‘---~ _______—i ,~ ____ —---~~, ._____________________(/2 ~‘— 12.0 —_.--
(I) — —.—-.——-‘ __________________(‘2 ‘— — _____
~ 3,~ ~14.4
11I1,1I4.41I11I1,I1i ______________________________
—90. —60. —30. 0. 30. 60. 90 —90. —60. —30. 0. 30. 60. 90.
lÀ
TEMPERATURE MEAN MOL MASS
~~~O-6O3OO3O~9O -9o.-6o.-3:~3o.6o.go
SOUTHWARD WIND VERTICAL WIND
~
11.~~ I - -
9.~0~I 0.0 -~ ‘ -
____ 00\7
°“~ 1. ‘111 /‘T’~’T’’~ii’1 I III I “II I I I ‘I I I I
—90. —60. —30. 0. 30. 60. 90 —90. —60. —30. 0. 30. 60. 90
78

LowerThermosphericTraceSpeciesModels (1)121
NITRIC OXIDE DENSITY (CM—3)EQUINOX, F1O,7= 80, LEVEL=9 ([<P 5)
~:::~ ‘r\\’ I”I”I’ -
~120.
1009Q -6ft ~0. 0. 30. 60. 90.
LATITUDE
7C
FIGURE 7. Variations of atmospheric structure and composition as a function of altitude andlatitude simulated using the two-dimensional, time-dependent model. The display is as forFigure 5. The conditions which are simulated are low solar (F
10 ~ cm = 80) and moderatelyhigh geomagnetic activity (Kp = 5) at equinox.

(1)122 D.ReesandT.J. Fuller-Rowell
LOG1O(NO) CM—3 LOG1O(O) CM—31 7. ~ _5._.I....I~ I III’
(‘2 15 ~ 8.00—~-~p —~_~ — 8.80
(‘2 ~0____
~ 5 ______
~0.-60.-30.0.~9O -90.-60.-30.Q.30.6ft90
LOG1O(02) CM—3 LOG1O(N2) CM—31 7. ‘‘I’~ d 06 ‘ I I
4.80
~ 15.> ________________________________________ 8.00~ 13. - 7.20 _____________- ______
11 _______ _________ — 10 0
~ ________________~ ~:,‘ ___________________
12 0— i’ ~_—__~ -
12.0
(12 _____
(‘2 ‘—~ 3 _______________ 14.0
I I I , 1144 , I I I I I I I I I I I I I I I I I
—90. —60. —30. 0. 30. 60. 90 —90. —60. —30. 0. 30. 60. 90.
8A
TEMPERATURE MEAN MOL MASS1’’~’. ‘~
11I11I11I1 I
~ 15. ) 6.8 ~
~ /~__~_ ~ ~
1 ~
411 ~(‘2 ~ ______________
3’ _______
~ 7 ~
~ ~0. -60. -30. 0. 30. 60. ~ -9~-60. 60.90
SOUTHWARD WIND VERTICAL WIND17. ;; II~) I ‘ ~ I ‘ \\,~I I I H
~ K”—’-’-’-~’-’-~’-~~i ___________________
—90. —60. —30. 0. 30. 60. 90 —90 —60. —30. 0 30. 60. 90
8B

LowerThermosphericTraceSpeciesModels (1)123
NITRiC OXIDE DENSITY (CM~3)EQUINOX, F10.7=200, LEVEL=5 (KP 2)
16O.~ .~ I\~)I~’I’’I \<_,___~/I -
‘~‘ 150.
1000306090
LATTTUDE
8CFIGURE 8. Variations of atmospheric structure and composition as a function of altitude andlatitude simulated using the two -dimensional, time-dependent model. The display is as forFigure 5. The conditions which are simulated are high solar (F
107 cm = 200) and low
geomagnetic activity (Kp 2) at equinox.
As a result of the latitudinal variation in eddy diffusion [32], the temperature decreasesslightly in the mesosphere and lower thermosphere at northern mid-latitudes, This decreaseis less than was previously modelled [3], due to the competing effect of heat dissipation.A temperature and pressure gradient is established between the northern and southernhemispheres which drives the northward flow which peaks at level 9 (125 km) in excess of 20ms~ . A vertical flow, balancing the meridional circulation, is established below pressurelevel 9 with rising motion in the southern hemisphere and sinking in the northern. Thevertical and meridional circulation causes the mean molecular mass to depart from symmetry.
The mean mass is increased by rising motion and decreased by downward motion.
The magnitude of the response to a change in eddy diffusion is therefore qualitativelysimilar to the simulations in the previous study, but the magnitude of the response issubstantially reduced and the explanation of the results is different, as a result of theadditional processes considered and modelled.
The latitude variation in turbulence has changed the mesosphere concentration of NO by amorder of magnitude. As shown in Figure lOb, upper mesosphere NO densities at 45°N are anorder of magnitude higher than at 4505 The cause of this change is not directly due toenhanced or depleted downward turbulent mixing (Fuller-Rowell and Rees, [32]). Thecompositional changes that occur in nitric oxide in the two-dimensional model [32] occurbecause of variations in the mean large-scale circulation (convection and advection) induced
by the latitudinal temperature and pressure gradient resulting from variations in turbulentdiffusion. Changes in NO density of this magnitude can have a profound effect on thechemistry of the stratosphere and mesosphere. Atomic oxygen shows a similar response,although the magnitude of the change is considerably less.

(1)124 D.ReesandT.J.Fuller-Rowell
TEMPERATURE MEAN MOL MASS
_ ~I1hIu~11I/
~O.-60.-30. 0. ~60.9O -9~-60. 300. 30.
SOEJTHWARD WIND VERTICAL WIND
~ ‘ ~l” ‘ ‘ ‘ I7~
9. ‘I 0 , ~ çO~ °I ~o -
7. - / V
~“ 1.~I1IIh1~’I~I—90. —60. —30. 0. 30. 60. 90 —90. —60. —30. 0. 30. 60. 90.
LATITUDE LATITUDE
LOG1O(NO) CM—3 LOG 10(0) CM—317. ~-.. - _-_~-7~ ~4I’ ~
15. ~10(/2 13. ~
~-2 ~
(/2 ~
~ 9. ~
_ 111111 III I’-
—90. —60. —30. 0. 30. 60. 90 —90. —60. —30. 0. 30. 60. 90
LOG1O(02) CM—3 LOG1O(N2) CM—31 7. ~ 41 sd I I _!J__J.L~__4—
1——L .L.&,J I’-~ —~.----—--—-——---- —
~ 1 ~ —-—-—----——-----~--. ~E~— 8.00 —----—---‘TIIIE
~ 13. ~E~72° ~ ___ _______=2 ~ — _______11 ._— —: ____~ 10.0(/2 ,,,,_— 9 60 —‘---—-——--—-—-—--_.. -
‘~‘ ~ E~i~12.0ClJ 5 — ____________—
1IIIII1~.4IIIIIII
—90. —60. —30. 0. 30. 60. 90 —90. —60. —30. 0. 30. 60. 90.
LATITUDE LATITUDE
FIGURE 9. The 2-D global model was run at equinox, with conditions of low solar activity(Fl0.7 cm = 80), and low geomagnetic activity (Kp =2) with a latitude-invariant eddydiffusion coefficient. The temperature, mean molecular mass, meridional and vertical winds(a) and the corresponding distributions of nitric oxide, atomic oxygen and molecularnitrogen and oxygen (b) as a function of latitude between pressure levels 1 and 17 of thetwo-dimensional model. The vertical profile of eddy turbulence is assumed constant as afunction of latitude in this simulation.

LowerThermosphericTraceSpeciesModels (1)125
The latitudinal variations in the concentration of NO and atomic oxygen extend throughoutthe vertical profiles (Figure 12 of [32]). The increase in mesospheric and lowerthermospheric NO density in the northern mesosphere (elevated turbulent diffusion) amountsto an enhancement of a factor of 3 (Northern Hemisphere compared with Southern Hemisphere)
at pressure level 6 and a factor of 8 below pressure level 4. The effect for atomic oxygenis smaller, but is still quite significant.
There is a corresponding change in the zonal winds, whence the effect of the Coriolis forceon the induced meridional flow drives zonal jets (Figure 13 of [32]). A zonal jet of morethan 110 ms’~’ is generated in the southern hemisphere. In the northern hemisphere, theeastward jet has been displaced poleward and a weaker westward flow has stabilised at lowlatitudes. Thus far, no momentum dissipation has been included in the two-dimensionalsimulations. The development of zonal jets might be modified were momentum dissipation
included. However, a possible increase in the resultant meridional flow, would be expectedto increase the vertical flow and further enhance the consequent composition effects (i.e.enhancement and depletion of nitric oxide and atomic oxygen densities).
5. DISCUSSION.
Atomic oxygen in the upper thermosphere shows large seasonal / latitudinal variations inresponse to asymmetric solar insolation. Such variations have been well known for manyyears, and have now been successfully simulated by theoretical and numerical modelling.Wind-driven diffusion (Hayr and Harris [37]) caused by systematic upwelling over the summerpole, downwelling near the winter pole, with an interconnecting mean meridional flow of theorder of 50 m/sec, partly overcomes diffusive equilibrium within the thermosphere. Thiscauses the enhancement of heavy atomic and molecular species relative to light atomicspecies in the summer polar region and the converse in the region of downwelling near thewinter pole.
At higher levels of geomagnetic activity, the wind-driven diffusion process is enhanced,causing a further enrichment of heavy and molecular species in the summer geomagnetic polarcap, where the strongest combined solar and geomagnetic heating occurs. At such times, thelatitudinal variations of the atomic oxygen mixing ratio in the upper thermosphere becomeboth larger and more complex, particularly at the solstice. Using coupled ionosphere -thermosphere models, the structures observed during major disturbances can be reasonablywell simulated, and related to the locally-enhanced heating and upwelling caused, in thepolar regions, by enhanced ion-neutral coupling (ion drag / frictional / Joule heating)resulting from the enhancement of E-region plasma densities by particle precipitation.
Under disturbed geomagnetic conditions at solstice, there can be a factor of 10 latitudevariation in atomic oxygen concentration at the same F-region altitude (300 km). Even at E-
region altitudes (around 125 km), a factor of 5 variation can occur. In both cases,maximum values are within the summer geomagnetic polar cap, while minimum values are at highwinter mid-latitudes, equatorward of the auroral oval.
Nitric oxide variations caused by changes of solar or auroral production tend to followdirectly the combination of solar and auroral production inputs. Transport by winds is
significant, but the large inter-hemispheric circulation at solstice has little influence onoverall distributions. Indeed, much of the effect of inter-hemispheric transport canprobably be related to the major background thermospheric composition changes caused tomolecular nitrogen and atomic oxygen, rather than by long-range (i.e. inter-hemispheric)
nitric oxide transport. There are significant diurnal variations of nitric oxide density,however, the detailed diurnal response cannot be evaluated by the present 2-dimensional
models [4].
We have previously shown 13] that increased eddy turbulence causes enhanced downwardtransport of nitric oxide from the upper thermosphere to the mesosphere. This process hasbeen re-assessed by Fuller-Rowell and Rees [32]. The number density of nitric oxide is
increased in the lower thermosphere, at the mesopause, and in the upper mesosphere by morethan a factor of 3 - 10 by enhanced values if eddy turbulence is increased, within publishedvalues, by a factor of 4. The main effect of a local increase in turbulence is for thetemperature to cool at the mesopause and thermosphere. This is a direct result of themixing of potential temperature by the eddies which pushes the temperature profile towardthe dry adiabatic lapse rate. This occurs despite heating due to turbulent dissipation. Asthe result of the vertical motions, the distributions of both nitric oxide and atomic oxygenare significantly modified.
There is still an issue related to the actual solar EUV and soft X-ray fluxes. It has beensuggested that an index related to sunspot number might provide a batter key forpredictions. The uncertainly in the soft X-ray flux is highlighted by the recent papers byBarth et al [39] and Lean [40], and it will remain an issue until reliable long-term directflux measurements are routinely made.

(1)126 D.ReesandT.J. Fuller-Rowell
TEMPERATURE MEAN MOL MASS
~ ~~2OO~ ~rI1~I~LII
—90 —60 —30. 0 30 60. 90 --90 —60 —30. 0 30 60 90
SOUTHWARD WIND VERTICAL WIND
!~ //L~ I
~~ 3 - -0 ,~:
1 ~ I I I I .L Ii I I I I I I I I I I I I I I—90. —60 —30. 0 30 60 90 —90 —60 —30. 0. 30. 60 90
LATITUDE LATITUDEIOA
LOCIO(NO) CM—3 LOG 10(0) CM--317. ___________
~ 13 ~ _______=2 - ~- 9 00 ~ 9.60
- _ 104~ II \~. ~ 7
—90 —60 -30 0 30 60. 90 —90. —60. —30 0. 30 60. 90
LOG1O(O2)_CM—3 LOG1O(N2) CM—317. ~‘~7~-J172~’4 ~j ‘~4.L~-T - L~-~--7’j~f~
15.> 7 20C3 13. —_~_----—------~ ________=2 _______________ ___ _____
1 1 - - 100_——-—— 9 60 — “— ___________________________
~ 9 —‘---—---—--—-——-—-—--—---—-----. —~- -
- 12.0 ~— ——~ 0 - _______—
I - 12 0
140
11I11/I4.4~I,,I~~t1T
—90 —60 —30. 0 30 60. 90 —90. —60. —30. 0. 30. 60. 90
LATITUDE LATITUDElOB
FIGURE 10. The temperature, mean molecular mass, meridional and vertical winds (A) and thecorresponding distributions of nitric oxide, atomic oxygen and molecular nitrogen and oxygen(B) as a function of latitude between pressure levels 1 and 17 of the two-dimensional model.The simulation was run for the same conditions as Figure 9, except that the vertical profileof eddy turbulence was assumed to vary sinusoidally as a function of latitude, Highestvalues of eddy turbulence are at 450 latitude in the northern hemisphere.

Lower Thermospheric TraceSpeciesModels (1)127
NITRIC OXIDE ATOMIC OXYGENNUMBER DENSITY NUMBER DENSITY
16. . , %~I’’I.I. 16. ‘
15. C 15. D
14. 14.
~ 13. ~ 13.
~12. ~12.(‘211 N (‘211
~1o. \~9.
~8.Cl) 1(/27. )) (1)7(‘2
2 8~ ~. ‘1~.’ 1L1a13.14. ~13.’ 1~. ‘ 1k’ 1~.’ 17.’ i~.ig
LOG1O (M—3) LOG1O (M—3)
Panel C compares the vertical distribution of nitric oxide density at 45°N (1) with 45°S (2)[NO] density associated with enhancement and diininuition of turbulent diffusion coefficientrespectively. In Panel D the corresponding atomic oxygen distribution is shown, with asmaller effect than for [NO].
6. SUMMARY:- Causes and extent of natural variability.
In this study, we have attempted to use the numerical models to study the range ofvariability of atomic oxygen and nitric oxide which might be expected to occur as the resultof four fundamental physical processes which affect composition in the thermosphere and
upper mesosphere.
(i) Seasonal / latitudinal variations.
Global convection and advection, induced by asymmetric solar isolation near solstice, causesa strong latitudinal variation in the composition of the thermosphere. Systematic upwellingand outflow near the summer pole, the connecting circulation and systematic convergence anddownwelling towards the winter pole disturbs diffusive equilibrium. The result is theenhancement of heavy atomic and molecular species, as viewed at constant pressure levels, inthe summer polar regions, and a complementary enhancement of light atomic species near thewinter polar region (again relative to constant pressure levels). For quiet geomagneticconditions, at pressure level 12, the variation of atomic oxygen density from summer towinter pole is about a factor of 4-5. The effects are well-determined empirically, and the
seasonal / latitudinal variation is further enhanced by enhanced high latitude heatingduring periods of high geomagnetic activity.
In the summer polar region, the mean molecular mass at pressure level 12 (F-region, around300 km) may increase to above 24 / 25 amu (high solar activity, F107 = 185, and for
moderately disturbed geomagnetic conditions, Ep = 3’~’ - 5). At solstice and for highgeomagnetic activity, minimum mean molecular mass (a value close to 17 amu) at pressurelevel 12 (around 280 km) occurs at high winter mid-latitudes, rather than in the winterpolar region. For high geomagnetic activity, the n[O~ variation from summer pole to middlewinter latitudes may exceed a factor of 10 at pressure level 12. At times of geomagneticquiet, but particularly at times of high geomagnetic activity, the vertical profiles of
atomic and molecular species depart significantly from diffusive equilibrium, an effect
which is further enhanced at solstice [38]
These seasonal / latitudinal compositional disturbances are not confined to the F-regionand, even at 125 km, latitudinal variations of a factor of 5 in atomic oxygen density can be

(1)128 D. Rees andT. J. Fuller-Rowell
For nitric oxide, there is approximately a 50% modulation in number density caused byseasonal variations. Global scale circulation does not appear to influence the distributionto the same extent as for atomic oxygen (with the opposite variation for molecularnitrogen).
(ii) Solar Activity variations.
The latitude variations observed at constant pressure levels in atomic oxygen and molecularnitrogen caused by seasonal asymmetries of illumination and heating are only marginallychanged by variations of solar activity. However, nitric oxide responds quite dramatically.The simulations indicate a variation of approximately a factor of 3-4, as solar F
10 7 Cmflux increases from FlO.lcm = 80 to 200. This is similar to the ratio of about 2.5 rep’ortedfrom a re-assessment of SHE observations [4].
(iii) Geomagnetic Activity Variations.
The relatively localised energy inputs associated with elevated levels of geomagneticactivity generally cause a local decrease in atomic oxygen concentrations (when observed onconstant pressure levels) in the middle and upper thermosphere, due to npwelling andoutflow. In the summer polar cap, the n[O] decrease can be an order of magnitude at F-region altitudes (around 300 km), and a factor of 5 at E-region altitudes (125 km).Normally, molecular nitrogen densities are elevated as the atomic oxygen density decreases.At low latItudes (equinox) or at middle winter latitudes, n[O] is enhanced by this sameprocess. Nitric oxide densities generally increase rapidly locally, in response to anincrease of auroral precipitation and production. Wind transport of nitric oxide issignificant within the thermosphere and in the mesosphere. However, due to its limitedlifetime, large scale transport by convection and advection Cannot C5U5C, for nitric oxide,the global-scale order of magnitude density changes that, for atomic oxygen and molecularnitrogen, are associated with global-scale wind-driven diffusion. Significant down-windplumes of enhanced [NO] density may also occur as a result of enhanced auroral productionand the generation of rapid equatorward neutral winds in the middle and upper thermosphere.
(iv) Effects of eddy turbulence transport:
Nitric Oxide.
Nitric Oxide is transported downward from the lower thermosphere as the indirect effect ofenhanced eddy diffusion around and above the mesopause. Large-scale circulation changes asthe result of heating by eddy dissipation of winds and waves results in large-scalecirculation systems which act to transport nitric oxide downward from the loverthermosphere. Regions of decreased eddy dissipation have the opposite effect. A factor of 3density increase or decrease at 100 km, and factor of 10 changes around 85 - 90 km can beproduced by this process.
Atomic Oxygen.
Increased eddy turbulence also indirectly causes enhanced downward transport of atomicoxygen from the upper thermosphere into the mesosphere. Where eddy turbulence is enhanced,the resulting mixing ratio of (0] is increased at all upper mesospheric altitudes. Theeffects are rather smaller than for nitric oxide, but amount to an increase or decrease of afactor of 2 near 100 km and a factor of 5 around 85 - 90 km.
In conclusion, the combination of the seasonal, solar activity and geomagnetic variationsdiscussed in this paper can cause significant enhancements and depletions of nitric oxide oratomic oxygen density within the thermosphere and upper mesosphere. Factor of 3 - 5 changesin the local concentration can be quite easily produced. Generally, there should be acorrelation or anticorrelation between variations of different major and minor constituentswithin the lower thermosphere and upper mesosphere, which may also leave a signature intemperature, density or wind profiles. In addition to these causes of changes of minorconstituent distributions, increases (decreases) in the eddy diffusion coefficient, actingon the dissipation of wind and wave energy can cause increases (decreases) of the order of afactor of 3 or more in the density of nitric oxide, and rather smaller changes in atomicoxide, in the lowest parts of the thermosphere and in the upper mesosphere. Host of theseprocesses cause significant departures from diffusive equilibrium, so that the verticalprofiles, obtained from rocket or satellite measurements, may depart significantly fromchemical and or diffusive equilibrium.
ACKNOWLEDGEMENTS
The work at IJCL was supported with computer time allocated by the University of LondonComputer Centre, by grants from the UK Science and Engineering Research Council, and fromthe Air Force Geophysics Laboratory (AFOSR-86-341).

Lower Thermospheric TraceSpeciesModels (1)129
REFERENCES
[1] BARTH CA., Adv. Space Res. j~, No. 6, 103-115, (1990).[2] ROSLE R.G., E.C. RIDLEY and RE. DICKINSON, 3. Geophys. Res., 92, 8745-87, (1987).[33 REES D. and T.J. FULLER-ROWELL, Adv. Space Res., Vol. 10, No. 6, 83-102, (1990).[4] GERARD3.-C., C.G. FESEN and D,W. RUSCH, J. Geophys. Res., 95, 12235-12242, (1990).[5] BANKS and KOCKARTSAeronomy, Parts A and B, Academic Press, New York, (1973).[6] CIRA 1972, Akademie Verlag, Berlin, (1972).[7] HEDIN A.E., 3. Geophys. Res. ~, 10170, (1983).[8] HEDIN A.E., 3. Geophys. Res. 92, 4649, (1987).[9] REES D., R. GORDON, T.J. FULLER-ROWELL, HF. SMITH, G.R. CARIGIVAN, T.L. KILLEEM, PB.
HAYS, NW. SPENCER, Planet. Space. Sci. ~, 617, (1985).[10] REES 0., and T.J. FULLER-ROWELL, Physica Scripta, Vol. T18, 212-228, (1987).[11] CRAVENS T.E. , J.-C. GERARD, Al. STEWARTand D.W. RUSCH, J. Geophys. Res. , ~j, 1675-
2680, (1979).[12] REES N.H., B.A. EMERY, R.G. ROBLE, and K. STAMNES, J. Geophys. Res., ~, 6289
-6300, (1983).113] RICHARDS P.G, HR. TORR and D.G. TORR, J. Geophys. Res., 86, 1498-1498, (1981).[14] TOR.R MR. and 0G. TORR, 3. Atm. Terr. Phys. ~ 797-839, (1979).[153 GARCIA R.R. and S. SOLOMON, 3. Geophys. Res., 90, 3850-3868, (1985)[16] FULLER-ROWELLT.J. and D. REES, .7. Atmos. Sci., 37, 2545, (1980).[17] FULLER-ROWELLT.J. and D. REES, Planet. Space Sd., 31, 1209-1222, (1983).[18] FULLER-ROWELLT.J. and D. REES, Planet. Space Sci., ~j, 69-85, (1984).[19] REES D. and FULLER-ROWELLT.J., Adv. Space Res. 7, 827-838, (1987).[20] FULLER-ROWELLT.J., J. Geophys. Res., ~, 2971-2990, (1984).[21] FTJLLER-ROWELL T.J., J. Geophys. Res., 90, 6567-6586, (1985).[22] FULLER-ROWELL‘1.3, D. REES, S. QUEGAN, R.J. NOPFETT, G.J. BAILEY, 3. Geophys. Res.,
7744-7748, (1987).[23] FULLER-F.OWELL T.J, S. QUEGAN, D. REES, R.J. HOFFETT, G.J. BAILEY, PAGEOPH, Vol. 127,
No2/3 (1988).[24] FULLER-ROWELL T.J, S. QUEGAN, D. REES, R.J. MOFFETT, G.J. BAILEY, J. Atmos. Terr.
Phys. , Vo1.~, No. 10/li, 903-930, (1988).[25] FULLER-ROWELL T.J, and D. REES, AGARD CP-44l, (1988).[26] ROBLE R.G., and J.M. GARY, Geophys. Res. Lett., ~, 703-706, (1979).[27] PULLER-ROWELLT.J. and D.S. EVANS, 3. Geophys. Res. 92, 7606, (1987).[28] KOCKARTS, G., Geophys. Res. Lett., 7, 137-140, (1980).
[29] ROBLE R.G., and B.A. EMERY, Planet. Space Sci., 31, 597-614, (1983).[303 ROBLE R.G., DICKINSON R.E., and E.C. RIDLEY, 3. Geophys. Res., ~, 1599, (1982).
[31] CHIU Y.T. , J. Atmos. Terr. Phys. 37, 1563-1570, (1975).[32] FULLER-ROWELLT.J. and D. REES, (l99l).These proceedings:- Adv. SpaceRes.[33] GORDIETS S.F., YU.N. KULIKOV, MN. MARKOVand M.YA MAROV, 3, Geophys. Res., ~, 4504
(1982).[34] WEINSTOCKJ. , J. Atmos. Sd, 38, 880, (1981).[35] LUSKEN F. -3., U. von ZA}lN, E.V ThRANE, T.BLIX, GA. KOKIN and S.V. PACHONOV, J. Atmos.
Terr. Phys. , ~, 763, (1987).[36] PARISH H., T.J. FULLER-ROWELL, 0. REES, T.S. VIRDI and F.J.S. WILLIAMS, Adv, Space
Res. , 10, (6), 287-292, (1989)[37] MAYRHG. and I. HARRIS, Rev. Geophys and Space Phys., 16, 539, (1978).[38] REES D. , T.J. FULLER-ROWELLand H. RISHBETH, Planet. Space Sd., Vol. 36, No 3, 281
-290, (1988).[39] BARTH C., W.K. TOBISKA and D.E. SISKIND, Geophys. Res. Lett. 15, 92, (1988).[40] LEAN .3., S. Geophys. HAs., 95, 11933, (1990).


