Embed Size (px)
Citation preview
Journal of Atmospheric and Solar-Terrestrial Physics 90-91 (2012) 104–116
Contents lists available at SciVerse ScienceDirect
Journal of Atmospheric and Solar-Terrestrial Physics
1364-68
doi:10.1
n Corr
of Atmo
Researc
Tel.: þ1
E-m
URL
journal homepage: www.elsevier.com/locate/jastp
Dynamical effects of internal gravity waves in the equinoctial thermosphere
Erdal Yigit a,c,n, Alexander S. Medvedev b, Alan D. Aylward c, Aaron J. Ridley a,Matthew J. Harris c, Mark B. Moldwin a, Paul Hartogh b
a Center for Space Environment Modeling, Department of Atmosphere, Oceanic and Space Sciences, University of Michigan, 1429 Space Research Building, 2455 Hayward Street,
Ann Arbor, MI 48109-2143, USAb Max Planck Institute for Solar System Research, Katlenburg-Lindau, Germanyc Atmospheric Physics Laboratory, Department of Physics and Astronomy, University College London, London, UK
a r t i c l e i n f o
Article history:
Received 19 May 2011
Received in revised form
3 November 2011
Accepted 18 November 2011Available online 8 December 2011
Keywords:
Gravity waves
Thermosphere
Mean flow
Wave dissipation
Dynamical effects
26/$ - see front matter & 2011 Elsevier Ltd. A
016/j.jastp.2011.11.014
esponding author at: Center for Space Environ
sphere, Oceanic and Space Sciences, Univers
h Building, 2455 Hayward Street, Ann A
734 763 6248.
ail address: [email protected] (E. Yigit).
: http://aoss.engin.umich.edu/people/erdal (E
a b s t r a c t
Using a recently developed spectral nonlinear gravity wave (GW) parameterization implemented into a
3-D coupled general circulation model, the effects of a broad spectrum of small-scale internal GWs of
lower atmospheric origin on the equinoctial thermosphere are studied for the first time. GWs propagate
to F region altitudes in both hemispheres, producing appreciable drag on the mean zonal wind. Some
modifications of the two-cell equinoctial mean circulation by GWs are simulated, too. The mean zonal
GW drag is comparable to the ion drag up to � 260 km in the middle- and high-latitudes. While the
mean dynamical effect of GWs is the deceleration of the mean flow, the instantaneous GW body force
can have both signs. In the Southern Hemisphere high-latitude, GWs are found to produce large torque
of more than 1000 m s�1 day�1 the mechanism of which is investigated in detail. GW anisotropy plays
a crucial role in offsetting and modulating wave filtering, introducing increased favourable conditions
for westerly harmonics in the high-latitudes. This leads to a very large localized eastward GW
drag reaching a maximum in the upper thermosphere as a consequence of enhanced molecular
viscosity, thermal conduction, and ion drag. Finally, the high-latitude distribution of the GW body
force is presented in the upper thermosphere along with the comparison with ion drag. It demons-
trates significant interhemispheric differences and large longitudinal variations in GW momentum
deposition.
& 2011 Elsevier Ltd. All rights reserved.
1. Introduction
Internal gravity waves (GWs) of lower atmospheric origin playa crucial role for the dynamical structure of the mesosphere andlower thermosphere (MLT) region. The associated momentumflux deposition is largely responsible for the departure of themiddle atmosphere from a radiative equilibrium and sustaining asummer mesopause that is the coldest place in the Earth’s atmo-sphere (‘‘mesopause anomaly’’). Although GW signatures havebeen observed in the thermosphere for several decades (Oliveret al., 1994; Hocke and Schlegel, 1996), the dynamical effects ofGWs have been studied to a much lesser extent in the thermo-sphere–ionosphere (TI) system above the turbopause (� 105 km).While the traditional Lindzen-type saturation threshold is arelatively good approximation for the nonlinear decay of GWs
ll rights reserved.
ment Modeling, Department
ity of Michigan, 1429 Space
rbor, MI 48109-2143, USA.
. Yigit).
in the MLT region that can be applied to reproduce the observeddynamical structure of the middle atmosphere, determining GWeffects in the upper atmosphere above the turbopause requires(1) a general circulation model (GCM) that extends from thelower atmosphere to the upper thermosphere, and (2) a GWparameterization that accounts for the dissipation and propaga-tion of small-scale GWs under conditions of thermospheric andionospheric dissipative processes. Historically, owing to thelimitations of GCMs in their vertical extent (e.g., Richmondet al., 1992; Beagley et al., 1997) and/or incomplete physics inGW parameterizations, scientific requirements (1) and (2) couldnot be addressed properly. Recently, in order to alleviate thesecond limitation, Yigit et al. (2008) have developed an extendednonlinear spectral GW parameterization (‘‘the extended scheme/parameterization’’ hereafter) that systematically accounts for thepropagation and dissipation of GWs propagating from the lowerto the upper atmosphere by incorporating lower and upperatmospheric wave dissipations such as nonlinear diffusion,molecular viscosity and thermal conduction, eddy viscosity, iondrag, and radiative damping in the form of Newtonian cooling.The extended scheme has already been successfully used in theCoupled Middle Atmosphere and Thermosphere-2 (CMAT2)
E. Yigit et al. / Journal of Atmospheric and Solar-Terrestrial Physics 90-91 (2012) 104–116 105
model to determine the dynamical (Yigit et al., 2009) and thermalGW effects (Yigit and Medvedev, 2009) in the mean solstitialcirculation of the thermosphere above the turbopause at quietsolar and geomagnetic conditions. It is important to note thatauroral processes, under conditions of enhanced geomagneticactivity in particular, are a major source of thermospheric gravitywaves that can propagate to low latitudes (e.g., Hocke andSchlegel, 1996). It is also important to note that gravity wavesgenerated by deep convection, important at low- and middle-latitudes with strong local-time dependence, are not included inthis study.
Modeling studies by Yigit et al. (2009) and Yigit and Medvedev(2009) have demonstrated that GW effects compete with ion dragand Joule heating up to F region altitudes and their representa-tions by the extended scheme help to improve the agreement ofthe GCM with the observations of the circulation and the thermalbalance of the thermosphere. The resulting GW effects have alsodemonstrated appreciable solar cycle variations that primarilyresult from the variations of the upper atmospheric parameters(Yigit and Medvedev, 2010). Recently, the Yigit et al. (2008)extended parameterization has also been successfully used in aMartian numerical study (Medvedev et al., 2011a), yieldingimportant diagnostic information on the momentum budget ofthe Martian atmosphere. Medvedev et al. (2011b) then imple-mented the Yigit et al. (2008) parameterization into the MartianGeneral Circulation Model at the Max Planck Institute for SolarSystem Research and showed a strong dynamical influence ofGWs on the Martian circulation between 100 and 130 km.
Despite the historical limitations within 3-D coupled GCMsand the failure of previous GW parameterizations to account forthermospheric dissipation, GW propagation into the thermo-sphere and the resulting attenuation have been studied to a largeextent in numerical simulations. One of the earlier studies wasperformed by Volland (1969) who investigated GW propagationin a theoretical model extending from 150 to 500 km, consideringthermal conduction, but neglecting the effects of height depen-dent winds, molecular viscosity, ion drag, and Coriolis force. Usinga simplified numerical model for a similar altitude range asVolland (1969), Klostermeyer (1972) took into account the effectsof molecular viscosity and thermal conduction and ionization,showing their importance in the upper thermosphere. Using twonumerical models that differ in their dissipative characteristics inthe thermosphere, Hickey and Cole (1988) have argued that anatmosphere that includes dissipation due to molecular viscosity,and thermal conduction, and ion drag has to be assumed toadequately model GW energy flux. While earlier numericalmodels provided some insight into the importance of thermo-spheric dissipative processes, they could not self-consistentlypredict the propagation, dissipation, and the resulting effects ofGWs emanating from the lower atmosphere on the thermosphere.More recent studies focus on the possible coupling between thelower and the upper atmosphere by GWs. Besides the compre-hensive 3-D general circulation modeling studies of Yigit et al.(2009), Yigit and Medvedev (2009), and Yigit and Medvedev(2010), for instance, Hickey et al. (2009) have studied in a spectralfull wave model a single GW packet originating from a tsunamievent and the resulting perturbations in the thermosphere.However, their model assumes that the gravity wave source istime-independent and horizontally uniform, in contrast to thecharacteristics of the tsunami. In a follow-up study based onthe same numerical model, Hickey et al. (2010) have studied theimpact of a characteristic tsunami-driven GW harmonic on thenightglow emission at F region altitudes. Using the ray tracingmethodology, Vadas and Fritts (2005) and Vadas (2007) havestudied the propagation and dissipation of gravity waves in thethermosphere from viscosity and thermal conductivity. Vadas and
Liu (2009) investigated the thermospheric body force associatedwith convectively generated GWs originating from a deepconvective plume in the lower atmosphere. More recently,Vadas and Liu (2011) have looked at the effects on the thermo-sphere from the body forces from dissipating gravity waves in aGCM. These body forces were calculated from the dissipation ofmany convective plumes, clusters, and complexes in Brazil duringone night of the SpreadFex campaign. Ray tracing was used tocalculate the body forces. This ray tracing included molecularviscosity and thermal conductivity.
Recent observations indicate that GWs are continuously pre-sent in the thermosphere, strengthening the probability ofobserved signatures to be of lower atmospheric origin (Djuthet al., 2004; Livneh et al., 2007; Seker et al., 2009). Three-dimensional GCM studies, such as the one presented in thispaper, provide an unprecedented opportunity to self-consistentlyinvestigate the propagation/dissipation of GWs and the resultingeffects in light of the available modeling and observationalstudies.
Here, we focus on the dynamical effects of GWs on theequinoctial thermosphere at quiet solar and geomagnetic condi-tions. Section 2 briefly reviews the extended nonlinear GWparameterization after Yigit et al. (2008) and its implementationin the Coupled Middle Atmosphere Thermosphere-2 model,which is described in Section 3. Sections 4–7 discuss the meanequinoctial effects of GWs on the mean zonal and meridionalcirculation, quantifying the mean GW drag. The temporal varia-tions of GW effects are then discussed in Section 8. Section 9presents the latitude–longitude variability of the GW body forceat the high-latitude upper thermosphere. Summary and conclu-sions are given in Section 10.
2. The extended spectral nonlinear gravity waveparameterization
Gravity wave parameterizations approximate the effects ofunresolved small-scale harmonics on the resolved mean fields.The extended scheme in this study is based on the work by Yigitet al. (2008), and provides the advantage of determining GWeffects in whole atmosphere models, extending from the loweratmosphere to the upper thermosphere. A steady wave approx-imation is employed and individual gravity wave harmonics areassumed to propagate vertically upwards. This implies that waveharmonics do not leave a column above a given grid point and theresolved model fields are independent of time during a time step.Each dissipative process for a GW harmonic j is described by anassociated damping term bj
d, where the total vertical dissipationrate bj
tot acting on the given harmonic j is then
bjtot ¼
XNd
d
bjd ¼ bj
molþbjnonþb
jeddyþb
jradþb
jion, ð1Þ
where bjtot�b
jnon � bj
ext , that is, the ‘‘external dissipation’’, unlikethe ‘‘internal’’ one associated with the nonlinearity of waves. Thedissipation terms in the right hand side of (1) are due tomolecular viscosity and thermal conduction, nonlinear diffusion,eddy viscosity, radiative damping in the form of Newtoniancooling, and ion drag, respectively, and their exact forms aredescribed in detail in the works by Yigit et al. (2008, 2009). Theresultant dissipation then acts to modify the vertical flux of thehorizontal momentum of a GW harmonic j, Fj ¼ u0w0 j, as
u0w0 jðzÞ ¼ u0w0 jðz0Þrðz0ÞrðzÞ�1tjðzÞ, ð2Þ
where z0 � 15 km is the source level, rðzÞ is the backgroundneutral density, u0w0 jðz0Þ and rðz0Þ are the momentum flux andneutral density at the source level, and tjðzÞ is the so-called
E. Yigit et al. / Journal of Atmospheric and Solar-Terrestrial Physics 90-91 (2012) 104–116106
transmissivity. The total GW dissipation, bjtot , determines the
vertical variation of t and, thus, the flux Fj. For t¼ 1, GWpropagation is conservative, and no momentum flux is deposited,while 0rto1 implies a transfer of momentum into themean flow.
Once a GW source spectrum is specified at the source level z0,the altitude variation of bðzÞ and the associated variation ofu0w0 jðzÞ can be determined. Upward propagating GWs producethe momentum deposition a, provided that the wave stress isdivergent
a¼XM
j
aj ¼�XM
j
r�1 @½rðzÞu0w0 jðzÞ�@z
: ð3Þ
At the source level, a Gaussian distribution of GW horizontalmomentum fluxes (per unit mass) u0w0 jðz0Þ as a function ofhorizontal phase speed cj is assumed
u0w0 jðz0Þ ¼ sgnðcj�u0Þu0w0max exp ½�ðcj�u0Þ2=c2
w�, ð4Þ
where u0 is the source wind and cj�u0 is the intrinsic phase speedat the source level, u0w0max is the maximum GW amplitude, and cw
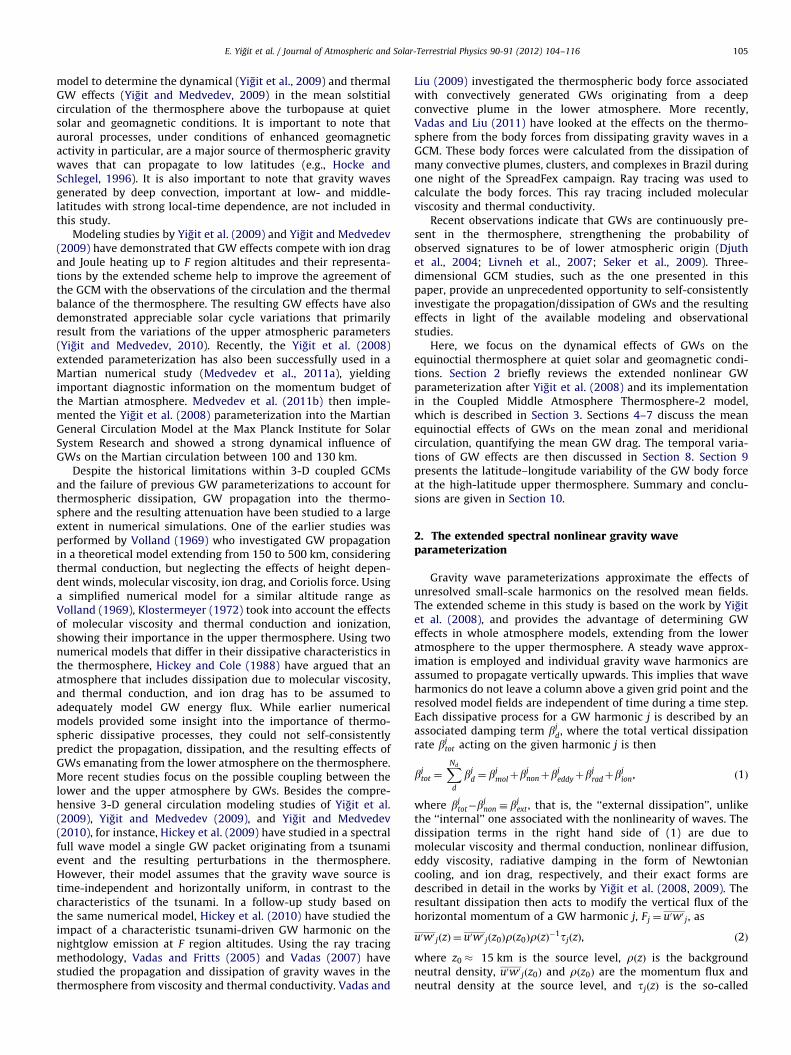
is the half width of the spectrum at half maximum. This spectrumis in a good agreement with recent balloon measurements(Hertzog et al., 2008), and has been successfully used in GCMstudies to produce realistic simulations of the mean flow (Yigitet al., 2009). In Fig. 1, two types of spectra are demonstratedbased on Eq. (4): (a) isotropic (symmetric) and (b) anisotropic(asymmetric) with respect to the mean wind. As the source meanwind is predominantly eastward, a representative case ofu0 ¼ 20 m s�1 is assumed to illustrate the asymmetric case. Bothcases are investigated in the GCM simulations presented in thispaper. The spectral parameters are: the maximum phase speedcmax is 80 m s�1, cw¼35 m s�1, u0w0max ¼ 2:6� 10�4 m2 s�2, thetotal number of harmonics M is 34. The horizontal scale of GWs isassumed to be lH ¼ 2p=9kH9¼ 2p=
ffiffiffiffiffiffiffiffiffiffiffiffiffiffik2þ l2
p¼ 300 km, k and l
being the longitudinal and latitudinal wavenumbers. Gravitywave properties can be highly variable in the lower atmosphere(e.g., Alexander et al., 2008). It is though a common modelingpractice to assume a representative horizontal scale for
Fig. 1. Gravity wave source spectrum with u0w0max ¼ 2:6� 10�4 m2 s�2 launched
at the model lower boundary (� 15 km). Asymmetric and symmetric cases
represent the anisotropic and the isotropic source spectra, respectively. Individual
harmonics are denoted by diamonds and asterisk in the anisotropic and isotropic
cases, respectively. A representative situation of u ¼ 20 m s�1 is assumed in order
to illustrate the anisotropic case.
unresolved small-scale gravity waves (e.g., Medvedev andKlaassen, 2001; Yigit et al., 2009). Typical gravity wave horizontalscales vary with altitude, but to a much smaller extent than theirvertical and temporal scales, being overall between � 100 and500 km (Samson et al., 1990). We therefore employ a horizontalscale of 300 km, which is thought to be representative of theunresolved small-scale gravity waves.
3. Model description and experiment design
The Coupled Middle Atmosphere and Thermosphere Model-2(CMAT2) is a 3-D GCM based on a pressure coordinate system,extending from the lower stratosphere (102 hPa, � 15 km) up tothe thermosphere (1.43�10�8 hPa, 250–600 km). The details ofmodel development have been summarized in a number ofpublications (e.g., Yigit, 2009; Yigit et al., 2009). As the modeldoes not self-consistently incorporate a troposphere, it is drivenfrom below by National Centers for Environmental Prediction(NCEP) reanalysis data including large-scale planetary waves withwavenumbers from one to three, and by solar tides from theGlobal Scale Wave Model (GSWM, Hagan and Forbes, 2002)including diurnal and semidiurnal migrating tides.
The model was run for half a year, and the fields for equinoc-tial conditions were output every 3 h from 2 September to1 October 0000 UT. Note that in the thermosphere the relativelyinert neutrals can take several hours to respond to ion forcing(Killeen et al., 1984). Additionally, the details of GW temporalvariations at equinox are studied outputting every 30 min from21 to 22 September 0000 UT.
4. Zonal mean zonal wind
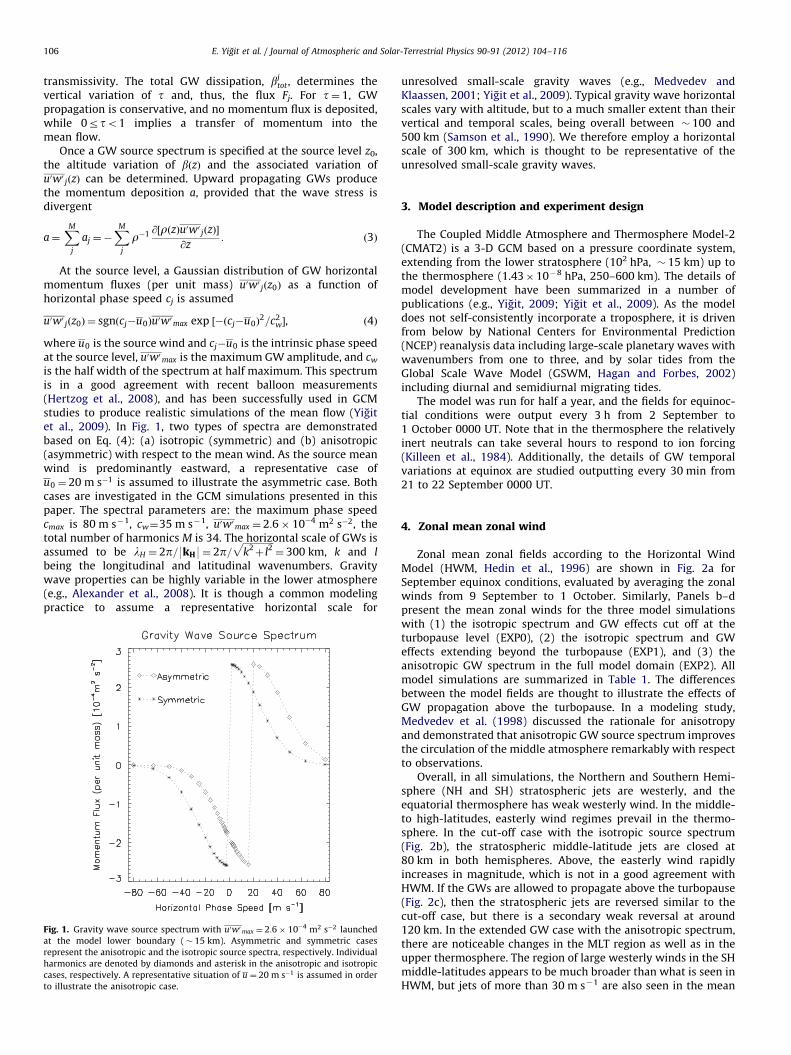
Zonal mean zonal fields according to the Horizontal WindModel (HWM, Hedin et al., 1996) are shown in Fig. 2a forSeptember equinox conditions, evaluated by averaging the zonalwinds from 9 September to 1 October. Similarly, Panels b–dpresent the mean zonal winds for the three model simulationswith (1) the isotropic spectrum and GW effects cut off at theturbopause level (EXP0), (2) the isotropic spectrum and GWeffects extending beyond the turbopause (EXP1), and (3) theanisotropic GW spectrum in the full model domain (EXP2). Allmodel simulations are summarized in Table 1. The differencesbetween the model fields are thought to illustrate the effects ofGW propagation above the turbopause. In a modeling study,Medvedev et al. (1998) discussed the rationale for anisotropyand demonstrated that anisotropic GW source spectrum improvesthe circulation of the middle atmosphere remarkably with respectto observations.
Overall, in all simulations, the Northern and Southern Hemi-sphere (NH and SH) stratospheric jets are westerly, and theequatorial thermosphere has weak westerly wind. In the middle-to high-latitudes, easterly wind regimes prevail in the thermo-sphere. In the cut-off case with the isotropic source spectrum(Fig. 2b), the stratospheric middle-latitude jets are closed at80 km in both hemispheres. Above, the easterly wind rapidlyincreases in magnitude, which is not in a good agreement withHWM. If the GWs are allowed to propagate above the turbopause(Fig. 2c), then the stratospheric jets are reversed similar to thecut-off case, but there is a secondary weak reversal at around120 km. In the extended GW case with the anisotropic spectrum,there are noticeable changes in the MLT region as well as in theupper thermosphere. The region of large westerly winds in the SHmiddle-latitudes appears to be much broader than what is seen inHWM, but jets of more than 30 m s�1 are also seen in the mean
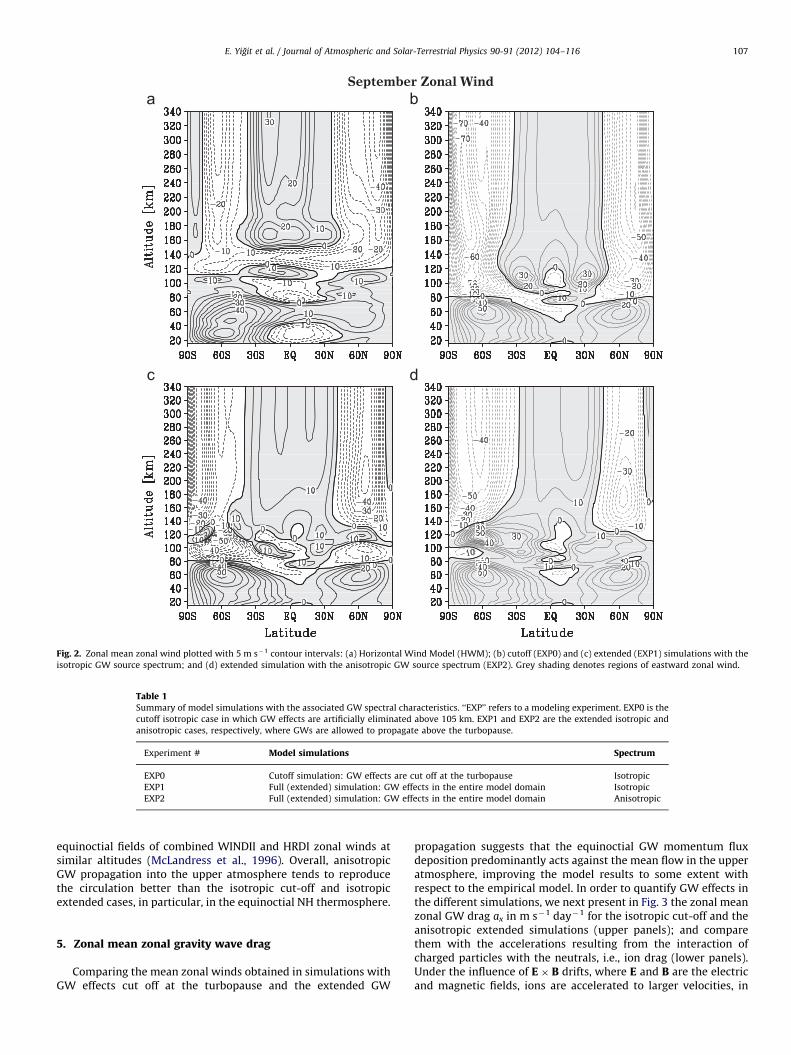
Fig. 2. Zonal mean zonal wind plotted with 5 m s�1 contour intervals: (a) Horizontal Wind Model (HWM); (b) cutoff (EXP0) and (c) extended (EXP1) simulations with the
isotropic GW source spectrum; and (d) extended simulation with the anisotropic GW source spectrum (EXP2). Grey shading denotes regions of eastward zonal wind.
Table 1Summary of model simulations with the associated GW spectral characteristics. ‘‘EXP’’ refers to a modeling experiment. EXP0 is the
cutoff isotropic case in which GW effects are artificially eliminated above 105 km. EXP1 and EXP2 are the extended isotropic and
anisotropic cases, respectively, where GWs are allowed to propagate above the turbopause.
Experiment # Model simulations Spectrum
EXP0 Cutoff simulation: GW effects are cut off at the turbopause Isotropic
EXP1 Full (extended) simulation: GW effects in the entire model domain Isotropic
EXP2 Full (extended) simulation: GW effects in the entire model domain Anisotropic
E. Yigit et al. / Journal of Atmospheric and Solar-Terrestrial Physics 90-91 (2012) 104–116 107
equinoctial fields of combined WINDII and HRDI zonal winds atsimilar altitudes (McLandress et al., 1996). Overall, anisotropicGW propagation into the upper atmosphere tends to reproducethe circulation better than the isotropic cut-off and isotropicextended cases, in particular, in the equinoctial NH thermosphere.
5. Zonal mean zonal gravity wave drag
Comparing the mean zonal winds obtained in simulations withGW effects cut off at the turbopause and the extended GW
propagation suggests that the equinoctial GW momentum fluxdeposition predominantly acts against the mean flow in the upperatmosphere, improving the model results to some extent withrespect to the empirical model. In order to quantify GW effects inthe different simulations, we next present in Fig. 3 the zonal meanzonal GW drag ax in m s�1 day�1 for the isotropic cut-off and theanisotropic extended simulations (upper panels); and comparethem with the accelerations resulting from the interaction ofcharged particles with the neutrals, i.e., ion drag (lower panels).Under the influence of E� B drifts, where E and B are the electricand magnetic fields, ions are accelerated to larger velocities, in
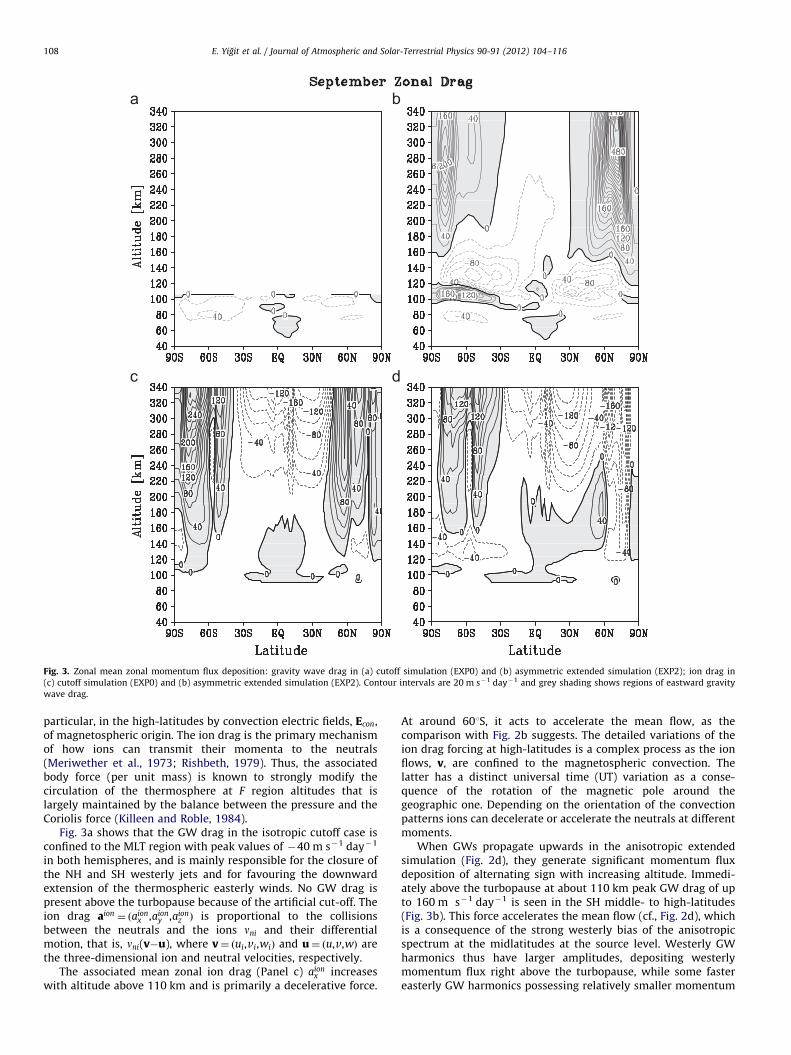
Fig. 3. Zonal mean zonal momentum flux deposition: gravity wave drag in (a) cutoff simulation (EXP0) and (b) asymmetric extended simulation (EXP2); ion drag in
(c) cutoff simulation (EXP0) and (b) asymmetric extended simulation (EXP2). Contour intervals are 20 m s�1 day�1 and grey shading shows regions of eastward gravity
wave drag.
E. Yigit et al. / Journal of Atmospheric and Solar-Terrestrial Physics 90-91 (2012) 104–116108
particular, in the high-latitudes by convection electric fields, Econ,of magnetospheric origin. The ion drag is the primary mechanismof how ions can transmit their momenta to the neutrals(Meriwether et al., 1973; Rishbeth, 1979). Thus, the associatedbody force (per unit mass) is known to strongly modify thecirculation of the thermosphere at F region altitudes that islargely maintained by the balance between the pressure and theCoriolis force (Killeen and Roble, 1984).
Fig. 3a shows that the GW drag in the isotropic cutoff case isconfined to the MLT region with peak values of �40 m s�1 day�1
in both hemispheres, and is mainly responsible for the closure ofthe NH and SH westerly jets and for favouring the downwardextension of the thermospheric easterly winds. No GW drag ispresent above the turbopause because of the artificial cut-off. Theion drag aion ¼ ðaion
x ,aiony ,aion
z Þ is proportional to the collisionsbetween the neutrals and the ions nni and their differentialmotion, that is, nni(v�u), where v¼ ðui,vi,wiÞ and u¼ ðu,v,wÞ arethe three-dimensional ion and neutral velocities, respectively.
The associated mean zonal ion drag (Panel c) aionx increases
with altitude above 110 km and is primarily a decelerative force.
At around 601S, it acts to accelerate the mean flow, as thecomparison with Fig. 2b suggests. The detailed variations of theion drag forcing at high-latitudes is a complex process as the ionflows, v, are confined to the magnetospheric convection. Thelatter has a distinct universal time (UT) variation as a conse-quence of the rotation of the magnetic pole around thegeographic one. Depending on the orientation of the convectionpatterns ions can decelerate or accelerate the neutrals at differentmoments.
When GWs propagate upwards in the anisotropic extendedsimulation (Fig. 2d), they generate significant momentum fluxdeposition of alternating sign with increasing altitude. Immedi-ately above the turbopause at about 110 km peak GW drag of upto 160 m s�1 day�1 is seen in the SH middle- to high-latitudes(Fig. 3b). This force accelerates the mean flow (cf., Fig. 2d), whichis a consequence of the strong westerly bias of the anisotropicspectrum at the midlatitudes at the source level. Westerly GWharmonics thus have larger amplitudes, depositing westerlymomentum flux right above the turbopause, while some fastereasterly GW harmonics possessing relatively smaller momentum
E. Yigit et al. / Journal of Atmospheric and Solar-Terrestrial Physics 90-91 (2012) 104–116 109
fluxes propagate further up and deposit some westward momen-tum that peaks at around 130 km with �100 m s�1 day�1, anddiminishes rapidly with altitude. In the SH high-latitudes above701 where the middle atmosphere mean winds are relativelyweaker and the source level westerly bias is less pronounced, fastwesterly harmonics possess large vertical wavelengths and, thus,are capable of propagating up to the upper thermosphere andproduce drag of up to 200 m s�1 day�1. In the NH middle atmo-sphere westerly jets are overall weaker and the source levelanisotropy is smaller, thus easterly GWs propagating against themean flow are responsible for the easterly GW momentumdeposition at around 120 km, while in the upper thermospherethe fast westerly GWs produce globally the largest mean dragpeaking at � 300 km with 4400 m s�1 day�1. Occurrence oflarge GW drag in the thermosphere above the turbopausemodifies the mean flow and, thus, is a potential source ofvariation for the ion drag. Comparison of aion
x in the cutoffsimulation with the extended case suggests that, especially inthe NH high-latitudes at z4120 km, aion
x changes significantlyfrom a deceleration to an acceleration in the presence of GWmomentum flux deposition. Also, the magnitude of aion
x is appre-ciably reduced in the SH high-latitudes, for example, from 260 to
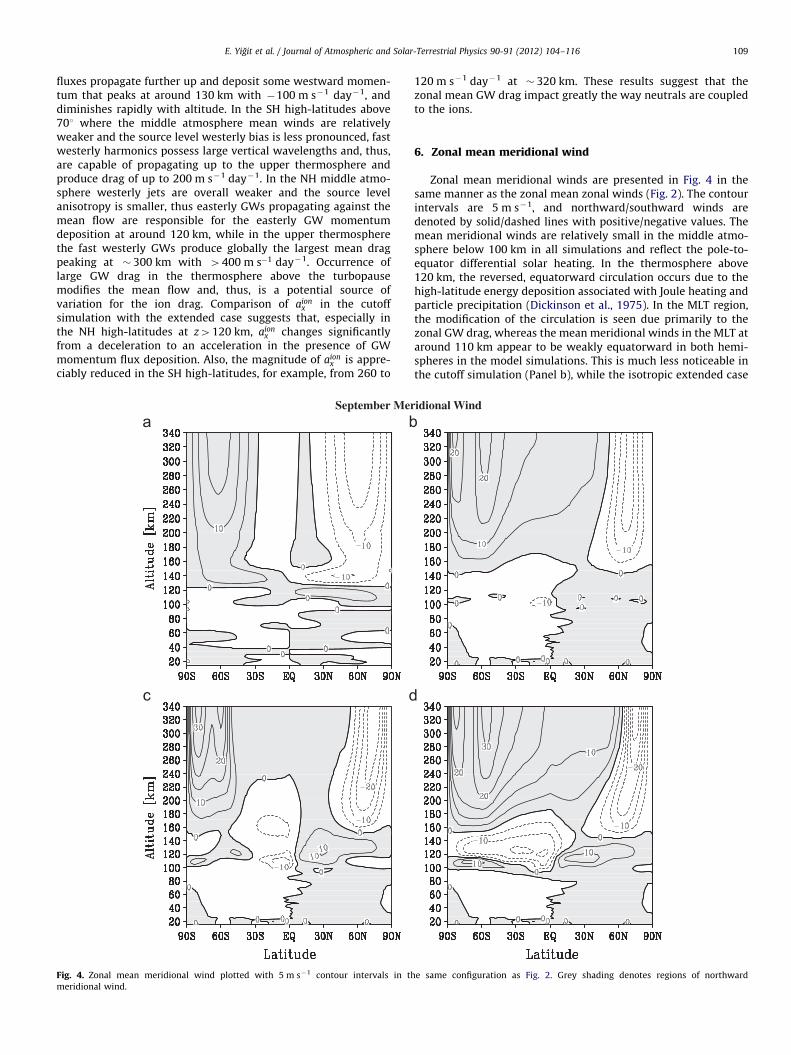
Fig. 4. Zonal mean meridional wind plotted with 5 m s�1 contour intervals in th
meridional wind.
120 m s�1 day�1 at � 320 km. These results suggest that thezonal mean GW drag impact greatly the way neutrals are coupledto the ions.
6. Zonal mean meridional wind
Zonal mean meridional winds are presented in Fig. 4 in thesame manner as the zonal mean zonal winds (Fig. 2). The contourintervals are 5 m s�1, and northward/southward winds aredenoted by solid/dashed lines with positive/negative values. Themean meridional winds are relatively small in the middle atmo-sphere below 100 km in all simulations and reflect the pole-to-equator differential solar heating. In the thermosphere above120 km, the reversed, equatorward circulation occurs due to thehigh-latitude energy deposition associated with Joule heating andparticle precipitation (Dickinson et al., 1975). In the MLT region,the modification of the circulation is seen due primarily to thezonal GW drag, whereas the mean meridional winds in the MLT ataround 110 km appear to be weakly equatorward in both hemi-spheres in the model simulations. This is much less noticeable inthe cutoff simulation (Panel b), while the isotropic extended case
e same configuration as Fig. 2. Grey shading denotes regions of northward
E. Yigit et al. / Journal of Atmospheric and Solar-Terrestrial Physics 90-91 (2012) 104–116110
shows, for example, � 5 m s�1 pole-to-equator circulation in themidlatitude Southern Hemisphere between 100 and 120 km.These features are more intensified with 10 m s�1 in theextended anisotropic case. The regions of poleward circulationthat are seen in both hemispheres above � 120 km and extendupwards are more pronounced in the full anisotropic configura-tion with SH/NH extremum of about �15/10 m s�1, demonstrat-ing an increased degree of hemispheric asymmetry. While overallHWM wind demonstrates a relatively symmetric behaviourbetween the two hemispheres, all model simulations show somedegree of hemispheric asymmetry in the magnitude and distribu-tion of the mean meridional winds in the thermosphere above theturbopause.
7. Zonal mean meridional gravity wave drag
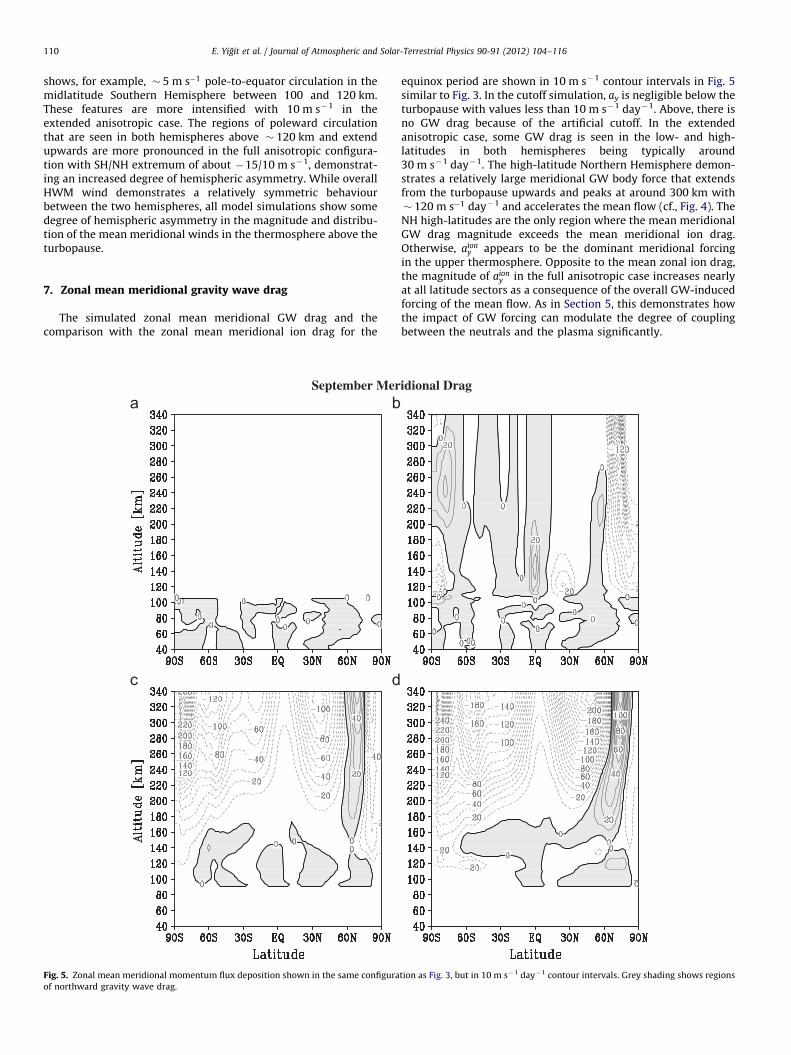
The simulated zonal mean meridional GW drag and thecomparison with the zonal mean meridional ion drag for the
Fig. 5. Zonal mean meridional momentum flux deposition shown in the same configura
of northward gravity wave drag.
equinox period are shown in 10 m s�1 contour intervals in Fig. 5similar to Fig. 3. In the cutoff simulation, ay is negligible below theturbopause with values less than 10 m s�1 day�1. Above, there isno GW drag because of the artificial cutoff. In the extendedanisotropic case, some GW drag is seen in the low- and high-latitudes in both hemispheres being typically around30 m s�1 day�1. The high-latitude Northern Hemisphere demon-strates a relatively large meridional GW body force that extendsfrom the turbopause upwards and peaks at around 300 km with� 120 m s�1 day�1 and accelerates the mean flow (cf., Fig. 4). TheNH high-latitudes are the only region where the mean meridionalGW drag magnitude exceeds the mean meridional ion drag.Otherwise, aion
y appears to be the dominant meridional forcingin the upper thermosphere. Opposite to the mean zonal ion drag,the magnitude of aion
y in the full anisotropic case increases nearlyat all latitude sectors as a consequence of the overall GW-inducedforcing of the mean flow. As in Section 5, this demonstrates howthe impact of GW forcing can modulate the degree of couplingbetween the neutrals and the plasma significantly.
tion as Fig. 3, but in 10 m s�1 day�1 contour intervals. Grey shading shows regions
E. Yigit et al. / Journal of Atmospheric and Solar-Terrestrial Physics 90-91 (2012) 104–116 111
8. Variability of gravity wave effects in the thermosphere
The results for the mean fields presented in the precedingsections provide a good overview of the average influence of GWson the equinoctial circulation. In order to study the details of thepropagation of GWs into the equinoctial thermosphere, theuniversal time (UT) variability of the zonal wind and the zonalGW effects are investigated for the middle- and high-latitudesbecause the largest effects in the model mean fields were seen inthese regions. The results from the extended anisotropic simula-tion (EXP2) are used in this section.
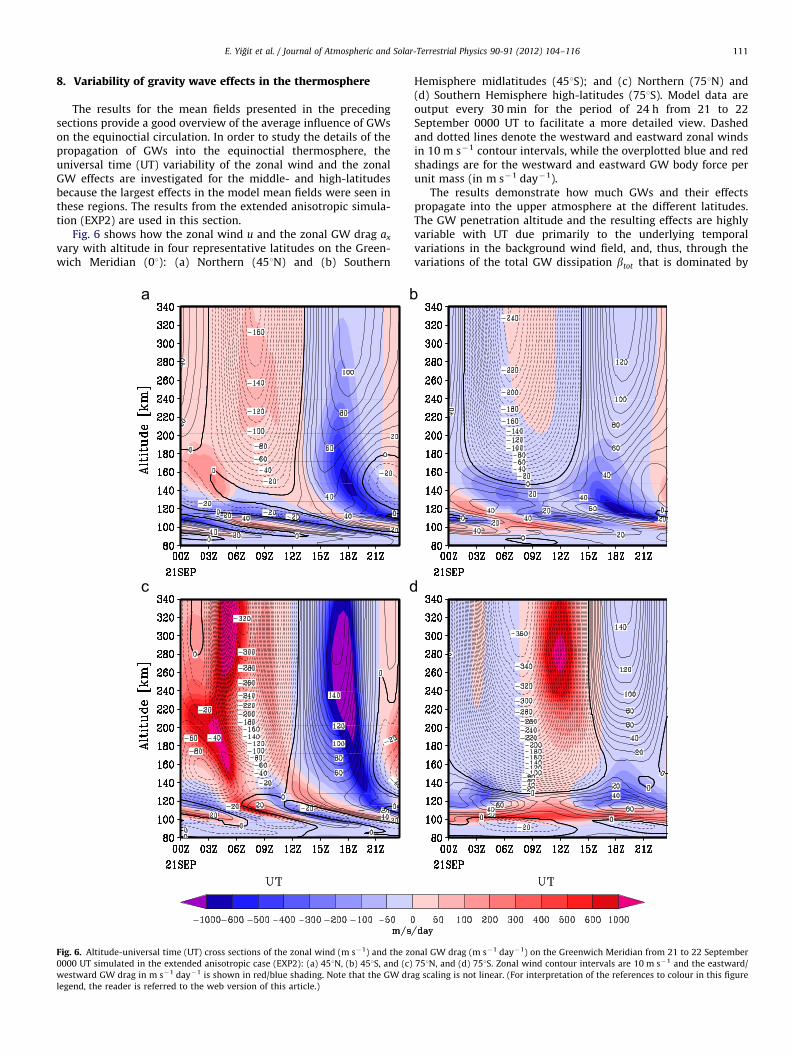
Fig. 6 shows how the zonal wind u and the zonal GW drag ax
vary with altitude in four representative latitudes on the Green-wich Meridian (01): (a) Northern (451N) and (b) Southern
Fig. 6. Altitude-universal time (UT) cross sections of the zonal wind (m s�1) and the zo
0000 UT simulated in the extended anisotropic case (EXP2): (a) 451N, (b) 451S, and (c)
westward GW drag in m s�1 day�1 is shown in red/blue shading. Note that the GW dra
legend, the reader is referred to the web version of this article.)
Hemisphere midlatitudes (451S); and (c) Northern (751N) and(d) Southern Hemisphere high-latitudes (751S). Model data areoutput every 30 min for the period of 24 h from 21 to 22September 0000 UT to facilitate a more detailed view. Dashedand dotted lines denote the westward and eastward zonal windsin 10 m s�1 contour intervals, while the overplotted blue and redshadings are for the westward and eastward GW body force perunit mass (in m s�1 day�1).
The results demonstrate how much GWs and their effectspropagate into the upper atmosphere at the different latitudes.The GW penetration altitude and the resulting effects are highlyvariable with UT due primarily to the underlying temporalvariations in the background wind field, and, thus, through thevariations of the total GW dissipation btot that is dominated by
nal GW drag (m s�1 day�1) on the Greenwich Meridian from 21 to 22 September
751N, and (d) 751S. Zonal wind contour intervals are 10 m s�1 and the eastward/
g scaling is not linear. (For interpretation of the references to colour in this figure
E. Yigit et al. / Journal of Atmospheric and Solar-Terrestrial Physics 90-91 (2012) 104–116112
large bmol and bion at higher altitudes. GWs encounter favourablepropagation in the noon-to-midnight sectors in the midlatitudes.Close investigation shows some asymmetry between the mid-latitudes: in the NH midlatitude (451N) at around 1700 UT GWsproduce a drag of 4�100 m s�1 day�1 at � 260 km, while in theSH midlatitude similar GW drag is found at a much lower altitude(� 160 km) and at a slightly earlier UT.
More drastic hemispheric asymmetry is seen at the high-latitudes (Fig. 6c,d): in the NH, GWs penetrate to altitudesz4300 km primarily at dawn and dusk, having experienced weakdissipation at lower altitudes. Enhanced dissipation at higheraltitudes produce the large drag of 1000 m s�1 day�1 modeled ataround 280 km. In the SH high-latitude, comparable peak GWdrag appears to be localized at around noon.
The dominant instantaneous effect of GWs is directed againstthe wind analogous to their (mean) effects on the mean flow.However, for instance, in the lower thermosphere in all thelatitude sectors there are regions where GWs produce body forcethat is clearly accelerative. Weakly accelerative GW torquepartially occurs in the upper atmosphere in SH latitudes as well.
We next focus on the remarkable feature of the large (morethan 1000 m s�1 day�1) localized GW drag at � 280 km that isseen in the SH high-latitude at around noon. The underlyingmechanisms for the production of such a large localized momen-tum deposition is crucial for understanding the variability of theupper atmosphere, and is thus investigated in more detail. Howcan GWs propagate to such altitudes and produce large bodyforce? In simulations for the solstitial conditions, Yigit et al.(2009) demonstrated that GWs can penetrate to F region heights,due to the enhanced anisotropy and being weakly affected bylower atmospheric filtering. The resulting body force was shownto be accelerative, too. Similar to those studies, the significance ofGW anisotropy for the equinoctial thermosphere along with therelative importance of wave filtering and external dissipations inform of molecular viscosity and ion drag is assessed here.
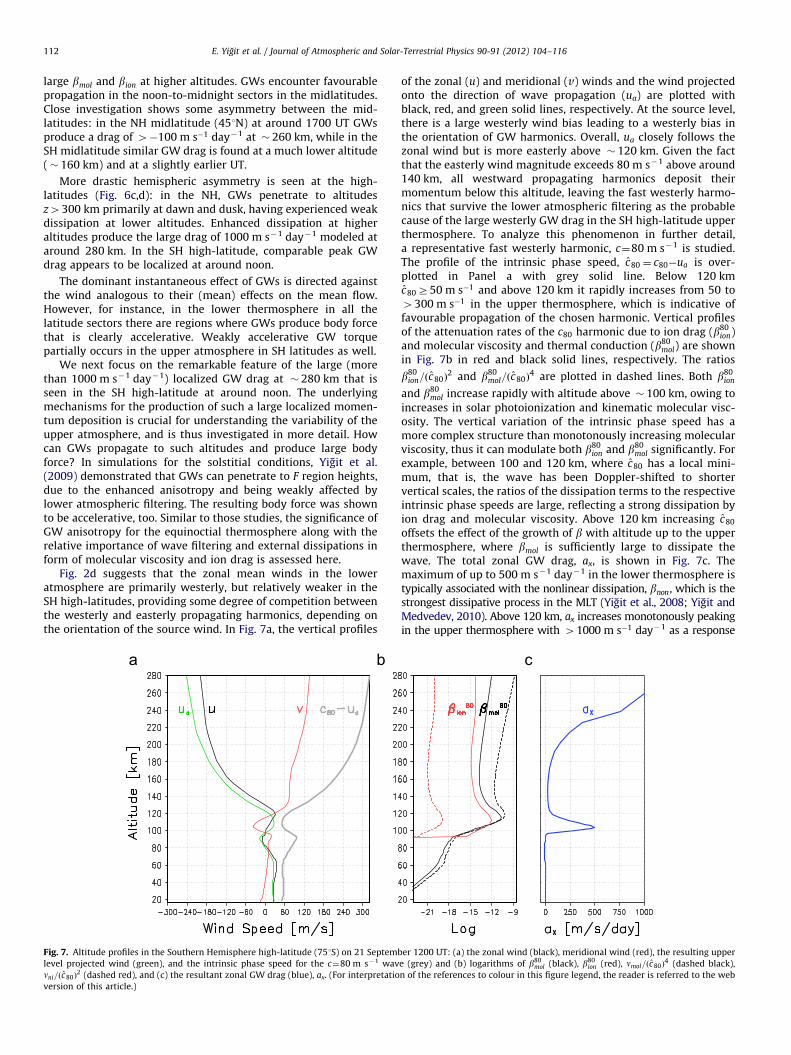
Fig. 2d suggests that the zonal mean winds in the loweratmosphere are primarily westerly, but relatively weaker in theSH high-latitudes, providing some degree of competition betweenthe westerly and easterly propagating harmonics, depending onthe orientation of the source wind. In Fig. 7a, the vertical profiles
Fig. 7. Altitude profiles in the Southern Hemisphere high-latitude (751S) on 21 Septemb
level projected wind (green), and the intrinsic phase speed for the c¼80 m s�1 wav
nni=ðc80Þ2 (dashed red), and (c) the resultant zonal GW drag (blue), ax. (For interpretatio
version of this article.)
of the zonal (u) and meridional (v) winds and the wind projectedonto the direction of wave propagation (ua) are plotted withblack, red, and green solid lines, respectively. At the source level,there is a large westerly wind bias leading to a westerly bias inthe orientation of GW harmonics. Overall, ua closely follows thezonal wind but is more easterly above � 120 km. Given the factthat the easterly wind magnitude exceeds 80 m s�1 above around140 km, all westward propagating harmonics deposit theirmomentum below this altitude, leaving the fast westerly harmo-nics that survive the lower atmospheric filtering as the probablecause of the large westerly GW drag in the SH high-latitude upperthermosphere. To analyze this phenomenon in further detail,a representative fast westerly harmonic, c¼80 m s�1 is studied.The profile of the intrinsic phase speed, c80 ¼ c80�ua is over-plotted in Panel a with grey solid line. Below 120 kmc80Z50 m s�1 and above 120 km it rapidly increases from 50 to4300 m s�1 in the upper thermosphere, which is indicative offavourable propagation of the chosen harmonic. Vertical profilesof the attenuation rates of the c80 harmonic due to ion drag (b80
ion)and molecular viscosity and thermal conduction (b80
mol) are shownin Fig. 7b in red and black solid lines, respectively. The ratios
b80ion=ðc80Þ
2 and b80mol=ðc80Þ
4 are plotted in dashed lines. Both b80ion
and b80mol increase rapidly with altitude above � 100 km, owing to
increases in solar photoionization and kinematic molecular visc-osity. The vertical variation of the intrinsic phase speed has amore complex structure than monotonously increasing molecularviscosity, thus it can modulate both b80
ion and b80mol significantly. For
example, between 100 and 120 km, where c80 has a local mini-mum, that is, the wave has been Doppler-shifted to shortervertical scales, the ratios of the dissipation terms to the respectiveintrinsic phase speeds are large, reflecting a strong dissipation byion drag and molecular viscosity. Above 120 km increasing c80
offsets the effect of the growth of b with altitude up to the upperthermosphere, where bmol is sufficiently large to dissipate thewave. The total zonal GW drag, ax, is shown in Fig. 7c. Themaximum of up to 500 m s�1 day�1 in the lower thermosphere istypically associated with the nonlinear dissipation, bnon, which is thestrongest dissipative process in the MLT (Yigit et al., 2008; Yigit andMedvedev, 2010). Above 120 km, ax increases monotonously peakingin the upper thermosphere with 41000 m s�1 day�1 as a response
er 1200 UT: (a) the zonal wind (black), meridional wind (red), the resulting upper
e (grey) and (b) logarithms of b80mol (black), b80
ion (red), nmol=ðc80Þ4 (dashed black),
n of the references to colour in this figure legend, the reader is referred to the web
E. Yigit et al. / Journal of Atmospheric and Solar-Terrestrial Physics 90-91 (2012) 104–116 113
to the large external dissipation. The analysis suggests that the maincontribution to ax comes from the dissipation of fast harmonics, suchas c80, whose obliteration is deferred to higher altitudes owing toDoppler shifting.
The detailed discussion of the localized GW drag simulated inthe SH high-latitude upper thermosphere highlights the complexinterplay of the following mechanisms that control the GWvertical propagation and the resulting dissipation: (1) variabilityof the source level winds that can introduce a directional bias inthe GW fluxes; (2) GW anisotropy that has a great impact on theGW intrinsic phase speed and vertical scales, which in turnmodulates and even greatly offsets the extent of the dissipation,vertical attenuation, and the resulting drag.
The next section presents the high-latitude distributions ofzonal GW drag in order to evaluate its relative importance for theupper thermosphere from a further perspective in the presence ofother well-established physical forces.
9. Northern and southern hemisphere high-latitudethermosphere in the presence of gravity waves
A variety of dynamical processes contribute to the momentumbalance of the thermosphere at F region altitudes. Earlier upperatmosphere models that typically did not extend into the loweratmosphere have shown that a high-latitude momentum sourceassociated with coupling between the ions and neutrals play asignificant role in shaping the thermospheric circulation(Dickinson et al., 1971, 1981). Although the Coriolis and thepressure gradient forces are prevalent, upper atmosphere windsare typically not geostrophic due primarily to ion drag, which canproduce wind flows that can be directed across the isobars. Theresults presented so far suggest that the mean GW drag canconstitute an important portion of the thermosphere momentumbudget at middle- and high-latitudes and the instantaneouslythey can penetrate to F region altitudes, producing large drag.This section investigates the details of GW drag in the high-latitude thermosphere and its comparison to ion drag.
The force acting on a unit mass can be represented by
Du
Dt¼�2X� u�
1
rr � pþ1
rrðmmolr � uÞþaþaionþg, ð5Þ
where on the right hand side the Coriolis, pressure, viscous, GW,ion friction, and gravitational forces are listed from left to right,respectively; mmol ¼ nmolr is the molecular viscosity coefficient, Xis the angular velocity of the Earth’s rotation, and D=Dt ¼ @=@tþu �r is the material derivative. In the high-latitude thermosphere,via coupling to the magnetosphere aion can attain significantlylarge values, while typically the Coriolis and pressure terms areassumed to dominate. Based on EISCAT data, ion drag effects werealso found to be important in the high-latitude summer lowerthermosphere (Tsuda et al., 2007).
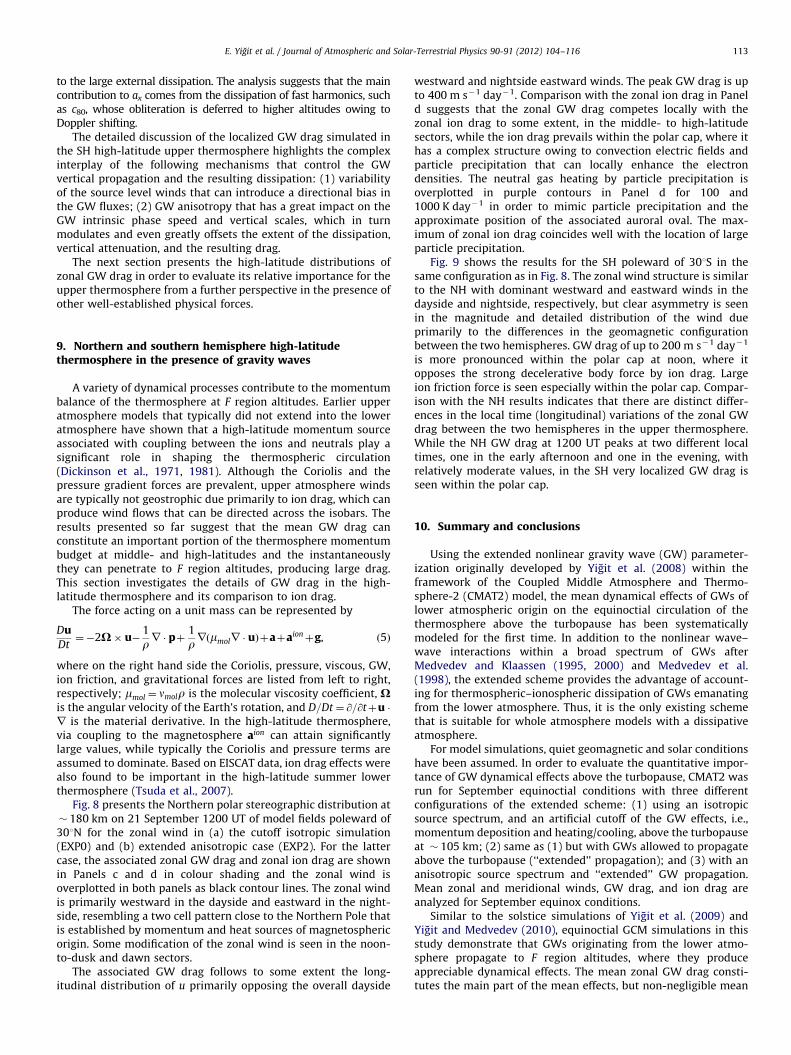
Fig. 8 presents the Northern polar stereographic distribution at� 180 km on 21 September 1200 UT of model fields poleward of301N for the zonal wind in (a) the cutoff isotropic simulation(EXP0) and (b) extended anisotropic case (EXP2). For the lattercase, the associated zonal GW drag and zonal ion drag are shownin Panels c and d in colour shading and the zonal wind isoverplotted in both panels as black contour lines. The zonal windis primarily westward in the dayside and eastward in the night-side, resembling a two cell pattern close to the Northern Pole thatis established by momentum and heat sources of magnetosphericorigin. Some modification of the zonal wind is seen in the noon-to-dusk and dawn sectors.
The associated GW drag follows to some extent the long-itudinal distribution of u primarily opposing the overall dayside
westward and nightside eastward winds. The peak GW drag is upto 400 m s�1 day�1. Comparison with the zonal ion drag in Paneld suggests that the zonal GW drag competes locally with thezonal ion drag to some extent, in the middle- to high-latitudesectors, while the ion drag prevails within the polar cap, where ithas a complex structure owing to convection electric fields andparticle precipitation that can locally enhance the electrondensities. The neutral gas heating by particle precipitation isoverplotted in purple contours in Panel d for 100 and1000 K day�1 in order to mimic particle precipitation and theapproximate position of the associated auroral oval. The max-imum of zonal ion drag coincides well with the location of largeparticle precipitation.
Fig. 9 shows the results for the SH poleward of 301S in thesame configuration as in Fig. 8. The zonal wind structure is similarto the NH with dominant westward and eastward winds in thedayside and nightside, respectively, but clear asymmetry is seenin the magnitude and detailed distribution of the wind dueprimarily to the differences in the geomagnetic configurationbetween the two hemispheres. GW drag of up to 200 m s�1 day�1
is more pronounced within the polar cap at noon, where itopposes the strong decelerative body force by ion drag. Largeion friction force is seen especially within the polar cap. Compar-ison with the NH results indicates that there are distinct differ-ences in the local time (longitudinal) variations of the zonal GWdrag between the two hemispheres in the upper thermosphere.While the NH GW drag at 1200 UT peaks at two different localtimes, one in the early afternoon and one in the evening, withrelatively moderate values, in the SH very localized GW drag isseen within the polar cap.
10. Summary and conclusions
Using the extended nonlinear gravity wave (GW) parameter-ization originally developed by Yigit et al. (2008) within theframework of the Coupled Middle Atmosphere and Thermo-sphere-2 (CMAT2) model, the mean dynamical effects of GWs oflower atmospheric origin on the equinoctial circulation of thethermosphere above the turbopause has been systematicallymodeled for the first time. In addition to the nonlinear wave–wave interactions within a broad spectrum of GWs afterMedvedev and Klaassen (1995, 2000) and Medvedev et al.(1998), the extended scheme provides the advantage of account-ing for thermospheric–ionospheric dissipation of GWs emanatingfrom the lower atmosphere. Thus, it is the only existing schemethat is suitable for whole atmosphere models with a dissipativeatmosphere.
For model simulations, quiet geomagnetic and solar conditionshave been assumed. In order to evaluate the quantitative impor-tance of GW dynamical effects above the turbopause, CMAT2 wasrun for September equinoctial conditions with three differentconfigurations of the extended scheme: (1) using an isotropicsource spectrum, and an artificial cutoff of the GW effects, i.e.,momentum deposition and heating/cooling, above the turbopauseat � 105 km; (2) same as (1) but with GWs allowed to propagateabove the turbopause (‘‘extended’’ propagation); and (3) with ananisotropic source spectrum and ‘‘extended’’ GW propagation.Mean zonal and meridional winds, GW drag, and ion drag areanalyzed for September equinox conditions.
Similar to the solstice simulations of Yigit et al. (2009) andYigit and Medvedev (2010), equinoctial GCM simulations in thisstudy demonstrate that GWs originating from the lower atmo-sphere propagate to F region altitudes, where they produceappreciable dynamical effects. The mean zonal GW drag consti-tutes the main part of the mean effects, but non-negligible mean
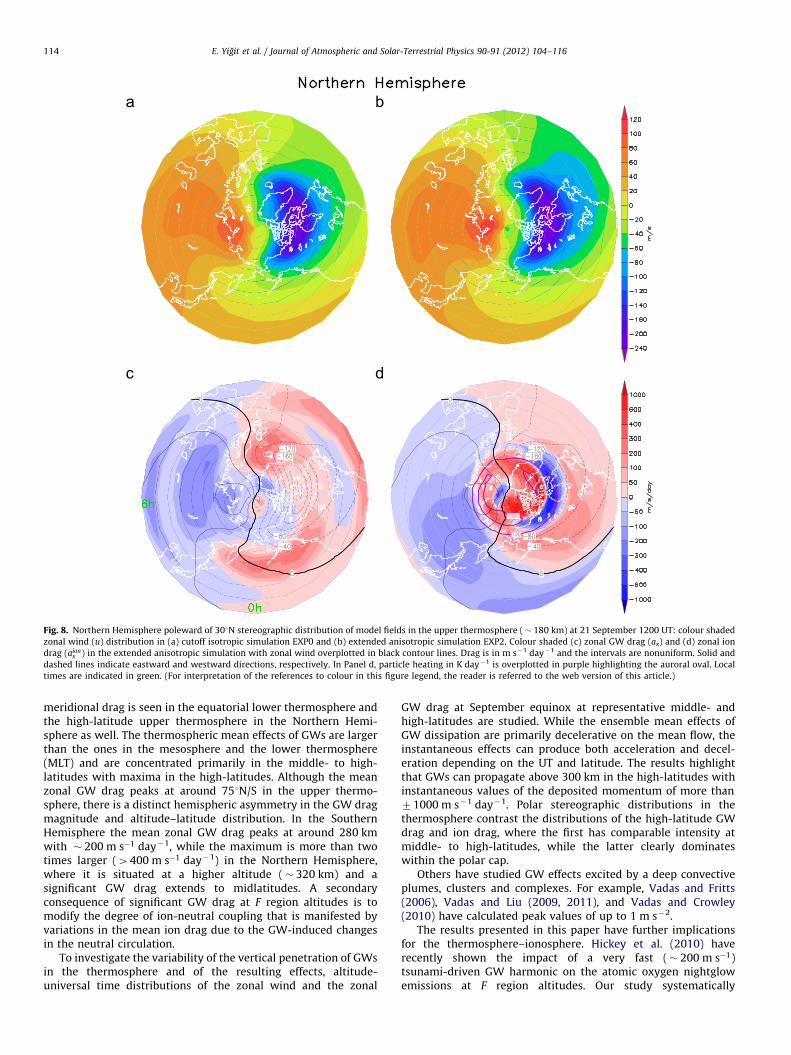
Fig. 8. Northern Hemisphere poleward of 301N stereographic distribution of model fields in the upper thermosphere (� 180 km) at 21 September 1200 UT: colour shaded
zonal wind (u) distribution in (a) cutoff isotropic simulation EXP0 and (b) extended anisotropic simulation EXP2. Colour shaded (c) zonal GW drag (ax) and (d) zonal ion
drag (aionx ) in the extended anisotropic simulation with zonal wind overplotted in black contour lines. Drag is in m s�1 day�1 and the intervals are nonuniform. Solid and
dashed lines indicate eastward and westward directions, respectively. In Panel d, particle heating in K day�1 is overplotted in purple highlighting the auroral oval. Local
times are indicated in green. (For interpretation of the references to colour in this figure legend, the reader is referred to the web version of this article.)
E. Yigit et al. / Journal of Atmospheric and Solar-Terrestrial Physics 90-91 (2012) 104–116114
meridional drag is seen in the equatorial lower thermosphere andthe high-latitude upper thermosphere in the Northern Hemi-sphere as well. The thermospheric mean effects of GWs are largerthan the ones in the mesosphere and the lower thermosphere(MLT) and are concentrated primarily in the middle- to high-latitudes with maxima in the high-latitudes. Although the meanzonal GW drag peaks at around 751N/S in the upper thermo-sphere, there is a distinct hemispheric asymmetry in the GW dragmagnitude and altitude–latitude distribution. In the SouthernHemisphere the mean zonal GW drag peaks at around 280 kmwith � 200 m s�1 day�1, while the maximum is more than twotimes larger (4400 m s�1 day�1) in the Northern Hemisphere,where it is situated at a higher altitude (� 320 km) and asignificant GW drag extends to midlatitudes. A secondaryconsequence of significant GW drag at F region altitudes is tomodify the degree of ion-neutral coupling that is manifested byvariations in the mean ion drag due to the GW-induced changesin the neutral circulation.
To investigate the variability of the vertical penetration of GWsin the thermosphere and of the resulting effects, altitude-universal time distributions of the zonal wind and the zonal
GW drag at September equinox at representative middle- andhigh-latitudes are studied. While the ensemble mean effects ofGW dissipation are primarily decelerative on the mean flow, theinstantaneous effects can produce both acceleration and decel-eration depending on the UT and latitude. The results highlightthat GWs can propagate above 300 km in the high-latitudes withinstantaneous values of the deposited momentum of more than71000 m s�1 day�1. Polar stereographic distributions in thethermosphere contrast the distributions of the high-latitude GWdrag and ion drag, where the first has comparable intensity atmiddle- to high-latitudes, while the latter clearly dominateswithin the polar cap.
Others have studied GW effects excited by a deep convectiveplumes, clusters and complexes. For example, Vadas and Fritts(2006), Vadas and Liu (2009, 2011), and Vadas and Crowley(2010) have calculated peak values of up to 1 m s�2.
The results presented in this paper have further implicationsfor the thermosphere–ionosphere. Hickey et al. (2010) haverecently shown the impact of a very fast (� 200 m s�1)tsunami-driven GW harmonic on the atomic oxygen nightglowemissions at F region altitudes. Our study systematically
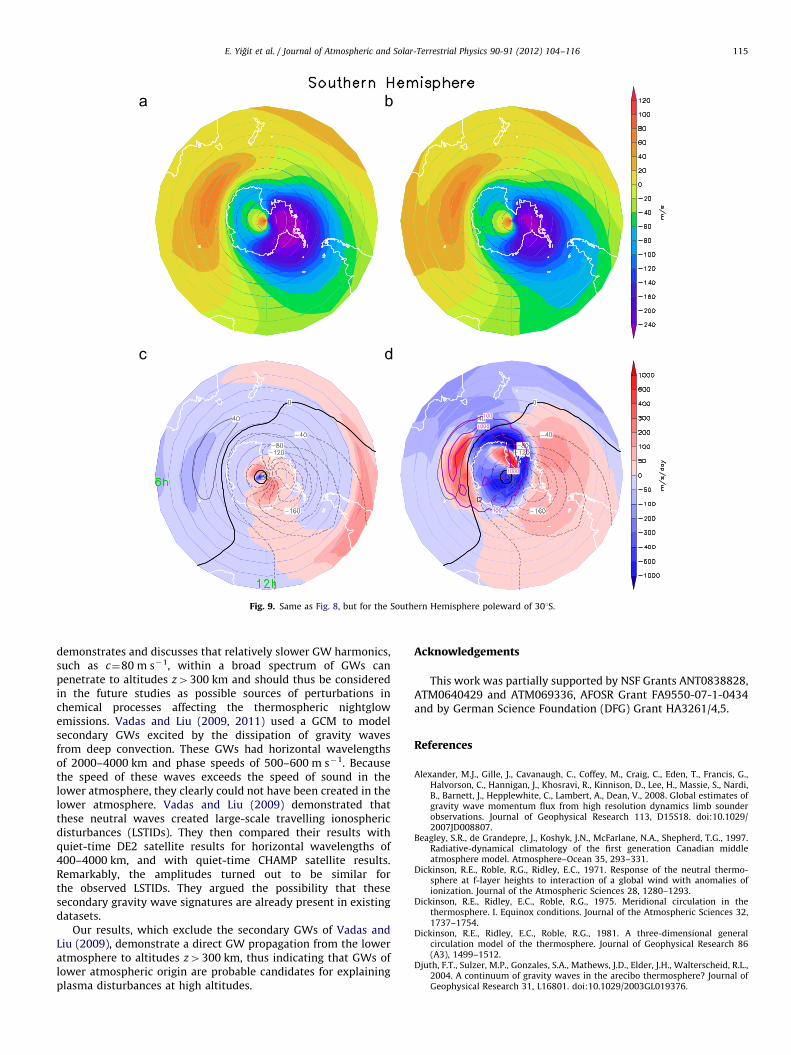
Fig. 9. Same as Fig. 8, but for the Southern Hemisphere poleward of 301S.
E. Yigit et al. / Journal of Atmospheric and Solar-Terrestrial Physics 90-91 (2012) 104–116 115
demonstrates and discusses that relatively slower GW harmonics,such as c¼80 m s�1, within a broad spectrum of GWs canpenetrate to altitudes z4300 km and should thus be consideredin the future studies as possible sources of perturbations inchemical processes affecting the thermospheric nightglowemissions. Vadas and Liu (2009, 2011) used a GCM to modelsecondary GWs excited by the dissipation of gravity wavesfrom deep convection. These GWs had horizontal wavelengthsof 2000–4000 km and phase speeds of 500–600 m s�1. Becausethe speed of these waves exceeds the speed of sound in thelower atmosphere, they clearly could not have been created in thelower atmosphere. Vadas and Liu (2009) demonstrated thatthese neutral waves created large-scale travelling ionosphericdisturbances (LSTIDs). They then compared their results withquiet-time DE2 satellite results for horizontal wavelengths of400–4000 km, and with quiet-time CHAMP satellite results.Remarkably, the amplitudes turned out to be similar forthe observed LSTIDs. They argued the possibility that thesesecondary gravity wave signatures are already present in existingdatasets.
Our results, which exclude the secondary GWs of Vadas andLiu (2009), demonstrate a direct GW propagation from the loweratmosphere to altitudes z4300 km, thus indicating that GWs oflower atmospheric origin are probable candidates for explainingplasma disturbances at high altitudes.
Acknowledgements
This work was partially supported by NSF Grants ANT0838828,ATM0640429 and ATM069336, AFOSR Grant FA9550-07-1-0434and by German Science Foundation (DFG) Grant HA3261/4,5.
References
Alexander, M.J., Gille, J., Cavanaugh, C., Coffey, M., Craig, C., Eden, T., Francis, G.,Halvorson, C., Hannigan, J., Khosravi, R., Kinnison, D., Lee, H., Massie, S., Nardi,B., Barnett, J., Hepplewhite, C., Lambert, A., Dean, V., 2008. Global estimates ofgravity wave momentum flux from high resolution dynamics limb sounderobservations. Journal of Geophysical Research 113, D15S18. doi:10.1029/2007JD008807.
Beagley, S.R., de Grandepre, J., Koshyk, J.N., McFarlane, N.A., Shepherd, T.G., 1997.Radiative-dynamical climatology of the first generation Canadian middleatmosphere model. Atmosphere–Ocean 35, 293–331.
Dickinson, R.E., Roble, R.G., Ridley, E.C., 1971. Response of the neutral thermo-sphere at f-layer heights to interaction of a global wind with anomalies ofionization. Journal of the Atmospheric Sciences 28, 1280–1293.
Dickinson, R.E., Ridley, E.C., Roble, R.G., 1975. Meridional circulation in thethermosphere. I. Equinox conditions. Journal of the Atmospheric Sciences 32,1737–1754.
Dickinson, R.E., Ridley, E.C., Roble, R.G., 1981. A three-dimensional generalcirculation model of the thermosphere. Journal of Geophysical Research 86(A3), 1499–1512.
Djuth, F.T., Sulzer, M.P., Gonzales, S.A., Mathews, J.D., Elder, J.H., Walterscheid, R.L.,2004. A continuum of gravity waves in the arecibo thermosphere? Journal ofGeophysical Research 31, L16801. doi:10.1029/2003GL019376.
E. Yigit et al. / Journal of Atmospheric and Solar-Terrestrial Physics 90-91 (2012) 104–116116
Hagan, M.E., Forbes, J.M., 2002. Migrating and nonmigrating semidiurnal tides inthe middle and upper atmosphere excited by tropospheric latent heat release.Journal of Geophysical Research 108 (A2), 1062. doi:10.1029/2002JA009466.
Hedin, A.E., Fleming, E.L., Manson, A.H., Schmidlin, F.J., Avery, S.K., Clark, R.R.,Franke, S.J., Fraser, G.J., Tsuda, T., Vial, F., Vincent, R.A., 1996. Empirical windmodel for the upper, middle and lower atmosphere. The Journal of Atmo-spheric and Terrestrial Physics 58, 1421–1447.
Hertzog, A., Boccara, G., Vincent, R.A., Vial, F., Cocquerez, P., 2008. Estimation ofgravity wave momentum flux and phase speeds from quasi-Lagrangianstratospheric balloon flights. Part II. Results from the vorcore campaign inAntarctica. Journal of the Atmospheric Sciences 65, 3056–3070.
Hickey, M.P., Cole, K.D., 1988. A numerical model for gravity wave dissipation inthe thermosphere. The Journal of Atmospheric and Terrestrial Physics 50,689–697.
Hickey, M.P., Schubert, G., Walterscheid, R.L., 2009. Propagation of tsunami-drivengravity waves into the thermosphere and ionosphere. Journal of GeophysicalResearch 5. doi:10.1029/2009JA014105.
Hickey, M.P., Schubert, G., Walterscheid, R.L., 2010. Atmospheric airglow fluctua-tions due to a tsunami driven gravity wave disturbance. Journal of GeophysicalResearch 115, A06308. doi:10.1029/2009JA014977.
Hocke, K., Schlegel, K., 1996. A review of atmospheric gravity waves and travelingionospheric disturbances. Annals of Geophysics 14, 917–940.
Killeen, T.L., Roble, R.G., 1984. An analysis of the high-latitude thermospheric windpattern calculated by a thermospheric general circulation model. 1. Momen-tum forcing. Journal of Geophysical Research 89, 7509–7522.
Killeen, T.L., Hays, B., Carignan, G.R., Heelis, R.A., Hanson, W.B., Spencer, N.W.,Brace, L.H., 1984. Ion-neutral coupling in the high-latitude f region: evaluationof ion heating terms from Dynamics Explorer 2. Journal of GeophysicalResearch 89, 7495–7508.
Klostermeyer, J., 1972. Influence of viscosity, thermal conduction, and ion drag onthe propagation of atmospheric gravity waves in the thermosphere. Zeitschriftfur Geophysik 38, 881–890.
Livneh, D.J., Seker, I., Djuth, F.T., Mathews, J.D., 2007. Continuous quasiperiodicthermospheric waves over arecibo. Journal of Geophysical Research 112,A07313. doi:10.1029/2006JA012225.
McLandress, C., Shepherd, G.G., Solheim, B.H., Burrage, M.D., Hays, P.B., Skinner,W.R., 1996. Combined mesosphere/thermosphere winds using WINDII andHRDI data from the Upper Atmosphere Research Satellite. Journal of Geophy-sical Research 101, 10441–10453.
Medvedev, A.S., Klaassen, G.P., 1995. Vertical evolution of gravity wave spectraand the parameterization of associated wave drag. Journal of GeophysicalResearch 100, 25841–25853.
Medvedev, A.S., Klaassen, G.P., 2000. Parameterization of gravity wave momentumdeposition based on nonlinear wave interactions: basic formulation andsensitivity tests. Journal of Atmospheric and Solar-Terrestrial Physics 62,1015–1033.
Medvedev, A.S., Klaassen, G.P., 2001. Realistic semiannual oscillation simulated ina middle atmosphere general circulation model. Geophysical Research Letters28, 733–736.
Medvedev, A.S., Klaassen, G.P., Beagley, S.R., 1998. On the role of an anisotropicgravity wave spectrum in maintaining the circulation of the middle atmo-sphere. Geophysical Research Letters 25, 509–512.
Medvedev, A.S., Yigit, E., Hartogh, P., 2011a. Estimates of gravity wave drag onMars: indication of a possible lower thermosphere wind reversal. Icarus 211,909–912. doi:10.1016/j.icarus.2010.10.013.
Medvedev, A.S., Yigit, E., Hartogh, P., Becker, E., 2011b. Influence of gravity waveson the Martian atmosphere: general circulation modeling. Journal of Geophy-sical Research 116, E10004. doi:10.1029/2011JE003848.
Meriwether, J.W., Heppner, J.P., Stolarik, J.D., Wescott, E.M., 1973. Neutral windsabove 200 km at high-latitudes. Journal of Geophysical Research 78,6643–6661.
Oliver, W.L., Fukao, S., Yamamoto, Y., Takami, T., Yamanaka, M.D., Yamamoto, M.,Nakamura, T., Tsuda, T., 1994. Middle and upper atmosphere radar observa-tions of ionospheric density gradients produced by gravity wave packets.Journal of Geophysical Research 99, 6321–6329.
Richmond, A.D., Ridley, E.C., Roble, R.G., 1992. A thermosphere/ionosphere generalcirculation model with coupled electrodynamics. Geophysical Research Letters19, 601–604.
Rishbeth, H., 1979. Ion drag effects in the thermosphere. The Journal of Atmo-spheric and Terrestrial Physics 41, 885–894.
Samson, J.C., Greenwald, R.A., Ruohoniemi, J.M., Frey, A., Baker, K.B., 1990. Goosebay radar observations of earth-reflected, atmospheric gravity waves in thehigh-latitude ionosphere. Journal of Geophysical Research 95, 7693–7709.
Seker, I., Livneh, D.J., Mathews, J.D., 2009. A 3-D empirical model of f regionmedium-scale traveling ionospheric disturbance bands using incoherentscatter radar and all-sky imaging at arecibo. Journal of Geophysical Research114, A06302.
Tsuda, T.T., Nozawa, S., Brekke, A., Ogawa, Y., Motoba, T., Roble, R., Fujii, R., 2007.An ion drag contribution to the lower thermospheric wind in the summerpolar region. Journal of Geophysical Research 112, A06319. doi:10.1029/2006JA011785.
Vadas, S., Liu, H., 2009. Generation of large-scale gravity waves and neutral windsin the thermosphere from the dissipation of convectively generated gravitywaves. Journal of Geophysical Research 114, A10310. doi:10.1029/2009JA014108.
Vadas, S.L., 2007. Horizontal and vertical propagation of gravity waves in thethermosphere from lower atmospheric and thermospheric sources. Journal ofGeophysical Research 112, A06305. doi:10.1029/2006JA011845.
Vadas, S.L., Crowley, G., 2010. Sources of the traveling ionospheric disturbancesobserved by the ionospheric tiddbit sounder near Wallops Island on 30October 2007. Journal of Geophysical Research 115, A07324. doi:10.1029/2009JA015053.
Vadas, S.L., Fritts, D., 2006. Journal of Geophysical Research 111, A10S12.doi:10.1029/2005JA011510.
Vadas, S.L., Fritts, D.C., 2005. Thermospheric responses to gravity waves: influ-ences of increasing viscosity and thermal diffusivity. Journal of GeophysicalResearch 110, D15103. doi:10.1029/2004JD005574.
Vadas, S.L., Liu, H.-L., 2011. Neutral winds and densities at the bottomside of the flayer from primary and secondary gravity waves from deep convection. In:Abdu, M., Pancheva, D. (Eds.), Aeronomy of the Earths Atmosphere andIonosphere, IAGA Special Sopron Book Series 2. , Springer, pp. 131–139.
Volland, H., 1969. Full wave calculations of gravity wave propagation through thethermosphere. Journal of Geophysical Research 74, 1786–1795.
Yigit, E., 2009. Modelling Atmospheric Vertical Coupling: Role of Gravity WaveDissipation in the Upper Atmosphere, Ph.D. Thesis, University College LondonDoctoral Thesis.
Yigit, E., Medvedev, A.S., 2009. Heating and cooling of the thermosphere byinternal gravity waves. Geophysical Research Letters 36, L14807. doi:10.1029/2009GL038507.
Yigit, E., Medvedev, A.S., 2010. Internal gravity waves in the thermosphere duringlow and high solar activity: simulation study. Journal of Geophysical Research115, A00G02. doi:10.1029/2009JA015106.
Yigit, E., Aylward, A.D., Medvedev, A.S., 2008. Parameterization of the effects ofvertically propagating gravity waves for thermosphere general circulationmodels: sensitivity study. Journal of Geophysical Research 113, D19106.doi:10.1029/2008JD010135.
Yigit, E., Medvedev, A.S., Aylward, A.D., Hartogh, P., Harris, M.J., 2009. Modeling theeffects of gravity wave momentum deposition on the general circulation abovethe turbopause. Journal of Geophysical Research 114, D07101. doi:10.1029/2008JD011132.


