Embed Size (px)
Citation preview
Composites Manufacturing Technologies:Applications in Automotive, Petroleum,
and Civil Infrastructure Industries
Economic Study of a Cluster of ATP-Funded Projects
Prepared for Economic Assessment Office
Advanced Technology ProgramNational Institute of Standards and Technology
Gaithersburg, MD 20899-4710
ByThomas M. Pelsoci, Ph.D.
Delta Research Co., Chicago, [email protected]
Grant SB1341-02-W-1015
June 2004
U.S. DEPARTMENT OF COMMERCEDonald L. Evans, Secretary
TECHNOLOGY ADMINISTRATIONPhillip J. Bond, Under Secretary of Commerce for Technology
NATIONAL INSTITUTE OF STANDARDS AND TECHNOLOGYArden L. Bement, Jr., Director
UN
ITE
DSTATES OF AM
ER
ICA
DE
PARTMENT OF COMMERC
E
NIST GCR 04-863
ii COMPOSITES MANUFACTURING TECHNOLOGIES
Composite materials are strong, lightweight, and corrosion resistant, as well asexpensive to manufacture and not widely used in large scale industrial applications.In 1994, the Advanced Technology Program undertook a program focused oncomposites manufacturing in order to trigger the creation of high-performancemanufacturing infrastructure for commercial composite parts. From 1994 to 2000,ATP invested $43 million, along with industry partners who invested $39 million, in22 high-risk projects.
To assess the economic and societal benefits from ATP-funded projects forcomposites manufacturing, a cluster-study approach was used to combine themethodological advantages of detailed case studies and higher-level overview studies.Five projects were selected for analysis, spanning automotive, offshore oil production,and civil infrastructure applications. Within the cluster of five projects, two projectswith the best near-term prospects for commercial deployment were selected fordetailed case studies.
Based on primary research and analysis, the cluster study estimates exceptionalreturns on ATP’ s investment in five composites manufacturing projects:
• Benefit-to-cost ratios on ATP’s investment ranging from 83:1 to 92:1. • Net present value of ATP’s investment ranging from $892 to $994 million. • Public rates of return on ATP’s investment ranging from 44 to 46 percent.
These measures reflect the estimated benefits to industry users and the general publicrelative to the ATP investment. Estimated benefits to direct recipients of ATP fundingare excluded.
Additional qualitative benefits are reported, including automotive qualityimprovements, energy production benefits, reduced harmful environmental emissions,and lower levels of traffic congestion in metropolitan areas.
Abstract

Research performed for this study indicates that ATP’s industry partners would nothave developed high-risk, low-cost composites manufacturing technologies withoutATP support and without ATP facilitation of broad-based industrial joint ventures.The study concludes that the above benefits are directly attributable to ATP’sinvestment.
Abstract iii
I would like to thank the following people for helpful comments regarding datacollection, analysis, interpretation of results, and earlier drafts of the final report:Jeanne Powell, John Nail, Felix Wu, and Stephanie Shipp (NIST AdvancedTechnology Program), Max Lake, Thomas Hughes, and Gary Tibbetts (AppliedSciences, Inc.), Mark Verbrugge (General Motors Technology Center), Harry Couch(National Composites Center), Brent Larsen (Goodyear Tire & Rubber Company),Deborah Chung (University of Buffalo), Kurt O’Conner (Delco Electronics), JosephFox (Ashland Chemical Co.), Jeff Kronebusch (RTP Company), Christopher Sawyer(Automotive Design & Production), Douglas Johnson (Lincoln Composites),Mamdouh Salama (ConocoPhillips), K. Him Lo (Shell E&P Technology Co.), andCharles Smith (U.S. Minerals Management Service).
Elissa Sobolewski, Stephanie Shipp, Michael Schen, Robert Fireovid, MichaelMcDermott, (NIST Advanced Technology Program), and Brian Belanger (former ATPDeputy Director) provided additional comments on the final report.
iv COMPOSITES MANUFACTURING TECHNOLOGIES
Acknowledgments
Executive Summary v
Executive Summary
Polymer composites are hybrid materials consisting of reinforcing fibers in a polymerresin, which are formed to a desired shape and engineered to achieve performancespecifications.
High-performance composite materials are strong, lightweight, and corrosionresistant, as well as expensive to manufacture and not widely used in large-scalecommercial applications.
In 1994, the Advanced Technology Program (ATP) undertook a program focused oncomposites manufacturing to trigger the creation of an infrastructure for commercialcomposite manufacturing (Wu 2002). The focused program was aimed at helpingU.S. companies develop the technical capability for producing vast amounts ofaffordable performance composites. This new capacity was to be targeted at large-scalecommercial applications in the automotive, offshore oil production, and civilinfrastructure industries. The performance benefits of composite materials, validated inthe focused program, would then be delivered to other U.S. industries and end users.
From 1994 to 2000, ATP invested $43 million, along with industry partners whoinvested $39 million, in 22 high-risk projects. Fifteen of the 22 ATP-funded projectsreached completion; seven closed early. Upon program completion, significantinnovations in composite manufacturing were realized, which can be expected toproduce the following results:
• Rapid, high-volume, low-cost manufacturing processes.• Affordable high performance composites.• Expanded commercial and industrial utilization.
To assess the economic and societal benefits from the ATP-funded program, a cluster-study approach was used to combine the methodological advantages of detailed casestudies and higher-level overview studies. Five projects targeted by the focusedprogram were selected for analysis, spanning automotive, offshore oil production,and civil infrastructure applications. The projects were as follows:
• Vapor-Grown Carbon Fibers for Automotive Applications. • Composite Production Risers for Offshore Oil Production. • Innovative Joining/Fitting Systems for Composite Piping Systems. • Innovative Manufacturing Techniques for Large Composite Shapes. • Synchronous CNC Machining of Pultruded Lineals.
Within the cluster of five projects, two were singled out as having the most probablenear-term prospects for commercial deployment and associated public benefits:
• Vapor-Grown Carbon Fibers for Automotive Applications. • Composite Production Risers for Offshore Oil Production.
For these two projects, detailed case studies were conducted to identify key technicalaccomplishments, identify pathways to market, and quantify productivity, capitalefficiency, and environmental benefits.
This executive summary describes the results of the cluster study, composed of twodetailed case studies and high-level analysis for the remaining three projects. Cluster-study research and analysis were completed during 2002 and early 2003.
COMPOSITE MATERIALSComposites are systems of at least two component materials, acting in concert, withphysical properties that are not attainable by individual components acting alone.Reinforcing fibers provide strength and stiffness. The matrix material binds the fiberstogether, provides form and rigidity, transfers load to the fibers, and protects load-bearing fiber from corrosion and wear. A technical discussion of composite materialsis provided in an appendix.
Engineers can utilize over 50,000 materials for the design and manufacture ofengineered products, including metals, polymers, ceramics, and composites. Whilemetals and polymers are currently the dominant materials for engineeringapplications, composite utilization is gradually increasing due to superior strength,low weight, and improved thermal and electrical performance characteristics. Lowercomposite manufacturing costs would accelerate this trend, especially in cost-sensitiveindustrial mass markets.
MARKET APPLICATIONS AND PROJECTIONSFor automotive applications, ATP-funded vapor-grown carbon fibers are likely to beused in the following ways:
• Exterior automotive panels to facilitate electrostatic painting.• Electromagnetic interference shielding without metal or metal coated enclosures.• Automotive tires for improved fuel economy.
vi COMPOSITES MANUFACTURING TECHNOLOGIES
By 2006, vapor-grown carbon fiber utilization for exterior painting andelectromagnetic interference shielding applications is likely to start with a singlemodel year of 90,000 vehicles. By 2010, vapor-grown carbon fibers could beincorporated in one million vehicles for exterior painting and in 1.5 million vehiclesfor electromagnetic interference shielding. Automotive tire applications are projectedto start in 2011 with 1.25 million tires.
For offshore oil production, starting in 2007, ATP-funded composite productionrisers will be used to reach increasingly deep petroleum reservoirs in the Gulf ofMexico. Over a period of 16 years, lightweight composite production risers areexpected to be used in the
• Construction of 15 new oil production platforms. • Redeployment of 9 existing platforms that have exhausted their underlying
reservoirs.
Prior to 2007, as part of a transitional stage, composite production risers could alsobe used in currently operating Gulf of Mexico platforms to complete remainingproduction wells and expand production from nearby lateral reserves.
BENEFIT-TO-COST ANALYSISBased on primary research and analysis, the cluster study projects high public returnson ATP’s investment in five composite manufacturing projects:
• Benefit-to-cost ratios on ATP’s investment ranging from 83:1 to 92:1 (base case versus step-out scenarios in 2003 dollars).
• Net present value of ATP’s investment ranging from $892 to $994 million. • Public rates of return on ATP’s investment ranging from 44 to 46 percent.
Executive Summary vii
The above indicators point to exceptional returns to the nation on ATP’sinvestment.
For every dollar of ATP’s $9 million investment in the cluster of five projects, U.S.industry, U.S. consumers, and the nation can expect to enjoy $83 of quantifiabledollar benefits. If more optimistic step-out scenario conditions prevail, publicbenefits could reach $92 for every dollar of public investment.
When cash flow benefits from the cluster of five projects are measured againstATP’s entire $43 million investment in the 22 projects of the compositesmanufacturing program, projected public benefits remain at $18 for every dollarof ATP’s investment.
viii COMPOSITES MANUFACTURING TECHNOLOGIES
These performance metrics reflect the estimated benefits to industry users and thegeneral public relative to the ATP investment. Estimated benefits to direct recipientsof ATP funding are excluded.
Performance metrics are estimated on the basis of conservative assumptions,including an average market price of crude oil at $20 per barrel and average retailgasoline price at $1.50 per gallon. If average prices increase to higher levels, theexpected benefits from ATP-funded technologies and performance metrics will alsoincrease.
Qualitative benefits, which can not be quantified at this time, illustrate the potentialof innovative composites manufacturing technologies to create public benefits alongmultiple dimensions of societal value. These benefits include:
• Quality improvements for exterior automotive panels.• Reduced oil consumption from improved automotive fuel economies. • Increased domestic oil production from reaching substantial new petroleum
reserves in the Gulf of Mexico.• Improved maintainability of offshore oil production risers.• Reduced harmful environmental emissions from automotive painting processes. • Reduced traffic congestion in metropolitan areas.
CONCLUSIONSThe cluster study concludes that several ATP-funded composite manufacturingprojects have made significant progress toward meeting the necessary conditions forcommercial implementation. For the two case study projects, technologicaladvantages are close to being translated into business advantages, including:
• Large-scale production of composite components and products.• Improved cost competitiveness with traditional engineering materials.
Based on the above elements of progress toward commercial implementation, thecluster study concludes that public returns from ATP’s investment have a strongprobability of being realized for automotive and offshore oil production. There isalso a reasonable likelihood that future benefits will be realized from civilinfrastructure applications.
Research performed for this study indicates that ATP’s industry partners would nothave developed high-risk, low-cost composites manufacturing technologies withoutATP support and without ATP facilitation of broad-based industrial joint ventures.The study concludes that the above benefits are directly attributable to ATPinvestment.
Executive Summary ix
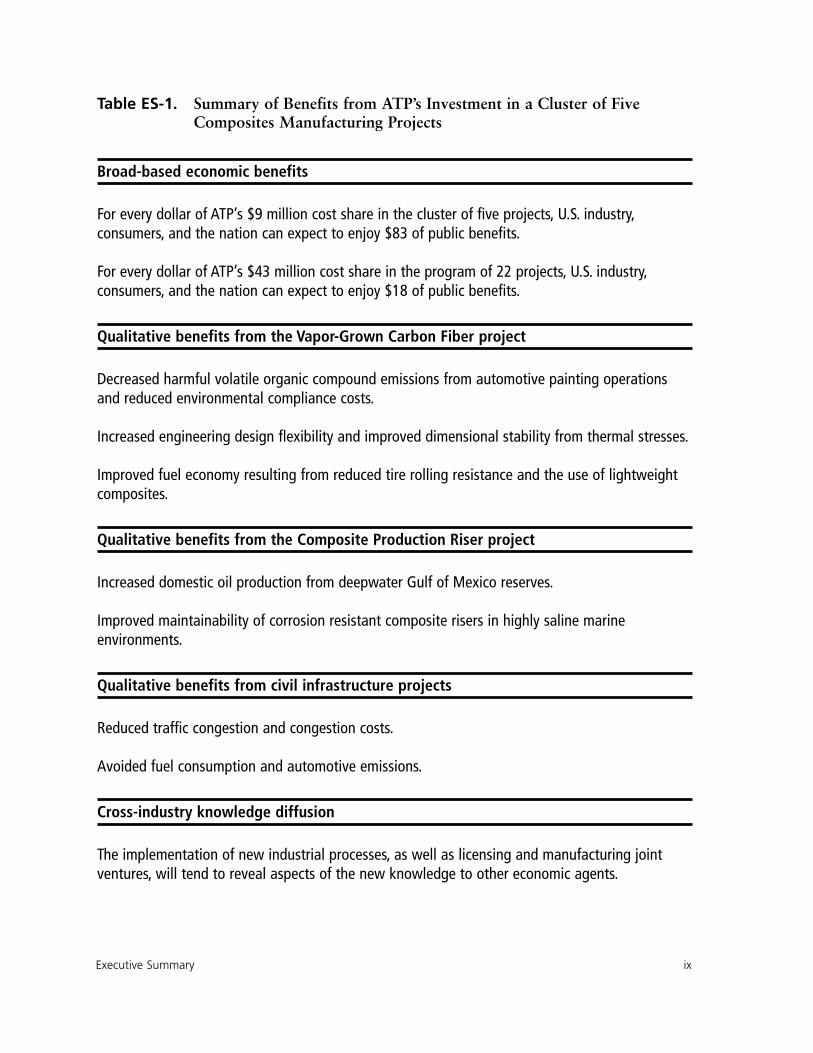
Table ES-1. Summary of Benefits from ATP’s Investment in a Cluster of Five Composites Manufacturing Projects
Broad-based economic benefits
For every dollar of ATP’s $9 million cost share in the cluster of five projects, U.S. industry,consumers, and the nation can expect to enjoy $83 of public benefits.
For every dollar of ATP’s $43 million cost share in the program of 22 projects, U.S. industry,consumers, and the nation can expect to enjoy $18 of public benefits.
Qualitative benefits from the Vapor-Grown Carbon Fiber project
Decreased harmful volatile organic compound emissions from automotive painting operationsand reduced environmental compliance costs.
Increased engineering design flexibility and improved dimensional stability from thermal stresses.
Improved fuel economy resulting from reduced tire rolling resistance and the use of lightweightcomposites.
Qualitative benefits from the Composite Production Riser project
Increased domestic oil production from deepwater Gulf of Mexico reserves.
Improved maintainability of corrosion resistant composite risers in highly saline marineenvironments.
Qualitative benefits from civil infrastructure projects
Reduced traffic congestion and congestion costs.
Avoided fuel consumption and automotive emissions.
Cross-industry knowledge diffusion
The implementation of new industrial processes, as well as licensing and manufacturing jointventures, will tend to reveal aspects of the new knowledge to other economic agents.

Abstract . . . . . . . . . . . . . . . . . . . . . . . . . . . . . . . . . . . . . . . . . . . . . . . . . . . . . . . .ii
Acknowledgements . . . . . . . . . . . . . . . . . . . . . . . . . . . . . . . . . . . . . . . . . . . . . . . .iv
Executive Summary . . . . . . . . . . . . . . . . . . . . . . . . . . . . . . . . . . . . . . . . . . . . . . . .v
Abbreviations and Acronyms . . . . . . . . . . . . . . . . . . . . . . . . . . . . . . . . . . . . . . .xiv
1. Introduction . . . . . . . . . . . . . . . . . . . . . . . . . . . . . . . . . . . . . . . . . . . . . . . . .1Cluster Study Objectives and Scope . . . . . . . . . . . . . . . . . . . . . . . . . . . . . . . . . . . . . . . . . . . .2Five Projects in the Cluster Study . . . . . . . . . . . . . . . . . . . . . . . . . . . . . . . . . . . . . . . . . . . . . .3
2. Analytical Framework and Methodology . . . . . . . . . . . . . . . . . . . . . . . . . . . .5Analytical Framework . . . . . . . . . . . . . . . . . . . . . . . . . . . . . . . . . . . . . . . . . . . . . . . . . . . . . .5General Approach . . . . . . . . . . . . . . . . . . . . . . . . . . . . . . . . . . . . . . . . . . . . . . . . . . . . . . . . .5Methodology . . . . . . . . . . . . . . . . . . . . . . . . . . . . . . . . . . . . . . . . . . . . . . . . . . . . . . . . . . . .9
3. Vapor-Grown Carbon Fiber Case Study . . . . . . . . . . . . . . . . . . . . . . . . . . . .11Project History . . . . . . . . . . . . . . . . . . . . . . . . . . . . . . . . . . . . . . . . . . . . . . . . . . . . . . . . . .11How Does It Work? . . . . . . . . . . . . . . . . . . . . . . . . . . . . . . . . . . . . . . . . . . . . . . . . . . . . . .13Technical Accomplishments . . . . . . . . . . . . . . . . . . . . . . . . . . . . . . . . . . . . . . . . . . . . . . . .14Production Capacity and Cost . . . . . . . . . . . . . . . . . . . . . . . . . . . . . . . . . . . . . . . . . . . . . . .17Automotive Markets for VGCF-Reinforced Composites . . . . . . . . . . . . . . . . . . . . . . . . . . . .18VGCF Competitive Position . . . . . . . . . . . . . . . . . . . . . . . . . . . . . . . . . . . . . . . . . . . . . . . .21Automotive Industry Initiatives . . . . . . . . . . . . . . . . . . . . . . . . . . . . . . . . . . . . . . . . . . . . . .22Benefit-to-Cost Analysis . . . . . . . . . . . . . . . . . . . . . . . . . . . . . . . . . . . . . . . . . . . . . . . . . . .23Qualitative Benefits . . . . . . . . . . . . . . . . . . . . . . . . . . . . . . . . . . . . . . . . . . . . . . . . . . . . . . .29
4. Composite Production Riser Case Study . . . . . . . . . . . . . . . . . . . . . . . . . . .31Project History . . . . . . . . . . . . . . . . . . . . . . . . . . . . . . . . . . . . . . . . . . . . . . . . . . . . . . . . . .31How Does It Work? . . . . . . . . . . . . . . . . . . . . . . . . . . . . . . . . . . . . . . . . . . . . . . . . . . . . . .32Technical Accomplishments . . . . . . . . . . . . . . . . . . . . . . . . . . . . . . . . . . . . . . . . . . . . . . . .33Offshore Oil Production Trends . . . . . . . . . . . . . . . . . . . . . . . . . . . . . . . . . . . . . . . . . . . . . .36Pathways for CPR Deployment . . . . . . . . . . . . . . . . . . . . . . . . . . . . . . . . . . . . . . . . . . . . . .39
Contents xi
Contents
xii COMPOSITES MANUFACTURING TECHNOLOGIES
Offshore Industry Initiatives . . . . . . . . . . . . . . . . . . . . . . . . . . . . . . . . . . . . . . . . . . . . . . . .40Platforms Projections with Composite Risers . . . . . . . . . . . . . . . . . . . . . . . . . . . . . . . . . . . .40Benefit-to-Cost Analysis . . . . . . . . . . . . . . . . . . . . . . . . . . . . . . . . . . . . . . . . . . . . . . . . . . .41Qualitative Benefits . . . . . . . . . . . . . . . . . . . . . . . . . . . . . . . . . . . . . . . . . . . . . . . . . . . . . . .48
5. Additional Projects in the Cluster Study . . . . . . . . . . . . . . . . . . . . . . . . . . . .49Innovative Manufacturing Techniques for Large Composite Shapes . . . . . . . . . . . . . . . . . . . .49Synchronous CNC Machining of Pultruded Lineals . . . . . . . . . . . . . . . . . . . . . . . . . . . . . . .50Innovative Joining and Fitting Technology for Composite Piping Systems . . . . . . . . . . . . . . .51
6. Benefit-to-Cost Analysis for Cluster of Projects . . . . . . . . . . . . . . . . . . . . . .53Project Cluster and Focused Program . . . . . . . . . . . . . . . . . . . . . . . . . . . . . . . . . . . . . . . . . .53Public Benefits, Public Investments, and Performance Metrics . . . . . . . . . . . . . . . . . . . . . . . .54Economic Analysis . . . . . . . . . . . . . . . . . . . . . . . . . . . . . . . . . . . . . . . . . . . . . . . . . . . . . . .56Future Extension of Cash Flow Benefits . . . . . . . . . . . . . . . . . . . . . . . . . . . . . . . . . . . . . . . .60
7. Conclusions . . . . . . . . . . . . . . . . . . . . . . . . . . . . . . . . . . . . . . . . . . . . . . . .63
References . . . . . . . . . . . . . . . . . . . . . . . . . . . . . . . . . . . . . . . . . . . . . . . . . . . . . .65
Appendices . . . . . . . . . . . . . . . . . . . . . . . . . . . . . . . . . . . . . . . . . . . . . . . . . . . . .69Appendix 1. ATP-Funded Projects for Composites Manufacturing Technologies . . . . . . . . . .69Appendix 2. Actual ATP and Industry Investments in Composites Manufacturing
Technologies ($ Millions) . . . . . . . . . . . . . . . . . . . . . . . . . . . . . . . . . . . . . . . . .70Appendix 3. Composite Materials for Engineered Products . . . . . . . . . . . . . . . . . . . . . . . . .71
About the Advanced Technology Program . . . . . . . . . . . . . . . . . . . . . . . .back cover
About the Author . . . . . . . . . . . . . . . . . . . . . . . . . . . . . . . . . . . . . . . . . .back cover
TABLESTable ES-1: Summary of Benefits from ATP’s Investment in a Cluster of Five Composites
Manufacturing Projects . . . . . . . . . . . . . . . . . . . . . . . . . . . . . . . . . . . . . . . . . . . . . . . .ixTable 1: Market Projections for VGCF Utilization in North American Automotive Production
(Numbers of Vehicles in Thousands) . . . . . . . . . . . . . . . . . . . . . . . . . . . . . . . . . . . . . . .24Table 2: Cash Flows and Performance Metrics from VGCF Use in the Automotive Industry
($ Millions, in 2003 Dollars): Base Case . . . . . . . . . . . . . . . . . . . . . . . . . . . . . . . . . . . .28Table 3: Performance Metrics from VGCF Use in the Automotive Industry
($ Millions, in 2003 Dollars): Step-Out Scenario . . . . . . . . . . . . . . . . . . . . . . . . . . . . . .29Table 4: Projected Gulf of Mexico Tension Leg and SPAR Platforms with Composite
Production Risers . . . . . . . . . . . . . . . . . . . . . . . . . . . . . . . . . . . . . . . . . . . . . . . . . . . . .41Table 5: Expected Number of Production Wells Completed with CPR on Existing Tension Leg
Platforms . . . . . . . . . . . . . . . . . . . . . . . . . . . . . . . . . . . . . . . . . . . . . . . . . . . . . . . . . . .43Table 6: Expected Number of Wells Completed with Composite Production Risers on New TLP
and SPAR Platforms . . . . . . . . . . . . . . . . . . . . . . . . . . . . . . . . . . . . . . . . . . . . . . . . . . .44Table 7: Cash Flows and Performance Metrics from CPR Deployment in Gulf of Mexico
($ Millions, in 2003 Dollars): Base Case . . . . . . . . . . . . . . . . . . . . . . . . . . . . . . . . . . . .46Table 8: Performance Metrics from CPR Deployment in Gulf of Mexico: Step-Out Scenario . . . .47
Table 9: Combined Cash Flows of ATP Investments and Expected Benefits from VGCF and CPR Deployment ($ Millions, in 2003 Dollars): Base Case . . . . . . . . . . . . . . . . . . .57
Table 10: Base Case Performance Metrics from Combined VGCF and CPR Cash Flows against ATP Cluster and ATP Program Investments (in 2003 Dollars) . . . . . . . . . . . . . . . . . . . .58
Table 11: Step-Out Scenario Performance Metrics from Combined VGCF and CPR Cash Flowsagainst ATP Cluster and ATP Program Investments (in 2003 Dollars) . . . . . . . . . . . . . .60
APPENDICES TABLESTable A3-1: Typical Properties of Some Engineering Materials . . . . . . . . . . . . . . . . . . . . . . . . . . . .73
FIGURESFigure 1: Flow of Benefits from ATP-Funded Composites Manufacturing Projects . . . . . . . . . . . . . .7Figure 2: Benefit Allocation from ATP-Funded Composites Manufacturing Projects . . . . . . . . . . . .8Figure 3: Vapor-Grown Carbon Fiber Manufacturing Process . . . . . . . . . . . . . . . . . . . . . . . . . . .14Figure 4: Flow of Benefits from the ATP-Funded VGCF Project . . . . . . . . . . . . . . . . . . . . . . . . . .23Figure 5: Wound-in Metallic End Fittings with Traplock Composite-to-Metal Interface . . . . . . . . .34Figure 6: Recent History of Deepwater Developments . . . . . . . . . . . . . . . . . . . . . . . . . . . . . . . . .36Figure 7: Deepwater Production Rates and Compound Annual Growth Rate (CAGR) of
Deepwater Production in the Gulf of Mexico . . . . . . . . . . . . . . . . . . . . . . . . . . . . . . . .37Figure 8: Seven Types of Offshore Oil Production Platforms . . . . . . . . . . . . . . . . . . . . . . . . . . . .38Figure 9: Market Share of Tension Leg or SPAR Platforms in the Gulf of Mexico . . . . . . . . . . . . .39Figure 10: Flow of Benefits from the ATP-Funded Composite Production Riser Technology . . . . . .42Figure 11: Public Benefits, Investments, and Performance Metrics for Cluster of Related ATP
Projects and, by Extension, Program of ATP Projects . . . . . . . . . . . . . . . . . . . . . . . . . . .55Figure 12: Net Present Value Component Analysis: Base Case . . . . . . . . . . . . . . . . . . . . . . . . . . . .59
APPENDICES FIGURESFigure A3-1: Continuous-Fiber versus Short-Fiber Composites . . . . . . . . . . . . . . . . . . . . . . . . . . . .72
Contents xiii
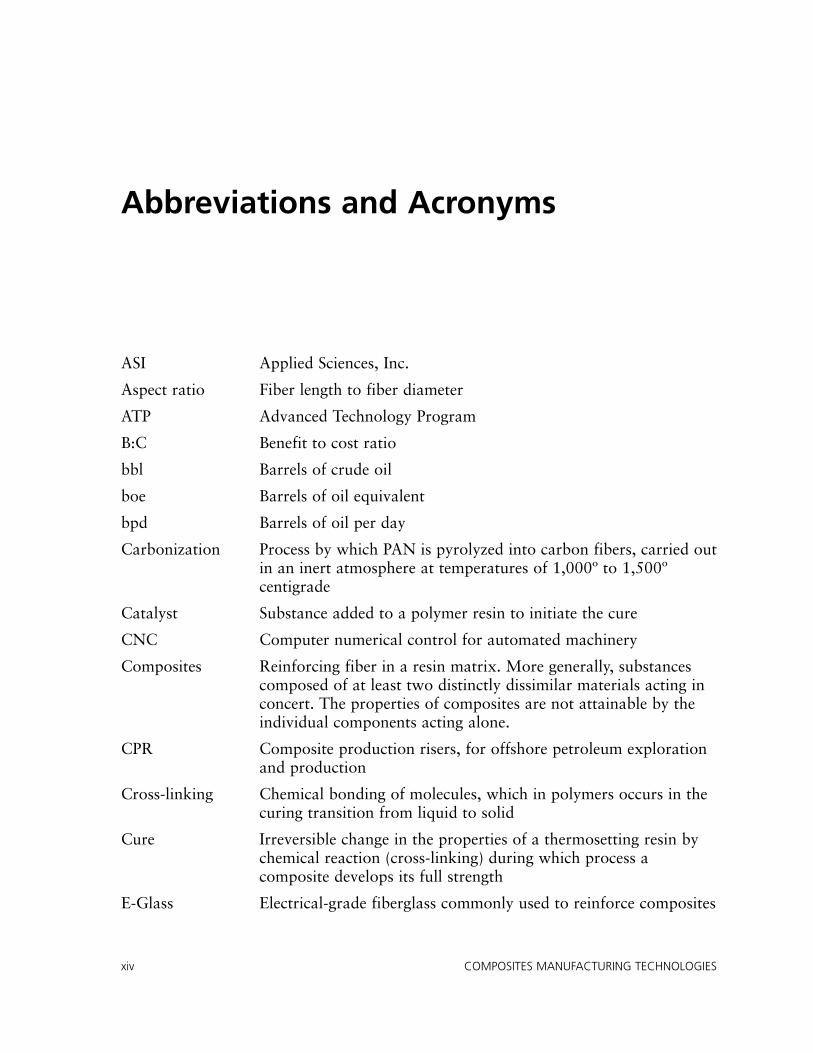
ASI Applied Sciences, Inc.
Aspect ratio Fiber length to fiber diameter
ATP Advanced Technology Program
B:C Benefit to cost ratio
bbl Barrels of crude oil
boe Barrels of oil equivalent
bpd Barrels of oil per day
Carbonization Process by which PAN is pyrolyzed into carbon fibers, carried outin an inert atmosphere at temperatures of 1,000º to 1,500ºcentigrade
Catalyst Substance added to a polymer resin to initiate the cure
CNC Computer numerical control for automated machinery
Composites Reinforcing fiber in a resin matrix. More generally, substancescomposed of at least two distinctly dissimilar materials acting inconcert. The properties of composites are not attainable by theindividual components acting alone.
CPR Composite production risers, for offshore petroleum explorationand production
Cross-linking Chemical bonding of molecules, which in polymers occurs in thecuring transition from liquid to solid
Cure Irreversible change in the properties of a thermosetting resin bychemical reaction (cross-linking) during which process acomposite develops its full strength
E-Glass Electrical-grade fiberglass commonly used to reinforce composites
xiv COMPOSITES MANUFACTURING TECHNOLOGIES
Abbreviations and Acronyms
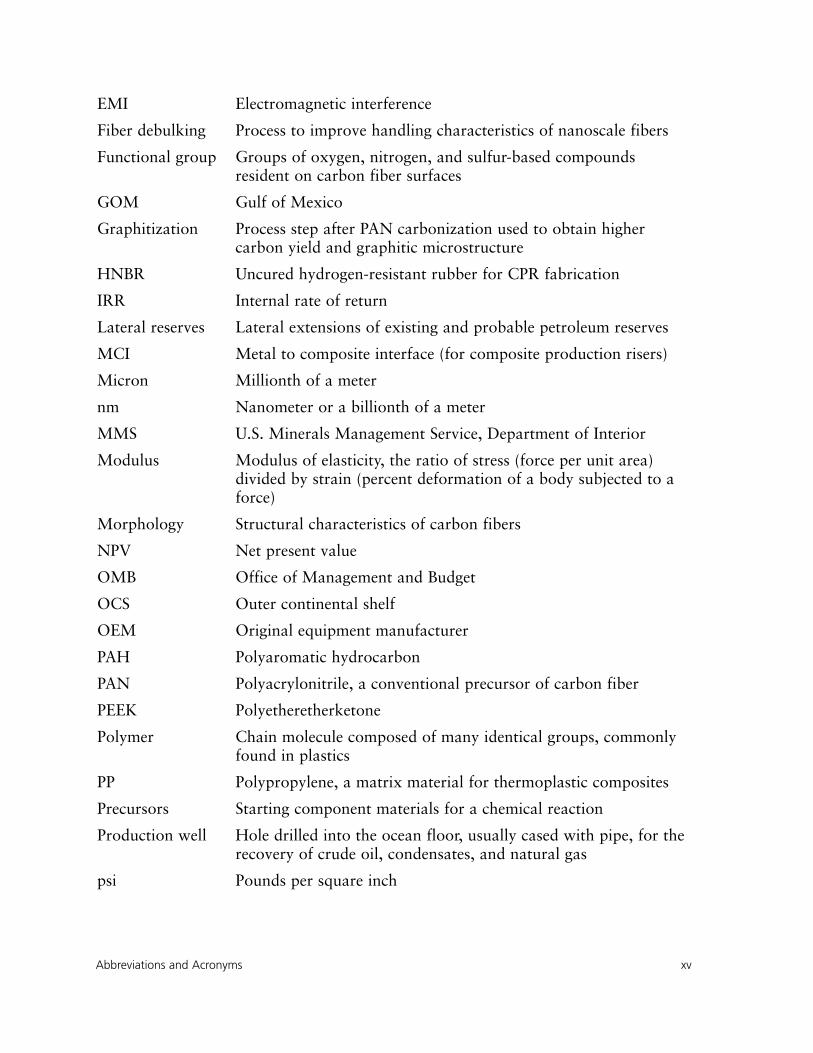
EMI Electromagnetic interference
Fiber debulking Process to improve handling characteristics of nanoscale fibers
Functional group Groups of oxygen, nitrogen, and sulfur-based compoundsresident on carbon fiber surfaces
GOM Gulf of Mexico
Graphitization Process step after PAN carbonization used to obtain highercarbon yield and graphitic microstructure
HNBR Uncured hydrogen-resistant rubber for CPR fabrication
IRR Internal rate of return
Lateral reserves Lateral extensions of existing and probable petroleum reserves
MCI Metal to composite interface (for composite production risers)
Micron Millionth of a meter
nm Nanometer or a billionth of a meter
MMS U.S. Minerals Management Service, Department of Interior
Modulus Modulus of elasticity, the ratio of stress (force per unit area)divided by strain (percent deformation of a body subjected to aforce)
Morphology Structural characteristics of carbon fibers
NPV Net present value
OMB Office of Management and Budget
OCS Outer continental shelf
OEM Original equipment manufacturer
PAH Polyaromatic hydrocarbon
PAN Polyacrylonitrile, a conventional precursor of carbon fiber
PEEK Polyetheretherketone
Polymer Chain molecule composed of many identical groups, commonlyfound in plastics
PP Polypropylene, a matrix material for thermoplastic composites
Precursors Starting component materials for a chemical reaction
Production well Hole drilled into the ocean floor, usually cased with pipe, for therecovery of crude oil, condensates, and natural gas
psi Pounds per square inch
Abbreviations and Acronyms xv
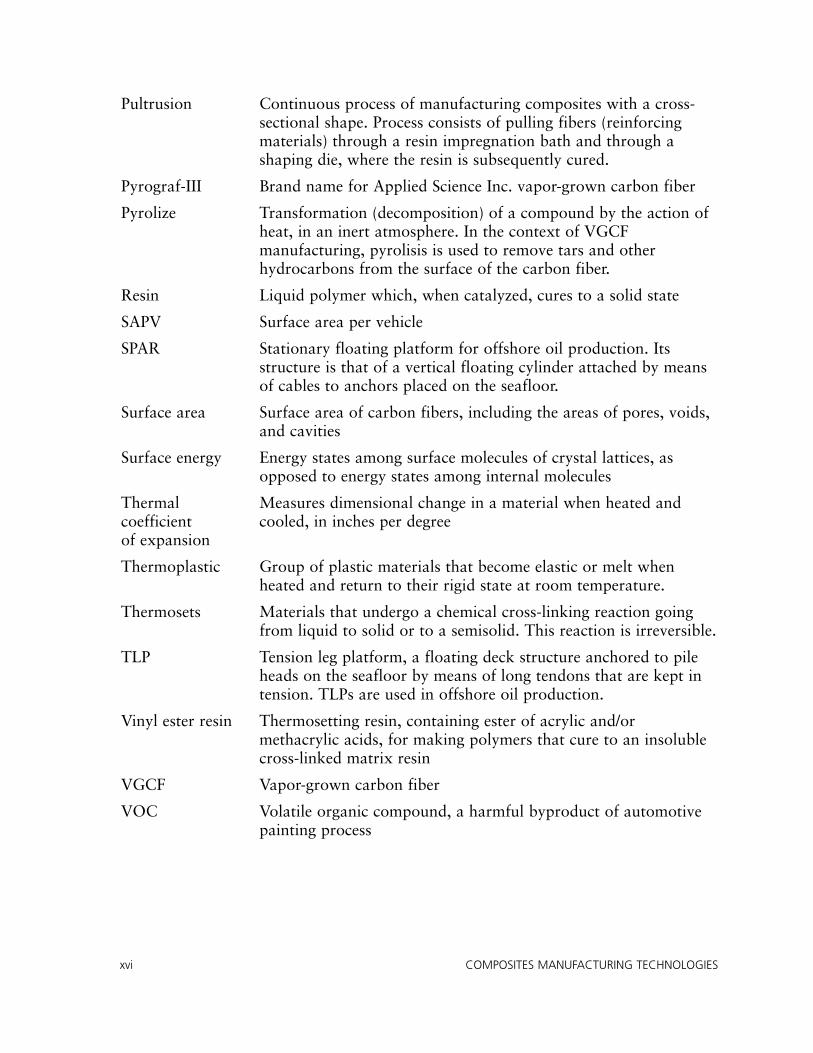
Pultrusion Continuous process of manufacturing composites with a cross-sectional shape. Process consists of pulling fibers (reinforcingmaterials) through a resin impregnation bath and through ashaping die, where the resin is subsequently cured.
Pyrograf-III Brand name for Applied Science Inc. vapor-grown carbon fiber
Pyrolize Transformation (decomposition) of a compound by the action ofheat, in an inert atmosphere. In the context of VGCFmanufacturing, pyrolisis is used to remove tars and otherhydrocarbons from the surface of the carbon fiber.
Resin Liquid polymer which, when catalyzed, cures to a solid state
SAPV Surface area per vehicle
SPAR Stationary floating platform for offshore oil production. Itsstructure is that of a vertical floating cylinder attached by meansof cables to anchors placed on the seafloor.
Surface area Surface area of carbon fibers, including the areas of pores, voids,and cavities
Surface energy Energy states among surface molecules of crystal lattices, asopposed to energy states among internal molecules
Thermal Measures dimensional change in a material when heated and coefficient cooled, in inches per degreeof expansion
Thermoplastic Group of plastic materials that become elastic or melt whenheated and return to their rigid state at room temperature.
Thermosets Materials that undergo a chemical cross-linking reaction goingfrom liquid to solid or to a semisolid. This reaction is irreversible.
TLP Tension leg platform, a floating deck structure anchored to pileheads on the seafloor by means of long tendons that are kept intension. TLPs are used in offshore oil production.
Vinyl ester resin Thermosetting resin, containing ester of acrylic and/ormethacrylic acids, for making polymers that cure to an insolublecross-linked matrix resin
VGCF Vapor-grown carbon fiber
VOC Volatile organic compound, a harmful byproduct of automotivepainting process
xvi COMPOSITES MANUFACTURING TECHNOLOGIES
The Advanced Technology Program (ATP), National Institute of Standards andTechnology (NIST), fosters partnerships among government, industry, and academiaby cost-sharing innovative, high-risk research to develop enabling technologies thatpromise broad economic benefits for the nation. Improved manufacturing processesfor composite materials constitute an important class of enabling technologies withsubstantial promise for large-scale industrial impact and broad-based economicbenefits. (See inside back cover for a more detailed description of the ATP.)
More than 50,000 materials are available to engineers for the design andmanufacture of engineered products, offering an extensive range of physical and costcharacteristics. While metals and plastics are currently the dominant materials,composite materials with superior physical performance characteristics areincreasingly used to replace traditional metals and plastic materials in engineeredproducts (Mazumdar 2002).
Polymer composites are hybrid systems of two or more materials, typically containingreinforcing fibers in a polymer matrix. Reinforcing fibers provide strength andstiffness to the composite. The polymer matrix material binds the fibers together,provides form and rigidity, transfers load to the fibers, and protects load-bearingfiber from corrosion and wear. The resulting composites have superior physicalproperties, such as improved strength, electrical conductivity, and corrosionresistance, which are not attainable by the individual components acting alone.
Despite superior physical properties, the utilization of composites has been generallyrestricted to military and small-scale commercial applications. Two key factors havebeen holding back mass-market industrial utilization:
• Labor-intensive and product-specific manufacturing practices that do not lendthemselves to high-volume, large-scale applications.
• High relative initial cost of composite materials.
Introduction 1
1. Introduction
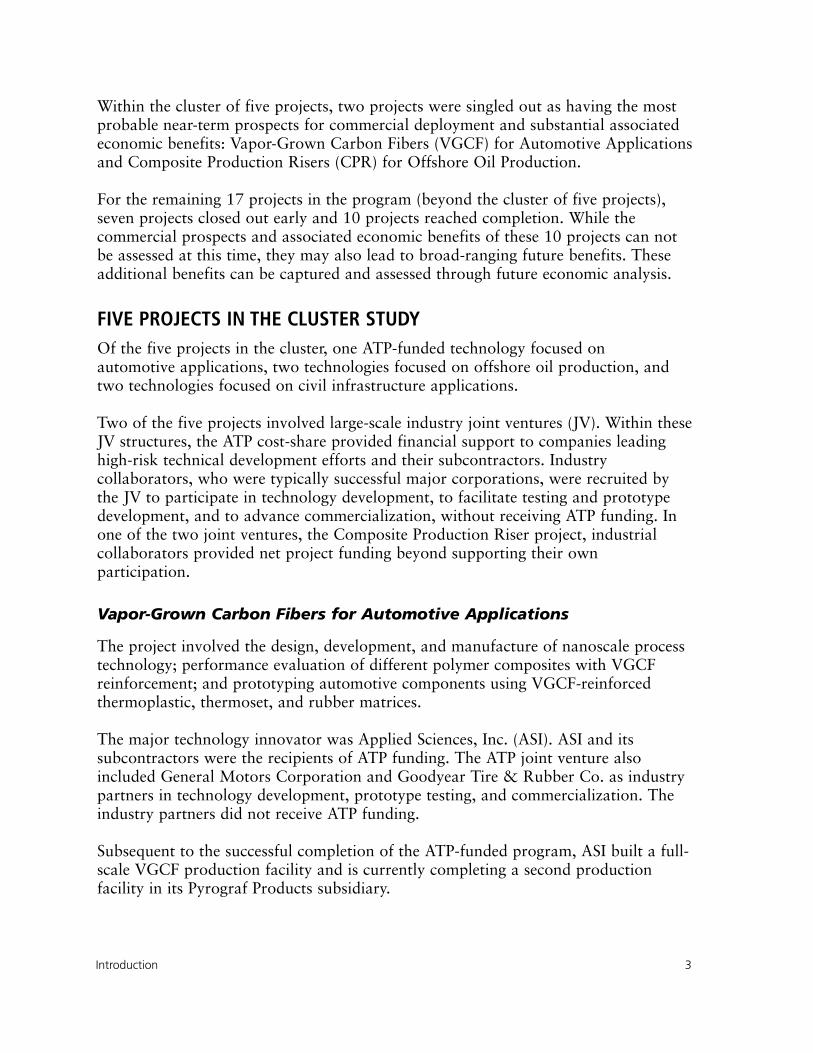
Given composites’ potential for broad-based economic benefits as well as currentmanufacturing and cost limitations, in 1994 ATP undertook a program to developcomposites manufacturing technologies in order to trigger the creation of a high-performance manufacturing infrastructure for commercial composite parts. Theprogram would lead to significant innovations in composites manufacturing, resultingin the following:
• Rapid, high-volume, low-cost fabrication.• Affordable, high-performance composites. • High strength, lightweight, appropriate electrical conductivity, corrosion, resistance
and less maintenance. • Substantially expanded use of composites in the U.S. automotive, offshore oil
production, and civil infrastructure industries.
During 1994 and 1995, ATP funded 22 high-risk projects. If successful, the programwas expected to “help U.S. companies develop the technical capability for producingvast amounts of affordable high-performance composites for large-scale commercialapplications,” and to deliver the performance benefits of composites to U.S. industryand to end users (ATP 2002).
CLUSTER STUDY OBJECTIVES AND SCOPEATP conducts economic analyses to assess the short- and long-term benefits of ATP-funded projects to the nation. Economic analyses evaluate the impact of ATP-fundedtechnologies on project participants, on industrial users of new products andprocesses, and on end users benefiting from new technologies.
To assess the economic benefits from the ATP-funded program for compositesmanufacturing technologies, a cluster study approach was used to combine some ofthe methodological advantages of detailed case studies and of higher-level overviewstudies (see Section 2). Using this hybrid analytical approach, a cluster of five projectsfrom the program was selected for analysis:
• Vapor-Grown Carbon Fibers for Automotive Applications.• Composite Production Risers for Offshore Oil Production.• Innovative Joining/Fitting Systems for Composite Piping Systems.• Innovative Manufacturing Techniques for Large Composite Shapes. • Synchronous CNC Machining of Pultruded Lineals.
This cluster of projects spanned automotive, offshore oil production, and civilinfrastructure applications and included only projects where all ATP-funded technicaltasks were completed. In addition, each project in the cluster possessed near-termcommercial prospects with identifiable economic benefits for U.S. industry andsociety at large.
2 COMPOSITES MANUFACTURING TECHNOLOGIES
Within the cluster of five projects, two projects were singled out as having the mostprobable near-term prospects for commercial deployment and substantial associatedeconomic benefits: Vapor-Grown Carbon Fibers (VGCF) for Automotive Applicationsand Composite Production Risers (CPR) for Offshore Oil Production.
For the remaining 17 projects in the program (beyond the cluster of five projects),seven projects closed out early and 10 projects reached completion. While thecommercial prospects and associated economic benefits of these 10 projects can notbe assessed at this time, they may also lead to broad-ranging future benefits. Theseadditional benefits can be captured and assessed through future economic analysis.
FIVE PROJECTS IN THE CLUSTER STUDYOf the five projects in the cluster, one ATP-funded technology focused on automotive applications, two technologies focused on offshore oil production, andtwo technologies focused on civil infrastructure applications.
Two of the five projects involved large-scale industry joint ventures (JV). Within theseJV structures, the ATP cost-share provided financial support to companies leadinghigh-risk technical development efforts and their subcontractors. Industrycollaborators, who were typically successful major corporations, were recruited bythe JV to participate in technology development, to facilitate testing and prototypedevelopment, and to advance commercialization, without receiving ATP funding. Inone of the two joint ventures, the Composite Production Riser project, industrialcollaborators provided net project funding beyond supporting their ownparticipation.
Vapor-Grown Carbon Fibers for Automotive Applications
The project involved the design, development, and manufacture of nanoscale processtechnology; performance evaluation of different polymer composites with VGCFreinforcement; and prototyping automotive components using VGCF-reinforcedthermoplastic, thermoset, and rubber matrices.
The major technology innovator was Applied Sciences, Inc. (ASI). ASI and itssubcontractors were the recipients of ATP funding. The ATP joint venture alsoincluded General Motors Corporation and Goodyear Tire & Rubber Co. as industrypartners in technology development, prototype testing, and commercialization. Theindustry partners did not receive ATP funding.
Subsequent to the successful completion of the ATP-funded program, ASI built a full-scale VGCF production facility and is currently completing a second productionfacility in its Pyrograf Products subsidiary.
Introduction 3
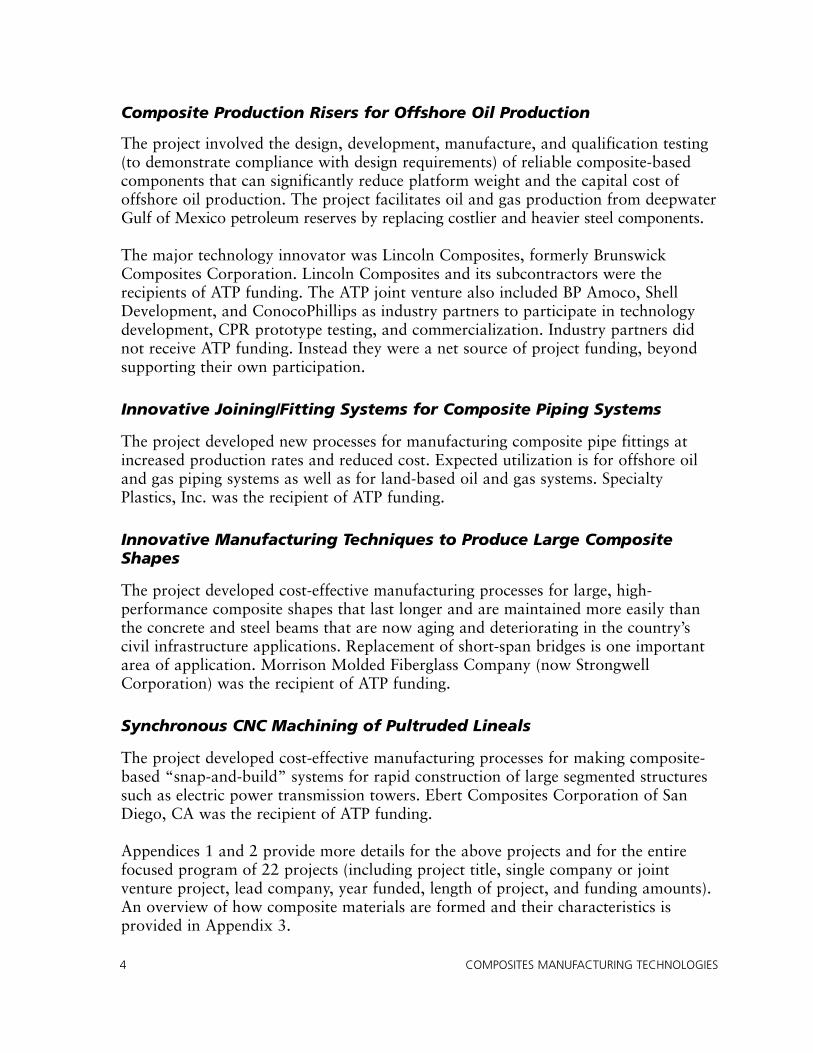
Composite Production Risers for Offshore Oil Production
The project involved the design, development, manufacture, and qualification testing(to demonstrate compliance with design requirements) of reliable composite-basedcomponents that can significantly reduce platform weight and the capital cost ofoffshore oil production. The project facilitates oil and gas production from deepwaterGulf of Mexico petroleum reserves by replacing costlier and heavier steel components.
The major technology innovator was Lincoln Composites, formerly BrunswickComposites Corporation. Lincoln Composites and its subcontractors were therecipients of ATP funding. The ATP joint venture also included BP Amoco, ShellDevelopment, and ConocoPhillips as industry partners to participate in technologydevelopment, CPR prototype testing, and commercialization. Industry partners didnot receive ATP funding. Instead they were a net source of project funding, beyondsupporting their own participation.
Innovative Joining/Fitting Systems for Composite Piping Systems
The project developed new processes for manufacturing composite pipe fittings atincreased production rates and reduced cost. Expected utilization is for offshore oiland gas piping systems as well as for land-based oil and gas systems. SpecialtyPlastics, Inc. was the recipient of ATP funding.
Innovative Manufacturing Techniques to Produce Large CompositeShapes
The project developed cost-effective manufacturing processes for large, high-performance composite shapes that last longer and are maintained more easily thanthe concrete and steel beams that are now aging and deteriorating in the country’scivil infrastructure applications. Replacement of short-span bridges is one importantarea of application. Morrison Molded Fiberglass Company (now StrongwellCorporation) was the recipient of ATP funding.
Synchronous CNC Machining of Pultruded Lineals
The project developed cost-effective manufacturing processes for making composite-based “snap-and-build” systems for rapid construction of large segmented structuressuch as electric power transmission towers. Ebert Composites Corporation of SanDiego, CA was the recipient of ATP funding.
Appendices 1 and 2 provide more details for the above projects and for the entirefocused program of 22 projects (including project title, single company or jointventure project, lead company, year funded, length of project, and funding amounts).An overview of how composite materials are formed and their characteristics isprovided in Appendix 3.
4 COMPOSITES MANUFACTURING TECHNOLOGIES
ANALYTICAL FRAMEWORK
The performance of publicly funded science and technology programs can beevaluated using alternative analytical approaches. The case-study method isparticularly useful for exploring the genesis of projects and for telling the stories ofprojects, including sponsoring organizations and key champions (Ruegg and Feller2003). Traditional case-study approaches for assessing the benefits of publicly fundedscience and technology programs include in-depth case studies of individual projectsand overview case studies of many projects.
Detailed case studies generate insights into the industry dynamics and complex causalchains that link innovation to market pathways to public benefits. Case studies canthus support the development of quantitative cash flow estimates for public andprivate benefits and rigorous analysis of investment performance. However, detailedcase studies are labor intensive and costly.
In contrast, overview studies of many projects often aim at identifying observabletrends in the flow of public benefits from technology innovations, without developingdetailed information about specific technologies, industry, and market factors.Overview studies of many projects can provide a general impression of investmentperformance and can be cost effective. At the same time, overview studies may fail togenerate sufficiently detailed information for quantitative analysis.
The cluster study approach is a hybrid of these two traditional case study approachesand aims at obtaining some of the advantages of detailed case studies and ofmultiproject overview studies, while avoiding some of their limitations.
GENERAL APPROACHThe ATP program for composites manufacturing technologies recognized a dualchallenge: the need to solve high-risk technical problems affecting innovative
Analytical Framework and Methodology 5
2. Analytical Framework andMethodology
manufacturing processes, and the necessity of demonstrating accelerated compliancewith industrial standards and codes and commercial acceptance of new and improvedproducts.
To meet these challenges, the ATP
• Funded entrepreneurial firms to develop high-risk, innovative compositesmanufacturing technologies on a cost-sharing basis.
• Funded projects that would not have been privately funded or would have takensubstantially longer to develop without ATP funds.
• Vigorously facilitated the collaboration of major industrial companies to secureindustrial-scale platforms for the development, testing, and commercialization ofnew and improved products. For projects examined in this study, the participatingindustrial companies did not receive ATP funding but could anticipate sometemporary commercial advantages from acquiring know-how as a result of theiruncompensated collaboration.
Based on the above approach, new composites manufacturing processes and newindustrial products (incorporating advanced composites) emerged that would nothave been possible without ATP funding and ATP facilitation.
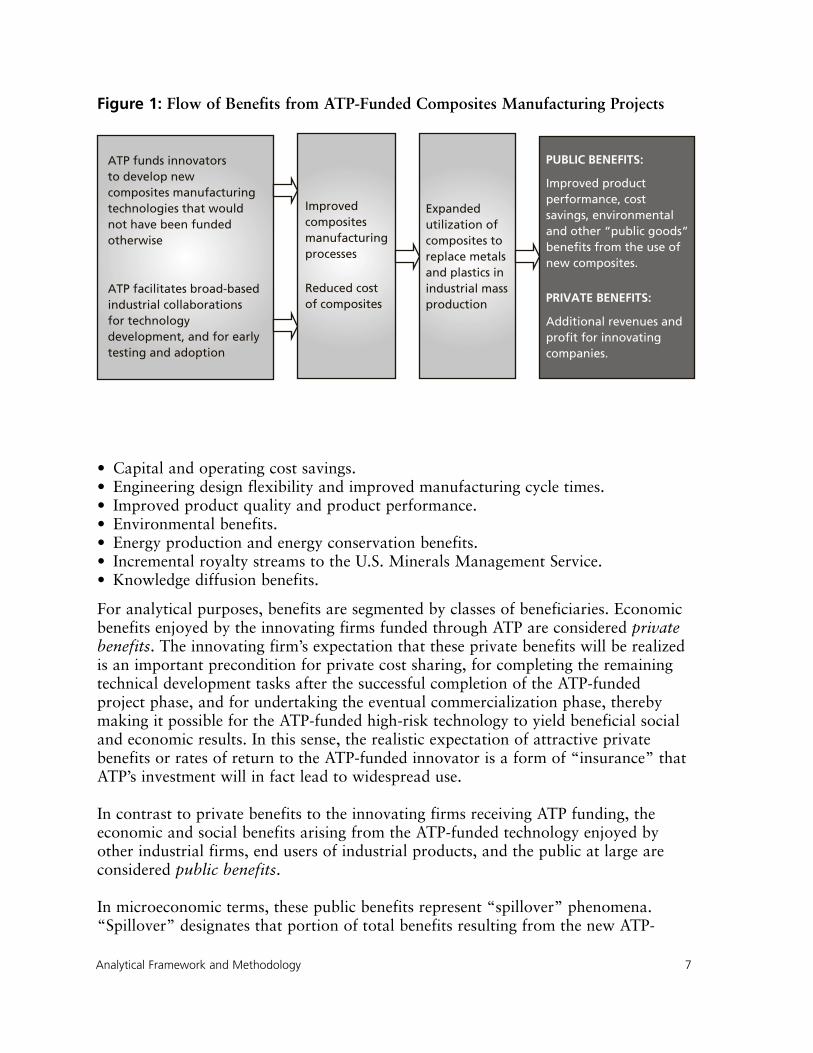
As indicated in Figure 1, the cluster of ATP-funded innovative compositesmanufacturing projects will result in a rich variety of social and economic benefits,directly attributable to the ATP.
The causal chain from manufacturing process to improved industrial productsincludes the intermediate elements of lower composites costs and expandedcomposite utilization. The resultant social and economic benefits will include:
6 COMPOSITES MANUFACTURING TECHNOLOGIES
The cluster study approach combines some of the advantages of detailed casestudies and higher-level overview studies, such as:
• Developing rich insights into industry and market dynamics andcommercialization pathways for ATP-funded high-risk technologies.
• Establishing a basis for estimating cash flow benefits to be enjoyed byinnovators, industry, customers, and society at large, as well as performancemetrics.
• Providing a basis for meaningful generalizations across projects about theeffectiveness of ATP investments.
• Capital and operating cost savings.• Engineering design flexibility and improved manufacturing cycle times.• Improved product quality and product performance.• Environmental benefits.• Energy production and energy conservation benefits.• Incremental royalty streams to the U.S. Minerals Management Service. • Knowledge diffusion benefits.
For analytical purposes, benefits are segmented by classes of beneficiaries. Economicbenefits enjoyed by the innovating firms funded through ATP are considered privatebenefits. The innovating firm’s expectation that these private benefits will be realizedis an important precondition for private cost sharing, for completing the remainingtechnical development tasks after the successful completion of the ATP-fundedproject phase, and for undertaking the eventual commercialization phase, therebymaking it possible for the ATP-funded high-risk technology to yield beneficial socialand economic results. In this sense, the realistic expectation of attractive privatebenefits or rates of return to the ATP-funded innovator is a form of “insurance” thatATP’s investment will in fact lead to widespread use.
In contrast to private benefits to the innovating firms receiving ATP funding, theeconomic and social benefits arising from the ATP-funded technology enjoyed byother industrial firms, end users of industrial products, and the public at large areconsidered public benefits.
In microeconomic terms, these public benefits represent “spillover” phenomena.“Spillover” designates that portion of total benefits resulting from the new ATP-
Analytical Framework and Methodology 7
Figure 1: Flow of Benefits from ATP-Funded Composites Manufacturing Projects
ATP funds innovators to develop new composites manufacturingtechnologies that would not have been fundedotherwise
ATP facilitates broad-based industrial collaborations for technology development, and for early testing and adoption
Improvedcompositesmanufacturingprocesses
Reduced cost of composites
Expandedutilization ofcomposites toreplace metalsand plastics inindustrial massproduction
PUBLIC BENEFITS:
Improved product performance, cost savings, environmentaland other “public goods”benefits from the use ofnew composites.
PRIVATE BENEFITS:
Additional revenues and profit for innovating companies.
funded technology (both public and private) that the innovating firm is unable tocapture for itself (Jaffe 1998). Both the theoretical and empirical economics literaturesuggests that public benefits, or the spillover from ATP investment, can be expectedto substantially exceed the magnitude of private benefits (Mansfield et al. 1977).
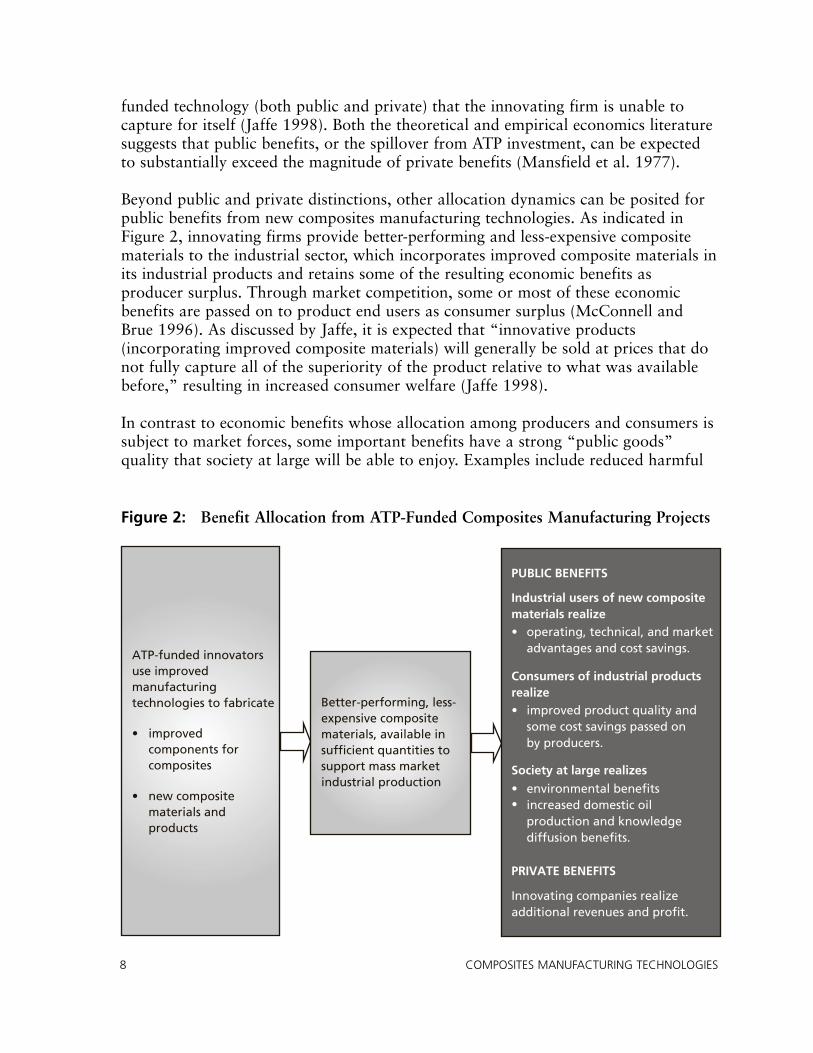
Beyond public and private distinctions, other allocation dynamics can be posited forpublic benefits from new composites manufacturing technologies. As indicated inFigure 2, innovating firms provide better-performing and less-expensive compositematerials to the industrial sector, which incorporates improved composite materials inits industrial products and retains some of the resulting economic benefits asproducer surplus. Through market competition, some or most of these economicbenefits are passed on to product end users as consumer surplus (McConnell andBrue 1996). As discussed by Jaffe, it is expected that “innovative products(incorporating improved composite materials) will generally be sold at prices that donot fully capture all of the superiority of the product relative to what was availablebefore,” resulting in increased consumer welfare (Jaffe 1998).
In contrast to economic benefits whose allocation among producers and consumers issubject to market forces, some important benefits have a strong “public goods”quality that society at large will be able to enjoy. Examples include reduced harmful
8 COMPOSITES MANUFACTURING TECHNOLOGIES
Figure 2: Benefit Allocation from ATP-Funded Composites Manufacturing Projects
ATP-funded innovators use improvedmanufacturingtechnologies to fabricate
• improvedcomponents forcomposites
• new compositematerials andproducts
Better-performing, less-expensive compositematerials, available insufficient quantities tosupport mass marketindustrial production
PUBLIC BENEFITS
Industrial users of new compositematerials realize• operating, technical, and market
advantages and cost savings.
Consumers of industrial productsrealize• improved product quality and
some cost savings passed on by producers.
Society at large realizes
• environmental benefitsincreased domestic oilproduction and knowledgediffusion benefits.
•
PRIVATE BENEFITS
Innovating companies realizeadditional revenues and profit.
environmental emissions, reduced energy dependence, and knowledge diffusion aboutthe new technology. Regarding the expectation of knowledge diffusion, Jaffe (1998)notes that
[C]ommercial development and use of new knowledge will tend to cause it to spread,despite any desire of the (innovator) to prevent such spread. Economic exploitation ofnew knowledge requires the sale of new products or the incorporation of newprocesses into commercial use. Such commercialization tends to reveal at least someaspects of the new knowledge to other economic agents. Hence the very process ofeconomically exploiting the knowledge that research creates tends to pass thatknowledge to others.
METHODOLOGYIn their seminal study of public and private benefits resulting from technologyinnovation, Mansfield et al. (1977) stress the necessity of undertaking detailed casestudies and other empirical work to provide a rich set of non-obvious and oftencounterintuitive insights into the complex causal chain from innovation, to marketpathways, and to the eventual benefits realized by innovators, other industryparticipants at higher levels in product chains, customers, and society at large.
The need for detailed case studies is justified, in part, by the variety of commercialand market dynamics that are unique and specific to industries. Surface generalizationsabout these dynamics may sometimes lead to unreliable conclusions and detract fromthe credibility for analytical results.
In line with Mansfield et al. (1977), our cluster study of composite manufacturingprojects uses a detailed empirical approach so as to fully capture the causalconnections from technological innovation to public and private benefits in thewidely divergent automotive, offshore petroleum, and civil infrastructure industries.
Accordingly, two projects ATP funded in the area of composites manufacturing wereselected for detailed case studies, one in the automotive industry and the other in theoffshore petroleum industry. These detailed case studies present project history(including an account of the need for ATP funding), the characterization of technicalchallenges and accomplishments, opportunities for commercial application, pathwaysto markets, and an extensive identification of all expected benefits, both public andprivate.
Economic analysis estimated benefits to industry users and the general public andcompared them to the ATP investment. Estimated benefits to direct recipients of ATPfunding were excluded. For public benefits that could be meaningfully quantified,cash flow estimates were generated for a conservative base case scenario and for amore optimistic “step-out” scenario. Cash flow estimates were used to compute threesets of economic performance measures for comparing the value of public benefits to
Analytical Framework and Methodology 9
10 COMPOSITES MANUFACTURING TECHNOLOGIES
ATP’s investments: benefit-to-cost ratios, net present values, and internal rates ofreturn.
Additional ATP projects that had completed their technical goals but whosecommercialization prospects are longer term were selected as the remaining threeprojects in the cluster of five projects. High-level analysis was conducted to reviewkey technical challenges and achievements, as well as future prospects forcommercialization and public benefit creation. Measures of performance werecomputed for the cluster using estimates of currently identifiable benefits. Thesemeasures compare public benefits of the two case-study projects with near-termcommercialization prospects to the ATP-funded costs of all five projects in the cluster.
Benefit-to-cost ratio is computed by dividing the present value of “publicbenefit” cash flow estimates (enjoyed by U.S. beneficiaries except the ATP-funded innovator) by the present value of ATP’s investment. This measureestimates the benefit to the nation for every dollar of ATP’s investment.
Net present value (NPV) is calculated by subtracting the present value of ATP’sinvestment from the present value of public benefits from innovative compositesmanufacturing technologies. Cash flows are normalized to 2003 dollars anddiscounted at the 7 percent OMB-mandated rate. This measure describes the netbenefit to the nation, in 2003 dollars.
The public rate of return is calculated by iterative solution for a rate at which thediscounted value of ATP’s investment would equal the discounted value of publicbenefit cash flows. This measure describes the rate of return to the nation onATP’s investment.
The U.S. automotive industry operates in a highly competitive global market. Toretain its competitiveness, the industry is committed to cost-reduction initiatives,continuous quality improvement, and greater fuel economy, while addressingincreasingly challenging emissions standards.
Composites reinforced with vapor-grown carbon fiber (VGCF) have improvedelectrical conductivity and strength and can provide a broad range of benefits to theautomotive industry and to consumers in the form of improved quality, better fueleconomy, reduced cost, and lower environmental emissions. These benefits canpotentially be achieved through several VGCF automotive applications:
• Electrostatic painting of exterior automotive panels reinforced with VGCF canavoid the use of conductive primers and “off-line” finishing processes, leading tocost, quality, and environmental benefits.
• Enclosures for shielding automotive electronic systems from electromagneticinterference (EMI) can be fabricated from VGCF reinforced composites, leading tocost reduction benefits.
• Automotive tires with VGCF additives will have improved electrical conductivityand stiffness and will contribute to improved fuel economy.
This section describes the results of a case study of the ATP-funded VGCFtechnology. It presents project history and key technical accomplishments, describescommercial and market applications in the automotive and tire industries, andpresents the results of a quantitative economic benefit-to-cost analysis together with abrief discussion of qualitative benefits.
PROJECT HISTORYPolymer composites reinforced with carbon fiber provide improved electricalconductivity, high strength and stiffness, and other desirable properties. In the past,
Vapor-Grown Carbon Fiber Case Study 11
3. Vapor-Grown Carbon Fiber Case Study
the widespread industrial utilization of carbon-reinforced composites has been limitedby the high relative cost of carbon fiber and the absence of well-defined design rulesand proven manufacturing methods to support industrial-scale production (Strong1989).
These limitations have inhibited widespread U.S. industrial use of composites(American Composites Manufacturing Association 2002). The need to overcomethese systemic limitations was a significant factor in ATP’s 1994 decision to initiate aprogram to develop innovative composites manufacturing technologies and to investin the development of the VGCF technology as part of that program.
In 1994, Applied Sciences, Inc. (ASI), an independent U.S. company, with the supportof General Motors Corporation and Goodyear Tire & Rubber Co., submitted aproposal to ATP for the high-risk vapor-grown carbon fiber (VGCF) technologydevelopment project. According to ASI’s proposal for ATP funding, VGCF wasintended as an electrically conductive, high-strength structure for mass productionpolymer molding processes (automotive panels and parts) and for mass productionelastomer molding processes (automotive tires).
In 1995, the ATP cost shared the project with ASI, General Motors Corporation, andGoodyear Tire & Rubber Company. The ATP investment was used to support ASI’stechnology development efforts. General Motors and Goodyear provided sufficientinvestment to fund their own activities in technology development, testing, andprototyping. However, General Motors and Goodyear did not receive any ATPfunding.
The major technical challenges of the ATP-funded project included the following:
• Creating an adequate interface between the carbon fiber and the polymer matrix toassure uniform infiltration and adhesion and to allow load transfer from thematrix to the carbon fiber reinforcement.
• Developing a deliverable form of the VGCF fiber that would be practical for plasticcompounders, who normally work with powder additives.
• Developing manufacturing processes for large quantities of fiber, thus reachingeconomies of scale and reducing fiber costs to competitive levels.
The project was successfully completed in 2000 and resulted in the development ofthe following practical design and production methods:
• Controlling VGCF diameter, surface chemistry, morphology, and achievingappropriate interface adhesion.
• Debulking nanoscale fibers to optimize strength and electrical properties andfacilitate handling.
• Positioning VGCF manufacturing operations for substantial future cost reductionsand industrial-scale production.
12 COMPOSITES MANUFACTURING TECHNOLOGIES
ATP funding also contributed to credibility and project momentum, leading tosubsequent funding from the state of Ohio and private investors to support theconstruction of a $3 million pilot production plant and further technicaldevelopments, including coal gasification to replace expensive methane feedstock.
Without ATP funding these accomplishments would not have been realized. Inparticular, the surface state of VGCF fibers and the impact of surface state on compositeperformance would not have been characterized and “this would have substantiallyinhibited or effectively stopped the development of industrial-scale application ofVGCF composites, outside of specialized niche markets” (Lake 2002 et al.).
HOW DOES IT WORK?Carbon fiber’s electrical properties, strength, stiffness, thermal characteristics, andproduction costs are strongly affected by the type of precursor and processingparameters.
The conventional manufacturing process for carbon fiber (the defender technology)uses commercially available PAN (polyacrylonitrile) textile as the precursor. PANfibers are first “stabilized” by thermosetting or cross-linking to ensure that theprecursor material does not melt in subsequent processing steps. The thermosettingstep is accompanied by a stretching of the fibers, which are subsequently carbonizeduntil PAN fibers are essentially transformed into all-carbon fibers. To avoid internalvoids and other material defects, carbonization requires a slow heating rate,eventually reaching 1000°C. To further improve the tensile modulus or stiffness ofthe fiber, graphitization is carried out at temperatures in excess of 1200°C. Aftergraphitization, the fibers are surface treated, a sizing or coating is applied, and thecontinuous fibers are wound for shipment (Strong 1989).
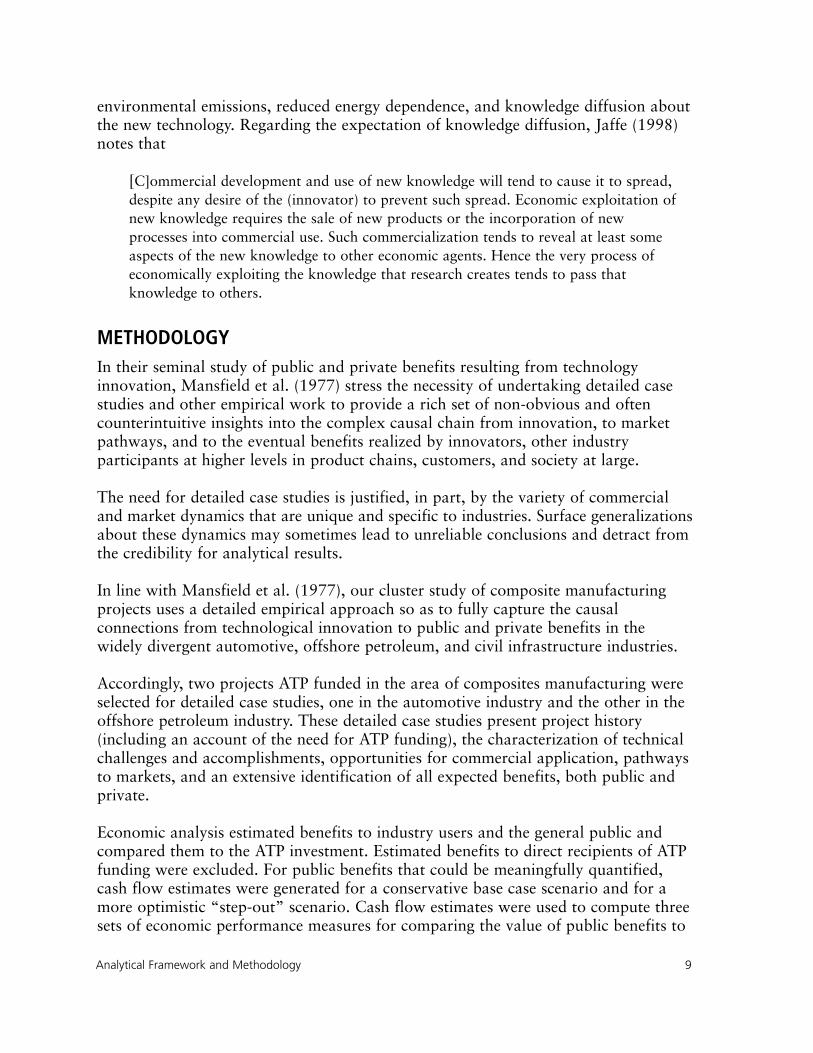
Unlike the complex PAN based processes, the ATP-funded manufacturing processuses a simpler, faster, and cheaper “vapor-grown” production technology (see Figure 3).
As indicated in Figure 3, vapor-grown carbon fiber (branded Pyrograf-III) isproduced in the vapor phase by decomposing either methane, ethane, or coal gas inthe presence of a metal catalyst, hydrogen sulfide, and ammonia. The catalyzed gasdecomposes into carbon and hydrogen and is conveyed to a reactor furnace.
Carbon remains in the reactor for only a few milliseconds, growing into a fiber of 60to 200 nanometers in diameter and about 100 microns in length. The fiber isentrained in a gas flow, which carries it from the reactor, on a continuous basis, intoa fiber catch basin. The fiber is debulked for sale or for additional processing (suchas heat treatment).
The above VGCF process overcomes many of the costly production steps andprocessing limitations of the PAN-derived process and provides an innovative
Vapor-Grown Carbon Fiber Case Study 13
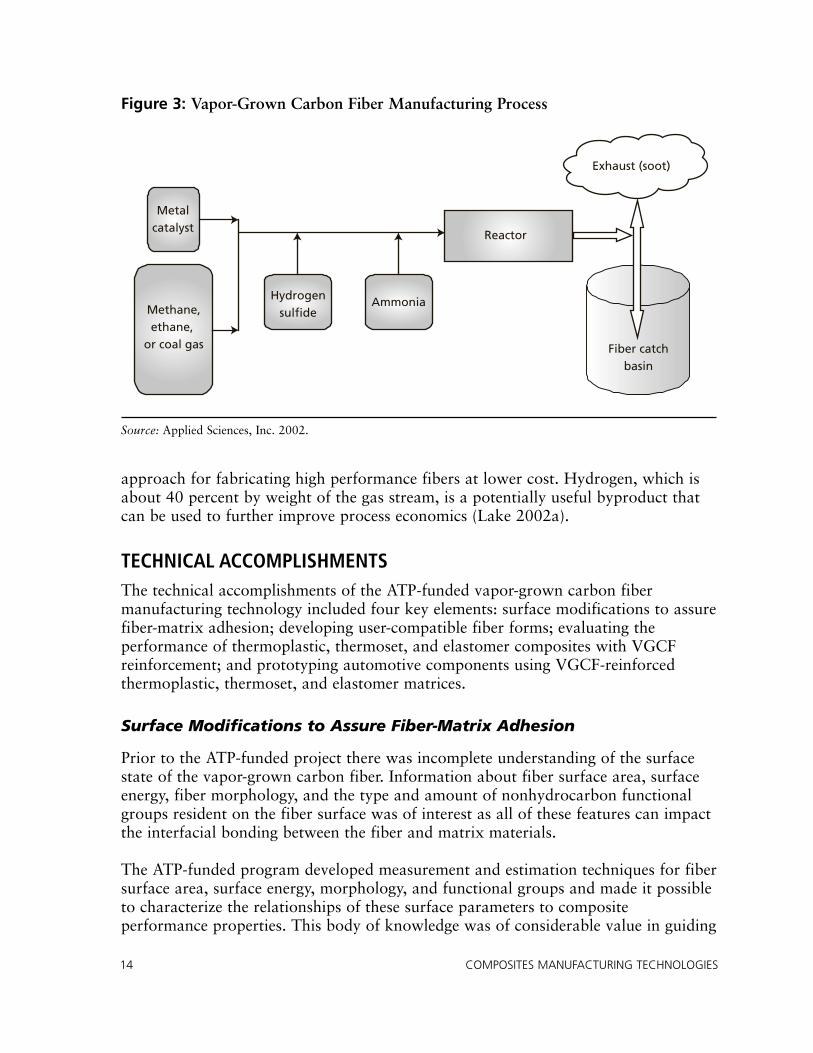
approach for fabricating high performance fibers at lower cost. Hydrogen, which isabout 40 percent by weight of the gas stream, is a potentially useful byproduct thatcan be used to further improve process economics (Lake 2002a).
TECHNICAL ACCOMPLISHMENTS The technical accomplishments of the ATP-funded vapor-grown carbon fibermanufacturing technology included four key elements: surface modifications to assurefiber-matrix adhesion; developing user-compatible fiber forms; evaluating theperformance of thermoplastic, thermoset, and elastomer composites with VGCFreinforcement; and prototyping automotive components using VGCF-reinforcedthermoplastic, thermoset, and elastomer matrices.
Surface Modifications to Assure Fiber-Matrix Adhesion
Prior to the ATP-funded project there was incomplete understanding of the surfacestate of the vapor-grown carbon fiber. Information about fiber surface area, surfaceenergy, fiber morphology, and the type and amount of nonhydrocarbon functionalgroups resident on the fiber surface was of interest as all of these features can impactthe interfacial bonding between the fiber and matrix materials.
The ATP-funded program developed measurement and estimation techniques for fibersurface area, surface energy, morphology, and functional groups and made it possibleto characterize the relationships of these surface parameters to compositeperformance properties. This body of knowledge was of considerable value in guiding
14 COMPOSITES MANUFACTURING TECHNOLOGIES
Figure 3: Vapor-Grown Carbon Fiber Manufacturing Process
Source: Applied Sciences, Inc. 2002.
Metalcatalyst
Ammonia
Fiber catchbasin
Reactor
Exhaust (soot)
Methane,ethane,
or coal gas
Hydrogensulfide
optimization efforts during the evaluation of VGCF properties, which in turn wereused to guide further development and refinement of VGCF production processes.
The surface area determination produced values for total surface area (includinginternal areas of surface micropores) as well as external surface area (withoutmicropores). Processes were developed to decrease the fiber diameter, which resultedin larger relative surface areas. This proved beneficial since increased surface areawas found to contribute to improved fiber matrix bonding.
The surface energy of the fiber impacts the ability of matrix materials to wet andspread on the fiber and thus increase fiber matrix adhesion. Surface energy levelswere determined using inverse gas chromatographic techniques. It was found thatsurface energy and adhesion could be increased by the removal of surface layers ofpolyaromatic hydrocarbons (PAH) produced in the vapor-grown carbon fiberprocess. Surface energy could be further increased by heat treatment. In addition topromoting better fiber–to-matrix adhesion, higher surface energy levels promotedimproved fiber dispersion in the polymer matrix resin.
Prior to the ATP-funded project, there was insufficient knowledge as to the natureand extent of resident functional groups on the fiber surface. The ATP-funded projectidentified the presence of low levels of oxygenated, nitrogen, and sulfur groups.“Fibers, with such functional groups on the fiber surface, were found to haveimproved mechanical performance and appropriate levels of electrical conductivityfor a variety of composite applications” (Hughes 2003).
The ATP-funded project also contributed to improved fiber structure or morphology.Initially, VGCF consisted of a hollow core with a graphitic sheath and a carbon“overcoat” on top of the graphitic sheath. During the project, the fiber productionprocess was changed to produce fibers with altered morphology (without a carboncoating), resulting in lower cost and higher levels of surface energy.
Developing User-Compatible Fiber Forms
Prior to the ATP-funded project, “as grown” fibers existed in the reactor as a flakymaterial with very low density (inhomogeneous with respect to density) that couldnot be efficiently handled by composite manufacturers. The ATP-funded projectdeveloped an efficient VGCF debulking process resulting in improved handlingcharacteristics as well as improved fiber-matrix adhesion. As an alternative form ofVGCF, ASI determined that the fiber could be produced in paper form, usingproduction processes similar to the paper industry.
Evaluating Composites with VGCF Reinforcement
Prior to the ATP-funded project, there was limited information on the effect ofcarbon fiber reinforcement on the properties of polymer composites.
Vapor-Grown Carbon Fiber Case Study 15
The evaluation of VGCF-reinforced thermoplastic composites was completed by theGeneral Motors Technology Center (General Motors 2002), using polypropylene (PP)and nylon 6,6 as matrix materials. It was shown that VGCF increased the tensilestrength of PP by up to 300 percent. The increase was linear with increasingconcentrations of reinforcing VGCF in the matrix. It was also found that fibers withlow surface energy provided weaker adhesion and much lower composite tensilestrengths. To a lesser extent, lower fiber surface area was also related to lowercomposite tensile strength.
Separately, the GM Technology Center tests identified that VGCF-reinforcedthermoplastic composites possessed attractive electrical properties, demonstratingsubstantially improved electrical conductivity in both PP and nylon 6,6 composites.Electrical properties were within required levels for electrostatic painting, EMIshielding, and static electricity dissipation in the automotive industry. The thermalconductivity of VGCF-based composites was determined to be better than the baseresin, and VGCF reinforcement could be expected to inhibit thermal warping andresult in improved dimensional stability of automotive panels.
The GM Technology Center also completed limited work on VGCF-reinforcedthermoset composites with vinyl ester resins. These tests indicated greatly improvedelectrical conductivity but only slight impact on strength and stiffness. It was foundthat a mixed fiber structure, using glass fiber in combination with VGCF, providedhigh electrical conductivity as well as substantially improved stiffness compared withthermosets reinforced with only VGCF.
Preliminary evaluation of VGCF-reinforced elastomer composites was undertaken atthe Goodyear Tire & Rubber Co. Initial results indicated “desirable increases” intensile strength and stiffness, without a buildup of undesirable static electricity.
Prototyping Automotive Components
General Motors used VGCF reinforced composites for prototyping instrument panelparts. GM also identified additional components for prototyping, including fuel hosefittings, oil pans, gas tanks, door panels, seat backs and supports, truck beds, doorhinges, engine mounts, and suspension bushings.
Goodyear built and tested prototype tires and indicated that tire properties were verypromising and that VGCF costs were the remaining barrier to adoption.
Based on the above ATP-funded accomplishments, VGCF provides a “multifunctionalreinforcing structure” with the following performance characteristics:
• Ten times the electrical conductivity of conventional “chopped” carbon fiber.• Four times the thermal conductivity of fiberglass at ten percent by weight loading.
16 COMPOSITES MANUFACTURING TECHNOLOGIES
• Half the coefficient of thermal expansion as conventional carbon fiber at tenpercent by weight loading, reducing thermal distortion and increasing dimensionalstability.
• “Environment friendly” flame retardancy properties.
The ATP-funded technical accomplishments and resulting performance characteristicsenabled ASI to learn how to control VGCF diameter, surface chemistry, andmorphology, how to debulk and package nanoscale fibers to optimize strength andelectrical properties, and how to accomplish these tasks in an industrial-scaleproduction environment. The ATP-funded project also identified a “65 percentreduction in material costs by learning how to properly handle hydrogen sulfide in aproduction reactor” (ASI 2002 et al.).
Without ATP funding these accomplishments would not have been realized. Inparticular, the surface state of VGCF fibers and the impact of surface state oncomposite performance would not have been characterized and “this would havesubstantially inhibited or effectively stopped the development of industrial-scaleapplication of VGCF composites, outside of specialized niche markets, such asdefense applications” (Lake 2000a ).
ATP funding also provided credibility and project momentum, which facilitatedsubsequent funding from the state of Ohio and from private investors to support theconstruction of a $3 million VGCF production pilot plant, as well as additionaltechnological developments, including coal gasification to replace expensive methanefeedstock.
PRODUCTION CAPACITY AND COSTSDuring the summer of 2000, ASI completed construction of a VGCF pilot plant. Ithas one production line and was built at an approximate cost of $3 million,including engineering and infrastructure costs. This line now supports annualproduction levels of 100,000 lbs of VGCF. Capacity expansion is expected to be aneasily replicable process and the facility could be expanded (by adding additionalproduction lines) up to annual production levels of 5 million lbs. In contrast to thefirst line, the capital cost of the second line is expected to be about $900,000.
Given the relatively low complexity of the VGCF manufacturing process andcorrespondingly low capital investments for additional production capacity, capacityexpansion is not expected to restrict expanded VGCF utilization, as long as VGCFcontinues to make progress in meeting automotive industry performance and priceexpectations.
ASI is currently pursuing additional cost reduction opportunities, including thepossible utilization of cheaper VGCF feedstock from coal gasification. Nevertheless,ASI asserts that the $3 to $5 per pound pricing target for VGCF could be met solely
Vapor-Grown Carbon Fiber Case Study 17
on the basis of expanded production and associated economies of scale. In this pricerange, VGCF is expected to be competitive in the mass production automotivemarket.
AUTOMOTIVE MARKETS FOR VGCF-REINFORCED COMPOSITESASI’s marketing efforts for VGCF are focused on automotive applications forelectrostatic painting of composite body panels, electromagnetic interference shieldingof automotive electronics, and reduced tire rolling resistance. These applications aretied to VGCF providing intrinsic electrical conductivity to composite parts andcomponents.
Automotive Industry Trends
In 2001, North American sales of new light vehicles exceeded 17 million units, evenlysplit between passenger cars and light trucks (minivans, SUVs, and pickup trucks).Fourteen million units were produced domestically, including a growing share (2.4million units) by Japanese affiliates and a rapidly growing share by German affiliates(Office of Automotive Affairs 2002). North American markets are expected to growat only one percent, and there is substantial excess motor vehicle production capacityin the United States and worldwide.
Slow growth, excess capacity, and increasing environmental regulation are expectedto accelerate global competition and result in continued cost pressures. According toa BearingPoint survey, auto executives believe that technical innovation will be key toaddressing these challenges and ensuring the industry’s future prosperity (KPMG2003). Rapid technological change will have a significant impact on cutting coststhrough manufacturing and development efficiencies, including through increased useof composites for exterior body components. Composite usage is expected to grow20 percent by 2009. Another area of technological change is in electrical andelectronics systems, used for engine controls, safety, steering, braking, tire sensing,and telematics systems; investment in these technologies is expected to grow from 10percent of vehicle cost in 1998 to 19 percent by 2009 (University of Michigan 2001).
Motor vehicles are built around common platform concepts, with different modelssharing structural elements such as floor plans. Automakers will seek cost reductionsby reducing the number of platforms and increasing the number of models that canbe built using common platform features (CSM Worldwide 2001).
Technology innovations, tied to platform changes, currently require two to threeyears to impact automotive production. The industry plans to compress the time thatis required to go from a “clean sheet” (starting a new design process from scratch) tothe assembly line to less than two years (Sawyer 2001). So called “running changes,”within the built-in flexibility of existing platforms, can be accomplished in less than12 months.
18 COMPOSITES MANUFACTURING TECHNOLOGIES
Automotive Composite Utilization
Composite use can lead to weight reduction and improved fuel economy. The use ofcomposites also facilitates making “comparatively cost effective modifications tovehicles … due to lower tooling costs” (Vasilach 2001).
The average North American vehicle weighs about 3,300 pounds and containsapproximately 250 pounds of composites (Brown and Gregus 2001). Composites areused for interior trim (instrument panel skin, door trim panels, airbag covers, and soforth), exterior body panels (such as fenders, hoods, and deck lids), and exterior trimand facia. In addition, 42 percent of vehicle bumpers are molded from composites(BRG Townsend 1998) and composites are used in engine compartments for a varietyof applications, including protective enclosures to provide electromagnetic shieldingfor electrical and electronic systems.
In 2000, 29 percent of average automotive SAPV (surface area per vehicle) in theNorth American market was manufactured from composite materials. The use ofcomposites for exterior body panels and trim is projected to grow at 4.5 percent peryear and to exceed 36 percent of SAPV by 2005 (Gregus 2001).
Composite use in North American auto vehicles is expected to grow from 4.2 billionpounds in 2001 to 5.6 billion pounds in 2011. Of this amount, 1.7 billion poundswill be for exterior body panels and exterior trim parts (Broge 2001).
VGCF Automotive Target Markets
The first target market for VGCF is automotive coating and painting. Use of VGCFfacilitates efficient electrostatic painting of external parts and panels made fromcomposites.
Automotive coating and painting (finishing processes) occur between bodypressing, welding, and final assembly. The assembled body shell goes through upto 13 distinct steps, including electrocoating, priming, painting, clearcoating, andcuring, to become a painted body ready for the assembly line. The finishingprocess can take about 10 hours, and there is a tendency for this process tobottleneck automotive assembly (Sawyer, n.d.). Finishing operations involve largecapital costs, including investments in robotics. “An automotive painting facilitycan be a $400 million investment” (Banholzer and Adams 2002).
Automotive painting facilities are generally set up to paint steel parts (Vasilach2001). The standard procedure is a continuous “in-line” process of painting andfinishing the entire assembled body and the method of choice is electrostaticpainting, where exterior panels are given a negative charge and the paint is givena positive charge and atomized through a special nozzle. Charged exterior panelsmagnetically attract paint droplets with sufficient force to “pull” paint around
Vapor-Grown Carbon Fiber Case Study 19
corners, ensuring a smooth and even coat. This reduces overspray and foggingrelative to conventional spray guns and it also provides productivity benefits byreducing color mismatch, rework, scrap loss, and downtime (Couch 2003).
Painting composite surfaces can be more costly and time consuming than steelsurfaces. Composite parts and panels typically cannot hold an electrical chargeand require the application of conductive primers for electrostatic painting. Inaddition, they are often painted separately from metal body panels in an off-lineprocess. Off-line painting is an expensive and time-consuming process that canlead to color mismatch and other quality problems and thus extensive rework.As a related problem, composite parts often cannot survive the hightemperatures of paint curing ovens.
VGCF’s ability to add intrinsic electrical conductivity and to improve thermalconductivity makes it possible to avoid conductive primers, off-line painting, andcuring-oven quality problems. This will simplify the finishing process forexternal automotive body panels made from composites, reduce processing timeand costs, and improve color matching.
By eliminating the conductive primer, VGCF utilization will also reduce harmfulenvironmental emissions. Automotive assembly facilities generate 4.5 pounds ofvolatile organic compound (VOC) emissions per vehicle (General Motors 2002),and 90 percent of these emissions result from the painting and finishingprocesses. Eliminating the conductive primer coat removes one in five layers withsignificant VOC content and is projected to result in an 18 percent reduction inVOC emissions. At current levels of composite use in vehicles, VGCF utilizationwill eliminate 0.23 pounds of VOC emissions per vehicle. With projectedincreases in the use of composites, the elimination of VOC emissions will becorrespondingly higher.
The second target market for VGCF is automotive electronics systems, where VGCF-reinforced composites can be used to provide shielding from electromagneticinterference (EMI).
Spark plug wires are a significant source of EMI and lead to operating problemswhen engine management computers receive signals from sensors that have beenaltered by spark plug interference. Many other electronic devices also emit EMIthat can interfere with onboard computers, systems, and sensors (RTP 2000).
With the proliferation of electronic devices in cars and trucks, EMI shielding isbecoming increasingly important. Computer chips regulate and monitor ABSbrakes, fuel injection, oxygen sensors, navigation equipment, engine controls,and communication systems. In addition, the “next level of systems andembedded sensors will replace mechanical and hydraulic systems with electronic
20 COMPOSITES MANUFACTURING TECHNOLOGIES
micro-systems and include drive by wire, brake by wire, collision avoidance, andother ‘smart car’ features” (Krueger 2001).
To provide EMI shielding, electronic systems are enclosed in metal or compositeenclosures. While composites provide design flexibility and lower weight,composite enclosures must be coated with a conductive layer to provide effectiveEMI shielding. The cost of conductively coated enclosures or die-cast metalenclosures is in the range of $1.00 to $1.50 per part.
Compared to metal or conductively coated enclosures, intrinsic EMI shieldingwith stainless steel fibers dispersed in a polymer matrix can reduce part costs by50 percent (RTP 2000). Given very low (by weight) VGCF loading requirementsand cost advantages over stainless steel fiber, EMI shielding with VGCF-loadedpolymer can be used to further reduce part costs. It is conservatively estimatedthat VGCF-loaded composites will result in cost reductions of 65 percent perpart compared with metal or conductively coated enclosures.
The third target market for VGCF is automotive tires. VGCF can partially replacecarbon black and silica additives and improve tire performance.
Carbon black is an inexpensive additive to automotive tire compounds andprovides electrical conductivity to prevent the buildup of static charges duringtire operations. To improve tire stiffness, reduce rolling resistance, and improvefuel efficiency, silica is sometimes substituted for carbon black. However, silicahas much lower conductivity and can result in the buildup of undesirableelectrical charges.
As a tire additive, VGCF can provide directional stiffness, reduced rollingresistance, and improved fuel efficiency while improving electrical conductivityand avoiding static charge buildup. ASI estimates that a partial (20 percent)replacement of carbon black with VGCF additives will lead to a “1.2 percentimprovement in fuel economy for passenger vehicles and up to 4 percentimprovement for heavy trucks” (ASI 2002a).
According to a major U.S. tire manufacturer, “the technical challenges of VGCFhave been largely addressed and the remaining challenges are tied to theeconomics of scaling up VGCF production, in the most cost effective manner, toeffectively support automotive tire mass production.” (ASI 2002a).
VGCF COMPETITIVE POSITION The carbon nanofiber market for industrial-scale applications is characterized by highprices, low availability, and customer reluctance to enter into development programsdue to perceived supply risks. Currently prices range from $90 to $170 per poundand there are four major suppliers, including ASI.
Vapor-Grown Carbon Fiber Case Study 21
ASI is the low-cost producer in this market and expects to reach further, substantialeconomies of scale. VGCF prices are projected to reach $30 per pound by 2006, $15per pound by 2008, and to be under $5 per pound by 2010 (Hughes 2002). WithVGCF electrical and thermal properties (ten times the electrical conductivity and halfthe coefficient of thermal expansion relative to competing carbon fibers), the VGCFcost advantage can be further leveraged by lower fiber loadings in the polymermatrix.
Based on these competitive market conditions, it is expected that VGCF will beeconomically viable for
• Electrostatic painting and EMI shielding applications at $30 per pound by 2006.• Automotive tire applications at under $2 per pound by 2011.
AUTOMOTIVE INDUSTRY INITIATIVES The automotive industry is aware of VGCF’s technical and commercial potentialrelative to electrostatic painting and EMI shielding applications. According to theMaterials and Processes Laboratory of the General Motors R&D Center, the“electrical properties of VGCF in polypropylene and VGCF in nylon composites arevery attractive compared with those provided by other conventional conductingadditives. Because of the low VGCF diameter, the onset of (acceptable) conductivitycan be below 3 percent by volume” (Finegan and Tibbetts 2001).
Other active and probable industry initiatives to develop VGCF-reinforced compositepanels, parts, and tires are listed below.
• ASI is currently working with a major compounder of polymer resins and asecond-tier supplier to automotive OEMs to evaluate VGCF as a possible additiveto provide conductivity to composite automotive panels for electrostatic painting.Based on discussions with automotive executives, the probability of VGCF-filledcomposites being used in a North American assembly plant by 2006 is estimated at70 percent.
• Discussions with a major automotive electrical supplier indicate that, while there isnot yet an active development program for incorporating VGCF into plasticenclosures for EMI shielding, this company and its competitors are “activelyaware” of VGCF and consider it to be a promising material for “potentiallycheaper, better EMI shielding.” Once prices begin to drop, as projected by ASI,plastic enclosures with conductive coating or metal enclosures can be replaced withVGCF-filled composite enclosures through “running changes” within a timeframeof less than 12 months. It is expected that design and production changes will notbe platform dependent. The probability of VGCF-filled composites used for EMIshielding in a North American assembly plant by 2006 is estimated at 50 percent.
• Discussion with a major U.S. tire manufacturer indicates awareness and interest inVGCF. An active product development and testing program will become likely
22 COMPOSITES MANUFACTURING TECHNOLOGIES
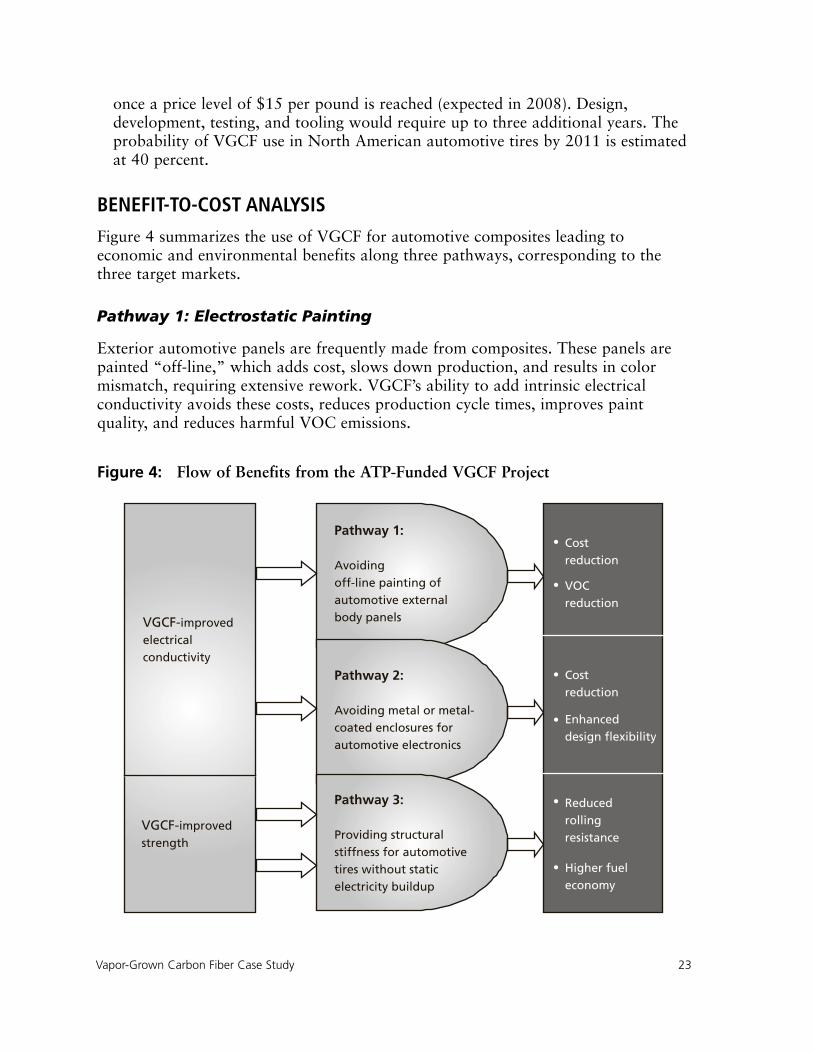
once a price level of $15 per pound is reached (expected in 2008). Design,development, testing, and tooling would require up to three additional years. Theprobability of VGCF use in North American automotive tires by 2011 is estimatedat 40 percent.
BENEFIT-TO-COST ANALYSIS
Figure 4 summarizes the use of VGCF for automotive composites leading toeconomic and environmental benefits along three pathways, corresponding to thethree target markets.
Pathway 1: Electrostatic Painting
Exterior automotive panels are frequently made from composites. These panels arepainted “off-line,” which adds cost, slows down production, and results in colormismatch, requiring extensive rework. VGCF’s ability to add intrinsic electricalconductivity avoids these costs, reduces production cycle times, improves paintquality, and reduces harmful VOC emissions.
Vapor-Grown Carbon Fiber Case Study 23
Figure 4: Flow of Benefits from the ATP-Funded VGCF Project
VGCF-improved electricalconductivity
VGCF-improved strength
Pathway 1:
Avoiding off-line painting of automotive external body panels
Pathway 2:
Avoiding metal or metal-coated enclosures for automotive electronics
Pathway 3:
Providing structural stiffness for automotive tires without static electricity buildup
Cost reduction
VOCreduction
Enhanceddesign flexibility
Reduced rolling resistance
Higher fueleconomy
Cost reduction
•
•
•
•
•
•
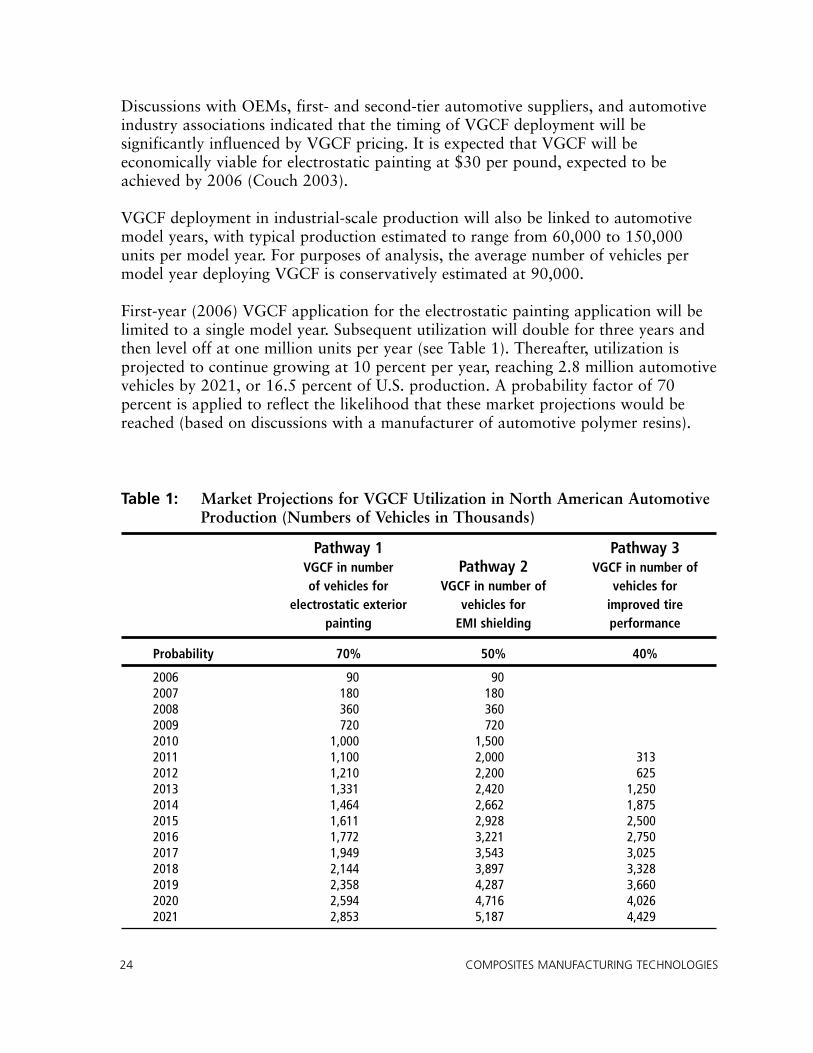
Discussions with OEMs, first- and second-tier automotive suppliers, and automotiveindustry associations indicated that the timing of VGCF deployment will besignificantly influenced by VGCF pricing. It is expected that VGCF will beeconomically viable for electrostatic painting at $30 per pound, expected to beachieved by 2006 (Couch 2003).
VGCF deployment in industrial-scale production will also be linked to automotivemodel years, with typical production estimated to range from 60,000 to 150,000units per model year. For purposes of analysis, the average number of vehicles permodel year deploying VGCF is conservatively estimated at 90,000.
First-year (2006) VGCF application for the electrostatic painting application will belimited to a single model year. Subsequent utilization will double for three years andthen level off at one million units per year (see Table 1). Thereafter, utilization isprojected to continue growing at 10 percent per year, reaching 2.8 million automotivevehicles by 2021, or 16.5 percent of U.S. production. A probability factor of 70percent is applied to reflect the likelihood that these market projections would bereached (based on discussions with a manufacturer of automotive polymer resins).
24 COMPOSITES MANUFACTURING TECHNOLOGIES
Table 1: Market Projections for VGCF Utilization in North American AutomotiveProduction (Numbers of Vehicles in Thousands)
Pathway 1 Pathway 3VGCF in number Pathway 2 VGCF in number of of vehicles for VGCF in number of vehicles for
electrostatic exterior vehicles for improved tirepainting EMI shielding performance
Probability 70% 50% 40%
2006 90 902007 180 1802008 360 3602009 720 7202010 1,000 1,5002011 1,100 2,000 3132012 1,210 2,200 6252013 1,331 2,420 1,2502014 1,464 2,662 1,8752015 1,611 2,928 2,5002016 1,772 3,221 2,7502017 1,949 3,543 3,0252018 2,144 3,897 3,3282019 2,358 4,287 3,6602020 2,594 4,716 4,0262021 2,853 5,187 4,429
Base case assumptions for estimating Pathway 1 benefits are as follows:
• Average exterior painting cost for an all-steel U.S. automotive vehicle, painted in-line, is $504 per vehicle (Sawyer n.d.).
• Average exterior surface area of U.S. automotive vehicles, including panels andtrim, is 137.2 square feet (Couch 2003).
• By 2005, the polymer content in the exterior surface of an average U.S. automotivevehicle will reach 40.5 square feet or 29.5 percent of exterior surface area (Brown2000).
• Exterior painting of a car body with 29.5 percent polymer surface area is currentlyestimated at $606, compared to $504 for an all-steel vehicle. The cost penaltyincludes the cost of conductive primer, increased production time, reducedproductivity, color mismatch, and related rework (BRG 1998). VGCF utilizationwill avoid the $102 of additional cost.
• Avoiding the application of a conductive primer for off-line painting of polymerpanels and trim will reduce VOC emissions during painting and finishingoperations. North American automotive assembly operations generate 4.5 poundsof VOC emissions per vehicle and 90 percent of these emissions result frompainting and finishing processes (General Motors 2002). The conductive primercoating for off-line painting is one in five layers with significant VOC content.Eliminating the primer coat is projected to result in 0.23 pounds of avoided VOCemissions per vehicle.
For a step-out scenario, exterior surface polymer content is assumed to increase 10percent over the base case to 44.6 square feet per vehicle, or 32.6 percent of exteriorsurface area. The cost penalty of off-line painting for the increased surface area is$113 over an all-steel exterior vehicle, compared with $102 for the base case. VGCFutilization will avoid the $113 additional cost.
Pathway 2: Electromagnetic Interference (EMI) Shielding
EMI is important for safe and reliable automotive vehicle operations and is nowprovided by conductive enclosures made from metal or metal-coated parts. VGCF’sintrinsic conductivity eliminates the need for metal parts or metallic coating and leadsto cost savings.
Discussions with OEMs, first- and second-tier automotive suppliers, and automotiveindustry associations indicated that the timing of VGCF deployment for EMI andrequired VGCF price reduction are the same as for electrostatic painting (Couch2003).
As for electrostatic painting, VGCF use for EMI shielding will be linked toautomotive model years, with typical production ranging from 60,000 to 150,000units per model year. For purposes of analysis, the average number of vehicles permodel year deploying VGCF is conservatively estimated at 90,000.
Vapor-Grown Carbon Fiber Case Study 25
First year (2006) VGCF utilization will be limited to a single model year. Subsequentutilization will double for four years and then level off at 2.0 million units per year(see Table 1). Thereafter, utilization is projected to continue growing at 10 percentper year, reaching 5.2 million automotive vehicles by 2021, or 30.5 percent of U.S.production. A probability factor of 50 percent is applied (based on discussion withan automotive electrical parts supplier).
Base case assumptions are as follows:
• By 2006, the typical U.S. vehicle will have 26 electronic systems, includingautomotive steering and control, safety, and communications (based on discussionswith a first-tier electronics supplier).
• Each electronic system needs to be effectively shielded within metal enclosures ormetal-coated plastic enclosures. The cost of these enclosures is approximately $1per enclosure (based on discussions with a first-tier supplier).
• Replacing metal enclosures or metal-coated plastic enclosures with VGCF-reinforced composite enclosures results in a 65 percent savings, or $16.9 pervehicle.
For a step-out scenario, replacing metal enclosures or metal-coated plastic enclosureswith VGCF composites is expected to lead to 69 percent savings, or $17.9 pervehicle.
Pathway 3: VGCF-Reinforced Tires
In automotive tires, carbon black is used as a tire additive to provide conductivityand eliminate the buildup of static electricity. To improve tire stiffness and to reducerolling resistance, silica additives are sometimes used to partially replace carbon blackadditives. Since silica has lower conductivity, its use can lead to the buildup of staticelectricity.
Using VGCF as an alternative to silica can provide both stiffness and conductivity,leading to reduced rolling resistance and improved fuel economy without a buildupof static electricity.
Discussions with automotive OEMs, first-tier automotive suppliers, and automotiveindustry associations indicate that VGCF as a automotive tire additive will beeconomically viable at $2 per pound, expected to be achieved by 2011.
First-year (2011) VGCF utilization will be limited to daily lot sizes of 5,000 tires or1.25 million tires per year, corresponding to 312,500 vehicles (see Table 1). If thisapplication is successfully developed, lot sizes will double for two subsequent yearsand then increase by 625,000 units per year for the next two years. Thereafter, VGCFuse in automotive tires will increase at 10 percent per year, corresponding to 4.4
26 COMPOSITES MANUFACTURING TECHNOLOGIES
million vehicles by 2021. Since there is currently no active development program, theprobability of successful deployment is estimated at 40 percent.
Given a probability of deployment under 50 percent, VGCF use for automotive tireapplications was not included in the base case analysis. For a step-out scenario, it isassumed that VGCF additives will replace 20 percent of carbon black additives forthe above number of vehicles. This will result in reduced tire rolling resistance andimproved fuel economy by 1.2 percent (ASI 2002a). For passenger cars with 20.7miles per gallon CAFE standards, average annual mileage of 12,000 miles, and motorgasoline prices at $1.5 per gallon, the 1.2 percent improvement will result in annualper vehicle savings of 6.9 gallons and $10.4.
Timeframe of Analysis
Timeframes for base case and step-out scenario analyses are 15 years for electrostaticpainting and EMI shielding applications and 10 years for the automotive tireapplications. These timeframes are reasonable in light of anticipated aggressive VGCFprice reductions from $30 dollars per pound in 2006 to $2 in 2011.
ATP and Industry Partner Investments
During the 1995 to 2000 period, ATP invested $2.2 million and its industry partners(ASI, General Motors Corporation, and Goodyear Tire & Rubber) invested $3.2million in the VGCF technology.
The ATP investment was used to support ASI (an independent small U.S. companythat was the technology innovator) and its engineering and technical subcontractors.General Motors Corporation and Goodyear Tire & Rubber Company providedsufficient funding to fully support their own project-related activities includingtechnical development, testing, and the prototyping of automotive parts with VGCFadditives. General Motors and Goodyear did not receive ATP funds.
For purposes of cash flow analysis, the ATP investment was normalized to 2003dollars and assumed to occur in 1998, the midpoint of the five-year investmentperiod. Given the study’s focus on measuring benefits to industry users and thenation broadly (that is, public benefits), industry’s investment costs relative to theATP (public) investment were not included in the analysis.
Base Case Economic Analysis
The expected values of cash flow benefits (adjusted for probabilities of VGCFdeployment in industrial-scale production) for electrostatic painting and EMI shieldingapplications are indicated in Table 2. The net present value (NPV) from ATP’sinvestment is $552 million for the two pathways combined. Over 80 percent of NPV
Vapor-Grown Carbon Fiber Case Study 27
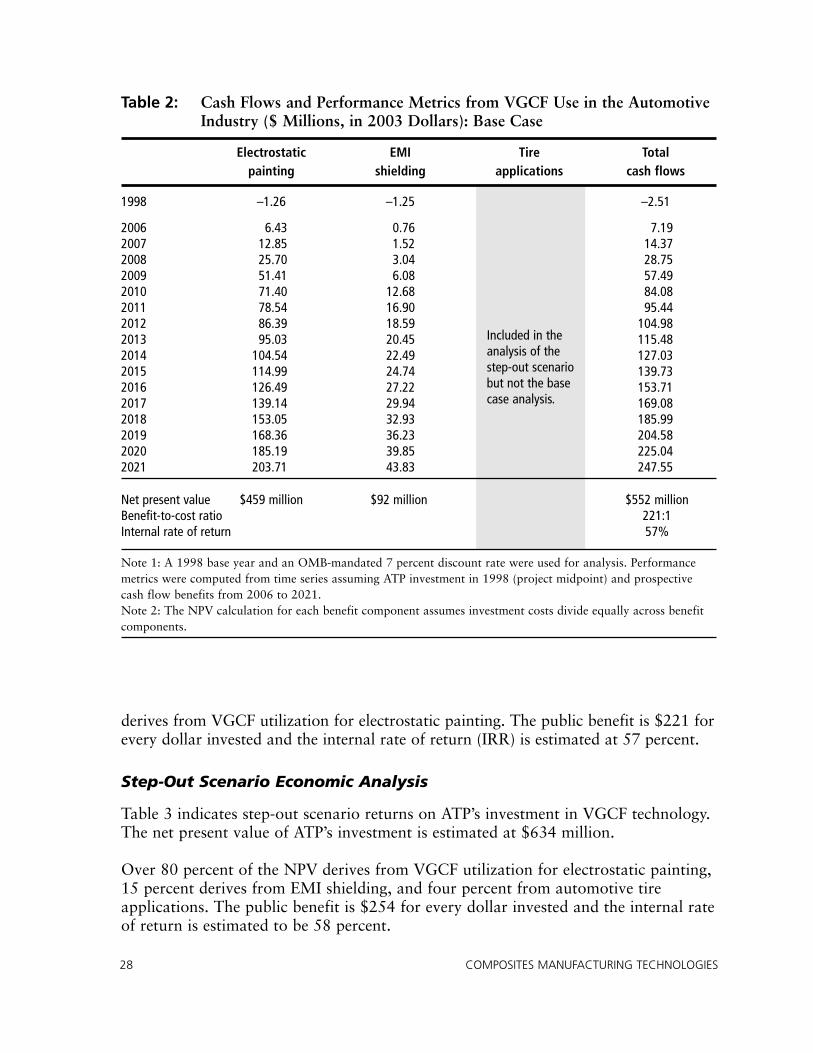
Included in theanalysis of thestep-out scenariobut not the basecase analysis.
derives from VGCF utilization for electrostatic painting. The public benefit is $221 forevery dollar invested and the internal rate of return (IRR) is estimated at 57 percent.
Step-Out Scenario Economic Analysis
Table 3 indicates step-out scenario returns on ATP’s investment in VGCF technology.The net present value of ATP’s investment is estimated at $634 million.
Over 80 percent of the NPV derives from VGCF utilization for electrostatic painting,15 percent derives from EMI shielding, and four percent from automotive tireapplications. The public benefit is $254 for every dollar invested and the internal rateof return is estimated to be 58 percent.
28 COMPOSITES MANUFACTURING TECHNOLOGIES
Table 2: Cash Flows and Performance Metrics from VGCF Use in the AutomotiveIndustry ($ Millions, in 2003 Dollars): Base Case
Electrostatic EMI Tire Totalpainting shielding applications cash flows
1998 –1.26 –1.25 –2.51
2006 6.43 0.76 7.192007 12.85 1.52 14.372008 25.70 3.04 28.752009 51.41 6.08 57.492010 71.40 12.68 84.082011 78.54 16.90 95.442012 86.39 18.59 104.982013 95.03 20.45 115.482014 104.54 22.49 127.032015 114.99 24.74 139.732016 126.49 27.22 153.712017 139.14 29.94 169.082018 153.05 32.93 185.992019 168.36 36.23 204.582020 185.19 39.85 225.042021 203.71 43.83 247.55
Net present value $459 million $92 million $552 millionBenefit-to-cost ratio 221:1Internal rate of return 57%
Note 1: A 1998 base year and an OMB-mandated 7 percent discount rate were used for analysis. Performancemetrics were computed from time series assuming ATP investment in 1998 (project midpoint) and prospectivecash flow benefits from 2006 to 2021.Note 2: The NPV calculation for each benefit component assumes investment costs divide equally across benefitcomponents.
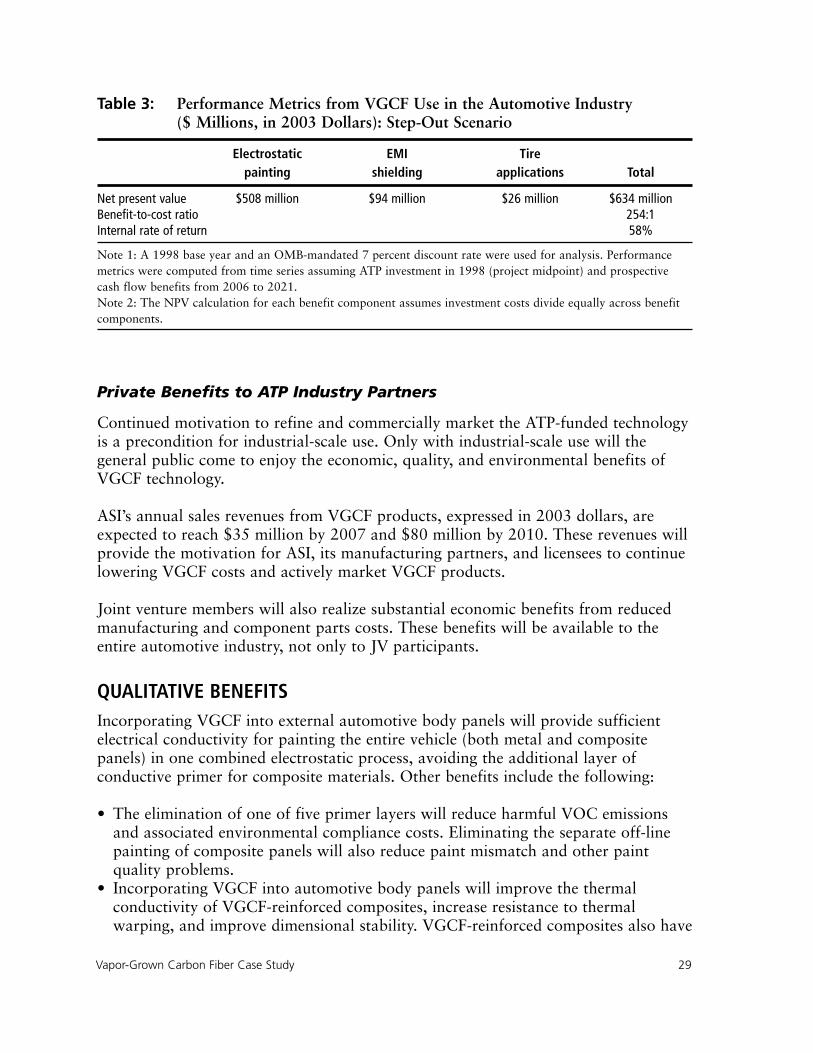
Private Benefits to ATP Industry Partners
Continued motivation to refine and commercially market the ATP-funded technologyis a precondition for industrial-scale use. Only with industrial-scale use will thegeneral public come to enjoy the economic, quality, and environmental benefits ofVGCF technology.
ASI’s annual sales revenues from VGCF products, expressed in 2003 dollars, areexpected to reach $35 million by 2007 and $80 million by 2010. These revenues willprovide the motivation for ASI, its manufacturing partners, and licensees to continuelowering VGCF costs and actively market VGCF products.
Joint venture members will also realize substantial economic benefits from reducedmanufacturing and component parts costs. These benefits will be available to theentire automotive industry, not only to JV participants.
QUALITATIVE BENEFITS Incorporating VGCF into external automotive body panels will provide sufficientelectrical conductivity for painting the entire vehicle (both metal and compositepanels) in one combined electrostatic process, avoiding the additional layer ofconductive primer for composite materials. Other benefits include the following:
• The elimination of one of five primer layers will reduce harmful VOC emissionsand associated environmental compliance costs. Eliminating the separate off-linepainting of composite panels will also reduce paint mismatch and other paintquality problems.
• Incorporating VGCF into automotive body panels will improve the thermalconductivity of VGCF-reinforced composites, increase resistance to thermalwarping, and improve dimensional stability. VGCF-reinforced composites also have
Vapor-Grown Carbon Fiber Case Study 29
Table 3: Performance Metrics from VGCF Use in the Automotive Industry ($ Millions, in 2003 Dollars): Step-Out Scenario
Electrostatic EMI Tirepainting shielding applications Total
Net present value $508 million $94 million $26 million $634 millionBenefit-to-cost ratio 254:1Internal rate of return 58%
Note 1: A 1998 base year and an OMB-mandated 7 percent discount rate were used for analysis. Performancemetrics were computed from time series assuming ATP investment in 1998 (project midpoint) and prospectivecash flow benefits from 2006 to 2021.Note 2: The NPV calculation for each benefit component assumes investment costs divide equally across benefitcomponents.
improved flame retardancy, increasing safety in case of road accidents or electricaland mechanical malfunctioning.
• Incorporating VGCF into protective enclosures to shield automotive electronicsystems from EMI (electromagnetic interference) will facilitate the replacement ofmetal enclosures with composite enclosures, thereby providing significant designflexibility in the engine compartment and other highly constrained internal spaces.
• Incorporating VGCF into automotive tires will provide sufficient electricalconductivity to discharge the buildup of static electricity and reduce the likelihoodof electrical shock during vehicle operations and fueling.
* * * * * *
At the time of the ATP funding in 1995, ASI was a new company with 10 employees,including 4 engineers and scientists, and without the financial resources to undertakea high-risk VGCF research and development program. By 2003, ASI had grown to 26full time employees, including 10 engineers and scientists. According to ASImanagement, the VGCF project would not have been undertaken without the ATPcost share and the associated qualitative and qualitative benefits would not have beenpossible.
30 COMPOSITES MANUFACTURING TECHNOLOGIES
In offshore petroleum production, steel risers (tubing) are used to bring oil from theseabed to floating production platforms. In deepwater applications (3,000 to 5,000feet), heavy steel risers require expensive tensioning and buoyancy systems. For ultra-deep operations in water depths of 5,000 to 13,000 feet, the size and weight ofconventional steel risers becomes cost prohibitive, inhibiting the exploitation ofsubstantial offshore domestic oil reserves (Silverman 1999).
The use of lighter-weight composite production risers (CPRs) will reduce platformweight together with floatation and tensioning requirements and overcome one of thegreatest limiting factors in offshore oil production, that is, increasing riser loads thatfloating platforms have to support in increasing water depths. However, the cost ofCPRs has been significantly higher than steel risers because prior manufacturingtechniques have not been optimized and production levels have not achievedeconomies of scale. When CPR cost disadvantages are overcome, platform lifecyclecosts will be reduced, and additional crude oil production from deepwater Gulf ofMexico petroleum reserves will be realized (Johnson 2000).
This section describes the results of a case study of ATP-funded CPR technology. Itpresents project history and key technical accomplishments, describes commercialand market applications in the offshore petroleum industry, and presents the resultsof a quantitative economic benefit-to-cost analysis together with a brief discussion ofqualitative benefits.
PROJECT HISTORYThe development of fiberglass-reinforced composites for petroleum productionstarted with the efforts of Koch Exploration & Development Company in the 1950sto facilitate crude oil production from highly corrosive wells. The effort wascontinued by Institut Français du Pétrole (IFP) and Aerospatiale, resulting in proof ofconcept as well as some development and testing of glass- and carbon-reinforced rigidcomposite tubes for offshore applications. IFP subsequently attempted to form joint
Composite Production Riser Case Study 31
4. Composite Production Riser Case Study
ventures with major petroleum exploration and development companies to completetechnical development, to develop standard product specifications, to define designand manufacturing practices, and to conduct reliability testing. However, these jointventure efforts were “shelved due to a lack of sustained participation by the majorpetroleum companies” (DeLuca 2000).
Lincoln Composites (formerly a division of Brunswick Corporation) learned fromIFP’s setbacks and recognized the significant commercial and energy independencebenefits of CPRs for the offshore petroleum industry. In 1994, Lincoln Compositesformed a joint venture with Shell Oil, Amoco, and Conoco corporations, and withtechnical and engineering service providers Brown & Root, Hydril, and theUniversity of Houston. The joint venture submitted a proposal to ATP to cost shareremaining technical development tasks and to facilitate industrial-scale testing andprototyping of CPRs.
In 1995, ATP selected the proposed high-risk project. In addition to cost sharing thehigh-risk technology development effort, ATP involvement also provided theadditional important benefit of “keeping the industry collaborators engaged andmaking it possible to jointly develop product performance specifications forcomposite risers” (Johnson 1999).
The project was successfully completed in 2000 and resulted in technical advances,including the development of CPR design and performance criteria, development ofhigh-quality, cost-effective manufacturing processes, and effectively addressingperformance monitoring and reliability issues in deepwater saline environments.
Technical and cost efficiency benefits from the CPR project would not have beenrealized without ATP funding and without ATP’s role in motivating industrycollaborators to remain “engaged in the development of appropriate CPR productspecifications” (Johnson 2003).
Subsequent to commencing the ATP-funded project, Lincoln Composites becameindependent briefly. It was recently acquired (in 2002) by General DynamicsCorporation. The Lincoln Composites Division of General Dynamics now consists of250 employees, including 60 engineers. It has potential access to General Dynamicscorporate resources to support the completion of the remaining technical tasks and toeffectively market and deploy the CPR technology for deepwater offshore oilproduction in the Gulf of Mexico.
HOW DOES IT WORK?Composite production risers are hybrid composite structures, consisting ofcontinuous carbon fibers and electrical-grade fiberglass (E-glass) in an epoxy matrix.CPR strength and stiffness are provided by the carbon and glass fibers, with higheststrength in the direction of the fibers (Johnson 1999).
32 COMPOSITES MANUFACTURING TECHNOLOGIES
As DeLuca (2000) explains:
Composite risers are designed with fiber orientation and layer thickness tailored toresist the actual load configuration. In offshore riser applications, the tension loadsare carried by fibers that are axially oriented or helically filament wound at lowangles to the tube axis and pressure loads are resisted by circumferentially placedhoop-wound fibers.
The primary success of composites in a particular application is due to the ability totailor the composite’s superior strength and fatigue properties in a particulardirection. Directional tailoring minimizes the amount of material (and weight) in thenon-loaded direction. In contrast to composite structures, directional tailoring is notpossible in homogenous materials such as steel and titanium (Silverman 1999).
CPR Manufacturing Process
CPRs are fabricated with a laminated composite tube body and a metal-to-compositeinterface (MCI). The MCI transfers loads between the composite tube body and themetal end fitting. Metal fittings are used for joining risers in a string.
The first step in CPR production involves machining metal end fittings from steeltubing for a “geometric trap” type of MCI design. End fittings are installed on amandrel and uncured hydrogen resistant rubber (HNBR) is wound onto the mandrelto provide the inner liner of the CPR. Low-angle helically wound carbon fibers arewound over the HNBR and the metal end fittings, reversed through a low-profiledome, and secured between the trap geometry and the dome. Circumferentiallyoriented E-glass fibers are then hoop-wound to resist pressure loads, and both carbonand E-glass fibers are impregnated with epoxy resin during the winding process. Themethods of impregnation and fiber tensioning are proprietary.
Next, “the mandrel wound assembly is removed from the winding machine andplaced in a rotating cure dolly. After a curing process, the assembly is replaced on thewinding machine, where another layer of HNBR is spiral wrapped on the outside ofthe assembly. Over the HNBR is wound a layer of glass hoops and a glass helicallayer which compact the HNBR elastomer and provide extra abrasion protection.”This is followed by a final curing process (Johnson 1999). Figure 5 provides acutaway view of the CPR and MCI.
TECHNICAL ACCOMPLISHMENTS A viable CPR structure has to achieve functional specifications, including resistinginternal and external pressures, fluid containment, structural support, and resistingchemical corrosion and other environmental attack. It must also be cost competitivewith steel risers. Relative to these functional specifications, the ATP-funded projectfaced technical challenges in the following areas:
Composite Production Riser Case Study 33
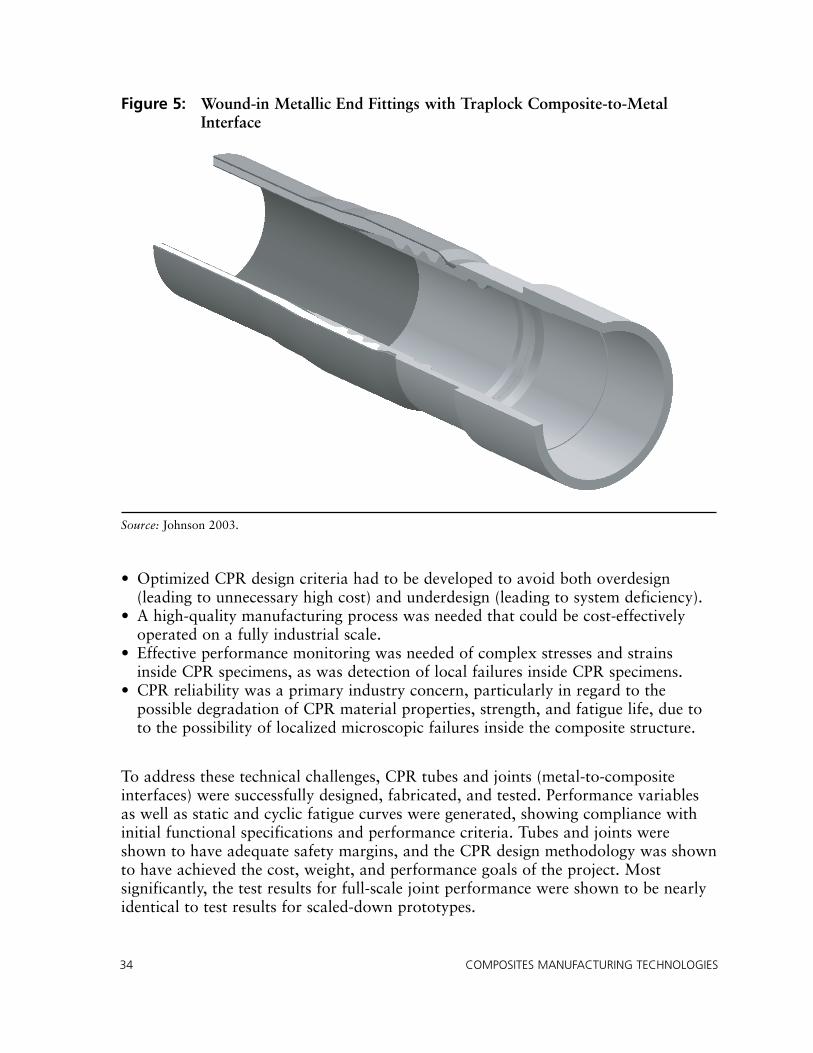
• Optimized CPR design criteria had to be developed to avoid both overdesign(leading to unnecessary high cost) and underdesign (leading to system deficiency).
• A high-quality manufacturing process was needed that could be cost-effectivelyoperated on a fully industrial scale.
• Effective performance monitoring was needed of complex stresses and strainsinside CPR specimens, as was detection of local failures inside CPR specimens.
• CPR reliability was a primary industry concern, particularly in regard to thepossible degradation of CPR material properties, strength, and fatigue life, due toto the possibility of localized microscopic failures inside the composite structure.
To address these technical challenges, CPR tubes and joints (metal-to-compositeinterfaces) were successfully designed, fabricated, and tested. Performance variablesas well as static and cyclic fatigue curves were generated, showing compliance withinitial functional specifications and performance criteria. Tubes and joints wereshown to have adequate safety margins, and the CPR design methodology was shownto have achieved the cost, weight, and performance goals of the project. Mostsignificantly, the test results for full-scale joint performance were shown to be nearlyidentical to test results for scaled-down prototypes.
34 COMPOSITES MANUFACTURING TECHNOLOGIES
Figure 5: Wound-in Metallic End Fittings with Traplock Composite-to-MetalInterface
Source: Johnson 2003.
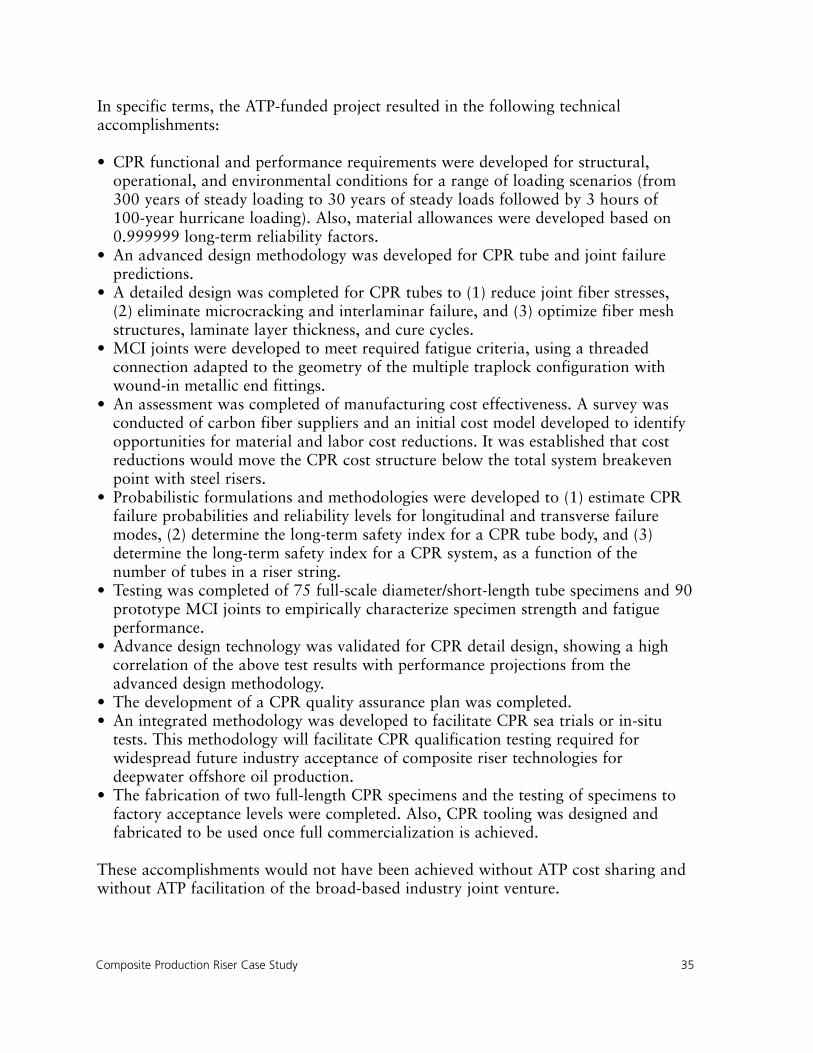
In specific terms, the ATP-funded project resulted in the following technicalaccomplishments:
• CPR functional and performance requirements were developed for structural,operational, and environmental conditions for a range of loading scenarios (from300 years of steady loading to 30 years of steady loads followed by 3 hours of100-year hurricane loading). Also, material allowances were developed based on0.999999 long-term reliability factors.
• An advanced design methodology was developed for CPR tube and joint failurepredictions.
• A detailed design was completed for CPR tubes to (1) reduce joint fiber stresses,(2) eliminate microcracking and interlaminar failure, and (3) optimize fiber meshstructures, laminate layer thickness, and cure cycles.
• MCI joints were developed to meet required fatigue criteria, using a threadedconnection adapted to the geometry of the multiple traplock configuration withwound-in metallic end fittings.
• An assessment was completed of manufacturing cost effectiveness. A survey wasconducted of carbon fiber suppliers and an initial cost model developed to identifyopportunities for material and labor cost reductions. It was established that costreductions would move the CPR cost structure below the total system breakevenpoint with steel risers.
• Probabilistic formulations and methodologies were developed to (1) estimate CPRfailure probabilities and reliability levels for longitudinal and transverse failuremodes, (2) determine the long-term safety index for a CPR tube body, and (3)determine the long-term safety index for a CPR system, as a function of thenumber of tubes in a riser string.
• Testing was completed of 75 full-scale diameter/short-length tube specimens and 90prototype MCI joints to empirically characterize specimen strength and fatigueperformance.
• Advance design technology was validated for CPR detail design, showing a highcorrelation of the above test results with performance projections from theadvanced design methodology.
• The development of a CPR quality assurance plan was completed.• An integrated methodology was developed to facilitate CPR sea trials or in-situ
tests. This methodology will facilitate CPR qualification testing required forwidespread future industry acceptance of composite riser technologies fordeepwater offshore oil production.
• The fabrication of two full-length CPR specimens and the testing of specimens tofactory acceptance levels were completed. Also, CPR tooling was designed andfabricated to be used once full commercialization is achieved.
These accomplishments would not have been achieved without ATP cost sharing andwithout ATP facilitation of the broad-based industry joint venture.
Composite Production Riser Case Study 35
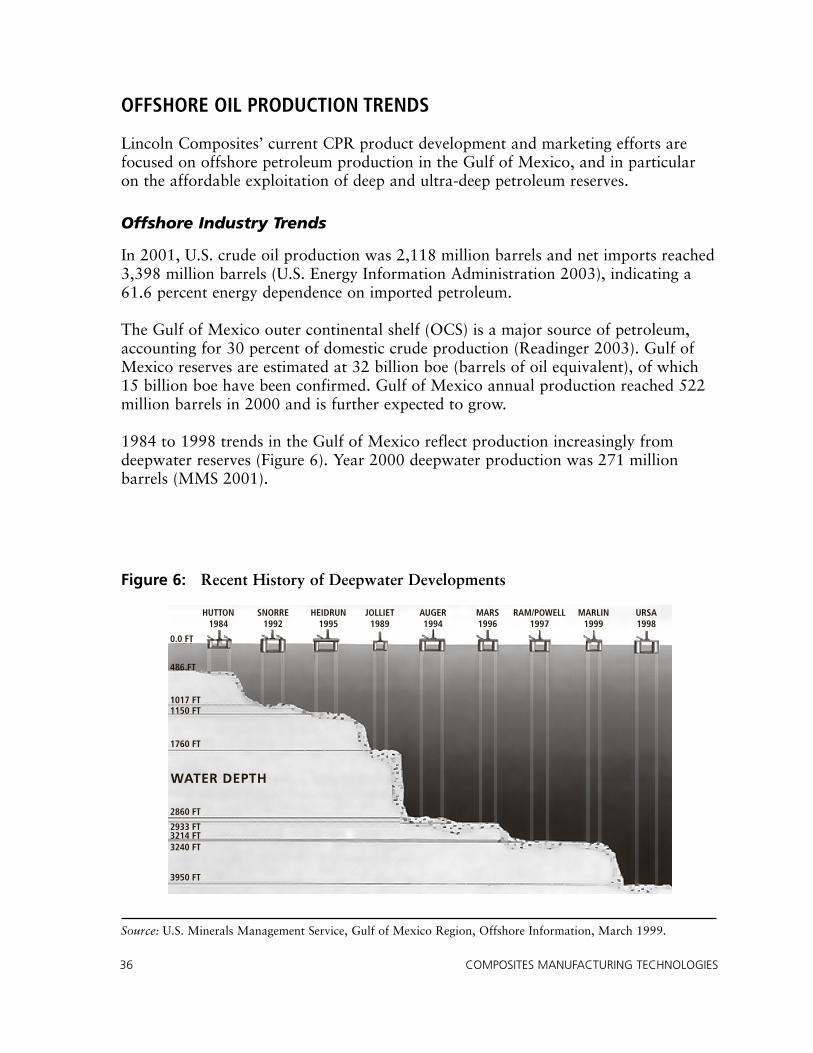
OFFSHORE OIL PRODUCTION TRENDS
Lincoln Composites’ current CPR product development and marketing efforts arefocused on offshore petroleum production in the Gulf of Mexico, and in particularon the affordable exploitation of deep and ultra-deep petroleum reserves.
Offshore Industry Trends
In 2001, U.S. crude oil production was 2,118 million barrels and net imports reached3,398 million barrels (U.S. Energy Information Administration 2003), indicating a61.6 percent energy dependence on imported petroleum.
The Gulf of Mexico outer continental shelf (OCS) is a major source of petroleum,accounting for 30 percent of domestic crude production (Readinger 2003). Gulf ofMexico reserves are estimated at 32 billion boe (barrels of oil equivalent), of which15 billion boe have been confirmed. Gulf of Mexico annual production reached 522million barrels in 2000 and is further expected to grow.
1984 to 1998 trends in the Gulf of Mexico reflect production increasingly fromdeepwater reserves (Figure 6). Year 2000 deepwater production was 271 millionbarrels (MMS 2001).
36 COMPOSITES MANUFACTURING TECHNOLOGIES
Figure 6: Recent History of Deepwater Developments
HUTTON1984
SNORRE1992
HEIDRUN1995
JOLLIET1989
AUGER1994
MARS1996
RAM/POWELL1997
MARLIN1999
URSA1998
0.0 FT
486 FT
1017 FT1150 FT
1760 FT
2860 FT
2933 FT3214 FT3240 FT
3950 FT
WATER DEPTH
Source: U.S. Minerals Management Service, Gulf of Mexico Region, Offshore Information, March 1999.
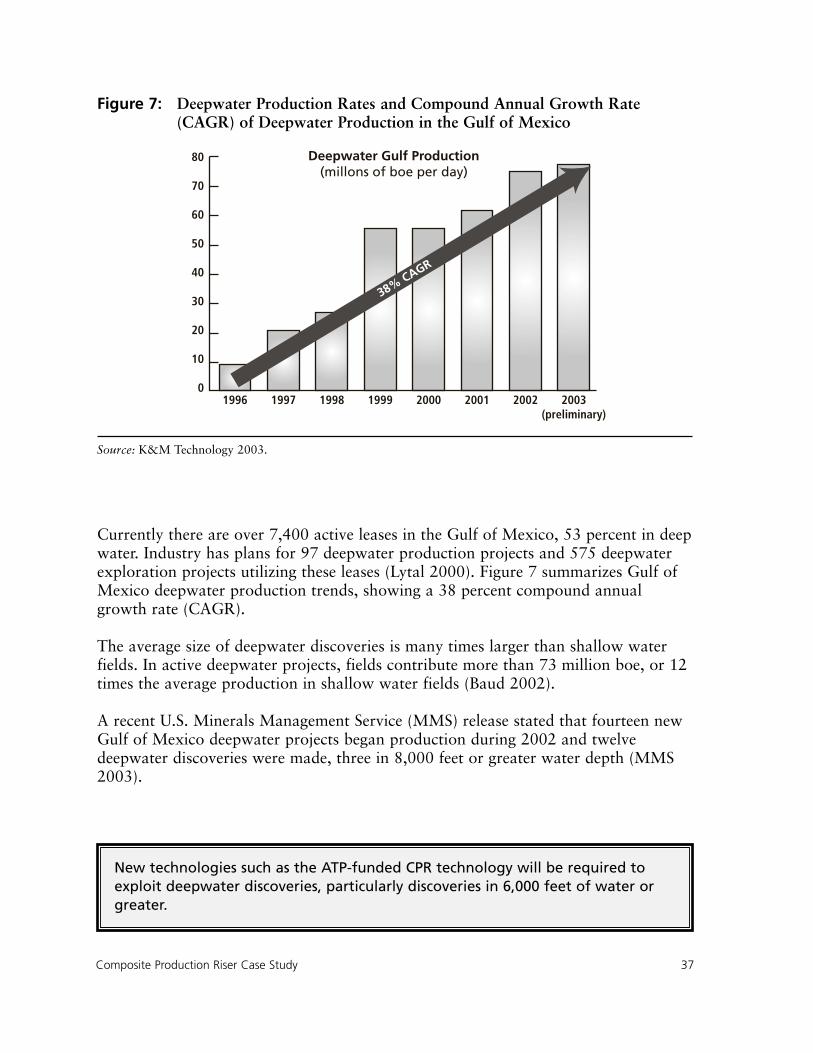
Currently there are over 7,400 active leases in the Gulf of Mexico, 53 percent in deepwater. Industry has plans for 97 deepwater production projects and 575 deepwaterexploration projects utilizing these leases (Lytal 2000). Figure 7 summarizes Gulf ofMexico deepwater production trends, showing a 38 percent compound annualgrowth rate (CAGR).
The average size of deepwater discoveries is many times larger than shallow waterfields. In active deepwater projects, fields contribute more than 73 million boe, or 12times the average production in shallow water fields (Baud 2002).
A recent U.S. Minerals Management Service (MMS) release stated that fourteen newGulf of Mexico deepwater projects began production during 2002 and twelvedeepwater discoveries were made, three in 8,000 feet or greater water depth (MMS2003).
Composite Production Riser Case Study 37
1996 1997 1998 1999 2000 2001 2002 2003(preliminary)
80
70
60
50
40
30
20
10
0
Deepwater Gulf Production(millons of boe per day)
38% CAGR
Figure 7: Deepwater Production Rates and Compound Annual Growth Rate(CAGR) of Deepwater Production in the Gulf of Mexico
Source: K&M Technology 2003.
New technologies such as the ATP-funded CPR technology will be required toexploit deepwater discoveries, particularly discoveries in 6,000 feet of water orgreater.
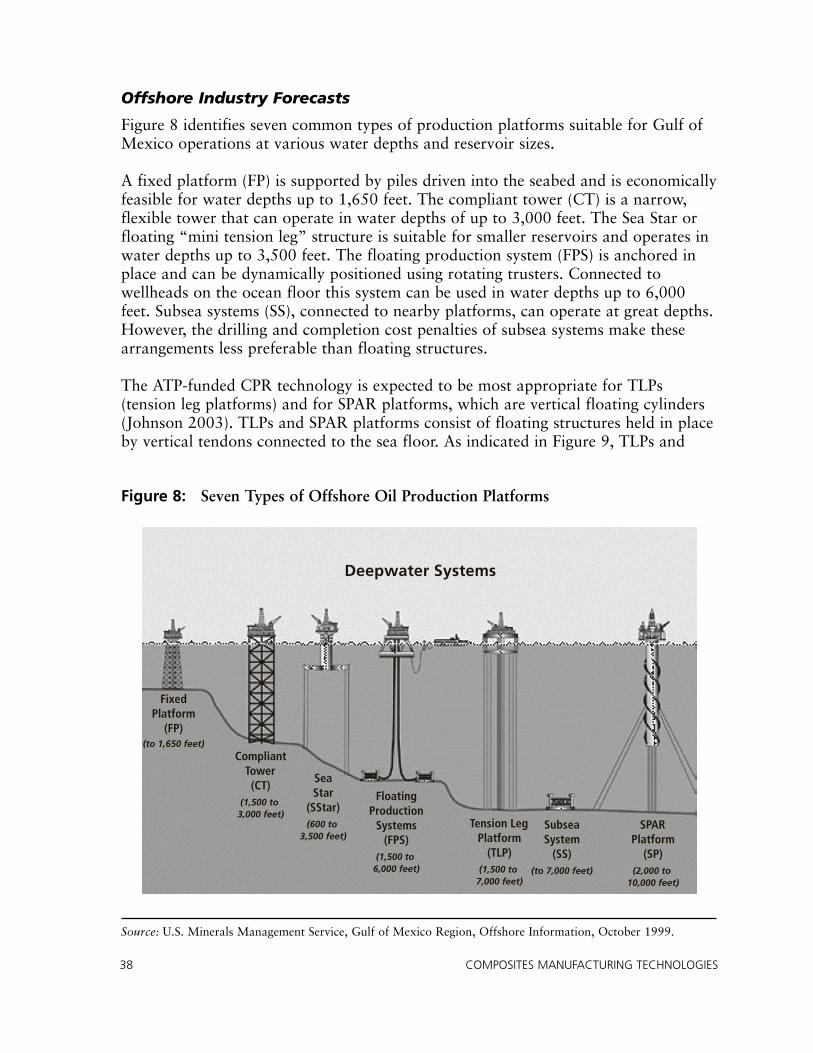
Offshore Industry Forecasts
Figure 8 identifies seven common types of production platforms suitable for Gulf ofMexico operations at various water depths and reservoir sizes.
A fixed platform (FP) is supported by piles driven into the seabed and is economicallyfeasible for water depths up to 1,650 feet. The compliant tower (CT) is a narrow,flexible tower that can operate in water depths of up to 3,000 feet. The Sea Star orfloating “mini tension leg” structure is suitable for smaller reservoirs and operates inwater depths up to 3,500 feet. The floating production system (FPS) is anchored inplace and can be dynamically positioned using rotating trusters. Connected towellheads on the ocean floor this system can be used in water depths up to 6,000feet. Subsea systems (SS), connected to nearby platforms, can operate at great depths.However, the drilling and completion cost penalties of subsea systems make thesearrangements less preferable than floating structures.
The ATP-funded CPR technology is expected to be most appropriate for TLPs(tension leg platforms) and for SPAR platforms, which are vertical floating cylinders(Johnson 2003). TLPs and SPAR platforms consist of floating structures held in placeby vertical tendons connected to the sea floor. As indicated in Figure 9, TLPs and
38 COMPOSITES MANUFACTURING TECHNOLOGIES
Figure 8: Seven Types of Offshore Oil Production Platforms
FixedPlatform
(FP)(to 1,650 feet)
CompliantTower(CT)
(1,500 to 3,000 feet)
SeaStar
(SStar)(600 to
3,500 feet)
FloatingProduction
Systems(FPS)
(1,500 to 6,000 feet)
Tension LegPlatform
(TLP)(1,500 to
7,000 feet)
SubseaSystem
(SS)(to 7,000 feet)
SPARPlatform
(SP)(2,000 to
10,000 feet)
Deepwater Systems
Source: U.S. Minerals Management Service, Gulf of Mexico Region, Offshore Information, October 1999.
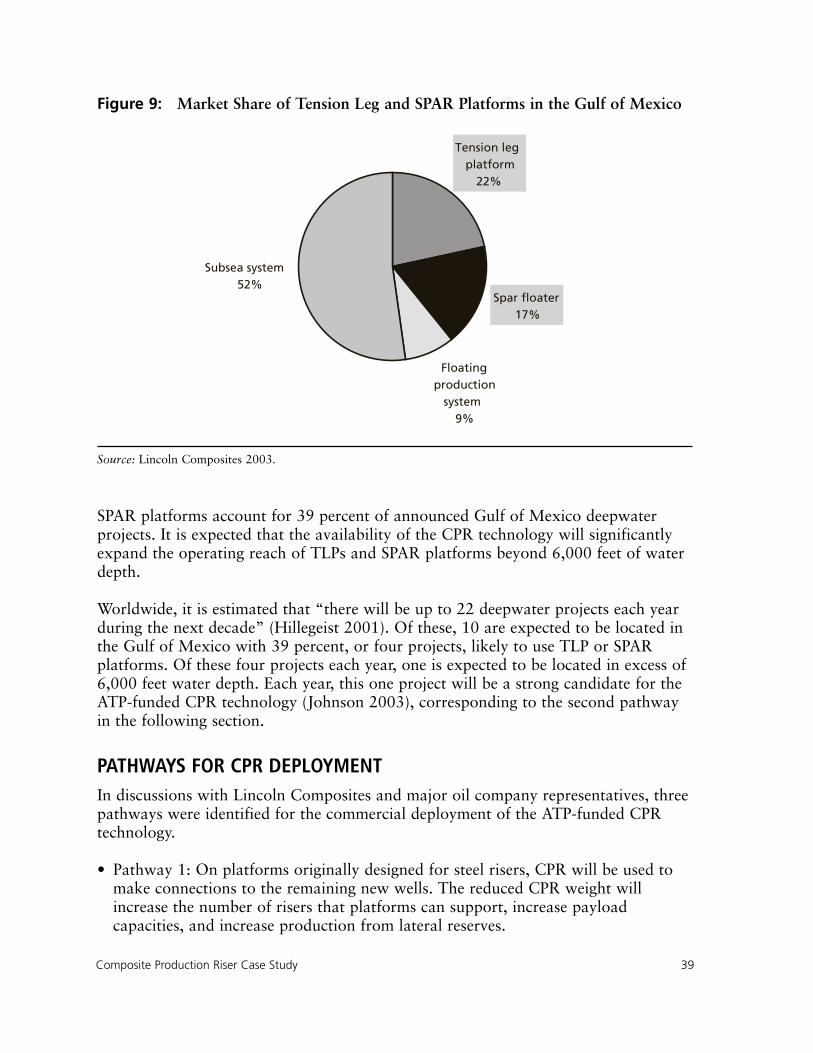
SPAR platforms account for 39 percent of announced Gulf of Mexico deepwaterprojects. It is expected that the availability of the CPR technology will significantlyexpand the operating reach of TLPs and SPAR platforms beyond 6,000 feet of waterdepth.
Worldwide, it is estimated that “there will be up to 22 deepwater projects each yearduring the next decade” (Hillegeist 2001). Of these, 10 are expected to be located inthe Gulf of Mexico with 39 percent, or four projects, likely to use TLP or SPARplatforms. Of these four projects each year, one is expected to be located in excess of6,000 feet water depth. Each year, this one project will be a strong candidate for theATP-funded CPR technology (Johnson 2003), corresponding to the second pathwayin the following section.
PATHWAYS FOR CPR DEPLOYMENTIn discussions with Lincoln Composites and major oil company representatives, threepathways were identified for the commercial deployment of the ATP-funded CPRtechnology.
• Pathway 1: On platforms originally designed for steel risers, CPR will be used tomake connections to the remaining new wells. The reduced CPR weight willincrease the number of risers that platforms can support, increase payloadcapacities, and increase production from lateral reserves.
Composite Production Riser Case Study 39
Figure 9: Market Share of Tension Leg and SPAR Platforms in the Gulf of Mexico
Floating production
system9%
Subsea system52%
Spar floater17%
Tension leg platform
22%
Source: Lincoln Composites 2003.
• Pathway 2: On new platforms designed for CPR, lighter-weight CPRs will make itpossible to reach large new deepwater petroleum reserves economically.
• Pathway 3: To facilitate the redeployment of out-of-production platforms that havegradually exhausted their underlying reservoirs, lighter-weight CPRs can replacesteel pipe, making it possible to redeploy platforms in water depths two or threetimes their original nameplate specifications.
OFFSHORE INDUSTRY INITIATIVES
A representative of Shell Exploration & Production Technology Company stated that“the ATP-funded CPR technology is of considerable commercial interest to ShellInternational and is under active review for possible Gulf of Mexico deepwaterdeployment.” In the absence of cost-effective technologies for ultra-deep production(6,000 feet water depths), Shell could lose its investment in several leases ready toexpire within the next few years.
Dr. Mamdouh Salama of ConocoPhillips said that the company intends to install 10CPR risers in its Magnolia TLP, currently under construction. He indicated a “95percent certainty that CPR technology, developed with ATP-funding, will beapproved by the Minerals Management Service and will be used in the MagnoliaTLP.” Dr. Salama also indicated that ConocoPhillips recently gave seriousconsideration to the redeployment of the Joliet TLP in ultra deepwater (per Pathway3). While lighter-weight CPR was not yet available to facilitate redeployment at thetime of that decision, “Joliet remains available for future redeployment, which couldbecome economically attractive with CPR risers” (Salama 2003).
PLATFORM PROJECTIONS WITH COMPOSITE RISERSBased on discussions with Lincoln Composites, major oil company representatives,regulators, and other industry participants, the benefits of composite productionrisers are generally recognized by major petroleum exploration and productioncompanies. As long as CPR is cost competitive, these benefits will include reducedweight per foot of production riser, lower system lifecycle costs, ability to reachgreater water depths, and improved protection from seawater temperatures andcorrosion.
Composite production riser deployment is projected to commence in 2004 andproceed as indicated in Table 4. The probability of reaching these projections isestimated to be 75 percent.
Given the presence of two competing initiatives to develop composite productionrisers, it is conservatively assumed that the ATP-funded CPR technology will capturea one-third share of projected CPR deployment.
40 COMPOSITES MANUFACTURING TECHNOLOGIES
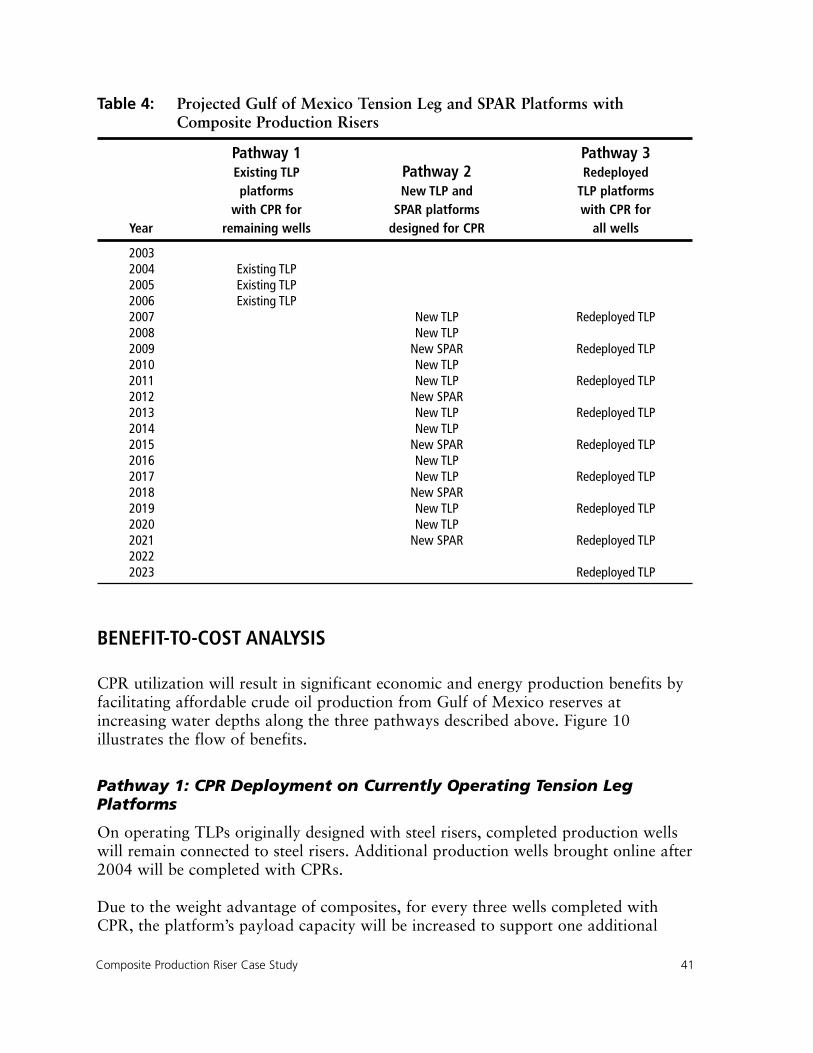
BENEFIT-TO-COST ANALYSIS
CPR utilization will result in significant economic and energy production benefits byfacilitating affordable crude oil production from Gulf of Mexico reserves atincreasing water depths along the three pathways described above. Figure 10illustrates the flow of benefits.
Pathway 1: CPR Deployment on Currently Operating Tension LegPlatforms
On operating TLPs originally designed with steel risers, completed production wellswill remain connected to steel risers. Additional production wells brought online after2004 will be completed with CPRs.
Due to the weight advantage of composites, for every three wells completed withCPR, the platform’s payload capacity will be increased to support one additional
Composite Production Riser Case Study 41
Table 4: Projected Gulf of Mexico Tension Leg and SPAR Platforms withComposite Production Risers
Pathway 1 Pathway 3Existing TLP Pathway 2 Redeployed platforms New TLP and TLP platforms
with CPR for SPAR platforms with CPR forYear remaining wells designed for CPR all wells
20032004 Existing TLP2005 Existing TLP2006 Existing TLP2007 New TLP Redeployed TLP2008 New TLP 2009 New SPAR Redeployed TLP2010 New TLP2011 New TLP Redeployed TLP2012 New SPAR2013 New TLP Redeployed TLP2014 New TLP2015 New SPAR Redeployed TLP2016 New TLP2017 New TLP Redeployed TLP2018 New SPAR2019 New TLP Redeployed TLP2020 New TLP2021 New SPAR Redeployed TLP20222023 Redeployed TLP
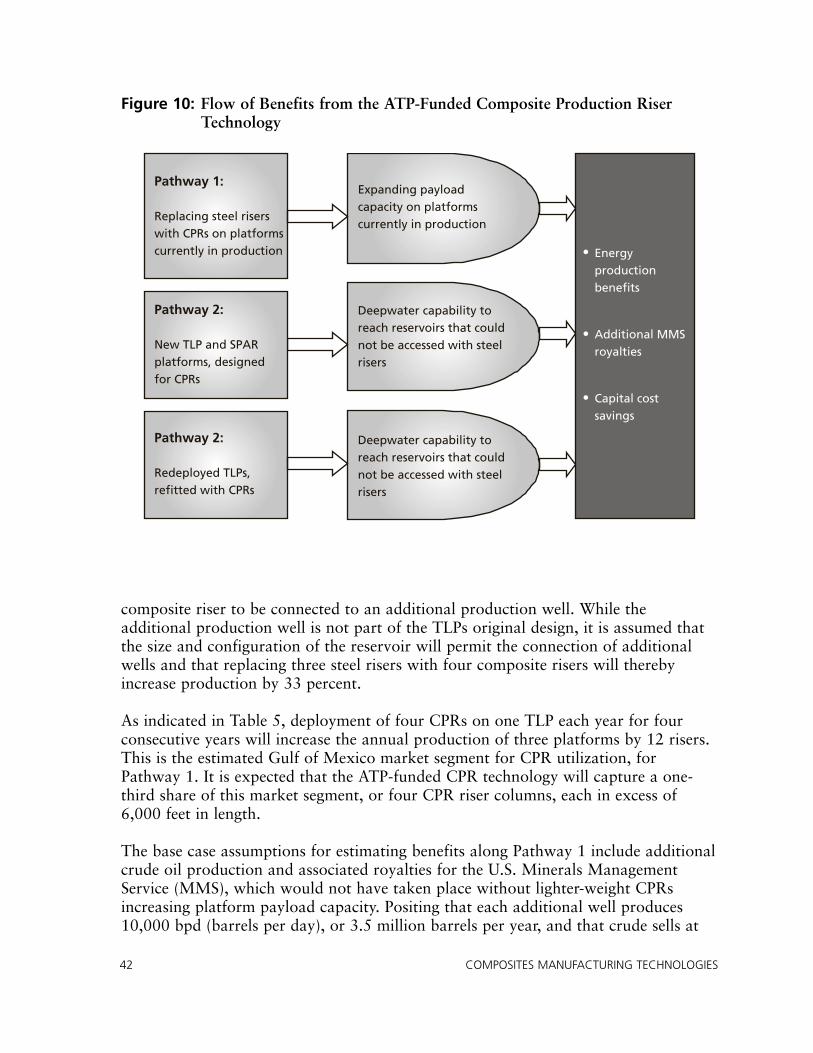
composite riser to be connected to an additional production well. While theadditional production well is not part of the TLPs original design, it is assumed thatthe size and configuration of the reservoir will permit the connection of additionalwells and that replacing three steel risers with four composite risers will therebyincrease production by 33 percent.
As indicated in Table 5, deployment of four CPRs on one TLP each year for fourconsecutive years will increase the annual production of three platforms by 12 risers.This is the estimated Gulf of Mexico market segment for CPR utilization, forPathway 1. It is expected that the ATP-funded CPR technology will capture a one-third share of this market segment, or four CPR riser columns, each in excess of6,000 feet in length.
The base case assumptions for estimating benefits along Pathway 1 include additionalcrude oil production and associated royalties for the U.S. Minerals ManagementService (MMS), which would not have taken place without lighter-weight CPRsincreasing platform payload capacity. Positing that each additional well produces10,000 bpd (barrels per day), or 3.5 million barrels per year, and that crude sells at
42 COMPOSITES MANUFACTURING TECHNOLOGIES
Figure 10: Flow of Benefits from the ATP-Funded Composite Production RiserTechnology
Pathway 1:
Replacing steel riserswith CPRs on platformscurrently in production
Pathway 2:
Redeployed TLPs,refitted with CPRs
Expanding payload capacity on platformscurrently in production
Deepwater capability toreach reservoirs that couldnot be accessed with steelrisers
Deepwater capability toreach reservoirs that couldnot be accessed with steelrisers
Pathway 2:
New TLP and SPARplatforms, designedfor CPRs
Energy productionbenefits
•
Additional MMSroyalties
•
Capital costsavings
•
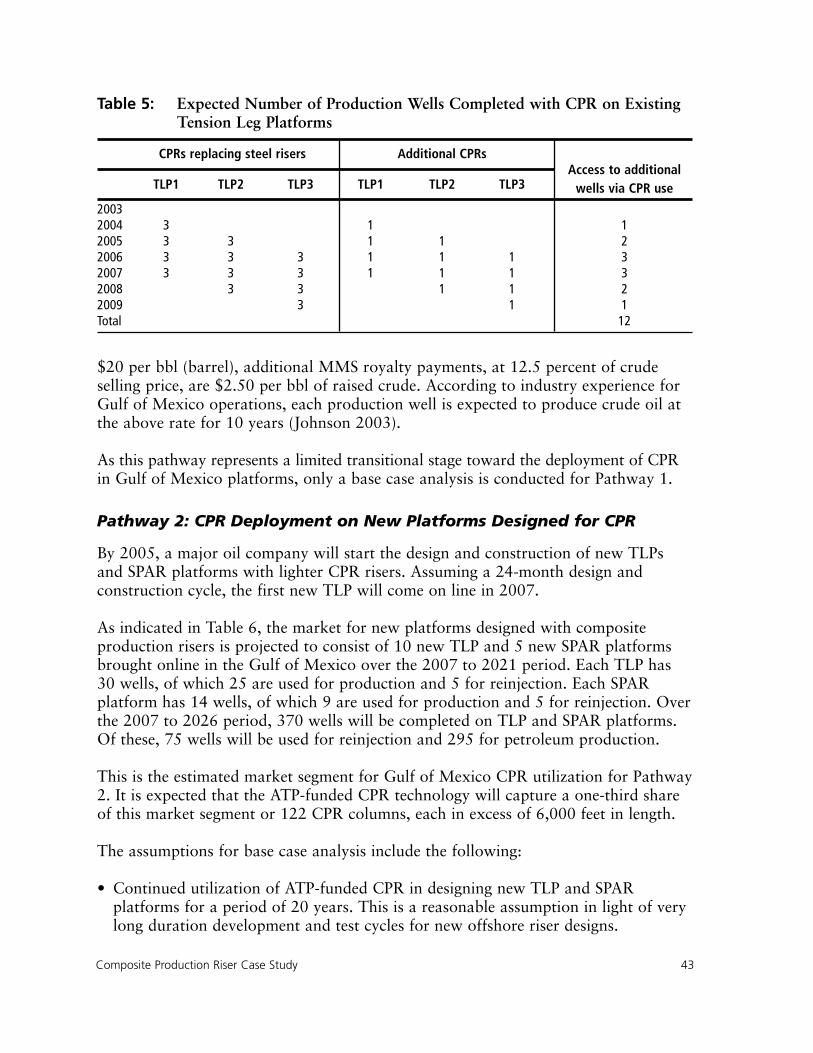
$20 per bbl (barrel), additional MMS royalty payments, at 12.5 percent of crudeselling price, are $2.50 per bbl of raised crude. According to industry experience forGulf of Mexico operations, each production well is expected to produce crude oil atthe above rate for 10 years (Johnson 2003).
As this pathway represents a limited transitional stage toward the deployment of CPRin Gulf of Mexico platforms, only a base case analysis is conducted for Pathway 1.
Pathway 2: CPR Deployment on New Platforms Designed for CPR
By 2005, a major oil company will start the design and construction of new TLPsand SPAR platforms with lighter CPR risers. Assuming a 24-month design andconstruction cycle, the first new TLP will come on line in 2007.
As indicated in Table 6, the market for new platforms designed with compositeproduction risers is projected to consist of 10 new TLP and 5 new SPAR platformsbrought online in the Gulf of Mexico over the 2007 to 2021 period. Each TLP has30 wells, of which 25 are used for production and 5 for reinjection. Each SPARplatform has 14 wells, of which 9 are used for production and 5 for reinjection. Overthe 2007 to 2026 period, 370 wells will be completed on TLP and SPAR platforms.Of these, 75 wells will be used for reinjection and 295 for petroleum production.
This is the estimated market segment for Gulf of Mexico CPR utilization for Pathway2. It is expected that the ATP-funded CPR technology will capture a one-third shareof this market segment or 122 CPR columns, each in excess of 6,000 feet in length.
The assumptions for base case analysis include the following:
• Continued utilization of ATP-funded CPR in designing new TLP and SPARplatforms for a period of 20 years. This is a reasonable assumption in light of verylong duration development and test cycles for new offshore riser designs.
Composite Production Riser Case Study 43
Table 5: Expected Number of Production Wells Completed with CPR on ExistingTension Leg Platforms
CPRs replacing steel risers Additional CPRsAccess to additional
TLP1 TLP2 TLP3 TLP1 TLP2 TLP3 wells via CPR use
20032004 3 1 12005 3 3 1 1 22006 3 3 3 1 1 1 32007 3 3 3 1 1 1 32008 3 3 1 1 22009 3 1 1Total 12
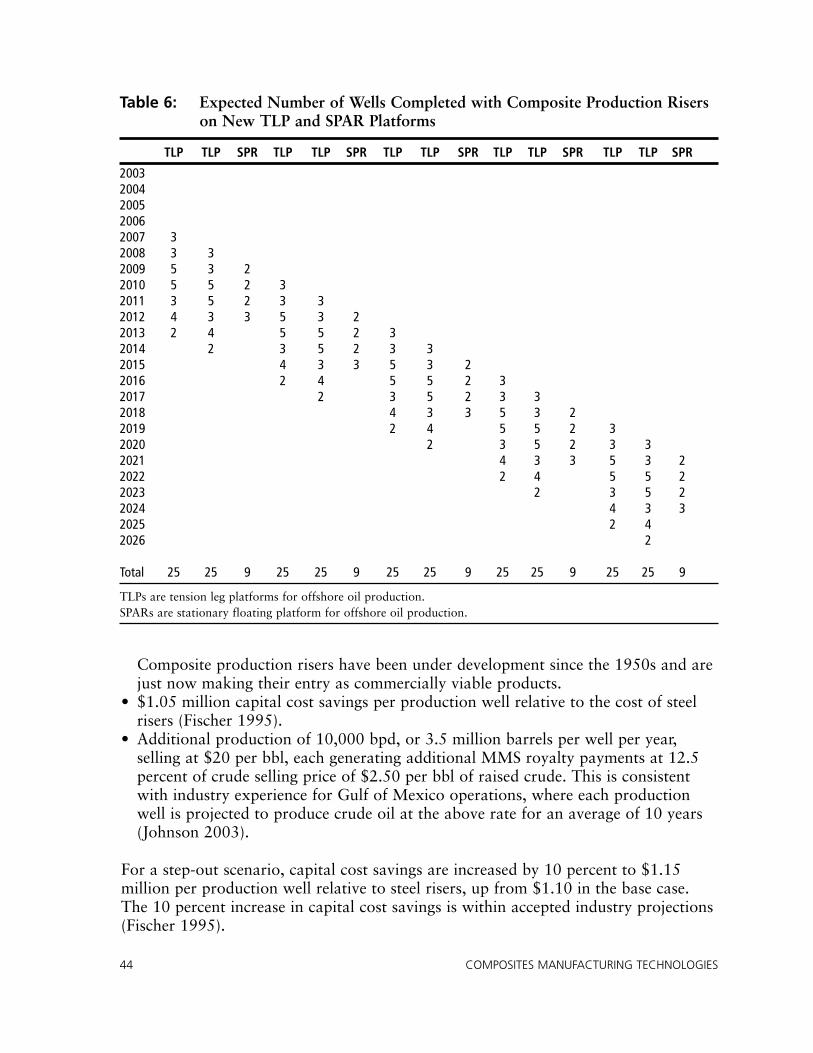
Composite production risers have been under development since the 1950s and arejust now making their entry as commercially viable products.
• $1.05 million capital cost savings per production well relative to the cost of steelrisers (Fischer 1995).
• Additional production of 10,000 bpd, or 3.5 million barrels per well per year,selling at $20 per bbl, each generating additional MMS royalty payments at 12.5percent of crude selling price of $2.50 per bbl of raised crude. This is consistentwith industry experience for Gulf of Mexico operations, where each productionwell is projected to produce crude oil at the above rate for an average of 10 years(Johnson 2003).
For a step-out scenario, capital cost savings are increased by 10 percent to $1.15million per production well relative to steel risers, up from $1.10 in the base case.The 10 percent increase in capital cost savings is within accepted industry projections(Fischer 1995).
44 COMPOSITES MANUFACTURING TECHNOLOGIES
Table 6: Expected Number of Wells Completed with Composite Production Riserson New TLP and SPAR Platforms
TLP TLP SPR TLP TLP SPR TLP TLP SPR TLP TLP SPR TLP TLP SPR
20032004200520062007 32008 3 32009 5 3 22010 5 5 2 32011 3 5 2 3 32012 4 3 3 5 3 22013 2 4 5 5 2 32014 2 3 5 2 3 32015 4 3 3 5 3 22016 2 4 5 5 2 32017 2 3 5 2 3 32018 4 3 3 5 3 22019 2 4 5 5 2 32020 2 3 5 2 3 32021 4 3 3 5 3 22022 2 4 5 5 22023 2 3 5 22024 4 3 32025 2 42026 2
Total 25 25 9 25 25 9 25 25 9 25 25 9 25 25 9
TLPs are tension leg platforms for offshore oil production.SPARs are stationary floating platform for offshore oil production.
Pathway 3: CPR Use for Redeploying Out-of-Production TLP Platforms
Operational TLPs that gradually exhaust their underlying reservoirs can be moved tonew, deeper reservoirs and refitted with lighter-weight risers to reach productionwells in water depths twice or three times the original nameplate. This process isenabled by the availability of affordable and lighter-weight composite risers.
It is assumed that one operating TLP in the Gulf of Mexico will reach the end of itsreservoir’s economic life in 2007. The TLP will be disconnected from the currentreservoir, relocated over a much deeper reservoir, and refitted with CPRs. For eachrelocation, the topside capital investment for hull and processing facilities is largelyavoided. It is assumed this process is repeated every second year until 2023, by whichtime nine TLPs will have been redeployed in deeper water. The ATP-funded CPRtechnology is expected to capture one third of this market segment.
The base case analysis assumes that TLP redeployment in deeper water will result in$325 million capital cost savings, or 25 percent of a $1.3 billion new TLP. For thestep-out scenario, capital cost savings are estimated at $390 million, or 30 percent ofa $1.3 billion new TLP. The step-out scenario assumption remains a conservativeestimate as capital costs of new platform hull and processing facility can be as muchas 50 percent of total TLP capital costs (Lytal 2000).
ATP and Industrial Partner Investments
During the 1994 to 1999 period, ATP invested $2.39 million and its industrypartners (Shell, BP Amoco, and ConocoPhillips) cost shared $2.42 million to develophigh-risk CPR technology.
The ATP funding was exclusively used by Brunswick Corporation (the technologyinnovator) and its successor, Lincoln Composites, which acquired Brunswick, and bytheir technical and engineering subcontractors. Shell, BP Amoco, and ConocoPhillipsfully funded their own project-related activities for CPR technical development,testing, and prototyping, and were funding sources for Lincoln Composites.
For purposes of cash flow analysis, the ATP investment was normalized to 2003dollars and assumed to occur in 1997, the midpoint of the five-year investmentperiod. The industry partner’s investment costs were not included in the economicanalysis, given the emphasis on measuring benefits to the nation relative to ATP’spublic investment.
Base Case Economic Analysis
Costs and expected values of benefit cash flows are indicated in Table 7. The netpresent value of ATP’s investment is $510 million. Forty-seven percent of the NPVderives from CPR capital cost savings and 53 percent from additional MMS royalties.
Composite Production Riser Case Study 45

46 COMPOSITES MANUFACTURING TECHNOLOGIES
Table 7: Cash Flows and Performance Metrics from CPR Deployment in Gulf ofMexico ($ Millions, in 2003 Dollars): Base Case
Capital cost savings MMS royaltiesTotal
Path 2 Path 3 All Paths Path 1 Path 2 All Paths cash flows
1997 –1.37 –1.37 –2.74
2004 2.17 2.17 2.17
2005 6.50 6.50 6.50
2006 12.99 12.99 12.99
2007 0.78 80.44 81.22 19.49 0.97 20.47 101.68
2008 1.56 0.00 1.56 23.82 2.92 26.75 28.30
2009 2.60 80.44 83.04 25.99 6.17 32.16 115.20
2010 3.90 0.00 3.90 25.99 11.04 37.03 40.93
2011 4.16 80.44 84.60 25.99 16.24 42.23 126.83
2012 5.20 0.00 5.20 25.99 22.74 48.73 53.92
2013 5.46 80.44 85.89 25.99 29.56 55.55 141.44
2014 4.68 0.00 4.68 23.82 35.41 59.23 63.91
2015 5.20 80.44 85.64 19.49 41.90 61.40 147.03
2016 5.46 0.00 5.46 12.99 48.73 61.72 67.18
2017 4.68 80.44 85.12 6.50 53.60 60.10 145.21
2018 5.20 0.00 5.20 2.17 58.15 60.31 65.51
2019 5.46 80.44 85.89 61.72 61.72 147.62
2020 4.68 0.00 4.68 62.69 62.69 67.37
2021 5.20 80.44 85.64 63.99 63.99 149.63
2022 4.68 0.00 4.68 63.34 63.34 68.02
2023 3.12 80.44 83.56 60.42 60.42 143.98
2024 2.60 0.00 2.60 57.82 57.82 60.42
2025 1.56 80.44 82.00 53.27 53.27 135.27
2026 0.52 0.52 47.10 47.10 47.62
Net present value $243 $267 $510 million million million
Benefit-to-cost ratio 187:1
Internal rate of return 58%
Note 1: A 1997 base year and an OMB-mandated 7 percent discount rate were used for analysis. Performancemetrics were computed from time series assuming ATP investment in 1997 (project midpoint) and prospectivecash flow benefits from 2004 to 2026.Note 2: The NPV calculations for the Capital Cost Savings and Royalties benefit components assume investmentcosts divide equally across these benefit components.
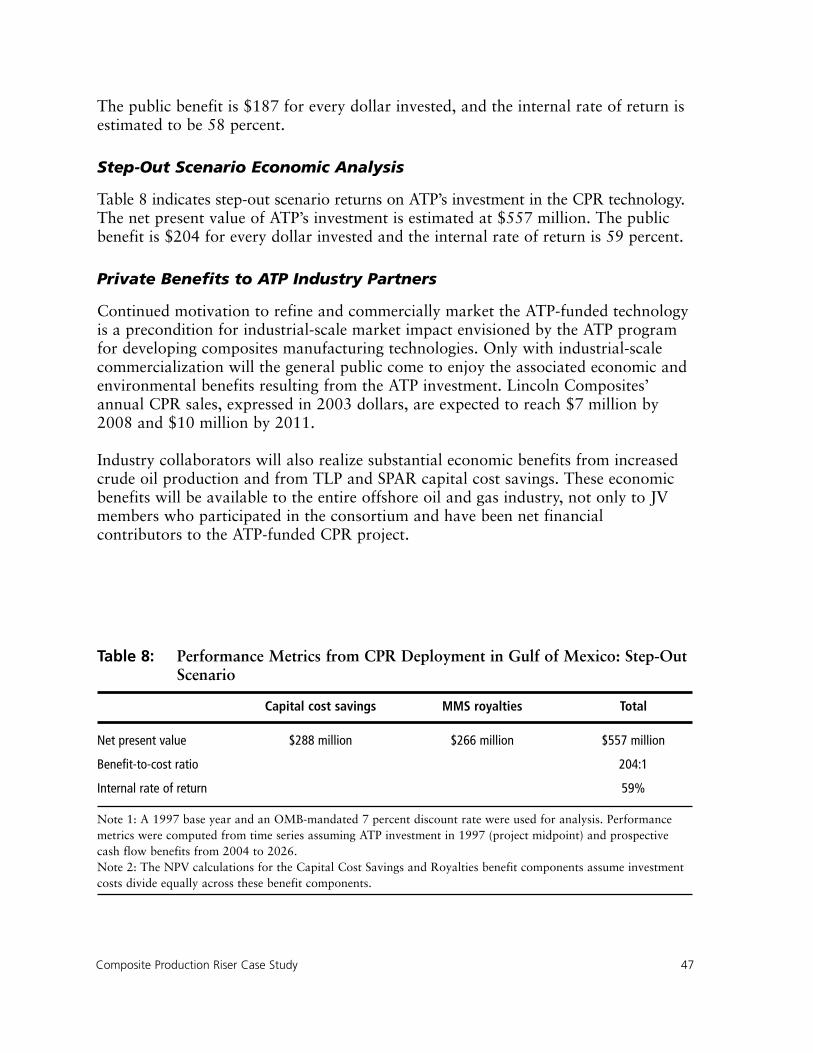
Composite Production Riser Case Study 47
The public benefit is $187 for every dollar invested, and the internal rate of return isestimated to be 58 percent.
Step-Out Scenario Economic Analysis
Table 8 indicates step-out scenario returns on ATP’s investment in the CPR technology.The net present value of ATP’s investment is estimated at $557 million. The publicbenefit is $204 for every dollar invested and the internal rate of return is 59 percent.
Private Benefits to ATP Industry Partners
Continued motivation to refine and commercially market the ATP-funded technologyis a precondition for industrial-scale market impact envisioned by the ATP programfor developing composites manufacturing technologies. Only with industrial-scalecommercialization will the general public come to enjoy the associated economic andenvironmental benefits resulting from the ATP investment. Lincoln Composites’annual CPR sales, expressed in 2003 dollars, are expected to reach $7 million by2008 and $10 million by 2011.
Industry collaborators will also realize substantial economic benefits from increasedcrude oil production and from TLP and SPAR capital cost savings. These economicbenefits will be available to the entire offshore oil and gas industry, not only to JVmembers who participated in the consortium and have been net financialcontributors to the ATP-funded CPR project.
Table 8: Performance Metrics from CPR Deployment in Gulf of Mexico: Step-OutScenario
Capital cost savings MMS royalties Total
Net present value $288 million $266 million $557 million
Benefit-to-cost ratio 204:1
Internal rate of return 59%
Note 1: A 1997 base year and an OMB-mandated 7 percent discount rate were used for analysis. Performancemetrics were computed from time series assuming ATP investment in 1997 (project midpoint) and prospectivecash flow benefits from 2004 to 2026.Note 2: The NPV calculations for the Capital Cost Savings and Royalties benefit components assume investmentcosts divide equally across these benefit components.
QUALITATIVE BENEFITS
Additional benefits from the ATP-funded CPR technology are expected to include thefollowing:
• Additional domestic crude oil production of 7.5 million bbl in 2008, 77 million bblin 2013, and 167 million bbl by 2020. Given the weight of steel risers, theseincremental production levels and associated progress towards energyindependence may not have been practical with currently available, state-of-the-artsteel risers.
• Improved thermal protection from seawater temperatures and from corrosivesaltwater environments as a result of composites’ superior corrosion resistancecharacteristics compared with steel risers.
* * * * *
Prior to ATP funding, Lincoln Composites was unable to allocate financial resourcesto fund in full a high-risk program to develop composite production risers. In largepart, the perception of unacceptable technical risk reflected prior failed industryefforts to develop composite risers.
In 1994, the ATP funded the proposed CPR project. In addition to cost sharing thehigh-risk technology development effort, ATP involvement provided the additionalimportant benefit of “keeping the industry collaborators engaged and making itpossible to jointly develop product performance specifications for composite risers”(Johnson 1999).
Technical and cost efficiency benefits from the CPR project would not have beenrealized without ATP funding and without ATP facilitation.
48 COMPOSITES MANUFACTURING TECHNOLOGIES
This section discusses the technical challenges and accomplishments of two ATP-funded composites manufacturing projects for civil infrastructure applications andone composites manufacturing project for offshore oil and gas application. Togetherwith the two case studies, these three projects comprise the cluster of five projects.
While the ATP-funded technical tasks of these three projects have been successfullycompleted, there has been less progress toward commercialization than for the twocase study projects.
INNOVATIVE MANUFACTURING TECHNIQUES FOR LARGE COMPOSITE SHAPES: Applications in Load-Bearing Beams for Short-Span Bridges
Federal Highway Administration studies indicate that nearly 30 percent of U.S.bridges are obsolete or structurally deficient and that bridge maintenance and repairare major ongoing expenses for many state and local transportation departments. Inaddition, road construction in metropolitan and urban areas significantly contributesto traffic congestion and to associated economic and environmental costs (Taylor2002).
Load-bearing composite beams would be lighter than steel beams for bridgemaintenance and repair, easier to transport, and faster to install. Composite beamswould also be more durable and require less maintenance than steel. At the sametime, composite beams are currently more expensive and can be difficult to fabricateinto structures of appropriate shape and size, and with adequate stiffness.
Strongwell Corporation, working in conjunction with Georgia Institute ofTechnology, developed a proposal for addressing the design, fabrication, and costchallenges of composite beams for bridge maintenance and repair. In 1995, the ATPagreed to cost share the project with an investment of $2 million. Strongwell
Additional Projects in the Cluster Study 49
5. Additional Projects in the ClusterStudy
Corporation provided a cost share of $1.138 million. The project was successfullycompleted in 1998.
Strongwell beams are made with glass and carbon fibers bound in polymer resin.Fabrication uses a pultrusion process that pulls fibers through a resin impregnationbath and a shaping die to form complex cross-sectional shapes. Technicalaccomplishments of the ATP-funded project include the following:
• Optimizing beam shape and developing design standards to increase beam stiffness,eliminate the need for braces, and reduce costs.
• Developing a manufacturing process to create 36 inch by 18 inch double-web I-beams from vinyl ester phenolic composites.
• Designing and fabricating a dual reciprocating hydraulic puller system,synchronized by a programmable linear controller, and developing a biofiltrationprocess for emissions control.
The ATP-funded technology development effort led to a bridge demonstration projectinstalled at Sugar Grove, VA, jointly funded by Strongwell Corporation, the FederalHighway Administration, and the Virginia Department of Transportation.
Future commercial use of the ATP-funded technology will lead to more efficientbridge maintenance, faster completion of construction tasks, and reduced congestioncosts and environmental emissions. Realizing these benefits will depend on achievingfurther manufacturing improvements and cost reductions.
SYNCHRONOUS CNC MACHINING OF PULTRUDED LINEALS:Application in Electric Transmission Towers
“While increasing amounts of electricity are flowing over the nation’s ‘wires’,America’s electric transmission infrastructure is aging. If new technologies and morecapital are not utilized to relieve congestion, reliability will suffer. The economy willnot grow, if it continues to rely on an inadequate transmission system” (Silverstein2002).
Modernization of the nation’s electrical transmission system is inhibited, in part, bythe traditional use of steel structures. Steel towers are expensive to manufacture,require large teams and heavy equipment to install, require anticorrosion treatments,and can weigh too much for helicopter transport into remote areas. Using lighter-weight and corrosion-resistant transmission towers made from composite materialscould provide a number of benefits for modernizing the electric transmissioninfrastructure, including the following:
• Improved ease of transporting tower structures to remote sites (lighter weight).• Faster installation and lower installation costs.• Improved maintainability of corrosion-resistant transmission towers.
50 COMPOSITES MANUFACTURING TECHNOLOGIES
Ebert Composites Corporation submitted a proposal to the ATP to address thedesign, fabrication, and cost challenges of composite-based electric transmissiontowers. In 1994, the ATP agreed to cost share the project with an investment of$1.032 million. Ebert Composites Corporation provided a cost share of $0.303million. The project was successfully completed in 1997.
Ebert designed and demonstrated an affordable manufacturing system, withsignificantly reduced production times, for composite towers. The system combinesthe pultrusion process with computer numerical control (CNC) machining. The ATPfunding was used to design a CNC workstation with a five-axis machining head thatperforms intricate detailing on pultruded parts. Designs for different parts could nowbe stored in the computer and produced with high accuracy in any quantity andsequence without interrupting the pultrusion. The CNC machine significantlyreduced labor costs and human error. Southern California Edison Co. (SCE) iscurrently testing several demonstration towers that Ebert made using the ATP-fundedmanufacturing process.
INNOVATIVE JOINING AND FITTING TECHNOLOGY FOR COMPOSITE PIPING SYSTEMS: Applications in Offshore Oil and Gas Platforms
The weight of steel piping for cooling water, process water, fire suppression, andchemical systems on superstructures of floating oil and gas platforms is a significantcapital cost in offshore platform design.
To realize capital cost savings, lighter-weight composite piping systems, able to reachoperating pressures of 400 psi, could replace “topside” steel piping if cost-effectivetechnologies were developed for joining composite pipes. This requires thedevelopment of reliable composite-to-composite and composite-to-metal joiningtechnologies, to be produced with low-cost manufacturing processes that replacelabor-intensive practices.
Specialty Plastics, Inc. makes composite pipes and components for the petrochemicaland marine industries. To enable and stimulate the use of composite piping onoffshore oil and gas platforms, the company proposed to develop an improvedmethod for joining composite pipe segments and to develop more efficient, less costlyprocesses for manufacturing pipe fittings. In 1995, ATP agreed to cost share theproposed project with an investment of $1.809 million. Specialty Plastics, Inc.provided a cost share of $0.773 million.
The project was completed in 1998. While many technical objectives were achieved,the extent of surface adhesion or chemical bonding between adhesives andcomposites could not be improved sufficiently to reach a targeted 400 psi operatingpressure. As a result, the ATP-funded piping and fitting technology was limited toseawater cooling systems and other lower-pressure applications.
Additional Projects in the Cluster Study 51
In 1998 Specialty Plastics was acquired by EDO Corporation. According to themanager of engineering for EDO Specialty Plastics, the successor company will makethe ATP-funded technology available upon customer request. ATP-funded joining andfitting elements have been incorporated in some commercial sales of composite pipingsystems used for cooling water applications on offshore platform superstructures, aswell as in some commercial sales for onshore composite piping systems. However, thesuccessor company’s business strategy and current plans do not include the activemarketing of the composites joining and fitting technology.
52 COMPOSITES MANUFACTURING TECHNOLOGIES
The current cluster study uses a hybrid of traditional case-study approaches. Thecluster study combines the advantages of overview case studies and detailed casestudies for a richer assessment of empirical relationships between public investmentsand public benefits than would be possible with either of the two methods alone.
Detailed case studies are used to develop insights into market dynamics andtechnology commercialization pathways and to provide a credible basis for estimatingbenefit cash flows and associated probabilities. Cash flow estimates are then used tocompute performance metrics to quantify the relationships of public investments andresultant public benefits.
Multiproject overviews are used to envision additional benefits, extend analysisbeyond individual projects, and generate lower-bound performance estimates for acluster of projects and an entire technology program.
PROJECT CLUSTER AND FOCUSED PROGRAM The cluster of ATP-funded composites manufacturing technologies is composed offive projects. Two of these projects are at advanced stages of commercialization andhave a high probability of generating public benefits: vapor-grown carbon fibertechnology and the composite production riser technology. Detailed case studies forthese two projects are discussed in Sections 3 and 4. The remaining three projects inthe cluster discussed in Section 5 (composite bridge beam technology, compositejoining and fitting technology, and machining technology for pultruded lineals) are atearlier stages of commercialization and can be associated with only speculative publicbenefits. At some point, these remaining technologies may also becomecommercialized and become associated with probable cash flow benefits. Given thatremaining technologies may yield benefits in the future, developing performancemetrics using cash flows from only two projects with near-term commercial impactleads to conservative, lower-bound performance estimates for the entire cluster.
Benefit-to-Cost Analysis for Cluster of Projects 53
6. Benefit-to-Cost Analysis for Clusterof Projects
Over the 1994–1998 period, the ATP funded 17 additional compositesmanufacturing technologies. Together with the five cluster projects, these 22 projectsconstitute the ATP focused program for manufacturing of advanced compositematerials. While beyond the original scope of the cluster study, it seemed appropriateto extend analysis to include preliminary performance metrics for the focusedprogram. Using the same approach as for the cluster analysis, cash flow benefits fromthe two case studies are compared to the combined cost of 22 projects of relatedtechnologies in the focused program. Given that at some future time additionalprojects in the program may become commercially successful and may yield benefitsthat are not yet determined and not yet included in the analysis, preliminaryperformance metrics for the program of 22 projects represent conservative, lower-bound estimates.
PUBLIC BENEFITS, PUBLIC INVESTMENTS, AND PERFORMANCE METRICSWhile ATP-funded composites manufacturing technologies, once fully commercialized,will generate both public and private benefits, the estimation of benefit cash flowsand the computation of performance metrics were limited to public benefits,excluding private benefits to innovating firms. These public benefits will be realizedby industrial users of new composite materials, by consumers of improved industrialproducts incorporating new composite materials, and by society at large, throughenjoyment of reduced environmental emissions and increased energy availability.
Figure 11 illustrates the general flow of the cluster-study process. Public benefits fromATP-funded technologies and ATP-facilitated industry joint ventures are combinedwith public investment costs to yield economic measures of return. More specifically,two of the five projects in the cluster, analyzed in Sections 3 and 4 and associatedwith quantifiable, high-probability cash flow estimates from automotive and oil andgas applications, are connected with solid-line arrows to the “Combined Cash FlowEstimates” box in the middle of Figure 11. The remaining three projects with broken-line arrows to the “Combined Cash Flow Estimates” box do not represent currentcontributions. Rather, broken-line arrows denote possible future benefit cash flows,should currently speculative benefits from these three projects become more probablethrough ongoing commercialization efforts. While beyond the scope of the currentstudy, cash flow estimates for these three remaining projects could be developed,when appropriate.
The “Combined Cash Flow Estimates” box in the middle of Figure 11 representscash flows from automotive and from oil and gas applications, normalized forconstant 2003 dollars. Normalized cash flows are added to yield a combined cashflow time series.
Boxes on the right side of Figure 11, “ATP Investment in 22 Projects” and “ATPInvestment in Cluster of Five Projects,” represent investment costs for the focusedprogram and the cluster of projects, respectively.
54 COMPOSITES MANUFACTURING TECHNOLOGIES
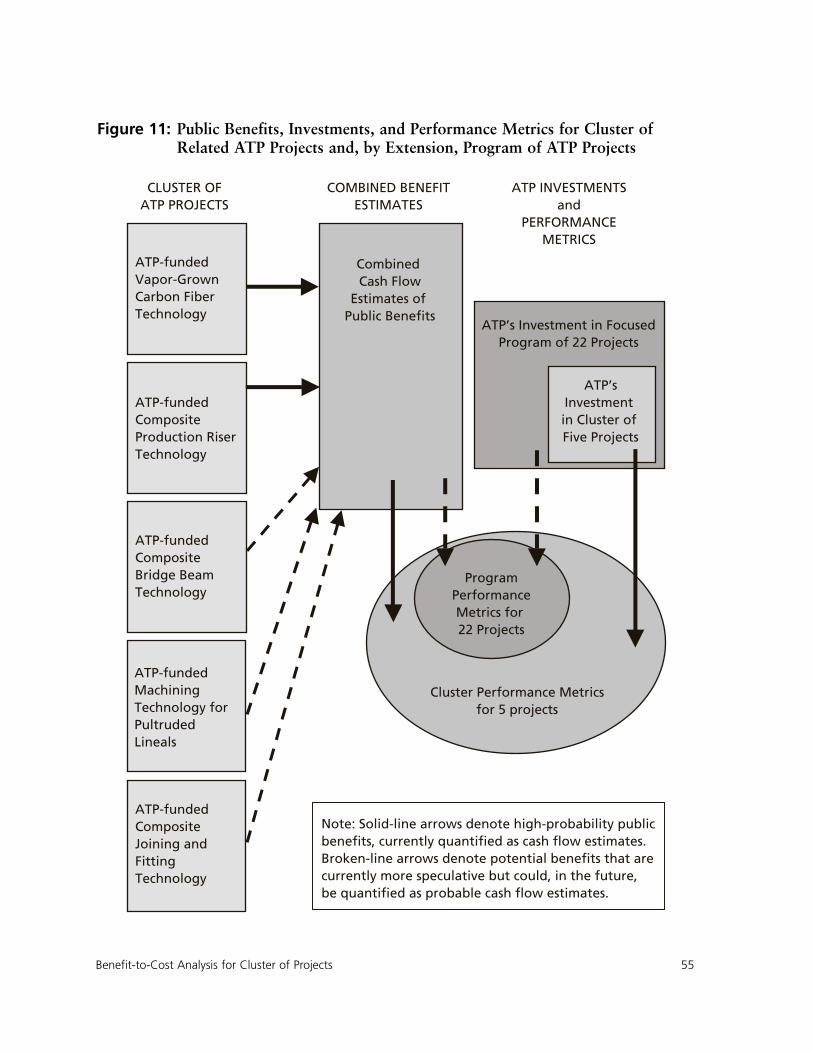
Benefit-to-Cost Analysis for Cluster of Projects 55
Figure 11: Public Benefits, Investments, and Performance Metrics for Cluster ofRelated ATP Projects and, by Extension, Program of ATP Projects
Cluster Performance Metricsfor 5 projects
ProgramPerformanceMetrics for 22 Projects
CLUSTER OFATP PROJECTS
COMBINED BENEFITESTIMATES
ATP INVESTMENTSand
PERFORMANCEMETRICS
ATP-fundedVapor-GrownCarbon FiberTechnology
ATP-fundedComposite Production RiserTechnology
ATP-fundedComposite Bridge BeamTechnology
ATP-fundedMachiningTechnology forPultruded Lineals
ATP-fundedCompositeJoining andFittingTechnology
Combined Cash Flow
Estimates of Public Benefits
ATP’s Investment in FocusedProgram of 22 Projects
ATP’sInvestment in Cluster of Five Projects
Note: Solid-line arrows denote high-probability public benefits, currently quantified as cash flow estimates. Broken-line arrows denote potential benefits that are currently more speculative but could, in the future, be quantified as probable cash flow estimates.
The “Cluster Performance Metrics” circle represents the calculation of performancemeasures by comparing combined cash flow benefits to ATP’s investment in thecluster of five projects. The metrics generated for the cluster, net present value (NPV),benefit-to-cost ratio, and internal rate of return (IRR), measure public returns againstpublic investments.
Similarly, the “Program Performance Metrics” circle represents the calculation ofperformance measures by comparing combined cash flow benefits to ATP’sinvestment in a program of 22 projects. The metrics generated for the program, NPV,benefit-to-cost ratio, and IRR measure public returns against public investments inthe focused program. Given that program metrics are derived by comparing cashflow benefits from two projects to a much larger program investment, performancemetrics for the focused program, while still at significant levels, have lower valuesthan metrics for the cluster of five projects.
ECONOMIC ANALYSISThe flow of benefits in Figure 11, from the two cases study projects and from theremaining three projects in the cluster, are directly attributable to the ATP.
Industry partners for the five cluster projects have indicated that, for various reasonsspecific to each high-risk technology project, development programs would not havebeen undertaken without ATP funding. In addition, industry partners for the twoprojects with currently quantifiable cash flow benefits stressed the value of ATP-facilitated industry joint ventures as essential ingredients for successful technicaldevelopment and commercialization.
Base Case Analysis
The base case analysis represents a conservative set of assumptions regardingexpected benefits from ATP-funded technology development.
On the benefit side, combined cash flows from the commercial utilization of twotechnologies for which quantifiable benefits are currently available (VGCF and CPR),covering the period of 2004 to 2026, are used to characterize both cluster andprogram performance, as summarized in Table 9. Combined cash flow estimatesreflect the following assumptions:
• VGCF utilization in the automotive industry starting in 2006 and continuing for aperiod of 16 years until 2021 (estimates developed in Section 3).
• CPR utilization in Gulf of Mexico offshore oil platforms starting in 2004 andcontinuing for a period of 23 years until 2026 (estimates developed in Section 4).
On the cost side, ATP invested $9.4 million and industry partners invested $7.8million in the cluster of five projects. To fund the 22-project focused program, the
56 COMPOSITES MANUFACTURING TECHNOLOGIES
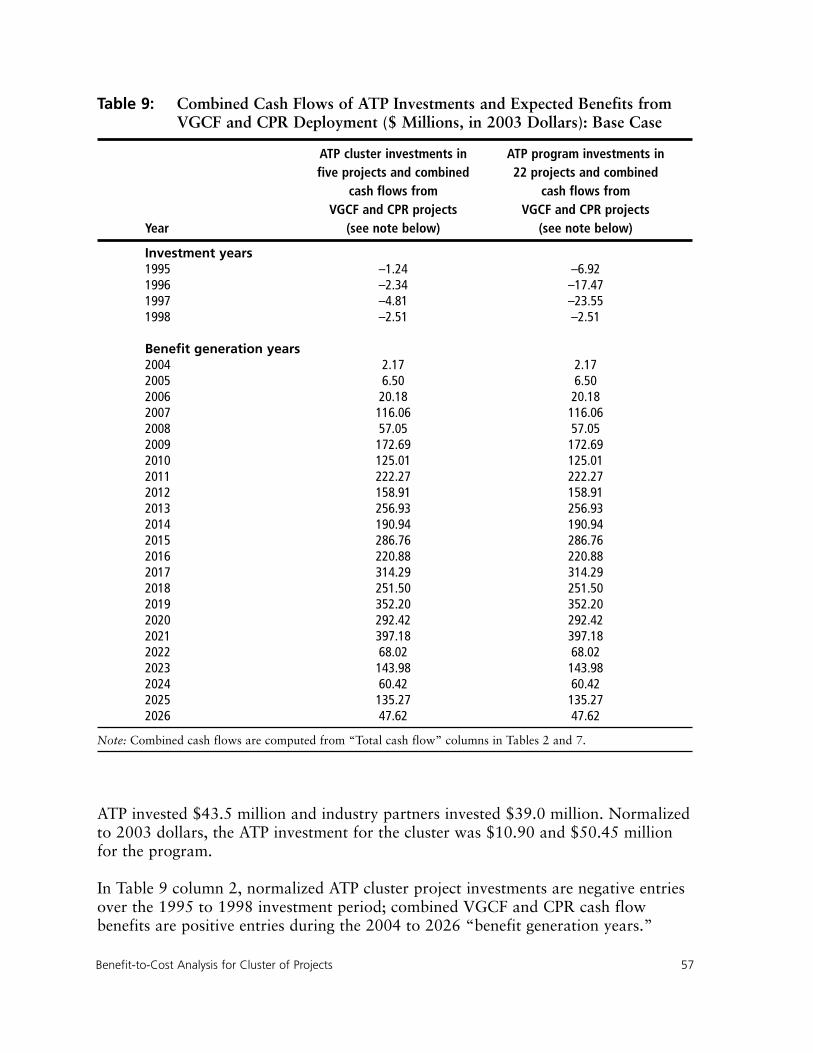
ATP invested $43.5 million and industry partners invested $39.0 million. Normalizedto 2003 dollars, the ATP investment for the cluster was $10.90 and $50.45 millionfor the program.
In Table 9 column 2, normalized ATP cluster project investments are negative entriesover the 1995 to 1998 investment period; combined VGCF and CPR cash flowbenefits are positive entries during the 2004 to 2026 “benefit generation years.”
Benefit-to-Cost Analysis for Cluster of Projects 57
Table 9: Combined Cash Flows of ATP Investments and Expected Benefits fromVGCF and CPR Deployment ($ Millions, in 2003 Dollars): Base Case
ATP cluster investments in ATP program investments in five projects and combined 22 projects and combined
cash flows from cash flows fromVGCF and CPR projects VGCF and CPR projects
Year (see note below) (see note below)
Investment years1995 –1.24 –6.921996 –2.34 –17.471997 –4.81 –23.551998 –2.51 –2.51
Benefit generation years2004 2.17 2.172005 6.50 6.502006 20.18 20.182007 116.06 116.062008 57.05 57.052009 172.69 172.692010 125.01 125.012011 222.27 222.272012 158.91 158.912013 256.93 256.932014 190.94 190.942015 286.76 286.762016 220.88 220.882017 314.29 314.292018 251.50 251.502019 352.20 352.202020 292.42 292.422021 397.18 397.182022 68.02 68.022023 143.98 143.982024 60.42 60.422025 135.27 135.272026 47.62 47.62
Note: Combined cash flows are computed from “Total cash flow” columns in Tables 2 and 7.
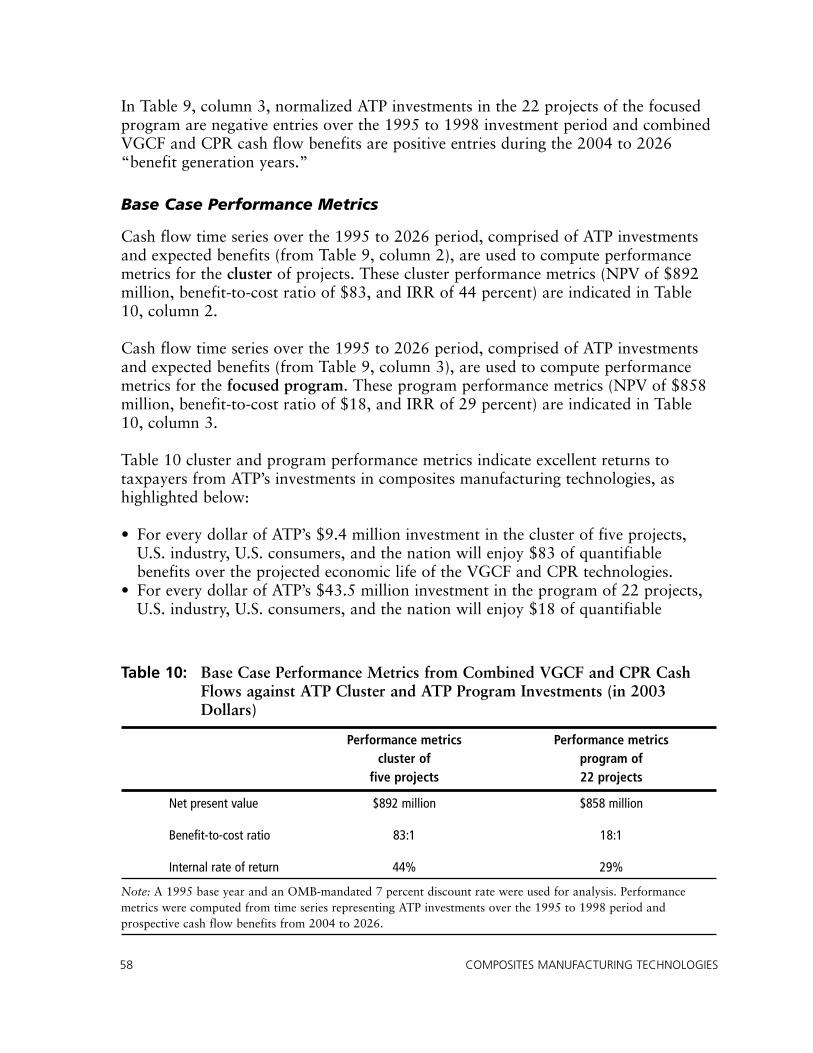
In Table 9, column 3, normalized ATP investments in the 22 projects of the focusedprogram are negative entries over the 1995 to 1998 investment period and combinedVGCF and CPR cash flow benefits are positive entries during the 2004 to 2026“benefit generation years.”
Base Case Performance Metrics
Cash flow time series over the 1995 to 2026 period, comprised of ATP investmentsand expected benefits (from Table 9, column 2), are used to compute performancemetrics for the cluster of projects. These cluster performance metrics (NPV of $892million, benefit-to-cost ratio of $83, and IRR of 44 percent) are indicated in Table10, column 2.
Cash flow time series over the 1995 to 2026 period, comprised of ATP investmentsand expected benefits (from Table 9, column 3), are used to compute performancemetrics for the focused program. These program performance metrics (NPV of $858million, benefit-to-cost ratio of $18, and IRR of 29 percent) are indicated in Table10, column 3.
Table 10 cluster and program performance metrics indicate excellent returns totaxpayers from ATP’s investments in composites manufacturing technologies, ashighlighted below:
• For every dollar of ATP’s $9.4 million investment in the cluster of five projects,U.S. industry, U.S. consumers, and the nation will enjoy $83 of quantifiablebenefits over the projected economic life of the VGCF and CPR technologies.
• For every dollar of ATP’s $43.5 million investment in the program of 22 projects,U.S. industry, U.S. consumers, and the nation will enjoy $18 of quantifiable
58 COMPOSITES MANUFACTURING TECHNOLOGIES
Table 10: Base Case Performance Metrics from Combined VGCF and CPR CashFlows against ATP Cluster and ATP Program Investments (in 2003Dollars)
Performance metrics Performance metricscluster of program of
five projects 22 projects
Net present value $892 million $858 million
Benefit-to-cost ratio 83:1 18:1
Internal rate of return 44% 29%
Note: A 1995 base year and an OMB-mandated 7 percent discount rate were used for analysis. Performancemetrics were computed from time series representing ATP investments over the 1995 to 1998 period andprospective cash flow benefits from 2004 to 2026.
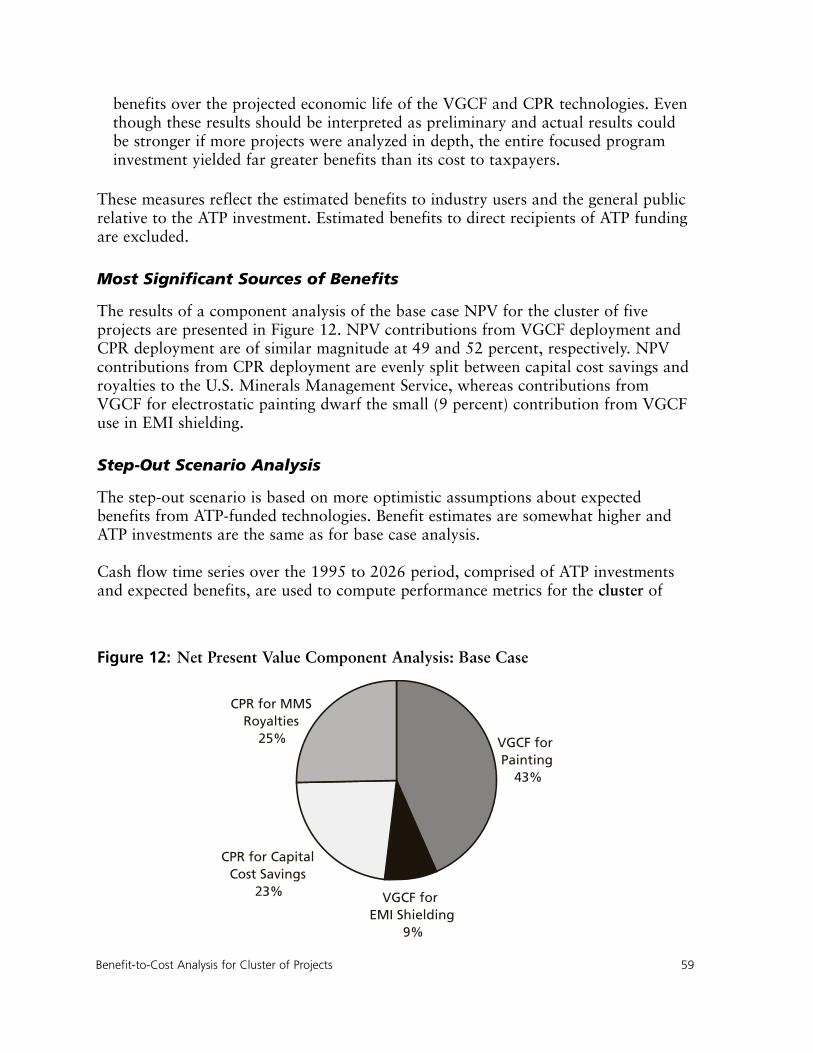
benefits over the projected economic life of the VGCF and CPR technologies. Eventhough these results should be interpreted as preliminary and actual results couldbe stronger if more projects were analyzed in depth, the entire focused programinvestment yielded far greater benefits than its cost to taxpayers.
These measures reflect the estimated benefits to industry users and the general publicrelative to the ATP investment. Estimated benefits to direct recipients of ATP fundingare excluded.
Most Significant Sources of Benefits
The results of a component analysis of the base case NPV for the cluster of fiveprojects are presented in Figure 12. NPV contributions from VGCF deployment andCPR deployment are of similar magnitude at 49 and 52 percent, respectively. NPVcontributions from CPR deployment are evenly split between capital cost savings androyalties to the U.S. Minerals Management Service, whereas contributions fromVGCF for electrostatic painting dwarf the small (9 percent) contribution from VGCFuse in EMI shielding.
Step-Out Scenario Analysis
The step-out scenario is based on more optimistic assumptions about expectedbenefits from ATP-funded technologies. Benefit estimates are somewhat higher andATP investments are the same as for base case analysis.
Cash flow time series over the 1995 to 2026 period, comprised of ATP investmentsand expected benefits, are used to compute performance metrics for the cluster of
Benefit-to-Cost Analysis for Cluster of Projects 59
Figure 12: Net Present Value Component Analysis: Base Case
VGCF for Painting
43%
VGCF for EMI Shielding
9%
CPR for CapitalCost Savings
23%
CPR for MMSRoyalties
25%
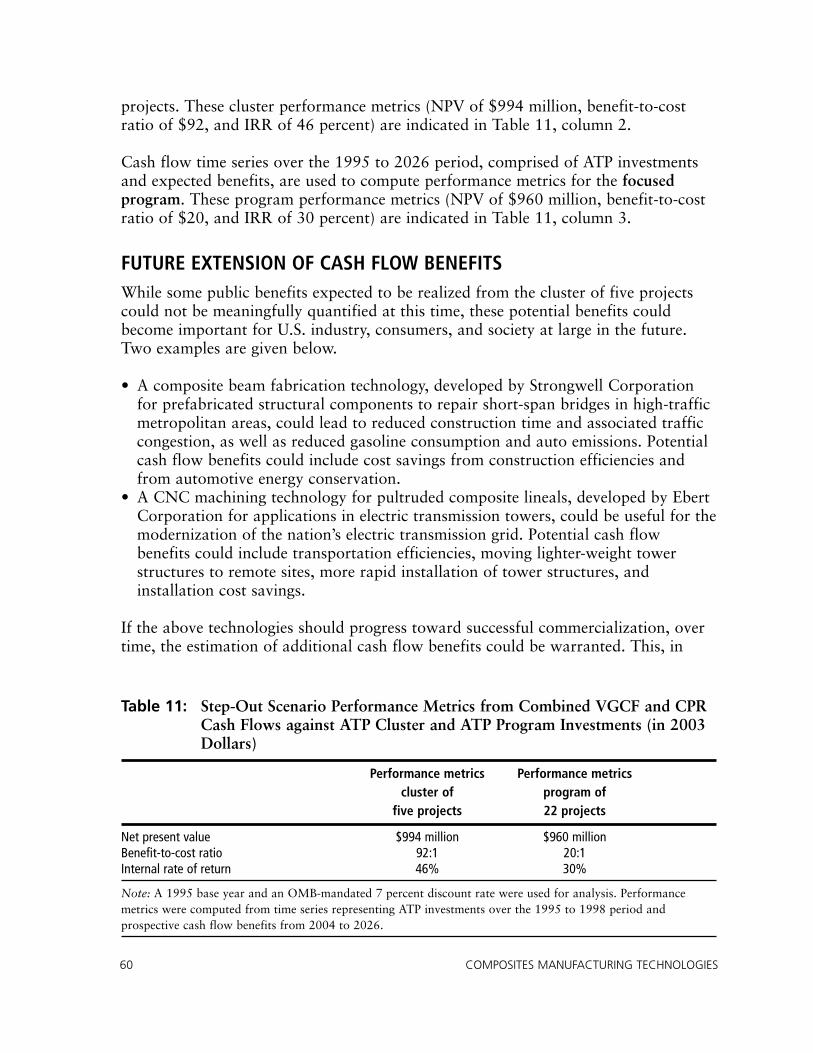
projects. These cluster performance metrics (NPV of $994 million, benefit-to-costratio of $92, and IRR of 46 percent) are indicated in Table 11, column 2.
Cash flow time series over the 1995 to 2026 period, comprised of ATP investmentsand expected benefits, are used to compute performance metrics for the focusedprogram. These program performance metrics (NPV of $960 million, benefit-to-costratio of $20, and IRR of 30 percent) are indicated in Table 11, column 3.
FUTURE EXTENSION OF CASH FLOW BENEFITSWhile some public benefits expected to be realized from the cluster of five projectscould not be meaningfully quantified at this time, these potential benefits couldbecome important for U.S. industry, consumers, and society at large in the future.Two examples are given below.
• A composite beam fabrication technology, developed by Strongwell Corporationfor prefabricated structural components to repair short-span bridges in high-trafficmetropolitan areas, could lead to reduced construction time and associated trafficcongestion, as well as reduced gasoline consumption and auto emissions. Potentialcash flow benefits could include cost savings from construction efficiencies andfrom automotive energy conservation.
• A CNC machining technology for pultruded composite lineals, developed by EbertCorporation for applications in electric transmission towers, could be useful for themodernization of the nation’s electric transmission grid. Potential cash flowbenefits could include transportation efficiencies, moving lighter-weight towerstructures to remote sites, more rapid installation of tower structures, andinstallation cost savings.
If the above technologies should progress toward successful commercialization, overtime, the estimation of additional cash flow benefits could be warranted. This, in
60 COMPOSITES MANUFACTURING TECHNOLOGIES
Table 11: Step-Out Scenario Performance Metrics from Combined VGCF and CPRCash Flows against ATP Cluster and ATP Program Investments (in 2003Dollars)
Performance metrics Performance metricscluster of program of
five projects 22 projects
Net present value $994 million $960 millionBenefit-to-cost ratio 92:1 20:1Internal rate of return 46% 30%
Note: A 1995 base year and an OMB-mandated 7 percent discount rate were used for analysis. Performancemetrics were computed from time series representing ATP investments over the 1995 to 1998 period andprospective cash flow benefits from 2004 to 2026.

turn, would lead to an upward adjustment of performance metrics presented in thecurrent study.
Given the potential for additional cash flow benefits from future analysis, it is clearthat the levels of performance reported in this study (based on cash flow benefitstreams from only two ATP-funded projects) provide conservative, lower-boundestimates of cluster performance and program performance.
Benefit-to-Cost Analysis for Cluster of Projects 61

The cluster-study approach of focusing on a few, targeted, ATP-funded projects is anefficient methodology for evaluating agency investment in high-risk compositesmanufacturing technologies.
Technology portfolios are complex, interdependent, and responsive to suddenchanges in the research environment such as breakthroughs, new barriers, andcollaboration patterns. Only a subset of agency-funded projects can be expected tosucceed on a commercial basis. Hence, the relevant performance criterion for agencytechnology programs, as for privately funded venture capital portfolios, is not theaverage performance of all investments, but rather the performance of a subset ofsuccessful projects against agency program investment.
Starting in 1994, the Advanced Technology Program undertook a focused program of22 composite manufacturing technology projects to develop these technologies andbenefits:
• Rapid, high-volume, and low-cost composite manufacturing processes.• Affordable, high-performance composites with high strength, lightweight,
appropriate electrical conductivity, and corrosion resistance. • Expanded use of composites in U.S. automotive, offshore oil production, and civil
infrastructure industries.
To evaluate the expected performance of the focused program, a cluster of fiveprojects spanning automotive, offshore oil production, and civil infrastructureapplications were selected for analysis. Within this cluster, two projects were singledout as having the most probable near-term prospects for commercial deployment andfor generating substantial economic benefits: the Vapor-Grown Carbon Fiber (VGCF)project for automotive applications and the Composite Production Riser (CPR)project for offshore oil platforms in the Gulf of Mexico. Detailed case studies wereconducted for the VGCF and CPR projects and higher-level overview studies wereconducted for the remaining three projects in the cluster.
Conclusions 63
7. Conclusions
Cluster analysis points to substantial public returns on ATP’s investment. For everydollar of ATP’s $9 million investment in the cluster of five projects, U.S. industry,consumers, and the nation will enjoy $83 of benefits. For every dollar of ATP’s $43million investment in the 22 projects of the focused program, U.S. industry,consumers, and the nation will enjoy $18 of benefits.
In addition to these quantitative performance metrics, cluster analysis also points tobroad-based qualitative benefits including automotive body quality benefits, energyproduction benefits, reduced harmful environmental emissions, and reducedconstruction-related traffic congestion in metropolitan areas.
Based on extensive fact finding, the cluster study supports the following conclusions:
• Projected public returns and broad-based economic benefits to the U.S. automotive,offshore oil, and civic infrastructure industries have a strong probability of beingrealized.
• ATP’s industry partners would not have developed these high-risk, low-costcomposites manufacturing technologies without ATP support and without ATPfacilitation of broad-based industrial joint ventures.
As the cluster analysis targeted only a few ATP-funded projects deemed to have thegreatest current potential for commercialization and benefit generation, it is likelythat additional ATP-funded composites manufacturing technologies will progresstoward commercialization and benefit society over time. When appropriate,additional cash flow benefits from these remaining technologies can be estimated andthe levels of performance metrics adjusted upward.
64 COMPOSITES MANUFACTURING TECHNOLOGIES
Advanced Technology Program, National Institute of Standards and Technology.2002. Manufacturing Composites Structures Program. Online at:<www.atp.nist.gov/atp/focus/mcs.htm>
American Composites Manufacturing Association. 2002. Technical Resources:Materials for Composites Manufacturing, Reinforcement Materials. Online at: <http://www.cfa-hq.org/resources/>
ASI (Applied Sciences, Inc.). 2002. Pyrograf-III Products: Frequently AskedQuestions. Online at: <www.apsci.com/ppi-faq.html>
———. 2002a. “Commercialization of Carbon Nanofibers” (December). Cedarville,OH.
Banholzer, W., and Adams, B. 2002. “Expanding Markets with Technology andApplication Development.” GE Plastics Technology Leadership Meeting.
Baud, R., et al. 2002. Deepwater Gulf of Mexico 2002: America’s ExpandingFrontier. Washington DC: Minerals Management Service, U.S. Department ofInterior.
Broge, J.L. 2001. “Marketing Modular Plastics.” SAE Automotive EngineeringInternational Online (August). Online at: <http://www.sae.org/automag/material/08-2001/matinn2.htm>
BRG Townsend. 1998. Automotive Bumper Systems. Mt. Olive, NJ: BRG Townsend.
Brown, M. 2000. “Alternatives to Painting Automotive Plastic Parts: A MarketForecast for North America through 2004.” Troy, MI: 3rd InternationalCoatings and Plastics Symposium (June).
References 65
References
Brown, M., and M. Gregus. 2001. “A Market in Transition.” Industrial Paint &Powder (December).
Couch, H. 2003. (National Composites Center.) Interview.
CSM Worldwide. 2001. “Automotive Market Snapshots.” Injection Molding(November). Cannon Communications.
DeLuca, M. 2000. “Composites Shape Up for Risers.” Offshore Engineer (December 1).
Finegan, I, and G. Tibbetts. 2001 “Electrical Conductivity of Vapor-Grown CarbonFiber/Thermoplastic Composites.” Journal of Materials Research16(6):1668–1674.
Fischer, F.J. 1995. “Composite Production Risers for Deepwater OffshoreStructures.” Reveue de L’Institut Francais du Petrole 50(1) (January).
General Motors. 2002. Corporate Responsibility and Sustainability Report2001–2002. Detroit MI.
Gregus, M. 2001. “Painting Automotive Plastics Parts: A Market Forecast for NorthAmerica through 2005.” Chicago, IL: SME Finishing Conference, June.
Hillegeist, P. 2001. “Global Deepwater Forecast on Floating Production.”Alexander’s Oil & Gas Connections 6(10).
Hughes, T.W. 2002. Pyrograf-III Overview Polymer Applications. Cedarville, OH:Applied Sciences Inc.
———. 2003. Correspondence “Review of Draft Technical Discussion.”
Jaffe, A. 1998. “The Importance of Spillover in the Policy Mission of the AdvancedTechnology Program.” Journal of Technology Transfer 23(2):11–19.
Johnson, D.B. 1999. “Rigid Composite Risers for Deepwater Oil Production.”Intertech Second International Conference on the Global Outlook for CarbonFibers 1999. San Antonio, TX.
———. 2000. “Demand for Composites in Deepwater Oil Production.” InternationalConference on the Global Outlook for Carbon Fiber 2000, December. SanAntonio TX.
———. 2003. (Lincoln Composites.) Interview.
66 COMPOSITES MANUFACTURING TECHNOLOGIES
KPMG. 2003. “In the Automotive Industry, Momentum.” KPMG Survey Report3(1).
Krueger, S., et al. 2001. “New Challenges for Microsystem Technology in AutomotiveApplications.” MST News (January). Online at: <www.rgrace.com/Papers/leitartikel_klein%20(1).pdf>
Lake, M.L. 2002. “Production of Carbon Nanofiber from High Sulfur Coal.”National Coal Council Annual Meeting.
———. 2002a. Carbon Nanofiber Production and Applications. Cedarville, OH:Applied Sciences Inc.
Lake, M.L., et al. 2002. Carbon Nanofiber Polymer Composites: Electrical andMechanical Properties. Cedarville, OH: Applied Sciences Inc.
Lytal, J. 2000. “Deepwater Projects.” El Paso Energy Partners. Presentation toAnalysts.
Mansfield E., J. Rapoport, A. Romeo, S. Wagner, and G. Beardsley. 1977. “Socialand Private Rates of Return from Industrial Innovation.” Quarterly Journal ofEconomics 91 (May):221–240.
Mazumdar, S.K. 2002. Composites Manufacturing: Materials, Products, and ProcessEngineering. New York: CRC Press.
McConnell, C., and S. Brue. 1996. Microeconomics: Principles, Problems, andPolicies. Boston: McGraw-Hill Irwin.
MMS (Minerals Management Service), U.S. Department of Interior. 2003. “NewsRelease” (February). Online at: <www.gomr.mms.gov>
———. 2001. “News Release” (April). Online at: <www.gomr.mms.gov>
Office of Automotive Affairs. 2002. The Road Ahead for the Automotive Industry.Washington, DC: International Trade Administration, U.S. Department ofCommerce.
Readinger, T. 2003. “Role of Science and Technology in U.S. Energy Security.”Annual Review and Forecast 44(1).
RTP Engineering Plastics. 2000. “EMI Shielding: Cost Reductions for ElectronicDevice Protection” (January). Winona, MN.
References 67
Ruegg, R., and E. Feller. 2003. A Toolkit for Evaluating Public R&D Investments:Models, Methods, and Findings from ATP’s First Decade. NIST GCR 03-857U.S. Department of Commerce: Washington DC.
Salama, M. 2003. (ConocoPhillips). Interview.
Sawyer, C. 2001. “Speed to Market.” Automotive Design & Production (July).Online at: <http://www.autofieldguide.com/>
———. n.d. “Full Metal Jacket.”Automotive Design and Production. Online at:<http://www.autofieldguide.com/articles/060206.html>
Silverman, B. 1999.“Drilling and Production Risers Business Poised to Grow.” Hart’sE&P Net (November). Online at: <http://www.eandpnet.com/ep/previous/nov99/lightweight.htm>
Silverstein, K. 2002. “Transmission Infrastructure Needs Critical Care.” Science IssueAlert (August 16). Email at: [email protected].
Strong, A.B. 1989. Fundamentals of Composite Manufacturing: Materials, Methods,and Applications. Dearborn, MI: Society of Mechanical Engineers.
Taylor, B.D. 2002 “Rethinking Traffic Congestion.” Access. Institute ofTransportation Studies. October 2002
University of Michigan, Office for the Study of Automotive Transportation. 2001.Delphi X Forecast and Analysis of the North American Automotive Industry.Ann Arbor, MI.
U.S. Energy Information Administration. 2003. Annual Energy Outlook 2003.Washington, DC.
Vasilash, G.S. 2001. “Body Building.” Automotive Design and Production (March).Online at: <http://www.autofieldguide.com/>
Wu, H.F. 2002. “High Risk Composites Research Funded by the NIST AdvancedTechnology Program.” Proceedings of the American Society for Composites17th Technical Conference, Paper # 2060.
68 COMPOSITES MANUFACTURING TECHNOLOGIES
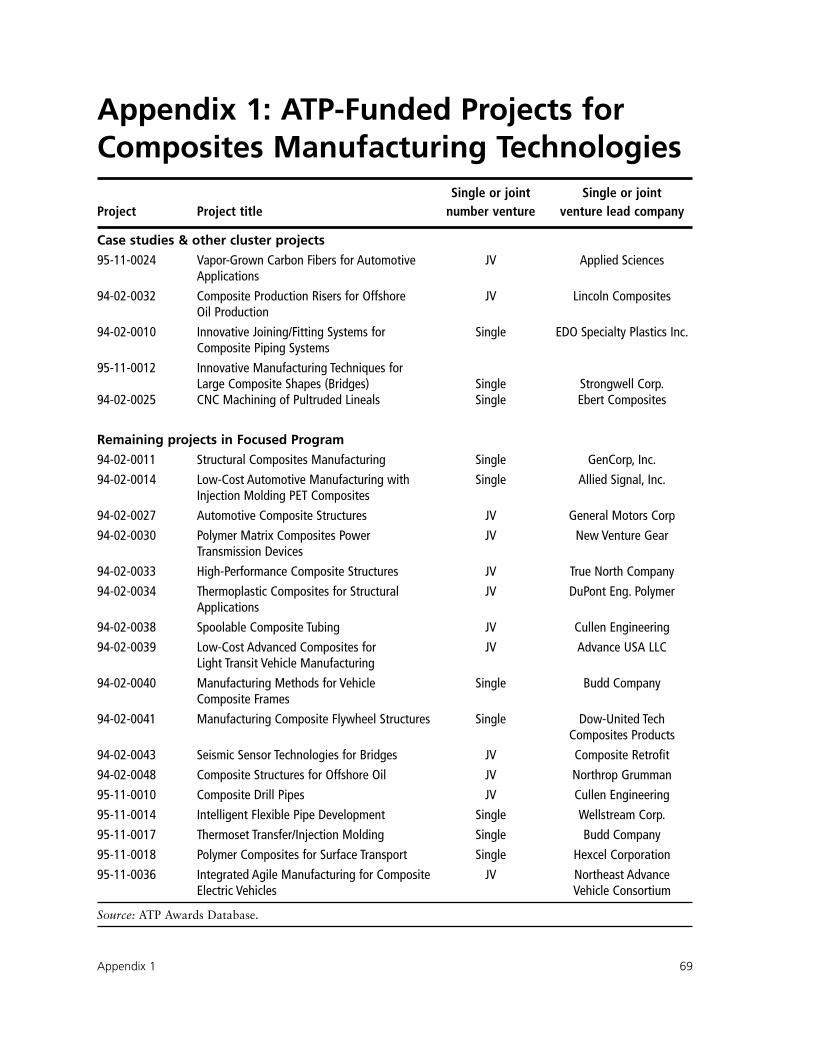
Single or joint Single or joint Project Project title number venture venture lead company
Case studies & other cluster projects
95-11-0024 Vapor-Grown Carbon Fibers for Automotive JV Applied Sciences Applications
94-02-0032 Composite Production Risers for Offshore JV Lincoln CompositesOil Production
94-02-0010 Innovative Joining/Fitting Systems for Single EDO Specialty Plastics Inc.Composite Piping Systems
95-11-0012 Innovative Manufacturing Techniques for Large Composite Shapes (Bridges) Single Strongwell Corp.
94-02-0025 CNC Machining of Pultruded Lineals Single Ebert Composites
Remaining projects in Focused Program
94-02-0011 Structural Composites Manufacturing Single GenCorp, Inc.
94-02-0014 Low-Cost Automotive Manufacturing with Single Allied Signal, Inc.Injection Molding PET Composites
94-02-0027 Automotive Composite Structures JV General Motors Corp
94-02-0030 Polymer Matrix Composites Power JV New Venture GearTransmission Devices
94-02-0033 High-Performance Composite Structures JV True North Company
94-02-0034 Thermoplastic Composites for Structural JV DuPont Eng. PolymerApplications
94-02-0038 Spoolable Composite Tubing JV Cullen Engineering
94-02-0039 Low-Cost Advanced Composites for JV Advance USA LLCLight Transit Vehicle Manufacturing
94-02-0040 Manufacturing Methods for Vehicle Single Budd CompanyComposite Frames
94-02-0041 Manufacturing Composite Flywheel Structures Single Dow-United TechComposites Products
94-02-0043 Seismic Sensor Technologies for Bridges JV Composite Retrofit
94-02-0048 Composite Structures for Offshore Oil JV Northrop Grumman
95-11-0010 Composite Drill Pipes JV Cullen Engineering
95-11-0014 Intelligent Flexible Pipe Development Single Wellstream Corp.
95-11-0017 Thermoset Transfer/Injection Molding Single Budd Company
95-11-0018 Polymer Composites for Surface Transport Single Hexcel Corporation
95-11-0036 Integrated Agile Manufacturing for Composite JV Northeast AdvanceElectric Vehicles Vehicle Consortium
Source: ATP Awards Database.
Appendix 1 69
Appendix 1: ATP-Funded Projects forComposites Manufacturing Technologies
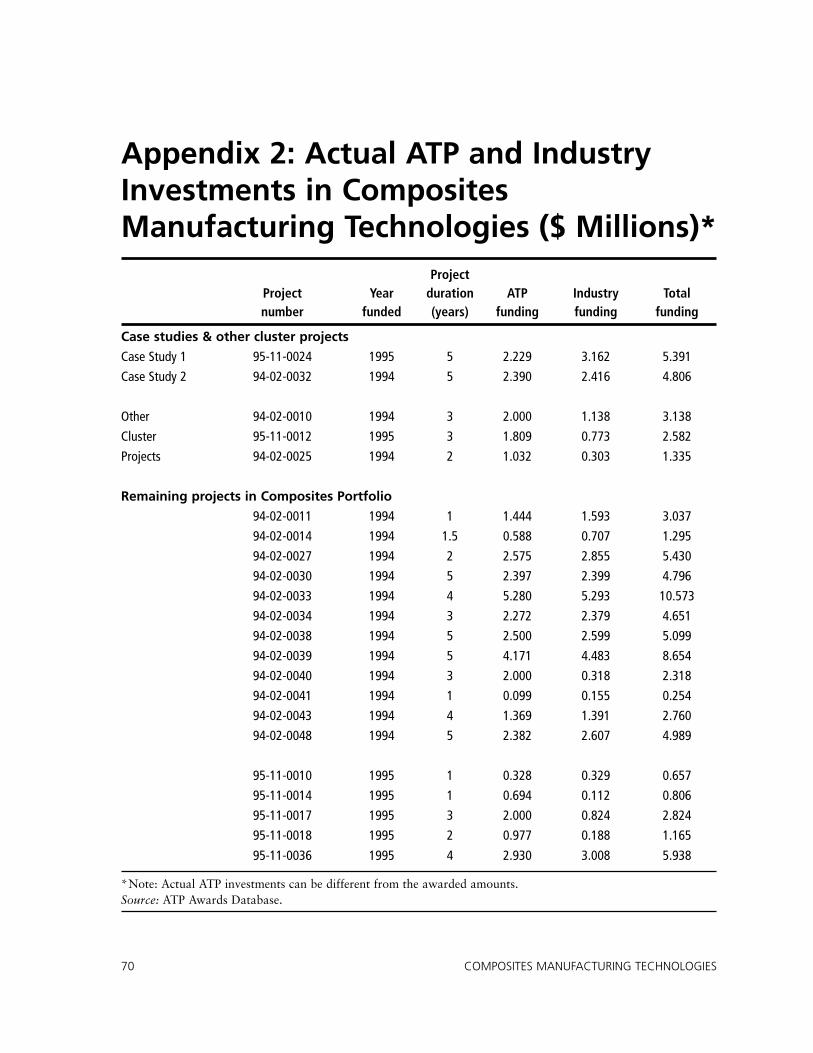
Project Project Year duration ATP Industry Totalnumber funded (years) funding funding funding
Case studies & other cluster projects
Case Study 1 95-11-0024 1995 5 2.229 3.162 5.391
Case Study 2 94-02-0032 1994 5 2.390 2.416 4.806
Other 94-02-0010 1994 3 2.000 1.138 3.138
Cluster 95-11-0012 1995 3 1.809 0.773 2.582
Projects 94-02-0025 1994 2 1.032 0.303 1.335
Remaining projects in Composites Portfolio
94-02-0011 1994 1 1.444 1.593 3.037
94-02-0014 1994 1.5 0.588 0.707 1.295
94-02-0027 1994 2 2.575 2.855 5.430
94-02-0030 1994 5 2.397 2.399 4.796
94-02-0033 1994 4 5.280 5.293 10.573
94-02-0034 1994 3 2.272 2.379 4.651
94-02-0038 1994 5 2.500 2.599 5.099
94-02-0039 1994 5 4.171 4.483 8.654
94-02-0040 1994 3 2.000 0.318 2.318
94-02-0041 1994 1 0.099 0.155 0.254
94-02-0043 1994 4 1.369 1.391 2.760
94-02-0048 1994 5 2.382 2.607 4.989
95-11-0010 1995 1 0.328 0.329 0.657
95-11-0014 1995 1 0.694 0.112 0.806
95-11-0017 1995 3 2.000 0.824 2.824
95-11-0018 1995 2 0.977 0.188 1.165
95-11-0036 1995 4 2.930 3.008 5.938
*Note: Actual ATP investments can be different from the awarded amounts.Source: ATP Awards Database.
70 COMPOSITES MANUFACTURING TECHNOLOGIES
Appendix 2: Actual ATP and IndustryInvestments in CompositesManufacturing Technologies ($ Millions)*
Engineers can utilize over 50,000 materials for the design and manufacture ofengineered products. These materials, depending on their mechanical and physicalcharacteristics such as strength, stiffness, density, melting temperature, andconductivity, can be divided into four main categories: metals, plastics, ceramics, andcomposites.
While metals and plastics are currently the dominant materials for engineeringapplications, there has been an increasing utilization of composite materials,reflecting their superior performance characteristics. The key factor holding backadditional increases in composite utilization has been the high cost of composites.
Composites are systems composed of at least two distinctly dissimilar materials,acting in concert. The properties of the polymeric composite system are notattainable by individual components acting alone. Engineered composites can bedefined as systems of reinforcing fibrous materials in a polymer matrix binder.
The reinforcing fiber provides strength and stiffness to the composite. The matrixmaterial binds the fibers together, provides form and rigidity, transfers the load to thefibers, and protects the load-bearing fiber from corrosion and wear. For compositesin structural applications, continuous or long-fiber configurations are typical,whereas for nonstructural applications, short fibers can be used (Figure A3-1).
Common composite reinforcing fibers include glass fibers and carbon/graphite fibers.For specialized applications, boron and aramid (Kevlar) fibers can also be used.General fiber properties are described below:
• Kevlar fibers are organic fibers which have high strength and stiffness which ispossible in fully aligned polymers. Kevlar fibers have a very low resistance tofailure under axial compression.
Appendix 3 71
Appendix 3: Composite Materials forEngineered Products
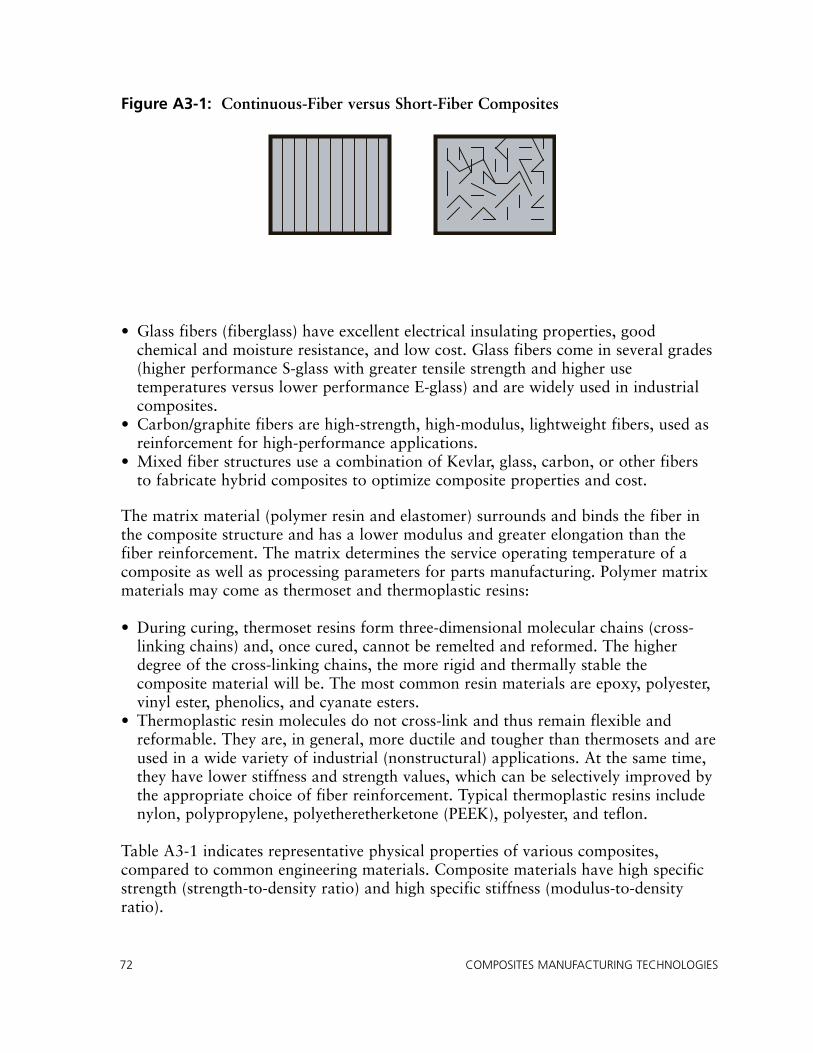
• Glass fibers (fiberglass) have excellent electrical insulating properties, goodchemical and moisture resistance, and low cost. Glass fibers come in several grades(higher performance S-glass with greater tensile strength and higher usetemperatures versus lower performance E-glass) and are widely used in industrialcomposites.
• Carbon/graphite fibers are high-strength, high-modulus, lightweight fibers, used asreinforcement for high-performance applications.
• Mixed fiber structures use a combination of Kevlar, glass, carbon, or other fibersto fabricate hybrid composites to optimize composite properties and cost.
The matrix material (polymer resin and elastomer) surrounds and binds the fiber inthe composite structure and has a lower modulus and greater elongation than thefiber reinforcement. The matrix determines the service operating temperature of acomposite as well as processing parameters for parts manufacturing. Polymer matrixmaterials may come as thermoset and thermoplastic resins:
• During curing, thermoset resins form three-dimensional molecular chains (cross-linking chains) and, once cured, cannot be remelted and reformed. The higherdegree of the cross-linking chains, the more rigid and thermally stable thecomposite material will be. The most common resin materials are epoxy, polyester,vinyl ester, phenolics, and cyanate esters.
• Thermoplastic resin molecules do not cross-link and thus remain flexible andreformable. They are, in general, more ductile and tougher than thermosets and areused in a wide variety of industrial (nonstructural) applications. At the same time,they have lower stiffness and strength values, which can be selectively improved bythe appropriate choice of fiber reinforcement. Typical thermoplastic resins includenylon, polypropylene, polyetheretherketone (PEEK), polyester, and teflon.
Table A3-1 indicates representative physical properties of various composites,compared to common engineering materials. Composite materials have high specificstrength (strength-to-density ratio) and high specific stiffness (modulus-to-densityratio).
72 COMPOSITES MANUFACTURING TECHNOLOGIES
Figure A3-1: Continuous-Fiber versus Short-Fiber Composites
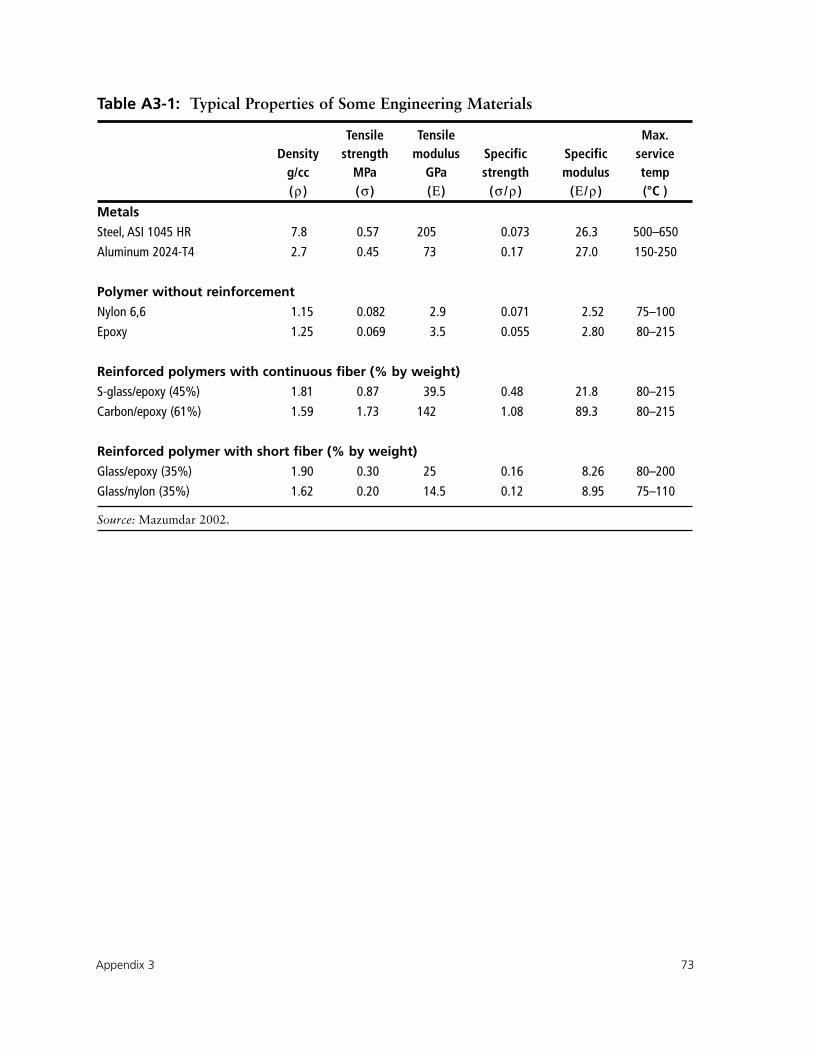
Table A3-1: Typical Properties of Some Engineering Materials
Tensile Tensile Max.Density strength modulus Specific Specific service
g/cc MPa GPa strength modulus temp(ρ ) (σ ) (Ε ) (σ /ρ ) (Ε /ρ ) (°C )
Metals
Steel, ASI 1045 HR 7.8 0.57 205 0.073 26.3 500–650
Aluminum 2024-T4 2.7 0.45 73 0.17 27.0 150-250
Polymer without reinforcement
Nylon 6,6 1.15 0.082 2.9 0.071 2.52 75–100
Epoxy 1.25 0.069 3.5 0.055 2.80 80–215
Reinforced polymers with continuous fiber (% by weight)
S-glass/epoxy (45%) 1.81 0.87 39.5 0.48 21.8 80–215
Carbon/epoxy (61%) 1.59 1.73 142 1.08 89.3 80–215
Reinforced polymer with short fiber (% by weight)
Glass/epoxy (35%) 1.90 0.30 25 0.16 8.26 80–200
Glass/nylon (35%) 1.62 0.20 14.5 0.12 8.95 75–110
Source: Mazumdar 2002.
Appendix 3 73
About the Advanced Technology Program
The Advanced Technology Program (ATP) is a partnership between government and private industryto conduct high-risk research to develop enabling technologies that promise significant commercialpayoffs and widespread benefits for the economy. ATP provides a mechanism for industry to extend itstechnological reach and push the envelope beyond what it otherwise would attempt.
Promising future technologies are the domain of ATP:
• Enabling technologies that are essential to the development of future new and substantiallyimproved projects, processes, and services across diverse application areas.
• Technologies for which there are challenging technical issues standing in the way of success.
• Technologies whose development often involves complex “systems” problems requiring acollaborative effort by multiple organizations.
• Technologies which will go undeveloped and/or proceed too slowly to be competitive in globalmarkets without ATP.
ATP funds technical research, but it does not fund product development. That is the domain of thecompany partners. ATP is industry driven, and that keeps it grounded in real-world needs. For-profitcompanies conceive, propose, cofund, and execute all of the projects cost shared by ATP.
Smaller companies working on single-firm projects pay a minimum of all the indirect costs associatedwith the project. Large “Fortune 500” companies participating as a single firm pay at least 60 percentof total project costs. Joint ventures pay at least half of total project costs. Single-firm projects can lastup to three years; joint ventures can last as long as five years. Companies of all sizes participate inATP-funded projects. To date, two out of three ATP awards have gone to individual small businessesor to joint ventures led by a small business.
Each project has specific goals, funding allocations, and completion dates established at the outset.Projects are monitored and can be terminated for cause before completion. All projects are selected inrigorous competitions that are peer reviewed to identify those that score highest against technical andeconomic criteria. Contact the ATP for more information:
• On the World Wide Web: http://www.atp.nist.gov.
• By e-mail: [email protected].
• By phone: 1-800-ATP-FUND (1-800-287-3863).
• By writing: Advanced Technology Program, National Institute of Standards and Technology, 100 Bureau Drive, Stop 4701, Gaithersburg, MD 20899-4701.
About the Author
Dr. Thomas Pelsoci is the managing director of Delta Research Co., specializing in the economicassessment of new technologies and manufacturing processes, including prospective economic impactstudies during early-stage “proof of concept” and later-stage demonstration phases.
His industrial experience includes positions as R&D engineer at TRW and management consultant inthe high technology practice of BearingPoint (KPMG Peat Marwick Management Consultants).Subsequently, Dr. Pelsoci held senior banking positions at First National Bank of Chicago and atSanwa Bank, specializing in financing high-risk technology projects. He received a degree inMechanical Engineering from Case Western Reserve University and a Ph.D. in Public Policy &Administration from the University of Minnesota.