Embed Size (px)
Citation preview
Comprehensive Traffic and
Transportation Plan for Mysore
Final Report – Volume 2
(Supporting Documents)
2012
ICRA Management
Consulting
Services Limited
Directorate of Urban
Land Transport
Comprehensive Traffic and Transportation Plan – Mysore, Karnataka, India
Final Report – Volume 2 P a g e | ii
Table of Contents
Chapter 1 Data Collection and Analysis ........................................................................................ 1
1.1 Classified Traffic Volume Count .......................................................................................... 2
1.2 Household Survey ............................................................................................................ 19
1.3 Origin Destination Survey ................................................................................................. 27
1.4 Pedestrian Count ............................................................................................................. 31
1.5 Public Transport Survey .................................................................................................... 34
1.6 Road Inventory................................................................................................................. 46
1.7 Floating Population Survey ............................................................................................... 56
1.8 Work Place Survey ........................................................................................................... 59
1.9 Speed Delay Survey .......................................................................................................... 61
1.10 Parking Survey ................................................................................................................. 68
1.11 Road Accidents................................................................................................................. 74
1.12 Intermediate Public Transport Survey .............................................................................. 76
1.13 Goods Terminal Survey .................................................................................................... 78
1.14 Railway Terminal .............................................................................................................. 81
1.15 Air Terminal Survey .......................................................................................................... 81
1.16 SWOT Analysis ................................................................................................................. 82
1.17 Transportation Issues ....................................................................................................... 83
Chapter 2 Travel Demand Forecast ............................................................................................. 86
2.1 Introduction ..................................................................................................................... 86
2.2 Methodology of Model Development............................................................................... 88
2.3 Zonal Trip Generation Model (At Gross Level) .................................................................. 89
2.4 Trip Attraction .................................................................................................................. 95
2.5 Base Year Network Development ..................................................................................... 98
2.6 Trip Distribution ............................................................................................................. 100
2.7 Modal Split Modelling .................................................................................................... 105
2.8 Calibration and Validation of Traffic Assignment Models ................................................ 108
2.9 Conclusions .................................................................................................................... 114
Chapter 3 Transport Improvement Strategies ...................................................................... 115
3.1 Introduction ................................................................................................................... 115
3.2 Land-use and Transport Strategy .................................................................................... 117
3.3 Mobility Corridors .......................................................................................................... 121
3.4 Public Transit Improvement Strategy.............................................................................. 123
3.5 Intermodal Integration ................................................................................................... 128
3.6 Non – motorized Transport Strategy .............................................................................. 128
3.7 Road Safety Awareness Programme ............................................................................... 131
Comprehensive Traffic and Transportation Plan – Mysore, Karnataka, India
Final Report – Volume 2 P a g e | iii
3.8 Freight Management Strategy ........................................................................................ 131
3.9 Traffic Management Strategies ...................................................................................... 132
3.10 Travel Demand Management Strategy ........................................................................... 141
Chapter 4 Alternate Development Scenarios and their Evaluation ................................. 145
4.1 Scenario 1 – Do Nothing Scenario ................................................................................... 145
4.2 Scenario 2 - Evaluation of CDP, Projects under implementation/ proposed .................... 150
4.3 Scenario 3: Construction of Outer Ring Road and Public Transport Route Rationalization 169
4.4 Evaluation of Scenario’s ................................................................................................. 181
4.5 Recommended Scenario................................................................................................. 181
Comprehensive Traffic and Transportation Plan – Mysore, Karnataka, India
Final Report – Volume 2 P a g e | iv
List of Figures
Figure 1.1 Traffic Composition at Midblock Locations ........................................................................ 5
Figure 1.2 Daily Traffic Variations at Mid Block Survey Locations ....................................................... 6
Figure 1.3 Traffic Composition at Screen Line Locations ..................................................................... 8
Figure 1.4 Hourly Traffic Variation Screen Line Locations ................................................................... 9
Figure 1.5 Daily Variation of Traffic Composition at Screen line Survey Locations............................... 9
Figure 1.6 Traffic Composition at Outer Cordon Locations ............................................................... 11
Figure 1.7 Weekly Variation of Traffic at Outer Cordon Locations .................................................... 12
Figure 1.8 Daily Variation of Traffic Composition at Outer Cordon Locations.................................... 13
Figure 1.9 Traffic Composition & Junction Flow Diagram – Balal Circle ............................................. 15
Figure 1.10 Traffic Composition & Junction Flow Diagram – HD Kote - ORR Intersection .................. 15
Figure 1.11 Traffic Composition & Junction Flow Diagram – JLB Road – ORR Intersection ................ 16
Figure 1.12 Traffic Composition & Junction Flow Diagram – K R Circle ............................................. 16
Figure 1.13 Traffic Composition & Junction Flow Diagram – Mahadevpura Road ............................. 17
Figure 1.14 Traffic Composition & Junction Flow Diagram – Pulkeshi – Shivaji Road Intersection ..... 17
Figure 1.15 Traffic Composition & Junction Flow Diagram – Ram Vilas – Sayyaji Rao Road Intersection
........................................................................................................................................................ 18
Figure 1.16 Traffic Composition & Junction Flow Diagram – Srinivasan Circle ................................... 18
Figure 1.17 Traffic Composition & Junction Flow Diagram – Vishvamanava Double Road Intersection
........................................................................................................................................................ 19
Figure 1.18 Distribution of Households by Income ........................................................................... 24
Figure 1.19 Trip Distribution by Purpose .......................................................................................... 25
Figure 1.20 Modal Split with and without Walk Trips ....................................................................... 26
Figure 1.21 Purpose Wise Trip Length Distribution .......................................................................... 26
Figure 1.22 Trip Distribution by Purpose .......................................................................................... 30
Figure 1.23 Mode Wise Average Trip Length .................................................................................... 30
Figure 1.24 Lack of Pedestrian Facilities at K R Circle (L) and Sayyaji Rao Road ................................. 32
Figure 1.25 Unorganized pedestrian movement at City Bus Stand, Church Road, Devraj Urs Road ... 33
Figure 1.26 Unorganized pedestrian movement at K R Circle, Sayaji Rao Road and Devraj Urs Road 33
Figure 1.27 Location of Bus Terminals.............................................................................................. 35
Figure 1.28 Entry Gate at City Bus Terminal (L), Exit Gate at City Bus Terminal ................................. 36
Figure 1.29 Terminal Layout ............................................................................................................ 36
Figure 1.30 Pedestrian Vehicular Conflict at City Bus Terminal ......................................................... 37
Figure 1.31 Issues observed at City Bus Terminal ............................................................................. 37
Figure 1.32 Pedestrian Movement Areas – Sub urban Bus Terminal ................................................. 37
Figure 1.33 Three Wheeler Parking .................................................................................................. 38
Comprehensive Traffic and Transportation Plan – Mysore, Karnataka, India
Final Report – Volume 2 P a g e | v
Figure 1.34 Pedestrian conflict points at the Terminal ..................................................................... 38
Figure 1.35 Traffic Conflict ............................................................................................................... 39
Figure 1.36 Private Bus Terminal (L), Private Bus Terminal Layout .................................................... 39
Figure 1.37 Public Transport Operational Characteristics ................................................................. 40
Figure 1.38 Desire Line Diagram for Intercity Travel ......................................................................... 42
Figure 1.39 Regional Connectivity Public Transport Coverage Map .................................................. 43
Figure 1.40 Zone wise Population V/ s Public Transport Demand ..................................................... 44
Figure 1.41 Public Transport Assignment ......................................................................................... 44
Figure 1.42 Road Network Distribution by ROW .............................................................................. 48
Figure 1.43 Road Network Distribution By C/W Width ..................................................................... 49
Figure 1.44 Cross section of Devrajurs Road (a), Dhanvantri road (b), Ashoka road (c), Sayyaji Rao
road(d) in Mysore. ........................................................................................................................... 51
Figure 1.45 Devraj Urs Road, Ashoka Road (R) ................................................................................. 52
Figure 1.46 K R Circle, Gandhi Square .............................................................................................. 55
Figure 1.47 Existing Layout of Harding Circle.................................................................................... 56
Figure 1.48 Existing Layout of KR Circle ............................................................................................ 56
Figure 1.49 Purpose Wise Distribution of Floating Population Trips ................................................. 57
Figure 1.50 Major Tourist Locations, Mysore ................................................................................... 58
Figure 1.51 Mode Wise Distribution of Intra City Travel of Floating Population ................................ 59
Figure 1.52 Major Workplace Locations ........................................................................................... 60
Figure 1.53 Car pooling attitude with and without car pooling attitude ........................................... 61
Figure 1.54 Average Journey Speeds on Major Roads ...................................................................... 63
Figure 1.55 Speed Bands.................................................................................................................. 65
Figure 1.56 Speed Distance Curve along Major Corridors in Mysore ................................................ 67
Figure 1.57 Parking Survey Locations ............................................................................................... 69
Figure 1.58 Parking Composition during Peak hours ........................................................................ 71
Figure 1.59 On – Street Parking at Old Clock Tower ......................................................................... 73
Figure 1.60 Areas of Higher Accident Numbers ................................................................................ 74
Figure 1.61 Road Safety Statistics .................................................................................................... 75
Figure 1.62 Analysis of accident statistics ........................................................................................ 76
Figure 1.63 Average Travel Time, Travel Distance and Travel Cost ................................................... 77
Figure 1.64 Purpose wise distribution of Trips ................................................................................. 77
Figure 1.65 Desire Line Diagram of IPT Travel in the City .................................................................. 78
Figure 1.66 Frequency Wise Distribution of Trips Figure (L), Goods Wise Distribution of Trips.......... 79
Figure 1.67 Desire Line Diagram of Goods Movement in the City ..................................................... 80
Figure 1.68 Railway Terminal at Mysore .......................................................................................... 81
Comprehensive Traffic and Transportation Plan – Mysore, Karnataka, India
Final Report – Volume 2 P a g e | vi
Figure 2.1 Analytical Framework towards Model Built Up ................................................................ 86
Figure 2.2 Development of the UTPS Model .................................................................................... 88
Figure 2.3 Correlation Matrix (Trip Production) ............................................................................... 90
Figure 2.4 Scatter Diagram for Trip Generation - Population ............................................................ 91
Figure 2.5 Scatter Diagram for Trip Generation – Population and No. of Households ....................... 91
Figure 2.6 Scatter Plot for Work and Non – Work Trips .................................................................... 95
Figure 2.7 Correlation Matrix (Trip Attraction) ................................................................................. 95
Figure 2.8 Scatter Plot for Work Trips Attracted............................................................................... 97
Figure 2.9 Mysore Base Road Network ............................................................................................ 98
Figure 2.10 Road Node and Centroid and their Connectors .............................................................. 99
Figure 2.11 Process of Trip Distribution ......................................................................................... 101
Figure 2.12 Cumulative TLFD ......................................................................................................... 104
Figure 2.13 Process of Modal Split ................................................................................................. 105
Figure 2.14 Travel Desire Lines ...................................................................................................... 110
Figure 2.15 Assignment Results (Gross Level) ................................................................................ 111
Figure 2.16 SATURN Assignment .................................................................................................... 111
Figure 2.17 Peak Hour Assignment ................................................................................................ 113
Figure 2.18 Major Corridors ........................................................................................................... 113
Figure 3.1 Roads proposed to be developed around the palace ..................................................... 118
Figure 3.2 Typical Road Section – Stretch 1 .................................................................................... 119
Figure 3.3 Typical Road Section – Stretch 2 .................................................................................... 119
Figure 3.4 Typical Road Section – Stretch 3 .................................................................................... 120
Figure 3.5 Typical Road Section – Stretch 4 .................................................................................... 120
Figure 3.6 Traffic Conflict ............................................................................................................... 126
Figure 3.7 Conceptual Plan ............................................................................................................ 126
Figure 3.8 Conceptual Plan ............................................................................................................ 127
Figure 3.9 Proposed Pedestrian Facilities ....................................................................................... 127
Figure 3.10 Pedestrian Crossing Design.......................................................................................... 130
Figure 3.11 Harding Circle – Proposed Layout ................................................................................ 134
Figure 3.12 K R Circle – Proposed Layout ....................................................................................... 135
Figure 3.13 Entrance to the Subway .............................................................................................. 135
Figure 4.1 V/C Ratio - 2018 ............................................................................................................ 146
Figure 4.2 V/C Ratio – 2023 ........................................................................................................... 147
Figure 4.3 V/C Ratio - 2028 ............................................................................................................ 148
Figure 4.4 V / C 2018 ..................................................................................................................... 155
Comprehensive Traffic and Transportation Plan – Mysore, Karnataka, India
Final Report – Volume 2 P a g e | vii
Figure 4.5 V/C Ratio - 2023 ............................................................................................................ 156
Figure 4.6 V/C Ratio – 2028 ........................................................................................................... 157
Figure 4.7 Public – 2018 ................................................................................................................. 163
Figure 4.8 Public – 2023 ................................................................................................................. 164
Figure 4.9 Public – 2028 ................................................................................................................. 165
Figure 4.10 Private 2018 ................................................................................................................ 166
Figure 4.11 Private 2023 ................................................................................................................ 167
Figure 4.12 Private 2028 ................................................................................................................ 168
Figure 4.13 Total Trips 2018 .......................................................................................................... 170
Figure 4.14 Total Trips 2023 .......................................................................................................... 171
Figure 4.15 Total Trips 2028 .......................................................................................................... 172
Figure 4.16 Private 2018 ................................................................................................................ 174
Figure 4.17 Private 2023 ................................................................................................................ 175
Figure 4.18 Private 2028 ................................................................................................................ 176
Figure 4.19 Public 2018 ................................................................................................................. 177
Figure 4.20 Public 2023 ................................................................................................................. 178
Figure 4.21 Public 2028 ................................................................................................................. 179
Comprehensive Traffic and Transportation Plan – Mysore, Karnataka, India
Final Report – Volume 2 P a g e | viii
List of Tables
Table 1.1 Classified Traffic Volume Count Survey Locations ............................................................... 2
Table 1.2 Traffic Volume at Mid-Block Locations ................................................................................ 3
Table 1.3 Traffic Volume at Screen – line locations ............................................................................ 7
Table 1.4 Traffic Volume at Outer Cordon locations ......................................................................... 10
Table 1.5 Turning Volume Count Survey Locations ........................................................................... 14
Table 1.6 Zonal Population .............................................................................................................. 20
Table 1.7 Zoning List of Mysore ....................................................................................................... 21
Table 1.8 Area wise Sample size adopted for the HH survey ............................................................ 23
Table 1.9 Distribution of Households by Family Size......................................................................... 24
Table 1.10 Distribution of Trip by Purpose ....................................................................................... 25
Table 1.11 Distribution of Trips by Mode of Travel ........................................................................... 25
Table 1.12 Purpose Wise Trip Length Distribution ............................................................................ 26
Table 1.13 Distribution of Trips by Mode & Trip Length ................................................................... 27
Table 1.14 Per - Capita Trip Rates .................................................................................................... 27
Table 1.15 Origin Destination Survey Locations ............................................................................... 28
Table 1.16 O-D survey locations and sample size ............................................................................. 28
Table 1.17 Purpose Wise Distribution of Trips.................................................................................. 29
Table 1.18 Pedestrian Survey Locations ........................................................................................... 31
Table 1.19 Peak Hour Volume vs Motorised Traffic Volume ............................................................. 32
Table 1.20 Bus Operation Details ..................................................................................................... 34
Table 1.21 Depot wise split up of Bus operations ............................................................................. 40
Table 1.22 Operational characteristics of the KSRTC bus operations in Mysore ................................ 41
Table 1.23 Comparison of KSRTC Operations in Mysore with International Standards...................... 41
Table 1.24 Travel Characteristics for Inter & Intra City Bus Service ................................................... 41
Table 1.25 Ratio between public transport trip and private vehicle trips .......................................... 45
Table 1.26 Distribution of Road Length by Row ................................................................................ 47
Table 1.27 Distribution of Road Length By C/W Width ..................................................................... 47
Table 1.28 Distribution of Road Length By No. Of Lanes ................................................................... 47
Table 1.29 Distribution of Road Length by Footpath Availability ...................................................... 50
Table 1.30 Distribution of Road Length by ROW and Footpath ......................................................... 50
Table 1.31 Distribution of Road Length by Median Availability ......................................................... 50
Table 1.32 Lane Wise Distribution of Road Length by Median Availability ........................................ 50
Table 1.33 Distribution of Road Length by Encroachment ................................................................ 50
Table 1.34 ROW and Carriageway Distribution of Main Roads in Mysore ......................................... 52
Comprehensive Traffic and Transportation Plan – Mysore, Karnataka, India
Final Report – Volume 2 P a g e | ix
Table 1.35 V/ C Ratio of Major Roads in Mysore .............................................................................. 52
Table 1.36 Major Intersections of Mysore........................................................................................ 53
Table 1.37 List of Critical Junctions in Mysore .................................................................................. 55
Table 1.38 Purpose Wise Distribution of Floating Population Trips................................................... 57
Table 1.39 Location-wise Annual Tourist Inflow, Mysore ................................................................. 58
Table 1.40 Major Tourist Locations, Mysore .................................................................................... 59
Table 1.41 Mode Wise Distribution of Intra City Travel of Floating Population ................................. 59
Table 1.42 Major Workplace Locations ............................................................................................ 60
Table 1.43 Road Length Distributions by Speed ............................................................................... 64
Table 1.44 Parking Survey Locations ................................................................................................ 68
Table 1.45 Parking Summary for Survey Locations ........................................................................... 70
Table 1.46 Parking Summary for Survey Locations ........................................................................... 72
Table 1.47 Destination Zones ........................................................................................................... 77
Table 2.1 Summary Output of Trip Generation – Single Variable ...................................................... 92
Table 2.2 Summary Output of Trip Generation – Multiple Variables................................................. 93
Table 2.3 Purpose Wise Trip Production Equations .......................................................................... 93
Table 2.4 Summary Output of Non -Work Trip Production Model .................................................... 93
Table 2.5 Summary Output of Work Trip Production Model............................................................. 94
Table 2.6 Purpose Wise Trip Attraction Model ................................................................................. 96
Table 2.7 Summary Output of Trip Attraction Model – Total Trips ................................................... 96
Table 2.8 Summary Output of Trip Attraction Model – Work Trips ................................................... 97
Table 2.9 Calibrated Deterrence Functions .................................................................................... 103
Table 2.10 Comparison of Total trips by Mode ............................................................................... 104
Table 2.11 Total number of Vehicles and trips Assigned ................................................................. 109
Table 2.12 Comparison of Observed and Assigned Flows (Sample Results) .................................... 112
Table 2.13 Estimated Travel under various parameters - 2009 ....................................................... 112
Table 3.1 Transport Strategies and Sub-strategies ......................................................................... 116
Table 3.2 List of Heritage Precincts in Mysore ................................................................................ 118
Table 3.3 Traffic Impact assessment of Pedestrianisation of Stretch 2 on stretch 3 ........................ 119
Table 3.4 Ring Road Details ........................................................................................................... 122
Table 3.5 Projected Modal Split in Do – Nothing Scenario .............................................................. 123
Table 3.6 Identified BRT Corridors ................................................................................................. 124
Table 3.7 Proposed Lane Configuration – Harding Circle ................................................................ 133
Table 3.8 Road safety proposals for blackspots .............................................................................. 139
Table 3.9 Forecasted Parking Demand ........................................................................................... 141
Comprehensive Traffic and Transportation Plan – Mysore, Karnataka, India
Final Report – Volume 2 P a g e | x
Table 4.1 Modal Split – Present and Forecasted – Do Nothing Scenario ......................................... 145
Table 4.2 V/C Ratio – Horizon Year ................................................................................................ 148
Table 4.3 Estimated Travel under various parameters – Do Nothing .............................................. 149
Table 4.4 Transport Strategies – Scenario 2 ................................................................................... 150
Table 4.5 Proposed Road Widening ............................................................................................... 152
Table 4.6 Targeted Modal Split ...................................................................................................... 152
Table 4.7 Modal Split – Base and Horizon Year – Scenario 2 ........................................................... 157
Table 4.8 New Public Transport Bus Routes ................................................................................... 158
Table 4.9 Accessibility Index .......................................................................................................... 158
Table 4.10 Zone-wise Frequency.................................................................................................... 160
Table 4.11 v/c Ratio ....................................................................................................................... 162
Table 4.12 Estimated Travel under various parameters – Scenario 2 .............................................. 169
Table 4.13 Willingness to Shift ....................................................................................................... 172
Table 4.14 Modal Split – Base and Horizon .................................................................................... 173
Table 4.15 BRT Corridor Details ..................................................................................................... 179
Table 4.16 V/C Ratio after BRTS ..................................................................................................... 180
Table 4.17 Estimated travel under various parameters – Scenario 3 .............................................. 180
Table 4.18 Comparison of v/c ratios across the scenarios .............................................................. 181
Table 4.19 Evaluation of Scenarios................................................................................................. 181
Comprehensive Traffic and Transportation Plan – Mysore, Karnataka, India
Final Report – Volume 2 P a g e | xi
List of Annexure
Annexure I – Study Methodology
Annexure II - Traffic Volume Survey and Screen Line Survey Locations
Annexure III - Outer Cordon and Pedestrian Survey Locations
Annexure IV - Turning Volume Survey Locations
Annexure V – Zoning List
Annexure VI – Zoning Map
Annexure VII – Public Transport Coverage
Annexure VIII – Goods Terminal, Bus Terminal and Parking Survey Locations
Annexure IX – Traffic Flow Diagram
Annexure X - Major Boarding Alighting Points
Annexure XI – Data Set for Travel Demand Modeling
Annexure XII – Bus Terminal and Depot Locations
Annexure XIII – Junctions proposed for improvement
Annexure XIV – Roads proposed for capacity augmentation and improvement
Annexure XV – BRTS Corridor
Annexure XVI – Feeder Services
Annexure XVII – IPT Parking Lots
Annexure XVIII – Proposed alignment of major roads
Annexure XIX – Proposed Rail over bridges
Annexure XX – Present Land Use
Annexure XXI – Proposed Classification of Arterial and Sub-Arterial Roads
Annexure XXII – Proposed Cycle Tracks
Comprehensive Traffic and Transportation Plan – Mysore, Karnataka, India
Final Report – Volume 2 P a g e | 1
CC hh aa pp tt eerr 11 DDaatt aa CCoo ll lleecc tt ii oo nn aa nndd AAnn aa llyyss iiss
The first and foremost step to be initiated in the development of any Comprehensive Transportation
Plan for a city is the collection of data relevant to the traffic &travel pattern of the residents of the
city and the factors that influence mobility. Various transportation studies have revealed that the
travel pattern in any urban agglomeration is characterized by large scale movement of passengers
and goods traffic posing traffic congestions and unsafe conditions to the road users. This in turn
helps us conceptualize upon a transportation plan with a reasonable degree of confidence. This data
collation exercise is undertaken through a mix of secondary and primary data collection procedures.
This chapter provides an account of the primary traffic and travel surveys conducted as a part of this
study along with emerging traffic, socioeconomic and travel characteristics. This aforesaid database
helped us in identifying and validating issues and act as a starting point for the travel demand
modelling and forecasting exercise. This chapter further presents the survey results and
corresponding analysis.
Data Collection
A study of this nature requires a string of primary surveys to collect the required quantitative and
qualitative information to understand the traffic and travel patterns emanating within the study
area, and the consequent impact/ repercussions on travel demand. The following primary surveys
were carried out as part of the study:-
• Classified Traffic Volume Counts
• Turning Volume Counts
• Origin-Destination Survey
• Terminal Survey
• Public Transport Survey
• Intermediate Public Transport Survey
• Household Survey
• Speed and Delay Surveys
• Pedestrian Surveys
• Road Inventory
• Workplace Survey
• Floating Population Survey
• Parking Survey
In order to give effect to the above requirements, the city was initially considered from the
viewpoint of:
• The influence and location of major intersection and feeder roads
• The influence and location of through traffic on the city
• Effect of Land use on the Traffic and Transport Characteristics
The locations selected provide a framework for carrying out the necessary surveys and studies in
accordance with the guidelines specified in IRC codes of practice. The various survey locations,
summarized on the city map have been selected following careful assessment of the traffic
characteristics of the city.
Comprehensive Traffic and Transportation Plan – Mysore, Karnataka, India
Final Report – Volume 2 P a g e | 2
1.1 Classified Traffic Volume Count
Mid-Block Classified Traffic Volume Survey, Screen Line Classified Traffic Volume Survey and Outer
Cordon Traffic Volume Survey were conducted. This was undertaken to estimate the vehicular trips
and traffic characteristics on the road. This data otherwise will also be used to expand the O-D
Survey sample to the total population of traffic in O-D location. The survey would provide the traffic
composition by various modes and relative importance of the links in the road network. The
directional classified traffic volume counts, observed at various count stations, will be analysed to
obtain:
• Average Daily Traffic (ADT)
• Hourly variation and Peak Hour flows
• Directional distribution by hour of the day
• Traffic composition
• Intra or Inter day coefficients of variation in Traffic numbers
Mid-Block Traffic Counts were conducted at 9 locations as shown in Annexure II. The traffic survey
was carried out continuously for 24 hours for 7 days at Mid-Block Locations, while the survey at
Screen Line and Outer Cordon Locations were conducted for 16 hours for 3 days. The locations of
the major road were accounted for in the selection of the survey sites in order to ensure maximum
capture of traffic. The counts were carried out in both directions.
Traffic volume count at mid-block locations give a clear picture about the density of traffic volume
along different stretches of roads within the study area, which helps in assessing the V/C ratio of the
road stretches. This in turn helps in assessing the current strategies to be adopted to ease the
prevailing congestion as also in evolving future long term strategies.
Outer Cordon Traffic Volume Count was carried out at 8 locations as shown in Annexure III. Mysore
experiences extensive interaction with other nearby cities and towns. Thus it was extremely
important to estimate the traffic moving in and out of the study area. There are basically three kinds
of traffic movements Internal to External movement, External to External movement and External to
Internal movement. It is very important to estimate the E-E trips as they use the road space without
having any need to enter the city. Thus these trips can be averted by justification of a bypass if
required.
The railway line passes through the city. The railways line runs north – south in the city. Screen line
surveys were conducted at 5 Number of locations. The locations of the Screen-line Surveys were
accounted for in the major road were accounted for in the selection of the survey sites in order to
ensure maximum capture of traffic. The counts were carried out in both directions, for successive 15
minutes periods, 16 hours a day for 3 days. The locations for Screen line survey are shown in
Annexure II.
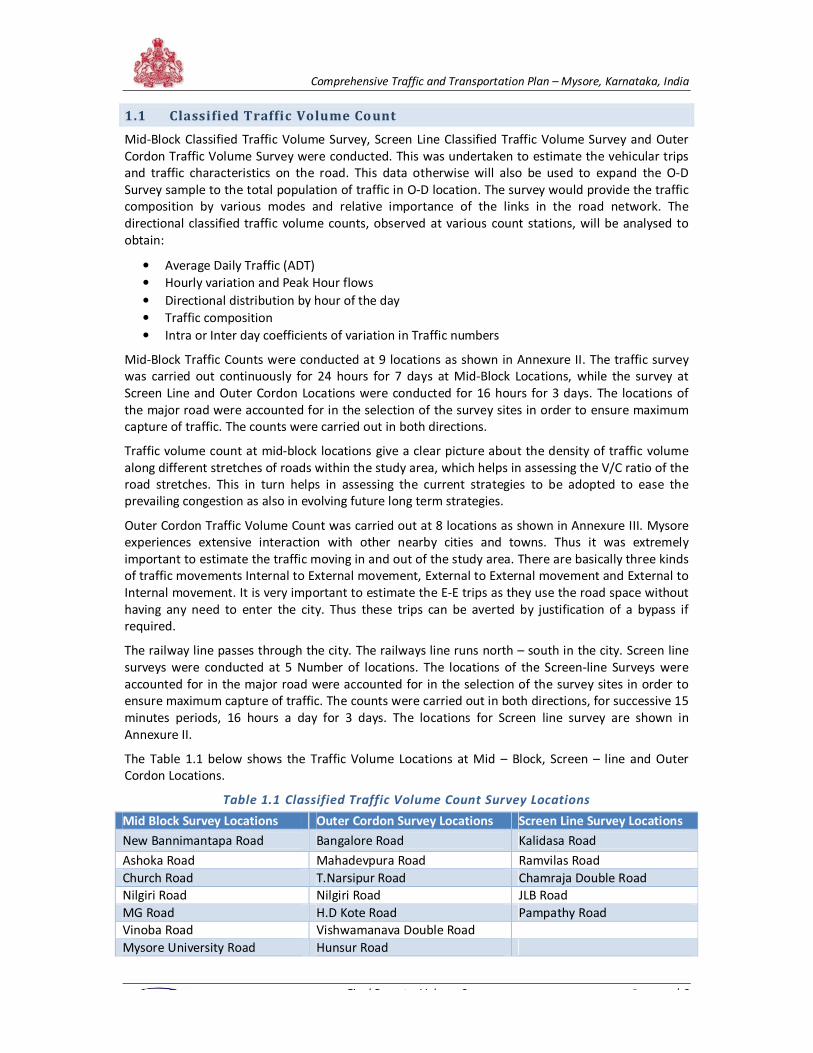
The Table 1.1 below shows the Traffic Volume Locations at Mid – Block, Screen – line and Outer
Cordon Locations.
Table 1.1 Classified Traffic Volume Count Survey Locations
Mid Block Survey Locations Outer Cordon Survey Locations Screen Line Survey Locations
New Bannimantapa Road Bangalore Road Kalidasa Road
Ashoka Road Mahadevpura Road Ramvilas Road
Church Road T.Narsipur Road Chamraja Double Road
Nilgiri Road Nilgiri Road JLB Road
MG Road H.D Kote Road Pampathy Road
Vinoba Road Vishwamanava Double Road
Mysore University Road Hunsur Road
Comprehensive Traffic and Transportation Plan – Mysore, Karnataka, India
Final Report – Volume 2 P a g e | 3
Mid Block Survey Locations Outer Cordon Survey Locations Screen Line Survey Locations
Bogadi Road KRS Road
Adhichunchunagiri Road
1.1.2 Mid-Block Location Volume Counts
Traffic volume count at mid-block locations give a clear picture about the density of traffic volume
along different stretches of roads within the study area, which helps in assessing the V/C ratio of the
road stretches. This in turn helps in assessing the current strategies to be adopted to ease the
prevailing congestion and also in evolving future long term strategies. 9 mid-blocks were identified
for carrying out the volume count survey covering some of the major and important roads of the city
as shown in Annexure II. Mid-block volume counts were carried out for 24 hours continuously. The
volume counts were carried out for seven days.
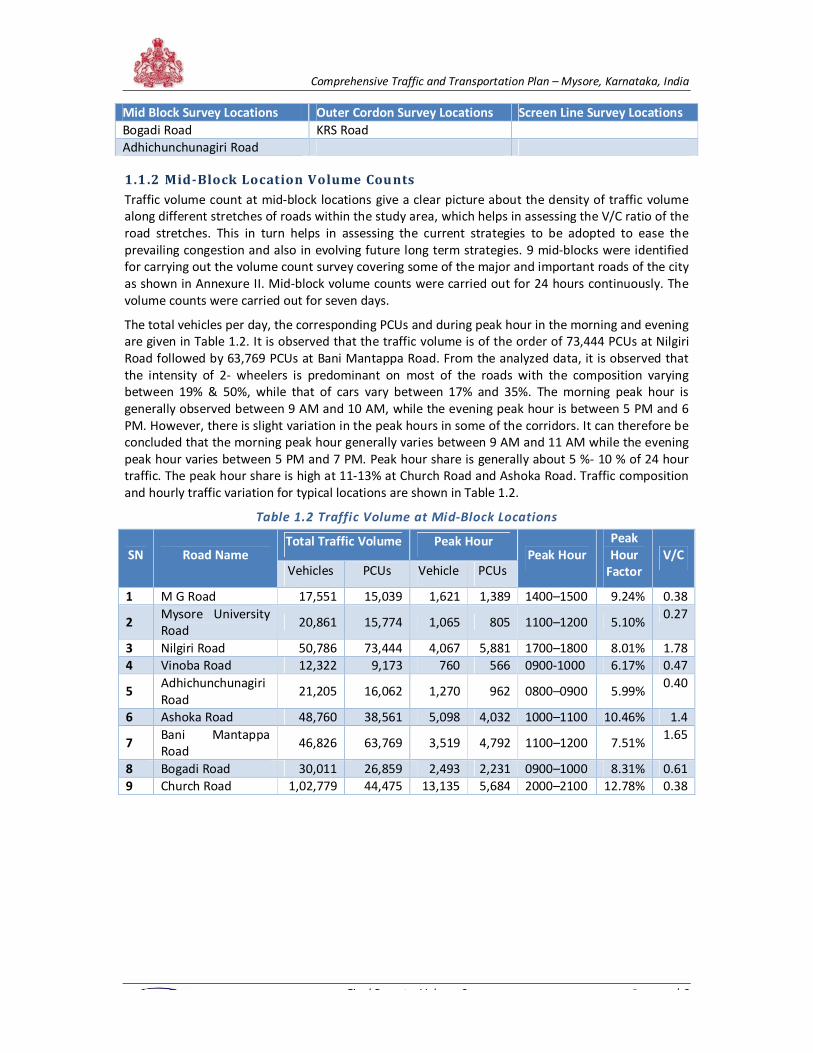
The total vehicles per day, the corresponding PCUs and during peak hour in the morning and evening
are given in Table 1.2. It is observed that the traffic volume is of the order of 73,444 PCUs at Nilgiri
Road followed by 63,769 PCUs at Bani Mantappa Road. From the analyzed data, it is observed that
the intensity of 2- wheelers is predominant on most of the roads with the composition varying
between 19% & 50%, while that of cars vary between 17% and 35%. The morning peak hour is
generally observed between 9 AM and 10 AM, while the evening peak hour is between 5 PM and 6
PM. However, there is slight variation in the peak hours in some of the corridors. It can therefore be
concluded that the morning peak hour generally varies between 9 AM and 11 AM while the evening
peak hour varies between 5 PM and 7 PM. Peak hour share is generally about 5 %- 10 % of 24 hour
traffic. The peak hour share is high at 11-13% at Church Road and Ashoka Road. Traffic composition
and hourly traffic variation for typical locations are shown in Table 1.2.
Table 1.2 Traffic Volume at Mid-Block Locations
SN Road Name Total Traffic Volume Peak Hour
Peak Hour
Peak
Hour
Factor
V/C
Vehicles PCUs Vehicle PCUs
1 M G Road 17,551 15,039 1,621 1,389 1400–1500 9.24% 0.38
2 Mysore University
Road 20,861 15,774 1,065 805 1100–1200 5.10%
0.27
3 Nilgiri Road 50,786 73,444 4,067 5,881 1700–1800 8.01% 1.78
4 Vinoba Road 12,322 9,173 760 566 0900-1000 6.17% 0.47
5 Adhichunchunagiri
Road 21,205 16,062 1,270 962 0800–0900 5.99%
0.40
6 Ashoka Road 48,760 38,561 5,098 4,032 1000–1100 10.46% 1.4
7 Bani Mantappa
Road 46,826 63,769 3,519 4,792 1100–1200 7.51%
1.65
8 Bogadi Road 30,011 26,859 2,493 2,231 0900–1000 8.31% 0.61
9 Church Road 1,02,779 44,475 13,135 5,684 2000–2100 12.78% 0.38
Comprehensive Traffic and Transportation Plan – Mysore, Karnataka, India
Final Report – Volume 2 P a g e | 4
Comprehensive Traffic and Transportation Plan – Mysore, Karnataka, India
Final Report – Volume 2 P a g e | 5
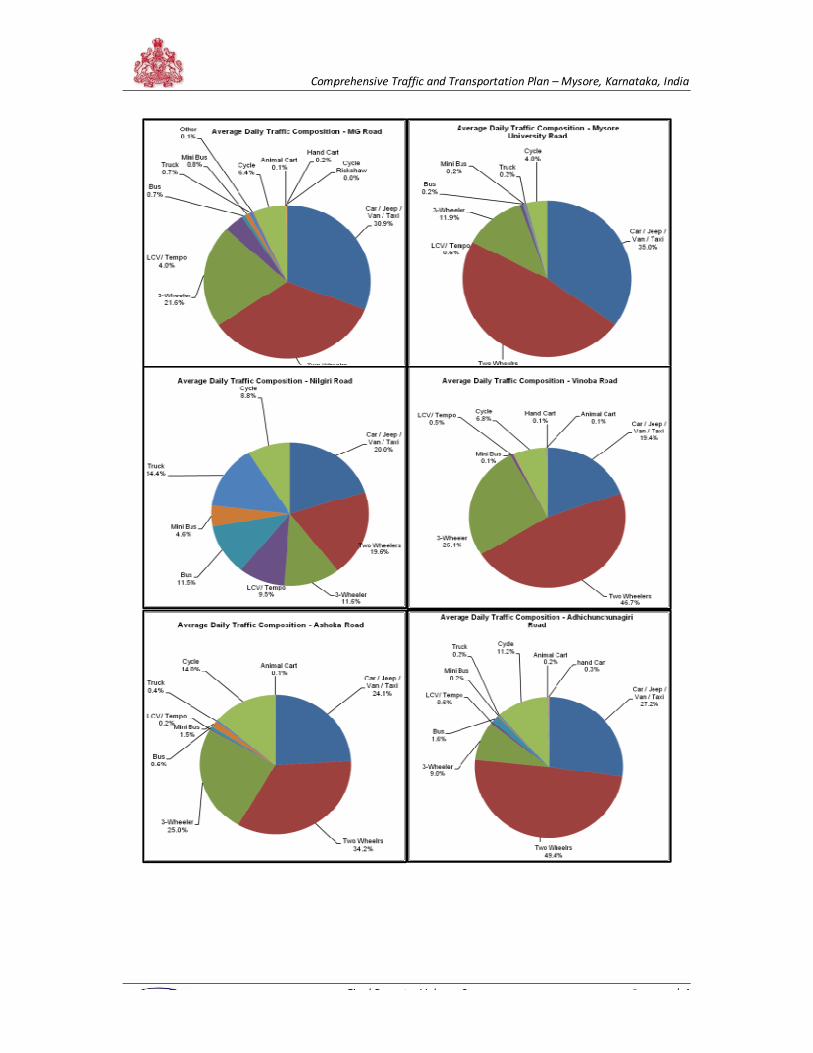
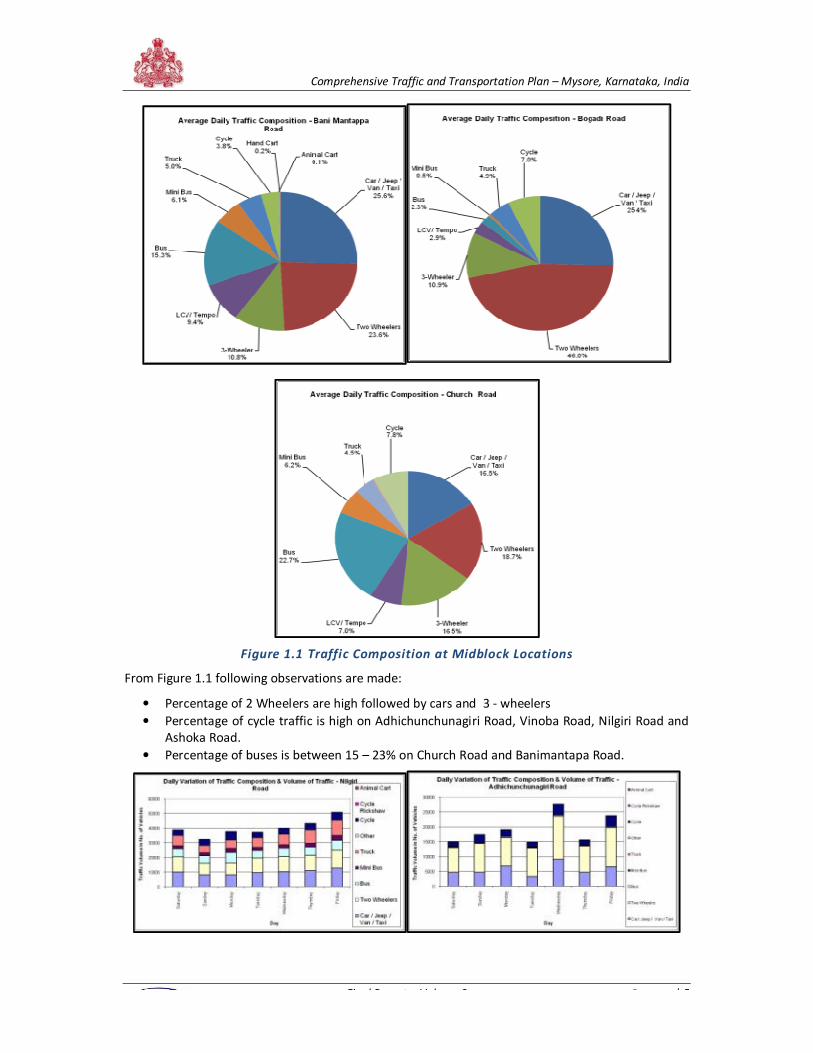
Figure 1.1 Traffic Composition at Midblock Locations
From Figure 1.1 following observations are made:
• Percentage of 2 Wheelers are high followed by cars and 3 - wheelers
• Percentage of cycle traffic is high on Adhichunchunagiri Road, Vinoba Road, Nilgiri Road and
Ashoka Road.
• Percentage of buses is between 15 – 23% on Church Road and Banimantapa Road.
Comprehensive Traffic and Transportation Plan – Mysore, Karnataka, India
Final Report – Volume 2 P a g e | 6
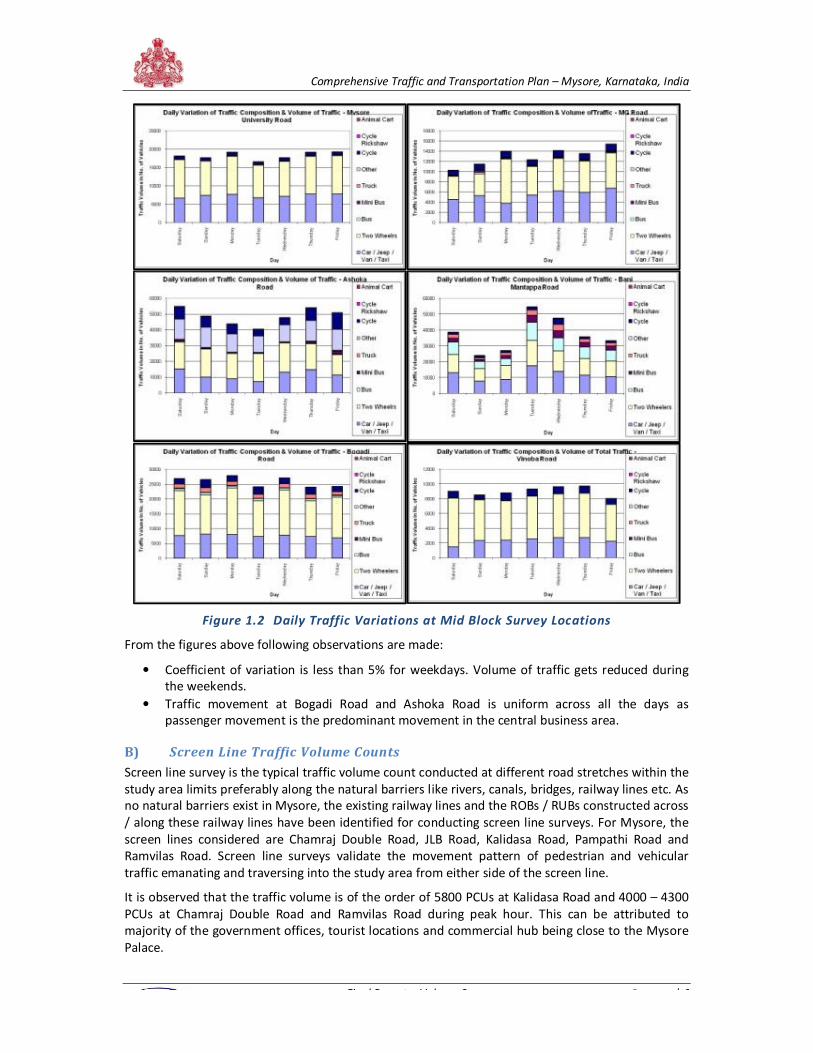
Figure 1.2 Daily Traffic Variations at Mid Block Survey Locations
From the figures above following observations are made:
• Coefficient of variation is less than 5% for weekdays. Volume of traffic gets reduced during
the weekends.
• Traffic movement at Bogadi Road and Ashoka Road is uniform across all the days as
passenger movement is the predominant movement in the central business area.
B) Screen Line Traffic Volume Counts
Screen line survey is the typical traffic volume count conducted at different road stretches within the
study area limits preferably along the natural barriers like rivers, canals, bridges, railway lines etc. As
no natural barriers exist in Mysore, the existing railway lines and the ROBs / RUBs constructed across
/ along these railway lines have been identified for conducting screen line surveys. For Mysore, the
screen lines considered are Chamraj Double Road, JLB Road, Kalidasa Road, Pampathi Road and
Ramvilas Road. Screen line surveys validate the movement pattern of pedestrian and vehicular
traffic emanating and traversing into the study area from either side of the screen line.
It is observed that the traffic volume is of the order of 5800 PCUs at Kalidasa Road and 4000 – 4300
PCUs at Chamraj Double Road and Ramvilas Road during peak hour. This can be attributed to
majority of the government offices, tourist locations and commercial hub being close to the Mysore
Palace.
Comprehensive Traffic and Transportation Plan – Mysore, Karnataka, India
Final Report – Volume 2 P a g e | 7
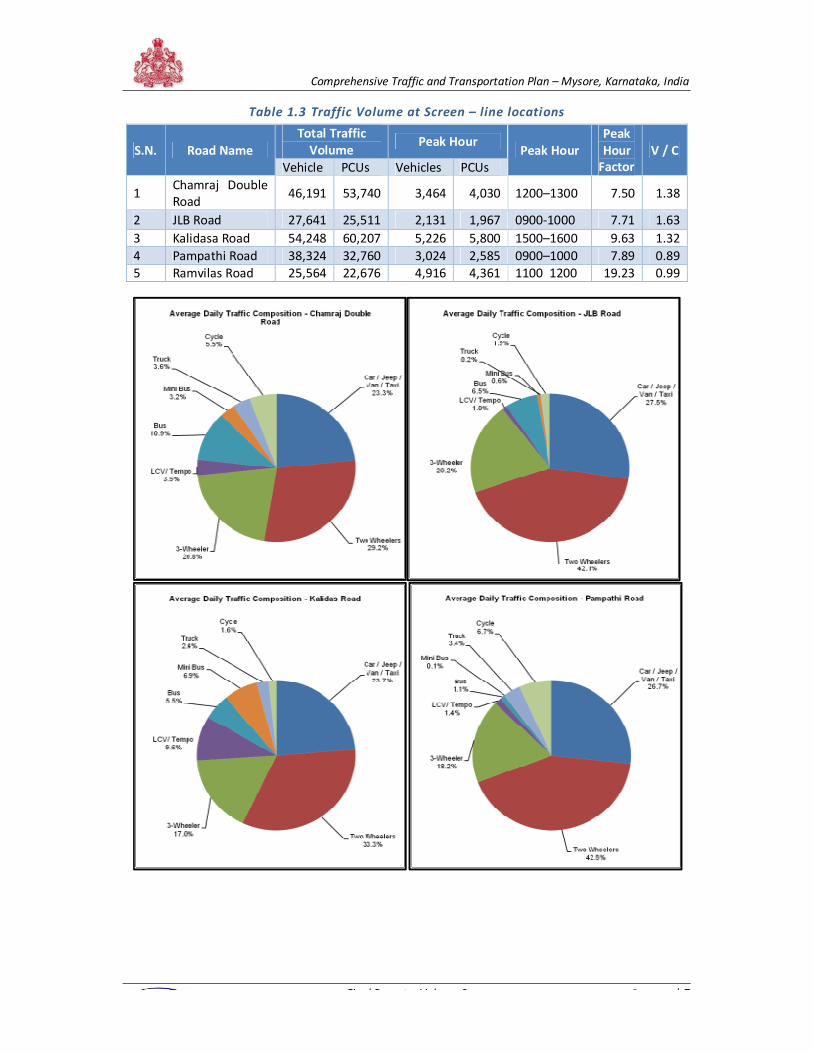
Table 1.3 Traffic Volume at Screen – line locations
S.N. Road Name
Total Traffic
Volume Peak Hour
Peak Hour
Peak
Hour
Factor
V / C
Vehicle PCUs Vehicles PCUs
1 Chamraj Double
Road 46,191 53,740 3,464 4,030 1200–1300 7.50 1.38
2 JLB Road 27,641 25,511 2,131 1,967 0900-1000 7.71 1.63
3 Kalidasa Road 54,248 60,207 5,226 5,800 1500–1600 9.63 1.32
4 Pampathi Road 38,324 32,760 3,024 2,585 0900–1000 7.89 0.89
5 Ramvilas Road 25,564 22,676 4,916 4,361 1100 1200 19.23 0.99
Comprehensive Traffic and Transportation Plan – Mysore, Karnataka, India
Final Report – Volume 2 P a g e | 8
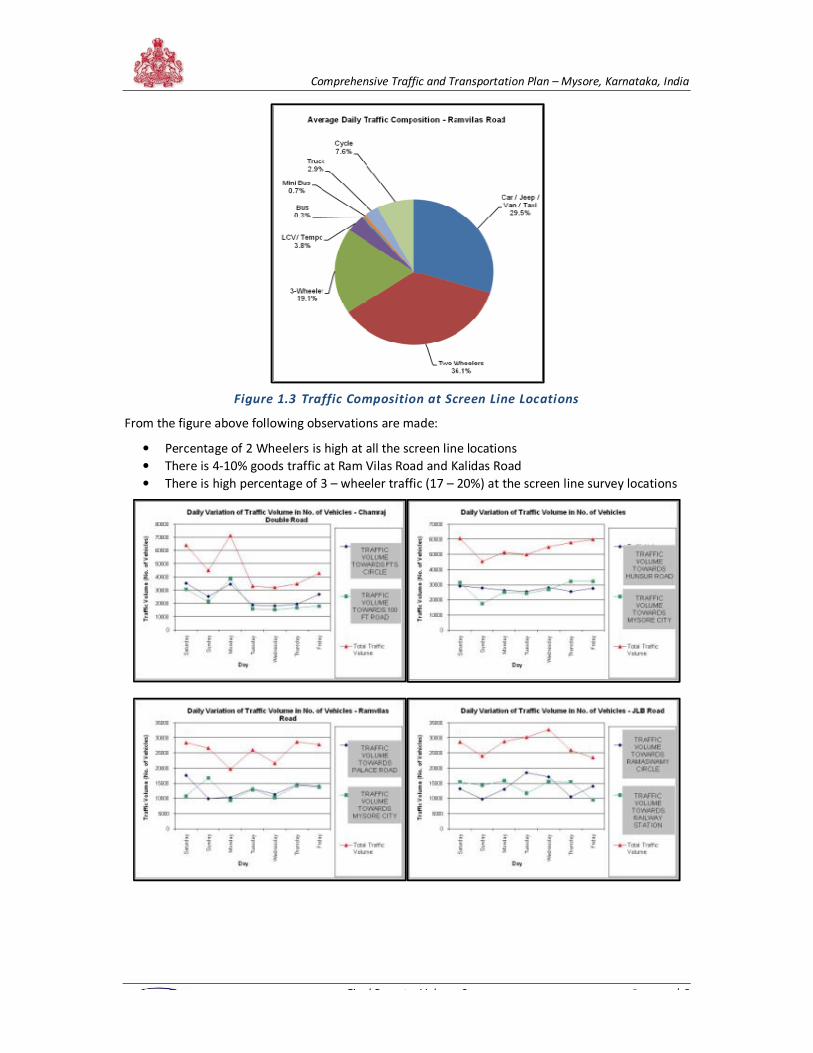
Figure 1.3 Traffic Composition at Screen Line Locations
From the figure above following observations are made:
• Percentage of 2 Wheelers is high at all the screen line locations
• There is 4-10% goods traffic at Ram Vilas Road and Kalidas Road
• There is high percentage of 3 – wheeler traffic (17 – 20%) at the screen line survey locations
Comprehensive Traffic and Transportation Plan – Mysore, Karnataka, India
Final Report – Volume 2 P a g e | 9
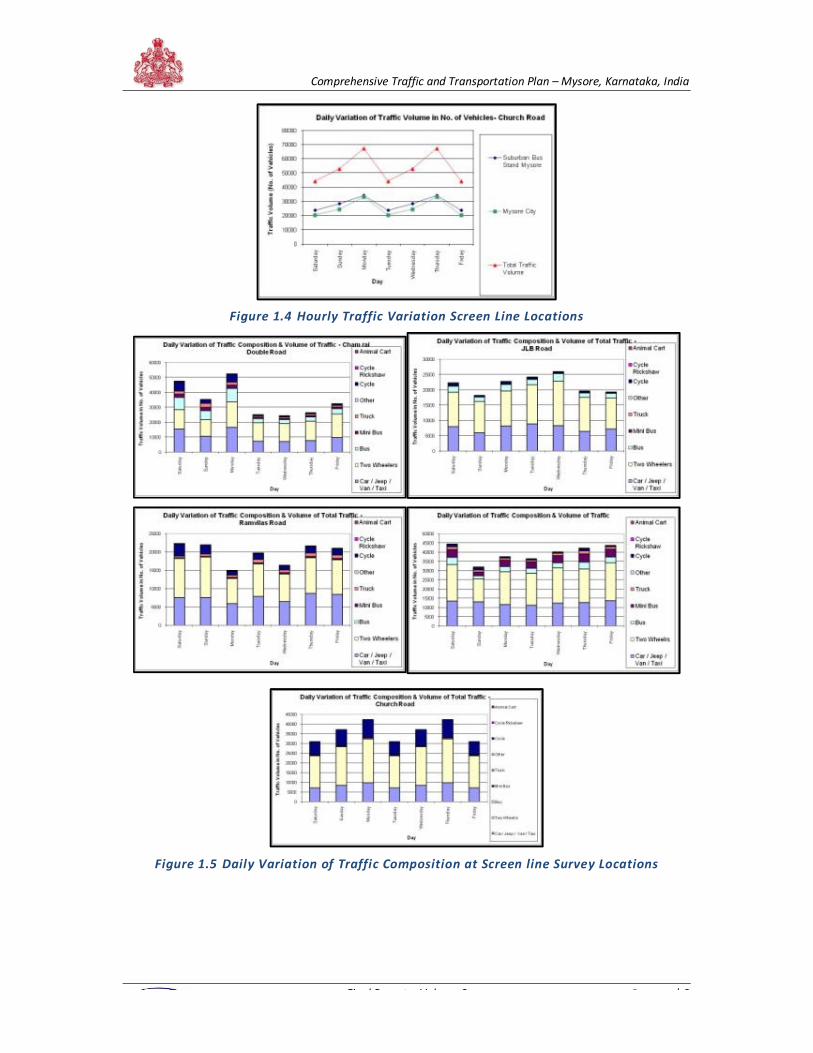
Figure 1.4 Hourly Traffic Variation Screen Line Locations
Figure 1.5 Daily Variation of Traffic Composition at Screen line Survey Locations
Comprehensive Traffic and Transportation Plan – Mysore, Karnataka, India
Final Report – Volume 2 P a g e | 10
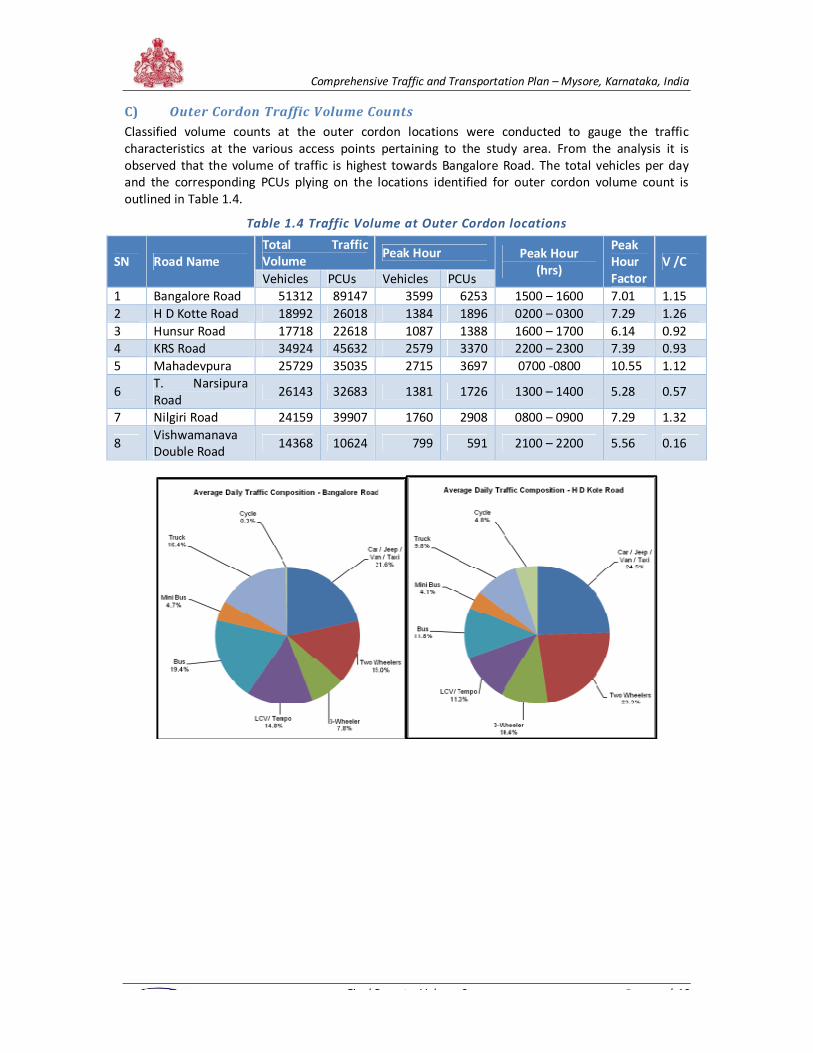
C) Outer Cordon Traffic Volume Counts
Classified volume counts at the outer cordon locations were conducted to gauge the traffic
characteristics at the various access points pertaining to the study area. From the analysis it is
observed that the volume of traffic is highest towards Bangalore Road. The total vehicles per day
and the corresponding PCUs plying on the locations identified for outer cordon volume count is
outlined in Table 1.4.
Table 1.4 Traffic Volume at Outer Cordon locations
SN Road Name
Total Traffic
Volume Peak Hour Peak Hour
(hrs)
Peak
Hour
Factor
V /C
Vehicles PCUs Vehicles PCUs
1 Bangalore Road 51312 89147 3599 6253 1500 – 1600 7.01 1.15
2 H D Kotte Road 18992 26018 1384 1896 0200 – 0300 7.29 1.26
3 Hunsur Road 17718 22618 1087 1388 1600 – 1700 6.14 0.92
4 KRS Road 34924 45632 2579 3370 2200 – 2300 7.39 0.93
5 Mahadevpura 25729 35035 2715 3697 0700 -0800 10.55 1.12
6 T. Narsipura
Road 26143 32683 1381 1726 1300 – 1400 5.28 0.57
7 Nilgiri Road 24159 39907 1760 2908 0800 – 0900 7.29 1.32
8 Vishwamanava
Double Road 14368 10624 799 591 2100 – 2200 5.56 0.16
Comprehensive Traffic and Transportation Plan – Mysore, Karnataka, India
Final Report – Volume 2 P a g e | 11
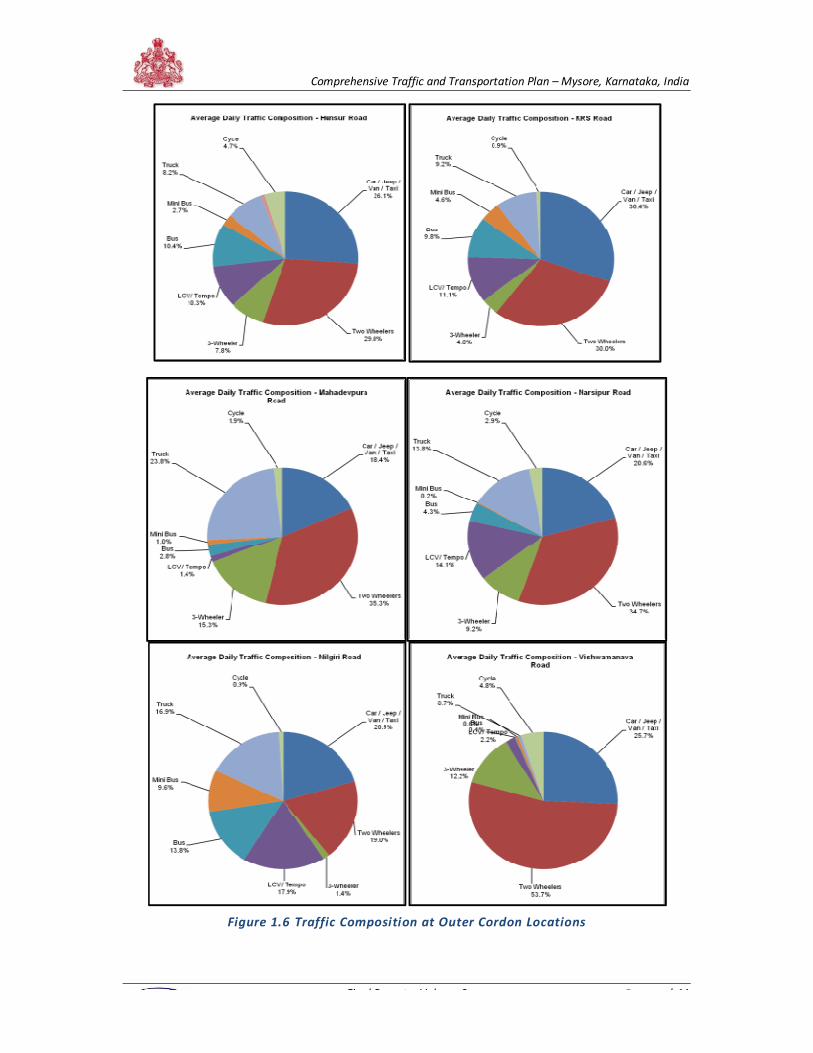
Figure 1.6 Traffic Composition at Outer Cordon Locations
Comprehensive Traffic and Transportation Plan – Mysore, Karnataka, India
Final Report – Volume 2 P a g e | 12
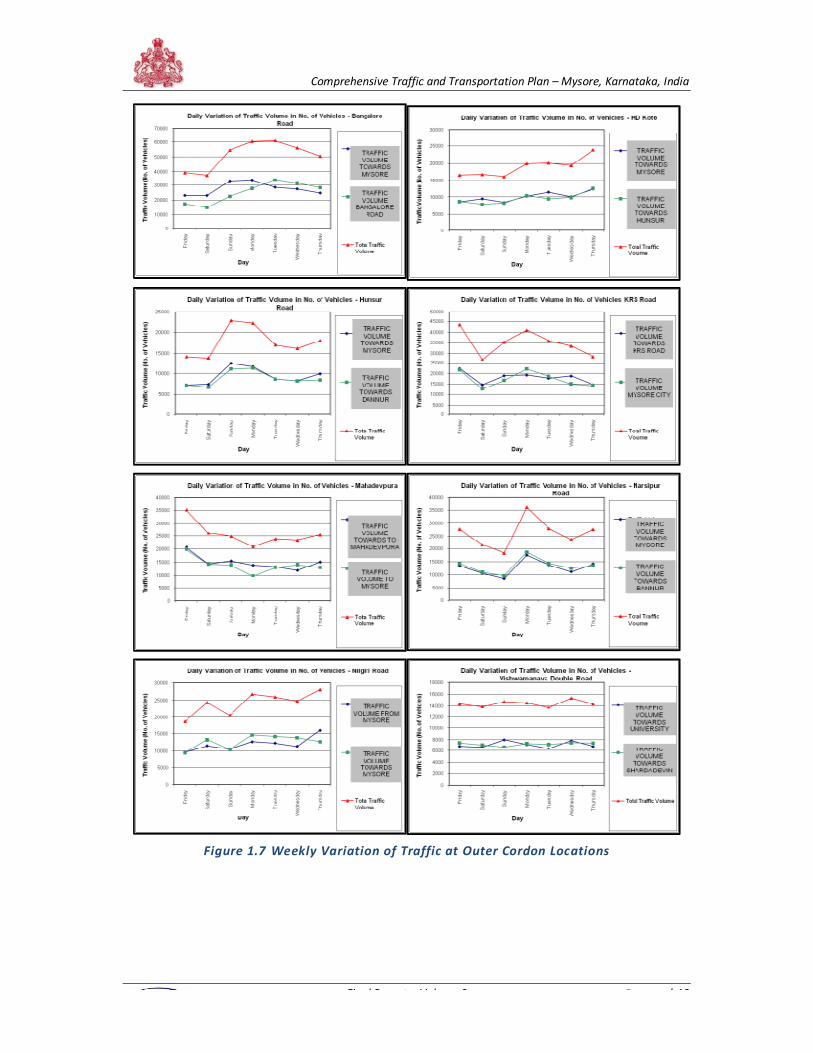
Figure 1.7 Weekly Variation of Traffic at Outer Cordon Locations
Comprehensive Traffic and Transportation Plan – Mysore, Karnataka, India
Final Report – Volume 2 P a g e | 13
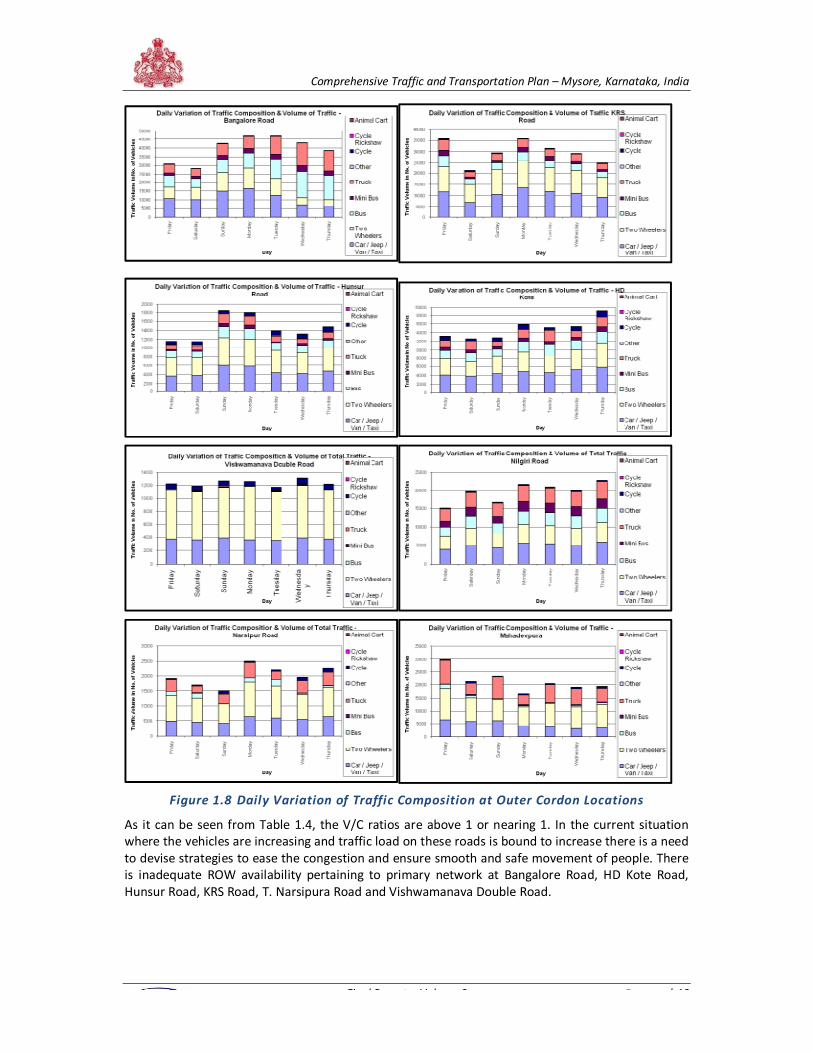
Figure 1.8 Daily Variation of Traffic Composition at Outer Cordon Locations
As it can be seen from Table 1.4, the V/C ratios are above 1 or nearing 1. In the current situation
where the vehicles are increasing and traffic load on these roads is bound to increase there is a need
to devise strategies to ease the congestion and ensure smooth and safe movement of people. There
is inadequate ROW availability pertaining to primary network at Bangalore Road, HD Kote Road,
Hunsur Road, KRS Road, T. Narsipura Road and Vishwamanava Double Road.
Comprehensive Traffic and Transportation Plan – Mysore, Karnataka, India
Final Report – Volume 2 P a g e | 14
Devraj Urs Road is one the main roads of Mysore. It connects JLB Road on one side and K R Circle on
the other. It is a four lane un-divided road with mixed land use on both sides. It has some major
Commercial areas along it and forms a part of the Mysore CBD. It has a defined footpath on both
sides that is invariably encroached throughout the stretch. There is on – street parking present all
through the road that hampers movement of traffic.
D) Turning Volume Count
Turning movement surveys were carried out at the locations of the 16 major intersections as
summarized in Table 1.5. Classified Turning Volume Counts of all vehicle types were made
separately for all directions. The survey was conducted for both directions for 16 hours for one day.
The locations for Turning Volume Count are shown in Annexure IV. All the movements at the
junctions for each arm (Left, Right, Straight, U- Turn) were captured at each of the selected
intersection.
Turning movement count survey will provide inputs for developing capacity augmentation proposals
in the study area along with conceptual layout of grade separators etc.
The classified turning movement counts, observed at various intersections, were analyzed to obtain:
• Total Passenger Car Units (PCUs)
• PCUs on each turning movement
• Junction flow diagram
• Hourly variation and peak hour flows
• Traffic composition
The junction volume count were conducted at the following intersections
Table 1.5 Turning Volume Count Survey Locations
Junction Name Junction Name Junction Name Junction Name
Balal Circle JLB Outer Ring Road
Intersection Mahadevpura Road
Ramvilas Sayaji Rao
Road Intersection
H D Kotte Outer Ring
Road Intersection K R Circle
Pulkeshi – Shivaji Road
Intersection Srinivasan Circle
Vishwamanava Double
Road Intersection Harding Circle Akashwani Circle
Race Course Road
Intersection
Bogadi Road
Intersection
Nilgiri – Outer Ring
Road Intersection Highway Circle
Sayaji – Chamaraja
Double Road
Intersection
The analysis of all the survey locations are summarised and given in subsequent sections.
Comprehensive Traffic and Transportation Plan – Mysore, Karnataka, India
Final Report – Volume 2 P a g e | 15
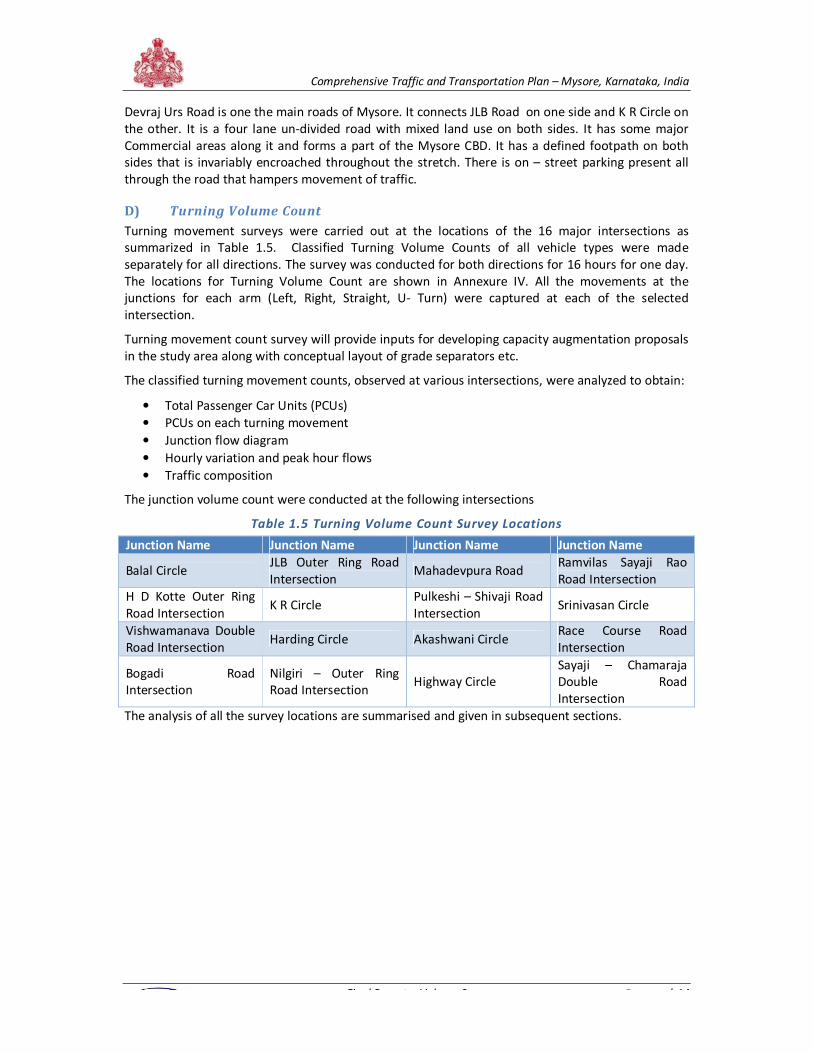
Ballal Circle
Figure 1.9 Traffic Composition & Junction Flow Diagram – Balal Circle
• Total traffic flow at junction is 48,821 PCU whereas peak hour traffic is 5310 PCU.
• Peak hour traffic flow is 11% of total traffic flow and 9.00 AM to 10.00 AM.
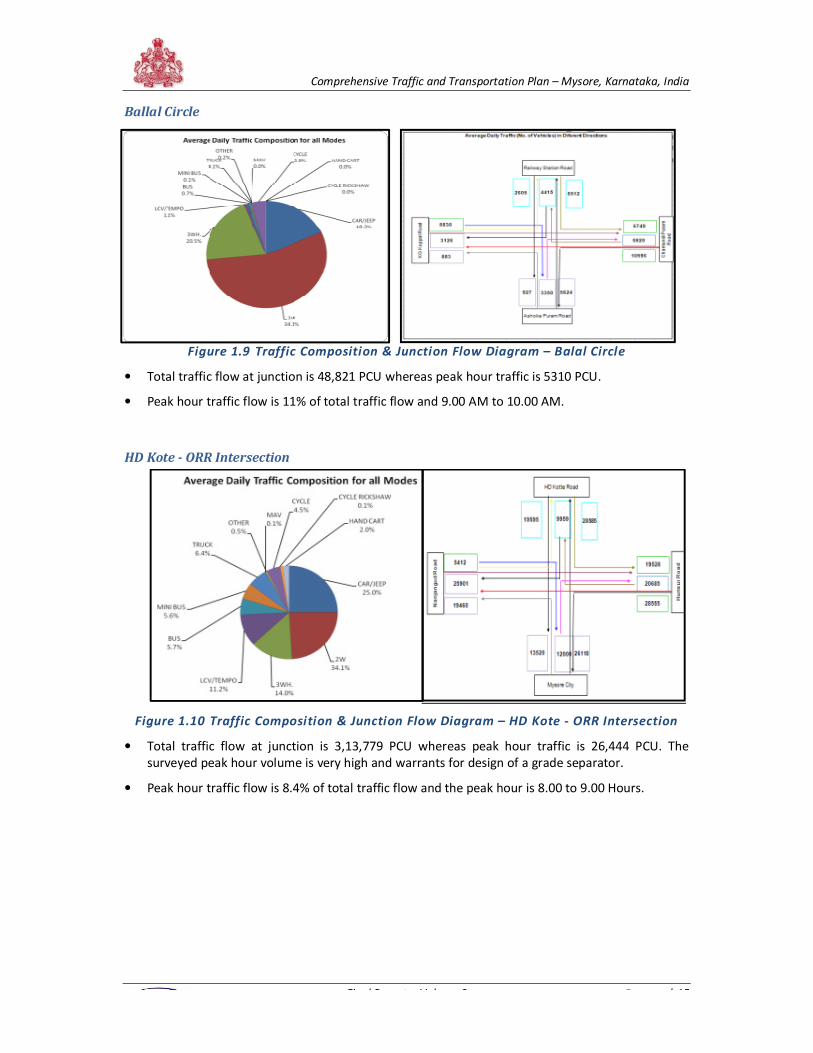
HD Kote - ORR Intersection
Figure 1.10 Traffic Composition & Junction Flow Diagram – HD Kote - ORR Intersection
• Total traffic flow at junction is 3,13,779 PCU whereas peak hour traffic is 26,444 PCU. The
surveyed peak hour volume is very high and warrants for design of a grade separator.
• Peak hour traffic flow is 8.4% of total traffic flow and the peak hour is 8.00 to 9.00 Hours.
Comprehensive Traffic and Transportation Plan – Mysore, Karnataka, India
Final Report – Volume 2 P a g e | 16
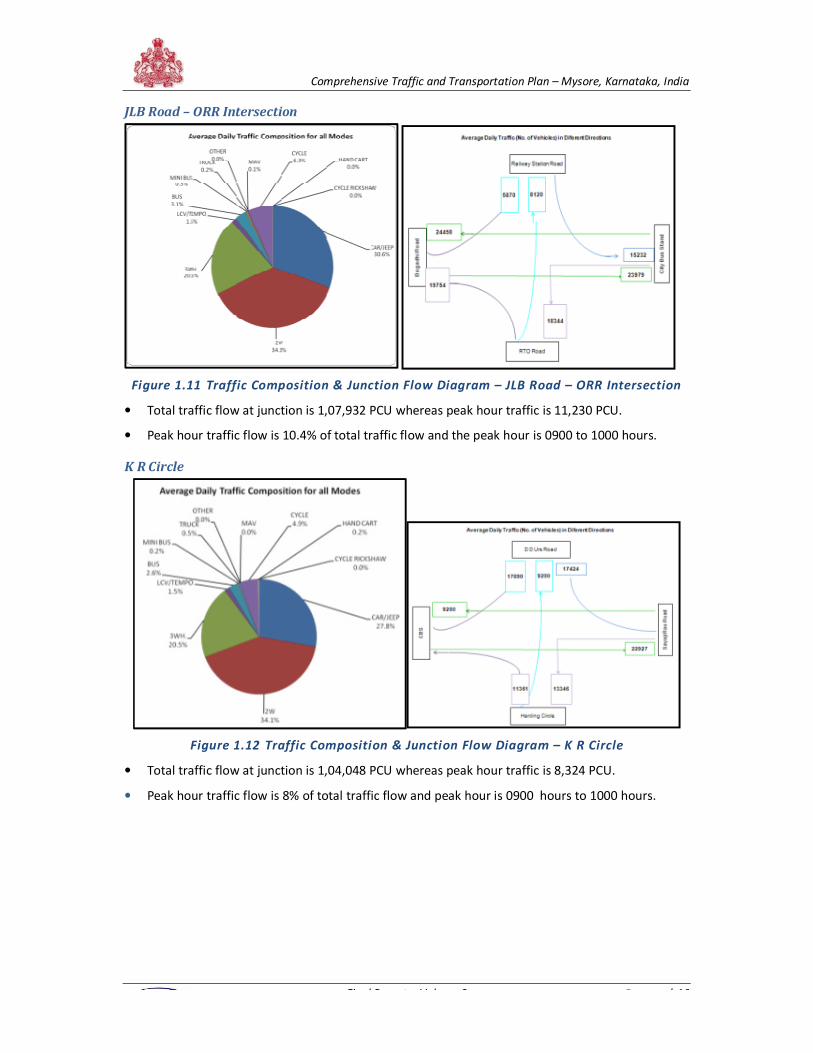
JLB Road – ORR Intersection
Figure 1.11 Traffic Composition & Junction Flow Diagram – JLB Road – ORR Intersection
• Total traffic flow at junction is 1,07,932 PCU whereas peak hour traffic is 11,230 PCU.
• Peak hour traffic flow is 10.4% of total traffic flow and the peak hour is 0900 to 1000 hours.
K R Circle
Figure 1.12 Traffic Composition & Junction Flow Diagram – K R Circle
• Total traffic flow at junction is 1,04,048 PCU whereas peak hour traffic is 8,324 PCU.
• Peak hour traffic flow is 8% of total traffic flow and peak hour is 0900 hours to 1000 hours.
Comprehensive Traffic and Transportation Plan – Mysore, Karnataka, India
Final Report – Volume 2 P a g e | 17
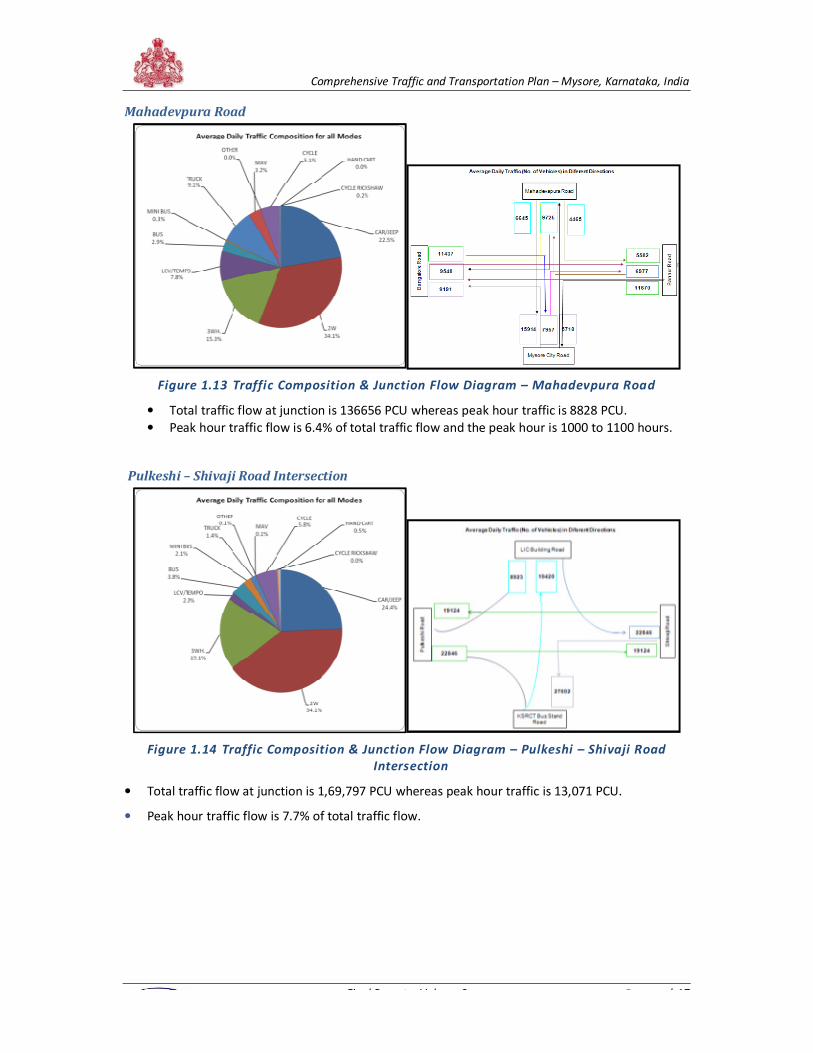
Mahadevpura Road
Figure 1.13 Traffic Composition & Junction Flow Diagram – Mahadevpura Road
• Total traffic flow at junction is 136656 PCU whereas peak hour traffic is 8828 PCU.
• Peak hour traffic flow is 6.4% of total traffic flow and the peak hour is 1000 to 1100 hours.
Pulkeshi – Shivaji Road Intersection
Figure 1.14 Traffic Composition & Junction Flow Diagram – Pulkeshi – Shivaji Road
Intersection
• Total traffic flow at junction is 1,69,797 PCU whereas peak hour traffic is 13,071 PCU.
• Peak hour traffic flow is 7.7% of total traffic flow.
Comprehensive Traffic and Transportation Plan – Mysore, Karnataka, India
Final Report – Volume 2 P a g e | 18
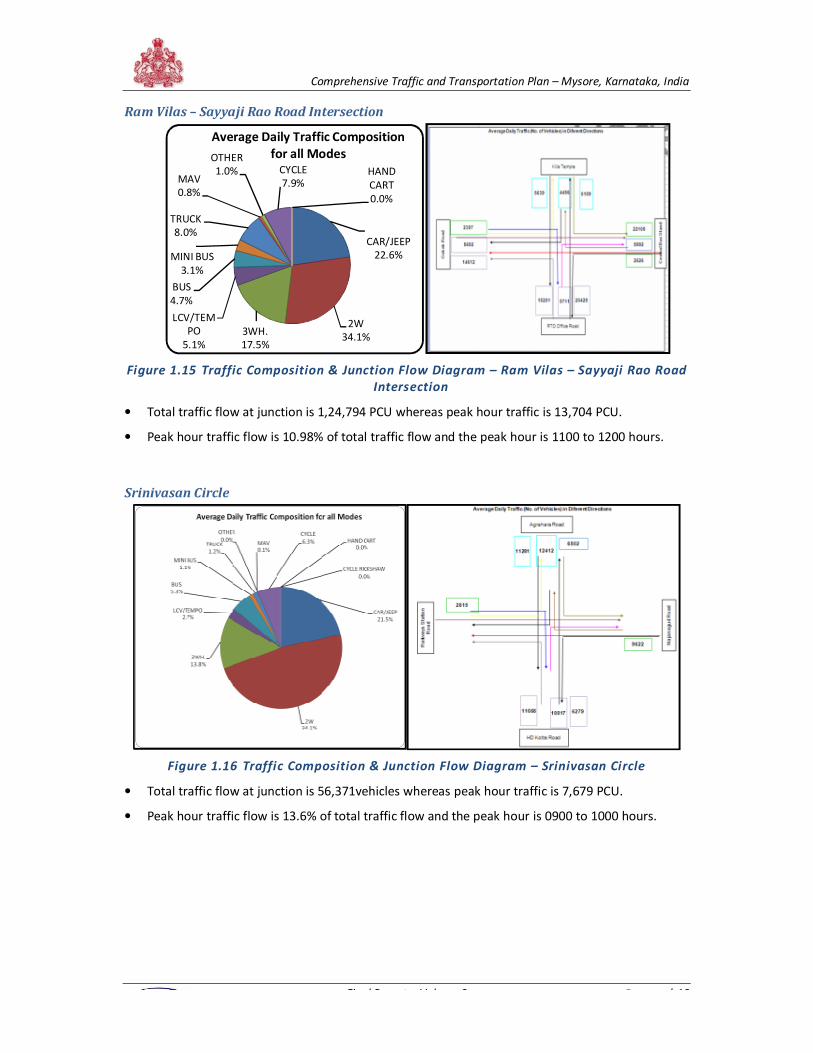
Ram Vilas – Sayyaji Rao Road Intersection
Figure 1.15 Traffic Composition & Junction Flow Diagram – Ram Vilas – Sayyaji Rao Road
Intersection
• Total traffic flow at junction is 1,24,794 PCU whereas peak hour traffic is 13,704 PCU.
• Peak hour traffic flow is 10.98% of total traffic flow and the peak hour is 1100 to 1200 hours.
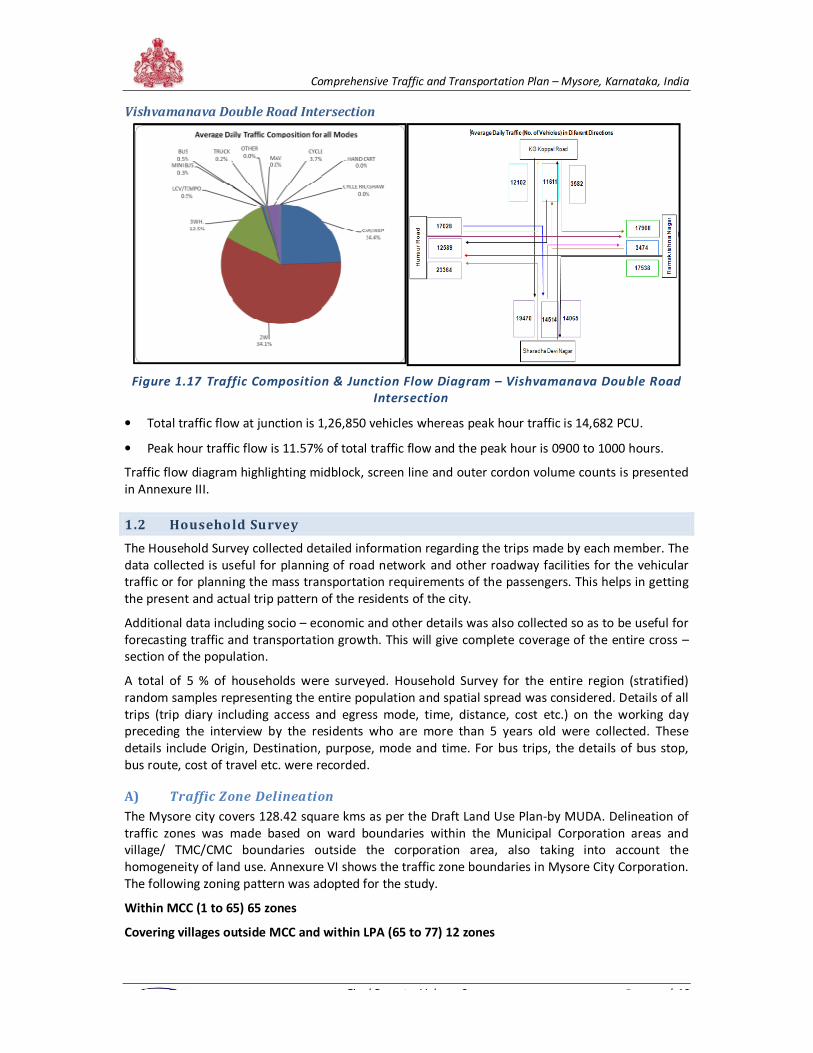
Srinivasan Circle
Figure 1.16 Traffic Composition & Junction Flow Diagram – Srinivasan Circle
• Total traffic flow at junction is 56,371vehicles whereas peak hour traffic is 7,679 PCU.
• Peak hour traffic flow is 13.6% of total traffic flow and the peak hour is 0900 to 1000 hours.
CAR/JEEP
22.6%
2W
34.1%3WH.
17.5%
LCV/TEM
PO
5.1%
BUS
4.7%
MINI BUS
3.1%
TRUCK
8.0%
MAV
0.8%
OTHER
1.0% CYCLE
7.9%HAND
CART
0.0%
Average Daily Traffic Composition
for all Modes
Comprehensive Traffic and Transportation Plan – Mysore, Karnataka, India
Final Report – Volume 2 P a g e | 19
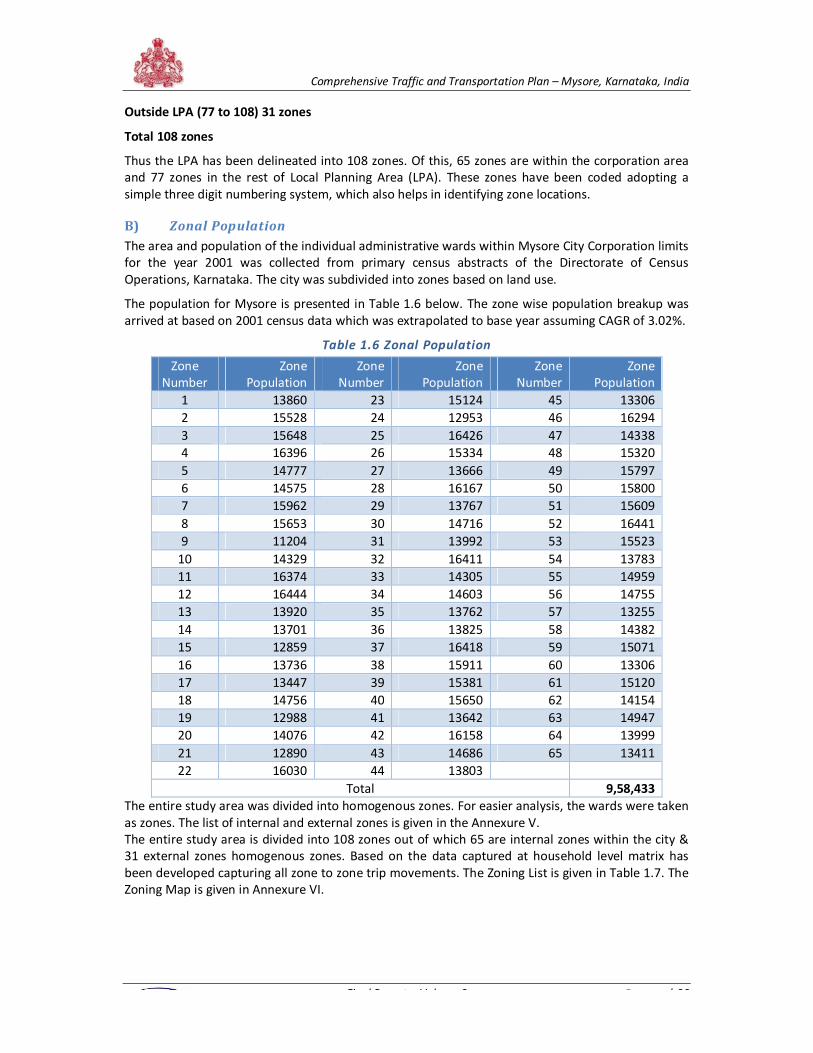
Vishvamanava Double Road Intersection
Figure 1.17 Traffic Composition & Junction Flow Diagram – Vishvamanava Double Road
Intersection
• Total traffic flow at junction is 1,26,850 vehicles whereas peak hour traffic is 14,682 PCU.
• Peak hour traffic flow is 11.57% of total traffic flow and the peak hour is 0900 to 1000 hours.
Traffic flow diagram highlighting midblock, screen line and outer cordon volume counts is presented
in Annexure III.
1.2 Household Survey
The Household Survey collected detailed information regarding the trips made by each member. The
data collected is useful for planning of road network and other roadway facilities for the vehicular
traffic or for planning the mass transportation requirements of the passengers. This helps in getting
the present and actual trip pattern of the residents of the city.
Additional data including socio – economic and other details was also collected so as to be useful for
forecasting traffic and transportation growth. This will give complete coverage of the entire cross –
section of the population.
A total of 5 % of households were surveyed. Household Survey for the entire region (stratified)
random samples representing the entire population and spatial spread was considered. Details of all
trips (trip diary including access and egress mode, time, distance, cost etc.) on the working day
preceding the interview by the residents who are more than 5 years old were collected. These
details include Origin, Destination, purpose, mode and time. For bus trips, the details of bus stop,
bus route, cost of travel etc. were recorded.
A) Traffic Zone Delineation
The Mysore city covers 128.42 square kms as per the Draft Land Use Plan-by MUDA. Delineation of
traffic zones was made based on ward boundaries within the Municipal Corporation areas and
village/ TMC/CMC boundaries outside the corporation area, also taking into account the
homogeneity of land use. Annexure VI shows the traffic zone boundaries in Mysore City Corporation.
The following zoning pattern was adopted for the study.
Within MCC (1 to 65) 65 zones
Covering villages outside MCC and within LPA (65 to 77) 12 zones
Comprehensive Traffic and Transportation Plan – Mysore, Karnataka, India
Final Report – Volume 2 P a g e | 20
Outside LPA (77 to 108) 31 zones
Total 108 zones
Thus the LPA has been delineated into 108 zones. Of this, 65 zones are within the corporation area
and 77 zones in the rest of Local Planning Area (LPA). These zones have been coded adopting a
simple three digit numbering system, which also helps in identifying zone locations.
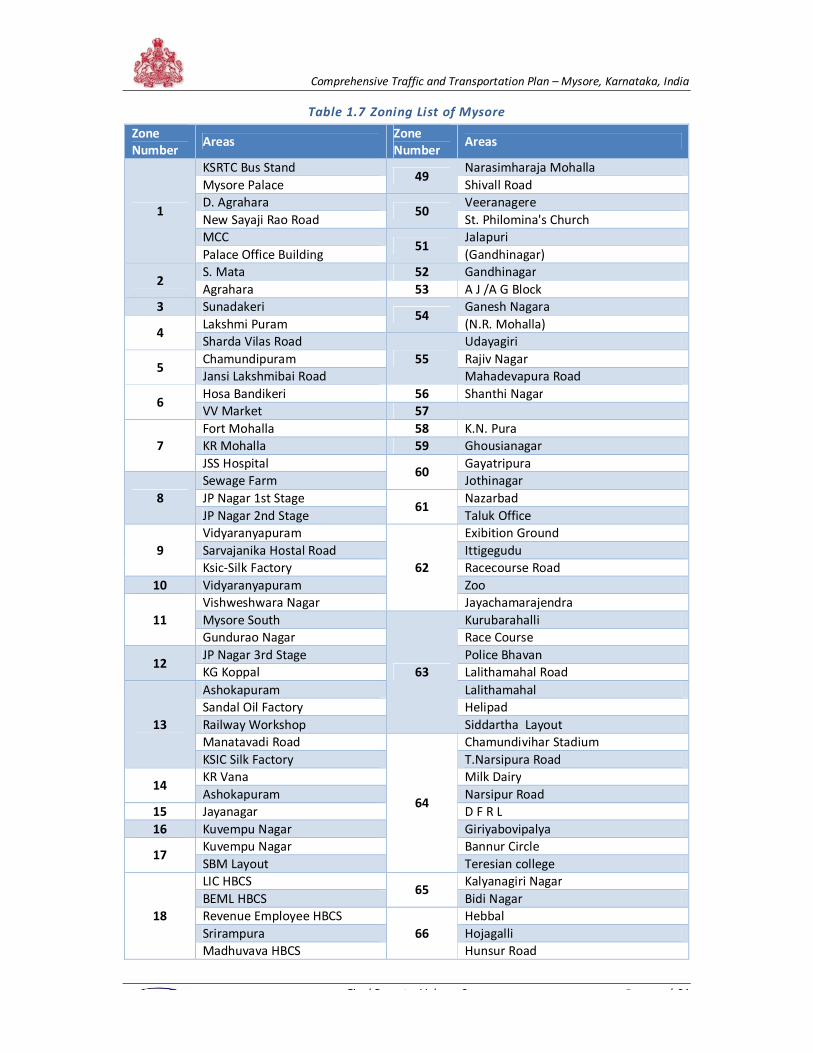
B) Zonal Population
The area and population of the individual administrative wards within Mysore City Corporation limits
for the year 2001 was collected from primary census abstracts of the Directorate of Census
Operations, Karnataka. The city was subdivided into zones based on land use.
The population for Mysore is presented in Table 1.6 below. The zone wise population breakup was
arrived at based on 2001 census data which was extrapolated to base year assuming CAGR of 3.02%.
Table 1.6 Zonal Population
Zone
Number
Zone
Population
Zone
Number
Zone
Population
Zone
Number
Zone
Population
1 13860 23 15124 45 13306
2 15528 24 12953 46 16294
3 15648 25 16426 47 14338
4 16396 26 15334 48 15320
5 14777 27 13666 49 15797
6 14575 28 16167 50 15800
7 15962 29 13767 51 15609
8 15653 30 14716 52 16441
9 11204 31 13992 53 15523
10 14329 32 16411 54 13783
11 16374 33 14305 55 14959
12 16444 34 14603 56 14755
13 13920 35 13762 57 13255
14 13701 36 13825 58 14382
15 12859 37 16418 59 15071
16 13736 38 15911 60 13306
17 13447 39 15381 61 15120
18 14756 40 15650 62 14154
19 12988 41 13642 63 14947
20 14076 42 16158 64 13999
21 12890 43 14686 65 13411
22 16030 44 13803
Total 9,58,433
The entire study area was divided into homogenous zones. For easier analysis, the wards were taken
as zones. The list of internal and external zones is given in the Annexure V.
The entire study area is divided into 108 zones out of which 65 are internal zones within the city &
31 external zones homogenous zones. Based on the data captured at household level matrix has
been developed capturing all zone to zone trip movements. The Zoning List is given in Table 1.7. The
Zoning Map is given in Annexure VI.
Comprehensive Traffic and Transportation Plan – Mysore, Karnataka, India
Final Report – Volume 2 P a g e | 21
Table 1.7 Zoning List of Mysore
Zone
Number Areas
Zone
Number Areas
1
KSRTC Bus Stand 49
Narasimharaja Mohalla
Mysore Palace Shivall Road
D. Agrahara 50
Veeranagere
New Sayaji Rao Road St. Philomina's Church
MCC 51
Jalapuri
Palace Office Building (Gandhinagar)
2 S. Mata 52 Gandhinagar
Agrahara 53 A J /A G Block
3 Sunadakeri 54
Ganesh Nagara
4 Lakshmi Puram (N.R. Mohalla)
Sharda Vilas Road
55
Udayagiri
5 Chamundipuram Rajiv Nagar
Jansi Lakshmibai Road Mahadevapura Road
6 Hosa Bandikeri 56 Shanthi Nagar
VV Market 57
7
Fort Mohalla 58 K.N. Pura
KR Mohalla 59 Ghousianagar
JSS Hospital 60
Gayatripura
8
Sewage Farm Jothinagar
JP Nagar 1st Stage 61
Nazarbad
JP Nagar 2nd Stage Taluk Office
9
Vidyaranyapuram
62
Exibition Ground
Sarvajanika Hostal Road Ittigegudu
Ksic-Silk Factory Racecourse Road
10 Vidyaranyapuram Zoo
11
Vishweshwara Nagar Jayachamarajendra
Mysore South
63
Kurubarahalli
Gundurao Nagar Race Course
12 JP Nagar 3rd Stage Police Bhavan
KG Koppal Lalithamahal Road
13
Ashokapuram Lalithamahal
Sandal Oil Factory Helipad
Railway Workshop Siddartha Layout
Manatavadi Road
64
Chamundivihar Stadium
KSIC Silk Factory T.Narsipura Road
14 KR Vana Milk Dairy
Ashokapuram Narsipur Road
15 Jayanagar D F R L
16 Kuvempu Nagar Giriyabovipalya
17 Kuvempu Nagar Bannur Circle
SBM Layout Teresian college
18
LIC HBCS 65
Kalyanagiri Nagar
BEML HBCS Bidi Nagar
Revenue Employee HBCS
66
Hebbal
Srirampura Hojagalli
Madhuvava HBCS Hunsur Road
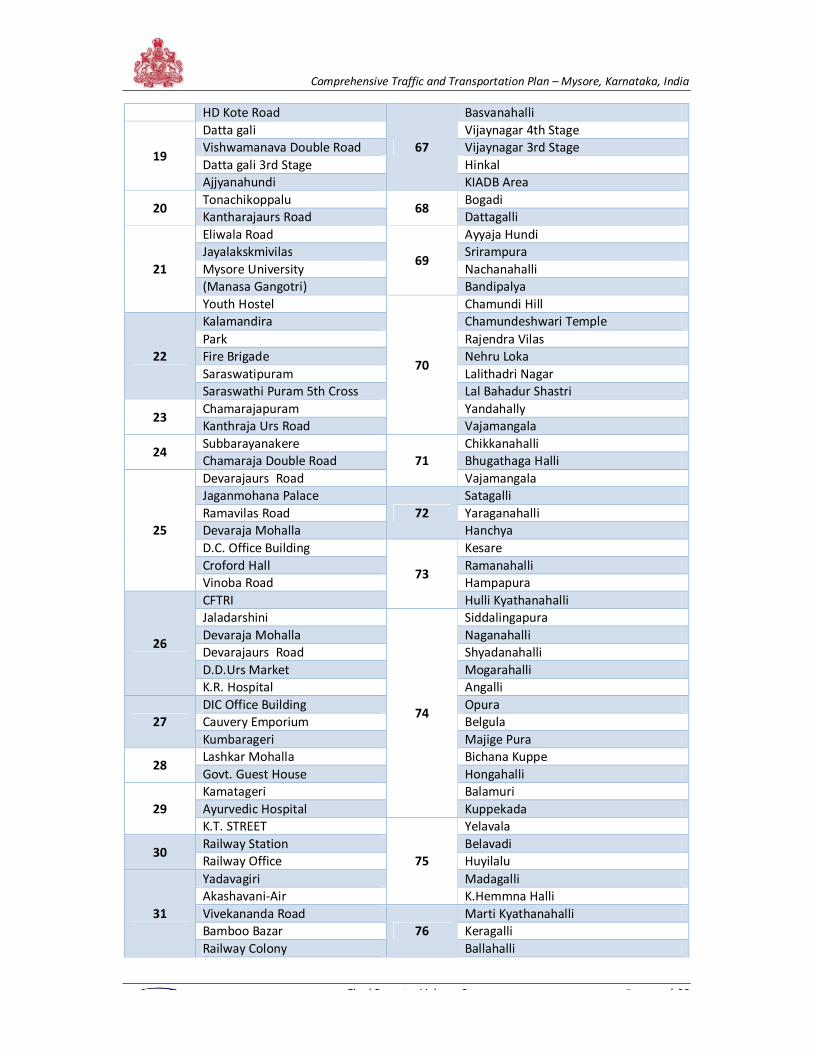
Comprehensive Traffic and Transportation Plan – Mysore, Karnataka, India
Final Report – Volume 2 P a g e | 22
HD Kote Road
67
Basvanahalli
19
Datta gali Vijaynagar 4th Stage
Vishwamanava Double Road Vijaynagar 3rd Stage
Datta gali 3rd Stage Hinkal
Ajjyanahundi KIADB Area
20 Tonachikoppalu
68 Bogadi
Kantharajaurs Road Dattagalli
21
Eliwala Road
69
Ayyaja Hundi
Jayalakskmivilas Srirampura
Mysore University Nachanahalli
(Manasa Gangotri) Bandipalya
Youth Hostel
70
Chamundi Hill
22
Kalamandira Chamundeshwari Temple
Park Rajendra Vilas
Fire Brigade Nehru Loka
Saraswatipuram Lalithadri Nagar
Saraswathi Puram 5th Cross Lal Bahadur Shastri
23 Chamarajapuram Yandahally
Kanthraja Urs Road Vajamangala
24 Subbarayanakere
71
Chikkanahalli
Chamaraja Double Road Bhugathaga Halli
25
Devarajaurs Road Vajamangala
Jaganmohana Palace
72
Satagalli
Ramavilas Road Yaraganahalli
Devaraja Mohalla Hanchya
D.C. Office Building
73
Kesare
Croford Hall Ramanahalli
Vinoba Road Hampapura
26
CFTRI Hulli Kyathanahalli
Jaladarshini
74
Siddalingapura
Devaraja Mohalla Naganahalli
Devarajaurs Road Shyadanahalli
D.D.Urs Market Mogarahalli
K.R. Hospital Angalli
27
DIC Office Building Opura
Cauvery Emporium Belgula
Kumbarageri Majige Pura
28 Lashkar Mohalla Bichana Kuppe
Govt. Guest House Hongahalli
29
Kamatageri Balamuri
Ayurvedic Hospital Kuppekada
K.T. STREET
75
Yelavala
30 Railway Station Belavadi
Railway Office Huyilalu
31
Yadavagiri Madagalli
Akashavani-Air K.Hemmna Halli
Vivekananda Road
76
Marti Kyathanahalli
Bamboo Bazar Keragalli
Railway Colony Ballahalli
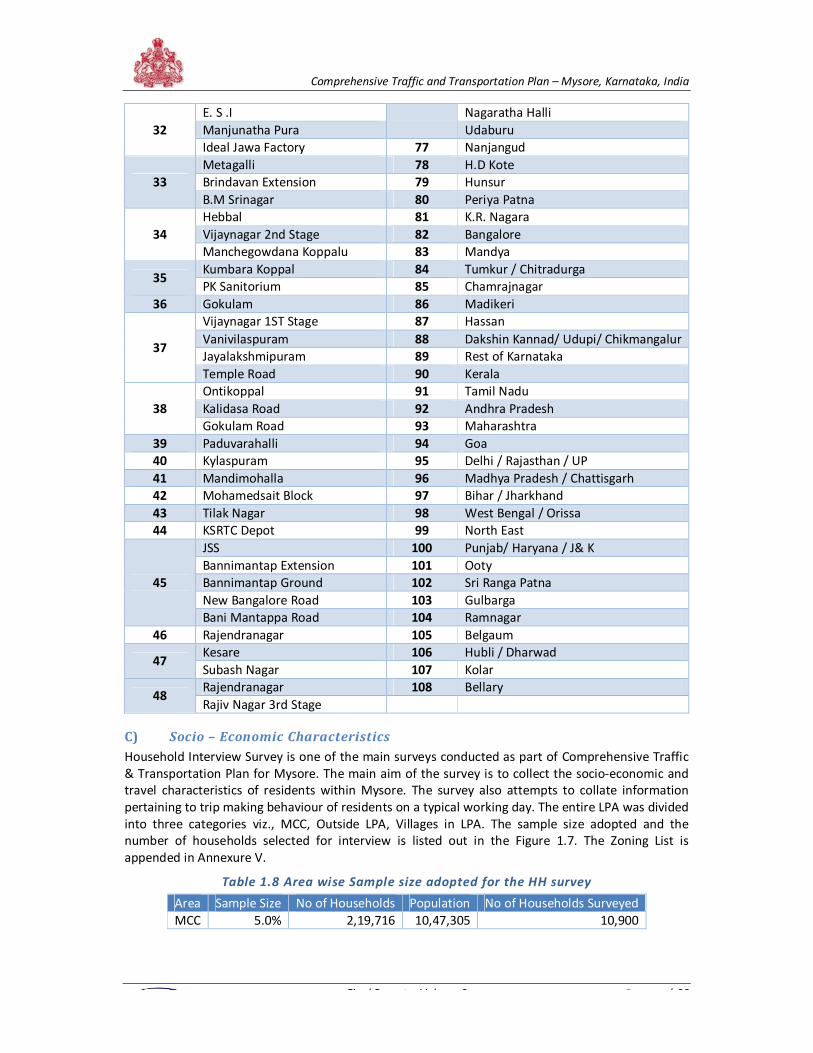
Comprehensive Traffic and Transportation Plan – Mysore, Karnataka, India
Final Report – Volume 2 P a g e | 23
32
E. S .I Nagaratha Halli
Manjunatha Pura Udaburu
Ideal Jawa Factory 77 Nanjangud
33
Metagalli 78 H.D Kote
Brindavan Extension 79 Hunsur
B.M Srinagar 80 Periya Patna
34
Hebbal 81 K.R. Nagara
Vijaynagar 2nd Stage 82 Bangalore
Manchegowdana Koppalu 83 Mandya
35 Kumbara Koppal 84 Tumkur / Chitradurga
PK Sanitorium 85 Chamrajnagar
36 Gokulam 86 Madikeri
37
Vijaynagar 1ST Stage 87 Hassan
Vanivilaspuram 88 Dakshin Kannad/ Udupi/ Chikmangalur
Jayalakshmipuram 89 Rest of Karnataka
Temple Road 90 Kerala
38
Ontikoppal 91 Tamil Nadu
Kalidasa Road 92 Andhra Pradesh
Gokulam Road 93 Maharashtra
39 Paduvarahalli 94 Goa
40 Kylaspuram 95 Delhi / Rajasthan / UP
41 Mandimohalla 96 Madhya Pradesh / Chattisgarh
42 Mohamedsait Block 97 Bihar / Jharkhand
43 Tilak Nagar 98 West Bengal / Orissa
44 KSRTC Depot 99 North East
45
JSS 100 Punjab/ Haryana / J& K
Bannimantap Extension 101 Ooty
Bannimantap Ground 102 Sri Ranga Patna
New Bangalore Road 103 Gulbarga
Bani Mantappa Road 104 Ramnagar
46 Rajendranagar 105 Belgaum
47 Kesare 106 Hubli / Dharwad
Subash Nagar 107 Kolar
48 Rajendranagar 108 Bellary
Rajiv Nagar 3rd Stage
C) Socio – Economic Characteristics
Household Interview Survey is one of the main surveys conducted as part of Comprehensive Traffic
& Transportation Plan for Mysore. The main aim of the survey is to collect the socio-economic and
travel characteristics of residents within Mysore. The survey also attempts to collate information
pertaining to trip making behaviour of residents on a typical working day. The entire LPA was divided
into three categories viz., MCC, Outside LPA, Villages in LPA. The sample size adopted and the
number of households selected for interview is listed out in the Figure 1.7. The Zoning List is
appended in Annexure V.
Table 1.8 Area wise Sample size adopted for the HH survey
Area Sample Size No of Households Population No of Households Surveyed
MCC 5.0% 2,19,716 10,47,305 10,900
Comprehensive Traffic and Transportation Plan – Mysore, Karnataka, India
Final Report – Volume 2 P a g e | 24
It is observed that the average household size as per survey is 5.02 while the same as per the census
2001 stands at 5.32. The details are furnished in the Table 1.9.
Table 1.9 Distribution of Households by Family Size
Zone Group
Household Size (Persons) Avg.
Household
Size 1 2 3 4 5 6 7 8
MCC 0.43 4.46 8.73 28.60 20.51 17.47 11.51 8.29 5.04
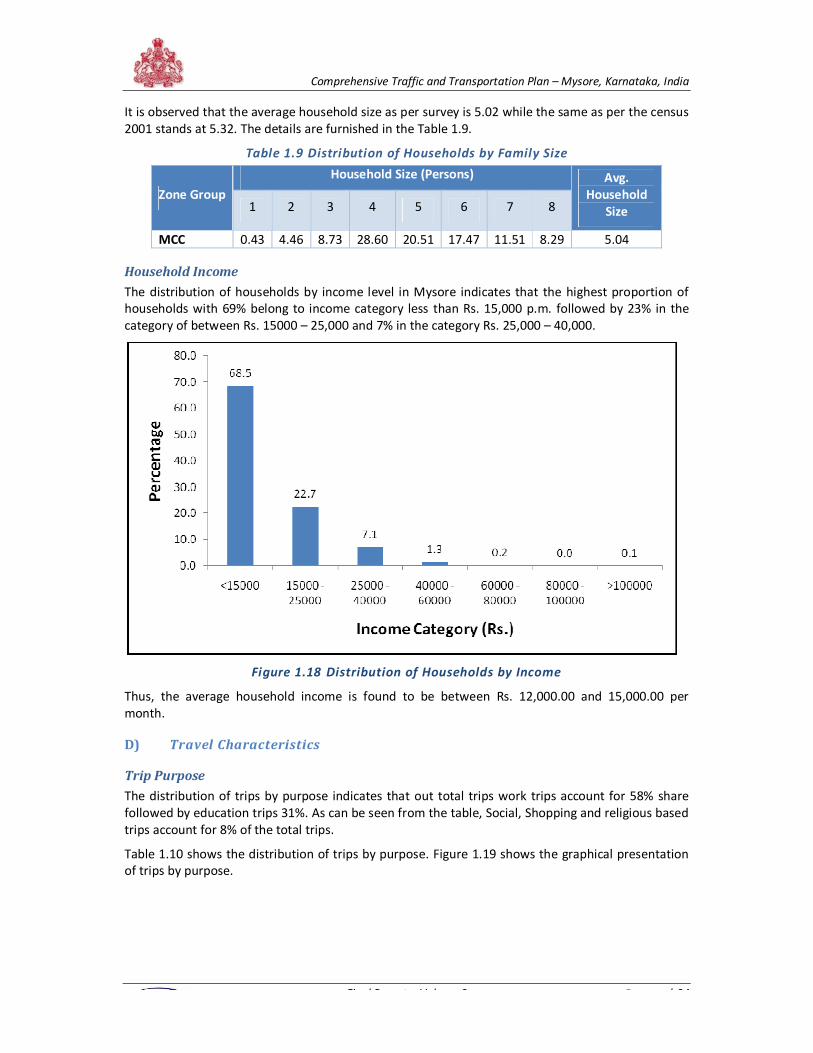
Household Income
The distribution of households by income level in Mysore indicates that the highest proportion of
households with 69% belong to income category less than Rs. 15,000 p.m. followed by 23% in the
category of between Rs. 15000 – 25,000 and 7% in the category Rs. 25,000 – 40,000.
Figure 1.18 Distribution of Households by Income
Thus, the average household income is found to be between Rs. 12,000.00 and 15,000.00 per
month.
D) Travel Characteristics
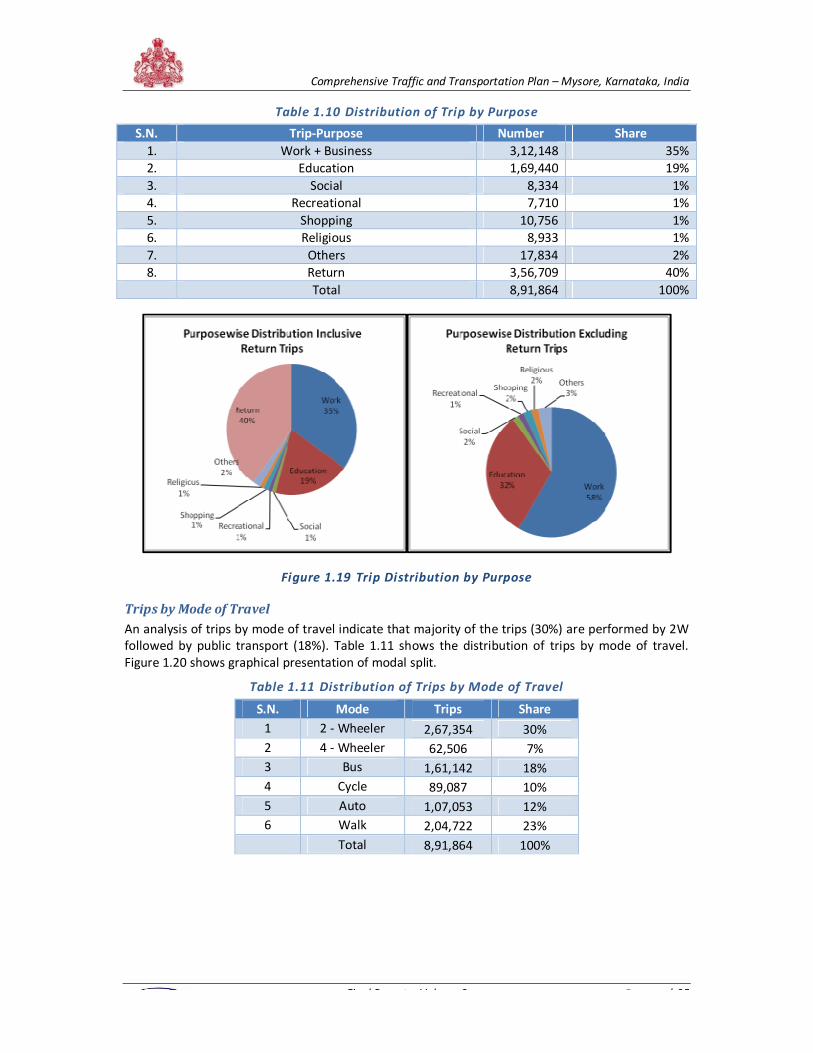
Trip Purpose
The distribution of trips by purpose indicates that out total trips work trips account for 58% share
followed by education trips 31%. As can be seen from the table, Social, Shopping and religious based
trips account for 8% of the total trips.
Table 1.10 shows the distribution of trips by purpose. Figure 1.19 shows the graphical presentation
of trips by purpose.
Comprehensive Traffic and Transportation Plan – Mysore, Karnataka, India
Final Report – Volume 2 P a g e | 25
Table 1.10 Distribution of Trip by Purpose
S.N. Trip-Purpose Number Share
1. Work + Business 3,12,148 35%
2. Education 1,69,440 19%
3. Social 8,334 1%
4. Recreational 7,710 1%
5. Shopping 10,756 1%
6. Religious 8,933 1%
7. Others 17,834 2%
8. Return 3,56,709 40%
Total 8,91,864 100%
Figure 1.19 Trip Distribution by Purpose
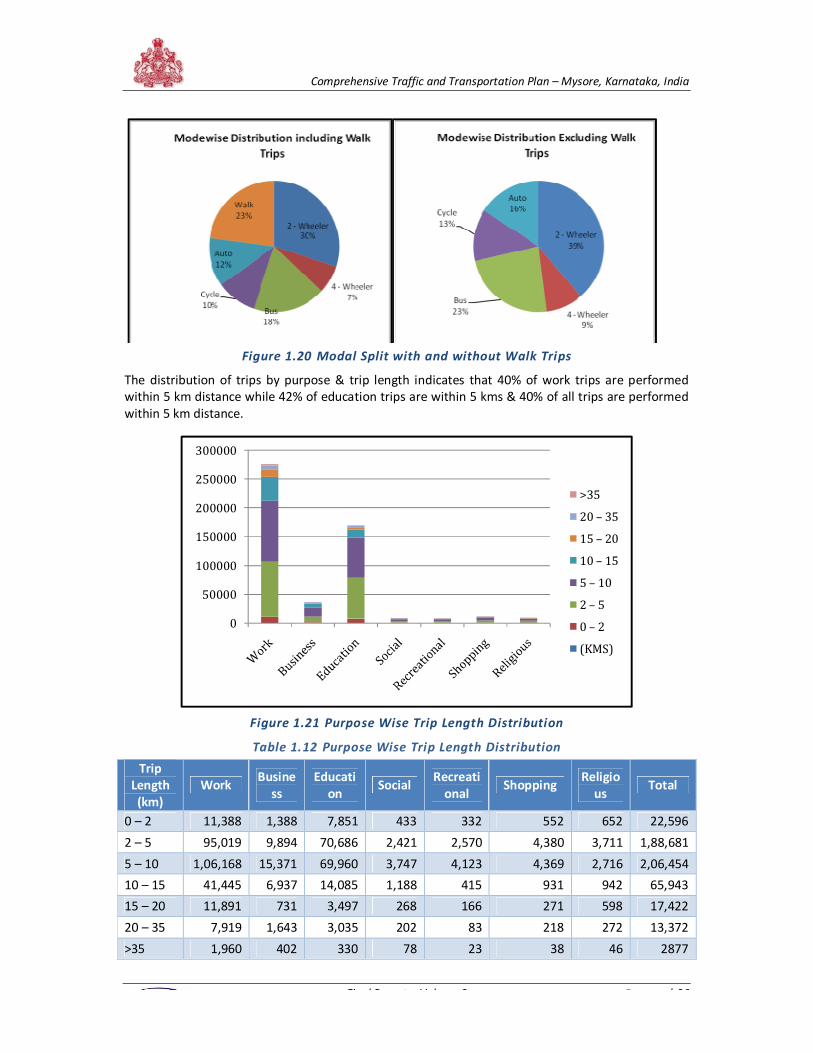
Trips by Mode of Travel
An analysis of trips by mode of travel indicate that majority of the trips (30%) are performed by 2W
followed by public transport (18%). Table 1.11 shows the distribution of trips by mode of travel.
Figure 1.20 shows graphical presentation of modal split.
Table 1.11 Distribution of Trips by Mode of Travel
S.N. Mode Trips Share
1 2 - Wheeler 2,67,354 30%
2 4 - Wheeler 62,506 7%
3 Bus 1,61,142 18%
4 Cycle 89,087 10%
5 Auto 1,07,053 12%
6 Walk 2,04,722 23%
Total 8,91,864 100%
Comprehensive Traffic and Transportation Plan – Mysore, Karnataka, India
Final Report – Volume 2 P a g e | 26
Figure 1.20 Modal Split with and without Walk Trips
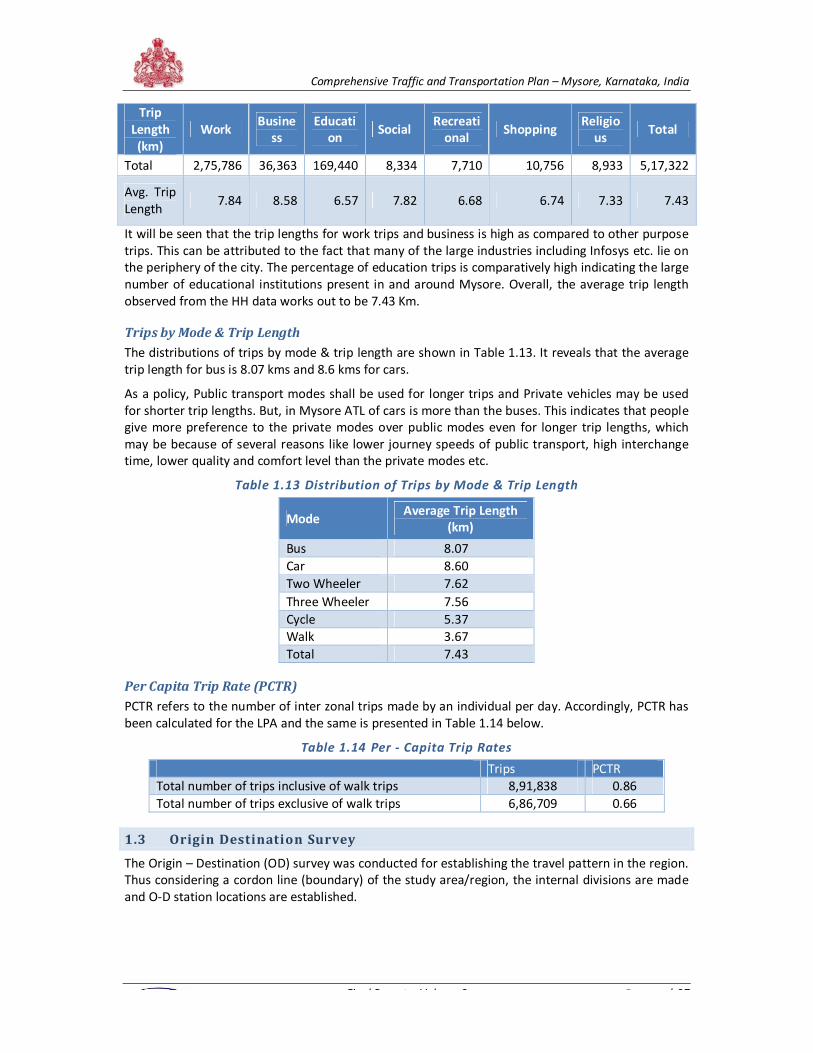
The distribution of trips by purpose & trip length indicates that 40% of work trips are performed
within 5 km distance while 42% of education trips are within 5 kms & 40% of all trips are performed
within 5 km distance.
Figure 1.21 Purpose Wise Trip Length Distribution
Table 1.12 Purpose Wise Trip Length Distribution
Trip
Length
(km)
Work Busine
ss
Educati
on Social
Recreati
onal Shopping
Religio
us Total
0 – 2 11,388 1,388 7,851 433 332 552 652 22,596
2 – 5 95,019 9,894 70,686 2,421 2,570 4,380 3,711 1,88,681
5 – 10 1,06,168 15,371 69,960 3,747 4,123 4,369 2,716 2,06,454
10 – 15 41,445 6,937 14,085 1,188 415 931 942 65,943
15 – 20 11,891 731 3,497 268 166 271 598 17,422
20 – 35 7,919 1,643 3,035 202 83 218 272 13,372
>35 1,960 402 330 78 23 38 46 2877
0
50000
100000
150000
200000
250000
300000
>35
20 – 35
15 – 20
10 – 15
5 – 10
2 – 5
0 – 2
(KMS)
Comprehensive Traffic and Transportation Plan – Mysore, Karnataka, India
Final Report – Volume 2 P a g e | 27
Trip
Length
(km)
Work Busine
ss
Educati
on Social
Recreati
onal Shopping
Religio
us Total
Total 2,75,786 36,363 169,440 8,334 7,710 10,756 8,933 5,17,322
Avg. Trip
Length 7.84 8.58 6.57 7.82 6.68 6.74 7.33 7.43
It will be seen that the trip lengths for work trips and business is high as compared to other purpose
trips. This can be attributed to the fact that many of the large industries including Infosys etc. lie on
the periphery of the city. The percentage of education trips is comparatively high indicating the large
number of educational institutions present in and around Mysore. Overall, the average trip length
observed from the HH data works out to be 7.43 Km.
Trips by Mode & Trip Length
The distributions of trips by mode & trip length are shown in Table 1.13. It reveals that the average
trip length for bus is 8.07 kms and 8.6 kms for cars.
As a policy, Public transport modes shall be used for longer trips and Private vehicles may be used
for shorter trip lengths. But, in Mysore ATL of cars is more than the buses. This indicates that people
give more preference to the private modes over public modes even for longer trip lengths, which
may be because of several reasons like lower journey speeds of public transport, high interchange
time, lower quality and comfort level than the private modes etc.
Table 1.13 Distribution of Trips by Mode & Trip Length
Mode Average Trip Length
(km)
Bus 8.07
Car 8.60
Two Wheeler 7.62
Three Wheeler 7.56
Cycle 5.37
Walk 3.67
Total 7.43
Per Capita Trip Rate (PCTR)
PCTR refers to the number of inter zonal trips made by an individual per day. Accordingly, PCTR has
been calculated for the LPA and the same is presented in Table 1.14 below.
Table 1.14 Per - Capita Trip Rates
Trips PCTR
Total number of trips inclusive of walk trips 8,91,838 0.86
Total number of trips exclusive of walk trips 6,86,709 0.66
1.3 Origin Destination Survey
The Origin – Destination (OD) survey was conducted for establishing the travel pattern in the region.
Thus considering a cordon line (boundary) of the study area/region, the internal divisions are made
and O-D station locations are established.
Comprehensive Traffic and Transportation Plan – Mysore, Karnataka, India
Final Report – Volume 2 P a g e | 28
The origin - destination surveys was conducted by means of the roadside interview method at
selected locations (listed below) to capture major trip desires in each section. The surveys were
conducted on 3 days for 16 hours on a random sampling basis. All categories of motorized vehicles
(e.g. Cars, Buses, LGV, Trucks), was surveyed for their trip origin, destination, trip purpose,
occupancy and weight of commodity carried. The survey crew was organized into 2 shifts of 8 hours
with sufficient enumerators for each direction of flow. These enumerators were fully trained in the
use of standard interview sheets. Police help was sought to ensure smooth flow of traffic and to stop
randomly selected vehicles. The target sample size for the survey was maintained at levels across
vehicle categories as specified for such an exercise. The origin – destination survey was conducted as
per the provisions of IRC Guidelines (IRC 102-1988). The locations for Origin Destination survey are
given in Annexure III.
The locations of the Origin Destination Survey are given in the Table 1.15 below.
Table 1.15 Origin Destination Survey Locations
Origin – Destination Survey
Location
Origin – Destination Survey
Location
Origin – Destination Survey
Location
Bangalore Road Mahadevpura Road T. Narsipura Road
Nilgiri Road H D Kote Road Vishwamanava Double Road
Bogadi Road Hunsur Road
The O-D surveys were conducted at inner and outer cordon locations to gauge the intra and inter
city traffic and travel pattern. The surveys aimed at collecting information pertaining to sampled
trips (origin, destination, mode, purpose, and time and vehicle occupancy) from vehicles interviewed
at the roadside. Systematic random sampling was adopted for the said purpose. It was ensured that
the sample size at any one point was a minimal of 10%. The O-D survey was carried out for 16 hours
on a typical weekday. The survey was commenced at 7.00 A.M and concluded at 11.00 PM. The
vehicles were interviewed as per the sample design based upon overall midblock counts & relative
modal split. Police assistance was solicited for stopping the vehicles. The sample size collected at
each of the OD Location is given in Table 1.16.
Table 1.16 O-D survey locations and sample size
Count
Station Location
Vehicle
Category
Total
Flow
Samples
Interviewed
OD-1 Bangalore Road Passenger Vehicles 35,305 12%
Goods Vehicles 16,006 17%
OD-2 HD Kote Road Passenger Vehicles 14,986 14%
Goods Vehicles 4,006 13%
OD-3 Hunsur Road Passenger Vehicles 14,440 11%
Goods Vehicles 3,278 16%
OD – 4 KRS Road Passenger Vehicles 27,823 12%
Goods Vehicles 7,101 16%
OD – 5 Mahadevpura Passenger Vehicles 19,240 17%
Goods Vehicles 6,489 14%
OD – 6 T. Narsipur Road Passenger Vehicles 18,858 16%
Goods Vehicles 7,285 13%
OD – 7 Nilgiri Road Passenger Vehicles 15,761 12%
Goods Vehicles 8,397 13%
OD – 8 Vishwamanava Double
Road
Passenger Vehicles 13,954 14%
Goods Vehicles 413 13%
Comprehensive Traffic and Transportation Plan – Mysore, Karnataka, India
Final Report – Volume 2 P a g e | 29
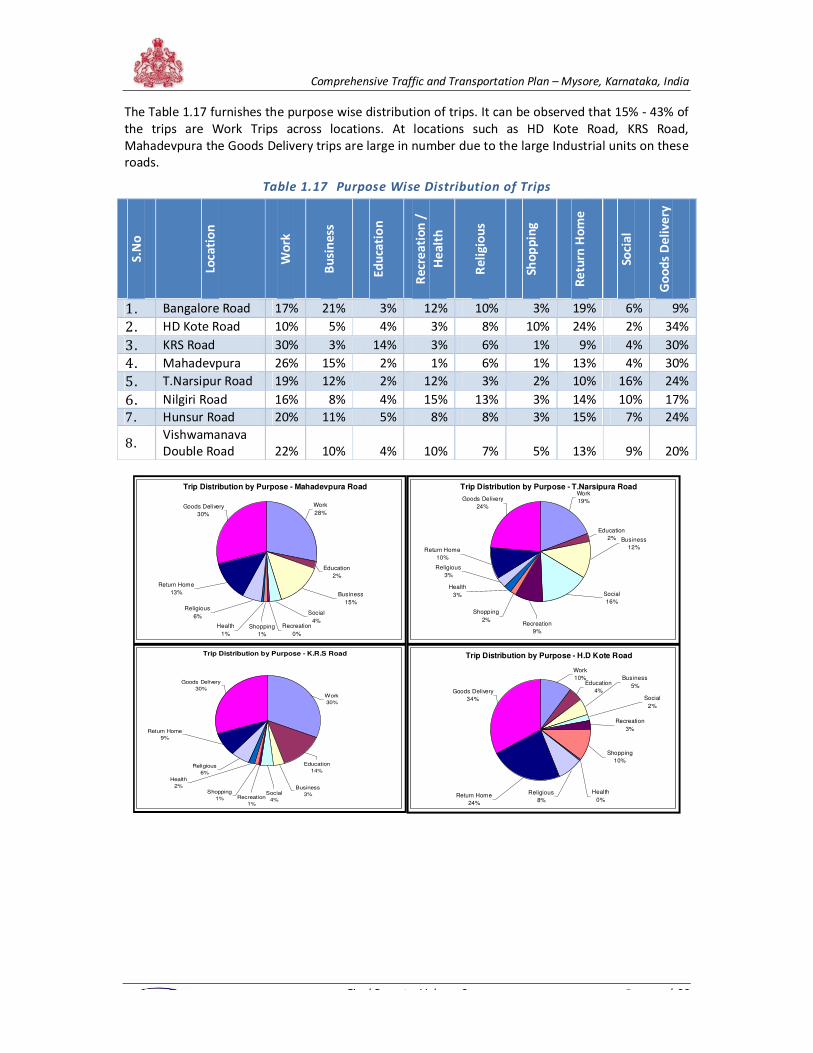
The Table 1.17 furnishes the purpose wise distribution of trips. It can be observed that 15% - 43% of
the trips are Work Trips across locations. At locations such as HD Kote Road, KRS Road,
Mahadevpura the Goods Delivery trips are large in number due to the large Industrial units on these
roads.
Table 1.17 Purpose Wise Distribution of Trips
S.N
o
Loca
tio
n
Wo
rk
Bu
sin
ess
Ed
uca
tio
n
Re
cre
ati
on
/
He
alt
h
Re
lig
iou
s
Sho
pp
ing
Re
turn
Ho
me
Soci
al
Go
od
s D
eli
ve
ry
1. Bangalore Road 17% 21% 3% 12% 10% 3% 19% 6% 9%
2. HD Kote Road 10% 5% 4% 3% 8% 10% 24% 2% 34%
3. KRS Road 30% 3% 14% 3% 6% 1% 9% 4% 30%
4. Mahadevpura 26% 15% 2% 1% 6% 1% 13% 4% 30%
5. T.Narsipur Road 19% 12% 2% 12% 3% 2% 10% 16% 24%
6. Nilgiri Road 16% 8% 4% 15% 13% 3% 14% 10% 17%
7. Hunsur Road 20% 11% 5% 8% 8% 3% 15% 7% 24%
8. Vishwamanava
Double Road 22% 10% 4% 10% 7% 5% 13% 9% 20%
Trip Distribution by Purpose - Mahadevpura Road
Recreation
0%
Social
4%
Business
15%
Education
2%
Work
28%Goods Delivery
30%
Return Home
13%
Religious
6%
Shopping
1%
Health
1%
Trip Distribution by Purpose - T.Narsipura Road
Recreation
9%
Social
16%
Business
12%
Education
2%
Work
19%Goods Delivery
24%
Return Home
10%
Religious
3%
Shopping
2%
Health
3%
Trip Distribution by Purpose - K.R.S Road
Recreation
1%
Social
4%
Business
3%
Education
14%
Work
30%
Goods Delivery
30%
Return Home
9%
Religious
6%
Shopping
1%
Health
2%
Trip Distribution by Purpose - H.D Kote Road
Recreation
3%
Social
2%
Business
5%Education
4%
Work
10%
Goods Delivery
34%
Return Home
24%
Religious
8%
Shopping
10%
Health
0%
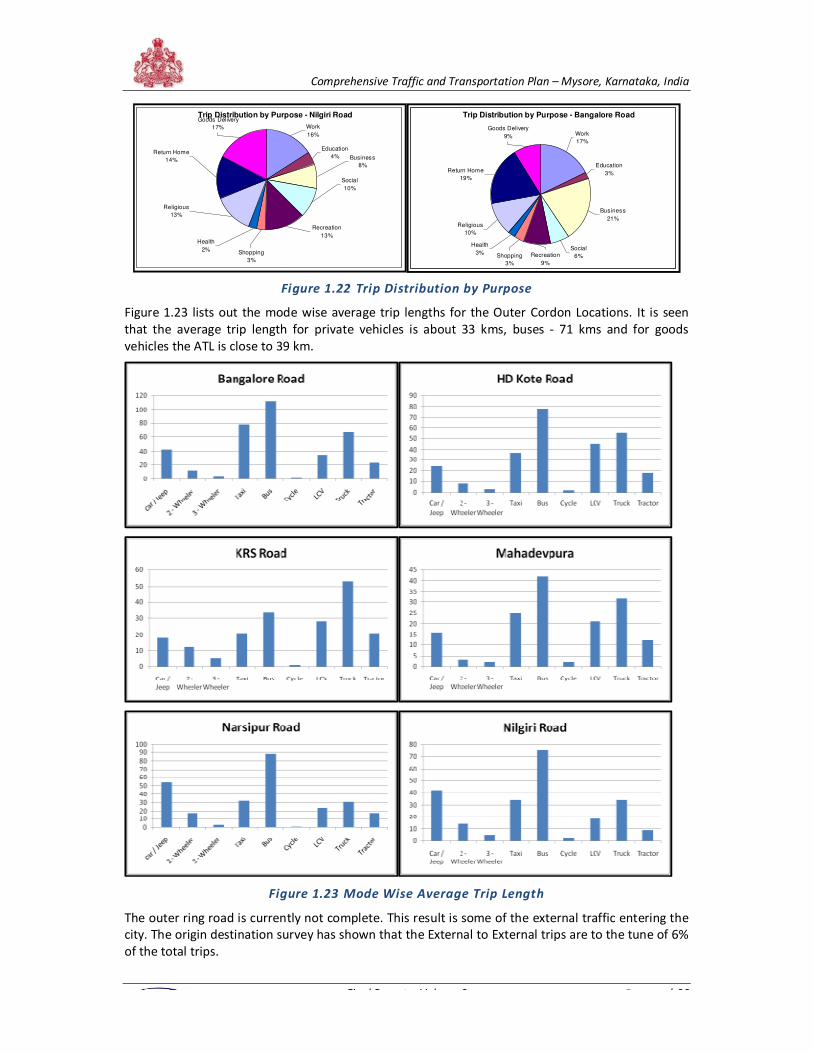
Comprehensive Traffic and Transportation Plan – Mysore, Karnataka, India
Final Report – Volume 2 P a g e | 30
Figure 1.22 Trip Distribution by Purpose
Figure 1.23 lists out the mode wise average trip lengths for the Outer Cordon Locations. It is seen
that the average trip length for private vehicles is about 33 kms, buses - 71 kms and for goods
vehicles the ATL is close to 39 km.
Figure 1.23 Mode Wise Average Trip Length
The outer ring road is currently not complete. This result is some of the external traffic entering the
city. The origin destination survey has shown that the External to External trips are to the tune of 6%
of the total trips.
Trip Distribution by Purpose - Nilgiri Road
Recreation
13%
Social
10%
Business
8%
Education
4%
Work
16%
Goods Delivery
17%
Return Home
14%
Religious
13%
Shopping
3%
Health
2%
Trip Distribution by Purpose - Bangalore Road
Recreation
9%
Social
6%
Business
21%
Education
3%
Work
17%
Goods Delivery
9%
Return Home
19%
Religious
10%
Shopping
3%
Health
3%
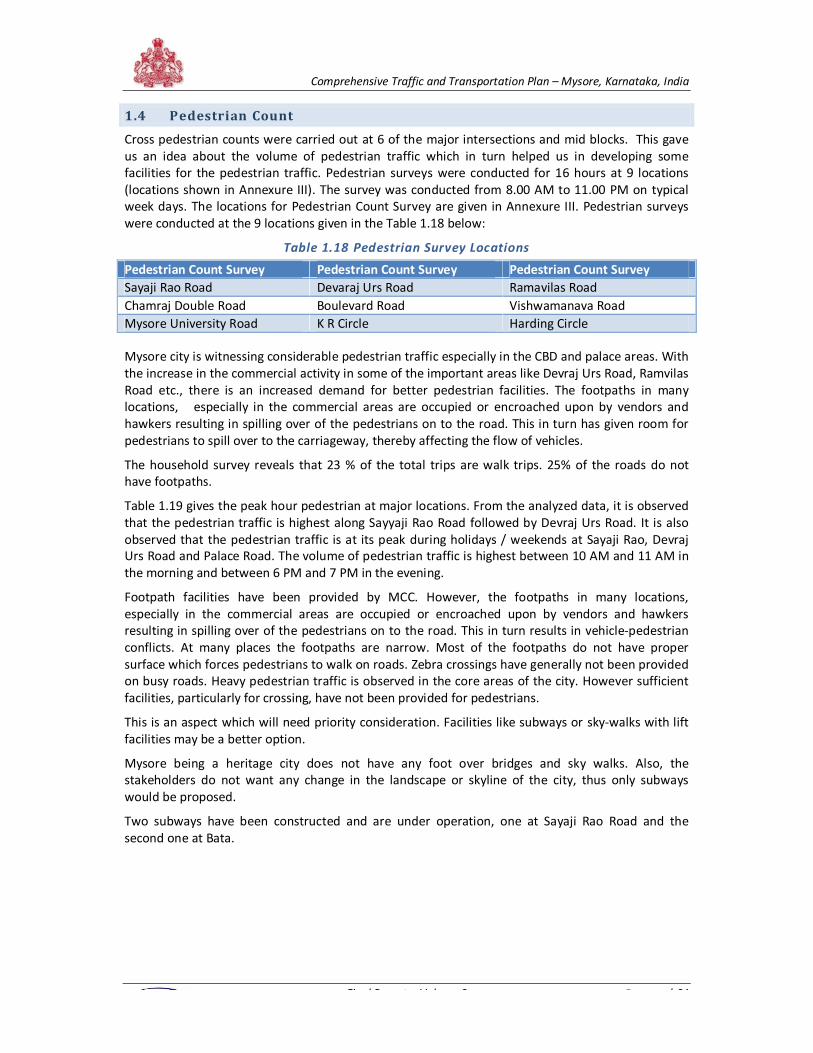
Comprehensive Traffic and Transportation Plan – Mysore, Karnataka, India
Final Report – Volume 2 P a g e | 31
1.4 Pedestrian Count
Cross pedestrian counts were carried out at 6 of the major intersections and mid blocks. This gave
us an idea about the volume of pedestrian traffic which in turn helped us in developing some
facilities for the pedestrian traffic. Pedestrian surveys were conducted for 16 hours at 9 locations
(locations shown in Annexure III). The survey was conducted from 8.00 AM to 11.00 PM on typical
week days. The locations for Pedestrian Count Survey are given in Annexure III. Pedestrian surveys
were conducted at the 9 locations given in the Table 1.18 below:
Table 1.18 Pedestrian Survey Locations
Pedestrian Count Survey Pedestrian Count Survey Pedestrian Count Survey
Sayaji Rao Road Devaraj Urs Road Ramavilas Road
Chamraj Double Road Boulevard Road Vishwamanava Road
Mysore University Road K R Circle Harding Circle
Mysore city is witnessing considerable pedestrian traffic especially in the CBD and palace areas. With
the increase in the commercial activity in some of the important areas like Devraj Urs Road, Ramvilas
Road etc., there is an increased demand for better pedestrian facilities. The footpaths in many
locations, especially in the commercial areas are occupied or encroached upon by vendors and
hawkers resulting in spilling over of the pedestrians on to the road. This in turn has given room for
pedestrians to spill over to the carriageway, thereby affecting the flow of vehicles.
The household survey reveals that 23 % of the total trips are walk trips. 25% of the roads do not
have footpaths.
Table 1.19 gives the peak hour pedestrian at major locations. From the analyzed data, it is observed
that the pedestrian traffic is highest along Sayyaji Rao Road followed by Devraj Urs Road. It is also
observed that the pedestrian traffic is at its peak during holidays / weekends at Sayaji Rao, Devraj
Urs Road and Palace Road. The volume of pedestrian traffic is highest between 10 AM and 11 AM in
the morning and between 6 PM and 7 PM in the evening.
Footpath facilities have been provided by MCC. However, the footpaths in many locations,
especially in the commercial areas are occupied or encroached upon by vendors and hawkers
resulting in spilling over of the pedestrians on to the road. This in turn results in vehicle-pedestrian
conflicts. At many places the footpaths are narrow. Most of the footpaths do not have proper
surface which forces pedestrians to walk on roads. Zebra crossings have generally not been provided
on busy roads. Heavy pedestrian traffic is observed in the core areas of the city. However sufficient
facilities, particularly for crossing, have not been provided for pedestrians.
This is an aspect which will need priority consideration. Facilities like subways or sky-walks with lift
facilities may be a better option.
Mysore being a heritage city does not have any foot over bridges and sky walks. Also, the
stakeholders do not want any change in the landscape or skyline of the city, thus only subways
would be proposed.
Two subways have been constructed and are under operation, one at Sayaji Rao Road and the
second one at Bata.
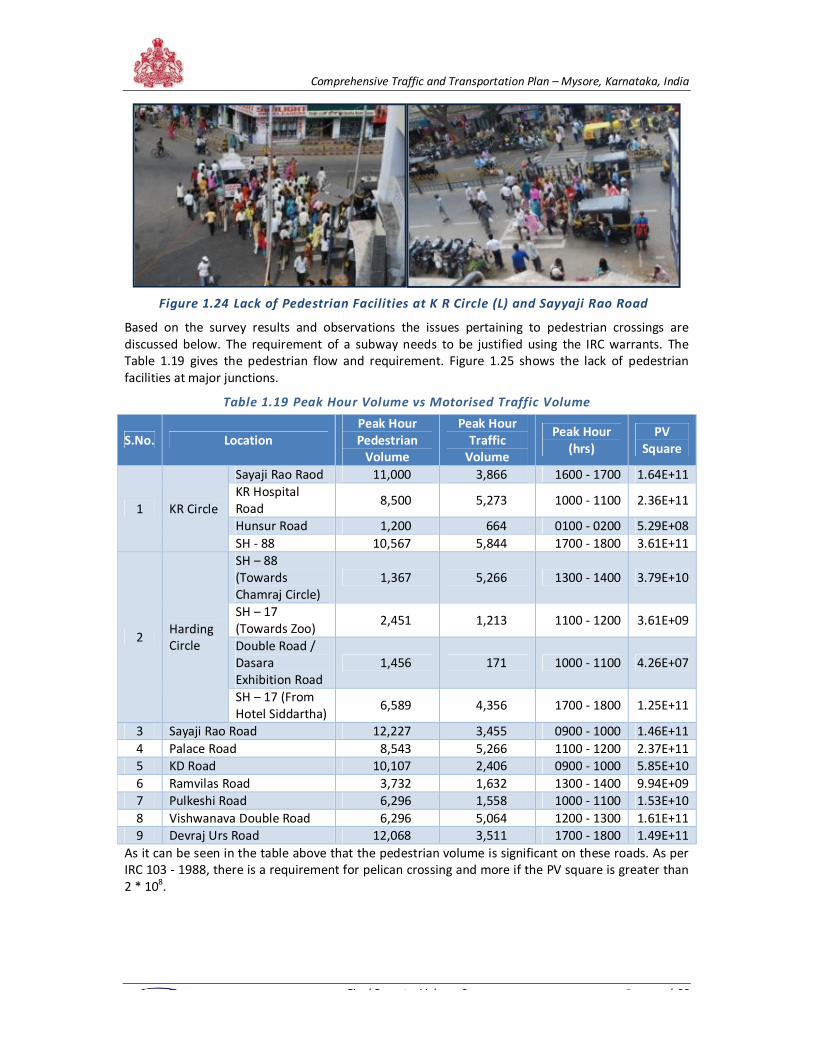
Comprehensive Traffic and Transportation Plan – Mysore, Karnataka, India
Final Report – Volume 2 P a g e | 32
Figure 1.24 Lack of Pedestrian Facilities at K R Circle (L) and Sayyaji Rao Road
Based on the survey results and observations the issues pertaining to pedestrian crossings are
discussed below. The requirement of a subway needs to be justified using the IRC warrants. The
Table 1.19 gives the pedestrian flow and requirement. Figure 1.25 shows the lack of pedestrian
facilities at major junctions.
Table 1.19 Peak Hour Volume vs Motorised Traffic Volume
S.No. Location
Peak Hour
Pedestrian
Volume
Peak Hour
Traffic
Volume
Peak Hour
(hrs)
PV
Square
1 KR Circle
Sayaji Rao Raod 11,000 3,866 1600 - 1700 1.64E+11
KR Hospital
Road 8,500 5,273 1000 - 1100 2.36E+11
Hunsur Road 1,200 664 0100 - 0200 5.29E+08
SH - 88 10,567 5,844 1700 - 1800 3.61E+11
2 Harding
Circle
SH – 88
(Towards
Chamraj Circle)
1,367 5,266 1300 - 1400 3.79E+10
SH – 17
(Towards Zoo) 2,451 1,213 1100 - 1200 3.61E+09
Double Road /
Dasara
Exhibition Road
1,456 171 1000 - 1100 4.26E+07
SH – 17 (From
Hotel Siddartha) 6,589 4,356 1700 - 1800 1.25E+11
3 Sayaji Rao Road 12,227 3,455 0900 - 1000 1.46E+11
4 Palace Road 8,543 5,266 1100 - 1200 2.37E+11
5 KD Road 10,107 2,406 0900 - 1000 5.85E+10
6 Ramvilas Road 3,732 1,632 1300 - 1400 9.94E+09
7 Pulkeshi Road 6,296 1,558 1000 - 1100 1.53E+10
8 Vishwanava Double Road 6,296 5,064 1200 - 1300 1.61E+11
9 Devraj Urs Road 12,068 3,511 1700 - 1800 1.49E+11
As it can be seen in the table above that the pedestrian volume is significant on these roads. As per
IRC 103 - 1988, there is a requirement for pelican crossing and more if the PV square is greater than
2 * 108.
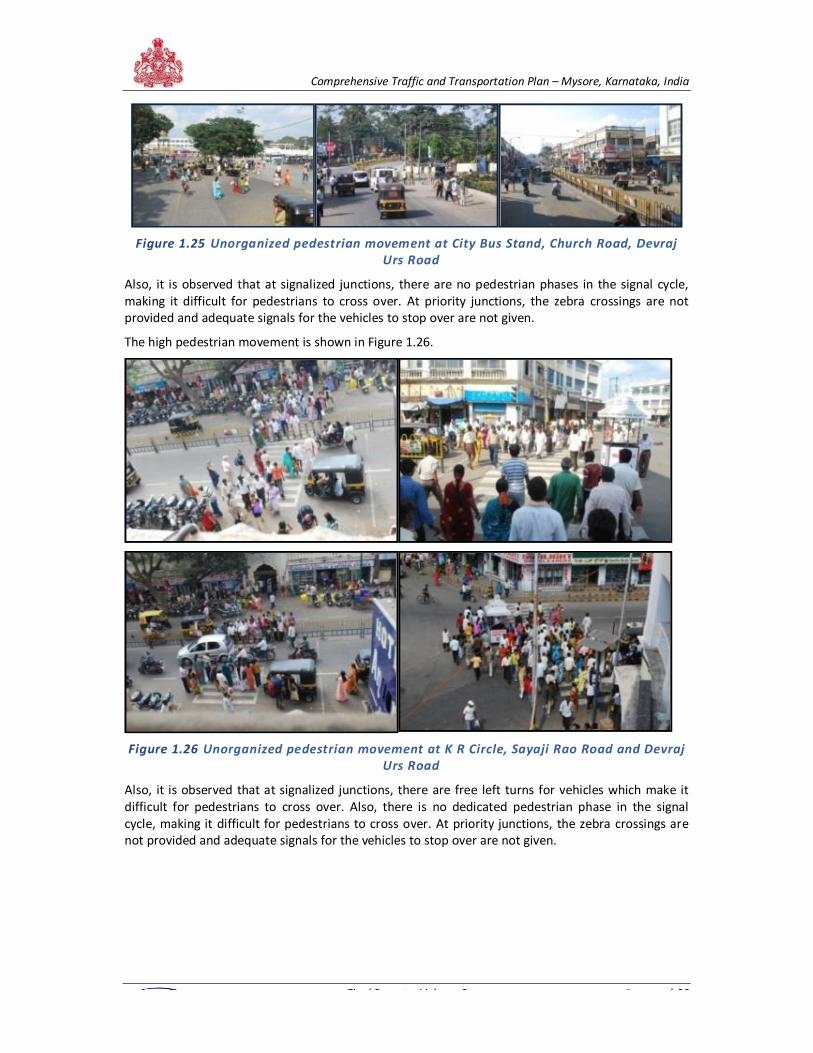
Comprehensive Traffic and Transportation Plan – Mysore, Karnataka, India
Final Report – Volume 2 P a g e | 33
Figure 1.25 Unorganized pedestrian movement at City Bus Stand, Church Road, Devraj
Urs Road
Also, it is observed that at signalized junctions, there are no pedestrian phases in the signal cycle,
making it difficult for pedestrians to cross over. At priority junctions, the zebra crossings are not
provided and adequate signals for the vehicles to stop over are not given.
The high pedestrian movement is shown in Figure 1.26.
Figure 1.26 Unorganized pedestrian movement at K R Circle, Sayaji Rao Road and Devraj
Urs Road
Also, it is observed that at signalized junctions, there are free left turns for vehicles which make it
difficult for pedestrians to cross over. Also, there is no dedicated pedestrian phase in the signal
cycle, making it difficult for pedestrians to cross over. At priority junctions, the zebra crossings are
not provided and adequate signals for the vehicles to stop over are not given.
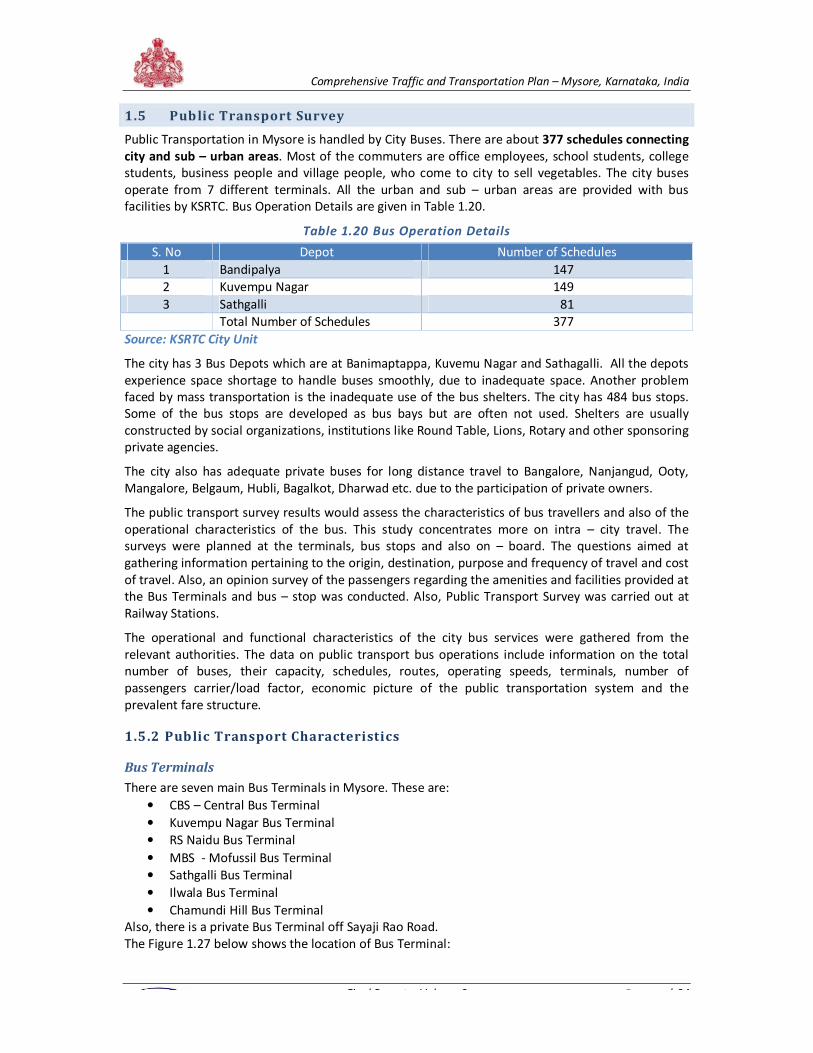
Comprehensive Traffic and Transportation Plan – Mysore, Karnataka, India
Final Report – Volume 2 P a g e | 34
1.5 Public Transport Survey
Public Transportation in Mysore is handled by City Buses. There are about 377 schedules connecting
city and sub – urban areas. Most of the commuters are office employees, school students, college
students, business people and village people, who come to city to sell vegetables. The city buses
operate from 7 different terminals. All the urban and sub – urban areas are provided with bus
facilities by KSRTC. Bus Operation Details are given in Table 1.20.
Table 1.20 Bus Operation Details
S. No Depot Number of Schedules
1 Bandipalya 147
2 Kuvempu Nagar 149
3 Sathgalli 81
Total Number of Schedules 377
Source: KSRTC City Unit
The city has 3 Bus Depots which are at Banimaptappa, Kuvemu Nagar and Sathagalli. All the depots
experience space shortage to handle buses smoothly, due to inadequate space. Another problem
faced by mass transportation is the inadequate use of the bus shelters. The city has 484 bus stops.
Some of the bus stops are developed as bus bays but are often not used. Shelters are usually
constructed by social organizations, institutions like Round Table, Lions, Rotary and other sponsoring
private agencies.
The city also has adequate private buses for long distance travel to Bangalore, Nanjangud, Ooty,
Mangalore, Belgaum, Hubli, Bagalkot, Dharwad etc. due to the participation of private owners.
The public transport survey results would assess the characteristics of bus travellers and also of the
operational characteristics of the bus. This study concentrates more on intra – city travel. The
surveys were planned at the terminals, bus stops and also on – board. The questions aimed at
gathering information pertaining to the origin, destination, purpose and frequency of travel and cost
of travel. Also, an opinion survey of the passengers regarding the amenities and facilities provided at
the Bus Terminals and bus – stop was conducted. Also, Public Transport Survey was carried out at
Railway Stations.
The operational and functional characteristics of the city bus services were gathered from the
relevant authorities. The data on public transport bus operations include information on the total
number of buses, their capacity, schedules, routes, operating speeds, terminals, number of
passengers carrier/load factor, economic picture of the public transportation system and the
prevalent fare structure.
1.5.2 Public Transport Characteristics
Bus Terminals
There are seven main Bus Terminals in Mysore. These are:
• CBS – Central Bus Terminal
• Kuvempu Nagar Bus Terminal
• RS Naidu Bus Terminal
• MBS - Mofussil Bus Terminal
• Sathgalli Bus Terminal
• Ilwala Bus Terminal
• Chamundi Hill Bus Terminal
Also, there is a private Bus Terminal off Sayaji Rao Road.
The Figure 1.27 below shows the location of Bus Terminal:
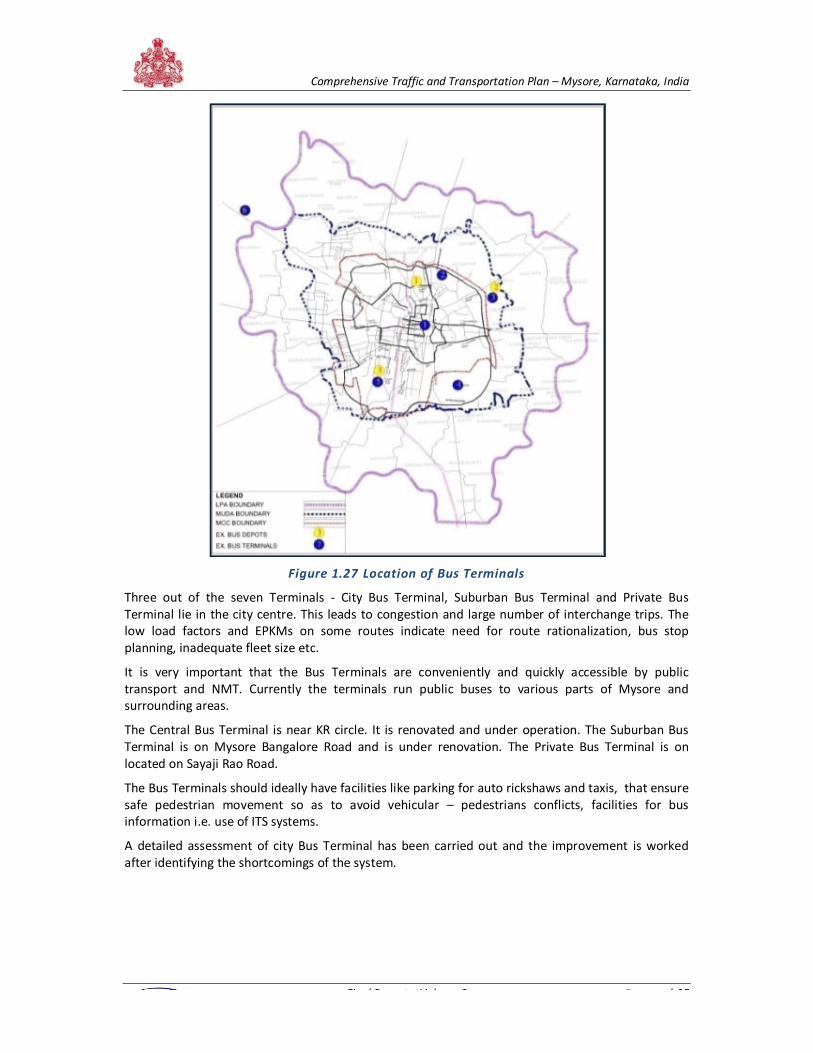
Comprehensive Traffic and Transportation Plan – Mysore, Karnataka, India
Final Report – Volume 2 P a g e | 35
Figure 1.27 Location of Bus Terminals
Three out of the seven Terminals - City Bus Terminal, Suburban Bus Terminal and Private Bus
Terminal lie in the city centre. This leads to congestion and large number of interchange trips. The
low load factors and EPKMs on some routes indicate need for route rationalization, bus stop
planning, inadequate fleet size etc.
It is very important that the Bus Terminals are conveniently and quickly accessible by public
transport and NMT. Currently the terminals run public buses to various parts of Mysore and
surrounding areas.
The Central Bus Terminal is near KR circle. It is renovated and under operation. The Suburban Bus
Terminal is on Mysore Bangalore Road and is under renovation. The Private Bus Terminal is on
located on Sayaji Rao Road.
The Bus Terminals should ideally have facilities like parking for auto rickshaws and taxis, that ensure
safe pedestrian movement so as to avoid vehicular – pedestrians conflicts, facilities for bus
information i.e. use of ITS systems.
A detailed assessment of city Bus Terminal has been carried out and the improvement is worked
after identifying the shortcomings of the system.
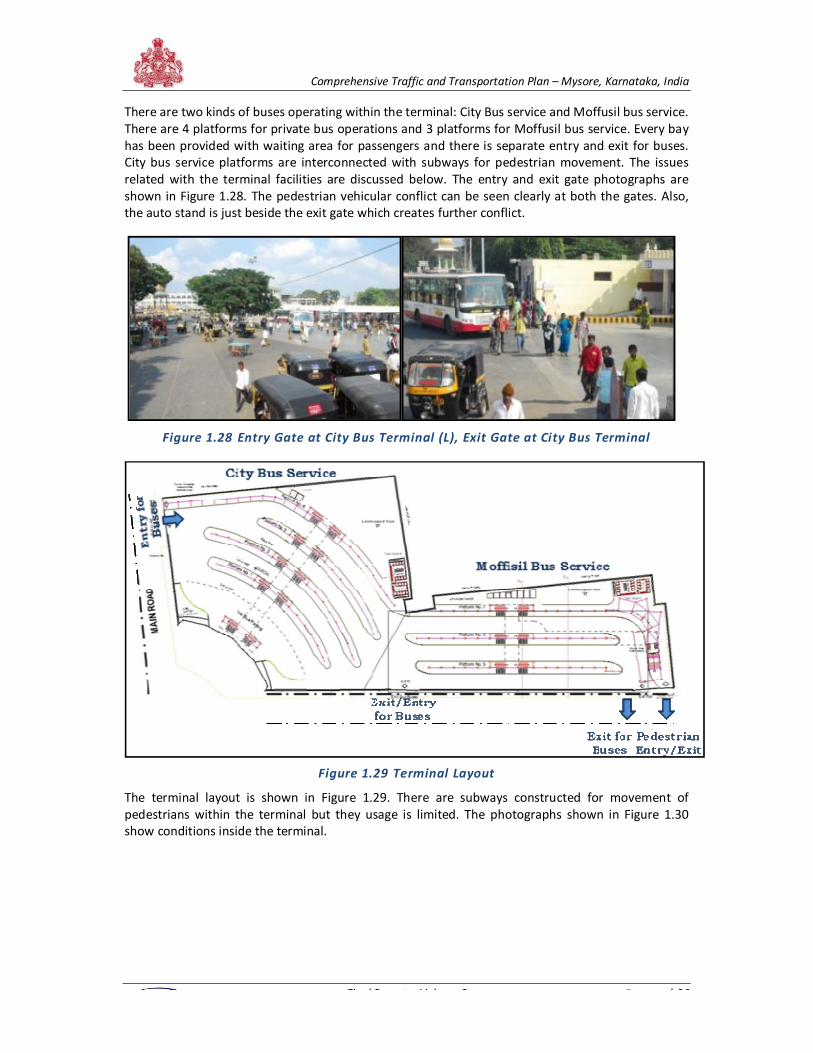
Comprehensive Traffic and Transportation Plan – Mysore, Karnataka, India
Final Report – Volume 2 P a g e | 36
There are two kinds of buses operating within the terminal: City Bus service and Moffusil bus service.
There are 4 platforms for private bus operations and 3 platforms for Moffusil bus service. Every bay
has been provided with waiting area for passengers and there is separate entry and exit for buses.
City bus service platforms are interconnected with subways for pedestrian movement. The issues
related with the terminal facilities are discussed below. The entry and exit gate photographs are
shown in Figure 1.28. The pedestrian vehicular conflict can be seen clearly at both the gates. Also,
the auto stand is just beside the exit gate which creates further conflict.
Figure 1.28 Entry Gate at City Bus Terminal (L), Exit Gate at City Bus Terminal
Figure 1.29 Terminal Layout
The terminal layout is shown in Figure 1.29. There are subways constructed for movement of
pedestrians within the terminal but they usage is limited. The photographs shown in Figure 1.30
show conditions inside the terminal.
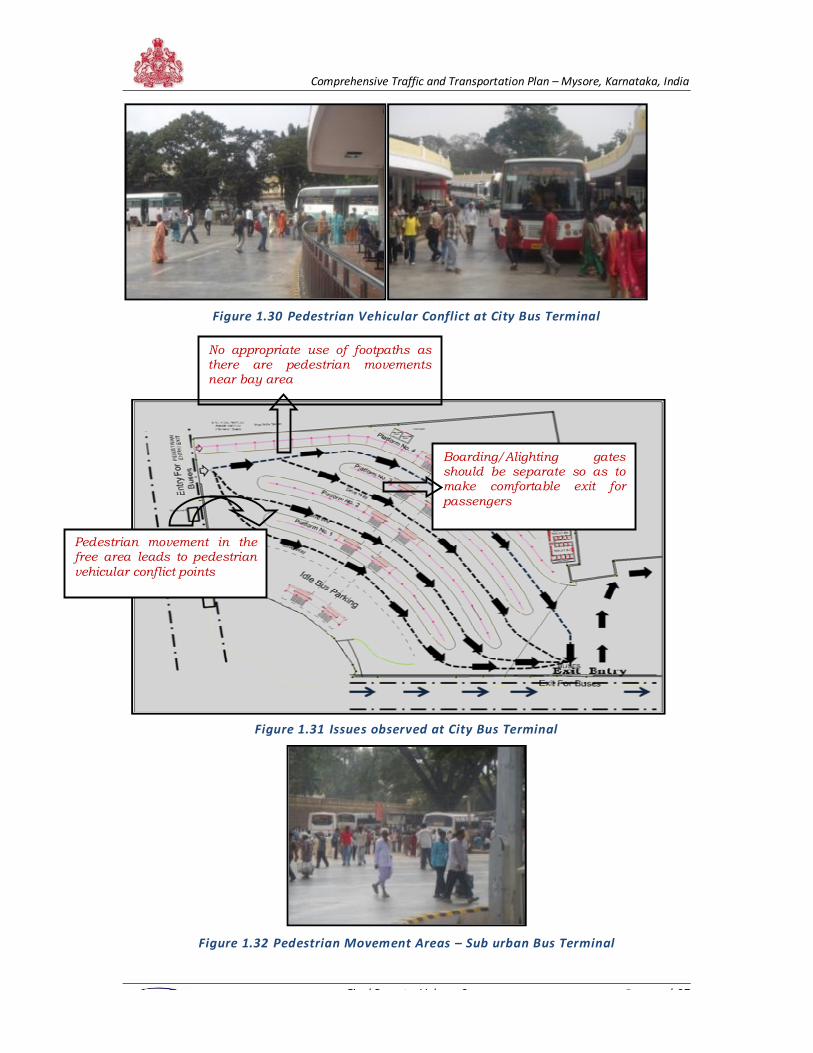
Comprehensive Traffic and Transportation Plan – Mysore, Karnataka, India
Final Report – Volume 2 P a g e | 37
Figure 1.30 Pedestrian Vehicular Conflict at City Bus Terminal
Figure 1.31 Issues observed at City Bus Terminal
Figure 1.32 Pedestrian Movement Areas – Sub urban Bus Terminal
Pedestrian movement in the free area leads to pedestrian
vehicular conflict points
Boarding/Alighting gates should be separate so as to make comfortable exit for
passengers
No appropriate use of footpaths as there are pedestrian movements near bay area
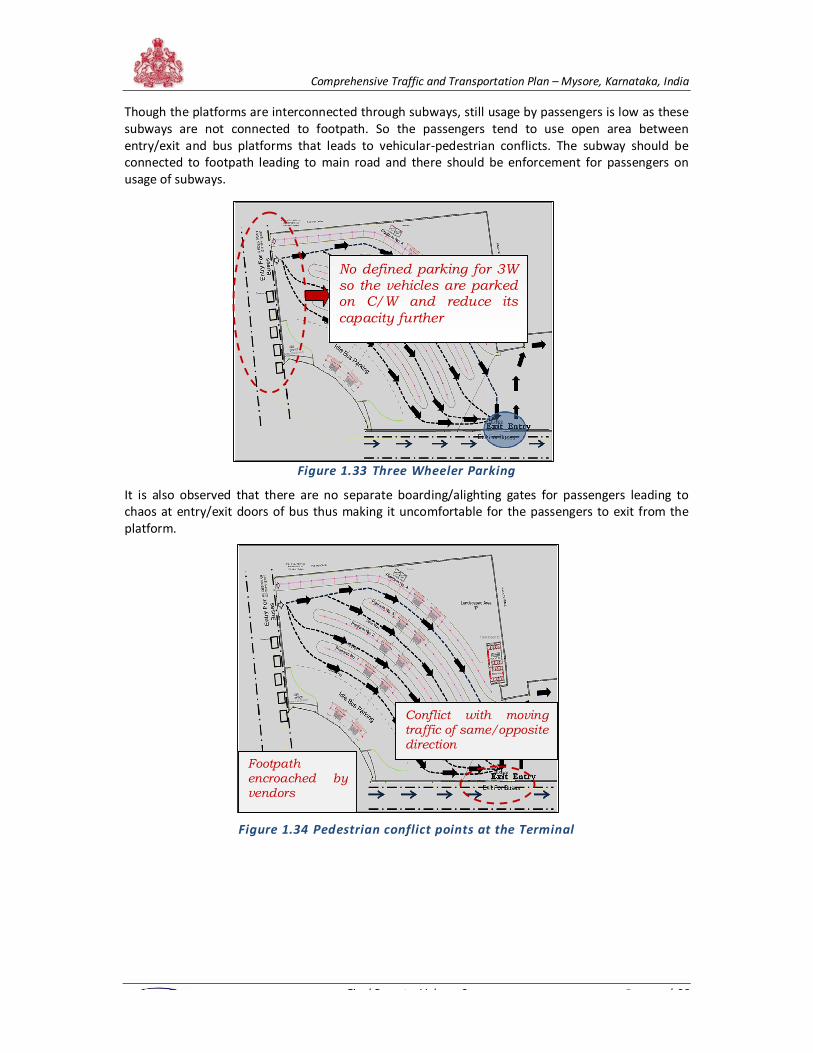
Comprehensive Traffic and Transportation Plan – Mysore, Karnataka, India
Final Report – Volume 2 P a g e | 38
Though the platforms are interconnected through subways, still usage by passengers is low as these
subways are not connected to footpath. So the passengers tend to use open area between
entry/exit and bus platforms that leads to vehicular-pedestrian conflicts. The subway should be
connected to footpath leading to main road and there should be enforcement for passengers on
usage of subways.
Figure 1.33 Three Wheeler Parking
It is also observed that there are no separate boarding/alighting gates for passengers leading to
chaos at entry/exit doors of bus thus making it uncomfortable for the passengers to exit from the
platform.
Figure 1.34 Pedestrian conflict points at the Terminal
Footpath encroached by vendors
Conflict with moving traffic of same/opposite direction
No defined parking for 3W so the vehicles are parked on C/W and reduce its
capacity further
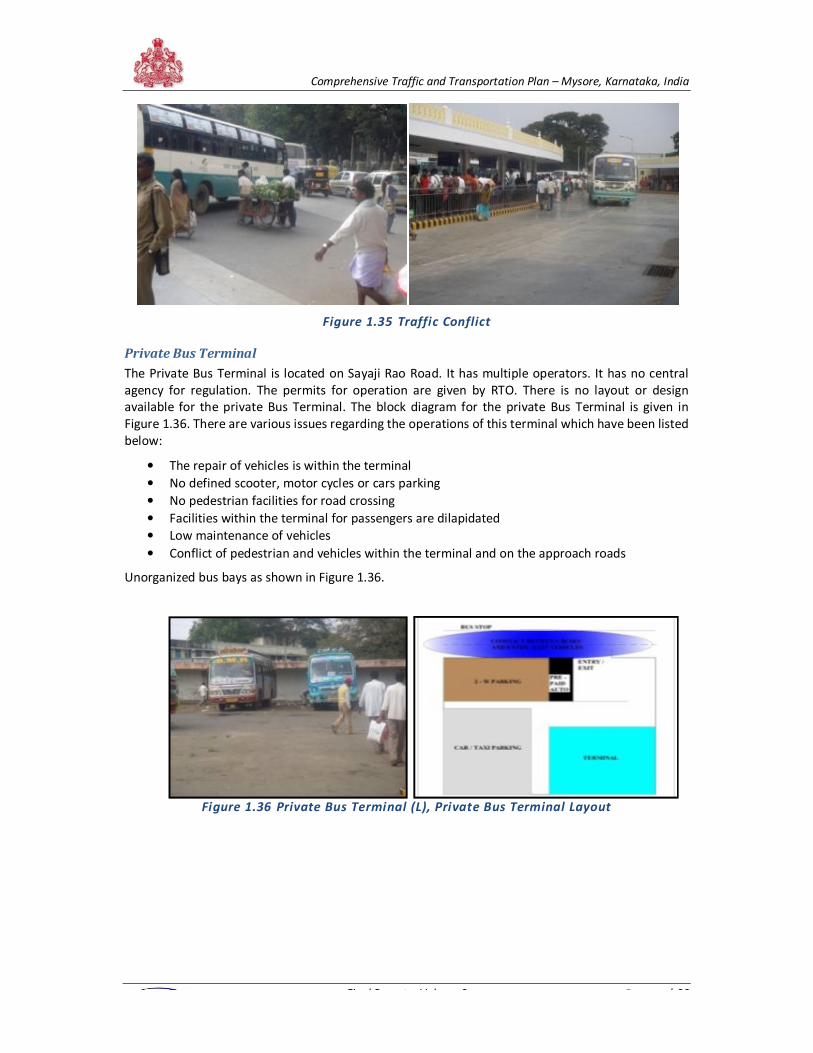
Comprehensive Traffic and Transportation Plan – Mysore, Karnataka, India
Final Report – Volume 2 P a g e | 39
Figure 1.35 Traffic Conflict
Private Bus Terminal
The Private Bus Terminal is located on Sayaji Rao Road. It has multiple operators. It has no central
agency for regulation. The permits for operation are given by RTO. There is no layout or design
available for the private Bus Terminal. The block diagram for the private Bus Terminal is given in
Figure 1.36. There are various issues regarding the operations of this terminal which have been listed
below:
• The repair of vehicles is within the terminal
• No defined scooter, motor cycles or cars parking
• No pedestrian facilities for road crossing
• Facilities within the terminal for passengers are dilapidated
• Low maintenance of vehicles
• Conflict of pedestrian and vehicles within the terminal and on the approach roads
Unorganized bus bays as shown in Figure 1.36.
Figure 1.36 Private Bus Terminal (L), Private Bus Terminal Layout
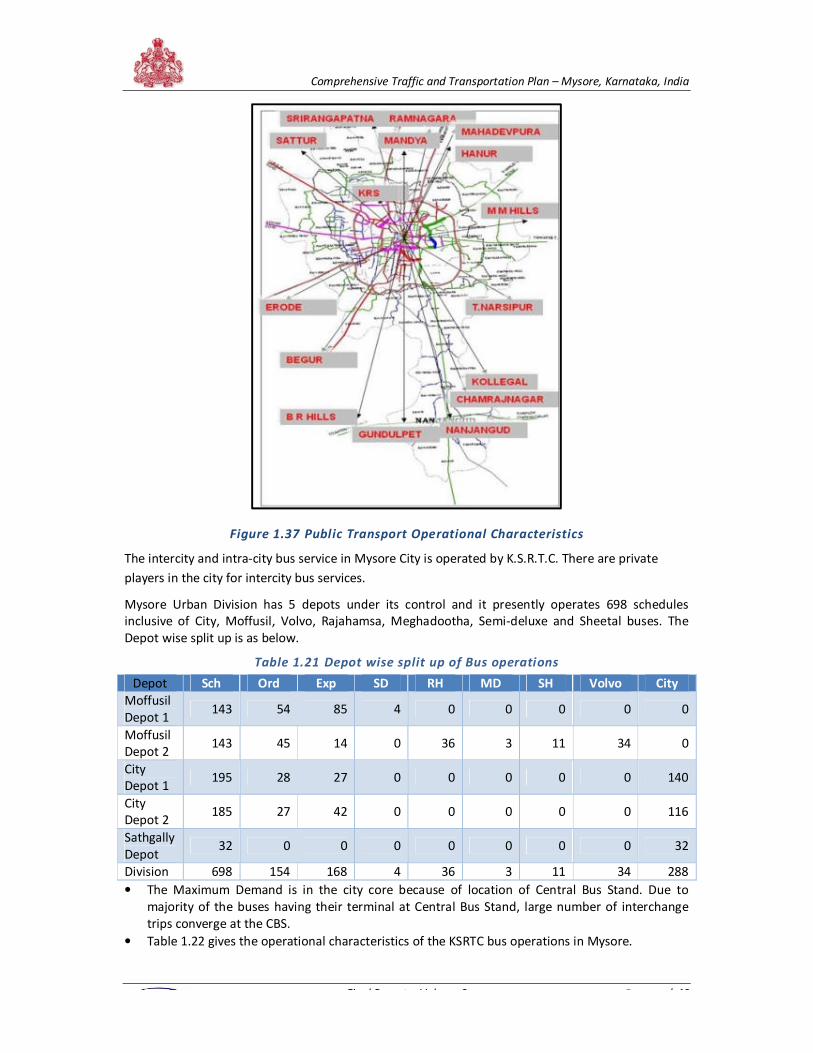
Comprehensive Traffic and Transportation Plan – Mysore, Karnataka, India
Final Report – Volume 2 P a g e | 40
Figure 1.37 Public Transport Operational Characteristics
The intercity and intra-city bus service in Mysore City is operated by K.S.R.T.C. There are private
players in the city for intercity bus services.
Mysore Urban Division has 5 depots under its control and it presently operates 698 schedules
inclusive of City, Moffusil, Volvo, Rajahamsa, Meghadootha, Semi-deluxe and Sheetal buses. The
Depot wise split up is as below.
Table 1.21 Depot wise split up of Bus operations
Depot Sch Ord Exp SD RH MD SH Volvo City Moffusil
Depot 1 143 54 85 4 0 0 0 0 0
Moffusil
Depot 2 143 45 14 0 36 3 11 34 0
City
Depot 1 195 28 27 0 0 0 0 0 140
City
Depot 2 185 27 42 0 0 0 0 0 116
Sathgally
Depot 32 0 0 0 0 0 0 0 32
Division 698 154 168 4 36 3 11 34 288
• The Maximum Demand is in the city core because of location of Central Bus Stand. Due to
majority of the buses having their terminal at Central Bus Stand, large number of interchange
trips converge at the CBS.
• Table 1.22 gives the operational characteristics of the KSRTC bus operations in Mysore.
Comprehensive Traffic and Transportation Plan – Mysore, Karnataka, India
Final Report – Volume 2 P a g e | 41
Table 1.22 Operational characteristics of the KSRTC bus operations in Mysore
Operation Characteristics Value
Number of Schedules 237
Fleet Strength 258
Total Number of Bus Stops 484
Load Factor 72.8%
Effective Kms per Day 5,55,475
Bus Network Density
Number of Trips 4217
Average Trip Length per Passenger 8.38 Km
Number of Routes 185
Passenger Trips per Day 1.79 Lakhs
Number of Bus Stops 484
Average Waiting Time at Bus Stops 15 Mins
Fare 34.76 paise per km
A comparison of the operating characteristics with the international standards in given below in
Table 1.23.
Table 1.23 Comparison of KSRTC Operations in Mysore with International Standards
Operating
Characteristics As per Norms In Mysore Source
Passengers Carried
per Bus per Day 1000-1200 678 KSRTC Annual Report
Vehicle Utilization in
kms per bus per day 230-260 237 KSRTC Annual Report
Staffing Ratio per bus 3-8 6.06 KSRTC Annual Report
Dead Kilometerage 0.6-1 * total Mileage 0.95* total mileage KSRTC Annual Report
Accident Rates per
Lakh Kilometer 1.5 -3 8.3 KSRTC Annual Report
Operating Ratio
(EPKM : CPKM) 1.05-1.08:1 0.82 : 1 KSRTC Annual Report
As Mysore is a tourist city, there are a number of private mini bus operators in the city. Also, there
are tempos which are available for day trips. These can be found at Gandhi Square.
Primary survey was conducted at Bus Terminals for both intra & intercity passengers. The main aim
of the survey was to indicate travel characteristics for Intra and Intercity travel. The average trip
length for intra city travel is 6.24 km whereas the average cost of travel is Rs. 9.00. OD analysis show
that the major trip movements for inter-city travel are between Mysore - Bangalore, Mysore -
Hunsur, Nanjangud, Mandya.
It is also observed that significant percentage of passengers use IPT as access and egress mode
indicating lack of point to point connectivity. Figure 1.38 & Figure 1.39 shows the inter and intra city
bus connectivity. Travel characteristics for inter and intra city travel are given below in Table 1.24.
Table 1.24 Travel Characteristics for Inter & Intra City Bus Service
Travel Characteristics Intra City Bus Service Inter City Bus Service
Average Trip Length (km) 6.24 11.7
Average Trip Cost (Rs.) 9.00 21.00
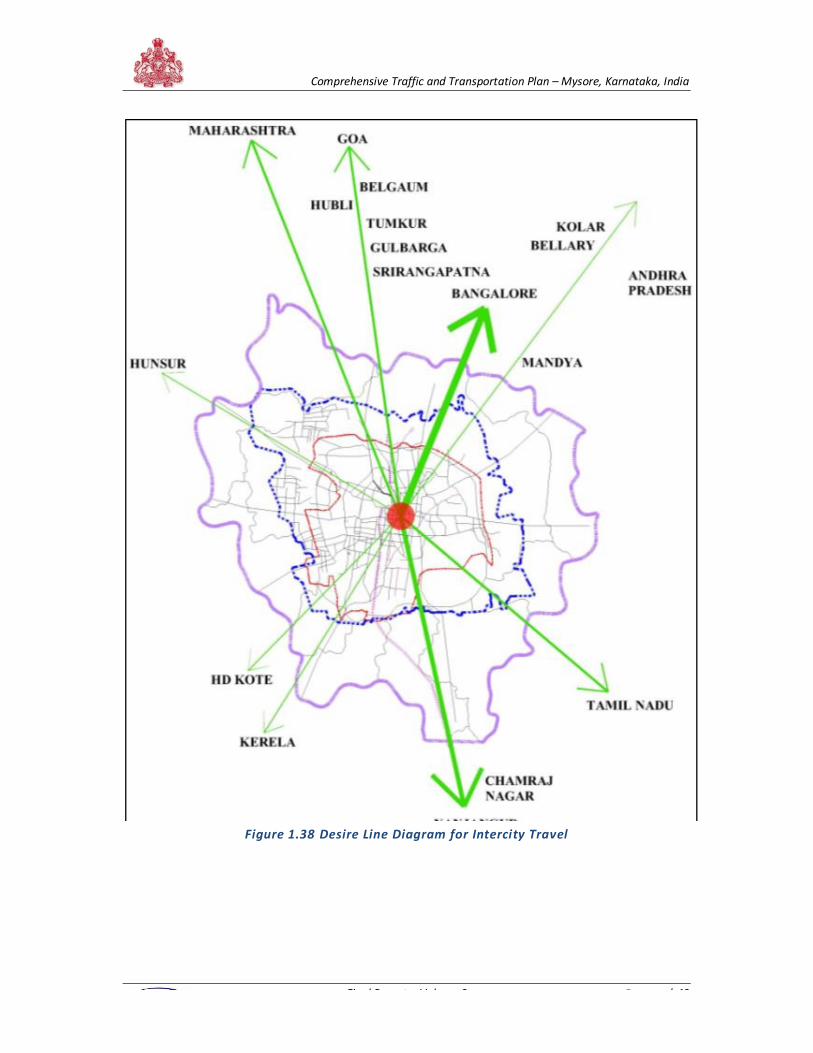
Comprehensive Traffic and Transportation Plan – Mysore, Karnataka, India
Final Report – Volume 2 P a g e | 42
Figure 1.38 Desire Line Diagram for Intercity Travel
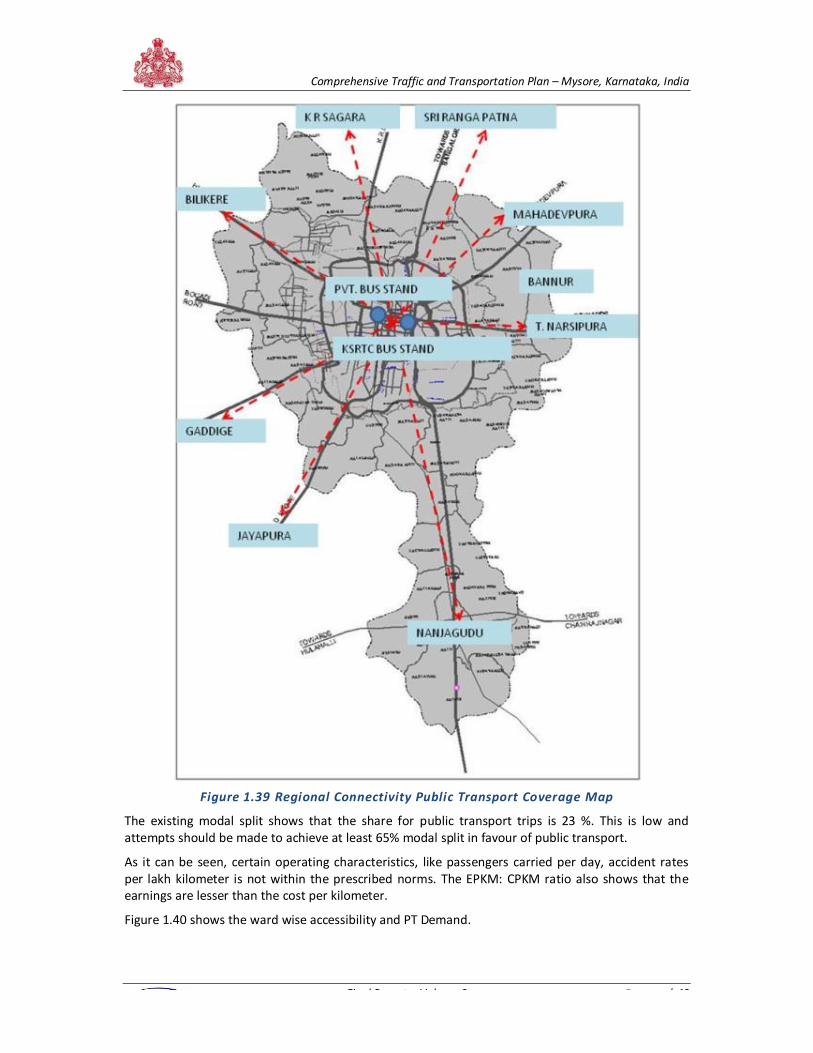
Comprehensive Traffic and Transportation Plan – Mysore, Karnataka, India
Final Report – Volume 2 P a g e | 43
Figure 1.39 Regional Connectivity Public Transport Coverage Map
The existing modal split shows that the share for public transport trips is 23 %. This is low and
attempts should be made to achieve at least 65% modal split in favour of public transport.
As it can be seen, certain operating characteristics, like passengers carried per day, accident rates
per lakh kilometer is not within the prescribed norms. The EPKM: CPKM ratio also shows that the
earnings are lesser than the cost per kilometer.
Figure 1.40 shows the ward wise accessibility and PT Demand.
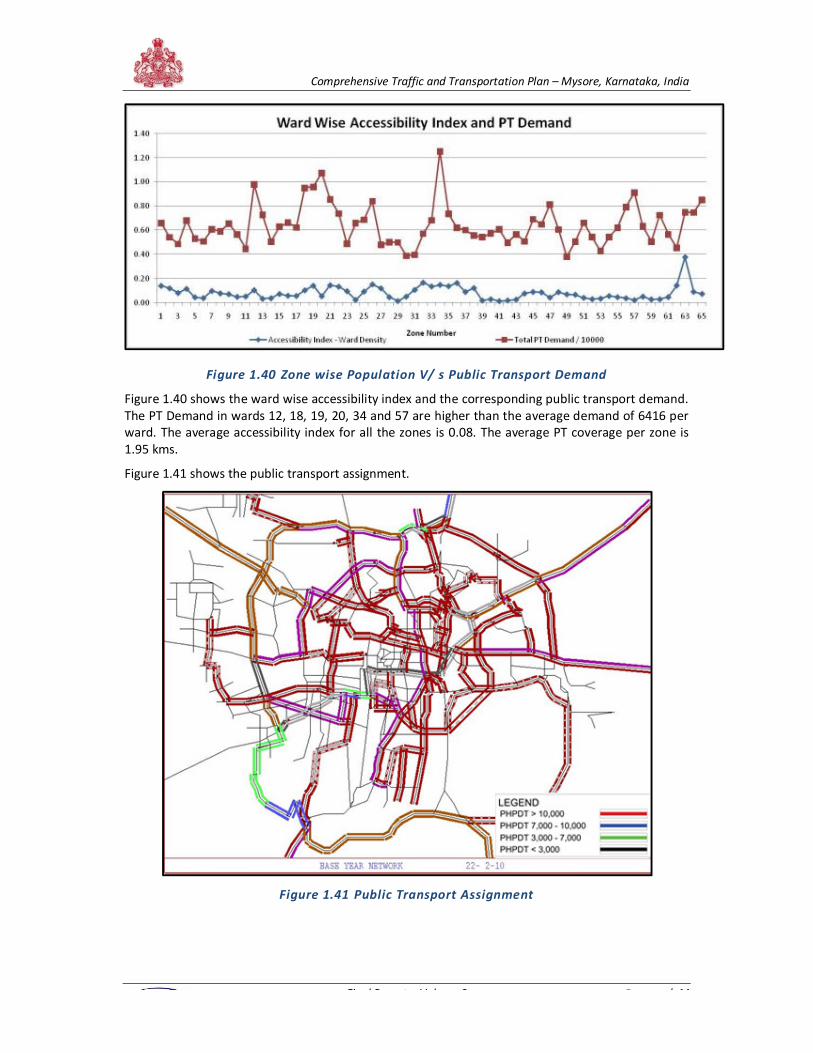
Comprehensive Traffic and Transportation Plan – Mysore, Karnataka, India
Final Report – Volume 2 P a g e | 44
Figure 1.40 Zone wise Population V/ s Public Transport Demand
Figure 1.40 shows the ward wise accessibility index and the corresponding public transport demand.
The PT Demand in wards 12, 18, 19, 20, 34 and 57 are higher than the average demand of 6416 per
ward. The average accessibility index for all the zones is 0.08. The average PT coverage per zone is
1.95 kms.
Figure 1.41 shows the public transport assignment.
Figure 1.41 Public Transport Assignment
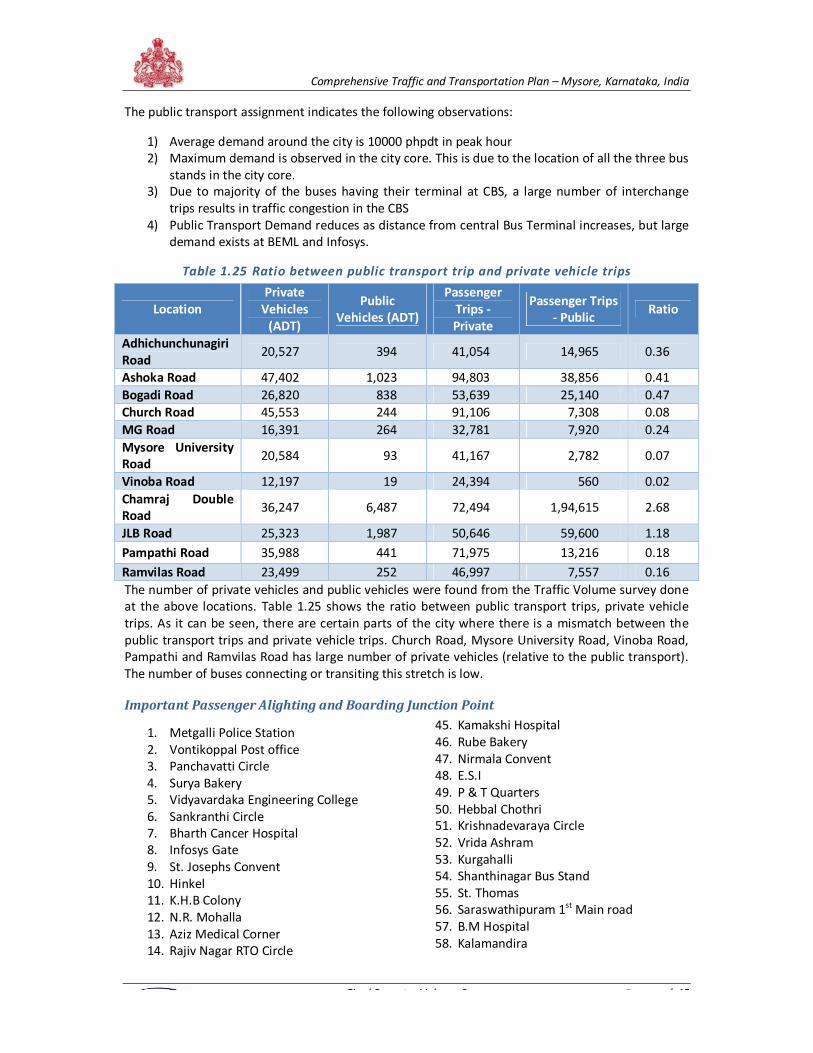
Comprehensive Traffic and Transportation Plan – Mysore, Karnataka, India
Final Report – Volume 2 P a g e | 45
The public transport assignment indicates the following observations:
1) Average demand around the city is 10000 phpdt in peak hour
2) Maximum demand is observed in the city core. This is due to the location of all the three bus
stands in the city core.
3) Due to majority of the buses having their terminal at CBS, a large number of interchange
trips results in traffic congestion in the CBS
4) Public Transport Demand reduces as distance from central Bus Terminal increases, but large
demand exists at BEML and Infosys.
Table 1.25 Ratio between public transport trip and private vehicle trips
Location
Private
Vehicles
(ADT)
Public
Vehicles (ADT)
Passenger
Trips -
Private
Passenger Trips
- Public Ratio
Adhichunchunagiri
Road 20,527 394 41,054 14,965 0.36
Ashoka Road 47,402 1,023 94,803 38,856 0.41
Bogadi Road 26,820 838 53,639 25,140 0.47
Church Road 45,553 244 91,106 7,308 0.08
MG Road 16,391 264 32,781 7,920 0.24
Mysore University
Road 20,584 93 41,167 2,782 0.07
Vinoba Road 12,197 19 24,394 560 0.02
Chamraj Double
Road 36,247 6,487 72,494 1,94,615 2.68
JLB Road 25,323 1,987 50,646 59,600 1.18
Pampathi Road 35,988 441 71,975 13,216 0.18
Ramvilas Road 23,499 252 46,997 7,557 0.16
The number of private vehicles and public vehicles were found from the Traffic Volume survey done
at the above locations. Table 1.25 shows the ratio between public transport trips, private vehicle
trips. As it can be seen, there are certain parts of the city where there is a mismatch between the
public transport trips and private vehicle trips. Church Road, Mysore University Road, Vinoba Road,
Pampathi and Ramvilas Road has large number of private vehicles (relative to the public transport).
The number of buses connecting or transiting this stretch is low.
Important Passenger Alighting and Boarding Junction Point
1. Metgalli Police Station
2. Vontikoppal Post office
3. Panchavatti Circle
4. Surya Bakery
5. Vidyavardaka Engineering College
6. Sankranthi Circle
7. Bharth Cancer Hospital
8. Infosys Gate
9. St. Josephs Convent
10. Hinkel
11. K.H.B Colony
12. N.R. Mohalla
13. Aziz Medical Corner
14. Rajiv Nagar RTO Circle
45. Kamakshi Hospital
46. Rube Bakery
47. Nirmala Convent
48. E.S.I
49. P & T Quarters
50. Hebbal Chothri
51. Krishnadevaraya Circle
52. Vrida Ashram
53. Kurgahalli
54. Shanthinagar Bus Stand
55. St. Thomas
56. Saraswathipuram 1st Main road
57. B.M Hospital
58. Kalamandira
Comprehensive Traffic and Transportation Plan – Mysore, Karnataka, India
Final Report – Volume 2 P a g e | 46
15. Kalyangiri Nagar RTO Circle
16. Jyothi Nagar
17. Jalapuri
18. Teresian College
19. A V Hospital
20. Jockey Quarters
21. Sterling Theatre
22. Ramabalnagar
23. Nagumallige
24. Ashoka Circle
25. Jayanagar Railway Gate
26. Jayanagar Ramanadira
27. Arvinda Nagar
28. Kuvempu Nagar Complex
29. Andolana Circle
30. Maruthi Temple
31. Maruthi Chitramandira
32. Sarada devi Nagar
33. Sangam Bhandara
34. Bogadi Toll gate
35. Agnishamaka Station
36. Lakshmi Chitramadira
37. Mahrani College
38. Hanumantha Nagar
39. Srinivasa theatre
40. Geeta Convent
41. Sidappa square city bus stand
42. Sidappa square Chamundi puram
43. Shivapura
44. Kuvempu Nagar
59. Towards Hinkel Yelvala
60. K.R Hospital Circle
61. Abdul Kalam Azad Circle
62. Shanthi Nagar Bus Stand
63. Udaygirir
64. J.C Engineerng College
65. Raghavendra Nagar
66. Pallya Gate
67. B.M Hospital
68. Sayaji Rao Road (Ayurveda Hospital)
69. Bannimantappa (Opposite Vasuagarbati)
70. J.K Ground
71. Akashwani
72. Balbavana Park
73. V V Mohalla
74. KRS Road
75. Regalis Hotel
76. Maharaja Hotel
77. Maharani Hotel
78. Ramaswamy Circle
79. RTO Circle
80. Chamundipuram
81. Agrahara
82. Harding Circle
83. Zoo
84. Taluk Office
85. Maruthi Circle
86. Rajendra Nagar
87. Udaygiri Nehru Park
The public transport coverage and major boarding alighting points are given in Annexure VII.
1.6 Road Inventory
Detailed road inventory surveys were carried out to collect details of all existing road and pavement
features along the existing road sections. The inventory data included but not limited to the
following: "Road Inventory/ Pavement Condition Survey" and "Traffic/Road Safety Analysis & land
use strategy". The Road Inventory was carried out for sample of road sections aggregating 50 km in
the city.
Review of Mysore Road Network
A detailed analysis of the primary network in terms of right of way, carriageway width, surface type,
number of lanes, median and footpath availability, drainage facilities and abutting land use,
encroachment is described as under;
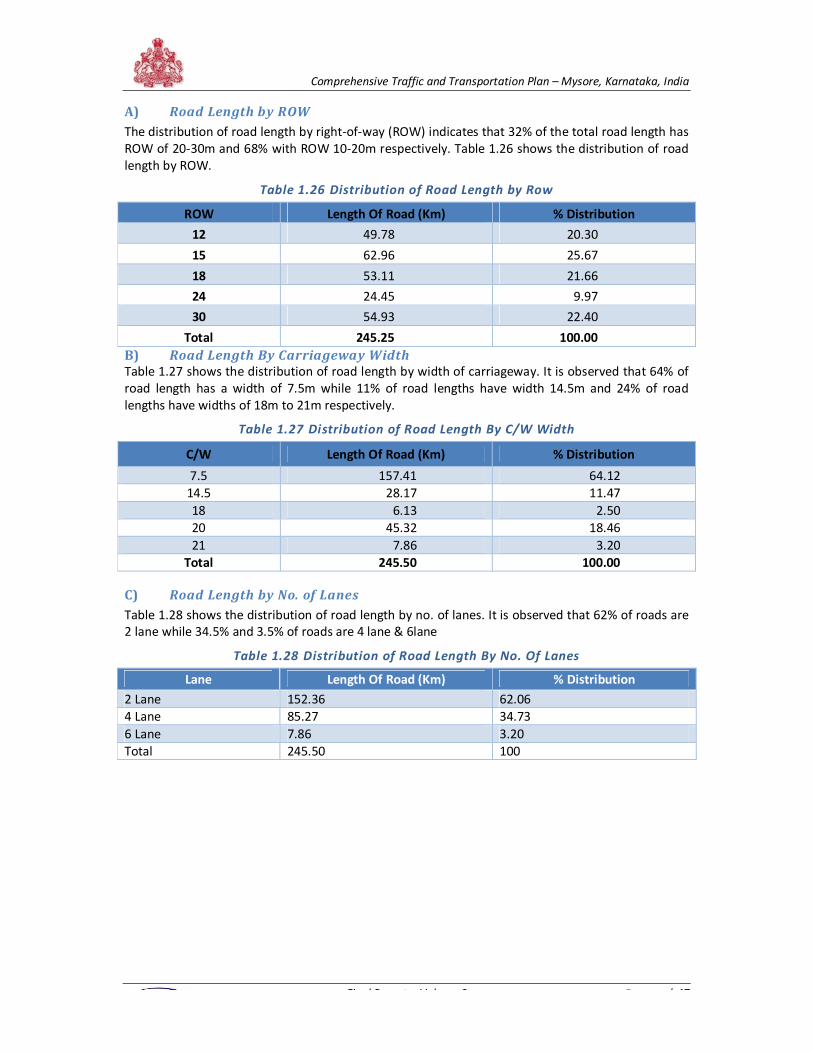
Comprehensive Traffic and Transportation Plan – Mysore, Karnataka, India
Final Report – Volume 2 P a g e | 47
A) Road Length by ROW
The distribution of road length by right-of-way (ROW) indicates that 32% of the total road length has
ROW of 20-30m and 68% with ROW 10-20m respectively. Table 1.26 shows the distribution of road
length by ROW.
Table 1.26 Distribution of Road Length by Row
ROW Length Of Road (Km) % Distribution
12 49.78 20.30
15 62.96 25.67
18 53.11 21.66
24 24.45 9.97
30 54.93 22.40
Total 245.25 100.00
B) Road Length By Carriageway Width
Table 1.27 shows the distribution of road length by width of carriageway. It is observed that 64% of
road length has a width of 7.5m while 11% of road lengths have width 14.5m and 24% of road
lengths have widths of 18m to 21m respectively.
Table 1.27 Distribution of Road Length By C/W Width
C/W Length Of Road (Km) % Distribution
7.5 157.41 64.12
14.5 28.17 11.47
18 6.13 2.50
20 45.32 18.46
21 7.86 3.20
Total 245.50 100.00
C) Road Length by No. of Lanes
Table 1.28 shows the distribution of road length by no. of lanes. It is observed that 62% of roads are
2 lane while 34.5% and 3.5% of roads are 4 lane & 6lane
Table 1.28 Distribution of Road Length By No. Of Lanes
Lane Length Of Road (Km) % Distribution
2 Lane 152.36 62.06
4 Lane 85.27 34.73
6 Lane 7.86 3.20
Total 245.50 100
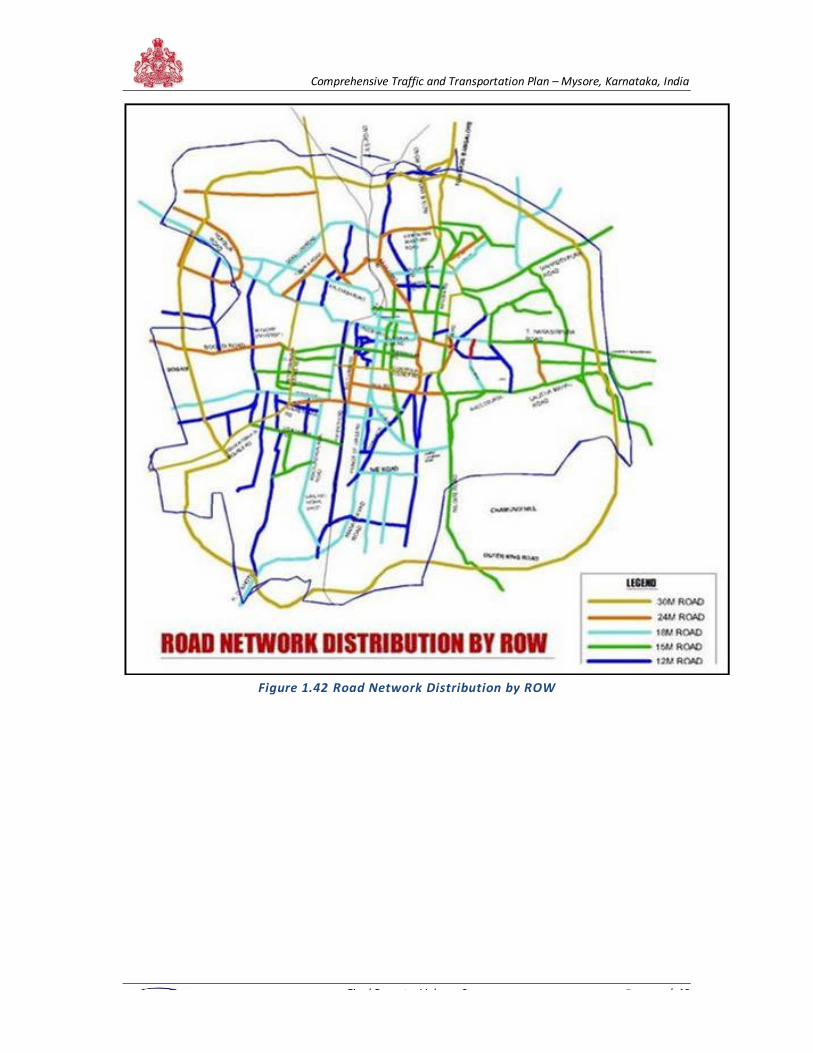
Comprehensive Traffic and Transportation Plan – Mysore, Karnataka, India
Final Report – Volume 2 P a g e | 48
Figure 1.42 Road Network Distribution by ROW
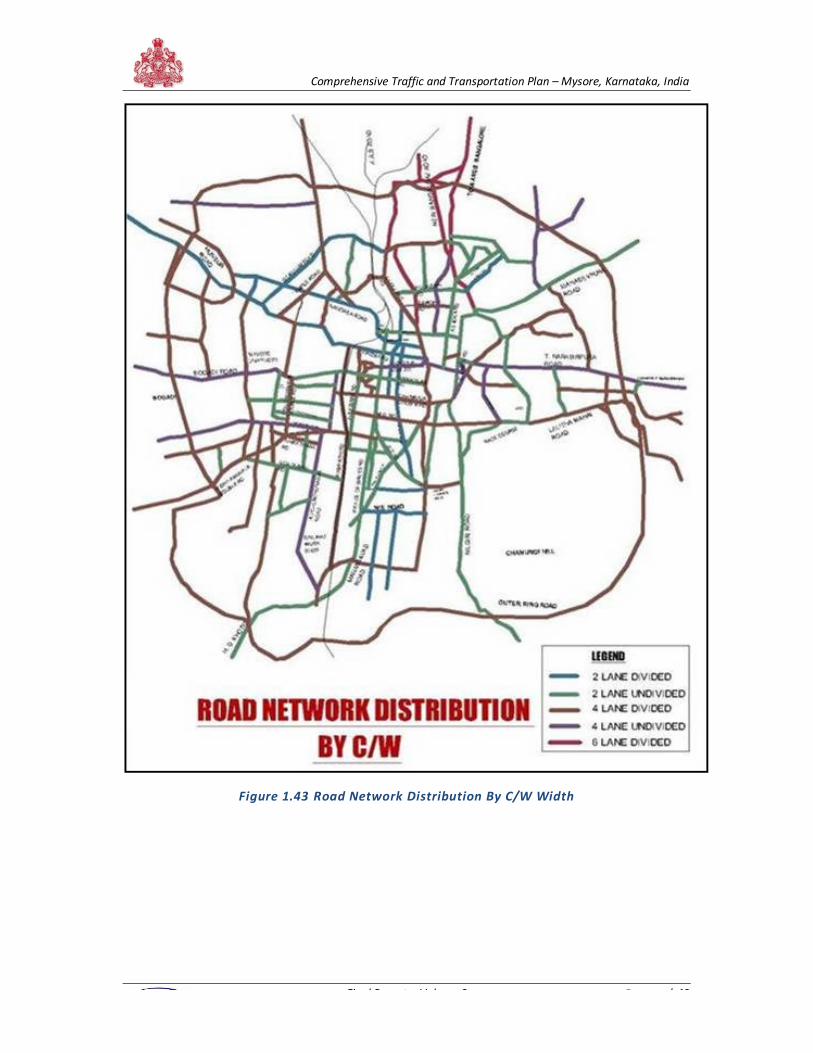
Comprehensive Traffic and Transportation Plan – Mysore, Karnataka, India
Final Report – Volume 2 P a g e | 49
Figure 1.43 Road Network Distribution By C/W Width
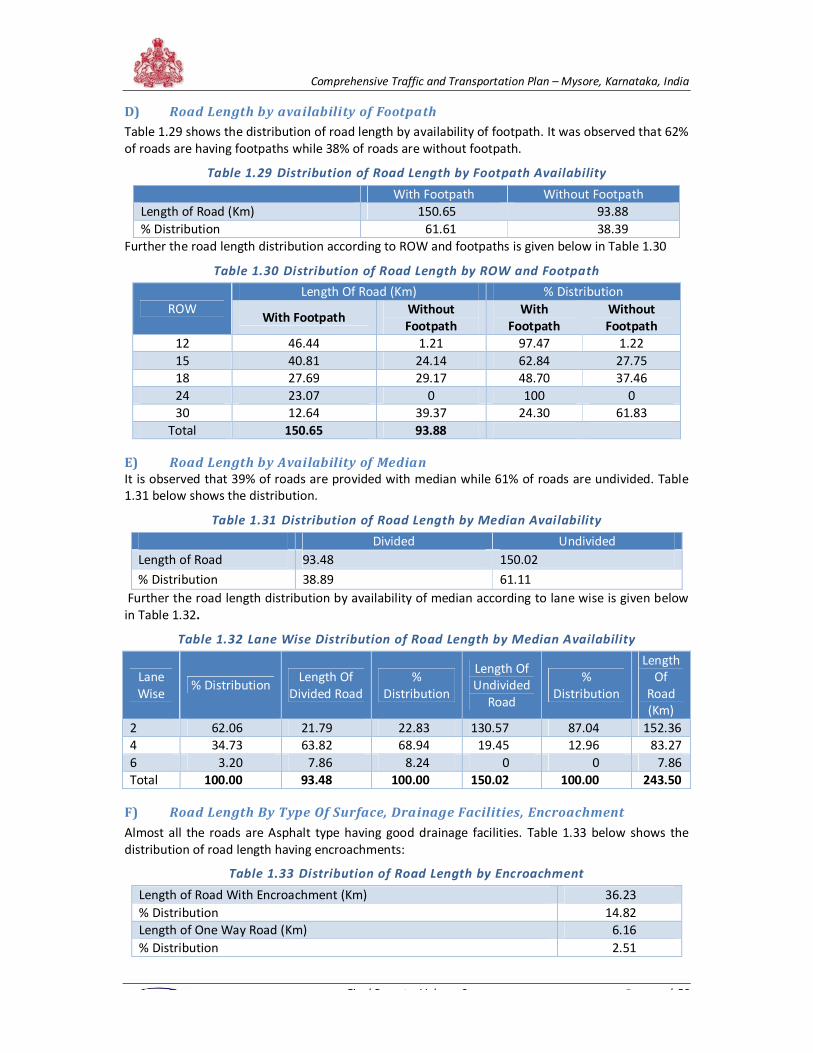
Comprehensive Traffic and Transportation Plan – Mysore, Karnataka, India
Final Report – Volume 2 P a g e | 50
D) Road Length by availability of Footpath
Table 1.29 shows the distribution of road length by availability of footpath. It was observed that 62%
of roads are having footpaths while 38% of roads are without footpath.
Table 1.29 Distribution of Road Length by Footpath Availability
With Footpath Without Footpath
Length of Road (Km) 150.65 93.88
% Distribution 61.61 38.39
Further the road length distribution according to ROW and footpaths is given below in Table 1.30
Table 1.30 Distribution of Road Length by ROW and Footpath
ROW
Length Of Road (Km) % Distribution
With Footpath Without
Footpath
With
Footpath
Without
Footpath
12 46.44 1.21 97.47 1.22
15 40.81 24.14 62.84 27.75
18 27.69 29.17 48.70 37.46
24 23.07 0 100 0
30 12.64 39.37 24.30 61.83
Total 150.65 93.88
E) Road Length by Availability of Median
It is observed that 39% of roads are provided with median while 61% of roads are undivided. Table
1.31 below shows the distribution.
Table 1.31 Distribution of Road Length by Median Availability
Divided Undivided
Length of Road 93.48 150.02
% Distribution 38.89 61.11
Further the road length distribution by availability of median according to lane wise is given below
in Table 1.32.
Table 1.32 Lane Wise Distribution of Road Length by Median Availability
Lane
Wise % Distribution
Length Of
Divided Road
%
Distribution
Length Of
Undivided
Road
%
Distribution
Length
Of
Road
(Km)
2 62.06 21.79 22.83 130.57 87.04 152.36
4 34.73 63.82 68.94 19.45 12.96 83.27
6 3.20 7.86 8.24 0 0 7.86
Total 100.00 93.48 100.00 150.02 100.00 243.50
F) Road Length By Type Of Surface, Drainage Facilities, Encroachment
Almost all the roads are Asphalt type having good drainage facilities. Table 1.33 below shows the
distribution of road length having encroachments:
Table 1.33 Distribution of Road Length by Encroachment
Length of Road With Encroachment (Km) 36.23
% Distribution 14.82
Length of One Way Road (Km) 6.16
% Distribution 2.51
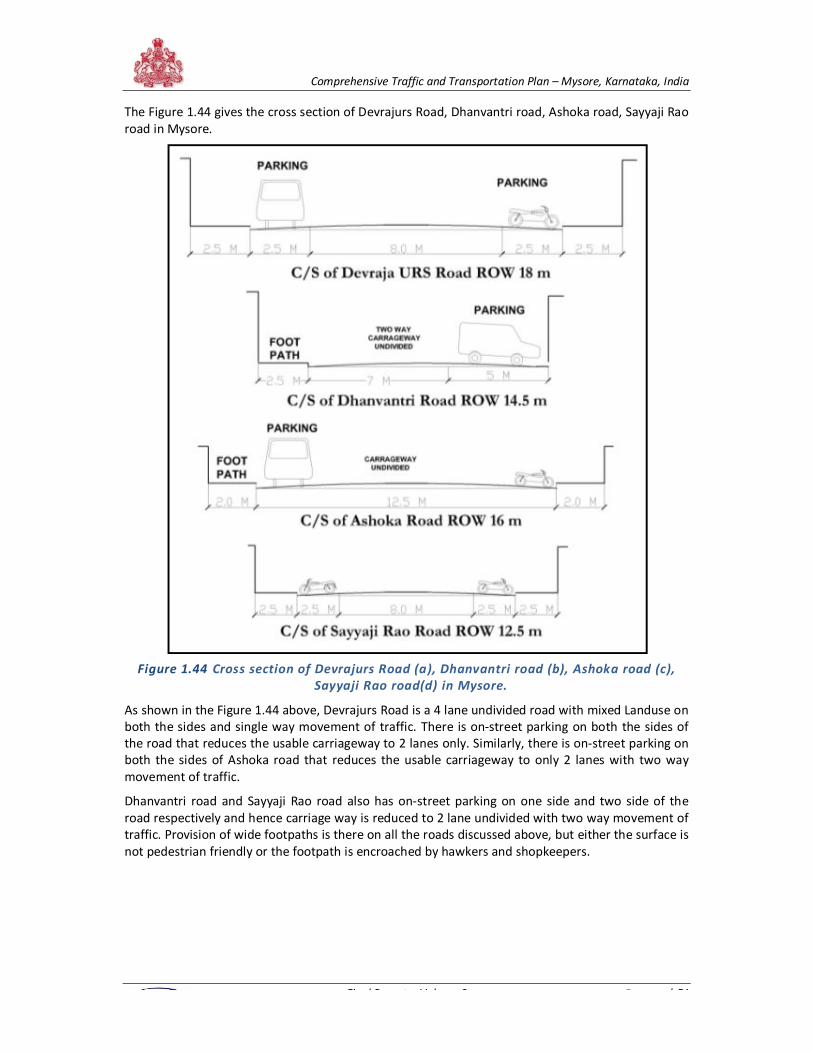
Comprehensive Traffic and Transportation Plan – Mysore, Karnataka, India
Final Report – Volume 2 P a g e | 51
The Figure 1.44 gives the cross section of Devrajurs Road, Dhanvantri road, Ashoka road, Sayyaji Rao
road in Mysore.
Figure 1.44 Cross section of Devrajurs Road (a), Dhanvantri road (b), Ashoka road (c),
Sayyaji Rao road(d) in Mysore.
As shown in the Figure 1.44 above, Devrajurs Road is a 4 lane undivided road with mixed Landuse on
both the sides and single way movement of traffic. There is on-street parking on both the sides of
the road that reduces the usable carriageway to 2 lanes only. Similarly, there is on-street parking on
both the sides of Ashoka road that reduces the usable carriageway to only 2 lanes with two way
movement of traffic.
Dhanvantri road and Sayyaji Rao road also has on-street parking on one side and two side of the
road respectively and hence carriage way is reduced to 2 lane undivided with two way movement of
traffic. Provision of wide footpaths is there on all the roads discussed above, but either the surface is
not pedestrian friendly or the footpath is encroached by hawkers and shopkeepers.
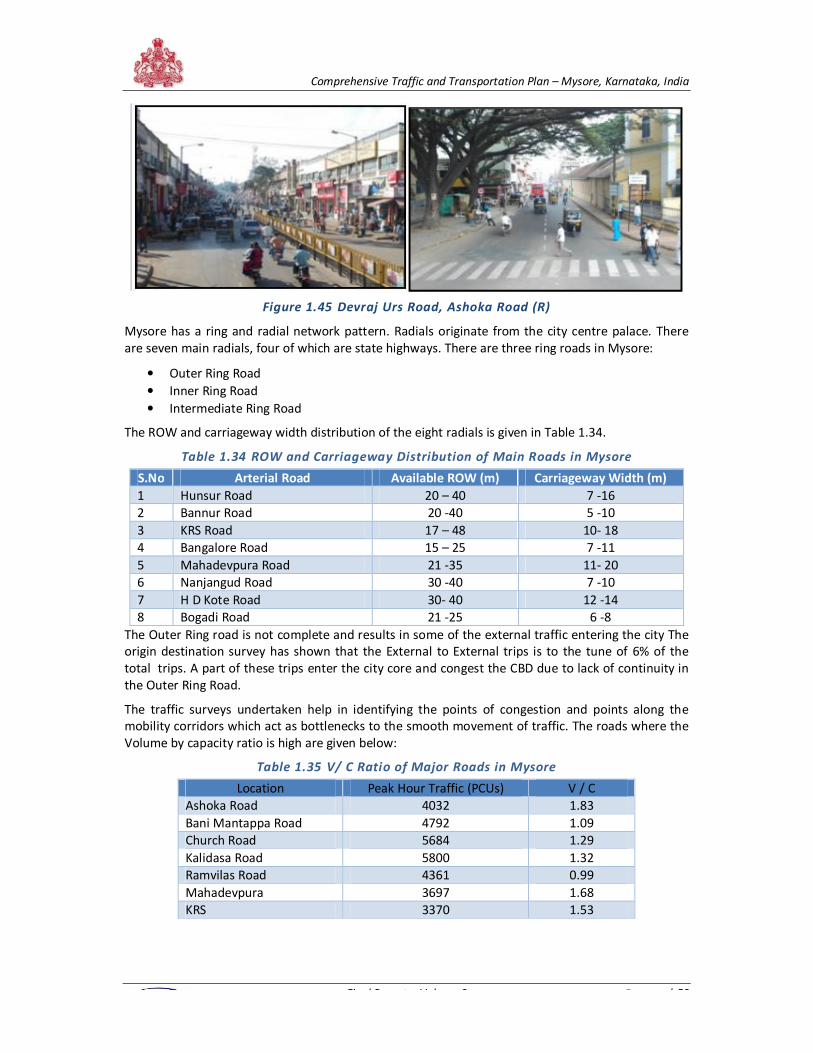
Comprehensive Traffic and Transportation Plan – Mysore, Karnataka, India
Final Report – Volume 2 P a g e | 52
Figure 1.45 Devraj Urs Road, Ashoka Road (R)
Mysore has a ring and radial network pattern. Radials originate from the city centre palace. There
are seven main radials, four of which are state highways. There are three ring roads in Mysore:
• Outer Ring Road
• Inner Ring Road
• Intermediate Ring Road
The ROW and carriageway width distribution of the eight radials is given in Table 1.34.
Table 1.34 ROW and Carriageway Distribution of Main Roads in Mysore
S.No Arterial Road Available ROW (m) Carriageway Width (m)
1 Hunsur Road 20 – 40 7 -16
2 Bannur Road 20 -40 5 -10
3 KRS Road 17 – 48 10- 18
4 Bangalore Road 15 – 25 7 -11
5 Mahadevpura Road 21 -35 11- 20
6 Nanjangud Road 30 -40 7 -10
7 H D Kote Road 30- 40 12 -14
8 Bogadi Road 21 -25 6 -8
The Outer Ring road is not complete and results in some of the external traffic entering the city The
origin destination survey has shown that the External to External trips is to the tune of 6% of the
total trips. A part of these trips enter the city core and congest the CBD due to lack of continuity in
the Outer Ring Road.
The traffic surveys undertaken help in identifying the points of congestion and points along the
mobility corridors which act as bottlenecks to the smooth movement of traffic. The roads where the
Volume by capacity ratio is high are given below:
Table 1.35 V/ C Ratio of Major Roads in Mysore
Location Peak Hour Traffic (PCUs) V / C
Ashoka Road 4032 1.83
Bani Mantappa Road 4792 1.09
Church Road 5684 1.29
Kalidasa Road 5800 1.32
Ramvilas Road 4361 0.99
Mahadevpura 3697 1.68
KRS 3370 1.53
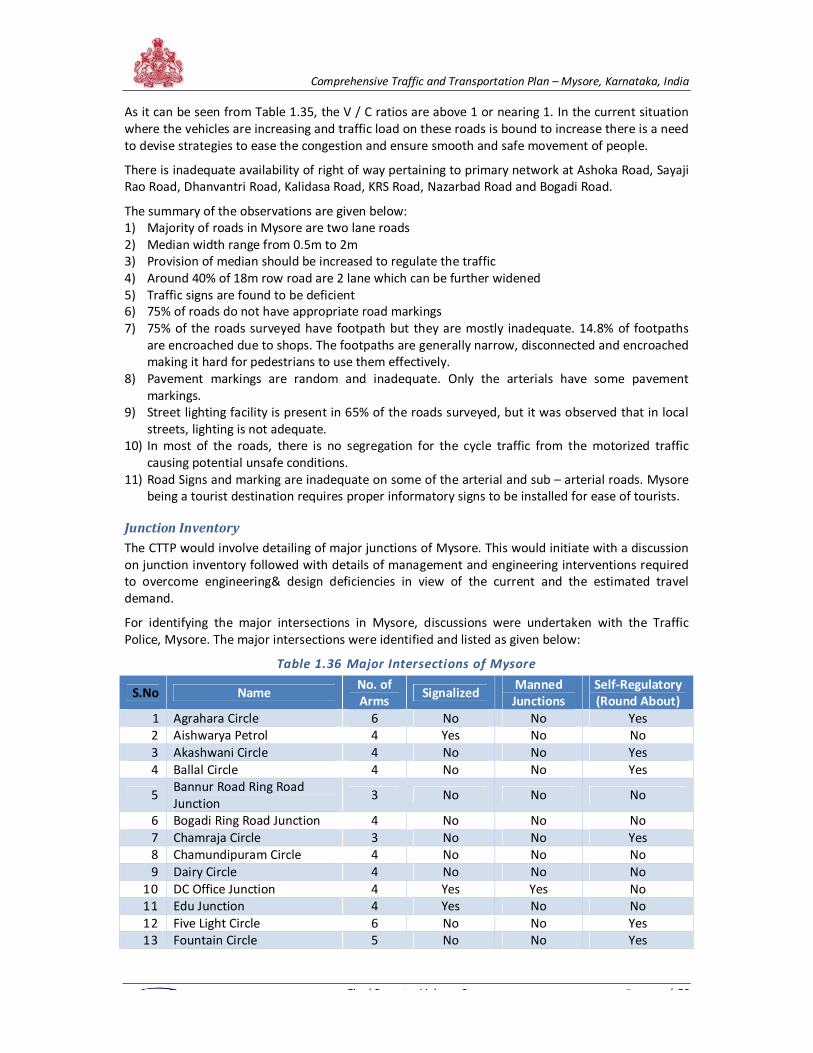
Comprehensive Traffic and Transportation Plan – Mysore, Karnataka, India
Final Report – Volume 2 P a g e | 53
As it can be seen from Table 1.35, the V / C ratios are above 1 or nearing 1. In the current situation
where the vehicles are increasing and traffic load on these roads is bound to increase there is a need
to devise strategies to ease the congestion and ensure smooth and safe movement of people.
There is inadequate availability of right of way pertaining to primary network at Ashoka Road, Sayaji
Rao Road, Dhanvantri Road, Kalidasa Road, KRS Road, Nazarbad Road and Bogadi Road.
The summary of the observations are given below:
1) Majority of roads in Mysore are two lane roads
2) Median width range from 0.5m to 2m
3) Provision of median should be increased to regulate the traffic
4) Around 40% of 18m row road are 2 lane which can be further widened
5) Traffic signs are found to be deficient
6) 75% of roads do not have appropriate road markings
7) 75% of the roads surveyed have footpath but they are mostly inadequate. 14.8% of footpaths
are encroached due to shops. The footpaths are generally narrow, disconnected and encroached
making it hard for pedestrians to use them effectively.
8) Pavement markings are random and inadequate. Only the arterials have some pavement
markings.
9) Street lighting facility is present in 65% of the roads surveyed, but it was observed that in local
streets, lighting is not adequate.
10) In most of the roads, there is no segregation for the cycle traffic from the motorized traffic
causing potential unsafe conditions.
11) Road Signs and marking are inadequate on some of the arterial and sub – arterial roads. Mysore
being a tourist destination requires proper informatory signs to be installed for ease of tourists.
Junction Inventory
The CTTP would involve detailing of major junctions of Mysore. This would initiate with a discussion
on junction inventory followed with details of management and engineering interventions required
to overcome engineering& design deficiencies in view of the current and the estimated travel
demand.
For identifying the major intersections in Mysore, discussions were undertaken with the Traffic
Police, Mysore. The major intersections were identified and listed as given below:
Table 1.36 Major Intersections of Mysore
S.No Name No. of
Arms Signalized
Manned
Junctions Self-Regulatory
(Round About)
1 Agrahara Circle 6 No No Yes
2 Aishwarya Petrol 4 Yes No No
3 Akashwani Circle 4 No No Yes
4 Ballal Circle 4 No No Yes
5 Bannur Road Ring Road
Junction 3 No No No
6 Bogadi Ring Road Junction 4 No No No
7 Chamraja Circle 3 No No Yes
8 Chamundipuram Circle 4 No No No
9 Dairy Circle 4 No No No
10 DC Office Junction 4 Yes Yes No
11 Edu Junction 4 Yes No No
12 Five Light Circle 6 No No Yes
13 Fountain Circle 5 No No Yes
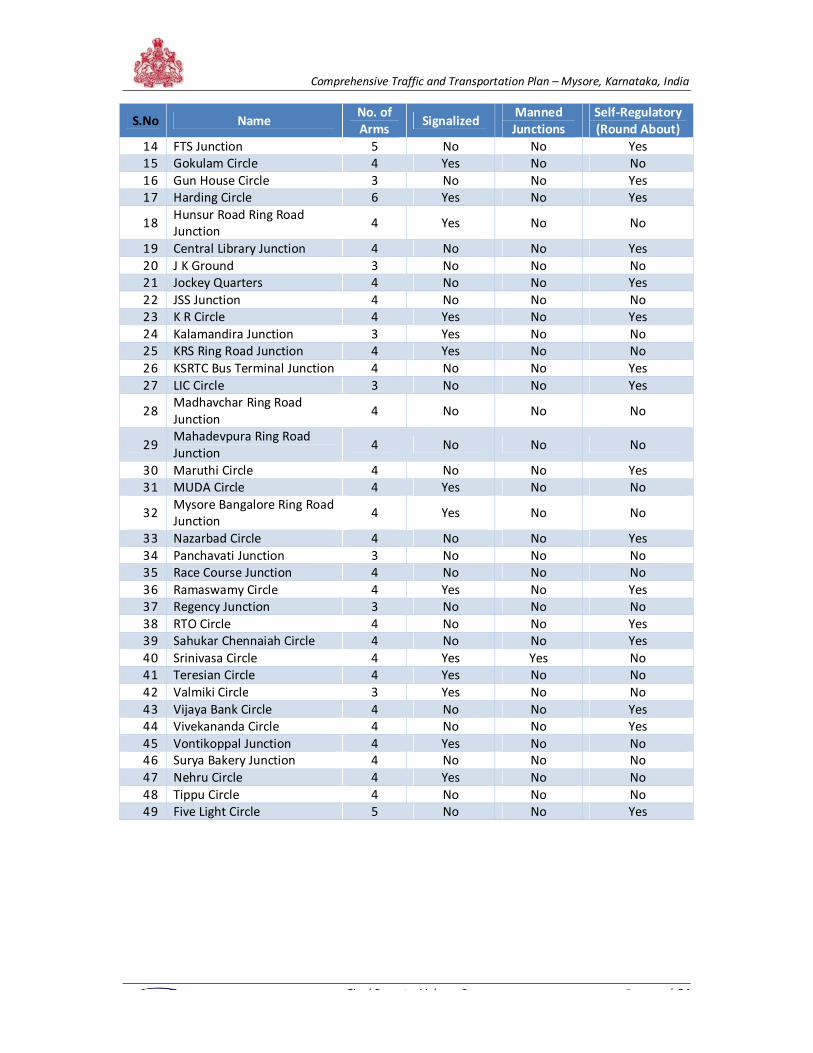
Comprehensive Traffic and Transportation Plan – Mysore, Karnataka, India
Final Report – Volume 2 P a g e | 54
S.No Name No. of
Arms Signalized
Manned
Junctions
Self-Regulatory
(Round About)
14 FTS Junction 5 No No Yes
15 Gokulam Circle 4 Yes No No
16 Gun House Circle 3 No No Yes
17 Harding Circle 6 Yes No Yes
18 Hunsur Road Ring Road
Junction 4 Yes No No
19 Central Library Junction 4 No No Yes
20 J K Ground 3 No No No
21 Jockey Quarters 4 No No Yes
22 JSS Junction 4 No No No
23 K R Circle 4 Yes No Yes
24 Kalamandira Junction 3 Yes No No
25 KRS Ring Road Junction 4 Yes No No
26 KSRTC Bus Terminal Junction 4 No No Yes
27 LIC Circle 3 No No Yes
28 Madhavchar Ring Road
Junction 4 No No No
29 Mahadevpura Ring Road
Junction 4 No No No
30 Maruthi Circle 4 No No Yes
31 MUDA Circle 4 Yes No No
32 Mysore Bangalore Ring Road
Junction 4 Yes No No
33 Nazarbad Circle 4 No No Yes
34 Panchavati Junction 3 No No No
35 Race Course Junction 4 No No No
36 Ramaswamy Circle 4 Yes No Yes
37 Regency Junction 3 No No No
38 RTO Circle 4 No No Yes
39 Sahukar Chennaiah Circle 4 No No Yes
40 Srinivasa Circle 4 Yes Yes No
41 Teresian Circle 4 Yes No No
42 Valmiki Circle 3 Yes No No
43 Vijaya Bank Circle 4 No No Yes
44 Vivekananda Circle 4 No No Yes
45 Vontikoppal Junction 4 Yes No No 46 Surya Bakery Junction 4 No No No
47 Nehru Circle 4 Yes No No
48 Tippu Circle 4 No No No
49 Five Light Circle 5 No No Yes
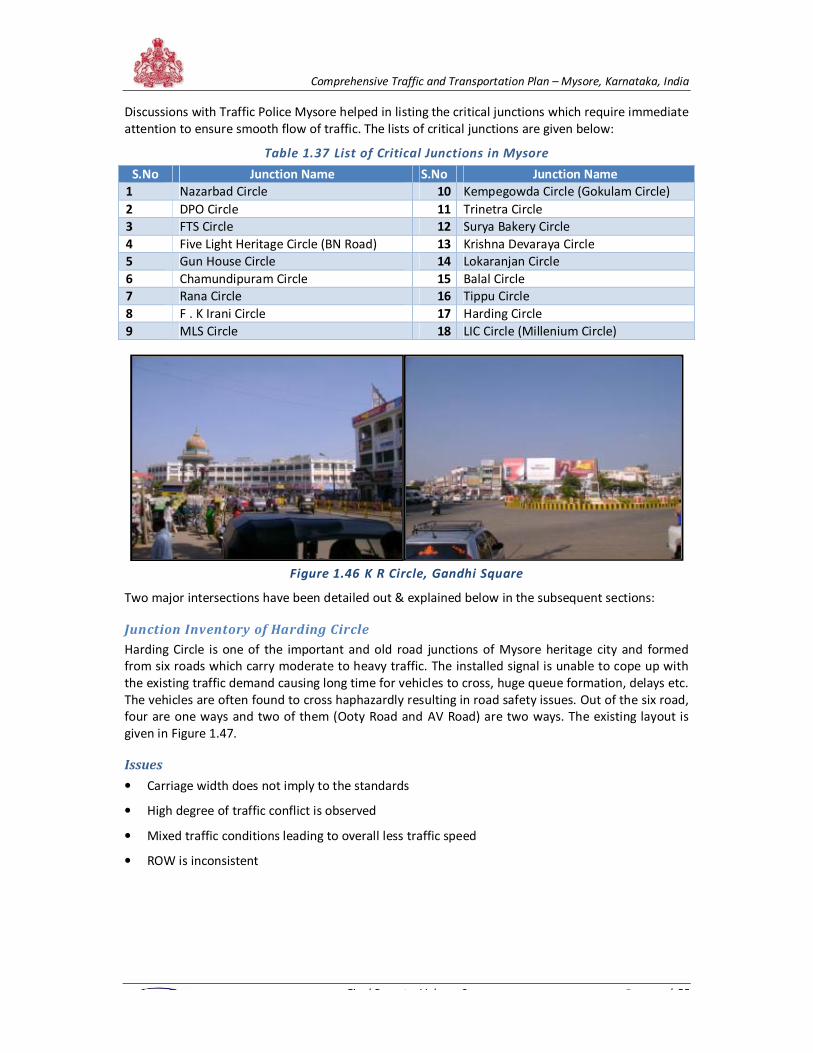
Comprehensive Traffic and Transportation Plan – Mysore, Karnataka, India
Final Report – Volume 2 P a g e | 55
Discussions with Traffic Police Mysore helped in listing the critical junctions which require immediate
attention to ensure smooth flow of traffic. The lists of critical junctions are given below:
Table 1.37 List of Critical Junctions in Mysore
S.No Junction Name S.No Junction Name
1 Nazarbad Circle 10 Kempegowda Circle (Gokulam Circle)
2 DPO Circle 11 Trinetra Circle
3 FTS Circle 12 Surya Bakery Circle
4 Five Light Heritage Circle (BN Road) 13 Krishna Devaraya Circle
5 Gun House Circle 14 Lokaranjan Circle
6 Chamundipuram Circle 15 Balal Circle
7 Rana Circle 16 Tippu Circle
8 F . K Irani Circle 17 Harding Circle
9 MLS Circle 18 LIC Circle (Millenium Circle)
Figure 1.46 K R Circle, Gandhi Square
Two major intersections have been detailed out & explained below in the subsequent sections:
Junction Inventory of Harding Circle
Harding Circle is one of the important and old road junctions of Mysore heritage city and formed
from six roads which carry moderate to heavy traffic. The installed signal is unable to cope up with
the existing traffic demand causing long time for vehicles to cross, huge queue formation, delays etc.
The vehicles are often found to cross haphazardly resulting in road safety issues. Out of the six road,
four are one ways and two of them (Ooty Road and AV Road) are two ways. The existing layout is
given in Figure 1.47.
Issues
• Carriage width does not imply to the standards
• High degree of traffic conflict is observed
• Mixed traffic conditions leading to overall less traffic speed
• ROW is inconsistent
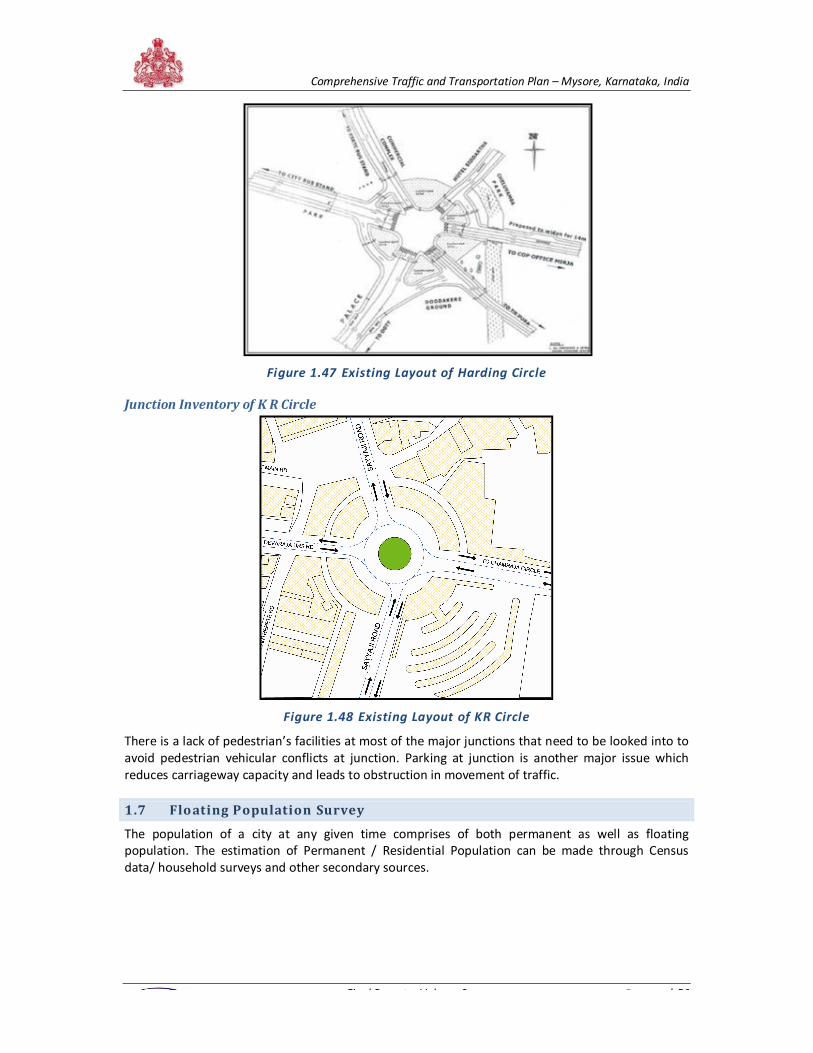
Comprehensive Traffic and Transportation Plan – Mysore, Karnataka, India
Final Report – Volume 2 P a g e | 56
Figure 1.47 Existing Layout of Harding Circle
Junction Inventory of K R Circle
Figure 1.48 Existing Layout of KR Circle
There is a lack of pedestrian’s facilities at most of the major junctions that need to be looked into to
avoid pedestrian vehicular conflicts at junction. Parking at junction is another major issue which
reduces carriageway capacity and leads to obstruction in movement of traffic.
1.7 Floating Population Survey
The population of a city at any given time comprises of both permanent as well as floating
population. The estimation of Permanent / Residential Population can be made through Census
data/ household surveys and other secondary sources.
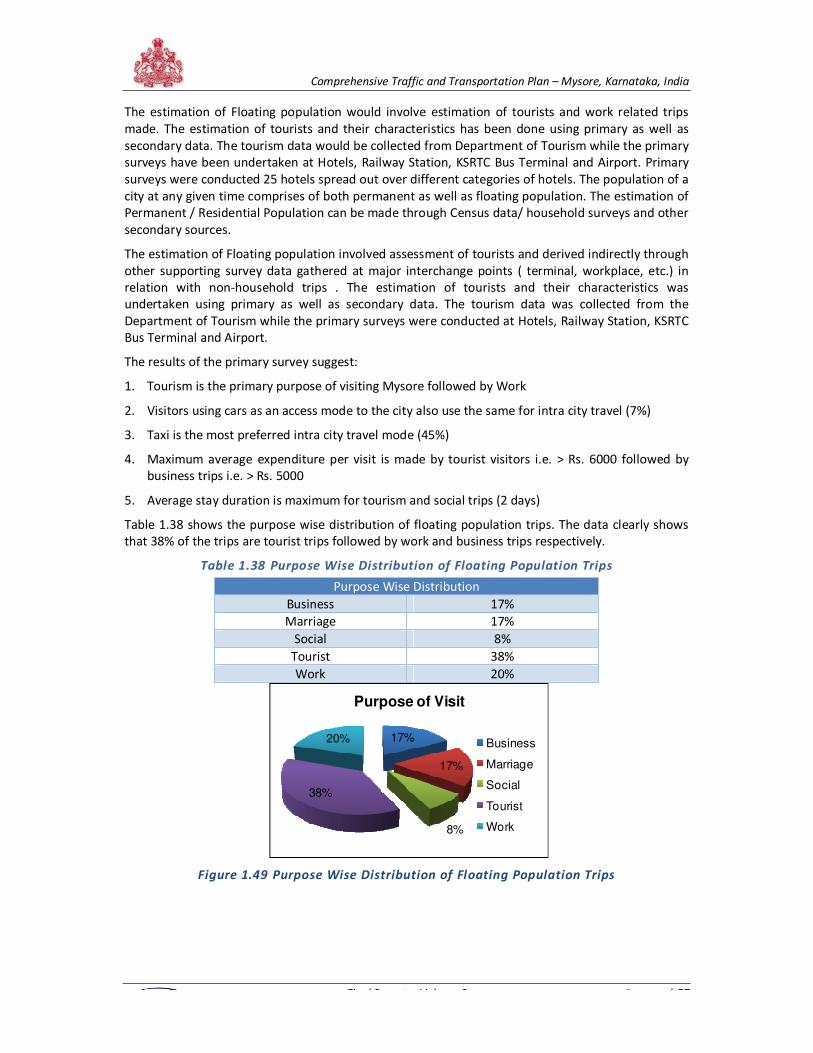
Comprehensive Traffic and Transportation Plan – Mysore, Karnataka, India
Final Report – Volume 2 P a g e | 57
The estimation of Floating population would involve estimation of tourists and work related trips
made. The estimation of tourists and their characteristics has been done using primary as well as
secondary data. The tourism data would be collected from Department of Tourism while the primary
surveys have been undertaken at Hotels, Railway Station, KSRTC Bus Terminal and Airport. Primary
surveys were conducted 25 hotels spread out over different categories of hotels. The population of a
city at any given time comprises of both permanent as well as floating population. The estimation of
Permanent / Residential Population can be made through Census data/ household surveys and other
secondary sources.
The estimation of Floating population involved assessment of tourists and derived indirectly through
other supporting survey data gathered at major interchange points ( terminal, workplace, etc.) in
relation with non-household trips . The estimation of tourists and their characteristics was
undertaken using primary as well as secondary data. The tourism data was collected from the
Department of Tourism while the primary surveys were conducted at Hotels, Railway Station, KSRTC
Bus Terminal and Airport.
The results of the primary survey suggest:
1. Tourism is the primary purpose of visiting Mysore followed by Work
2. Visitors using cars as an access mode to the city also use the same for intra city travel (7%)
3. Taxi is the most preferred intra city travel mode (45%)
4. Maximum average expenditure per visit is made by tourist visitors i.e. > Rs. 6000 followed by
business trips i.e. > Rs. 5000
5. Average stay duration is maximum for tourism and social trips (2 days)
Table 1.38 shows the purpose wise distribution of floating population trips. The data clearly shows
that 38% of the trips are tourist trips followed by work and business trips respectively.
Table 1.38 Purpose Wise Distribution of Floating Population Trips
Purpose Wise Distribution
Business 17%
Marriage 17%
Social 8%
Tourist 38%
Work 20%
Figure 1.49 Purpose Wise Distribution of Floating Population Trips
17%
17%
8%
38%
20%
Purpose of Visit
Business
Marriage
Social
Tourist
Work
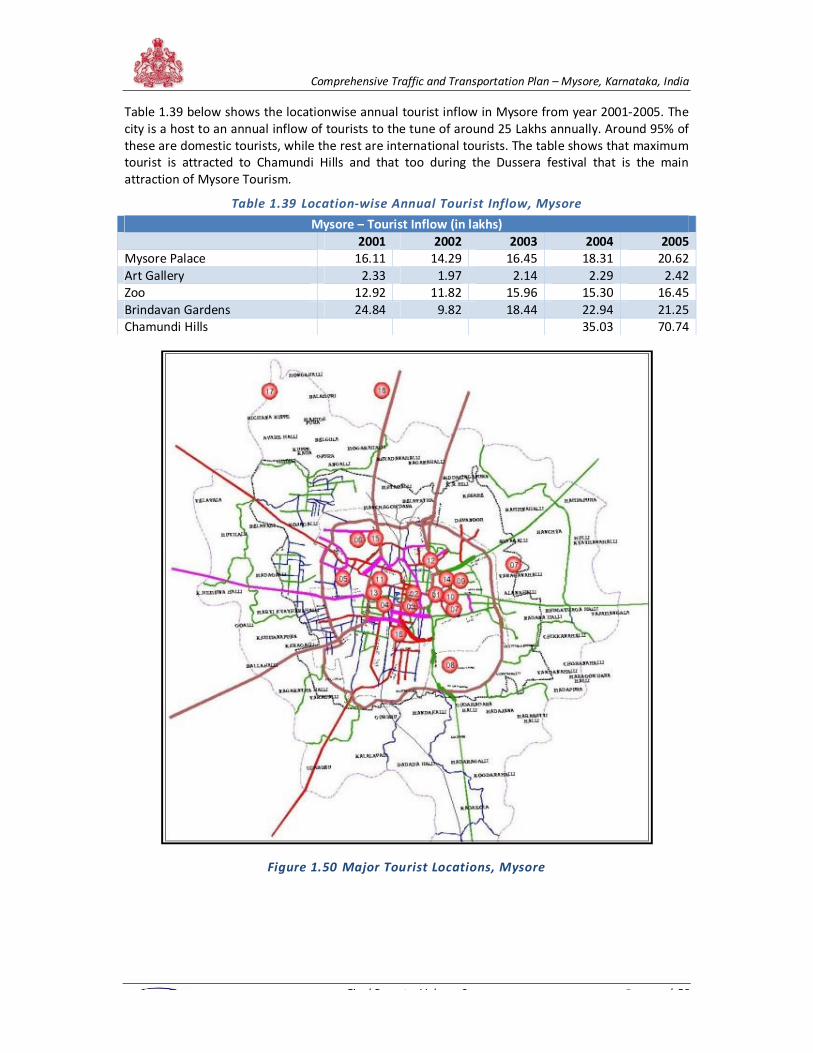
Comprehensive Traffic and Transportation Plan – Mysore, Karnataka, India
Final Report – Volume 2 P a g e | 58
Table 1.39 below shows the locationwise annual tourist inflow in Mysore from year 2001-2005. The
city is a host to an annual inflow of tourists to the tune of around 25 Lakhs annually. Around 95% of
these are domestic tourists, while the rest are international tourists. The table shows that maximum
tourist is attracted to Chamundi Hills and that too during the Dussera festival that is the main
attraction of Mysore Tourism.
Table 1.39 Location-wise Annual Tourist Inflow, Mysore
Mysore – Tourist Inflow (in lakhs)
2001 2002 2003 2004 2005
Mysore Palace 16.11 14.29 16.45 18.31 20.62
Art Gallery 2.33 1.97 2.14 2.29 2.42
Zoo 12.92 11.82 15.96 15.30 16.45
Brindavan Gardens 24.84 9.82 18.44 22.94 21.25
Chamundi Hills
35.03 70.74
Figure 1.50 Major Tourist Locations, Mysore
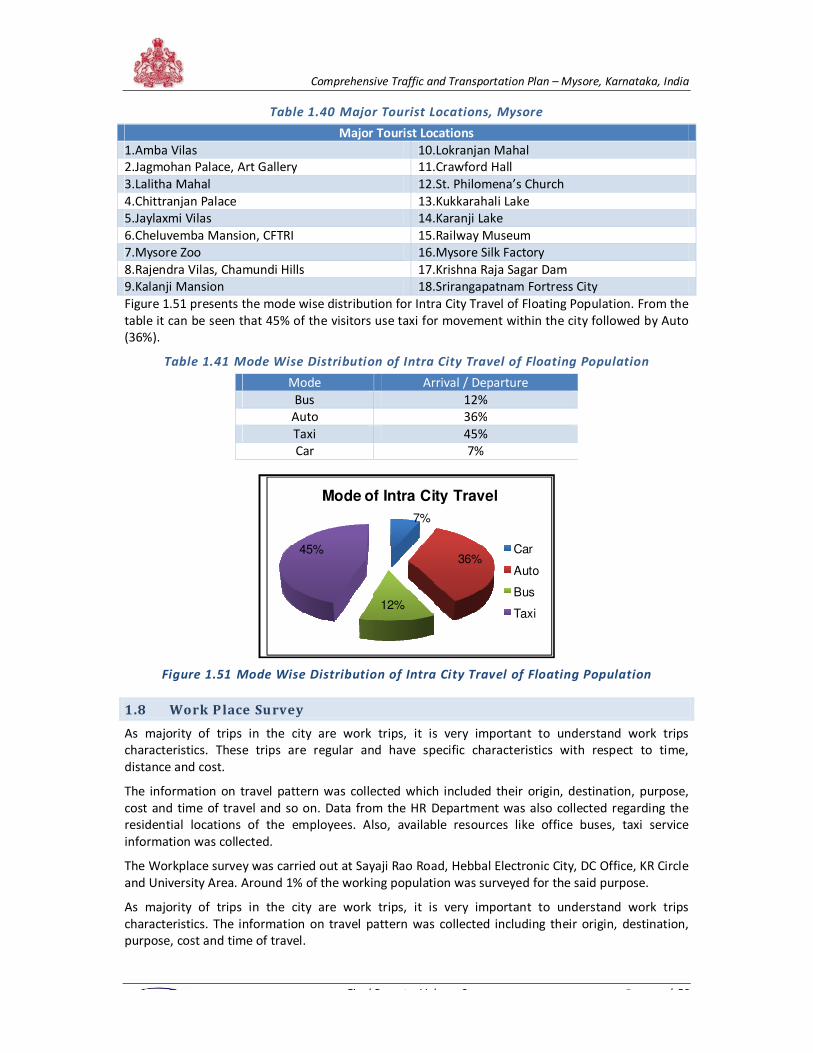
Comprehensive Traffic and Transportation Plan – Mysore, Karnataka, India
Final Report – Volume 2 P a g e | 59
Table 1.40 Major Tourist Locations, Mysore
Major Tourist Locations
1.Amba Vilas 10.Lokranjan Mahal
2.Jagmohan Palace, Art Gallery 11.Crawford Hall
3.Lalitha Mahal 12.St. Philomena’s Church
4.Chittranjan Palace 13.Kukkarahali Lake
5.Jaylaxmi Vilas 14.Karanji Lake
6.Cheluvemba Mansion, CFTRI 15.Railway Museum
7.Mysore Zoo 16.Mysore Silk Factory
8.Rajendra Vilas, Chamundi Hills 17.Krishna Raja Sagar Dam
9.Kalanji Mansion 18.Srirangapatnam Fortress City
Figure 1.51 presents the mode wise distribution for Intra City Travel of Floating Population. From the
table it can be seen that 45% of the visitors use taxi for movement within the city followed by Auto
(36%).
Table 1.41 Mode Wise Distribution of Intra City Travel of Floating Population
Mode Arrival / Departure
Bus 12%
Auto 36%
Taxi 45%
Car 7%
Figure 1.51 Mode Wise Distribution of Intra City Travel of Floating Population
1.8 Work Place Survey
As majority of trips in the city are work trips, it is very important to understand work trips
characteristics. These trips are regular and have specific characteristics with respect to time,
distance and cost.
The information on travel pattern was collected which included their origin, destination, purpose,
cost and time of travel and so on. Data from the HR Department was also collected regarding the
residential locations of the employees. Also, available resources like office buses, taxi service
information was collected.
The Workplace survey was carried out at Sayaji Rao Road, Hebbal Electronic City, DC Office, KR Circle
and University Area. Around 1% of the working population was surveyed for the said purpose.
As majority of trips in the city are work trips, it is very important to understand work trips
characteristics. The information on travel pattern was collected including their origin, destination,
purpose, cost and time of travel.
7%
36%
12%
45%
Mode of Intra City Travel
Car
Auto
Bus
Taxi
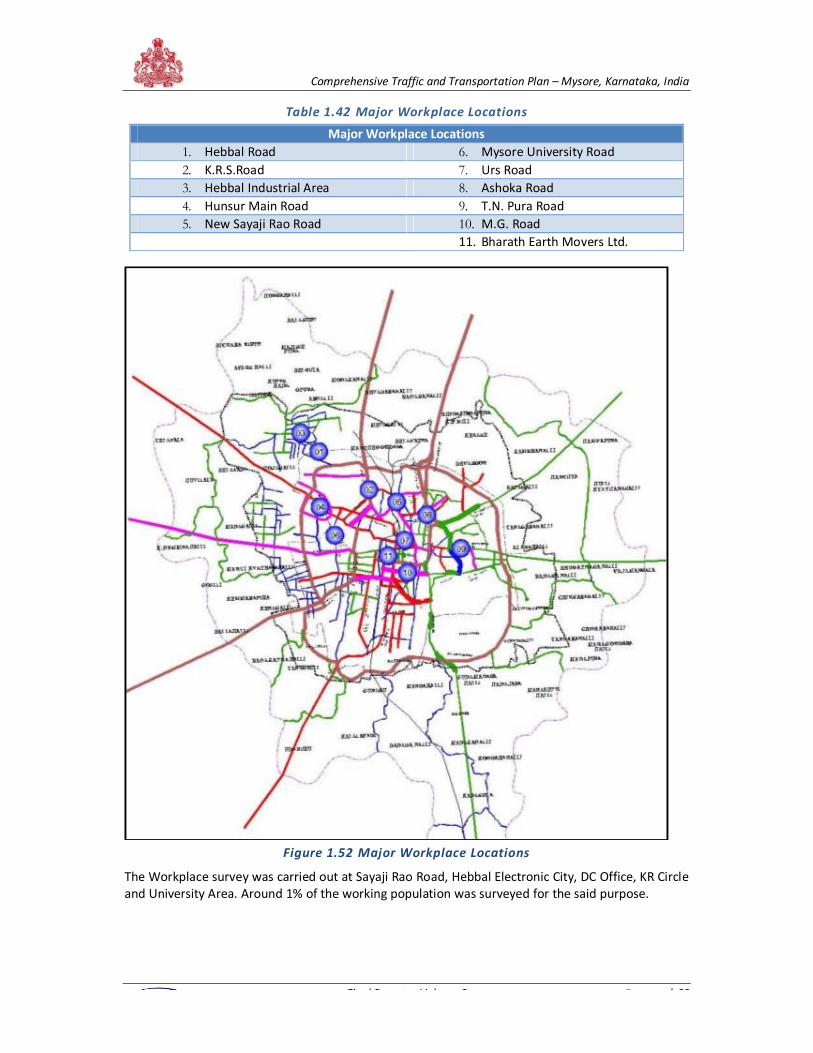
Comprehensive Traffic and Transportation Plan – Mysore, Karnataka, India
Final Report – Volume 2 P a g e | 60
Table 1.42 Major Workplace Locations
Major Workplace Locations
1. Hebbal Road 6. Mysore University Road
2. K.R.S.Road 7. Urs Road
3. Hebbal Industrial Area 8. Ashoka Road
4. Hunsur Main Road 9. T.N. Pura Road
5. New Sayaji Rao Road 10. M.G. Road
11. Bharath Earth Movers Ltd.
Figure 1.52 Major Workplace Locations
The Workplace survey was carried out at Sayaji Rao Road, Hebbal Electronic City, DC Office, KR Circle
and University Area. Around 1% of the working population was surveyed for the said purpose.
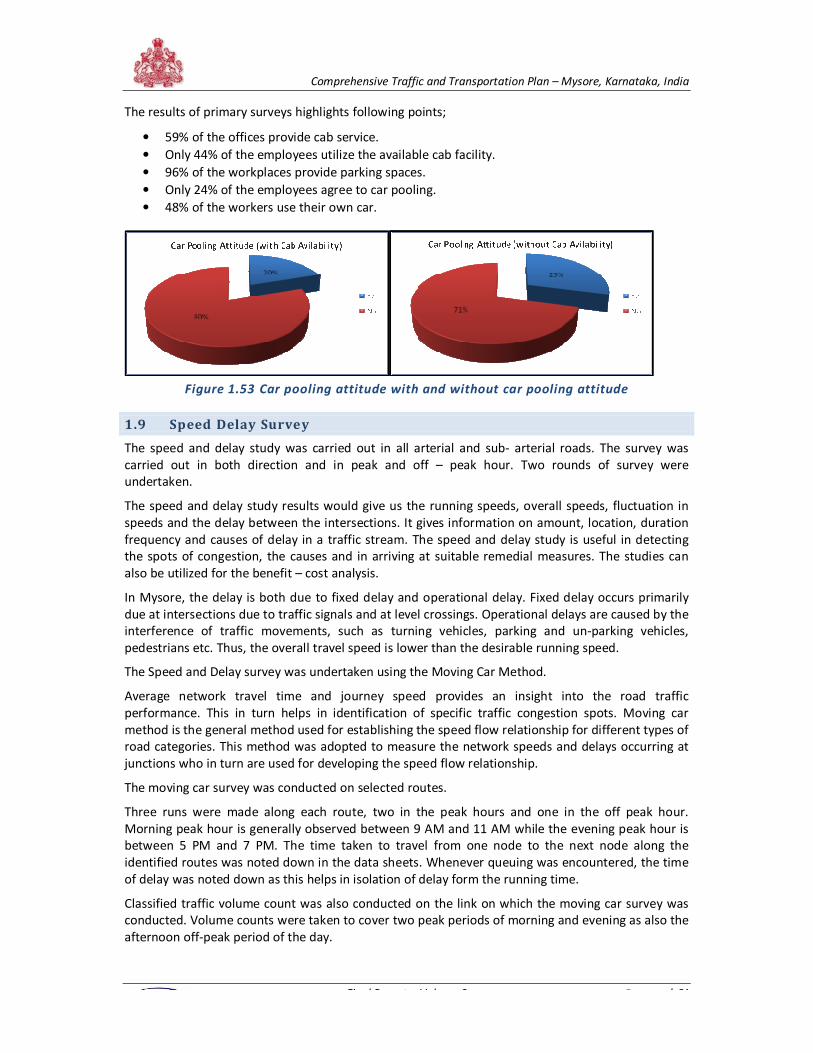
Comprehensive Traffic and Transportation Plan – Mysore, Karnataka, India
Final Report – Volume 2 P a g e | 61
The results of primary surveys highlights following points;
• 59% of the offices provide cab service.
• Only 44% of the employees utilize the available cab facility.
• 96% of the workplaces provide parking spaces.
• Only 24% of the employees agree to car pooling.
• 48% of the workers use their own car.
Figure 1.53 Car pooling attitude with and without car pooling attitude
1.9 Speed Delay Survey
The speed and delay study was carried out in all arterial and sub- arterial roads. The survey was
carried out in both direction and in peak and off – peak hour. Two rounds of survey were
undertaken.
The speed and delay study results would give us the running speeds, overall speeds, fluctuation in
speeds and the delay between the intersections. It gives information on amount, location, duration
frequency and causes of delay in a traffic stream. The speed and delay study is useful in detecting
the spots of congestion, the causes and in arriving at suitable remedial measures. The studies can
also be utilized for the benefit – cost analysis.
In Mysore, the delay is both due to fixed delay and operational delay. Fixed delay occurs primarily
due at intersections due to traffic signals and at level crossings. Operational delays are caused by the
interference of traffic movements, such as turning vehicles, parking and un-parking vehicles,
pedestrians etc. Thus, the overall travel speed is lower than the desirable running speed.
The Speed and Delay survey was undertaken using the Moving Car Method.
Average network travel time and journey speed provides an insight into the road traffic
performance. This in turn helps in identification of specific traffic congestion spots. Moving car
method is the general method used for establishing the speed flow relationship for different types of
road categories. This method was adopted to measure the network speeds and delays occurring at
junctions who in turn are used for developing the speed flow relationship.
The moving car survey was conducted on selected routes.
Three runs were made along each route, two in the peak hours and one in the off peak hour.
Morning peak hour is generally observed between 9 AM and 11 AM while the evening peak hour is
between 5 PM and 7 PM. The time taken to travel from one node to the next node along the
identified routes was noted down in the data sheets. Whenever queuing was encountered, the time
of delay was noted down as this helps in isolation of delay form the running time.
Classified traffic volume count was also conducted on the link on which the moving car survey was
conducted. Volume counts were taken to cover two peak periods of morning and evening as also the
afternoon off-peak period of the day.
Comprehensive Traffic and Transportation Plan – Mysore, Karnataka, India
Final Report – Volume 2 P a g e | 62
Journey speed studies on a road network are useful to evaluate congestion, capacity, level of
services and the need for improvements. In transportation planning exercise, determination of the
travel time is necessary for carrying out the trip assignment and travel time and delays are some of
the factors affecting model choice. Before and after studies pertaining to journey time are useful for
assessing the effectiveness of improvement measures. Delay studies at intersections provide data
for the design and installation of appropriate traffic control devices.
1.9.1 Method followed for measurement of running speed and journey speed
Moving Observer Method: In this method, the speed and flow can be obtained by travelling in a car
against and with the flow and at the same time noting down the journey time, delays, and the
number of vehicles met with from the opposite direction and number of vehicles overtaking the test
vehicle. The field survey was conducted mostly during the morning peak in the working day from
9.30 AM to 11.00 AM and also in the evening peak from 4.00 PM to 6.00 PM.
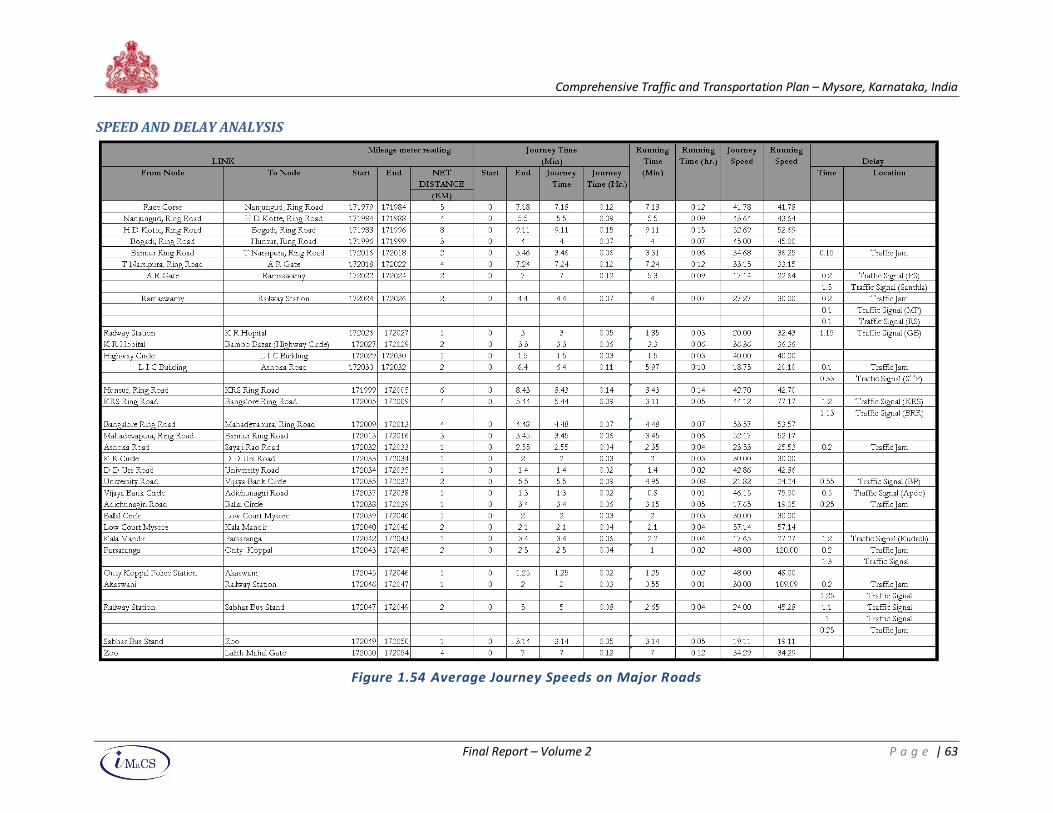
Comprehensive Traffic and Transportation Plan – Mysore, Karnataka, India
Final Report – Volume 2 P a g e | 63
SPEED AND DELAY ANALYSIS
Figure 1.54 Average Journey Speeds on Major Roads
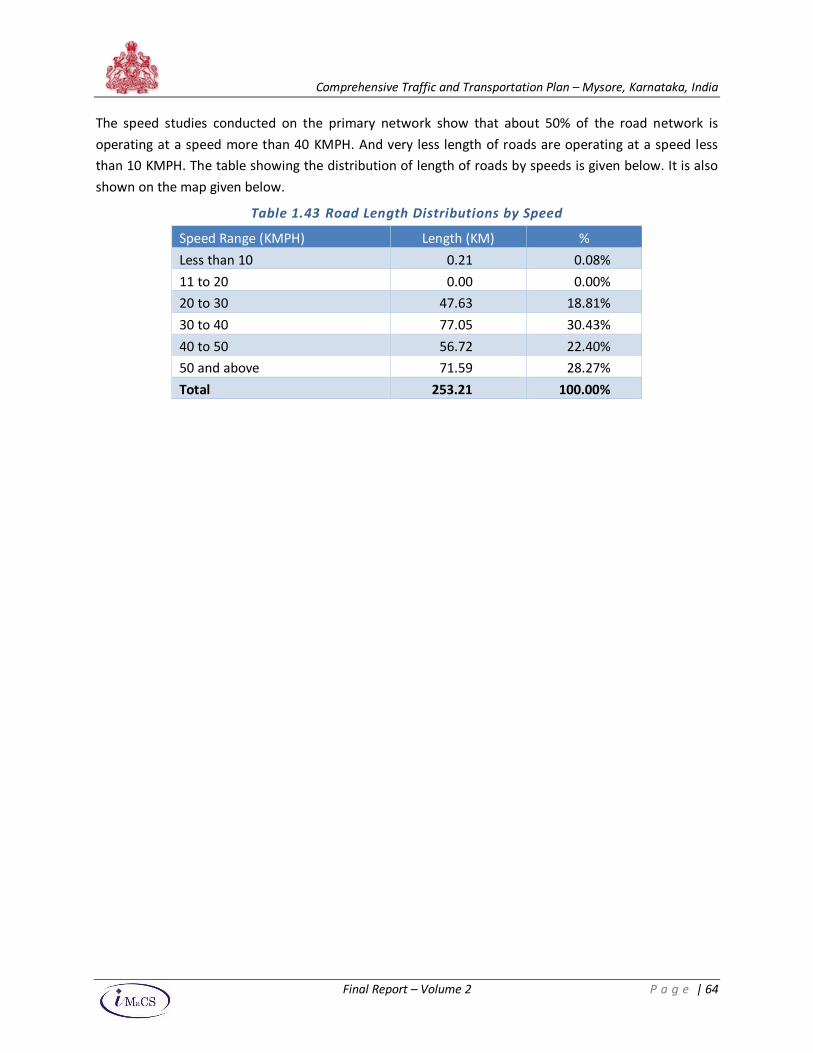
Comprehensive Traffic and Transportation Plan – Mysore, Karnataka, India
Final Report – Volume 2 P a g e | 64
The speed studies conducted on the primary network show that about 50% of the road network is
operating at a speed more than 40 KMPH. And very less length of roads are operating at a speed less
than 10 KMPH. The table showing the distribution of length of roads by speeds is given below. It is also
shown on the map given below.
Table 1.43 Road Length Distributions by Speed
Speed Range (KMPH) Length (KM) %
Less than 10 0.21 0.08%
11 to 20 0.00 0.00%
20 to 30 47.63 18.81%
30 to 40 77.05 30.43%
40 to 50 56.72 22.40%
50 and above 71.59 28.27%
Total 253.21 100.00%
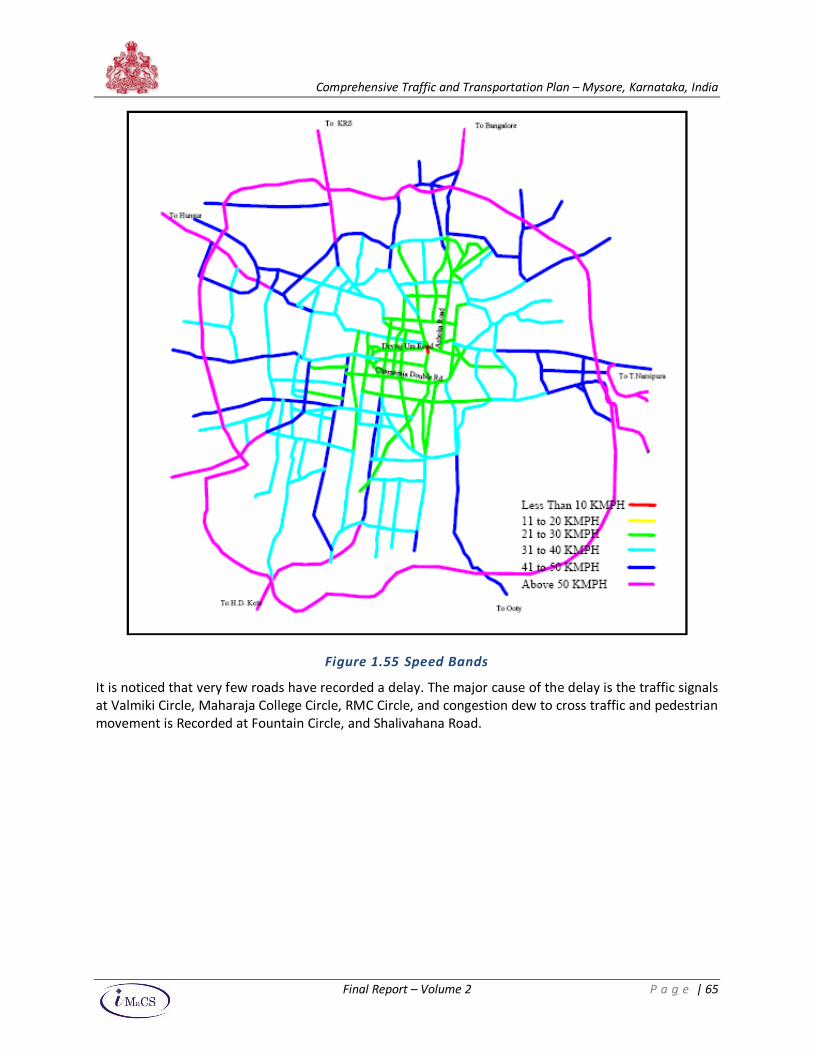
Comprehensive Traffic and Transportation Plan – Mysore, Karnataka, India
Final Report – Volume 2 P a g e | 65
Figure 1.55 Speed Bands
It is noticed that very few roads have recorded a delay. The major cause of the delay is the traffic signals
at Valmiki Circle, Maharaja College Circle, RMC Circle, and congestion dew to cross traffic and pedestrian
movement is Recorded at Fountain Circle, and Shalivahana Road.
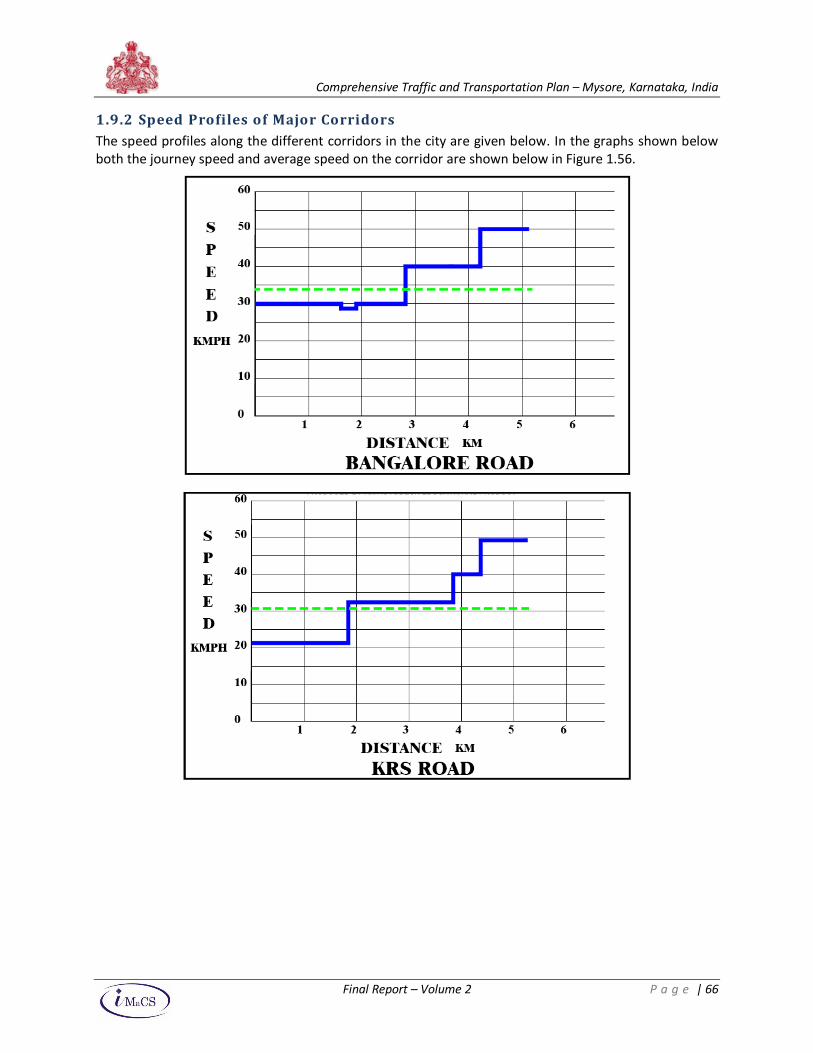
Comprehensive Traffic and Transportation Plan – Mysore, Karnataka, India
Final Report – Volume 2 P a g e | 66
1.9.2 Speed Profiles of Major Corridors
The speed profiles along the different corridors in the city are given below. In the graphs shown below
both the journey speed and average speed on the corridor are shown below in Figure 1.56.
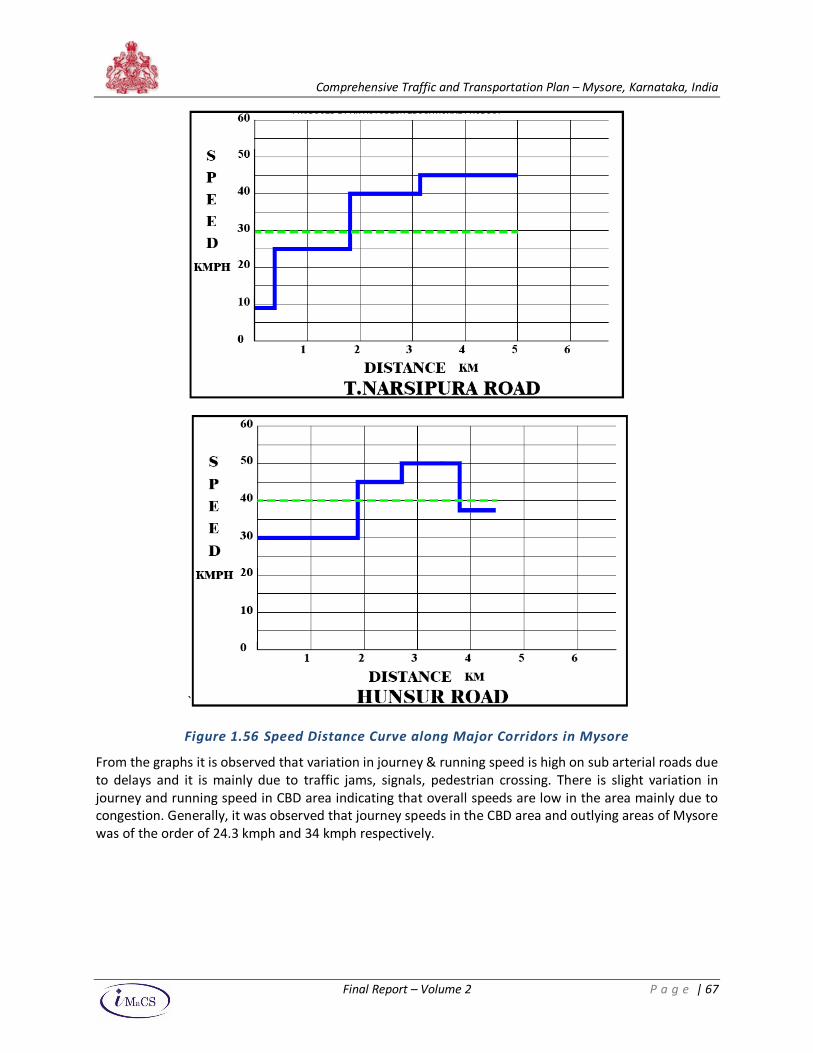
Comprehensive Traffic and Transportation Plan – Mysore, Karnataka, India
Final Report – Volume 2 P a g e | 67
`
Figure 1.56 Speed Distance Curve along Major Corridors in Mysore
From the graphs it is observed that variation in journey & running speed is high on sub arterial roads due
to delays and it is mainly due to traffic jams, signals, pedestrian crossing. There is slight variation in
journey and running speed in CBD area indicating that overall speeds are low in the area mainly due to
congestion. Generally, it was observed that journey speeds in the CBD area and outlying areas of Mysore
was of the order of 24.3 kmph and 34 kmph respectively.
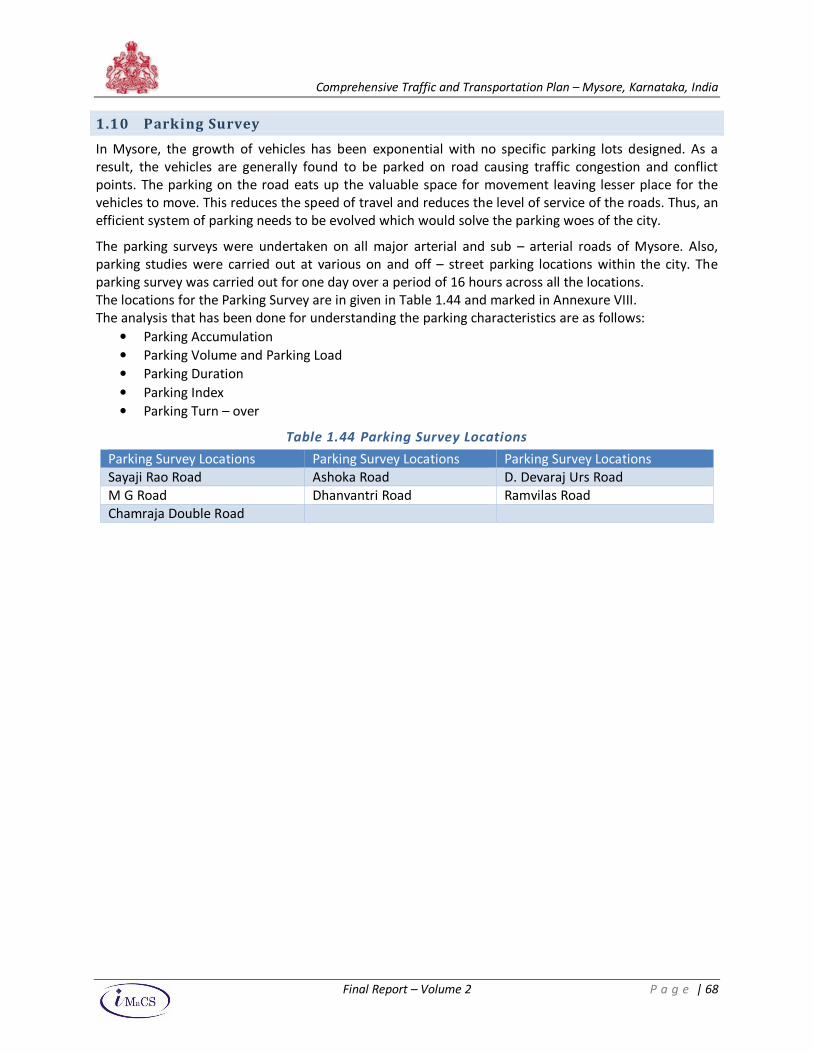
Comprehensive Traffic and Transportation Plan – Mysore, Karnataka, India
Final Report – Volume 2 P a g e | 68
1.10 Parking Survey
In Mysore, the growth of vehicles has been exponential with no specific parking lots designed. As a
result, the vehicles are generally found to be parked on road causing traffic congestion and conflict
points. The parking on the road eats up the valuable space for movement leaving lesser place for the
vehicles to move. This reduces the speed of travel and reduces the level of service of the roads. Thus, an
efficient system of parking needs to be evolved which would solve the parking woes of the city.
The parking surveys were undertaken on all major arterial and sub – arterial roads of Mysore. Also,
parking studies were carried out at various on and off – street parking locations within the city. The
parking survey was carried out for one day over a period of 16 hours across all the locations.
The locations for the Parking Survey are in given in Table 1.44 and marked in Annexure VIII.
The analysis that has been done for understanding the parking characteristics are as follows:
• Parking Accumulation
• Parking Volume and Parking Load
• Parking Duration
• Parking Index
• Parking Turn – over
Table 1.44 Parking Survey Locations
Parking Survey Locations Parking Survey Locations Parking Survey Locations
Sayaji Rao Road Ashoka Road D. Devaraj Urs Road
M G Road Dhanvantri Road Ramvilas Road
Chamraja Double Road
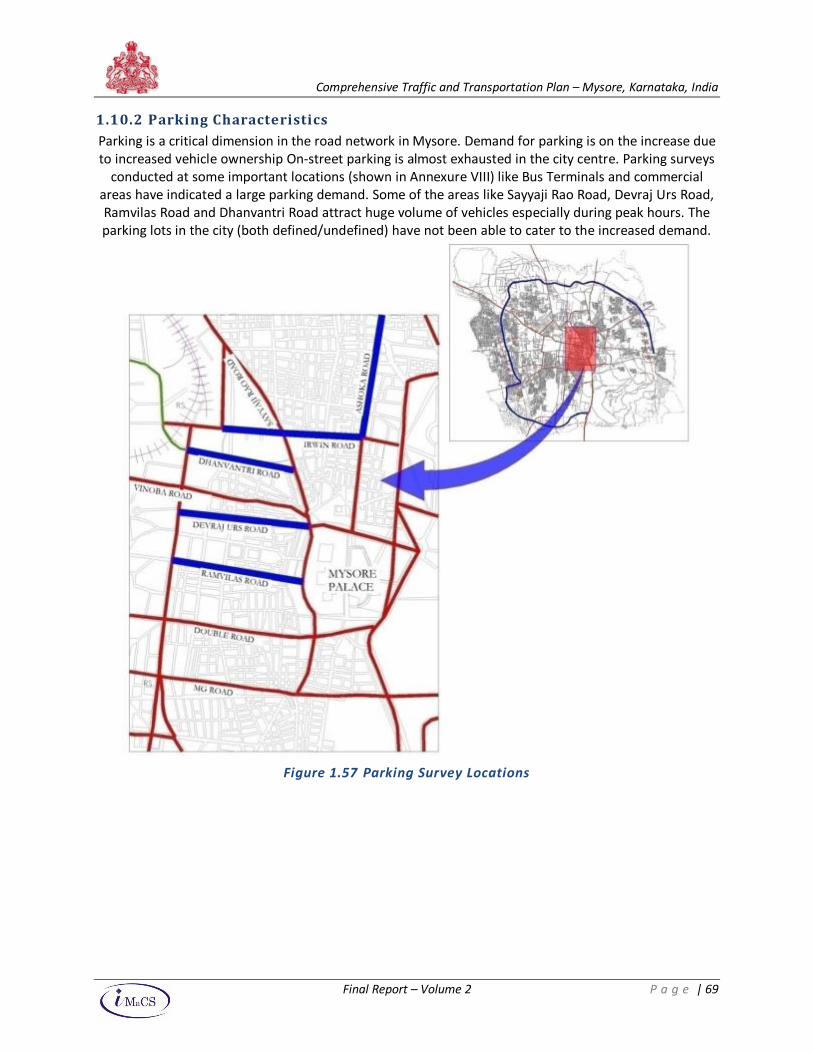
Comprehensive Traffic and Transportation Plan – Mysore, Karnataka, India
Final Report – Volume 2 P a g e | 69
1.10.2 Parking Characteristics
Parking is a critical dimension in the road network in Mysore. Demand for parking is on the increase due
to increased vehicle ownership On-street parking is almost exhausted in the city centre. Parking surveys
conducted at some important locations (shown in Annexure VIII) like Bus Terminals and commercial
areas have indicated a large parking demand. Some of the areas like Sayyaji Rao Road, Devraj Urs Road,
Ramvilas Road and Dhanvantri Road attract huge volume of vehicles especially during peak hours. The
parking lots in the city (both defined/undefined) have not been able to cater to the increased demand.
Figure 1.57 Parking Survey Locations
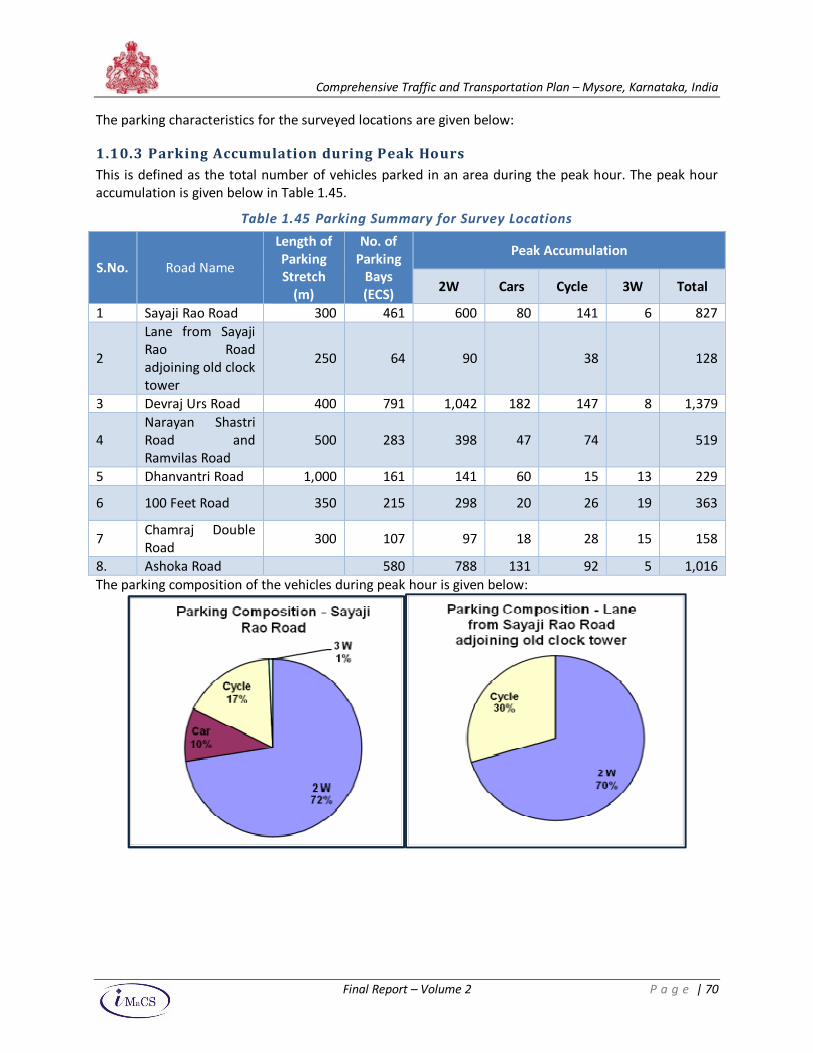
Comprehensive Traffic and Transportation Plan – Mysore, Karnataka, India
Final Report – Volume 2 P a g e | 70
The parking characteristics for the surveyed locations are given below:
1.10.3 Parking Accumulation during Peak Hours
This is defined as the total number of vehicles parked in an area during the peak hour. The peak hour
accumulation is given below in Table 1.45.
Table 1.45 Parking Summary for Survey Locations
S.No. Road Name
Length of
Parking
Stretch
(m)
No. of
Parking
Bays
(ECS)
Peak Accumulation
2W Cars Cycle 3W Total
1 Sayaji Rao Road 300 461 600 80 141 6 827
2
Lane from Sayaji
Rao Road
adjoining old clock
tower
250 64 90 38 128
3 Devraj Urs Road 400 791 1,042 182 147 8 1,379
4
Narayan Shastri
Road and
Ramvilas Road
500 283 398 47 74 519
5 Dhanvantri Road 1,000 161 141 60 15 13 229
6 100 Feet Road 350 215 298 20 26 19 363
7 Chamraj Double
Road 300 107 97 18 28 15 158
8. Ashoka Road 580 788 131 92 5 1,016
The parking composition of the vehicles during peak hour is given below:
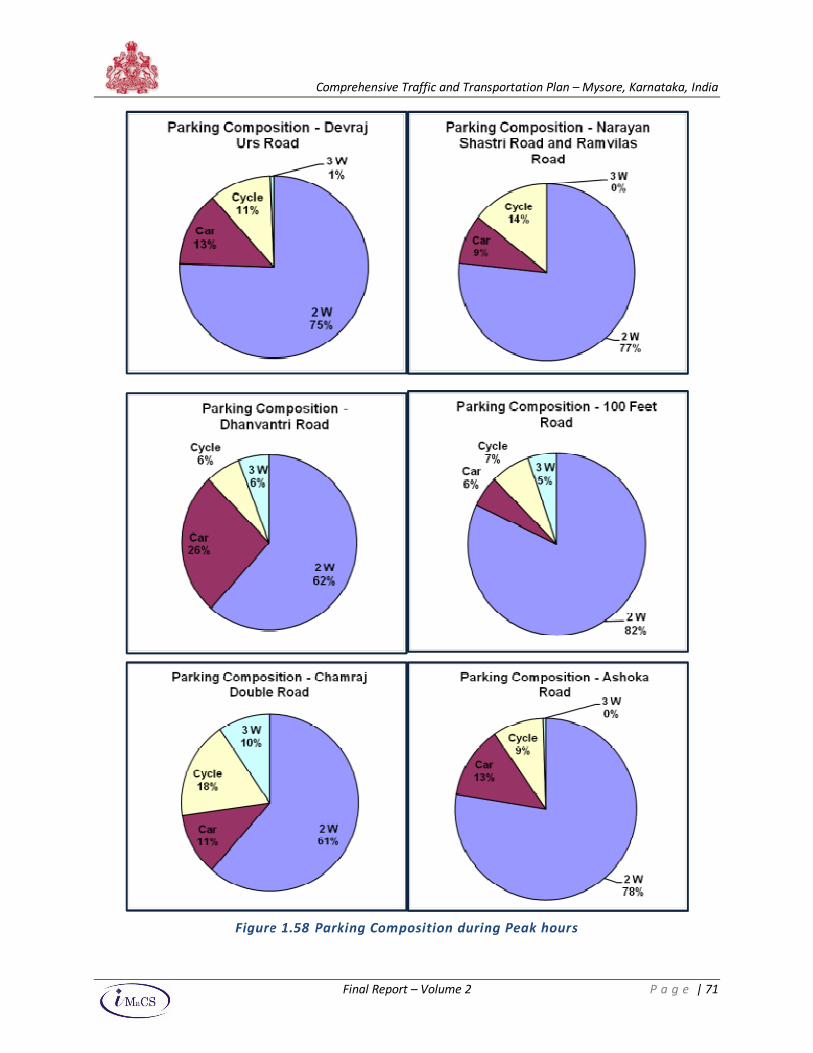
Comprehensive Traffic and Transportation Plan – Mysore, Karnataka, India
Final Report – Volume 2 P a g e | 71
Figure 1.58 Parking Composition during Peak hours
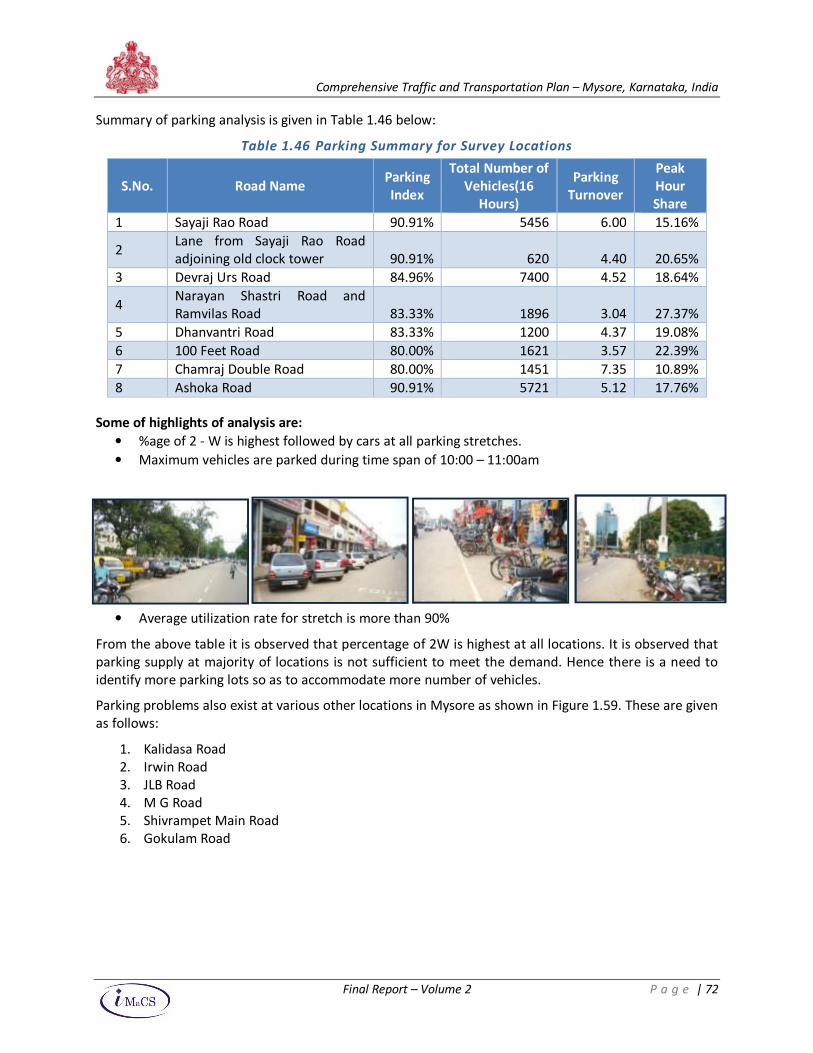
Comprehensive Traffic and Transportation Plan – Mysore, Karnataka, India
Final Report – Volume 2 P a g e | 72
Summary of parking analysis is given in Table 1.46 below:
Table 1.46 Parking Summary for Survey Locations
S.No. Road Name Parking
Index
Total Number of
Vehicles(16
Hours)
Parking
Turnover
Peak
Hour
Share
1 Sayaji Rao Road 90.91% 5456 6.00 15.16%
2 Lane from Sayaji Rao Road
adjoining old clock tower 90.91% 620 4.40 20.65%
3 Devraj Urs Road 84.96% 7400 4.52 18.64%
4 Narayan Shastri Road and
Ramvilas Road 83.33% 1896 3.04 27.37%
5 Dhanvantri Road 83.33% 1200 4.37 19.08%
6 100 Feet Road 80.00% 1621 3.57 22.39%
7 Chamraj Double Road 80.00% 1451 7.35 10.89%
8 Ashoka Road 90.91% 5721 5.12 17.76%
Some of highlights of analysis are:
• %age of 2 - W is highest followed by cars at all parking stretches.
• Maximum vehicles are parked during time span of 10:00 – 11:00am
• Average utilization rate for stretch is more than 90%
From the above table it is observed that percentage of 2W is highest at all locations. It is observed that
parking supply at majority of locations is not sufficient to meet the demand. Hence there is a need to
identify more parking lots so as to accommodate more number of vehicles.
Parking problems also exist at various other locations in Mysore as shown in Figure 1.59. These are given
as follows:
1. Kalidasa Road
2. Irwin Road
3. JLB Road
4. M G Road
5. Shivrampet Main Road
6. Gokulam Road
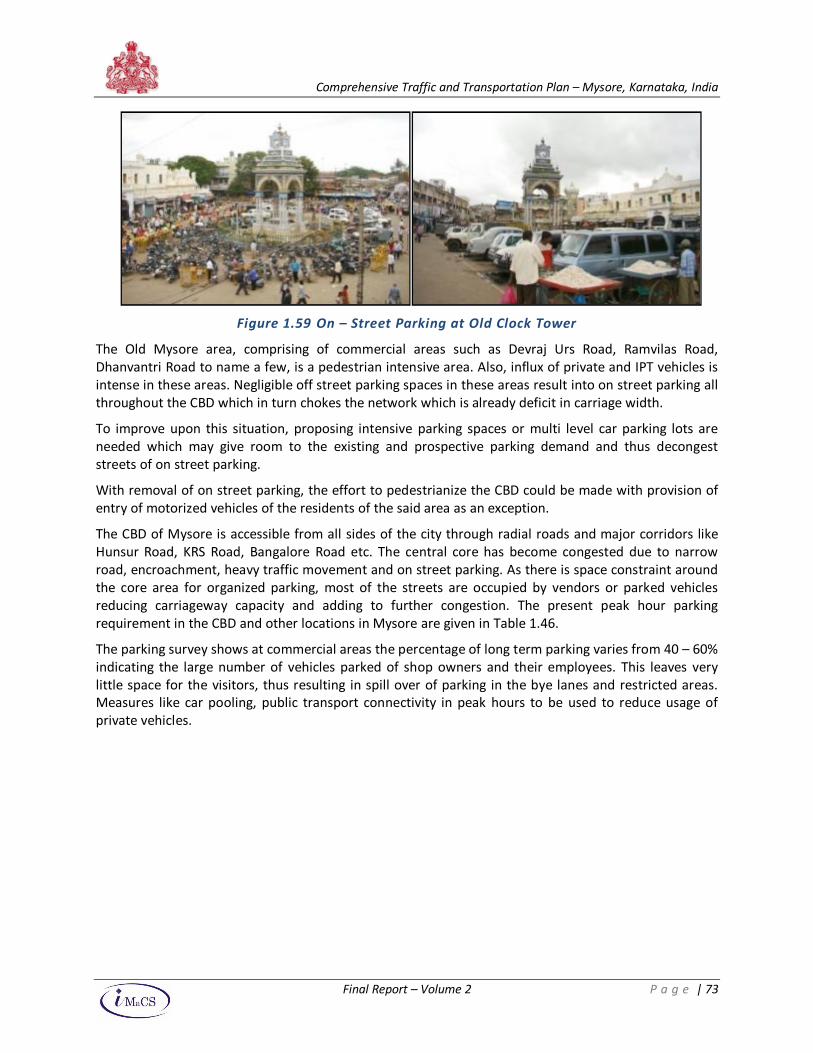
Comprehensive Traffic and Transportation Plan – Mysore, Karnataka, India
Final Report – Volume 2 P a g e | 73
Figure 1.59 On – Street Parking at Old Clock Tower
The Old Mysore area, comprising of commercial areas such as Devraj Urs Road, Ramvilas Road,
Dhanvantri Road to name a few, is a pedestrian intensive area. Also, influx of private and IPT vehicles is
intense in these areas. Negligible off street parking spaces in these areas result into on street parking all
throughout the CBD which in turn chokes the network which is already deficit in carriage width.
To improve upon this situation, proposing intensive parking spaces or multi level car parking lots are
needed which may give room to the existing and prospective parking demand and thus decongest
streets of on street parking.
With removal of on street parking, the effort to pedestrianize the CBD could be made with provision of
entry of motorized vehicles of the residents of the said area as an exception.
The CBD of Mysore is accessible from all sides of the city through radial roads and major corridors like
Hunsur Road, KRS Road, Bangalore Road etc. The central core has become congested due to narrow
road, encroachment, heavy traffic movement and on street parking. As there is space constraint around
the core area for organized parking, most of the streets are occupied by vendors or parked vehicles
reducing carriageway capacity and adding to further congestion. The present peak hour parking
requirement in the CBD and other locations in Mysore are given in Table 1.46.
The parking survey shows at commercial areas the percentage of long term parking varies from 40 – 60%
indicating the large number of vehicles parked of shop owners and their employees. This leaves very
little space for the visitors, thus resulting in spill over of parking in the bye lanes and restricted areas.
Measures like car pooling, public transport connectivity in peak hours to be used to reduce usage of
private vehicles.
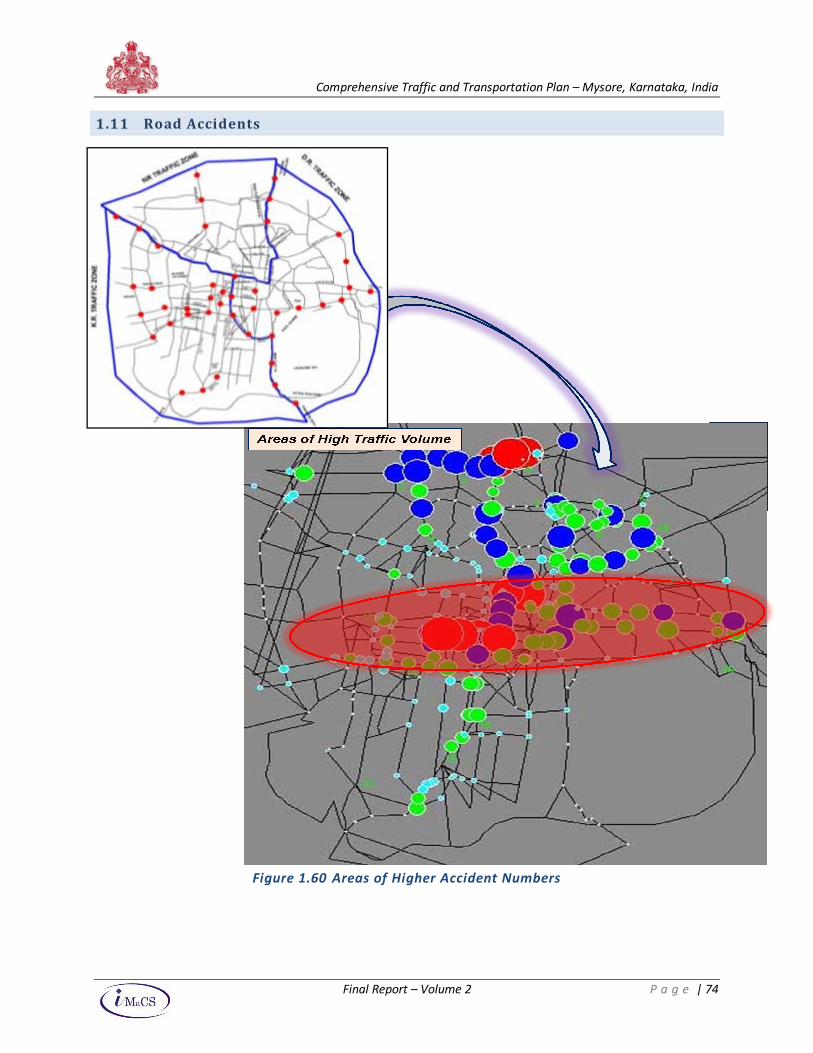
Comprehensive Traffic and Transportation Plan – Mysore, Karnataka, India
Final Report – Volume 2 P a g e | 74
1.11 Road Accidents
Figure 1.60 Areas of Higher Accident Numbers
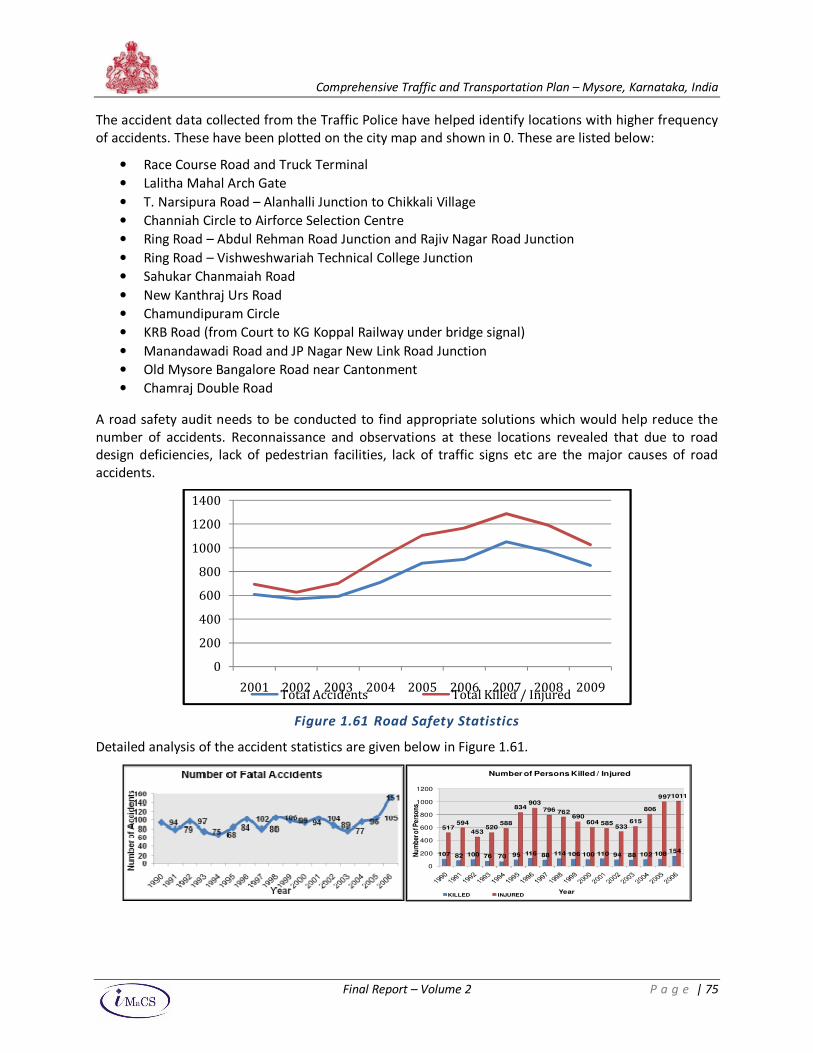
Comprehensive Traffic and Transportation Plan – Mysore, Karnataka, India
Final Report – Volume 2 P a g e | 75
The accident data collected from the Traffic Police have helped identify locations with higher frequency
of accidents. These have been plotted on the city map and shown in 0. These are listed below:
• Race Course Road and Truck Terminal
• Lalitha Mahal Arch Gate
• T. Narsipura Road – Alanhalli Junction to Chikkali Village
• Channiah Circle to Airforce Selection Centre
• Ring Road – Abdul Rehman Road Junction and Rajiv Nagar Road Junction
• Ring Road – Vishweshwariah Technical College Junction
• Sahukar Chanmaiah Road
• New Kanthraj Urs Road
• Chamundipuram Circle
• KRB Road (from Court to KG Koppal Railway under bridge signal)
• Manandawadi Road and JP Nagar New Link Road Junction
• Old Mysore Bangalore Road near Cantonment
• Chamraj Double Road
A road safety audit needs to be conducted to find appropriate solutions which would help reduce the
number of accidents. Reconnaissance and observations at these locations revealed that due to road
design deficiencies, lack of pedestrian facilities, lack of traffic signs etc are the major causes of road
accidents.
Figure 1.61 Road Safety Statistics
Detailed analysis of the accident statistics are given below in Figure 1.61.
0
200
400
600
800
1000
1200
1400
2001 2002 2003 2004 2005 2006 2007 2008 2009Total Accidents Total Killed / Injured
107 82 100 76 70 95 116 88 114 106 100 110 94 88 102 108154
517594
453520
588
834903
796 762690
604 585533
615
806
9971011
0
200
400
600
800
1000
1200
Nu
mbe
r of P
erso
ns
Year
Number of Persons Killed / Injured
KILLED INJURED
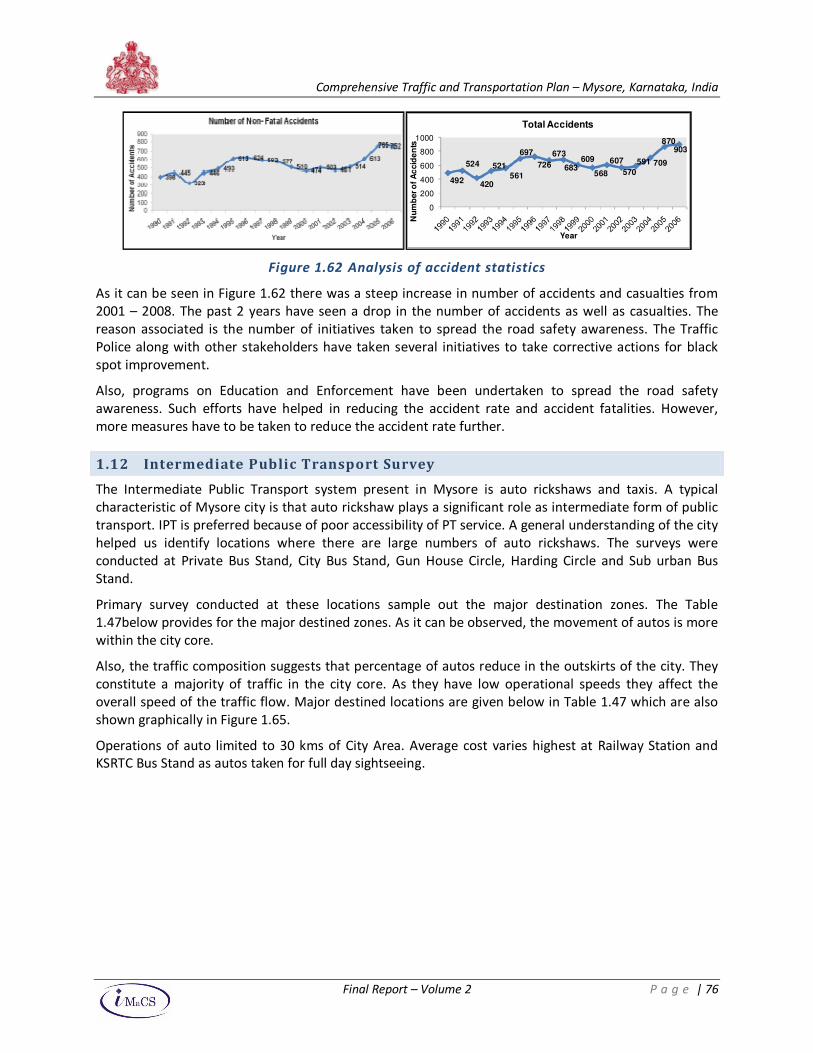
Comprehensive Traffic and Transportation Plan – Mysore, Karnataka, India
Final Report – Volume 2 P a g e | 76
Figure 1.62 Analysis of accident statistics
As it can be seen in Figure 1.62 there was a steep increase in number of accidents and casualties from
2001 – 2008. The past 2 years have seen a drop in the number of accidents as well as casualties. The
reason associated is the number of initiatives taken to spread the road safety awareness. The Traffic
Police along with other stakeholders have taken several initiatives to take corrective actions for black
spot improvement.
Also, programs on Education and Enforcement have been undertaken to spread the road safety
awareness. Such efforts have helped in reducing the accident rate and accident fatalities. However,
more measures have to be taken to reduce the accident rate further.
1.12 Intermediate Public Transport Survey
The Intermediate Public Transport system present in Mysore is auto rickshaws and taxis. A typical
characteristic of Mysore city is that auto rickshaw plays a significant role as intermediate form of public
transport. IPT is preferred because of poor accessibility of PT service. A general understanding of the city
helped us identify locations where there are large numbers of auto rickshaws. The surveys were
conducted at Private Bus Stand, City Bus Stand, Gun House Circle, Harding Circle and Sub urban Bus
Stand.
Primary survey conducted at these locations sample out the major destination zones. The Table
1.47below provides for the major destined zones. As it can be observed, the movement of autos is more
within the city core.
Also, the traffic composition suggests that percentage of autos reduce in the outskirts of the city. They
constitute a majority of traffic in the city core. As they have low operational speeds they affect the
overall speed of the traffic flow. Major destined locations are given below in Table 1.47 which are also
shown graphically in Figure 1.65.
Operations of auto limited to 30 kms of City Area. Average cost varies highest at Railway Station and
KSRTC Bus Stand as autos taken for full day sightseeing.
492
524
420
521
561
697
726
673
683609
568
607
570
591 709
870903
0
200
400
600
800
1000
Nu
mb
er o
f A
ccid
en
ts
Year
Total Accidents
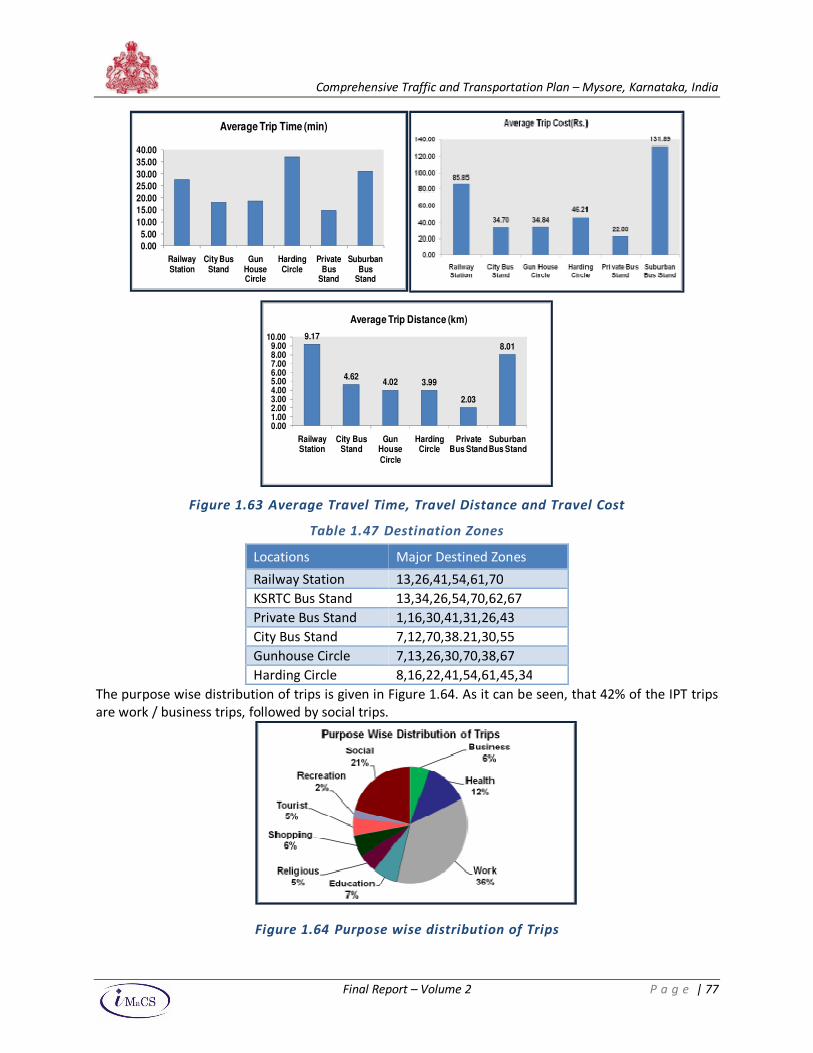
Comprehensive Traffic and Transportation Plan – Mysore, Karnataka, India
Final Report – Volume 2 P a g e | 77
Figure 1.63 Average Travel Time, Travel Distance and Travel Cost
Table 1.47 Destination Zones
Locations Major Destined Zones
Railway Station 13,26,41,54,61,70
KSRTC Bus Stand 13,34,26,54,70,62,67
Private Bus Stand 1,16,30,41,31,26,43
City Bus Stand 7,12,70,38.21,30,55
Gunhouse Circle 7,13,26,30,70,38,67
Harding Circle 8,16,22,41,54,61,45,34
The purpose wise distribution of trips is given in Figure 1.64. As it can be seen, that 42% of the IPT trips
are work / business trips, followed by social trips.
Figure 1.64 Purpose wise distribution of Trips
0.00
5.00
10.00
15.00
20.00
25.00
30.00
35.00
40.00
Railway Station
City Bus Stand
Gun House Circle
Harding Circle
Private Bus
Stand
Suburban Bus
Stand
Average Trip Time (min)
9.17
4.624.02 3.99
2.03
8.01
0.001.002.003.004.005.006.007.008.009.00
10.00
Railway Station
City Bus Stand
Gun House
Circle
Harding Circle
Private Bus Stand
Suburban Bus Stand
Average Trip Distance (km)
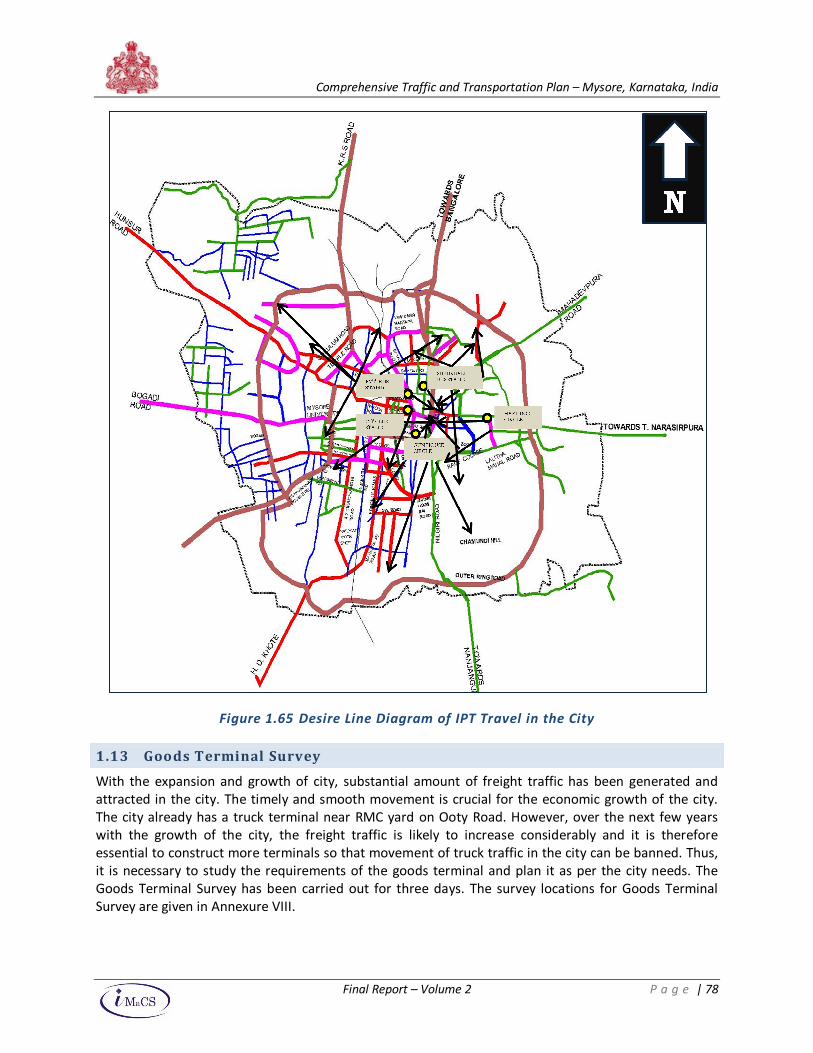
Comprehensive Traffic and Transportation Plan – Mysore, Karnataka, India
Final Report – Volume 2 P a g e | 78
Figure 1.65 Desire Line Diagram of IPT Travel in the City
1.13 Goods Terminal Survey
With the expansion and growth of city, substantial amount of freight traffic has been generated and
attracted in the city. The timely and smooth movement is crucial for the economic growth of the city.
The city already has a truck terminal near RMC yard on Ooty Road. However, over the next few years
with the growth of the city, the freight traffic is likely to increase considerably and it is therefore
essential to construct more terminals so that movement of truck traffic in the city can be banned. Thus,
it is necessary to study the requirements of the goods terminal and plan it as per the city needs. The
Goods Terminal Survey has been carried out for three days. The survey locations for Goods Terminal
Survey are given in Annexure VIII.
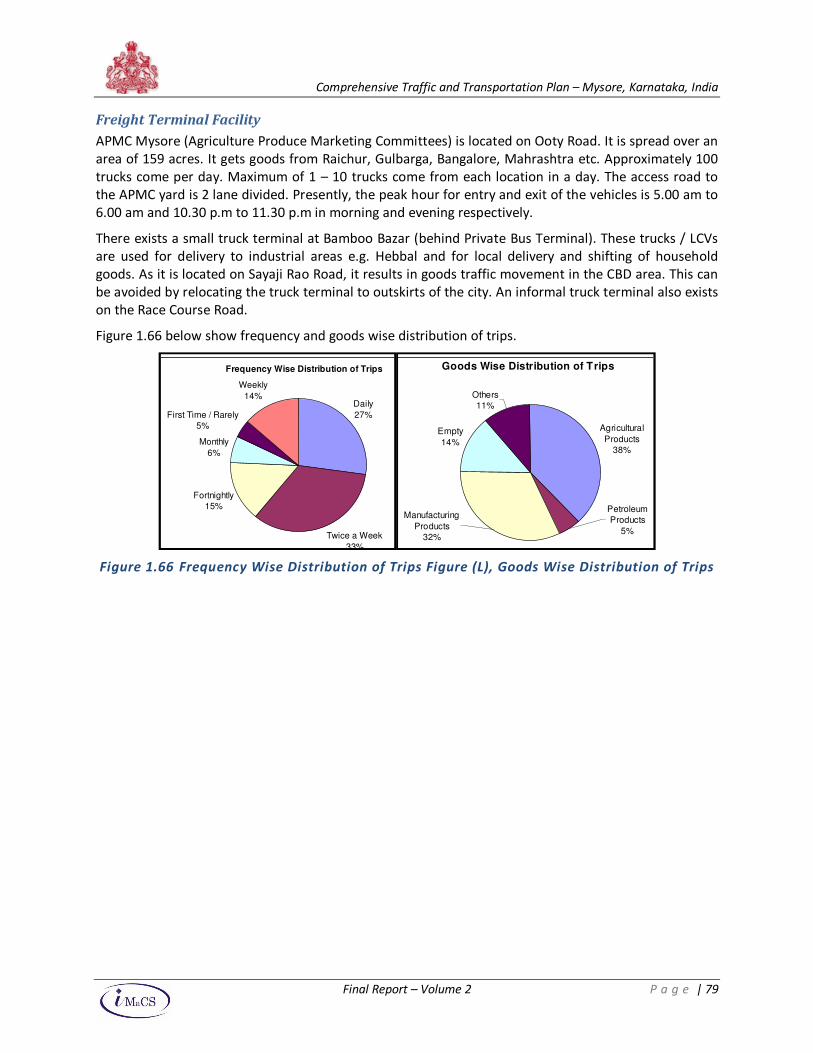
Comprehensive Traffic and Transportation Plan – Mysore, Karnataka, India
Final Report – Volume 2 P a g e | 79
Freight Terminal Facility
APMC Mysore (Agriculture Produce Marketing Committees) is located on Ooty Road. It is spread over an
area of 159 acres. It gets goods from Raichur, Gulbarga, Bangalore, Mahrashtra etc. Approximately 100
trucks come per day. Maximum of 1 – 10 trucks come from each location in a day. The access road to
the APMC yard is 2 lane divided. Presently, the peak hour for entry and exit of the vehicles is 5.00 am to
6.00 am and 10.30 p.m to 11.30 p.m in morning and evening respectively.
There exists a small truck terminal at Bamboo Bazar (behind Private Bus Terminal). These trucks / LCVs
are used for delivery to industrial areas e.g. Hebbal and for local delivery and shifting of household
goods. As it is located on Sayaji Rao Road, it results in goods traffic movement in the CBD area. This can
be avoided by relocating the truck terminal to outskirts of the city. An informal truck terminal also exists
on the Race Course Road.
Figure 1.66 below show frequency and goods wise distribution of trips.
Figure 1.66 Frequency Wise Distribution of Trips Figure (L), Goods Wise Distribution of Trips
Frequency Wise Distribution of Trips
Daily
27%
Twice a Week
33%
Fortnightly
15%
Monthly
6%
First Time / Rarely
5%
Weekly
14%
Goods Wise Distribution of Trips
Agricultural
Products
38%
Empty
14%
Petroleum
Products
5%
Manufacturing
Products
32%
Others
11%
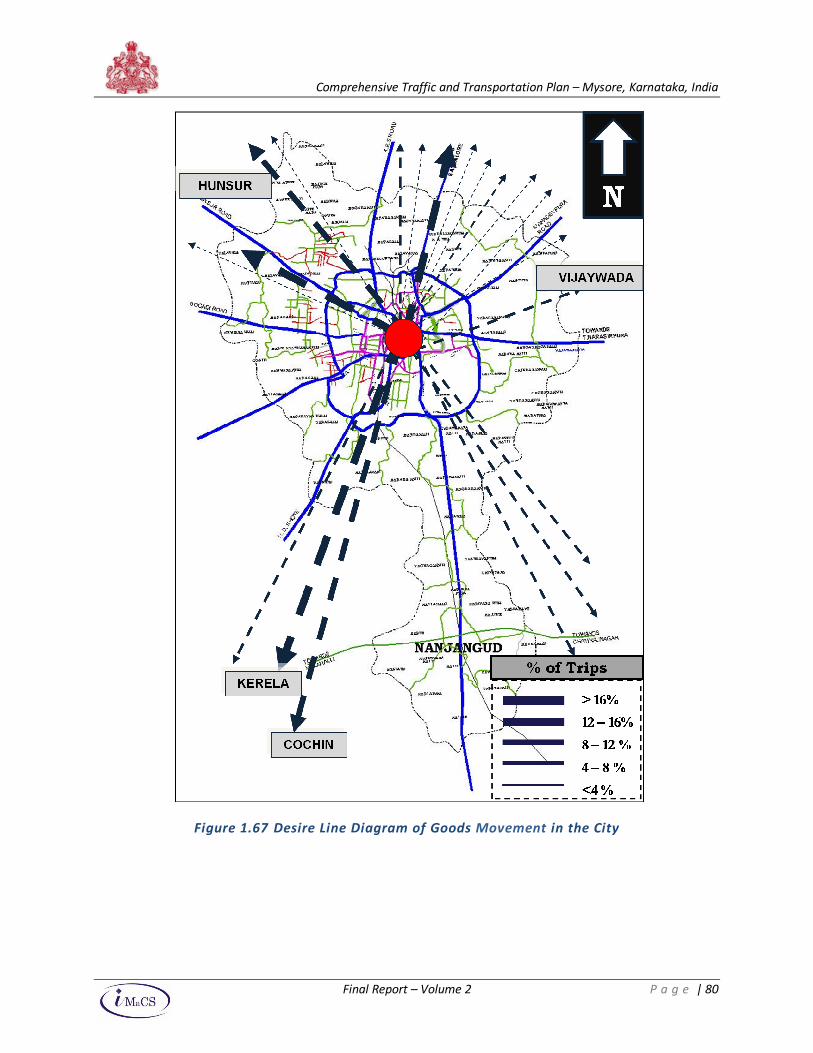
Comprehensive Traffic and Transportation Plan – Mysore, Karnataka, India
Final Report – Volume 2 P a g e | 80
Figure 1.67 Desire Line Diagram of Goods Movement in the City
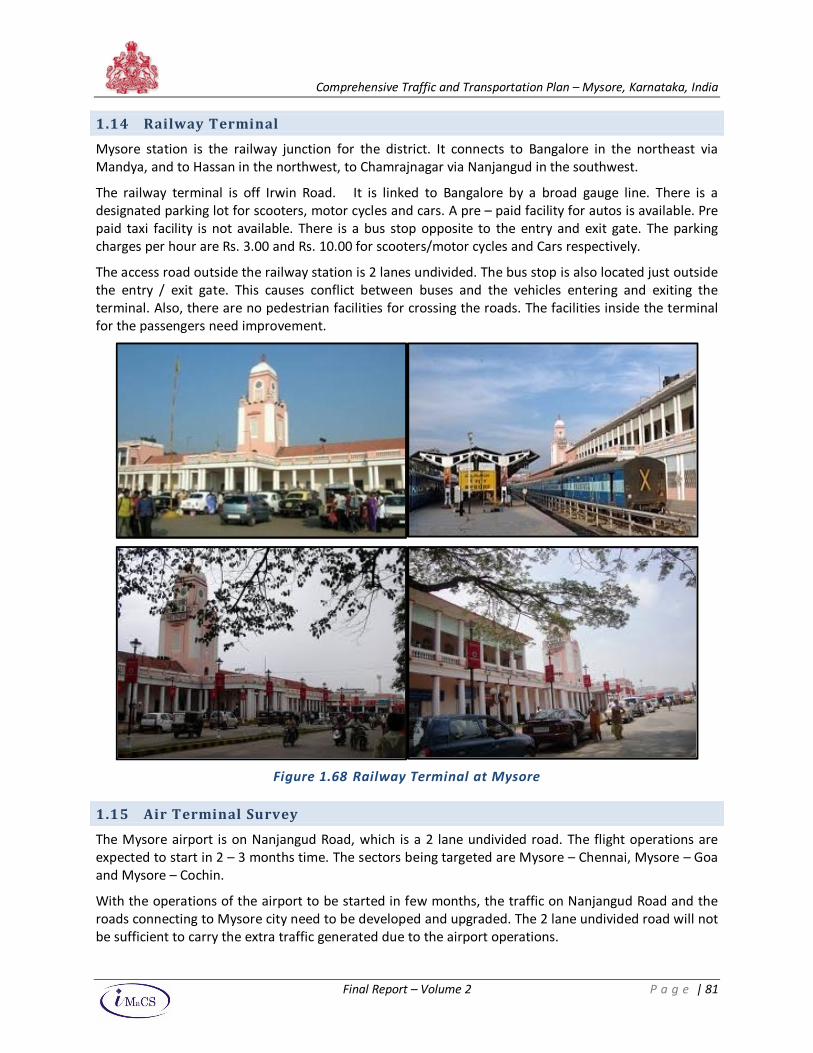
Comprehensive Traffic and Transportation Plan – Mysore, Karnataka, India
Final Report – Volume 2 P a g e | 81
1.14 Railway Terminal
Mysore station is the railway junction for the district. It connects to Bangalore in the northeast via
Mandya, and to Hassan in the northwest, to Chamrajnagar via Nanjangud in the southwest.
The railway terminal is off Irwin Road. It is linked to Bangalore by a broad gauge line. There is a
designated parking lot for scooters, motor cycles and cars. A pre – paid facility for autos is available. Pre
paid taxi facility is not available. There is a bus stop opposite to the entry and exit gate. The parking
charges per hour are Rs. 3.00 and Rs. 10.00 for scooters/motor cycles and Cars respectively.
The access road outside the railway station is 2 lanes undivided. The bus stop is also located just outside
the entry / exit gate. This causes conflict between buses and the vehicles entering and exiting the
terminal. Also, there are no pedestrian facilities for crossing the roads. The facilities inside the terminal
for the passengers need improvement.
Figure 1.68 Railway Terminal at Mysore
1.15 Air Terminal Survey
The Mysore airport is on Nanjangud Road, which is a 2 lane undivided road. The flight operations are
expected to start in 2 – 3 months time. The sectors being targeted are Mysore – Chennai, Mysore – Goa
and Mysore – Cochin.
With the operations of the airport to be started in few months, the traffic on Nanjangud Road and the
roads connecting to Mysore city need to be developed and upgraded. The 2 lane undivided road will not
be sufficient to carry the extra traffic generated due to the airport operations.
Comprehensive Traffic and Transportation Plan – Mysore, Karnataka, India
Final Report – Volume 2 P a g e | 82
1.16 SWOT Analysis
SWOT is an acronym for Strengths, Weakness, Opportunities and Threats. The aim of SWOT analysis is
to take advantage of strengths and opportunities and minimize weakness and eliminate threats.
1.16.1 Strengths in Mysore Transport Development
The strengths of the City are encapsulated in the following:
1. Old-world charm and confluence of heritage and culture
2. Salubrious climate, Planned city, having one of the oldest planning authorities in the country
3. High standard of education.
4. Low slum population (< 10%)
5. Room to grow
6. Good linkages with Bangalore, Tamil Nadu, Kerala The City benefiting from its proximity to
Bangalore, and the ‘push-effect’ on industry seeking to expand out of Bangalore.
1.16.2 Weakness in Mysore Transport Development
1. Tourism industry in a status-quo for the past many years Not much development beyond the ‘sight
seeing’ circuit
2. Inadequate transportation infrastructure
3. No proper airport, which could be a key reason why Mysore’s development has been so different
from that of Bangalore
4. Inadequate urban transport system
5. Inadequate bus system
6. No local tourist shuttles, which are very important in a tourist city
7. Rail connectivity with Bangalore is poor & doubling still not on the fast-track
1.16.3 Opportunities
1) Tourism - Mysore attracts annually 25 lakh visitors, which as anticipated is expected to increase to
50 lakh by 2015. This would be because of better connectivity in terms of
a) Doubling of rail track between Mysore and Bangalore
b) Operations at Mysore Airport to start by June, 2010
c) Development of Bangalore – Mysore Expressway – Nandi Infrastructure Corridor Enterprise
(NICE) – The expressway would run parallel to the 4 lane Bangalore – Mysore State Highway
No. 17.
2) IT Hub - Mysore is set to emerge as an information technology (IT) hub, next only to Bangalore. At
present a fairly large amount of tech hub is flourishing in the imperial city and is the home to more
than three dozens IT companies such as Software Paradigms India, WiFiyNet, Logrosoft, Raman
Infotech, Infosys Technologies, Excel Soft, Signefera and L&T. Presently the city gave employment to
more than 5,000 IT professionals in different IT Companies in Mysore.
3) Development of Educational and Health Facilities : The City Development Plan has been prepared by
Mysore City Corporation in context of the Jawaharlal Nehru National Urban Renewal Mission
(JNNURM). Special mention of development of healthcare and educational facilities are mentioned.
The sector specific strategies talks about allocation of 1051 crores in development of healthcare and
educational facilities.
Comprehensive Traffic and Transportation Plan – Mysore, Karnataka, India
Final Report – Volume 2 P a g e | 83
1.16.4 Threats / Challenges in Mysore Transport Development
1) Institutional Mechanism: The above discussion suggests that there are many agencies involved in
the urban transport in Mysore. As such there is nothing wrong in multiplicity of authorities. However
currently there is no mechanism to ensure coordination among various institutions which is one of
the key road block affecting formulation and implementation of major schemes and initiatives to
improve the traffic situation and mobility plans in the city. Close co-ordination is needed on number
of factors
2) Absence of Master Plan: The Master Plan – Mysore is under preparation and is the absence of the
same, it is difficult to understand the growth prospects and change in land use that would impact
the traffic and transport scenario of the city.
3) Unplanned and uncontrolled expansion of Mysore City: The growth of IT and ITES, health and
educational facilities might lead to unplanned and uncontrolled spatial expansion. This often results
in under utilisation and over exploitation of resources and planned facilities. Such growth leads to
rapid increase in infrastructure demand and clogs and deteriorates the existing infrastructure too.
4) Rising Private Vehicle Population: With the fast pace development in Mysore, the private vehicles
population is on a rise. The growth of IT and ITES, health care and education facilities would further
increase the private vehicles. The growth needs to be controlled.
1.17 Transportation Issues
A) Road Network Issues
1. In the current situation where the vehicles are increasing and traffic load on these roads is
bound to increase there is a need to devise strategies to ease the congestion and ensure smooth
and safe movement of people.
2. There is inadequate availability of right of way pertaining to primary network at Ashoka Road,
Sayaji Rao Road, Dhanvantri Road, Kalidasa Road, KRS Road, Nazarbad Road and Bogadi Road.
Concentration of vehicles is high in CBD area. High percentage of traffic and low speed profile in
CBD area lead to traffic congestion in city centre. There is need to decongest city centre and
avoid irregular traffic movements.
3. On majority of the city roads, a four lane road is reduced to a two lane road due to on-street
parking, encroachment and spill over of pedestrian traffic on the vehicular carriageway.
4. The origin destination survey has shown that the External to External trips are to the tune of 6%
of the total trips.
5. Erratic traffic operation caused by vehicles stopping or slowing in the roadway, passing and
weaving manoeuvres, or surprise elements.
6. Slower speed does not necessarily mean safer traffic operation. The chances of a driver
becoming involved in an accident are least when he/she is travelling at the average speed of
traffic.
7. Discontinuity and non – uniformity of Traffic control devices (signs, signals, markings, and
devices)
8. Lack of Pedestrian Facilities
B) Intersections
1. Invariably most of the intersections have heavy congestion and encroachment on all sides.
Comprehensive Traffic and Transportation Plan – Mysore, Karnataka, India
Final Report – Volume 2 P a g e | 84
2. The footpath is discontinuous on the arms of the intersection.
3. Absence of traffic signals for traffic management at majority of the intersections.
4. Lack of pedestrian facilities
5. Mixed traffic conditions leads to overall less traffic speed.
6. No street light present at the intersection
7. Intersection geometry including stopping sight distance and turning distance are not as per the
prescribed standards and need revision.
C) Pedestrian Facilities
1. The household survey reveals that 23% of the total trips are walk trips.
2. The footpaths in many locations, especially in the commercial areas are occupied or encroached
upon by vendors and hawkers resulting in spilling over of the pedestrians on to the road, leading
to vehicle-pedestrian conflicts.
3. At many places the footpaths are narrower than the standard widths.
4. Most of the footpaths do not have proper surface which forces pedestrians to walk on roads.
5. Pedestrian crossing facilities have generally not been provided on busy roads in CBD areas.
6. At signalized intersections, there are no pedestrian phases in the signal cycle, making it difficult
for pedestrians to cross over.
7. At priority intersections, the zebra crossings are not provided and adequate signals for the
vehicles to stop over are not given.
D) Public Transport Issues
1. The existing modal split shows that the share for public transport trips is 23 %. This is low and
attempts should be made to achieve 65% modal split in favour of public transport.
2. The 2009 existing fleet size of Mysore KSRTC operations is approximately 264 (CIRT, 2008). A bus
transport supply index (buses per lakh of population) of approximately 50 is suggested by
Central Institute of Road Transport (CIRT), Pune. The existing index is 26.4. Based on the
proposed index, the number of buses per lakh is inadequate.
3. There are certain parts of the city where there is a mismatch between the public transport trips
and private vehicle trips. MG Road and Vinoba Road has large number of private vehicles. The
number of buses connecting or transiting this stretch is low.Areas like Ramdev Galli and Khade
Bazar Road have limited ROW to allow bus operations.
4. The three bus terminals - City Bus Terminal, Suburban Bus Terminal and Private Bus Terminal all
lie in the city centre. This leads to congestion and large number of interchange trips.
5. The low load factors and EPKMs on some routes indicate need for route rationalization, bus stop
planning, inadequate fleet size etc.
E) Bus Terminal Issues- City Bus Terminal
1. The pedestrian vehicular conflict can be seen clearly at both the gates. Also, the auto stand is
just beside the exit gate which creates further conflict.
2. Though the platforms are interconnected through subways, still usage by passengers is low as
these subways are not connected to footpath. So the passengers tend to use open area
between entry/exit and bus platforms that leads to vehicular-pedestrian conflicts. There is
conflict between pedestrian and buses within the terminals.
3. The repair and maintenance facilities of the buses of the buses are done in an area within the
terminal.
Comprehensive Traffic and Transportation Plan – Mysore, Karnataka, India
Final Report – Volume 2 P a g e | 85
4. There is no defined parking bays of buses which results in haphazard movement of buses and
pedestrian.
5. There are no defined facilities for pedestrians and passengers. This results in major conflict
between pedestrian and vehicles.
6. It is also observed that there are no separate boarding/ alighting gates in the bus for passengers
leading to chaos.
F) Truck Terminals
1. APMC Mysore is located on Ooty Road.. The access road to the APMC yard is 2 lane divided.
Presently, the peak hour for entry and exit of the vehicles is 5.00 a.m to 6.00 a.m and 10.30 p.m
to 11.30 p.m in morning and evening respectively.
G) Railway Terminal Issues
1. The bus stop is located outside the entry / exit gate. This causes conflict between buses and the
vehicles entering and exiting the terminal.
2. There are no pedestrian facilities for crossing.
H) Parking Issues
1. Demand for parking is on the increase due to increased vehicle ownership, On-street parking is
almost exhausted in the city centre.
2. Some of the areas like Sayyaji Rao Road, Devraj Urs Road, Ramvilas Road and Dhanvantri Road
attract huge volume of vehicles especially during peak hours. The parking lots in the city (both
defined/undefined) have not been able to cater to the increased demand.
3. Negligible off street parking spaces result into on street parking all throughout the CBD which in
turn chokes the network which is already deficit in carriage width.
4. The parking survey shows at commercial areas the percentage of long term parking varies from
40 – 60% indicating the large number of vehicles parked of shop owners and their employees.
This leaves very little space for the visitors, thus resulting in spill over of parking in the bye lanes
and restricted areas.
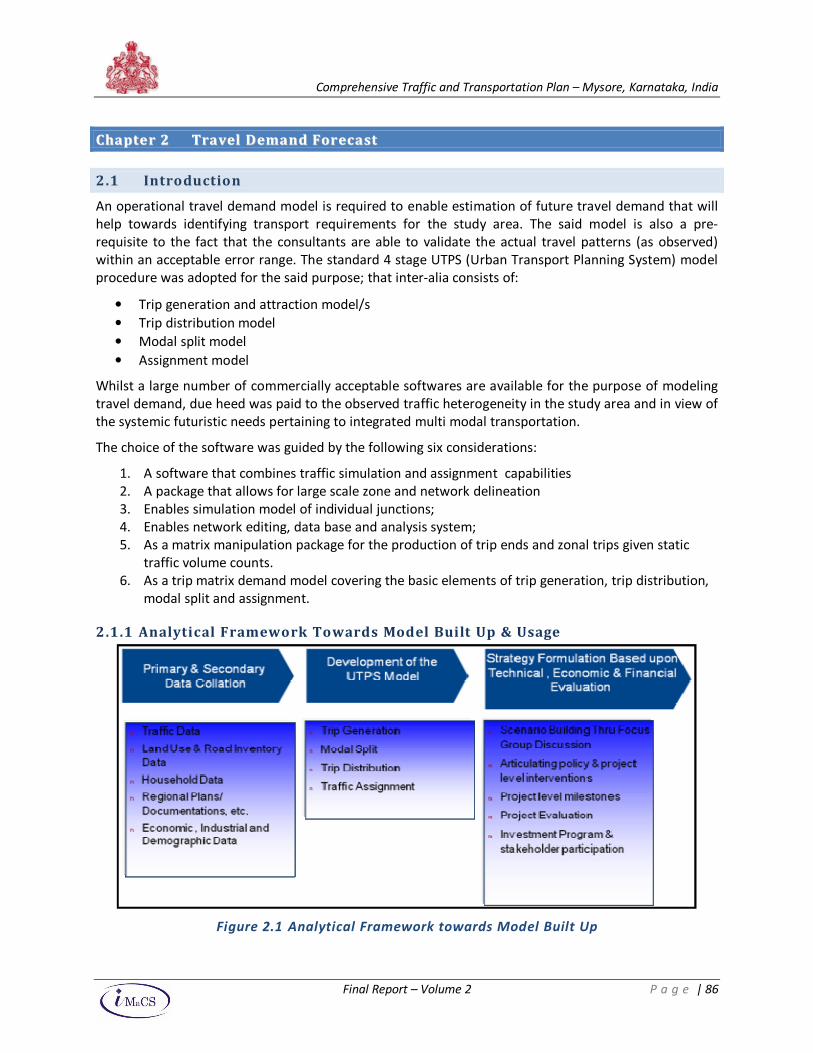
Comprehensive Traffic and Transportation Plan – Mysore, Karnataka, India
Final Report – Volume 2 P a g e | 86
CChhaa pptt ee rr 22 TTrraa vveell DD eemm aa nn dd FFoorr eecc aa sstt
2.1 Introduction
An operational travel demand model is required to enable estimation of future travel demand that will
help towards identifying transport requirements for the study area. The said model is also a pre-
requisite to the fact that the consultants are able to validate the actual travel patterns (as observed)
within an acceptable error range. The standard 4 stage UTPS (Urban Transport Planning System) model
procedure was adopted for the said purpose; that inter-alia consists of:
• Trip generation and attraction model/s
• Trip distribution model
• Modal split model
• Assignment model
Whilst a large number of commercially acceptable softwares are available for the purpose of modeling
travel demand, due heed was paid to the observed traffic heterogeneity in the study area and in view of
the systemic futuristic needs pertaining to integrated multi modal transportation.
The choice of the software was guided by the following six considerations:
1. A software that combines traffic simulation and assignment capabilities
2. A package that allows for large scale zone and network delineation
3. Enables simulation model of individual junctions;
4. Enables network editing, data base and analysis system;
5. As a matrix manipulation package for the production of trip ends and zonal trips given static
traffic volume counts.
6. As a trip matrix demand model covering the basic elements of trip generation, trip distribution,
modal split and assignment.
2.1.1 Analytical Framework Towards Model Built Up & Usage
Figure 2.1 Analytical Framework towards Model Built Up
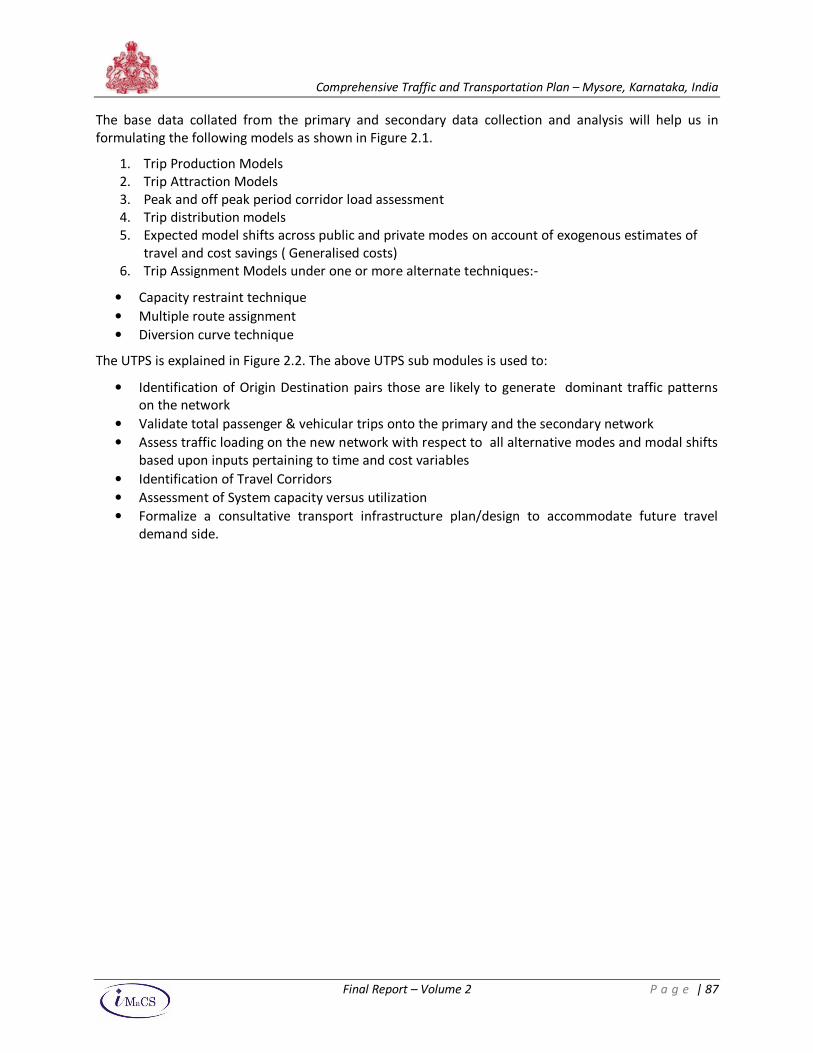
Comprehensive Traffic and Transportation Plan – Mysore, Karnataka, India
Final Report – Volume 2 P a g e | 87
The base data collated from the primary and secondary data collection and analysis will help us in
formulating the following models as shown in Figure 2.1.
1. Trip Production Models
2. Trip Attraction Models
3. Peak and off peak period corridor load assessment
4. Trip distribution models
5. Expected model shifts across public and private modes on account of exogenous estimates of
travel and cost savings ( Generalised costs)
6. Trip Assignment Models under one or more alternate techniques:-
• Capacity restraint technique
• Multiple route assignment
• Diversion curve technique
The UTPS is explained in Figure 2.2. The above UTPS sub modules is used to:
• Identification of Origin Destination pairs those are likely to generate dominant traffic patterns
on the network
• Validate total passenger & vehicular trips onto the primary and the secondary network
• Assess traffic loading on the new network with respect to all alternative modes and modal shifts
based upon inputs pertaining to time and cost variables
• Identification of Travel Corridors
• Assessment of System capacity versus utilization
• Formalize a consultative transport infrastructure plan/design to accommodate future travel
demand side.
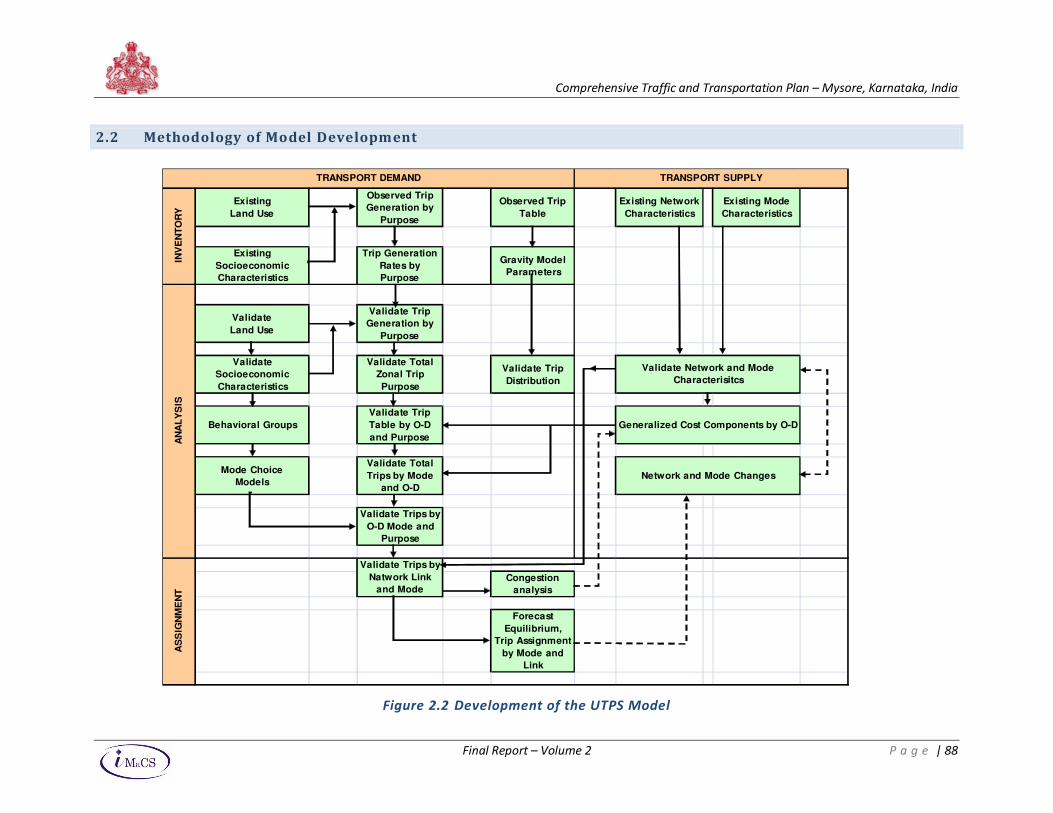
Comprehensive Traffic and Transportation Plan – Mysore, Karnataka, India
Final Report – Volume 2 P a g e | 88
2.2 Methodology of Model Development
Figure 2.2 Development of the UTPS Model
Existing
Land Use
Observed Trip
Generation by
Purpose
Observed Trip
Table
Existing Network
Characteristics
Existing Mode
Characteristics
Existing
Socioeconomic
Characteristics
Trip Generation
Rates by
Purpose
Gravity Model
Parameters
Validate
Land Use
Validate Trip
Generation by
Purpose
Validate
Socioeconomic
Characteristics
Validate Total
Zonal Trip
Purpose
Validate Trip
Distribution
Behavioral Groups
Validate Trip
Table by O-D
and Purpose
Mode Choice
Models
Validate Total
Trips by Mode
and O-D
Validate Trips by
O-D Mode and
Purpose
Congestion
analysis
Forecast
Equilibrium,
Trip Assignment
by Mode and
Link
AS
SIG
NM
EN
TTRANSPORT DEMAND TRANSPORT SUPPLY
INV
EN
TO
RY
AN
AL
YS
IS
Validate Network and Mode
Characterisitcs
Generalized Cost Components by O-D
Network and Mode Changes
Validate Trips by
Natwork Link
and Mode
Comprehensive Traffic and Transportation Plan – Mysore, Karnataka, India
Final Report – Volume 2 P a g e | 89
2.3 Zonal Trip Generation Model (At Gross Level)
The first step entailed derivation of baseline models for modeling / validating trips ends across the 65
zones. There are basically two different model structures for trip generation models -- the cross-
classification models and the regression models.
The trip generation models so derived can take the following alternate forms:
(Multiple Regression Model) To = ao + a1x1 + a2x2 + ……….. + anxn
OR (Log-Log Model) Ln (To )= a1 Ln (x1) + a2Ln(x2)
ao is the constant ( unexplained/intercept part);
a1, a2, ……………. an are coefficients associated with each explanatory variable/s;
x1, x2, ……………. xn are the explanatory variables
that included one or more planning parameters, socio-economic and trip characteristics pertaining to
each zone in the base year.
IMaCS has made use of DOUBLE LOG model for validating trip ends (both generation & attraction
models).
The underlying benefit associated with the aforesaid choice are:
1. Enables uniform scaling of parameters used in the model
2. Coefficients could be interpreted as ‘elasticities’ (absolute value of more than 1 implies
dependent variable greater than unitary elastic in relation to the independent variable and vice-
versa)
3. Ease in terms of measuring plausible impact owing to alternate strategies
Multiple Linear Regression analysis is of two types:
1. Aggregate or Zonal Least square regression, where each traffic zone is treated as one
observation
2. Disaggregate, or Household least square regression where each household is treated as an
observation
The aggregated analysis which is most widely used is based on the assumption that contiguous
households exhibit a certain amount of similarity in travel characteristics. This assumption allows the
data in a zone to be grouped and the mean value of the independent variable used in further
calculations.
Disaggregate analysis, though not so widely used, treats each household as an observation. In this
process, all the enormous amount of data is used more effectively resulting in a more meaningful
description of the characteristic. As compared to aggregated analysis, disaggregated analysis produces
better results and is considered more likely to be stable over time and to provide more reliable future
estimates.
Category Analysis
Category Analysis or cross – classification technique is based on determining the average response or
average value of the dependent variable for certain defined categories of the independent variables. A
multi – matrix defines the categories, each dimension in the matrix representing one independent
variable. The independent variables are classified into a definite number of discrete class intervals.
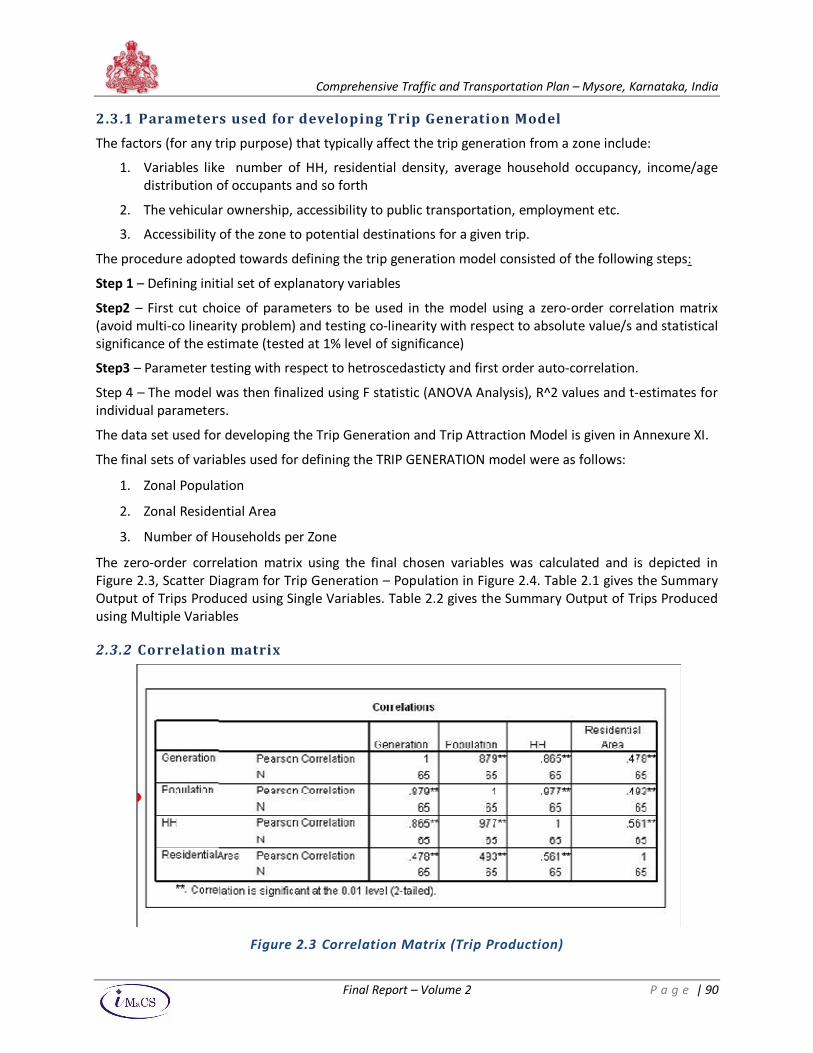
Comprehensive Traffic and Transportation Plan – Mysore, Karnataka, India
Final Report – Volume 2 P a g e | 90
2.3.1 Parameters used for developing Trip Generation Model
The factors (for any trip purpose) that typically affect the trip generation from a zone include:
1. Variables like number of HH, residential density, average household occupancy, income/age
distribution of occupants and so forth
2. The vehicular ownership, accessibility to public transportation, employment etc.
3. Accessibility of the zone to potential destinations for a given trip.
The procedure adopted towards defining the trip generation model consisted of the following steps:
Step 1 – Defining initial set of explanatory variables
Step2 – First cut choice of parameters to be used in the model using a zero-order correlation matrix
(avoid multi-co linearity problem) and testing co-linearity with respect to absolute value/s and statistical
significance of the estimate (tested at 1% level of significance)
Step3 – Parameter testing with respect to hetroscedasticty and first order auto-correlation.
Step 4 – The model was then finalized using F statistic (ANOVA Analysis), R^2 values and t-estimates for
individual parameters.
The data set used for developing the Trip Generation and Trip Attraction Model is given in Annexure XI.
The final sets of variables used for defining the TRIP GENERATION model were as follows:
1. Zonal Population
2. Zonal Residential Area
3. Number of Households per Zone
The zero-order correlation matrix using the final chosen variables was calculated and is depicted in
Figure 2.3, Scatter Diagram for Trip Generation – Population in Figure 2.4. Table 2.1 gives the Summary
Output of Trips Produced using Single Variables. Table 2.2 gives the Summary Output of Trips Produced
using Multiple Variables
2.3.2 Correlation matrix
Figure 2.3 Correlation Matrix (Trip Production)
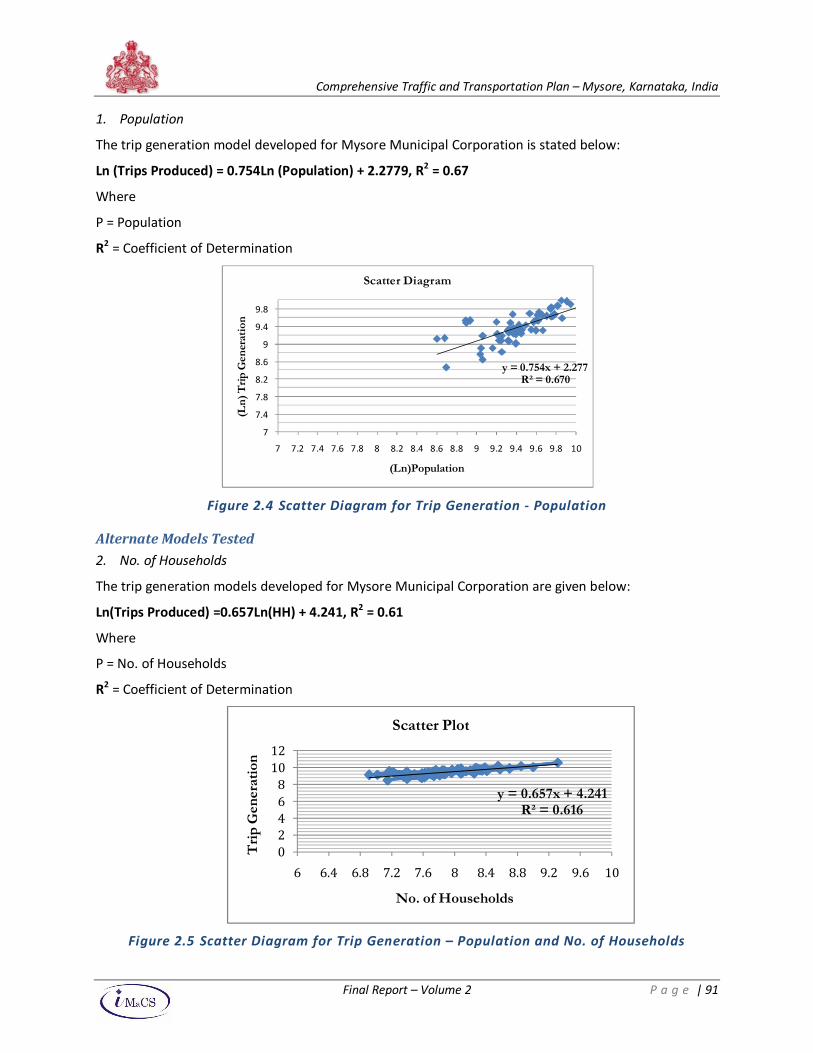
Comprehensive Traffic and Transportation Plan – Mysore, Karnataka, India
Final Report – Volume 2 P a g e | 91
1. Population
The trip generation model developed for Mysore Municipal Corporation is stated below:
Ln (Trips Produced) = 0.754Ln (Population) + 2.2779, R2 = 0.67
Where
P = Population
R2 = Coefficient of Determination
Figure 2.4 Scatter Diagram for Trip Generation - Population
Alternate Models Tested
2. No. of Households
The trip generation models developed for Mysore Municipal Corporation are given below:
Ln(Trips Produced) =0.657Ln(HH) + 4.241, R2 = 0.61
Where
P = No. of Households
R2 = Coefficient of Determination
Figure 2.5 Scatter Diagram for Trip Generation – Population and No. of Households
y = 0.754x + 2.277R² = 0.670
7
7.4
7.8
8.2
8.6
9
9.4
9.8
7 7.2 7.4 7.6 7.8 8 8.2 8.4 8.6 8.8 9 9.2 9.4 9.6 9.8 10
(Ln) Trip Generation
(Ln)Population
Scatter Diagram
y = 0.657x + 4.241R² = 0.616
0
2
4
6
8
10
12
6 6.4 6.8 7.2 7.6 8 8.4 8.8 9.2 9.6 10
Trip G
eneration
No. of Households
Scatter Plot
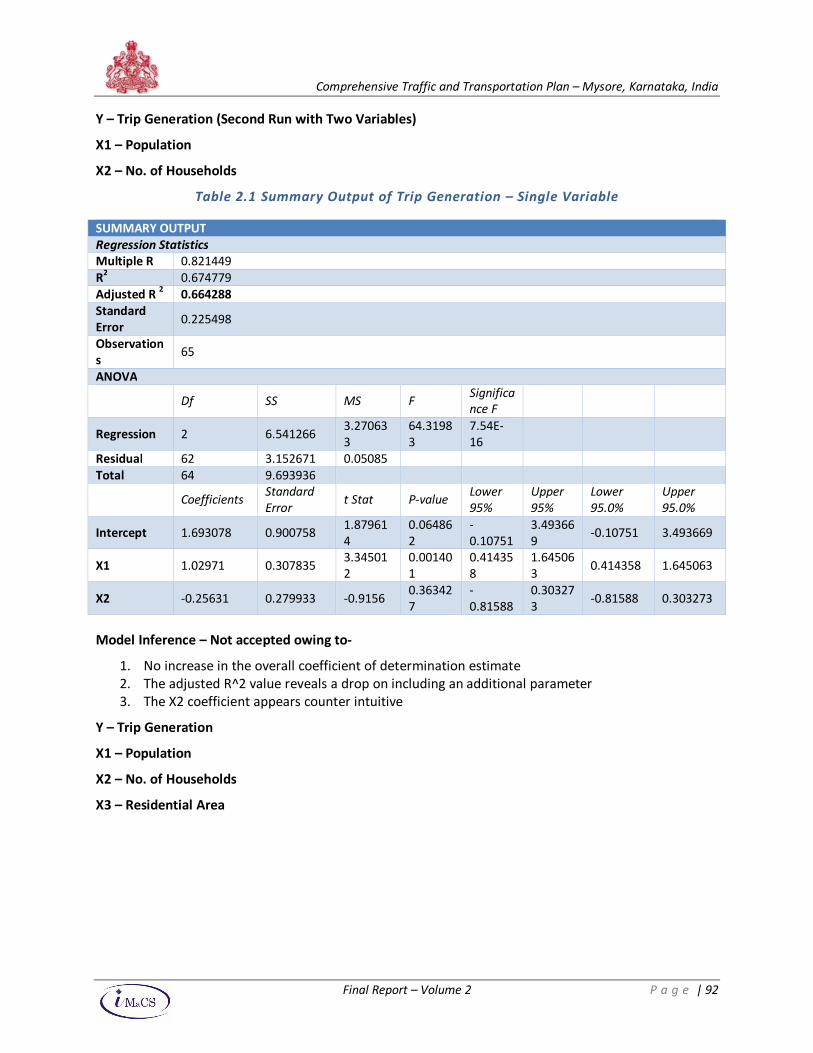
Comprehensive Traffic and Transportation Plan – Mysore, Karnataka, India
Final Report – Volume 2 P a g e | 92
Y – Trip Generation (Second Run with Two Variables)
X1 – Population
X2 – No. of Households
Table 2.1 Summary Output of Trip Generation – Single Variable
Model Inference – Not accepted owing to-
1. No increase in the overall coefficient of determination estimate
2. The adjusted R^2 value reveals a drop on including an additional parameter
3. The X2 coefficient appears counter intuitive
Y – Trip Generation
X1 – Population
X2 – No. of Households
X3 – Residential Area
SUMMARY OUTPUT
Regression Statistics
Multiple R 0.821449
R2 0.674779
Adjusted R 2 0.664288
Standard
Error 0.225498
Observation
s 65
ANOVA
Df SS MS F Significa
nce F
Regression 2 6.541266 3.27063
3
64.3198
3
7.54E-
16
Residual 62 3.152671 0.05085
Total 64 9.693936
Coefficients Standard
Error t Stat P-value
Lower
95%
Upper
95%
Lower
95.0%
Upper
95.0%
Intercept 1.693078 0.900758 1.87961
4
0.06486
2
-
0.10751
3.49366
9 -0.10751 3.493669
X1 1.02971 0.307835 3.34501
2
0.00140
1
0.41435
8
1.64506
3 0.414358 1.645063
X2 -0.25631 0.279933 -0.9156 0.36342
7
-
0.81588
0.30327
3 -0.81588 0.303273
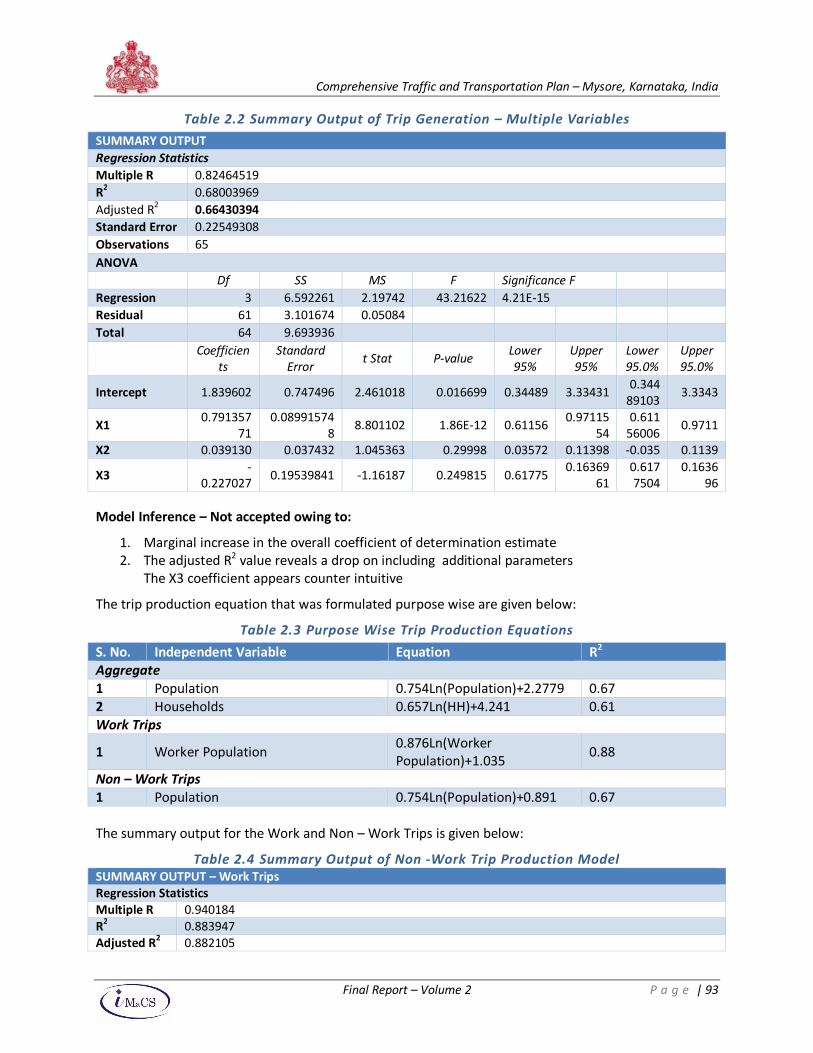
Comprehensive Traffic and Transportation Plan – Mysore, Karnataka, India
Final Report – Volume 2 P a g e | 93
Table 2.2 Summary Output of Trip Generation – Multiple Variables
SUMMARY OUTPUT
Regression Statistics
Multiple R 0.82464519
R2 0.68003969
Adjusted R2 0.66430394
Standard Error 0.22549308
Observations 65
ANOVA
Df SS MS F Significance F
Regression 3 6.592261 2.19742 43.21622 4.21E-15
Residual 61 3.101674 0.05084
Total 64 9.693936
Coefficien
ts
Standard
Error t Stat P-value
Lower
95%
Upper
95%
Lower
95.0%
Upper
95.0%
Intercept 1.839602 0.747496 2.461018 0.016699 0.34489 3.33431 0.344
89103 3.3343
X1 0.791357
71
0.08991574
8 8.801102 1.86E-12 0.61156
0.97115
54
0.611
56006 0.9711
X2 0.039130 0.037432 1.045363 0.29998 0.03572 0.11398 -0.035 0.1139
X3 -
0.227027 0.19539841 -1.16187 0.249815 0.61775
0.16369
61
0.617
7504
0.1636
96
Model Inference – Not accepted owing to:
1. Marginal increase in the overall coefficient of determination estimate
2. The adjusted R2 value reveals a drop on including additional parameters
The X3 coefficient appears counter intuitive
The trip production equation that was formulated purpose wise are given below:
Table 2.3 Purpose Wise Trip Production Equations
S. No. Independent Variable Equation R2
Aggregate
1 Population 0.754Ln(Population)+2.2779 0.67
2 Households 0.657Ln(HH)+4.241 0.61
Work Trips
1 Worker Population 0.876Ln(Worker
Population)+1.035 0.88
Non – Work Trips
1 Population 0.754Ln(Population)+0.891 0.67
The summary output for the Work and Non – Work Trips is given below:
Table 2.4 Summary Output of Non -Work Trip Production Model
SUMMARY OUTPUT – Work Trips
Regression Statistics
Multiple R 0.940184
R2 0.883947
Adjusted R2 0.882105
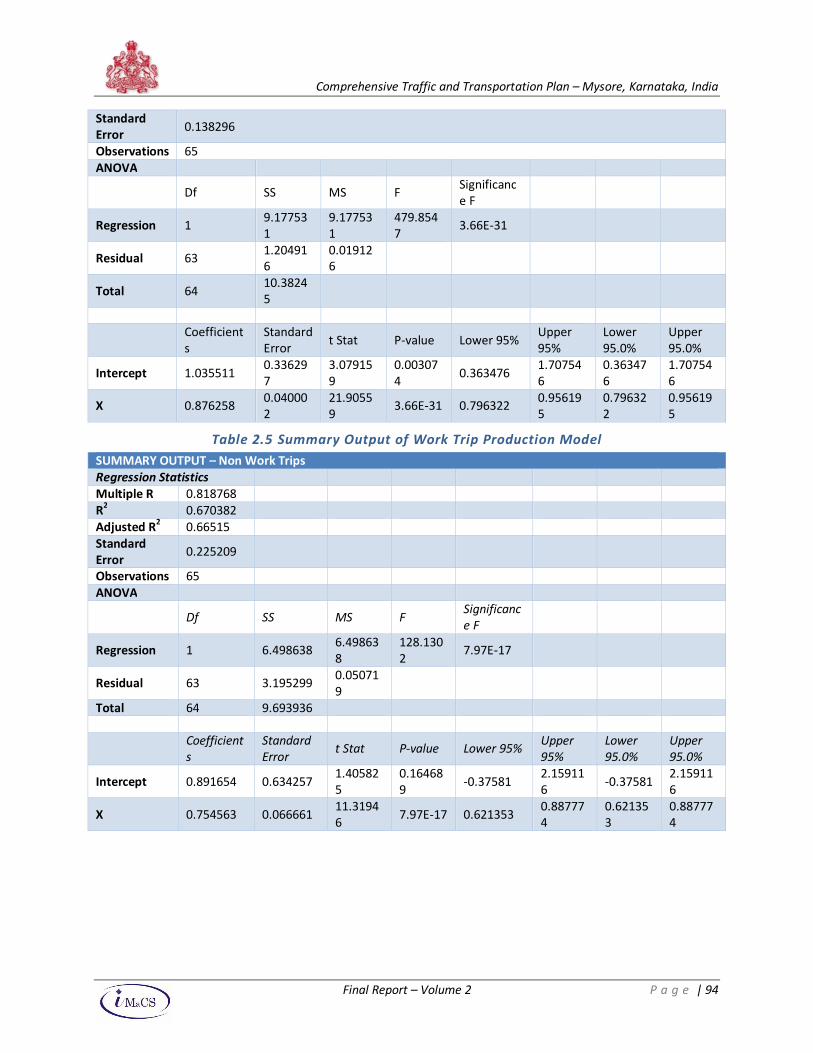
Comprehensive Traffic and Transportation Plan – Mysore, Karnataka, India
Final Report – Volume 2 P a g e | 94
Standard
Error 0.138296
Observations 65
ANOVA
Df SS MS F Significanc
e F
Regression 1 9.17753
1
9.17753
1
479.854
7 3.66E-31
Residual 63 1.20491
6
0.01912
6
Total 64 10.3824
5
Coefficient
s
Standard
Error t Stat P-value Lower 95%
Upper
95%
Lower
95.0%
Upper
95.0%
Intercept 1.035511 0.33629
7
3.07915
9
0.00307
4 0.363476
1.70754
6
0.36347
6
1.70754
6
X 0.876258 0.04000
2
21.9055
9 3.66E-31 0.796322
0.95619
5
0.79632
2
0.95619
5
Table 2.5 Summary Output of Work Trip Production Model
SUMMARY OUTPUT – Non Work Trips
Regression Statistics
Multiple R 0.818768
R2 0.670382
Adjusted R
2 0.66515
Standard
Error 0.225209
Observations 65
ANOVA
Df SS MS F Significanc
e F
Regression 1 6.498638 6.49863
8
128.130
2 7.97E-17
Residual 63 3.195299 0.05071
9
Total 64 9.693936
Coefficient
s
Standard
Error t Stat P-value Lower 95%
Upper
95%
Lower
95.0%
Upper
95.0%
Intercept 0.891654 0.634257 1.40582
5
0.16468
9 -0.37581
2.15911
6 -0.37581
2.15911
6
X 0.754563 0.066661 11.3194
6 7.97E-17 0.621353
0.88777
4
0.62135
3
0.88777
4
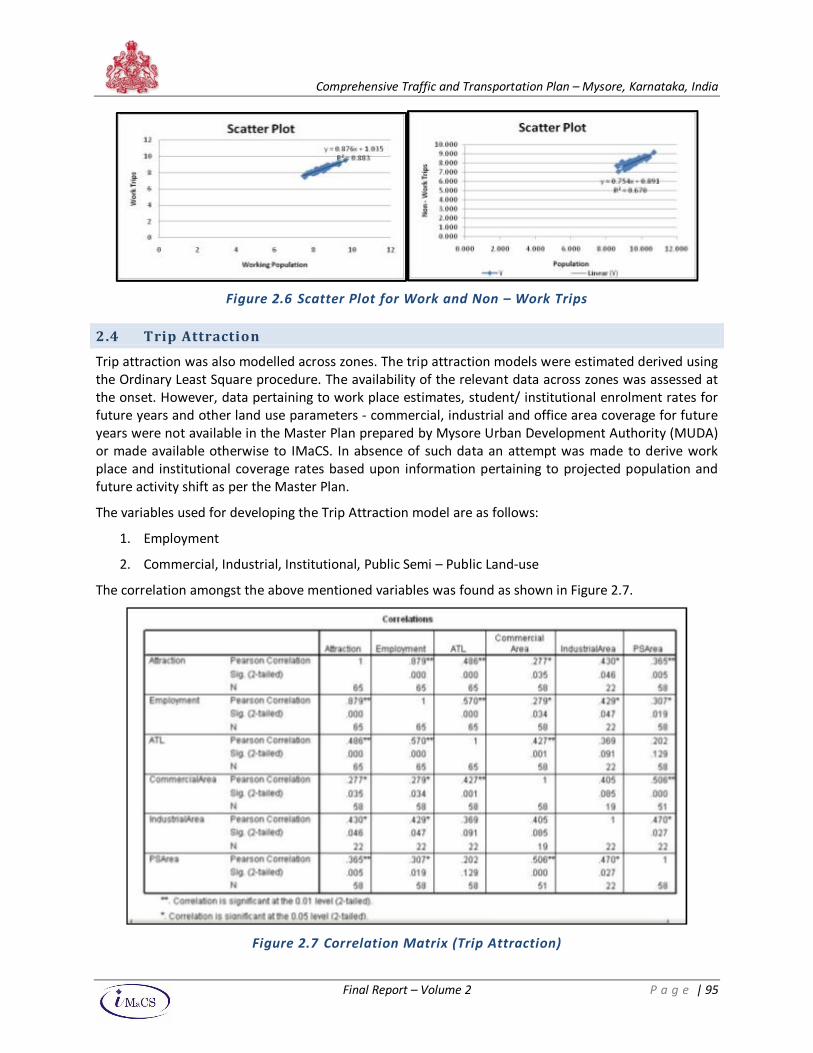
Comprehensive Traffic and Transportation Plan – Mysore, Karnataka, India
Final Report – Volume 2 P a g e | 95
Figure 2.6 Scatter Plot for Work and Non – Work Trips
2.4 Trip Attraction
Trip attraction was also modelled across zones. The trip attraction models were estimated derived using
the Ordinary Least Square procedure. The availability of the relevant data across zones was assessed at
the onset. However, data pertaining to work place estimates, student/ institutional enrolment rates for
future years and other land use parameters - commercial, industrial and office area coverage for future
years were not available in the Master Plan prepared by Mysore Urban Development Authority (MUDA)
or made available otherwise to IMaCS. In absence of such data an attempt was made to derive work
place and institutional coverage rates based upon information pertaining to projected population and
future activity shift as per the Master Plan.
The variables used for developing the Trip Attraction model are as follows:
1. Employment
2. Commercial, Industrial, Institutional, Public Semi – Public Land-use
The correlation amongst the above mentioned variables was found as shown in Figure 2.7.
Figure 2.7 Correlation Matrix (Trip Attraction)
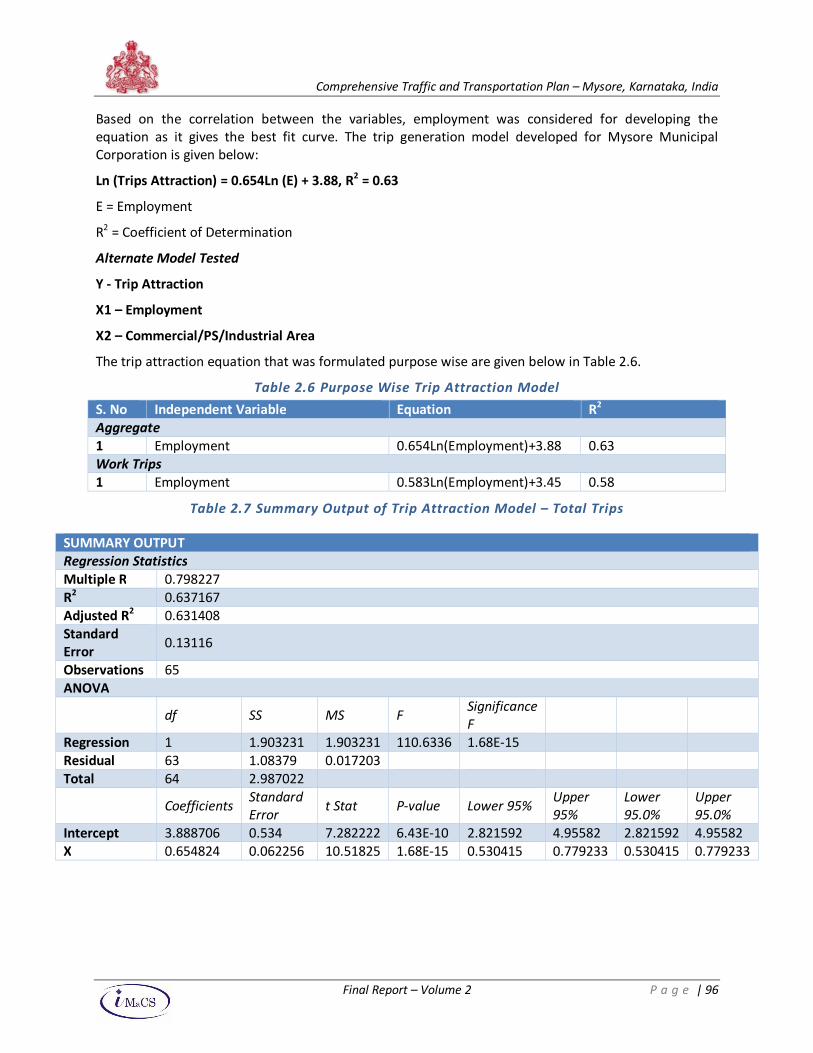
Comprehensive Traffic and Transportation Plan – Mysore, Karnataka, India
Final Report – Volume 2 P a g e | 96
Based on the correlation between the variables, employment was considered for developing the
equation as it gives the best fit curve. The trip generation model developed for Mysore Municipal
Corporation is given below:
Ln (Trips Attraction) = 0.654Ln (E) + 3.88, R2 = 0.63
E = Employment
R2 = Coefficient of Determination
Alternate Model Tested
Y - Trip Attraction
X1 – Employment
X2 – Commercial/PS/Industrial Area
The trip attraction equation that was formulated purpose wise are given below in Table 2.6.
Table 2.6 Purpose Wise Trip Attraction Model
S. No Independent Variable Equation R2
Aggregate
1 Employment 0.654Ln(Employment)+3.88 0.63
Work Trips
1 Employment 0.583Ln(Employment)+3.45 0.58
Table 2.7 Summary Output of Trip Attraction Model – Total Trips
SUMMARY OUTPUT
Regression Statistics
Multiple R 0.798227
R2 0.637167
Adjusted R2 0.631408
Standard
Error 0.13116
Observations 65
ANOVA
df SS MS F Significance
F
Regression 1 1.903231 1.903231 110.6336 1.68E-15
Residual 63 1.08379 0.017203
Total 64 2.987022
Coefficients Standard
Error t Stat P-value Lower 95%
Upper
95%
Lower
95.0%
Upper
95.0%
Intercept 3.888706 0.534 7.282222 6.43E-10 2.821592 4.95582 2.821592 4.95582
X 0.654824 0.062256 10.51825 1.68E-15 0.530415 0.779233 0.530415 0.779233
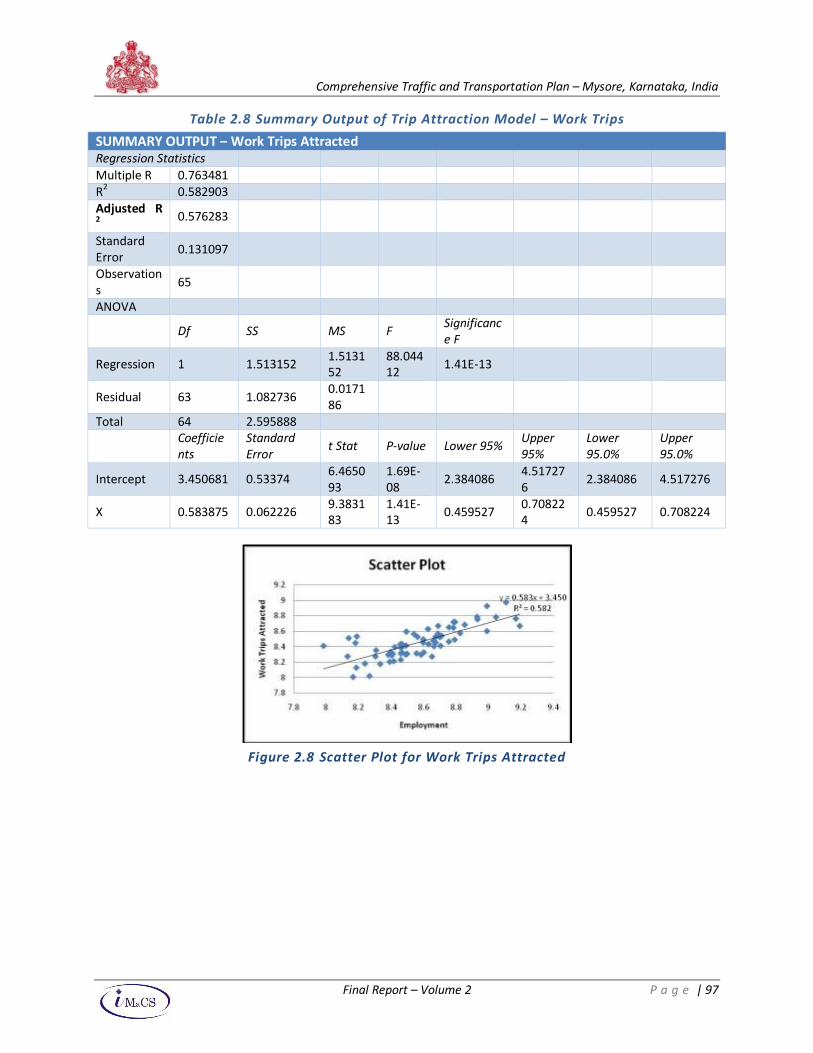
Comprehensive Traffic and Transportation Plan – Mysore, Karnataka, India
Final Report – Volume 2 P a g e | 97
Table 2.8 Summary Output of Trip Attraction Model – Work Trips
SUMMARY OUTPUT – Work Trips Attracted
Regression Statistics
Multiple R 0.763481
R2 0.582903
Adjusted R 2
0.576283
Standard
Error 0.131097
Observation
s 65
ANOVA
Df SS MS F
Significanc
e F
Regression 1 1.513152 1.5131
52
88.044
12 1.41E-13
Residual 63 1.082736 0.0171
86 Total 64 2.595888
Coefficie
nts
Standard
Error t Stat P-value Lower 95%
Upper
95%
Lower
95.0%
Upper
95.0%
Intercept 3.450681 0.53374 6.4650
93
1.69E-
08 2.384086
4.51727
6 2.384086 4.517276
X 0.583875 0.062226 9.3831
83
1.41E-
13 0.459527
0.70822
4 0.459527 0.708224
Figure 2.8 Scatter Plot for Work Trips Attracted
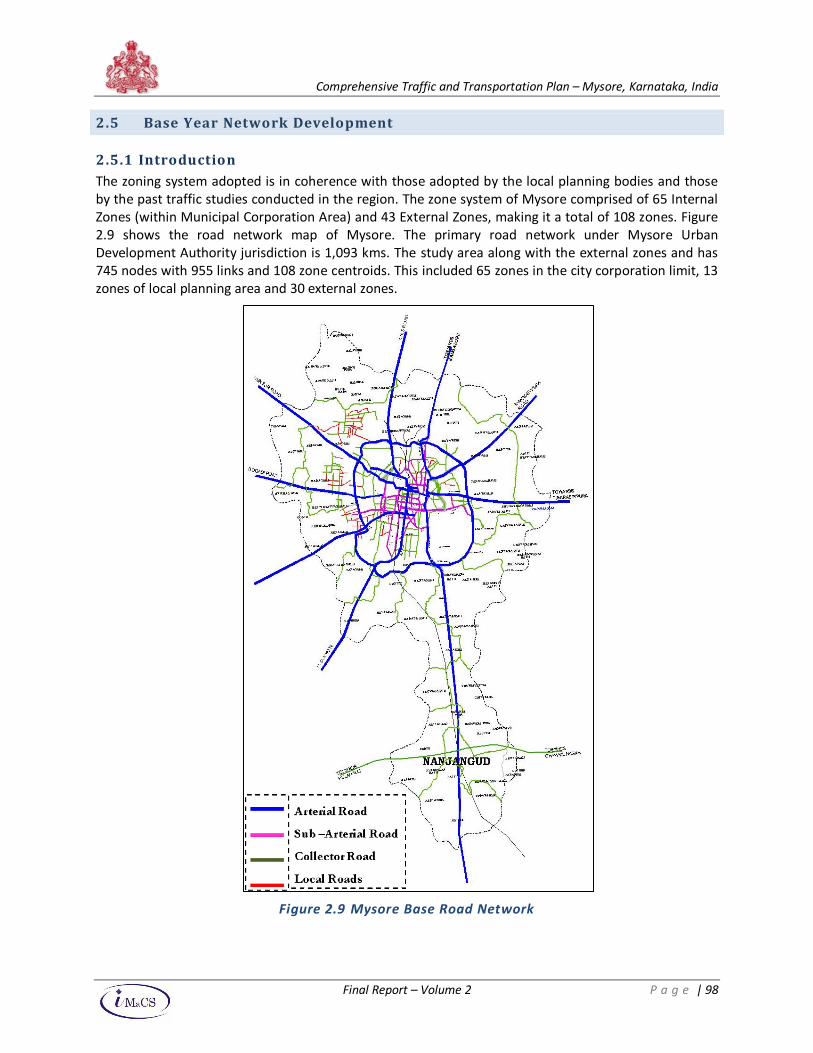
Comprehensive Traffic and Transportation Plan – Mysore, Karnataka, India
Final Report – Volume 2 P a g e | 98
2.5 Base Year Network Development
2.5.1 Introduction
The zoning system adopted is in coherence with those adopted by the local planning bodies and those
by the past traffic studies conducted in the region. The zone system of Mysore comprised of 65 Internal
Zones (within Municipal Corporation Area) and 43 External Zones, making it a total of 108 zones. Figure
2.9 shows the road network map of Mysore. The primary road network under Mysore Urban
Development Authority jurisdiction is 1,093 kms. The study area along with the external zones and has
745 nodes with 955 links and 108 zone centroids. This included 65 zones in the city corporation limit, 13
zones of local planning area and 30 external zones.
Figure 2.9 Mysore Base Road Network
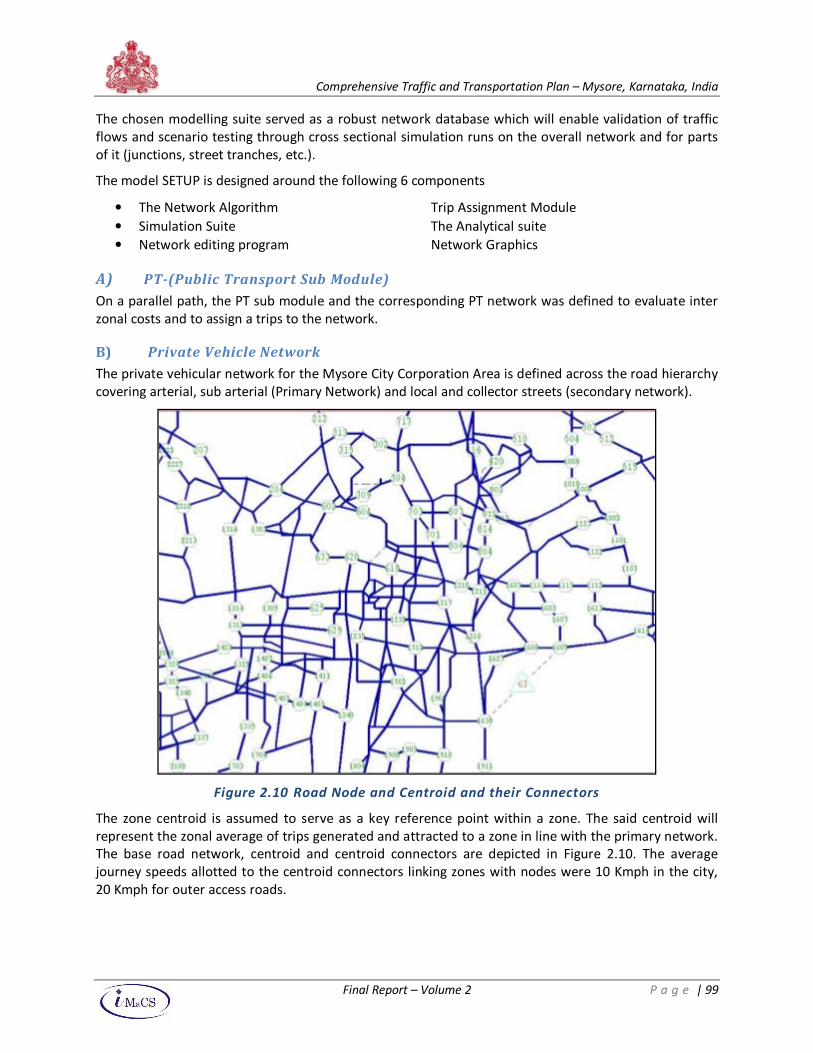
Comprehensive Traffic and Transportation Plan – Mysore, Karnataka, India
Final Report – Volume 2 P a g e | 99
The chosen modelling suite served as a robust network database which will enable validation of traffic
flows and scenario testing through cross sectional simulation runs on the overall network and for parts
of it (junctions, street tranches, etc.).
The model SETUP is designed around the following 6 components
• The Network Algorithm Trip Assignment Module
• Simulation Suite The Analytical suite
• Network editing program Network Graphics
A) PT-(Public Transport Sub Module)
On a parallel path, the PT sub module and the corresponding PT network was defined to evaluate inter
zonal costs and to assign a trips to the network.
B) Private Vehicle Network
The private vehicular network for the Mysore City Corporation Area is defined across the road hierarchy
covering arterial, sub arterial (Primary Network) and local and collector streets (secondary network).
Figure 2.10 Road Node and Centroid and their Connectors
The zone centroid is assumed to serve as a key reference point within a zone. The said centroid will
represent the zonal average of trips generated and attracted to a zone in line with the primary network.
The base road network, centroid and centroid connectors are depicted in Figure 2.10. The average
journey speeds allotted to the centroid connectors linking zones with nodes were 10 Kmph in the city,
20 Kmph for outer access roads.
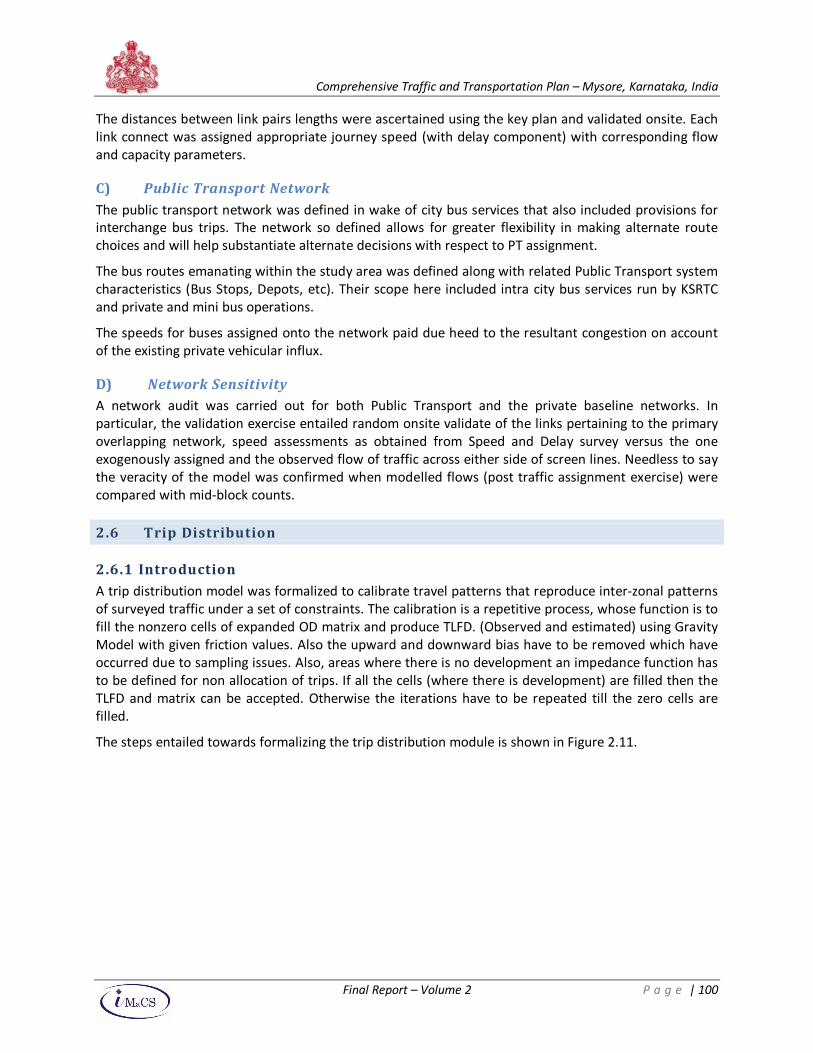
Comprehensive Traffic and Transportation Plan – Mysore, Karnataka, India
Final Report – Volume 2 P a g e | 100
The distances between link pairs lengths were ascertained using the key plan and validated onsite. Each
link connect was assigned appropriate journey speed (with delay component) with corresponding flow
and capacity parameters.
C) Public Transport Network
The public transport network was defined in wake of city bus services that also included provisions for
interchange bus trips. The network so defined allows for greater flexibility in making alternate route
choices and will help substantiate alternate decisions with respect to PT assignment.
The bus routes emanating within the study area was defined along with related Public Transport system
characteristics (Bus Stops, Depots, etc). Their scope here included intra city bus services run by KSRTC
and private and mini bus operations.
The speeds for buses assigned onto the network paid due heed to the resultant congestion on account
of the existing private vehicular influx.
D) Network Sensitivity
A network audit was carried out for both Public Transport and the private baseline networks. In
particular, the validation exercise entailed random onsite validate of the links pertaining to the primary
overlapping network, speed assessments as obtained from Speed and Delay survey versus the one
exogenously assigned and the observed flow of traffic across either side of screen lines. Needless to say
the veracity of the model was confirmed when modelled flows (post traffic assignment exercise) were
compared with mid-block counts.
2.6 Trip Distribution
2.6.1 Introduction
A trip distribution model was formalized to calibrate travel patterns that reproduce inter-zonal patterns
of surveyed traffic under a set of constraints. The calibration is a repetitive process, whose function is to
fill the nonzero cells of expanded OD matrix and produce TLFD. (Observed and estimated) using Gravity
Model with given friction values. Also the upward and downward bias have to be removed which have
occurred due to sampling issues. Also, areas where there is no development an impedance function has
to be defined for non allocation of trips. If all the cells (where there is development) are filled then the
TLFD and matrix can be accepted. Otherwise the iterations have to be repeated till the zero cells are
filled.
The steps entailed towards formalizing the trip distribution module is shown in Figure 2.11.
Comprehensive Traffic and Transportation Plan – Mysore, Karnataka, India
Final Report – Volume 2 P a g e | 101
Figure 2.11 Process of Trip Distribution
2.6.2 Approach
Calibration of the base matrix has been carried out using the Gravity model. The model specification
used is as follows:
Tij = Pi x Aj x Fij x Kij
Σ Aj x Fij x Kij
Where Tij : Trips between i and j
Pi : Trips produced from i
Aj : Trips attracted to j
Fij : Friction factor
Kij : Balancing Constant
Fij = deterrence function for mode m
= Km e-Bcijm C Jim
Where K = above mentioned constant
Comprehensive Traffic and Transportation Plan – Mysore, Karnataka, India
Final Report – Volume 2 P a g e | 102
C = generalized cost of travel
= Calibration constant – as obtained from the exponential/power deterrence function
The model was calibrated with doubly constraints imposed on the horizontal totals and the vertical
totals of the matrix so as to ensure
Σ Tim = Gi Σ Tim = Aj
The broad methodology adopted for calibrating the base OD matrix is as follows:
i) The process is initiated with an endeavour to ascertain the relationship between the friction
factor (F) and the time. Beginning with Fij equal to 1, the observed matrix is iterated to get the
first iteration matrix.
ii) The trip length frequency distribution, as well as the average trip length (ATL) of the matrix
above is then compared with the observed matrix. As the desired difference in the ATL of ± 3%
was not achieved, the next round of iteration was required.
iii) For this the new Fij was calculated using the formula :-
Fij1 = Fij x Trips (Observed)
Trips (Calculated)
Where Fij’ = new Fij
iv) The Fij obtained from this is used to plot a scatter with relation to Tij observed from the Travel-
Time Matrix. The equation of the best-fit of this scatter will give the relationship between the
two.
v) Using this, and the Travel Time Matrix, the next set of Fij is calculated.
vi) The iteration process is repeated till no significant difference between observed and modeled
Trip Length Frequency Distribution (TLFD)
2.6.3 Generation of travel time matrix
The inputs required to generate a Travel Time matrix are:
1. Road Networking comprising of ‘Links’, ‘Node’, and ‘Zone Centroid’.
2. Speed and Delay survey results giving speed and travel time between all identified nodes of the
network.
For any pair of zone centroids, different paths exist on the network (comprising of links and nodes) with
a different travel time along each path (obtained from speed and delay survey results). The ‘Shortest
Path’ between any pair of zone centroids is the one having minimum value of total ‘Travel Time’. This
concept in conjunction with the ‘capacity restraint’ option) has been applied for all pairs of zone
centroids for the preparation of travel time matrix.
2.6.4 Overall Matrix Calibration Statistics
A) Calibration Statistics for Each OD Pair – Validation of software Output
The objective herewith was twofold:
1. To validate the calibrated estimates of the model as obtained using the software
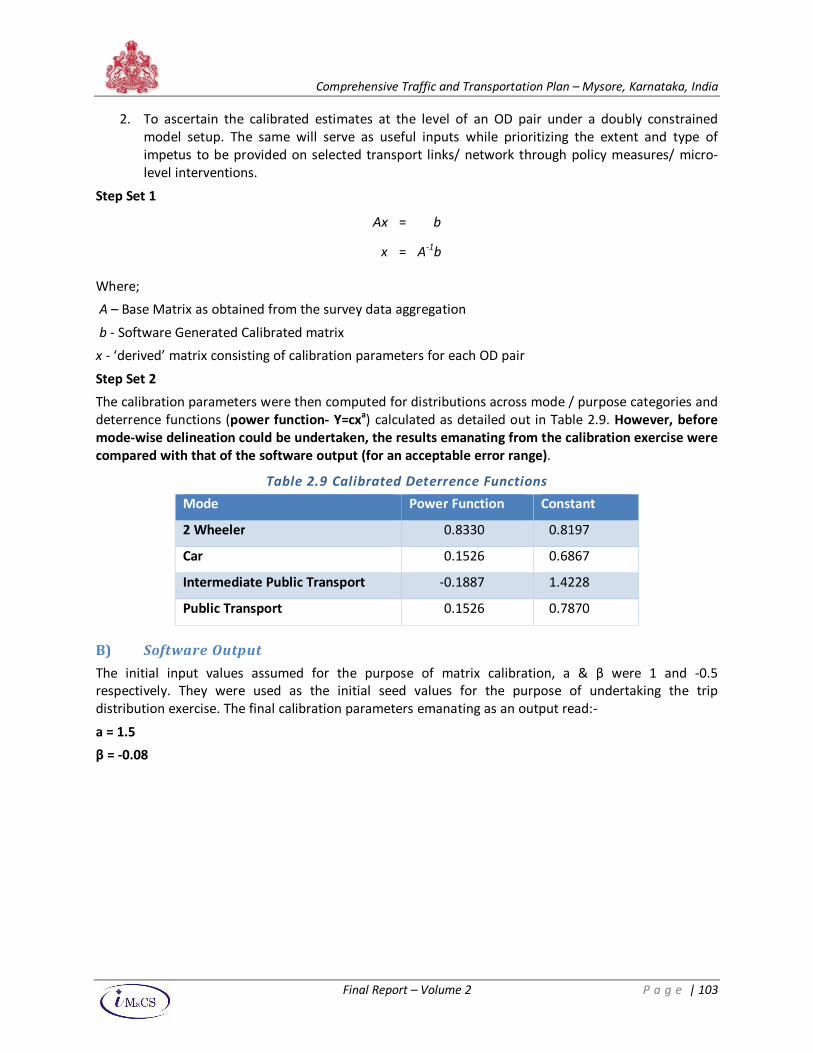
Comprehensive Traffic and Transportation Plan – Mysore, Karnataka, India
Final Report – Volume 2 P a g e | 103
2. To ascertain the calibrated estimates at the level of an OD pair under a doubly constrained
model setup. The same will serve as useful inputs while prioritizing the extent and type of
impetus to be provided on selected transport links/ network through policy measures/ micro-
level interventions.
Step Set 1
Ax = b
x = A-1
b
Where;
A – Base Matrix as obtained from the survey data aggregation
b - Software Generated Calibrated matrix
x - ‘derived’ matrix consisting of calibration parameters for each OD pair
Step Set 2
The calibration parameters were then computed for distributions across mode / purpose categories and
deterrence functions (power function- Y=cxa) calculated as detailed out in Table 2.9. However, before
mode-wise delineation could be undertaken, the results emanating from the calibration exercise were
compared with that of the software output (for an acceptable error range).
Table 2.9 Calibrated Deterrence Functions
Mode Power Function Constant
2 Wheeler 0.8330 0.8197
Car 0.1526 0.6867
Intermediate Public Transport -0.1887 1.4228
Public Transport 0.1526 0.7870
B) Software Output
The initial input values assumed for the purpose of matrix calibration, a & β were 1 and -0.5
respectively. They were used as the initial seed values for the purpose of undertaking the trip
distribution exercise. The final calibration parameters emanating as an output read:-
a = 1.5
β = -0.08
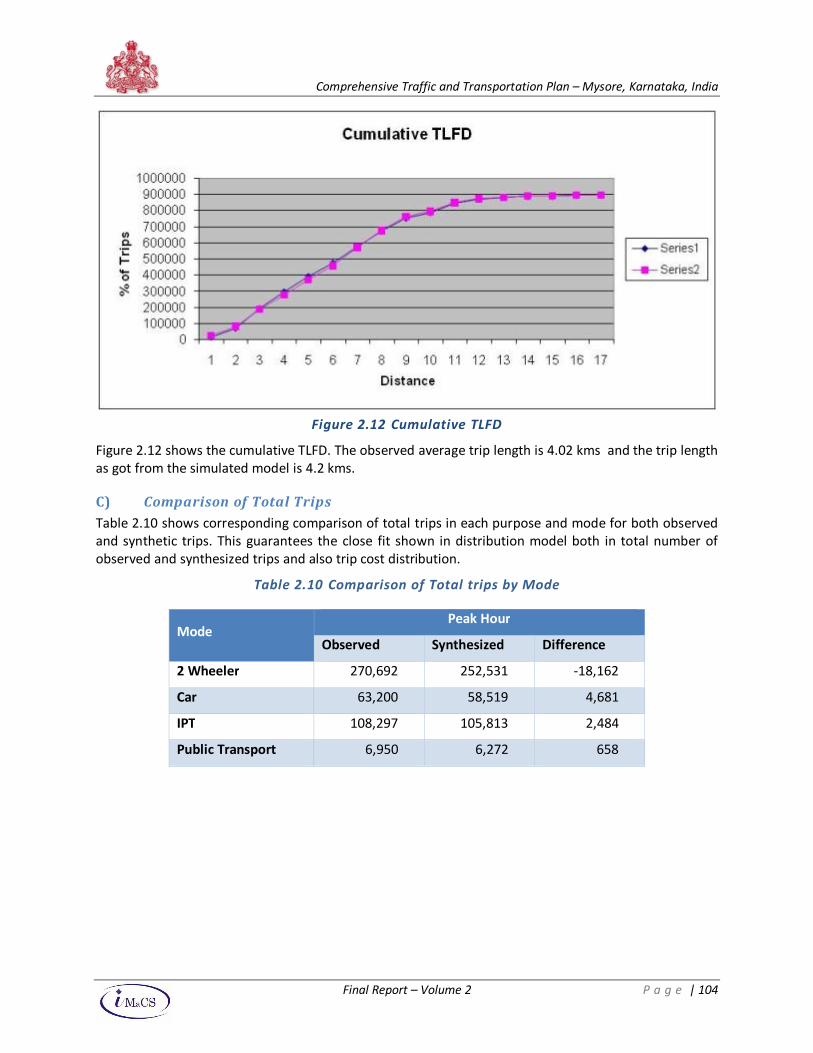
Comprehensive Traffic and Transportation Plan – Mysore, Karnataka, India
Final Report – Volume 2 P a g e | 104
Figure 2.12 Cumulative TLFD
Figure 2.12 shows the cumulative TLFD. The observed average trip length is 4.02 kms and the trip length
as got from the simulated model is 4.2 kms.
C) Comparison of Total Trips
Table 2.10 shows corresponding comparison of total trips in each purpose and mode for both observed
and synthetic trips. This guarantees the close fit shown in distribution model both in total number of
observed and synthesized trips and also trip cost distribution.
Table 2.10 Comparison of Total trips by Mode
Mode Peak Hour
Observed Synthesized Difference
2 Wheeler 270,692 252,531 -18,162
Car 63,200 58,519 4,681
IPT 108,297 105,813 2,484
Public Transport 6,950 6,272 658
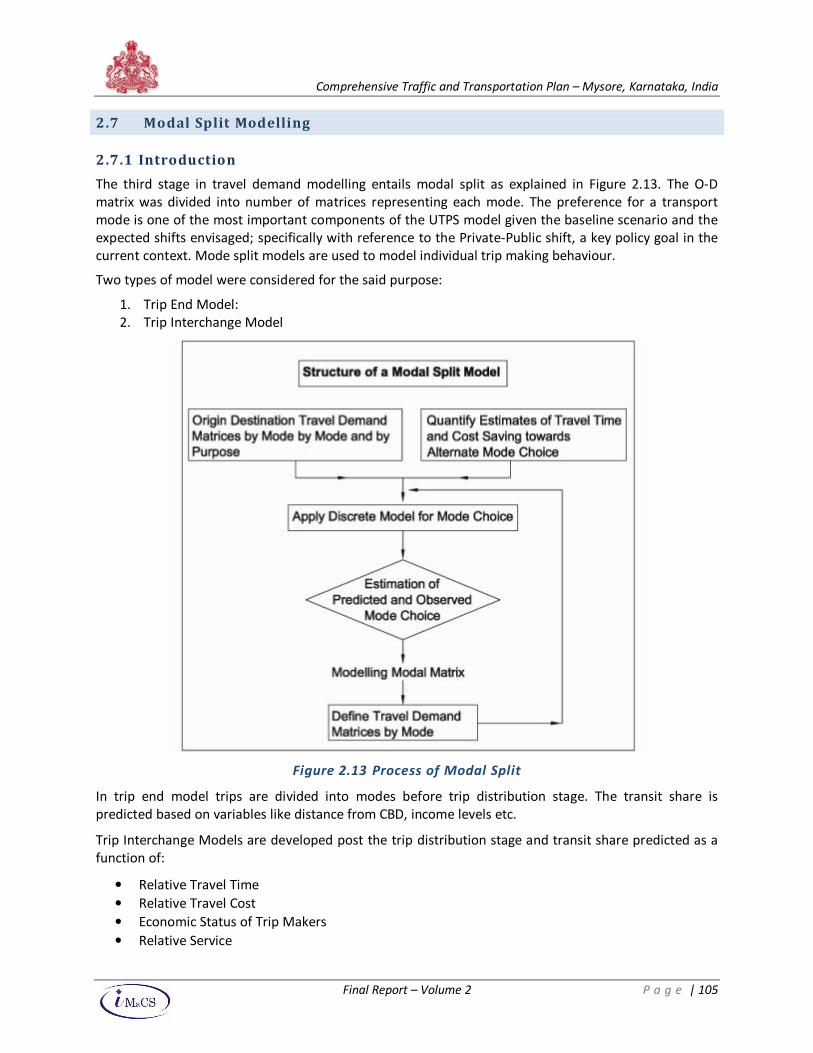
Comprehensive Traffic and Transportation Plan – Mysore, Karnataka, India
Final Report – Volume 2 P a g e | 105
2.7 Modal Split Modelling
2.7.1 Introduction
The third stage in travel demand modelling entails modal split as explained in Figure 2.13. The O-D
matrix was divided into number of matrices representing each mode. The preference for a transport
mode is one of the most important components of the UTPS model given the baseline scenario and the
expected shifts envisaged; specifically with reference to the Private-Public shift, a key policy goal in the
current context. Mode split models are used to model individual trip making behaviour.
Two types of model were considered for the said purpose:
1. Trip End Model:
2. Trip Interchange Model
Figure 2.13 Process of Modal Split
In trip end model trips are divided into modes before trip distribution stage. The transit share is
predicted based on variables like distance from CBD, income levels etc.
Trip Interchange Models are developed post the trip distribution stage and transit share predicted as a
function of:
• Relative Travel Time
• Relative Travel Cost
• Economic Status of Trip Makers
• Relative Service
Comprehensive Traffic and Transportation Plan – Mysore, Karnataka, India
Final Report – Volume 2 P a g e | 106
Trip interchange model has been developed for the study area. The purpose of the exercise is to report
estimates of foreseeable changes to user preferences towards alternate mode choice in view of the
travel time and travel cost savings. Such estimates shall serve as important ingredients for developing
travel demand scenarios and assess changes in mode preference across horizon years. It is based on
the utility of a particular mode choice i.e. degree of satisfaction people derive from their mode choices.
The model uses the generalized cost associated with each mode. The model has been developed for
expected shift from Private to Public Transport using a set of discrete choice models. The model is in the
form of Logit Model which assumes the following form:
Pk = e u
k
----------
n
∑ e u
n
K = 1
Where,
Pi – Probability of an individual choosing alternative i
Ui – Utility function of mode i
N – Set of modal alternatives
The utility function however is defined using a PROBIT model defined as:
Uj = a0 + a1X1 + a2X2
Where,
X1 – Difference in Accessibility Index of Public and Private Transport
X2 – Operational Cost (Rs. /km)
For each of the mode the average cost and difference in accessibility index zone wise according to
private and public transport was calculated. A multi – linear regression has been developed to define the
utility function and then probability of choosing a particular mode is calculated.
2.7.2 Probit Estimation
It is easy to show that Pr(y = 1) = (x). This gives us the likelihood for both cases y = 0 and y = 1. Assuming
the observations are independent and identically distributed. it is easy to construct the sample log
likelihood. This can be maximised using standard nonlinear maximisation algorithms. The standard MLE
inference procedures give us the variance-covariance matrix of the parameter beta.
The trips generated so far are split into Public and Private Mode. A Logit Model framework has then
been developed for both the modes. The probability for each of the mode and the generalized cost for
both are calculated. The choice probability for public and private is calculated based on combined cost.
The parameters considered for generalized cost are:
• Travel Time (Min./km)
• Operational Cost (Rs./km)
Comprehensive Traffic and Transportation Plan – Mysore, Karnataka, India
Final Report – Volume 2 P a g e | 107
For each of the mode the average cost and time saving is calculated. A multi-linear regression has been
developed to define the utility function and then probability of choosing a particular mode is calculated.
2.7.3 Generalized Cost Estimation for Modeling User Preference
Two types of cost components defined the generalized cost for the study area; an input that will be used
to model alternate travel choice in wake of envisaged improvements to transport infrastructure and
facilities; in particular the Private–Public shift across the horizon years. The said generalized cost
measure consisted of the intrinsic value of travel time spent and the upfront trip related expenses
incurred on alternate travel modes.
Operational Cost
A) Assumptions pertaining to Car usage:
• Car Mileage assumed - 11.7 Km/Litre
• Fuel Price - Rs. 53.25 per litre for petrol and Rs. 39.71 per litre for diesel as in March 2010
• Expense towards fuel @cost per Km - Rs 4.40 per Vehicle.
B) Assumption for Scooter / Motor Cycles Usage
• Two Wheeler mileage ( typical) – 45 Km/ Lt
• Fuel Price - Rs. 53.25 per litre as in March 2010
• Expense towards fuel @cost per Km – Rs. 1.35
C) Public Transport
The public transport fares tend to be telescopic.
1. average fare assumed per km is Rs. 0.50 for ordinary bus with Rs. 3.00 as minimum
2. Rs.0.75 for Pushpak buses with a minimum fare of Rs.4.00.
D) Intermediate Public Transport
The minimal auto fare charged is Rs.12.00 for first 2.0 Km. & for Taxi the corresponding number is Rs.
30.00 for the first 3 Km. A different rate is applicable thereafter. The weighted average fare for IPT per
km works out to Rs. 7.50/km (based upon respective Average Trip Lengths and trips performed by IPT
modes) and the same has been proposed for usage in model.
E) Modeling Public Transport Preference:
LOGIT ESTIMATION
Functional Form
where px measures the possible shift from private to public
Comprehensive Traffic and Transportation Plan – Mysore, Karnataka, India
Final Report – Volume 2 P a g e | 108
The aforesaid exercise was undertaken for a regrouped set of 25 zones (clubbed from the 65 zone list)
for ease of analysis. The calculation of probability estimates is detailed below:
The above derived probability measures should be looked upon as ‘maximum plausible shift’ from
private to public modes (given the consistency of perceived travel time and cost savings as emanated
from survey findings). The actual shift in the short run can be approximated to 15% (based upon limited
research) of the said probabilities given improvements in public transport amenities/ infrastructure. At
an average the shift in the short run can be safely assumed at 8-10% for the study area.
The utility function defined using a PROBIT function for private transport is
Uj = -0.18 – 0.425 X1 + 0.159 X2
Where,
X1 - Difference in Accessibility Index between Public and Private Transport
X2 - Difference in Cost (Rs / km) between Public and Private Transport
Also, an attempt to improve the model, the exercise was repeated for the zone to zone pairs. The
parameters that were used for developing the probit model are generalized cost, Accessibility Index
(Public and Private) and cost saving between private and public mode.
The calculated probability of travel by private vehicles is 63%. The observed modal split for private
vehicle is 67%, which indicates the robustness of the model.
This model shall be used for planning public transport facilities for future. Studies show that for a
healthy travel mix, a modal split of 60% may go in favor of public transport.
2.8 Calibration and Validation of Traffic Assignment Models
2.8.1 Key Components – Network Preparation
A) Precise Network Representation
The different types of road in the network are distinguished, firstly, according to the capacity of
stretches of road, differentiating between dual and single roadways, etc. A 'Capacity Index' is used to
give similar roads of comparable capacities, although more precision is possible, say when on-street
parking reduces the capacities at certain locations.
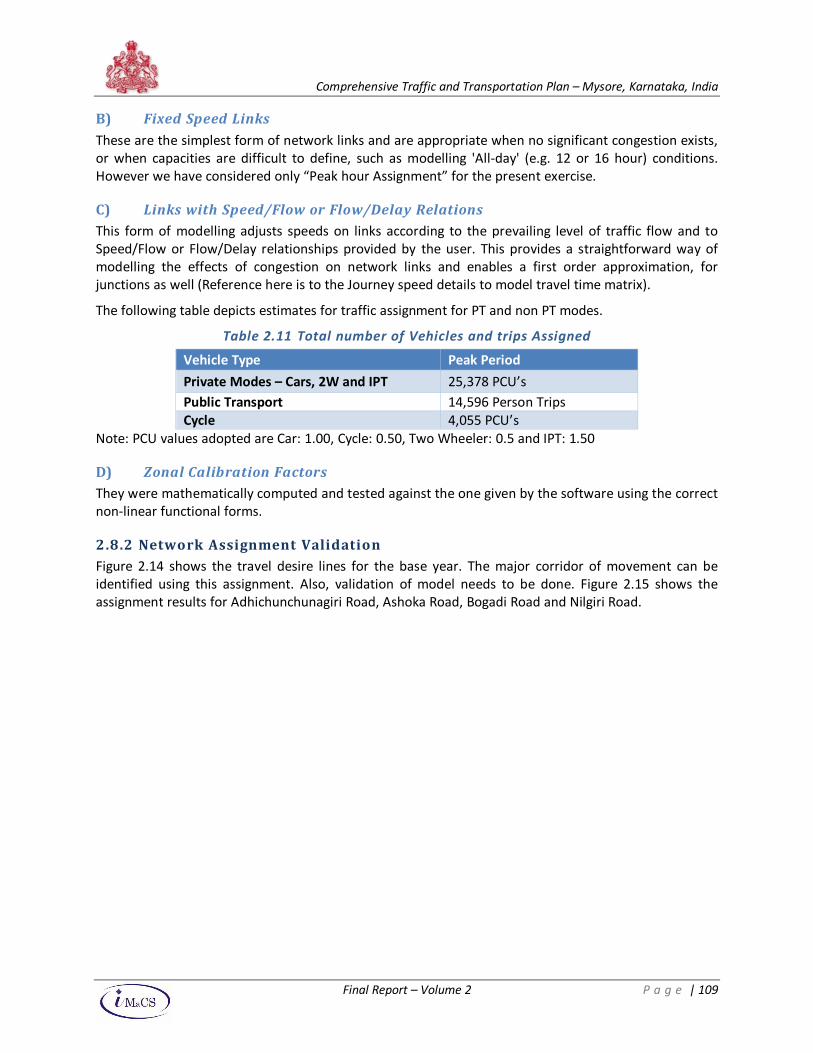
Comprehensive Traffic and Transportation Plan – Mysore, Karnataka, India
Final Report – Volume 2 P a g e | 109
B) Fixed Speed Links
These are the simplest form of network links and are appropriate when no significant congestion exists,
or when capacities are difficult to define, such as modelling 'All-day' (e.g. 12 or 16 hour) conditions.
However we have considered only “Peak hour Assignment” for the present exercise.
C) Links with Speed/Flow or Flow/Delay Relations
This form of modelling adjusts speeds on links according to the prevailing level of traffic flow and to
Speed/Flow or Flow/Delay relationships provided by the user. This provides a straightforward way of
modelling the effects of congestion on network links and enables a first order approximation, for
junctions as well (Reference here is to the Journey speed details to model travel time matrix).
The following table depicts estimates for traffic assignment for PT and non PT modes.
Table 2.11 Total number of Vehicles and trips Assigned
Vehicle Type Peak Period
Private Modes – Cars, 2W and IPT 25,378 PCU’s
Public Transport 14,596 Person Trips
Cycle 4,055 PCU’s
Note: PCU values adopted are Car: 1.00, Cycle: 0.50, Two Wheeler: 0.5 and IPT: 1.50
D) Zonal Calibration Factors
They were mathematically computed and tested against the one given by the software using the correct
non-linear functional forms.
2.8.2 Network Assignment Validation
Figure 2.14 shows the travel desire lines for the base year. The major corridor of movement can be
identified using this assignment. Also, validation of model needs to be done. Figure 2.15 shows the
assignment results for Adhichunchunagiri Road, Ashoka Road, Bogadi Road and Nilgiri Road.
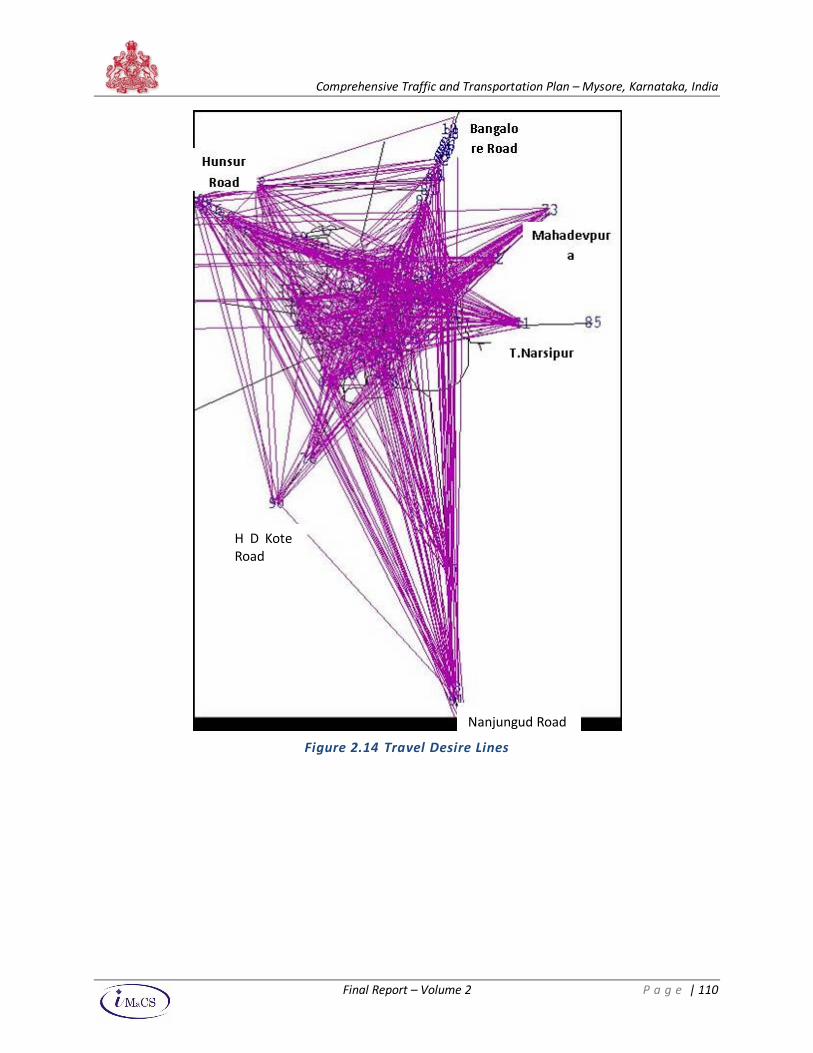
Comprehensive Traffic and Transportation Plan – Mysore, Karnataka, India
Final Report – Volume 2 P a g e | 110
Figure 2.14 Travel Desire Lines
H D Kote
Road
Nanjungud Road
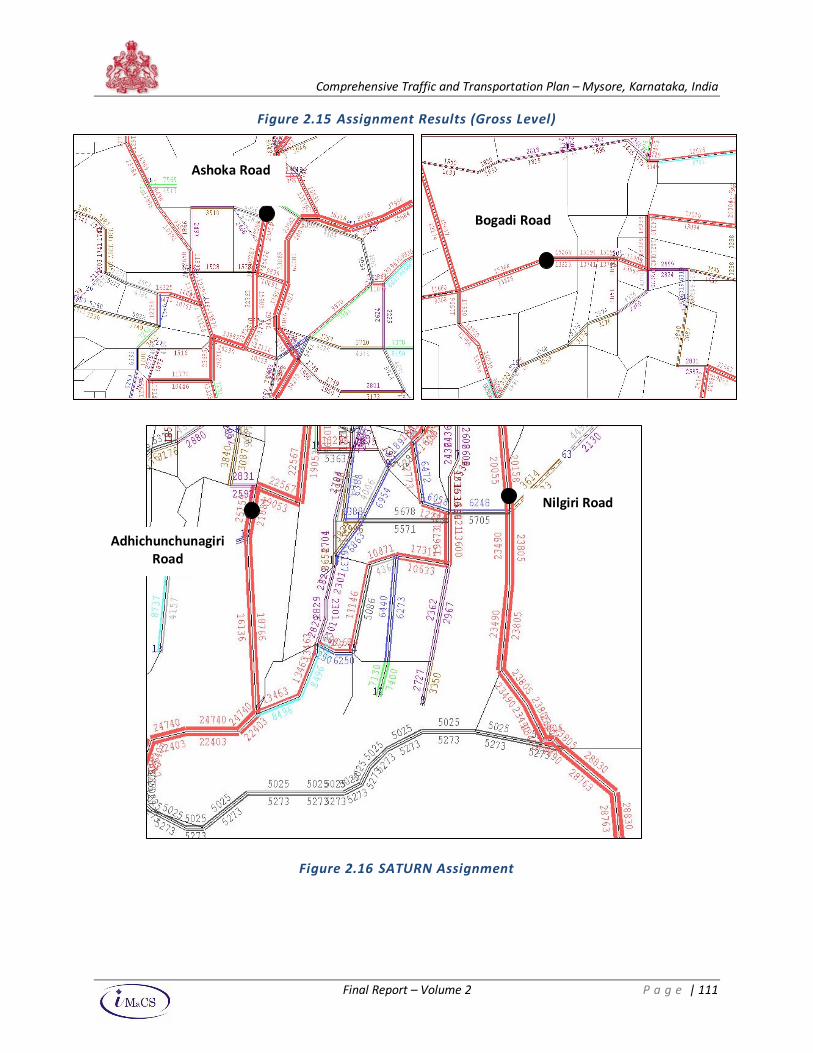
Comprehensive Traffic and Transportation Plan – Mysore, Karnataka, India
Final Report – Volume 2 P a g e | 111
Figure 2.15 Assignment Results (Gross Level)
Figure 2.16 SATURN Assignment
Ashoka Road
Bogadi Road
Nilgiri Road
Adhichunchunagiri
Road
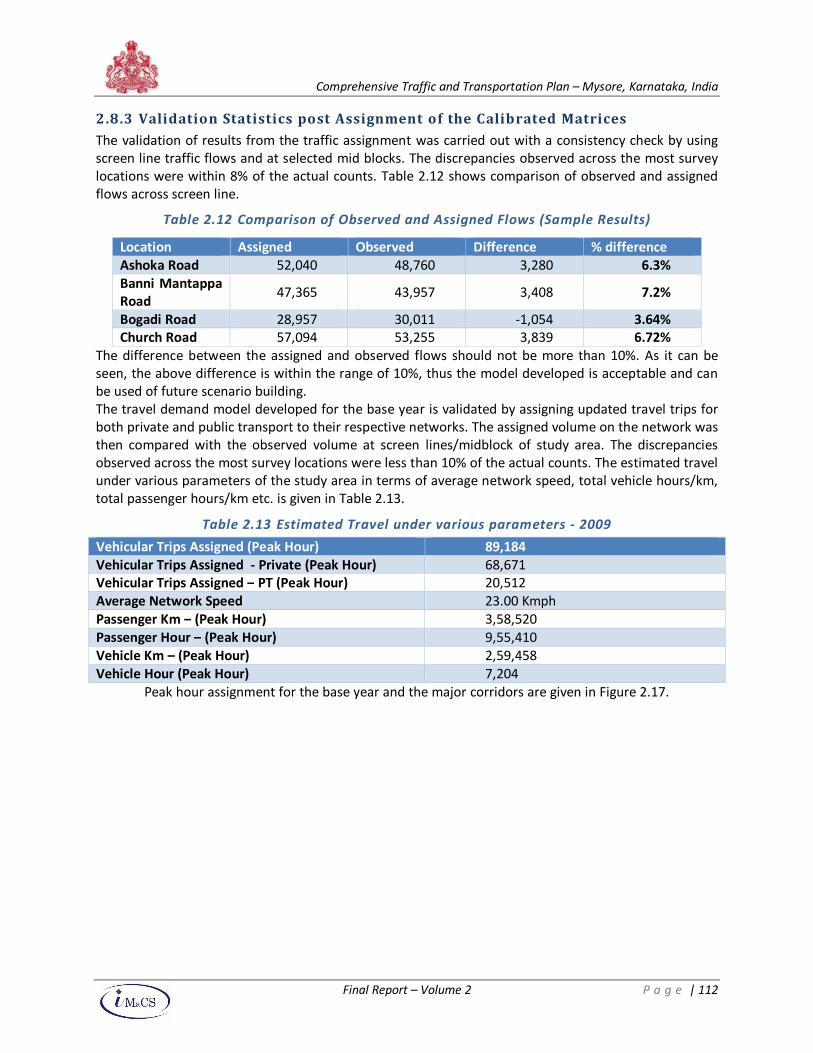
Comprehensive Traffic and Transportation Plan – Mysore, Karnataka, India
Final Report – Volume 2 P a g e | 112
2.8.3 Validation Statistics post Assignment of the Calibrated Matrices
The validation of results from the traffic assignment was carried out with a consistency check by using
screen line traffic flows and at selected mid blocks. The discrepancies observed across the most survey
locations were within 8% of the actual counts. Table 2.12 shows comparison of observed and assigned
flows across screen line.
Table 2.12 Comparison of Observed and Assigned Flows (Sample Results)
The difference between the assigned and observed flows should not be more than 10%. As it can be
seen, the above difference is within the range of 10%, thus the model developed is acceptable and can
be used of future scenario building.
The travel demand model developed for the base year is validated by assigning updated travel trips for
both private and public transport to their respective networks. The assigned volume on the network was
then compared with the observed volume at screen lines/midblock of study area. The discrepancies
observed across the most survey locations were less than 10% of the actual counts. The estimated travel
under various parameters of the study area in terms of average network speed, total vehicle hours/km,
total passenger hours/km etc. is given in Table 2.13.
Table 2.13 Estimated Travel under various parameters - 2009
Vehicular Trips Assigned (Peak Hour) 89,184
Vehicular Trips Assigned - Private (Peak Hour) 68,671
Vehicular Trips Assigned – PT (Peak Hour) 20,512
Average Network Speed 23.00 Kmph
Passenger Km – (Peak Hour) 3,58,520
Passenger Hour – (Peak Hour) 9,55,410
Vehicle Km – (Peak Hour) 2,59,458
Vehicle Hour (Peak Hour) 7,204
Peak hour assignment for the base year and the major corridors are given in Figure 2.17.
Location Assigned Observed Difference % difference
Ashoka Road 52,040 48,760 3,280 6.3%
Banni Mantappa
Road 47,365 43,957 3,408 7.2%
Bogadi Road 28,957 30,011 -1,054 3.64%
Church Road 57,094 53,255 3,839 6.72%
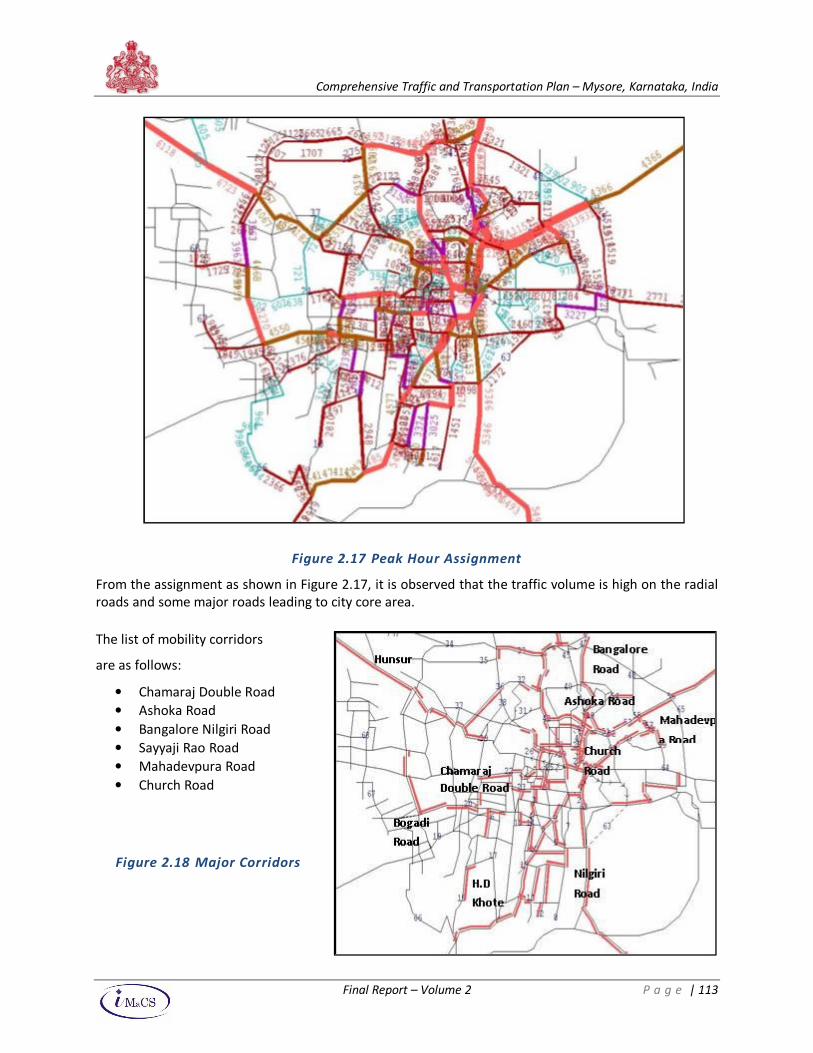
Comprehensive Traffic and Transportation Plan – Mysore, Karnataka, India
Final Report – Volume 2 P a g e | 113
Figure 2.17 Peak Hour Assignment
From the assignment as shown in Figure 2.17, it is observed that the traffic volume is high on the radial
roads and some major roads leading to city core area.
The list of mobility corridors
are as follows:
• Chamaraj Double Road
• Ashoka Road
• Bangalore Nilgiri Road
• Sayyaji Rao Road
• Mahadevpura Road
• Church Road
Figure 2.18 Major Corridors
Comprehensive Traffic and Transportation Plan – Mysore, Karnataka, India
Final Report – Volume 2 P a g e | 114
2.9 Conclusions
The travel demand model for the study was formalized using the UTPS framework. It is used to validate
the estimates of traffic and model the travel pattern as obtained from primary surveys. The following
are the key concluding remarks:
i. The detailed operational model was able to replicate and validate much of the travel and traffic
patterns on the primary/secondary network and across screen-line points
ii. The validation exercise bought out limited discrepancies with respect to midblock data
consistency (when compared to model flows).
iii. The exercise clearly models the shift in consumer preferences towards alternate mode choice
(to be used as an input in subsequent analysis) on account of savings on travel cost and time
iv. The developed travel demand model is fully operational and can be subjected to scenario and
sensitivity testing across horizon years owing to endogenous and exogenous interventions.
Comprehensive Traffic and Transportation Plan – Mysore, Karnataka, India
Final Report – Volume 2 P a g e | 115
CChhaa pptt ee rr 33 TTrraa nn ssppoorrtt IImm pprroo vveemm eenn tt SS tt rraa tt eegg iieess
3.1 Introduction
Mysore is a rapidly growing city and travel demand will continue to grow. There is no escape from
having to decongest some of the highly choked areas and intersections in the city. This is also being
suggested because long idling of motor vehicles at crowded intersections and corridors adding to
pollution of noise and air. Measures have to be suggested to discourage the use of motor vehicles and
attract a large part of the growing travel demand to be made by public transport and non-motorised
modes.
Considering the status of progress in various fronts that have already been initiated in Mysore, the road
to an integrated urban transportation strategy is fraught with difficulties. The process will be costly in
terms of time, money and effort to be invested in such an exercise. However, the cost of not doing the
integration is far higher than that of doing it and the resultant situation, if the integration is not done,
will be far messier than the process of doing it. Therefore, the following initiatives are recommended.
The above strategy is sought to be implemented through the following broad approaches:
• To identify the mobility corridors along which high capacity public transport system such as BRT /
Monorail / Metro etc to be developed on the basis of a technical and economic feasibility
• Improving operations of public transport so that there is significant shift of modal split towards
public transport.
• Providing alternative routes for those having to enter the core city area even when their journey
does not begin or end in this part of the city. For this purpose, ring corridors have been suggested to
enable the core city area to be bypassed.
• Providing bypass routes for long distance commuter and truck traffic so that they do not have to
travel through the city roads.
• Identifying feeder systems that connect different pockets and wards in the city to the most
convenient point in one or more of the mobility corridors
• Developing dedicated cycle and promoting NMT and pedestrian facilities
• Pedestrianizing important portions of the core city area and linking them with strategic parking
places to encourage people to walk in such areas
• Intersection improvement plans in a few heavily congested intersections/intersections to reduce
idling traffic
• Road Safety Initiatives and programs
• Policy level intervention that would discourage the use of personal motor vehicles
• Reform and strengthen the institutional arrangements for managing and regulating the transport
system in the city
An important aspect that would be considered while preparing the plan would be to maintain the
historical landscape of the city. Thus no steps would be taken that would lead to change in the skyline of
the historical city.
The Traffic Transportation Plan for Mysore will be addressed through a multi-prolonged approach.
Solutions for complex transport improvements cannot be achieved by a single strategy. The following
strategies need to be adopted in tandem to meet the various goals set for Mysore.
1. Land use and Transport Strategy
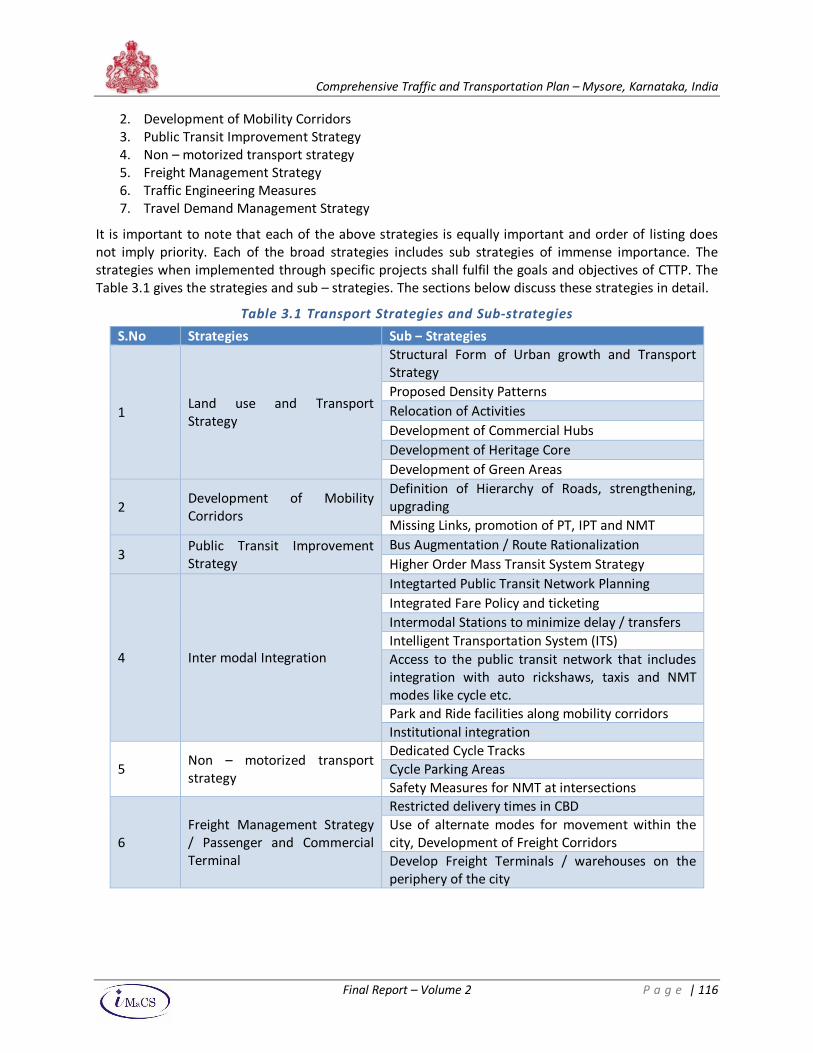
Comprehensive Traffic and Transportation Plan – Mysore, Karnataka, India
Final Report – Volume 2 P a g e | 116
2. Development of Mobility Corridors
3. Public Transit Improvement Strategy
4. Non – motorized transport strategy
5. Freight Management Strategy
6. Traffic Engineering Measures
7. Travel Demand Management Strategy
It is important to note that each of the above strategies is equally important and order of listing does
not imply priority. Each of the broad strategies includes sub strategies of immense importance. The
strategies when implemented through specific projects shall fulfil the goals and objectives of CTTP. The
Table 3.1 gives the strategies and sub – strategies. The sections below discuss these strategies in detail.
Table 3.1 Transport Strategies and Sub-strategies
S.No Strategies Sub – Strategies
1 Land use and Transport
Strategy
Structural Form of Urban growth and Transport
Strategy
Proposed Density Patterns
Relocation of Activities
Development of Commercial Hubs
Development of Heritage Core
Development of Green Areas
2 Development of Mobility
Corridors
Definition of Hierarchy of Roads, strengthening,
upgrading
Missing Links, promotion of PT, IPT and NMT
3 Public Transit Improvement
Strategy
Bus Augmentation / Route Rationalization
Higher Order Mass Transit System Strategy
4 Inter modal Integration
Integtarted Public Transit Network Planning
Integrated Fare Policy and ticketing
Intermodal Stations to minimize delay / transfers
Intelligent Transportation System (ITS)
Access to the public transit network that includes
integration with auto rickshaws, taxis and NMT
modes like cycle etc.
Park and Ride facilities along mobility corridors
Institutional integration
5 Non – motorized transport
strategy
Dedicated Cycle Tracks
Cycle Parking Areas
Safety Measures for NMT at intersections
6
Freight Management Strategy
/ Passenger and Commercial
Terminal
Restricted delivery times in CBD
Use of alternate modes for movement within the
city, Development of Freight Corridors
Develop Freight Terminals / warehouses on the
periphery of the city
Comprehensive Traffic and Transportation Plan – Mysore, Karnataka, India
Final Report – Volume 2 P a g e | 117
3.2 Land-use and Transport Strategy
The Present Land Use and Master Plan Vision
The Mysore Master Plan 2021 is under preparation. In absence of the same, a series of discussions were
undertaken with the stakeholders for understanding the broad strategies for development.
Development of the region has been concentrated along the main roads, and the core area where the
palace and market are currently situated within the city. Future development is being planned to
decongest the city center. In prime locations of the city situated along the main roads of the city v.z.
Palace Road, Devraj Urs Road, Ashoka Road, Kalidasa Road, KRS Road, Bannur Road, JLB Road,
Dhanvantri Road etc. residential units comprising of individual houses are being developed in the form
of apartment buildings. Departmental stores, supermarkets and large format stand alone stores are
coming up all over the city. High street retailing is flourishing in the region.
The new residential areas being developed are Bugatahalli, Yandahalli, Uttanahalli, Kupaluru,
Mandakalli, Hadajavu, Keargalli, Bervadi, Huyilalu, K Hemanahalli, Sadanhalli, Sidalingapura, Beragura,
Havurahalli.
The new commercial areas being developed are on Bangalore Sreerangapatna road, T. Narsipur Road
and Bannur Road. The land allotted for commercial development is 4 – 5 acres on each of these roads.
Along with this, another new industrial area being developed is Karkoda with an area of 250 acres that
would generate an employment of 5000 – 6000.
3.2.1 Development of Heritage Core
Mysore, being a heritage city, requires special attention in integrating the traffic transport plan with the
city cultural aspects. Discussions with the stakeholders have revealed that there are plans for heritage
and urban renewal of city core. The inputs for developing this strategy have been taken from the study
“Heritage and Urban Renewal of Heritage Core” by Stup Consultants Private Limited.
The Mysore Palace, placed at the heart of the city, has created a special interest for the tourists over
thousands of years in the past. At present, the city core is losing its charm as the roads around this
palace have been encroached by commercial developments. The vicinity around the Palace has
haphazard growth without proper regulations. The city bus stand operating just beside the palace has
made the place congested and the vehicles parked on the roads have worsened the condition.
In view of above, the area around the Mysore palace and the Jaganmohan Palace has been proposed
to be declared as heritage core with a unified image of maharaja’s era. The area delineated as heritage
core of Mysore City consists of the following prominent heritage structures and precincts as given in
Table 3.2:
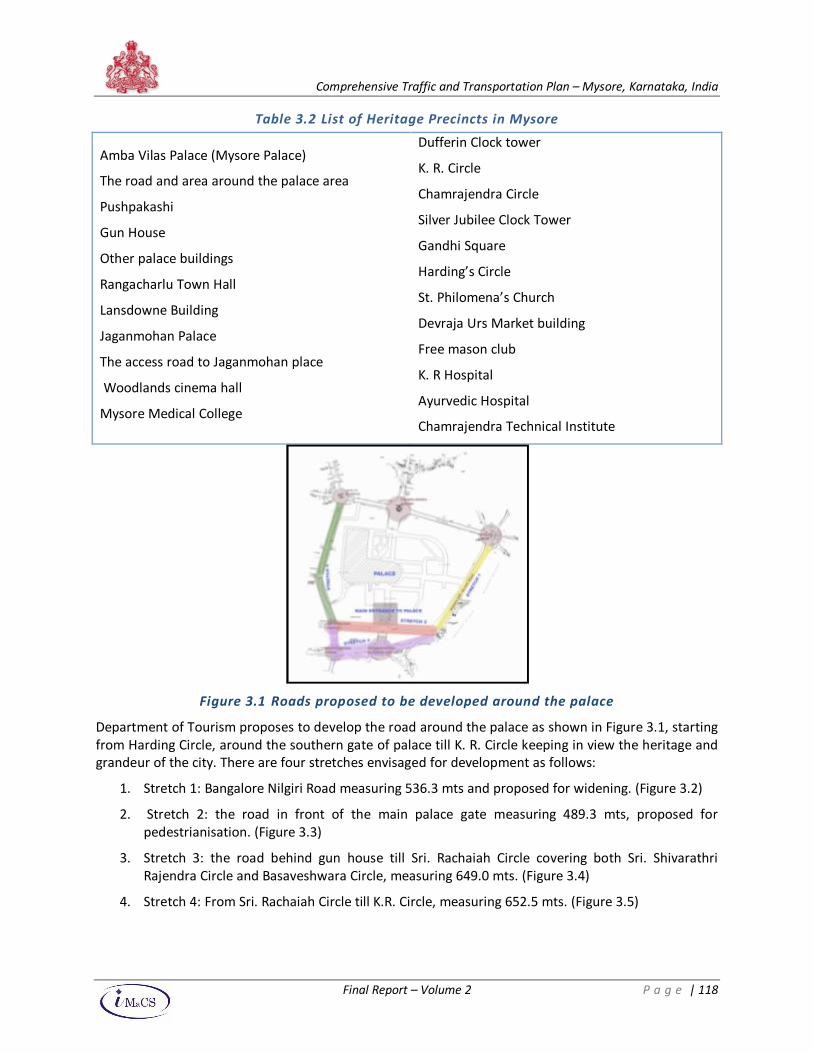
Comprehensive Traffic and Transportation Plan – Mysore, Karnataka, India
Final Report – Volume 2 P a g e | 118
Table 3.2 List of Heritage Precincts in Mysore
Amba Vilas Palace (Mysore Palace)
The road and area around the palace area
Pushpakashi
Gun House
Other palace buildings
Rangacharlu Town Hall
Lansdowne Building
Jaganmohan Palace
The access road to Jaganmohan place
Woodlands cinema hall
Mysore Medical College
Dufferin Clock tower
K. R. Circle
Chamrajendra Circle
Silver Jubilee Clock Tower
Gandhi Square
Harding’s Circle
St. Philomena’s Church
Devraja Urs Market building
Free mason club
K. R Hospital
Ayurvedic Hospital
Chamrajendra Technical Institute
Figure 3.1 Roads proposed to be developed around the palace
Department of Tourism proposes to develop the road around the palace as shown in Figure 3.1, starting
from Harding Circle, around the southern gate of palace till K. R. Circle keeping in view the heritage and
grandeur of the city. There are four stretches envisaged for development as follows:
1. Stretch 1: Bangalore Nilgiri Road measuring 536.3 mts and proposed for widening. (Figure 3.2)
2. Stretch 2: the road in front of the main palace gate measuring 489.3 mts, proposed for
pedestrianisation. (Figure 3.3)
3. Stretch 3: the road behind gun house till Sri. Rachaiah Circle covering both Sri. Shivarathri
Rajendra Circle and Basaveshwara Circle, measuring 649.0 mts. (Figure 3.4)
4. Stretch 4: From Sri. Rachaiah Circle till K.R. Circle, measuring 652.5 mts. (Figure 3.5)
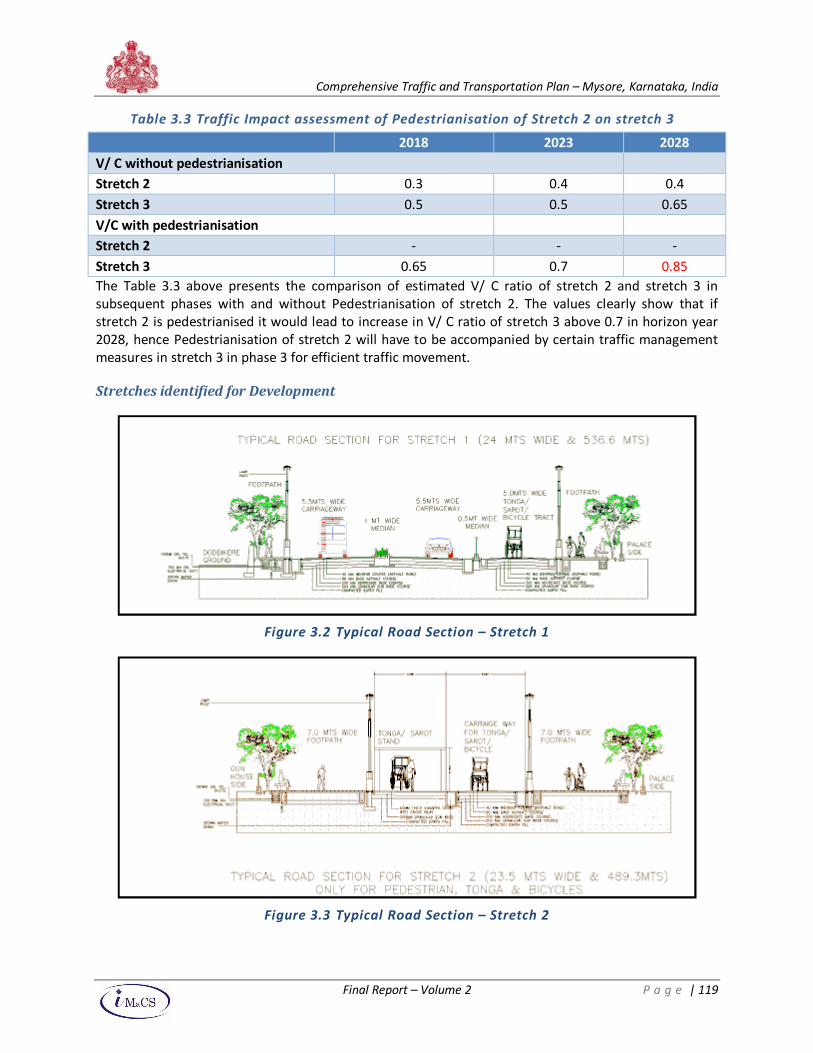
Comprehensive Traffic and Transportation Plan – Mysore, Karnataka, India
Final Report – Volume 2 P a g e | 119
Table 3.3 Traffic Impact assessment of Pedestrianisation of Stretch 2 on stretch 3
2018 2023 2028
V/ C without pedestrianisation
Stretch 2 0.3 0.4 0.4
Stretch 3 0.5 0.5 0.65
V/C with pedestrianisation
Stretch 2 - - -
Stretch 3 0.65 0.7 0.85
The Table 3.3 above presents the comparison of estimated V/ C ratio of stretch 2 and stretch 3 in
subsequent phases with and without Pedestrianisation of stretch 2. The values clearly show that if
stretch 2 is pedestrianised it would lead to increase in V/ C ratio of stretch 3 above 0.7 in horizon year
2028, hence Pedestrianisation of stretch 2 will have to be accompanied by certain traffic management
measures in stretch 3 in phase 3 for efficient traffic movement.
Stretches identified for Development
Figure 3.2 Typical Road Section – Stretch 1
Figure 3.3 Typical Road Section – Stretch 2
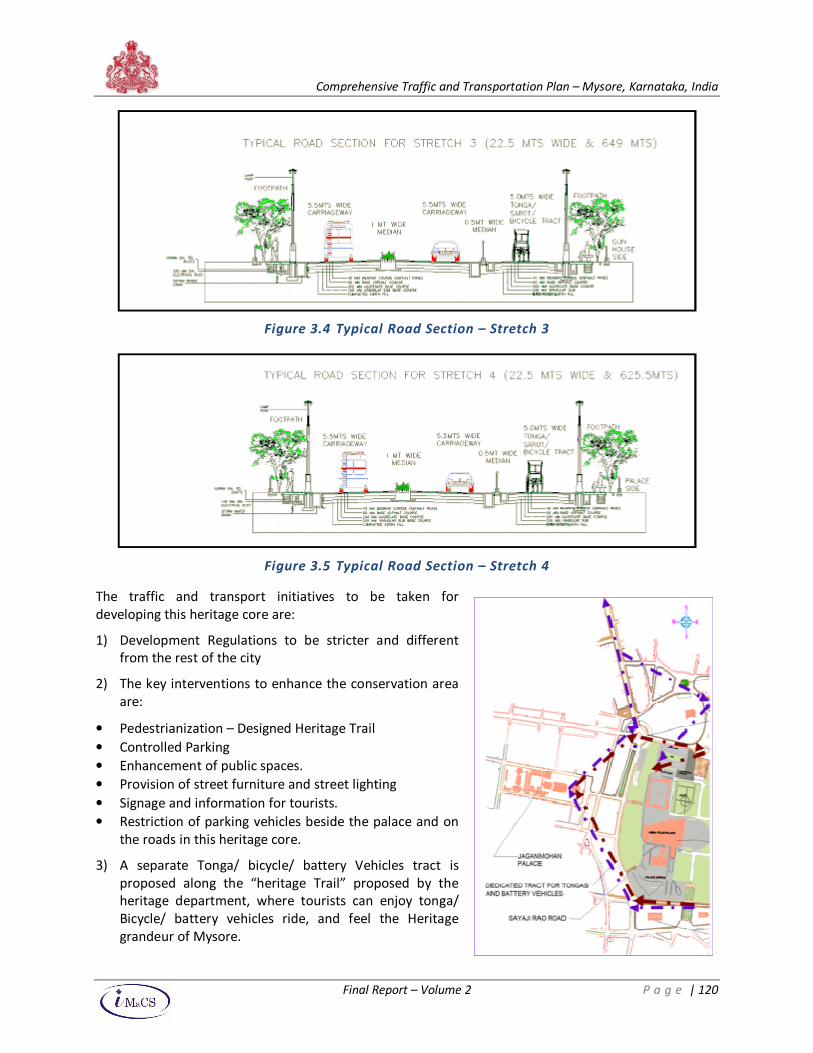
Comprehensive Traffic and Transportation Plan – Mysore, Karnataka, India
Final Report – Volume 2 P a g e | 120
Figure 3.4 Typical Road Section – Stretch 3
Figure 3.5 Typical Road Section – Stretch 4
The traffic and transport initiatives to be taken for
developing this heritage core are:
1) Development Regulations to be stricter and different
from the rest of the city
2) The key interventions to enhance the conservation area
are:
• Pedestrianization – Designed Heritage Trail
• Controlled Parking
• Enhancement of public spaces.
• Provision of street furniture and street lighting
• Signage and information for tourists.
• Restriction of parking vehicles beside the palace and on
the roads in this heritage core.
3) A separate Tonga/ bicycle/ battery Vehicles tract is
proposed along the “heritage Trail” proposed by the
heritage department, where tourists can enjoy tonga/
Bicycle/ battery vehicles ride, and feel the Heritage
grandeur of Mysore.
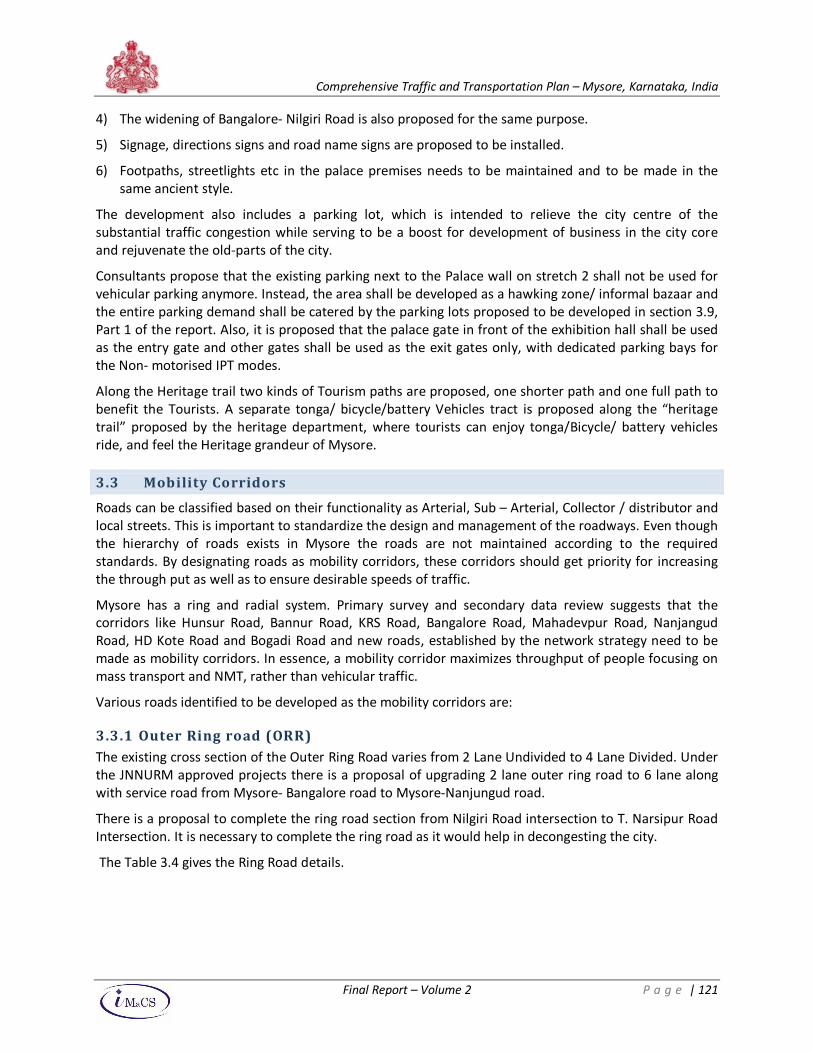
Comprehensive Traffic and Transportation Plan – Mysore, Karnataka, India
Final Report – Volume 2 P a g e | 121
4) The widening of Bangalore- Nilgiri Road is also proposed for the same purpose.
5) Signage, directions signs and road name signs are proposed to be installed.
6) Footpaths, streetlights etc in the palace premises needs to be maintained and to be made in the
same ancient style.
The development also includes a parking lot, which is intended to relieve the city centre of the
substantial traffic congestion while serving to be a boost for development of business in the city core
and rejuvenate the old-parts of the city.
Consultants propose that the existing parking next to the Palace wall on stretch 2 shall not be used for
vehicular parking anymore. Instead, the area shall be developed as a hawking zone/ informal bazaar and
the entire parking demand shall be catered by the parking lots proposed to be developed in section 3.9,
Part 1 of the report. Also, it is proposed that the palace gate in front of the exhibition hall shall be used
as the entry gate and other gates shall be used as the exit gates only, with dedicated parking bays for
the Non- motorised IPT modes.
Along the Heritage trail two kinds of Tourism paths are proposed, one shorter path and one full path to
benefit the Tourists. A separate tonga/ bicycle/battery Vehicles tract is proposed along the “heritage
trail” proposed by the heritage department, where tourists can enjoy tonga/Bicycle/ battery vehicles
ride, and feel the Heritage grandeur of Mysore.
3.3 Mobility Corridors
Roads can be classified based on their functionality as Arterial, Sub – Arterial, Collector / distributor and
local streets. This is important to standardize the design and management of the roadways. Even though
the hierarchy of roads exists in Mysore the roads are not maintained according to the required
standards. By designating roads as mobility corridors, these corridors should get priority for increasing
the through put as well as to ensure desirable speeds of traffic.
Mysore has a ring and radial system. Primary survey and secondary data review suggests that the
corridors like Hunsur Road, Bannur Road, KRS Road, Bangalore Road, Mahadevpur Road, Nanjangud
Road, HD Kote Road and Bogadi Road and new roads, established by the network strategy need to be
made as mobility corridors. In essence, a mobility corridor maximizes throughput of people focusing on
mass transport and NMT, rather than vehicular traffic.
Various roads identified to be developed as the mobility corridors are:
3.3.1 Outer Ring road (ORR)
The existing cross section of the Outer Ring Road varies from 2 Lane Undivided to 4 Lane Divided. Under
the JNNURM approved projects there is a proposal of upgrading 2 lane outer ring road to 6 lane along
with service road from Mysore- Bangalore road to Mysore-Nanjungud road.
There is a proposal to complete the ring road section from Nilgiri Road intersection to T. Narsipur Road
Intersection. It is necessary to complete the ring road as it would help in decongesting the city.
The Table 3.4 gives the Ring Road details.
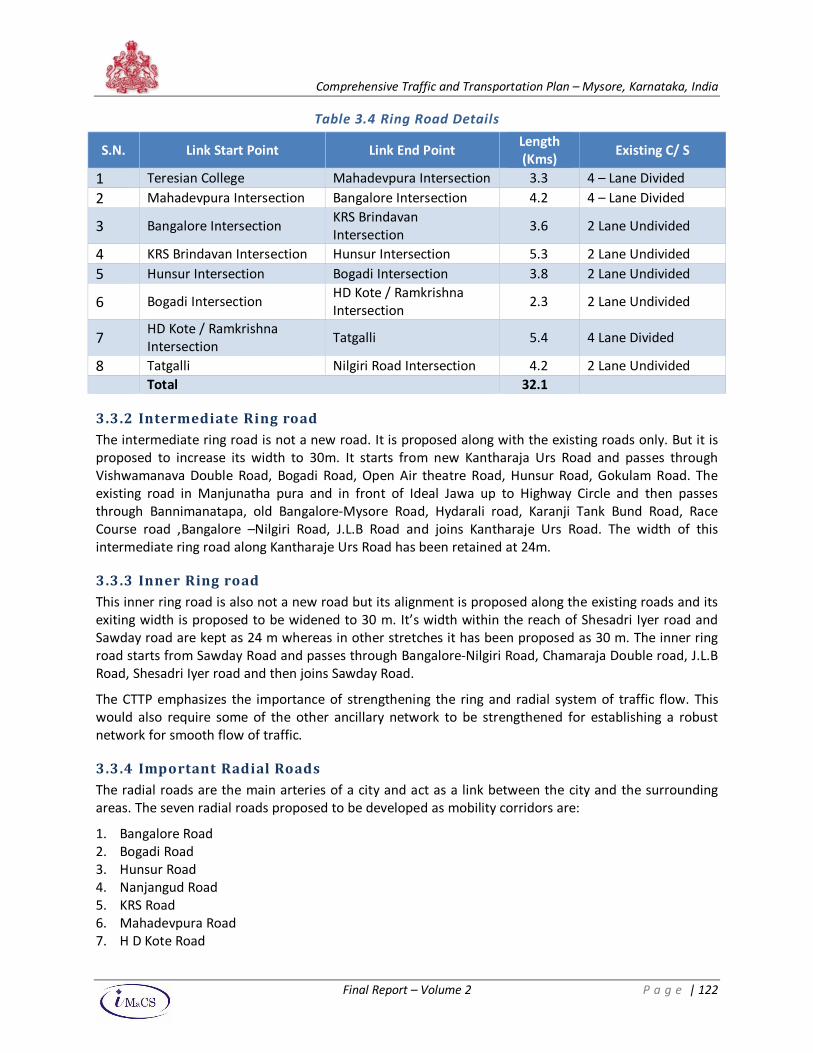
Comprehensive Traffic and Transportation Plan – Mysore, Karnataka, India
Final Report – Volume 2 P a g e | 122
Table 3.4 Ring Road Details
S.N. Link Start Point Link End Point Length
(Kms) Existing C/ S
1 Teresian College Mahadevpura Intersection 3.3 4 – Lane Divided
2 Mahadevpura Intersection Bangalore Intersection 4.2 4 – Lane Divided
3 Bangalore Intersection KRS Brindavan
Intersection 3.6 2 Lane Undivided
4 KRS Brindavan Intersection Hunsur Intersection 5.3 2 Lane Undivided
5 Hunsur Intersection Bogadi Intersection 3.8 2 Lane Undivided
6 Bogadi Intersection HD Kote / Ramkrishna
Intersection 2.3 2 Lane Undivided
7 HD Kote / Ramkrishna
Intersection Tatgalli 5.4 4 Lane Divided
8 Tatgalli Nilgiri Road Intersection 4.2 2 Lane Undivided
Total 32.1
3.3.2 Intermediate Ring road
The intermediate ring road is not a new road. It is proposed along with the existing roads only. But it is
proposed to increase its width to 30m. It starts from new Kantharaja Urs Road and passes through
Vishwamanava Double Road, Bogadi Road, Open Air theatre Road, Hunsur Road, Gokulam Road. The
existing road in Manjunatha pura and in front of Ideal Jawa up to Highway Circle and then passes
through Bannimanatapa, old Bangalore-Mysore Road, Hydarali road, Karanji Tank Bund Road, Race
Course road ,Bangalore –Nilgiri Road, J.L.B Road and joins Kantharaje Urs Road. The width of this
intermediate ring road along Kantharaje Urs Road has been retained at 24m.
3.3.3 Inner Ring road
This inner ring road is also not a new road but its alignment is proposed along the existing roads and its
exiting width is proposed to be widened to 30 m. It’s width within the reach of Shesadri Iyer road and
Sawday road are kept as 24 m whereas in other stretches it has been proposed as 30 m. The inner ring
road starts from Sawday Road and passes through Bangalore-Nilgiri Road, Chamaraja Double road, J.L.B
Road, Shesadri Iyer road and then joins Sawday Road.
The CTTP emphasizes the importance of strengthening the ring and radial system of traffic flow. This
would also require some of the other ancillary network to be strengthened for establishing a robust
network for smooth flow of traffic.
3.3.4 Important Radial Roads
The radial roads are the main arteries of a city and act as a link between the city and the surrounding
areas. The seven radial roads proposed to be developed as mobility corridors are:
1. Bangalore Road
2. Bogadi Road
3. Hunsur Road
4. Nanjangud Road
5. KRS Road
6. Mahadevpura Road
7. H D Kote Road
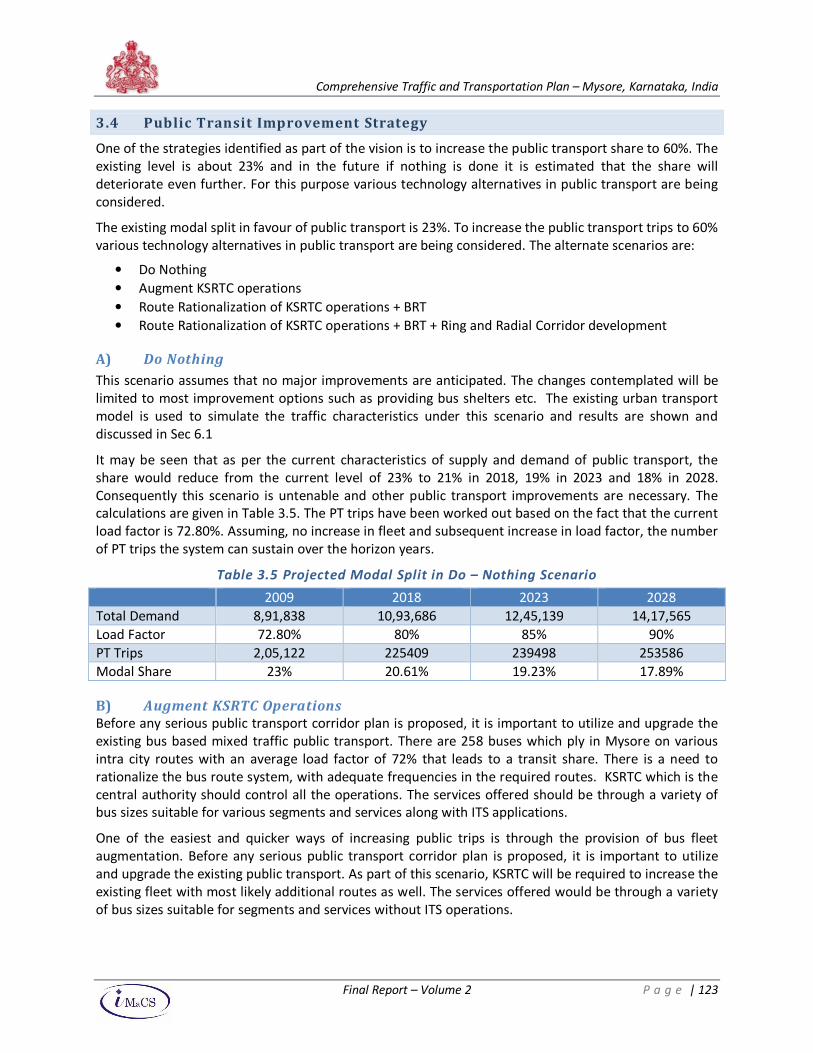
Comprehensive Traffic and Transportation Plan – Mysore, Karnataka, India
Final Report – Volume 2 P a g e | 123
3.4 Public Transit Improvement Strategy
One of the strategies identified as part of the vision is to increase the public transport share to 60%. The
existing level is about 23% and in the future if nothing is done it is estimated that the share will
deteriorate even further. For this purpose various technology alternatives in public transport are being
considered.
The existing modal split in favour of public transport is 23%. To increase the public transport trips to 60%
various technology alternatives in public transport are being considered. The alternate scenarios are:
• Do Nothing
• Augment KSRTC operations
• Route Rationalization of KSRTC operations + BRT
• Route Rationalization of KSRTC operations + BRT + Ring and Radial Corridor development
A) Do Nothing
This scenario assumes that no major improvements are anticipated. The changes contemplated will be
limited to most improvement options such as providing bus shelters etc. The existing urban transport
model is used to simulate the traffic characteristics under this scenario and results are shown and
discussed in Sec 6.1
It may be seen that as per the current characteristics of supply and demand of public transport, the
share would reduce from the current level of 23% to 21% in 2018, 19% in 2023 and 18% in 2028.
Consequently this scenario is untenable and other public transport improvements are necessary. The
calculations are given in Table 3.5. The PT trips have been worked out based on the fact that the current
load factor is 72.80%. Assuming, no increase in fleet and subsequent increase in load factor, the number
of PT trips the system can sustain over the horizon years.
Table 3.5 Projected Modal Split in Do – Nothing Scenario
2009 2018 2023 2028
Total Demand 8,91,838 10,93,686 12,45,139 14,17,565
Load Factor 72.80% 80% 85% 90%
PT Trips 2,05,122 225409 239498 253586
Modal Share 23% 20.61% 19.23% 17.89%
B) Augment KSRTC Operations
Before any serious public transport corridor plan is proposed, it is important to utilize and upgrade the
existing bus based mixed traffic public transport. There are 258 buses which ply in Mysore on various
intra city routes with an average load factor of 72% that leads to a transit share. There is a need to
rationalize the bus route system, with adequate frequencies in the required routes. KSRTC which is the
central authority should control all the operations. The services offered should be through a variety of
bus sizes suitable for various segments and services along with ITS applications.
One of the easiest and quicker ways of increasing public trips is through the provision of bus fleet
augmentation. Before any serious public transport corridor plan is proposed, it is important to utilize
and upgrade the existing public transport. As part of this scenario, KSRTC will be required to increase the
existing fleet with most likely additional routes as well. The services offered would be through a variety
of bus sizes suitable for segments and services without ITS operations.
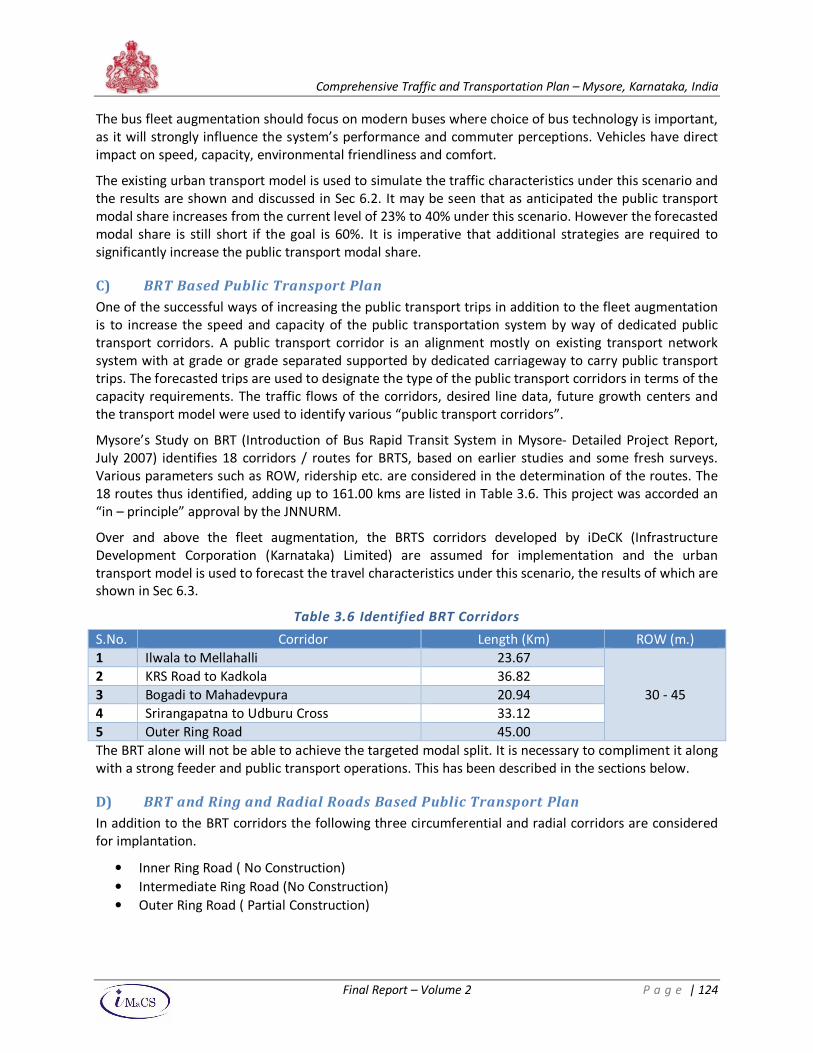
Comprehensive Traffic and Transportation Plan – Mysore, Karnataka, India
Final Report – Volume 2 P a g e | 124
The bus fleet augmentation should focus on modern buses where choice of bus technology is important,
as it will strongly influence the system’s performance and commuter perceptions. Vehicles have direct
impact on speed, capacity, environmental friendliness and comfort.
The existing urban transport model is used to simulate the traffic characteristics under this scenario and
the results are shown and discussed in Sec 6.2. It may be seen that as anticipated the public transport
modal share increases from the current level of 23% to 40% under this scenario. However the forecasted
modal share is still short if the goal is 60%. It is imperative that additional strategies are required to
significantly increase the public transport modal share.
C) BRT Based Public Transport Plan
One of the successful ways of increasing the public transport trips in addition to the fleet augmentation
is to increase the speed and capacity of the public transportation system by way of dedicated public
transport corridors. A public transport corridor is an alignment mostly on existing transport network
system with at grade or grade separated supported by dedicated carriageway to carry public transport
trips. The forecasted trips are used to designate the type of the public transport corridors in terms of the
capacity requirements. The traffic flows of the corridors, desired line data, future growth centers and
the transport model were used to identify various “public transport corridors”.
Mysore’s Study on BRT (Introduction of Bus Rapid Transit System in Mysore- Detailed Project Report,
July 2007) identifies 18 corridors / routes for BRTS, based on earlier studies and some fresh surveys.
Various parameters such as ROW, ridership etc. are considered in the determination of the routes. The
18 routes thus identified, adding up to 161.00 kms are listed in Table 3.6. This project was accorded an
“in – principle” approval by the JNNURM.
Over and above the fleet augmentation, the BRTS corridors developed by iDeCK (Infrastructure
Development Corporation (Karnataka) Limited) are assumed for implementation and the urban
transport model is used to forecast the travel characteristics under this scenario, the results of which are
shown in Sec 6.3.
Table 3.6 Identified BRT Corridors
S.No. Corridor Length (Km) ROW (m.)
1 Ilwala to Mellahalli 23.67
30 - 45
2 KRS Road to Kadkola 36.82
3 Bogadi to Mahadevpura 20.94
4 Srirangapatna to Udburu Cross 33.12
5 Outer Ring Road 45.00
The BRT alone will not be able to achieve the targeted modal split. It is necessary to compliment it along
with a strong feeder and public transport operations. This has been described in the sections below.
D) BRT and Ring and Radial Roads Based Public Transport Plan
In addition to the BRT corridors the following three circumferential and radial corridors are considered
for implantation.
• Inner Ring Road ( No Construction)
• Intermediate Ring Road (No Construction)
• Outer Ring Road ( Partial Construction)
Comprehensive Traffic and Transportation Plan – Mysore, Karnataka, India
Final Report – Volume 2 P a g e | 125
The details of these corridors are given in Section 3.6, Part 1.The seven radials as proposed to be
developed are:
1. Bangalore Road
2. Bogadi Road
3. Hunsur Road
4. Nanjangud Road
5. KRS Road
6. Mahadevpura Road
7. H D Kote Road
The introduction of BRT and the strengthening of the ring and radial system of road are tested in
Scenario 3 (Section 4.3, Part 2). KSRTC is developing / expanding operations at 5 satellite bus terminals
in Mysore. These are:
1. Kuvempu Nagar
2. RS Naidu Nagar
3. Sathgalli
4. Ilwala
5. Chamundi Hill
The map of the city and sub – urban bus terminal locations is given in Annexure XII.
E) Route Rationalization of KSRTC operations + BRT + Ring and Radial Corridor
development
The traffic scenario as anticipated in 2018 and above would have some corridors emerging which would
have phpdt more than 20000. In such cases, it is difficult for the BRT to manage the demand on a single
route. It is necessary to strengthen the public transport operations on corridors apart from the
identified BRT corridors. This would require route rationalization of KSRTC operations, and ring and
radial development of the city along with BRT development.
3.4.2 Bus Terminals
An assessment was done at the city bus terminal to ascertain the facilities provided in the bus terminal.
It helped identify the issues and weakness of the terminal. Some changes or improvements have been
suggested for smoother operations.
The exit of city buses on Sayyaji Rao Road causes hindrance to the moving traffic. The lane should be
widened so as to provide sufficient distance for the buses to merge in smoothly with the moving traffic.
Also the same exit/entry point of city and moffusil buses leads to vehicular conflicts. The exit/entry point
should be defined distinctly so as to avoid any conflicts as shown in Figure 3.6.
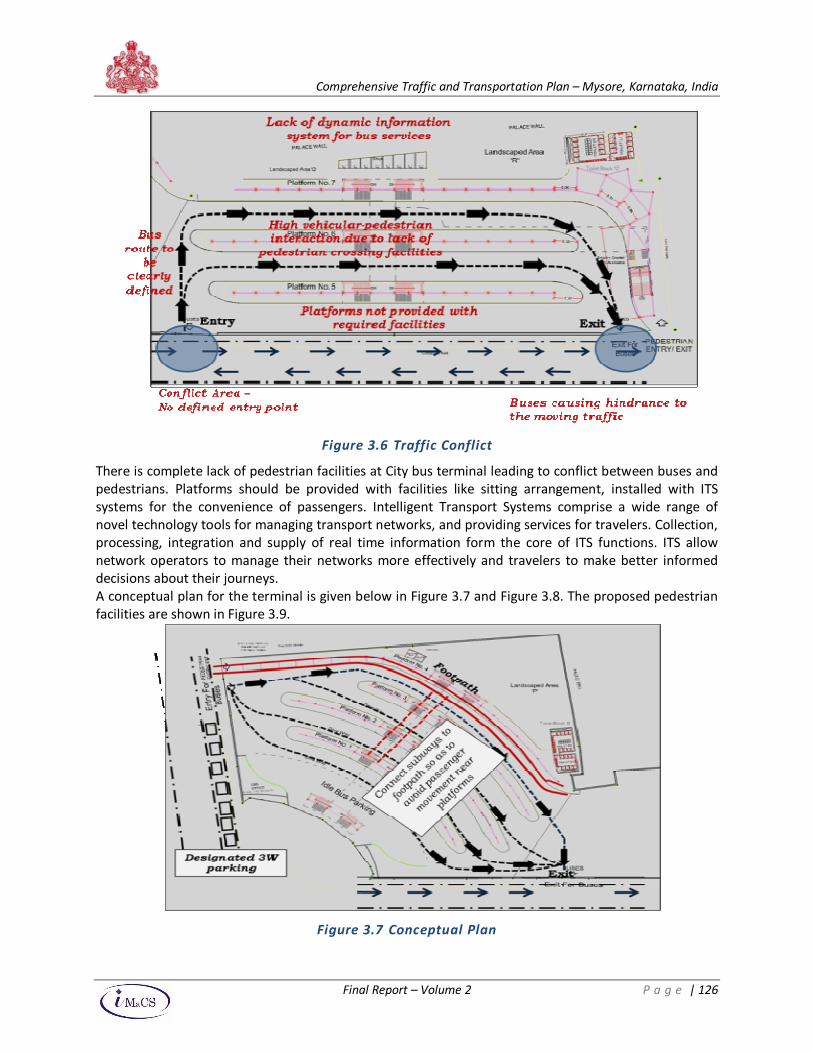
Comprehensive Traffic and Transportation Plan – Mysore, Karnataka, India
Final Report – Volume 2 P a g e | 126
Figure 3.6 Traffic Conflict
There is complete lack of pedestrian facilities at City bus terminal leading to conflict between buses and
pedestrians. Platforms should be provided with facilities like sitting arrangement, installed with ITS
systems for the convenience of passengers. Intelligent Transport Systems comprise a wide range of
novel technology tools for managing transport networks, and providing services for travelers. Collection,
processing, integration and supply of real time information form the core of ITS functions. ITS allow
network operators to manage their networks more effectively and travelers to make better informed
decisions about their journeys.
A conceptual plan for the terminal is given below in Figure 3.7 and Figure 3.8. The proposed pedestrian
facilities are shown in Figure 3.9.
Figure 3.7 Conceptual Plan
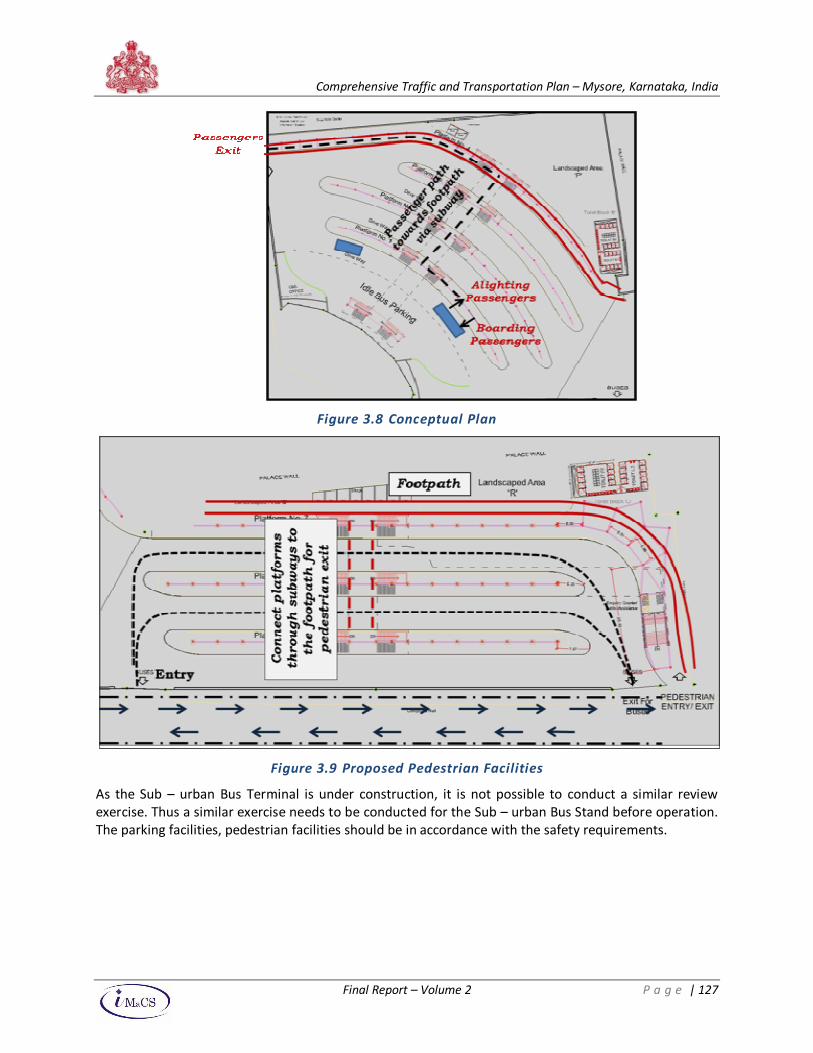
Comprehensive Traffic and Transportation Plan – Mysore, Karnataka, India
Final Report – Volume 2 P a g e | 127
Figure 3.8 Conceptual Plan
Figure 3.9 Proposed Pedestrian Facilities
As the Sub – urban Bus Terminal is under construction, it is not possible to conduct a similar review
exercise. Thus a similar exercise needs to be conducted for the Sub – urban Bus Stand before operation.
The parking facilities, pedestrian facilities should be in accordance with the safety requirements.
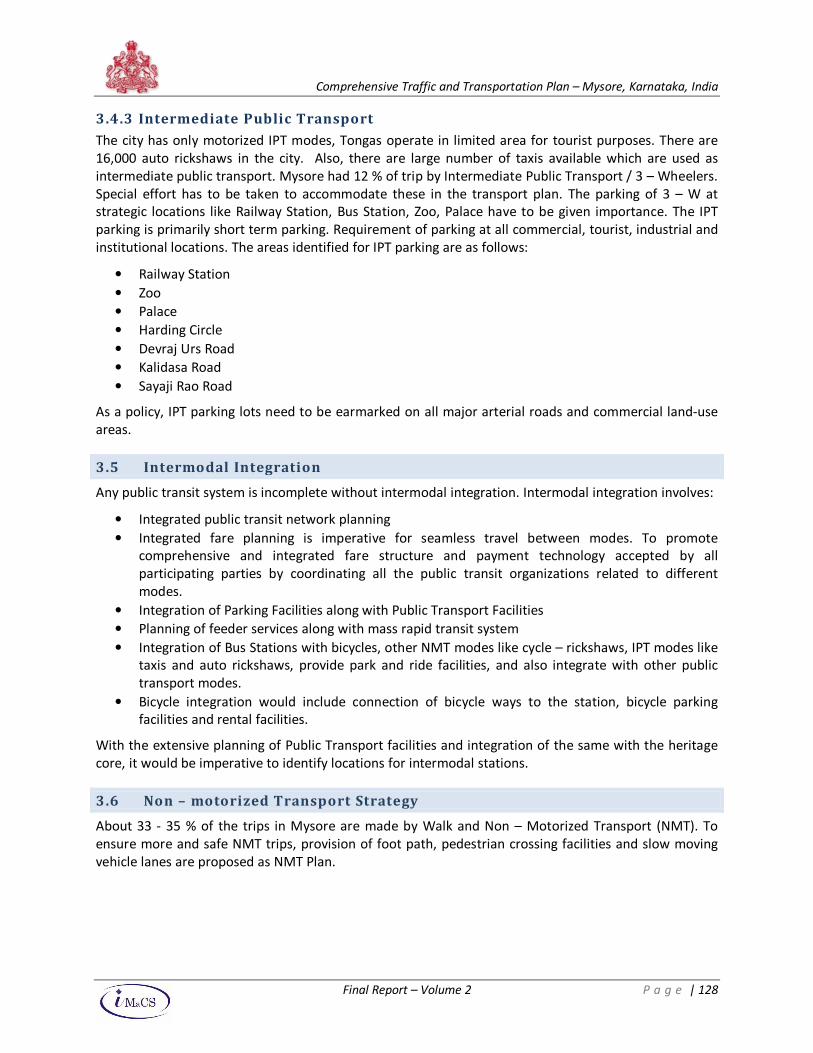
Comprehensive Traffic and Transportation Plan – Mysore, Karnataka, India
Final Report – Volume 2 P a g e | 128
3.4.3 Intermediate Public Transport
The city has only motorized IPT modes, Tongas operate in limited area for tourist purposes. There are
16,000 auto rickshaws in the city. Also, there are large number of taxis available which are used as
intermediate public transport. Mysore had 12 % of trip by Intermediate Public Transport / 3 – Wheelers.
Special effort has to be taken to accommodate these in the transport plan. The parking of 3 – W at
strategic locations like Railway Station, Bus Station, Zoo, Palace have to be given importance. The IPT
parking is primarily short term parking. Requirement of parking at all commercial, tourist, industrial and
institutional locations. The areas identified for IPT parking are as follows:
• Railway Station
• Zoo
• Palace
• Harding Circle
• Devraj Urs Road
• Kalidasa Road
• Sayaji Rao Road
As a policy, IPT parking lots need to be earmarked on all major arterial roads and commercial land-use
areas.
3.5 Intermodal Integration
Any public transit system is incomplete without intermodal integration. Intermodal integration involves:
• Integrated public transit network planning
• Integrated fare planning is imperative for seamless travel between modes. To promote
comprehensive and integrated fare structure and payment technology accepted by all
participating parties by coordinating all the public transit organizations related to different
modes.
• Integration of Parking Facilities along with Public Transport Facilities
• Planning of feeder services along with mass rapid transit system
• Integration of Bus Stations with bicycles, other NMT modes like cycle – rickshaws, IPT modes like
taxis and auto rickshaws, provide park and ride facilities, and also integrate with other public
transport modes.
• Bicycle integration would include connection of bicycle ways to the station, bicycle parking
facilities and rental facilities.
With the extensive planning of Public Transport facilities and integration of the same with the heritage
core, it would be imperative to identify locations for intermodal stations.
3.6 Non – motorized Transport Strategy
About 33 - 35 % of the trips in Mysore are made by Walk and Non – Motorized Transport (NMT). To
ensure more and safe NMT trips, provision of foot path, pedestrian crossing facilities and slow moving
vehicle lanes are proposed as NMT Plan.
Comprehensive Traffic and Transportation Plan – Mysore, Karnataka, India
Final Report – Volume 2 P a g e | 129
3.6.1 Strategies for providing Pedestrian Facilities
A significant portion of the trips (23 %) are made completely by walk. A comprehensive walking network
is necessary for having an environment conducive to walking. While all categories of roads should have
footpaths, other public spaces should also be utilized to provide a better walking environment. Owners
of private land should also be encouraged to provide pedestrian facilities so that continuity of network is
maintained.
Typical Segregation of NMVs
Footpaths
A significant portion of the trips (23 %) are made completely by walk. Sidewalks have valuable
community benefits. The following is suggested for the installation and maintenance of footpaths:
• Foot path is to be constructed on the proposed mobility corridors and also the secondary
arterials, as a minimum requirement. It should also be provided in all the residential roads,
wherever possible.
• A minimum usable width of 1.5 meters should be provided for footpath and wherever possible a
width of 2.0 meters for all roads.
• Encroachments on footpaths to be removed. Any further obstruction like tress etc to be
relocated.
• The footpath design should be comfortable to all class of users. The height should be easily
accessible by children, old people, women, etc. Also, it must discourage two wheelers using the
footpath.
• At signalized intersections, pedestrian zebra crossings must be clearly marked
• Footpaths at all busy intersections must be provided with handrails to enforce pedestrian cross
at zebra crossings
3.6.2 Road User Hierarchy
Road User hierarchy should be defined after understanding the local situation, meeting the needs of all
road users. In order to provide supportive environments for walking, such a hierarchy should give
precedence to pedestrians. In terms of road user hierarchy, pedestrian should be at the top of the
hierarchy on all roads except on primary arterial high speed corridors. This principle may be changed
under exceptional situation as per the local requirement.
From the pedestrian safety and security point of view, planning and design of pedestrian facilities should
encompass measures that aim at traffic and speed reduction. For traffic reduction, road engineering
techniques have an important role to play. This could be done through increasing journey times for
drivers, deterring them from using certain roads unless they have business in the area, reducing vehicle
volumes to achieve an improved environment, especially in regard to neighborhood severance, reducing
vehicle volumes to create the opportunity to reallocate road - space to favor pedestrians and reducing
the likelihood of a collision between a pedestrian and a vehicle through separation in space.
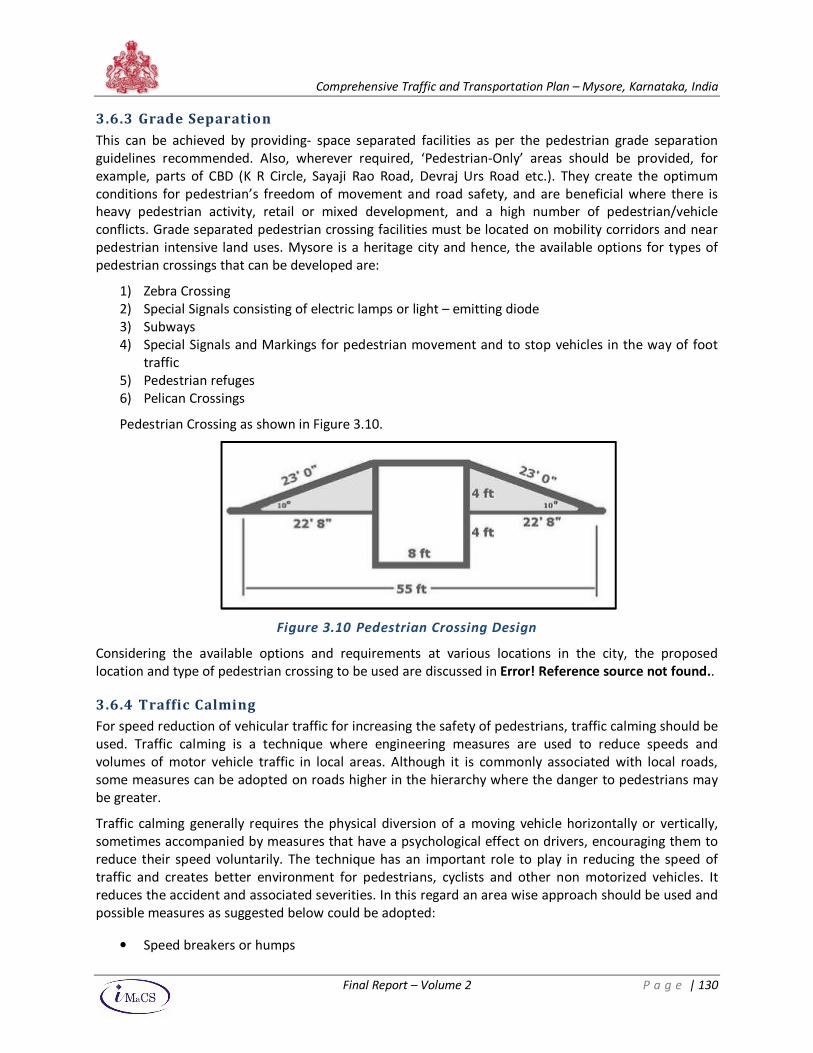
Comprehensive Traffic and Transportation Plan – Mysore, Karnataka, India
Final Report – Volume 2 P a g e | 130
3.6.3 Grade Separation
This can be achieved by providing- space separated facilities as per the pedestrian grade separation
guidelines recommended. Also, wherever required, ‘Pedestrian-Only’ areas should be provided, for
example, parts of CBD (K R Circle, Sayaji Rao Road, Devraj Urs Road etc.). They create the optimum
conditions for pedestrian’s freedom of movement and road safety, and are beneficial where there is
heavy pedestrian activity, retail or mixed development, and a high number of pedestrian/vehicle
conflicts. Grade separated pedestrian crossing facilities must be located on mobility corridors and near
pedestrian intensive land uses. Mysore is a heritage city and hence, the available options for types of
pedestrian crossings that can be developed are:
1) Zebra Crossing
2) Special Signals consisting of electric lamps or light – emitting diode
3) Subways
4) Special Signals and Markings for pedestrian movement and to stop vehicles in the way of foot
traffic
5) Pedestrian refuges
6) Pelican Crossings
Pedestrian Crossing as shown in Figure 3.10.
Figure 3.10 Pedestrian Crossing Design
Considering the available options and requirements at various locations in the city, the proposed
location and type of pedestrian crossing to be used are discussed in Error! Reference source not found..
3.6.4 Traffic Calming
For speed reduction of vehicular traffic for increasing the safety of pedestrians, traffic calming should be
used. Traffic calming is a technique where engineering measures are used to reduce speeds and
volumes of motor vehicle traffic in local areas. Although it is commonly associated with local roads,
some measures can be adopted on roads higher in the hierarchy where the danger to pedestrians may
be greater.
Traffic calming generally requires the physical diversion of a moving vehicle horizontally or vertically,
sometimes accompanied by measures that have a psychological effect on drivers, encouraging them to
reduce their speed voluntarily. The technique has an important role to play in reducing the speed of
traffic and creates better environment for pedestrians, cyclists and other non motorized vehicles. It
reduces the accident and associated severities. In this regard an area wise approach should be used and
possible measures as suggested below could be adopted:
• Speed breakers or humps
Comprehensive Traffic and Transportation Plan – Mysore, Karnataka, India
Final Report – Volume 2 P a g e | 131
• Speed cushions
• speed tables
• Rumble strips
• Entry treatments
• Road narrowing or chicanes
• Pedestrian facilities
• Landscaping and environmental features
• Speed limit signs
• Mini roundabouts
• Road closures
• Mid-block kerb extensions
• Intersection kerb extensions
3.7 Road Safety Awareness Programme
Road Safety is about engineering, education, enforcement, emergency and encouragement. With the
engineering and enforcement measures being improved it is also important to improve the road safety
awareness amongst the road users. Road safety campaigns are most likely to be successful if advertising
is only one element in a total campaign, with specific tasks to be undertaken. Usually, behavioural
changes will not be among the outcomes that can be accomplished by the campaign by itself. Road
safety mass media campaigns can achieve, and have achieved, the following:
• An increased awareness of a problem or behaviour;
• A raise in the level of information about a topic or issue;
• Help in the formation of beliefs, especially, where beliefs are not held formally;
• The establishment of a topic as more salient;
• Sensitization of the audience to other forms of communication
Mysore Traffic Police celebrates the Road Safety Week and has regular activities to spread the message
of road safety. The schools, colleges, NGOs, and CBOs have to be regularly involved in the road safety
activity. Road Crossing events, painting competitions, slogan writing competitions etc should be
organized to spread the importance of safety.
3.8 Freight Management Strategy
Freight transport management includes various strategies of increasing the efficiency of freight and
commercial transport. Measures like restricted delivery time in central business district and important
corridors for freight movement.
A truck terminal can be planned at the Race Course which would accommodate this informal setup of
truck stands. These trucks should be restricted for use within the city. The entry of trucks in the heritage
core should be completely banned at any time during the day.
Other measures that should be taken are:
Comprehensive Traffic and Transportation Plan – Mysore, Karnataka, India
Final Report – Volume 2 P a g e | 132
a. Encourage use of small and medium size vehicles. The advantage of using these would be to
minimize the impact of large freight vehicles in the city area
b. Rationalize delivery systems so fewer trips are needed to distribute goods
c. Change of delivery times to reduce congestion
d. Have a central authority which regulates the freight operations
The APMC Yard is at Bandipalya, Mysore. The area of the yard is 159 Acres. It deals with primarily
agriculture products. It has four gates. 2 gate on Ooty road, 1 gate on Uttanahalli and 1 gate on
Nandipalya. At APMC 79% of the trips are from within the state while 21% of the trips are inter – state
trips. Maximum trucks come from Raichur, Gulbarga, Hassan etc. Total number of lorries coming per day
is 100. Average number of trucks from one location is 5 – 10 with permissible weight of Trucks is 10 – 15
tonnes. The morning and evening peak hours is from 5.00 a.m to 6.00 a.m. and 10 p.m – 11.00 p.m
respectively. The access roads at each of the 4 gates mentioned above are 2 lane divided road. With the
expansion of APMC Yard, it would be necessary to widen the access roads.
3.9 Traffic Management Strategies
Traffic Management Strategies are classified under the following sub-heads:
• Intersection Improvements
• Area Traffic Control Systems
• Traffic Management Measures
• Safety Measures
• Parking Management Measures
3.9.1 Intersection Improvements
Intersections are the major sources of bottlenecks in the transportation system. Depending on the
volume of traffic and the topography of the intersection, it is important to decide the kind of
intersection to be developed. Intersections that satisfy the IRC traffic signal warrants must be installed
preferably with demand responsive traffic signals. As traffic delays continue to increase at intersections,
the following traffic management measures must be considered before any major improvements.
• Reduction of number of phases
• Restriction of right turns. The restricted right turn traffic must suitably be rerouted through
indirect right turns or U – turns etc.
• Widening the intersection mouth to increase the approach capacity
• Coordinating traffic signals on adjacent intersections using ITS
• Installation of medians and closing the cross street to divert traffic to other high capacity
intersections if feasible
• Improving one way rule
The saturation flow for each intersection need to be studied and based on it a detailed proposal needs
to be drafted. Often a intersection problem gets solved by synchronization of traffic signals in the
corridor.
Some intersections that need improvement are listed below and shown in the Figure. A detailed
engineering study should be conducted for each of the intersection to come up with specific design
solutions. The intersections are:
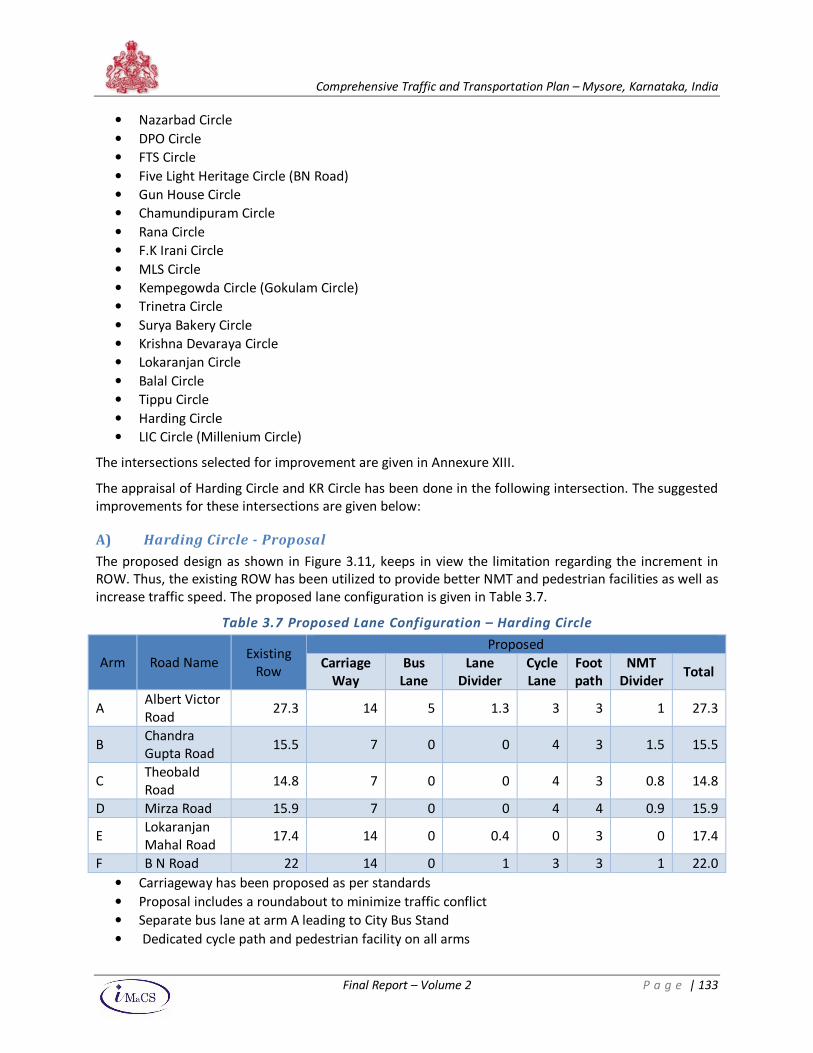
Comprehensive Traffic and Transportation Plan – Mysore, Karnataka, India
Final Report – Volume 2 P a g e | 133
• Nazarbad Circle
• DPO Circle
• FTS Circle
• Five Light Heritage Circle (BN Road)
• Gun House Circle
• Chamundipuram Circle
• Rana Circle
• F.K Irani Circle
• MLS Circle
• Kempegowda Circle (Gokulam Circle)
• Trinetra Circle
• Surya Bakery Circle
• Krishna Devaraya Circle
• Lokaranjan Circle
• Balal Circle
• Tippu Circle
• Harding Circle
• LIC Circle (Millenium Circle)
The intersections selected for improvement are given in Annexure XIII.
The appraisal of Harding Circle and KR Circle has been done in the following intersection. The suggested
improvements for these intersections are given below:
A) Harding Circle - Proposal
The proposed design as shown in Figure 3.11, keeps in view the limitation regarding the increment in
ROW. Thus, the existing ROW has been utilized to provide better NMT and pedestrian facilities as well as
increase traffic speed. The proposed lane configuration is given in Table 3.7.
Table 3.7 Proposed Lane Configuration – Harding Circle
• Carriageway has been proposed as per standards
• Proposal includes a roundabout to minimize traffic conflict
• Separate bus lane at arm A leading to City Bus Stand
• Dedicated cycle path and pedestrian facility on all arms
Arm Road Name Existing
Row
Proposed
Carriage
Way
Bus
Lane
Lane
Divider
Cycle
Lane
Foot
path
NMT
Divider Total
A Albert Victor
Road 27.3 14 5 1.3 3 3 1 27.3
B Chandra
Gupta Road 15.5 7 0 0 4 3 1.5 15.5
C Theobald
Road 14.8 7 0 0 4 3 0.8 14.8
D Mirza Road 15.9 7 0 0 4 4 0.9 15.9
E Lokaranjan
Mahal Road 17.4 14 0 0.4 0 3 0 17.4
F B N Road 22 14 0 1 3 3 1 22.0
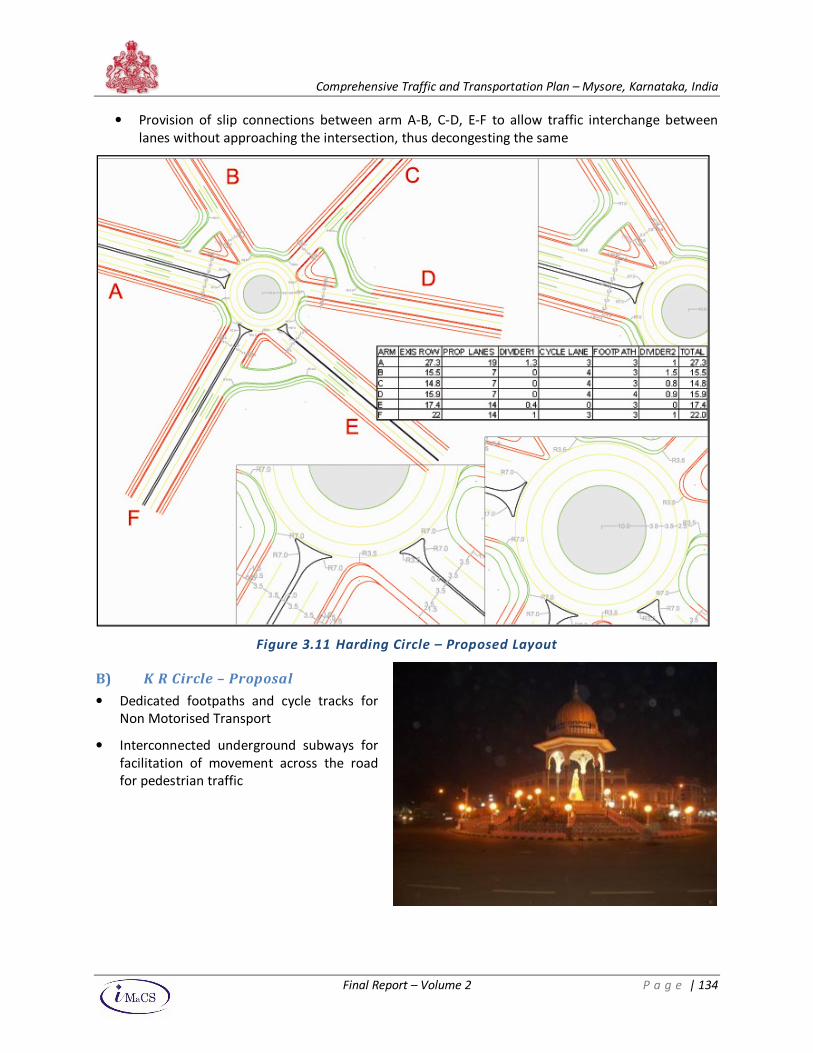
Comprehensive Traffic and Transportation Plan – Mysore, Karnataka, India
Final Report – Volume 2 P a g e | 134
• Provision of slip connections between arm A-B, C-D, E-F to allow traffic interchange between
lanes without approaching the intersection, thus decongesting the same
Figure 3.11 Harding Circle – Proposed Layout
B) K R Circle – Proposal
• Dedicated footpaths and cycle tracks for
Non Motorised Transport
• Interconnected underground subways for
facilitation of movement across the road
for pedestrian traffic
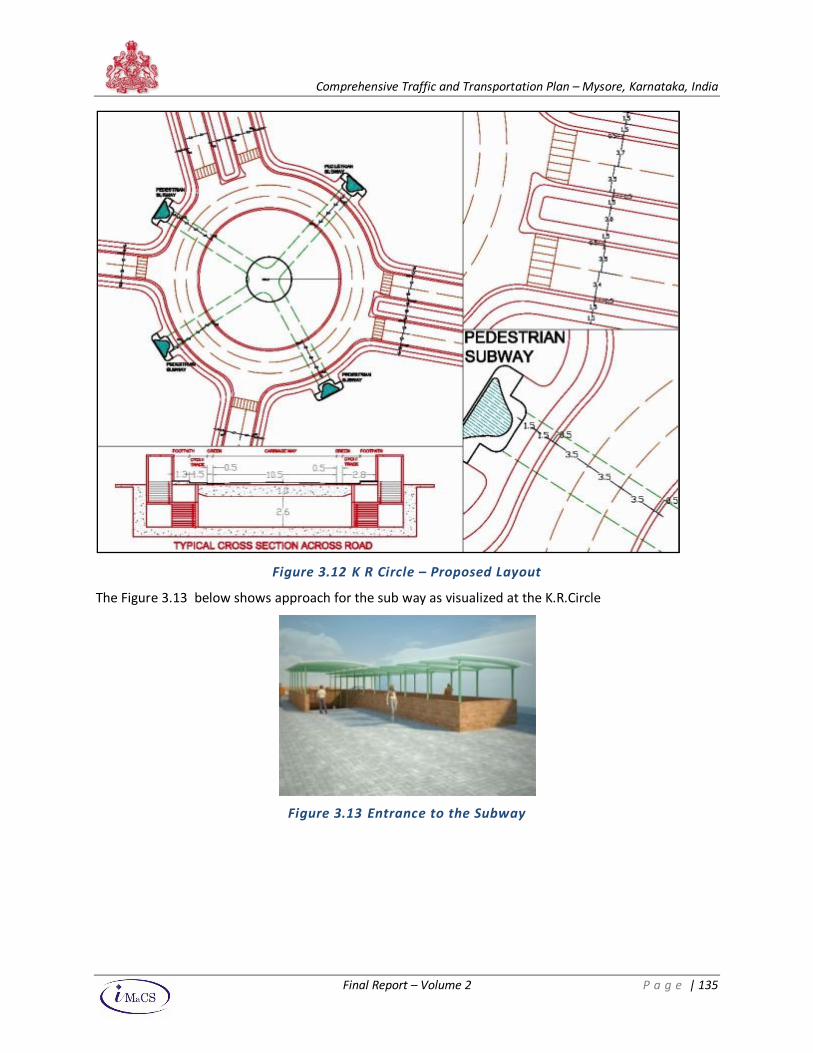
Comprehensive Traffic and Transportation Plan – Mysore, Karnataka, India
Final Report – Volume 2 P a g e | 135
Figure 3.12 K R Circle – Proposed Layout
The Figure 3.13 below shows approach for the sub way as visualized at the K.R.Circle
Figure 3.13 Entrance to the Subway
Comprehensive Traffic and Transportation Plan – Mysore, Karnataka, India
Final Report – Volume 2 P a g e | 136
3.9.2 Signal Coordination and Optimization
Traffic Signals have been installed at some of the intersections in Mysore. Some of them are not
functioning presently. Some of the intersections that need to be signalized are listed below.
• Harding Circle
• Akashwani Circle
• Teresian College Circle
• Nazarbad Intersection
When properly used, traffic control signals are valuable devices for the control of both vehicular and
pedestrian traffic. They assign the right of way to the various traffic movements and thereby profoundly
influence traffic flow. Traffic control signals that area properly designed, located, operated and
maintained will have many advantages. Traffic signal types, spacing, phasing, offsets should be
optimized for all modes of traffic on the corridors to ensure a speedy throughput. Where possible
actuated (demand response) traffic signals must be provided.
3.9.3 Pavement Markings and Signage
In general, it was observed that the traffic signs are not of much use in Mysore. It is recommended that
proper signs be installed at appropriate locations. Road signs are classified into three categories.
Mandatory / regulatory signs, cautionary / warning signs and informatory signs. It is recommended that
signs near schools should be installed on priority basis. Traffic control facilities such as: Center Line,
Traffic lane lines, Stop lines, Pedestrian zebra crossing, Kerb markings for visibility, obstruction marking
etc. must be provided keeping in view all users of the road and especially for night time driving. All the
traffic signs should be facilitated as per the guidelines provided in IRC publication 67 – 2001.
3.9.4 Traffic flow Management Measures
The inventory of the roads undertaken revealed that road space allocation on some roads do not allow
any major restructuring. The ROW range from 10 – 48 meters. In such a situation certain traffic
management measures need to be adopted to allow smooth operation of traffic. The areas that need
special focus in abating the current situation that they are facing certain traffic management measures
may be adopted, after careful analysis/ study of the following areas.
• Church Road
• Palace Road
• Sayaji Rao Road
• JLB Road
• Ashoka Road
• Nazarbad Road
• Lalit Mahal Road
Ensuring smooth traffic movements in such situations can only be achieved through the integrated
application of traffic management techniques like segregations, pedestrianization, one way street
systems etc. Details regarding measures that can be adopted for these core areas are given below.
• One way of Irwin Road
• Restriction of Goods movement on Sayaji Rao Road
• One way of Nazarbad Road
• Road improvement between Karanji lake and Zoo, Harding Circle and Big Bazar.
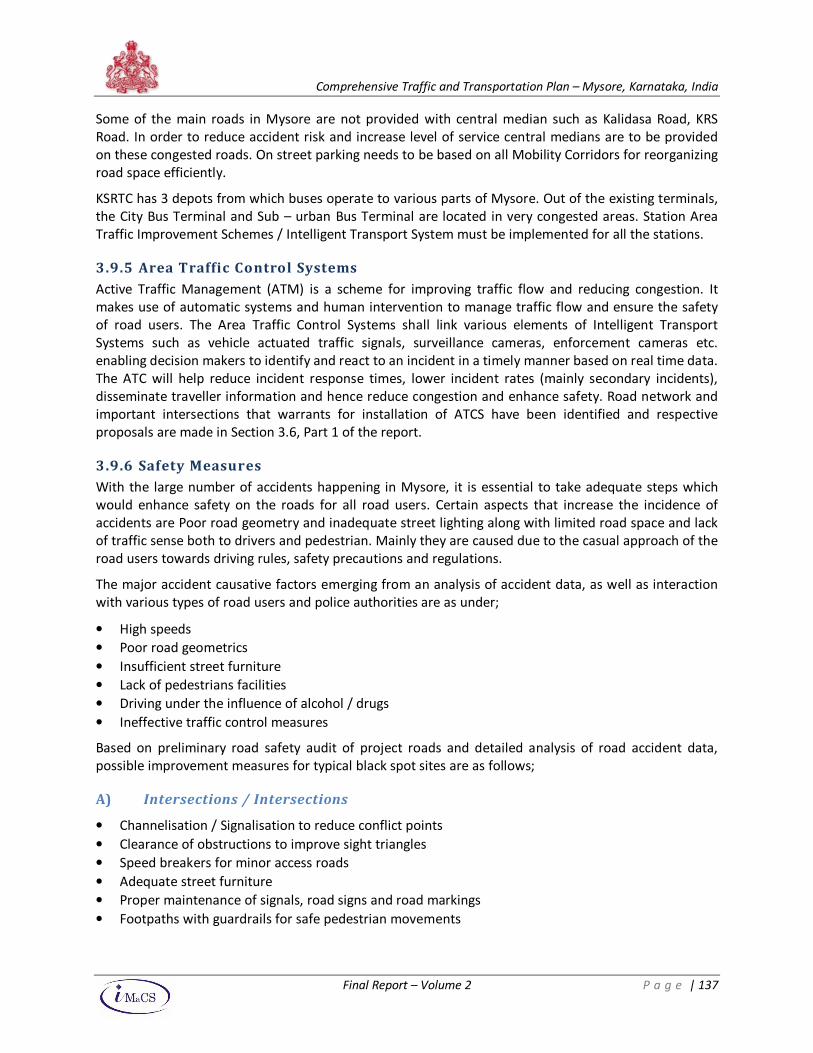
Comprehensive Traffic and Transportation Plan – Mysore, Karnataka, India
Final Report – Volume 2 P a g e | 137
Some of the main roads in Mysore are not provided with central median such as Kalidasa Road, KRS
Road. In order to reduce accident risk and increase level of service central medians are to be provided
on these congested roads. On street parking needs to be based on all Mobility Corridors for reorganizing
road space efficiently.
KSRTC has 3 depots from which buses operate to various parts of Mysore. Out of the existing terminals,
the City Bus Terminal and Sub – urban Bus Terminal are located in very congested areas. Station Area
Traffic Improvement Schemes / Intelligent Transport System must be implemented for all the stations.
3.9.5 Area Traffic Control Systems
Active Traffic Management (ATM) is a scheme for improving traffic flow and reducing congestion. It
makes use of automatic systems and human intervention to manage traffic flow and ensure the safety
of road users. The Area Traffic Control Systems shall link various elements of Intelligent Transport
Systems such as vehicle actuated traffic signals, surveillance cameras, enforcement cameras etc.
enabling decision makers to identify and react to an incident in a timely manner based on real time data.
The ATC will help reduce incident response times, lower incident rates (mainly secondary incidents),
disseminate traveller information and hence reduce congestion and enhance safety. Road network and
important intersections that warrants for installation of ATCS have been identified and respective
proposals are made in Section 3.6, Part 1 of the report.
3.9.6 Safety Measures
With the large number of accidents happening in Mysore, it is essential to take adequate steps which
would enhance safety on the roads for all road users. Certain aspects that increase the incidence of
accidents are Poor road geometry and inadequate street lighting along with limited road space and lack
of traffic sense both to drivers and pedestrian. Mainly they are caused due to the casual approach of the
road users towards driving rules, safety precautions and regulations.
The major accident causative factors emerging from an analysis of accident data, as well as interaction
with various types of road users and police authorities are as under;
• High speeds
• Poor road geometrics
• Insufficient street furniture
• Lack of pedestrians facilities
• Driving under the influence of alcohol / drugs
• Ineffective traffic control measures
Based on preliminary road safety audit of project roads and detailed analysis of road accident data,
possible improvement measures for typical black spot sites are as follows;
A) Intersections / Intersections
• Channelisation / Signalisation to reduce conflict points
• Clearance of obstructions to improve sight triangles
• Speed breakers for minor access roads
• Adequate street furniture
• Proper maintenance of signals, road signs and road markings
• Footpaths with guardrails for safe pedestrian movements
Comprehensive Traffic and Transportation Plan – Mysore, Karnataka, India
Final Report – Volume 2 P a g e | 138
B) Road links / mid blocks
• Widening of road network with central medians
• Provision of adequate hard shoulders for traffic segregation
• Lane markings, road edge markings with retro reflective paints
• Forgiving road side objects
• Provision of adequate street lighting
• Narrow bridges
• Widening of narrow culverts / bridges to roadway width
• Painting parapet walls / railings by retro reflective paintings at frequent intervals
• Raised footpaths and physically segregated bicycle paths
• Railway Level Crossings
• Provision of R O B / R U B
• Level crossings with electronic gates and adequate warnings and speed breakers
• Provision of sufficient illumination
C) Sharp curves
• Realignment of curves by improving the radii
• Provision of adequate super elevation and extra widening
D) Urban areas
• Provision of pedestrian footpath with guardrails
• Provision of pelican signals and raised pedestrian crossings
• Provision of adequate off-street parking to avoid on-street parking
• Provision of bus bays, truck lay byes and loading and unloading areas
• Provision of adequate street lighting
E) Traffic control and management measures
• Installation of adequate retro-reflective traffic signs and markings
• Provision of object / obstruction markings and delineators with reflectors
• Provision of bypasses at major settlements
• Traffic control, regulation and management devices
F) Enforcement measures
• Training for enforcement personnel for efficient enforcement
• Speed control by road signs, traffic calming measures and enforcement measures
• Helmets for two wheelers to be made mandatory to avoid casualties
• Seat belts for cars to be made mandatory to avoid casualties
• Parking control on streets to retain capacity for traffic movement
• Driving under the influence of alcohol and drugs should be strictly controlled.
Table 3.8 below shows the prominent accident locations in Mysore, Reasons of accidents and proposed
improvement measures.
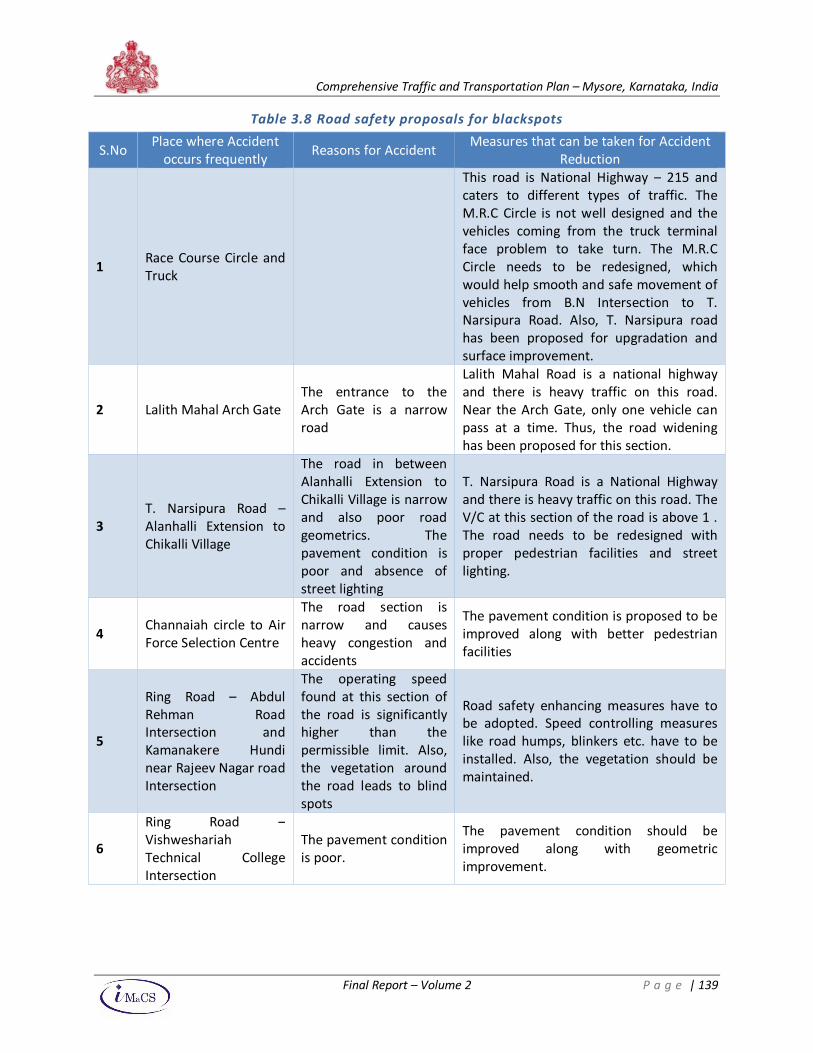
Comprehensive Traffic and Transportation Plan – Mysore, Karnataka, India
Final Report – Volume 2 P a g e | 139
Table 3.8 Road safety proposals for blackspots
S.No Place where Accident
occurs frequently Reasons for Accident
Measures that can be taken for Accident
Reduction
1 Race Course Circle and
Truck
This road is National Highway – 215 and
caters to different types of traffic. The
M.R.C Circle is not well designed and the
vehicles coming from the truck terminal
face problem to take turn. The M.R.C
Circle needs to be redesigned, which
would help smooth and safe movement of
vehicles from B.N Intersection to T.
Narsipura Road. Also, T. Narsipura road
has been proposed for upgradation and
surface improvement.
2 Lalith Mahal Arch Gate
The entrance to the
Arch Gate is a narrow
road
Lalith Mahal Road is a national highway
and there is heavy traffic on this road.
Near the Arch Gate, only one vehicle can
pass at a time. Thus, the road widening
has been proposed for this section.
3
T. Narsipura Road –
Alanhalli Extension to
Chikalli Village
The road in between
Alanhalli Extension to
Chikalli Village is narrow
and also poor road
geometrics. The
pavement condition is
poor and absence of
street lighting
T. Narsipura Road is a National Highway
and there is heavy traffic on this road. The
V/C at this section of the road is above 1 .
The road needs to be redesigned with
proper pedestrian facilities and street
lighting.
4 Channaiah circle to Air
Force Selection Centre
The road section is
narrow and causes
heavy congestion and
accidents
The pavement condition is proposed to be
improved along with better pedestrian
facilities
5
Ring Road – Abdul
Rehman Road
Intersection and
Kamanakere Hundi
near Rajeev Nagar road
Intersection
The operating speed
found at this section of
the road is significantly
higher than the
permissible limit. Also,
the vegetation around
the road leads to blind
spots
Road safety enhancing measures have to
be adopted. Speed controlling measures
like road humps, blinkers etc. have to be
installed. Also, the vegetation should be
maintained.
6
Ring Road –
Vishweshariah
Technical College
Intersection
The pavement condition
is poor.
The pavement condition should be
improved along with geometric
improvement.
Comprehensive Traffic and Transportation Plan – Mysore, Karnataka, India
Final Report – Volume 2 P a g e | 140
3.9.7 Parking Management Plan
As part of the principles upon which the CTTP is being developed it is envisaged that strategic parking
lots would be developed and integrated with the CTTP elements. The parking structures, either isolated
or integrated with the public transport terminals, should meet some or all of the following requirements
before implementation:
• The parking lots must discourage other commercial uses in the same premises
• The parking must facilitate public transport
• The parking must facilitate non – motorized transport
• The parking lots should improve off – set removal of on – street parking
• The parking lot should improve the traffic circulation of the vicinity
The parking survey shows at commercial areas the percentage of long term parking varies from 40 – 60%
indicating the large number of vehicles parked of shop owners and their employees. This leaves very
little space for the visitors, thus resulting in spill over of parking in the bye lanes and restricted areas.
Measures like car pooling, public transport connectivity in peak hours to be used to reduce usage of
private vehicles.
The central core has become congested due to the commercial areas around it at Devaraja Urs market,
Lansdowne Building etc. and there is an intermixing of daily traffic, commercial traffic and tourists’
traffic adding to the congestion. Moreover, there is no space around this area for organized parking and
all the roads and street are occupied by on-street parked vehicles and tongas. The city bus stand is
operating from just beside the palace, adding to the congestion. A multi level car parking can be
developed at Town Hall, Zoo, Palace.
There are many parks and open spaces around the palace area, but at present they are not well
maintained and convey a barren look.
In order to decongest the core area it is proposed to have a multi level car parking to meet the parking
demands and augment the capacity of roads further. The parking lot would be integrated with Public
Transport/NMT facilities in order to access the core area comfortably. The multi level parking lot is
proposed at Dasshera ground, space required for parking will be calculated based on parking demand
required for different horizon years.
The future peak hour parking demand for horizon year 2018 assuming vehicular growth as 6.5% for cars
5.5% for 2 W and 4.0% for 3 – W is given below:
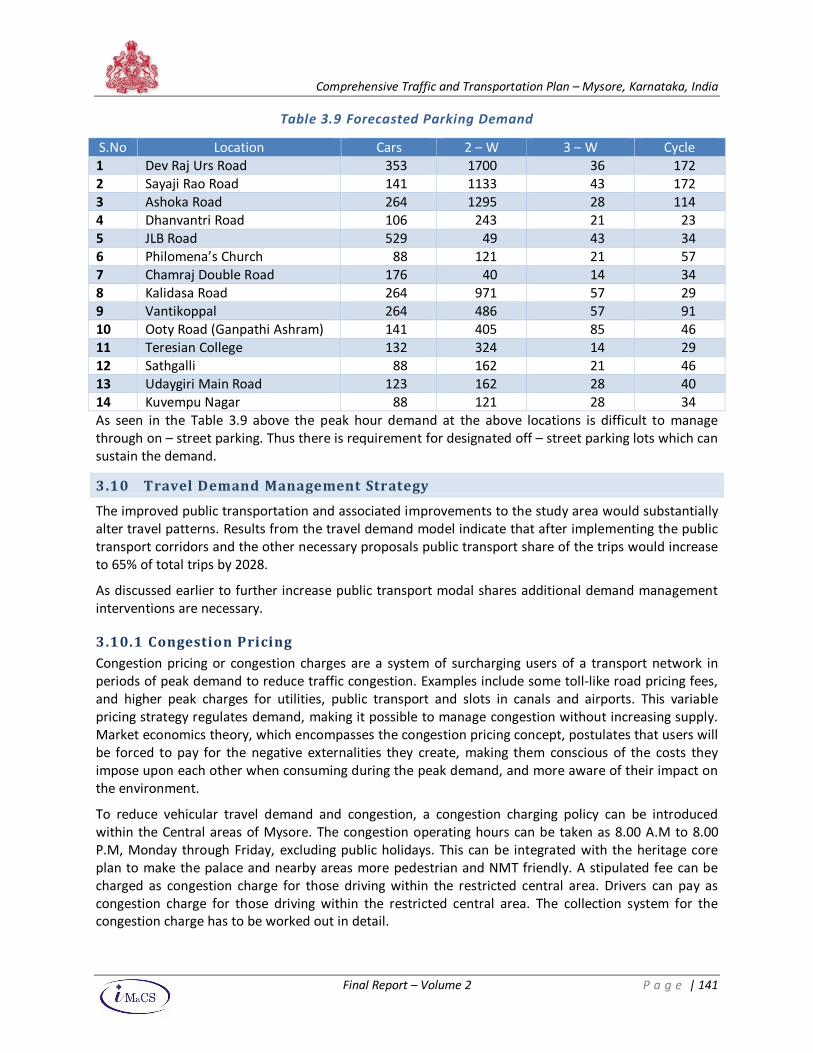
Comprehensive Traffic and Transportation Plan – Mysore, Karnataka, India
Final Report – Volume 2 P a g e | 141
Table 3.9 Forecasted Parking Demand
As seen in the Table 3.9 above the peak hour demand at the above locations is difficult to manage
through on – street parking. Thus there is requirement for designated off – street parking lots which can
sustain the demand.
3.10 Travel Demand Management Strategy
The improved public transportation and associated improvements to the study area would substantially
alter travel patterns. Results from the travel demand model indicate that after implementing the public
transport corridors and the other necessary proposals public transport share of the trips would increase
to 65% of total trips by 2028.
As discussed earlier to further increase public transport modal shares additional demand management
interventions are necessary.
3.10.1 Congestion Pricing
Congestion pricing or congestion charges are a system of surcharging users of a transport network in
periods of peak demand to reduce traffic congestion. Examples include some toll-like road pricing fees,
and higher peak charges for utilities, public transport and slots in canals and airports. This variable
pricing strategy regulates demand, making it possible to manage congestion without increasing supply.
Market economics theory, which encompasses the congestion pricing concept, postulates that users will
be forced to pay for the negative externalities they create, making them conscious of the costs they
impose upon each other when consuming during the peak demand, and more aware of their impact on
the environment.
To reduce vehicular travel demand and congestion, a congestion charging policy can be introduced
within the Central areas of Mysore. The congestion operating hours can be taken as 8.00 A.M to 8.00
P.M, Monday through Friday, excluding public holidays. This can be integrated with the heritage core
plan to make the palace and nearby areas more pedestrian and NMT friendly. A stipulated fee can be
charged as congestion charge for those driving within the restricted central area. Drivers can pay as
congestion charge for those driving within the restricted central area. The collection system for the
congestion charge has to be worked out in detail.
S.No Location Cars 2 – W 3 – W Cycle
1 Dev Raj Urs Road 353 1700 36 172
2 Sayaji Rao Road 141 1133 43 172
3 Ashoka Road 264 1295 28 114
4 Dhanvantri Road 106 243 21 23
5 JLB Road 529 49 43 34
6 Philomena’s Church 88 121 21 57
7 Chamraj Double Road 176 40 14 34
8 Kalidasa Road 264 971 57 29
9 Vantikoppal 264 486 57 91
10 Ooty Road (Ganpathi Ashram) 141 405 85 46
11 Teresian College 132 324 14 29
12 Sathgalli 88 162 21 46
13 Udaygiri Main Road 123 162 28 40
14 Kuvempu Nagar 88 121 28 34
Comprehensive Traffic and Transportation Plan – Mysore, Karnataka, India
Final Report – Volume 2 P a g e | 142
A number of video cameras need to be installed to scan the rear license plates of the motorists who
enter the restricted central area daily. This information will be matched each night with the database.
Anyone who has failed to pay the charges will be fined. With the improved pubic and non – motorized
transport, land use interventions, parking and congestion pricing the study area can expect a public
transport share of about 60% fulfilling the vision of the CTTP.
3.10.2 Parking Control
This can include restrictions on vehicle traffic, in congested areas and at peak times. Such schemes
include car free streets, cordon controls on entering a particular area and odd/ even schemes and
variations based on number plates. Along with the high entry free for motorized vehicles, safe non
motorized vehicle parking the areas that should be considered for parking control include congested
areas like Ashoka Road, Devraj Urs Road, Palace Road, Sayaji Rao Road, Kalidasa Road. Parking control in
these areas along with the proposed parking lots will also require alternative circulation strategies. A
detailed traffic study must be prepared considering the impacts.
3.10.3 Missing Links
The road network system in Mysore has not grown commensurate to the vehicle growth due to the
inadequacy of road links. Because of the lack of connectivity among important roads, the traffic from all
the roads from all directions has to pass through the Central Business District. This has resulted in traffic
congestion on arterial roads and reduced speeds in the inner parts of the city. As a measure of diverting
traffic from the congested roads and providing access to developing settlements, new link roads have
been proposed.
The missing link roads proposed for construction are discussed in section 3.6, Part 1 of the report.
Other than the roadway infrastructure, there are other complimentary projects / proposals that must be
implemented in tandem to the public transport corridors towards a successful public transport system
that meets the objectives and goals of the transport plan:
• Augmentation and strengthening of feeder service network
• Appropriate vehicle and terminal design
• Safe, faster and convenient pedestrian dispersal system
• Rationalization of existing bus routes in light of the public transport corridors
• Public transport friendly tax structure
• Use of Intelligent Transport System (ITS) technology
• Signal prioritization for public transport vehicles
It is important that the above mentioned actions must not be treated in isolation but a systems
approach to be adopted.
3.10.4 Encroachment and Hawker Management
Many of the roads in Mysore are encroached; these hawker encroachments are hindrance to the
movement of people and also reduction to the capacity of the roadways. The pedestrians are forced to
walk on carriageway at these locations of encroachments, thereby creating hazardous situations for
both themselves and the traffic. In this regard, the Consultants propose that “Hawker Zones” should be
developed. The Heritage Plan also talks about locations where the hawkers would be allowed to operate
from. As mentioned in section 3.5, Part 1 of the report, consultants propose that the existing parking
next to the Palace wall on stretch 2 of the Heritage Trail shall not be used for vehicular parking anymore.
Instead, the area shall be developed as a hawking zone/ informal bazaar.
Comprehensive Traffic and Transportation Plan – Mysore, Karnataka, India
Final Report – Volume 2 P a g e | 143
Accordingly, the Municipal officials in consultations with the traders and the developers of the city have
to come up with a hawking zone plan. Different hawking zones need to be identified and the proposals
have to be enforced stringently.
3.10.5 Education and Enforcement
With the rise in road accidents in Mysore and growing vehicular population, it is imperative to take
some road safety initiatives to improve the safety scenario in Mysore. There are 3 E’s to Road Safety –
Engineering, Education and Enforcement.
Geometric improvement of road intersections, pedestrian facilities and grade separations are attempts
to improve the engineering aspects of the road.
Education programs are largely school – based. The programs usually involve informing and advising
teachers, and they may have specific objectives or be part of a long term development of learning and
ideas. Training programs are mostly targeted at specific types of road user or age group and are
deisgned to develop the practical skills required to use the road network safely.
Also, in Mysore road safety education campaigns can be organized within large employment complex
like Infosys, BEML, JSS College etc. At hospitals short documentary films on road safety can be shown.
Road Safety campaigns are most likely to be successful if advertising is only one element in a total
campaign, with specific tasks to be undertaken. Usually, behavioural changes will not be among the
outcomes that can be accomplished by the campaign by itself. Road safety mass media campaign can
achieve and have achieved the following:
• An increased awareness of a problem or behaviour
• A raise in the level of information about a topic or issue
• Help in the formation of beliefs especially, where beliefs are not held formally
• The establishment of a topic as more salient
• Sensitization of the audience to other forms of communication.
The aforementioned traffic management measures are normally easy to implement, requires no land
acquisition and not costly.
In Mysore, very few people are found to wear helmets. Measures like compulsory helmet wearing, ban
on talking on mobile should be enforced strictly. The Traffic Police should organize road crossing events
for school children.
3.10.6 Road Asset Management Plan
The Road Asset Management Plan is a key document to keep road users informed about the agency’s
management and maintenance practices and activities on Mysore’s road network program.
Mysore’s road network is used daily by thousands of people who expect to travel safely with minimum
delay on roads that are in good condition. The network itself has a high asset value of so it is vital it is
not only well maintained for road users but for economic, social and environmental reasons.
For road users the most visible part of the maintenance process is the roadworks which are necessary to
deliver a safer and more reliable journey but can themselves create delays in the short-term.
Comprehensive Traffic and Transportation Plan – Mysore, Karnataka, India
Final Report – Volume 2 P a g e | 144
Integral to the Programme is the drive for continual improvement in all aspects of Transport Mysore’s
management practices for the trunk road network. This will include:
• Systematically reviewing and updating our asset management practices based on feedback received
and sought from road users, our staff and our suppliers
• Benchmarking Transport Scotland against similar infrastructure organization so to identify where
our current practices can be improved
• Developing our knowledge of new materials and maintenance techniques that may be suitable for
use on the trunk road network
• Critically reviewing the information we hold about the trunk road network, identifying new
information for collection and information that is no longer required.
3.10.7 Use of ITS
The term intelligent transportation system (ITS) refers to efforts to add information and
communications technology to transport infrastructure and vehicles in an effort to manage factors that
typically are at odds with each other, such as vehicles, loads, and routes to improve safety and reduce
vehicle wear, transportation times, and fuel consumption.
Intelligent Transport System comprise of wide range of novel technology tools for managing transport
networks, and providing services for travelers. Collection, processing, integration and supply of real time
information form the core of ITS functions. ITS allow network operators to manage their networks more
efficiently and travelers to make better informed decisions about their journeys.
The core objectives of deploying Intelligent Transport System in the city of Mysore include:
• Providing effective, safe, environmental and commuter friendly solutions to the travelling public
who use KSRTC buses.
• Track and monitor the movement of buses on real time basis to enable communication of the arrival
timings of buses at the bus stops through state of the art GPS/GPRS technologies
• Inform commuters about the bus routes and arrival timings of buses at the bus stops/terminals
through LED Display systems.
• Effective management through a Decision Support system by collecting, collating and storing
information on real time basis about the transport system and its effectiveness using
communication technology.
• Instant access to information related to bus schedules, ETA, ETD, annunciating bus stop names, fare
details, etc at bus stops, bus terminals and within the buses and through SMS, Internet and IVRS.
• Issuing of Passes Daily, Weekly, Monthly for commuters and e-purse facilities through Smart Cards.
• Facilitate timely management of Incidents/Accidents
• Establish meaningful instant two-way interaction facility between Driver and Central Control Station.
• Obtaining on-line real time information on bus operations and management.
• Effective monitoring of breakdowns and the related information.
• Effective diversion of traffic in case of emergency.
• Monitoring accidents and the related aspects.
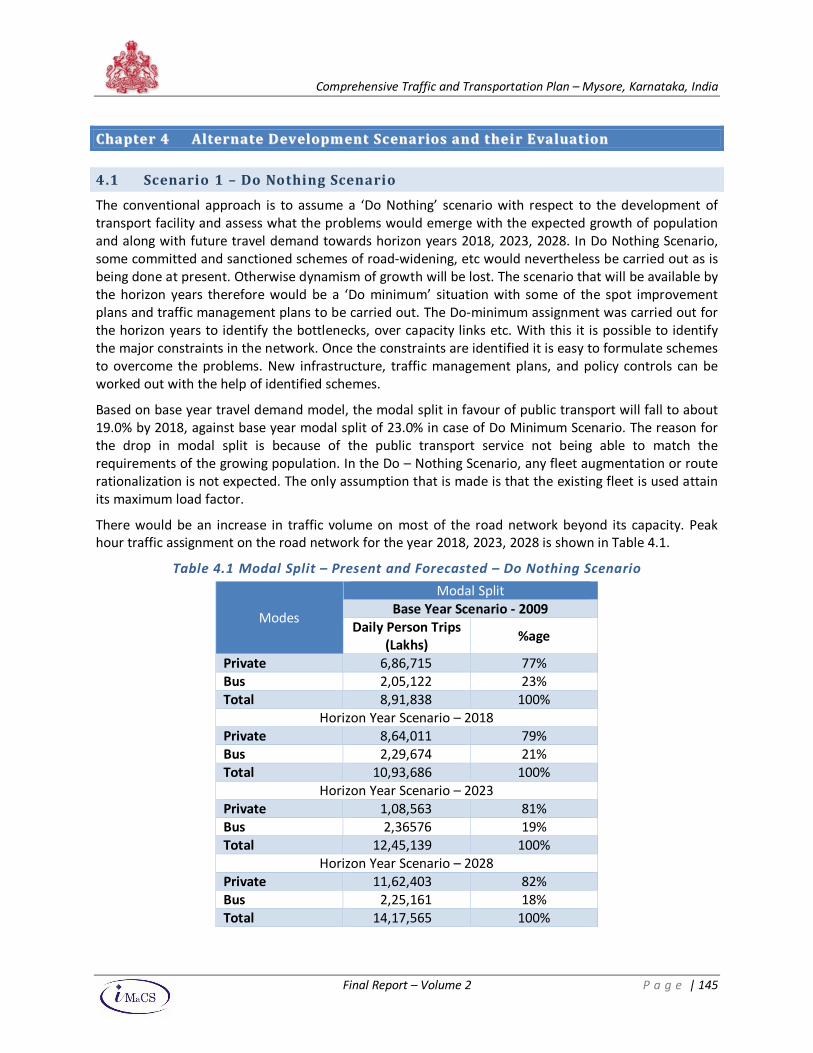
Comprehensive Traffic and Transportation Plan – Mysore, Karnataka, India
Final Report – Volume 2 P a g e | 145
CChhaa pptt ee rr 44 AA lltt eerrnn aa tt ee DD eevv eellooppmm eenn tt SS cc eenn aa rriiooss aa nn dd tt hhee ii rr EE vvaa lluuaa tt iioonn
4.1 Scenario 1 – Do Nothing Scenario
The conventional approach is to assume a ‘Do Nothing’ scenario with respect to the development of
transport facility and assess what the problems would emerge with the expected growth of population
and along with future travel demand towards horizon years 2018, 2023, 2028. In Do Nothing Scenario,
some committed and sanctioned schemes of road-widening, etc would nevertheless be carried out as is
being done at present. Otherwise dynamism of growth will be lost. The scenario that will be available by
the horizon years therefore would be a ‘Do minimum’ situation with some of the spot improvement
plans and traffic management plans to be carried out. The Do-minimum assignment was carried out for
the horizon years to identify the bottlenecks, over capacity links etc. With this it is possible to identify
the major constraints in the network. Once the constraints are identified it is easy to formulate schemes
to overcome the problems. New infrastructure, traffic management plans, and policy controls can be
worked out with the help of identified schemes.
Based on base year travel demand model, the modal split in favour of public transport will fall to about
19.0% by 2018, against base year modal split of 23.0% in case of Do Minimum Scenario. The reason for
the drop in modal split is because of the public transport service not being able to match the
requirements of the growing population. In the Do – Nothing Scenario, any fleet augmentation or route
rationalization is not expected. The only assumption that is made is that the existing fleet is used attain
its maximum load factor.
There would be an increase in traffic volume on most of the road network beyond its capacity. Peak
hour traffic assignment on the road network for the year 2018, 2023, 2028 is shown in Table 4.1.
Table 4.1 Modal Split – Present and Forecasted – Do Nothing Scenario
Modes
Modal Split
Base Year Scenario - 2009
Daily Person Trips
(Lakhs) %age
Private 6,86,715 77%
Bus 2,05,122 23%
Total 8,91,838 100%
Horizon Year Scenario – 2018
Private 8,64,011 79%
Bus 2,29,674 21%
Total 10,93,686 100%
Horizon Year Scenario – 2023
Private 1,08,563 81%
Bus 2,36576 19%
Total 12,45,139 100%
Horizon Year Scenario – 2028
Private 11,62,403 82%
Bus 2,25,161 18%
Total 14,17,565 100%
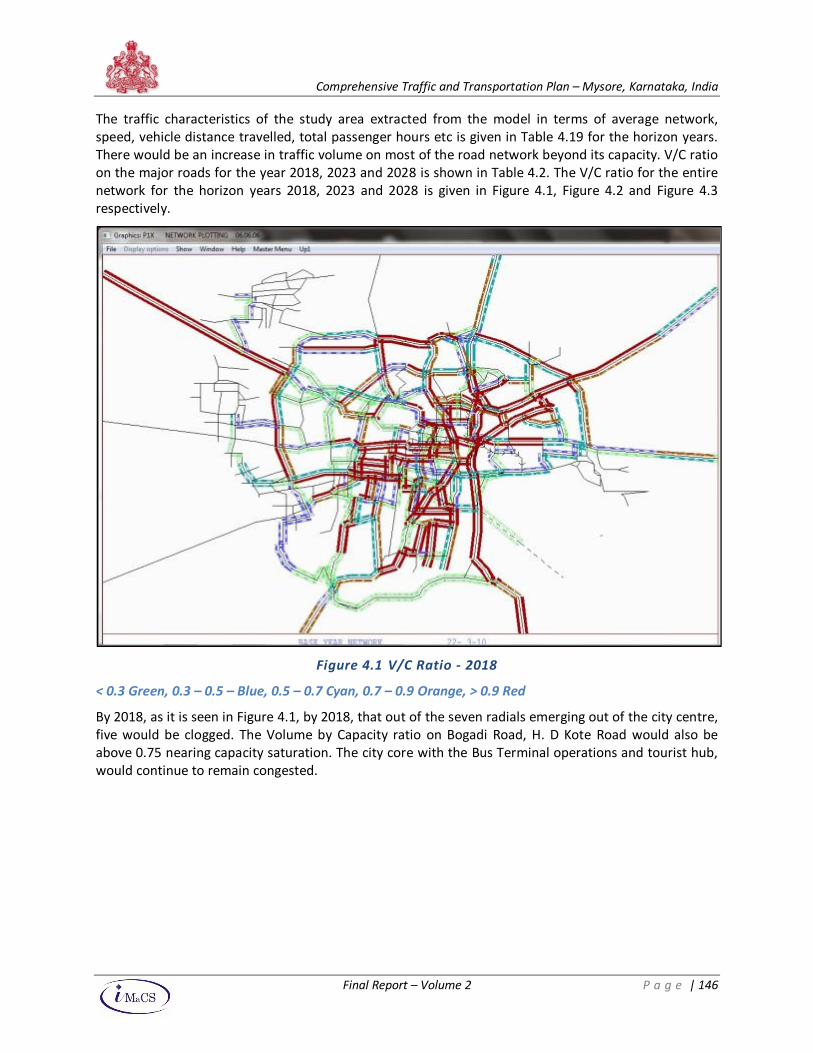
Comprehensive Traffic and Transportation Plan – Mysore, Karnataka, India
Final Report – Volume 2 P a g e | 146
The traffic characteristics of the study area extracted from the model in terms of average network,
speed, vehicle distance travelled, total passenger hours etc is given in Table 4.19 for the horizon years.
There would be an increase in traffic volume on most of the road network beyond its capacity. V/C ratio
on the major roads for the year 2018, 2023 and 2028 is shown in Table 4.2. The V/C ratio for the entire
network for the horizon years 2018, 2023 and 2028 is given in Figure 4.1, Figure 4.2 and Figure 4.3
respectively.
Figure 4.1 V/C Ratio - 2018
< 0.3 Green, 0.3 – 0.5 – Blue, 0.5 – 0.7 Cyan, 0.7 – 0.9 Orange, > 0.9 Red
By 2018, as it is seen in Figure 4.1, by 2018, that out of the seven radials emerging out of the city centre,
five would be clogged. The Volume by Capacity ratio on Bogadi Road, H. D Kote Road would also be
above 0.75 nearing capacity saturation. The city core with the Bus Terminal operations and tourist hub,
would continue to remain congested.
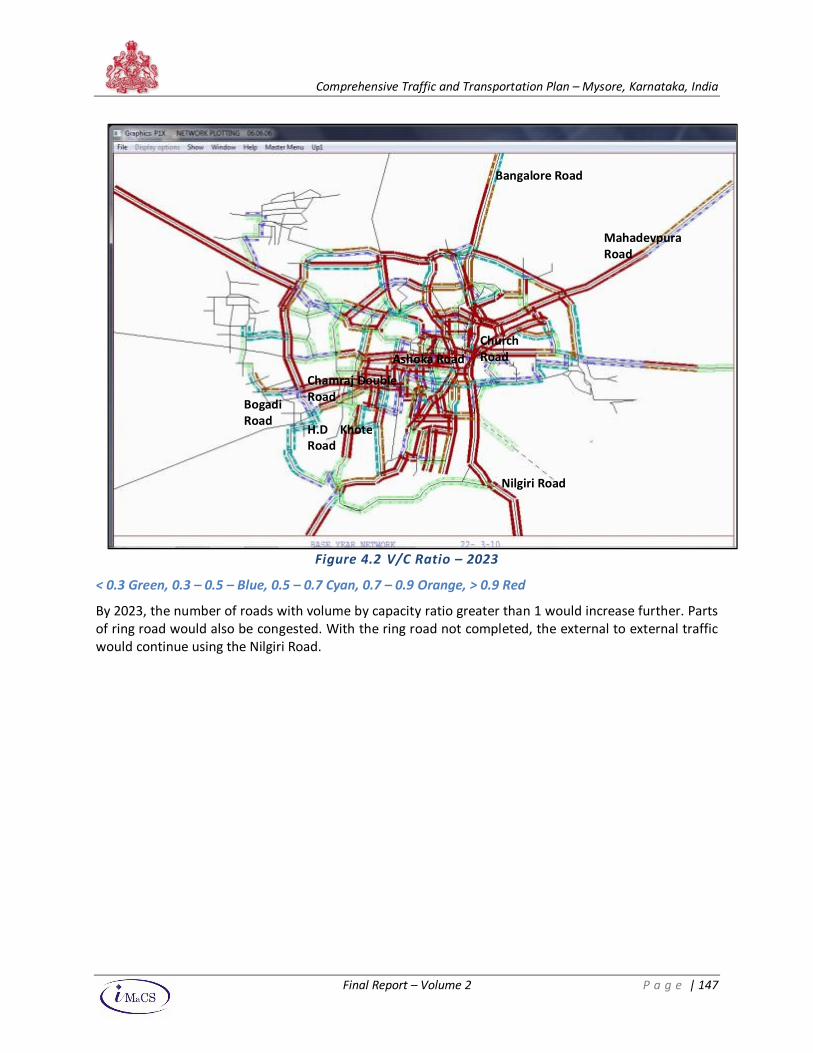
Comprehensive Traffic and Transportation Plan – Mysore, Karnataka, India
Final Report – Volume 2 P a g e | 147
Figure 4.2 V/C Ratio – 2023
< 0.3 Green, 0.3 – 0.5 – Blue, 0.5 – 0.7 Cyan, 0.7 – 0.9 Orange, > 0.9 Red
By 2023, the number of roads with volume by capacity ratio greater than 1 would increase further. Parts
of ring road would also be congested. With the ring road not completed, the external to external traffic
would continue using the Nilgiri Road.
Nilgiri Road
Bogadi
Road
Mahadevpura
Road
H.D Khote
Road
Chamraj Double
Road
Bangalore Road
Ashoka Road
Church
Road
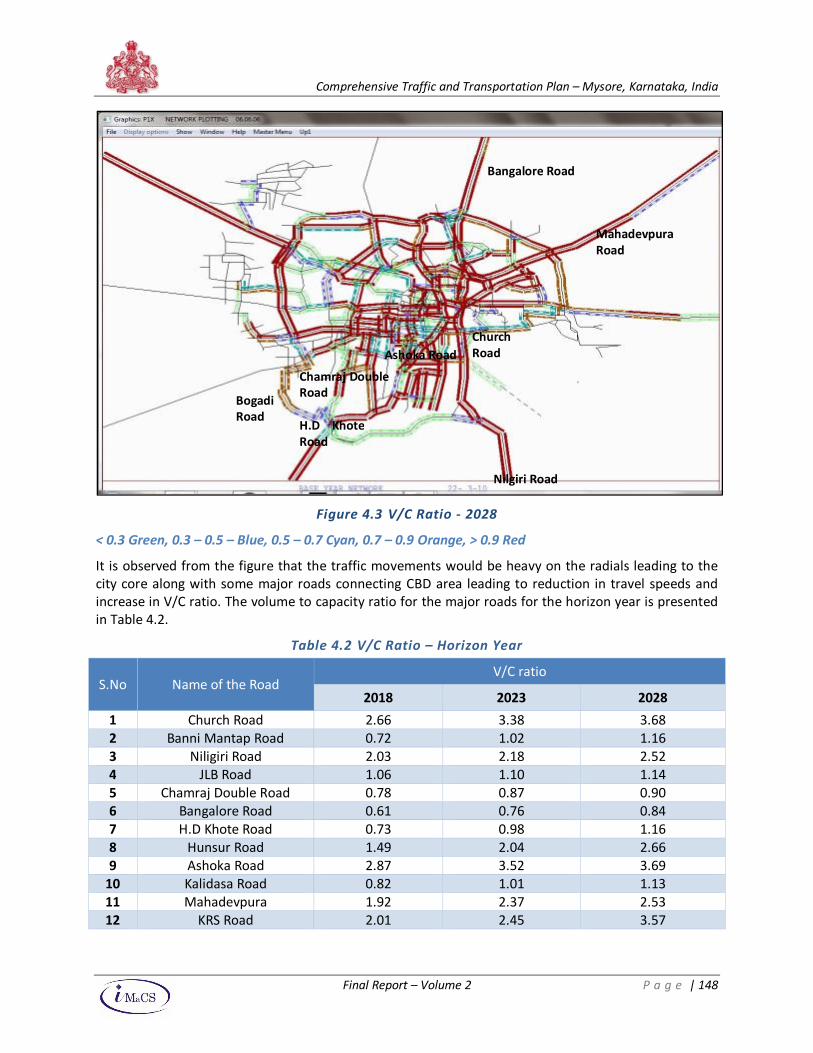
Comprehensive Traffic and Transportation Plan – Mysore, Karnataka, India
Final Report – Volume 2 P a g e | 148
Figure 4.3 V/C Ratio - 2028
< 0.3 Green, 0.3 – 0.5 – Blue, 0.5 – 0.7 Cyan, 0.7 – 0.9 Orange, > 0.9 Red
It is observed from the figure that the traffic movements would be heavy on the radials leading to the
city core along with some major roads connecting CBD area leading to reduction in travel speeds and
increase in V/C ratio. The volume to capacity ratio for the major roads for the horizon year is presented
in Table 4.2.
Table 4.2 V/C Ratio – Horizon Year
S.No Name of the Road V/C ratio
2018 2023 2028
1 Church Road 2.66 3.38 3.68
2 Banni Mantap Road 0.72 1.02 1.16
3 Niligiri Road 2.03 2.18 2.52
4 JLB Road 1.06 1.10 1.14
5 Chamraj Double Road 0.78 0.87 0.90
6 Bangalore Road 0.61 0.76 0.84
7 H.D Khote Road 0.73 0.98 1.16
8 Hunsur Road 1.49 2.04 2.66
9 Ashoka Road 2.87 3.52 3.69
10 Kalidasa Road 0.82 1.01 1.13
11 Mahadevpura 1.92 2.37 2.53
12 KRS Road 2.01 2.45 3.57
Nilgiri Road
Bogadi
Road
Mahadevpura
Road
H.D Khote
Road
Chamraj Double
Road
Bangalore Road
Ashoka Road
Church
Road
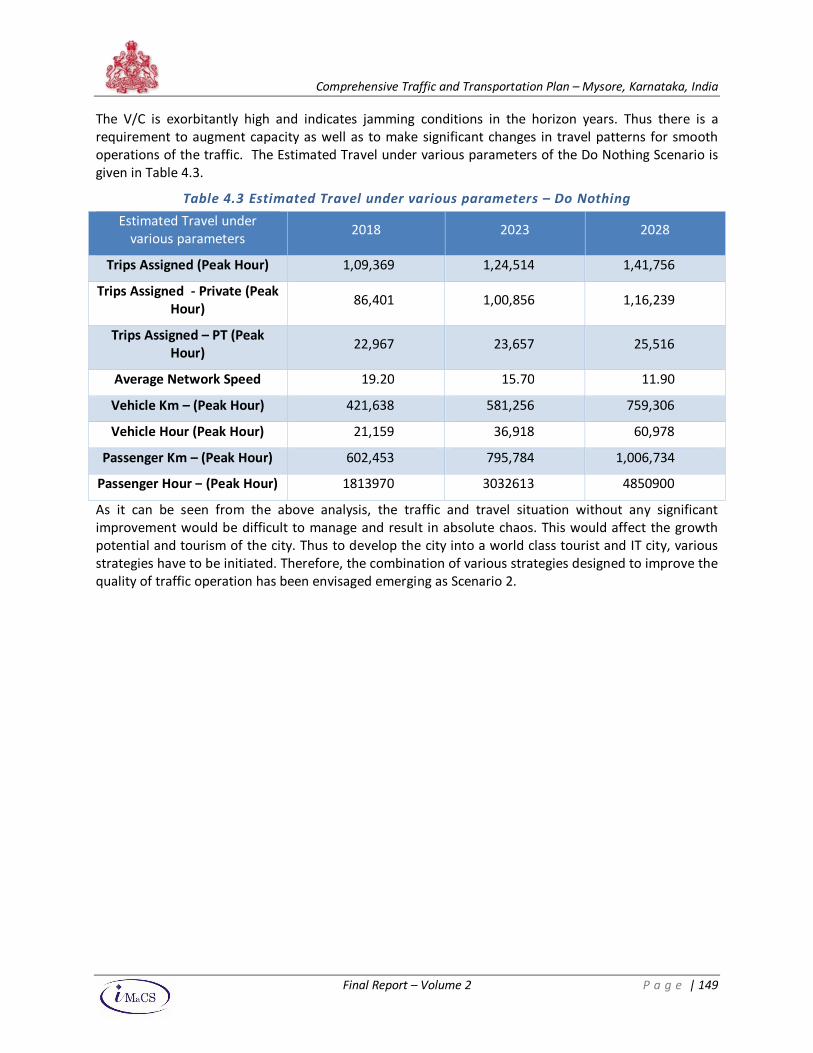
Comprehensive Traffic and Transportation Plan – Mysore, Karnataka, India
Final Report – Volume 2 P a g e | 149
The V/C is exorbitantly high and indicates jamming conditions in the horizon years. Thus there is a
requirement to augment capacity as well as to make significant changes in travel patterns for smooth
operations of the traffic. The Estimated Travel under various parameters of the Do Nothing Scenario is
given in Table 4.3.
Table 4.3 Estimated Travel under various parameters – Do Nothing
Estimated Travel under
various parameters 2018 2023 2028
Trips Assigned (Peak Hour) 1,09,369 1,24,514 1,41,756
Trips Assigned - Private (Peak
Hour) 86,401 1,00,856 1,16,239
Trips Assigned – PT (Peak
Hour) 22,967 23,657 25,516
Average Network Speed 19.20 15.70 11.90
Vehicle Km – (Peak Hour) 421,638 581,256 759,306
Vehicle Hour (Peak Hour) 21,159 36,918 60,978
Passenger Km – (Peak Hour) 602,453 795,784 1,006,734
Passenger Hour – (Peak Hour) 1813970 3032613 4850900
As it can be seen from the above analysis, the traffic and travel situation without any significant
improvement would be difficult to manage and result in absolute chaos. This would affect the growth
potential and tourism of the city. Thus to develop the city into a world class tourist and IT city, various
strategies have to be initiated. Therefore, the combination of various strategies designed to improve the
quality of traffic operation has been envisaged emerging as Scenario 2.
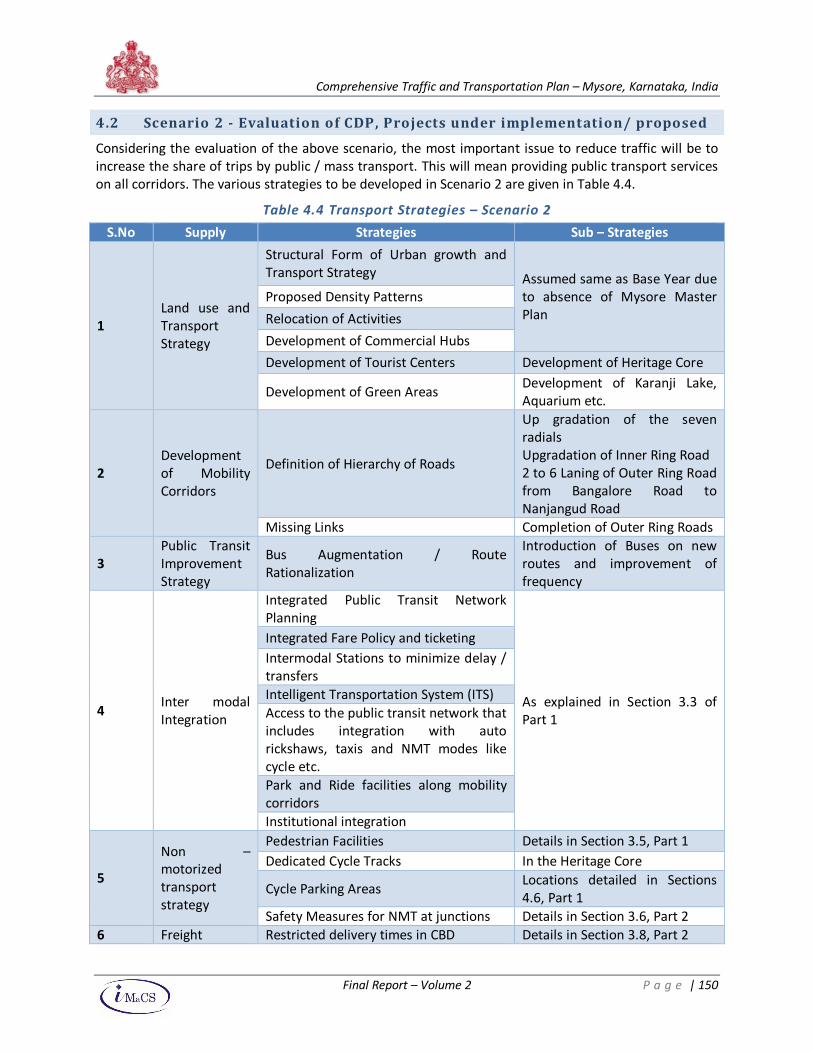
Comprehensive Traffic and Transportation Plan – Mysore, Karnataka, India
Final Report – Volume 2 P a g e | 150
4.2 Scenario 2 - Evaluation of CDP, Projects under implementation/ proposed
Considering the evaluation of the above scenario, the most important issue to reduce traffic will be to
increase the share of trips by public / mass transport. This will mean providing public transport services
on all corridors. The various strategies to be developed in Scenario 2 are given in Table 4.4.
Table 4.4 Transport Strategies – Scenario 2
S.No Supply Strategies Sub – Strategies
1
Land use and
Transport
Strategy
Structural Form of Urban growth and
Transport Strategy Assumed same as Base Year due
to absence of Mysore Master
Plan
Proposed Density Patterns
Relocation of Activities
Development of Commercial Hubs
Development of Tourist Centers Development of Heritage Core
Development of Green Areas Development of Karanji Lake,
Aquarium etc.
2
Development
of Mobility
Corridors
Definition of Hierarchy of Roads
Up gradation of the seven
radials
Upgradation of Inner Ring Road
2 to 6 Laning of Outer Ring Road
from Bangalore Road to
Nanjangud Road
Missing Links Completion of Outer Ring Roads
3
Public Transit
Improvement
Strategy
Bus Augmentation / Route
Rationalization
Introduction of Buses on new
routes and improvement of
frequency
4 Inter modal
Integration
Integrated Public Transit Network
Planning
As explained in Section 3.3 of
Part 1
Integrated Fare Policy and ticketing
Intermodal Stations to minimize delay /
transfers
Intelligent Transportation System (ITS)
Access to the public transit network that
includes integration with auto
rickshaws, taxis and NMT modes like
cycle etc.
Park and Ride facilities along mobility
corridors
Institutional integration
5
Non –
motorized
transport
strategy
Pedestrian Facilities Details in Section 3.5, Part 1
Dedicated Cycle Tracks In the Heritage Core
Cycle Parking Areas Locations detailed in Sections
4.6, Part 1
Safety Measures for NMT at junctions Details in Section 3.6, Part 2
6 Freight Restricted delivery times in CBD Details in Section 3.8, Part 2
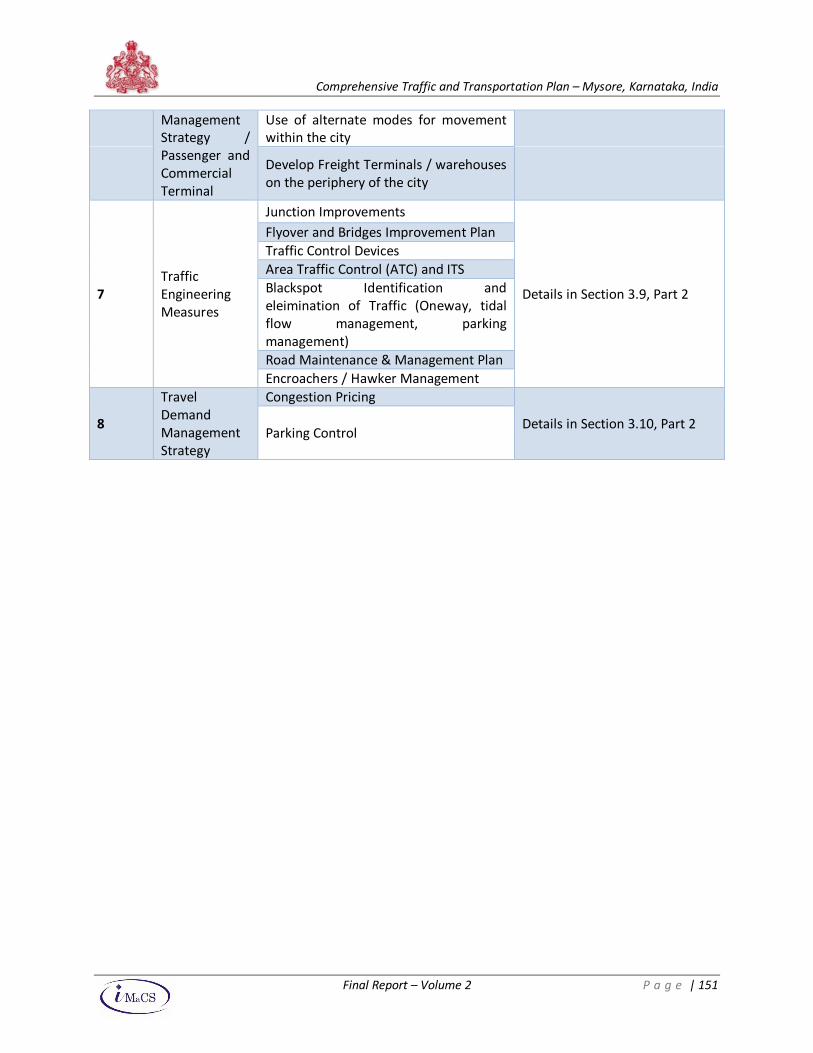
Comprehensive Traffic and Transportation Plan – Mysore, Karnataka, India
Final Report – Volume 2 P a g e | 151
Management
Strategy /
Passenger and
Commercial
Terminal
Use of alternate modes for movement
within the city
Develop Freight Terminals / warehouses
on the periphery of the city
7
Traffic
Engineering
Measures
Junction Improvements
Details in Section 3.9, Part 2
Flyover and Bridges Improvement Plan
Traffic Control Devices
Area Traffic Control (ATC) and ITS
Blackspot Identification and
eleimination of Traffic (Oneway, tidal
flow management, parking
management)
Road Maintenance & Management Plan
Encroachers / Hawker Management
8
Travel
Demand
Management
Strategy
Congestion Pricing
Details in Section 3.10, Part 2 Parking Control
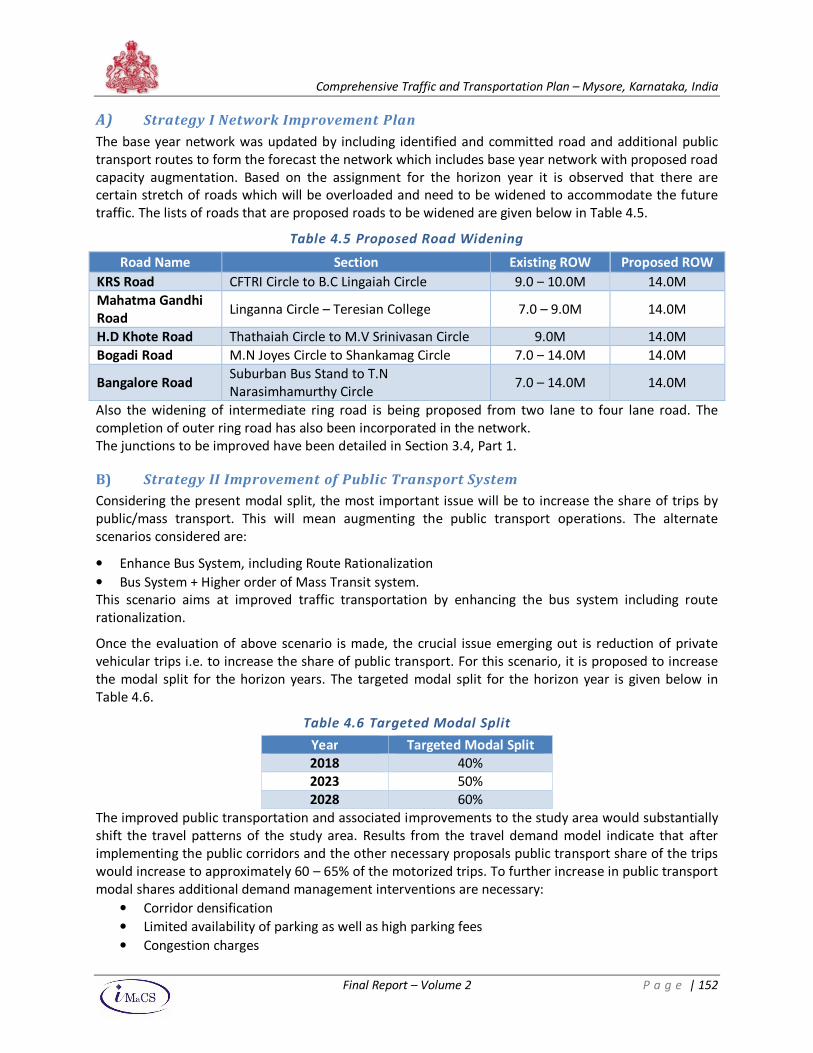
Comprehensive Traffic and Transportation Plan – Mysore, Karnataka, India
Final Report – Volume 2 P a g e | 152
A) Strategy I Network Improvement Plan
The base year network was updated by including identified and committed road and additional public
transport routes to form the forecast the network which includes base year network with proposed road
capacity augmentation. Based on the assignment for the horizon year it is observed that there are
certain stretch of roads which will be overloaded and need to be widened to accommodate the future
traffic. The lists of roads that are proposed roads to be widened are given below in Table 4.5.
Table 4.5 Proposed Road Widening
Road Name Section Existing ROW Proposed ROW
KRS Road CFTRI Circle to B.C Lingaiah Circle 9.0 – 10.0M 14.0M
Mahatma Gandhi
Road Linganna Circle – Teresian College 7.0 – 9.0M 14.0M
H.D Khote Road Thathaiah Circle to M.V Srinivasan Circle 9.0M 14.0M
Bogadi Road M.N Joyes Circle to Shankamag Circle 7.0 – 14.0M 14.0M
Bangalore Road Suburban Bus Stand to T.N
Narasimhamurthy Circle 7.0 – 14.0M 14.0M
Also the widening of intermediate ring road is being proposed from two lane to four lane road. The
completion of outer ring road has also been incorporated in the network.
The junctions to be improved have been detailed in Section 3.4, Part 1.
B) Strategy II Improvement of Public Transport System
Considering the present modal split, the most important issue will be to increase the share of trips by
public/mass transport. This will mean augmenting the public transport operations. The alternate
scenarios considered are:
• Enhance Bus System, including Route Rationalization
• Bus System + Higher order of Mass Transit system.
This scenario aims at improved traffic transportation by enhancing the bus system including route
rationalization.
Once the evaluation of above scenario is made, the crucial issue emerging out is reduction of private
vehicular trips i.e. to increase the share of public transport. For this scenario, it is proposed to increase
the modal split for the horizon years. The targeted modal split for the horizon year is given below in
Table 4.6.
Table 4.6 Targeted Modal Split
Year Targeted Modal Split
2018 40%
2023 50%
2028 60%
The improved public transportation and associated improvements to the study area would substantially
shift the travel patterns of the study area. Results from the travel demand model indicate that after
implementing the public corridors and the other necessary proposals public transport share of the trips
would increase to approximately 60 – 65% of the motorized trips. To further increase in public transport
modal shares additional demand management interventions are necessary:
• Corridor densification
• Limited availability of parking as well as high parking fees
• Congestion charges
Comprehensive Traffic and Transportation Plan – Mysore, Karnataka, India
Final Report – Volume 2 P a g e | 153
Corridor Densification Plan
The Master Plan under preparation must anticipate the increase in value of land due to the public
transport investments and must capture the land value. The Master Plan for the study area must orient
itself towards densifying the proposed public transport corridors and vicinity to improve the ridership.
Consequently, the land use structure and regulations must be corridor based. The Master Plan must
anticipate the increase in value of land due to the public transport investments and must capture the
land value.
Parking Management Plan
Presently most of the roads in Mysore have on street parking. Parking control is important for many
considerations including the following:
• Control the personalized vehicles plying in the system
• Potential to augment and facilitate the public transport corridor ridership
• Loss in the throughput of the adjacent street due to parking interface
• Consolidation of the on – street parking
• Gain / loss of the business of the commercial uses on the street
• Revenue generation potential through parking charges
• Facilitate pedestrianisation policy
C) Strategy III: Development of Mobility Corridors
Functionally, urban roads are classified as Arterial, Sub – arterial, Collector / Distributor and Local
Streets. Functional classification of the urban roads is an important step wherein design and
management of the roadway would be standardized. In Mysore, even though the hierarchy of roads
exist the roads are not maintained according to the required standards. By designating certain roads as
mobility corridors, these corridors get priority for increasing the throughput as well as operating level of
service. Therefore for a mobility corridor increasing the throughput as well as speeds would then be
focused and appropriate solutions have been proposed.
The radial road network would be complemented with circumferential roads to form a radial and ring
pattern of urban network. The circumferential rings have been envisaged in the study area:
The inner ring would utilize the existing sections of the road and encircle the core area. Traffic not
destined to the core area would utilize this ring to bypass the core area thereby relieving congestion in
old city and vicinity.
The intermediate ring road would be the second ring.
The outer ring road along with its completed section would be the third ring. This would help bypassing
the external traffic using the city roads. Mysore caters to a lot of external traffic from Bangalore to Ooty,
Coorg and Tamil Nadu.
These three rings would also be a part of the mobility corridors.
Peak hour traffic assignment on the road network for this scenario for the horizon years 2018, 2023 and
2028 is shown in Figure 4.4, Figure 4.5 and Figure 4.6.
It is observed that there is significant reduction in traffic volume on many roads with increase in
passenger trips on mass transport network. The daily trips assigned in the proposed network for horizon
years are given below in Table 4.7.
Comprehensive Traffic and Transportation Plan – Mysore, Karnataka, India
Final Report – Volume 2 P a g e | 154
D) Strategy IV: Non Motorized Plan
The Non – Motorized Plan in explained in detail in Section 3.6, Part 2. The broad plans are summarized
below:
• Install Footpaths
• Install Pedestrian Grade Separated Facilities
• Install Bi – cycle lanes
• Encourage and Designate Pedestrianisation in Core Area
E) Strategy V: Passenger and Commercial Terminal Plan
Bus Terminals
KSRTC plans to Improve the existing 7 and additionally develop 3 more Bus Terminals in Mysore. Out of
these, the City Bus Terminals and Sub – Urban Bus Terminal are located in very congested environs.
Station area traffic schemes must be implemented for all the stations but more specifically for the two
stations. This includes traffic management improvements discussed earlier.
It is very important that the Bus Terminals are conveniently and quickly accessible by public transport
and NMT. There are currently siginificant private inter state buses plying through the city. Many of them
are seen parked on the city road (E.g near Harding Circle, Gun House Circle) for lack of dedicated parking
facilities. At the time of locating and designing intermodal transfer terminals, the parking for private
buses must be integrated with the intermodal terminals.
Railway Station
KSRTC operates buses to the railway station. The railway and traffic police officials have recently
improved the traffic operations of station road and vicinity of the railway station. However, the terminal
and vicinity is still very congested due to hawkers and heavy traffic among other reasons.
Airport
The airport coming on Nanjangud Road, would be creating substantial traffic on the access roads. The
Zoo Road, Race Course road are all likely to be effected with this increase in traffic. This has been
accounted for in the transport plan.
Truck Terminal
One of the main problems with Mysore city is that lot of activities are all clustered together in old city
and vicinity. One of the solutions for the problem would be to relocate some of the activity centres to
less congested areas.
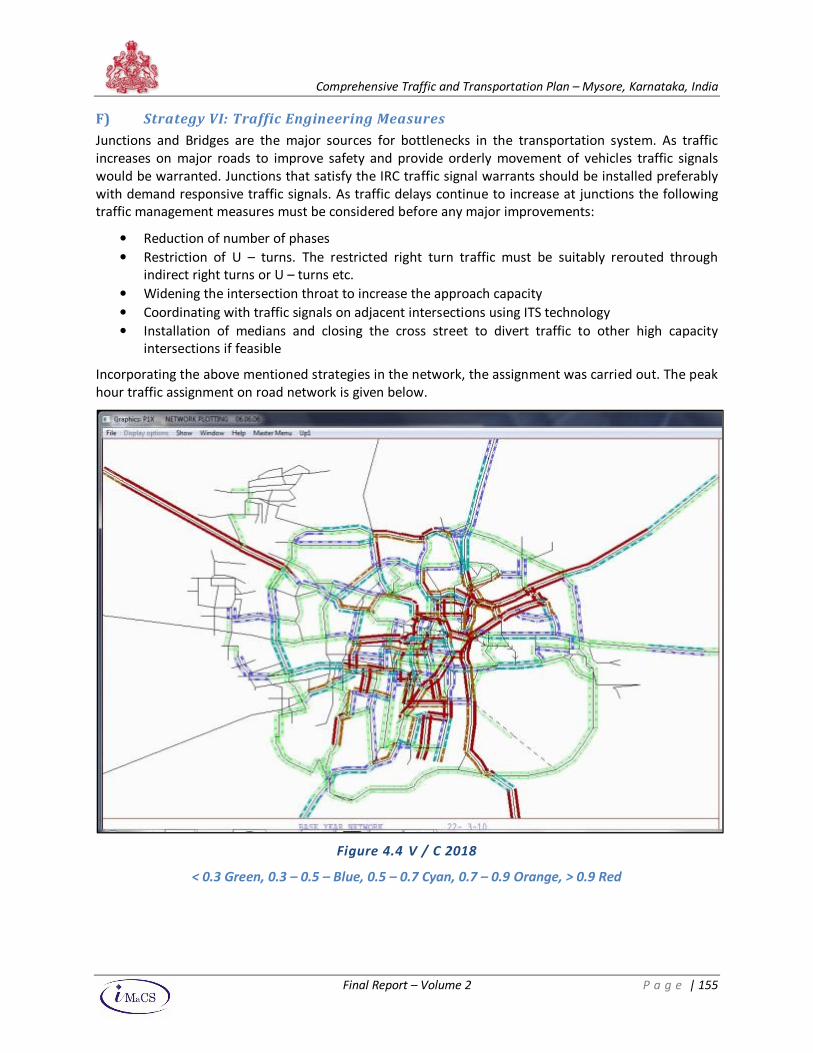
Comprehensive Traffic and Transportation Plan – Mysore, Karnataka, India
Final Report – Volume 2 P a g e | 155
F) Strategy VI: Traffic Engineering Measures
Junctions and Bridges are the major sources for bottlenecks in the transportation system. As traffic
increases on major roads to improve safety and provide orderly movement of vehicles traffic signals
would be warranted. Junctions that satisfy the IRC traffic signal warrants should be installed preferably
with demand responsive traffic signals. As traffic delays continue to increase at junctions the following
traffic management measures must be considered before any major improvements:
• Reduction of number of phases
• Restriction of U – turns. The restricted right turn traffic must be suitably rerouted through
indirect right turns or U – turns etc.
• Widening the intersection throat to increase the approach capacity
• Coordinating with traffic signals on adjacent intersections using ITS technology
• Installation of medians and closing the cross street to divert traffic to other high capacity
intersections if feasible
Incorporating the above mentioned strategies in the network, the assignment was carried out. The peak
hour traffic assignment on road network is given below.
Figure 4.4 V / C 2018
< 0.3 Green, 0.3 – 0.5 – Blue, 0.5 – 0.7 Cyan, 0.7 – 0.9 Orange, > 0.9 Red
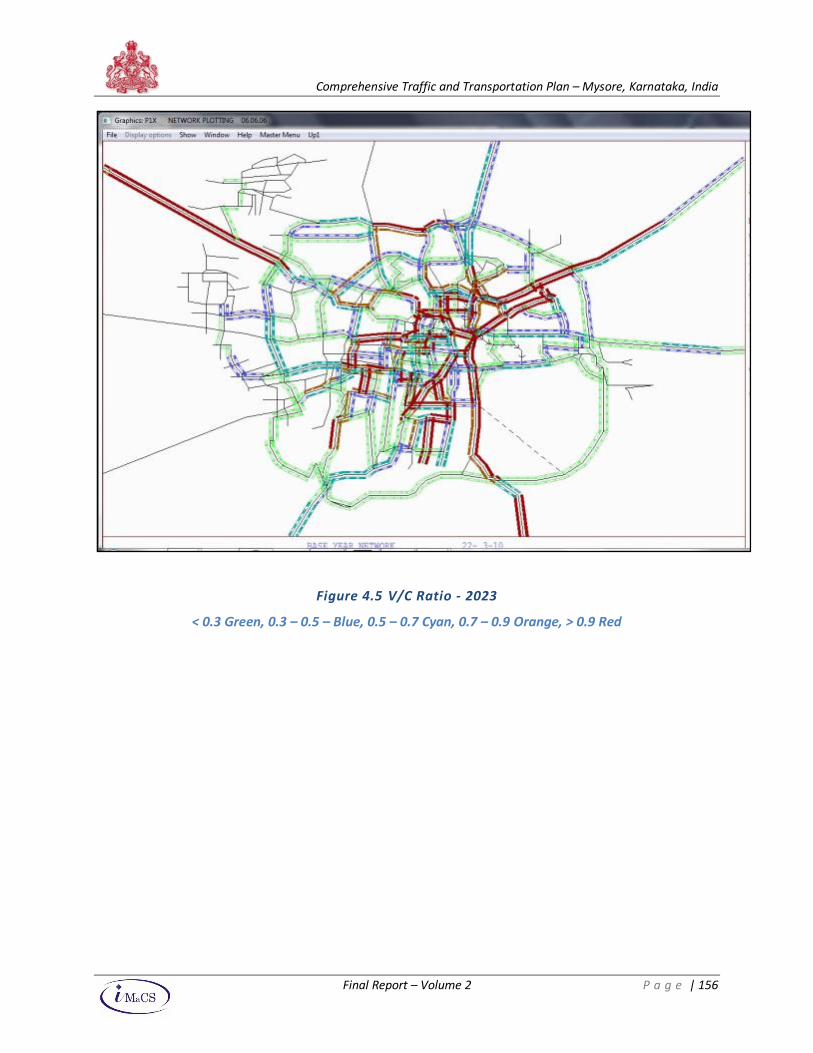
Comprehensive Traffic and Transportation Plan – Mysore, Karnataka, India
Final Report – Volume 2 P a g e | 156
Figure 4.5 V/C Ratio - 2023
< 0.3 Green, 0.3 – 0.5 – Blue, 0.5 – 0.7 Cyan, 0.7 – 0.9 Orange, > 0.9 Red
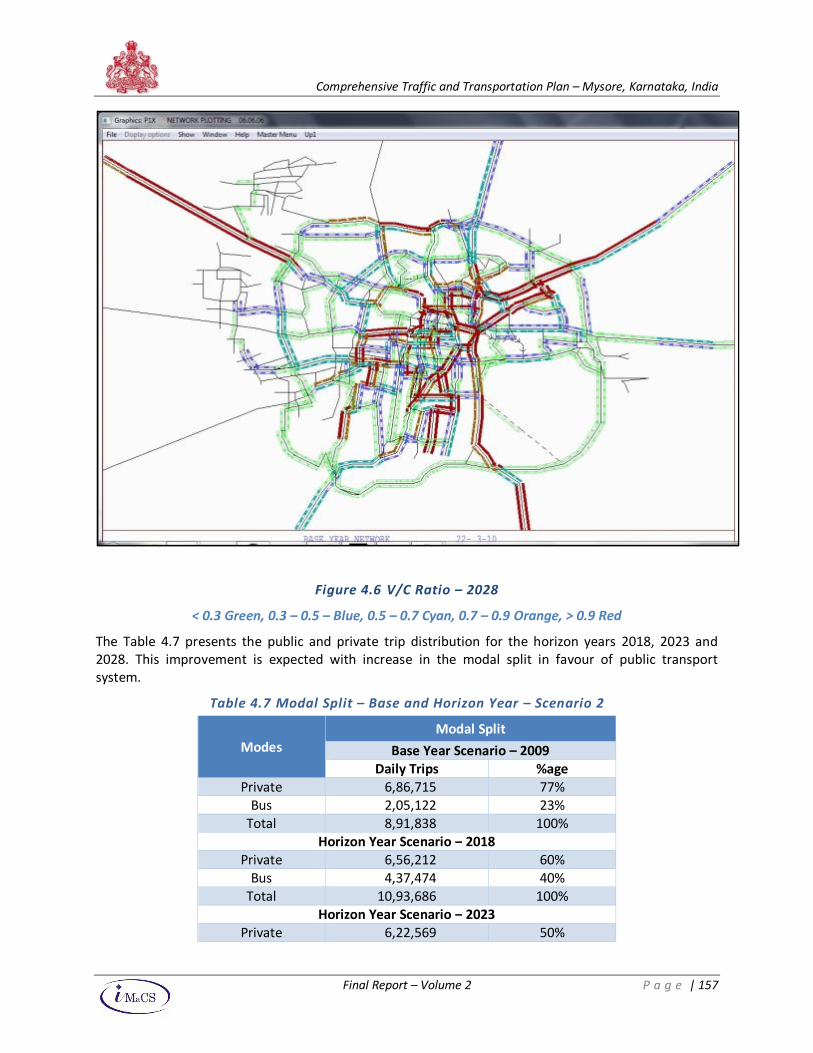
Comprehensive Traffic and Transportation Plan – Mysore, Karnataka, India
Final Report – Volume 2 P a g e | 157
Figure 4.6 V/C Ratio – 2028
< 0.3 Green, 0.3 – 0.5 – Blue, 0.5 – 0.7 Cyan, 0.7 – 0.9 Orange, > 0.9 Red
The Table 4.7 presents the public and private trip distribution for the horizon years 2018, 2023 and
2028. This improvement is expected with increase in the modal split in favour of public transport
system.
Table 4.7 Modal Split – Base and Horizon Year – Scenario 2
Modes
Modal Split
Base Year Scenario – 2009
Daily Trips %age
Private 6,86,715 77%
Bus 2,05,122 23%
Total 8,91,838 100%
Horizon Year Scenario – 2018
Private 6,56,212 60%
Bus 4,37,474 40%
Total 10,93,686 100%
Horizon Year Scenario – 2023
Private 6,22,569 50%
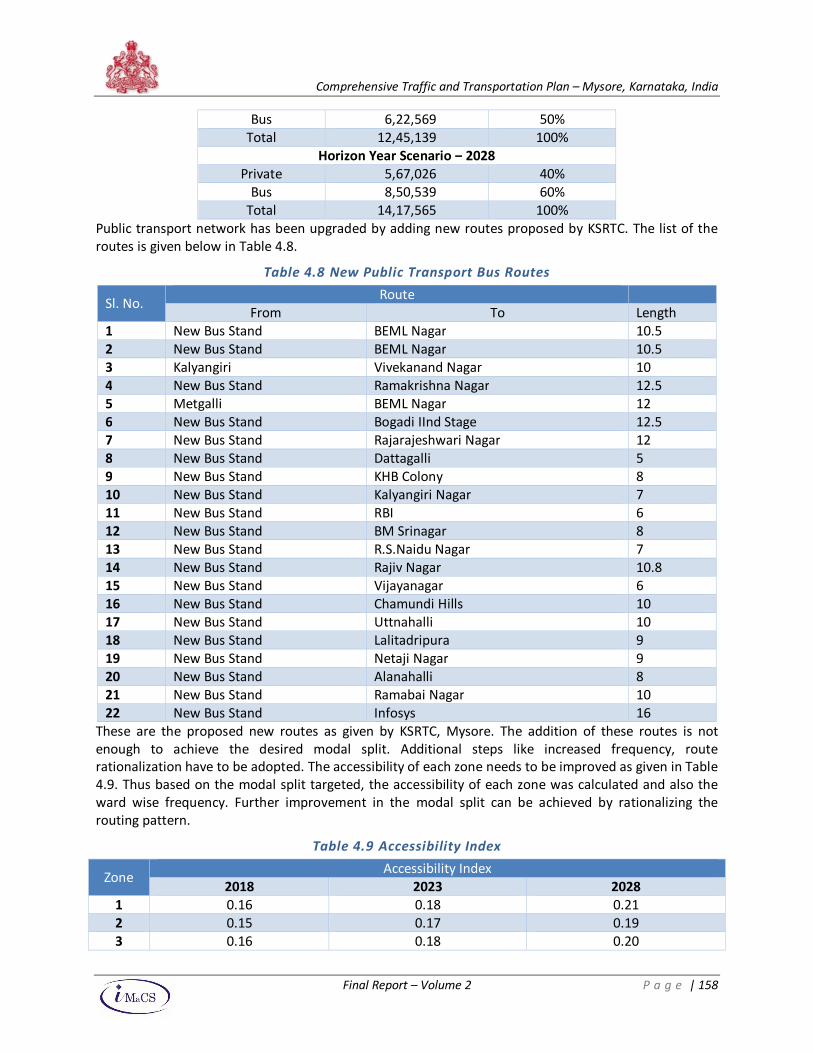
Comprehensive Traffic and Transportation Plan – Mysore, Karnataka, India
Final Report – Volume 2 P a g e | 158
Bus 6,22,569 50%
Total 12,45,139 100%
Horizon Year Scenario – 2028
Private 5,67,026 40%
Bus 8,50,539 60%
Total 14,17,565 100%
Public transport network has been upgraded by adding new routes proposed by KSRTC. The list of the
routes is given below in Table 4.8.
Table 4.8 New Public Transport Bus Routes
Sl. No. Route
From To Length
1 New Bus Stand BEML Nagar 10.5
2 New Bus Stand BEML Nagar 10.5
3 Kalyangiri Vivekanand Nagar 10
4 New Bus Stand Ramakrishna Nagar 12.5
5 Metgalli BEML Nagar 12
6 New Bus Stand Bogadi IInd Stage 12.5
7 New Bus Stand Rajarajeshwari Nagar 12
8 New Bus Stand Dattagalli 5
9 New Bus Stand KHB Colony 8
10 New Bus Stand Kalyangiri Nagar 7
11 New Bus Stand RBI 6
12 New Bus Stand BM Srinagar 8
13 New Bus Stand R.S.Naidu Nagar 7
14 New Bus Stand Rajiv Nagar 10.8
15 New Bus Stand Vijayanagar 6
16 New Bus Stand Chamundi Hills 10
17 New Bus Stand Uttnahalli 10
18 New Bus Stand Lalitadripura 9
19 New Bus Stand Netaji Nagar 9
20 New Bus Stand Alanahalli 8
21 New Bus Stand Ramabai Nagar 10
22 New Bus Stand Infosys 16
These are the proposed new routes as given by KSRTC, Mysore. The addition of these routes is not
enough to achieve the desired modal split. Additional steps like increased frequency, route
rationalization have to be adopted. The accessibility of each zone needs to be improved as given in Table
4.9. Thus based on the modal split targeted, the accessibility of each zone was calculated and also the
ward wise frequency. Further improvement in the modal split can be achieved by rationalizing the
routing pattern.
Table 4.9 Accessibility Index
Zone Accessibility Index
2018 2023 2028
1 0.16 0.18 0.21
2 0.15 0.17 0.19
3 0.16 0.18 0.20
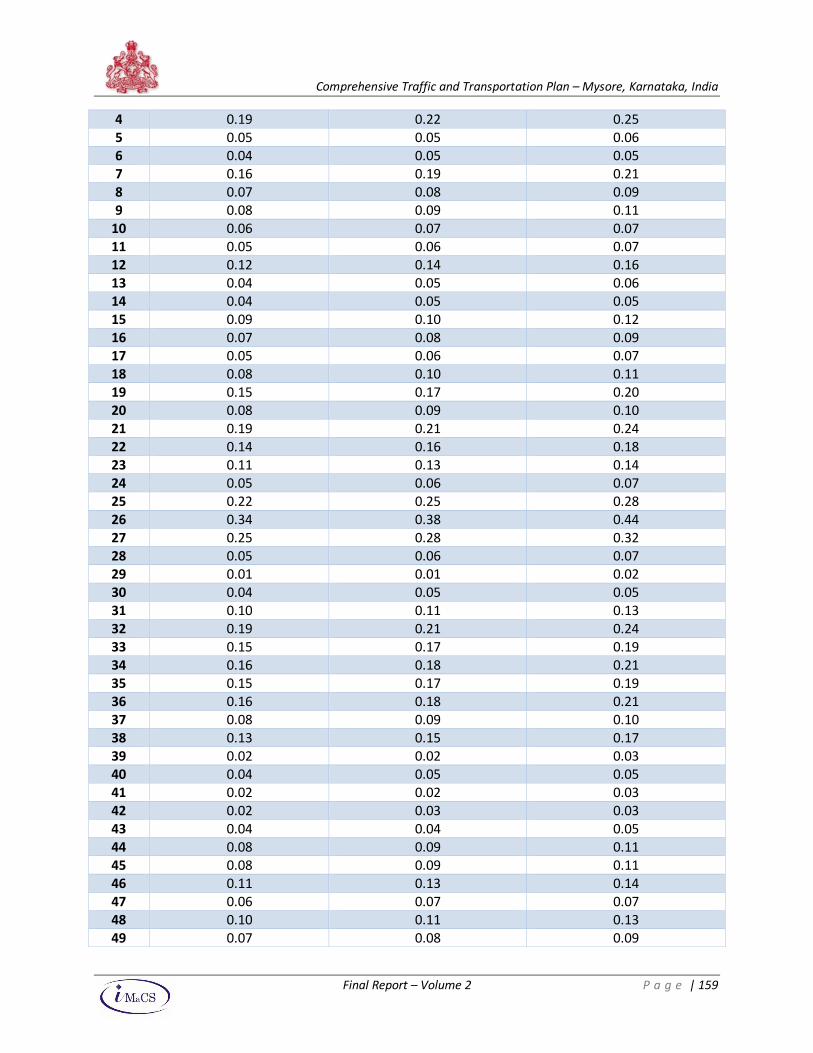
Comprehensive Traffic and Transportation Plan – Mysore, Karnataka, India
Final Report – Volume 2 P a g e | 159
4 0.19 0.22 0.25
5 0.05 0.05 0.06
6 0.04 0.05 0.05
7 0.16 0.19 0.21
8 0.07 0.08 0.09
9 0.08 0.09 0.11
10 0.06 0.07 0.07
11 0.05 0.06 0.07
12 0.12 0.14 0.16
13 0.04 0.05 0.06
14 0.04 0.05 0.05
15 0.09 0.10 0.12
16 0.07 0.08 0.09
17 0.05 0.06 0.07
18 0.08 0.10 0.11
19 0.15 0.17 0.20
20 0.08 0.09 0.10
21 0.19 0.21 0.24
22 0.14 0.16 0.18
23 0.11 0.13 0.14
24 0.05 0.06 0.07
25 0.22 0.25 0.28
26 0.34 0.38 0.44
27 0.25 0.28 0.32
28 0.05 0.06 0.07
29 0.01 0.01 0.02
30 0.04 0.05 0.05
31 0.10 0.11 0.13
32 0.19 0.21 0.24
33 0.15 0.17 0.19
34 0.16 0.18 0.21
35 0.15 0.17 0.19
36 0.16 0.18 0.21
37 0.08 0.09 0.10
38 0.13 0.15 0.17
39 0.02 0.02 0.03
40 0.04 0.05 0.05
41 0.02 0.02 0.03
42 0.02 0.03 0.03
43 0.04 0.04 0.05
44 0.08 0.09 0.11
45 0.08 0.09 0.11
46 0.11 0.13 0.14
47 0.06 0.07 0.07
48 0.10 0.11 0.13
49 0.07 0.08 0.09
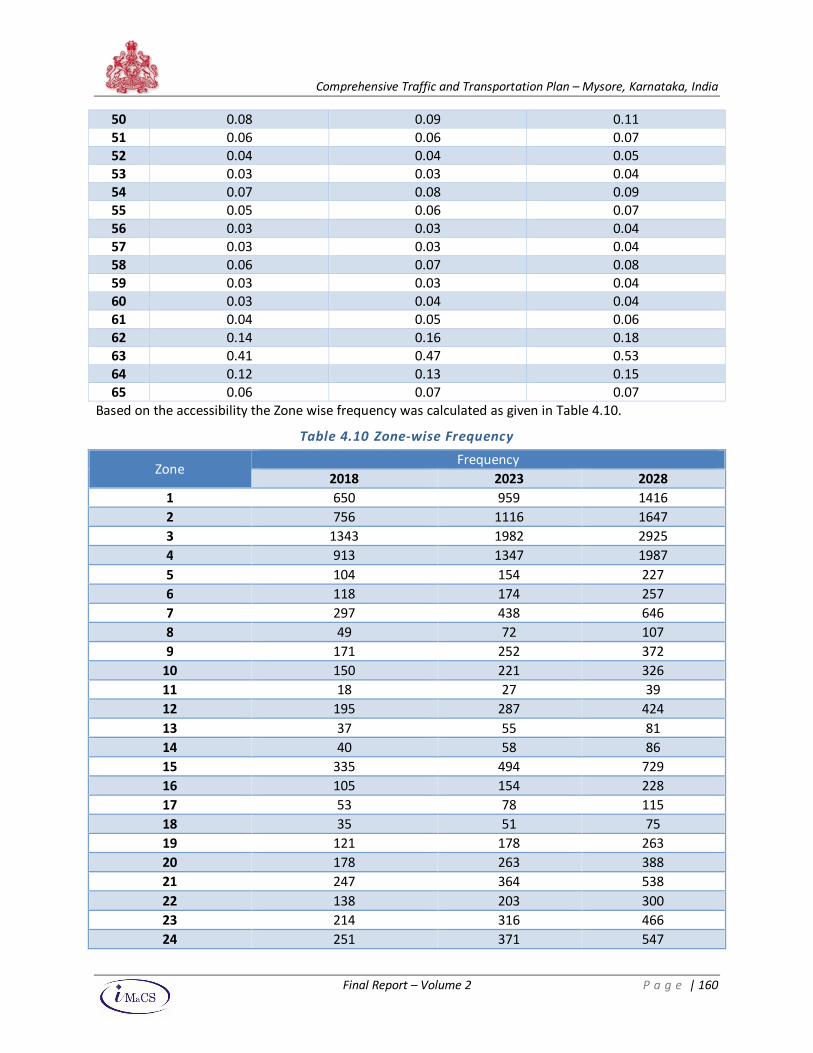
Comprehensive Traffic and Transportation Plan – Mysore, Karnataka, India
Final Report – Volume 2 P a g e | 160
50 0.08 0.09 0.11
51 0.06 0.06 0.07
52 0.04 0.04 0.05
53 0.03 0.03 0.04
54 0.07 0.08 0.09
55 0.05 0.06 0.07
56 0.03 0.03 0.04
57 0.03 0.03 0.04
58 0.06 0.07 0.08
59 0.03 0.03 0.04
60 0.03 0.04 0.04
61 0.04 0.05 0.06
62 0.14 0.16 0.18
63 0.41 0.47 0.53
64 0.12 0.13 0.15
65 0.06 0.07 0.07
Based on the accessibility the Zone wise frequency was calculated as given in Table 4.10.
Table 4.10 Zone-wise Frequency
Zone Frequency
2018 2023 2028
1 650 959 1416
2 756 1116 1647
3 1343 1982 2925
4 913 1347 1987
5 104 154 227
6 118 174 257
7 297 438 646
8 49 72 107
9 171 252 372
10 150 221 326
11 18 27 39
12 195 287 424
13 37 55 81
14 40 58 86
15 335 494 729
16 105 154 228
17 53 78 115
18 35 51 75
19 121 178 263
20 178 263 388
21 247 364 538
22 138 203 300
23 214 316 466
24 251 371 547
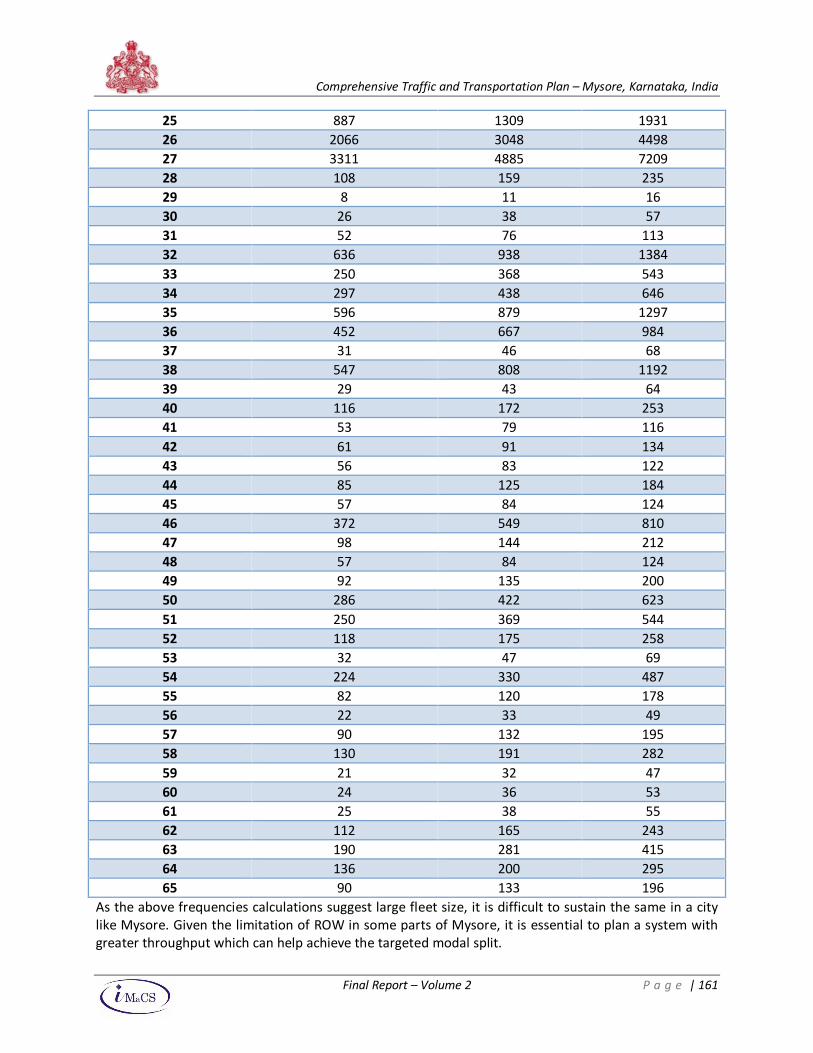
Comprehensive Traffic and Transportation Plan – Mysore, Karnataka, India
Final Report – Volume 2 P a g e | 161
25 887 1309 1931
26 2066 3048 4498
27 3311 4885 7209
28 108 159 235
29 8 11 16
30 26 38 57
31 52 76 113
32 636 938 1384
33 250 368 543
34 297 438 646
35 596 879 1297
36 452 667 984
37 31 46 68
38 547 808 1192
39 29 43 64
40 116 172 253
41 53 79 116
42 61 91 134
43 56 83 122
44 85 125 184
45 57 84 124
46 372 549 810
47 98 144 212
48 57 84 124
49 92 135 200
50 286 422 623
51 250 369 544
52 118 175 258
53 32 47 69
54 224 330 487
55 82 120 178
56 22 33 49
57 90 132 195
58 130 191 282
59 21 32 47
60 24 36 53
61 25 38 55
62 112 165 243
63 190 281 415
64 136 200 295
65 90 133 196
As the above frequencies calculations suggest large fleet size, it is difficult to sustain the same in a city
like Mysore. Given the limitation of ROW in some parts of Mysore, it is essential to plan a system with
greater throughput which can help achieve the targeted modal split.
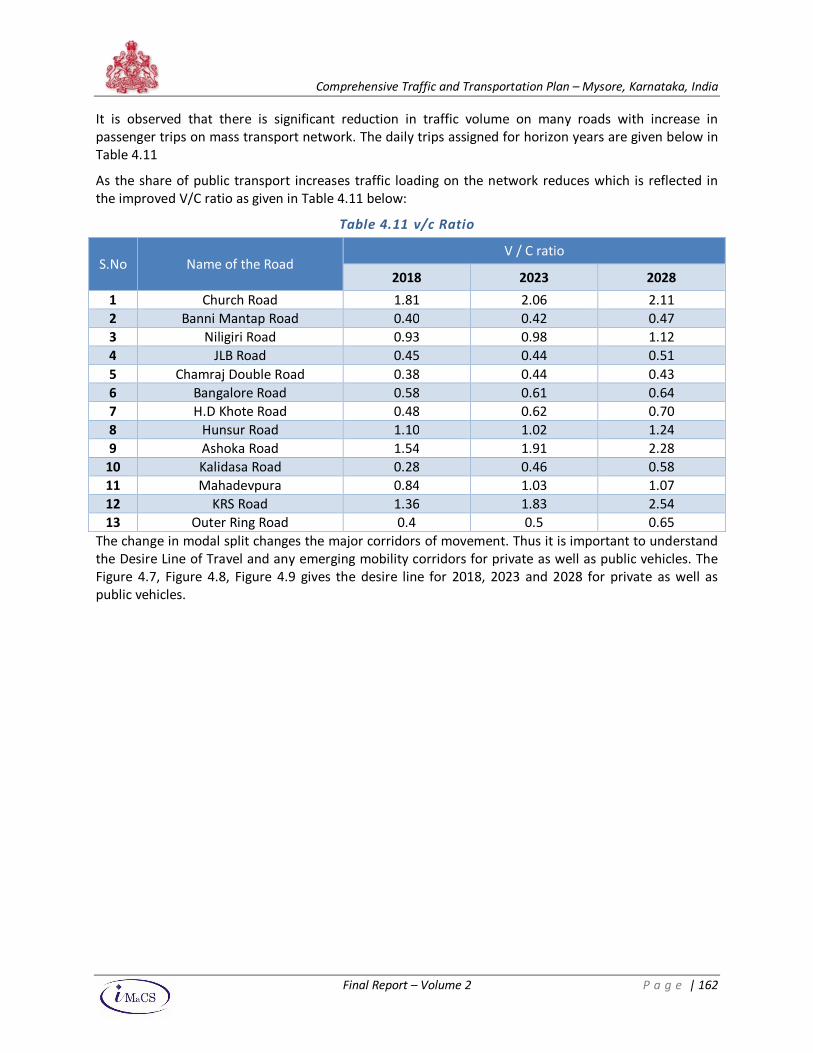
Comprehensive Traffic and Transportation Plan – Mysore, Karnataka, India
Final Report – Volume 2 P a g e | 162
It is observed that there is significant reduction in traffic volume on many roads with increase in
passenger trips on mass transport network. The daily trips assigned for horizon years are given below in
Table 4.11
As the share of public transport increases traffic loading on the network reduces which is reflected in
the improved V/C ratio as given in Table 4.11 below:
Table 4.11 v/c Ratio
S.No Name of the Road V / C ratio
2018 2023 2028
1 Church Road 1.81 2.06 2.11
2 Banni Mantap Road 0.40 0.42 0.47
3 Niligiri Road 0.93 0.98 1.12
4 JLB Road 0.45 0.44 0.51
5 Chamraj Double Road 0.38 0.44 0.43
6 Bangalore Road 0.58 0.61 0.64
7 H.D Khote Road 0.48 0.62 0.70
8 Hunsur Road 1.10 1.02 1.24
9 Ashoka Road 1.54 1.91 2.28
10 Kalidasa Road 0.28 0.46 0.58
11 Mahadevpura 0.84 1.03 1.07
12 KRS Road 1.36 1.83 2.54
13 Outer Ring Road 0.4 0.5 0.65
The change in modal split changes the major corridors of movement. Thus it is important to understand
the Desire Line of Travel and any emerging mobility corridors for private as well as public vehicles. The
Figure 4.7, Figure 4.8, Figure 4.9 gives the desire line for 2018, 2023 and 2028 for private as well as
public vehicles.
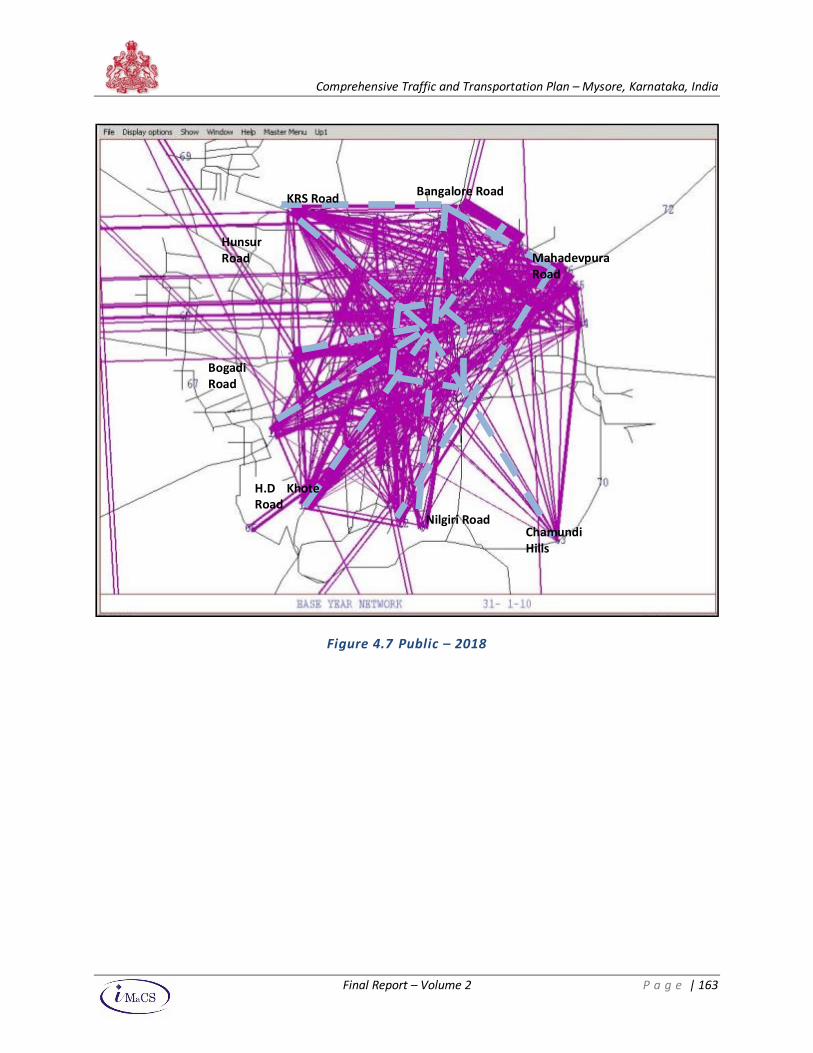
Comprehensive Traffic and Transportation Plan – Mysore, Karnataka, India
Final Report – Volume 2 P a g e | 163
Figure 4.7 Public – 2018
Hunsur
Road
Nilgiri Road
H.D Khote
Road
Mahadevpura
Road
Bangalore Road
Bogadi
Road
KRS Road
Chamundi
Hills
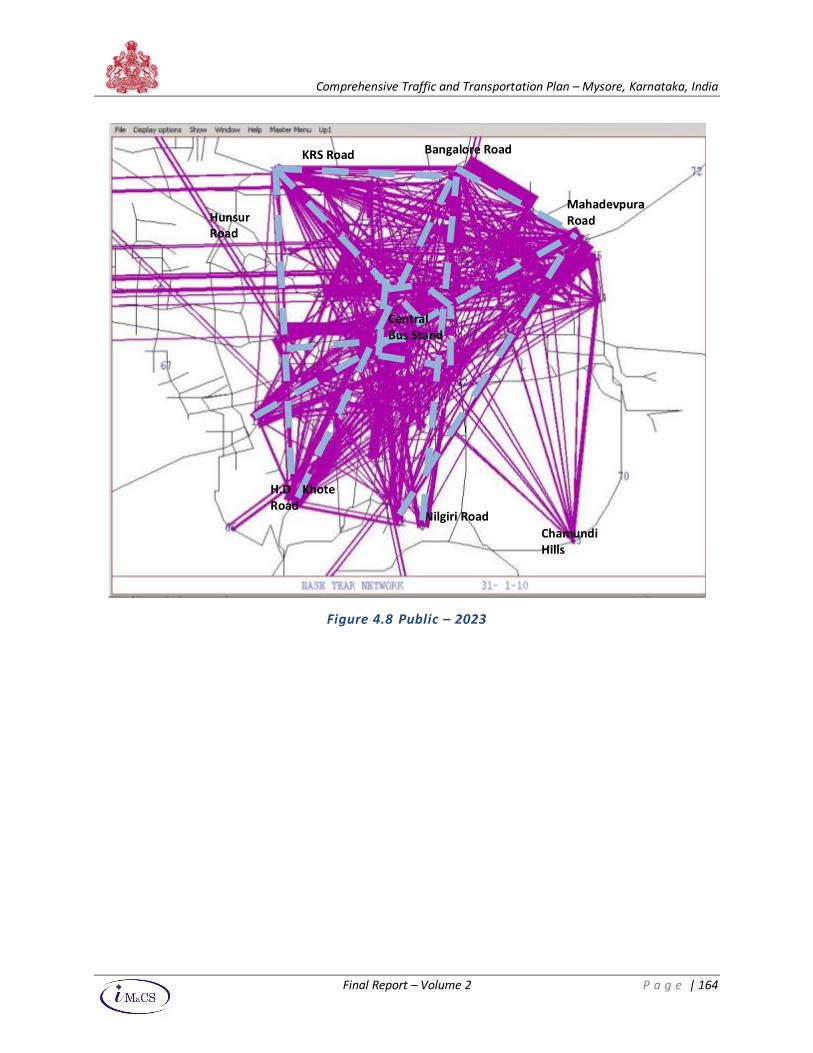
Comprehensive Traffic and Transportation Plan – Mysore, Karnataka, India
Final Report – Volume 2 P a g e | 164
Figure 4.8 Public – 2023
Chamundi
Hills
Nilgiri Road
H.D Khote
Road
Hunsur
Road
KRS Road Bangalore Road
Mahadevpura
Road
Central
Bus Stand
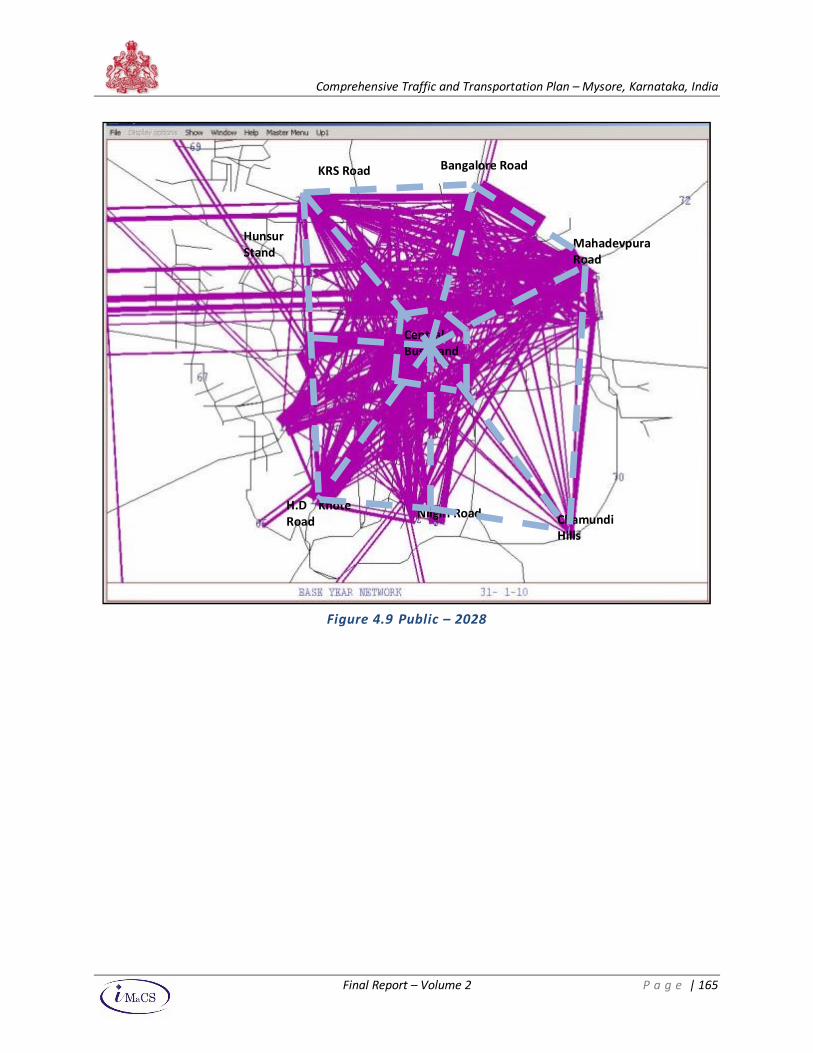
Comprehensive Traffic and Transportation Plan – Mysore, Karnataka, India
Final Report – Volume 2 P a g e | 165
Figure 4.9 Public – 2028
H.D Khote
Road Nilgiri Road
Central
Bus Stand
Chamundi
Hills
Mahadevpura
Road
Hunsur
Stand
KRS Road Bangalore Road
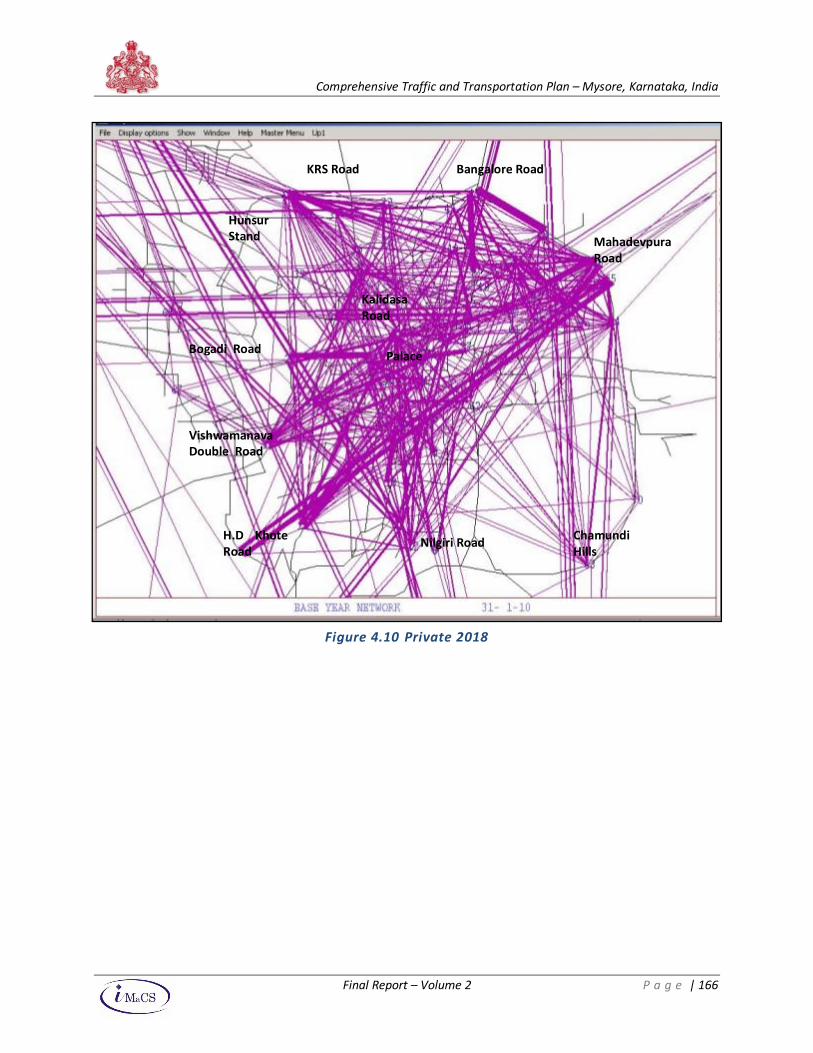
Comprehensive Traffic and Transportation Plan – Mysore, Karnataka, India
Final Report – Volume 2 P a g e | 166
Figure 4.10 Private 2018
Chamundi
Hills Nilgiri Road
KRS Road
Hunsur
Stand Mahadevpura
Road
H.D Khote
Road
Vishwamanava
Double Road
Bogadi Road
Bangalore Road
Palace
Kalidasa
Road
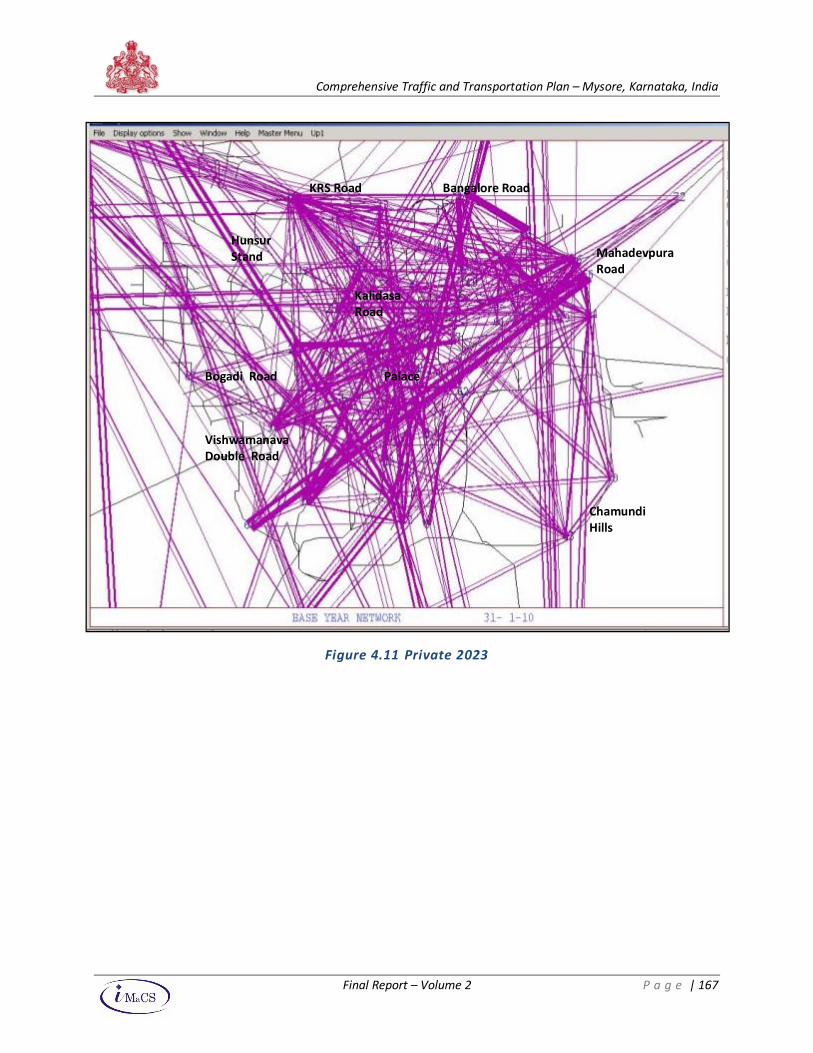
Comprehensive Traffic and Transportation Plan – Mysore, Karnataka, India
Final Report – Volume 2 P a g e | 167
Figure 4.11 Private 2023
Vishwamanava
Double Road
Bogadi Road
Hunsur
Stand
KRS Road
Mahadevpura
Road
Chamundi
Hills
Palace
Kalidasa
Road
Bangalore Road
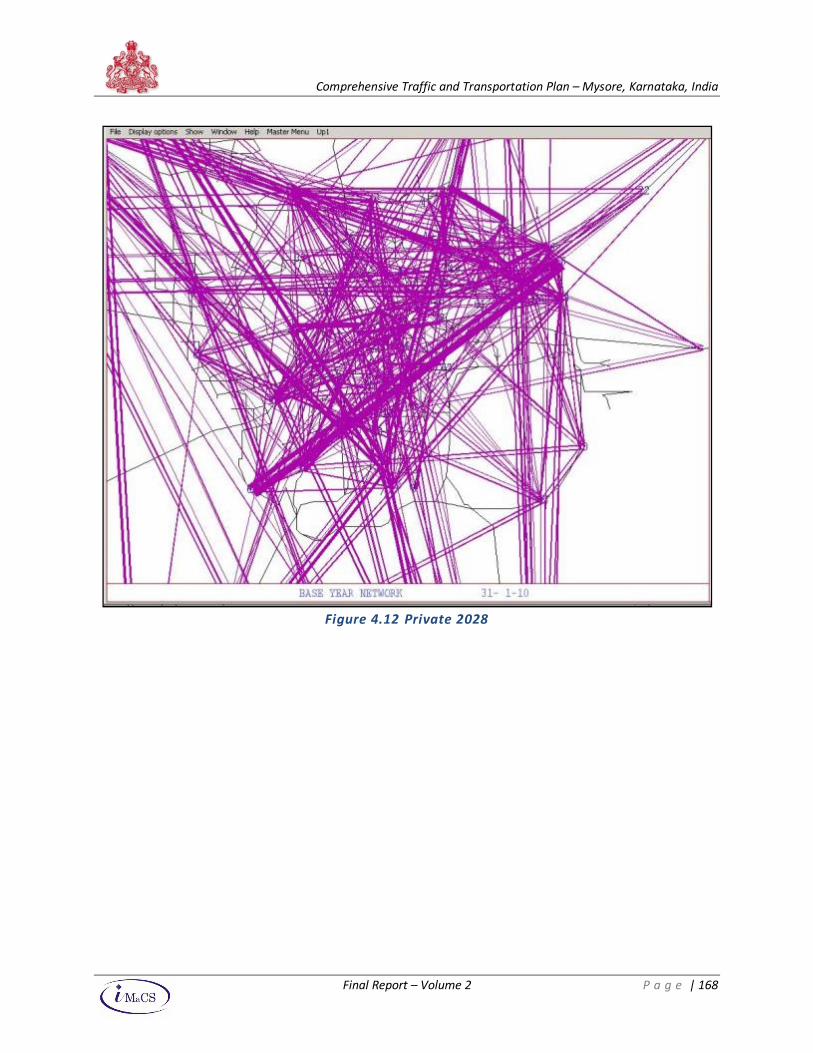
Comprehensive Traffic and Transportation Plan – Mysore, Karnataka, India
Final Report – Volume 2 P a g e | 168
Figure 4.12 Private 2028
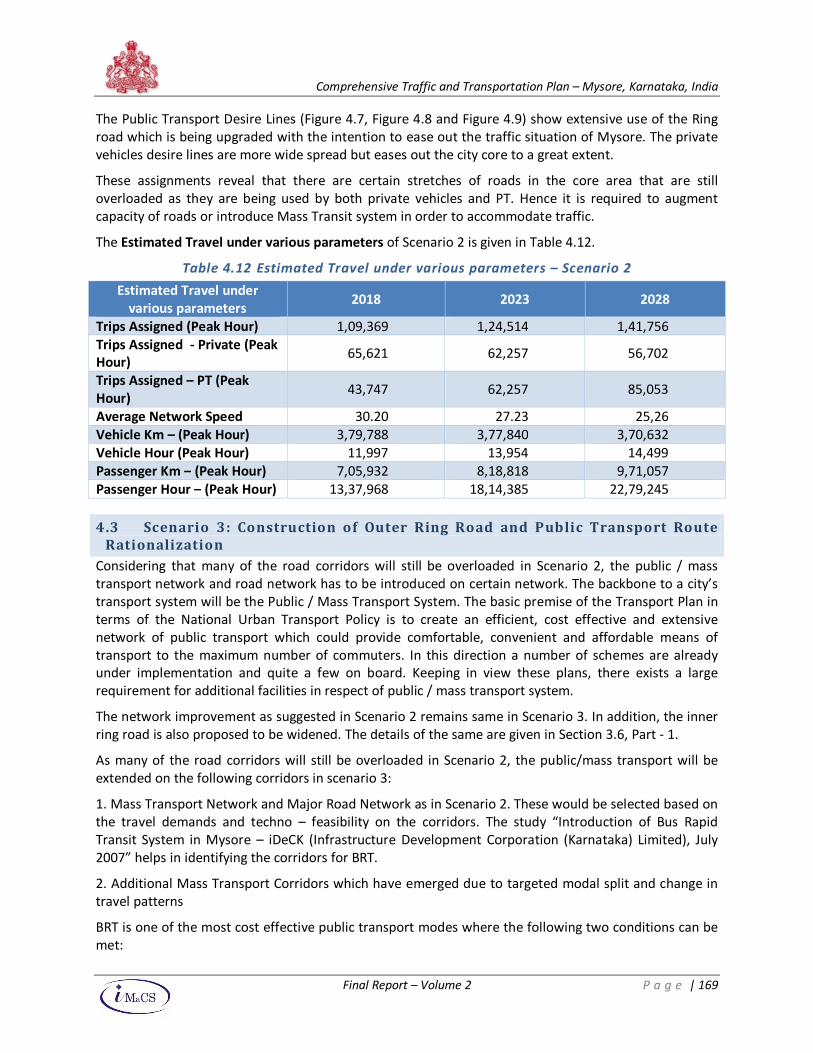
Comprehensive Traffic and Transportation Plan – Mysore, Karnataka, India
Final Report – Volume 2 P a g e | 169
The Public Transport Desire Lines (Figure 4.7, Figure 4.8 and Figure 4.9) show extensive use of the Ring
road which is being upgraded with the intention to ease out the traffic situation of Mysore. The private
vehicles desire lines are more wide spread but eases out the city core to a great extent.
These assignments reveal that there are certain stretches of roads in the core area that are still
overloaded as they are being used by both private vehicles and PT. Hence it is required to augment
capacity of roads or introduce Mass Transit system in order to accommodate traffic.
The Estimated Travel under various parameters of Scenario 2 is given in Table 4.12.
Table 4.12 Estimated Travel under various parameters – Scenario 2
Estimated Travel under
various parameters 2018 2023 2028
Trips Assigned (Peak Hour) 1,09,369 1,24,514 1,41,756
Trips Assigned - Private (Peak
Hour) 65,621 62,257 56,702
Trips Assigned – PT (Peak
Hour) 43,747 62,257 85,053
Average Network Speed 30.20 27.23 25,26
Vehicle Km – (Peak Hour) 3,79,788 3,77,840 3,70,632
Vehicle Hour (Peak Hour) 11,997 13,954 14,499
Passenger Km – (Peak Hour) 7,05,932 8,18,818 9,71,057
Passenger Hour – (Peak Hour) 13,37,968 18,14,385 22,79,245
4.3 Scenario 3: Construction of Outer Ring Road and Public Transport Route
Rationalization
Considering that many of the road corridors will still be overloaded in Scenario 2, the public / mass
transport network and road network has to be introduced on certain network. The backbone to a city’s
transport system will be the Public / Mass Transport System. The basic premise of the Transport Plan in
terms of the National Urban Transport Policy is to create an efficient, cost effective and extensive
network of public transport which could provide comfortable, convenient and affordable means of
transport to the maximum number of commuters. In this direction a number of schemes are already
under implementation and quite a few on board. Keeping in view these plans, there exists a large
requirement for additional facilities in respect of public / mass transport system.
The network improvement as suggested in Scenario 2 remains same in Scenario 3. In addition, the inner
ring road is also proposed to be widened. The details of the same are given in Section 3.6, Part - 1.
As many of the road corridors will still be overloaded in Scenario 2, the public/mass transport will be
extended on the following corridors in scenario 3:
1. Mass Transport Network and Major Road Network as in Scenario 2. These would be selected based on
the travel demands and techno – feasibility on the corridors. The study “Introduction of Bus Rapid
Transit System in Mysore – iDeCK (Infrastructure Development Corporation (Karnataka) Limited), July
2007” helps in identifying the corridors for BRT.
2. Additional Mass Transport Corridors which have emerged due to targeted modal split and change in
travel patterns
BRT is one of the most cost effective public transport modes where the following two conditions can be
met:
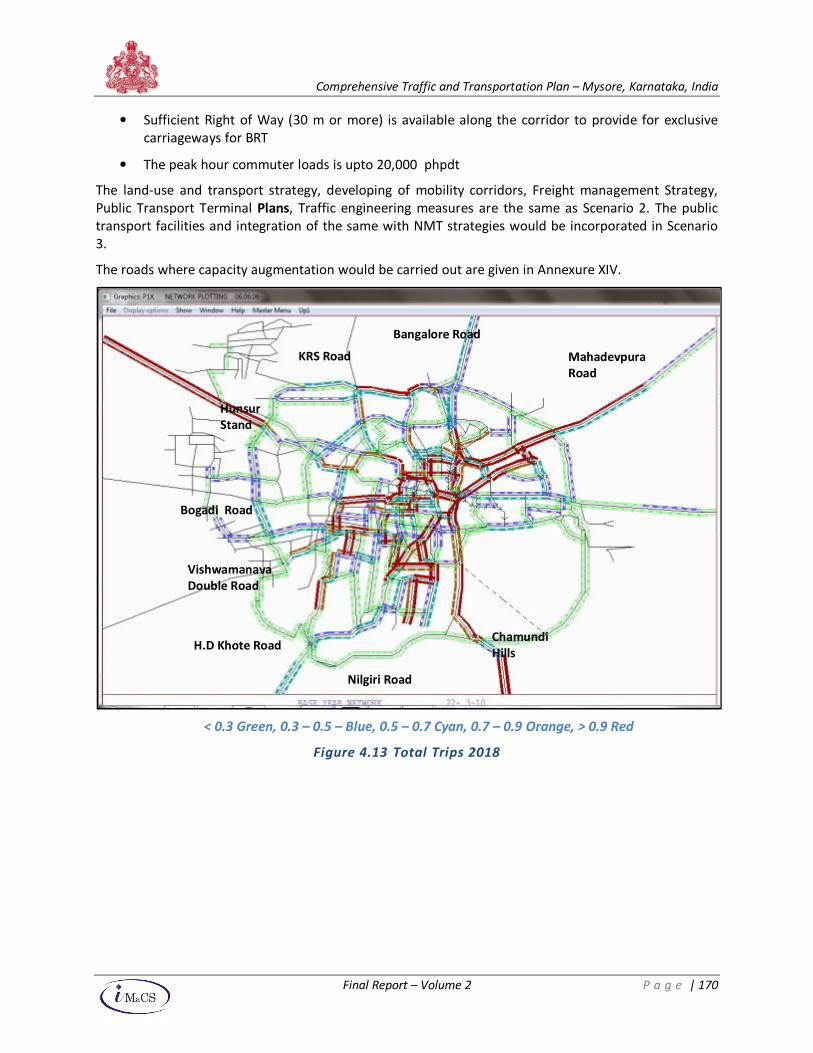
Comprehensive Traffic and Transportation Plan – Mysore, Karnataka, India
Final Report – Volume 2 P a g e | 170
• Sufficient Right of Way (30 m or more) is available along the corridor to provide for exclusive
carriageways for BRT
• The peak hour commuter loads is upto 20,000 phpdt
The land-use and transport strategy, developing of mobility corridors, Freight management Strategy,
Public Transport Terminal Plans, Traffic engineering measures are the same as Scenario 2. The public
transport facilities and integration of the same with NMT strategies would be incorporated in Scenario
3.
The roads where capacity augmentation would be carried out are given in Annexure XIV.
< 0.3 Green, 0.3 – 0.5 – Blue, 0.5 – 0.7 Cyan, 0.7 – 0.9 Orange, > 0.9 Red
Figure 4.13 Total Trips 2018
Nilgiri Road
Chamundi
Hills
Mahadevpura
Road
Bangalore Road
KRS Road
Hunsur
Stand
Vishwamanava
Double Road
H.D Khote Road
Bogadi Road
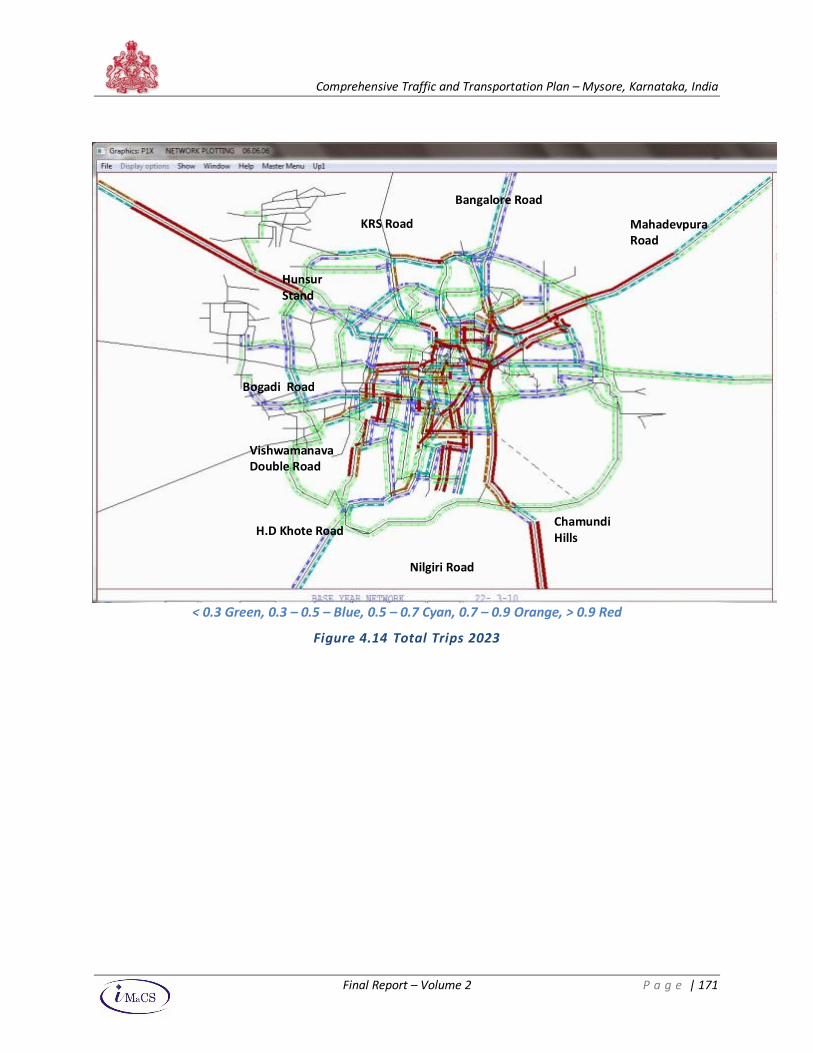
Comprehensive Traffic and Transportation Plan – Mysore, Karnataka, India
Final Report – Volume 2 P a g e | 171
< 0.3 Green, 0.3 – 0.5 – Blue, 0.5 – 0.7 Cyan, 0.7 – 0.9 Orange, > 0.9 Red
Figure 4.14 Total Trips 2023
Nilgiri Road
Chamundi
Hills
Mahadevpura
Road
Bangalore Road
KRS Road
Hunsur
Stand
Vishwamanava
Double Road
H.D Khote Road
Bogadi Road
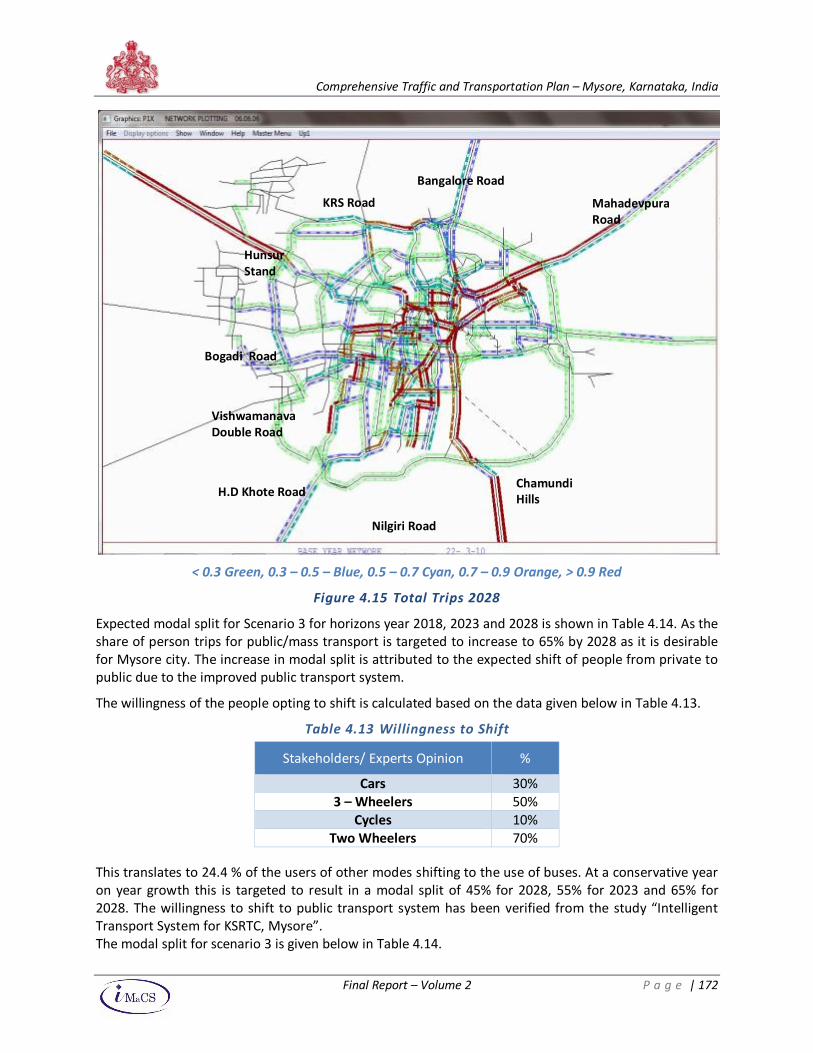
Comprehensive Traffic and Transportation Plan – Mysore, Karnataka, India
Final Report – Volume 2 P a g e | 172
< 0.3 Green, 0.3 – 0.5 – Blue, 0.5 – 0.7 Cyan, 0.7 – 0.9 Orange, > 0.9 Red
Figure 4.15 Total Trips 2028
Expected modal split for Scenario 3 for horizons year 2018, 2023 and 2028 is shown in Table 4.14. As the
share of person trips for public/mass transport is targeted to increase to 65% by 2028 as it is desirable
for Mysore city. The increase in modal split is attributed to the expected shift of people from private to
public due to the improved public transport system.
The willingness of the people opting to shift is calculated based on the data given below in Table 4.13.
Table 4.13 Willingness to Shift
Stakeholders/ Experts Opinion %
Cars 30%
3 – Wheelers 50%
Cycles 10%
Two Wheelers 70%
This translates to 24.4 % of the users of other modes shifting to the use of buses. At a conservative year
on year growth this is targeted to result in a modal split of 45% for 2028, 55% for 2023 and 65% for
2028. The willingness to shift to public transport system has been verified from the study “Intelligent
Transport System for KSRTC, Mysore”.
The modal split for scenario 3 is given below in Table 4.14.
Nilgiri Road
Chamundi
Hills
Mahadevpura
Road
Bangalore Road
KRS Road
Hunsur
Stand
Vishwamanava
Double Road
H.D Khote Road
Bogadi Road
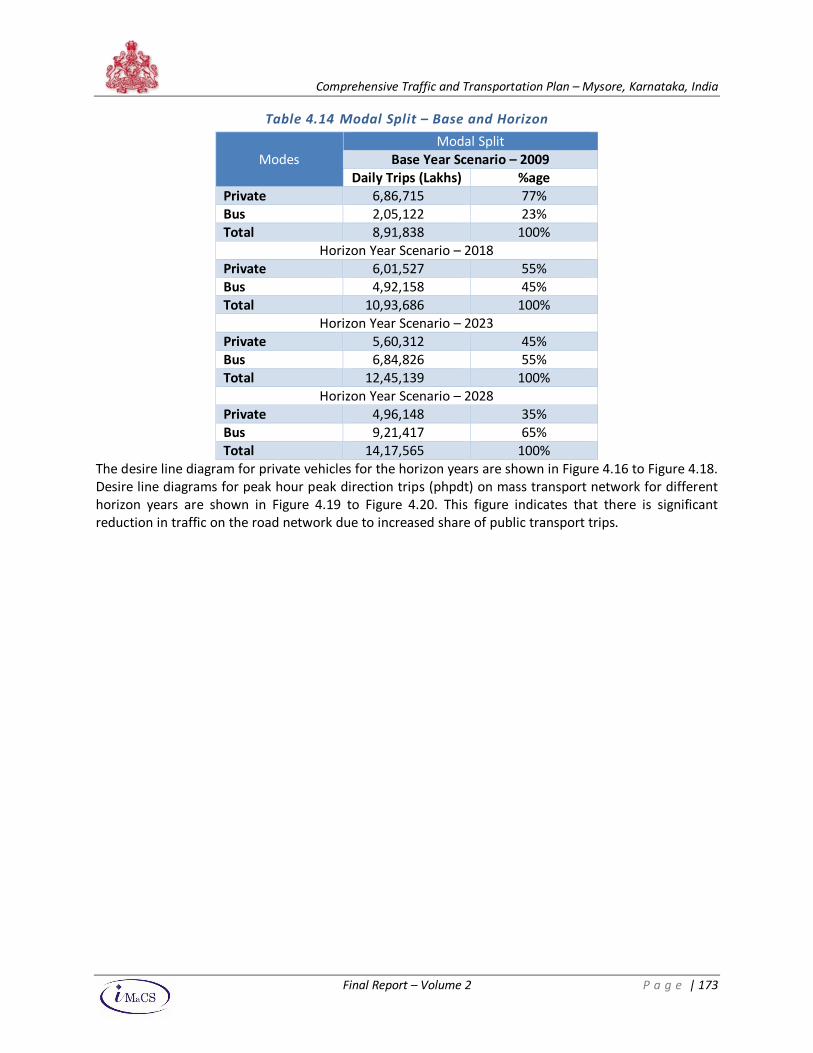
Comprehensive Traffic and Transportation Plan – Mysore, Karnataka, India
Final Report – Volume 2 P a g e | 173
Table 4.14 Modal Split – Base and Horizon
Modes
Modal Split
Base Year Scenario – 2009
Daily Trips (Lakhs) %age
Private 6,86,715 77%
Bus 2,05,122 23%
Total 8,91,838 100%
Horizon Year Scenario – 2018
Private 6,01,527 55%
Bus 4,92,158 45%
Total 10,93,686 100%
Horizon Year Scenario – 2023
Private 5,60,312 45%
Bus 6,84,826 55%
Total 12,45,139 100%
Horizon Year Scenario – 2028
Private 4,96,148 35%
Bus 9,21,417 65%
Total 14,17,565 100%
The desire line diagram for private vehicles for the horizon years are shown in Figure 4.16 to Figure 4.18.
Desire line diagrams for peak hour peak direction trips (phpdt) on mass transport network for different
horizon years are shown in Figure 4.19 to Figure 4.20. This figure indicates that there is significant
reduction in traffic on the road network due to increased share of public transport trips.
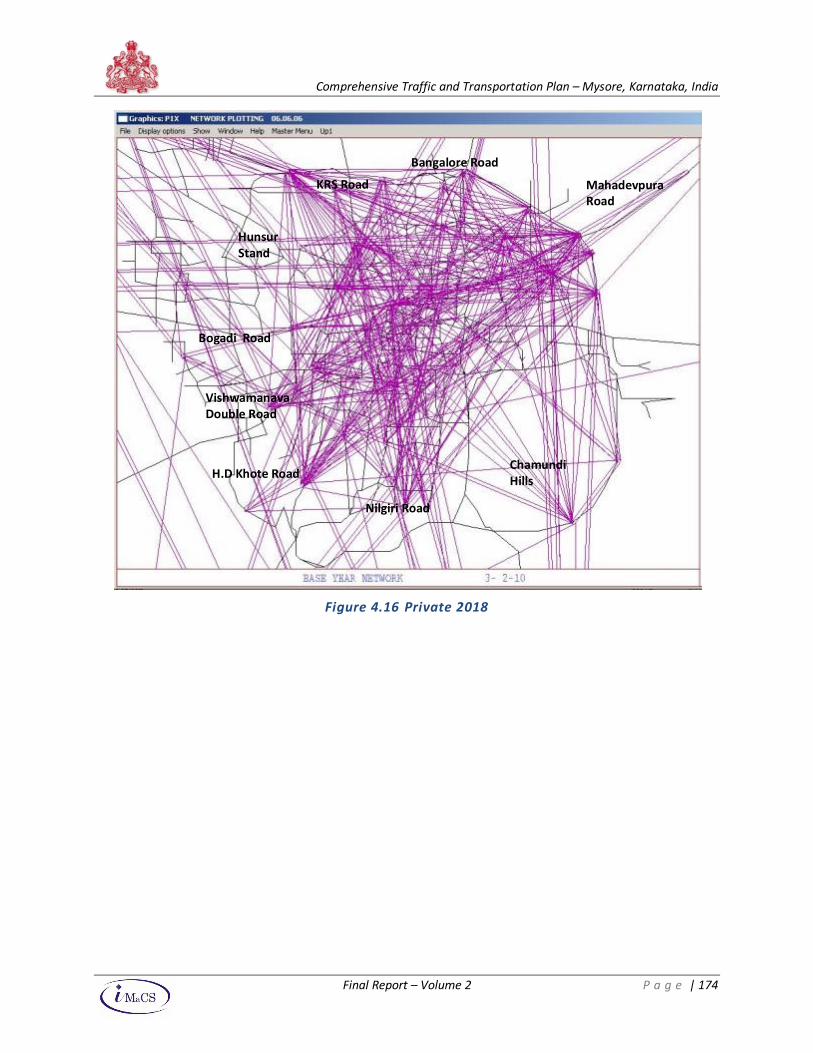
Comprehensive Traffic and Transportation Plan – Mysore, Karnataka, India
Final Report – Volume 2 P a g e | 174
Figure 4.16 Private 2018
Nilgiri Road
Chamundi
Hills
Mahadevpura
Road
Bangalore Road
KRS Road
Hunsur
Stand
Vishwamanava
Double Road
H.D Khote Road
Bogadi Road
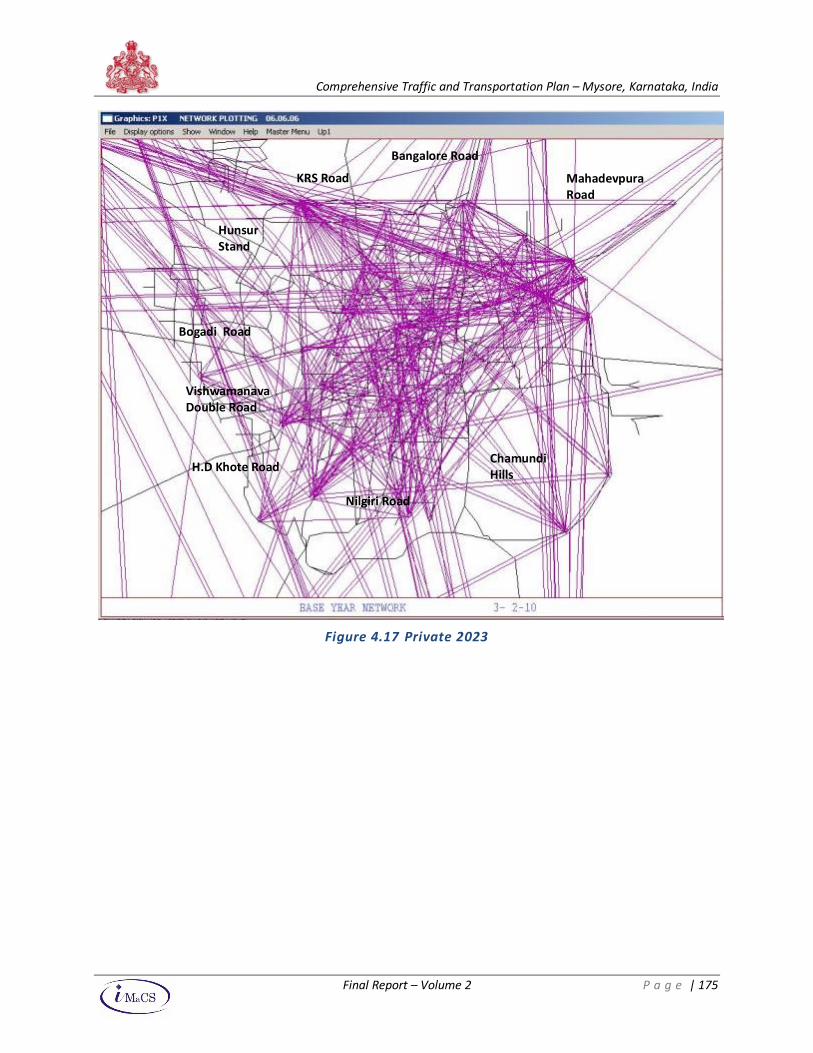
Comprehensive Traffic and Transportation Plan – Mysore, Karnataka, India
Final Report – Volume 2 P a g e | 175
Figure 4.17 Private 2023
Nilgiri Road
Chamundi
Hills
Mahadevpura
Road
Bangalore Road
KRS Road
Hunsur
Stand
Vishwamanava
Double Road
H.D Khote Road
Bogadi Road
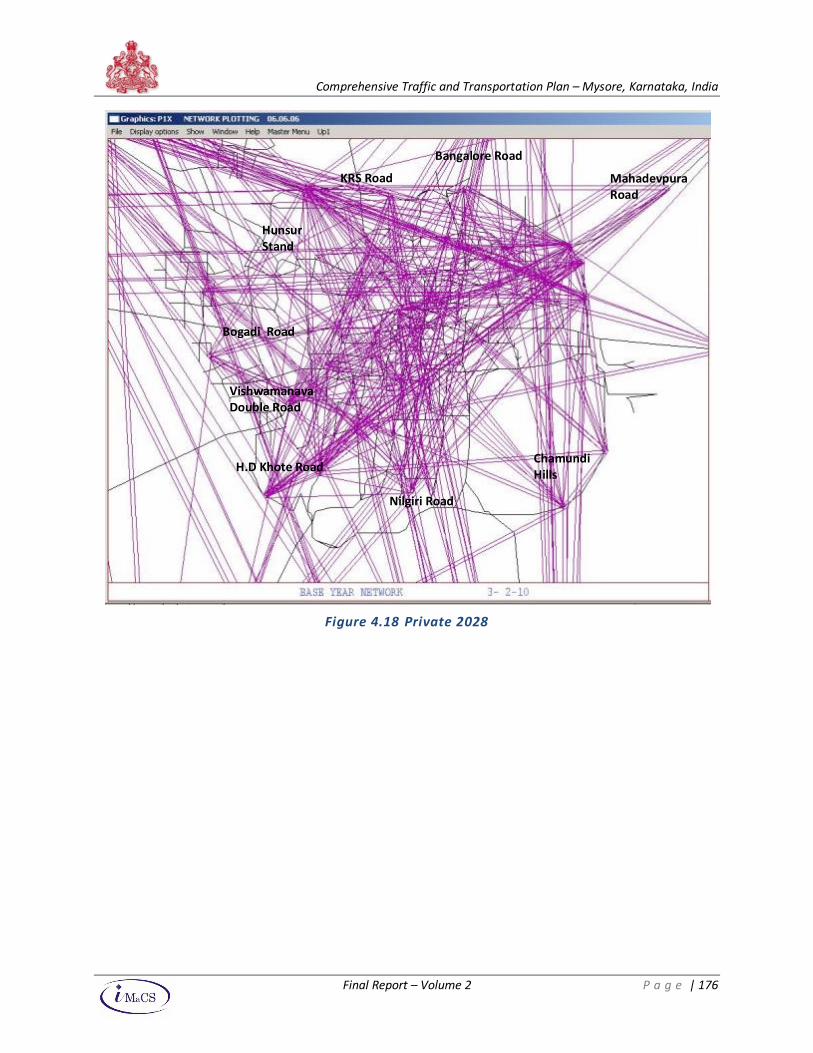
Comprehensive Traffic and Transportation Plan – Mysore, Karnataka, India
Final Report – Volume 2 P a g e | 176
Figure 4.18 Private 2028
Nilgiri Road
Chamundi
Hills
Mahadevpura
Road
Bangalore Road
KRS Road
Hunsur
Stand
Vishwamanava
Double Road
H.D Khote Road
Bogadi Road
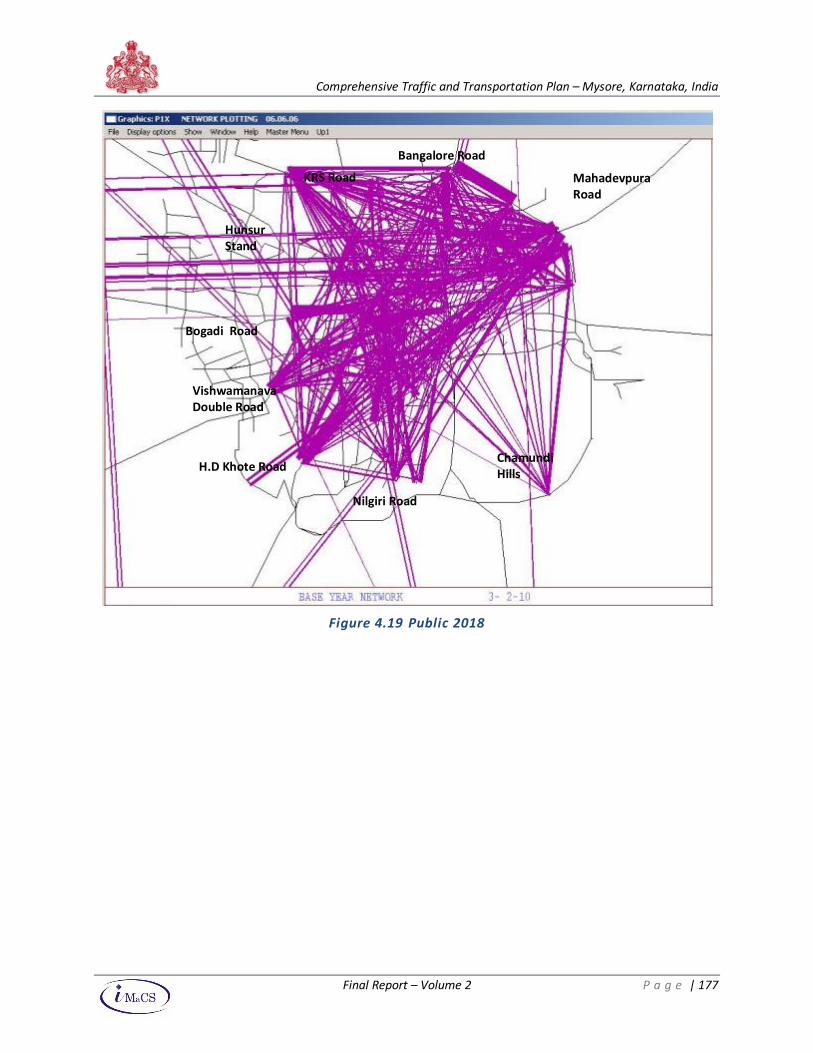
Comprehensive Traffic and Transportation Plan – Mysore, Karnataka, India
Final Report – Volume 2 P a g e | 177
Figure 4.19 Public 2018
Nilgiri Road
Chamundi
Hills
Mahadevpura
Road
Bangalore Road
KRS Road
Hunsur
Stand
Vishwamanava
Double Road
H.D Khote Road
Bogadi Road
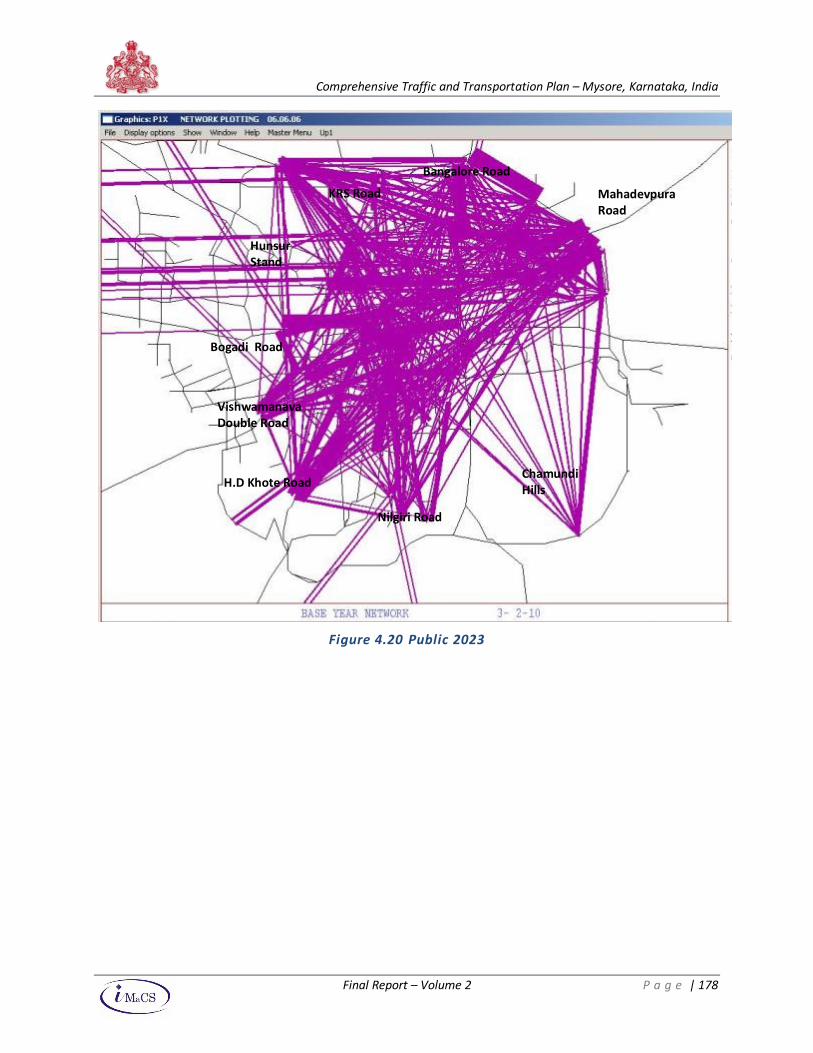
Comprehensive Traffic and Transportation Plan – Mysore, Karnataka, India
Final Report – Volume 2 P a g e | 178
Figure 4.20 Public 2023
Nilgiri Road
Chamundi
Hills
Mahadevpura
Road
Bangalore Road
KRS Road
Hunsur
Stand
Vishwamanava
Double Road
H.D Khote Road
Bogadi Road
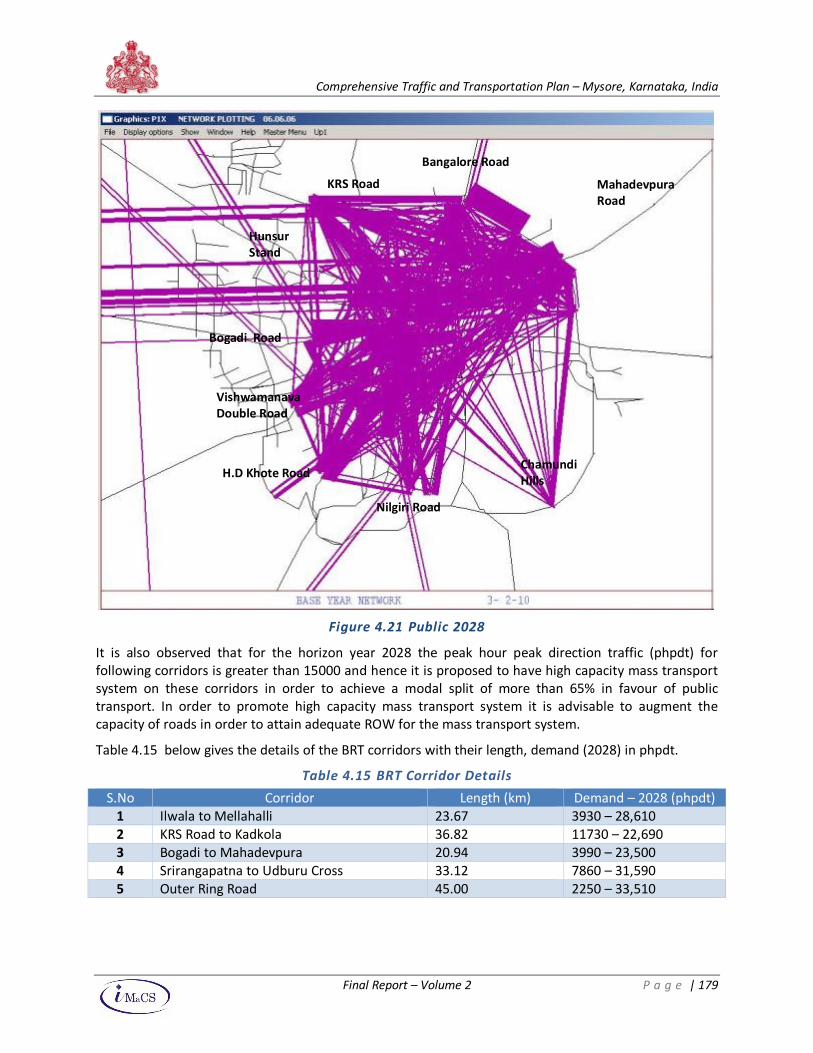
Comprehensive Traffic and Transportation Plan – Mysore, Karnataka, India
Final Report – Volume 2 P a g e | 179
Figure 4.21 Public 2028
It is also observed that for the horizon year 2028 the peak hour peak direction traffic (phpdt) for
following corridors is greater than 15000 and hence it is proposed to have high capacity mass transport
system on these corridors in order to achieve a modal split of more than 65% in favour of public
transport. In order to promote high capacity mass transport system it is advisable to augment the
capacity of roads in order to attain adequate ROW for the mass transport system.
Table 4.15 below gives the details of the BRT corridors with their length, demand (2028) in phpdt.
Table 4.15 BRT Corridor Details
S.No Corridor Length (km) Demand – 2028 (phpdt)
1 Ilwala to Mellahalli 23.67 3930 – 28,610
2 KRS Road to Kadkola 36.82 11730 – 22,690
3 Bogadi to Mahadevpura 20.94 3990 – 23,500
4 Srirangapatna to Udburu Cross 33.12 7860 – 31,590
5 Outer Ring Road 45.00 2250 – 33,510
Nilgiri Road
Chamundi
Hills
Mahadevpura
Road
Bangalore Road
KRS Road
Hunsur
Stand
Vishwamanava
Double Road
H.D Khote Road
Bogadi Road
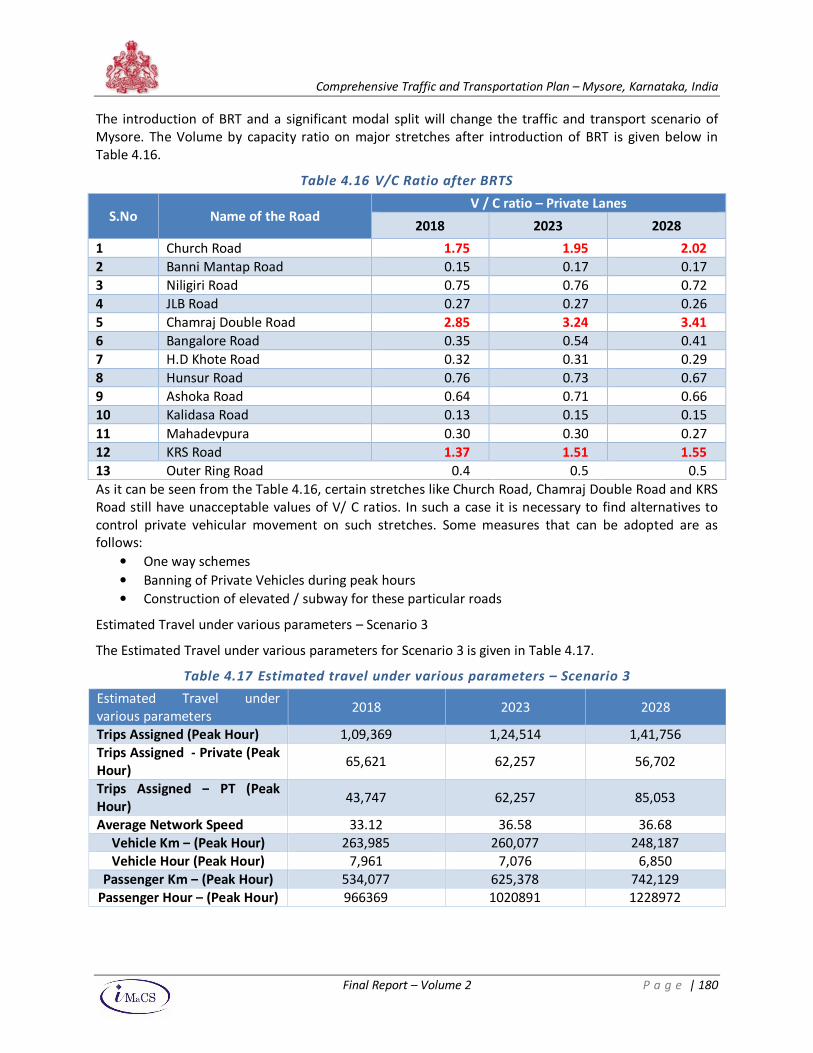
Comprehensive Traffic and Transportation Plan – Mysore, Karnataka, India
Final Report – Volume 2 P a g e | 180
The introduction of BRT and a significant modal split will change the traffic and transport scenario of
Mysore. The Volume by capacity ratio on major stretches after introduction of BRT is given below in
Table 4.16.
Table 4.16 V/C Ratio after BRTS
S.No Name of the Road V / C ratio – Private Lanes
2018 2023 2028
1 Church Road 1.75 1.95 2.02
2 Banni Mantap Road 0.15 0.17 0.17
3 Niligiri Road 0.75 0.76 0.72
4 JLB Road 0.27 0.27 0.26
5 Chamraj Double Road 2.85 3.24 3.41
6 Bangalore Road 0.35 0.54 0.41
7 H.D Khote Road 0.32 0.31 0.29
8 Hunsur Road 0.76 0.73 0.67
9 Ashoka Road 0.64 0.71 0.66
10 Kalidasa Road 0.13 0.15 0.15
11 Mahadevpura 0.30 0.30 0.27
12 KRS Road 1.37 1.51 1.55
13 Outer Ring Road 0.4 0.5 0.5
As it can be seen from the Table 4.16, certain stretches like Church Road, Chamraj Double Road and KRS
Road still have unacceptable values of V/ C ratios. In such a case it is necessary to find alternatives to
control private vehicular movement on such stretches. Some measures that can be adopted are as
follows:
• One way schemes
• Banning of Private Vehicles during peak hours
• Construction of elevated / subway for these particular roads
Estimated Travel under various parameters – Scenario 3
The Estimated Travel under various parameters for Scenario 3 is given in Table 4.17.
Table 4.17 Estimated travel under various parameters – Scenario 3
Estimated Travel under
various parameters 2018 2023 2028
Trips Assigned (Peak Hour) 1,09,369 1,24,514 1,41,756
Trips Assigned - Private (Peak
Hour) 65,621 62,257 56,702
Trips Assigned – PT (Peak
Hour) 43,747 62,257 85,053
Average Network Speed 33.12 36.58 36.68
Vehicle Km – (Peak Hour) 263,985 260,077 248,187
Vehicle Hour (Peak Hour) 7,961 7,076 6,850
Passenger Km – (Peak Hour) 534,077 625,378 742,129
Passenger Hour – (Peak Hour) 966369 1020891 1228972
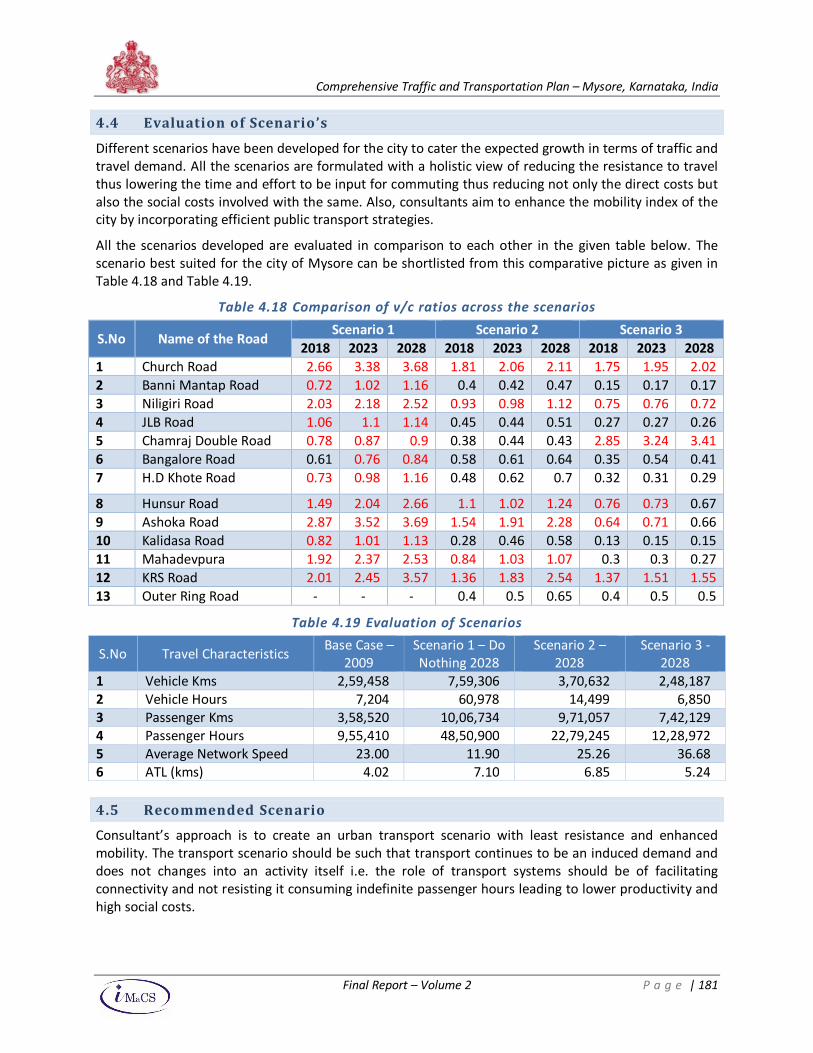
Comprehensive Traffic and Transportation Plan – Mysore, Karnataka, India
Final Report – Volume 2 P a g e | 181
4.4 Evaluation of Scenario’s
Different scenarios have been developed for the city to cater the expected growth in terms of traffic and
travel demand. All the scenarios are formulated with a holistic view of reducing the resistance to travel
thus lowering the time and effort to be input for commuting thus reducing not only the direct costs but
also the social costs involved with the same. Also, consultants aim to enhance the mobility index of the
city by incorporating efficient public transport strategies.
All the scenarios developed are evaluated in comparison to each other in the given table below. The
scenario best suited for the city of Mysore can be shortlisted from this comparative picture as given in
Table 4.18 and Table 4.19.
Table 4.18 Comparison of v/c ratios across the scenarios
S.No Name of the Road Scenario 1 Scenario 2 Scenario 3
2018 2023 2028 2018 2023 2028 2018 2023 2028
1 Church Road 2.66 3.38 3.68 1.81 2.06 2.11 1.75 1.95 2.02
2 Banni Mantap Road 0.72 1.02 1.16 0.4 0.42 0.47 0.15 0.17 0.17
3 Niligiri Road 2.03 2.18 2.52 0.93 0.98 1.12 0.75 0.76 0.72
4 JLB Road 1.06 1.1 1.14 0.45 0.44 0.51 0.27 0.27 0.26
5 Chamraj Double Road 0.78 0.87 0.9 0.38 0.44 0.43 2.85 3.24 3.41
6 Bangalore Road 0.61 0.76 0.84 0.58 0.61 0.64 0.35 0.54 0.41
7 H.D Khote Road 0.73 0.98 1.16 0.48 0.62 0.7 0.32 0.31 0.29
8 Hunsur Road 1.49 2.04 2.66 1.1 1.02 1.24 0.76 0.73 0.67
9 Ashoka Road 2.87 3.52 3.69 1.54 1.91 2.28 0.64 0.71 0.66
10 Kalidasa Road 0.82 1.01 1.13 0.28 0.46 0.58 0.13 0.15 0.15
11 Mahadevpura 1.92 2.37 2.53 0.84 1.03 1.07 0.3 0.3 0.27
12 KRS Road 2.01 2.45 3.57 1.36 1.83 2.54 1.37 1.51 1.55
13 Outer Ring Road - - - 0.4 0.5 0.65 0.4 0.5 0.5
Table 4.19 Evaluation of Scenarios
S.No Travel Characteristics Base Case –
2009
Scenario 1 – Do
Nothing 2028
Scenario 2 –
2028
Scenario 3 -
2028
1 Vehicle Kms 2,59,458 7,59,306 3,70,632 2,48,187
2 Vehicle Hours 7,204 60,978 14,499 6,850
3 Passenger Kms 3,58,520 10,06,734 9,71,057 7,42,129
4 Passenger Hours 9,55,410 48,50,900 22,79,245 12,28,972
5 Average Network Speed 23.00 11.90 25.26 36.68
6 ATL (kms) 4.02 7.10 6.85 5.24
4.5 Recommended Scenario
Consultant’s approach is to create an urban transport scenario with least resistance and enhanced
mobility. The transport scenario should be such that transport continues to be an induced demand and
does not changes into an activity itself i.e. the role of transport systems should be of facilitating
connectivity and not resisting it consuming indefinite passenger hours leading to lower productivity and
high social costs.
Comprehensive Traffic and Transportation Plan – Mysore, Karnataka, India
Final Report – Volume 2 P a g e | 182
All the scenarios discussed above have their own set of pros and cons. Still, scenario 3 where consultants
propose a high modal split for public transport and support the modal share assumption by proposing a
Rapid Transit System i.e. BRTS, is considered to be the best scenario achieved.
The reasoning behind considering the scenario 3 to be of high utility value is
i. Higher modal split in favour of PT
ii. Provision of Bus Rapid Transit System to stimulate modal shift from private to public
iii. Incorporation of all existing proposals regarding capacity augmentation
iv. Proposal of capacity augmentation on critical road sections
Bus rapid transit system includes variety of public transportation systems that will use buses to provide
a service that is of a higher speed than an ordinary bus line. This will be achieved by making
improvements to existing infrastructure, vehicles and scheduling. The goal of this system will be to
achieve the service quality of rail transit still enjoying the cost effectiveness of bus transit.


