Embed Size (px)
Citation preview
Enhancing “Mobility” through Integrated Transportation
and Traffic Management
By
H. S. SUDHIRA
Research Scholar, Ph. D., Department of Management Studies
and Centre for Sustainable Technologies, Indian Institute of Science,
Bangalore – 560 012 [email protected]
January, 2007
Bangalore Mahanagara Palike (BMP)
N. R. Square,
Bangalore – 560 002
Enhancing ‘Mobility’ through Integrated Transportation and Traffic Management
Executive Summary
During the course of preparation of a master plan for the transportation networks in
Bangalore city, mapping the various initiatives and interventions planned towards
addressing mobility, existing situation and implications of some of the proposed
interventions was analysed. The inferences are based on existing transportation
network; synthesis of various transportation related studies and proposed
infrastructure initiatives (road works) in Bangalore. Broadly, they can be
summarized as following five aspects:
I. Need for “reclassifying” existing road networks (arterial and sub-arterial)
with effective geospatial database in the back-end.
II. The proposed Core Ring Road at surface grade may not be feasible.
III. Current interventions encouraging more independent motorable transport by
way of road widening, construction of underpasses, flyovers and grade-
separators would not ease traffic congestion when addressed in isolation.
IV. Factors affecting time and cost-overruns in infrastructure projects and ways to
tackle are discussed.
V. Initiatives required for addressing effective planning for operations
recommended.
Elaborating the above five aspects, factors leading to these are briefly noted below:
1. “Reclassifying” existing road networks based on a geospatial database
a. BMP has notified 96 arterial roads and 118 sub-arterial roads following
directions from the Honourable High Court.
b. During the course of mapping these along with other ongoing and
proposed interventions related to road infrastructure, it was found that
there are significant inconsistencies in ascribing arterial and sub-arterial
roads.
H. S. Sudhira i
Enhancing ‘Mobility’ through Integrated Transportation and Traffic Management
c. Initiatives like, IT-BT roads, Flood damaged roads, roads identified for
widening etc. does not impress the notion of arterial or sub-arterial roads.
d. Studies carried out on transportation networks have identified corridors of
high and medium density traffic flows. Some these corridors do not
reflect among the list notified by BMP as arterial roads.
e. As a way forward, it is recommended to undertake “reclassifying” road
networks based on criteria enclosed as Annexure A.
f. The entire road network should be mapped on a spatial database with the
template recommended and used for operational planning and
management of various road infrastructure works.
2. The concept of developing a core ring road at surface grade level in the proposed
alignment may not be feasible for the following reasons:
a. The notion of a core ring road (as an expressway) is to facilitate enhanced
mobility by motorable vehicles without any obstruction of passage across
any intersections with traffic movement as primary consideration and not
access to property.
b. However, the proposed alignment already has numerous properties being
part of older and central city for which restricting any property access
would become ill-conceived and impractical with construction of CRR at
surface grade level.
c. In the proposed alignment, the entire stretch is not conceived for “signal
free passage” and hence very purpose of core ring road is defeated.
d. With 50 intersections along the CRR and only about 13 junction
improvements proposed (underpasses and flyovers) mobility along CRR
would still instil waiting at various intersections.
e. The entire alignment is not a fresh alignment, but over existing road
networks alongside existing properties of various types. A review of the
existing studies suggests that some of the segments of CRR are high and
medium density corridors with some other interventions are conceived
over these.
H. S. Sudhira ii
Enhancing ‘Mobility’ through Integrated Transportation and Traffic Management
f. The alignment is mostly on already built-up area and constructing a 4-lane
at surface grade would call for acquisition and consequent legal challenges
across the entire alignment. Noting that some segments of CRR pass
through older city areas, wherein existing road networks are 2-lane, it
would be a challenging task to implement this project without any hurdles
in the scheduled time.
g. There are already some interventions for junction improvements (like,
Mekhri circle and Dairy circle) while another 13 interventions are
proposed. Unless, all these interventions are taken up collectively instead
of interventions in isolation, traffic congestion will not be arrested but
aggravated.
h. However, an elevated core ring road might suffice to fulfil
abovementioned objectives.
3. Current interventions encouraging more independent motorable transport by
way of road widening, construction of underpasses, flyovers and grade-
separators would not ease traffic congestion when addressed in isolation. The
same when analysed under the perspective of Braess Paradox and Systems
Analysis reveal that such interventions would only intensify the traffic
congestion.
a. Braess Paradox: In a congested road network, German scientist, Braess had
demonstrated that adding a link within the network to ease congestion
would be counter-intuitive. Thus, the average time spent in the entire
network would only increase instead of reducing travel time.
b. Systems Analysis: Based on systems analysis for current approaches in
addressing mobility to ease congestion, it reveals that any measures by
way of encouraging mobility of independent motorable transport by way
of road widening, construction of underpasses, flyovers and grade-
separators in the absence of favourable mass transit systems, traffic
congestion will increase and encourages more outgrowth of city inducing
more sprawl areas.
H. S. Sudhira iii
Enhancing ‘Mobility’ through Integrated Transportation and Traffic Management
4. Analysis and discussion with BMP engineers on factors for time and cost-
overruns in various infrastructure projects are outlined below while the ways to
tackle are discussed in the report.
a. Shifting of utilities
b. Traffic diversion
c. Acceptance by public/locals
d. Handing over the site in the light of unclear title documents
e. Administrative delays in getting appropriate approvals at various levels
both internal (Council) and external (other agencies, like BMRCL)
f. Escalation of costs of materials from the time of tender to actual issue of
work order
g. Acquisition of land
h. Surprise legal hurdles
i. Improper tender documents
j. Accountability of BMP Engineers in-charge of the project and Contractor
responsible for executing the project
k. Incentives / Sanctions on BMP Engineers and Contractors towards
successful execution of the project
5. A significant aspect relating to immediate steps to be taken up by BMP for
addressing effective planning for operations are recommended. Tagged as Silicon
Valley and IT City, it is apt for BMP to transform its organisation by adopting
relevant technologies and Policies that aid in operational planning and
management.
a. An essential aspect required for operations planning and management is
INFORMATION. Unfortunately, BMP does not stand in good position
with regard to the nature of information relating to Mobility. Thus, an
appropriate Cell addressing Data Collection, Analysis and Sharing for
effective operations is suggested. Alongside the development of spatial
H. S. Sudhira iv
Enhancing ‘Mobility’ through Integrated Transportation and Traffic Management
database for road networks, the Cell should integrate and coordinate the
various activities outlined further.
b. As a means towards addressing mobility in general and traffic congestion
in particular, Intelligent Transport Systems (ITS) are required for:
i. Activity tracking and online tracking, monitoring of vehicular
movement: This is possible by enforcing Radio Frequency-based ID
(RFID) tags installed to all vehicles that ply within city limits. Such
tags would flush in thousands of data clouds for vehicular traffic
movement along various segments that can be tracked, visualised
through appropriate systems for effective management. The same is
elaborated in the report.
ii. Automated / synchronised traffic signals: With the possibility of
collecting data online through RFID, traffic signals can be
effectively synchronised and automated.
c. Policies curtailing Congestion and Traffic Growth through some Smart
Growth options:
i. Enforcing additional cess/tax for vehicles plying in the central city.
ii. Additional/heavy tax for vehicles discouraging independent
motorable transport.
iii. Introduction / encouragement of utilising bicycles for mobility in
short distances and central areas without any motorable transport
apart from mass transit.
iv. Acknowledging implications of changing land use on mobility to
discourage any inappropriate and inefficient land use.
v. Effective enforcement and regulation of the above with strong
administrative and political will.
d. Tracking progress through Performance Measures: In the absence of any
performance measures the direction of interventions/progress or their
effectiveness is unknown. A set of performance measures essential to track
the progress of various interventions towards addressing mobility are
elaborated in the report.
H. S. Sudhira v
Enhancing ‘Mobility’ through Integrated Transportation and Traffic Management
Acknowledgement My aspiration of undergoing Internship at Bangalore Mahanagara Palike was made possible
by Shri. K. Jairaj, Commissioner, Bangalore Mahanagara Palike, Bangalore. I am extremely
grateful to Prof. K. B. Akhilesh, Department of Management Studies, Indian Institute of
Science for timely and necessary help that proved to be a catalyst in the process. Words are
inadequate to convey the gratitude to Shri. K. Jairaj for encouraging and facilitating me to
undergo the internship. His support, motivation, encouragement and ever spirited advice
have enabled in the completion of this report.
I would like to express my heartfelt gratitude and thankfulness to Shri. B. N. Viswanath,
Technical Advisor, JNNURM Project Office, BMP for his kind advice, encouragement and
support throughout the period of my internship.
I take this opportunity to thank Shri. Gaurav Gupta, Special Commissioner, BMP for kind
support and fruitful discussions that helped in shaping up this report. My sincere thanks are
due to Shri. Harsh Gupta, Joint Commissioner (Works), BMP for permitting me to have
access to necessary details and discussions during the course of my internship. I am also
thankful to Shri. Venkataramana Naik, Joint Commissioner (Admin), BMP for
encouragement and support.
I am thankful to Shri. Mandanna, Special Officer to Commissioner, BMP and Shri.
Ravindra, PS to Commissioner, BMP for priceless discussions, invaluable insights and
support during the period. I am grateful to Shri. A. M. Ranganath and Shri H. Rajasimha
for the numerous discussions, advice and timely suggestions during the period. It is my
pleasure to recognize and be grateful to the support provided by all the officials of
Bangalore Mahanagara Palike and especially Shri. Jaiprasad, Shri. Manjunath and Shri.
Kiran and all officials and staff at JNNURM Project Office, BMP.
I would like to thank my thesis advisors: Prof. T. V. Ramachandra and Prof. M. H. Bala
Subrahmanya, Indian Institute of Science, for facilitating my internship at BMP.
H. S. Sudhira Bangalore, India
H. S. Sudhira vi
Enhancing ‘Mobility’ through Integrated Transportation and Traffic Management
Table of Contents
EXECUTIVE SUMMARY.................................................................................................................................. I ACKNOWLEDGEMENT ................................................................................................................................VI TABLE OF CONTENTS ................................................................................................................................ VII
List of Figures ............................................................................................................................................ viii List of Tables.............................................................................................................................................. viii List of Maps................................................................................................................................................ viii List of Abbreviations .................................................................................................................................. viii
1 INTRODUCTION....................................................................................................................................... 1 1.1 MOBILITY IN URBAN AREAS ................................................................................................................. 1 1.2 OBJECTIVES OF THE STUDY .................................................................................................................. 3 1.3 INDICATORS FOR MEASURING MOBILITY .............................................................................................. 4
2 SITUATION IN BANGALORE ................................................................................................................ 7 2.1 STATUS AND TRENDS OF MOBILITY IN BANGALORE ............................................................................. 8
2.1.1 Road Network ................................................................................................................................. 9 2.1.2 Rail Network ................................................................................................................................. 10 2.1.3 Air Travel...................................................................................................................................... 11 2.1.4 Vehicular Profile .......................................................................................................................... 11
2.2 OVERVIEW OF ORGANISATIONS ADDRESSING MOBILITY .................................................................... 13 2.3 REVIEW OF TRAFFIC AND TRANSPORTATION STUDIES IN BANGALORE .............................................. 13
2.3.1 Tracing the recent history of infrastructure related initiatives in Bangalore ............................... 15 2.4 CLASSIFICATION OF ROADS – TOWARDS STANDARDISATION............................................................. 16 2.5 SPATIAL DATABASE AND MAPS IDENTIFYING JUNCTIONS AND SEGMENTS FOR INTERVENTION........... 23
3 BMP’S INITIATIVES IN ADDRESSING MOBILITY ........................................................................ 32 3.1 UPCOMING PROPOSALS ADDRESSING MOBILITY UNDER JNNURM..................................................... 32
4 SYSTEMS ANALYSIS FOR ADDRESSING MOBILITY................................................................... 34 4.1 IDENTIFYING THE VARIABLES – IDENTIFYING THE CAUSES FOR CONGESTION .................................... 35 4.2 REPRESENTATIONS THROUGH CAUSAL LOOP DIAGRAMS................................................................... 35 4.3 SYSTEMS ANALYSIS ........................................................................................................................... 36
5 ANALYSING FOR TIME- AND COST-OVERRUNS: EXPERIENCES FROM PREVIOUS INITIATIVES ..................................................................................................................................................... 38
5.1 KEY ISSUES RESPONSIBLE................................................................................................................... 38 5.2 WAYS TO TACKLE .............................................................................................................................. 39
6 FUTURE INITIATIVES - MECHANISMS FOR ENSURING COORDINATION........................... 41 6.1 INTEGRATING PLANNING AND OPERATIONS....................................................................................... 41
6.1.1 Planning for Operations through Coordination ........................................................................... 41 6.1.2 A Common Geographic Unit: Key for Coordination.................................................................... 42
6.2 GATHERING INFORMATION: TECHNOLOGICAL INTERVENTIONS ......................................................... 43 6.3 TRACKING PROGRESS THROUGH PERFORMANCE MEASURES.............................................................. 47 6.4 CONCLUSIONS .................................................................................................................................... 48
7 REFERENCES.......................................................................................................................................... 50 ANNEXURE ....................................................................................................................................................... 51
Annexure A: Classification Criteria for Roads ........................................................................................... 52 Annexure B: Traffic Volumes and Congestion Indices of Important Intersections (Source: KRDCL, 2002).................................................................................................................................................................... 53 Annexure C: List of Roads Identified for Widening under TDR for Phase 1 .............................................. 54
H. S. Sudhira vii
Enhancing ‘Mobility’ through Integrated Transportation and Traffic Management
List of Figures FIGURE 1: POPULATION GROWTH OF BANGALORE CITY DURING 1871 - 2005......................................................... 8 FIGURE 2: TRAFFIC PLYING ACROSS THE CORPORATION CIRCLE........................................................................... 12 FIGURE 3: CAUSAL LOOP DIAGRAM OF EXISTING PRACTICES TO REDUCE CONGESTION AND IMPLICATIONS ....... 36 FIGURE 4: URBAN SPRAWL ACROSS BANGALORE, 1992-2000............................................................................... 37 FIGURE 5: MICRO-SIMULATION OF ROAD TRAFFIC BY MARTIN TREIBER, (2005)................................................... 45 FIGURE 6: REPRESENTATION OF TRAFFIC STATUS ONLINE ALONG THE NATIONAL HIGHWAYS (AUTOBAHNS) OF
NORTH-WESTERN STATE OF GERMANY........................................................................................................ 46
List of Tables TABLE 1: VEHICLE POPULATION IN BANGALORE CITY (SOURCE: BANGALORE TRAFFIC POLICE, 2006)................. 2 TABLE 2: INCIDENCE OF ROAD ACCIDENTS (SOURCE: BANGALORE TRAFFIC POLICE, 2006) .................................. 3 TABLE 3: SAMPLE CONGESTION PERFORMANCE MEASURES................................................................................... 6 TABLE 4: TOTAL DOMESTIC AND INTERNATIONAL PASSENGER TRAFFIC (SOURCE: AIRPORTS AUTHORITY OF
INDIA).......................................................................................................................................................... 11 TABLE 5: COMPOSITION OF VEHICLES BY TYPE (SOURCE: BANGALOREIT.IN)...................................................... 12 TABLE 6: ORGANISATIONS ADDRESSING MOBILITY IN BANGALORE CITY............................................................. 13 TABLE 7: ROADS AND CORRIDOR DETAILS ........................................................................................................... 16 TABLE 8: IDECK-RITES CORRIDORS AND ARTERIAL ROADS ................................................................................. 17 TABLE 9: IDECK-RITES CORRIDORS AND INTERVENTIONS PLANNED ................................................................... 19 TABLE 10: PROJECT STATUS UNDER JNNURM..................................................................................................... 33 TABLE 11: POSSIBLE METRICS / INDICATORS ........................................................................................................ 46 TABLE 12: MOBILITY PERFORMANCE MEASURES ................................................................................................. 48
List of Maps MAP 1: MAJOR TRANSPORTATION NETWORKS...................................................................................................... 24 MAP 2: ROADS IDENTIFIED FOR WIDENING ........................................................................................................... 25 MAP 3: IT - BT CORRIDORS .................................................................................................................................. 26 MAP 4: HIGH-MEDIUM CORRIDORS IDENTIFIED BY RITES/IDECK ........................................................................ 27 MAP 5: CORE RING ROADS - SEGMENTS AND JUNCTIONS ..................................................................................... 28 MAP 6: INTERSECTIONS IDENTIFIED BY KRDCL ................................................................................................... 29 MAP 7: PROJECT STATUS UNDER JNNURM.......................................................................................................... 30
List of Abbreviations
AR ARTERIAL ROAD BDA BANGALORE DEVELOPMENT AUTHORITY BESCOM BANGALORE ELECTRICITY SUPPLY COMPANY LTD. BMP BANGALORE MAHANAGARA PALIKE BMRC BANGALORE METRO RAIL CORPORATION BMRDA BANGALORE METROPOLITAN REGION DEVELOPMENT AUTHORITY BMTC BANGALORE METROPOLITAN TRANSPORT CORPORATION BWSSB BANGALORE WATER SUPPLY AND SEWERAGE BOARD CDP COMPREHENSIVE DEVELOPMENT PLAN CSDP CITY STRATEGIC DEVELOPMENT PLAN CMC CITY MUNICIPAL COUNCIL CRR CORE RING ROAD CRRI CENTRAL ROAD RESEARCH INSTITUTE DOT DEPARTMENT OF TRANSPORT GOI GOVERNMENT OF INDIA
H. S. Sudhira viii
Enhancing ‘Mobility’ through Integrated Transportation and Traffic Management
GOK GOVERNMENT OF KARNATAKA IDIP INFRASTRUCTURE DEVELOPMENT AND INVESTMENT PLAN IISC INDIAN INSTITUTE OF SCIENCE IRC INDIAN ROAD CONGRESS IRR INTERNAL RING ROAD IDECK INFRASTRUCTURE DEVELOPMENT CORPORATION OF KARNATAKA JNNURM JAWAHARLAL NEHRU NATIONAL URBAN RENEWAL MISSION KRDCL KARNATAKA ROAD DEVELOPMENT CORPORATION LIMITED KSPCB KARNATAKA STATE POLLUTION CONTROL BOARD KUID&FC KARNATAKA URBAN INFRASTRUCTURE DEVELOPMENT AND FINANCE
CORPORATION MUD MINISTRY OF URBAN DEVELOPMENT MUEPA MINISTRY OF URBAN EMPLOYMENT AND POVERTY ALLEVIATION NUTP NATIONAL URBAN TRANSPORT POLICY ORR OUTER RING ROAD PRR PERIPHERAL RING ROAD SAR SUB-ARTERIAL ROAD TDR TRANSFER OF DEVELOPMENT RIGHTS TMC TOWN MUNICIPAL COUNCIL UDD URBAN DEVELOPMENT DEPARTMENT, GOVT. OF KARNATAKA
H. S. Sudhira ix
Enhancing ‘Mobility’ through Integrated Transportation and Traffic Management
1 Introduction
1.1 Mobility in urban areas
Mobility is an important aspect of any urban system. Most activities in an urban area involve
mobility either for people or goods. Further, the efficiency of city functions is determined by
the level of service achieved in terms of mobility of people and goods. Collectively mobility
is mostly achieved through different modes of transportation. There can be individual
modes of transportation for mobility of people (2-wheelers, passenger cars, etc.) to public
transport (high capacity bus, metro-rails, etc.) apart from goods carriers like heavy goods
transport vehicles and others that can ply on transportation network of the city. Typically in
India, transportation network is characterised by the vast road networks aided by fuel-
driven automobiles. Some cities may also have intercity rail networks or any form of mass
transit system that cater to address mobility of people, thereby leaving the remaining
transportation networks (mostly roads) for mobility of goods and some individual
transportation.
The consequence of lack of integrated planning both at regional and national level has also
had implications on the national economy as well. With the rise in usage of individual motor
transport, the demand for petroleum products has seen a sharp increase bearing a significant
impact on the foreign exchange reserves. According to the recent Economic Survey (Ministry
of Finance, 2006) the sharp rise in global crude prices has resulted increased imports of
petroleum, oil and lubricants (POL) by 46.9 per cent in April-January, 2005-06. The rise in oil
imports has gone up from Rs. 136 crores in 1970-71 to Rs. 106875 crores during 2005.
In the light of rampant urbanization India is currently facing and the consequent urban
sprawl, the implications above mentioned would persist in most of our cities. Apart from the
local problems that are caused by large scale individual transportation, the dependence on
foreign resources (oil) may not be self-reliant and sustainable. This problem is already
impacting the national economy at a macro-level and hence the need of the hour is an
effective national policy and mechanisms to address these issues. In this context, the
Ministry of Urban Development, Government of India, has come up with the “National
Urban Transport Policy (NUTP)” approved on 4th April 2006. However, effective
mechanisms to address these issues primarily at city level aided by appropriate support
H. S. Sudhira 1
Enhancing ‘Mobility’ through Integrated Transportation and Traffic Management
from the central government are to be channelised and operationalised through the
Jawaharlal Nehru National Urban Renewal Mission funding to these cities. A key distinction
of NUTP (Ministry of Urban Development, 2006) is on the notion of addressing mobility of
‘people’ over ‘vehicles’. Thus, the NUTP has the primary aim to ensure easily accessible,
safe, affordable, quick, comfortable, reliable and sustainable mobility for all and thus outline
the following objectives:
1. Reduce the existing levels of congestion,
2. Reduce the impact of motor vehicles on urban air pollution,
3. Improve road safety, and
4. Foster the use of sustainable technologies that minimize the consumption of imported
fuels in urban transport and thus preserve the country’s energy security.
It should be noted that among the above four objectives, by the shear magnitude of vehicles,
a consequent congestion has resulted in most of our cities thus leading to urban air pollution
and reduced road safety. Thus easing the levels of congestion is a key aspect that needs
more attention. In this report, easing the levels of congestion has been elaborated in detail.
In the absence of effective mass transit systems in most cities of India, individual mobility
has risen resulting in the rapid growth in the number of motor vehicles in these cities, far
outpacing the growth in the urban population. Table 1 shows how the number of registered
motor vehicles has increased, in Bangalore, during the last few years. The rising number of
motor vehicles has led to severe congestion on the roads. As a result of the large number of
vehicles on the roads, there has also been a rapid deterioration in the air quality. Again, as a
direct consequence of air pollution, this is also resulting in health related risks. The growth
in motor vehicle use has also led to an increase in the number of road accidents, thus
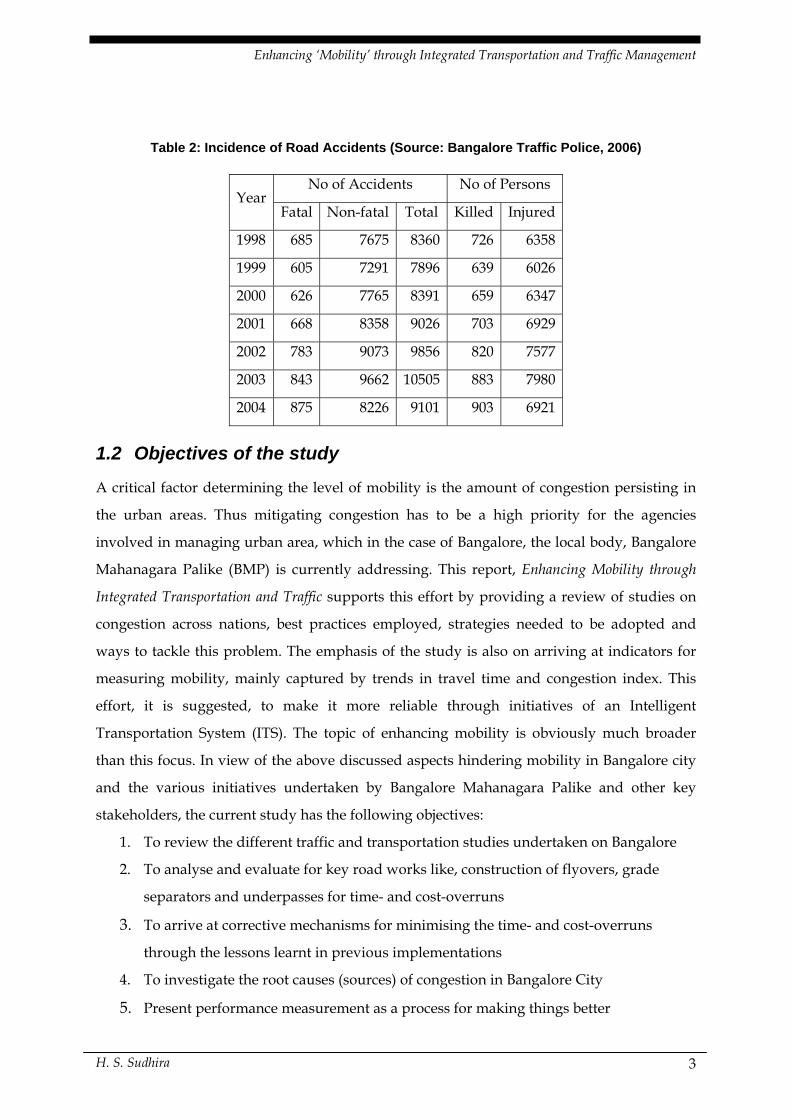
compromising on the safety of road transport. Table 2 gives the year wise road accident
statistics and the number of deaths caused due to road traffic in Bangalore.
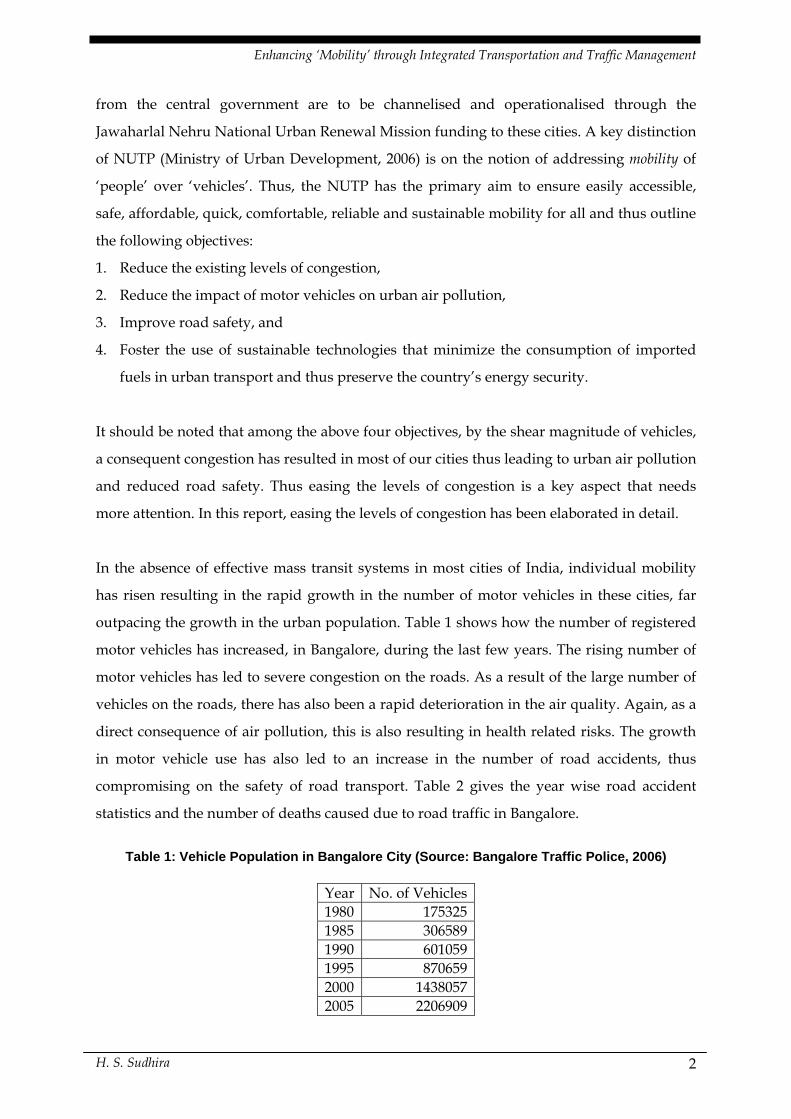
Table 1: Vehicle Population in Bangalore City (Source: Bangalore Traffic Police, 2006)
Year No. of Vehicles 1980 175325 1985 306589 1990 601059 1995 870659 2000 1438057 2005 2206909
H. S. Sudhira 2
Enhancing ‘Mobility’ through Integrated Transportation and Traffic Management
Table 2: Incidence of Road Accidents (Source: Bangalore Traffic Police, 2006)
No of Accidents No of Persons Year
Fatal Non-fatal Total Killed Injured
1998 685 7675 8360 726 6358
1999 605 7291 7896 639 6026
2000 626 7765 8391 659 6347
2001 668 8358 9026 703 6929
2002 783 9073 9856 820 7577
2003 843 9662 10505 883 7980
2004 875 8226 9101 903 6921
1.2 Objectives of the study
A critical factor determining the level of mobility is the amount of congestion persisting in
the urban areas. Thus mitigating congestion has to be a high priority for the agencies
involved in managing urban area, which in the case of Bangalore, the local body, Bangalore
Mahanagara Palike (BMP) is currently addressing. This report, Enhancing Mobility through
Integrated Transportation and Traffic supports this effort by providing a review of studies on
congestion across nations, best practices employed, strategies needed to be adopted and
ways to tackle this problem. The emphasis of the study is also on arriving at indicators for
measuring mobility, mainly captured by trends in travel time and congestion index. This
effort, it is suggested, to make it more reliable through initiatives of an Intelligent
Transportation System (ITS). The topic of enhancing mobility is obviously much broader
than this focus. In view of the above discussed aspects hindering mobility in Bangalore city
and the various initiatives undertaken by Bangalore Mahanagara Palike and other key
stakeholders, the current study has the following objectives:
1. To review the different traffic and transportation studies undertaken on Bangalore
2. To analyse and evaluate for key road works like, construction of flyovers, grade
separators and underpasses for time- and cost-overruns
3. To arrive at corrective mechanisms for minimising the time- and cost-overruns
through the lessons learnt in previous implementations
4. To investigate the root causes (sources) of congestion in Bangalore City
5. Present performance measurement as a process for making things better
H. S. Sudhira 3
Enhancing ‘Mobility’ through Integrated Transportation and Traffic Management
1.3 Indicators for measuring mobility
Among the recent trends in measuring mobility, by way of capturing the amount of
congestion is mostly represented by volumes of traffic (level of service) plying on the road
network. However a key deviation this report suggests is measuring congestion based on
travel time. It is noted that while most transportation studies have used other types of
metrics to measure congestion, travel time is a more direct measure of how congestion
affects users.
Monitoring congestion is just one of the several aspects of transportation system
performance that leads to more effective investment decisions for transportation
improvements. Safety, physical condition, environmental quality, economic development,
quality of life, and customer satisfaction are among the aspects of performance that also
require monitoring. Congestion is intertwined with all of these other categories since higher
congestion levels have been associated with their degradation.
Travel time is understood by a wide variety of audiences – both technical and non-technical
– as a way to describe the performance of the transportation network. The congestion
metrics suggested in this Report is based on this concept.
Travel Time as the Basis for Congestion Performance Measures
The performance of the highway system in terms of how efficiently users can traverse it may
be described in three basic terms: congestion, mobility, and accessibility. While researchers
have different definitions of these terms, we have found it useful to define them as follows:
• Congestion – Describes the travel conditions on facilities;
• Mobility – Describes how well users can complete entire trips; and
• Accessibility – Describes how close opportunities (e.g., jobs, shopping) are spaced in
terms of the user’s ability to access them through the transportation system.
Congestion and mobility are very closely related and the same metrics and concepts can be
used to monitor both. Accessibility is a relatively new concept and requires a different set of
metrics. Most the data that are currently available describe facility performance, not trip
performance although new technologies are emerging that will allow for direct monitoring
of entire trips. One of the principles that United States Highway Administration has
H. S. Sudhira 4
Enhancing ‘Mobility’ through Integrated Transportation and Traffic Management
established for monitoring congestion as part of its annual performance plan is that
meaningful congestion performance measures must be based on the measurement of travel
time. Travel times are easily understood by practitioners and the public, and are applicable
to both the user and facility perspectives of performance.
Temporal Aspects of Congestion: Measuring congestion by times of the day and day of
week has a long history in transportation. A relatively new twist on this is the definition of a
weekday “peak period” – multiple hours rather than the traditional peak hour. In many
metropolitan areas, particularly the larger ones, congestion now lasts three or more hours
each weekday morning and evening. In other words, over time, congestion has spread into
more hours of the day as commuters leave earlier or later to avoid the traditional rush hour.
Definition of peak periods is critical in performing comparisons. For example, consider a
three-hour peak period. In smaller cities, congestion may usually only last for one hour –
better conditions in the remaining two hours will “dilute” the metrics. One way around this
is not to establish a fixed time period in which to measure congestion, but rather determine
how long congestion exists (e.g., percent of time where operating conditions are below a
threshold.)
Spatial Aspects of Congestion: Congestion spreads not only in time but in space as well.
Queues from physical bottlenecks and major traffic-influencing events (like traffic incidents)
can extend for many miles. Congestion measures need to be sensitive to this by tracking
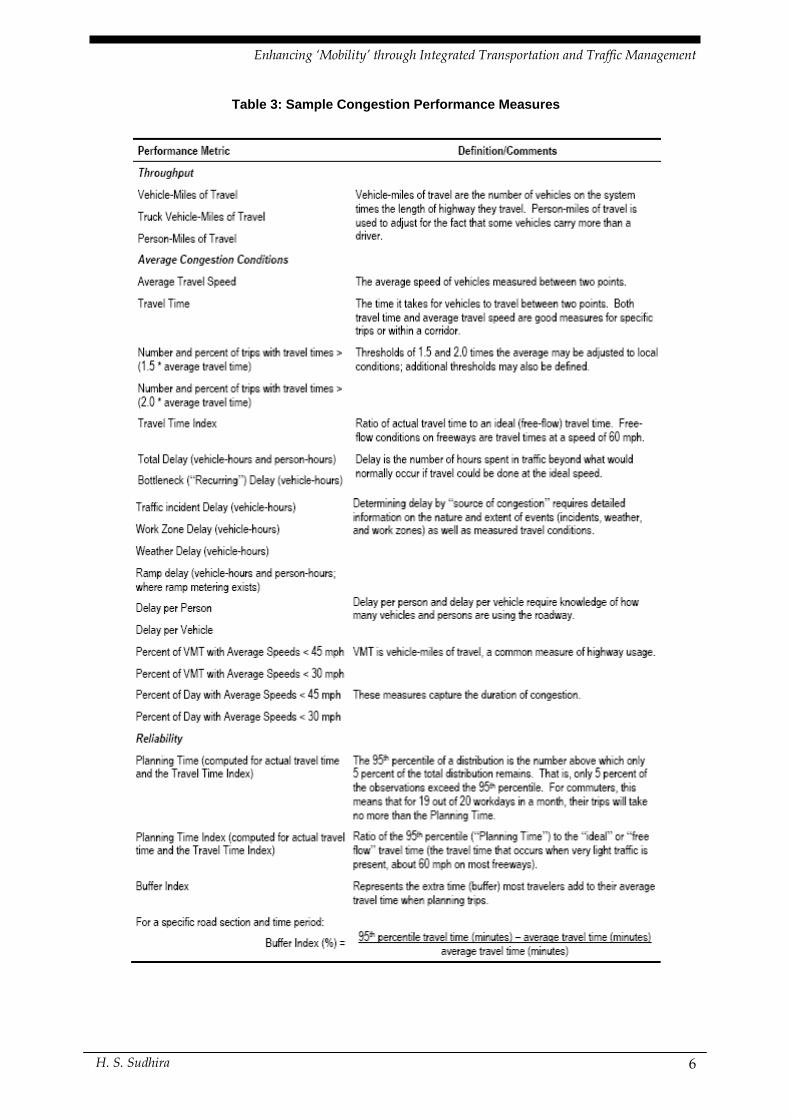
congestion over facilities or corridors, rather than just short highway segments. Table 3
presents a sample of congestion performance measures used by agencies to monitor trends.
H. S. Sudhira 5
Enhancing ‘Mobility’ through Integrated Transportation and Traffic Management
Table 3: Sample Congestion Performance Measures
H. S. Sudhira 6
Enhancing ‘Mobility’ through Integrated Transportation and Traffic Management
2 Situation in Bangalore Bangalore is the principal administrative, cultural, commercial and industrial centre of the
state of Karnataka. The city of Bangalore is situated at an altitude of 920 metres above mean
sea level. Geographically it is located on 12.95º North latitude and 77.57º East longitude. The
Greater Bangalore 1 agglomerating the neighbouring outgrowth and municipal councils is
proposed to spread over an area of 696 square kilometres. A tiny village in the 12th century
grew through times to become one of the fastest growing cities in the world by 21st century
and figured among the million-plus cities in India 2. The city enjoys a pleasant and
salubrious climate throughout the year. Its tree-lined streets and abundant greenery have
led to it being called the 'Garden City' of India. This Silicon Valley of India has been
identified as one of the technological innovation hub with a technological achievement index
(TAI) of 13 3 according to the Human Development Report (United Nations Development
Programme, 2001). It has also been in the news for a variety of reasons. If at first, a sleepy
Garden City of India woke to take on the IT revolution in the late last century, it also firmly
re-established the myth, that ‘The World is Flat’ in the words of Thomas Friedman (Friedman,
2004). The expansion of Bangalore in recent times, as a major economic centre with
concentrated development of industries and commercial establishments has given impetus
to the growth. However, this growth is reaching its threshold and the city is currently facing
the crisis in terms of infrastructure, etc. Early 90’s boom in the software sector with
consequent infrastructure initiatives, has contributed to rise in population, mainly due to
migration from other parts of India to Karnataka. It is now home to more than 250 high-tech
companies apart from numerous establishments in manufacturing and processing
industries. The population of Bangalore as per the 2001 census was 56,86,844 while it was
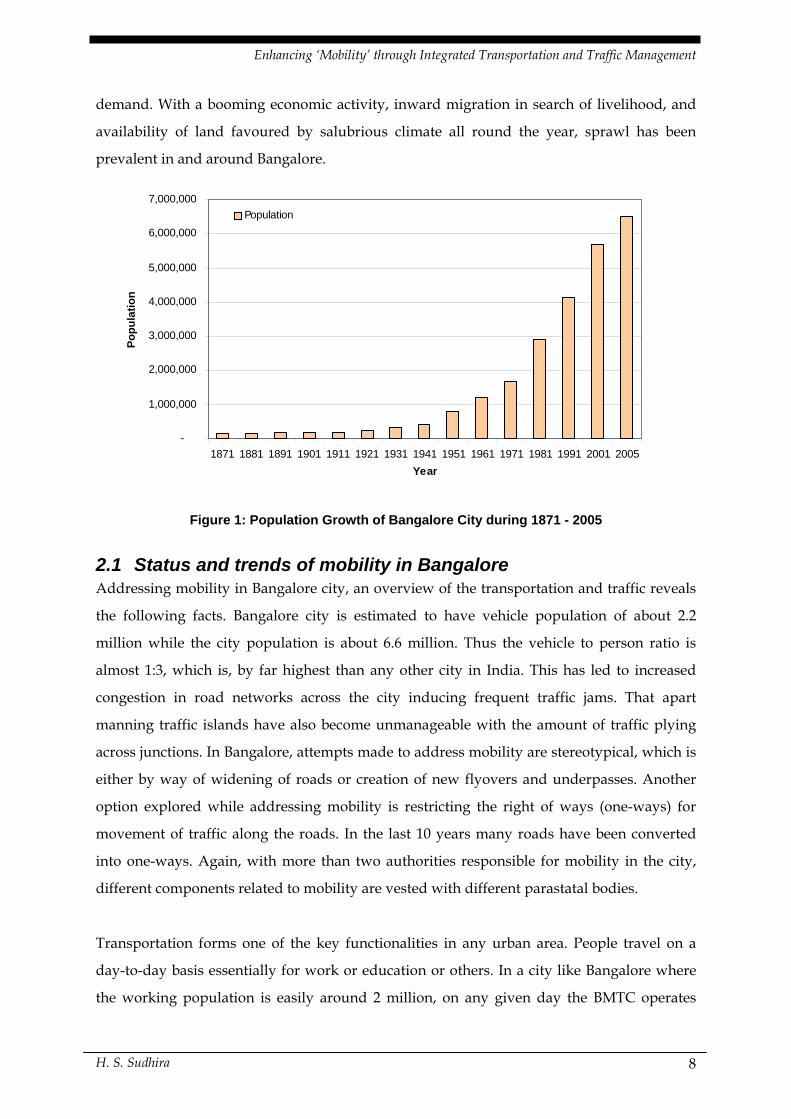
1,63,091 in the beginning of the last century (1901) (Figure 1). As an immediate consequence
of this growth in the last decade, apart from creating a ripple effect in the local economy,
there has also been an extensive pressure on infrastructure and resources like, water supply,
energy, public transportation, land, etc. The local bodies and other parastatal agencies
responsible for delivery of basic services are facing stiff challenges in catering to this
1 The Urban Development Department, Government of Karnataka has issued gazette notification vide No. UDD/92/MNY/2006, dated 2.11.2006 for constituting the Bruhat Bangalore Mahanagara Palike (Greater Bangalore City Corporation) merging the existing area of Bangalore City Corporation, 8 Urban Local Bodies (ULBs) and 111 Villages of Bangalore Urban District. 2 Bangalore is the fifth largest metropolis in India currently with a population of about 6.5 million. 3 Almost on par with San Francisco, USA, while Silicon Valley, USA is number 1 with TAI of 16.
H. S. Sudhira 7
Enhancing ‘Mobility’ through Integrated Transportation and Traffic Management
demand. With a booming economic activity, inward migration in search of livelihood, and
availability of land favoured by salubrious climate all round the year, sprawl has been
prevalent in and around Bangalore.
-
1,000,000
2,000,000
3,000,000
4,000,000
5,000,000
6,000,000
7,000,000
1871 1881 1891 1901 1911 1921 1931 1941 1951 1961 1971 1981 1991 2001 2005Year
Popu
latio
n
Population
Figure 1: Population Growth of Bangalore City during 1871 - 2005
2.1 Status and trends of mobility in Bangalore Addressing mobility in Bangalore city, an overview of the transportation and traffic reveals
the following facts. Bangalore city is estimated to have vehicle population of about 2.2
million while the city population is about 6.6 million. Thus the vehicle to person ratio is
almost 1:3, which is, by far highest than any other city in India. This has led to increased
congestion in road networks across the city inducing frequent traffic jams. That apart
manning traffic islands have also become unmanageable with the amount of traffic plying
across junctions. In Bangalore, attempts made to address mobility are stereotypical, which is
either by way of widening of roads or creation of new flyovers and underpasses. Another
option explored while addressing mobility is restricting the right of ways (one-ways) for
movement of traffic along the roads. In the last 10 years many roads have been converted
into one-ways. Again, with more than two authorities responsible for mobility in the city,
different components related to mobility are vested with different parastatal bodies.
Transportation forms one of the key functionalities in any urban area. People travel on a
day-to-day basis essentially for work or education or others. In a city like Bangalore where
the working population is easily around 2 million, on any given day the BMTC operates
H. S. Sudhira 8
Enhancing ‘Mobility’ through Integrated Transportation and Traffic Management
with 4144 schedules, 4262 buses, 60,475 trips, carry 3.5 million passengers, earn Rs.20.5
million per day and pay Rs.0.955 million to the Govt. as taxes! (BMTC, 2006) Further,
according to the recent estimates, there are about 1.6 million 2-wheelers, 0.32 million motor-
cars, 80,000 auto-rickshaws, and 0.17 million other vehicles totalling to around 2.2 million
vehicles on road!
2.1.1 Road Network Among the key modes of transport in Bangalore city, currently road-based travel is the only
available option. The city itself has developed in radial direction along all the major
highways that ply and intersect in the city. The National Highway 4, National Highway 7
and National Highway 209 intersect the city forming 5 important radial axes. The NH 4 is
part of the National Golden Quadrilateral that connects all the four metros in the country.
The other important radial axes are the State Highways plying to Mysore, Magadi and
Bannerghatta. As well, there have been radial outer ring roads linking all these important
highways. Within these outer ring roads are ‘sinks of urban growth’ that has developed
rapidly over the last few years in spite of an effective network of roads that linked all these.
In Bangalore, most of the major road networks are carrying much beyond their capacities.
Additionally there have been interventions by some of the organisations, always in parts, to
address this situation, by way of junction improvement measures or corridor improvements.
However, there hasn’t been any comprehensive and integrated management and operations
effort initiated by any of these organisations.
The onus of maintaining road networks is with the City Corporation - BMP, and hence, BMP
from time-to-time takes up road improvement programmes to ease congestion of traffic in
the city. Indeed the investments required to address the situation again has to be mostly met
by the local body, which are incommensurate with the explosion of vehicular traffic.
However, now and then, there are studies that have addressed the problem of congestion in
road networks by ways of suggesting numerous grade separators at various junctions and
identification of corridors that require intervention.
On the aspects of mobility pertaining to road networks, apart from addressing the road
length alone, the street lights, amount of pedestrian walkways / footpaths, skywalks, etc.
are also need to be addressed comprehensively. The total road length in the BMP limits is
about 3,500 km (while Greater Bangalore has about 5,000 km) of which about 320 km form
H. S. Sudhira 9
Enhancing ‘Mobility’ through Integrated Transportation and Traffic Management
the important roads as arterial and sub-arterial roads. However, the existing road length in
Bangalore is less than the normative road length by about 11 % as per the prescribed
standards of 17.33 km per sq. km (KUIDFC, 2006). Further, in all there are about 0.25 million
street lights in Bangalore. As per the planning guidelines, there should be about 33 street
lights per one km length of road, which in the case of Bangalore is better than standards.
However, in the absence of effective proactive maintenance mechanisms, there is significant
amount of expenditure incurred with regard to maintenance of street lights. It is noted that
there is a pressing need for online tracking of street lights and their status over a spatial
database, for effective and efficient maintenance of street lights. However on the aspects of
pedestrian walkways / footpaths there was no adequate information that could be collated.
For addressing mobility through road improvements, there have been various studies that
have attempted to identify the key corridors – road segments requiring interventions by
other agencies. A review of these studies is discussed in next chapter. However, there are
two common aspects in all these studies: the volume-based indices are used and interaction
of land use with transportation is consistently ignored. As noted earlier, this report suggests
using travel time based metrics to capture mobility and congestion in the transportation
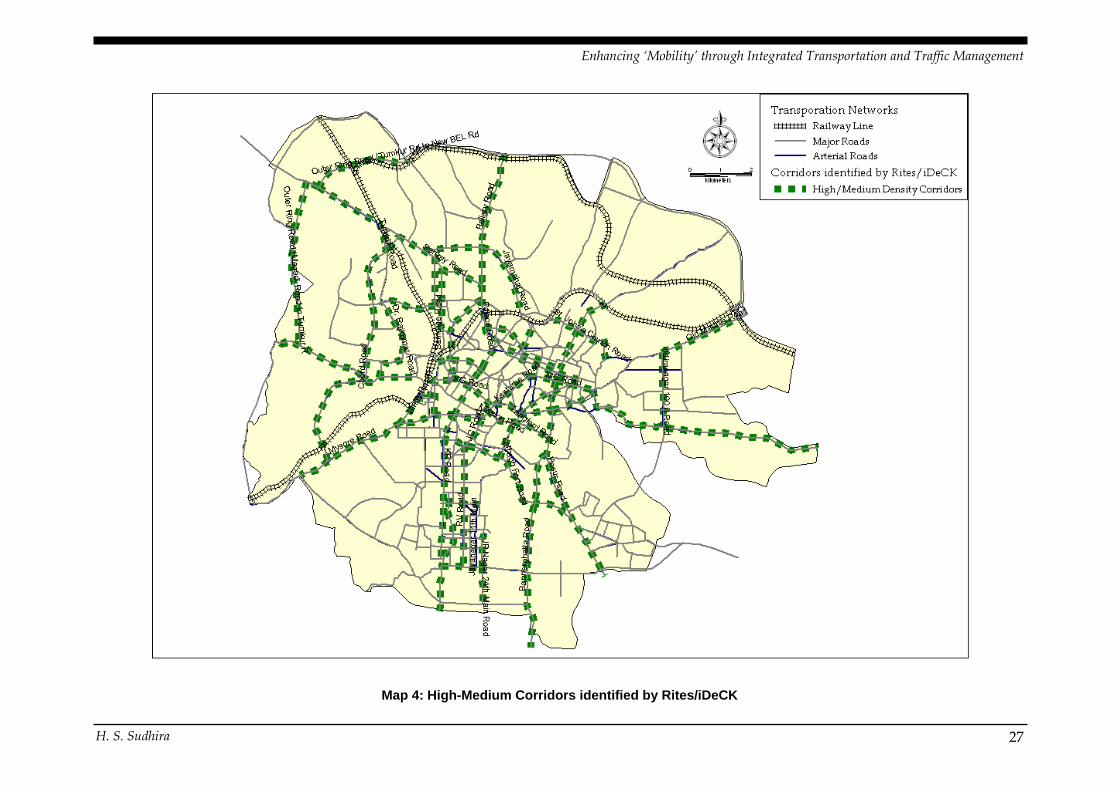
network than volume-based metrics. Although in a study by iDeCK and Rites (2005), they
have identified 52 corridors as high and medium traffic intensity corridors, requiring
different type of interventions by various organisations, BMP proposes to widen some of
these roads. A key aspect ignored while addressing mobility is the land use associated with
transportation networks. The lack of acknowledgement of implications owing to change in
land use from residential to commercial or industrial, has significantly led to stereotypical
approaches addressing mobility. The nature of land use determines the home-work-home,
home-education-home, and home-other-home distances and corresponding travel-times. In
general Bangalore has over a period promoted mixed land use, thus at some level led to
inefficient usage of land. With compartmentalised approaches of widening of roads or
construction of flyovers and grade separators, the problem of mobility is far from being
solved.
2.1.2 Rail Network Bangalore is well connected by railway to all important regions of India through a railway
network converging at Bangalore City station. Railway lines from five different directions
H. S. Sudhira 10
Enhancing ‘Mobility’ through Integrated Transportation and Traffic Management
terminate at the Bangalore City station. The five railway lines, all now Broad-Gauge lines
are:
1. Guntakal line from the North
2. Chennai line on the East
3. Salem line from South-east
4. Mysore line from South-west
5. Mumbai-Pune line from North-west
In spite of the five radial rail corridors, these are not currently used for any public transport.
However at some point of time there were proposals to introduce Commuter Rail Service to
utilise some these networks. A brief review on these is elaborated in forthcoming sections.
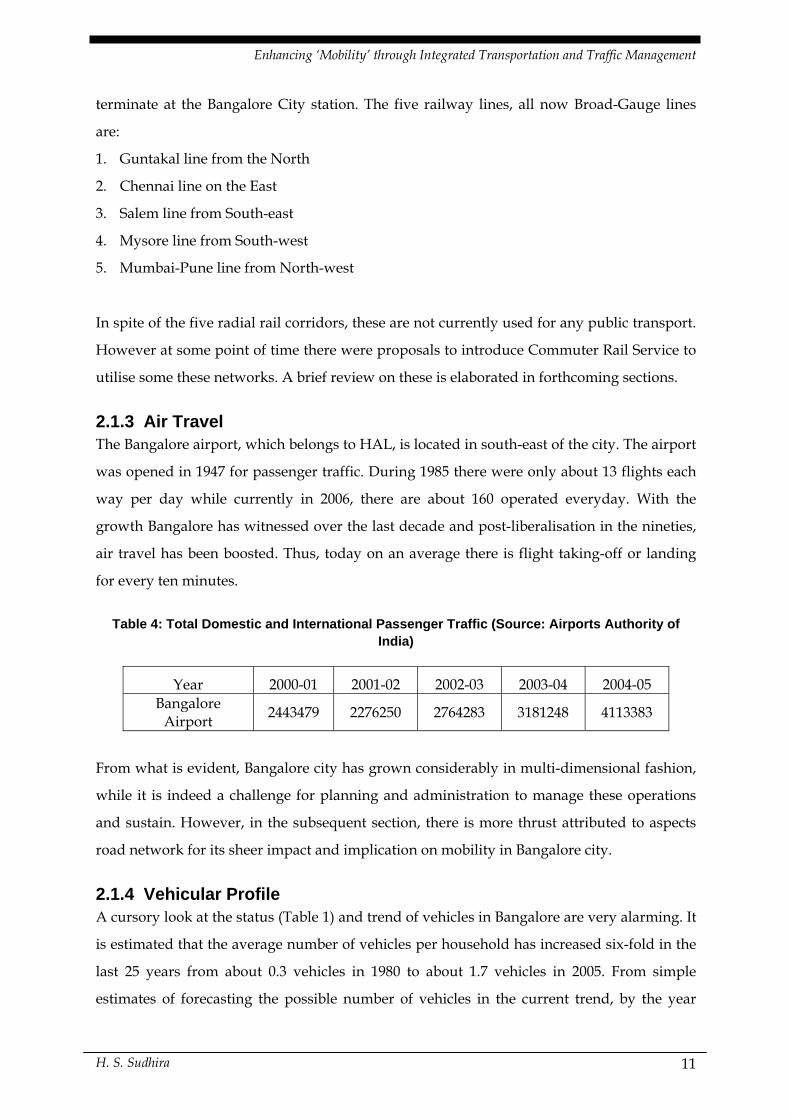
2.1.3 Air Travel The Bangalore airport, which belongs to HAL, is located in south-east of the city. The airport
was opened in 1947 for passenger traffic. During 1985 there were only about 13 flights each
way per day while currently in 2006, there are about 160 operated everyday. With the
growth Bangalore has witnessed over the last decade and post-liberalisation in the nineties,
air travel has been boosted. Thus, today on an average there is flight taking-off or landing
for every ten minutes.
Table 4: Total Domestic and International Passenger Traffic (Source: Airports Authority of India)
Year 2000-01 2001-02 2002-03 2003-04 2004-05 Bangalore
Airport 2443479 2276250 2764283 3181248 4113383
From what is evident, Bangalore city has grown considerably in multi-dimensional fashion,
while it is indeed a challenge for planning and administration to manage these operations
and sustain. However, in the subsequent section, there is more thrust attributed to aspects
road network for its sheer impact and implication on mobility in Bangalore city.
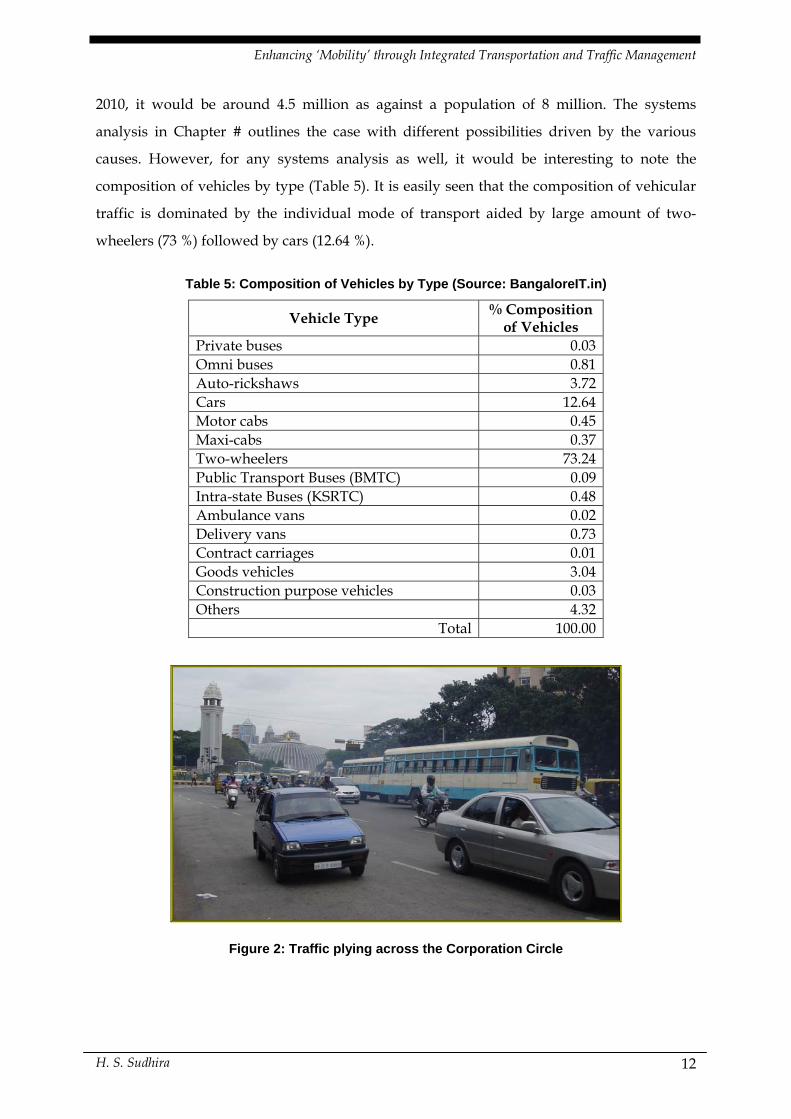
2.1.4 Vehicular Profile A cursory look at the status (Table 1) and trend of vehicles in Bangalore are very alarming. It
is estimated that the average number of vehicles per household has increased six-fold in the
last 25 years from about 0.3 vehicles in 1980 to about 1.7 vehicles in 2005. From simple
estimates of forecasting the possible number of vehicles in the current trend, by the year
H. S. Sudhira 11
Enhancing ‘Mobility’ through Integrated Transportation and Traffic Management
2010, it would be around 4.5 million as against a population of 8 million. The systems
analysis in Chapter # outlines the case with different possibilities driven by the various
causes. However, for any systems analysis as well, it would be interesting to note the
composition of vehicles by type (Table 5). It is easily seen that the composition of vehicular
traffic is dominated by the individual mode of transport aided by large amount of two-
wheelers (73 %) followed by cars (12.64 %).
Table 5: Composition of Vehicles by Type (Source: BangaloreIT.in)
Vehicle Type % Composition of Vehicles
Private buses 0.03 Omni buses 0.81 Auto-rickshaws 3.72 Cars 12.64 Motor cabs 0.45 Maxi-cabs 0.37 Two-wheelers 73.24 Public Transport Buses (BMTC) 0.09 Intra-state Buses (KSRTC) 0.48 Ambulance vans 0.02 Delivery vans 0.73 Contract carriages 0.01 Goods vehicles 3.04 Construction purpose vehicles 0.03 Others 4.32
Total 100.00
Figure 2: Traffic plying across the Corporation Circle
H. S. Sudhira 12
Enhancing ‘Mobility’ through Integrated Transportation and Traffic Management
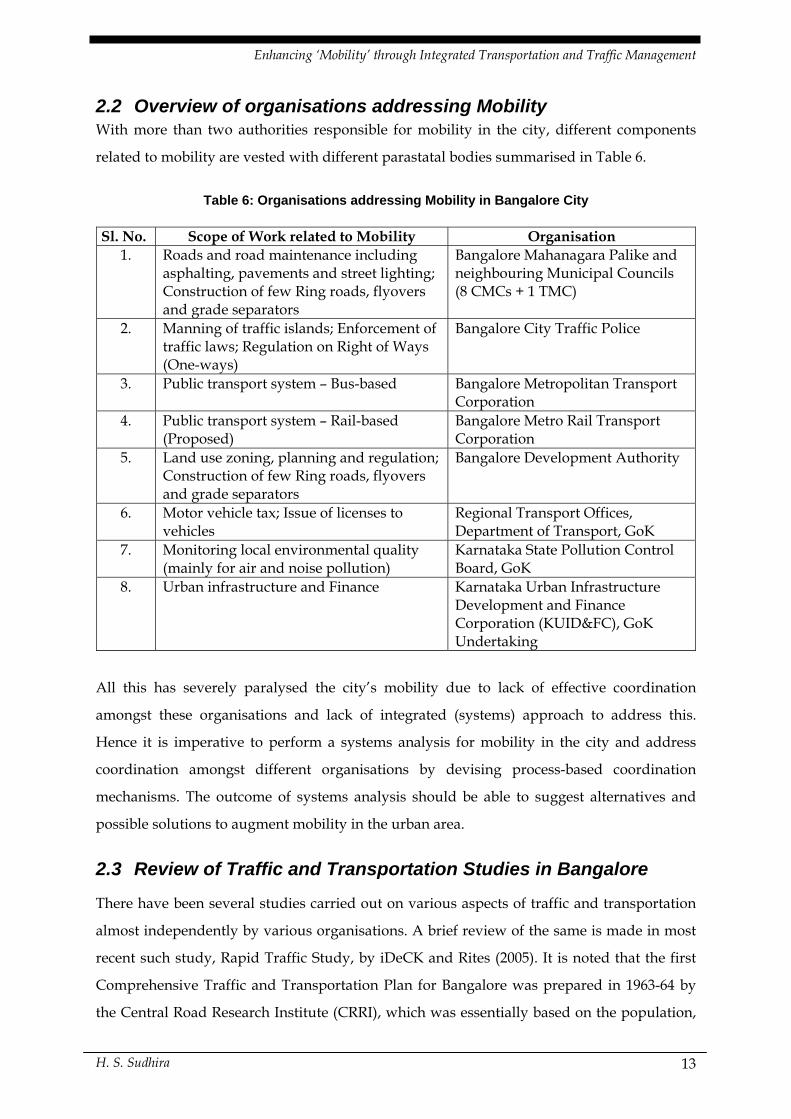
2.2 Overview of organisations addressing Mobility With more than two authorities responsible for mobility in the city, different components
related to mobility are vested with different parastatal bodies summarised in Table 6.
Table 6: Organisations addressing Mobility in Bangalore City
Sl. No. Scope of Work related to Mobility Organisation 1. Roads and road maintenance including
asphalting, pavements and street lighting; Construction of few Ring roads, flyovers and grade separators
Bangalore Mahanagara Palike and neighbouring Municipal Councils (8 CMCs + 1 TMC)
2. Manning of traffic islands; Enforcement of traffic laws; Regulation on Right of Ways (One-ways)
Bangalore City Traffic Police
3. Public transport system – Bus-based Bangalore Metropolitan Transport Corporation
4. Public transport system – Rail-based (Proposed)
Bangalore Metro Rail Transport Corporation
5. Land use zoning, planning and regulation; Construction of few Ring roads, flyovers and grade separators
Bangalore Development Authority
6. Motor vehicle tax; Issue of licenses to vehicles
Regional Transport Offices, Department of Transport, GoK
7. Monitoring local environmental quality (mainly for air and noise pollution)
Karnataka State Pollution Control Board, GoK
8. Urban infrastructure and Finance Karnataka Urban Infrastructure Development and Finance Corporation (KUID&FC), GoK Undertaking
All this has severely paralysed the city’s mobility due to lack of effective coordination
amongst these organisations and lack of integrated (systems) approach to address this.
Hence it is imperative to perform a systems analysis for mobility in the city and address
coordination amongst different organisations by devising process-based coordination
mechanisms. The outcome of systems analysis should be able to suggest alternatives and
possible solutions to augment mobility in the urban area.
2.3 Review of Traffic and Transportation Studies in Bangalore
There have been several studies carried out on various aspects of traffic and transportation
almost independently by various organisations. A brief review of the same is made in most
recent such study, Rapid Traffic Study, by iDeCK and Rites (2005). It is noted that the first
Comprehensive Traffic and Transportation Plan for Bangalore was prepared in 1963-64 by
the Central Road Research Institute (CRRI), which was essentially based on the population,
H. S. Sudhira 13
Enhancing ‘Mobility’ through Integrated Transportation and Traffic Management
land use and area projections made by the Town Planning Department. By 1965, the Town
and Country Planning Act came into effect and then a City Planning Authority was
constituted which then prepared a Comprehensive Development Plan (CDP) for the year
2001 with a population estimate of 3.8 million. However, until the constitution of City
Planning Authority, there existed City Improvement Trust Board (CITB), which was
responsible for land use zoning and planning.
Subsequently in order to implement the CDP and to control the land use in the metropolitan
area, the Bangalore Development Authority was created in 1976. The decade 1971-1981 saw
the highest population growth rate owing to significant in-migration by about 75 % growth
than the previous census estimates. This necessitated the revision of CDP which was
prepared afresh and approved in 1984. By 1995, the CDP was again revised, this time the
forecast year was 2011. At the behest of the Town Planning Department, a ‘metro rail’ for
Bangalore was proposed in 1981. The Southern Railways, based on Lynne Committee which
looked into these recommended a 2-corridor metro for 24 km along with 3 commuter rail
lines and a 58 km ring railway at a cost of Rs. 6500 million at 1983 prices. However, for
various reasons, as evident today, this was not taken up. Later in 1988, Rites was
commissioned to carryout a transport study funded by the World Bank addressing issues
concerning roads, traffic and mass transit. Yet again in 1993, Government of Karnataka
established another committee to look into a mass rapid transit system for Bangalore, which
reinforced the Southern Railway’s recommendation made in 1983. Soon after, in 1994 a
special purpose vehicle, Bangalore Mass Rapid Transit Limited was formed to take up the
mass rapid transit system through a public-private partnership.
Meanwhile, the CRRI made another study on the status of Bangalore’s traffic and proposed
various road improvement programmes including 45 multi-grade intersections, 25
pedestrian underpasses and various corridor improvement programs. With change in the
state government, there was another study, this time jointly with Ministry of Railways, was
commissioned to Rites to study the introduction of commuter rail facility. However, in 2003,
the Government of Karnataka, commissioned Delhi Metro Rail Corporation to prepare
detailed project report on the introduction of mass rapid transit system in Bangalore. The
study recommended two corridors, North-South and East-West, intersecting at the Kempe
Gowda Bus Station with a total length of 33 km. A special purpose vehicle, Bangalore Metro
Rail Corporation Ltd. (BMRC) was formed recently and currently this proposal is being
H. S. Sudhira 14
Enhancing ‘Mobility’ through Integrated Transportation and Traffic Management
taken forward for implementation. With over 20 years of ups and downs with regard to
mass rapid transit system, Bangalore is now witnessing a possible metro in the near future
(2008).
Amidst these recent developments, the road traffic has steeply increased throwing stiff
challenges for the administration to manage the operations. Hence, the ‘Comprehensive
Traffic and Transportation Study’ (CTTS) was commissioned to Rites in 2005, which is due
for completion in December 2006 / January 2007. Again in the meanwhile, it was felt
necessary that until the CTTS gets ready, there needs to be some initiatives to be taken for
easing congestion in the road networks. And hence, iDeCK along with Rites prepared the
‘Rapid Traffic Study’ in November 2005. The Rapid Traffic Study identified 52 corridors as
high and medium traffic intensity corridors requiring various types of intervention.
2.3.1 Tracing the recent history of infrastructure related initiatives in Bangalore
In the recent past owing to the exodus rise in vehicular traffic and the resulting congestion in
road networks, there were calls from many quarters to manage and develop the existing
road networks. Thus in 1998 under the Municipal Bond Road Scheme development of
arterial roads were taken up. Meanwhile, the Bangalore Metropolitan Transport Corporation
(BMTC) came out with all the motorable roads that were suitable for plying bus-based mass
transit system. After this, the arterial and sub-arterial roads were taken up for development.
In the same course, excluding the arterial, sub-arterial and municipal bond roads, the
maintenance of some of the remaining important roads were taken up by outsourcing the
same, while some never got implemented. By 2002, 100 % coverage of water supply and
sewer line, mainly in newly developed residential areas was taken up by BWSSB with a
funding of Rs. 180 crores raised by BMP. Subsequent to this, by the time of completion 100 %
black topping of roads for all areas where BWSSB had completed water supply and sewer
line was initiated. Funds was raised from HUDCO loan in several packages, Package 1 –
Interior roads and Package 2 – Main roads, while the left ones in above interventions was
taken up 2005 onwards.
At times, the government has faced brick-bats from industrialists for lack of effective
infrastructure in Bangalore. A consequence of such brick-bats was the creation of a package
called, IT-BT roads, which were initiated after the outburst of a leading entrepreneur on the
status of infrastructure facilities in Bangalore, especially towards Electronic City where
H. S. Sudhira 15
Enhancing ‘Mobility’ through Integrated Transportation and Traffic Management
much of the important software industries operate. Subsequently a High Power Committee
chaired by the Chief Secretary was formed comprising Principal Secretary / Commissioner’s
of key departments addressing this issue. About Rs. 20 crores fund was granted from the
state government in order to take up these roads under a package called, IT-BT roads, and
this work was entrusted to KLAC. Even while all this happened last year, there were heavy
rains which caused flooding in some of the areas in South and South-east Bangalore. And
thus, another package to take works related to restoration and development of these roads
were taken up as Flood Damaged Roads. This work was also entrusted to the KLAC. Thus in
the recent past, there have been numerous packages/projects created / tailored for
addressing some of the road development works in a ‘reactive’ mechanism and
compartmentalised approaches. Until recently, there were no efforts to integrate collectively
ascertain the implications of all these on the overall road network.
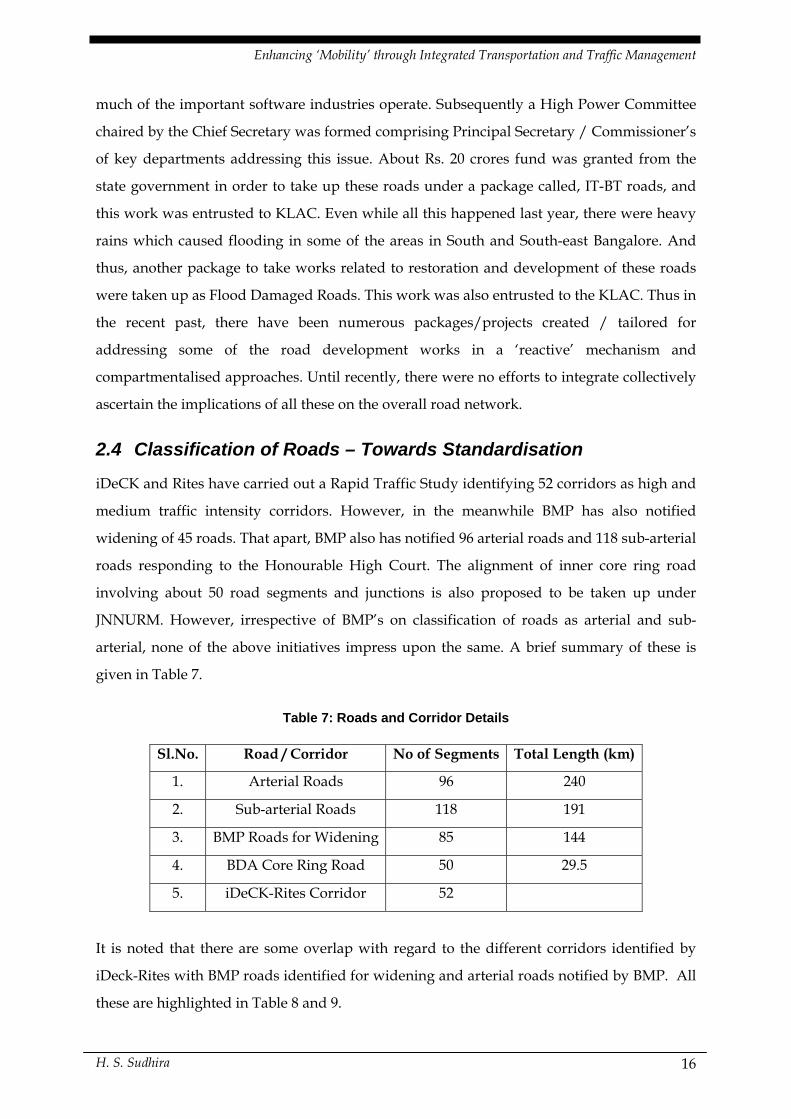
2.4 Classification of Roads – Towards Standardisation
iDeCK and Rites have carried out a Rapid Traffic Study identifying 52 corridors as high and
medium traffic intensity corridors. However, in the meanwhile BMP has also notified
widening of 45 roads. That apart, BMP also has notified 96 arterial roads and 118 sub-arterial
roads responding to the Honourable High Court. The alignment of inner core ring road
involving about 50 road segments and junctions is also proposed to be taken up under
JNNURM. However, irrespective of BMP’s on classification of roads as arterial and sub-
arterial, none of the above initiatives impress upon the same. A brief summary of these is
given in Table 7.
Table 7: Roads and Corridor Details
Sl.No. Road / Corridor No of Segments Total Length (km)
1. Arterial Roads 96 240
2. Sub-arterial Roads 118 191
3. BMP Roads for Widening 85 144
4. BDA Core Ring Road 50 29.5
5. iDeCK-Rites Corridor 52
It is noted that there are some overlap with regard to the different corridors identified by
iDeck-Rites with BMP roads identified for widening and arterial roads notified by BMP. All
these are highlighted in Table 8 and 9.
H. S. Sudhira 16
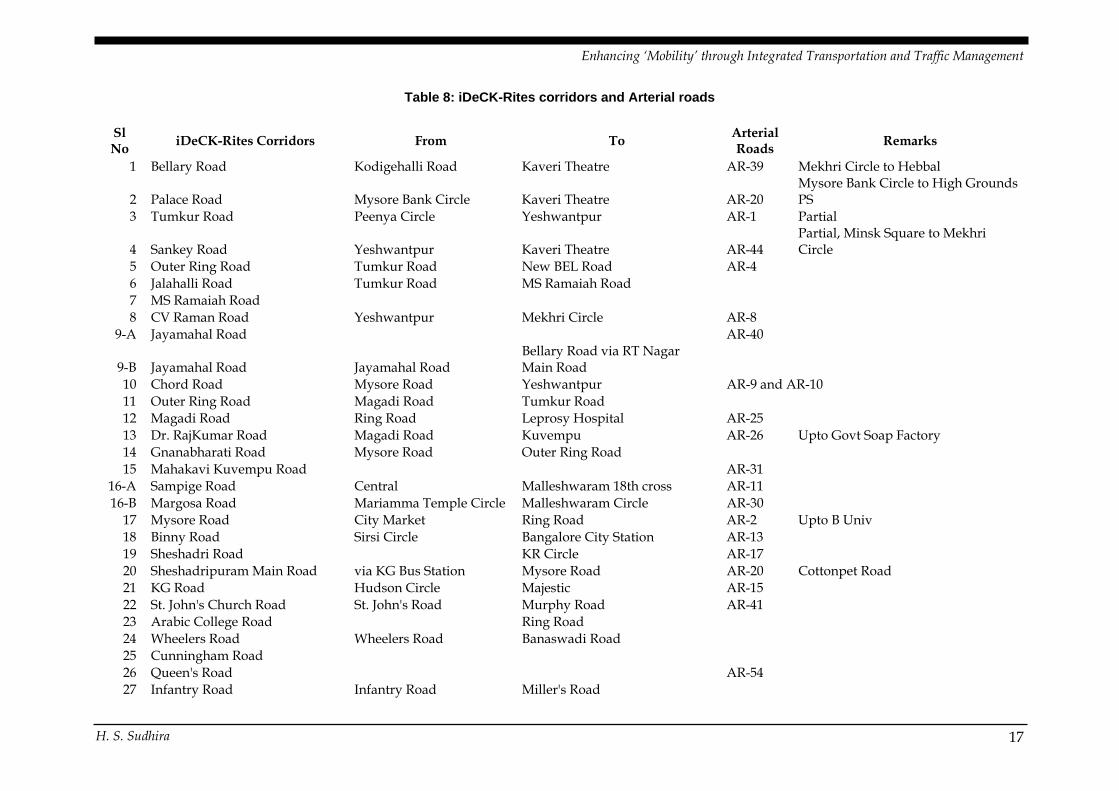
Enhancing ‘Mobility’ through Integrated Transportation and Traffic Management
Table 8: iDeCK-Rites corridors and Arterial roads
Sl No iDeCK-Rites Corridors From To Arterial
Roads Remarks
1 Bellary Road Kodigehalli Road Kaveri Theatre AR-39 Mekhri Circle to Hebbal
2 Palace Road Mysore Bank Circle Kaveri Theatre AR-20 Mysore Bank Circle to High Grounds PS
3 Tumkur Road Peenya Circle
Yeshwantpur AR-1 Partial
4 Sankey Road Yeshwantpur Kaveri Theatre AR-44Partial, Minsk Square to Mekhri Circle
5 Outer Ring Road Tumkur Road New BEL Road AR-4 6 Jalahalli Road Tumkur Road MS Ramaiah Road 7 MS Ramaiah Road 8 CV Raman Road Yeshwantpur
Mekhri Circle
AR-8 9-A Jayamahal Road AR-40
9-B Jayamahal Road Jayamahal Road Bellary Road via RT Nagar Main Road
10 Chord Road Mysore Road Yeshwantpur AR-9 and AR-10 11 Outer Ring Road Magadi Road Tumkur Road 12 Magadi Road Ring Road Leprosy Hospital AR-25 13 Dr. RajKumar Road Magadi Road Kuvempu AR-26 Upto Govt Soap Factory 14 Gnanabharati Road Mysore Road Outer Ring Road 15 Mahakavi Kuvempu Road AR-31
16-A Sampige Road Central Malleshwaram 18th cross AR-11 16-B Margosa Road Mariamma Temple Circle Malleshwaram Circle AR-30
17 Mysore Road City Market Ring Road AR-2 Upto B Univ 18 Binny Road Sirsi Circle
Bangalore City Station
AR-13
19 Sheshadri Road KR Circle AR-1720 Sheshadripuram Main Road via KG Bus Station Mysore Road AR-20 Cottonpet Road 21 KG Road Hudson Circle Majestic AR-15 22 St. John's Church Road St. John's Road Murphy Road AR-41 23 Arabic College Road Ring Road 24 Wheelers Road Wheelers Road
Banaswadi Road
25 Cunningham Road
26 Queen's Road AR-5427 Infantry Road Infantry Road Miller's Road
H. S. Sudhira 17
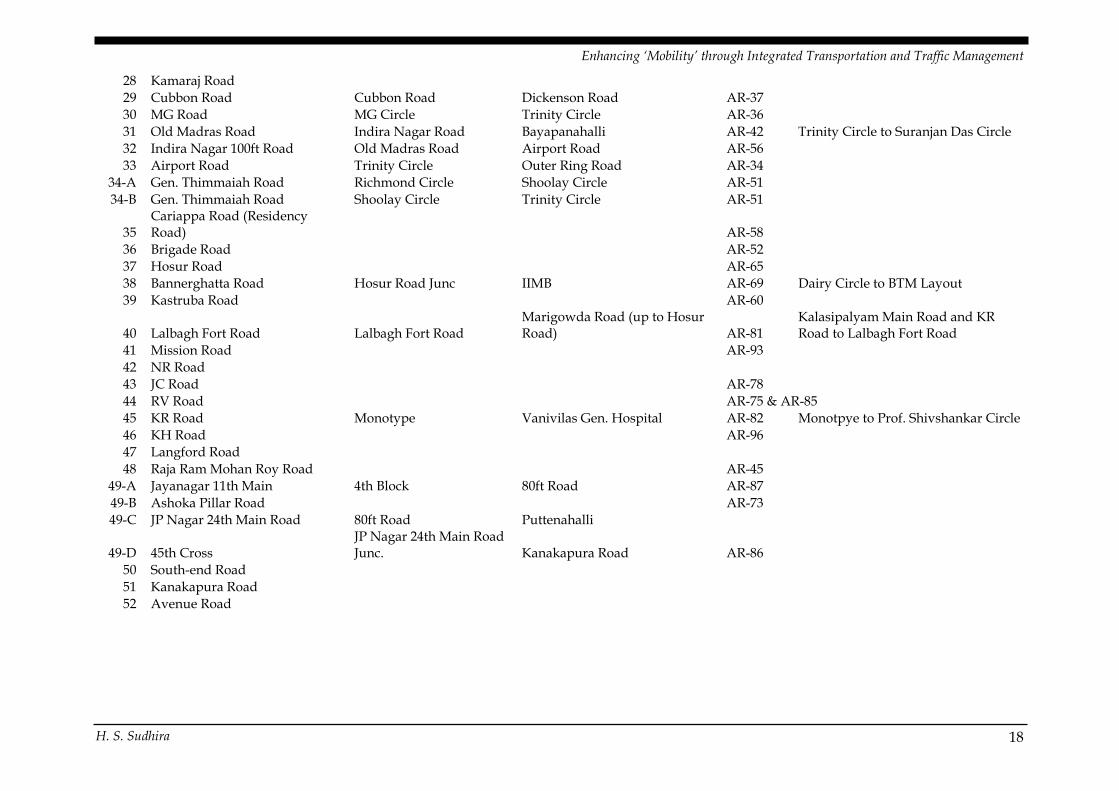
Enhancing ‘Mobility’ through Integrated Transportation and Traffic Management
28 Kamaraj Road
29 Cubbon Road Cubbon Road Dickenson Road AR-37 30 MG Road MG Circle Trinity Circle AR-36 31 Old Madras Road Indira Nagar Road Bayapanahalli AR-42 Trinity Circle to Suranjan Das Circle 32 Indira Nagar 100ft Road Old Madras Road Airport Road AR-56 33 Airport Road Trinity Circle Outer Ring Road AR-34
34-A Gen. Thimmaiah Road Richmond Circle Shoolay Circle AR-51 34-B Gen. Thimmaiah Road Shoolay Circle Trinity Circle AR-51
35 Cariappa Road (Residency Road) AR-58
36 Brigade Road
AR-5237 Hosur Road AR-6538 Bannerghatta Road
Hosur Road Junc
IIMB
AR-69 Dairy Circle to BTM Layout 39 Kastruba Road AR-60
40 Lalbagh Fort Road
Lalbagh Fort Road
Marigowda Road (up to Hosur Road)
AR-81 Kalasipalyam Main Road and KR Road to Lalbagh Fort Road 41 Mission Road
AR-93 42 NR Road
43 JC Road AR-7844 RV Road AR-75 & AR-85 45 KR Road Monotype
Vanivilas Gen. Hospital
AR-82 Monotpye to Prof. Shivshankar Circle 46 KH Road AR-96
47 Langford Road48 Raja Ram Mohan Roy Road AR-45
49-A Jayanagar 11th Main 4th Block 80ft Road AR-87 49-B Ashoka Pillar Road AR-73 49-C JP Nagar 24th Main Road 80ft Road Puttenahalli
49-D 45th Cross JP Nagar 24th Main Road Junc.
Kanakapura Road
AR-86 50 South-end Road
51 Kanakapura Road 52 Avenue Road
H. S. Sudhira 18
Enhancing ‘Mobility’ through Integrated Transportation and Traffic Management
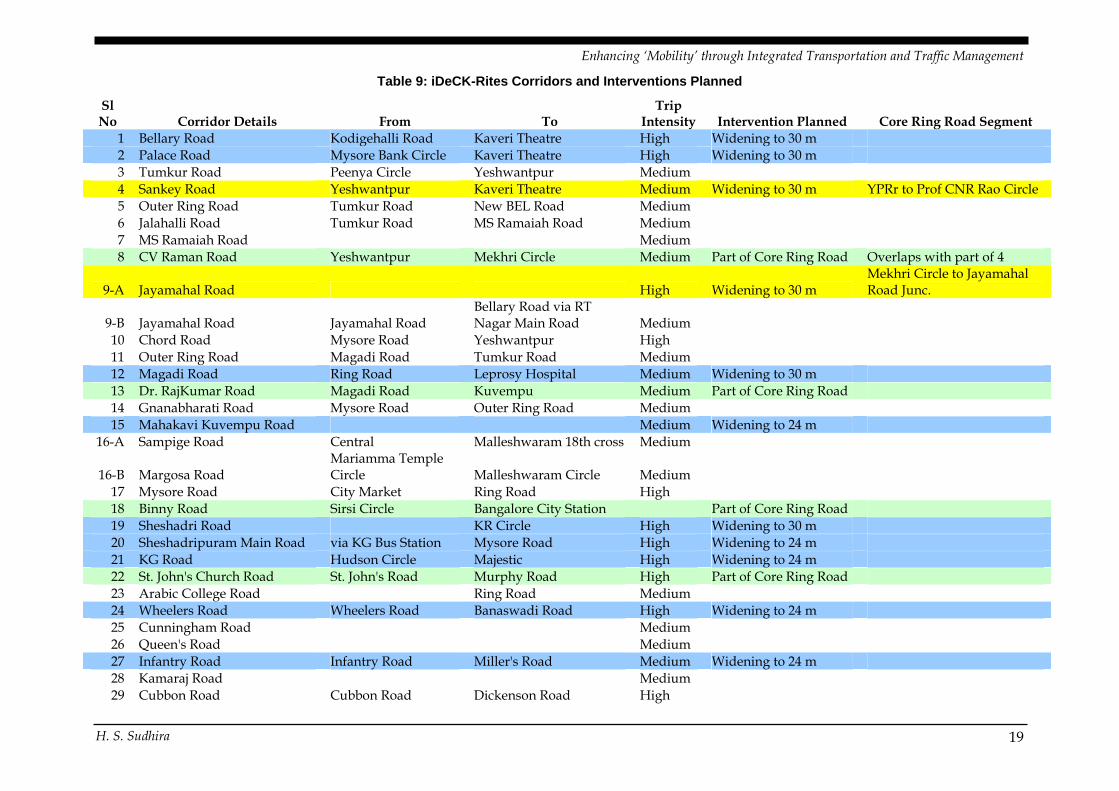
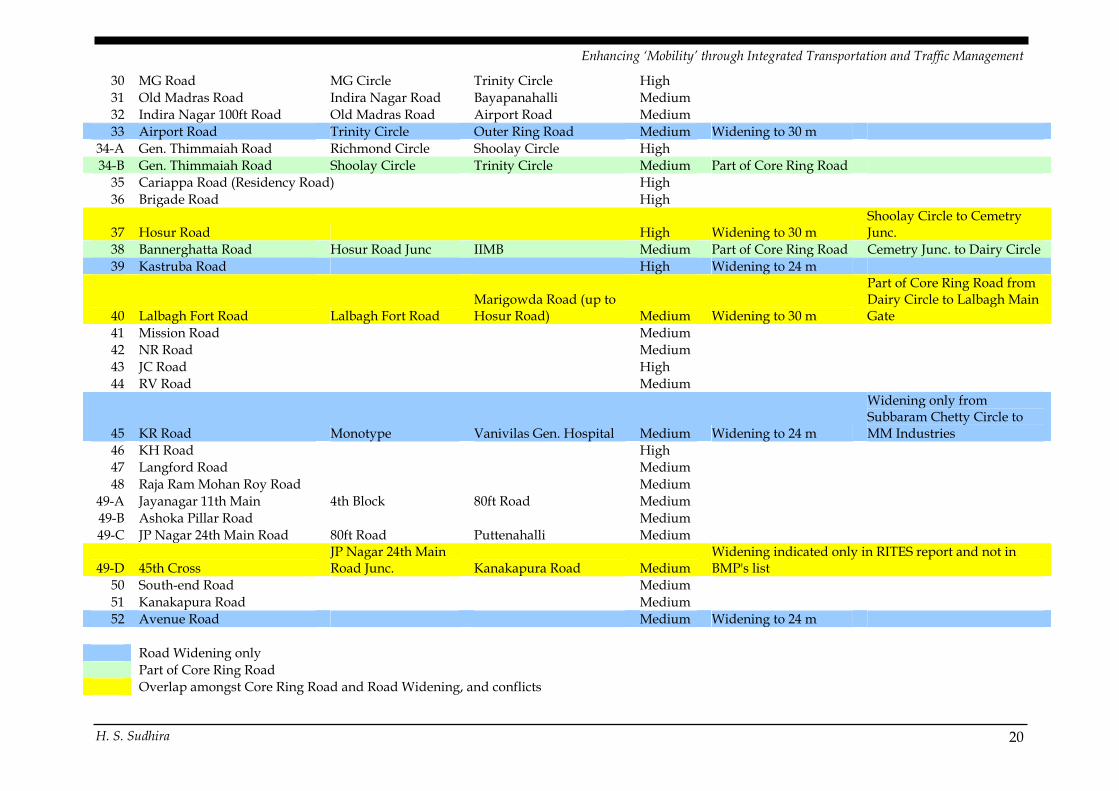
Table 9: iDeCK-Rites Corridors and Interventions Planned
Sl No Corridor Details From To
Trip Intensity Intervention Planned Core Ring Road Segment
1 Bellary Road Kodigehalli Road Kaveri Theatre High Widening to 30 m 2 Palace Road Mysore Bank Circle Kaveri Theatre High Widening to 30 m 3 Tumkur Road Peenya Circle Yeshwantpur Medium 4 Sankey Road Yeshwantpur Kaveri Theatre Medium Widening to 30 m YPRr to Prof CNR Rao Circle 5 Outer Ring Road Tumkur Road New BEL Road Medium 6 Jalahalli Road Tumkur Road MS Ramaiah Road Medium 7 MS Ramaiah Road Medium 8 CV Raman Road Yeshwantpur Mekhri Circle Medium Part of Core Ring Road Overlaps with part of 4
9-A Jayamahal Road High Widening to 30 m Mekhri Circle to Jayamahal Road Junc.
9-B Jayamahal Road Jayamahal Road Bellary Road via RT Nagar Main Road Medium
10 Chord Road Mysore Road Yeshwantpur High 11 Outer Ring Road Magadi Road Tumkur Road Medium 12 Magadi Road Ring Road Leprosy Hospital Medium Widening to 30 m 13 Dr. RajKumar Road Magadi Road Kuvempu Medium Part of Core Ring Road 14 Gnanabharati Road Mysore Road Outer Ring Road Medium 15 Mahakavi Kuvempu Road Medium Widening to 24 m
16-A Sampige Road Central Malleshwaram 18th cross Medium
16-B Margosa Road Mariamma Temple Circle Malleshwaram Circle Medium
17 Mysore Road City Market Ring Road High 18 Binny Road Sirsi Circle Bangalore City Station Part of Core Ring Road 19 Sheshadri Road KR Circle High Widening to 30 m 20 Sheshadripuram Main Road via KG Bus Station Mysore Road High Widening to 24 m 21 KG Road Hudson Circle Majestic High Widening to 24 m 22 St. John's Church Road St. John's Road Murphy Road High Part of Core Ring Road 23 Arabic College Road Ring Road Medium 24 Wheelers Road Wheelers Road Banaswadi Road High Widening to 24 m
25 Cunningham Road
Medium
26 Queen's Road Medium27 Infantry Road Infantry Road Miller's Road Medium Widening to 24 m
28 Kamaraj Road Medium 29 Cubbon Road Cubbon Road Dickenson Road High
H. S. Sudhira 19
Enhancing ‘Mobility’ through Integrated Transportation and Traffic Management
30 MG Road MG Circle Trinity Circle High 31 Old Madras Road Indira Nagar Road Bayapanahalli Medium 32 Indira Nagar 100ft Road Old Madras Road Airport Road Medium 33 Airport Road Trinity Circle Outer Ring Road Medium Widening to 30 m
34-A Gen. Thimmaiah Road Richmond Circle Shoolay Circle High 34-B Gen. Thimmaiah Road Shoolay Circle Trinity Circle Medium Part of Core Ring Road
35 Cariappa Road (Residency Road)
High 36 Brigade Road High
37 Hosur Road High Widening to 30 m Shoolay Circle to Cemetry Junc.
38 Bannerghatta Road Hosur Road Junc IIMB Medium Part of Core Ring Road Cemetry Junc. to Dairy Circle 39 Kastruba Road High Widening to 24 m
40 Lalbagh Fort Road Lalbagh Fort Road Marigowda Road (up to Hosur Road) Medium Widening to 30 m
Part of Core Ring Road from Dairy Circle to Lalbagh Main Gate 41 Mission Road
Medium
42 NR Road
Medium
43 JC Road High44 RV Road Medium
45 KR Road Monotype Vanivilas Gen. Hospital Medium Widening to 24 m
Widening only from Subbaram Chetty Circle to MM Industries 46 KH Road
High
47 Langford Road Medium48 Raja Ram Mohan Roy Road Medium
49-A Jayanagar 11th Main 4th Block 80ft Road Medium 49-B Ashoka Pillar Road Medium 49-C JP Nagar 24th Main Road 80ft Road Puttenahalli Medium
49-D 45th Cross JP Nagar 24th Main Road Junc. Kanakapura Road Medium
Widening indicated only in RITES report and not in BMP's list 50 South-end Road
Medium
51 Kanakapura Road Medium52 Avenue Road Medium Widening to 24 m
Road Widening only Part of Core Ring Road Overlap amongst Core Ring Road and Road Widening, and conflicts
H. S. Sudhira 20
Enhancing ‘Mobility’ through Integrated Transportation and Traffic Management
The above tables depict the overlap amongst Core Ring Road, Arterial roads and the roads
identified for widening. From Table 8, it is evident that amongst the corridors identified as
high and medium density corridors, not all are notified as arterial roads. It is noted that of 52
High/Medium density corridors, the 43 arterial roads correspond to 38 of these corridors. It
is noted that the even among the arterial roads overlapping with the corridors there isn’t
much harmony. And so, it is imperative that the rest of these corridors should be notified as
arterial roads. On the other hand, there are 45 roads identified for widening, of which only
19 belong to the corridors identified by Rites/iDeCK as High-Medium density corridors.
However, noting the various differences and discrepancies with the details on arterial roads,
there is a stronger and pressing need to reclassify the road network based on sound
classification strategy rather than impromptu and reactive approaches of classifying the
same. On the same lines, the road classification strategy is suggested in Annexure A, which
is adapted and suitably modified for conditions in Bangalore. Accordingly, there would be
Local/Link roads, Collector roads, Sub-arterial roads, Arterial roads and Ring Roads
(Expressways). The key criteria emphasized for such classification is traffic movement
versus property access. The characteristics that would establish the classification are given
below:
1. Traffic movement versus property access
2. Typical daily motor vehicle traffic volume (both directions)
3. Minimum number of peak period lanes
4. Desirable connections
5. Flow characteristics
6. Legal speed limit, km/hour
7. Accommodation of pedestrians
8. Accommodation of auto rickshaws
9. Accommodation of cyclists
10. Surface transit
11. Surface transit daily passengers
12. Heavy truck restrictions
13. Typical spacing between traffic control devices, m
14. Typical right-of-way width, m
While noting that creation of information system / developing such database on existing
road networks to ascertain the classification is very essential, such database can be used very
H. S. Sudhira 21
Enhancing ‘Mobility’ through Integrated Transportation and Traffic Management
effectively in operational planning.
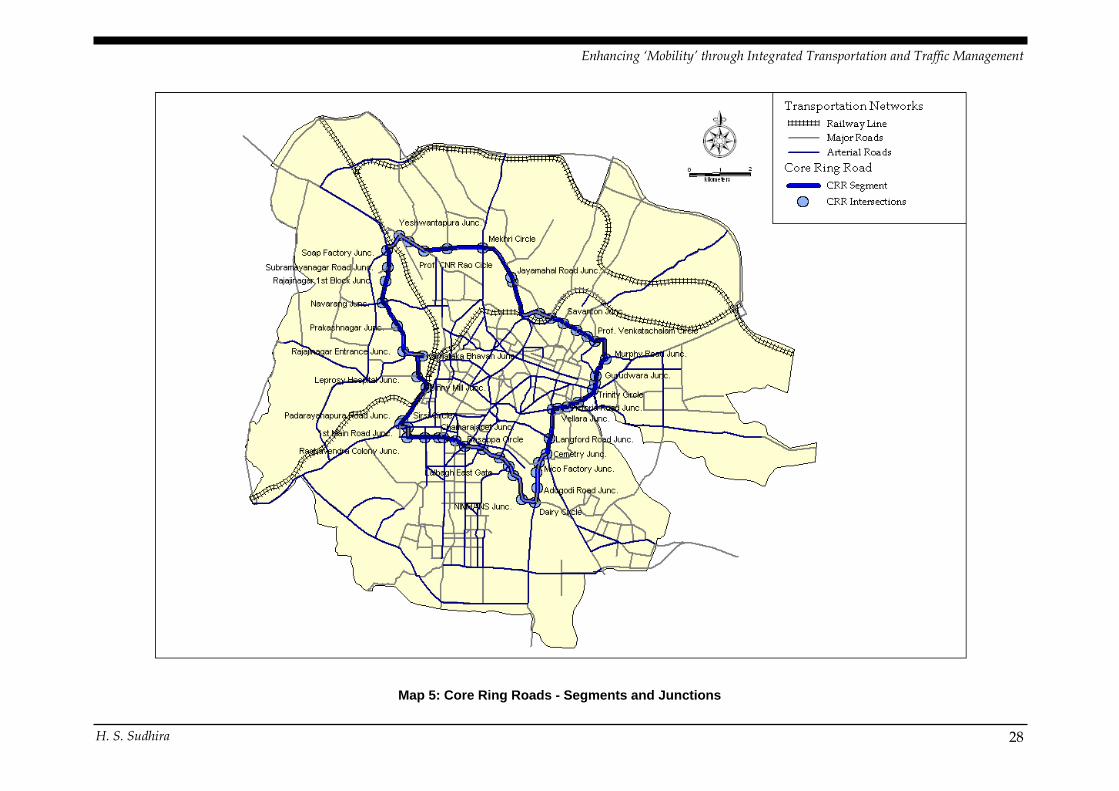
At this juncture, an attempt was made to reason out the feasibility of core ring road at
surface grade level towards practical implementation of the same. It is noted that the
concept of developing a core ring road at surface grade level in the proposed alignment
(Map 5) may not be feasible for the following reasons:
1. The notion of a core ring road (as an expressway) is to facilitate enhanced mobility by
motorable vehicles without any obstruction of passage across any intersections with
traffic movement as primary consideration and not access to property.
2. However, the proposed alignment already has numerous properties being part of older
and central city for which restricting any property access would become ill-conceived
and impractical with construction of CRR at surface grade level.
3. In the proposed alignment, the entire stretch is not conceived for “signal free passage”
and hence very purpose of core ring road is defeated.
4. With 50 intersections along the CRR and only about 13 junction improvements proposed
(underpasses and flyovers) mobility along CRR would still instil waiting at various
intersections.
5. The entire alignment is not a fresh alignment, but over existing road networks alongside
existing properties of various types. A review of the existing studies suggests that some
of the segments of CRR are high and medium density corridors with some other
interventions are conceived over these.
6. The alignment is mostly on already built-up area and constructing a 4-lane at surface
grade would call for acquisition and consequent legal challenges across the entire
alignment. Noting that some segments of CRR pass through older city areas, wherein
existing road networks are 2-lane, it would be a challenging task to implement this
project without any hurdles in the scheduled time.
7. There are already some interventions for junction improvements (like, Mekhri circle and
Dairy circle) while another 13 interventions are proposed. Unless, all these interventions
are taken up collectively instead of interventions in isolation, traffic congestion will not
be arrested but aggravated.
8. However, an elevated core ring road might suffice to fulfil abovementioned objectives.
There has been some confusion regarding the various roads and the associated development
/ improvement programmes proposed through various packages in view of numerous
H. S. Sudhira 22
Enhancing ‘Mobility’ through Integrated Transportation and Traffic Management
classification and packages. Further there are also other proposals to be taken up for
improving condition of traffic. In this regard, there is also lack of appropriate maps
highlighting the different road segments identified under different proposals. Hence it was
initiated to create spatial database for all these using GIS so that this can be used to chalk out
necessary action plans.
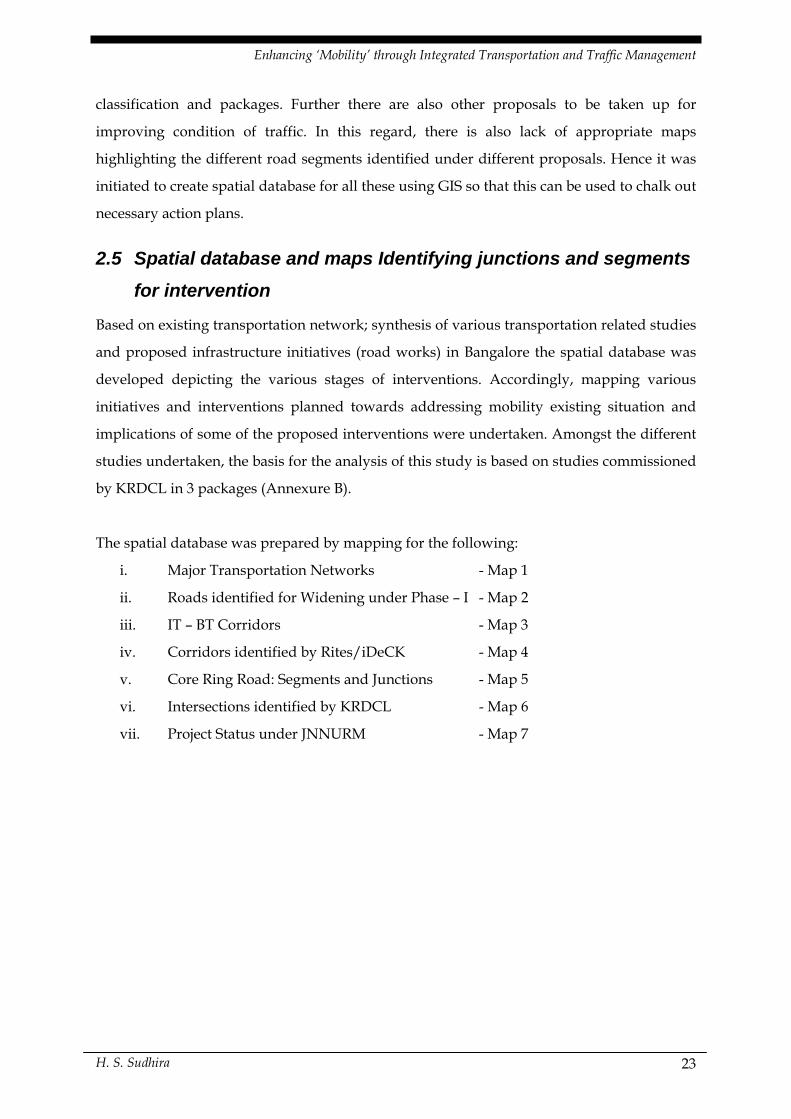
2.5 Spatial database and maps Identifying junctions and segments
for intervention
Based on existing transportation network; synthesis of various transportation related studies
and proposed infrastructure initiatives (road works) in Bangalore the spatial database was
developed depicting the various stages of interventions. Accordingly, mapping various
initiatives and interventions planned towards addressing mobility existing situation and
implications of some of the proposed interventions were undertaken. Amongst the different
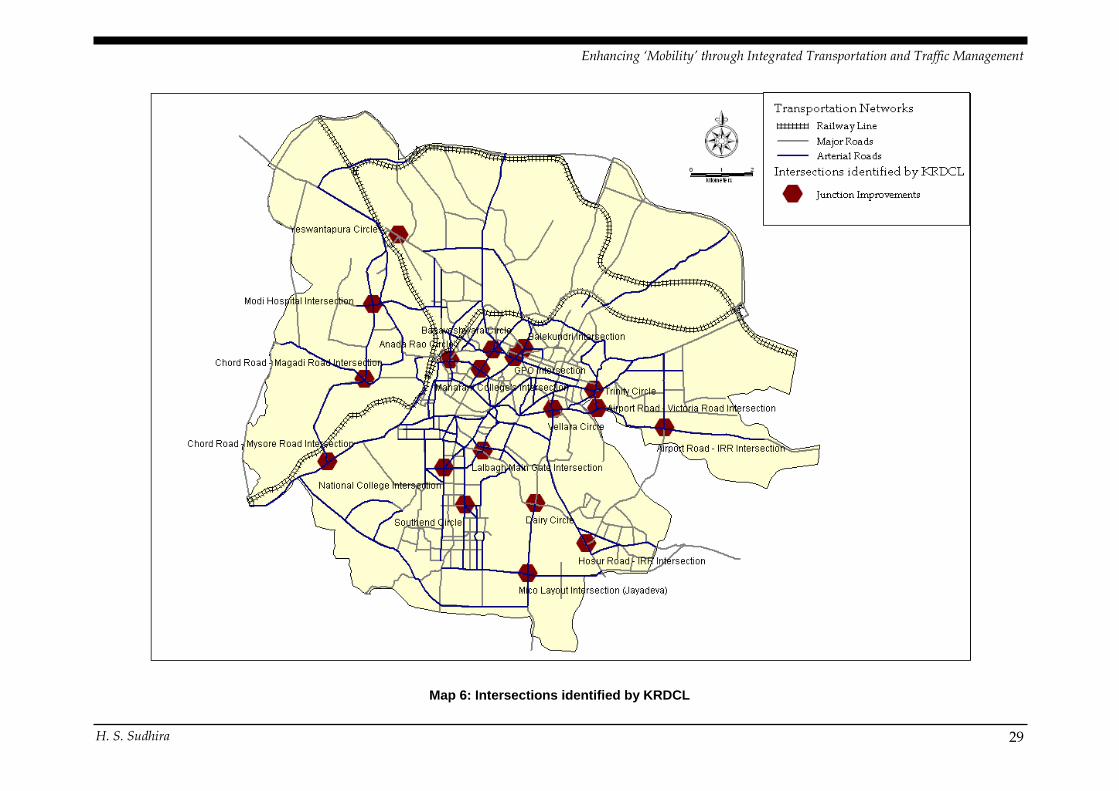
studies undertaken, the basis for the analysis of this study is based on studies commissioned
by KRDCL in 3 packages (Annexure B).
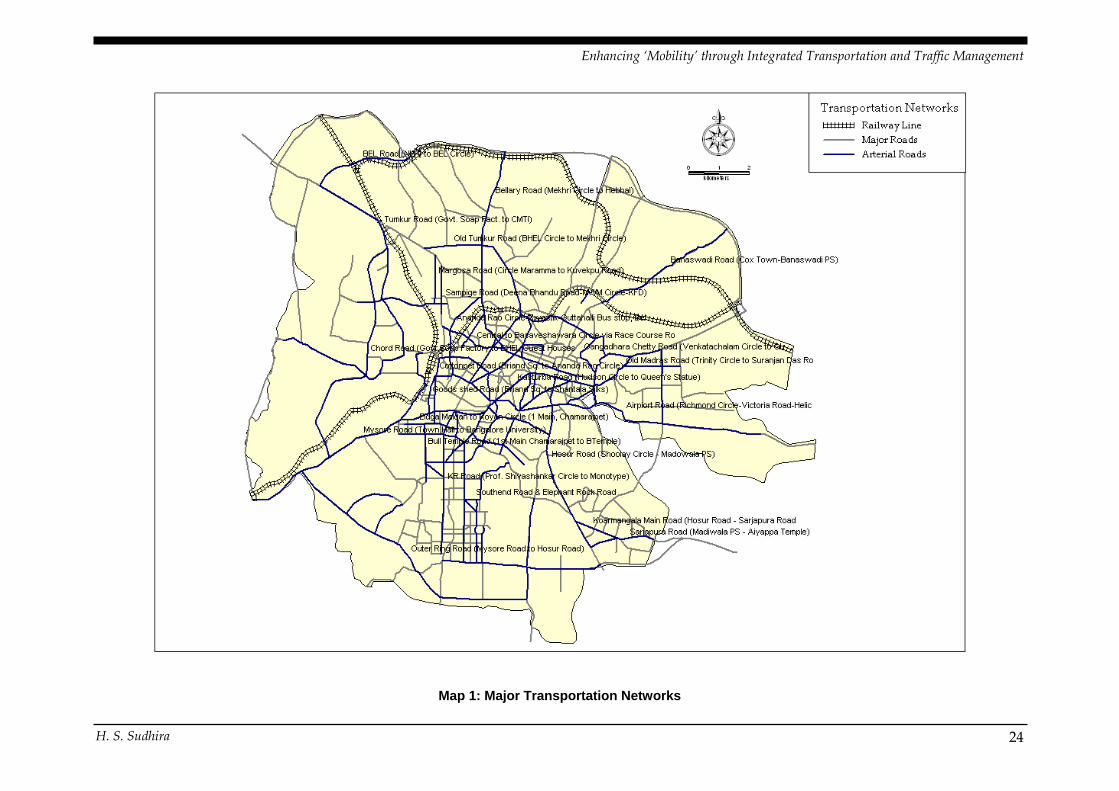
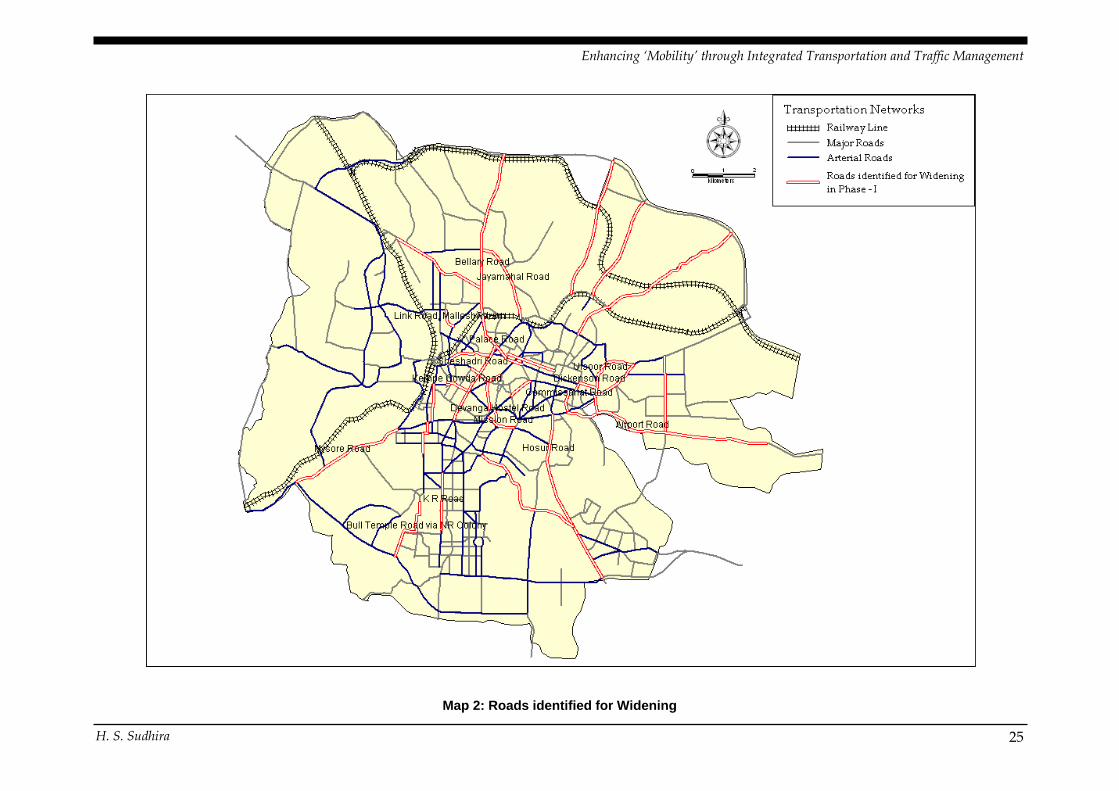
The spatial database was prepared by mapping for the following:
i. Major Transportation Networks - Map 1
ii. Roads identified for Widening under Phase – I - Map 2
iii. IT – BT Corridors - Map 3
iv. Corridors identified by Rites/iDeCK - Map 4
v. Core Ring Road: Segments and Junctions - Map 5
vi. Intersections identified by KRDCL - Map 6
vii. Project Status under JNNURM - Map 7
H. S. Sudhira 23
Enhancing ‘Mobility’ through Integrated Transportation and Traffic Management
Map 1: Major Transportation Networks
H. S. Sudhira 24
Enhancing ‘Mobility’ through Integrated Transportation and Traffic Management
Map 2: Roads identified for Widening
H. S. Sudhira 25
Enhancing ‘Mobility’ through Integrated Transportation and Traffic Management
Map 3: IT - BT Corridors
H. S. Sudhira 26
Enhancing ‘Mobility’ through Integrated Transportation and Traffic Management
Map 4: High-Medium Corridors identified by Rites/iDeCK
H. S. Sudhira 27
Enhancing ‘Mobility’ through Integrated Transportation and Traffic Management
Map 5: Core Ring Roads - Segments and Junctions
H. S. Sudhira 28
Enhancing ‘Mobility’ through Integrated Transportation and Traffic Management
Map 6: Intersections identified by KRDCL
H. S. Sudhira 29
Enhancing ‘Mobility’ through Integrated Transportation and Traffic Management
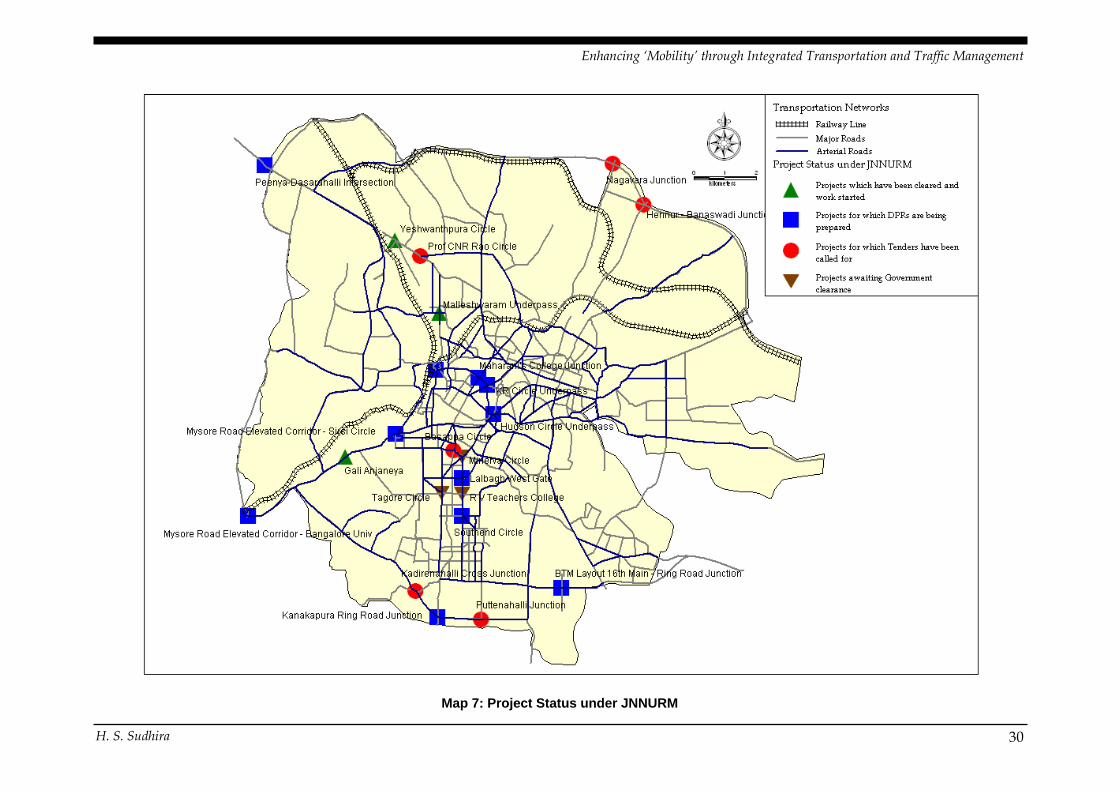
Map 7: Project Status under JNNURM
H. S. Sudhira 30
Enhancing ‘Mobility’ through Integrated Transportation and Traffic Management
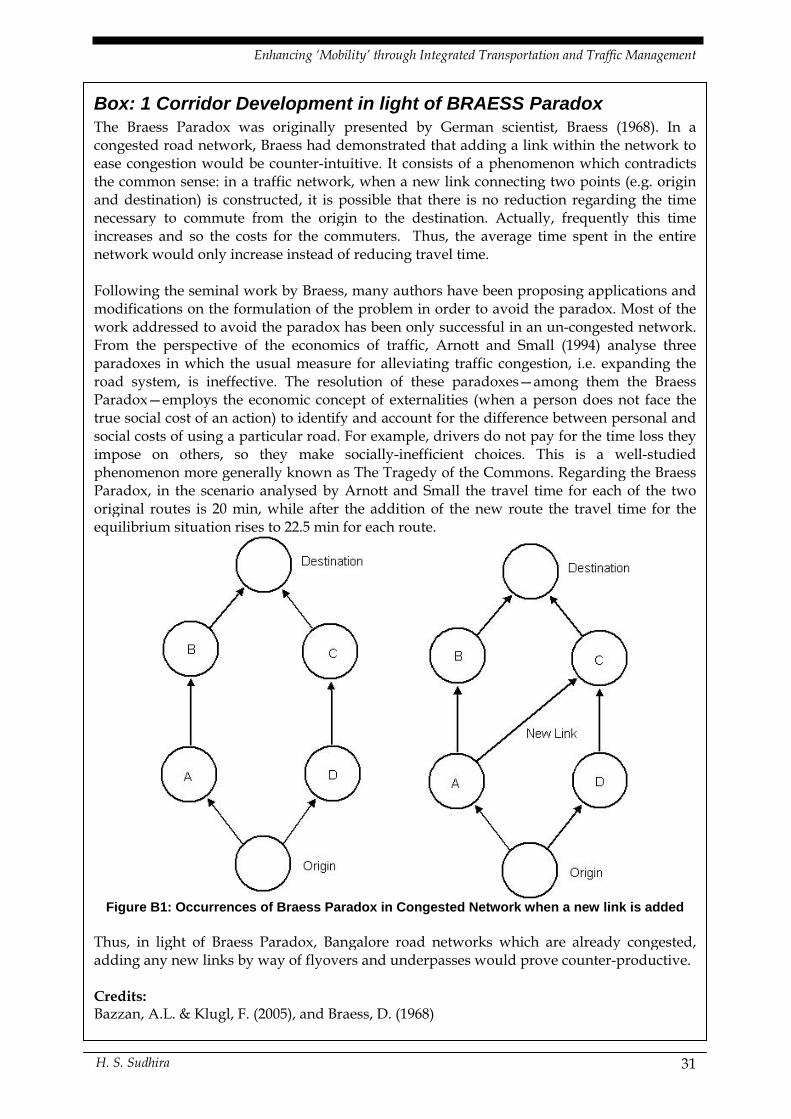
Box: 1 Corridor Development in light of BRAESS Paradox The Braess Paradox was originally presented by German scientist, Braess (1968). In a congested road network, Braess had demonstrated that adding a link within the network to ease congestion would be counter-intuitive. It consists of a phenomenon which contradicts the common sense: in a traffic network, when a new link connecting two points (e.g. origin and destination) is constructed, it is possible that there is no reduction regarding the time necessary to commute from the origin to the destination. Actually, frequently this time increases and so the costs for the commuters. Thus, the average time spent in the entire network would only increase instead of reducing travel time. Following the seminal work by Braess, many authors have been proposing applications and modifications on the formulation of the problem in order to avoid the paradox. Most of the work addressed to avoid the paradox has been only successful in an un-congested network. From the perspective of the economics of traffic, Arnott and Small (1994) analyse three paradoxes in which the usual measure for alleviating traffic congestion, i.e. expanding the road system, is ineffective. The resolution of these paradoxes—among them the Braess Paradox—employs the economic concept of externalities (when a person does not face the true social cost of an action) to identify and account for the difference between personal and social costs of using a particular road. For example, drivers do not pay for the time loss they impose on others, so they make socially-inefficient choices. This is a well-studied phenomenon more generally known as The Tragedy of the Commons. Regarding the Braess Paradox, in the scenario analysed by Arnott and Small the travel time for each of the two original routes is 20 min, while after the addition of the new route the travel time for the equilibrium situation rises to 22.5 min for each route.
Figure B1: Occurrences of Braess Paradox in Congested Network when a new link is added
Thus, in light of Braess Paradox, Bangalore road networks which are already congested, adding any new links by way of flyovers and underpasses would prove counter-productive. Credits: Bazzan, A.L. & Klugl, F. (2005), and Braess, D. (1968)
H. S. Sudhira 31
Enhancing ‘Mobility’ through Integrated Transportation and Traffic Management
3 BMP’s Initiatives in Addressing Mobility BMP has proposed to take up various programmes to ease congestion of traffic in the city.
Most of these are in various stages of conceptualisation to implementation. Among them are:
widening of roads, resurfacing of major roads, construction of grade separators, flyovers,
underpasses, construction of skywalks, multilevel automated car parking, and pavement
improvements.
The road widening is proposed to be taken up under two phases. In the phase 1, 45 roads
with about 91.2 km and in phase 2, another 40 roads with about 52.8 km would be widened.
The details of the roads identified for widening in phase 1 is presented in Annexure C.
Further, within phase 1, 12 roads are identified to be taken up in priority for about 30.2 km.
Mostly roads would be widened for about 24 m or 30 m.
3.1 Upcoming proposals addressing mobility under JNNURM
With enormous impetus under JNNURM for enhancing basic urban infrastructure and
governance, several infrastructure projects addressing mobility are being posed under the
same. The details of some of major infrastructure projects relating to road works are shown
in Table 10 and Map 7. In all there are about 23 active projects, of which work has been
started for 3 projects while Detail Project Reports are being prepared for 10 projects, tenders
have been called for about 6 projects and 3 projects are awaiting state government’s
clearance.
H. S. Sudhira 32
Enhancing ‘Mobility’ through Integrated Transportation and Traffic Management
Table 10: Project Status under JNNURM
Sl. No Project Status Projects which have been cleared and work started
1 Malleshwaram Underpass 2 Yeshwanthpura Circle 3 Gali Anjaneya
Projects for which DPRs are being prepared 4 Kanakapura Ring Road Junction 5 South-end Circle 6 Lalbagh West Gate 7 BTM Layout 16th Main - Ring Road Junction 8 Maharani's College Junction 9 Khoday's Circle
10 Peenya-Dasarahalli Intersection
11 Mysore Road Elevated Corridor from Sirsi Circle to Bangalore University
12 KR Circle Underpass 13 Hudson Circle Underpass
Projects for which Tenders have been called for 14 Prof CNR Rao Circle 15 Basappa Circle 16 Kadirenahalli Cross Junction 17 Puttenahalli Junction 18 Nagavara Junction 19 Hennur - Banaswadi Junction
Projects awaiting Government Clearance 20 R V Teachers College 21 Tagore Circle 22 Minerva Circle
H. S. Sudhira 33
Enhancing ‘Mobility’ through Integrated Transportation and Traffic Management
4 Systems Analysis for Addressing Mobility Systems dynamics is an approach to modelling the dynamics of population, ecological
systems, and economic systems, and the relationship between all three. Modelling under
system dynamics framework serve as a useful first step in making some reasonable
assumptions about the pattern a particular system might produce. However, by no accurate
means and more in depth analysis, modelling is attempted with few assumptions and
outputs as logical conclusions. Systems model were devised out of a long, inductive process
whereby computer modellers, using formal modelling techniques, noticed systems
characteristic patterns in different systems. Thus, modelling the existing condition of traffic
congestion and methods adopted to ease this are investigated with this modelling technique
by building – Causal Loop Diagrams. The systems approach for addressing traffic
congestion has almost become a classic textbook case while demonstrating / studying the
implication of road widening for easing congestion in road network. Such an example can be
found in John Sterman’s (2000) “Business Dynamics: Systems Thinking in a Complex World”.
Systems thinking use diagrams, graphs and pictures to describe and structure
interrelationships and behaviours of situations. Every element in a situation is called a
variable, and the influence of one element on another element is called a link; this can be
represented by drawing an arrow from the causing element to the affected element. In
systems thinking links always comprise a ‘circle of causality’, or a feedback loop, in which
every element is both cause and effect. Typically the process of systems modelling begins
with a clear statement of the problem, followed by gathering necessary data and identifying
the key variables contributing to the problem. The variables are mapped on to what is
referred to as Causal Loop Diagrams. With the gathered data and establishing relations with
the variables amongst the variables are the Stock Flow Diagrams created. It is possible to
simulate the behaviour of the system through Stock Flow Diagram and plot the behaviour of
key variables, test for different hypothesis and study the implications of specific
interventions. A limitation of this report is that the systems’ modelling is concluded only
with a Causal Loop Diagram. However, a detailed systems modelling can be taken up once
all the relevant data are gathered and the possible nature of interventions in to the system
are noted.
H. S. Sudhira 34
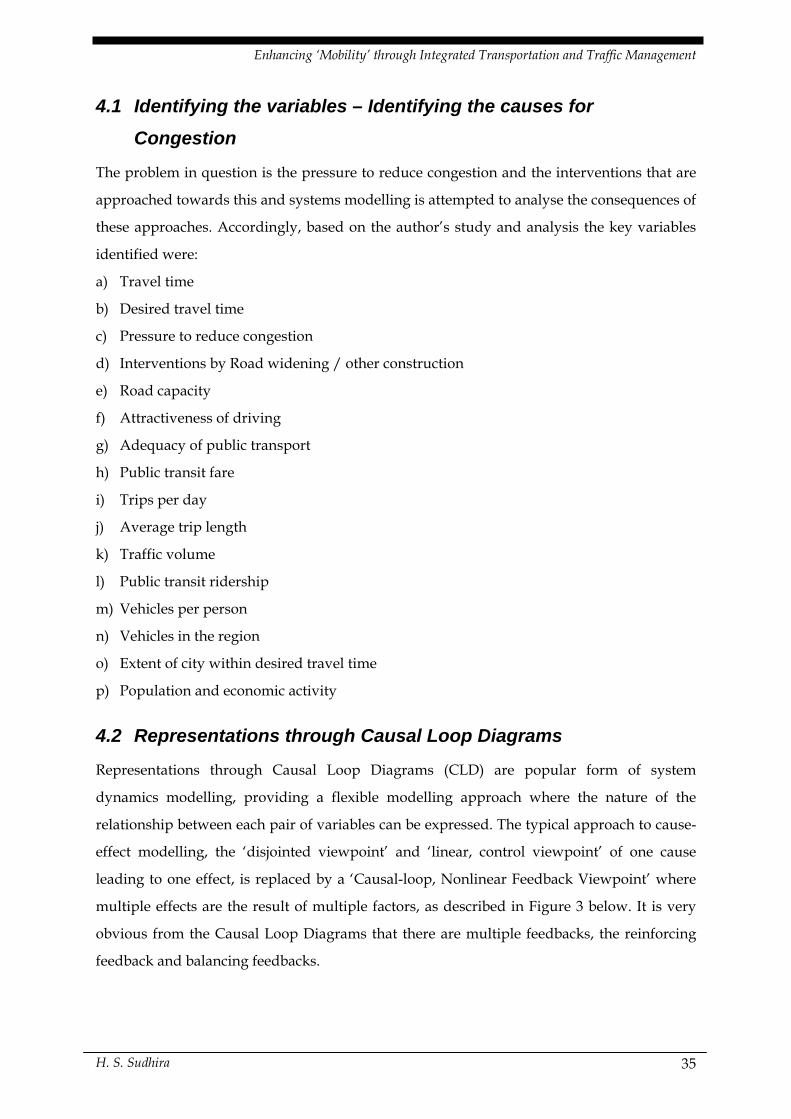
Enhancing ‘Mobility’ through Integrated Transportation and Traffic Management
4.1 Identifying the variables – Identifying the causes for
Congestion
The problem in question is the pressure to reduce congestion and the interventions that are
approached towards this and systems modelling is attempted to analyse the consequences of
these approaches. Accordingly, based on the author’s study and analysis the key variables
identified were:
a) Travel time
b) Desired travel time
c) Pressure to reduce congestion
d) Interventions by Road widening / other construction
e) Road capacity
f) Attractiveness of driving
g) Adequacy of public transport
h) Public transit fare
i) Trips per day
j) Average trip length
k) Traffic volume
l) Public transit ridership
m) Vehicles per person
n) Vehicles in the region
o) Extent of city within desired travel time
p) Population and economic activity
4.2 Representations through Causal Loop Diagrams
Representations through Causal Loop Diagrams (CLD) are popular form of system
dynamics modelling, providing a flexible modelling approach where the nature of the
relationship between each pair of variables can be expressed. The typical approach to cause-
effect modelling, the ‘disjointed viewpoint’ and ‘linear, control viewpoint’ of one cause
leading to one effect, is replaced by a ‘Causal-loop, Nonlinear Feedback Viewpoint’ where
multiple effects are the result of multiple factors, as described in Figure 3 below. It is very
obvious from the Causal Loop Diagrams that there are multiple feedbacks, the reinforcing
feedback and balancing feedbacks.
H. S. Sudhira 35
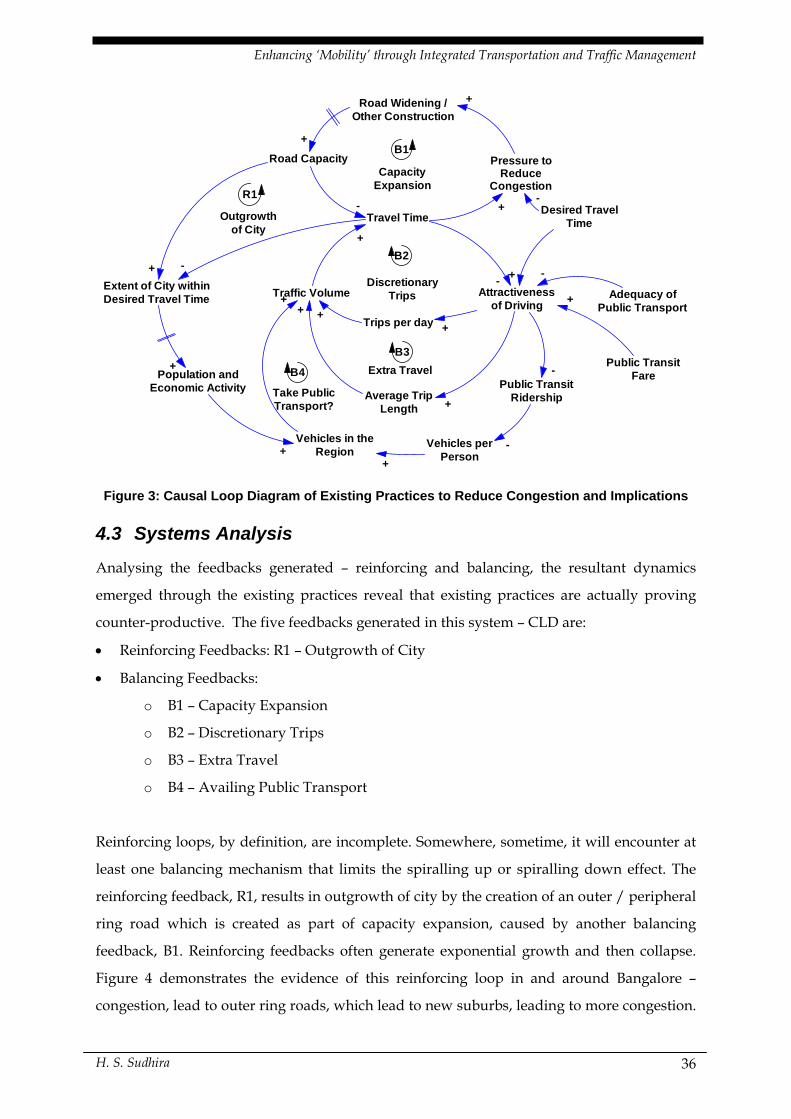
Enhancing ‘Mobility’ through Integrated Transportation and Traffic Management
Road Widening /Other Construction
Pressure toReduce
Congestion
Travel Time
Road Capacity
Traffic Volume Attractivenessof Driving
Trips per day
Average TripLength
Desired TravelTime
Adequacy ofPublic Transport
Public TransitFare
Public TransitRidership
Vehicles perPerson
Vehicles in theRegion
Population andEconomic Activity
Extent of City withinDesired Travel Time
+
+
- +-
+
+
-+
+++
+
++
-
-
+
+
+
--
B1
CapacityExpansion
R1
Outgrowthof City
B2
DiscretionaryTrips
B3Extra TravelB4
Take PublicTransport?
Figure 3: Causal Loop Diagram of Existing Practices to Reduce Congestion and Implications
4.3 Systems Analysis
Analysing the feedbacks generated – reinforcing and balancing, the resultant dynamics
emerged through the existing practices reveal that existing practices are actually proving
counter-productive. The five feedbacks generated in this system – CLD are:
• Reinforcing Feedbacks: R1 – Outgrowth of City
• Balancing Feedbacks:
o B1 – Capacity Expansion
o B2 – Discretionary Trips
o B3 – Extra Travel
o B4 – Availing Public Transport
Reinforcing loops, by definition, are incomplete. Somewhere, sometime, it will encounter at
least one balancing mechanism that limits the spiralling up or spiralling down effect. The
reinforcing feedback, R1, results in outgrowth of city by the creation of an outer / peripheral
ring road which is created as part of capacity expansion, caused by another balancing
feedback, B1. Reinforcing feedbacks often generate exponential growth and then collapse.
Figure 4 demonstrates the evidence of this reinforcing loop in and around Bangalore –
congestion, lead to outer ring roads, which lead to new suburbs, leading to more congestion.
H. S. Sudhira 36
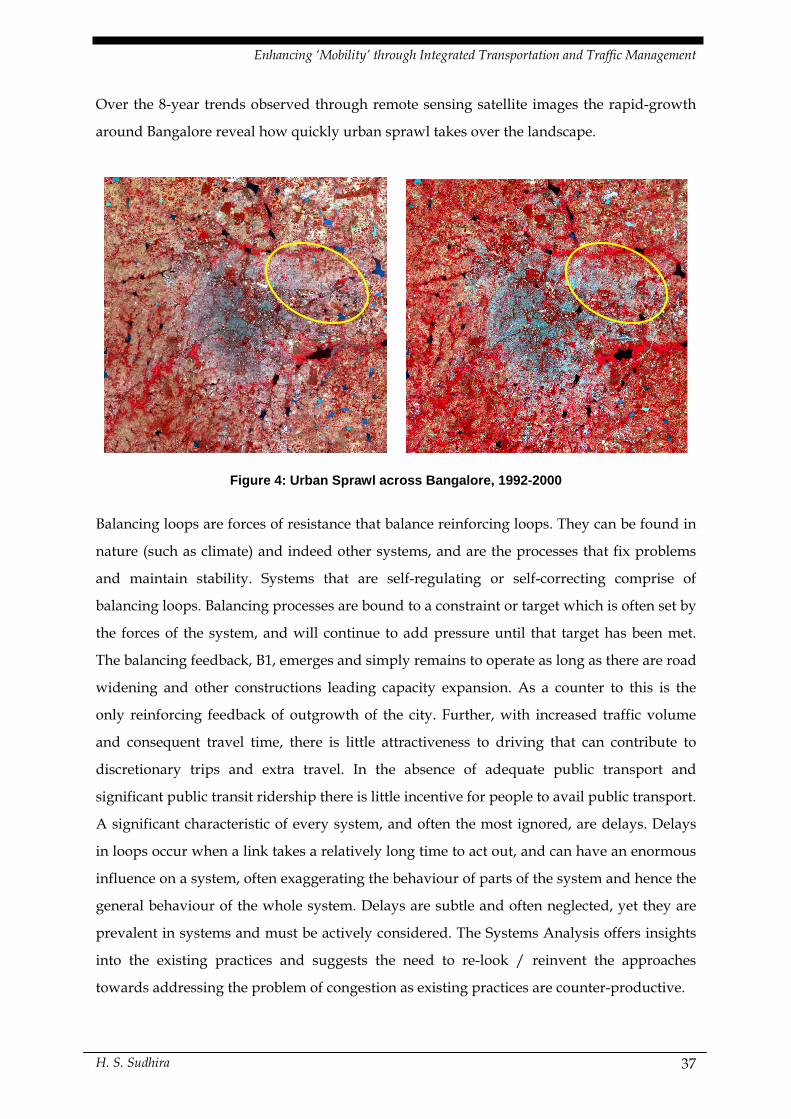
Enhancing ‘Mobility’ through Integrated Transportation and Traffic Management
Over the 8-year trends observed through remote sensing satellite images the rapid-growth
around Bangalore reveal how quickly urban sprawl takes over the landscape.
Figure 4: Urban Sprawl across Bangalore, 1992-2000
Balancing loops are forces of resistance that balance reinforcing loops. They can be found in
nature (such as climate) and indeed other systems, and are the processes that fix problems
and maintain stability. Systems that are self-regulating or self-correcting comprise of
balancing loops. Balancing processes are bound to a constraint or target which is often set by
the forces of the system, and will continue to add pressure until that target has been met.
The balancing feedback, B1, emerges and simply remains to operate as long as there are road
widening and other constructions leading capacity expansion. As a counter to this is the
only reinforcing feedback of outgrowth of the city. Further, with increased traffic volume
and consequent travel time, there is little attractiveness to driving that can contribute to
discretionary trips and extra travel. In the absence of adequate public transport and
significant public transit ridership there is little incentive for people to avail public transport.
A significant characteristic of every system, and often the most ignored, are delays. Delays
in loops occur when a link takes a relatively long time to act out, and can have an enormous
influence on a system, often exaggerating the behaviour of parts of the system and hence the
general behaviour of the whole system. Delays are subtle and often neglected, yet they are
prevalent in systems and must be actively considered. The Systems Analysis offers insights
into the existing practices and suggests the need to re-look / reinvent the approaches
towards addressing the problem of congestion as existing practices are counter-productive.
H. S. Sudhira 37
Enhancing ‘Mobility’ through Integrated Transportation and Traffic Management
5 Analysing for Time- and Cost-overruns: Experiences from Previous Initiatives
Bangalore Mahanagara Palike at any given point of time is responsible for delivery and
implementation of various public works especially on provision and maintenance of
infrastructure like road works, street-lighting, solid waste management, etc. However, with
ubiquitous pressure on delivering basic services and infrastructure to its citizens it is of
utmost importance that there aren’t any time- and cost overruns in the implementation of
various projects. Yet infrastructure related works envisaged by BMP faces severe road block
at various stages resulting in time and thus cost-overruns for successful and timely
completion of these projects. And so, as a first step it was attempted characterise some of the
key issues responsible for time and cost – overruns.
5.1 Key issues responsible
In order to arrive at the key issues responsible for the time and cost overruns, discussions
with various Engineers of BMP were undertaken. The factors responsible for these delays
indicate the lack of effective coordination from other line agencies. The factors for time and
cost-overruns in various infrastructure projects are outlined below while the ways to tackle
are listed in the report.
• Shifting of utilities: Most road networks carry either water supply pipe or a sewage line
along one of its shoulders, while there can be additionally telecommunication related
utilities lying underneath. Often, even after the work-order for the execution of the
project is granted by BMP, shifting of utilities owned by various agencies actually cause
significant time-lags in initiation of the projects.
• Traffic diversion: Some of the infrastructure projects like construction of flyovers or
underpasses would result in blocking certain right-of-ways at the junctions where the
projects are taken up. This would minimally result in diverting the traffic plying over
this junction. Again in most instances obtaining the necessary clearances and opting for
alternative routes during the execution of the project are contributing to the time-over
runs of the project.
• Acceptance by public/locals: It is noted that some of the infrastructure projects are
conceived under the pretext of larger common good, while there are definitive resistance
from the locals or people directly affected by the projects. Thus, even if a project has
H. S. Sudhira 38
Enhancing ‘Mobility’ through Integrated Transportation and Traffic Management
cleared all necessary hurdles of project approval and funding, it might actually face stiff
resistance from the public further delaying the completion of the project.
• Handing over the site in the light of unclear title documents: In instances like road
widening and other road construction works, at times it is the unclear title
deeds/documents with the residents/owners of the adjacent property.
• Administrative delays in getting appropriate approvals at various levels both internal
(Council) and external (other agencies, like BMRCL): Apart from the above factors,
sometimes right at the initial stages of project conceptualisation and subsequent
execution, BMP internally needs to take clearance from the council of elected
representatives. In few other instances, wherever the projects are coming up in the
region where the Metro is coming up, BMP has to take official clearance from the
concerned organisation, BMRCL. These clearances are often responsible for time-
overruns.
• Escalation of costs of materials from the time of tender to actual issue of work order: The
bill of materials required for the project would sometimes face with escalation of cost
with respect to the cost quoted during the conceptualisation of project to the day of
implementation of the project.
• Acquisition of land: Overcoming different hurdles acquiring the necessary land for
taking up the infrastructure work, is yet another factor responsible for time and cost
overrun.
• Surprise legal hurdles: At instances where there are stiff resistances from the public or
others, the project itself may face surprise legal hurdles for successful implementation.
5.2 Ways to tackle
The successful completion of infrastructure projects without any time and cost overruns are
to be achieved by the local body in order to save for the additional cost incurred and retain
faith from the public on the capabilities of a local body to deliver services and implement
projects professionally. Some of the possible ways of tackling this are listed below:
• Ensuring coordination amongst stakeholder organisations
• Effective information dissemination of the proposed project
• Increasing accountability of BMP Engineers in-charge of the project and Contractor
responsible for executing the project
• Incentives / sanctions on BMP Engineers and Contractors towards successful execution
of the project
H. S. Sudhira 39
Enhancing ‘Mobility’ through Integrated Transportation and Traffic Management
It is noted that key factor responsible for time and hence cost overruns is the lack of effective
coordination amongst stakeholder organisations and effective information dissemination of
the proposed project. Thus it is imperative that effective mechanisms for ensuring
coordination amongst the stakeholder organisation are created and put in place. Further,
with effective information dissemination of the proposed projects, there can less confusion
and hence opposition from the public, while it will be most effective when there is
community participation at the project conceptualisation stage. With community
participation at the project conceptualisation stages, there would be little resistance to these
projects, besides it is the community who should be benefited by these projects.
At present there isn’t any mechanism that acts as checks within the system to ensure that
responsible / concerned officials are held accountable for the successful implementation of
the project. Even simple information display boards on status of projects and the concerned
official at a public place should create minimal checks to ensure timely implementation of
the project. On the same lines, there can be incentives offered to the contractor who have
contributed to the timely completion of the project.
The mechanisms suggested here require only minimal mechanisms to display the status of
the projects corresponding to concerned officials, while decision on other mechanisms like
offering incentives are to be taken through policy decisions taken at the highest level of the
local body. This chapter only broaches this subject very briefly, noting that a detailed study
and analysis can offer better insights into successful and effective implementation of
infrastructure projects towards establishing best practices.
H. S. Sudhira 40
Enhancing ‘Mobility’ through Integrated Transportation and Traffic Management
6 Future Initiatives - Mechanisms for Ensuring Coordination
Among the key challenges that the city corporation faces towards successful implementation
and completion of various infrastructure projects related to mobility can be summed up in
three heads: Lack of effective coordination; Lack of complete/essential information and Lack
of benchmarking practices or performance measures to track progress. Each of these is
elaborated in slight detail in the subsequent sections. The argument put forward here is that
without complete picture (information) on the ground, there cannot be any coordination and
in the absence of these there will certainly be no benchmarking. However, in some isolated
instances there are examples of some initiatives resulting as Best Practices even within the
purview of BMP, which unfortunately are not replicated. Innovative mechanisms of
implementation though earn the tag of Best Practices, they at times fail to be repeated or
replicated and mostly it is difficult to sustain over a period of time these practices. Further,
such practices might have resulted from the lead taken by the executive head in these
institutions and the best practices initiated by one head need not stay on when the
incumbent head moves on another assignment. Hence, it is on the onus of the executive
heads to put mechanisms and systems in place that these practices are sustained and
replicated. As a first step towards achieving this, it is essential to integrate planning and
operations effectively. As noted in Chapter 2.2, with numerous organisations addressing
mobility, notably many on daily operations and the other on planning. In this regard, the
theme that is put forward in the subsequent section is on integrating planning and
operations for ensuring mobility.
6.1 Integrating Planning and Operations
The theme that is put forward for day-to-day operations is to ensure a sustainable best
practice through planning for operations through coordination and a common geographic
unit for these operations.
6.1.1 Planning for Operations through Coordination From the analysis and experiences with the style of local governance and administration, the
operation plans drawn are ineffective in addressing smooth coordination. Essentially much
of the chaos is contributed due to the disengagement with the planning organisation and the
organisation involved with daily operations. A stark contrasting fact with the planning
H. S. Sudhira 41
Enhancing ‘Mobility’ through Integrated Transportation and Traffic Management
organisation is its lack of acknowledgement of any city functions: mobility, jobs, economy,
energy, etc. The planning organisation on the one hand is focussed on land use plans and its
regulation alone with any acknowledgment of integrating land use with transportation for
enhancing mobility. On the other hand, the local administration has to wake overnight to act
for daily operations management with little realisation on the implications of the planning
organisation ignoring the city functions. With numerous organisations responsible for
addressing mobility, it is imperative that at least these organisations get together in
acknowledge their interdependencies formally through appropriate mechanisms. Thus the
possible way out to break the gridlock, is facilitating systems and practices that ensures
feedback and coordination effectively. Essentially the interplay of these organisations
involved with mobility has to be acknowledged and bridged from short-to-medium time
frame planning undertaken by BDA to near-to-short term operations undertaken by BMP.
Thus, it is essential to link the daily-operations with the planning of 10 year time period so
that future chaos is arrested.
A Coordination committee or an empowered committee to address these under a singe
umbrella would possibly be the option. To begin with it is essential to sensitise all the key
stakeholders on their interdependencies and the need for constant feedback and hence
coordination. Subsequently the coordination committee will have to create processes and
mechanisms ensuring the above objectives. This committee also has to charter the entire
workflow of the various activities and ensure systems for speedy approval and
implementation of these activities.
6.1.2 A Common Geographic Unit: Key for Coordination A key reason for the persistence of lack of effective coordination is the absence of “common
geographic unit”. Much of the mess, the planning or the administration currently facing are
the implications of having different geographic units for different stakeholder organisations.
Again as noted in Chapter 2.2, with multiple organisations addressing mobility, it is rather
incomprehensive that none of these organisations have a common geographic unit! In the
absence of common geographic unit, there is no way that any data can be collated and
assimilated collectively which leads to isolated interventions evident from the current
practices. Noting the notification of Greater Bangalore and the amalgamation of
neighbouring municipal councils and villages into the agglomeration, the landscape of
Bangalore has been formally extended. However, with the demarcation of regions, zones
H. S. Sudhira 42
Enhancing ‘Mobility’ through Integrated Transportation and Traffic Management
and wards based on possibly census and settlement patterns, it is imperative a common
geographic unit is mooted with the involvement of all the stakeholders in this region. By
ensuring that all other stakeholder organisations comply with the same geographic unit,
planning for operations will become very effective. The advantage of having common
geographic unit would also ensure easy collection, collation and dissemination of the data at
a common place. Thus the integration and coordination has to begin with the small step of
having a common geographic unit.
6.2 Gathering Information: Technological Interventions
Bangalore is currently experiencing a sea of challenges in urban governance and at the same
instance an opportunity in taking on this challenge. The challenges are self-evident: speedy
and efficient delivery of service and ensuring access to these across the cross-section of the
society. From managing infrastructure, to collection, transfer and safe disposal of solid
waste, to delivery of education and health services, to regulating building plans, and so on
the civic administration is flooded with many activities that relate to daily operations.
However, as evident from the current practices, there is a dearth of information at every
level. Specifically on mobility, in the absence of effective road classification strategy and
even compliance to existing classification, the nature of data available are sparse. Given the
multitude of organisations addressing mobility, no factual data are collected with regard to
status of traffic across key junctions or segments, status of roads with respect to asphalting
and potholes, status of pavements and streetlights, all on a spatial database. Thus it is highly
recommended that the administration invests on data collection, analysis and sharing for
effective operations. This can only be anchored and coordinated by the civic administration
as the key organisation responsible for delivery of basic services to its citizens.
Noting practices worldwide, like in London, the head of city, the Mayor, is the executive
head responsible for all issues under mobility including the Transport for London,
Metropolitan Police Authority and the London Development Agency. This has created a
mechanism for all stakeholders to be united under a single head / authority enabling
effective information gathering, sharing and coordination. Unlike London, administration in
Bangalore is a different setup. However, the notification of Greater Bangalore by the state
government calls for greater coordination and better delivery of services. In this regard, the
civic administration should initiate actions and mechanisms in a way that this goes a long
way in recognising the needs and collecting all the necessary information across different
H. S. Sudhira 43
Enhancing ‘Mobility’ through Integrated Transportation and Traffic Management
service delivery organisations. A possible way out is through specific administrative reforms
towards the same.
Further specifically on addressing mobility, gathering information periodically can aids in
activity tracking that can suggest optimal routes for vehicular movement in real time
ensuring effective traffic management. Gathering Information aiding in activity tracking,
analysis and decision-making for daily operations of traffic, forms the foundation of
Intelligent Transport Systems. Intelligent Transport Systems with real time information
helps online tracking, monitoring of vehicular movement, which will aid in automating /
synchronising traffic signals.
Activity tracking and online tracking, monitoring of vehicular movement is possible by
enforcing Radio Frequency-based ID (RFID) tags installed to all vehicles that ply within city
limits. Such tags would flush in thousands of data clouds for vehicular traffic movement
along various segments that can be tracked, visualised through appropriate systems for
effective management. Then the challenge is for technology to decipher the data and
represent the data clouds over a spatial domain for effective decision-making. Given the fact
that leading institution in the country, the Indian Institute of Science is also in Bangalore,
IISc can spearhead towards anchoring for the same in technology with opportunity for
private players to participate in terms of IT infrastructure and services. The civic
administration in coordination with other service agencies can be assured of real time data
dissemination for decision-making. The advantages of radio-tagging vehicles are that the
administration would know the nature of traffic at any junction/segment and the profile of
vehicular traffic in that segment. This would also curtail on any possible violation of traffic
rules and incidence of crime. The radio-tagging may be made mandatory similar to the
norms for mitigating environmental pollution through emission certificates that has to be
obtained periodically every six months. The administration may charge additionally
towards the costing of one-time set-up costs of such facility and let the owners of individual
motor transport to contribute for their radio-tags.
With the possibility of collecting data online through RFID, traffic signals can be effectively
synchronised and automated. Such a facility can also lead to developing an Integrated
Dynamic Decision Support Systems incorporating all the above. The ITS will be essentially
based out of this Decision Support System aided by an effective mechanism of data
H. S. Sudhira 44
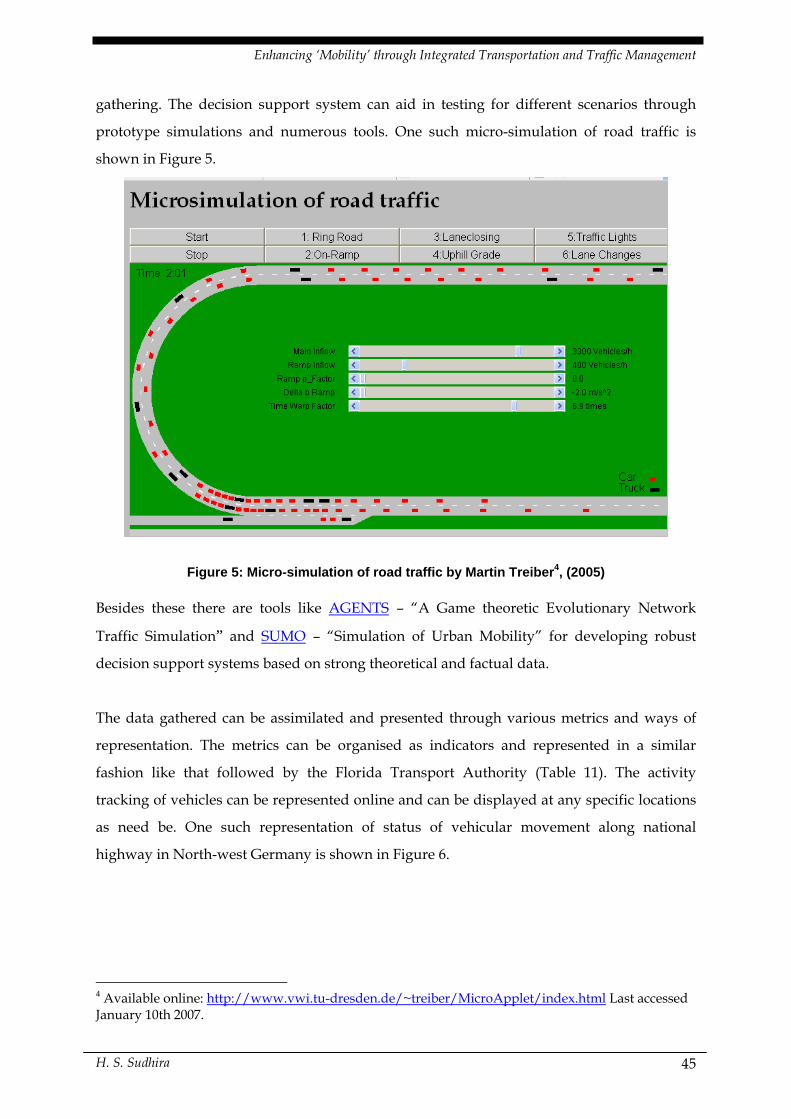
Enhancing ‘Mobility’ through Integrated Transportation and Traffic Management
gathering. The decision support system can aid in testing for different scenarios through
prototype simulations and numerous tools. One such micro-simulation of road traffic is
shown in Figure 5.
Figure 5: Micro-simulation of road traffic by Martin Treiber4, (2005)
Besides these there are tools like AGENTS – “A Game theoretic Evolutionary Network
Traffic Simulation” and SUMO – “Simulation of Urban Mobility” for developing robust
decision support systems based on strong theoretical and factual data.
The data gathered can be assimilated and presented through various metrics and ways of
representation. The metrics can be organised as indicators and represented in a similar
fashion like that followed by the Florida Transport Authority (Table 11). The activity
tracking of vehicles can be represented online and can be displayed at any specific locations
as need be. One such representation of status of vehicular movement along national
highway in North-west Germany is shown in Figure 6.
4 Available online: http://www.vwi.tu-dresden.de/~treiber/MicroApplet/index.html Last accessed January 10th 2007.
H. S. Sudhira 45
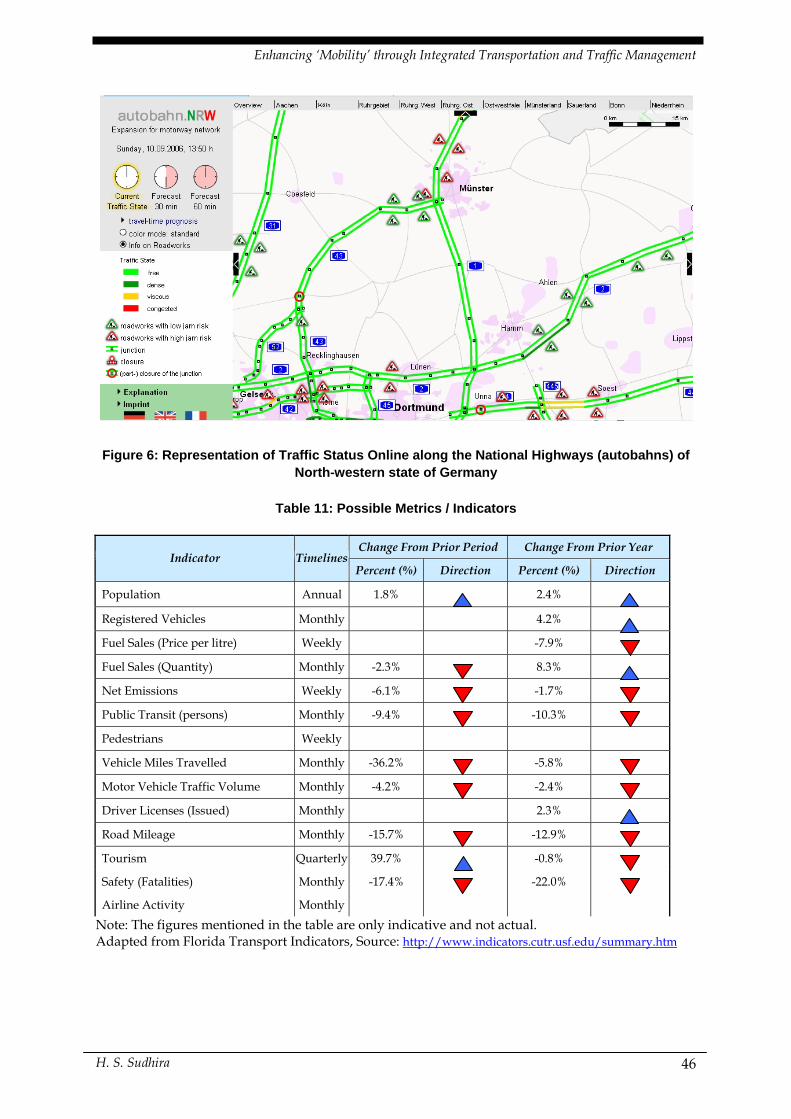
Enhancing ‘Mobility’ through Integrated Transportation and Traffic Management
Figure 6: Representation of Traffic Status Online along the National Highways (autobahns) of North-western state of Germany
Table 11: Possible Metrics / Indicators
Change From Prior Period Change From Prior Year Indicator Timelines
Percent (%) Direction Percent (%) Direction
Population Annual 1.8% 2.4%
Registered Vehicles Monthly 4.2%
Fuel Sales (Price per litre) Weekly -7.9%
Fuel Sales (Quantity) Monthly -2.3% 8.3%
Net Emissions Weekly -6.1% -1.7%
Public Transit (persons) Monthly -9.4% -10.3%
Pedestrians Weekly
Vehicle Miles Travelled Monthly -36.2% -5.8%
Motor Vehicle Traffic Volume Monthly -4.2% -2.4%
Driver Licenses (Issued) Monthly 2.3%
Road Mileage Monthly -15.7% -12.9%
Tourism Quarterly 39.7% -0.8%
Safety (Fatalities) Monthly -17.4% -22.0%
Airline Activity Monthly
Note: The figures mentioned in the table are only indicative and not actual. Adapted from Florida Transport Indicators, Source: http://www.indicators.cutr.usf.edu/summary.htm
H. S. Sudhira 46
Enhancing ‘Mobility’ through Integrated Transportation and Traffic Management
6.3 Tracking progress through Performance Measures In the absence of any performance measures the direction of interventions/progress or their
effectiveness is unknown. A set of performance measures essential to track the progress of
various interventions towards addressing mobility. Citizens, elected officials, policy makers
and transportation professionals required to measure the performance of the transportation
system to answer the following questions:
• How can services be enhanced for improving mobility?
• What are the outcomes of investment in transportation?
• What is the efficiency of investment addressing mobility?
Mobility performance measures are needed to answer these questions and to track
performance over time. They also provide accountability and link strategic planning to
resource allocation. By defining specific measures, the civic administration will be able to
measure the effectiveness of programs in meeting its objectives. Mobility performance
measures, adapted from the Florida Mobility Performance Measurement Program, are used
to characterize the success of transportation, in terms of:
1. Quantity of service (number of people served) - Collective user perspective, and measure
of a program's success.
2. Quality of service (degree of traveller satisfaction with the service provided) - Usually
related to travel time.
3. Accessibility of service (ease of engaging in activities) - Related to existence of service,
and difficulty of using it.
4. Utilization (how much of the available capacity is used) - Indication of whether the
system is properly sized, matching supply to demand.
Together, the four concepts of quantity, quality, accessibility, and utilization provide a
comprehensive picture of mobility to individual users, the general public, and decision
makers. Table 12 notes some of the mobility performance measures. The performance
metrics and indicators can be made available to public to keep track of progress made over
the last period and constantly monitor to ascertain the direction of investments and
supporting decisions. The performance measures together with the information and
indicators will significantly contribute to the quality of decision-making for better informed
citizens with direct feedback on the nature of initiative and investments made.
H. S. Sudhira 47
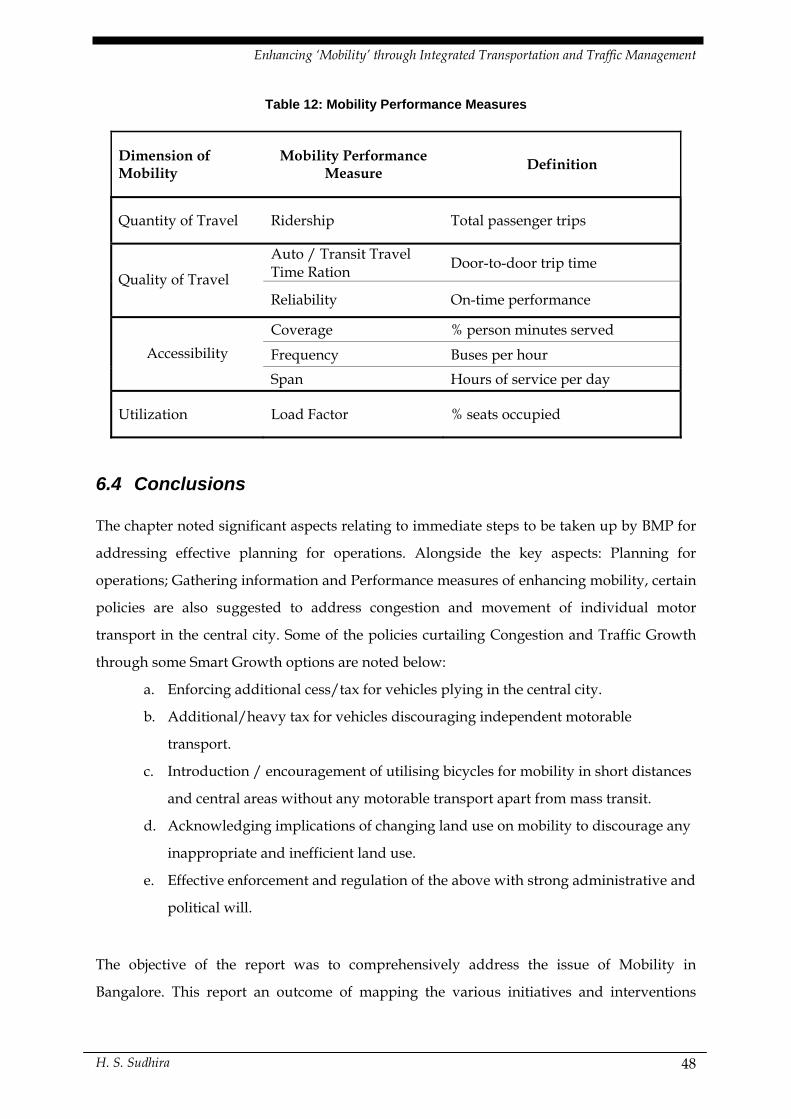
Enhancing ‘Mobility’ through Integrated Transportation and Traffic Management
Table 12: Mobility Performance Measures
Dimension of Mobility
Mobility Performance Measure Definition
Quantity of Travel Ridership Total passenger trips
Auto / Transit Travel Time Ration Door-to-door trip time
Quality of Travel Reliability On-time performance
Coverage % person minutes served
Frequency Buses per hour Accessibility
Span Hours of service per day
Utilization Load Factor % seats occupied
6.4 Conclusions The chapter noted significant aspects relating to immediate steps to be taken up by BMP for
addressing effective planning for operations. Alongside the key aspects: Planning for
operations; Gathering information and Performance measures of enhancing mobility, certain
policies are also suggested to address congestion and movement of individual motor
transport in the central city. Some of the policies curtailing Congestion and Traffic Growth
through some Smart Growth options are noted below:
a. Enforcing additional cess/tax for vehicles plying in the central city.
b. Additional/heavy tax for vehicles discouraging independent motorable
transport.
c. Introduction / encouragement of utilising bicycles for mobility in short distances
and central areas without any motorable transport apart from mass transit.
d. Acknowledging implications of changing land use on mobility to discourage any
inappropriate and inefficient land use.
e. Effective enforcement and regulation of the above with strong administrative and
political will.
The objective of the report was to comprehensively address the issue of Mobility in
Bangalore. This report an outcome of mapping the various initiatives and interventions
H. S. Sudhira 48
Enhancing ‘Mobility’ through Integrated Transportation and Traffic Management
planned towards addressing mobility, existing situation and implications of some of the
proposed interventions in Bangalore city. Though some of the aspects of mobility, especially
relating to pedestrian movement are less addressed, the report has integrated various
studies addressing mobility and involved mapping important initiatives. Based on existing
transportation network; synthesis of various transportation related studies, best practices
across the globe and proposed infrastructure initiatives (road works) in Bangalore, the
report has come out with key suggestions for enhancing mobility. The report suggests
integration of various stakeholders for effective coordination and notes critical aspects
relating to the same. Noting that information is an integral part of decision-making the
report suggests ways to achieve this. As a way of establishing best practices, the report
suggests tracking progress through performance measures that can support for the
investments made. The report brings a synthesis of various issues towards Enhancing
Mobility through integrated Traffic and Transportation Management.
H. S. Sudhira 49
Enhancing ‘Mobility’ through Integrated Transportation and Traffic Management
7 References 1. Arnott, R. and Small K., 1994. The economics of traffic congestion. American
Scientist, 82, 446-455.
2. Bangalore Metropolitan Transport Corporation (BMTC), 2006. At present, Statistics
available online: http://www.bmtcinfo.com/english/atpresent.htm Last Accessed:
20th November 2006.
3. Bazzan, A.L. & Klugl, F., 2005. 'Case studies on the Braess Paradox: Simulating route
recommendation and learning in abstract and microscopic models', Transportation
Research Part C: Emerging Technologies 13(4), 299--319.
4. Braess D., 1968. 'Ãœber ein Paradoxon aus der Verkehrsplanung', Mathematical
Methods of Operations Research (ZOR) 12(1), 258--268.
5. Friedman T., 2005. The world is flat: A brief history of the globalised world in the twenty-
first century Allen Lane, Penguin Group, England.
6. iDeCK and Rites, 2005. Rapid Traffic Study: Identification of traffic corridors in Bangalore,
Infrastructure Development Corporation (Karnataka) Limited and Rites, Bangalore.
7. Karnataka Urban Infrastructure Development and Finance Corporation (KUID&FC),
2006. Infrastructure Development and Investment Plan for Bangalore: 2006–30, Final
Report, Karnataka Urban Infrastructure Development and Finance Corporation,
Bangalore.
8. Ministry of Finance, 2006. Economic Survey 2005 – 2006. Ministry of Finance,
Government of India. Available online: http://indiabudget.nic.in/es2005-
06/esmain.htm Last accessed January 10th 2007.
9. Ministry of Urban Development, 2006. National Urban Transport Policy. Ministry of
Urban Development, Government of India. Available online:
http://urbanindia.nic.in/moud/programme/ut/TransportPolicy.pdf Last accessed
January 10th 2007.
10. Sterman, J. D., 2000. Business Dynamics: Systems Thinking and Modeling for a
Complex World. Irwin McGraw-Hill, Boston.
11. United Nations Development Programme (2001) Human Development Report –
2001, Making new technologies work for human development, UNDP, New York and
Oxford University Press, New York.
H. S. Sudhira 50
Enhancing ‘Mobility’ through Integrated Transportation and Traffic Management
Annexure
H. S. Sudhira 51
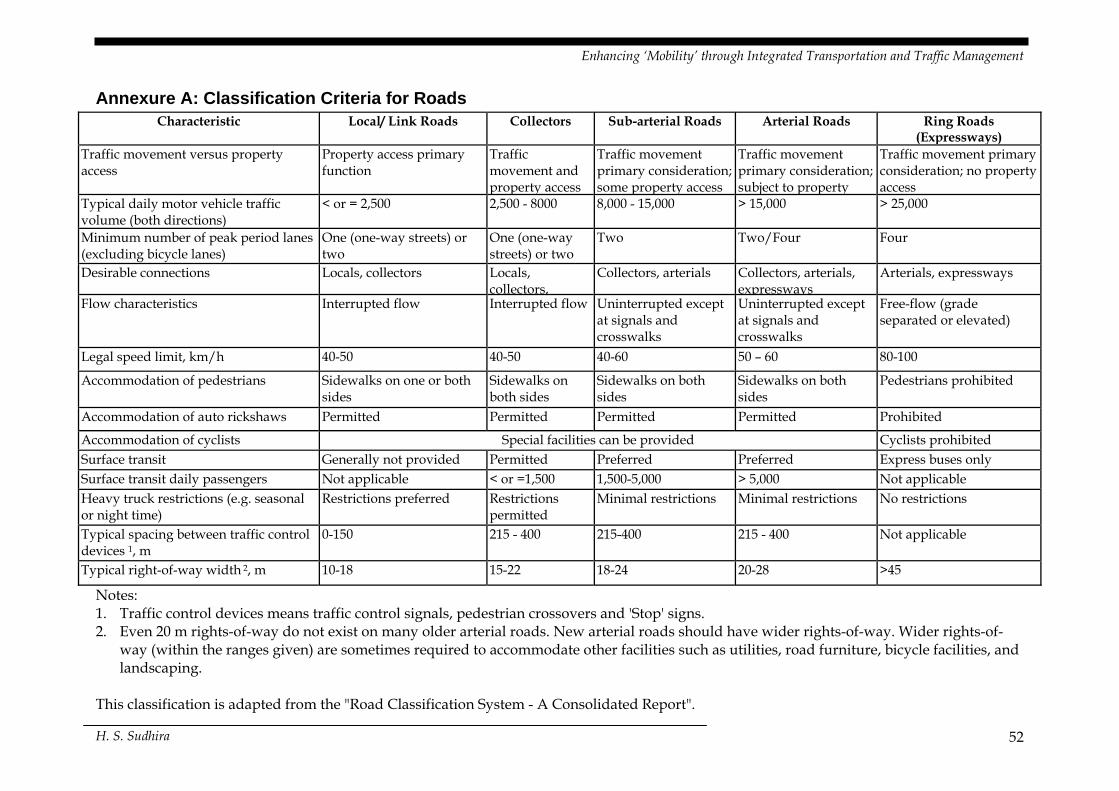
Enhancing ‘Mobility’ through Integrated Transportation and Traffic Management
Annexure A: Classification Criteria for Roads Characteristic Local/ Link Roads Collectors Sub-arterial Roads Arterial Roads Ring Roads
(Expressways) Traffic movement versus property access
Property access primary function
Traffic movement and property access
Traffic movement primary consideration; some property access
Traffic movement primary consideration; subject to property
Traffic movement primary consideration; no property access
Typical daily motor vehicle traffic volume (both directions)
< or = 2,500 2,500 - 8000 8,000 - 15,000 > 15,000 > 25,000
Minimum number of peak period lanes (excluding bicycle lanes)
One (one-way streets) or two
One (one-way streets) or two
Two Two/Four Four
Desirable connections Locals, collectors Locals, collectors,
Collectors, arterials Collectors, arterials, expressways
Arterials, expressways
Flow characteristics Interrupted flow Interrupted flow Uninterrupted except at signals and crosswalks
Uninterrupted except at signals and crosswalks
Free-flow (grade separated or elevated)
Legal speed limit, km/h 40-50 40-50 40-60 50 – 60 80-100
Accommodation of pedestrians Sidewalks on one or both sides
Sidewalks on both sides
Sidewalks on both sides
Sidewalks on both sides
Pedestrians prohibited
Accommodation of auto rickshaws Permitted Permitted Permitted Permitted Prohibited
Accommodation of cyclists Special facilities can be provided Cyclists prohibited Surface transit Generally not provided Permitted Preferred Preferred Express buses only Surface transit daily passengers Not applicable < or =1,500 1,500-5,000 > 5,000 Not applicable Heavy truck restrictions (e.g. seasonal or night time)
Restrictions preferred Restrictions permitted
Minimal restrictions Minimal restrictions No restrictions
Typical spacing between traffic control devices 1, m
0-150 215 - 400 215-400 215 - 400 Not applicable
Typical right-of-way width 2, m 10-18 15-22 18-24 20-28 >45
Notes: 1. Traffic control devices means traffic control signals, pedestrian crossovers and 'Stop' signs. 2. Even 20 m rights-of-way do not exist on many older arterial roads. New arterial roads should have wider rights-of-way. Wider rights-of-
way (within the ranges given) are sometimes required to accommodate other facilities such as utilities, road furniture, bicycle facilities, and landscaping.
This classification is adapted from the "Road Classification System - A Consolidated Report".
H. S. Sudhira 52
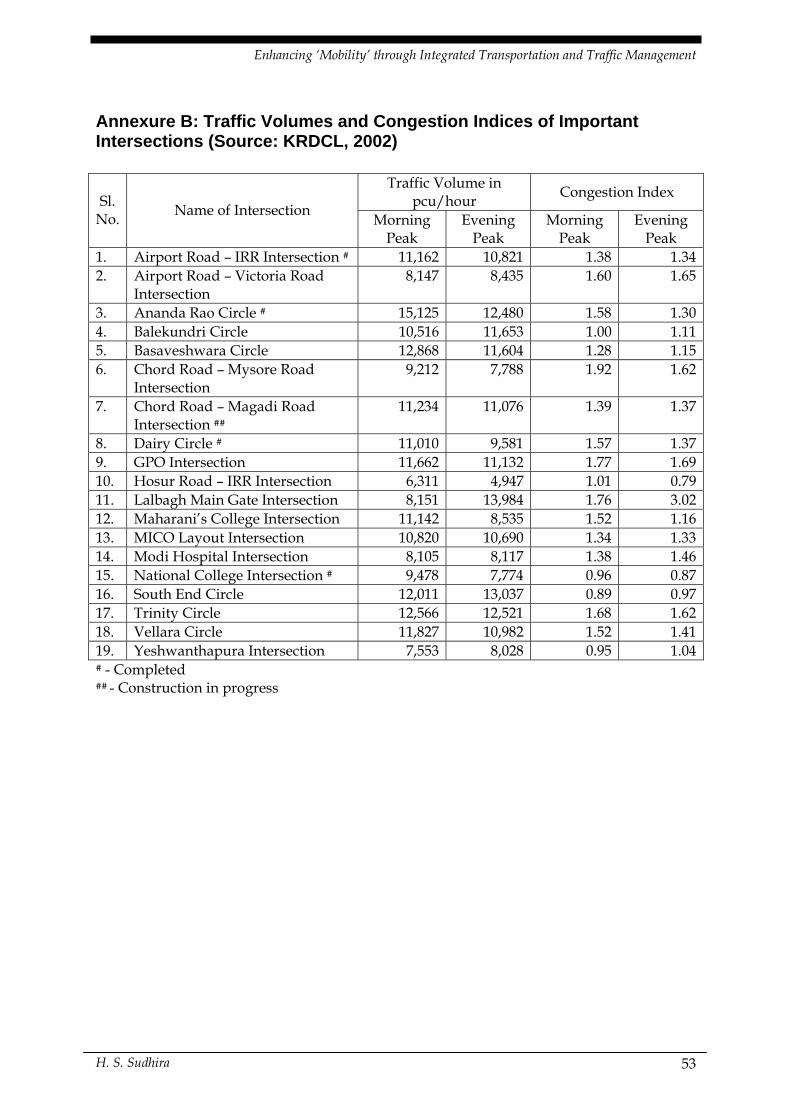
Enhancing ‘Mobility’ through Integrated Transportation and Traffic Management
Annexure B: Traffic Volumes and Congestion Indices of Important Intersections (Source: KRDCL, 2002)
Traffic Volume in pcu/hour Congestion Index Sl.
No. Name of Intersection Morning Peak
Evening Peak
Morning Peak
Evening Peak
1. Airport Road – IRR Intersection # 11,162 10,821 1.38 1.34 2. Airport Road – Victoria Road
Intersection 8,147 8,435 1.60 1.65
3. Ananda Rao Circle # 15,125 12,480 1.58 1.30 4. Balekundri Circle 10,516 11,653 1.00 1.11 5. Basaveshwara Circle 12,868 11,604 1.28 1.15 6. Chord Road – Mysore Road
Intersection 9,212 7,788 1.92 1.62
7. Chord Road – Magadi Road Intersection ##
11,234 11,076 1.39 1.37
8. Dairy Circle # 11,010 9,581 1.57 1.37 9. GPO Intersection 11,662 11,132 1.77 1.69 10. Hosur Road – IRR Intersection 6,311 4,947 1.01 0.79 11. Lalbagh Main Gate Intersection 8,151 13,984 1.76 3.02 12. Maharani’s College Intersection 11,142 8,535 1.52 1.16 13. MICO Layout Intersection 10,820 10,690 1.34 1.33 14. Modi Hospital Intersection 8,105 8,117 1.38 1.46 15. National College Intersection # 9,478 7,774 0.96 0.87 16. South End Circle 12,011 13,037 0.89 0.97 17. Trinity Circle 12,566 12,521 1.68 1.62 18. Vellara Circle 11,827 10,982 1.52 1.41 19. Yeshwanthapura Intersection 7,553 8,028 0.95 1.04 # - Completed ## - Construction in progress
H. S. Sudhira 53
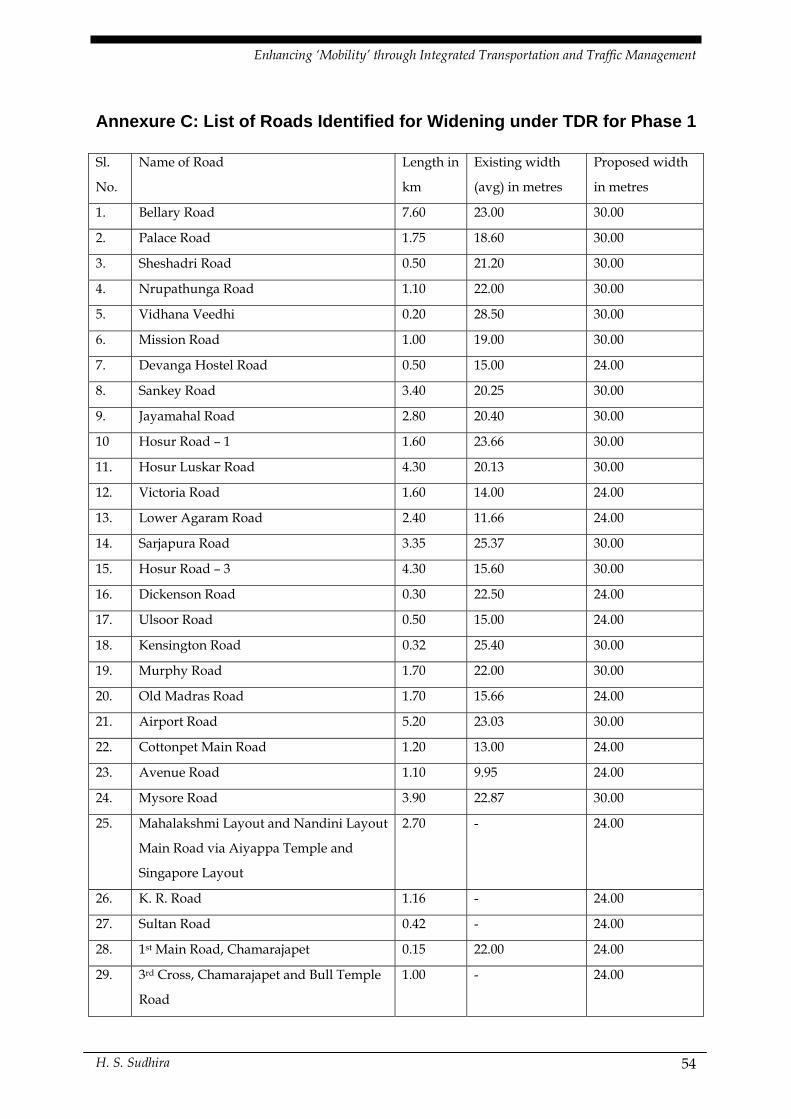
Enhancing ‘Mobility’ through Integrated Transportation and Traffic Management
Annexure C: List of Roads Identified for Widening under TDR for Phase 1 Sl.
No.
Name of Road Length in
km
Existing width
(avg) in metres
Proposed width
in metres
1. Bellary Road 7.60 23.00 30.00
2. Palace Road 1.75 18.60 30.00
3. Sheshadri Road 0.50 21.20 30.00
4. Nrupathunga Road 1.10 22.00 30.00
5. Vidhana Veedhi 0.20 28.50 30.00
6. Mission Road 1.00 19.00 30.00
7. Devanga Hostel Road 0.50 15.00 24.00
8. Sankey Road 3.40 20.25 30.00
9. Jayamahal Road 2.80 20.40 30.00
10 Hosur Road – 1 1.60 23.66 30.00
11. Hosur Luskar Road 4.30 20.13 30.00
12. Victoria Road 1.60 14.00 24.00
13. Lower Agaram Road 2.40 11.66 24.00
14. Sarjapura Road 3.35 25.37 30.00
15. Hosur Road – 3 4.30 15.60 30.00
16. Dickenson Road 0.30 22.50 24.00
17. Ulsoor Road 0.50 15.00 24.00
18. Kensington Road 0.32 25.40 30.00
19. Murphy Road 1.70 22.00 30.00
20. Old Madras Road 1.70 15.66 24.00
21. Airport Road 5.20 23.03 30.00
22. Cottonpet Main Road 1.20 13.00 24.00
23. Avenue Road 1.10 9.95 24.00
24. Mysore Road 3.90 22.87 30.00
25. Mahalakshmi Layout and Nandini Layout
Main Road via Aiyappa Temple and
Singapore Layout
2.70 - 24.00
26. K. R. Road 1.16 - 24.00
27. Sultan Road 0.42 - 24.00
28. 1st Main Road, Chamarajapet 0.15 22.00 24.00
29. 3rd Cross, Chamarajapet and Bull Temple
Road
1.00 - 24.00
H. S. Sudhira 54
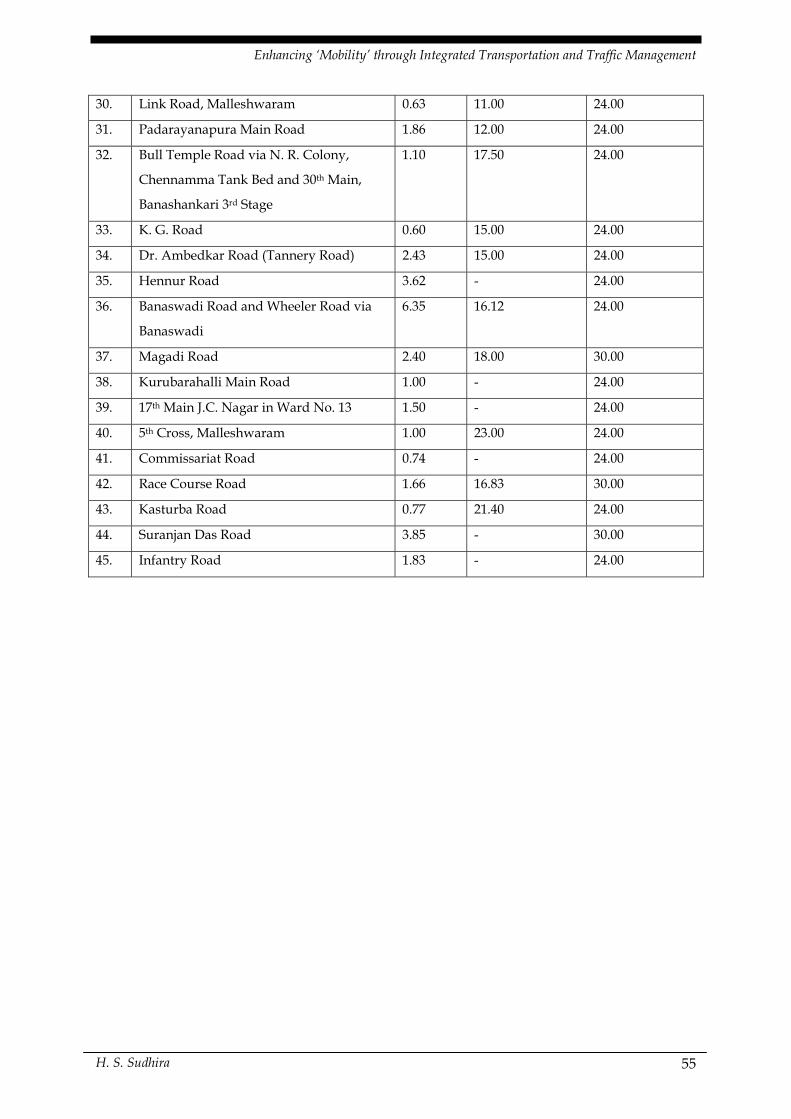
Enhancing ‘Mobility’ through Integrated Transportation and Traffic Management
30. Link Road, Malleshwaram 0.63 11.00 24.00
31. Padarayanapura Main Road 1.86 12.00 24.00
32. Bull Temple Road via N. R. Colony,
Chennamma Tank Bed and 30th Main,
Banashankari 3rd Stage
1.10 17.50 24.00
33. K. G. Road 0.60 15.00 24.00
34. Dr. Ambedkar Road (Tannery Road) 2.43 15.00 24.00
35. Hennur Road 3.62 - 24.00
36. Banaswadi Road and Wheeler Road via
Banaswadi
6.35 16.12 24.00
37. Magadi Road 2.40 18.00 30.00
38. Kurubarahalli Main Road 1.00 - 24.00
39. 17th Main J.C. Nagar in Ward No. 13 1.50 - 24.00
40. 5th Cross, Malleshwaram 1.00 23.00 24.00
41. Commissariat Road 0.74 - 24.00
42. Race Course Road 1.66 16.83 30.00
43. Kasturba Road 0.77 21.40 24.00
44. Suranjan Das Road 3.85 - 30.00
45. Infantry Road 1.83 - 24.00
H. S. Sudhira 55


