Embed Size (px)
Citation preview

Computer-Delivered Interventions to Reduce College StudentDrinking: A Meta-Analysis
Kate B. Carey, PhD, Lori A. J. Scott-Sheldon, PhD, Jennifer C. Elliott, MS, Jamie R. Bolles,BS, and Michael P. Carey, PhDCenter for Health and Behavior, Syracuse University
AbstractAims—This meta-analysis evaluates the efficacy and moderators of computer-deliveredinterventions (CDIs) to reduce alcohol use among college students.
Methods—We included 35 manuscripts with 43 separate interventions, and calculated bothbetween-group and within-group effect sizes for alcohol consumption and alcohol-relatedproblems. Effects sizes were calculated for short-term (≤ 5 weeks) and longer-term (≥ 6 weeks)intervals. All studies were coded for study descriptors, participant characteristics, and interventioncomponents.
Results—The effects of CDIs depended on the nature of the comparison condition: CDIsreduced quantity and frequency measures relative to assessment-only controls, but rarely differedfrom comparison conditions that included alcohol content. Small-to-medium within-group effectsizes can be expected for CDIs at short- and longer-term follow-ups; these changes are less than orequivalent to the within-group effect sizes observed for more intensive interventions.
Conclusions—CDIs reduce the quantity and frequency of drinking among college students.CDIs are generally equivalent to alternative alcohol-related comparison interventions.
Keywordsalcohol use; prevention; computer-delivered intervention; college students; meta-analysis
INTRODUCTIONMost college students (80%) drink alcohol, even though the majority cannot legallypurchase alcohol; many also report binge drinking, alcohol-related problems, and drinking toget drunk [1]. These drinking patterns have been identified as a public health problem by theSurgeon General [2], Institute of Medicine [3], and the National Center on Addiction andSubstance Abuse [4], and reducing binge drinking in college students is a goal in HealthyPeople 2010 [5]. Controlled studies of college alcohol interventions are increasing [6] and,within this literature, computer delivery of prevention interventions is appealing due to itsease of administration and lower cost [7].
The use of computers to deliver alcohol “counseling” offers many appealing features,especially to students. Computer-delivered interventions (CDIs) allow students to accessinformation at a self-determined pace while maintaining privacy. Technology permits
Lori A. J. Scott-Sheldon, PhD, Center for Health and Behavior, Syracuse University, 430 Huntington Hall, Syracuse, NY [email protected] of Interest: This work was supported by National Institute on Alcohol Abuse and Alcoholism Grants K02-AA15574 and R01-AA12518 to Kate B. Carey. The authors have no conflict of interest related to this research.
NIH Public AccessAuthor ManuscriptAddiction. Author manuscript; available in PMC 2010 November 1.
Published in final edited form as:Addiction. 2009 November ; 104(11): 1807–1819. doi:10.1111/j.1360-0443.2009.02691.x.
NIH
-PA Author Manuscript
NIH
-PA Author Manuscript
NIH
-PA Author Manuscript

personalization of content and the potential for using multimedia, games and virtualsimulations to engage emerging adults. Compared to interventions that require counselors,CDIs reach more students [8]; this potential for dissemination affords greater reach to asignificant subset of the population.
A 2005 review of CDIs for students described five programs but evaluation data werelimited to two randomized controlled trials (RCTs) [9]. By 2008, Elliott, Carey, and Bolles[10] reviewed 17 controlled trials of CDIs for college drinkers, and concluded that CDIswere more efficacious than assessment-only controls, but often equivalent to alternateinterventions. The rapid growth of research on CDIs for students now permits a quantitativereview of this literature.
The primary purpose of this meta-analytic review is to generate effect sizes that reflect (a)the efficacy of CDIs relative to comparison conditions and (b) within-groups change. Asecondary purpose is to explore the (c) efficacy of CDIs relative to active controls, and (d)maintenance of effects over time. We also explore (e) moderators of efficacy of CDIs (e.g.,intervention length).
METHODSSearch Strategy and Study Selection
Studies were retrieved from (a) electronic databases (PubMed, PsycINFO, CINAHL,Dissertation Abstracts, ERIC, Cochrane Library, CRISP) using a Boolean search strategythat includes the use of operators (i.e., and, or, not) and truncation (using an asterisk) to linkand expand specific keywords (search terms: alcohol/drink*/binge and college/university/undergraduate* and intervention/prevention and computer/internet/intranet/DVD/email/text*), (b) reference sections of manuscripts, (c) online contents of journals (e.g. Addiction),and (d) responses to listserv requests. Unpublished papers were included to avoid the file-drawer effect (i.e., stronger effects reported in published studies; [11]). Studies wereincluded if they (a) examined an alcohol-related intervention delivered via computer orelectronic device (e.g., text messages), (b) sampled undergraduates, (c) assessed behavioraloutcomes; and (d) provided sufficient information to calculate effect sizes. When authorsreported outcomes in multiple manuscripts, the studies were linked and represented as onestudy. If a study reported on more than one comparison condition (e.g., standard educationand assessment only), the condition with the least contact was used. In some cases,comparisons were made with an active non-CDI when a less-intensive control condition wasunavailable. Authors of 17 studies reporting insufficient details were contacted foradditional information (83% response rate resulting in the retention of 14 studies). Usingthese methods, we included 35 manuscripts with 43 separate interventions (Fig. 1).
Study OutcomesWe examined alcohol consumption and problems. Alcohol consumption included: (1)quantity consumed over time (e.g., week, month), (2) quantity per drinking occasion (e.g.,Friday night), (3) maximum quantity consumed on one occasion, (4) frequency of heavydrinking (usually defined as ≥5 drinks for men and ≥4 drinks for women [12], and (5)frequency of drinking days. Alcohol-related problems were operationalized using multi-itemscales.
Content Coding and ReliabilityStudy information (e.g., publication year), sample characteristics (e.g., gender, age), targetgroup (e.g., Greek members, freshmen), design and measurement specifics (e.g., recruitmentmethod), and content of intervention and control condition(s) (e.g., number of sessions,
Carey et al. Page 2
Addiction. Author manuscript; available in PMC 2010 November 1.
NIH
-PA Author Manuscript
NIH
-PA Author Manuscript
NIH
-PA Author Manuscript

content) were coded independently by two of the authors. (Appendix 2 contains a completelist of coding categories.) Methodological quality was assessed using 12 items adapted fromvalidated measures [13, 14]; scores ranged from 0 to 17. Fifteen studies were randomlyselected to evaluate interrater reliability. For the categorical dimensions, raters agreed on56% to 100% of the judgments (mean Cohen’s kappa = .72). Reliability for the continuousvariables was calculated using the intraclass correlation coefficient (ICC); ICC ranged from .82 to 1.00, with an average of .98 across categories. Disagreements were resolved throughdiscussion.
Effect Size DerivationEffect sizes (d) were calculated as the mean difference between the CDIs and control groupdivided by the pooled standard deviation (SD) [15] or from other statistical information(e.g., independent t-tests) when the means and SDs were unavailable [16]. If authorsreported dichotomous outcomes, we calculated an odds ratio and transformed it to d usingthe Cox transformation [17]. In addition, effect sizes were calculated for time-related changewithin each group as the mean difference between the post- and pre-test divided by the SDof the paired comparisons [18]. If statistical information could not be obtained from theauthors and the study reported no significant group differences, we estimated that effect sizeto be zero for between-group effect sizes [16]. In calculating d, we controlled for baselinedifferences when pre-intervention measures were available, and effect sizes were correctedfor sample size bias [19]. We calculated multiple effect sizes from individual studies whenthey had more than one outcome, multiple CDIs, or when outcomes were separated bysample characteristics (e.g., gender). Effect sizes calculated for each intervention and bysample characteristic were analyzed as a separate study [16]. When a study containedmultiple measures of the same outcome (e.g., weekly and monthly alcohol consumption),the effect sizes were averaged. A positive sign indicated that the CDIs improved comparedto controls or participants improved at post-test relative to pre-test. Two authorsindependently calculated effect sizes using DSTAT 2.0 [20]; discrepancies were examinedfor errors and corrected.
Statistical AnalysisWeighted mean effect sizes, d+, were calculated using fixed- and random-effects procedures[16], such that individual studies’ effect sizes were weighted by the inverse of their fixed- orrandom-effects variance. One study had an extremely large sample size relative to others[21], and these data exerted undue influence on the d+ calculations for three dependentvariables (i.e., quantity of alcohol consumed, frequency of heavy drinking, alcohol-relatedproblems at short-term). We retained the study in the analyses by recoding theunrepresentative sample size weights to be equivalent to the next smallest weight withineach dependent variable (i.e., windsorizing [16]).
The homogeneity statistic, Q, was computed to determine whether each set of d+s shared acommon effect size; a significant Q indicates that additional variability, beyond subject-level sampling error, can be explained [16]. In addition, the I2 index was calculated to assessthe proportion of variability in a set of effect sizes attributable to true heterogeneity [22,23].Percentages of 25%, 50%, and 75%, are considered low, medium, and high heterogeneity,respectively [24]. If the 95% confidence interval around the I2 index includes zero, the set ofeffect sizes are considered homogeneous. To explain variability in the effect sizes, therelation between study characteristics and the magnitude of the effects was examined using amodified least squares regression analyses with weights equivalent to the inverse of thevariance for each effect size. To examine pre to post differences between groups, wecalculated the between-groups-of-studies measure, QB, which is the weighed sum of squares
Carey et al. Page 3
Addiction. Author manuscript; available in PMC 2010 November 1.
NIH
-PA Author Manuscript
NIH
-PA Author Manuscript
NIH
-PA Author Manuscript

of group mean effect sizes about the grand mean effect size [25]. Analyzes were conductedin Stata 10.0 [26] using macros provided by Lipsey and Wilson [16].
RESULTSDescriptive Outcomes
Study and participant characteristics, research design, and intervention and comparisoncondition details are reported in Appendix 1; complete descriptive statistics are reported inAppendix 2. Of the 28,621 participants, 75% were White, 68% first year students, and meanage was 19.71 (SD = 1.09). Half (54%) volunteered; 33% were recruited with targetedefforts and 14% were mandated to participate. Most studies (94%) targeted the interventionto an at-risk group; studies targeted heavy drinkers (28%), freshman (23%), high-riskdrinkers (18%), violators of alcohol policy (13%), and current drinkers (13%).
The typical intervention (k) was a single-session computerized task delivered via the internet(38%), intranet (30%), or CD-ROM/DVD (25%) lasting a median of 20 minutes. Most CDIswere delivered onsite (72%), whereas 24% of students completed the CDI offsite. Most wereinvestigator-developed; only 41% used commercial programs. Interventions usuallyincluded consumption feedback (86%) and normative comparisons (77%), alcohol education(77%) and tailored materials (61%). The comparison condition consisted of wait-list/notreatment control for 43% of the comparisons; 51% presented alcohol-related content (e.g.,alcohol education).
The median number of post-intervention assessments was 1 (range = 1 to 3); the firstassessment occurred between 0 to 26 weeks, the second between 1 and 52 weeks, and thethird between 2 and 52 weeks. To avoid violating the assumption of independence, effectsizes were clustered into (a) short-term (≤ 5 weeks; k = 43), and (b) long-term (≥6 weeks; k= 14).
Intervention Impact Compared with ControlsAt short-term follow-up (≤ 5 weeks), students who received a CDI reduced quantity ofalcohol consumed on specific intervals/drinking days and the maximum quantity consumed(see Table 1). CDI participants did not differ from controls on quantity of alcoholconsumption, frequency of heavy drinking or drinking days, or alcohol-related problems(effects were parallel using fixed- and random-effects assumptions). The hypothesis ofhomogeneity was rejected only for alcohol-related problems; examination of the I2 indexconfirmed a moderate level of heterogeneity. Moderator tests were conducted to examinewhether study features related to the variability (reported below).
At long-term follow-up (≥ 6 weeks) students receiving a CDI reduced their quantity ofalcohol consumed, frequency of drinking days, and alcohol-related problems relative tocontrols. CDIs and controls were equivalent on measures of quantity at specific intervals/drinking days, maximum quantity, and frequency of heavy drinking (effects were parallelusing either fixed- or random-effects assumptions). The hypothesis of homogeneity wasrejected only for frequency of heavy drinking (I2 index = 62%, 95% CI 21%–82%);moderator tests were conducted on frequency of heavy drinking at long-term follow-up(reported below).
Supplemental analyses—Controls were categorized as having relevant content (i.e.,alcohol-related content including education only) vs. non-relevant content (i.e., wait-list/assessment only or content unrelated to alcohol use). Alcohol-relevant content includedalternative delivery (e.g., print or lecture) of the same content (21%), a face-to-face tailored
Carey et al. Page 4
Addiction. Author manuscript; available in PMC 2010 November 1.
NIH
-PA Author Manuscript
NIH
-PA Author Manuscript
NIH
-PA Author Manuscript

comparison (29%; e.g., brief motivational interview or cognitive behavioral therapy), a non-tailored version delivered via computer (36%), or education-only (14%). Most of the non-relevant controls consisted of wait-list/assessment only conditions (94% at short-term, 100%at long-term).
Compared to participants exposed to a non-relevant control condition, CDI participantsreduced their consumption (quantity and quantity at specific intervals/drinking days),frequency of heavy drinking, and frequency of drinking days in the short-term (see Table 2);at long-term they reduced quantity of consumed, and frequency of drinking days. Incontrast, compared with control conditions containing alcohol-relevant content, participationin a CDI did not result in less consumption at short-term or long-term. The only comparisonfavoring participants in the CDIs vs. alcohol-relevant controls was problems at long-term.To explore this finding, we removed alcohol education from “relevant control” and recodedthese conditions as “non-relevant control” (3 education-only comparisons), consistent withreviews that demonstrate education alone to be ineffective for changing drinking [27,28].After this recoding, the average effect size for CDIs vs. relevant controls at long-term forproblems, k = 3, becomes non-significant (d+ = −0.01, 95% confidence interval [CI] =−0.22–0.25), and the corresponding effect size for the CDIs vs. non-relevant controls, k = 8,becomes significant (d+ = 0.20, 95% CI = 0.09–0.30). This pattern corresponds to the otheroutcomes at long-term follow-up. (Details of this analysis are available from the authors.)
Moderators of Alcohol Consumption at Short- and Long-term AssessmentPotential moderators of intervention impact were examined using weighted regressionanalyses. Characteristics of the studies (e.g., published vs. unpublished), samples (e.g.,gender), and intervention (e.g., length) as well as study quality were entered as predictors ofalcohol consumption variables (see Appendix 2 for study, sample, and interventioncharacteristics used in the analyses). We examined the intervention impact of alcohol-relatedproblems at short-term and frequency of heavy drinking at long-term compared with anytype of control condition (i.e., both non-relevant and relevant comparisons are included).
Alcohol-related problems at short-term assessment—CDIs were more successfulwhen the study was published earlier (β = −0.61, p =.01; QResidual (1) = 5.95, P = .01), didnot use a commercially available program (β = −0.47, p =.04; QResidual (1) = 4.15, P = .04),included human interaction vs. using the computer alone (β = −0.53, p =.02; QResidual (1) =5.15, P = .02), and provided general alcohol-related materials (e.g., brochures) toparticipants (β = 0.53, p =.02; QResidual (1) = 5.15, P = .02).
Frequency of heavy drinking at long-term assessment—CDIs were moresuccessful at reducing heavy drinking frequency at long-term when they were publishedearlier (β = −0.77, P <.001; QResidual (1) = 12.29, P < .001), included fewer students (β =−0.93, P <.001; QResidual (1) = 18.15, P < .001), and did not provide feedback on alcohol-related problems (β = −0.63, P <.01; QResidual (1) = 8.21, P < .01).
Within-Group Changes Over TimeAs shown in Table 3, exposure to a CDI reduced all measured outcomes relative to baselinescores at short-term follow-up (≤ 5 weeks); within-group effect sizes ranged from 0.14 to0.32. Again, the comparison groups were stratified by relevancy. Participants receiving anon-relevant control tended not to change over time, reducing only their quantity of drinkingon specific intervals/drinking days (d+ = 0.22) while increasing their frequency of heavydrinking (d+ = −0.17). In contrast, participants exposed to a relevant control conditionshowed significant improvement on all outcomes (d+s = 0.19 to 0.34) at short-term.
Carey et al. Page 5
Addiction. Author manuscript; available in PMC 2010 November 1.
NIH
-PA Author Manuscript
NIH
-PA Author Manuscript
NIH
-PA Author Manuscript

To examine variation in improvement across the CDIs and control groups, we calculatedQB. Compared to non-relevant controls, CDI participants reduced quantity consumed (mean= 0.17, SE = 0.04 vs. mean = 0.02, SE = 0.08), frequency of heavy drinking (mean = 0.14,SE = 0.04 vs. mean = −0.17, SE = 0.06), and alcohol-related problems (mean = 0.14, SE =0.05 vs. mean = −0.24, SE = 0.07), QB = 4.22, 24.00, and 24.94 respectively, Ps ≤ 04.Compared to relevant controls, CDIs were less successful in reducing frequency of heavydrinking (mean = 0.14, SE = 0.04 vs. mean = 0.28, SE = 0.06) and alcohol-related problems(mean = 0.14, SE = 0.05 vs. mean = 0.34, SE = 0.08), QB = 4.94 and 4.42 respectively, Ps <.04.
At long-term follow-up (≥ 6 weeks), receiving a CDI reduced quantity of alcohol consumed,maximum quantity, and frequency of heavy drinking relative to baseline; within-groupeffect sizes ranged from 0.22 to 0.32. CDI participants did not reduce quantity consumed onspecific intervals/drinking days, frequency of drinking, or alcohol-related problems at long-term follow-up. No significant long-term effects were found among participants exposed toa non-relevant control; however, participants in relevant comparison groups reportedreductions on all measures of alcohol consumption (d+s = 0.27 to 0.69) except for alcohol-related problems (d+ = 0.09) at long-term.
The between-groups test (QB) again revealed differential improvement at long-term follow-up. Compared with non-relevant controls, CDIs produced greater reductions in quantity(mean = 0.32, SE = 0.05 vs. mean = 0.05, SE = 0.07) and maximum quantity (mean = 0.22,SE = 0.05 vs. mean = 0.01, SE = 0.06), QB = 12.01 and 7.62 respectively, Ps <.01.Compared with relevant controls, CDIs produced less change in quantity at specificintervals/drinking days (mean = 0.08, SE = 0.05 vs. mean = 0.27, SE = 0.07), maximumquantity (mean = 0.22, SE = 0.05 vs. mean = 0.69, SE = 0.11), and frequency of drinkingdays (mean = 0.09, SE = 0.06 vs. mean = 0.29, SE = 0.08), QB = 5.06, 21.77, and 4.42respectively, Ps ≤ .04.
DISCUSSIONThis meta-analysis summarizes the efficacy of CDIs for college students, across alcohol useoutcomes and assessment intervals. We presented both between- and within-group effectsizes to elucidate change resulting from CDIs. Overall, results provide qualified support forthe efficacy of CDIs to reduce alcohol use and problems in college students.
CDIs are associated with improvement over time, and produce greater risk reduction than nointervention. Relative to assessment-only controls, CDIs reduced both quantity andfrequency measures of consumption; the observed effects are small (0.09 to 0.28) over short-and long-term intervals [15]. In comparison, CDIs evaluated in other populations yield anaverage effect size of 0.24 at first measurement occasion [29]. Thus, CDIs targeted tostudents provide effects (relative to no treatment) similar to those found in the generalpopulation.
Improvements over time varied across outcomes. Between-groups effects on specificconsumption outcomes (quantity per drinking day and/or specific drinking occasions andmaximum quantity) were observed at short-term (≤ 5 weeks), but did not persist at the long-term assessment. In contrast, reduction in quantity consumed over a period of time (e.g.,weeks, months) was observed only at long-term assessment. Consistent with theTranstheoretical Model [30], delayed reductions in alcohol consumption are likely due to aperson’s readiness (and ability) to make necessary changes. Thus, reduction in averagequantity consumed may occur incrementally whereas consumption patterns occurring lessfrequently (e.g., holidays) may be more amenable to immediate change. With respect to
Carey et al. Page 6
Addiction. Author manuscript; available in PMC 2010 November 1.
NIH
-PA Author Manuscript
NIH
-PA Author Manuscript
NIH
-PA Author Manuscript

alcohol-related problems, CDIs were efficacious at improving long- but not short-termproblems, consistent with prior research examining controlled alcohol interventions [6]. Thelower base rate of problems (relative to drinking occasions) may require more time forreductions in problems to be observed.
Evidence for the efficacy of CDIs depends upon the comparison condition. Relative to CDIvs. no-treatment controls, CDI vs. active comparisons yielded smaller effects [cf, 31]. In thisstudy, relevant comparison conditions varied with regard to content and intensity; in somecases, the comparison conditions were empirically-validated, counselor-deliveredinterventions. The small number of comparisons with specific forms of alternativeinterventions prevents conclusions about the efficacy of CDIs to relative to specific activeinterventions but supports the conclusion that CDIs did not differ from these alcohol-focused interventions.
Within-group effect sizes afford stronger conclusions: Whereas true controls tended not tochange over time, CDI recipients reduced risk over time. Improvement is more consistent atshort-term assessments. Research is needed to explain the inconsistent findings at long-term.Not surprisingly, participation in other active alcohol interventions was associated withimprovement. In a review of web-based interventions (not restricted to college students),Bewick and colleagues [33] reported a similar pattern: equivalent change over time for bothweb and alternative intervention conditions. Comprehensive reviews of alcoholinterventions reveal that drinking is responsive to motivational [32] and other briefinterventions [28]; if they produce equivalent outcomes, CDIs offer a cost-effectivealternative to counselor-delivered interventions.
Despite the variability in the CDIs we sampled, few outcomes met formal tests ofheterogeneity with enough studies to support moderator analyses. Furthermore, weevaluated many features of the samples, designs, and interventions, but few explainedvariability in effect sizes. Relative to alternatives, CDIs produced stronger effects in earlierpublications, in studies with fewer participants, and when a commercial program was notused. These trends suggest as evaluation trials become larger and greater dissemination isachieved, the likelihood of detecting differences between CDIs and alternatives is reduced(consistent with the transition from efficacy to effectiveness [34]).
Limitations of the ReviewToo few studies were available to allow strong inferences regarding (a) trends over time, (b)efficacy of specific CDIs, and (c) moderators of alcohol consumption or problems. First,most studies in the meta-analysis included only one post-intervention assessment, and fewerevaluated outcomes beyond 6 weeks. Thus, fewer comparisons were available for longerfollow-ups, limiting opportunities to assess the stability of change. Moreover, variability inthe length of follow-ups (i.e., 6 to 52 weeks) may have influenced our findings, makinginferences more challenging. That is, it is unclear whether these improvements persist orrepresent more intermediate change. A prior meta-analytic review of alcohol interventionsfound reductions in consumption until 6 months whereas improvements in alcohol-relatedproblems persisted longer [6]. Second, CDI refers to delivery mode but other features (e.g.,content, structure, interactivity) may be important and varied across studies. The limitedcomparisons available on any dimension preclude further evaluation of the uniquerelationship of individual components to efficacy. Finally, the small number of studies didnot support multivariate predictor models that would allow evaluation of interactions amongmoderators.
Carey et al. Page 7
Addiction. Author manuscript; available in PMC 2010 November 1.
NIH
-PA Author Manuscript
NIH
-PA Author Manuscript
NIH
-PA Author Manuscript
Future ResearchFuture research might address issues of study design, optimizing efficacy, and understandingmechanisms of delivery. First, it will be informative to evaluate maintenance of gainsassociated with CDIs more systematically; studies should include more and longer follow-ups. Drinking varies over the academic year as a function of academic demands and breaks[36], so more assessment occasions will provide greater power to detect change. Second,systematic comparisons of CDIs to alternatives that vary in intensity (e.g., brief vs. intensiveface-to-face) and cost would be informative. Such data can provide a clearer picture of theadded value of CDIs over alternative interventions. Such comparisons will allowincremental cost-effectiveness analyses (see [37,38]) to supplement traditional outcomeanalyses. Third, research evaluating CDIs should identify the components that account forobserved outcomes. Several studies provide evidence that reductions in perceived drinkingnorms mediate the effects of feedback-based CDIs (e.g., [39–41]). As recently suggested,computer tailoring technologies range from personalized health assessments with feedbackto CDIs in which content is individualized based on complex algorithms [42]. Research onCDIs for college student drinkers might benefit from interventions developed for otherhealth behaviors.
Fourth, studies might be designed to match individuals with intervention modalities. Forexample, a recent study revealed that females respond more favorably to the counselor-administered intervention whereas males respond equivalently to computer- and counselor-administered interventions [43]. In addition, preference for CDIs and cognitive learningstyles might be studied to optimize web-based learning tools [44]. Alternately, low levels ofmotivation might favor face-to-face interventions, as certain counseling styles can reduceresistance and enhance outcomes [45,46].
Finally, as the number of evaluation studies increase, meta-analyses will be able to evaluatethe delivery mechanisms that moderate the impact of CDIs on alcohol consumption andproblems such as on-site vs. off-site, CD-ROM vs. Internet, and single vs. multiplecomputer-delivered modes. For example, on-site delivery may result in greater interventioncompliance than remote delivery.
CONCLUSIONSCDIs produce significant change over time on measures of quantity and frequency ofdrinking in college samples. Clear patterns of improvement emerged at short-term (≤ 5weeks); estimates of long-term improvement are qualified by fewer studies on which to baseeffect sizes. CDIs are clearly preferable to no intervention, and they are generally equivalentto alternative alcohol-related interventions. Once developed, CDIs are available for modest(or no) cost, providing researchers access to standardized alcohol-related interventions.Despite the availability of CDIs, few standardized programs have undergone rigorousevaluation. Policy decisions will benefit from systematic comparisons of CDIs(commercially available and newly developed) against alternate interventions of varyingintensity, determination of active ingredients of CDIs, and attention to person-by-intervention interactions.
AcknowledgmentsWe thank the following study authors for providing manuscripts and/or additional intervention or statisticalinformation: Nancy P. Barnett, PhD, Christopher J. Correia, PhD, Diana M. Doumas, PhD, William M. Hunt, PhD,Kypros Kypri, PhD, James E. Lange, PhD, Thad R. Leffingwell, PhD, Melissa A. Lewis, PhD, Michelle J. Moore,PhD, Clayton Neighbors, PhD, and Richard Saitz, MD.
Carey et al. Page 8
Addiction. Author manuscript; available in PMC 2010 November 1.
NIH
-PA Author Manuscript
NIH
-PA Author Manuscript
NIH
-PA Author Manuscript

References1. Wechsler H, Lee JE, Nelson TF, Kuo M. Underage college students' drinking behavior, access to
alcohol, and the influence of deterrence policies. Findings from the Harvard School of Public HealthCollege Alcohol Study. J Am Coll Health. 2002; 50:223–36. [PubMed: 11990980]
2. U.S. Department of Health and Human Services. The Surgeon General's Call to Action To Preventand Reduce Underage Drinking. U.S. Department of Health and Human Services, Office of theSurgeon General; 2007.
3. National Research Council & Institute of Medicine. Reducing underage drinking: A collectiveresponsibility. Washington, DC: The National Academies Press; 2004.
4. National Center on Addiction and Substance Abuse. Wasting the Best and the Brightest: SubstanceAbuse at America's Colleges and Universities. New York: Columbia University; 2007.
5. U.S. Department of Health and Human Services. Health People 2010. Washington, DC:Government Printing Office; 2000.
6. Carey KB, Scott-Sheldon LA, Carey MP, DeMartini KS. Individual-level interventions to reducecollege student drinking: a meta-analytic review. Addict Behav. 2007; 32:2469–94. [PubMed:17590277]
7. Larimer ME, Cronce JM, Lee CM, Kilmer JR. Brief intervention in college settings. Alcohol ResHealth. 2004; 28:94–104. [PubMed: 19006997]
8. Glasgow RE, Vogt TM, Boles SM. Evaluating the public health impact of health promotioninterventions: the RE-AIM framework. Am J Public Health. 1999; 89:1322–7. [PubMed: 10474547]
9. Walters ST, Miller E, Chiauzzi E. Wired for wellness: e-interventions for addressing collegedrinking. J Subst Abuse Treat. 2005; 29:139–45. [PubMed: 16135342]
10. Elliott JC, Carey KB, Bolles JR. Computer-based interventions for college drinking: a qualitativereview. Addict Behav. 2008; 33:994–1005. [PubMed: 18538484]
11. Rosenthal R. The file drawer problem and tolerance for null results. Psychological Bulletin. 1979;86:638–641.
12. Wechsler H, Davenport A, Dowdall G, Moeykens B, Rimm EB. A gender-specific measure ofbinge drinking among college students. American Journal of Public Health. 1995; 85:982–985.[PubMed: 7604925]
13. Jadad AR, Moore RA, Carroll D, et al. Assessing the quality of reports of randomized clinicaltrials: is blinding necessary? Control Clin Trials. 1996; 17:1–12. [PubMed: 8721797]
14. Miller, WR.; Brown, JM.; Simpson, TL., et al. Handbook of alcoholism treatment approaches:Effective alternatives. 2. Needham Heights, MA US: Allyn & Bacon; 1995. What works? Amethodological analysis of the alcohol treatment outcome literature ; p. 12-44.
15. Cohen, J. Statistical Power Analysis for the Behavioral Sciences. New York: Erlbaum; 1988.16. Lipsey, MW.; Wilson, DB. Practical meta-analysis. Thousand Oaks, CA: Sage; 2001.17. Sanchez-Meca J, Marin-Martinez F, Chacon-Moscoso S. Effect-size indices for dichotomized
outcomes in meta-analysis. Psychol Methods. 2003; 8:448–67. [PubMed: 14664682]18. Johnson, BT.; Eagly, AH.; Reis, HT.; Judd, CM. Handbook of research methods in social and
personality psychology. New York, NY US: Cambridge University Press; 2000. Quantitativesynthesis of social psychological research ; p. 496-528.
19. Hedges LV. Distribution theory for Glass's estimator of effect size and related estimators. J EducStat. 1981; 6:107–128.
20. Johnson, BT.; Wood, T. DSTAT 2.0: Software for Meta-Analysis. 2006.21. Wall A. Evaluating a health education web site: The case of AlcoholEdu. NASPA Journal. 2007;
44:692–714.22. Higgins JP, Thompson SG. Quantifying heterogeneity in a meta-analysis. Stat Med. 2002;
21:1539–58. [PubMed: 12111919]23. Huedo-Medina TB, Sanchez-Meca J, Marin-Martinez F, Botella J. Assessing heterogeneity in
meta-analysis: Q statistic or I2 index? Psychol Methods. 2006; 11:193–206. [PubMed: 16784338]24. Higgins JP, Thompson SG, Deeks JJ, Altman DG. Measuring inconsistency in meta-analyses. Bmj.
2003; 327:557–60. [PubMed: 12958120]
Carey et al. Page 9
Addiction. Author manuscript; available in PMC 2010 November 1.
NIH
-PA Author Manuscript
NIH
-PA Author Manuscript
NIH
-PA Author Manuscript

25. Hedges, LV.; Olkin, L. Statistical methods for meta-analysis. Orlando, FL: Academic Press; 1985.26. StataCorp. Stata. College Station, TX: StataCorp; 2007.27. Larimer ME, Cronce JM. Identification, prevention, and treatment revisited: individual-focused
college drinking prevention strategies 1999–2006. Addict Behav. 2007; 32:2439–68. [PubMed:17604915]
28. Miller WR, Wilbourne PL. Mesa Grande: a methodological analysis of clinical trials of treatmentsfor alcohol use disorders. Addiction. 2002; 97:265–77. [PubMed: 11964100]
29. Portnoy DB, Scott-Sheldon LA, Johnson BT, Carey MP. Computer-delivered interventions forhealth promotion and behavioral risk reduction: a meta-analysis of 75 randomized controlled trials,1988–2007. Prev Med. 2008; 47:3–16. [PubMed: 18403003]
30. Prochaska JO, Velicer WF. The transtheoretical model of health behavior change. Am J HealthPromot. 1997; 12:38–48. [PubMed: 10170434]
31. Grissom RJ. The magical number .7 +/−. 2: meta-meta-analysis of the probability of superioroutcome in comparisons involving therapy, placebo, and control. J Consult Clin Psychol. 1996;64:973–82. [PubMed: 8916626]
32. Hettema J, Steele J, Miller WR. Motivational interviewing. Annu Rev Clin Psychol. 2005; 1:91–111. [PubMed: 17716083]
33. Bewick BM, Trusler K, Barkham M, et al. The effectiveness of web-based interventions designedto decrease alcohol consumption--a systematic review. Prev Med. 2008; 47:17–26. [PubMed:18302970]
34. Hallfors D, Cho H, Sanchez V, et al. Efficacy vs effectiveness trial results of an indicated “model”substance abuse program: implications for public health. Am J Public Health. 2006; 96:2254–9.[PubMed: 16809591]
35. Petty, RE.; Cacioppo, JT. The elaboration likelihood model of persusion. In: Berkowitz, L., editor.Advances in experimental social psychology. New York: Academic Press; 1986. p. 123-205.
36. Del Boca FK, Darkes J, Greenbaum PE, Goldman MS. Up close and personal: temporal variabilityin the drinking of individual college students during their first year. J Consult Clin Psychol. 2004;72:155–64. [PubMed: 15065951]
37. Olmstead TA, Sindelar JL, Easton CJ, Carroll KM. The cost-effectiveness of four treatments formarijuana dependence. Addiction. 2007; 102:1443–53. [PubMed: 17645430]
38. Pinkerton SD, Holtgrave DR, Johnson-Masotti AP, et al. Cost-Effectiveness of the NIMH MultisiteHIV Prevention Intervention. AIDS and Behavior. 2002; 6:83–96.
39. Lewis MA, Neighbors C, Oster-Aaland L, Kirkeby BS, Larimer ME. Indicated prevention forincoming freshmen: Personalized normative feedback and high-risk drinking. AddictiveBehaviors. 2007; 32:2495–2508. [PubMed: 17658695]
40. Neighbors C, Larimer ME, Lewis MA. Targeting Misperceptions of Descriptive Drinking Norms:Efficacy of a Computer-Delivered Personalized Normative Feedback Intervention. Journal ofConsulting and Clinical Psychology. 2004; 72:434–447. [PubMed: 15279527]
41. Walters ST, Vader AM, Harris TR. A controlled trial of web-based feedback for heavy drinkingcollege students. Prev Sci. 2007; 8:83–8. [PubMed: 17136461]
42. Lustria ML, Cortese J, Noar SM, Glueckauf RL. Computer-tailored health interventions deliveredover the web: Review and analysis of key components. Patient Educ Couns. 2009; 74:156–73.[PubMed: 18947966]
43. Carey KB, Henson JM, Carey MP, Maisto SA. Computer versus in-person intervention forstudents violating campus alcohol policy. :45. in press.
44. Cook DA. Learning and cognitive styles in web-based learning: theory, evidence, and application.Acad Med. 2005; 80:266–78. [PubMed: 15734809]
45. Miller M. Distance guidance: Career advice by post. British Journal of Guidance & Counselling.1993; 21:221–229.
46. Moyers TB, Martin T. Therapist influence on client language during motivational interviewingsessions. J Subst Abuse Treat. 2006; 30:245–51. [PubMed: 16616169]
Carey et al. Page 10
Addiction. Author manuscript; available in PMC 2010 November 1.
NIH
-PA Author Manuscript
NIH
-PA Author Manuscript
NIH
-PA Author Manuscript

47. Allison, DL. Comparable effects of the use of a computer-assisted, facilitative teaching approach toa traditional, lecture teaching approach on college students' learning about and subsequent use ofalcohol. Texas A&M University; 2002.
48. Barnett NP, Murphy JG, Colby SM, Monti PM. Efficacy of counselor vs. computer-deliveredintervention with mandated college students. Addictive Behaviors. 2007; 32:2529–2548.[PubMed: 17707594]
49. Bersamin M, Paschall MJ, Fearnow-Kenney M, Wyrick D. Effectiveness of a web-based alcohol-misuse and harm-prevention course among high- and low-risk students. Journal of AmericanCollege Health. 2007; 55:247–254. [PubMed: 17319331]
50. Butler, LH.; Correia, CJ. Brief alcohol intervention with college student drinkers: Face-to-faceversus computerized feedback. Auburn, Alabama: Auburn University; 2008.
51. Chiauzzi E, Green TC, Lord S, Thum C, Goldstein M. My student body: a high-risk drinkingprevention web site for college students. J Am Coll Health. 2005; 53:263–74. [PubMed:15900990]
52. Dimeff LA, McNeely M. Computer-enhanced primary care practitioner advice for high-riskcollege drinkers in a student primary health-care setting. Cognitive and Behavioral Practice. 2000;7:82–100.
53. Donohue B, Allen DN, Maurer A, Ozols J, DeStefano G. A Controlled Evaluation of TwoPrevention Programs in Reducing Alcohol Use Among College Students at Low and High Risk forAlcohol Related Problems. Journal of Alcohol and Drug Education. 2004; 48:13–33.
54. Doumas, DM.; McKinley, LL.; Book, P. Evaluation of a two web-based alcohol interventions formandated college students. Boise, ID: Boise State University; 2008. p. 34
55. Doumas, DM.; Anderson, LL. Reducing alcohol use in college freshman: Evaluation of a web-based personalized feedback program. Boise, ID: Boise State University; 2008. p. 38
56. Doumas DM, Haustveit T. Reducing heavy drinking in intercollegiate athletes: Evaluation of aweb-based personalized feedback program. The Sports Psychologist. 2008
57. Fishburne, JW. Increasing the self-referencing in social norm interventions. University ofArkansas; 2006.
58. Hunt, WM. Dissertation Abstracts International: Section B: The Sciences and Engineering. US:ProQuest Information & Learning; 2005. Effects of participant engagement on alcoholexpectancies and drinking outcomes for a computerized expectancy challenge intervention ; p.6655-6655.
59. Kypri K, Langley JD, Saunders JB, Cashell-Smith ML, Herbison P. Randomized controlled trial ofweb-based alcohol screening and brief intervention in primary care. Arch Intern Med. 2008;168:530–6. [PubMed: 18332300]
60. Kypri K, Saunders JB, Williams SM, et al. Web-based screening and brief intervention forhazardous drinking: a double-blind randomized controlled trial. Addiction. 2004; 99:1410–7.[PubMed: 15500594]
61. Kypri K, McAnally HM. Randomized controlled trial of a web-based primary care intervention formultiple health risk behaviors. Preventive Medicine. 2005; 41:761–766. [PubMed: 16120456]
62. Lau-Barraco C, Dunn ME. Evaluation of a single-session expectancy challenge intervention toreduce alcohol use among college students. Psychol Addict Behav. 2008; 22:168–75. [PubMed:18540714]
63. Leffingwell, TR.; Leedy, MJ.; Lack, CW. Association for Behavioral and Cognitive Therapies(ABCT). Washington, DC: 2005. A multimedia computer-based intervention for college studentdrinking: Short-term outcomes of a randomized trial.
64. Lewis MA, Neighbors C. Optimizing Personalized Normative Feedback: The Use of Gender-Specific Referents. Journal of Studies on Alcohol and Drugs. 2007; 68:228–237. [PubMed:17286341]
65. Michael, ME. Dissertation Abstracts International: Section B: The Sciences and Engineering. US:ProQuest Information & Learning; 2000. Attitudes and perceived behavioral control of first-yearcollege student's alcohol use: A study of an instructional software intervention ; p. 2495-2495.
66. Mignogna, J. Ru drkn 2nite? Cellular text messaging prompts for alcohol harm-reduction oncampus. Oklahoma: Oklahoma State University; 2007.
Carey et al. Page 11
Addiction. Author manuscript; available in PMC 2010 November 1.
NIH
-PA Author Manuscript
NIH
-PA Author Manuscript
NIH
-PA Author Manuscript
67. Miller, ET. Dissertation Abstracts International: Section B: The Sciences and Engineering. US:ProQuest Information & Learning; 2000. Preventing alcohol abuse and alcohol-related negativeconsequences among freshmen college students: Using emerging computer technology to deliverand evaluate the effectiveness of brief intervention efforts ; p. 4417-4417.
68. Moore MJ, Soderquist J, Werch C. Feasibility and Efficacy of a Binge Drinking PreventionIntervention for College Students Delivered via the Internet Versus Postal Mail. Journal ofAmerican College Health. 2005; 54:38–44. [PubMed: 16050327]
69. Neighbors C, Lewis MA, Bergstrom RL, Larimer ME. Being Controlled by Normative Influences:Self-Determination as a Moderator of a Normative Feedback Alcohol Intervention. HealthPsychology. 2006; 25:571–579. [PubMed: 17014274]
70. Neighbors, C.; Lee, CM.; Lewis, MA.; Fossos, N.; Walter, T. Internet-based personalized feedbackto reduce 21st birthday drinking: A randomized controlled trial of an event specific preventionintervention. Vol. 49. Seattle: University of Washington; 2008.
71. Saitz R, Palfai TP, Freedner N, et al. Screening and brief intervention online for college students:The iHealth Study. Alcohol and Alcoholism. 2007; 42:28–36. [PubMed: 17130139]
72. Steiner, J.; Woodall, WG.; Yeagley, JA. The E-Chug: A randomized, controlled study of a web-based binge drinking intervention with college freshman. Paper presented at the Society forPrevention Research; Washington, DC. 2005.
73. Weitzel JA, Bernhardt JM, Usdan S, Mays D, Glanz K. Using wireless handheld computers andtailored text messaging to reduce negative consequence of drinking alcohol. Journal of Studies onAlcohol and Drugs. 2007; 68:534–537. [PubMed: 17568957]
74. Wyrick DL, Fearnow-Kenney MD, Wyrick CH, Bibeau DL. College alcohol education andprevention: A case for distance education. Journal of Alcohol and Drug Education. 2005; 49:5–14.
Carey et al. Page 12
Addiction. Author manuscript; available in PMC 2010 November 1.
NIH
-PA Author Manuscript
NIH
-PA Author Manuscript
NIH
-PA Author Manuscript

NIH
-PA Author Manuscript
NIH
-PA Author Manuscript
NIH
-PA Author Manuscript
Carey et al. Page 13
Tabl
e 1
Wei
ghte
d m
ean
effe
ct si
zes a
nd h
omog
enei
ty st
atis
tics f
or th
e C
DIs
by
follo
w-u
p in
terv
al*
Wei
ghed
mea
n d
(and
95%
CI)
Hom
ogen
eity
of e
ffect
size
s
Out
com
ek
Fixe
d ef
fect
sR
ando
m e
ffect
sQ
PI2 (
95%
CI)
Shor
t-ter
m F
ollo
w-u
p (≤
5 w
eeks
)
Qua
ntity
200.
07 (−
0.02
, 0.1
6)0.
09 (−
0.03
, 0.2
1)28
.71
.070
34%
(0%
, 61%
)
Qua
ntity
, spe
cific
inte
rval
s/dr
inki
ng d
ays
250.
10 (0
.01,
0.2
0)0.
10 (0
.01,
0.2
0)9.
49.9
960%
Max
imum
qua
ntity
70.
16 (0
.01,
0.3
1)0.
16 (0
.01,
0.3
1)3.
30.7
700%
Freq
uenc
y of
hea
vy d
rinki
ng12
0.10
(0.0
0, 0
.20)
0.13
(−0.
01, 0
.27)
19.1
6.0
5843
% (0
%, 7
1%)
Freq
uenc
y of
drin
king
day
s17
0.11
(−0.
01, 0
.23)
0.10
(−0.
04, 0
.25)
20.6
1.1
9423
% (0
%, 5
7%)
Prob
lem
s10
0.10
(−0.
02, 0
.22)
0.16
(−0.
02, 0
.34)
18.5
5.0
2951
% (1
%, 7
6%)
Long
-term
Fol
low
-up
(≥6
wee
ks)
Qua
ntity
120.
15 (0
.05,
0.2
5)0.
15 (0
.05,
0.2
5)8.
43.6
740%
Qua
ntity
, spe
cific
inte
rval
s/dr
inki
ng d
ays
60.
08 (−
0.05
, 0.2
2)0.
08 (−
0.05
, 0.2
2)3.
88.5
670%
Max
imum
qua
ntity
70.
03 (−
0.10
, 0.1
6)0.
02 (−
0.12
, 0.1
6)6.
85.3
3512
% (0
%, 5
5%)
Freq
uenc
y of
hea
vy d
rinki
ng9
−0.
10 (−0.
20, 0.
01)
−0.
06 (−0.
24, 0.
11)
20.9
8.0
0762
% (2
1%, 8
2%)
Freq
uenc
y of
drin
king
day
s7
0.16
(0.0
3, 0
.29)
0.16
(−0.
00, 0
.32)
9.28
.159
35%
(0%
, 73%
)
Prob
lem
s11
0.16
(0.0
6, 0
.25)
0.16
(0.0
6, 0
.25)
6.54
.768
0%
* CD
Is, c
ompu
ter-
deliv
ered
inte
rven
tions
. k, n
umbe
r of i
nter
vent
ions
. d, w
eigh
ted
stan
dard
ized
mea
n di
ffer
ence
. CI,
conf
iden
ce in
terv
al. B
oldf
ace
text
hig
hlig
hts s
igni
fican
t val
ues.
Addiction. Author manuscript; available in PMC 2010 November 1.

NIH
-PA Author Manuscript
NIH
-PA Author Manuscript
NIH
-PA Author Manuscript
Carey et al. Page 14
Tabl
e 2
Wei
ghte
d m
ean
effe
ct si
zes f
or th
e C
DIs
by
follo
w-u
p in
terv
al a
nd c
ontro
l typ
e*
CD
Is v
s. N
on-R
elev
ant C
ontr
ols
CD
Is v
s. R
elev
ant C
ontr
ols
Out
com
ek
Fixe
d ef
fect
s d+
(95%
CI)
Ran
dom
effe
cts d
+ (9
5% C
I)k
Fixe
d ef
fect
s d+
(95%
CI)
Ran
dom
effe
cts d
+ (9
5% C
I)
Shor
t-ter
m F
ollo
w-u
p (≤
5 w
eeks
)
Qua
ntity
100.
16 (0
.01,
0.3
1)0.
19 (−
0.01
, 0.3
8)10
0.01
(−0.
11, 0
.13)
0.01
(−0.
14, 0
.16)
Qua
ntity
, spe
cific
inte
rval
s/dr
inki
ng d
ays
110.
15 (0
.01,
0.2
8)0.
15 (0
.01,
0.2
8)14
0.06
(−0.
08, 0
.20)
0.06
(−0.
08, 0
.20)
Max
imum
qua
ntity
1--
--6
0.15
(−0.
01, 0
.31)
0.15
(−0.
01, 0
.31)
Freq
uenc
y of
hea
vy d
rinki
ng6
0.21
(0.0
7, 0
.35)
†0.
29 (0
.05,
0.5
2)6
−0.
01 (−0.
15, 0.
14)
−0.
01 (−0.
15, 0.
14)
Freq
uenc
y of
drin
king
day
s4
0.19
(0.0
1, 0
.37)
0.22
(−0.
08, 0
.51)
130.
06 (−
0.10
, 0.2
1)0.
06 (−
0.10
, 0.2
1)
Prob
lem
s6
0.11
(−0.
03, 0
.26)
0.18
(−0.
04, 0
.40)
40.
07 (−
0.13
, 0.2
7)†
0.14
(−0.
24, 0
.51)
Long
-term
Fol
low
-up
(≥ 6
wee
ks)
Qua
ntity
80.
20 (0
.08,
0.3
1)0.
20 (0
.08,
0.3
1)4
0.02
(−0.
18, 0
.22)
0.02
(−0.
18, 0
.22)
Qua
ntity
, spe
cific
inte
rval
s/dr
inki
ng d
ays
1--
--5
0.03
(−0.
12, 0
.18)
0.03
(−0.
12, 0
.18)
Max
imum
qua
ntity
40.
09 (−
0.06
, 0.2
4)0.
08 (−
0.07
, 0.2
5)3
0.14
(−0.
40, 0
.12)
0.14
(−0.
40, 0
.12)
Freq
uenc
y of
hea
vy d
rinki
ng1
8−0.
11 (−0.
22, 0.
01)†
−0.
07 (−0.
27, 0.
13)
Freq
uenc
y of
drin
king
day
s3
0.28
(0.1
0, 0
.46)
0.28
(0.1
0, 0
.46)
40.
03 (−
0.16
, 0.2
2)0.
04 (−
0.18
, 0.2
6)
Prob
lem
s5
0.14
(−0.
01, 0
.28)
0.14
(−0.
01, 0
.28)
60.
17 (0
.05,
0.3
0)0.
16 (0
.03,
0.3
0)
* Non
-rel
evan
t con
trols
refe
r to
wai
t-lis
t/ass
essm
ent o
nly
(94%
at s
hort-
term
, 100
% a
t lon
g-te
rm) a
nd ir
rele
vant
con
tent
unm
atch
ed fo
r tim
e (6
% a
t sho
rt-te
rm).
Rel
evan
t con
trols
refe
r to
com
paris
ons w
ithal
coho
l-rel
ated
con
tent
mat
ched
(68%
at s
hort-
term
, 70%
at l
ong-
term
) or u
nmat
ched
(30%
at s
hort-
term
, 11%
at l
ong-
term
) for
tim
e an
d al
coho
l-rel
ated
edu
catio
n (2
% a
t sho
rt-te
rm, 2
0% a
t lon
g-te
rm).
CD
Is, c
ompu
ter-
deliv
ered
inte
rven
tions
. k, n
umbe
r of i
nter
vent
ions
. d+
, wei
ghte
d st
anda
rdiz
ed m
ean
diff
eren
ce. C
I, co
nfid
ence
inte
rval
.
† Het
erog
eneo
us d
istri
butio
n, P
s <.0
5.
Addiction. Author manuscript; available in PMC 2010 November 1.

NIH
-PA Author Manuscript
NIH
-PA Author Manuscript
NIH
-PA Author Manuscript
Carey et al. Page 15
Tabl
e 3
Effic
acy
of in
terv
entio
ns a
nd c
ontro
ls fr
om p
re- t
o po
st-te
st b
y fo
llow
-up
inte
rval
and
con
trol t
ype*
Inte
rven
tions
Non
-Rel
evan
t Con
trol
sR
elev
ant C
ontr
ols
Out
com
ek
d + (9
5% C
I)k
d + (9
5% C
I)k
d + (9
5% C
I)
Shor
t-ter
m F
ollo
w-u
p (≤
5 w
eeks
)
Qua
ntity
140.
17 (0
.09,
0.2
6)4
0.02
(−0.
14, 0
.19)
†10
0.26
(0.1
6, 0
.35)
Qua
ntity
, spe
cific
inte
rval
s/dr
inki
ng d
ays
170.
32 (0
.23,
0.4
2)3
0.22
(0.0
1, 0
.44)
*9
0.26
(0.1
4, 0
.38)
Max
imum
qua
ntity
70.
26 (0
.15,
0.3
7)1
--6
0.21
(0.1
0, 0
.33)
Freq
uenc
y of
hea
vy d
rinki
ng12
0.14
(0.0
4, 0
.16)
5−0.
17 (−0.
28, −0.
05)†
60.
28 (0
.16,
0.3
9)†
Freq
uenc
y of
drin
king
day
s16
0.17
(0.0
7, 0
.27)
20.
12 (−
0.17
, 0.4
2)*
90.
19 (0
.07,
0.3
2)
Prob
lem
s9
0.14
(0.0
4, 0
.23)
4−0.
24 (0.
07, −0.
38)†
40.
34 (0
.17,
0.5
0)†
Long
-term
Fol
low
-up
(≥ 6
wee
ks)
Qua
ntity
80.
32 (0
.21,
0.4
2)3
0.05
(−0.
09, 0
.19)
†5
0.33
(0.1
9, 0
.46)
Qua
ntity
, spe
cific
inte
rval
s/dr
inki
ng d
ays
60.
08 (−
0.02
, 0.1
8)1
--4
0.27
(0.1
2, 0
.42)
†
Max
imum
qua
ntity
60.
22 (0
.11,
0.3
3)3
0.01
(−0.
12, 0
.13)
†3
0.69
(0.4
6, 0
.91)
†
Freq
uenc
y of
hea
vy d
rinki
ng5
0.26
(0.1
3, 0
.39)
0--
40.
27 (0
.13,
0.4
2)
Freq
uenc
y of
drin
king
day
s5
0.09
(−0.
02, 0
.21)
1--
30.
29 (0
.12,
0.4
6)†
Prob
lem
s5
0.10
(−0.
01, 0
.20)
3−0.
03 (−0.
15, 0.
10)*
20.
09 (−
0.09
, 0.2
8)
* Non
-rel
evan
t con
trols
refe
r to
wai
t-lis
t/ass
essm
ent o
nly.
Rel
evan
t con
trols
refe
r to
com
paris
ons w
ith a
lcoh
ol-r
elat
ed c
onte
nt m
atch
ed (3
1% a
t sho
rt-te
rm a
nd 1
00%
at l
ong-
term
) or u
nmat
ched
(69%
at
shor
t-ter
m) f
or ti
me.
Wei
ghte
d m
ean
effe
ct si
zes,
d +, f
or w
hich
the
95%
CI d
oes n
ot in
clud
e a
zero
are
sign
ifica
nt. E
ffec
t siz
es a
re b
ased
on
fixed
-eff
ects
ass
umpt
ions
; for
mos
t out
com
es, p
aral
lel r
esul
tsw
ere
foun
d us
ing
rand
om-e
ffec
ts a
ssum
ptio
ns w
ith th
e ex
cept
ion
of q
uant
ity a
t spe
cific
inte
rval
s/dr
inki
ng d
ays f
or th
e in
terv
entio
n gr
oup,
max
imum
qua
ntity
of a
lcoh
ol c
onsu
mpt
ion,
and
freq
uenc
y of
hea
vydr
inki
ng, a
ll at
long
-term
follo
w-u
p. C
DIs
, com
pute
r-de
liver
ed in
terv
entio
ns. k
, num
ber o
f int
erve
ntio
ns. d
+, w
eigh
ted
stan
dard
ized
mea
n di
ffer
ence
. CI,
conf
iden
ce in
terv
al. B
oldf
ace
text
hig
hlig
hts
sign
ifica
nt v
alue
s.
† Com
paris
ons b
etw
een
inte
rven
tion
and
cont
rol t
ype
(bet
wee
n-gr
oups
Q) i
s sta
tistic
ally
sign
ifica
nt a
t P <
.05.
Addiction. Author manuscript; available in PMC 2010 November 1.

NIH
-PA Author Manuscript
NIH
-PA Author Manuscript
NIH
-PA Author Manuscript
Carey et al. Page 16
APP
END
IX 1
Des
crip
tive
feat
ures
of t
he 3
5 co
mpu
ter-
deliv
ered
alc
ohol
inte
rven
tion
stud
ies i
nclu
ded
in th
e m
eta-
anal
ysis
*
Inte
rven
tion
Det
ails
Stud
yN
FW
Uni
vers
ityC
ontr
olD
eliv
ery
Loc
atio
nSe
ssio
nsD
ose†
Prog
ram
Qua
lity
Rat
ing‡
Alli
son
[47]
148
43%
91%
US-
NE,
M p
ublic
RM
CD
-RO
M (G
)O
nsite
112
0A
101
3
Bar
nett
et a
l. [4
8]21
551
%76
%U
S-N
E, L
priv
ate
RM
CD
-RO
MO
nsite
2/1
70/4
5A
101
13
Ber
sam
in e
t al.
[49]
D
rinke
rs13
952
%30
%U
S-SW
, L p
ublic
WL/
NT
Inte
rnet
Off
site
2.6
93.6
Oth
er7
N
on-D
rinke
rs23
1
But
ler a
nd C
orre
ia [5
0]84
65%
92%
US-
SE, L
pub
licW
L/N
TIn
tern
etO
nsite
111
.1O
ther
7
Car
ey e
t al.[
43]
192
46%
91%
US-
NE,
L p
rivat
eR
NM
CD
-RO
MO
nsite
160
A10
111
Chi
auzz
i et a
l. [5
1]21
254
%73
%U
S-N
E, m
ultip
leR
MIn
tern
etO
ffsi
te4
80M
SB:A
10
Dim
eff &
McN
eely
[52]
3363
%73
%U
S-N
W, L
pub
licW
L/N
TC
D-R
OM
Ons
ite2
19O
ther
11
Don
ohue
et a
l. [5
3]10
456
%63
%U
S-SW
, L p
ublic
RN
MC
D-R
OM
Ons
ite1
45A
101
11
Dou
mas
et a
l. [5
4]67
28%
86%
US-
NW
, L p
ublic
RN
MIn
tern
etO
nsite
115
Oth
er10
Dou
mas
& A
nder
son
[55]
5241
%79
%U
S-N
W, L
pub
licW
L/N
TIn
tern
etO
nsite
115
e-C
hug
6
Dou
mas
& H
aust
veit
[56]
5242
%54
%U
S-N
W, L
pub
licR
MIn
tern
etO
nsite
115
Oth
er6
Fish
burn
e [5
7]21
363
%N
RU
S-SE
, L p
ublic
RM
Intra
net
Ons
ite1/
135
/35
Oth
er10
Hun
t [58
]Lo
w-le
vel:
Ppt s
lides
how
12
158
064
%U
S, L
pub
licIM
Hig
h-le
vel:
Mac
rom
edia
Ons
ite1
20O
ther
9
Kyp
ri et
al.[
59]
360
52%
NR
New
Zea
land
EDU
CIn
tern
etO
nsite
1/3
6/18
Oth
er12
Kyp
ri et
al.[
60]
9450
%91
%N
ew Z
eala
ndED
UC
Intra
net
Ons
ite1
7.8
Oth
er12
Kyp
ri &
McA
nally
[61]
126
51%
75%
New
Zea
land
WL/
NT
Inte
rnet
Ons
ite1
11.8
Oth
er10
Lao-
Bar
raco
& D
unn
[62]
103
57%
76%
US-
SE, L
pub
licIR
MC
D-R
OM
Ons
ite1
105
A10
110
Leff
ingw
ell e
t al.[
63]
7022
%90
%U
S-SW
, L p
ublic
WL/
NT
CD
-RO
MO
nsite
135
Oth
er12
Lew
is e
t al.[
39]
230
52%
100%
US-
MW
, L p
ublic
WL/
NT
Intra
net
Ons
ite1
5O
ther
11
Lew
is &
Nei
ghbo
rs [6
4]16
555
%97
%U
S-N
W, L
pub
licW
L/N
TIn
trane
tO
nsite
11.
5O
ther
11
Mic
hael
[65]
676
45%
52%
US
NR
CD
-RO
MO
nsite
112
0A
101
5
Mig
nogn
a [6
6]
St
udy
128
58%
81%
US-
SW, L
pub
licED
UC
Mul
tiple
Bot
h28
57O
ther
10
St
udy
219
16%
94%
US-
SW, L
pub
licW
L/N
TM
ultip
leB
oth
3710
6O
ther
11
Addiction. Author manuscript; available in PMC 2010 November 1.

NIH
-PA Author Manuscript
NIH
-PA Author Manuscript
NIH
-PA Author Manuscript
Carey et al. Page 17
Inte
rven
tion
Det
ails
Stud
yN
FW
Uni
vers
ityC
ontr
olD
eliv
ery
Loc
atio
nSe
ssio
nsD
ose†
Prog
ram
Qua
lity
Rat
ing‡
Mill
er [6
7]44
563
%70
%U
S-N
W, L
pub
licW
L/N
TC
D-R
OM
(G)
Ons
ite2
180
A10
113
Moo
re e
t al.[
68]
106
58%
70%
US-
SE, L
pub
licR
MIn
tern
et &
Em
ail
Off
site
440
Oth
er9
Nei
ghbo
rs e
t al.[
40]
207
59%
80%
US-
NW
, L p
ublic
WL/
NT
Intra
net
Ons
ite1
1O
ther
12
Nei
ghbo
rs e
t al.[
69]
185
56%
98%
US-
MW
, L p
ublic
WL/
NT
Intra
net
Ons
ite1
1.5
Oth
er12
Nei
ghbo
rs e
t al.[
70]
282
58%
67%
US-
NW
, L p
ublic
WL/
NT
Inte
rnet
Off
site
220
Oth
er11
Saitz
et a
l.[71
]23
555
%81
%U
S-N
E, L
priv
ate
RN
MIn
tern
etO
ffsi
te1
20O
ther
8
Stei
ner e
t al.[
72]
159
61%
NR
US-
SW, L
pub
licW
L/N
TIn
tern
etO
ffsi
te1
25e-
Chu
g9
Wal
l [21
]23
,127
53%
82%
US
& C
anad
aW
L/N
TIn
tern
etU
nkno
wn
115
0A
Edu
6
Wal
ters
et a
l. [4
1]82
48%
73%
US-
SW, L
pub
licW
L/N
TIn
tern
etU
nkno
wn
125
e-C
hug
10
Wei
tzel
et a
l.[73
]40
55%
77%
US-
SE, L
priv
ate
WL/
NT
PED
Off
site
10.9
326
Oth
er8
Wyr
ick
et a
l.[74
]65
77%
55%
US-
SE, L
pub
licN
RIn
tern
etB
oth
360
Oth
er5
* N, n
umbe
r of p
artic
ipan
ts. F
, pro
porti
on fe
mal
e. W
, pro
porti
on W
hite
. US
= U
nite
d St
ates
. NE
= N
orth
east
. SE
= So
uthe
ast.
MW
= M
idw
est.
SW =
Sou
thw
est.
S =
Smal
l. M
= M
ediu
m. L
= L
arge
. WL/
NT,
wai
t-lis
t/no
treat
men
t con
trol.
PED
, por
tabl
e el
ectro
nic
devi
ce. G
,gr
oup
deliv
ery.
A10
1, A
lcoh
ol 1
01 (P
lus)
. MSB
:A, M
y St
uden
t Bod
y: A
lcoh
ol. e
-Chu
g, e
lect
roni
c ch
eck-
up to
go.
AEd
u, A
lcoh
ol E
du. N
R, n
one/
not r
epor
ted.
† Estim
ated
num
ber o
f min
utes
of i
nter
vent
ion
cont
ent e
xclu
ding
mea
sure
men
t.
‡ Met
hodo
logi
cal q
ualit
y ra
ting
scor
e ou
t of a
pos
sibl
e 17
poi
nts.
Addiction. Author manuscript; available in PMC 2010 November 1.

NIH
-PA Author Manuscript
NIH
-PA Author Manuscript
NIH
-PA Author Manuscript
Carey et al. Page 18
APPENDIX 2
Description of studies, samples, intervention, and control conditions.
Study characteristics (k =35)
Year of publication (k = 27)
Mdn 2005
Range 2000 – 2008
Year of data collection
Mdn 2004
Range 1994–2007
Year of program development
Mdn 2002
Range 1993–2006
Published 60%
* Financial Support
Public 57%
Private 17%
None/NR 26%
Region of Sample
US Northeast 14%
US Southeast 17%
US Midwest 6%
US Southwest 23%
US Northwest 23%
Non-US region 9%
Multiple regions 9%
* Type of institution (k = 33)
Public university 85%
Private university 12%
Multiple institutions 3%
* Size of institution (k = 33)
<6,000 students 3%
6,000 – 10,000 students 3%
>10,000 students 91%
Multiple 3%
Targeted intervention (% yes) 91%
Target group (k = 32)
Heavy drinkers 28%
College freshman 23%
High-risk drinkers 14%
Current drinkers 13%
Alcohol violators 13%
Upperclass students 3%
Addiction. Author manuscript; available in PMC 2010 November 1.

NIH
-PA Author Manuscript
NIH
-PA Author Manuscript
NIH
-PA Author Manuscript
Carey et al. Page 19
Students turning 21 3%
Athlete 2%
Males 2%
Methodological quality score (17 points total)
Mean (SD) 9.37 (2.52)
Mdn 10
Range 3 – 13
Research design and implementation (k = 35)
Recruitment method
Volunteered 53%
Recruited 33%
Mandated 14%
Random Assignment
Randomized individuals 74%
Randomized groups 17%
Nonequivalent control group 9%
Pretest post-test design (% yes) 100%
No. post-intervention assessments
Mean (SD) 1.63 (0.73)
Mdn 1
Range 1 – 3
First post-intervention assessment
Mean weeks (SD) 5.06 (5.63)
Mdn 4.33
Range 0 – 26
Sample Characteristics (k = 35)
Sample Size (N)
Total 28,621
Mean (SD) 817.74(3884)
Mdn 148
Year in school (mean %)
Freshman 68%
Sophomore 15%
Junior 12%
Senior 5%
Graduate 1%
Age in years (k = 31)
Mean (SD) 19.71 (1.09)
Range 18 – 22
% women
Mean (SD) 0.50 (0.15)
% Greek members (k = 9)
Addiction. Author manuscript; available in PMC 2010 November 1.

NIH
-PA Author Manuscript
NIH
-PA Author Manuscript
NIH
-PA Author Manuscript
Carey et al. Page 20
Mean (SD) 0.23 (0.15)
% White
Mean (SD) 0.75 (0.17)
% Black
Mean (SD) 0.10 (0.12)
% Asian
Mean (SD) 0.13 (0.12)
% Hispanic
Mean (SD) 0.08 (0.05)
Intervention Characteristics (k = 55)
No. of intervention conditions
Mean (SD) 1.36 (0.48)
Mdn (Range) 1 (1 – 2)
Level of intervention
Self-directed 86%
Group delivered 7%
Computer and groupsession(s)
5%
Computer and in-personsession
2%
Self-directed computer/web (k = 48)
No. of sessions (Mdn) 1
No. of minutes (Mdn) 20
Group-delivered computer/web (k = 4)
No. of sessions (Mdn) 1
No. of minutes (Mdn) 120
Computer/web and group session (k = 4)
No. of computer sessions(Mdn)
31.5
No. of computer minutes(Mdn)
1
No. of group sessions (Mdn) 1
No. of group minutes (Mdn) 30
Computer/web and in-person session (k = 1)
No. of computer sessions(Mdn)
1
No. of computer minutes(Mdn)
15
No. of in-person sessions(Mdn)
1
No. of in-person minutes(Mdn)
4
Interactive intervention (%yes)
93%
Intervention content tailored
Individual 89%
Addiction. Author manuscript; available in PMC 2010 November 1.

NIH
-PA Author Manuscript
NIH
-PA Author Manuscript
NIH
-PA Author Manuscript
Carey et al. Page 21
Group 2%
None/NR 9%
* Intervention Components
Feedback on consumption 86%
Alcohol education 77%
Normative comparisons, generic 77%
Tailored materials 61%
Modification strategies 43%
Challenges/expectancies 39%
Feedback on problems 36%
Focus on high-risksituations
34%
Feedback on risk factors 30%
Normative comparisons, matching 25%
General alcohol-related materials 20%
Writing and/or journaling 16%
Goal-setting 13%
Values clarification 7%
Decisional balance 2%
Delivery mechanism
Internet 38%
Intranet 30%
CD-ROM/Interactive DVD 25%
Multiple delivery modes 5%
Portable electronic device 2%
Delivery setting
On-site 72%
Off-site 24%
Unknown 4%
Type of commercially available program used
None 59%
Alcohol 101 (Plus) 20%
College Alc 7%
Electronic Check-Up to Go 5%
Check Your Drinking 4%
My Student Body: Alcohol 4%
Alcohol Edu 2%
Computer program includesavatar (%)
23%
Comparison Characteristics (k = 54)
Type of control/comparison
Wait-list/no treatment 43%
Relevant content, time-matched 31%
Addiction. Author manuscript; available in PMC 2010 November 1.
NIH
-PA Author Manuscript
NIH
-PA Author Manuscript
NIH
-PA Author Manuscript
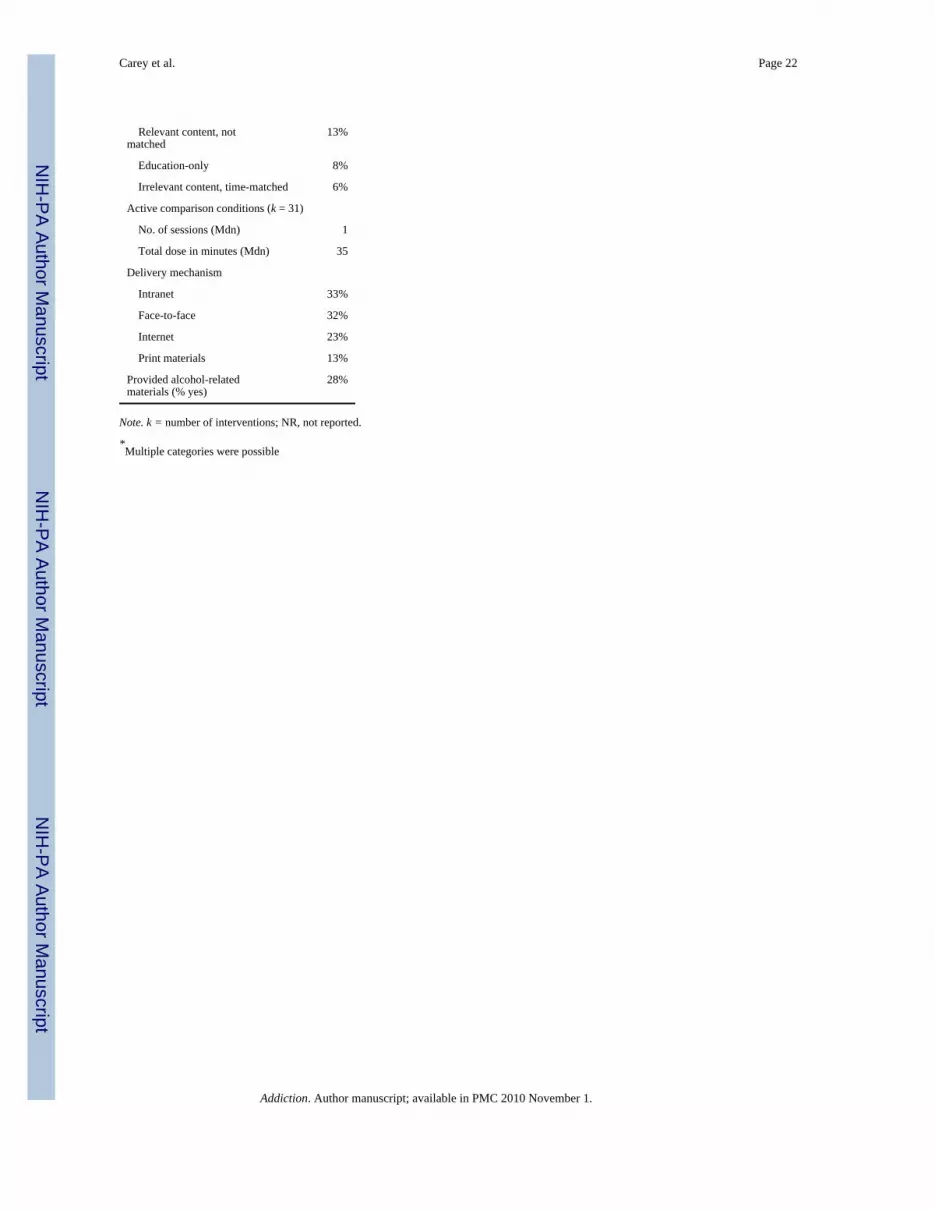
Carey et al. Page 22
Relevant content, notmatched
13%
Education-only 8%
Irrelevant content, time-matched 6%
Active comparison conditions (k = 31)
No. of sessions (Mdn) 1
Total dose in minutes (Mdn) 35
Delivery mechanism
Intranet 33%
Face-to-face 32%
Internet 23%
Print materials 13%
Provided alcohol-relatedmaterials (% yes)
28%
Note. k = number of interventions; NR, not reported.
*Multiple categories were possible
Addiction. Author manuscript; available in PMC 2010 November 1.