Embed Size (px)
Citation preview
© 2017 White et al.595
International Food and Agribusiness Management ReviewVolume 21 Issue 5, 2018; DOI: 10.22434/IFAMR2016.0182
Received: 19 December 2016 / Accepted: 10 September 2017
OPEN ACCESS
ConAgra Foods: valuing a potential recipe for success
Special issue: Teaching case studies in food and agribusiness management
CASE STUDY
Susan Whitea, Carlos Trejo-Pech b, and Magdy Noguerac
aClinical Professor of Finance, Robert H. Smith School of Business, University of Maryland, 4455 Van Munching Hall, College Park, MD 20742, USA
bAssistant Professor of Agribusiness Finance, Department of Agricultural and Resource Economics, The University of Tennessee, 2621 Morgan Circle Drive, 308D Morgan Hall, Knoxville, TN 37996, USA; Adjunct
Professor of Finance, Universidad Panamericana, Escuela de Ciencias Económicas y Empresariales, Universidad Panamericana at Guadalajara, Calz. Circ. Pte. 49, Zapopan, 45010 Jalisco, Mexico
cAssociate Professor of Finance, College of Business and Economics, University of Idaho, 875 Perimeter Drive MS 3161, Moscow, ID 83844-3161, USA
Abstract
In the fall of 2012, ConAgra Foods had the opportunity to become the largest private-label packaged food producer in North America. ConAgra was considering the purchase of Ralcorp, a large private brands manufacturer. This could be a strategic step for ConAgra, since the potential acquisition seemed aligned to the firm’s strategy for growth. Ralcorp, with revenue and assets representing about one third of ConAgra’s, was large enough to impact ConAgra’s business strategy and financial structure. This case study provides both firm level and private brands industry data to assess the potential acquisition. Ranges of implied stock prices could be estimated by using Discounted Cash Flow Valuation, Comparable Multiples, and Comparable Merger and Acquisitions Transaction analysis. A comparison of implied stock prices and actual stock price by the time of the case leads to the topic of control premium paid during acquisitions and to potential enterprise synergies.
Keywords: agribusiness finance, mergers and acquisitions, investment valuation, private brandsJEL code: G32, G34, M1, M2, Q13
Corresponding author: [email protected]
A teaching note has been prepared for this case study. Interested instructors at educational institutions may request the teaching note by contacting the author or IFAMA
${p
roto
col}
://w
ww
.wag
enin
gena
cade
mic
.com
/doi
/10.
2243
4/IF
AM
R20
16.0
182
- Fr
iday
, Jul
y 06
, 201
8 8:
44:1
9 A
M -
IP
Add
ress
:189
.201
.178
.194
International Food and Agribusiness Management Review596
White et al. Volume 21, Issue 5, 2018
1. Introduction
Banquet®, Chef Boyardee®, Egg Beaters®, Healthy Choice®, Hebrew National®, Hunt’s®, Marie Callender’s®, Orville Redenbacher’s®, PAM®, Peter Pan®, Reddi-wip®, Slim Jim®, Snack Pack®. Jordan Talbot thought of the pantry in his small apartment, where he stocked as many of these ConAgra labels as he could. Jordan was a food science graduate with a business minor from a large state land grant university in the east. ‘ConAgra was a great fit for me for my first job after graduating,’ Jordan said. ‘But now I’m glad I took those extra finance courses.’ ConAgra Foods was one of the largest packaged foods companies in North America, with its products found in 97% of America’s households. In addition, ConAgra had a large commercial foods business, supplying global restaurants and food service operations.
In the fall of 2012, ConAgra had the opportunity to become the largest private-label packaged food producer in North America. Private label or brand, sometimes referred to as store brand, refers to products sold in a grocery store under the store’s own brand (the term private brand is used hereafter). Often stores offered their own brand of a particular, popular product next to the brand name version (e.g. national brand) of that product. For some products, ConAgra produced both the national brand and private brand of the same product. ConAgra was considering the purchase of Ralcorp, a large private brands manufacturer. This could be a move to take advantage of economies of scale that being a large food producer would provide. Jordan was a part of the team that was looking at the economics of a Ralcorp purchase. It was time to put his business skills into practice.
2. The industry
ConAgra was part of a large, competitive and mature food manufacturing industry. Major players in the industry included Nestle, General Mills, Heinz, Kraft, Kellogg, and Unilever. Food manufacturing firms were part of the food and agribusiness value chain, which also included agricultural input suppliers, farm producers, food distributors, food retailers, and food service providers. Food manufacturing firms were the richest in terms of revenues compared to all other food related industries. According to Standard and Poor’s Net Advantage, long-term industry projected growth rates ranged from 1 to 4% for food manufacturing depending on the specific segment.
3. Private brands versus national brands
The private brand business involved providing packaged foods sold under the store’s name. For example, Safeway grocery stores used ‘Signature’ in its own brands: Signature Select, Home, Kitchen, Farms, etc. Grocery and department stores often offered their private branded products next to national brands, and generally charged lower prices for their own private brands. Table 1 shows the average difference in prices between national and private food branded products by categories from two major supermarket chains from 2008 to 2010. On average, this study conducted by Volpe in 2011 found that private branded food products were priced about 23% lower than the same national branded product. The study also reported that this 23% price gap was smaller than it used to be in the past, suggesting that private brands may have become more comparable to national brands in both quality and price over time and that future growth in private brands, if any, was expected to come at the expense of lower tier branded products mainly because the top national brands had larger advertising budgets and were better able to create loyal customers than less advertised products.
Private brands had recently brought increasing revenues to grocery stores. According to the 2009 Food Institute Report, private brand food sales increased at a 4.5% per year during 2003-2008 in the U.S. (Volpe, 2011), jumping by 7.4% from 2008 to 2009, with the food category growing the most (Straczynski, 2009). The latter number added support to the finding that demand for private brand products generally increased in economic downturns as consumers became more price-conscious (Dubé et al., 2015). It was difficult to predict the behavior of consumers regarding purchasing private brands vs national brands in the long-term,
${p
roto
col}
://w
ww
.wag
enin
gena
cade
mic
.com
/doi
/10.
2243
4/IF
AM
R20
16.0
182
- Fr
iday
, Jul
y 06
, 201
8 8:
44:1
9 A
M -
IP
Add
ress
:189
.201
.178
.194
International Food and Agribusiness Management Review597
White et al. Volume 21, Issue 5, 2018
though. On one hand, retailers had an incentive to intensify their efforts to promote and enhance their private brand products since these generated higher profit margin than national brands. According to a Fortune article, WalMart, for instance, had enhanced its Great Value foods in 2011 by adding ‘healthy’ options, foods with less sugar and sodium accompanied by new packaging and enhanced marketing (Wong, 2011). On the other hand, consumer driven factors such as the homogeneity of national brands, in terms of taste and appearance, and an income effect after the recovery of the economy (the possibility of considering private brands inferior products) might diminish the increase in the private brand products consumption trend observed during the economic recession.
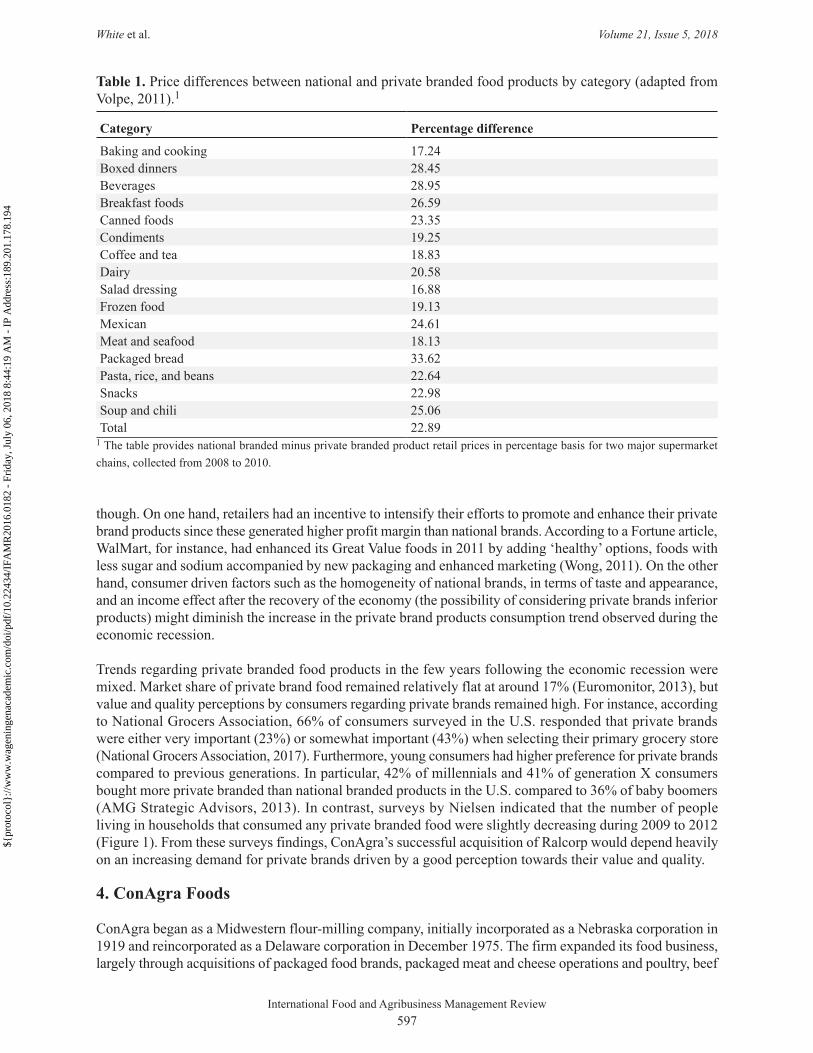
Trends regarding private branded food products in the few years following the economic recession were mixed. Market share of private brand food remained relatively flat at around 17% (Euromonitor, 2013), but value and quality perceptions by consumers regarding private brands remained high. For instance, according to National Grocers Association, 66% of consumers surveyed in the U.S. responded that private brands were either very important (23%) or somewhat important (43%) when selecting their primary grocery store (National Grocers Association, 2017). Furthermore, young consumers had higher preference for private brands compared to previous generations. In particular, 42% of millennials and 41% of generation X consumers bought more private branded than national branded products in the U.S. compared to 36% of baby boomers (AMG Strategic Advisors, 2013). In contrast, surveys by Nielsen indicated that the number of people living in households that consumed any private branded food were slightly decreasing during 2009 to 2012 (Figure 1). From these surveys findings, ConAgra’s successful acquisition of Ralcorp would depend heavily on an increasing demand for private brands driven by a good perception towards their value and quality.
4. ConAgra Foods
ConAgra began as a Midwestern flour-milling company, initially incorporated as a Nebraska corporation in 1919 and reincorporated as a Delaware corporation in December 1975. The firm expanded its food business, largely through acquisitions of packaged food brands, packaged meat and cheese operations and poultry, beef
Table 1. Price differences between national and private branded food products by category (adapted from Volpe, 2011).1
Category Percentage difference
Baking and cooking 17.24Boxed dinners 28.45Beverages 28.95Breakfast foods 26.59Canned foods 23.35Condiments 19.25Coffee and tea 18.83Dairy 20.58Salad dressing 16.88Frozen food 19.13Mexican 24.61Meat and seafood 18.13Packaged bread 33.62Pasta, rice, and beans 22.64Snacks 22.98Soup and chili 25.06Total 22.89
1 The table provides national branded minus private branded product retail prices in percentage basis for two major supermarket chains, collected from 2008 to 2010.
${p
roto
col}
://w
ww
.wag
enin
gena
cade
mic
.com
/doi
/10.
2243
4/IF
AM
R20
16.0
182
- Fr
iday
, Jul
y 06
, 201
8 8:
44:1
9 A
M -
IP
Add
ress
:189
.201
.178
.194
International Food and Agribusiness Management Review598
White et al. Volume 21, Issue 5, 2018
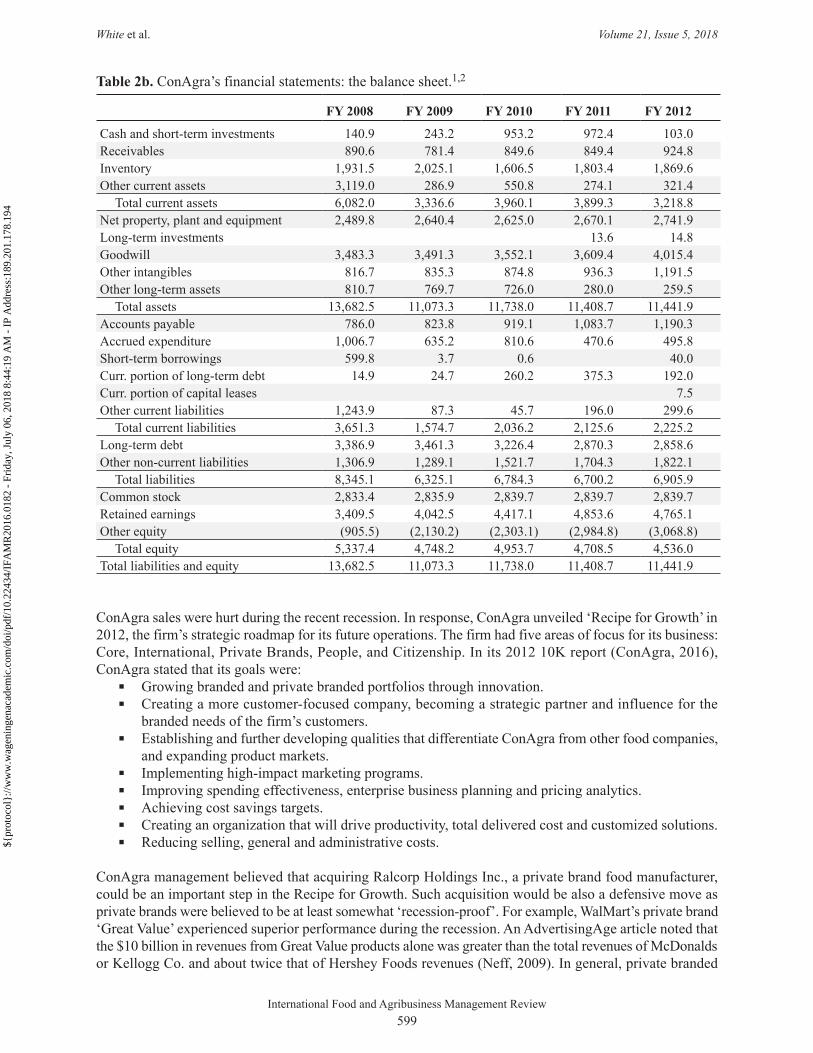
and pork businesses, while at the same time divesting dehydrated and fresh vegetable operations. According to S&P Capital IQ classification, ConAgra was part of the Food Manufacturing Products industry, which in turn included two segments: agricultural products and packaged food and meats. ConAgra primarily was a player in the latter segment. The firm, headquartered in Omaha, Nebraska, had 32,800 employees, primarily based in the US. Table 2 provides ConAgra’s financial statements. As of the end of 2012 ConAgra’s stock price was $29.50 and the firm had 418.3 million shares outstanding.
Figure 1. Number of people (in millions) living in households that consumed any private brand in the U.S. (Nielsen Scarborough, 2012).
106.04 107.28 107.06
102.9
99.3197.44
94.5995
100
105
110
Autumn 2009
Spring 2010
Autumn 2010
Spring 2011
Autumn 2011
Spring 2012
Autumn 2012
Table 2a. ConAgra’s financial statements: the income statement.1,2
FY 2008 FY 2009 FY 2010 FY 2011 FY 2012
Revenue 11,605.7 12,731.2 12,079.4 12,303.1 13,262.6 Cost of goods sold 8,886.1 9,890.6 8,998.9 9,366.9 10,413.2 Selling general and admin expenditure 1,740.7 1,659.5 1,759.2 1,582.8 1,951.5
Operating income 978.9 1,181.1 1,321.3 1,353.4 897.9 Net interest expenditure (253.3) (186.2) (160.4) (177.5) (204.0)
EBT excl. unusual items 775.3 1,018.9 1,183.0 1,202.3 738.8 Restructuring charges (29.4) (10.0) (72.2) (56.3) (58.5)
EBT incl. unusual items 745.9 983.6 1,106.9 1,251.3 670.1 Income tax expense 227.2 337.2 362.1 421.0 195.8
Earnings from cont. ops. 518.7 646.4 744.8 830.3 474.3 Earnings of discontinued ops. 411.9 332.0 (21.5) (11.5) 0.1
Net income 930.6 978.4 725.8 817.0 467.9 Diluted EPS. 1.90 2.15 1.62 1.87 1.12Weighted avg. diluted shares outstanding 490.9 455.4 447.1 434.3 418.3 Dividends per share 0.75 0.76 0.79 0.89 0.95EBITDA 1,275.6 1,500 1,648.1 1,714.3 1,269.7 Stock Price as of the end of calendar year 16.5 23.05 22.58 26.4 29.5
${p
roto
col}
://w
ww
.wag
enin
gena
cade
mic
.com
/doi
/10.
2243
4/IF
AM
R20
16.0
182
- Fr
iday
, Jul
y 06
, 201
8 8:
44:1
9 A
M -
IP
Add
ress
:189
.201
.178
.194
International Food and Agribusiness Management Review599
White et al. Volume 21, Issue 5, 2018
ConAgra sales were hurt during the recent recession. In response, ConAgra unveiled ‘Recipe for Growth’ in 2012, the firm’s strategic roadmap for its future operations. The firm had five areas of focus for its business: Core, International, Private Brands, People, and Citizenship. In its 2012 10K report (ConAgra, 2016), ConAgra stated that its goals were:
■ Growing branded and private branded portfolios through innovation. ■ Creating a more customer-focused company, becoming a strategic partner and influence for the
branded needs of the firm’s customers. ■ Establishing and further developing qualities that differentiate ConAgra from other food companies,
and expanding product markets. ■ Implementing high-impact marketing programs. ■ Improving spending effectiveness, enterprise business planning and pricing analytics. ■ Achieving cost savings targets. ■ Creating an organization that will drive productivity, total delivered cost and customized solutions. ■ Reducing selling, general and administrative costs.
ConAgra management believed that acquiring Ralcorp Holdings Inc., a private brand food manufacturer, could be an important step in the Recipe for Growth. Such acquisition would be also a defensive move as private brands were believed to be at least somewhat ‘recession-proof’. For example, WalMart’s private brand ‘Great Value’ experienced superior performance during the recession. An AdvertisingAge article noted that the $10 billion in revenues from Great Value products alone was greater than the total revenues of McDonalds or Kellogg Co. and about twice that of Hershey Foods revenues (Neff, 2009). In general, private branded
Table 2b. ConAgra’s financial statements: the balance sheet.1,2
FY 2008 FY 2009 FY 2010 FY 2011 FY 2012
Cash and short-term investments 140.9 243.2 953.2 972.4 103.0 Receivables 890.6 781.4 849.6 849.4 924.8 Inventory 1,931.5 2,025.1 1,606.5 1,803.4 1,869.6 Other current assets 3,119.0 286.9 550.8 274.1 321.4
Total current assets 6,082.0 3,336.6 3,960.1 3,899.3 3,218.8 Net property, plant and equipment 2,489.8 2,640.4 2,625.0 2,670.1 2,741.9 Long-term investments 13.6 14.8 Goodwill 3,483.3 3,491.3 3,552.1 3,609.4 4,015.4 Other intangibles 816.7 835.3 874.8 936.3 1,191.5 Other long-term assets 810.7 769.7 726.0 280.0 259.5
Total assets 13,682.5 11,073.3 11,738.0 11,408.7 11,441.9 Accounts payable 786.0 823.8 919.1 1,083.7 1,190.3 Accrued expenditure 1,006.7 635.2 810.6 470.6 495.8 Short-term borrowings 599.8 3.7 0.6 40.0 Curr. portion of long-term debt 14.9 24.7 260.2 375.3 192.0 Curr. portion of capital leases 7.5 Other current liabilities 1,243.9 87.3 45.7 196.0 299.6
Total current liabilities 3,651.3 1,574.7 2,036.2 2,125.6 2,225.2 Long-term debt 3,386.9 3,461.3 3,226.4 2,870.3 2,858.6 Other non-current liabilities 1,306.9 1,289.1 1,521.7 1,704.3 1,822.1
Total liabilities 8,345.1 6,325.1 6,784.3 6,700.2 6,905.9 Common stock 2,833.4 2,835.9 2,839.7 2,839.7 2,839.7 Retained earnings 3,409.5 4,042.5 4,417.1 4,853.6 4,765.1 Other equity (905.5) (2,130.2) (2,303.1) (2,984.8) (3,068.8)
Total equity 5,337.4 4,748.2 4,953.7 4,708.5 4,536.0 Total liabilities and equity 13,682.5 11,073.3 11,738.0 11,408.7 11,441.9
${p
roto
col}
://w
ww
.wag
enin
gena
cade
mic
.com
/doi
/10.
2243
4/IF
AM
R20
16.0
182
- Fr
iday
, Jul
y 06
, 201
8 8:
44:1
9 A
M -
IP
Add
ress
:189
.201
.178
.194
International Food and Agribusiness Management Review600
White et al. Volume 21, Issue 5, 2018
food products experienced higher growth rates during the recession compared to other periods (Straczynski, 2009), which in turn translated in better performance for private brands manufacturers. For instance, while ConAgra’s stock price declined 4% from 2009 to 2010, Ralcorp’s stock price declined 4% from 2007 to 2008, but then increased 2% the following year and gained 9% from 2009 to 2010 (stock prices in Table 2).
The acquisition of Ralcorp would change ConAgra’s business portfolio considerably. Private label packaging was not an essential part of ConAgra’s business model until the firm recently announced that producing private label foods was part of its strategy and acquired two companies in the private label business, National Pretzel Company, acquired in November 2011, and Kangaroo Brands, acquired in May 2012. Thus, the potential acquisition of Ralcorp would practically require ConAgra to enter a new business segment. Another challenge would be to balance out the presence of ConAgra’s private vs national brands in stores. WalMart’s efforts to increase sales of private brands would benefit ConAgra’s private brand segment but could put pressure on ConAgra’s national brands, which provided higher margins for ConAgra. By 2012, ConAgra’s sales to WalMart represented about 15% of its total revenue (MarketLine, 2015). The top five retailers in the private branded food segment in the U.S., in terms of total sales, were ALDI, WalMart, Kroger, Trader Joe’s, and Costco (PLBuyer 2013a,b). Food manufacturers such as ConAgra depended on a concentrated retailing sector.
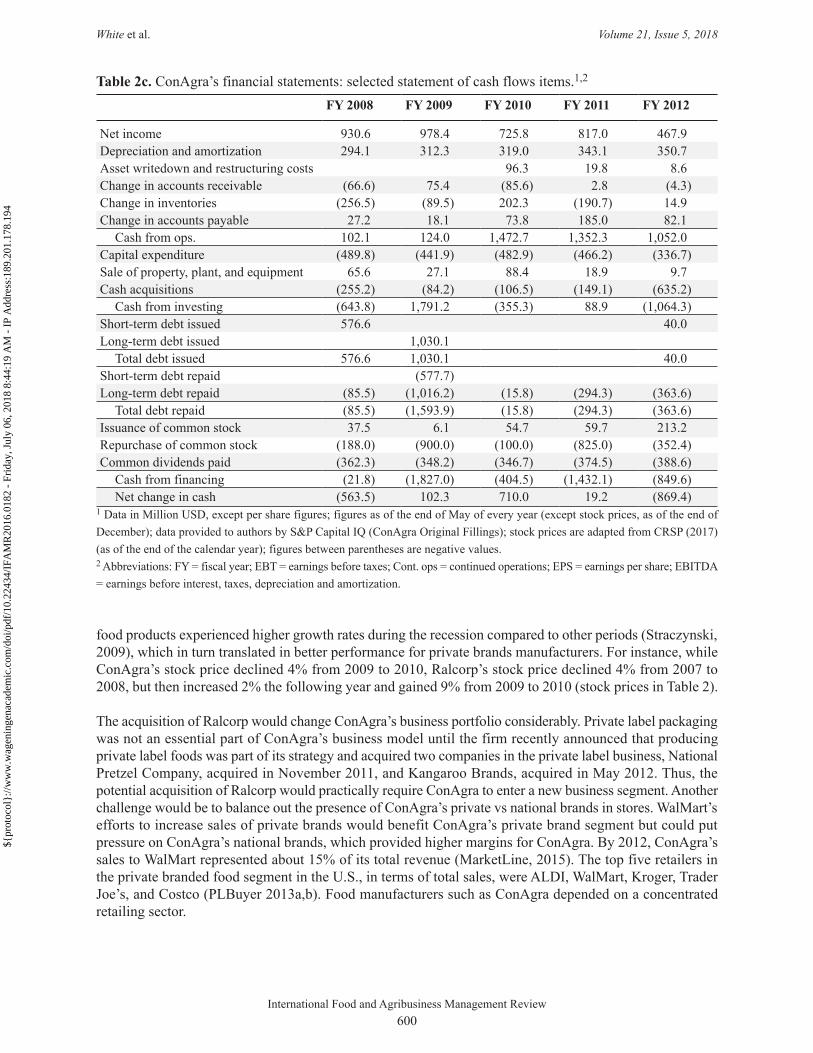
Table 2c. ConAgra’s financial statements: selected statement of cash flows items.1,2
FY 2008 FY 2009 FY 2010 FY 2011 FY 2012
Net income 930.6 978.4 725.8 817.0 467.9 Depreciation and amortization 294.1 312.3 319.0 343.1 350.7 Asset writedown and restructuring costs 96.3 19.8 8.6 Change in accounts receivable (66.6) 75.4 (85.6) 2.8 (4.3)Change in inventories (256.5) (89.5) 202.3 (190.7) 14.9 Change in accounts payable 27.2 18.1 73.8 185.0 82.1
Cash from ops. 102.1 124.0 1,472.7 1,352.3 1,052.0 Capital expenditure (489.8) (441.9) (482.9) (466.2) (336.7)Sale of property, plant, and equipment 65.6 27.1 88.4 18.9 9.7 Cash acquisitions (255.2) (84.2) (106.5) (149.1) (635.2)
Cash from investing (643.8) 1,791.2 (355.3) 88.9 (1,064.3)Short-term debt issued 576.6 40.0 Long-term debt issued 1,030.1
Total debt issued 576.6 1,030.1 40.0 Short-term debt repaid (577.7)Long-term debt repaid (85.5) (1,016.2) (15.8) (294.3) (363.6)
Total debt repaid (85.5) (1,593.9) (15.8) (294.3) (363.6)Issuance of common stock 37.5 6.1 54.7 59.7 213.2 Repurchase of common stock (188.0) (900.0) (100.0) (825.0) (352.4)Common dividends paid (362.3) (348.2) (346.7) (374.5) (388.6)
Cash from financing (21.8) (1,827.0) (404.5) (1,432.1) (849.6)Net change in cash (563.5) 102.3 710.0 19.2 (869.4)
1 Data in Million USD, except per share figures; figures as of the end of May of every year (except stock prices, as of the end of December); data provided to authors by S&P Capital IQ (ConAgra Original Fillings); stock prices are adapted from CRSP (2017) (as of the end of the calendar year); figures between parentheses are negative values.2 Abbreviations: FY = fiscal year; EBT = earnings before taxes; Cont. ops = continued operations; EPS = earnings per share; EBITDA = earnings before interest, taxes, depreciation and amortization.
${p
roto
col}
://w
ww
.wag
enin
gena
cade
mic
.com
/doi
/10.
2243
4/IF
AM
R20
16.0
182
- Fr
iday
, Jul
y 06
, 201
8 8:
44:1
9 A
M -
IP
Add
ress
:189
.201
.178
.194
International Food and Agribusiness Management Review601
White et al. Volume 21, Issue 5, 2018
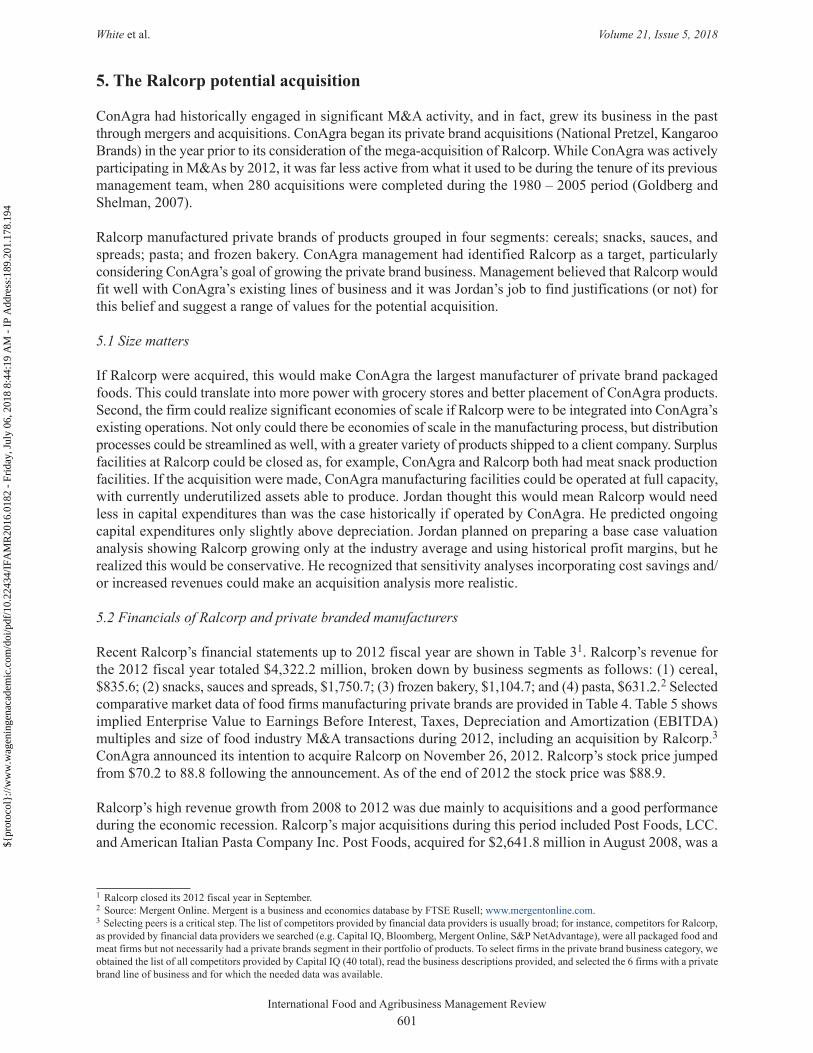
5. The Ralcorp potential acquisition
ConAgra had historically engaged in significant M&A activity, and in fact, grew its business in the past through mergers and acquisitions. ConAgra began its private brand acquisitions (National Pretzel, Kangaroo Brands) in the year prior to its consideration of the mega-acquisition of Ralcorp. While ConAgra was actively participating in M&As by 2012, it was far less active from what it used to be during the tenure of its previous management team, when 280 acquisitions were completed during the 1980 – 2005 period (Goldberg and Shelman, 2007).
Ralcorp manufactured private brands of products grouped in four segments: cereals; snacks, sauces, and spreads; pasta; and frozen bakery. ConAgra management had identified Ralcorp as a target, particularly considering ConAgra’s goal of growing the private brand business. Management believed that Ralcorp would fit well with ConAgra’s existing lines of business and it was Jordan’s job to find justifications (or not) for this belief and suggest a range of values for the potential acquisition.
5.1 Size matters
If Ralcorp were acquired, this would make ConAgra the largest manufacturer of private brand packaged foods. This could translate into more power with grocery stores and better placement of ConAgra products. Second, the firm could realize significant economies of scale if Ralcorp were to be integrated into ConAgra’s existing operations. Not only could there be economies of scale in the manufacturing process, but distribution processes could be streamlined as well, with a greater variety of products shipped to a client company. Surplus facilities at Ralcorp could be closed as, for example, ConAgra and Ralcorp both had meat snack production facilities. If the acquisition were made, ConAgra manufacturing facilities could be operated at full capacity, with currently underutilized assets able to produce. Jordan thought this would mean Ralcorp would need less in capital expenditures than was the case historically if operated by ConAgra. He predicted ongoing capital expenditures only slightly above depreciation. Jordan planned on preparing a base case valuation analysis showing Ralcorp growing only at the industry average and using historical profit margins, but he realized this would be conservative. He recognized that sensitivity analyses incorporating cost savings and/or increased revenues could make an acquisition analysis more realistic.
5.2 Financials of Ralcorp and private branded manufacturers
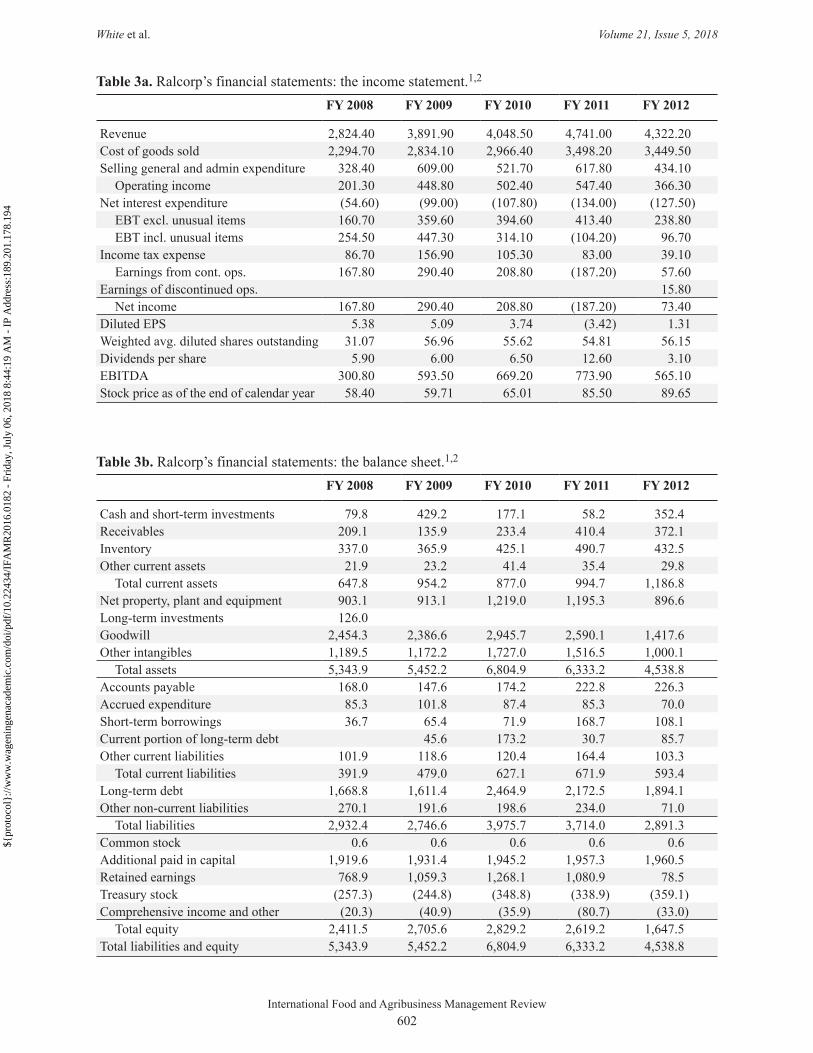
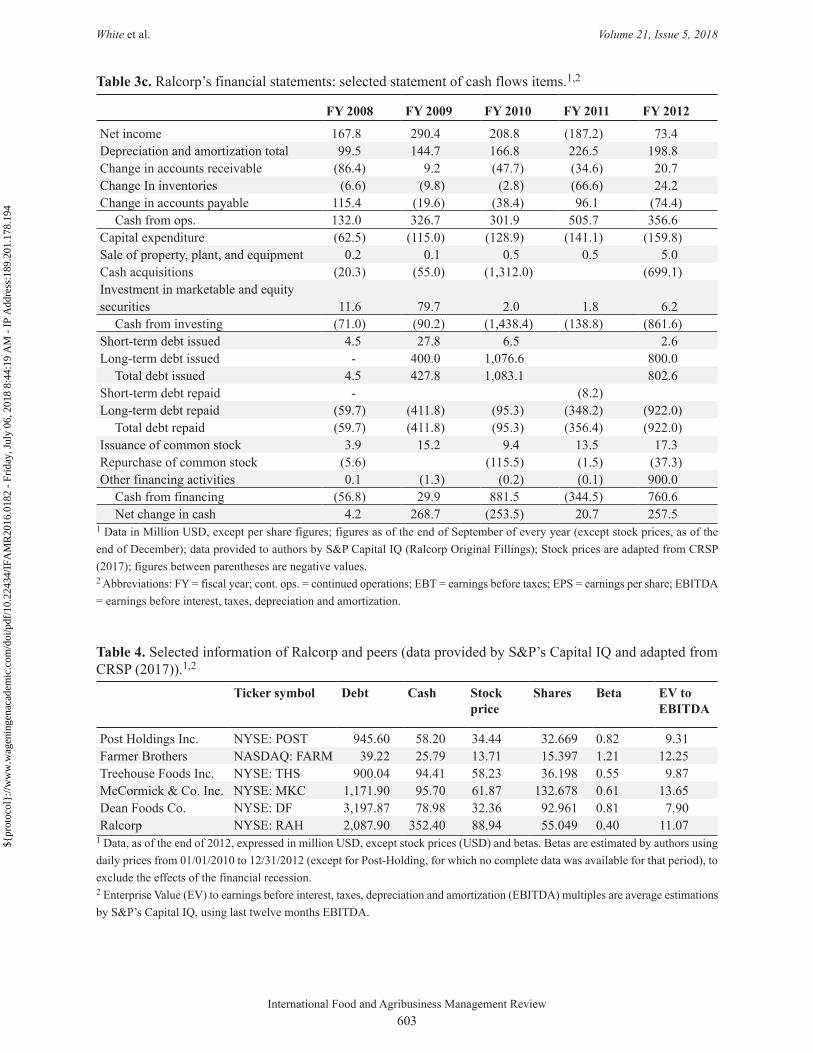
Recent Ralcorp’s financial statements up to 2012 fiscal year are shown in Table 31. Ralcorp’s revenue for the 2012 fiscal year totaled $4,322.2 million, broken down by business segments as follows: (1) cereal, $835.6; (2) snacks, sauces and spreads, $1,750.7; (3) frozen bakery, $1,104.7; and (4) pasta, $631.2.2 Selected comparative market data of food firms manufacturing private brands are provided in Table 4. Table 5 shows implied Enterprise Value to Earnings Before Interest, Taxes, Depreciation and Amortization (EBITDA) multiples and size of food industry M&A transactions during 2012, including an acquisition by Ralcorp.3 ConAgra announced its intention to acquire Ralcorp on November 26, 2012. Ralcorp’s stock price jumped from $70.2 to 88.8 following the announcement. As of the end of 2012 the stock price was $88.9.
Ralcorp’s high revenue growth from 2008 to 2012 was due mainly to acquisitions and a good performance during the economic recession. Ralcorp’s major acquisitions during this period included Post Foods, LCC. and American Italian Pasta Company Inc. Post Foods, acquired for $2,641.8 million in August 2008, was a
1 Ralcorp closed its 2012 fiscal year in September.2 Source: Mergent Online. Mergent is a business and economics database by FTSE Rusell; www.mergentonline.com.3 Selecting peers is a critical step. The list of competitors provided by financial data providers is usually broad; for instance, competitors for Ralcorp, as provided by financial data providers we searched (e.g. Capital IQ, Bloomberg, Mergent Online, S&P NetAdvantage), were all packaged food and meat firms but not necessarily had a private brands segment in their portfolio of products. To select firms in the private brand business category, we obtained the list of all competitors provided by Capital IQ (40 total), read the business descriptions provided, and selected the 6 firms with a private brand line of business and for which the needed data was available.
${p
roto
col}
://w
ww
.wag
enin
gena
cade
mic
.com
/doi
/10.
2243
4/IF
AM
R20
16.0
182
- Fr
iday
, Jul
y 06
, 201
8 8:
44:1
9 A
M -
IP
Add
ress
:189
.201
.178
.194
International Food and Agribusiness Management Review602
White et al. Volume 21, Issue 5, 2018
Table 3a. Ralcorp’s financial statements: the income statement.1,2
FY 2008 FY 2009 FY 2010 FY 2011 FY 2012
Revenue 2,824.40 3,891.90 4,048.50 4,741.00 4,322.20 Cost of goods sold 2,294.70 2,834.10 2,966.40 3,498.20 3,449.50 Selling general and admin expenditure 328.40 609.00 521.70 617.80 434.10
Operating income 201.30 448.80 502.40 547.40 366.30 Net interest expenditure (54.60) (99.00) (107.80) (134.00) (127.50)
EBT excl. unusual items 160.70 359.60 394.60 413.40 238.80 EBT incl. unusual items 254.50 447.30 314.10 (104.20) 96.70
Income tax expense 86.70 156.90 105.30 83.00 39.10 Earnings from cont. ops. 167.80 290.40 208.80 (187.20) 57.60
Earnings of discontinued ops. 15.80 Net income 167.80 290.40 208.80 (187.20) 73.40
Diluted EPS 5.38 5.09 3.74 (3.42) 1.31 Weighted avg. diluted shares outstanding 31.07 56.96 55.62 54.81 56.15 Dividends per share 5.90 6.00 6.50 12.60 3.10 EBITDA 300.80 593.50 669.20 773.90 565.10 Stock price as of the end of calendar year 58.40 59.71 65.01 85.50 89.65
Table 3b. Ralcorp’s financial statements: the balance sheet.1,2
FY 2008 FY 2009 FY 2010 FY 2011 FY 2012
Cash and short-term investments 79.8 429.2 177.1 58.2 352.4 Receivables 209.1 135.9 233.4 410.4 372.1 Inventory 337.0 365.9 425.1 490.7 432.5 Other current assets 21.9 23.2 41.4 35.4 29.8
Total current assets 647.8 954.2 877.0 994.7 1,186.8 Net property, plant and equipment 903.1 913.1 1,219.0 1,195.3 896.6 Long-term investments 126.0 Goodwill 2,454.3 2,386.6 2,945.7 2,590.1 1,417.6 Other intangibles 1,189.5 1,172.2 1,727.0 1,516.5 1,000.1
Total assets 5,343.9 5,452.2 6,804.9 6,333.2 4,538.8 Accounts payable 168.0 147.6 174.2 222.8 226.3 Accrued expenditure 85.3 101.8 87.4 85.3 70.0 Short-term borrowings 36.7 65.4 71.9 168.7 108.1 Current portion of long-term debt 45.6 173.2 30.7 85.7 Other current liabilities 101.9 118.6 120.4 164.4 103.3
Total current liabilities 391.9 479.0 627.1 671.9 593.4 Long-term debt 1,668.8 1,611.4 2,464.9 2,172.5 1,894.1 Other non-current liabilities 270.1 191.6 198.6 234.0 71.0
Total liabilities 2,932.4 2,746.6 3,975.7 3,714.0 2,891.3 Common stock 0.6 0.6 0.6 0.6 0.6 Additional paid in capital 1,919.6 1,931.4 1,945.2 1,957.3 1,960.5 Retained earnings 768.9 1,059.3 1,268.1 1,080.9 78.5 Treasury stock (257.3) (244.8) (348.8) (338.9) (359.1)Comprehensive income and other (20.3) (40.9) (35.9) (80.7) (33.0)
Total equity 2,411.5 2,705.6 2,829.2 2,619.2 1,647.5 Total liabilities and equity 5,343.9 5,452.2 6,804.9 6,333.2 4,538.8
${p
roto
col}
://w
ww
.wag
enin
gena
cade
mic
.com
/doi
/10.
2243
4/IF
AM
R20
16.0
182
- Fr
iday
, Jul
y 06
, 201
8 8:
44:1
9 A
M -
IP
Add
ress
:189
.201
.178
.194
International Food and Agribusiness Management Review603
White et al. Volume 21, Issue 5, 2018
Table 3c. Ralcorp’s financial statements: selected statement of cash flows items.1,2
FY 2008 FY 2009 FY 2010 FY 2011 FY 2012
Net income 167.8 290.4 208.8 (187.2) 73.4 Depreciation and amortization total 99.5 144.7 166.8 226.5 198.8 Change in accounts receivable (86.4) 9.2 (47.7) (34.6) 20.7 Change In inventories (6.6) (9.8) (2.8) (66.6) 24.2 Change in accounts payable 115.4 (19.6) (38.4) 96.1 (74.4)
Cash from ops. 132.0 326.7 301.9 505.7 356.6 Capital expenditure (62.5) (115.0) (128.9) (141.1) (159.8)Sale of property, plant, and equipment 0.2 0.1 0.5 0.5 5.0 Cash acquisitions (20.3) (55.0) (1,312.0) (699.1)Investment in marketable and equity securities 11.6 79.7 2.0 1.8 6.2
Cash from investing (71.0) (90.2) (1,438.4) (138.8) (861.6)Short-term debt issued 4.5 27.8 6.5 2.6 Long-term debt issued - 400.0 1,076.6 800.0
Total debt issued 4.5 427.8 1,083.1 802.6 Short-term debt repaid - (8.2)Long-term debt repaid (59.7) (411.8) (95.3) (348.2) (922.0)
Total debt repaid (59.7) (411.8) (95.3) (356.4) (922.0)Issuance of common stock 3.9 15.2 9.4 13.5 17.3 Repurchase of common stock (5.6) (115.5) (1.5) (37.3)Other financing activities 0.1 (1.3) (0.2) (0.1) 900.0
Cash from financing (56.8) 29.9 881.5 (344.5) 760.6 Net change in cash 4.2 268.7 (253.5) 20.7 257.5
1 Data in Million USD, except per share figures; figures as of the end of September of every year (except stock prices, as of the end of December); data provided to authors by S&P Capital IQ (Ralcorp Original Fillings); Stock prices are adapted from CRSP (2017); figures between parentheses are negative values.2 Abbreviations: FY = fiscal year; cont. ops. = continued operations; EBT = earnings before taxes; EPS = earnings per share; EBITDA = earnings before interest, taxes, depreciation and amortization.
Table 4. Selected information of Ralcorp and peers (data provided by S&P’s Capital IQ and adapted from CRSP (2017)).1,2
Ticker symbol Debt Cash Stock price
Shares Beta EV to EBITDA
Post Holdings Inc. NYSE: POST 945.60 58.20 34.44 32.669 0.82 9.31Farmer Brothers NASDAQ: FARM 39.22 25.79 13.71 15.397 1.21 12.25Treehouse Foods Inc. NYSE: THS 900.04 94.41 58.23 36.198 0.55 9.87McCormick & Co. Inc. NYSE: MKC 1,171.90 95.70 61.87 132.678 0.61 13.65Dean Foods Co. NYSE: DF 3,197.87 78.98 32.36 92.961 0.81 7.90Ralcorp NYSE: RAH 2,087.90 352.40 88.94 55.049 0.40 11.07
1 Data, as of the end of 2012, expressed in million USD, except stock prices (USD) and betas. Betas are estimated by authors using daily prices from 01/01/2010 to 12/31/2012 (except for Post-Holding, for which no complete data was available for that period), to exclude the effects of the financial recession.2 Enterprise Value (EV) to earnings before interest, taxes, depreciation and amortization (EBITDA) multiples are average estimations by S&P’s Capital IQ, using last twelve months EBITDA.
${p
roto
col}
://w
ww
.wag
enin
gena
cade
mic
.com
/doi
/10.
2243
4/IF
AM
R20
16.0
182
- Fr
iday
, Jul
y 06
, 201
8 8:
44:1
9 A
M -
IP
Add
ress
:189
.201
.178
.194
International Food and Agribusiness Management Review604
White et al. Volume 21, Issue 5, 2018
breakfast cereal company (Ralcorp divested Post Foods during the first quarter of 2012.) American Italian Pasta, a manufacturer of dry pasta and noodles, was acquired in July 2010 for $1,255.3 million.
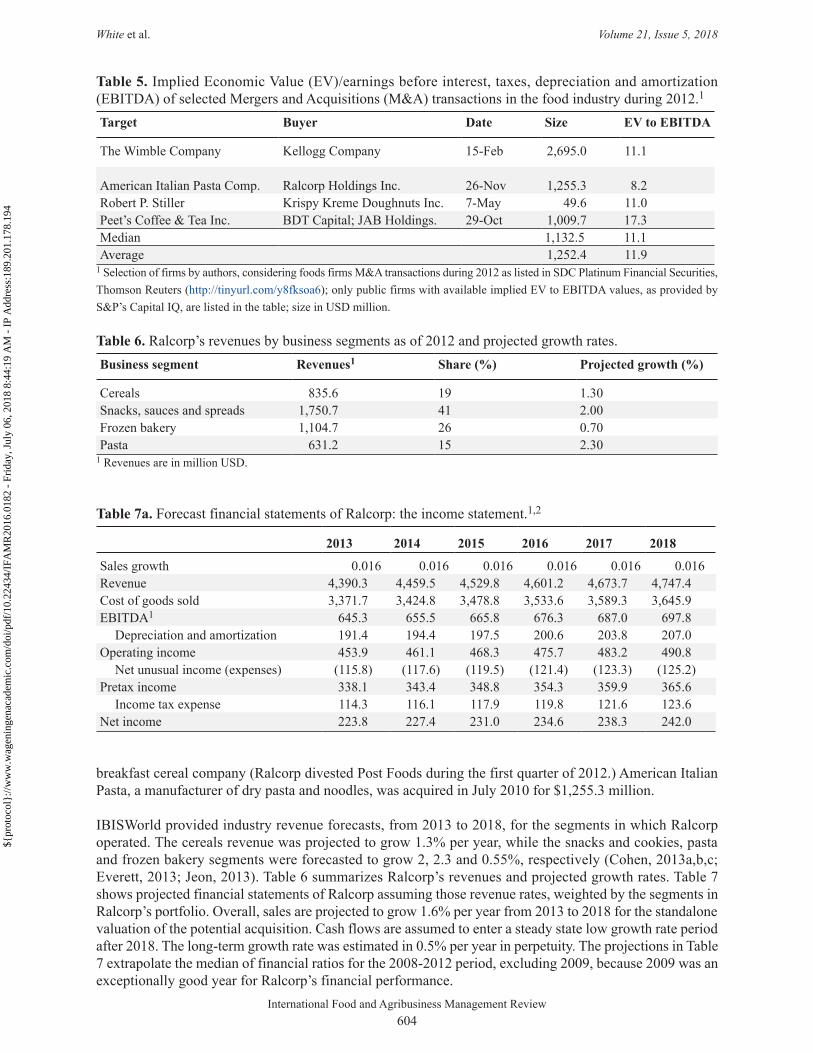
IBISWorld provided industry revenue forecasts, from 2013 to 2018, for the segments in which Ralcorp operated. The cereals revenue was projected to grow 1.3% per year, while the snacks and cookies, pasta and frozen bakery segments were forecasted to grow 2, 2.3 and 0.55%, respectively (Cohen, 2013a,b,c; Everett, 2013; Jeon, 2013). Table 6 summarizes Ralcorp’s revenues and projected growth rates. Table 7 shows projected financial statements of Ralcorp assuming those revenue rates, weighted by the segments in Ralcorp’s portfolio. Overall, sales are projected to grow 1.6% per year from 2013 to 2018 for the standalone valuation of the potential acquisition. Cash flows are assumed to enter a steady state low growth rate period after 2018. The long-term growth rate was estimated in 0.5% per year in perpetuity. The projections in Table 7 extrapolate the median of financial ratios for the 2008-2012 period, excluding 2009, because 2009 was an exceptionally good year for Ralcorp’s financial performance.
Table 5. Implied Economic Value (EV)/earnings before interest, taxes, depreciation and amortization (EBITDA) of selected Mergers and Acquisitions (M&A) transactions in the food industry during 2012.1
Target Buyer Date Size EV to EBITDA
The Wimble Company Kellogg Company 15-Feb 2,695.0 11.1
American Italian Pasta Comp. Ralcorp Holdings Inc. 26-Nov 1,255.3 8.2Robert P. Stiller Krispy Kreme Doughnuts Inc. 7-May 49.6 11.0Peet’s Coffee & Tea Inc. BDT Capital; JAB Holdings. 29-Oct 1,009.7 17.3Median 1,132.5 11.1Average 1,252.4 11.9
1 Selection of firms by authors, considering foods firms M&A transactions during 2012 as listed in SDC Platinum Financial Securities, Thomson Reuters (http://tinyurl.com/y8fksoa6); only public firms with available implied EV to EBITDA values, as provided by S&P’s Capital IQ, are listed in the table; size in USD million.
Table 6. Ralcorp’s revenues by business segments as of 2012 and projected growth rates.Business segment Revenues1 Share (%) Projected growth (%)
Cereals 835.6 19 1.30Snacks, sauces and spreads 1,750.7 41 2.00Frozen bakery 1,104.7 26 0.70Pasta 631.2 15 2.30
1 Revenues are in million USD.
Table 7a. Forecast financial statements of Ralcorp: the income statement.1,2
2013 2014 2015 2016 2017 2018
Sales growth 0.016 0.016 0.016 0.016 0.016 0.016Revenue 4,390.3 4,459.5 4,529.8 4,601.2 4,673.7 4,747.4 Cost of goods sold 3,371.7 3,424.8 3,478.8 3,533.6 3,589.3 3,645.9 EBITDA1 645.3 655.5 665.8 676.3 687.0 697.8
Depreciation and amortization 191.4 194.4 197.5 200.6 203.8 207.0 Operating income 453.9 461.1 468.3 475.7 483.2 490.8
Net unusual income (expenses) (115.8) (117.6) (119.5) (121.4) (123.3) (125.2)Pretax income 338.1 343.4 348.8 354.3 359.9 365.6
Income tax expense 114.3 116.1 117.9 119.8 121.6 123.6 Net income 223.8 227.4 231.0 234.6 238.3 242.0
${p
roto
col}
://w
ww
.wag
enin
gena
cade
mic
.com
/doi
/10.
2243
4/IF
AM
R20
16.0
182
- Fr
iday
, Jul
y 06
, 201
8 8:
44:1
9 A
M -
IP
Add
ress
:189
.201
.178
.194
International Food and Agribusiness Management Review605
White et al. Volume 21, Issue 5, 2018
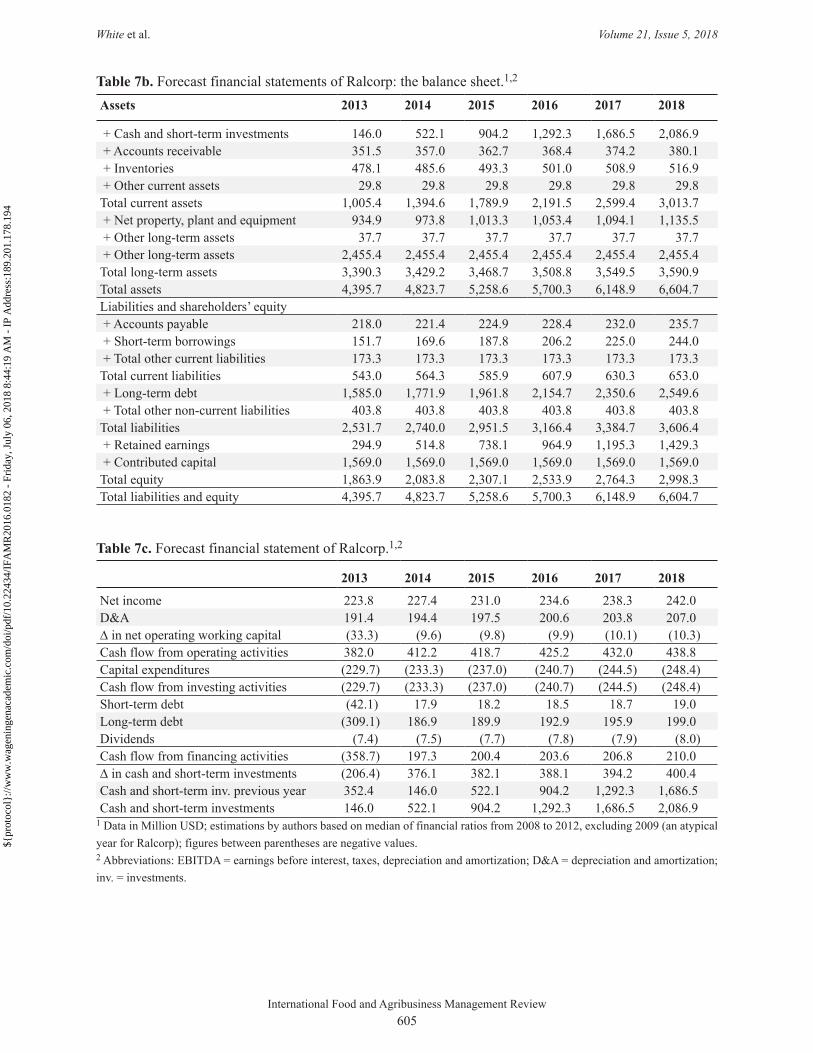
Table 7b. Forecast financial statements of Ralcorp: the balance sheet.1,2
Assets 2013 2014 2015 2016 2017 2018
+ Cash and short-term investments 146.0 522.1 904.2 1,292.3 1,686.5 2,086.9 + Accounts receivable 351.5 357.0 362.7 368.4 374.2 380.1 + Inventories 478.1 485.6 493.3 501.0 508.9 516.9 + Other current assets 29.8 29.8 29.8 29.8 29.8 29.8 Total current assets 1,005.4 1,394.6 1,789.9 2,191.5 2,599.4 3,013.7 + Net property, plant and equipment 934.9 973.8 1,013.3 1,053.4 1,094.1 1,135.5 + Other long-term assets 37.7 37.7 37.7 37.7 37.7 37.7 + Other long-term assets 2,455.4 2,455.4 2,455.4 2,455.4 2,455.4 2,455.4 Total long-term assets 3,390.3 3,429.2 3,468.7 3,508.8 3,549.5 3,590.9 Total assets 4,395.7 4,823.7 5,258.6 5,700.3 6,148.9 6,604.7 Liabilities and shareholders’ equity + Accounts payable 218.0 221.4 224.9 228.4 232.0 235.7 + Short-term borrowings 151.7 169.6 187.8 206.2 225.0 244.0 + Total other current liabilities 173.3 173.3 173.3 173.3 173.3 173.3 Total current liabilities 543.0 564.3 585.9 607.9 630.3 653.0 + Long-term debt 1,585.0 1,771.9 1,961.8 2,154.7 2,350.6 2,549.6 + Total other non-current liabilities 403.8 403.8 403.8 403.8 403.8 403.8 Total liabilities 2,531.7 2,740.0 2,951.5 3,166.4 3,384.7 3,606.4 + Retained earnings 294.9 514.8 738.1 964.9 1,195.3 1,429.3 + Contributed capital 1,569.0 1,569.0 1,569.0 1,569.0 1,569.0 1,569.0 Total equity 1,863.9 2,083.8 2,307.1 2,533.9 2,764.3 2,998.3 Total liabilities and equity 4,395.7 4,823.7 5,258.6 5,700.3 6,148.9 6,604.7
Table 7c. Forecast financial statement of Ralcorp.1,2
2013 2014 2015 2016 2017 2018
Net income 223.8 227.4 231.0 234.6 238.3 242.0 D&A 191.4 194.4 197.5 200.6 203.8 207.0 ∆ in net operating working capital (33.3) (9.6) (9.8) (9.9) (10.1) (10.3)Cash flow from operating activities 382.0 412.2 418.7 425.2 432.0 438.8 Capital expenditures (229.7) (233.3) (237.0) (240.7) (244.5) (248.4)Cash flow from investing activities (229.7) (233.3) (237.0) (240.7) (244.5) (248.4)Short-term debt (42.1) 17.9 18.2 18.5 18.7 19.0 Long-term debt (309.1) 186.9 189.9 192.9 195.9 199.0 Dividends (7.4) (7.5) (7.7) (7.8) (7.9) (8.0)Cash flow from financing activities (358.7) 197.3 200.4 203.6 206.8 210.0 ∆ in cash and short-term investments (206.4) 376.1 382.1 388.1 394.2 400.4 Cash and short-term inv. previous year 352.4 146.0 522.1 904.2 1,292.3 1,686.5 Cash and short-term investments 146.0 522.1 904.2 1,292.3 1,686.5 2,086.9
1 Data in Million USD; estimations by authors based on median of financial ratios from 2008 to 2012, excluding 2009 (an atypical year for Ralcorp); figures between parentheses are negative values.2 Abbreviations: EBITDA = earnings before interest, taxes, depreciation and amortization; D&A = depreciation and amortization; inv. = investments.
${p
roto
col}
://w
ww
.wag
enin
gena
cade
mic
.com
/doi
/10.
2243
4/IF
AM
R20
16.0
182
- Fr
iday
, Jul
y 06
, 201
8 8:
44:1
9 A
M -
IP
Add
ress
:189
.201
.178
.194
International Food and Agribusiness Management Review606
White et al. Volume 21, Issue 5, 2018
5.3 Competition
According to IBISWorld, while the segments on which Ralcorp operated (e.g. snacks, cereals, etc.) were dominated by well-known brand names, low-priced private brands constituted a growing category in those segments. New firms entering these business segments would need heavy investments in fixed assets to compete with the established large food manufacturers. Regarding market concentration, in the snacks segment four firms accounted for 43% of revenue, while four firms captured 55% of revenue in the cookie, pasta, and crackers segment. In the cereals segment, four top competitors held 69% of revenues. Cereal production was highly capital intensive, and agribusinesses in this segment competed on price, quality, product innovation and differentiation.
6. ConAgra financing and opportunity cost
For its short-term financing, ConAgra used bank loans, commercial paper and bankers’ acceptances. In 2012, the firm had about $40 million outstanding in commercial paper, carrying an interest rate of 0.26%. ConAgra had long-term debt as outlined in Table 2. The most restrictive debt covenants, from ConAgra’s revolving credit facility and some of its privately-placed long-term debt, required that consolidated debt not exceed 65% of the firm’s capital base and that the fixed charges coverage ratio be greater than 1.75×. ConAgra was in compliance with these covenants, with net interest expense of $204 million in 2012.
The rate of return on long-term U.S. Treasury bonds was about 2% at the end of 2012 (specifically, the rate for the 10-year US Treasury bond was 1.78%, for 20 years 2.54%, and 2.95% for 30 years (U.S. Department of the Treasury, 2013), and analysts, on average, were using a market premium (e.g. the difference between the overall market return and Treasury rates) of 6% for their equity return estimates (Brotherson et al., 2013).4 ConAgra estimated that new, long-term senior debt could be issued at an interest rate of 3.25%. Long-term debt was used to finance base working capital needs and long-term assets. According to financial theory, the opportunity cost at which the projected free cash flows are discounted to estimate the potential acquisition value, should be estimated using the risk of the target firm or the risk of the industry in which the target operates, and the capital structure weights and the cost of debt of the acquiring company. Given the size of the potential acquisition, the capital structure of ConAgra might or might not change if the firm decided to acquire Ralcorp.
7. What next?
Jordan’s manager needed a preliminary financial analysis of the potential acquisition. Jordan realized this would be a major decision with equally major consequences for the firm’s future. Ralcorp, with revenue and assets representing about one third of ConAgra’s, was large enough to impact business operations and the financial structure of this firm. What range of values might be reasonable to pay for Ralcorp? How should the acquisition be financed? What would be the risks of acquiring Ralcorp? Would the acquisition provide the ingredient ConAgra needed for its ‘recipe for success’?
4 According to Brotherson et al. (2013), the historical average (1926 to 2011) risk premium used by analysts ranged from 3.9 to 8.2% depending on the estimation method and the security chosen as risk free rate. By using the arithmetic mean, the risk premium was 8.2% (relative to Treasury bills) and 5.7% (relative to Treasury bonds). When the geometric mean was preferred, the risk premium was 6% (T-bills) and 3.9% (T-bonds).
${p
roto
col}
://w
ww
.wag
enin
gena
cade
mic
.com
/doi
/10.
2243
4/IF
AM
R20
16.0
182
- Fr
iday
, Jul
y 06
, 201
8 8:
44:1
9 A
M -
IP
Add
ress
:189
.201
.178
.194
International Food and Agribusiness Management Review607
White et al. Volume 21, Issue 5, 2018
References
AMG Strategic Advisors. 2013. Share of consumers that buy more private label than branded products in the United States in 2013, by generation. Available at: http://tinyurl.com/yd7rwygf.
Brotherson, T., K. Eades, R. Harris and R. Higgins. 2013. ‘Best practices’ in estimating the cost of capital: an update. Journal of Applied Finance 1: 1-19.
Cohen, J. 2013a. Snack on: producers will adapt to changing diets and food preferences to boost growth. IBISWorld. Industry Report 31191: 1-32. Available at: http://tinyurl.com/yb5aa6do.
Cohen, J. 2013b. Healthy habits: Demand for breakfast bars and healthy cereals will enable modest growth. IBISWorld. Industry Report 31123: 1-38. Available at: http://tinyurl.com/yb5aa6do.
Cohen, J. 2013c. Smart cookie: revenue will increase as producers target health-conscious consumers. IBISWorld. Industry Report 31182: 1-35. Available at: http://tinyurl.com/yb5aa6do.
ConAgra. 2017. The 2016 10K for ConAgra. Available at: http://tinyurl.com/ya5juwvg.CRSP. 2017. Center for Research in Security Prices by Standard & Poor’s. Database available at: http://
tinyurl.com/7ja42y7.Dubé, J., G. Hitsh and P. Rossi. 2015. Income and wealth effects on private-label demand: evidence from
the great recession. Available at: http://tinyurl.com/yco4476m.Euromonitor. 2013. The struggle for shelf space: how private label is impacting food brands. Available at:
http://tinyurl.com/ycoa2egy.Everett, N. 2013. Keeping cool: revenue will grow marginally as producers focus on convenience and health.
IBISWorld. Industry Report 31141: 1-40. Available at: http://tinyurl.com/yb5aa6do.Goldberg, R. and M. Shelman. 2007. ConAgra Foods: the next chapter. Harvard Business School Case 906-
409. Harvard Business School Publishing, Brighton, MA, USA.Jeon, H. 2013. Flour power: demand for nutrient-enriched breads will modestly boost revenue. IBISWorld.
Industry Report 31181: 1-37. Available at: http://tinyurl.com/yb5aa6do.MarketLine. 2015. Company Profile ConAgra Foods, Inc. Company SWOT analysis report, reference code:
61822F35-7A80-41E2-BCFA-5E8A63386140. Available at: http://tinyurl.com/yakox6e5.National Grocers Association. 2017. U.S. consumers’ importance of private label or store brands when
selecting their primary grocery store in 2013 and 2014. Available at: http://tinyurl.com/yap8vesr.Neff, J. 2009. Why WalMart’s great value changes the game. AdvertisingAge, September 7, 2009. Available
at: http://tinyurl.com/y73jblvj.Nielsen Scarborough. 2012. Any store brand or private label food use: number of people living in households
that consumed any store brand or private label food within the last 30 days in the United States (USA) from autumn 2009 to autumn 2012 (in millions). Available at: http://tinyurl.com/yceao9vb.
PLBuyer. 2013a. Percentage of private label food sales among the leading 15 North American retailers in 2013. Available at: http://tinyurl.com/yd936fp8.
PLBuyer. 2013b. Private label sales of the leading 15 private label retailers in North America in 2013 (in billion U.S. dollars). Available at: http://tinyurl.com/y9x3qacj.
Straczynski, S. 2009. Nielsen: U.S. private label sales up 7.4%, Brandweek, Nielsen Business Media. Available at: http://tinyurl.com/yc8uamtx.
U.S. Department of the Treasury. 2013. Daily treasury yield curve rates – 2012. Available at: http://tinyurl.com/zbb5zfd.
Volpe, R. 2011. The relationship between national brand and private label food products. USDA Economic Research Service. Available at: http://tinyurl.com/ydhfnyax.
Wong, E. 2011. Why Wal-Mart’s great value revamp is a smart private label move. Forbes, January 20. Available at: http://tinyurl.com/yadb7vjk.
${p
roto
col}
://w
ww
.wag
enin
gena
cade
mic
.com
/doi
/10.
2243
4/IF
AM
R20
16.0
182
- Fr
iday
, Jul
y 06
, 201
8 8:
44:1
9 A
M -
IP
Add
ress
:189
.201
.178
.194

${p
roto
col}
://w
ww
.wag
enin
gena
cade
mic
.com
/doi
/10.
2243
4/IF
AM
R20
16.0
182
- Fr
iday
, Jul
y 06
, 201
8 8:
44:1
9 A
M -
IP
Add
ress
:189
.201
.178
.194


![[RECIPE] Korean Potato Pancake](https://img.pdfslide.net/doc/110x75/63136f91fc260b71020f1802/recipe-korean-potato-pancake.jpg)


