Embed Size (px)
Citation preview
Dn
Sa
Db
a
ARRA
KSsACDP
1
tbnsabettnoopcrree
m
1d
Spectrochimica Acta Part A 73 (2009) 382–387
Contents lists available at ScienceDirect
Spectrochimica Acta Part A: Molecular andBiomolecular Spectroscopy
journa l homepage: www.e lsev ier .com/ locate /saa
FT study of adsorption site effect on surface-enhanced Raman scattering ofeutral and charged pyridine–Ag4 complexes
hasha Liua, Xiaohong Zhaoa, Yuanzuo Lia, Maodu Chena,∗, Mengtao Sunb,∗
School of Physics & Optoelectronic Technology, School of Chemical Engineering and College of Advanced Science and Technology,alian University of Technology, Dalian 116024, PR ChinaBeijing National Laboratory for Condensed Matter Physics, Institute of Physics, Chinese Academy of Sciences, Beijing 100080, PR China
r t i c l e i n f o
rticle history:eceived 27 October 2008eceived in revised form 11 February 2009ccepted 20 February 2009
eywords:
a b s t r a c t
Density functional theory (DFT) and time-dependent DFT (TDDFT) methods have been used to investi-gate the adsorption site effect of Raman scattering for neutral and charged pyridine–Ag4 complexes. Thecalculated results show that the SERS spectra are strongly dependent on adsorption site and the configu-ration of new complexes. The normal Raman spectra of neutral and charged pyridine–Ag4 complexes aresimilar with that of isolated pyridine but with an enhancement factor below 10 times. This enhancement
urface-enhanced Raman scatteringpectrumdsorption site effectharge-transfer excited stateFTyridine–silver complexes
is ascribed to ground state chemical enhancement. The pre-surface-enhanced Raman scattering (SERS)spectra were calculated at 1256 nm, 769 nm and 744.3 nm, which are nearly resonant with the chargetransfer excited states S2 for neutral and charged pyridine–Ag4 complexes, respectively. We obtain theenhancement factor about 104 to 105 in pre-SERS spectra which is mainly caused by charge transfer res-onance Raman enhancement. The three-dimensional cube representation is also applied to describe thephotoinduced CT, which are considered as direct evidence of chemical enhancement, between pyridine
luster
and two isomers of Ag4 c. Introduction
The Raman intensity of pyridine was strongly enhanced whenhe molecular adsorbed on rough silver surface which was foundy Albrecht et al. and Van Duyne et al. in 1977 [1–3]. This phe-omenon was commonly said to be surface-enhanced Ramancattering (SERS) spectra which enhanced the Raman intensity byt least 14 orders of magnitude. Because of the significant contri-ution on the vibrational spectra, the mechanisms of such hugenhancement have been referred to in a large number of inves-igations [4–7]. Two kinds of mechanisms are mainly resulted inhe huge enhancement of SERS spectra [5–10]. The electromag-etic (EM) enhancement mechanism results from the excitationf surface plasmon resonance with incident light [11–13]. On thether hand, the chemical mechanism (CM) enhancement is com-licated and roughly divided into three parts: (1) ground statehemical enhancement is caused by the change of chemical envi-
onment around the molecular; (2) resonant Raman enhancementesults from resonant between a molecule transition and thexcitation wavelength. (3) Charge transfer (CT) resonance Ramannhancement is produced by the excitation wavelength resonant∗ Corresponding authors.E-mail addresses: [email protected] (M. Chen),
[email protected] (M. Sun).
386-1425/$ – see front matter © 2009 Elsevier B.V. All rights reserved.oi:10.1016/j.saa.2009.02.036
s.© 2009 Elsevier B.V. All rights reserved.
with new transition states between metal and adsorbed molecular[3,10,14–18].
Large numbers of theoretical studies have been carried outto elucidate the mechanism of SERS [10,16,19–24]. Tian andco-workers presented a computation of the differential Ramanscattering cross-section of totally symmetric vibrational modes ofpyridine and pyridine–metal clusters [25]. They found that dueto the weak bonding for pyridine–silver complexes, the chemicalinteraction did not influence the relative intensities of the Ramanpeaks of modes �1 and �12. In 2006, pyridine–Ag20 model sys-tem was put forward by Schatz and co-workers, and they analyzedenhanced Raman scattering using time-dependent density func-tional theory (TDDFT) method in detail [14]. Results showed astrong dependence of the absolute and relative intensities on theadsorption site and incident light. They presented a general pro-file of different contributions to the enhancements, involving staticchemical enhancements (factor of 10), charge-transfer enhance-ments (103) and EM enhancements (105). Recently, Cardini et al.[26] reported that an improvement of pyridine adsorbed on silverclusters with different charges and considered the coadsorption ofchloride anions effect in SERS. They pointed out the strong CT effect
between pyridine and silver clusters are closely related with theformation of both in the absence and presence of coadsorbed chlo-ride anions. Those previous work mentioned above have providedsome understandings of the enhancement mechanism of SERS,but the adsorption site effect on the Raman intensity of pyridine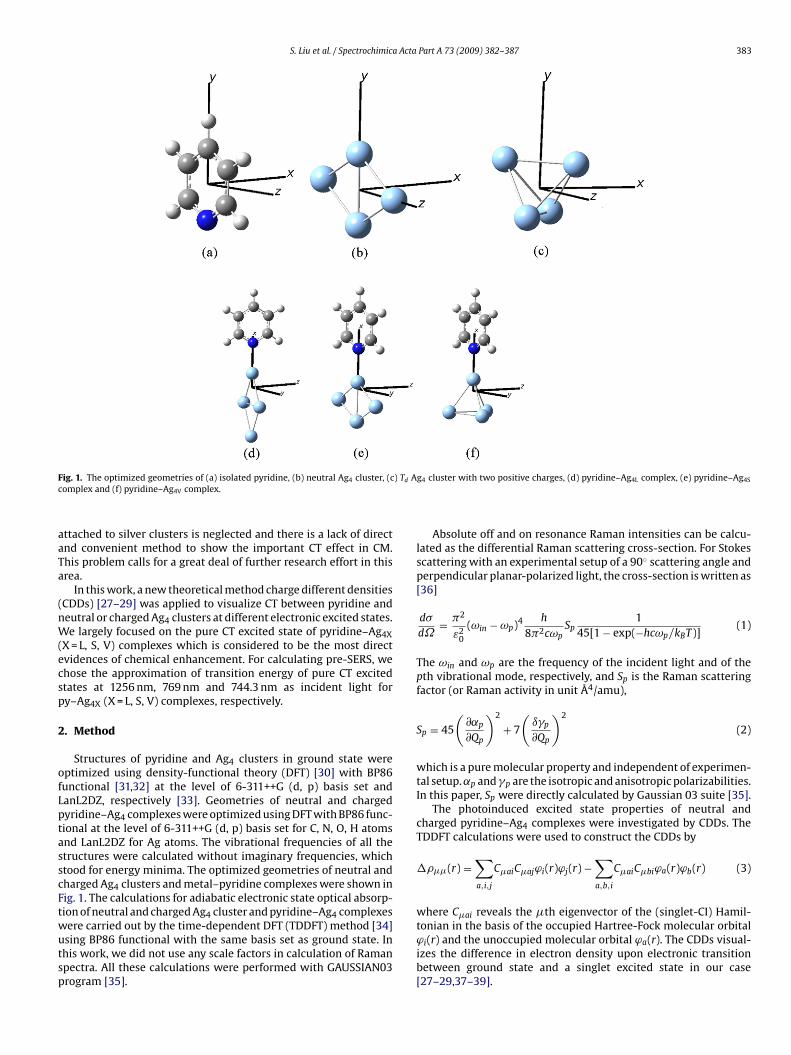
S. Liu et al. / Spectrochimica Acta Part A 73 (2009) 382–387 383
F ) Td Ac
aaTa
(nW(ecsp
2
ofLptasscFtwutsp
a,i,j a,b,i
where Cai reveals the th eigenvector of the (singlet-CI) Hamil-
ig. 1. The optimized geometries of (a) isolated pyridine, (b) neutral Ag4 cluster, (complex and (f) pyridine–Ag4V complex.
ttached to silver clusters is neglected and there is a lack of directnd convenient method to show the important CT effect in CM.his problem calls for a great deal of further research effort in thisrea.
In this work, a new theoretical method charge different densitiesCDDs) [27–29] was applied to visualize CT between pyridine andeutral or charged Ag4 clusters at different electronic excited states.e largely focused on the pure CT excited state of pyridine–Ag4X
X = L, S, V) complexes which is considered to be the most directvidences of chemical enhancement. For calculating pre-SERS, wehose the approximation of transition energy of pure CT excitedtates at 1256 nm, 769 nm and 744.3 nm as incident light fory–Ag4X (X = L, S, V) complexes, respectively.
. Method
Structures of pyridine and Ag4 clusters in ground state wereptimized using density-functional theory (DFT) [30] with BP86unctional [31,32] at the level of 6-311++G (d, p) basis set andanL2DZ, respectively [33]. Geometries of neutral and chargedyridine–Ag4 complexes were optimized using DFT with BP86 func-ional at the level of 6-311++G (d, p) basis set for C, N, O, H atomsnd LanL2DZ for Ag atoms. The vibrational frequencies of all thetructures were calculated without imaginary frequencies, whichtood for energy minima. The optimized geometries of neutral andharged Ag4 clusters and metal–pyridine complexes were shown inig. 1. The calculations for adiabatic electronic state optical absorp-ion of neutral and charged Ag4 cluster and pyridine–Ag4 complexes
ere carried out by the time-dependent DFT (TDDFT) method [34]sing BP86 functional with the same basis set as ground state. Inhis work, we did not use any scale factors in calculation of Ramanpectra. All these calculations were performed with GAUSSIAN03rogram [35].g4 cluster with two positive charges, (d) pyridine–Ag4L complex, (e) pyridine–Ag4S
Absolute off and on resonance Raman intensities can be calcu-lated as the differential Raman scattering cross-section. For Stokesscattering with an experimental setup of a 90◦ scattering angle andperpendicular planar-polarized light, the cross-section is written as[36]
d�
d˝= �2
ε20
(ωin − ωp)4 h
8�2cωpSp
145[1 − exp(−hcωp/kBT)]
(1)
The ωin and ωp are the frequency of the incident light and of thepth vibrational mode, respectively, and Sp is the Raman scatteringfactor (or Raman activity in unit Å4/amu),
Sp = 45
(∂˛p
∂Qp
)2
+ 7
(ı�p
∂Qp
)2
(2)
which is a pure molecular property and independent of experimen-tal setup. ˛p and �p are the isotropic and anisotropic polarizabilities.In this paper, Sp were directly calculated by Gaussian 03 suite [35].
The photoinduced excited state properties of neutral andcharged pyridine–Ag4 complexes were investigated by CDDs. TheTDDFT calculations were used to construct the CDDs by
�(r) =∑
CaiCajϕi(r)ϕj(r) −∑
CaiCbiϕa(r)ϕb(r) (3)
tonian in the basis of the occupied Hartree-Fock molecular orbitalϕi(r) and the unoccupied molecular orbital ϕa(r). The CDDs visual-izes the difference in electron density upon electronic transitionbetween ground state and a singlet excited state in our case[27–29,37–39].
384 S. Liu et al. / Spectrochimica Acta Part A 73 (2009) 382–387
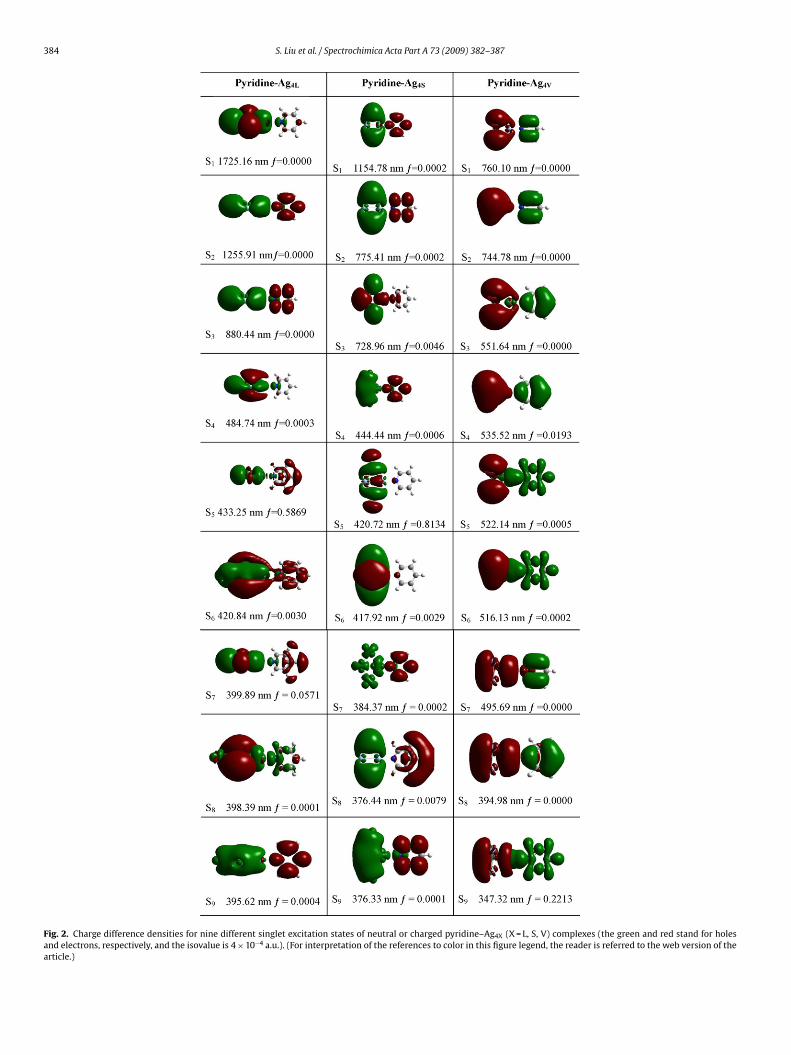
Fig. 2. Charge difference densities for nine different singlet excitation states of neutral or charged pyridine–Ag4X (X = L, S, V) complexes (the green and red stand for holesand electrons, respectively, and the isovalue is 4 × 10⁻⁴ a.u.). (For interpretation of the references to color in this figure legend, the reader is referred to the web version of thearticle.)
S. Liu et al. / Spectrochimica Acta Part A 73 (2009) 382–387 385
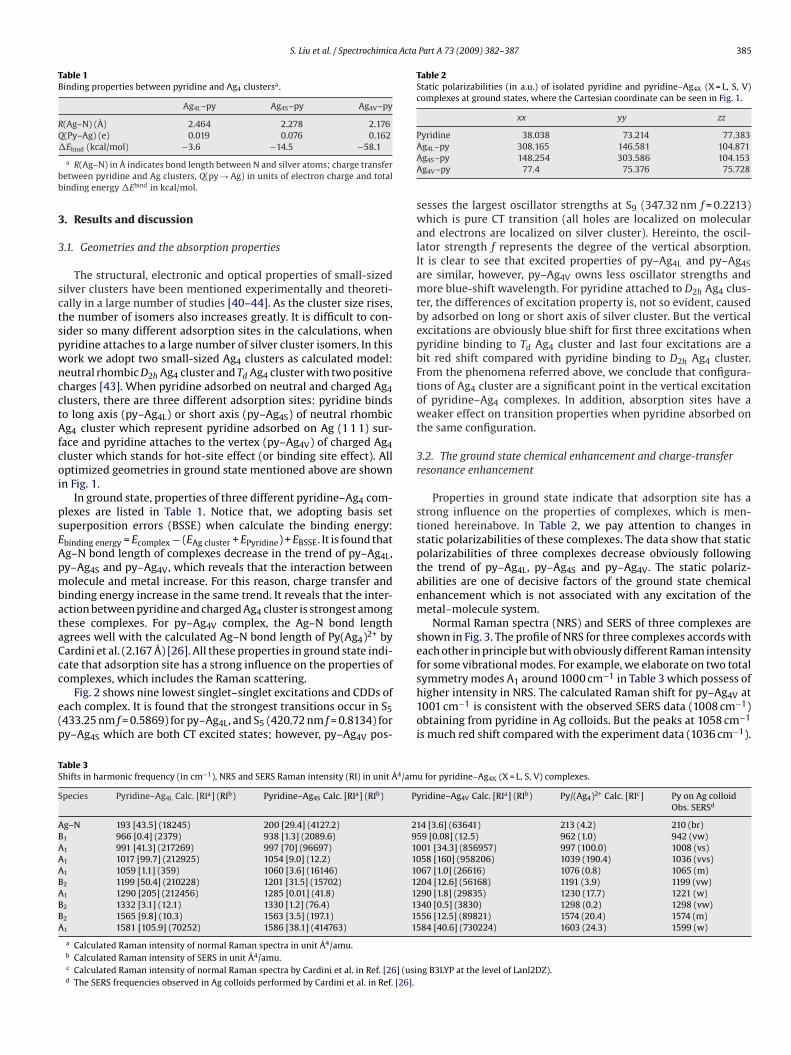
Table 1Binding properties between pyridine and Ag4 clustersa.
Ag4L–py Ag4S–py Ag4V–py
R(Ag–N) (Å) 2.464 2.278 2.176Q(Py–Ag) (e) 0.019 0.076 0.162�Ebind (kcal/mol) −3.6 −14.5 −58.1
bb
3
3
sctspwncctAfcoi
psEApmbataCcc
e(p
Table 2Static polarizabilities (in a.u.) of isolated pyridine and pyridine–Ag4X (X = L, S, V)complexes at ground states, where the Cartesian coordinate can be seen in Fig. 1.
xx yy zz
Pyridine 38.038 73.214 77.383
TS
S
ABAAABABBA
a R(Ag–N) in Å indicates bond length between N and silver atoms; charge transferetween pyridine and Ag clusters, Q(py → Ag) in units of electron charge and totalinding energy �Ebind in kcal/mol.
. Results and discussion
.1. Geometries and the absorption properties
The structural, electronic and optical properties of small-sizedilver clusters have been mentioned experimentally and theoreti-ally in a large number of studies [40–44]. As the cluster size rises,he number of isomers also increases greatly. It is difficult to con-ider so many different adsorption sites in the calculations, whenyridine attaches to a large number of silver cluster isomers. In thisork we adopt two small-sized Ag4 clusters as calculated model:eutral rhombic D2h Ag4 cluster and Td Ag4 cluster with two positiveharges [43]. When pyridine adsorbed on neutral and charged Ag4lusters, there are three different adsorption sites: pyridine bindso long axis (py–Ag4L) or short axis (py–Ag4S) of neutral rhombicg4 cluster which represent pyridine adsorbed on Ag (1 1 1) sur-
ace and pyridine attaches to the vertex (py–Ag4V) of charged Ag4luster which stands for hot-site effect (or binding site effect). Allptimized geometries in ground state mentioned above are shownn Fig. 1.
In ground state, properties of three different pyridine–Ag4 com-lexes are listed in Table 1. Notice that, we adopting basis setuperposition errors (BSSE) when calculate the binding energy:binding energy = Ecomplex − (EAg cluster + EPyridine) + EBSSE. It is found thatg–N bond length of complexes decrease in the trend of py–Ag4L,y–Ag4S and py–Ag4V, which reveals that the interaction betweenolecule and metal increase. For this reason, charge transfer and
inding energy increase in the same trend. It reveals that the inter-ction between pyridine and charged Ag4 cluster is strongest amonghese complexes. For py–Ag4V complex, the Ag–N bond lengthgrees well with the calculated Ag–N bond length of Py(Ag4)2+ byardini et al. (2.167 Å) [26]. All these properties in ground state indi-ate that adsorption site has a strong influence on the properties of
omplexes, which includes the Raman scattering.Fig. 2 shows nine lowest singlet–singlet excitations and CDDs ofach complex. It is found that the strongest transitions occur in S5433.25 nm f = 0.5869) for py–Ag4L, and S5 (420.72 nm f = 0.8134) fory–Ag4S which are both CT excited states; however, py–Ag4V pos-
able 3hifts in harmonic frequency (in cm−1), NRS and SERS Raman intensity (RI) in unit Å4/am
pecies Pyridine–Ag4L Calc. [RIa] (RIb) Pyridine–Ag4S Calc. [RIa] (RIb) P
g–N 193 [43.5] (18245) 200 [29.4] (4127.2) 211 966 [0.4] (2379) 938 [1.3] (2089.6) 91 991 [41.3] (217269) 997 [70] (96697) 101 1017 [99.7] (212925) 1054 [9.0] (12.2) 101 1059 [1.1] (359) 1060 [3.6] (16146) 102 1199 [50.4] (210228) 1201 [31.5] (15702) 121 1290 [205] (212456) 1285 [0.01] (41.8) 122 1332 [3.1] (12.1) 1330 [1.2] (76.4) 132 1565 [9.8] (10.3) 1563 [3.5] (197.1) 151 1581 [105.9] (70252) 1586 [38.1] (414763) 15
a Calculated Raman intensity of normal Raman spectra in unit Å4/amu.b Calculated Raman intensity of SERS in unit Å4/amu.c Calculated Raman intensity of normal Raman spectra by Cardini et al. in Ref. [26] (usid The SERS frequencies observed in Ag colloids performed by Cardini et al. in Ref. [26].
Ag4L–py 308.165 146.581 104.871Ag4S–py 148.254 303.586 104.153Ag4V–py 77.4 75.376 75.728
sesses the largest oscillator strengths at S9 (347.32 nm f = 0.2213)which is pure CT transition (all holes are localized on molecularand electrons are localized on silver cluster). Hereinto, the oscil-lator strength f represents the degree of the vertical absorption.It is clear to see that excited properties of py–Ag4L and py–Ag4Sare similar, however, py–Ag4V owns less oscillator strengths andmore blue-shift wavelength. For pyridine attached to D2h Ag4 clus-ter, the differences of excitation property is, not so evident, causedby adsorbed on long or short axis of silver cluster. But the verticalexcitations are obviously blue shift for first three excitations whenpyridine binding to Td Ag4 cluster and last four excitations are abit red shift compared with pyridine binding to D2h Ag4 cluster.From the phenomena referred above, we conclude that configura-tions of Ag4 cluster are a significant point in the vertical excitationof pyridine–Ag4 complexes. In addition, absorption sites have aweaker effect on transition properties when pyridine absorbed onthe same configuration.
3.2. The ground state chemical enhancement and charge-transferresonance enhancement
Properties in ground state indicate that adsorption site has astrong influence on the properties of complexes, which is men-tioned hereinabove. In Table 2, we pay attention to changes instatic polarizabilities of these complexes. The data show that staticpolarizabilities of three complexes decrease obviously followingthe trend of py–Ag4L, py–Ag4S and py–Ag4V. The static polariz-abilities are one of decisive factors of the ground state chemicalenhancement which is not associated with any excitation of themetal–molecule system.
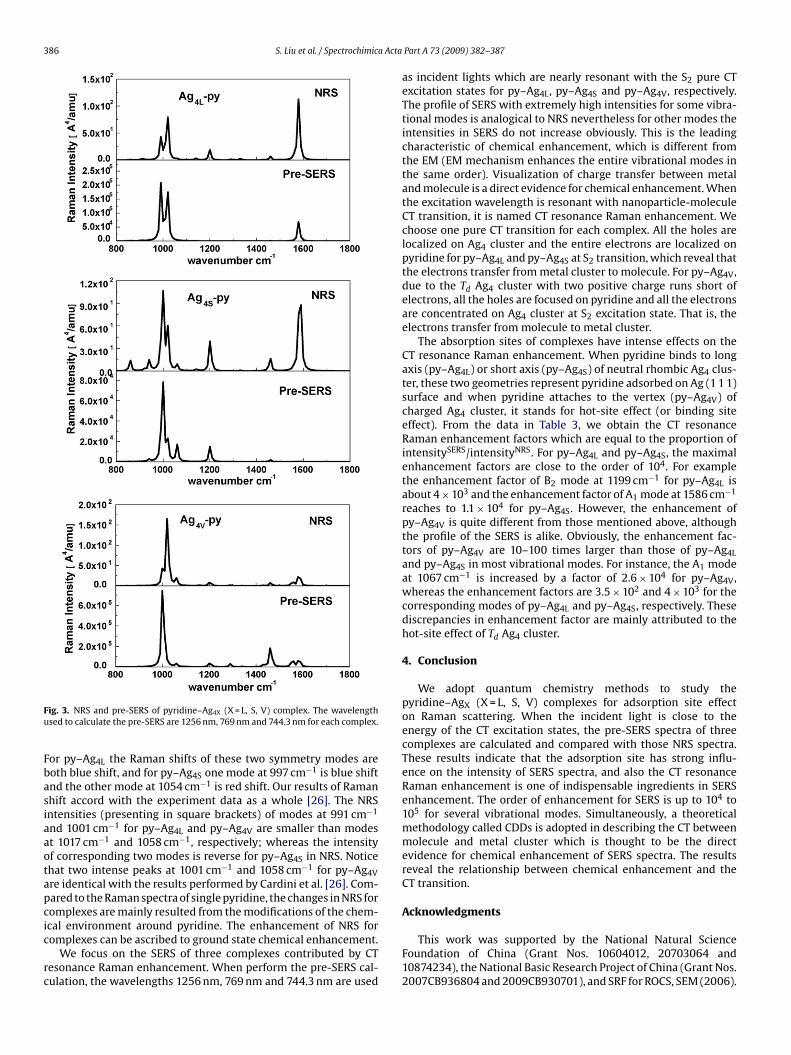
Normal Raman spectra (NRS) and SERS of three complexes areshown in Fig. 3. The profile of NRS for three complexes accords witheach other in principle but with obviously different Raman intensityfor some vibrational modes. For example, we elaborate on two total
symmetry modes A1 around 1000 cm−1 in Table 3 which possess ofhigher intensity in NRS. The calculated Raman shift for py–Ag4V at1001 cm−1 is consistent with the observed SERS data (1008 cm−1)obtaining from pyridine in Ag colloids. But the peaks at 1058 cm−1is much red shift compared with the experiment data (1036 cm−1).
u for pyridine–Ag4X (X = L, S, V) complexes.
yridine–Ag4V Calc. [RIa] (RIb) Py/(Ag4)2+ Calc. [RIc] Py on Ag colloidObs. SERSd
4 [3.6] (63641) 213 (4.2) 210 (br)59 [0.08] (12.5) 962 (1.0) 942 (vw)
01 [34.3] (856957) 997 (100.0) 1008 (vs)58 [160] (958206) 1039 (190.4) 1036 (vvs)67 [1.0] (26616) 1076 (0.8) 1065 (m)04 [12.6] (56168) 1191 (3.9) 1199 (vw)90 [1.8] (29835) 1230 (17.7) 1221 (w)40 [0.5] (3830) 1298 (0.2) 1298 (vw)56 [12.5] (89821) 1574 (20.4) 1574 (m)84 [40.6] (730224) 1603 (24.3) 1599 (w)
ng B3LYP at the level of Lanl2DZ).
386 S. Liu et al. / Spectrochimica Acta
Fu
Fbasiaaotapcic
rc
ig. 3. NRS and pre-SERS of pyridine–Ag4X (X = L, S, V) complex. The wavelengthsed to calculate the pre-SERS are 1256 nm, 769 nm and 744.3 nm for each complex.
or py–Ag4L the Raman shifts of these two symmetry modes areoth blue shift, and for py–Ag4S one mode at 997 cm−1 is blue shiftnd the other mode at 1054 cm−1 is red shift. Our results of Ramanhift accord with the experiment data as a whole [26]. The NRSntensities (presenting in square brackets) of modes at 991 cm−1
nd 1001 cm−1 for py–Ag4L and py–Ag4V are smaller than modest 1017 cm−1 and 1058 cm−1, respectively; whereas the intensityf corresponding two modes is reverse for py–Ag4S in NRS. Noticehat two intense peaks at 1001 cm−1 and 1058 cm−1 for py–Ag4Vre identical with the results performed by Cardini et al. [26]. Com-ared to the Raman spectra of single pyridine, the changes in NRS foromplexes are mainly resulted from the modifications of the chem-cal environment around pyridine. The enhancement of NRS for
omplexes can be ascribed to ground state chemical enhancement.We focus on the SERS of three complexes contributed by CTesonance Raman enhancement. When perform the pre-SERS cal-ulation, the wavelengths 1256 nm, 769 nm and 744.3 nm are used
Part A 73 (2009) 382–387
as incident lights which are nearly resonant with the S2 pure CTexcitation states for py–Ag4L, py–Ag4S and py–Ag4V, respectively.The profile of SERS with extremely high intensities for some vibra-tional modes is analogical to NRS nevertheless for other modes theintensities in SERS do not increase obviously. This is the leadingcharacteristic of chemical enhancement, which is different fromthe EM (EM mechanism enhances the entire vibrational modes inthe same order). Visualization of charge transfer between metaland molecule is a direct evidence for chemical enhancement. Whenthe excitation wavelength is resonant with nanoparticle-moleculeCT transition, it is named CT resonance Raman enhancement. Wechoose one pure CT transition for each complex. All the holes arelocalized on Ag4 cluster and the entire electrons are localized onpyridine for py–Ag4L and py–Ag4S at S2 transition, which reveal thatthe electrons transfer from metal cluster to molecule. For py–Ag4V,due to the Td Ag4 cluster with two positive charge runs short ofelectrons, all the holes are focused on pyridine and all the electronsare concentrated on Ag4 cluster at S2 excitation state. That is, theelectrons transfer from molecule to metal cluster.
The absorption sites of complexes have intense effects on theCT resonance Raman enhancement. When pyridine binds to longaxis (py–Ag4L) or short axis (py–Ag4S) of neutral rhombic Ag4 clus-ter, these two geometries represent pyridine adsorbed on Ag (1 1 1)surface and when pyridine attaches to the vertex (py–Ag4V) ofcharged Ag4 cluster, it stands for hot-site effect (or binding siteeffect). From the data in Table 3, we obtain the CT resonanceRaman enhancement factors which are equal to the proportion ofintensitySERS/intensityNRS. For py–Ag4L and py–Ag4S, the maximalenhancement factors are close to the order of 104. For examplethe enhancement factor of B2 mode at 1199 cm−1 for py–Ag4L isabout 4 × 10³ and the enhancement factor of A1 mode at 1586 cm−1
reaches to 1.1 × 10⁴ for py–Ag4S. However, the enhancement ofpy–Ag4V is quite different from those mentioned above, althoughthe profile of the SERS is alike. Obviously, the enhancement fac-tors of py–Ag4V are 10–100 times larger than those of py–Ag4Land py–Ag4S in most vibrational modes. For instance, the A1 modeat 1067 cm−1 is increased by a factor of 2.6 × 10⁴ for py–Ag4V,whereas the enhancement factors are 3.5 × 10² and 4 × 10³ for thecorresponding modes of py–Ag4L and py–Ag4S, respectively. Thesediscrepancies in enhancement factor are mainly attributed to thehot-site effect of Td Ag4 cluster.
4. Conclusion
We adopt quantum chemistry methods to study thepyridine–AgX (X = L, S, V) complexes for adsorption site effecton Raman scattering. When the incident light is close to theenergy of the CT excitation states, the pre-SERS spectra of threecomplexes are calculated and compared with those NRS spectra.These results indicate that the adsorption site has strong influ-ence on the intensity of SERS spectra, and also the CT resonanceRaman enhancement is one of indispensable ingredients in SERSenhancement. The order of enhancement for SERS is up to 104 to105 for several vibrational modes. Simultaneously, a theoreticalmethodology called CDDs is adopted in describing the CT betweenmolecule and metal cluster which is thought to be the directevidence for chemical enhancement of SERS spectra. The resultsreveal the relationship between chemical enhancement and theCT transition.
Acknowledgments
This work was supported by the National Natural ScienceFoundation of China (Grant Nos. 10604012, 20703064 and10874234), the National Basic Research Project of China (Grant Nos.2007CB936804 and 2009CB930701), and SRF for ROCS, SEM (2006).
a Acta
R
[[[[[[[[[[[
[[
[[[[
[[
[[[[[[[[[[
[[
S. Liu et al. / Spectrochimic
eferences
[1] D.L. Jeanmaire, R.P. Van Duyne, J. Electroanal. Chem. 84 (1977) 1.[2] M.G. Albrecht, J.A. Creighton, J. Am. Chem. Soc. 99 (1977) 5215.[3] A. Campion, J.E. Ivanecky, C.M. Child III, M. Foster, J. Am. Chem. Soc. 117 (1995)
11807.[4] M. Moskovits, Rev. Mod. Phys. 57 (1985) 783.[5] K. Kneipp, H. Kneipp, I. Itzkan, R.R. Dasari, M.S. Feld, Chem. Rev. 99 (1999) 2957.[6] A. Otto, H. Grabhorn, W. Akemann, J. Phys. Condens. Matter 4 (1992) 1143.[7] J.R. Lombardi, R.L. Birke, T. Lu, J. Xu, J. Chem. Phys. 84 (1986) 4174.[8] H.X. Xu, E.J. Bjerneld, M. Kall, L. Borjesson, Phys. Rev. Lett. 83 (1999) 4357.[9] H.X. Xu, X.H. Wang, M.P. Persson, H.Q. Xu, Phys. Rev. Lett. 93 (2004) 243002.10] M.T. Sun, S.B. Wan, Y.J. Liu, J. Yu, H.X. Xu, J. Raman Spectrosc. 39 (2008) 402.11] B.T. Draine, P.J.J. Flatau, Opt. Soc. Am. A 11 (1994) 1491.12] T. Jensen, L. Kelly, A. Lazarides, G.C. Schatz, J. Cluster Sci. 10 (1999) 295.13] H.X. Xu, M. Käll, Phys. Rev. Lett. 89 (2002) 246802.14] L.L. Zhao, L. Jensen, G.C. Schatz, J. Am. Chem. Soc. 128 (2006) 2911.15] S.S. Liu, S.B. Wan, M.D. Chen, M.T. Sun, J. Raman Spectrosc. 39 (2008) 1170.16] M.T. Sun, S.S. Liu, M.D. Chen, H.X. Xu, J. Raman Spectrosc., doi:10.1002/jrs.2093.17] M. Futamata, Y. Maruyama, Anal. Bioanal. Chem. 388 (2007) 89.18] A.M. Michaels, M. Nirmal, L.E. Brus, J. Am. Chem. Soc. 121 (1999) 9932.
19] L. Jensen, G.C. Schatz, J. Phys. Chem. A 110 (2006) 5973.20] S. Chlucker, R.K. Singh, B.P. Asthana, J. Popp, W. Kiefer, J. Phys. Chem. A 105(2001) 9983.21] D.Y. Wu, B. Ren, Z.Q. Tian, Chemphyschem. 7 (2006) 619.22] M. Muniz-Miranda, G. Cardini, M. Pagliai, V. Schettino, Chem. Phys. Lett. 436
(2007) 179.
[[[
Part A 73 (2009) 382–387 387
23] L.L. Zhao, L. Jensen, G.C. Schatz, Nano. Lett. 6 (2006) 1229.24] L. Jensen, C.M. Aikens, G.C. Schatz, Chem. Soc. Rev. 37 (2008) 1061.25] D.Y. Wu, M. Hayashi, S.H. Lin, Z.Q. Tian, Spectrochim. Acta A 60 (2004) 137.26] M. Muniz-Miranda, G. Cardini, V. Schettino, Theor. Chem. Acc. 117 (2007)
454.27] W.J.D. Beenken, T. Pullerits, J. Chem. Phys. 120 (2004) 2490.28] K.G. Jespersen, W.J.D. Beenken, Y. Zaushitsyn, A. Yartsev, M. Andersson, T. Pul-
lerits, V. Sundström, J. Chem. Phys. 121 (2004) 12613.29] J.L. Brédas, D. Beljonne, V. Coropceanu, J. Cornil, Chem. Rev. 104 (2004) 4971.30] P. Hohenberg, W. Kohn, Phys. Rev. 136 (1964) B864.31] A.D. Becke, Phys. Rev. A 38 (1988) 3098.32] J.P. Perdew, Phys. Rev. B 33 (1986) 8822.33] P.J. Hay, W.R. Wadt, J. Chem. Phys. 82 (1985) 270.34] E.K.U. Gross, W. Kohn, Phys. Rev. Lett. 55 (1985) 2850.35] Gaussian 03, Revision E.01, Gaussian, Inc., Pittsburgh, PA, 2003.36] J. Neugebauer, M. Reiher, C. Kind, B.A. Hess, J. Comput. Chem. 23 (2002) 895.37] W.J.D. Beenken, T. Pullerits, J. Phys. Chem. B 108 (2004) 6164.38] N.K. Persson, M.T. Sun, P. Kjellberg, T. Pullerits, O. Inganäs, J. Chem. Phys. 123
(2005) 204718.39] M.T. Sun, P. Kjellberg, W.J.D. Beenken, T. Pullerits, Chem. Phys. 327 (2006) 474.40] D.X. Tian, H.L. Zhang, J.J. Zhao, Solid State Commun. 144 (2007) 174.
[41] V. Bonacic-Koutecky, J. Pittner, M. Boiron, P. Fantucci, J. Chem. Phys. 110 (1999)3876.
42] V. Bonacic-Koutecky, V. Veyret, R. Mitric, J. Chem. Phys. 115 (2001) 10450.43] J.C. Idrobo, S. Ogut, J. Jellinek, Phys. Rev. B 72 (2005) 085445.44] L. Peyser-Capadona, J. Zheng, J.L. Gonzalez, T.H. Lee, S.A. Patel, R.M. Dickson,
Phys. Rev. Lett. 94 (2005) 058301.