Embed Size (px)
Citation preview
arX
iv:1
207.
6749
v2 [
astr
o-ph
.CO
] 7
Dec
201
2
Mon. Not. R. Astron. Soc. 000, 000–000 (0000) Printed 10 December 2012 (MN LATEX style file v2.2)
Constraining Extended Gamma-ray Emission from Galaxy
Clusters
Jiaxin Han,1,2,3⋆ Carlos S. Frenk,3 Vincent R. Eke,3 Liang Gao,4,3
Simon D. M. White,5 Alexey Boyarsky,6,7 Denys Malyshev7 and Oleg Ruchayskiy81Key Laboratory for Research in Galaxies and Cosmology, Shanghai Astronomical Observatory, Shanghai 200030, China2Graduate School of the Chinese Academy of Sciences, 19A, Yuquan Road, Beijing 100049, China3Institute of Computational Cosmology, Department of Physics, University of Durham, Science Laboratories,
South Road, Durham DH1 3LE4Partner Group of the Max Planck Institute for Astrophysics, National Astronomical Observatories,
Chinese Academy of Sciences, Beijing, 100012, China5Max-Planck Institute for Astrophysics, Karl-Schwarzschild Str. 1, D-85748, Garching, Germany6 Instituut-Lorentz for Theoretical Physics, Universiteit Leiden, Niels Bohrweg 2, Leiden, The Netherlands7 Bogolyubov Institute of Theoretical Physics, Kyiv, Ukraine8 CERN Physics Department, Theory Division, CH-1211 Geneva 23, Switzerland
10 December 2012
ABSTRACT
Cold dark matter models predict the existence of a large number of substructureswithin dark matter halos. If the cold dark matter consists of weakly interacting mas-sive particles, their annihilation within these substructures could lead to diffuse GeVemission that would dominate over the annihilation signal of the host halo. In this workwe search for GeV emission from three nearby galaxy clusters: Coma, Virgo and For-nax. We first remove known extragalactic and galactic diffuse gamma-ray backgroundsand point sources from the Fermi 2-year catalog and find a significant residual diffuseemission in all three clusters. We then investigate whether this emission is due to(i) unresolved point sources; (ii) dark matter annihilation; or (iii) cosmic rays (CR).Using 45 months of Fermi-LAT data we detect several new point sources (not presentin the Fermi 2-year point source catalogue) which contaminate the signal previouslyanalyzed by Han et al. Including these and accounting for the effects of undetectedpoint sources, we find no significant detection of extended emission from the threeclusters studied. Instead, we determine upper limits on emission due to dark matterannihilation and cosmic rays. For Fornax and Virgo the limits on CR emission areconsistent with theoretical models, but for Coma the upper limit is a factor of 2 belowthe theoretical expectation. Allowing for systematic uncertainties associated with thetreatment of CR, the upper limits on the cross section for dark matter annihilationfrom our clusters are more stringent than those from analyses of dwarf galaxies inthe Milky Way. Adopting a boost factor of ∼ 103 from subhalos on cluster luminosityas suggested by recent theoretical models, we rule out the thermal cross section forsupersymmetric dark matter particles for masses as large as 100 GeV (depending onthe annihilation channel).
Key words: dark matter experiments, gamma ray experiments, galaxy clusters
1 INTRODUCTION
The existence of dark matter (DM) in the universe has sofar only been deduced from its gravitational effect, due tothe lack of electromagnetic interactions of the DM withitself or with baryonic matter. There are several elemen-
tary particle candidates for DM in various extensions ofthe standard model of particle physics (Bertone et al. 2004).Weakly interacting massive particles or WIMPs (with a self-interaction cross-section at roughly the weak scale) are oneclass of the popular dark matter candidates. These parti-cles could be related to the electroweak symmetry break-ing which is currently being explored by experiments atthe LHC. For example, within the framework of the min-
2 J. Han et al.
imal supersymmetric standard model (MSSM), the light-est neutralino emerges as a candidate WIMP that is stableover cosmological timescales and can annihilate into stan-dard model particles. WIMPs behave as cold dark mattersince their primordial velocity dispersion is negligible. Highresolution N-body simulations show that cold dark mat-ter halos contain a population of self-bound substructures(subhalos) whose number decreases with increasing subhalomass as N ∝ M−α with α ≈ 1.9 (Diemand et al. 2007;Springel et al. 2008; Gao et al. 2012)
Much effort has been devoted to the search for WIMPseither directly or indirectly. Direct detection involves identi-fying the rare events of DM scattering off ordinary matter orsearching for new particles near the weak scale at the LHC.Indirect detection involves looking for the annihilation or de-cay products of dark matter in cosmic rays and gamma rays.In particular, pair annihilation produces gamma-ray pho-tons at a rate proportional to the square of the dark matterdensity, which then propagate, almost without absorption,to the observer. In this case, the Galactic centre should bethe brightest gamma-ray source on the sky (Springel et al.2008, and references therein). Extended emission (distinctfrom the central point source) was reported from the central1 around the Galactic centre by Hooper & Goodenough(2011); Hooper & Linden (2011b).1This emission has beeninterpreted as a signal from dark matter annihilation. Thereis, however, a strong ambiguity in modeling this region ofthe Galaxy. Its angular size is comparable with the PSFsize of the Fermi LAT at these energies, and the galac-tic diffuse background there is known to be complicatedand highly non-uniform. In particular, it was demonstratedin Boyarsky et al. (2011) that although an extra diffusecomponent improves the quality of fit, the radial profileof the “extended emission” is fully consistent with thatof known Fermi point sources and therefore the emissioncould all originate from point sources at the Galactic cen-tre(see also Abazajian & Kaplinghat 2012). An intriguingaspect of a DM explanation for the gamma-ray emissionfrom the Galactic centre is that the inferred particle massof around 10 GeV is also the mass claimed to be required toexplain other data, such as the synchrotron emission fromthe Milky Way’s radio filament (Linden et al. 2011) andthe “WMAP Haze” (Finkbeiner 2004; Hooper et al. 2007;Hooper & Linden 2011a), as well as signals from the di-rect detection experiments DAMA/LIBRA (Bernabei et al.2010), CoGeNT (Aalseth et al. 2011b,a) and CRESST-II(Angloher et al. 2012). These signals, however, could be intension with other direct detection experiments, such asCDMS (Ahmed et al. 2011) and XENON-100 (Aprile et al.2011), although optimistic arguments also exist (e.g.,Collar(2011a,b). We refer the reader to Hooper (2012) for review.
It has recently been reported that the γ-ray emissionfrom the region around the Galactic centre exhibits a line-like excess at energies ∼ 130 GeV (Bringmann et al. 2012;Weniger 2012; Tempel et al. 2012; Su & Finkbeiner 2012).The intepretation of this signal as arising from dark mat-ter particles, however, is controversial (see Boyarsky et al.2012).
1 See also a preliminary result by the Fermi-LAT collaboration(Vitale et al. 2009).
Targeting the entire sky rather than the Galactic cen-tre in searching for annihilation radiation may seem a goodstrategy since this takes advantage of the large-scale dis-tribution of dark matter while avoiding some of the uncer-tainties arising from the astrophysical modelling of galac-tic gamma-ray sources. However, the fact that we are lo-cated near the centre of the Galactic halo and that most ofthe annihilation emission outside the Galactic centre is pro-duced by dark matter substructures (Diemand et al. 2007;Springel et al. 2008) results in a gamma-ray map from anni-hilation that is almost uniform on large scales. This makesdetection within the Milky Way halo a difficult task, exacer-bated by the additional uncertainty of having to model theextragalactic background, which is more important on largescales (Zaharijas et al. 2010; Baxter & Dodelson 2011).
Dwarf galaxies are the most DM-dominated objectsknown, are relatively free from astrophysical contamina-tion and appear compact on the sky. They are thereforepromising targets to search for DM annihilation radia-tion. Recent joint analyses of eight to ten dwarf galaxies(Geringer-Sameth & Koushiappas 2011; Ackermann et al.2011) resulted in no significant detection but have be-gan to rule out the canonical annihilation cross-section of3× 10−26cm3s−1 for DM masses below ∼ 30− 40 GeV.
Galaxy clusters are the most massive virialized DMstructures in the universe and are also good targets for indi-rect DM searches. The presence of a large population of DMsubstructures (or subhalos) predicted by numerical simula-tions further enhances the detectability of DM in clusters.Although the total mass within subhalos amounts to only10 to 20 percent of the total halo mass, the density enhance-ment within subhalos can boost the total cluster annihila-tion luminosity by a factor as high as 1000 when extrapo-lated down to a subhalo mass limit of one Earth mass, thefiducial cutoff in the primoridal power spectrum of densityfluctuations for a typical 100 GeV WIMP (Gao et al. 2012;Pinzke et al. 2011). As the distribution of subhalos is muchless concentrated than that of the smooth main halo, thetotal annihilation emission from clusters is predicted to beextended. Thus, attempts to detect DM annihilation assum-ing a point source or NFW-squared profile could miss mostof the signal. In fact, just such a search using the 11-monthFermi-LAT data has yielded no significnat detection of emis-sion from six clusters (Ackermann et al. 2010).
Using the 45-month data, we consider possible contri-butions from cosmic ray (CR) induced gamma-ray emissionand from DM annihilation. For the former (which can beas high as, or higher than the emission from cluster DMannihilation (Jeltema et al. 2009; Pinzke & Pfrommer 2010;Pinzke et al. 2011), we adopt the semi-analytic method de-veloped by Pinzke & Pfrommer (2010). For the later, weadopt the model proposed by Gao et al. (2012) for thecluster DM annihilation profile. We provide constraints onboth the CR and DM components for the three galaxyclusters analyzed by Han et al. (2011): Coma, which ispredicted to have the highest signal-to-noise according toGao et al. (2012), and Fornax and Virgo which are predictedto have the lowest astrophysical contamination according toPinzke et al. (2011).
The current paper replaces an earlier version by a sub-set of the authors (Han et al. 2012, arXiv:1201.1003). Aftersubmission of that version, it was pointed out to us that a
Extended Gamma-ray Emission in Clusters 3
number of point sources are present in the full three-yearLAT data which were not detected significantly in the dataused for the ”official” Fermi point source catalogue availableat the time of our analysis, the LAT 2-year point source cat-alogue (2FGL; Nolan et al. (2012)). We now carry out ourown point source detection in the regions of interest andfind several new point sources.2 We account for these newdetections in our analysis, as well as for the fact that a signif-icant part of the “smooth” extragalactic background is con-tributed by point sources below the detection threshold; thisalters the noise properties of this background. Both changesreduce the significance of the diffuse components apparentlydetected in the first version of our paper, so that we can nowreliably only place upper limits.
Huang et al. (2012) have recently reported a failure todetect significant DM annihilation emission from a com-bined analysis of eight galaxy clusters. Our work differs fromtheirs in several respects: firstly, we assume a DM annihi-lation profile based on high resolution cosmological simula-tions (Gao et al. 2012); secondly, we assess the impact ofcosmic rays in the detection of dark matter; and finally, weinclude in our sample the Virgo cluster which turns out tobe the best candidate. The constraints we set on the annihi-lation cross-section are consistent with those of Huang et al.(2012).
The paper is organized as follows. In section 1 we de-scribe the data and provide an overview of the models ofthe Virgo, Fornax and Coma galaxy clusters regions usedin the analysis (see Table 1). The specification of the non-standard components of the models (dark matter and cosmicrays brightness profiles) is provided in Sec. 2. The constrainson CR emission and DM annihilation that we obtain aresummarized in section 3 and discussed in Sec. 4.
The cosmological parameters used in this work are thesame as those assumed by Gao et al. (2012): Ωm = 0.25,ΩΛ = 0.75, h = 0.73.
1.1 Data preparation
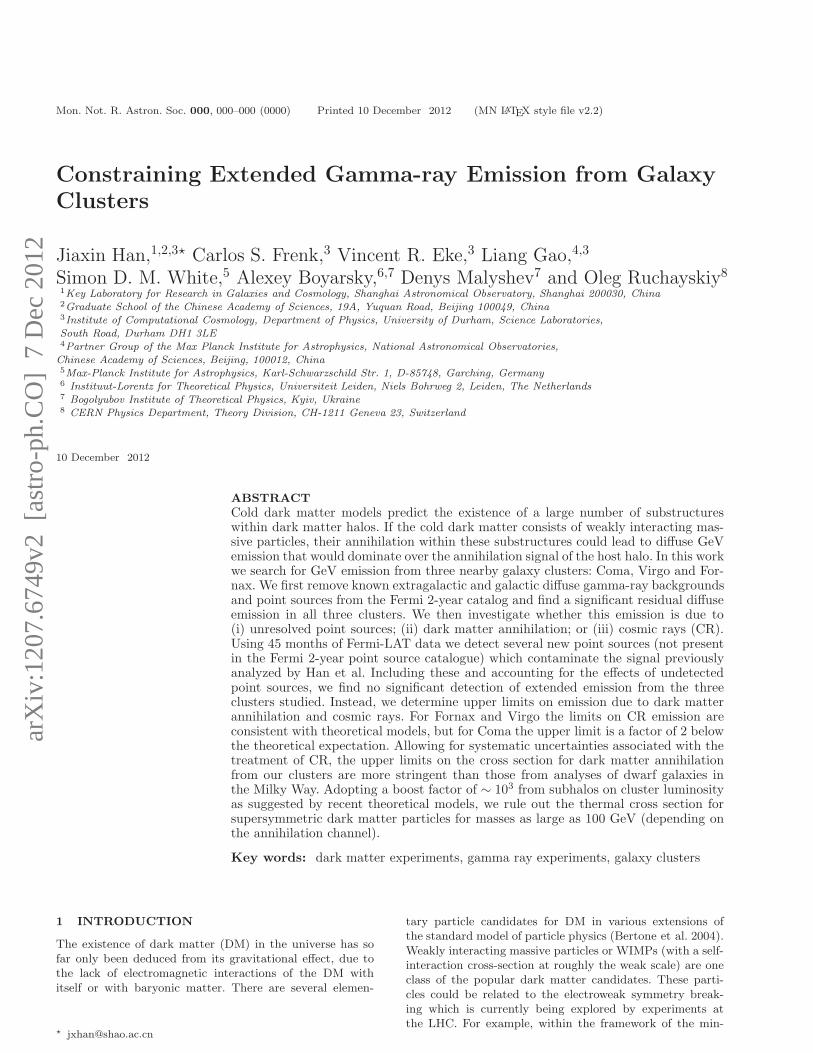
We analyze the first 45 months of data (04/08/2008 to20/05/2012) from the Fermi-LAT, 3 trimmed with the cutslisted below, to select high quality photon events. This typ-ically results in ∼ 105 photons within a radius of 10 de-grees around each cluster, while the expected number ofannihilation photons is of the order of 102 according toFig. 3. The most recent instrument response function (IRF),P7CLEAN V6, is adopted for the analysis, in accordancewith our event class selection.4 The resulting gamma-rayimages for the three clusters are shown in the left panel ofFig. 1 for Virgo and in Fig. C1 for Coma and Fornax.
Minimum Energy 100 MeVMaximum Energy 100 GeV
2 We notice that several new point sources in Virgo are also iden-tified in a concurrent paper(Macıas-Ramırez et al. 2012) and arefound to reduce the significance of DM-like emission in the clus-ter, consistent with what we find here.3 http://fermi.gsfc.nasa.gov/cgi-bin/ssc/LAT/LATDataQuery.cgi4 We also tried using P7SOURCE V6 IRF and Event Class 2data. The results are consistent with those presented in this pa-per.
Maximum zenith angle5 100 degreesEvent Class6 3 (P7CLEAN)DATA-QUAL7 1LAT CONFIG8 1ABS (ROCK ANGLE)9 < 52 degreesROI-based zenith angle cut yes
We list the basic properties of the three clusters in Ta-ble 1.
1.2 Maximum-likelihood fitting
We use the pyLikelihood tool shipped with the FermiScience Tools software package (version v9r27p1-fssc-20120410) to perform a maximum likelihood (ML) analysis(Mattox et al. 1996). After applying appropriate data cuts,as described in section 1.1, we bin the data into 0.1 degree-wide pixels and 30 logarithmic energy bins within a radiusof 10 degrees around each cluster. This large radius is cho-sen to account for the large LAT PSF size at low energies(4 ∼ 10 degrees at 100 MeV10). An exposure cube is com-puted around each cluster covering 25 degrees in radius andthe 30 energy bins, using the gtexpcube2 tool.
In the standard Fermi likelihood analysis, the photoncounts within each pixel are treated assuming Poisson statis-tics for each energy bin to calculate the likelihood. The best-fit parameters are obtained when the likelihood for the entiredata set is maximized. The significance of a given componentof interest (e.g. DM or CR) from the ML fitting is quantifiedby the likelihood ratio statistic,
TS = −2 ln(L0/L), (1)
where L is the maximum likelihood for the full model andL0 is the maximum likelihood for the null hypothesis, i.e,the model without the component of interest. According toWilk’s theorem, this test statistic, TS, approximately fol-lows a χ2 distribution when the null hypothesis is true, withone degree of freedom for our case where the normalizationis the only extra parameter in the alternative model. Theprobability that a given value of TS arises purely from fluc-tuations of the null hypothesis is:
P =
∫ ∞
TS
1
2χ21(ξ)dξ =
∫ ∞
√TS
e−x2/2
√2π
dx. (2)
5 ZENITH ANGLE (degrees): angle between the reconstructedevent direction and the zenith line (originates at the centre of theEarth and passes through the centre of mass of the spacecraft,pointing outward). The Earth’s limb lies at a zenith angle of 113degrees.6 EVENT CLASS: flag indicating the probability of the eventbeing a photon and the quality of the event reconstruction.7 DATA-QUAL: flag indicating the quality of the LAT data,where 1 = OK, 2 = waiting review, 3 = good with bad parts,0 = bad8 LAT-CONFIG: flag for the configuration of the lat (1 = nomi-nal science configuration, 0 = not recommended for analysis)9 ROCK ANGLE: angle of the spacecraft z-axis from the zenith(positive values indicate a rock toward the north).10 The LAT PSF size scales roughly as E−0.8, so at 1 GeV it is∼ 1deg
4 J. Han et al.
Table 1. Basic Properties of Target Clusters
Coma Fornax Virgo (M87)
RA (deg) 194.9468 54.6686 187.6958
DEC (deg) 27.9388 -35.3103 12.3369
DA (Mpc)a 95.8 17.5 16.8
M200 (M⊙)b 1.3e15 2.4e14 7.5e14
r200 (deg)b 1.3 4.1 6.2
JNFWc 5.9e-5 4.1e-4 1.2e-3
Enhancement due to subhalos within r200 d 1.3e3 6.5e2 1.0e3
aAngular diameter distance, from the NASA extragalactic database for Coma and Fornax, and from Tully & Shaya (1984) for Virgo.bCluster halo mass defined as the mass within the radius, r200, within which the average density equals 200 times the critical density ofthe universe. Values for Coma and Fornax are taken from Pinzke et al. (2011), while the value for Virgo is taken from Tully & Shaya
(1984).cIntegrated coefficient, Jint =
∫∆Ω
JdΩ, over the solid angle spanned by the cluster virial radius, assuming a smooth NFW densityprofile.
dEnhancement to the total annihilation luminosity within the virial radius due to substructures, extrapolated to a subhalo mass limit of10−6M⊙. Note this factor scales with the minimum subhalo mass as M−0.226
cut (Springel et al. 2008).
The factor1
2comes from the constraint that the normaliza-
tion parameter be non-negative. The significance of a detec-tion can thus be quoted as
√TSσ (one-sided Gaussian con-
fidence). Upper limits on the extra normalization parameterN are obtained by searching for a null hypothesis L′
0 whereN in the full model is constrained to be equal to the upperlimit, NUL, so that ln(L′
0/L) = −1.35, corresponding to the95% confidence interval.
1.3 Model
For the analysis we constructed a model to fit the data in-cluding all known foreground and background emission, aswell as DM and CR components, as appropriate. We in-clude all the point sources from 2FGL within a radius of15 degrees from the cluster centre in the model, plus themost recent galactic (GAL) and extragalactic (EG) diffuseemission given by the template files gal 2yearp7v6 v0.fits
and iso p7v6clean.txt. Additionally, we have searched the45-month data for new point sources; we detect several ofthem within the cluster region (see Appendix A for moredetail) and these are also included in our model. The nor-malization of the GAL and EG diffuse components are al-lowed to vary during the fitting. Within the cluster virialradius there are two 2FGL point sources and one newly de-tected point source in Fornax, six 2FGL, including the cen-tral AGN (M87; Abdo et al. 2009), plus four newly detectedones in Virgo. We allow the normalization and power-lawspectral index of these thirteen point sources to vary freely.In addition, the parameters of all sources with variability in-dex greater than 50 located within 10 degrees of the clustercentres are allowed to vary. Parameters for the other pointsources are fixed as in the 2FGL catalog. From now on we re-fer to the model with GAL, EG and the known point sourcesas the “base model”.
A DM annihilation surface brightness template (given
by the dimensionless factor J, see Eqn. 4 in Sec. 2.1) is gen-erated for each cluster out to a 15 degree radius by summingup both the contribution from a smooth NFW profile andthe contribution from subhalos. This J-map is used to fit forextended cluster annihilation emission. For the point sourcemodel, the integrated factor JNFW (see Eqn. 5) is used toderive an annihilation cross-section from the fitted total flux.Similarly, a CR photon template is generated for each clus-ter out to three times the cluster virial radius, where thesurface brightness has dropped to below 10−5 of the centralvalue and beyond which the model is not reliable. Images forvarious model components are shown in Fig. 1 taking Virgoas an example. We discuss these templates in more detailsin Sec. 2.
In the traditional Fermi analysis, the EG template istreated as a smooth component where all emission belowthe nominal point source detection limit is assumed to comefrom a smoothly distributed diffuse component. In this work,we also consider a more realistic one where a fraction isassumed to be contributed by fainter point sources with anumber-flux relation which extrapolates smoothly from thatmeasured for brighter sources. In this case the photon countswithin a given pixel are no longer Poisson-distributed sincethe photons arrive in packets. In principle, one can use thefull distribution of photon counts from a population of ran-domly placed point sources to calculate the likelihoods Land L0, but Eqns. 1 and 2, and the corresponding discus-sion, are not affected. However, since the full distribution ofphoton counts in this case (Han et.al., in prep.) is compli-cated and difficult to implement in the likelihood analysis,instead of recalculating L and L0, in this work we use Monte-Carlo simulations to re-evaluate the distribution of TS forthe more realistic background model and provide correctionsto the results of the standard analysis where needed.
Extended Gamma-ray Emission in Clusters 5
180185190195
5
10
15
20
RA (deg)
DEC (deg)
Virgo
Galactic Diffuse ExtraGal Diffuse Point Sources
Cosmic Ray DM Annihilation Fluctuation
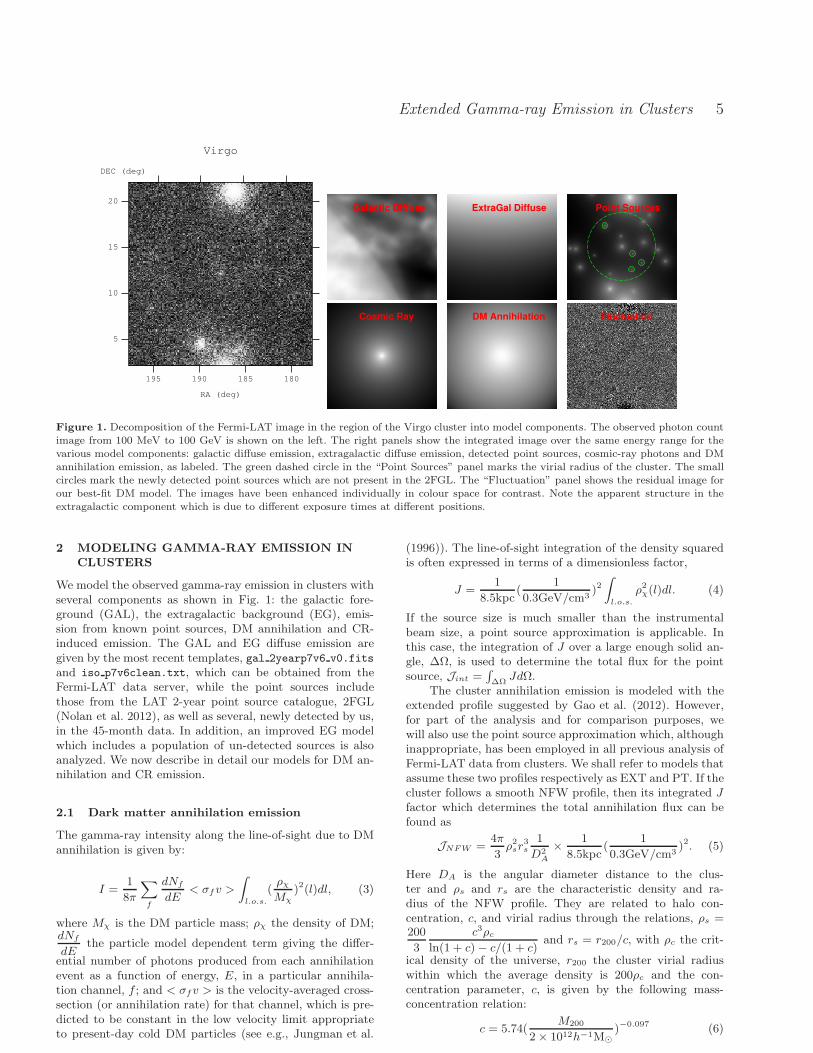
Figure 1. Decomposition of the Fermi-LAT image in the region of the Virgo cluster into model components. The observed photon countimage from 100 MeV to 100 GeV is shown on the left. The right panels show the integrated image over the same energy range for thevarious model components: galactic diffuse emission, extragalactic diffuse emission, detected point sources, cosmic-ray photons and DMannihilation emission, as labeled. The green dashed circle in the “Point Sources” panel marks the virial radius of the cluster. The smallcircles mark the newly detected point sources which are not present in the 2FGL. The “Fluctuation” panel shows the residual image forour best-fit DM model. The images have been enhanced individually in colour space for contrast. Note the apparent structure in theextragalactic component which is due to different exposure times at different positions.
2 MODELING GAMMA-RAY EMISSION IN
CLUSTERS
We model the observed gamma-ray emission in clusters withseveral components as shown in Fig. 1: the galactic fore-ground (GAL), the extragalactic background (EG), emis-sion from known point sources, DM annihilation and CR-induced emission. The GAL and EG diffuse emission aregiven by the most recent templates, gal 2yearp7v6 v0.fits
and iso p7v6clean.txt, which can be obtained from theFermi-LAT data server, while the point sources includethose from the LAT 2-year point source catalogue, 2FGL(Nolan et al. 2012), as well as several, newly detected by us,in the 45-month data. In addition, an improved EG modelwhich includes a population of un-detected sources is alsoanalyzed. We now describe in detail our models for DM an-nihilation and CR emission.
2.1 Dark matter annihilation emission
The gamma-ray intensity along the line-of-sight due to DMannihilation is given by:
I =1
8π
∑
f
dNf
dE< σfv >
∫
l.o.s.
(ρχMχ
)2(l)dl, (3)
where Mχ is the DM particle mass; ρχ the density of DM;dNf
dEthe particle model dependent term giving the differ-
ential number of photons produced from each annihilationevent as a function of energy, E, in a particular annihila-tion channel, f ; and < σfv > is the velocity-averaged cross-section (or annihilation rate) for that channel, which is pre-dicted to be constant in the low velocity limit appropriateto present-day cold DM particles (see e.g., Jungman et al.
(1996)). The line-of-sight integration of the density squaredis often expressed in terms of a dimensionless factor,
J =1
8.5kpc(
1
0.3GeV/cm3)2
∫
l.o.s.
ρ2χ(l)dl. (4)
If the source size is much smaller than the instrumentalbeam size, a point source approximation is applicable. Inthis case, the integration of J over a large enough solid an-gle, ∆Ω, is used to determine the total flux for the pointsource, Jint =
∫
∆ΩJdΩ.
The cluster annihilation emission is modeled with theextended profile suggested by Gao et al. (2012). However,for part of the analysis and for comparison purposes, wewill also use the point source approximation which, althoughinappropriate, has been employed in all previous analysis ofFermi-LAT data from clusters. We shall refer to models thatassume these two profiles respectively as EXT and PT. If thecluster follows a smooth NFW profile, then its integrated Jfactor which determines the total annihilation flux can befound as
JNFW =4π
3ρ2sr
3s
1
D2A
× 1
8.5kpc(
1
0.3GeV/cm3)2. (5)
Here DA is the angular diameter distance to the clus-ter and ρs and rs are the characteristic density and ra-dius of the NFW profile. They are related to halo con-centration, c, and virial radius through the relations, ρs =200
3
c3ρcln(1 + c)− c/(1 + c)
and rs = r200/c, with ρc the crit-
ical density of the universe, r200 the cluster virial radiuswithin which the average density is 200ρc and the con-centration parameter, c, is given by the following mass-concentration relation:
c = 5.74(M200
2× 10¹²h−1M⊙)−0.097 (6)
6 J. Han et al.
(Duffy et al. 2008). Here, M200 is the mass enclosed withinr200. Extrapolating to a cutoff mass of 10−6M⊙, the exis-tence of subhalos will increase this flux by a factor
b(M200) = Jsub/JNFW = 1.6 × 10⁻³(M200/M⊙)0.39 (7)
Gao et al. (2012). Using the results of the simulations bythese authors, the surface brightness profile of subhalo emis-sion can be fitted within r200 by the following formula:
Jsub(r) =16b(M200)JNFW
π ln(17)
D2A
r2200 + 16r2(r 6 r200). (8)
Below we fit the subhalo emission surface brightness beyondthe virial radius and extrapolate to several times the virialradius using an exponential decay,
Jsub(r) = Jsub(r200)e−2.377(r/r200−1) (r > r200). (9)
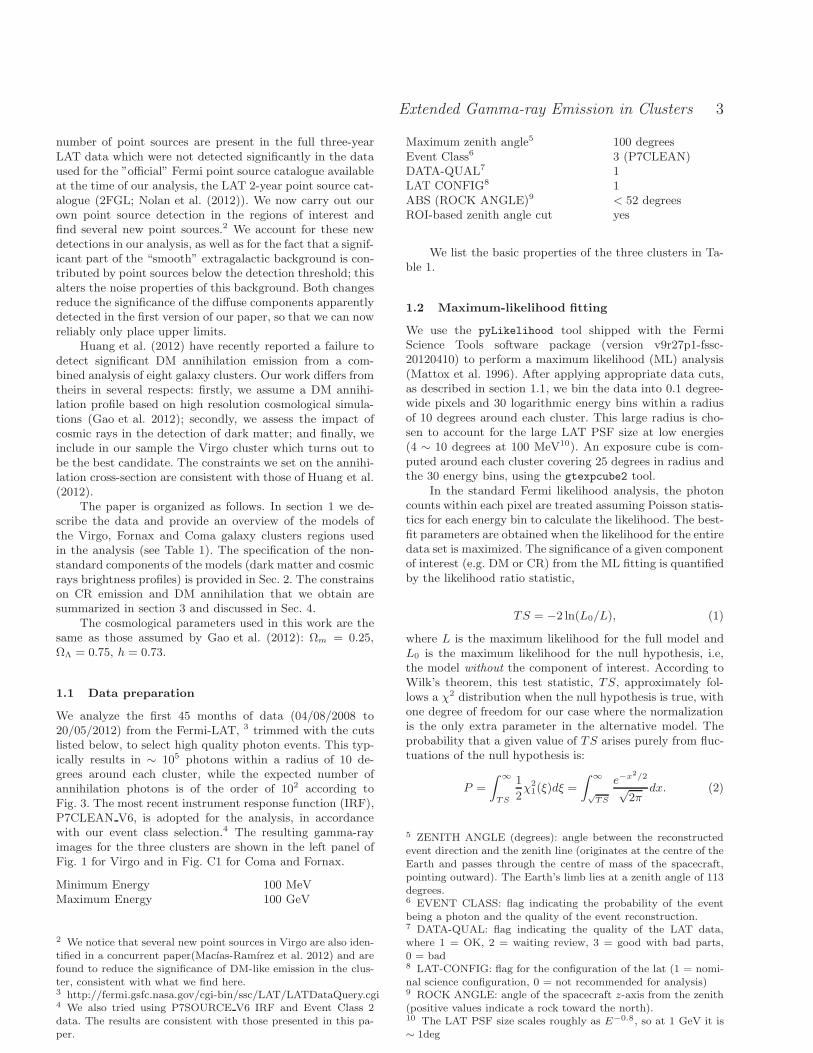
The total annihilation profile is the sum of the contributionsfrom a smooth NFW profile and the subhalo emission. Thisis completely dominated by subhalo emission except in thevery centre of the cluster. We show the total annihilationprofile and its decomposition into main halo and subhalocontributions in the left panel of Fig. 3, taking Virgo as anexample. This profile is further inflated after convolutionwith the LAT point spread function.
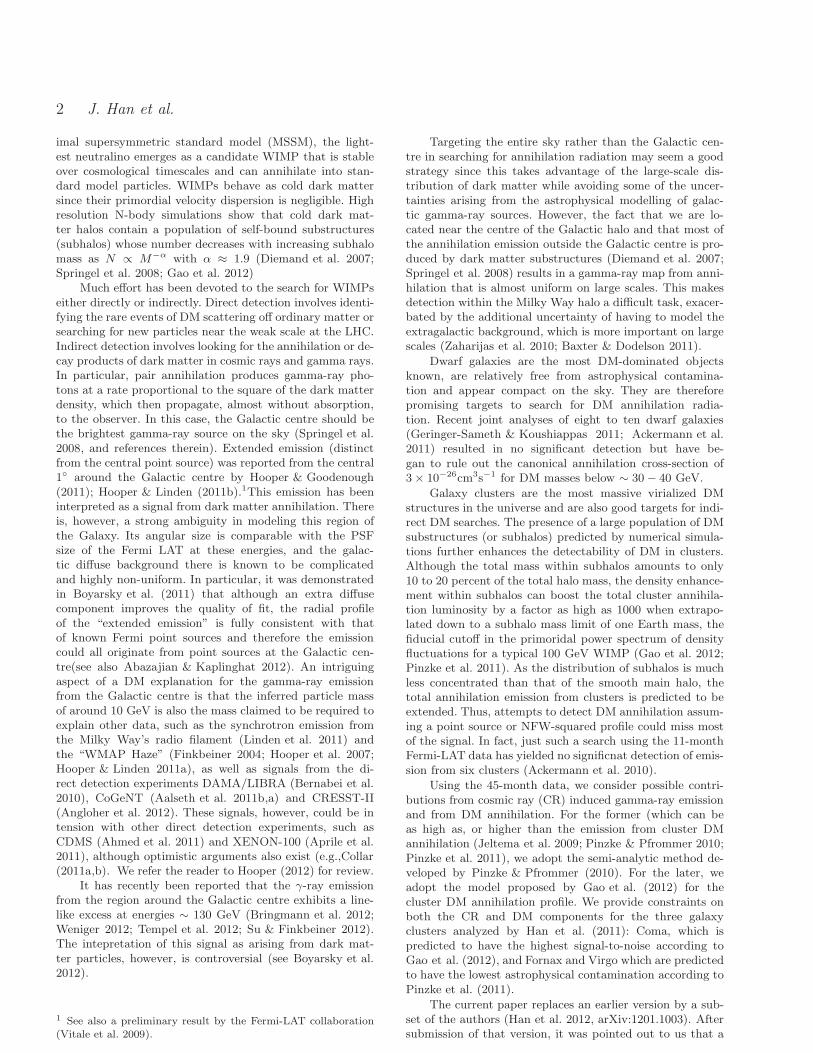
We consider three representative annihilation channels,namely into b−b, µ+−µ− and τ+−τ− final states. The anni-hilation spectrum is calculated using the DarkSUSY package(Gondolo & Silk 1999), 11 which tabulates simulation resultsfrom PYTHIA.12 We also include the contribution from in-verse Compton (IC) scattered photons by energetic electron-positron pairs produced during the annihilation process, fol-lowing the procedure described in Pinzke et al. (2011). Ingeneral, three external energy sources are involved in thedissipation and scattering of the injected electrons from an-nihilation: the Cosmic Microwave Background (CMB), in-frared to UV light from stars and dust, and the interstellarmagnetic field. However, as shown by Pinzke et al. (2011),the latter two components are expected to be importantonly in the inner region of clusters (< 0.03r200), correspond-ing to less than 0.2 degrees for our three clusters. Includingthem would introduce a position-dependent component tothe annihilation spectrum, so for simplicity we only considerthe contribution of CMB photons in the IC calculation. Forthe bb channel, IC photons only contribute significantly tothe low energy spectrum for relatively high neutralino mass,while for the leptonic channels, which have plenty of ener-getic electrons, the IC emission can completely dominate theannihilation emission over the full energy range of interestfor the highest neutralino masses considered.
We note that the electroweak corrections recentlyproposed by Ciafaloni et al. (2011) (see also Cirelli et al.(2011)) can bring visible differences to the leptonic channelspectra at highWIMP masses before IC scattering. However,since IC photons dominate at the high mass end and the elec-troweak correction only significantly changes the positronyields at low energy, thus having little effect on the IC spec-trum, the electroweak correction to the total spectrum isstill negligible. The total photon yields are shown in Fig. 2.
11 http://www.darksusy.org.12 http://home.thep.lu.se/ torbjorn/Pythia.html
The almost flat spectrum with a cutoff around the energycorresponding to the WIMP mass comes from prompt an-nihilation emission including continuum secondary photonsand final state radiation from charged final state particles.The low energy rise originates from IC scattered CMB pho-tons.
2.2 Cosmic-ray induced gamma-ray emission
within clusters
The cosmic ray induced gamma-ray emission is calculatedfollowing a semi-analytic prescription, derived from high res-olution numerical simulations of galaxy clusters, that mod-els cosmic ray physics self consistently (Pinzke & Pfrommer2010). The gamma-ray photon production rate (or sourcefunction) from pion decay is found to be separable into aspatial and a spectral part:
qCR(r, E) ≡ dNγ
dtdV dE= A(r)s(E), (10)
where the spatial part, A(r), is proportional to the square ofthe gas density profile multiplied by a slowly varying radialfunction parametrized by cluster mass. The spectral part,s(E), is almost independent of cluster mass and has a power-law form, dNγ/d ln(Eγ) ∝ E−1.3
γ , for the energy range 1 ∼100 GeV but flattens at low energies, as shown in Fig. 2.We summarize the detailed form of A(r) and s(E) plus thegas density profile for the three clusters derived from X-rayobservations in the Appendix.
The differential gamma-ray flux from this source func-tion, ICR(r,E), is simply the integral of qCR(r,E) along theline-of-sight. This prescription is derived from the averageemission profile for a sample of simulated clusters for a real-istic choice of parameter values (e.g., for the maximum shockacceleration efficiency, ζp,max). In addition to the uncertain-ties in the model parameters there is also uncertainty in theobservationally derived halo mass and gas density profile.In this work, we simply assume that the shape of qCR(r, E)is given by the model described above and account for theuncertainty in the model parameters, as well as sample vari-ance with an additional normalization parameter, αCR, sothat,
ICR(r, E) = αCR
∫
l.o.s
qCR(r,E)
4πdl. (11)
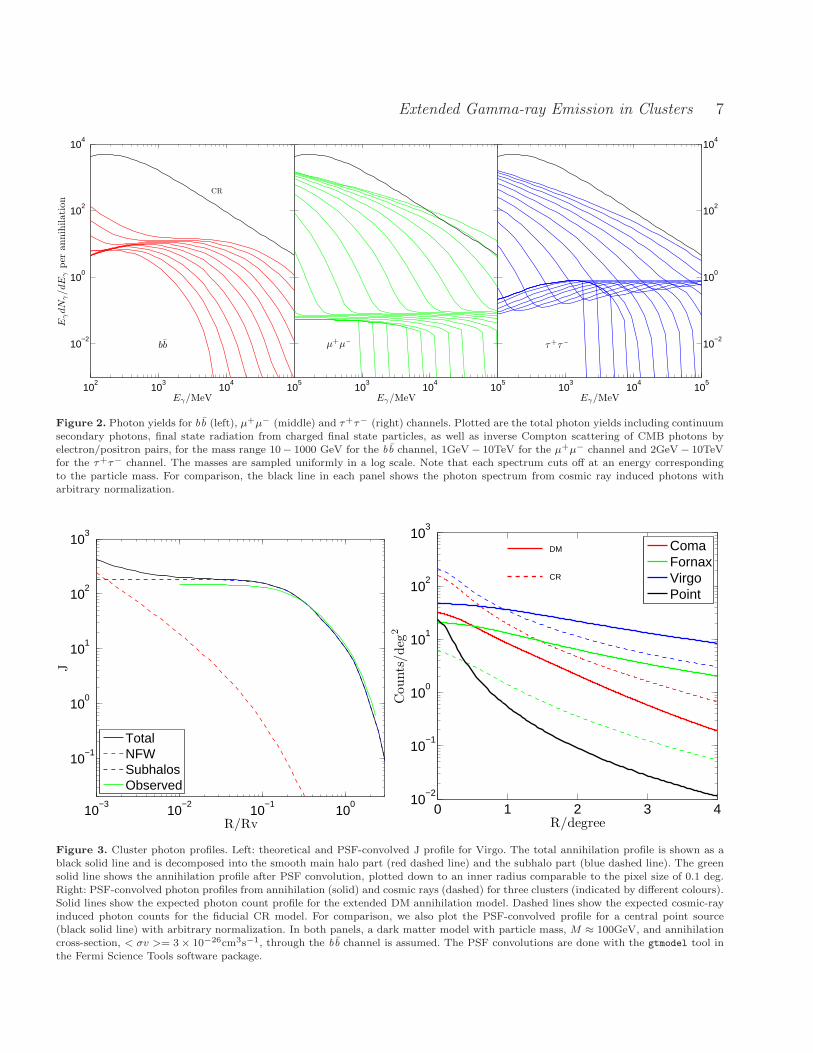
We take αCR = 1 as our fiducial CR model and also con-sider the case when αCR is fitted from the actual gamma-raydata as an optimal model. In the right panel of Fig. 3 wecompare the CR profile for the fiducial model to the ex-pected DM annihilation profile within our three clusters,assuming a fiducial DM particle model with particle mass,M ≈ 100GeV, annihilating through the bb channel withcross-section, < σv >= 3 × 10⁻²⁶cm3s−1. In general theCR emission is more centrally concentrated than the anni-hilation profile since the CR trace the gas profile. It canbe readily seen that Fornax has a particularly low CR levelwhile Coma is CR dominated. Coma has steeper profiles dueto its larger distance and hence smaller angular size.
Extended Gamma-ray Emission in Clusters 7
102
103
104
105
10−2
100
102
104
Eγ/MeV
EγdN
γ/dE
γper
annih
ilati
on
bb
CR
103
104
105
Eγ/MeV
µ+µ
103
104
105
10−2
100
102
104
τ+τ
Eγ/MeV
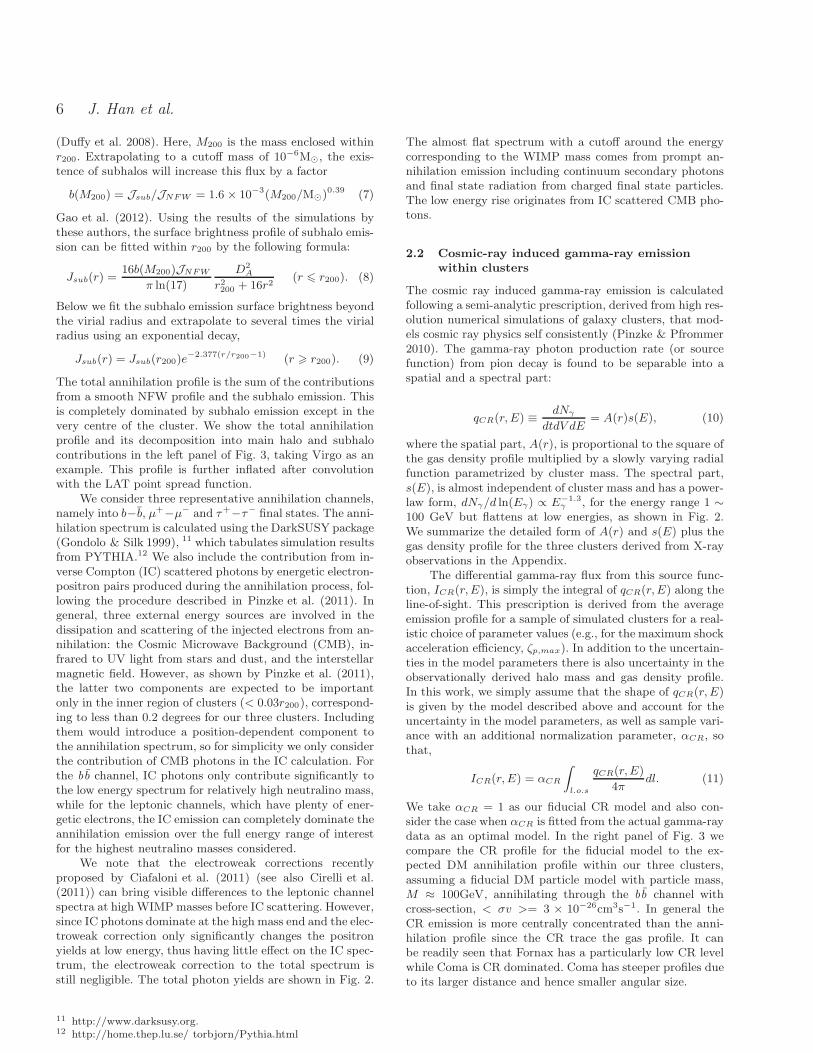
Figure 2. Photon yields for bb (left), µ+µ− (middle) and τ+τ− (right) channels. Plotted are the total photon yields including continuumsecondary photons, final state radiation from charged final state particles, as well as inverse Compton scattering of CMB photons byelectron/positron pairs, for the mass range 10− 1000 GeV for the bb channel, 1GeV− 10TeV for the µ+µ− channel and 2GeV− 10TeVfor the τ+τ− channel. The masses are sampled uniformly in a log scale. Note that each spectrum cuts off at an energy correspondingto the particle mass. For comparison, the black line in each panel shows the photon spectrum from cosmic ray induced photons witharbitrary normalization.
10−3
10−2
10−1
100
10−1
100
101
102
103
R/Rv
J
TotalNFWSubhalosObserved
0 1 2 3 410
−2
10−1
100
101
102
103
R/degree
Counts
/deg
2
DM
CR
ComaFornaxVirgoPoint
Figure 3. Cluster photon profiles. Left: theoretical and PSF-convolved J profile for Virgo. The total annihilation profile is shown as ablack solid line and is decomposed into the smooth main halo part (red dashed line) and the subhalo part (blue dashed line). The greensolid line shows the annihilation profile after PSF convolution, plotted down to an inner radius comparable to the pixel size of 0.1 deg.
Right: PSF-convolved photon profiles from annihilation (solid) and cosmic rays (dashed) for three clusters (indicated by different colours).Solid lines show the expected photon count profile for the extended DM annihilation model. Dashed lines show the expected cosmic-rayinduced photon counts for the fiducial CR model. For comparison, we also plot the PSF-convolved profile for a central point source(black solid line) with arbitrary normalization. In both panels, a dark matter model with particle mass, M ≈ 100GeV, and annihilationcross-section, < σv >= 3× 10⁻²⁶cm3s−1, through the bb channel is assumed. The PSF convolutions are done with the gtmodel tool inthe Fermi Science Tools software package.
8 J. Han et al.
3 RESULTS
3.1 Constraints on CR emission
With all the model components defined above, we first pro-ceed with ML fitting for a model with no DM annihilationbut with cosmic rays, the “CR-only” model hereafter. Notethat the GAL and EG backgrounds, as well as the nearbypoint sources, are always included in the analysis, as de-scribed in section 1.2. The results for the CR-only model fitsare listed in Table 2. The fitted CR levels all agree within afactor of three with the theoretical predictions. While For-nax is most consistent with no CR emission due to its in-trinsically low CR level, the derived upper limit for Comaalready rules out the fiducial value at 95% confidence.
3.2 Constraints on DM annihilation
Given the low significance of the CR detection in the CR-only model, it is not safe simply to adopt the best fit αCR
values for further extraction of the DM signal. Instead, weconsider the following four families of cosmic ray models inthe presence of a DM component:
Fiducial-CR model. The CR level is fixed to the theoreti-cal expectation, αCR = 1. Since this value exceeds our de-rived upper limit for Coma, we exclude Coma from furtherdiscussion of this family.Optimal-CR model. The CR level is taken as the best-fit
value listed in Table 2.Free-CR model. The normalization of the CR level is left
as a free parameter in the fit.No-CR model. No CR emission is considered, only DM.
For each family, both point source (PT) and extended(EXT) profiles are considered for the DM component (theformer merely for comparison with earlier work). Note thatwhen calculating the TS for DM, the null hypothesis refersto the full model excluding only the DM component, orequivalently, to the base model plus a CR component mod-elled according to one of our four families of CR models. Weshow results for the bb, µ+µ− and τ+τ− DM annihilationchannels.
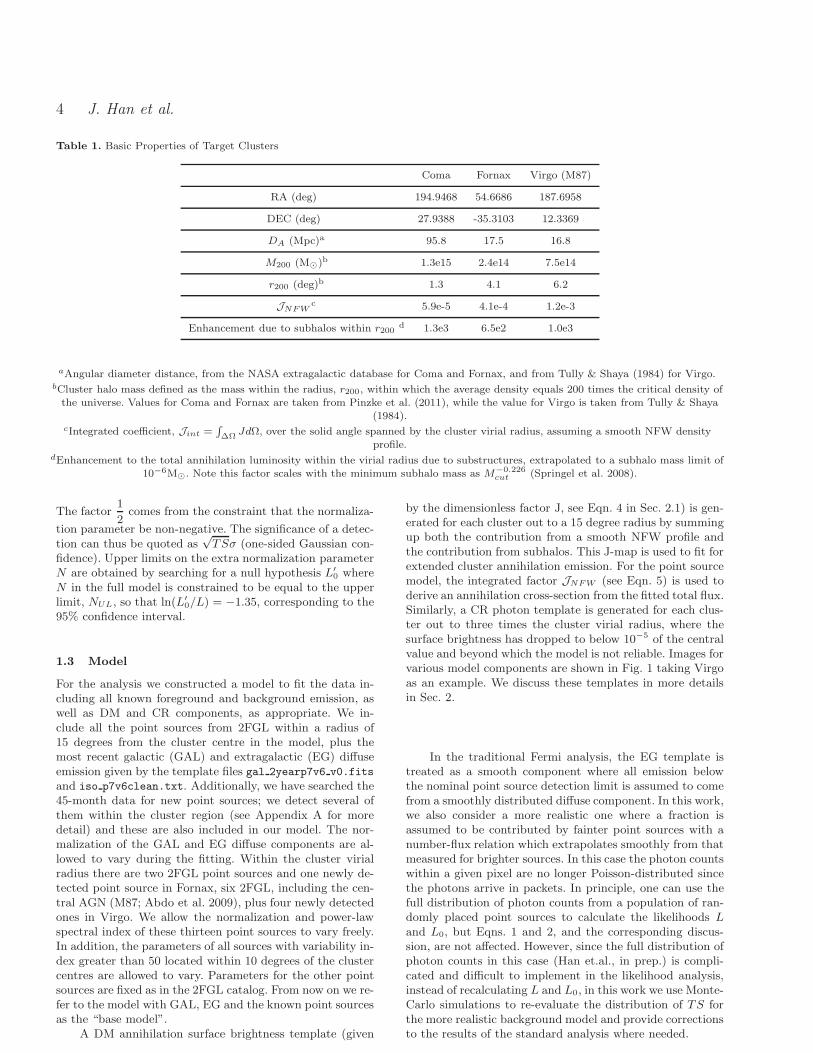
For none of the combinations of DM and CR modelsconsidered here, do we obtain a detection of DM at highsignificance in any of the three clusters. The highest sig-nificance is obtained for Virgo for the bb channel in a DMmodel that has a particle mass of 30 GeV and the EXT pro-file, in the absence of CR. In this case, we find TS = 11.6,corresponding to 3.4σ. This reduces to 2.6σ in the Free-CRmodel and to less than 1σ in the Fiducial-CR model.
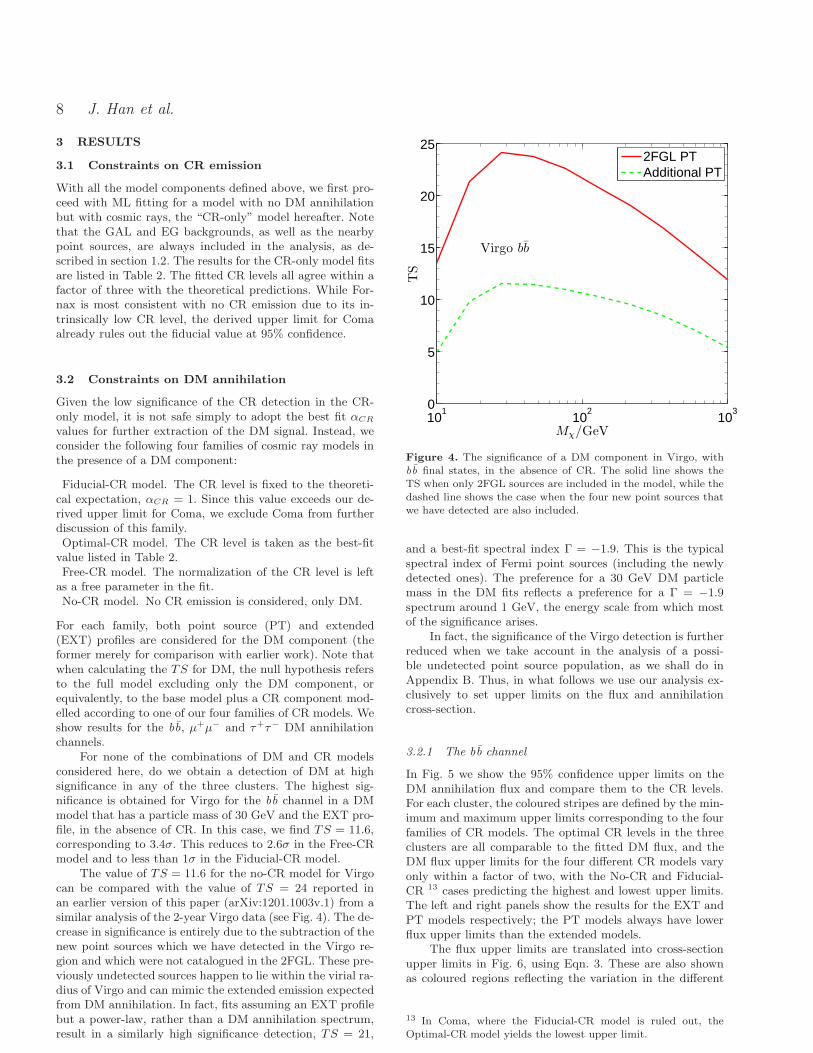
The value of TS = 11.6 for the no-CR model for Virgocan be compared with the value of TS = 24 reported inan earlier version of this paper (arXiv:1201.1003v.1) from asimilar analysis of the 2-year Virgo data (see Fig. 4). The de-crease in significance is entirely due to the subtraction of thenew point sources which we have detected in the Virgo re-gion and which were not catalogued in the 2FGL. These pre-viously undetected sources happen to lie within the virial ra-dius of Virgo and can mimic the extended emission expectedfrom DM annihilation. In fact, fits assuming an EXT profilebut a power-law, rather than a DM annihilation spectrum,result in a similarly high significance detection, TS = 21,
101
102
103
0
5
10
15
20
25
Mχ/GeV
TS
Virgo bb
2FGL PTAdditional PT
Figure 4. The significance of a DM component in Virgo, withbb final states, in the absence of CR. The solid line shows theTS when only 2FGL sources are included in the model, while thedashed line shows the case when the four new point sources thatwe have detected are also included.
and a best-fit spectral index Γ = −1.9. This is the typicalspectral index of Fermi point sources (including the newlydetected ones). The preference for a 30 GeV DM particlemass in the DM fits reflects a preference for a Γ = −1.9spectrum around 1 GeV, the energy scale from which mostof the significance arises.
In fact, the significance of the Virgo detection is furtherreduced when we take account in the analysis of a possi-ble undetected point source population, as we shall do inAppendix B. Thus, in what follows we use our analysis ex-clusively to set upper limits on the flux and annihilationcross-section.
3.2.1 The bb channel
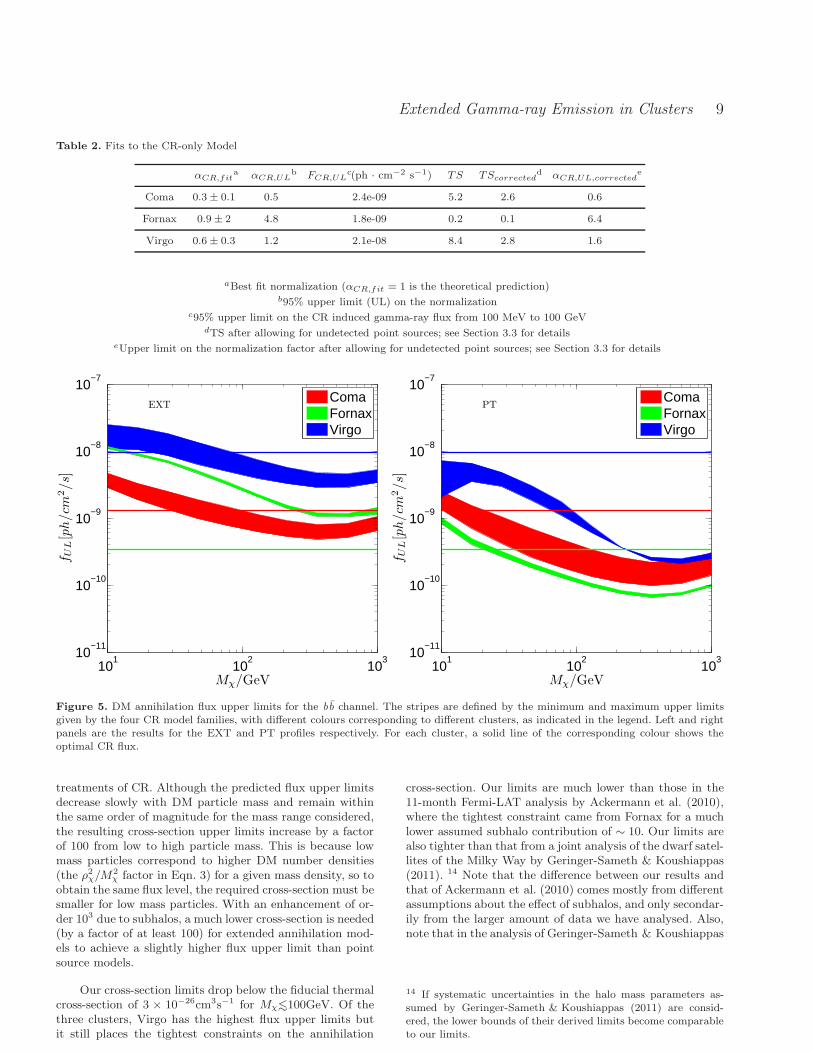
In Fig. 5 we show the 95% confidence upper limits on theDM annihilation flux and compare them to the CR levels.For each cluster, the coloured stripes are defined by the min-imum and maximum upper limits corresponding to the fourfamilies of CR models. The optimal CR levels in the threeclusters are all comparable to the fitted DM flux, and theDM flux upper limits for the four different CR models varyonly within a factor of two, with the No-CR and Fiducial-CR 13 cases predicting the highest and lowest upper limits.The left and right panels show the results for the EXT andPT models respectively; the PT models always have lowerflux upper limits than the extended models.
The flux upper limits are translated into cross-sectionupper limits in Fig. 6, using Eqn. 3. These are also shownas coloured regions reflecting the variation in the different
13 In Coma, where the Fiducial-CR model is ruled out, theOptimal-CR model yields the lowest upper limit.
Extended Gamma-ray Emission in Clusters 9
Table 2. Fits to the CR-only Model
αCR,fita αCR,UL
b FCR,ULc(ph · cm−2 s−1) TS TScorrected
d αCR,UL,correctede
Coma 0.3± 0.1 0.5 2.4e-09 5.2 2.6 0.6
Fornax 0.9± 2 4.8 1.8e-09 0.2 0.1 6.4
Virgo 0.6± 0.3 1.2 2.1e-08 8.4 2.8 1.6
aBest fit normalization (αCR,fit = 1 is the theoretical prediction)b95% upper limit (UL) on the normalization
c95% upper limit on the CR induced gamma-ray flux from 100 MeV to 100 GeVdTS after allowing for undetected point sources; see Section 3.3 for details
eUpper limit on the normalization factor after allowing for undetected point sources; see Section 3.3 for details
Mχ/GeV
f UL[p
h/cm
2/s]
EXT
101
102
103
10−11
10−10
10−9
10−8
10−7
ComaFornaxVirgo
Mχ/GeV
f UL[p
h/cm
2/s]
PT
101
102
103
10−11
10−10
10−9
10−8
10−7
ComaFornaxVirgo
Figure 5. DM annihilation flux upper limits for the bb channel. The stripes are defined by the minimum and maximum upper limitsgiven by the four CR model families, with different colours corresponding to different clusters, as indicated in the legend. Left and rightpanels are the results for the EXT and PT profiles respectively. For each cluster, a solid line of the corresponding colour shows theoptimal CR flux.
treatments of CR. Although the predicted flux upper limitsdecrease slowly with DM particle mass and remain withinthe same order of magnitude for the mass range considered,the resulting cross-section upper limits increase by a factorof 100 from low to high particle mass. This is because lowmass particles correspond to higher DM number densities(the ρ2χ/M
2χ factor in Eqn. 3) for a given mass density, so to
obtain the same flux level, the required cross-section must besmaller for low mass particles. With an enhancement of or-der 103 due to subhalos, a much lower cross-section is needed(by a factor of at least 100) for extended annihilation mod-els to achieve a slightly higher flux upper limit than pointsource models.
Our cross-section limits drop below the fiducial thermalcross-section of 3 × 10⁻²⁶cm3s−1 for Mχ∼<100GeV. Of thethree clusters, Virgo has the highest flux upper limits butit still places the tightest constraints on the annihilation
cross-section. Our limits are much lower than those in the11-month Fermi-LAT analysis by Ackermann et al. (2010),where the tightest constraint came from Fornax for a muchlower assumed subhalo contribution of ∼ 10. Our limits arealso tighter than that from a joint analysis of the dwarf satel-lites of the Milky Way by Geringer-Sameth & Koushiappas(2011). 14 Note that the difference between our results andthat of Ackermann et al. (2010) comes mostly from differentassumptions about the effect of subhalos, and only secondar-ily from the larger amount of data we have analysed. Also,note that in the analysis of Geringer-Sameth & Koushiappas
14 If systematic uncertainties in the halo mass parameters as-sumed by Geringer-Sameth & Koushiappas (2011) are consid-ered, the lower bounds of their derived limits become comparableto our limits.
10 J. Han et al.
101
102
103
10−27
10−26
10−25
10−24
10−23
10−22
Mχ/GeV
<σv
>U
L[c
m3/s]
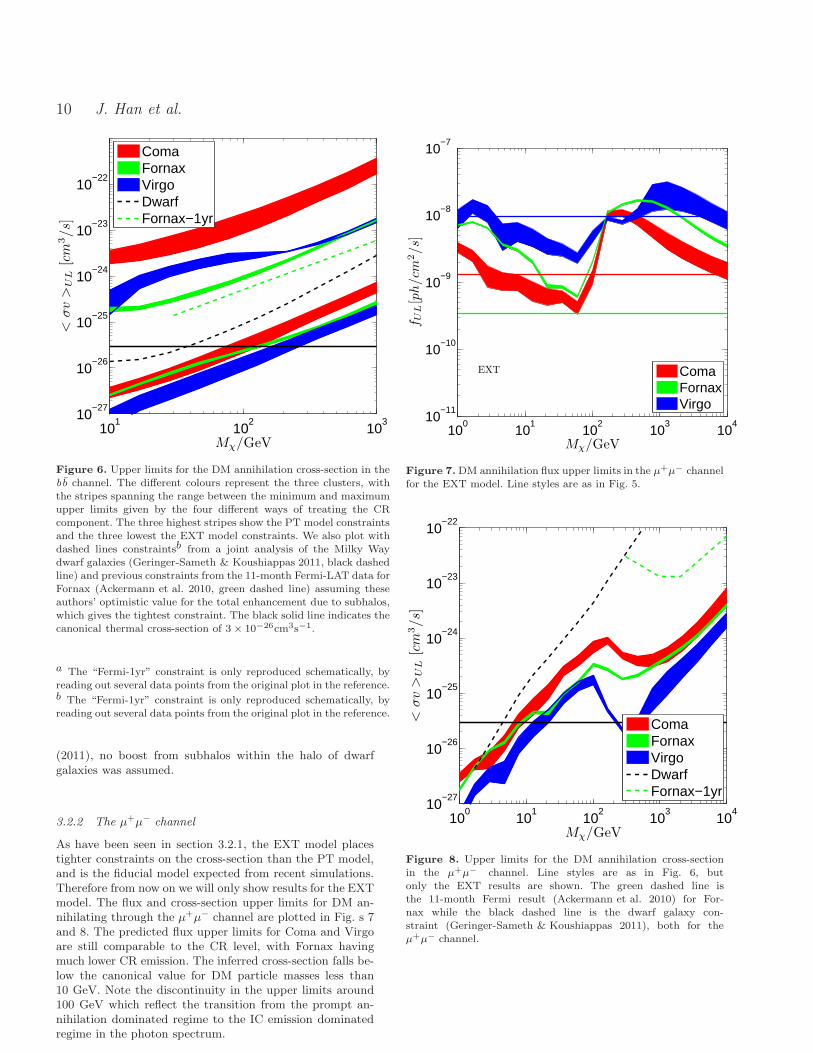
ComaFornaxVirgoDwarfFornax−1yr
Figure 6. Upper limits for the DM annihilation cross-section in thebb channel. The different colours represent the three clusters, withthe stripes spanning the range between the minimum and maximumupper limits given by the four different ways of treating the CRcomponent. The three highest stripes show the PT model constraintsand the three lowest the EXT model constraints. We also plot withdashed lines constraintsb from a joint analysis of the Milky Waydwarf galaxies (Geringer-Sameth & Koushiappas 2011, black dashedline) and previous constraints from the 11-month Fermi-LAT data forFornax (Ackermann et al. 2010, green dashed line) assuming theseauthors’ optimistic value for the total enhancement due to subhalos,which gives the tightest constraint. The black solid line indicates thecanonical thermal cross-section of 3× 10⁻²⁶cm3s−1.
a The “Fermi-1yr” constraint is only reproduced schematically, byreading out several data points from the original plot in the reference.b The “Fermi-1yr” constraint is only reproduced schematically, byreading out several data points from the original plot in the reference.
(2011), no boost from subhalos within the halo of dwarfgalaxies was assumed.
3.2.2 The µ+µ−channel
As have been seen in section 3.2.1, the EXT model placestighter constraints on the cross-section than the PT model,and is the fiducial model expected from recent simulations.Therefore from now on we will only show results for the EXTmodel. The flux and cross-section upper limits for DM an-nihilating through the µ+µ− channel are plotted in Fig. s 7and 8. The predicted flux upper limits for Coma and Virgoare still comparable to the CR level, with Fornax havingmuch lower CR emission. The inferred cross-section falls be-low the canonical value for DM particle masses less than10 GeV. Note the discontinuity in the upper limits around100 GeV which reflect the transition from the prompt an-nihilation dominated regime to the IC emission dominatedregime in the photon spectrum.
Mχ/GeV
f UL[p
h/cm
2/s]
EXT
100
101
102
103
104
10−11
10−10
10−9
10−8
10−7
ComaFornaxVirgo
Figure 7.DM annihilation flux upper limits in the µ+µ− channelfor the EXT model. Line styles are as in Fig. 5.
100
101
102
103
104
10−27
10−26
10−25
10−24
10−23
10−22
Mχ/GeV
<σv
>U
L[c
m3/s]
ComaFornaxVirgoDwarfFornax−1yr
Figure 8. Upper limits for the DM annihilation cross-sectionin the µ+µ− channel. Line styles are as in Fig. 6, butonly the EXT results are shown. The green dashed line isthe 11-month Fermi result (Ackermann et al. 2010) for For-nax while the black dashed line is the dwarf galaxy con-straint (Geringer-Sameth & Koushiappas 2011), both for theµ+µ− channel.
Extended Gamma-ray Emission in Clusters 11
101
102
103
104
10−28
10−27
10−26
10−25
10−24
10−23
Mχ/GeV
<σv
>U
L[c
m3/s]
ComaFornaxVirgoDwarf
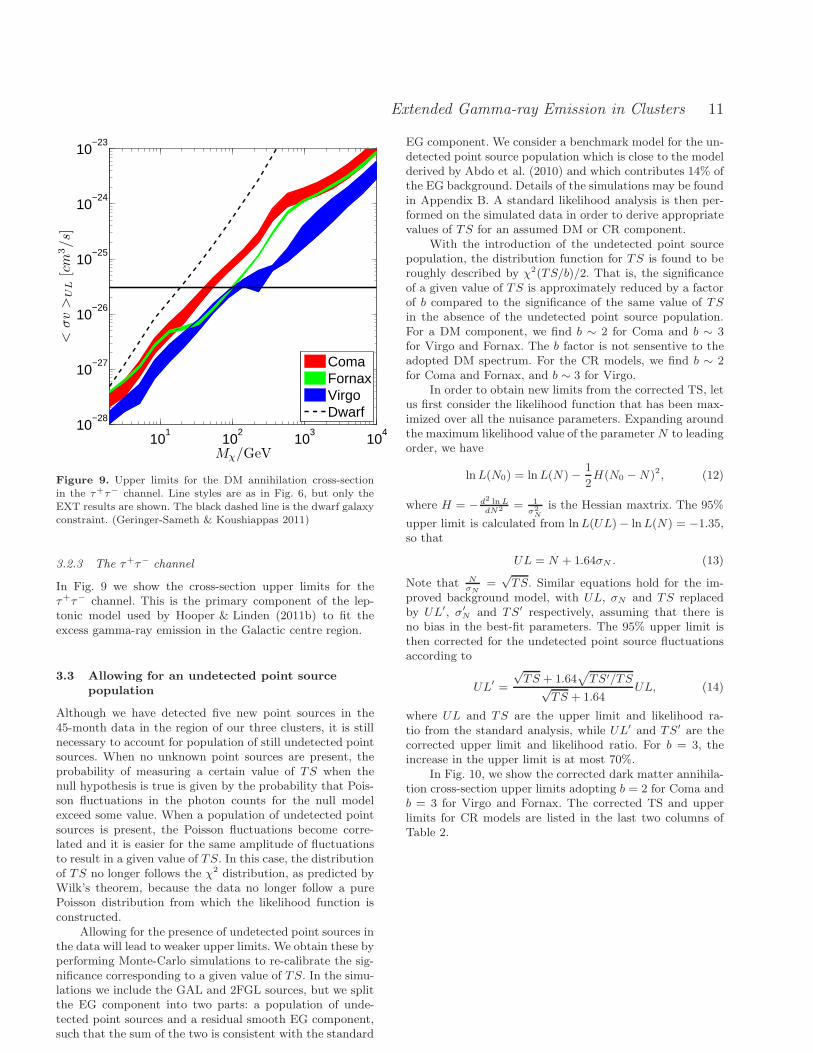
Figure 9. Upper limits for the DM annihilation cross-sectionin the τ+τ− channel. Line styles are as in Fig. 6, but only theEXT results are shown. The black dashed line is the dwarf galaxyconstraint. (Geringer-Sameth & Koushiappas 2011)
3.2.3 The τ+τ−channel
In Fig. 9 we show the cross-section upper limits for theτ+τ− channel. This is the primary component of the lep-tonic model used by Hooper & Linden (2011b) to fit theexcess gamma-ray emission in the Galactic centre region.
3.3 Allowing for an undetected point source
population
Although we have detected five new point sources in the45-month data in the region of our three clusters, it is stillnecessary to account for population of still undetected pointsources. When no unknown point sources are present, theprobability of measuring a certain value of TS when thenull hypothesis is true is given by the probability that Pois-son fluctuations in the photon counts for the null modelexceed some value. When a population of undetected pointsources is present, the Poisson fluctuations become corre-lated and it is easier for the same amplitude of fluctuationsto result in a given value of TS. In this case, the distributionof TS no longer follows the χ2 distribution, as predicted byWilk’s theorem, because the data no longer follow a purePoisson distribution from which the likelihood function isconstructed.
Allowing for the presence of undetected point sources inthe data will lead to weaker upper limits. We obtain these byperforming Monte-Carlo simulations to re-calibrate the sig-nificance corresponding to a given value of TS. In the simu-lations we include the GAL and 2FGL sources, but we splitthe EG component into two parts: a population of unde-tected point sources and a residual smooth EG component,such that the sum of the two is consistent with the standard
EG component. We consider a benchmark model for the un-detected point source population which is close to the modelderived by Abdo et al. (2010) and which contributes 14% ofthe EG background. Details of the simulations may be foundin Appendix B. A standard likelihood analysis is then per-formed on the simulated data in order to derive appropriatevalues of TS for an assumed DM or CR component.
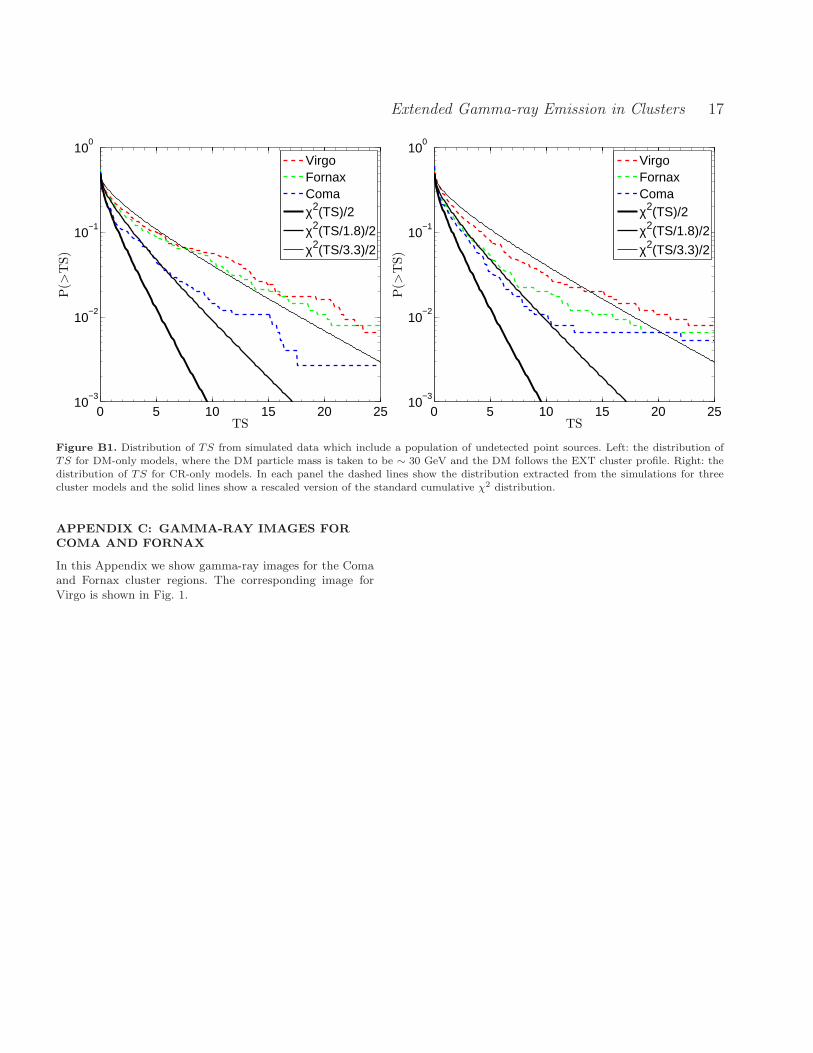
With the introduction of the undetected point sourcepopulation, the distribution function for TS is found to beroughly described by χ2(TS/b)/2. That is, the significanceof a given value of TS is approximately reduced by a factorof b compared to the significance of the same value of TSin the absence of the undetected point source population.For a DM component, we find b ∼ 2 for Coma and b ∼ 3for Virgo and Fornax. The b factor is not sensentive to theadopted DM spectrum. For the CR models, we find b ∼ 2for Coma and Fornax, and b ∼ 3 for Virgo.
In order to obtain new limits from the corrected TS, letus first consider the likelihood function that has been max-imized over all the nuisance parameters. Expanding aroundthe maximum likelihood value of the parameter N to leadingorder, we have
lnL(N0) = lnL(N)− 1
2H(N0 −N)2, (12)
where H = − d2 lnLdN2 = 1
σ2
N
is the Hessian maxtrix. The 95%
upper limit is calculated from lnL(UL)− lnL(N) = −1.35,so that
UL = N + 1.64σN . (13)
Note that NσN
=√TS. Similar equations hold for the im-
proved background model, with UL, σN and TS replacedby UL′, σ′
N and TS′ respectively, assuming that there isno bias in the best-fit parameters. The 95% upper limit isthen corrected for the undetected point source fluctuationsaccording to
UL′ =
√TS + 1.64
√
TS′/TS√TS + 1.64
UL, (14)
where UL and TS are the upper limit and likelihood ra-tio from the standard analysis, while UL′ and TS′ are thecorrected upper limit and likelihood ratio. For b = 3, theincrease in the upper limit is at most 70%.
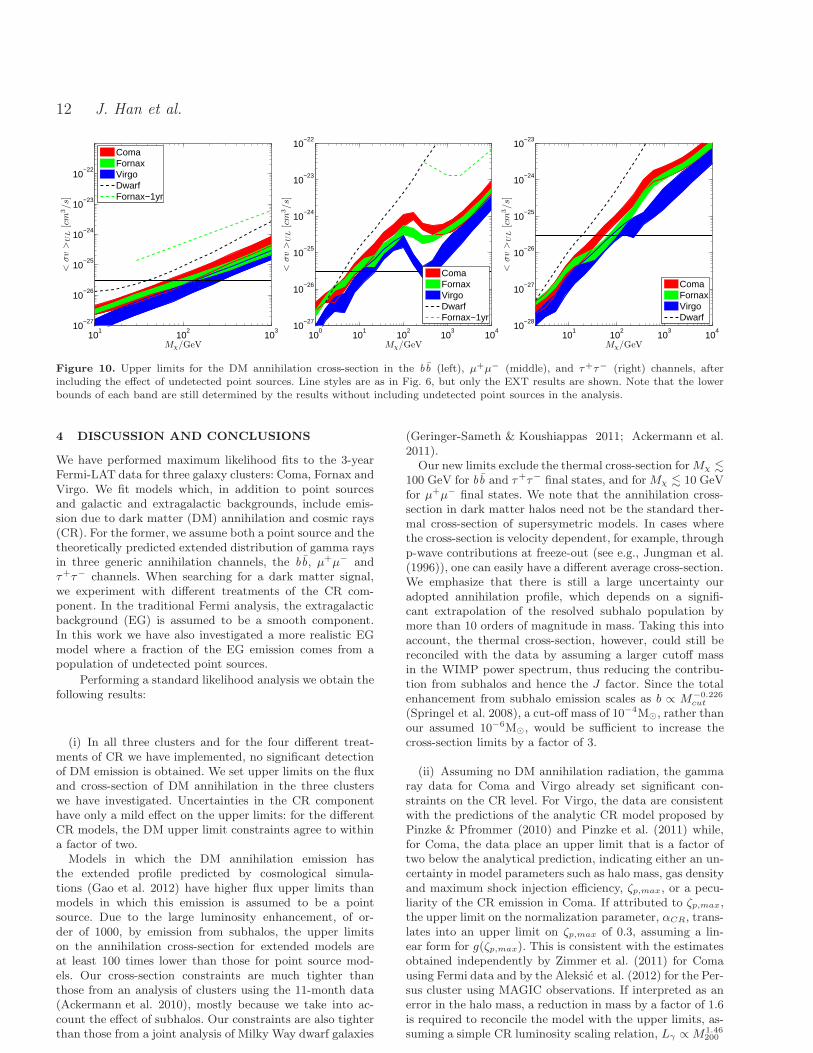
In Fig. 10, we show the corrected dark matter annihila-tion cross-section upper limits adopting b = 2 for Coma andb = 3 for Virgo and Fornax. The corrected TS and upperlimits for CR models are listed in the last two columns ofTable 2.
12 J. Han et al.
101
102
103
10−27
10−26
10−25
10−24
10−23
10−22
Mχ/GeV
<σv
>U
L[c
m3/s]
ComaFornaxVirgoDwarfFornax−1yr
100
101
102
103
104
10−27
10−26
10−25
10−24
10−23
10−22
Mχ/GeV
<σv
>U
L[c
m3/s]
ComaFornaxVirgoDwarfFornax−1yr
101
102
103
104
10−28
10−27
10−26
10−25
10−24
10−23
Mχ/GeV
<σv
>U
L[c
m3/s]
ComaFornaxVirgoDwarf
Figure 10. Upper limits for the DM annihilation cross-section in the bb (left), µ+µ− (middle), and τ+τ− (right) channels, afterincluding the effect of undetected point sources. Line styles are as in Fig. 6, but only the EXT results are shown. Note that the lowerbounds of each band are still determined by the results without including undetected point sources in the analysis.
4 DISCUSSION AND CONCLUSIONS
We have performed maximum likelihood fits to the 3-yearFermi-LAT data for three galaxy clusters: Coma, Fornax andVirgo. We fit models which, in addition to point sourcesand galactic and extragalactic backgrounds, include emis-sion due to dark matter (DM) annihilation and cosmic rays(CR). For the former, we assume both a point source and thetheoretically predicted extended distribution of gamma raysin three generic annihilation channels, the bb, µ+µ− andτ+τ− channels. When searching for a dark matter signal,we experiment with different treatments of the CR com-ponent. In the traditional Fermi analysis, the extragalacticbackground (EG) is assumed to be a smooth component.In this work we have also investigated a more realistic EGmodel where a fraction of the EG emission comes from apopulation of undetected point sources.
Performing a standard likelihood analysis we obtain thefollowing results:
(i) In all three clusters and for the four different treat-ments of CR we have implemented, no significant detectionof DM emission is obtained. We set upper limits on the fluxand cross-section of DM annihilation in the three clusterswe have investigated. Uncertainties in the CR componenthave only a mild effect on the upper limits: for the differentCR models, the DM upper limit constraints agree to withina factor of two.
Models in which the DM annihilation emission hasthe extended profile predicted by cosmological simula-tions (Gao et al. 2012) have higher flux upper limits thanmodels in which this emission is assumed to be a pointsource. Due to the large luminosity enhancement, of or-der of 1000, by emission from subhalos, the upper limitson the annihilation cross-section for extended models areat least 100 times lower than those for point source mod-els. Our cross-section constraints are much tighter thanthose from an analysis of clusters using the 11-month data(Ackermann et al. 2010), mostly because we take into ac-count the effect of subhalos. Our constraints are also tighterthan those from a joint analysis of Milky Way dwarf galaxies
(Geringer-Sameth & Koushiappas 2011; Ackermann et al.2011).
Our new limits exclude the thermal cross-section forMχ .
100 GeV for bb and τ+τ− final states, and for Mχ . 10 GeVfor µ+µ− final states. We note that the annihilation cross-section in dark matter halos need not be the standard ther-mal cross-section of supersymetric models. In cases wherethe cross-section is velocity dependent, for example, throughp-wave contributions at freeze-out (see e.g., Jungman et al.(1996)), one can easily have a different average cross-section.We emphasize that there is still a large uncertainty ouradopted annihilation profile, which depends on a signifi-cant extrapolation of the resolved subhalo population bymore than 10 orders of magnitude in mass. Taking this intoaccount, the thermal cross-section, however, could still bereconciled with the data by assuming a larger cutoff massin the WIMP power spectrum, thus reducing the contribu-tion from subhalos and hence the J factor. Since the totalenhancement from subhalo emission scales as b ∝ M−0.226
cut
(Springel et al. 2008), a cut-off mass of 10−4M⊙, rather thanour assumed 10−6M⊙, would be sufficient to increase thecross-section limits by a factor of 3.
(ii) Assuming no DM annihilation radiation, the gammaray data for Coma and Virgo already set significant con-straints on the CR level. For Virgo, the data are consistentwith the predictions of the analytic CR model proposed byPinzke & Pfrommer (2010) and Pinzke et al. (2011) while,for Coma, the data place an upper limit that is a factor oftwo below the analytical prediction, indicating either an un-certainty in model parameters such as halo mass, gas densityand maximum shock injection efficiency, ζp,max, or a pecu-liarity of the CR emission in Coma. If attributed to ζp,max,the upper limit on the normalization parameter, αCR, trans-lates into an upper limit on ζp,max of 0.3, assuming a lin-ear form for g(ζp,max). This is consistent with the estimatesobtained independently by Zimmer et al. (2011) for Comausing Fermi data and by the Aleksic et al. (2012) for the Per-sus cluster using MAGIC observations. If interpreted as anerror in the halo mass, a reduction in mass by a factor of 1.6is required to reconcile the model with the upper limits, as-suming a simple CR luminosity scaling relation, Lγ ∝ M1.46
200
Extended Gamma-ray Emission in Clusters 13
(Pinzke & Pfrommer 2010), or a factor of 4.3 according toEqn. D1 in the case when the gas density profile is fixed fromX-ray observations. For Fornax, the zero-significance of a CRcomponent is consistent with the low level predicted by themodel.
(iii) Five new point sources with TS > 25 in Virgo andFornax have been detected in the 45-month data. Ignoringthese new point sources results in a ∼ 5σ detection for a DMcomponent in Virgo, in contrast to a ∼ 3σ detection whenaccount is taken of these point sources.
In addition to the standard likelihood analysis, wehave also investigated a model in which the EG componentincludes a population of undetected point sources whosenumber-flux relation extrapolates smoothly that of the de-tected sources. Using Monte-Carlo simulations, we find thatthe standard Fermi likelihood analysis could overestimatethe TS of extended emission by a factor of 2 − 3, and un-derestimate the upper limits by up to 70 percent. Adoptingthis more realistic EG model yields slightly looser upperlimits, but does not quantitatively change any of the aboveconclusions. Still, it should be kept in mind that these cor-rections are derived from simulations assuming a particulardistribution for the point source population. It is too compu-tationally expensive to explore the parameter space of pointsource populations with Monte-Carlo simulations. A moredetailed and more general analytical study of the effect ofundetected point sources will be presented elsewhere (Hanet. al., in preparation).
In our analysis we have allowed the parameters of 2FGLpoint sources lying within the cluster virial radius to vary.This accounts for possible corrections to the 2FGL parame-ters in the presence of a DM or a CR component, while alsoavoiding the risk of refitting sources lying near the bound-ary of the data region with less accuracy. The parametersof highly variable sources are also kept free since the 2FGLparameters for these sources would be the average duringa 2 year period whereas here we have 45 months of data.However, we also tried keeping all the point sources fixed orallowing the parameters of all the point sources within thedata region to vary during the fitting. We find that this free-dom in the treatment of the point sources has little impacton the DM model fits.
The cluster annihilation luminosity scales roughly lin-early with halo mass, with the shape of the profile beingalmost independent of halo mass or concentration when ex-pressed in terms of the normalized radius r/R200. We inves-tigate the effect of mass uncertainties in Appendix E. Wehave also checked that the different energy cuts assumed inour analysis and in that of Huang et al. (2012) have no effecton the derived upper limits. We are able to reproduce the up-per limits on the annihilation cross-section of Huang et al.(2012) for the test case of the Fornax cluster with 3-yeardata, after adopting the same instrument response functionand correcting for slightly different assumed subhalo contri-butions.
The CR model used in this analysis is still subject to im-provement. This model is derived from simulations which,unavoidably, make simplifying assumptions. For example,the simulations only consider advective transport of CR byturbulent gas motions but there are other processes such asCR diffusion and streaming which may flatten the CR pro-
files (Enßlin et al. 2011). In particular, if the CR diffusionis momentum dependent this will entangle the spectral andspatial profile of CR and modify the morphology as well asthe spectrum of the CR emission, thus invalidating our basicassumption that αCR is the only free parameter. There couldalso be CR injected from AGN which are not accounted forin the current model.
Although we have not detected DM annihilation emis-sion in our small cluster sample, the signal-to-noise ratio canpotentially be enhanced by stacking many clusters. Such ananalysis was recently carried out by Huang et al. (2012), butthe signal-to-noise was degraded because of their assumptionof an NFW annihilation profile. These authors considered anextended subhalo-dominated annihilation profile but onlyfor individual clusters, not for the stack. Their stacked anal-ysis placed looser constraints on DM annihilation emissionthan their analysis of individual clusters, presumably be-cause the use of an inappropriate theoretical profile resultedin the different clusters yielding inconsistent results. Thus,it is clearly worth repeating the joint analysis with the “cor-rect” subhalo-dominated profile. It is also tempting to ex-tend the search for DM annihilation using multi-wavelengthdata, from the radio to very high energy gamma-rays andeven in the neutrino channel(Dasgupta & Laha 2012), wheredifferent systematics are expected for different bands.
ACKNOWLEDGMENTS
We thank Shaun Cole, Jie Liu, Yu Gao, John Lucey,Anders Pinzke, Christoff Pfrommer, Dan Hooper, NealWeiner, Douglas Finkbeiner, Gregory Dobbler, Louie Stri-gari, Christoph Weniger, Savvas Koushiappas, and FabioZandanel for helpful discussions. JXH acknowledges thesupport on software issues from Tesla Jeltema and theFermi science support team, especially Elizabeth C. Ferrara,Jeremy S. Perkins, Dave Davis and Robin Corbet. JXH issupported by the European Commissions Framework Pro-gramme 7, through the Marie Curie Initial Training Net-work Cosmo-Comp (PITNGA-2009-238356), and partiallysupported by NSFC (10878001, 11033006, 11121062) andby the CAS/SAFEA International Partnership Program forCreative Research Teams (KJCX2-YW-T23). CSF acknowl-edges a Royal Society Wolfson research merit award and anERC Advanced Investigator grant. The calculations for thiswork were performed on the ICC Cosmology Machine, whichis part of the DiRAC Facility jointly funded by STFC, theLarge Facilities Capital Fund of BIS, and Durham Univer-sity. This work was supported in part by an STFC rollinggrant to the ICC. The work of D.M. is supported in partfrom the SCOPES project IZ73Z0 128040 of Swiss NationalScience Foundation, grant No CM-203-2012 for young scien-tists of National Academy of Sciences of Ukraine, Cosmomi-crophysics programme of the National Academy of Sciencesof Ukraine and by the State Programme of Implementationof Grid Technology in Ukraine.
REFERENCES
Aalseth C. E. et al., 2011a, Physical Review Letters, 106,131301, arXiv:1002.4703
14 J. Han et al.
Aalseth C. E. et al., 2011b, Physical Review Letters, 107,141301, arXiv:1106.0650
Abazajian K. N., Kaplinghat M., 2012, Phys. Rev. D, 86,083511, arXiv:1207.6047
Abdo A. A. et al., 2010, ApJ, 720, 435, arXiv:1003.0895
Abdo A. A. et al., 2009, ApJ, 707, 55, arXiv:0910.3565
Ackermann M. et al., 2011, Physical Review Letters, 107,241302, arXiv:1108.3546
Ackermann M. et al., 2010, J. Cosmology Astropart. Phys.,5, 25, arXiv:1002.2239
Ahmed Z., et al., 2011, Physical Review Letters, 106,131302, arXiv:1011.2482
Aleksic J. et al., 2012, A&A, 541, A99, arXiv:1111.5544
Angloher G. et al., 2012, European Physical Journal C, 72,1971, arXiv:1109.0702
Aprile E., et al., 2011, Physical Review Letters, 107,131302, arXiv:1104.2549
Baxter E. J., Dodelson S., 2011, Phys. Rev. D, 83, 123516,arXiv:1103.5779
Bernabei R. et al., 2010, European Physical Journal C, 67,39, arXiv:1002.1028
Bertone G., Hooper D., Silk J., 2004, Phys. Rep., 405, 279
Bohringer H., Briel U. G., Schwarz R. A., Voges W., Hart-ner G., Trumper J., 1994, Nature, 368, 828
Boyarsky A., Malyshev D., Ruchayskiy O., 2011, PhysicsLetters B, 705, 165, arXiv:1012.5839
Boyarsky A., Malyshev D., Ruchayskiy O., 2012, ArXive-prints, arXiv:1205.4700
Bringmann T., Huang X., Ibarra A., Vogl S., WenigerC., 2012, J. Cosmology Astropart. Phys., 7, 54,arXiv:1203.1312
Ciafaloni P., Comelli D., Riotto A., Sala F., Strumia A.,Urbano A., 2011, J. Cosmology Astropart. Phys., 3, 19,arXiv:1009.0224
Cirelli M. et al., 2011, J. Cosmology Astropart. Phys., 3,51, arXiv:1012.4515
Collar J. I., 2011a, ArXiv e-prints, arXiv:1103.3481
Collar J. I., 2011b, ArXiv e-prints, arXiv:1106.0653
Dasgupta B., Laha R., 2012, ArXiv e-prints,arXiv:1206.1322
Diemand J., Kuhlen M., Madau P., 2007, ApJ, 657, 262,arXiv:astro-ph/0611370
Duffy A. R., Schaye J., Kay S. T., Dalla Vecchia C., 2008,MNRAS, 390, L64, arXiv:0804.2486
Enßlin T., Pfrommer C., Miniati F., Subramanian K., 2011,A&A, 527, A99, arXiv:1008.4717
Finkbeiner D. P., 2004, ArXiv e-prints,arXiv:astro-ph/0409027
Fouque P., Solanes J. M., Sanchis T., Balkowski C., 2001,A&A, 375, 770, arXiv:astro-ph/0106261
Gao L., Frenk C. S., Jenkins A., Springel V., WhiteS. D. M., 2012, MNRAS, 419, 1721, arXiv:1107.1916
Geringer-Sameth A., Koushiappas S. M., 2011, PhysicalReview Letters, 107, 241303, arXiv:1108.2914
Gondolo P., Silk J., 1999, Physical Review Letters, 83,1719, arXiv:astro-ph/9906391
Han J., Frenk C. S., Eke V. R., Gao L., White S. D. M.,2012, ArXiv e-prints, arXiv:1201.1003
Hoffman G. L., Olson D. W., Salpeter E. E., 1980, ApJ,242, 861
Hooper D., 2012, ArXiv e-prints, arXiv:1201.1303
Hooper D., Finkbeiner D. P., Dobler G., 2007,Phys. Rev. D, 76, 083012, arXiv:0705.3655
Hooper D., Goodenough L., 2011, Physics Letters B, 697,412, arXiv:1010.2752
Hooper D., Linden T., 2011a, Phys. Rev. D, 83, 083517,arXiv:1011.4520
Hooper D., Linden T., 2011b, Phys. Rev. D, 84, 123005,arXiv:1110.0006
Huang X., Vertongen G., Weniger C., 2012, J. CosmologyAstropart. Phys., 1, 42, arXiv:1110.1529
Jeltema T. E., Kehayias J., Profumo S., 2009,Phys. Rev. D, 80, 023005, arXiv:0812.0597
Jungman G., Kamionkowski M., Griest K., 1996,Phys. Rep., 267, 195, arXiv:hep-ph/9506380
Karachentsev I. D., Nasonova O. G., 2010, MNRAS, 405,1075, arXiv:1002.2085
Linden T., Hooper D., Yusef-Zadeh F., 2011, ApJ, 741, 95,arXiv:1106.5493
Macıas-Ramırez O., Gordon C., Brown A. M., Adams J.,2012, Phys. Rev. D, 86, 076004, arXiv:1207.6257
Mattox J. R. et al., 1996, ApJ, 461, 396Nolan P. L., Abdo A. A., AckermannM., Ajello M., AllafortA., et al., 2012, ApJS, 199, 31, arXiv:1108.1435
Pinzke A., Pfrommer C., 2010, MNRAS, 409, 449,arXiv:1001.5023
Pinzke A., Pfrommer C., Bergstrom L., 2011, Phys. Rev. D,84, 123509, arXiv:1105.3240
Schindler S., Binggeli B., Bohringer H., 1999, A&A, 343,420, arXiv:astro-ph/9811464
Smith S., 1936, ApJ, 83, 23Springel V. et al., 2008, Nature, 456, 73, arXiv:0809.0894Su M., Finkbeiner D. P., 2012, ArXiv e-prints,arXiv:1206.1616
Tempel E., Hektor A., Raidal M., 2012, J. Cosmology As-tropart. Phys., 9, 32, arXiv:1205.1045
Tonry J. L., Blakeslee J. P., Ajhar E. A., Dressler A., 2000,ApJ, 530, 625, arXiv:astro-ph/9907062
Tully R. B., Shaya E. J., 1984, ApJ, 281, 31Urban O., Werner N., Simionescu A., Allen S. W.,Bohringer H., 2011, MNRAS, 414, 2101, arXiv:1102.2430
Vitale V., Morselli A., for the Fermi/LAT Collaboration,2009, ArXiv e-prints, arXiv:0912.3828
Weniger C., 2012, J. Cosmology Astropart. Phys., 8, 7,arXiv:1204.2797
Zaharijas G., Cuoco A., Yang Z., Conrad J., 2010, ArXive-prints, arXiv:1012.0588
Zimmer S., Conrad J., for the Fermi-LAT Collaboration,Pinzke A., 2011, ArXiv e-prints, arXiv:1110.6863
APPENDIX A: DETECTION OF NEW POINT
SOURCES
We model the new point sources assuming power-law spec-tra. For a given pixel, we calculate the TS value for an as-sumed new point source centered on that pixel. The TScalculation is performed using the binned method in thepyLikelihood tool, with a null model which includes theGAL and EG components and all the 2FGL sources within15 deg of each cluster, but with the parameters of the 2FGLsources fixed. Around each cluster, we carry out a first scan
Extended Gamma-ray Emission in Clusters 15
of all the pixels within the cluster virial radius (and within4 deg around Coma) using a pixel size of 0.2 deg.
Regions with a peak TS > 16 are identified as potentiallocations of new point sources. We then scan each poten-tial point source region using 10 times smaller pixels. Thecalculated TS map is then interpolated with cubic splinesdown to 0.002 deg/pixel. The value and location of the TSpeak is taken as the TS and position for a new point source,if the peak TS > 25. In case several peaks are clustered,we first extract the primary TS peak, then scan for lowerTS peaks by including the newly detected sources into thenull model. In our sample, no secondary peaks survive thisiterative examination to be identified as new point sources.
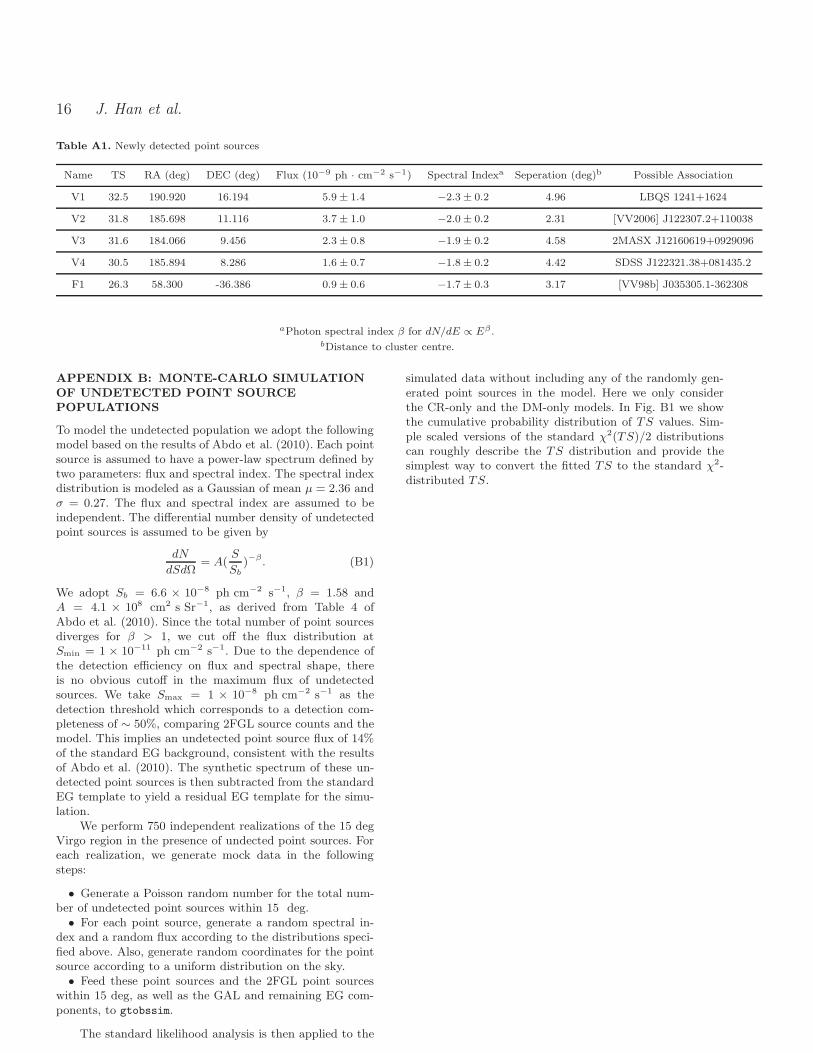
The new point sources are listed in Table A1, and plotedin Figure 1 and C1. Sources in Virgo and Fornax are prefixedby “V” and “F” in their names respectively. None of thesenew sources show significant variability when binned overmonthly scale. The last column of Table A1 shows possibleassociations of astrophysical sources with these new detec-tions, which are found to lie within the 2σ confidence regionof the detections.
16 J. Han et al.
Table A1. Newly detected point sources
Name TS RA (deg) DEC (deg) Flux (10−9 ph · cm−2 s−1) Spectral Indexa Seperation (deg)b Possible Association
V1 32.5 190.920 16.194 5.9± 1.4 −2.3± 0.2 4.96 LBQS 1241+1624
V2 31.8 185.698 11.116 3.7± 1.0 −2.0± 0.2 2.31 [VV2006] J122307.2+110038
V3 31.6 184.066 9.456 2.3± 0.8 −1.9± 0.2 4.58 2MASX J12160619+0929096
V4 30.5 185.894 8.286 1.6± 0.7 −1.8± 0.2 4.42 SDSS J122321.38+081435.2
F1 26.3 58.300 -36.386 0.9± 0.6 −1.7± 0.3 3.17 [VV98b] J035305.1-362308
aPhoton spectral index β for dN/dE ∝ Eβ .bDistance to cluster centre.
APPENDIX B: MONTE-CARLO SIMULATION
OF UNDETECTED POINT SOURCE
POPULATIONS
To model the undetected population we adopt the followingmodel based on the results of Abdo et al. (2010). Each pointsource is assumed to have a power-law spectrum defined bytwo parameters: flux and spectral index. The spectral indexdistribution is modeled as a Gaussian of mean µ = 2.36 andσ = 0.27. The flux and spectral index are assumed to beindependent. The differential number density of undetectedpoint sources is assumed to be given by
dN
dSdΩ= A(
S
Sb)−β. (B1)
We adopt Sb = 6.6 × 10⁻⁸ ph cm−2 s−1, β = 1.58 andA = 4.1 × 108 cm2 s Sr−1, as derived from Table 4 ofAbdo et al. (2010). Since the total number of point sourcesdiverges for β > 1, we cut off the flux distribution atSmin = 1 × 10⁻¹¹ ph cm−2 s−1. Due to the dependence ofthe detection efficiency on flux and spectral shape, thereis no obvious cutoff in the maximum flux of undetectedsources. We take Smax = 1 × 10⁻⁸ ph cm−2 s−1 as thedetection threshold which corresponds to a detection com-pleteness of ∼ 50%, comparing 2FGL source counts and themodel. This implies an undetected point source flux of 14%of the standard EG background, consistent with the resultsof Abdo et al. (2010). The synthetic spectrum of these un-detected point sources is then subtracted from the standardEG template to yield a residual EG template for the simu-lation.
We perform 750 independent realizations of the 15 degVirgo region in the presence of undected point sources. Foreach realization, we generate mock data in the followingsteps:
• Generate a Poisson random number for the total num-ber of undetected point sources within 15 deg.
• For each point source, generate a random spectral in-dex and a random flux according to the distributions speci-fied above. Also, generate random coordinates for the pointsource according to a uniform distribution on the sky.
• Feed these point sources and the 2FGL point sourceswithin 15 deg, as well as the GAL and remaining EG com-ponents, to gtobssim.
The standard likelihood analysis is then applied to the
simulated data without including any of the randomly gen-erated point sources in the model. Here we only considerthe CR-only and the DM-only models. In Fig. B1 we showthe cumulative probability distribution of TS values. Sim-ple scaled versions of the standard χ2(TS)/2 distributionscan roughly describe the TS distribution and provide thesimplest way to convert the fitted TS to the standard χ2-distributed TS.
Extended Gamma-ray Emission in Clusters 17
0 5 10 15 20 2510
−3
10−2
10−1
100
TS
P(>
TS)
VirgoFornaxComaχ2(TS)/2
χ2(TS/1.8)/2
χ2(TS/3.3)/2
0 5 10 15 20 2510
−3
10−2
10−1
100
TS
P(>
TS)
VirgoFornaxComaχ2(TS)/2
χ2(TS/1.8)/2
χ2(TS/3.3)/2
Figure B1. Distribution of TS from simulated data which include a population of undetected point sources. Left: the distribution ofTS for DM-only models, where the DM particle mass is taken to be ∼ 30 GeV and the DM follows the EXT cluster profile. Right: thedistribution of TS for CR-only models. In each panel the dashed lines show the distribution extracted from the simulations for threecluster models and the solid lines show a rescaled version of the standard cumulative χ2 distribution.
APPENDIX C: GAMMA-RAY IMAGES FOR
COMA AND FORNAX
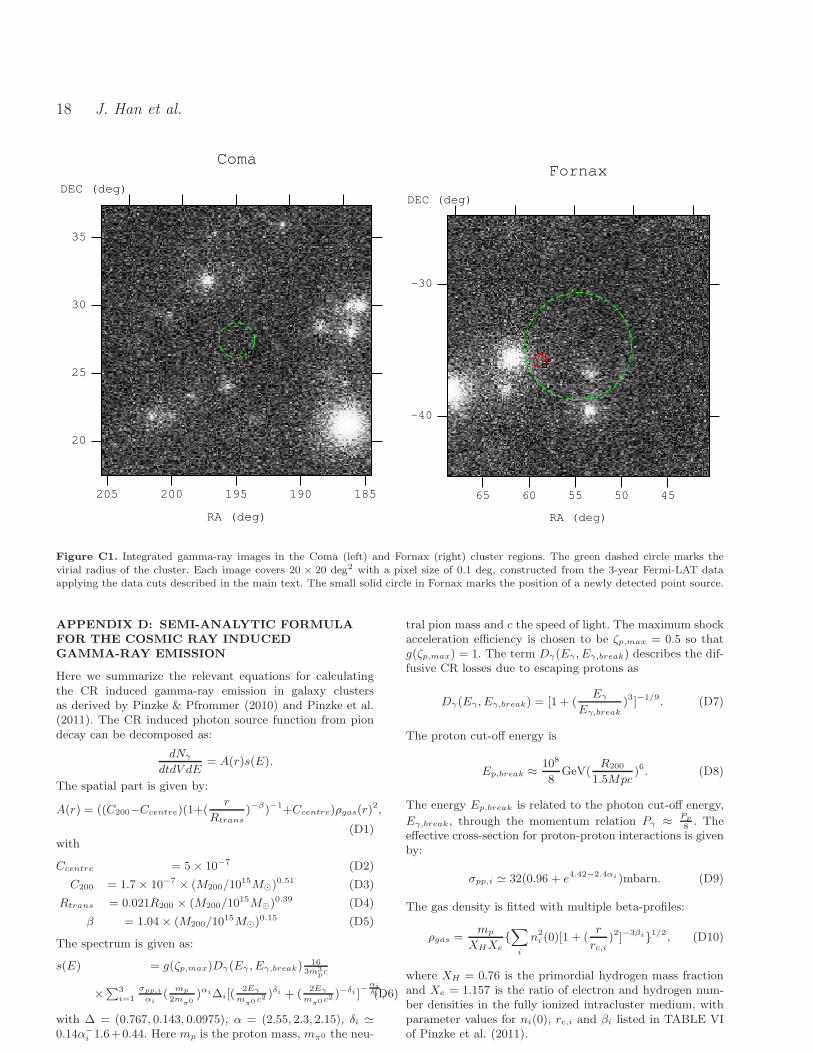
In this Appendix we show gamma-ray images for the Comaand Fornax cluster regions. The corresponding image forVirgo is shown in Fig. 1.
18 J. Han et al.
185190195200205
20
25
30
35
RA (deg)
DEC (deg)
Coma
4550556065
-40
-30
RA (deg)
DEC (deg)
Fornax
Figure C1. Integrated gamma-ray images in the Coma (left) and Fornax (right) cluster regions. The green dashed circle marks the
virial radius of the cluster. Each image covers 20 × 20 deg2 with a pixel size of 0.1 deg, constructed from the 3-year Fermi-LAT dataapplying the data cuts described in the main text. The small solid circle in Fornax marks the position of a newly detected point source.
APPENDIX D: SEMI-ANALYTIC FORMULA
FOR THE COSMIC RAY INDUCED
GAMMA-RAY EMISSION
Here we summarize the relevant equations for calculatingthe CR induced gamma-ray emission in galaxy clustersas derived by Pinzke & Pfrommer (2010) and Pinzke et al.(2011). The CR induced photon source function from piondecay can be decomposed as:
dNγ
dtdV dE= A(r)s(E).
The spatial part is given by:
A(r) = ((C200−Ccentre)(1+(r
Rtrans)−β)−1+Ccentre)ρgas(r)
2,
(D1)with
Ccentre = 5× 10⁻⁷ (D2)
C200 = 1.7× 10⁻⁷ × (M200/1015M⊙)
0.51 (D3)
Rtrans = 0.021R200 × (M200/1015M⊙)
0.39 (D4)
β = 1.04× (M200/1015M⊙)
0.15 (D5)
The spectrum is given as:
s(E) = g(ζp,max)Dγ(Eγ , Eγ,break)16
3m3pc
×∑3i=1
σpp,i
αi(
mp
2mπ0
)αi∆i[(2Eγ
mπ0 c2
)δi + (2Eγ
mπ0 c2
)−δi ]−αi
δi ,(D6)
with ∆ = (0.767, 0.143, 0.0975), α = (2.55, 2.3, 2.15), δi ≃0.14α−
i 1.6+0.44. Here mp is the proton mass, mπ0 the neu-
tral pion mass and c the speed of light. The maximum shockacceleration efficiency is chosen to be ζp,max = 0.5 so thatg(ζp,max) = 1. The term Dγ(Eγ , Eγ,break) describes the dif-fusive CR losses due to escaping protons as
Dγ(Eγ , Eγ,break) = [1 + (Eγ
Eγ,break)3]−1/9. (D7)
The proton cut-off energy is
Ep,break ≈ 108
8GeV(
R200
1.5Mpc)6. (D8)
The energy Ep,break is related to the photon cut-off energy,
Eγ,break, through the momentum relation Pγ ≈ Pp
8. The
effective cross-section for proton-proton interactions is givenby:
σpp,i ≃ 32(0.96 + e4.42−2.4αi )mbarn. (D9)
The gas density is fitted with multiple beta-profiles:
ρgas =mp
XHXe∑
i
n2i (0)[1 + (
r
rc,i)2]−3βi1/2, (D10)
where XH = 0.76 is the primordial hydrogen mass fractionand Xe = 1.157 is the ratio of electron and hydrogen num-ber densities in the fully ionized intracluster medium, withparameter values for ni(0), rc,i and βi listed in TABLE VIof Pinzke et al. (2011).
Extended Gamma-ray Emission in Clusters 19
101
102
103
10−27
10−26
10−25
10−24
10−23
Mχ/GeV
<σv
>U
L[c
m3/s]
1.4 × 10¹⁴M⊙
6.0 × 10¹⁴M⊙
7.5 × 10¹⁴M⊙
9.0 × 10¹⁴M⊙
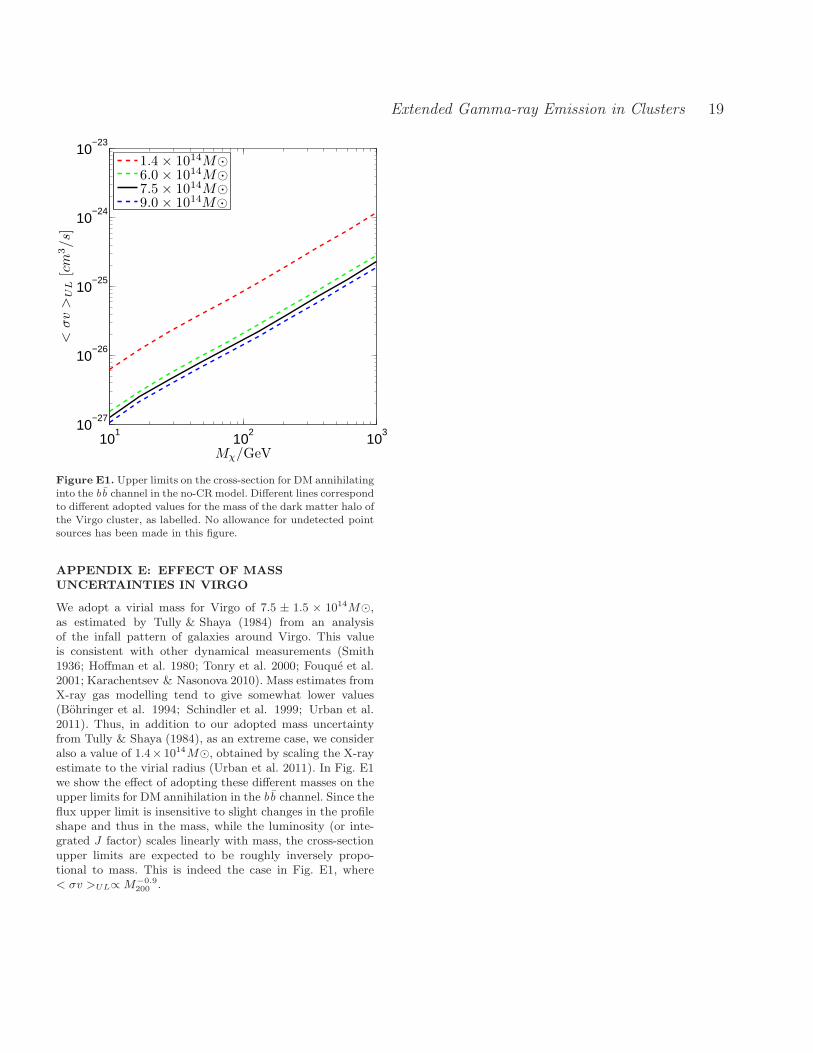
Figure E1. Upper limits on the cross-section for DM annihilatinginto the bb channel in the no-CRmodel. Different lines correspondto different adopted values for the mass of the dark matter halo ofthe Virgo cluster, as labelled. No allowance for undetected pointsources has been made in this figure.
APPENDIX E: EFFECT OF MASS
UNCERTAINTIES IN VIRGO
We adopt a virial mass for Virgo of 7.5 ± 1.5 × 10¹⁴M⊙,as estimated by Tully & Shaya (1984) from an analysisof the infall pattern of galaxies around Virgo. This valueis consistent with other dynamical measurements (Smith1936; Hoffman et al. 1980; Tonry et al. 2000; Fouque et al.2001; Karachentsev & Nasonova 2010). Mass estimates fromX-ray gas modelling tend to give somewhat lower values(Bohringer et al. 1994; Schindler et al. 1999; Urban et al.2011). Thus, in addition to our adopted mass uncertaintyfrom Tully & Shaya (1984), as an extreme case, we consideralso a value of 1.4× 10¹⁴M⊙, obtained by scaling the X-rayestimate to the virial radius (Urban et al. 2011). In Fig. E1we show the effect of adopting these different masses on theupper limits for DM annihilation in the bb channel. Since theflux upper limit is insensitive to slight changes in the profileshape and thus in the mass, while the luminosity (or inte-grated J factor) scales linearly with mass, the cross-sectionupper limits are expected to be roughly inversely propo-tional to mass. This is indeed the case in Fig. E1, where< σv >UL∝ M−0.9
200 .


