Embed Size (px)
Citation preview
arX
iv:a
stro
-ph/
0508
592v
1 2
7 A
ug 2
005
Astronomy & Astrophysics manuscript no.(will be inserted by hand later)
Cosmological constraints from clustering properties of
galaxy clusters.
A. Del Popolo1,2, N. Ercan1 and I. S. Yesilyurt1
1 Bogazici University, Physics Department, 80815 Bebek, Istanbul, Turkey2 Dipartimento di Matematica, Universita Statale di Bergamo, via dei Caniana, 2, 24127,Bergamo, ITALY
Abstract. An abstract should be given
n this paper, we discuss improvements of theSuto et al. (2000) model, in the light of recent the-oretical developments (new theoretical mass func-tions, a more accurate mass-temperature relationand an improved bias model) to predict the clus-tering properties of galaxy clusters and to obtainconstraints on cosmological parameters. We re-derive the two-point correlation function of clus-ters of galaxies for OCDM and ΛCDM cosmolog-ical models, and we compare these results withthe observed spatial correlation function for clus-ters in RASS1 (ROSAT All-Sky Survey 1), andin XBACs (X-RAY Brighest Abell-Type) samples.The comparison shows that the best agreement isobtained for the ΛCDM model with Ωm = 0.3.The values of the correlation length obtained,(r0 ≃ 28.2 ± 5.2h−1 Mpc for ΛCDM), are largerthan those found in the literature and compara-ble with the results found in Borgani, Plionis &Kolokotronis (1999). In order to study the possi-ble dependence of the clustering properties of theX-ray clusters on the observational characteristicsdefining the survey, we calculated the values of thecorrelation length r0 in the catalogues where wevary the limiting X-ray flux Slim. The result showsan increase of r0 with Llim, and correlation lengthsthat are larger than in previous papers in litera-ture (e.g Moscardini, Matarrese & Mo 2001 (here-after MMM); Suto et al. 2000). These differencesare due essentially to the different M-T, mass func-tion and bias model used in this paper. Then, weperform a maximum-likelihood analysis by com-paring the theoretical predictions to a set of ob-servational data in the X-ray band (RASS1 BrightSample, BCS (Rosat Brightest Cluster Sample),XBACs, REFLEX (ROSAT-ESO Flux Limited X-Ray Sample)), similarly to MMM. In the frame-
work of cold dark matter models, we compute theconstraints on cosmological parameters, such asthe matter density Ωm, the contribution to densitydue to the cosmological constant, ΩΛ, the power-spectrum shape parameter Γ and normalizationσ8. If we fix Γ and σ8, at the values suggestedby different observational datasets, we obtain (forflat cosmological models with varying cosmologi-cal constant Ω0Λ = 1 − Ω0m) constraints on thematter density parameter: 0.25 ≤ Ω0m ≤ 0.45 and0.23 ≤ Ω0m ≤ 0.52 at the 95.4 and 99.73 percent levels, respectively, which is 20-30 % largerthan the values obtained MMM. Leaving Γ, andΩm0, free for the flat model, the constraints forΓ are 0.1 ≤ Γ ≤ 0.14, while for the open model0.09 ≤ Γ ≤ 0.13. These values are smaller thanthose of MMM by about 20− 30%. If we keep thevalues of ΩΛ fixed, we obtain the constraints in theΓ− σ8 plane. For the open model with Ω0m = 0.3the 2σ region for Γ is 0.11-0.2 for σ8 it is 0.7 and1.55. For the flat model with Ω0m = 0.3 the 2σregion has 0.13 ≤ Γ ≤ 0.2 and 0.8 ≤ σ8 ≤ 1.6The values of σ8 obtained are larger than those ofMMM by ≃ 20%. If we allow the shape parame-ter to vary, we find that the clustering propertiesof clusters are almost independent of the matterdensity parameter and of the presence of a cosmo-logical constant, while they appear to be stronglydependent on the shape parameter.
Key words. cosmology: theory - large scale struc-ture of universe - galaxies: formation
1. Introduction
X-ray studies of clusters of galaxies have provideda large amount of quantitative data for the study

2 A. Del Popolo et al.: Cosmological constraints from galaxy clusters.
of cosmology. The mass of a rich cluster is ap-proximately 1015h−1M⊙. 1 This mass lies withina region of diameter ≃ 20h−1Mpc and conse-quently the observations of clusters can provide in-formation on the mass distribution of the Universeon these scales. Furthermore, since rich clustersare rare objects, their properties are expected tobe sensitive to the underlying mass density fieldfrom which they originated. Therefore, clusters ofgalaxies appear to be ideal tools for testing the-ories of structure formation as well as studyinglarge-scale structure.
X-ray catalogues of X-ray selected clustersare now available from ROSAT: RASS1 (DeGrandi et al. 1999) (ROSAT All-Sky survey 1),BCS (Ebeling et al. 1998) (ROSAT BrightestCluster Sample), XBACs (Ebeling et al. 1996)(X-ray brightest Abell Cluster Sample), REFLEX(Bohringer et al. 1998) (ROSAT-ESO Flux-Limited X-ray sample) and the volume coveredby the samples is expected to increase throughthe X-ray satellites such asAstro-E, Chandra, andXMM. These data together with optical data havebeen used to compute the cluster number countsand the X-ray luminosity function, which have rel-evant cosmological implications. In particular, theanalysis of the cluster abundance (also as a func-tion of redshift) has been used widely to provideestimates of the mass fluctuation amplitude andof the matter density parameter Ωm, with sev-eral, often discrepant results (Kitayama & Suto1997; Mathiesen & Evrard 1998; Sadat, Blanchard& Oukbir 1998; Reichart et al. 1999a,b; Viana &Liddle 1999; Blanchard, Bartlett & Sadat 1998;Eke et al. 1998; Bahcall, Fan & Cen 1997; Fan,Bahcall & Cen 1997; Bahcall & Fan 1998; Donahue& Voit 1999; Borgani et al. 2001). An alternativeapproach to the abundance of clusters is based onthe study of the spatial distribution of selectedclusters. The standard statistical tools used withthis aim are the (spatial and angular) two-pointcorrelation function and the power-spectrum.
The two-point correlation function is a funda-mental statistical test for the study of the clus-ter distribution and is relatively straightforwardto determine from observational data. The spa-tial correlation function of galaxy clusters pro-vides an important cosmological test, as both theamplitude of the correlation function and its de-pendence upon the mean intercluster separationare determined by the underlying cosmologicalmodel. Like for the cluster abundance, discrepantresults have been found for, e.g., the correlation
1 h = H0/(100kms−1Mpc−1), H0 being the Hubbleconstant at the current epoch (in the paper we adopth = 0.65) (see Spergel et al. (2003), Tegmark et al.(2004)).
length (Hauser & Peebles 1973; Bahcall & Soneira1983; Klypin & Kopylov 1983; Bahcall & Cen1992, Bahcall & West 1992; Efstathiou et al. 1992,Governato et al. 1999).
As shown in some papers (Eke et al. 1998;Reichart et al. 1999a,b; Donahue & Voit 1999;Borgani et al. 2001; Del Popolo 2003), the rea-sons leading to the quoted discrepancies are notonly connected to the observational data used, butother unknown systematic effects may be plagu-ing a large part of the quoted results (Reichartet al. 1999a,b; Eke et al. 1998; Donahue & Voit1999; Borgani et al. 2001). Systematic effects en-tering the quoted analyses are: 1) The inadequateapproximation given by the Press-Schechter rela-tion (e.g., Bryan & Norman 1998). 2) Inadequacyin the structure formation as described by thespherical model leading to changes in the thresh-old parameter δc (e.g., Governato et al. 1999).3) Inadequacy in the M-T relation obtained fromthe virial theorem (see Voit & Donahue 1998;Del Popolo 2002a). 4) Effects of cooling flows. 5)Missing high redshift clusters in the data used(e.g., the EMSS ). 6) Evolution of the L-T rela-tion.
Although the quoted uncertainties have so farbeen of minor importance with respect to thepaucity of observational data, a breakthrough isneeded in the quality of the theoretical frameworkif high-redshift clusters are to contribute to in thehigh-precision-era of observational cosmology.
Moreover, the proper comparison of the two-point correlation function with X-ray data, re-quires better theoretical predictions which takeaccount of the selection function of X-ray clusters(Kitayama, Sasaki & Suto 1998), the luminosity-and time dependent bias (Mo & White 1996;Jing 1998; Moscardini et al. 1998), the light-coneeffect (Matarrese et al. 1997; Matsubara, Suto& Szapudi 1997; Nakamura, Matsubara & Suto1998; Yamamoto & Suto 1999) and the redshift-space distortion (Hamilton 1998; Matsubara &Suto 1996; Suto et al. 2000; Nishioka & Yamamoto1999; Yamamoto, Nishioka & Suto 1999; Magira,Jing & Suto 2000).
The above discussion and recent developmentsin terms of both theory (improved relations for themass function, M-T relation, and bias) and obser-vation (X-ray data) suggest that it would be usefulto recalculate the two-point correlation functionand to revisit the constraints on cosmological pa-rameters obtained until now.
Likely in Del Popolo (2003), in the present pa-per we are principally interested in studying theeffects of these changes on the values of the cos-mological parameters and in comparing them withprevious estimates, and then in the specific valuesobtained. For this reason, we made a comparison
A. Del Popolo et al.: Cosmological constraints from galaxy clusters. 3
of the theoretical results with observations usingseveral samples such as RASS1 and XBAC, evenif it is known that the REFLEX is more precise(small errorbars). The paper is organized as fol-lows: in Sect. 2, we introduce the model used. Sect.3 is devoted to the results and Sect. 4 to discussionand conclusions.
2. Theoretical model
2.1. Redshift-space distortion
In order to obtain a theoretical model for the spa-tial two-point correlation function of galaxies indifferent cosmologies, we follow and improve thepaper of Suto et al. (2000) (hereafter S2000). Theirmodel takes proper account of nonlinear gravi-tational evolution of mass fluctuations, redshift-space distortion due to the linear peculiar veloc-ity field and to finger-of-god effect, cluster abun-dance and bias evolution on the basis of the Press– Schechter theory, and the light-cone effect.
As previously reported, one of the effects totake into account is the two-point correlation func-tion distortions due to the peculiar velocity field.We take into account this redshift-space distortionfollowing Cole et al. (1994), Magira et al.(2000)and Yamamoto et al. (1999). Assuming that thebias of the cluster density field relative to the massdensity field is linear and scale-independent, thepower spectrum in redshift space is well approxi-mated by:
P Scl(k, µ, z) = PR
mass(k, z) [bcl(z)]2
[
1 + β(z)µ2
1 + (kµσv)2/2
]2
,(1)
where PRmass(k, z) is the mass power spectrum in
real space, µ the direction cosine of the wavenum-ber vector and the line-of-sight of the fiducial ob-server, and β is linear redshift-space distortion(Kaiser 1987), defined by
β(z) =1
bcl(z)
d lnD1(z)
d ln a(z), (2)
where bcl(z) is the redshift-dependent bias factorand D1(z) is the linear growth factor normalizedto be unity at the present time.
The denominator in Eq. (1) takes account ofthe nonlinear redshift-space distortion (finger-of-
God) assuming that the pair-wise velocity distri-bution in real space is exponential with the veloc-ity dispersion of σv(z).
As in S2000, to calculate σv we use the fittingformula of Mo, Jing & Borner (1997). AveragingEq. (1) over the angle with respect to the line-of-sight of the observer one obtains P S
cl(k, z) similarlyto S2000 (Eq. 4-7). The corresponding two-point
correlation function of clusters in redshift space iscomputed as
ξScl(R, z) =
1
2π2
∫ ∞
0
dkk2P Scl(k, z)j0(kR), (3)
where j0(kR) is the spherical Bessel function.
2.2. The evolution of the mass auto-correlation
function
To predict the clustering properties of X-ray clus-ters, we need a description of the matter covari-ance function and its redshift evolution. To thisaim we used the method of Smith et al. (2003),which is an improvement of the method of Peacock& Dodds (1994), and Peacock & Dodds (1996)2 for evolving ξ(r, z) into the fully non-linearregime. The authors adopted a new approach tofitting power spectra, based upon a fusion of thehalo model and HKLM (Hamilton, Kumar, Lu,Matthews) scaling. This approach has been em-pirically shown to allow an accurate description ofa very wide range of power spectrum data. Theirformula reproduced the scale-free power spectrumdata and also the CDM results of Jing (1998) withan rms error better than 7% (see Smith et al.(2003) for more details and their Appendix for thefitting formula).
The linear power spectrum used in this pa-per, PL ∝ knT 2(k), uses the Bardeen et al.(1986) transfer function T (k) (Bardeen et al.(1986)(Eq. (G3)), and the shape parameter Γ isgiven by:
Γ = Ω0mh exp(−Ω0b −√
h/0.5 Ω0b/Ω0m) , (4)
(Sugiyama 1995), where Ω0m is the baryonic con-tribution to the density parameter. In the partof the paper dealing with the direct comparisonwith XBACs and RASS1 data, we consider anopen CDM model (OCDM), with matter densityparameter Ω0m = 0.3 and σ8 = 0.87, and a low-density flat CDM model (ΛCDM), with Ω0m =0.3, and σ8 = 0.93 (see e.g. Liddle et al. 1996a,band references therein).
In the part of the paper dealing with themaximum-likelihood analysis the value of Γ is al-lowed to vary in the range 0.05–0.5, while Ω0m
ranges from 0.1 to 1 in the framework of both openand flat models. The normalizations of the primor-dial power-spectrum, parameterized by σ8 (ther.m.s. fluctuation amplitude in a sphere of 8h−1
Mpc) is allowed to vary in the range 0.2 ≤ σ8 ≤ 2.In the maximum-likelihood analysis the cosmolog-ical models considered, are defined by four param-eters: Ω0m, Ω0Λ, Γ and σ8.
2 Based on Hamilton et al. (1991) original ansatz
4 A. Del Popolo et al.: Cosmological constraints from galaxy clusters.
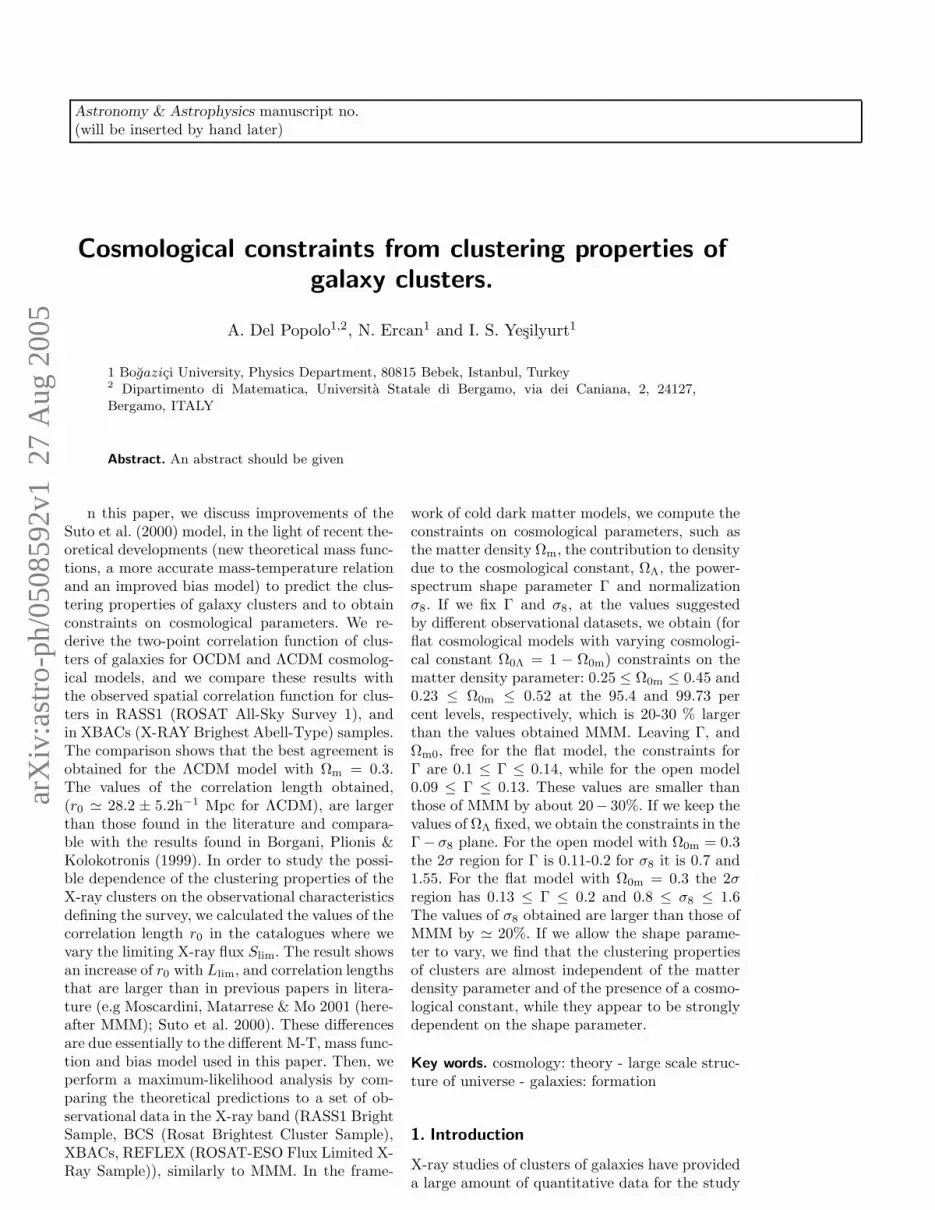
Fig. 1. The bias factor b(ν) as a function of ν2.The solid line represents the spherical collapse pre-diction of Mo & White (1996), the dotted line theprediction for b obtained from the model of thispaper and the dashed line the ellipsoidal collapseprediction of Sheth & Tormen (1999).
1 10
Fig. 2
0.1 1 100.001
0.01
0.1
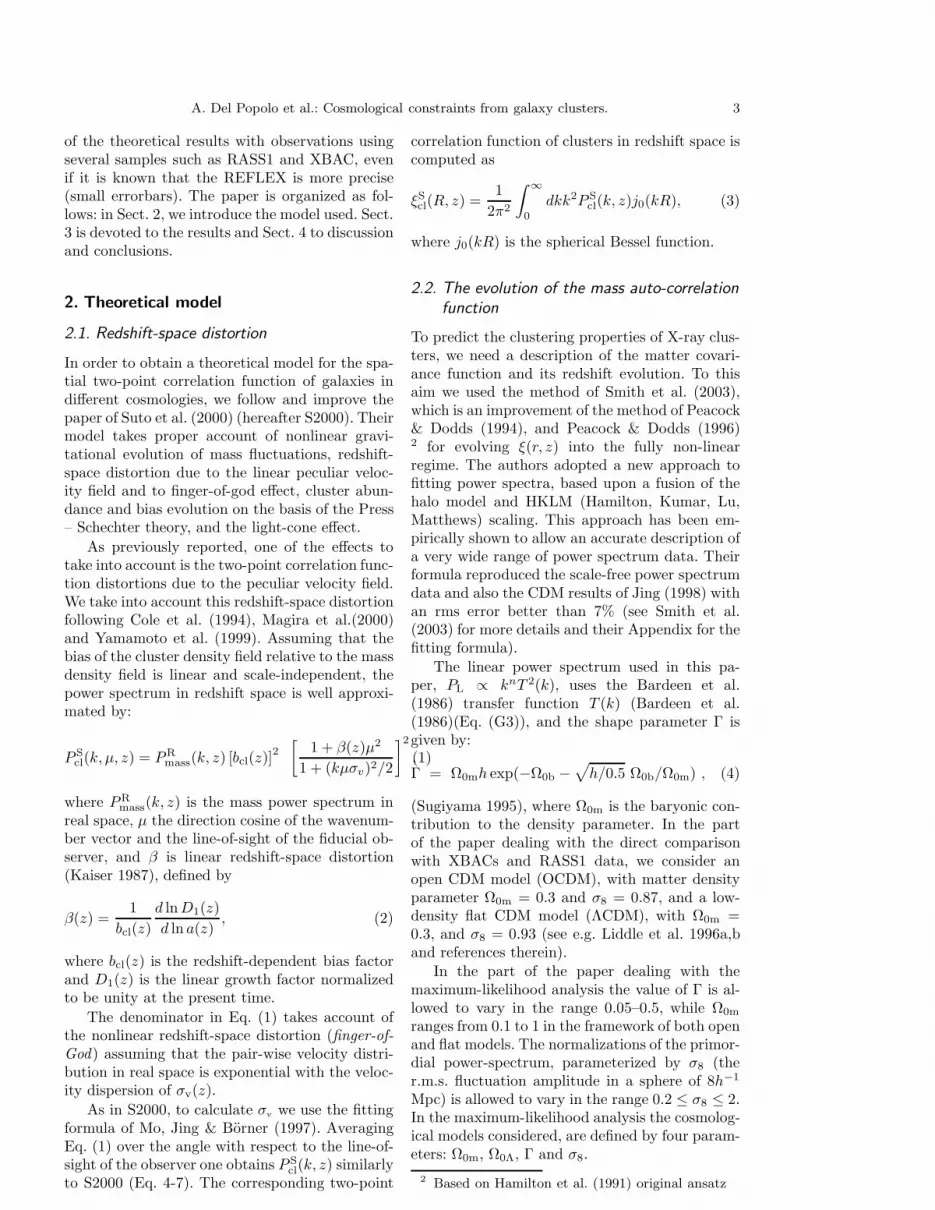
Fig. 2. Comparison of various mass functions. Thedotted line represents the Sheth & Tormen (2002)prediction, the solid line that of Jenkins et al.(2001) and the dashed line that of Del Popolo(2002b).
2.3. Bias evolution
In order to predict the clustering propertiesof clusters as a function of redshift, we needto know how bias evolves. S2000 adopted forthe ‘monochromatic’ bias b(M, z) the expressionwhich holds for virialized dark matter haloes (seetheir Eq. 17) (e.g. Mo & White 1996; Catelan et al.1998), and to get the effective bias factor the Mo& White (1996) equation was combined with thePress-Schechter relation to translate the quotedbias factor into a function of X-ray flux limit (seetheir Eq. 18).
Several papers in literature has shown that theMo & White (1996) bias formula does not cor-rectly reproduce the correlation of low mass haloesin numerical simulations.
Several alternative fits have been proposed(Del Popolo & Gambera 1998; Jing 1998; Porciani,Catelan & Lacey 1999; Sheth & Tormen 1999; Jing1999; Del Popolo 2001). The bias model of Sheth& Tormen (1999) has been shown to produce anaccurate fit of the distribution of the halo popu-lations in the GIF simulations (Kauffmann et al.1999).
(a)
0 0.2 0.4 0.6 0.8 1 1.212.5
13
13.5
14
14.5
15
log(T(keV))
(b)
0 0.2 0.4 0.6 0.8 1
1
1.2
1.4
1.6
1.8
2
z
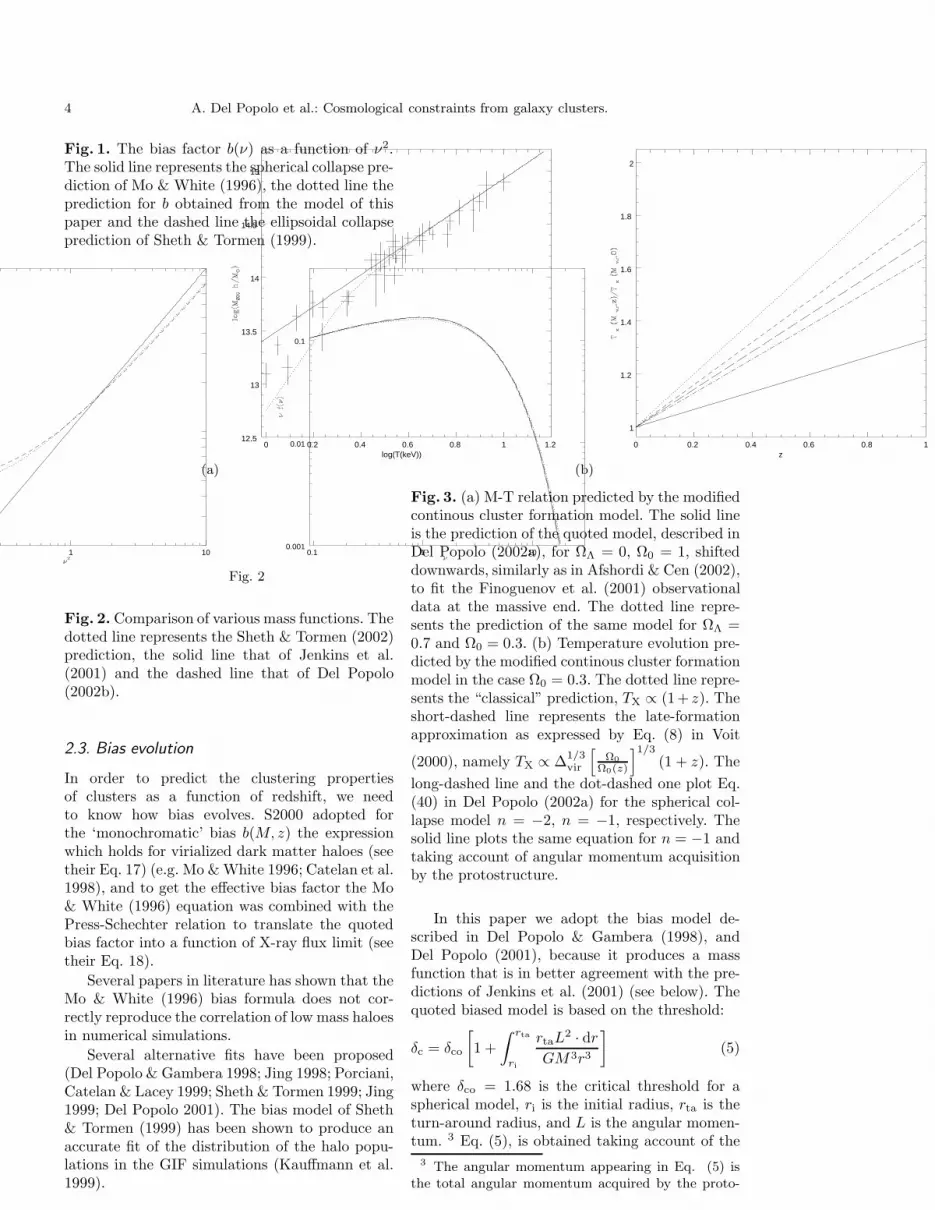
Fig. 3. (a) M-T relation predicted by the modifiedcontinous cluster formation model. The solid lineis the prediction of the quoted model, described inDel Popolo (2002a), for ΩΛ = 0, Ω0 = 1, shifteddownwards, similarly as in Afshordi & Cen (2002),to fit the Finoguenov et al. (2001) observationaldata at the massive end. The dotted line repre-sents the prediction of the same model for ΩΛ =0.7 and Ω0 = 0.3. (b) Temperature evolution pre-dicted by the modified continous cluster formationmodel in the case Ω0 = 0.3. The dotted line repre-sents the “classical” prediction, TX ∝ (1+ z). Theshort-dashed line represents the late-formationapproximation as expressed by Eq. (8) in Voit
(2000), namely TX ∝ ∆1/3vir
[
Ω0
Ω0(z)
]1/3
(1 + z). The
long-dashed line and the dot-dashed one plot Eq.(40) in Del Popolo (2002a) for the spherical col-lapse model n = −2, n = −1, respectively. Thesolid line plots the same equation for n = −1 andtaking account of angular momentum acquisitionby the protostructure.
In this paper we adopt the bias model de-scribed in Del Popolo & Gambera (1998), andDel Popolo (2001), because it produces a massfunction that is in better agreement with the pre-dictions of Jenkins et al. (2001) (see below). Thequoted biased model is based on the threshold:
δc = δco
[
1 +
∫ rta
ri
rtaL2 · dr
GM3r3
]
(5)
where δco = 1.68 is the critical threshold for aspherical model, ri is the initial radius, rta is theturn-around radius, and L is the angular momen-tum. 3 Eq. (5), is obtained taking account of the
3 The angular momentum appearing in Eq. (5) isthe total angular momentum acquired by the proto-

A. Del Popolo et al.: Cosmological constraints from galaxy clusters. 5
effect of asphericities. In Fig. 1, we plot the biasparameter, b, as a function of the peak height ν, 4
which is proportional to the halo mass. The solidline shows the spherical collapse prediction of Mo& White (1996), the dotted line the prediction forb obtained from our model, and the dashed line theellipsoidal collapse prediction of Sheth & Tormen(1999). As shown in the figure, taking accountof the effects of asphericity produces a change inthe dependence of b on ν in good agreement withSheth & Tormen (1999). From Fig. 1 it is evi-dent that at the low mass end the bias relationhas an upturn, meaning that less massive haloesare more strongly clustered than in the predictionof the spherical collapse model of Mo & White(1996) and in agreement with N-body simulations(Jing 1998; Sheth & Lemson 1999; Kauffmann etal. 1999).
The above bias factor can be translated into afunction of X-ray flux limit according to:
beff(z, > Slim) =
∫ ∞
Mlim(Slim)
dM b(z, M) n(z, M)
∫ ∞
Mlim
dM n(z, M)
(6)
where n(z, M) is the number of objects actuallypresent in the catalogue with redshift in the rangez, z+dz and M in the range M, M+dM. One canestimate n(z, M) from the Press-Schechter (1974)(PS) formula; however, several studies have shownsome discrepancies between PS and simulations.
In order to obtain a better estimate of n(M, z),we can use the excursion set approach. which al-lows one to calculate good approximations to sev-eral important quantities, such as the “uncondi-tional” and “conditional” mass functions. Sheth& Tormen (2002) (hereafter ST) provided formu-las to calculate these last quantities starting fromthe shape of the barrier. They also showed thatthe “unconditional” mass function, which is theone we need now, is in good agreement with re-sults from numerical simulations. Using the bar-rier shape obtained in Del Popolo & Gambera(1998), obtained from the parameterization of thenonlinear collapse discussed in that paper, to-gether with the results of ST we can calculate the“unconditional” mass function.
structure during evolution. In order to calculate L, Wewill use the same model as described in Del Popolo &Gambera (1998, 1999) (more hints on the model andsome of the model limits can be found in Del Popolo,Ercan & Gambera (2001)).
4 ν =(
δc(z)σ(M)
)2
is the ratio between the critical over-
density required for collapse in the spherical model,δc(z), to the r.m.s. density fluctuation σ(M), on thescale r of the initial size of the object M
Assuming that the barrier is proportional tothe threshold for the collapse, as in ST, the barriercan be expressed in the form:
B(M) = δc = δco
[
1 +
∫ rta
ri
rtaL2 · dr
GM3r3
]
≃ δco
[
1 +β1
να1
]
(7)
(Del Popolo 2001), where δco = 1.68 is the criticalthreshold for a spherical model, ri is the initialradius, rta is the turn-around radius, L the angularmomentum, α1 = 0.585 and β1 = 0.46.
As described in Del Popolo (2002b), the massfunction can be approximated by:
n(M, z) =ρ
M2
d log ν
d log Mνf(ν) ≃ 1.21
ρ
M2
d log(ν)
d log M
(
1 +0.06
(aν)0.585
)
√
aν
2πexp −aν
where a = 0.707, and ρ is the background density5. In Fig. 2 we plot a comparison of the variousmass functions: the dotted line represents Sheth& Tormen (2002) prediction, the solid line thatof Jenkins et al. (2001) and the dashed line thatof Del Popolo (2002b). As Fig. 2 shows, the massfunction obtained in this paper is in very goodagreement with that of Jenkins et al. (2001) in theregime probed by the simulations. Notice that alarge part of the constraints obtained in the pasthas been obtained using the PS mass function.Only in some more recent papers has the massfunction been calculated by means of ST model(e.g. Borgani et al. 2001) or that of Jenkins et al.(2001) (Hamana et al 2001; MMM). Moreover theM-T relation chosen is the usual one obtained sim-ply from the virial theorem (see next subsection).In other words, this paper introduces noteworthyimprovements on the previous calculations in lit-erature.
Before concluding this subsection, followingHamana et al. (2001), we further attempt to in-corporate the scale-dependence on the basis of theresults of Taruya & Suto (2000), in which thescale-dependence arises as a natural consequenceof the formation epoch distribution of halos.Yoshikawa et al. (2001), had shown that the scale-dependence of the Taruya & Suto (2000) modelagrees with their numerical simulations. Thereforewe construct an empirical halo bias model of thetwo-point statistics which reproduces the scale-dependence of the Taruya & Suto (2000) bias withthe amplitude fixed by the mass-dependent biasobtained in Del Popolo & Gambera (1998) and DelPopolo (2001). Following Hamana et al. (2001),the scale dependent bias shall be described by thefollowing simple fitting formula:
bh(M, R, z) = b(M, z) [1.0 + b(M, z)σR(R, z)]0.15 , (9)
5 Note that in this formula ν =(
δc(z)σ(M)
)2

6 A. Del Popolo et al.: Cosmological constraints from galaxy clusters.
for R > 2Rvir(M, z), and otherwise 0, whereRvir(M, z) is the virial radius of the halo ofmass M at z and σR(R, z) is the mass variancesmoothed over the top-hat radius R. The bias fac-tor b contained in Eq. (3) through the spectrumP S
cl should then be substituted by Eq. (9).Although the modeling is not completely self-
consistent in the sense that the scale-dependenceof the halo biasing factor is neglected in describ-ing the redshift distortion, the above prescriptionprovides a good approximation since the scale-dependence in the biasing is of secondary impor-tance in the redshift distortion effect of halos (seeHamana et al. 2001).
2.4. Limiting flux and halo mass
In order to predict the abundance and clusteringof X-ray clusters in a given sample, it is neces-sary to relate the X-ray fluxes to the correspond-ing halo mass at each redshift. As a first step, werelate the total mass of the dark halo of a clusterto the temperature of the gas. The M-T relationthat we shall use is that calculated in Del Popolo(2002a). The M-T relation is calculated using themerging-halo formalism of Lacey & Cole (1993),which takes account of the fact that massive clus-ters accrete matter quasi-continuously, and thepresent paper is an improvement of a model pro-posed by Voit (2000) (hereafter V2000), again totake account of angular momentum acquisition byprotostructures and of an external pressure termin the virial theorem. The M-T relation obtainedin Del Popolo (2002a), is given by:
kT ≃ 8keV
(
M2
3
1015h−1M⊙
)
[
1m +
(
tΩt
)2
3 + K(m,x)M8/3
]
[
1m +
(
tΩt0
)2
3
+ K0(m,x)
M8/3
0
] , (10)
where tΩ = πΩ0m
Ho(1−Ω0m−Ω0Λ)32
, m = 5/(n + 3) (
where n is the spectral index), M0 is defined inDel Popolo (2002a), and:
K(m, x) = Fx (m − 1)LerchPhi(x, 1, 3m/5 + 1) −
F (m − 1)LerchPhi(x, 1, 3m/5), (11)
where F is defined in Del Popolo (2002a) (Eq. 35)and the LerchPhi function is defined as follows:
LerchPhi(z, a, v) =
∞∑
n=0
zn
(v + n)a, (12)
and where K0(m, x) indicates that K(m, x) mustbe calculated assuming t = t0.
Eq. (10) takes account of the fact that massiveclusters accrete matter quasi-continuously, andalso of tidal interaction between clusters. The ob-tained M-T relation is no longer self-similar, there
is a break at the low mass end (T ∼ 3 − 4keV) ofthe M-T relation is present. The behavior of theM-T relation is as usual, M ∝ T 3/2, at the highmass end, and M ∝ T γ , with a value of γ > 3/2dependening on the chosen cosmology. Larger val-ues of γ are related to open cosmologies, whileΛCDM cosmologies give a slope intermediate be-tween the flat case and the open case.
In Fig. (3a), we plot the M-T relation predictedby the modified continous formation model. Thesolid line is the prediction of the quoted model,described in Del Popolo (2002a), for ΩΛ = 0,Ω0 = 1, shifted downwards, as in Afshordi &Cen (2002), to fit the FRB observational dataat the massive end. The dotted line representsthe prediction of the same model for ΩΛ = 0.7and Ω0 = 0.3. In Fig. (3b), we plot the temper-ature evolution predicted by the modified modelfor Ω0 = 0.3. The dotted line represents the “clas-sical” prediction, TX ∝ (1 + z). The short-dashedline represents the late-formation approximationas expressed by Eq. (8) in Voit (2000), namely
TX ∝ ∆1/3vir
[
Ω0
Ω0(z)
]1/3
(1+z). The long-dashed line
and the dot-dashed one plot Eq. (40) in Del Popolo(2002a) for the spherical collapse model n = −2,n = −1, respectively. The solid line plots the sameequation for n = −1 and taking account of angularmomentum acquisition by the protostructure.
The next step (see S2000) is to transform thetemperature to the luminosity of clusters usingthe observed luminosity-temperature relation. InS2000, they assumed:
Lbol = L44
(
Tgas
6keV
)α
(1+z)ζ 1044h−2erg sec−1(13)
with L44 = 2.9, α = 3.4 and ζ = 0 on the basis ofthe quoted observational indications (e.g., Davidet al. 1993; Ebeling et al. 1996; Ponman et al.1996; Mushotzky & Scharf 1997).
Several independent analyses of nearby clus-ters with TX ≥ 1 keV consistently show thatL44 ≃ 3 and α ≃ 2.5 − 3.5 (e.g., White, Jones& Forman 1997; Wu, Xue & Fang 1999, and ref-erences therein). For cooler groups, ≤ 1 keV, theLbol − T relation steepens. Mushotzky & Scharf(1997) found that data out to z ≃ 0.4 are consis-tent with no redshift evolution in the Lbol −T re-lation out to z ≃ 0.4. In Moscardini et al. (2000a,2000b) the authors translated the cluster bolomet-ric luminosity into a temperature, adopting theempirical relation
T = ALBbol(1 + z)−η (14)
where the temperature is expressed in keV andLbol is in units of 1044h−2 erg/s and A = 4.2 andB = 1/3, which are a good representation of the

A. Del Popolo et al.: Cosmological constraints from galaxy clusters. 7
data with T ≥ 1 keV (e.g. Markevitch 1998 andreferences therein).
From what was previously said, it is clear thatthe L-T relation is a source of uncertainties. Asin Del Popolo (2003), in the present paper weare principally interested in studying the effectsof the improvements on the M-T relation, massfunction and bias model on cosmological param-eters and to compare them with previous esti-mates. For this reason, in the following, we shallfollow the philosophy of Moscardini et al. (2000a),Borgani, Plionis, & Kolokotronis (1999), namelywe shall adopt a ‘default’ value for α and L44,(L44 = 2.9, and α = 3.4 as the reference values),and we calculate the correlation function and theconstraints on cosmological parameters. We shallcompare these with the results of previous pa-pers (e.g., Moscardini et al. 2000a, 2000b; S2000).Finally, we shall calculate the effects of the vari-ation of α (in the range 2.5 ≤ α ≤ 3.5) on theresulting model constraints. Notice that all plotsshown in the next sections are based on these ‘de-fault’ values L44 = 2.9, and α = 3.4.
After fixing the L-T relation, Lbol(Tgas)is transformed in the band-limited luminosityLband[Tgas, E1, E2] as shown by S2000 (Sect. 2.2).
To obtain Mlim, necessary to calculate beff inEq. (6), we use the method of S2000 (see theirSect. 2.4)
2.5. The light-cone effect
The final step is to calculate the two-point cor-relation function on the light cone (Yamamoto &Suto 1999):
ξLCX−cl(R; > Slim) =
∫ zmin
zmax
dzdVc
dzn2
0(z)ξScl(R, z(r); > Slim)
∫ zmin
zmax
dzdVc
dzn2
0(z)
where R is the comoving separation of a pair ofclusters, zmax and zmin denote the redshift range ofthe survey, and ξS
cl(R, z; > Slim) is the correspond-ing two-point correlation function on a constant-time hypersurface at z in redshift space (Eq.(3)).The comoving number density of clusters in theflux-limited survey, n0(z; > Slim), is computed byintegrating the mass function Eq. (8) as:
n0(z; > Slim) =
∫ ∞
Mlim(Slim)
n(M, z)dM.
Finally the comoving volume element per unitsolid angle is
dVc
dz=
d2C(z)
H(z).
where:
H(z) = H0
√
Ω0m(1 + z)3 + (1 − Ω0m − Ω0Λ)(1 + z)2 + Ω0Λ(15)
2.6. Maximum-likelihood analysis
In order to obtain constraints for cosmologicalmodels, we use a maximum-likelihood analysis.One possibility to accomplish the quoted analysisis as shown by Marshall et al. (1983), Del Popolo(2003), or Borgani, Plionis & Kolokotronis (1998).
In the present paper, We used the same modelas MMM. The likelihood is L ∝ exp(−χ2/2),where
χ2 =
Ndata∑
i=1
[r0(i) − r0(i; Ω0m, Ω0Λ, Γ, σ8)]2
σ2r0
(i). (16)
The sum runs over the observational dataset de-scribed in Sect. 2 of MMM, i.e. Ndata = 3 andNdata = 4 for the optical and X-ray bands, respec-tively (in the present paper we shall use only X-raydata). The quantities r0(i) and σr0
(i) representthe values of the correlation length and its 1σ er-rorbar for each catalogue, as reported in Table 1 ofMMM; r0(i; Ω0m, Ω0Λ, Γ, σ8) is the correspondingtheoretical prediction obtained with a given choiceof cosmological parameters. The best-fit cosmo-logical parameters are obtained by maximizing L,i.e. by minimizing χ2. The 95.4 and 99.73 per centconfidence levels for the parameters are computedby finding the region corresponding to an increase∆χ2 with respect to the minimum value of χ2.Other details of the maximum-likelihood analysisare given in the next section.
3. Results
We begin the analysis by comparing the theoreti-cal predictions for the two-point correlation func-tion to the observational clustering properties ofRASS1 and afterwards to those of XBACs.
Fig. 4 shows the comparison with RASS1. Inthe plot, the dashed line represents the predic-tion of Moscardini et al. (2000b) for their ΛCDMmodel, and the solid line represents the predic-tion of the ΛCDM, with Ω0m = 0.3, σ8 = 0.93,and Γ = 0.21 (see e.g. Liddle et al. 1996a,band references therein), for the ‘default’ value ofα = 3.4. The plot for the OCDM model was notreported since it gives very similar predictions tothe ΛCDM model. The ΛCDM model is in goodagreement with the data and the predictions arealways inside the 1 σ errorbars, r0 ≃ 28.2h−1 Mpc.A comparison with the Moscardini et al. (2000b)results, after the latter has been corrected takingaccount of the description of clustering in the past-light cone, (which gives r0 ≃ 22.4h−1 Mpc), showsthat in our model the correlations are higher, bymore than 20%. Varying the value of α in therange 2.5-3.5, not plotted in Fig. 4, the result-ing spatial correlation function does not changeits shape, but only its amplitude: the smaller α is,

8 A. Del Popolo et al.: Cosmological constraints from galaxy clusters.
Fig. 4. Comparison of the cluster space corre-lations in the RASS1 sample with the theoreticalmodel of the present paper. In the plot, the dashedline represents the prediction of Moscardini et al.(2000b) for their ΛCDM model, and the solid linethat of the ΛCDM (Ω0m = 0.3, σ8 = 0.93) calcu-lated using the model of this paper.
10 100r(Mpc/h)
Fig. 5
10 1000.01
0.1
1
10
r(Mpc/h)
Fig. 5. Comparison of the cluster space correla-tions in the XBACs sample with the theoreticalmodel of this paper. The observational estimatesare shown by two regions: the first (enclosed in thesolid lines connected by the vertical solid lines),refers to the (1σ) estimates obtained by Abadi,Lambas & Muriel (1998), while the second region(enclosed in the dashed lines connected by the hor-izontal dashed lines), shows the (2σ) estimates byBorgani, Plionis & Kolokotronis (1999). The solidcurve represents the Ω0m = 0.3, σ8 = 0.93 ΛCDMmodel calculated using the model of this paper,while the dashed line represents the prediction ofMoscardini et al. (2000a) for their ΛCDM model.
the smaller ξ(r) is. However, the changes are quitesmall, as shown in Fig. 11 of Moscardini et al.(2000a). The induced change of r0, can be writtenas r0 ≃ 28.2 ± 5.2h−1 Mpc.
In Fig. 5 the model is compared with theXBACs catalogue. Abadi, Lambas & Muriel(1998) found that the XBACs spatial correla-tion function can be fitted by the usual power-law relation ξ(r) = (r/r0)
−γ with γ = 1.92 andr0 = 21.1+1.6
−2.3 h−1 Mpc (the errors correspondto 1 σ), while Borgani, Plionis & Kolokotronis(1999), who adopted an analytical approximationto the bootstrap errors for the variance of ξ(r),found γ = 1.98+0.35
−0.53 and a slightly larger value of
r0 = 26.0+4.1−4.7 h−1 Mpc (the errors in this case are
-14 -13 -12 -11 -105
10
15
20
25
30
Fig. 6. The behavior of the correlation length r0
as a function of the limiting X-ray flux Slim. Thesolid line represents the ΛCDM model accordingto the model of this paper, and the dashed linethat of Moscardini et al. (2000a)
2-σ uncertainties). In Fig. 5, these observationalestimates are compared with the theoretical pre-dictions of this paper. The observational estimatesare shown by two regions: the first one (enclosedin the solid lines connected by the vertical solidlines), refers to the (1 σ) estimates obtained byAbadi, Lambas & Muriel (1998), while the secondregion (enclosed in the dashed lines connected bythe horizontal dashed lines), shows the (2 σ) esti-mates by Borgani, Plionis & Kolokotronis (1999).The solid curve represents the Ω0m = 0.3, σ8 =0.93 ΛCDM model, while the dashed line repre-sents the prediction of Moscardini et al. (2000a)for their ΛCDM model 6.
The results are in qualitative agreement withMMM, but the value for r0 (r0 ≃ 28.2h−1 Mpc)obtained here is larger than the value in thequoted paper (r0 ≃ 22h−1 Mpc for ΛCDM), whileit is in better agreement with that of Borgani,
6 For the ΛCDM model (solid line), the results arein good agreement with the observational data (r0 ≃
28.2h−1 Mpc).
A. Del Popolo et al.: Cosmological constraints from galaxy clusters. 9
0 0.2 0.4 0.6 0.8 1
0
5
10
15
99.73 %
95.4 %
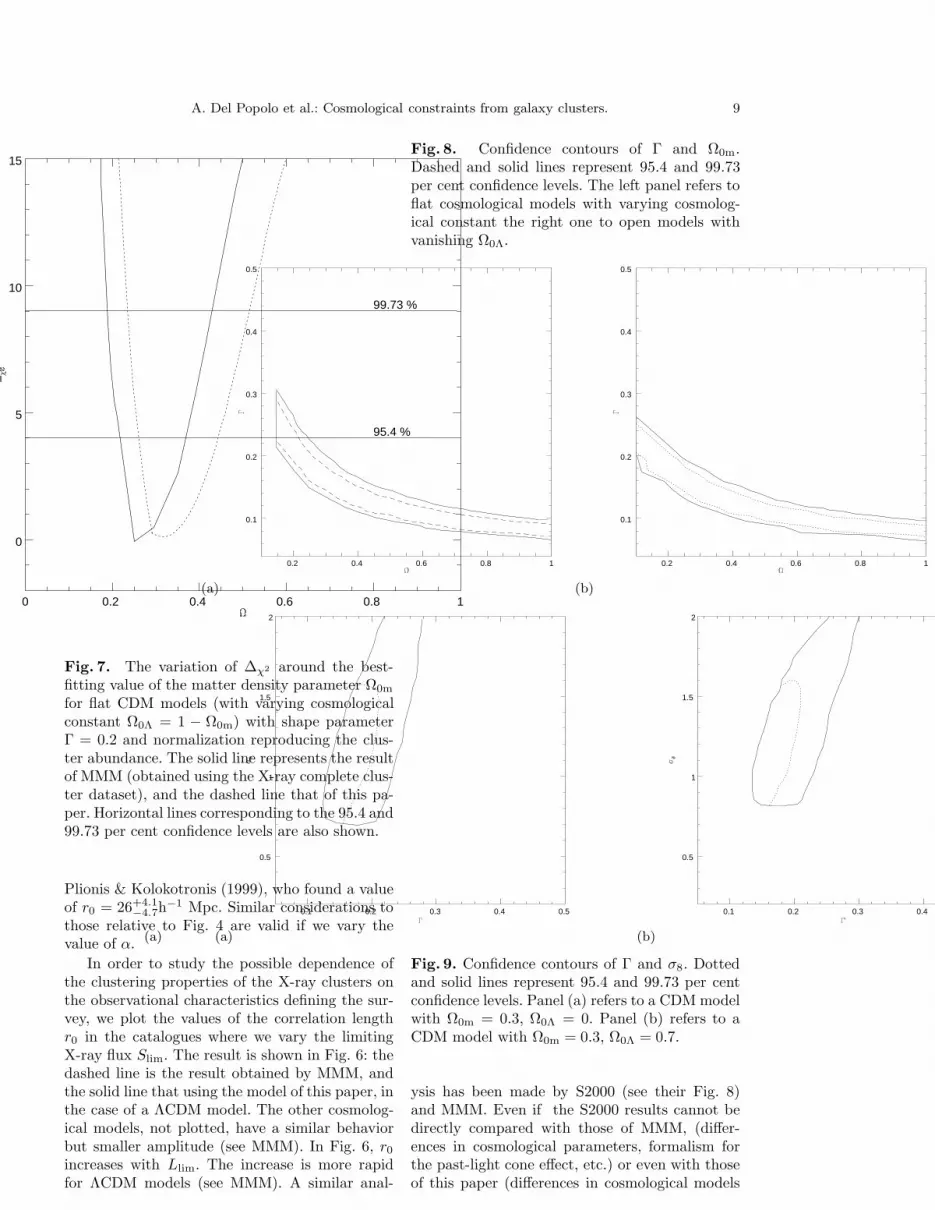
Fig. 7. The variation of ∆χ2 around the best-fitting value of the matter density parameter Ω0m
for flat CDM models (with varying cosmologicalconstant Ω0Λ = 1 − Ω0m) with shape parameterΓ = 0.2 and normalization reproducing the clus-ter abundance. The solid line represents the resultof MMM (obtained using the X-ray complete clus-ter dataset), and the dashed line that of this pa-per. Horizontal lines corresponding to the 95.4 and99.73 per cent confidence levels are also shown.
Plionis & Kolokotronis (1999), who found a valueof r0 = 26+4.1
−4.7h−1 Mpc. Similar considerations to
those relative to Fig. 4 are valid if we vary thevalue of α.
In order to study the possible dependence ofthe clustering properties of the X-ray clusters onthe observational characteristics defining the sur-vey, we plot the values of the correlation lengthr0 in the catalogues where we vary the limitingX-ray flux Slim. The result is shown in Fig. 6: thedashed line is the result obtained by MMM, andthe solid line that using the model of this paper, inthe case of a ΛCDM model. The other cosmolog-ical models, not plotted, have a similar behaviorbut smaller amplitude (see MMM). In Fig. 6, r0
increases with Llim. The increase is more rapidfor ΛCDM models (see MMM). A similar anal-
Fig. 8. Confidence contours of Γ and Ω0m.Dashed and solid lines represent 95.4 and 99.73per cent confidence levels. The left panel refers toflat cosmological models with varying cosmolog-ical constant the right one to open models withvanishing Ω0Λ.
(a)
0.2 0.4 0.6 0.8 1
0.1
0.2
0.3
0.4
0.5
(b)
0.2 0.4 0.6 0.8 1
0.1
0.2
0.3
0.4
0.5
(a) (a)
0.1 0.2 0.3 0.4 0.5
0.5
1
1.5
2
(b)
0.1 0.2 0.3 0.4
0.5
1
1.5
2
Fig. 9. Confidence contours of Γ and σ8. Dottedand solid lines represent 95.4 and 99.73 per centconfidence levels. Panel (a) refers to a CDM modelwith Ω0m = 0.3, Ω0Λ = 0. Panel (b) refers to aCDM model with Ω0m = 0.3, Ω0Λ = 0.7.
ysis has been made by S2000 (see their Fig. 8)and MMM. Even if the S2000 results cannot bedirectly compared with those of MMM, (differ-ences in cosmological parameters, formalism forthe past-light cone effect, etc.) or even with thoseof this paper (differences in cosmological models

10 A. Del Popolo et al.: Cosmological constraints from galaxy clusters.
parameters adopted), it is clear that there is aqualitative agreement but MMM tends to predictsmaller correlation lengths (by approximately 20-30 %) with respect to S2000 and the latter pre-dicts smaller correlation lengths than this paper.Part of the difference between MMM and S2000comes from the different values of the exponentof the temperature used by the quoted authorsin the temperature-luminosity relation: in MMMB = 1/3 (see Sect. 2.4)), and that used in S2000(α = 1/3.4 (see their Eq. 11)). Moreover, in theirapproach S2000 include a method to take accountof redshift-space distortion effects not completelyconsidered by MMM 7 which tends to increase thecorrelation estimates.
In the present paper, the correlation lengthsare larger in comparison with both the previoustwo quoted papers predictions. These differences,expecially when we compare the results with thoseof S2000, are due essentially to the different M-T relation, mass function and bias model usedin this paper. As reported in Sect. (2), the fun-damental goal of this paper is to study the ef-fects of the improvements quoted above on thevalues of the, cosmological parameters, and thento constrain the cosmological parameters by theclustering properties of clusters of galaxy using amaximum-likelihood analysis. This analysis wasstarted by considering as a free parameter Ωm
only, fixing Γ = 0.2, which is in the range sug-gested by various other works (see e.g. Peacock& Dodds 1996), and σ8 to reproduce the clusterabundance.
For the normalization we adopt the fitting for-mula by Pierpaoli et al. (2003), with the M-T nor-malization parameter T∗ = 1.75 (see Pierpaoli etal. 2003).
In Fig. 7, we plot the results of the maxi-mum likelihood analysis obtained by using X-rayband data (RASS1, BCS, XBACs, REFLEX) forflat models with varying cosmological constant(Ω0Λ = 1 − Ω0m), with Γ = 0.2. The solid linerepresents the results obtained using the completeX-ray data set by MMM, and the dotted line givesthe results for the model in the present paper.
The constraints on Ωm are: 0.25 ≤ Ω0m ≤ 0.45and 0.23 ≤ Ω0m ≤ 0.52 at 95.4 and 99.73 per centlevels, respectively. The result shows larger valuesfor Ω0m on the order of 20-30 %, when comparedwith MMM results (0.2 ≤ Ω0m ≤ 0.35 and 0.2 ≤Ω0m ≤ 0.45 at the 95.4 and 99.73 per cent levels,respectively).
In Fig. 8 we show the results of the maxi-mum likelihood analysis fixing the model normal-ization to reproduce the cluster abundance, and
7 They used a zero-order model similar to that ofKaiser
leaving two free parameters: Γ, and Ωm0. The solidlines represents the 99.73 confidence levels, andthe dashed lines the 95.4 confidence levels. Thefigure shows that the allowed regions, at least forΩ0m ≥ 0.5, depend strongly on Γ. In the case ofthe flat model (Fig. (8a)), the constraints for Γ are0.1 ≤ Γ ≤ 0.14, and in the case of the open model(Fig. (8b)) 0.09 ≤ Γ ≤ 0.13. These values aresmaller than those of MMM, by about 20 − 30%.(Note that in MMM paper, the reported valuesare approximated. A comparison of our and theirconfidence contours shows the difference).
In Fig. 9 we show the constraints in the Γ−σ8
plane (after keeping the values of ΩΛ fixed). Weconsider an open model with Ω0m = 0.3, Fig. (9a),and a flat model, Fig. (9b), again with Ω0m = 0.3.8
For the open model with Ω0m = 0.3 the 2σregion has Γ in the range 0.11-0.2 and σ8 between0.7 and 1.55. The values of σ8 obtained here arelarger by ≃ 20% than those of MMM.
For a flat model with Ω0m = 0.3 the 2σ regionhas 0.13 ≤ Γ ≤ 0.2 and 0.8 ≤ σ8 ≤ 1.6. The valuesof σ8 obtained are larger than those of MMM by≃ 20%
The effect of varying α on the maximum-likelihood analysis has been also studied. From thestudy, it turns out that Γ is quite insensitive to achange of α, while σ8 is only weakly dependent onit: the minimum in the maximum-likelihood anal-ysis decreases (increases) by ≃ 10% for α = 2.5,(for α = 3.5) (see also Fig. 8 of Borgani, Plionis &Kolokotronis 1999). For Ω0m the changes are sim-ilar to those of Γ but larger (of the order of 20 %)(see also Fig. 4 of Borgani et al. 2001, and Fig. 10of Eke et al. 1998).
Notice that in the analysis of this paper, weused only the data from the X-ray catalogues andnot a combination of optical and X-ray catalogues.This is because, as shown by MMM, the combina-tion of optical and X-ray catalogues gives resultsthat are almost indistinguishable from those ob-tained by the X-ray analysis only. As in MMM,the constraints from the X-ray datasets are in gen-eral tighter than those obtained from the opticaldata.
Although the quoted uncertainties have sofar been of minor importance because of thepaucity of observational data, a breakthrough isneeded in the quality of the theoretical model-ing if high-redshift clusters are to take part in thehigh-precision-era of observational cosmology. Asshown, using models like PS for the mass func-tion instead of models that are in agreement with
8 Note that the value of Ω0m chosen is not toodifferent from that obtained by WMAP: Ω0mh2 =0.14 ± 0.02 and h = 0.72 ± 0.05 (Spergel et al. 2003)

A. Del Popolo et al.: Cosmological constraints from galaxy clusters. 11
Jenkins et al. (2001), introduces errors of the or-der of 20-30 % in the values of the parametersconstrained (see Del Popolo 2003) and other er-rors are introduced if one uses a simplified ver-sion of the M-T relation. Moreover a proper in-terpretation of such redshift surveys in terms ofthe clustering evolution requires an understand-ing of many cosmological effects which can be ne-glected for z << 1 and thus have not been consid-ered seriously so far. For example, neglecting thelight-cone effect leads to underestimates of ≃ 20%in samples like RASS1, and of up to 25 % for adeeper survey such ABRIXAS (Moscardini et al.2000a). Neglecting red-shift space distortions pro-duces underestimates of r0 of ≃ 10%: as reportedin the present paper, a comparison between thebehavior of the correlation length as a functionof the limiting X-ray flux, in papers like S2000and MMM shows a difference of ≃ 30% becausein MMM the redshift-space distortion effects werenot taken into account, and because of a differencein the exponent in the temperature-luminosity re-lation. Taking into account the asphericity in grav-itational collapse that leads to a different relationfor bias (Del Popolo & Gambera 1998; Sheth &Tormen 1999), to a modified version of the massfunction (Del Popolo & Gambera 1998; Sheth &Tormen 2002; Del Popolo 2002b), and a differentM-T relation (Del Popolo 2002a), leads to highervalues of Ω0m, σ8, r0 by at least 20 %. In the nearfuture theory and observations should converge to-wards a more precise constraining of cosmologicalparameters.
4. Discussion and Conclusions
In this paper, we have recalculated the two-pointcorrelation function of clusters of galaxies forOCDM and ΛCDM cosmological models, improv-ing the model of S2000, in the light of recenttheoretical developments, by using the theoreti-cal mass function derived in Del Popolo (2002a),the M-T relation derived in Del Popolo (2002b)and the bias model of Del Popolo (2001). As inSuto’s paper, the model properly takes account ofnonlinear gravitational evolution of mass fluctu-ations, redshift-space distortion due to the linearpeculiar velocity field and to finger-of-god, clusterabundance and bias evolution, and the light-coneeffect. This theoretical model has before been com-pared with the observed spatial correlation func-tion for clusters in RASS1, and in XBACs sam-ples. The comparison shows that only the pre-dictions of models with Ωm = 0.3 are in goodagreement with data. The results are in qualita-tive agreement with MMM, but the values for r0
here obtained (r0 ≃ 28.2h−1 Mpc for the ΛCDMmodel) are larger than the values of the quoted pa-
per (MMM), (r0 ≃ 22h−1 Mpc for ΛCDM), whilethey are in better agreement with that of Borgani,Plionis & Kolokotronis (1999), who found a valueof r0 = 26+4.1
−4.7h−1 Mpc. In order to study the pos-
sible dependence of the clustering properties of theX-ray clusters on the observational characteristicsdefining the survey, we plot the values of the cor-relation length r0 in the catalogues where we varythe limiting X-ray flux Slim. 9 All the cosmolog-ical models displays an increase of r0 with Llim.The increase is more rapid for ΛCDM models (seeMMM). Comparing the result with those of a sim-ilar analysis by S2000, (see their Fig. 8) and MMMit is clear that there is a qualitative agreement butMMM tends to predict smaller correlation lengths(by approximately 20-30 %) with respect to S2000,and the latter predicts smaller correlation lengthsthan the present paper. These differences, expe-cially when we compare the results with those ofS2000, are due essentially to the different M-T re-lation and mass function used in this paper. In or-der to obtain constraints on cosmological parame-ters we performed a maximum-likelihood analysisby comparing the theoretical predictions to a setof observational data in the X-ray band (RASS1Bright Sample, BCS, XBACs, REFLEX), simi-larly to MMM. The parameters to be constrainedare: Ωm, ΩΛ, the power-spectrum shape parame-ter Γ and the normalization σ8. The constraintsobtained for the matter density parameter in aflat CDM model, are: 0.25 ≤ Ω0m ≤ 0.45 and0.23 ≤ Ω0m ≤ 0.52 at the 95.4 and 99.73 percent levels, respectively, larger by ≃ 20% thanthe MMM predictions. Keeping the model normal-ization fixed to reproduce the cluster abundance,and leaving two free parameters: Γ, and Ωm0, wefind that for the flat model the constraints for Γare 0.1 ≤ Γ ≤ 0.14, while for the open model0.09 ≤ Γ ≤ 0.13. These values are smaller thanthose of MMM, by about 20 − 30%. After fixingthe values of ΩΛ, we obtain the constraints in theΓ− σ8 plane, showing that if we keep the value ofΩΛ fixed the open model with Ω0m = 0.3 the 2σregion has Γ in the range 0.11-0.2 and σ8 between0.7 and 1.55. In the flat model with Ω0m = 0.3 the2σ region has 0.13 ≤ Γ ≤ 0.2 and 0.8 ≤ σ8 ≤ 1.6In all three cases, the values of σ8 obtained arelarger than those of MMM by ≃ 20%. Varyingα, it turns out that Γ is quite insensitive to thechange of α, while σ8 is only weakly dependent onit: the minimum in the maximum-likelihood anal-ysis decreases (increases) by ≃ 10% for α = 2.5,
9 Notice that this analysis can be related to thestudy of the richness dependence of the cluster corre-lation function. In fact, a change in the observationallimits implies a change in the expected mean inter-cluster separation dc.

12 A. Del Popolo et al.: Cosmological constraints from galaxy clusters.
(for α = 3.5). In the case of Ω0m the changes aresimilar to those of Γ but larger (of the order of20 %). Allowing the shape parameter to vary, wefind that the clustering properties of clusters arealmost independent of the matter density parame-ter and of the presence of a cosmological constant,while they appear to be strongly dependent on theshape parameter. The constraints from X-ray dataare tighter than those coming from optical data.In conclusion, the data on clustering properties ofgalaxies can be used to constrain important cos-mological parameters like Ω0m, Γ and σ8.
Acknowledgments
A. Del Popolo would like to thank BogaziciUniversity Research Foundation for the financialsupport through the project code 01B304.
References
Abadi M.G., Lambas D.G., Muriel H., 1998, ApJ, 507,526
Afshordi N., Cen R., 2002, ApJ 564, 669(astro-ph/0105020)
Bahcall N.A., Soneira R.M., 1983, ApJ 270, 20Bahcall N.A., Cen R., 1992, ApJ 398, L81Bahcall N.A., West M.J., 1992, ApJ 392, 419Bahcall N.A., Fan X., Cen R., 1997, ApJ 485, L53Bahcall N.A., Fan X., 1998, ApJ 504, 1Bardeen J.M., Bond J.R., Kaiser N., Szalay A.S., 1986,
ApJ, 304, 15Blanchard A., Bartlett J.G., 1997, A&A 332, L49Blanchard A., Bartlett J.G., Sadat R., 1998, in Les
Comptes Rendus de l’Academie des SciencesBorgani S., Girardi M., Carlberg R. G., Yee H. K. C.,
Ellingson E., 1999, ApJ 527, 561Borgani S., Plionis M., Kolokotronis V., 1999,
MNRAS, 305, 866Borgani S., Rosati P., Tozzi P., Stanford S. A.,
Eisenhardt P. R., Lidman C., Holden B., DellaCeca R., Norman C., Squires G., 2001, ApJ 561,13
Bohringer H. et al., 1998, Messenger, 94, 21Bryan G.L., Norman M.L., 1998, ApJ, 495, 80Catelan P., Lucchin F., Matarrese S., Porciani C.,
1998, MNRAS, 297, 692Cole S., Fisher K. B., & Weinberg D. H., 1994 MNRAS
267, 785David L. P., Slyz A., Jones C., Forman W., & Vrtilek,
S. D., 1993, ApJ 412, 479De Grandi S. et al., 1999a, ApJ, 514, 148De Grandi S. et al., 1999b, ApJ, 513, L17Del Popolo A., Gambera M., 1998, A&A 337, 96Del Popolo A., Gambera M., 1999, A&A 344, 17Del Popolo A., Gambera M., 2000, A&A 357, 809Del Popolo, A., 2001, MNRAS 326, 667Del Popolo, A., E. N. Ercan, Z. Q. Xia, 2001, AJ 122,
487Del Popolo A., 2002a, MNRAS 336, 81Del Popolo A., 2002b, MNRAS 337, 529
Del Popolo A., 2003, ApJ 599, 723Donahue M., Voit G.M., 1999, ApJ 523, 137
(astro-ph/9907333)Donahue M., et al., 1999, ApJ 527, 525Ebeling H., Voges W., B¨ohringer H., Edge A.C.,
Huchra J.P., Briel U.G., 1996, MNRAS, 283, 1103Ebeling H., Edge A.C., B¨ohringer H., Allen S.W.,
Crawford C.S., Fabian A.C., Voges W., HuchraJ.P., 1998, MNRAS, 301, 881
Efstathiou G., Dalton G.B., Sutherland W.J., MaddoxS.J., 1992, MNRAS 257, 125
Eke V. R., Cole S, Frenk C. S., Henry J.P., 1998,MNRAS 298, 1145
Fan X., Bahcall N.A., Cen R., 1997 ApJ 490, L123Governato F., Babul A., Quinn T, Tozzi P., Baugh C.,
Katz N., Lake G., 1999, MNRAS 307, 949Hamilton A.J.S., Kumar P., Lu E., Mathews A., 1991,
ApJ, 374, L1Hamana T., Yoshida N., Suto Y., Evrard A., 2001,
ApJ 561, 143 (astro-ph/0110061)Hamilton A. J. S., 1998, in “ The Evolving Universe.
Selected Topics on Large-Scale Structure and onthe Properties of Galaxies”, (Kluwer: Dordrecht),p.185
Hauser M.G., Peebles P.J.E., 1973, ApJ 185, 757Henry J.P., 2000, ApJ 534, 565Jenkins A., Frenk C. S.,White S. D. M., Colberg J.
M., Cole, S., Evrard, A. E., Couchman, H. P. M.,& Yoshida, N. 2001, MNRAS, 321, 372
Jing Y. P., 1998, ApJ 503, L9Jing Y.P., 1999, ApJ, 515, L45Kaiser N., 1987, MNRAS 227, 1Kravtsov A.V., Klypin A.A., 1999, ApJ, 520, 437Kauffmann G., Colberg J.M., Diaferio A., White
S.D.M., 1999, MNRAS, 303, 188Klypin A.A., Kopylov A.I., 1983, Sov. Astr. Lett. 9,
41Kitayama, T., Suto, Y., 1997, ApJ 490, 557Kitayama, T., Sasaki,S., & Suto, Y. 1998, PASJ 50, 1Lacey C., Cole S., 1993, MNRAS 262, 627Lacey C., Cole S., 1994, MNRAS 271, 676Liddle A.R., Lyth D.H., Roberts D., Viana P.T.P.,
1996a, MNRAS, 278, 644Liddle A.R., Lyth D.H., Viana P.T.P., White M.,
1996b, MNRAS, 282, 281Magira H., Jing Y. P., & Suto Y. 2000, ApJ 528, 30
(astro-ph/9907438)Marshall H. L., Avni Y., Tananbaum H., & Zamorani
G. 1983, ApJ 269, 35Matarrese S., Coles P., Lucchin F., & Moscardini L.
1997, MNRAS 286, 115Mathiesen B., Evrard A.E., 1998, MNRAS 295, 769Matsubara T., & Suto Y. 1996, ApJ 470, L1Matsubara T., Suto Y., & Szapudi I. 1997, ApJ 491,
L1Mo, H. J., & White, S. D. M. 1996, MNRAS 282, 347Mo H. J., Jing Y. P., & Borner G. 1997, MNRAS 286,
979 (MJB)Moscardini L., Coles P., Lucchin F., & Matarrese S.,
1998, MNRAS 299, 95Moscardini L., Matarrese S., Lucchin F., Rosati P.,
2000a, MNRAS 316, 283Moscardini L., Matarrese S., De Grandi S. & Lucchin
F. 2000b, MNRAS 314, 647 (astro-ph/9904282)

A. Del Popolo et al.: Cosmological constraints from galaxy clusters. 13
Moscardini L., Matarrese S., Mo H. J., 2001, MNRAS327, 422
Mushotzky R. F., & Scharf C. A. 1997, ApJ 482, L13Nakamura T. T., Matsubara T., & Suto Y. 1998, ApJ
494, 13Nishioka H., & Yamamoto K. 1999, ApJ 520, 426Peacock J.A., Dodds S.J., 1994, MNRAS, 267, 1020Peacock J. A., & Dodds S. J. 1996, MNRAS 280, L19Pierpaoli, E., Borgani, S., Scott, D., & White, M. 2003,
MNRAS, 342, 163Ponman T. J., Bourner P. D. J., Ebeling H., &
Bohringer H. 1996, MNRAS 283, 690Porciani C., Catelan P., Lacey C., 1999, ApJ, 513, L99Postman M., 1999, Evolution of large scale structure
: from recombination to Garching /edited by A.J. Banday, R. K. Sheth, L. N. da Costa. Garching,Germany : European Southern Observatory, [1999](”Proceedings of the MPA- ESO cosmology con-ference, Garching, Germany, 2-7 August 1998”.),p.270
Press W.H., Schechter P., 1974, ApJ, 187, 425Reichart D. E., Castander F. J., Nichol R. C., 1999a,
ApJ 516, 1Reichart D. E., Nichol R. C., Castander F. J., Burke
D. J., Romer A. K., Holden B. P., Collins C. A.,Ulmer M. P., 1999b, ApJ 518, 521
Sadat R., Blanchard A., Oukbir J., 1998 A&A 329, 21Sheth R.K., Tormen G., 1999, MNRAS, 308, 119Sheth R.K., Lemson G., 1999, MNRAS, 304,767Sheth R. K., Mo H. J., Tormen G., 2001, MNRAS 323,
1 (SMT)Sheth R. K., Tormen G., 2002, MNRAS 329, 61 (ST)Smith R.E., et al., 2003, MNRAS 341, 1311Spergel D.N. et al., 2003, ApJS 148, 175Sugiyama N., 1995, ApJS, 100, 281Suto Y., Yamamoto K., Kitayama T., Jing Y. P., 2000,
ApJ 534, 551Taruya, A. & Suto Y., 2000, ApJ 542, 559Viana P.T.P., Liddle A.R., 1999, MNRAS 303, 535Voit C. M., Donahue M., 1998, ApJ 500, 111
(astro-ph/9804306)Voit C. M., 2000, ApJ 543, 113 (astro-ph/0006366)White S.D.M., Jones C., Forman W., 1997, MNRAS
292, 419Wu X.P., Xue Y.J., Fang L.Z, 1999, ApJ 524, 22Yamamoto K., & Suto Y. 1999, ApJ 517, 1Yamamoto K., Nishioka H., & Suto Y. 1999, ApJ 527,Yoshikawa K., Taruya A., Jing Y.P., & Suto Y. 2001,
ApJ, 558, 520 (astro-ph/9908006)


