Embed Size (px)
Citation preview

9 - 11 December 2015University of Pretoria, Pretoria, South Africa
ISBN number 978-0-7988-5624-9 Edited by J Gibberd and DCU Conradie
Proceedings


Proceedings of the Smart and Sustainable Built Environment (SASBE)
Conference 2015
9 - 11 December 2015
University of Pretoria, Pretoria, South Africa
Editors
Dr J Gibberd, CSIR, South Africa
Dr D C U Conradie, CSIR, South Africa
ISBN: 978-0-7988-5624-9
SAIA CPD Nr: CPD SAIA 15-24
Published by: CIB, CSIR, University of Pretoria
Date published: 2015


PREFACE
Constructing Capability for Change
We are living in a rapidly changing world and the effects of climate change are beginning to impact on every aspect of our lives. On 27 October 2015, temperatures of 48.4 °C were experienced in Vredendal on the West Coast of South Africa. At the same time one of the strongest hurricanes ever recorded approached the west coast of Mexico (Patricia). Droughts and temperatures significantly above normal, attributed to a strongly developed El Nino (4 °C sea temperature above normal anomaly in the Pacific), are currently being experienced in California, South Africa and Australia. Given this situation, it is not only valuable to understand these changes; it is important that high impact, positive change also occurs. Positive change must be informed by rigorous and targeted research that can be readily and rapidly applied to counter climate change and develop more sustainable built environments. The papers at this conference characterise this positive approach. Papers include climatic studies that enable the development of more intelligent and responsive built environments. Work on building materials envisage, and minimise, environmental impacts. A considerable body of work propose methodologies and tools to transform existing built environments to a more sustainable basis. Modelling work explores how systems and feedback loops can enhance the performance of urban environments and services. Papers on renewable energy, recycling and prefabrication conject and refine systems that will become increasingly resource efficient. Finally, papers on education, policy and regulations provide the ‘glue’ that can be used to embed smarter and more sustainable approaches. Capability for change is, therefore, being constructed! We would like to welcome you to the conference and look forward to sharing, discussing and developing ideas, tools and plans needed fora smarter and more sustainable built environment.
Jeremy Gibberd Dirk Conradie
1

2

PEER REVIEW STATEMENT
SASBE2015 is the fifth in a global conferences series, with previous events being organized in Australia (2003), China (2006), The Netherlands (2009) and Brazil (2012). At global level, the conference is hosted by CIB (International Council for Research and Innovation in Building and Construction) Work Commission 116, which shares the conference name. The South African event is collaboration between CSIR and the University of Pretoria and was held on 9, 10, 11 December 2015, at the University of Pretoria, in Pretoria. The target audience of the conference are built environment researchers and professionals, as well as government, business and non-government organisations who have an interest in smart and sustainable built environments. A full double blind peer-review process was followed for the conference. This included a double-blind peer review process for all abstracts. A double-blind peer review of all full papers was also undertaken. Reviews were undertaken by the Scientific Committee and facilitated by the Organising Committee who communicated reviews to paper authors. The Scientific Committee was established through peer recommendation and consists of highly experienced senior academics and built environment professionals. A full list of members of the Scientific and Organising Committees is available in the conference proceedings and on the conference website. Full papers also received final editing and quality checks before being included in the proceedings. The proceedings have been edited by Dr J Gibberd and Dr DCU Conradie and are published with the ISBN number 978-0-7988-5624-9.
Dr J Gibberd Dr DCU Conradie
3

4

COMMITTEES
STEERING COMMITTEE
Dr J Gibberd, CSIR, South Africa (Chair) Prof V Gomes, University of Campinas, Brazil Prof F Schultmann, Karlsruhe Institute of Technology, Germany Prof A Van den Dobbelsteen, Delft University of Technology, The Netherlands Prof J Yang, Queensland University of Technology, Australia
SCIENTIFIC COMMITTEE
Dr S Agbola, University of Ibadan, Nigeria Prof H Alinaitwe, Makerere University, Uganda Dr A Barker, University of Pretoria, South Africa Prof J Bell, Queensland University of Technology, Australia Dr R Bokel, Delft University of Technology, The Netherlands Dr M Bilow, Delft University of Technology, The Netherlands Prof J Birkeland, Univ of Auckland, New Zealand Prof L Buys, Queensland University of Technology, Australia Prof E Chan, Hong Kong Polytechnic University, Hong Kong Dr Chileshe, University of South Australia, Australia Dr D Conradie, CSIR, South Africa Dr C Densha, Queensland University of Technology, Australia Prof C Du Plessis, University of Pretoria, South Africa Dr F Emuze, Central University of Technology, South Africa Prof D Fang, Tsinghua University, China Dr J Gibberd, CSIR, South Africa Prof V Gomes, University of Campinas, Brazil Dr M Gray, Queensland University of Technology, Australia Dr A Gunter, University of South Africa, South Africa Prof Hiete, University of Kassel, Germany Prof B Jekot, University of Pretoria, South Africa Dr G Karuri-Sebina, South African Cities Network, South Africa Dr Klein, Delft University of Technology, The Netherlands Prof D Kowaltowski, University of Campinas, Brazil Prof J Laubscher, Tswane University of Technology, South Africa Prof N Lema, University of Dar es Salaam, Tanzania Prof Q Li, Southeast University, China Prof C Miruka, North West University, South Africa Prof A Mosha, University of Botswana, Botswana Dr W Nadim, German University in Cairo, Egypt
5

Prof D Ness, University of South Australia, Australia Prof A Ngowi, Central University of Technology, South Africa Dr Remøy, Delft University of Technology, The Netherlands Prof F Schultmann, Karlsruhe Institute of Technology, Germany Prof J Smallwood, Nelson Mandela Metropolitan University, South Africa Prof G Stein, Tshwane University of Technology, South Africa Prof H Stoffberg, University of South Africa, South Africa Dr A Straub, Delft University of Technology, The Netherlands Prof Storey, Victoria University of Wellington, New Zealand Dr Tenpierik, Delft University of Technology, The Netherlands Prof A Talukhaba, Tshwane University of Technology, South Africa Dr E Van Bueren, Delft University of Technology, The Netherlands Prof A Van den Dobbelsteen Delft University of Technology, The Netherlands Prof P Vosloo, University of Pretoria, South Africa Prof H Visscher, Delft University of Technology, The Netherlands Prof S Wilkinson, University of Auckland, New Zealand Prof J Yang, Queensland University of Technology, Australia Prof N Yokoo, Utsunomiya University, Japan Prof K Zhang, RMIT University, Australia
ORGANISING COMMITTEE
J Gibberd, CSIR, South Africa (Chair) D Conradie, CSIR, South Africa C Du Plessis, University of Pretoria, South Africa J Laubscher, Tshwane University of Technology, South Africa L Motsatsi, CSIR, South Africa F Pieterse, University of Pretoria, South Africa S Sebake, CSIR, South Africa N Van Rooyen, University of Pretoria, South Africa P Vosloo, University of Pretoria, South Africa
PROFESSIONAL CONFERENCE ORGANISER
T Botha, TechnoScene (Pty) Ltd
6

TABLE OF CONTENTS
Reference1 Paper title with authors Page
SASBE201503 Sustainability in the Built Environment: Exploring Barriers in South Africa 19
F Emuze, B K Ntoi, R B Isa
SASBE201504 Transforming Bloemfontein City to a Smart City- A Systems Thinking
Approach
27
D K Das
SASBE201509 Supply-Side Collaboration for Energy-Efficient Renovations 39
A Straub, E Mlecnik
SASBE201511
Deconstruction Project Planning based on Automatic Acquisition and
Reconstruction of Building Information for Existing Buildings
47
R Volk, N Sevilmis, F Schultmann
SASBE201513 Sustainable Education of the Construction Sector in Zambia 57
C Antuña Rozado, A Huovila, H Ahvenniemi
SASBE201517
Reflections for Sustainability: Capitalising on Stakeholder Engagement
for Optimising Outcomes
65
U Iyer-Raniga, T Moore, I Ridley, M M Andamon
SASBE201518 Performance Quantification of Building Technologies within the South
African Climatic Regions
75
E Balzun, D C U Conradie
SASBE201519 The Creation of Cooling Degree (Cdd) and Heating Degree Day (Hdd)
Climatic Maps for South Africa
83
D C U Conradie, T Van Reenen, S Bole
SASBE201520
Greening of Cement Stabilized Brickyard Industry for Supporting
Sustainable Building in Kuruman in the Northern Cape Province
93
G Bosman, J J Steyn
SASBE201522 Smart Optimisation and Sensitivity Analysis in Water Distribution
Systems
101
P R Page
SASBE201525 Smart Sustainable Energy for the Rural Built Environment 109
S Szewczuk
1 The Reference Number is a unique paper reference that is used throughout the conference to identify the
paper. This is also used as a page number prefix in the proceedings, and papers are sorted according to this number in the proceedings.
7

SASBE201527 Factors Affecting Household Recycling Behaviour in Townhouses in
Pretoria, South Africa
119
J Du Toit, C Wagner, L Fletcher
SASBE201528
A Strong Research Environment for Sustainable Renovation
Established in Sweden
127
K Mjörnell, P Femenias, J Stenberg, D Johansson
SASBE201529 Revising The South African Guidelines for Human Settlement Planning
and Design (The Red Book)
135
W Van Niekerk, E Petzer, D Ndaba, A Pieterse, A Rajab
T Kruger
SASBE201530
The Future of the Built Environment in the Information Age: Integrating
Concepts of Sustainability, Information and Communication Technology,
and Architecture
143
M Macagnano
SASBE201535
Model for Sustainability Evaluation of Existing Residential Buildings 155
I Senjak, N Vezilic Strmo, S Basic
SASBE201536 Using Social Media Information in Transport- and Urban Planning in
South Africa
165
Q Van Heerden
SASBE201538
A Comparison of Predicted Design Efficacy and Environmental
Assessment for Tuberculosis Care Facilities in South Africa
175
J Nice, T Kumirai, D Conradie, J-H Grobler
SASBE201539 A Rating Tool to Assess the Condition of South African Infrastructure 185
K Wall, C Rust
SASBE201540
Adapting to Environmental Sustainable Construction in Developing
Countries: A Multi-Theory Conceptualization
195
S Mensah, J Ayarkwa, G Nani
SASBE201549 Data Qualifications and Data Availability for Resource Flow Analysis in
Support of Urban Planning: Amsterdam’s Energy Metabolism
205
I M Voskamp, S Stremke, M Spiller, A Van Den Brink, H H M.
Rijnaarts
SASBE201553 The City-Zen Approach for Urban Energy Master Plans. Addressing
Technical Opportunities and Non-Technical Barriers
213
M Fremouw, S Broersma
SASBE201563
Comparing Pertirnent International Standards for Permissible Window
Air Leakage of Mechanical or Naturally Ventilated Buildings with
Equivalent South African Standards
223
J Laubscher
8

SASBE201564 Guidelines for People Capability Enhancement in Support of
Sustainable Facility Management Practices
233
N Sarpin, J Yang
SASBE201565
Lessons Learned from Soltrain, South Africa's One Million Solar Water
Heaters Initiative and from International Champions- How to Improve
Market Penetration in South Africa
241
D Holm
SASBE201570 The Development of Apost Occupancy Evaluation Tool for Primary
Schools: Learner Comfort Assessment Tool (LCAT)
251
L Motsatsi
SASBE201572
An Integrated Design Process for a Zero-Energy Refurbishment
Prototype for Post-War Residential Buildings in The Netherlands
261
T Konstantinou, T Klein, O G Santin, S Boess, S Silvester
SASBE201573 The Other “Half Of The City” – Analysis of Non-Residential Building
Stock and its Materials
R Ortlepp, K Gruhler, G Schiller, C Deilmann
SASBE201574
Building Material Substitutes vs. Topsoil Harvesting – Technical
Considerations with a Focus on Developing Countries
271
R Ortlepp, G Schiller, Z Sebesvari
SASBE201576 The Health Implications of Replacing Common Building Materials with
Natural Fibre Reinforced Composites
281
N L Ampofo-Anti
SASBE201578 Cradle-to-Gate Life Cycle Greenhouse Gas Emissions of South African
Building Envelope Materials
291
N Dumani
SASBE201581
Factors Influencing the Growth of Green Building in the South African
Construction Industry
303
E K Simpeh, J J Smallwood
SASBE201583 Instruments and Capacity for Sustainable Built Environments 311
J Gibberd
SASBE201584
Smart Fuel Choices in Urban Households: Stories from Women in
Soshanguve
321
T Sole, C Wagner
SASBE201585
Resident Demographics as Determinants of Household Recycling
Behaviour on Enclosed Housing Typologies in Pretoria, South Africa
331
G Nicolaou, R Neville, L Ndima, J Du Toit
341
9

SASBE201586
Exploring Recycling Behaviours in Two Different Enclosed Residential
Typologies
349
L Marais, L Sesheba, M Ntsimane, C Wagner
SASBE201587 Performance Based Standards: A Sustainable Solution for
Transportation In South Africa
359
R Berman, R Benade
SASBE201588 Reflective Practice as Basis for Sustainable Transformation a
Pedagogical Challenge
367
L Matsebula, C Du Plessis
SASBE201589
Critical Success Factors for Smart and Sustainable Facilities
Management in a South African University of Technology
377
B O Awuzie, F A Emuze, A Ngowi
SASBE201590
Key Performance Indicators for Project Success on Innovative Building
Technology Projects
385
C Mphahlele
SASBE201592 Lowering Carbon Footprints and Embodied Energy Through Innovative
Design – A Bus Rapid Transit Case Study
391
J Hugo, G H Stoffberg, A Barker
SASBE201593
The Emerging Role of a Landscape Based Strategy in the South African
Built Environment: A Case Study of the Johannesburg Wemmer Pan
Precinct
405
G Young
SASBE201595
Floor Area Concession Incentives as Planning Instruments to Promote
Green Building: A Critical Review of International Practices
413
K Fan, Q K Qian, E H W. Chan
SASBE201597
Effectiveness of Energy Efficiency Regulatory Tools
in the Housing Sector
421
H Visscher
SASBE201598
A Thermal Performance Comparison of Six Wall Construction Methods
Frequently used in South Africa
427
N Van Rooyen, P Vosloo
10

ALPHABETIC AUTHOR INDEX
Author Paper title Reference1
Ahvenniemi, H Sustainable Education of the Construction Sector in Zambia SASBE201513
Ampofo-Anti, N L The Health Implications of Replacing Common Building
Materials with Natural Fibre Reinforced Composites
SASBE201576
Andamon, M M Reflections for sustainability: Capitalising on stakeholder
engagement for optimising outcomes
SASBE201517
Antuña Rozado, C Sustainable Education of the Construction Sector in Zambia SASBE201513
Awuzie, B O Critical Success Factors for Smart and Sustainable Facilities
Management in a South African University of Technology
SASBE201589
Ayarkwa, J Adapting to Environmental Sustainable Construction in
Developing Countries: A Multi-Theory Conceptualization
SASBE201540
Balzun, E Performance Quantification of Building Technologies within the
South African Climatic Regions
SASBE201518
Barker, A Lowering Carbon Footprints and Embodied Energy Through
Innovative Design – A Bus Rapid Transit Case Study
SASBE201592
Basic, S Model for Sustainability Evaluation of Existing Residential
Buildings
SASBE201535
Benade, R Performance Based Standards: A Sustainable Solution for
Transportation In South Africa
SASBE201587
Berman, R Performance Based Standards: A Sustainable Solution for
Transportation In South Africa
SASBE201587
Boess, S
An Integrated Design Process for a Zero-Energy Refurbishment
Prototype for Post-War Residential Buildings in The Netherlands
SASBE201572
Bole, S The Creation of Cooling Degree (Cdd) and Heating Degree Day
(Hdd) Climatic Maps for South Africa
SASBE201519
Bosman, G Greening of Cement Stabilized Brickyard Industry for Supporting
Sustainable Building in Kuruman in the Northern Cape Province
SASBE201520
Broersma, S The City-Zen Approach for Urban Energy Master Plans.
Addressing Technical Opportunities and Non-Technical Barriers
SASBE201553
1The Reference Number is a unique paper reference that is used throughout the conference to identify the paper. This is also used as a page number prefix in the proceedings, and papers are sorted according to this number in the proceedings.
11

Chan, E H W Floor Area Concession Incentives as Planning Instruments to
Promote Green Building: A Critical Review of International
Practices
SASBE201595
Conradie, D C U A Comparison of Predicted Design Efficacy and Environmental
Assessment for Tuberculosis Care Facilities in South Africa
SASBE201538
Conradie, D C U Performance Quantification of Building Technologies within the
South African Climatic Regions
SASBE201518
Conradie, D C U The Creation of Cooling Degree (Cdd) and Heating Degree Day
(Hdd) Climatic Maps for South Africa
SASBE201519
Das, D K Transforming Bloemfontein City to a Smart City- A Systems
Thinking Approach
SASBE201504
Deilmann, C The Other “Half Of The City” – Analysis of Non-Residential
Building Stock and its Materials
SASBE201573
Dumani, N Cradle-to-Gate Life Cycle Greenhouse Gas Emissions of South
African Building Envelope Materials
SASBE201578
Du Plessis, C Reflective Practice as Basis for Sustainable Transformation. A
Pedagogical Challenge
SASBE201588
Du Toit, J Factors Affecting Household Recycling Behaviour in
Townhouses in Pretoria, South Africa
SASBE201527
Du Toit, J Resident Demographics as Determinants of Household
Recycling Behaviour on Enclosed Housing Typologies in
Pretoria
SASBE201585
Emuze, F Sustainability in the Built Environment: Exploring Barriers in
South Africa
SASBE201503
Emuze, F A Critical Success Factors for Smart and Sustainable Facilities
Management in a South African University of Technology
SASBE201589
Fan, K Floor Area Concession Incentives as Planning Instruments to
Promote Green Building: A Critical Review of International
Practices
SASBE201595
Femenias, P A Strong Research Environment for Sustainable Renovation
Established in Sweden
SASBE201528
Fletcher, L Factors Affecting Household Recycling Behaviour in
Townhouses in Pretoria, South Africa
SASBE201527
Fremouw, M The City-Zen Approach for Urban Energy Master Plans.
Addressing Technical Opportunities and Non-Technical Barriers
SASBE201553
Gibberd, J Instruments and Capacity for Sustainable Built Environments
SASBE201583
12

Grobler, J-H A Comparison of Predicted Design Efficacy and Environmental
Assessment for Tuberculosis Care Facilities in South Africa
SASBE201538
Gruhler, K The Other “Half Of The City” – Analysis of Non-Residential
Building Stock and its Materials
SASBE201573
Holm, D Lessons Learned from Soltrain, South Africa's One Million Solar
Water Heaters Initiative and from International Champions- How
to Improve Market Penetration in South Africa
SASBE201565
Hugo, J Lowering Carbon Footprints and Embodied Energy Through
Innovative Design – A Bus Rapid Transit Case Study
SASBE201592
Huovila, A Sustainable Education of the Construction Sector in Zambia SASBE201513
Isa, R B Sustainability in the Built Environment: Exploring Barriers in
South Africa
SASBE201503
Iyer-Raniga, U Reflections for sustainability: Capitalising on stakeholder
engagement for optimising outcomes
SASBE201517
Johansson, D A Strong Research Environment for Sustainable Renovation
Established in Sweden
SASBE201528
Klein, T
An Integrated Design Process for a Zero-Energy Refurbishment
Prototype for Post-War Residential Buildings in The Netherlands
SASBE201572
Konstantinou, T
An Integrated Design Process for a Zero-Energy Refurbishment
Prototype for Post-War Residential Buildings in The Netherlands
SASBE201572
Kruger, T Revising The South African Guidelines for Human Settlement
Planning and Design (The Red Book)
SASBE201529
Kumirai, T A Comparison of Predicted Design Efficacy and Environmental
Assessment for Tuberculosis Care Facilities in South Africa
SASBE201538
Laubscher, J Comparing Pertirnent International Standards for Permissible
Window Air Leakage of Mechanical or Naturally Ventilated
Buildings with Equivalent South African Standards
SASBE201563
Macagnano, M The Future of the Built Environment in the Information Age:
Integrating Concepts of Sustainability, Information and
Communication Technology, and Architecture
SASBE201530
Marais, L Exploring Recycling Behaviours in Two Different Enclosed
Residential Typologies
SASBE201586
Matsebula, L Reflective Practice as Basis for Sustainable Transformation A
Pedagogical Challenge
SASBE201588
Mensah, S Adapting to Environmental Sustainable Construction in
Developing Countries: A Multi-Theory Conceptualization
SASBE201540
13

Mjörnell, K A Strong Research Environment for Sustainable Renovation
Established in Sweden
SASBE201528
Mlecnik, E Supply-Side Collaboration for Energy-Efficient Renovations SASBE201509
Moore, T Reflections for sustainability: Capitalising on stakeholder
engagement for optimising outcomes
SASBE201517
Motsatsi, L The Development of Apost Occupancy Evaluation Tool for
Primary Schools: Learner Comfort Assessment Tool (LCAT)
SASBE201570
Mphahlele, C Key Performance Indicators for Project Success on Innovative
Building Technology Projects
SASBE201590
Nani, G Adapting to Environmental Sustainable Construction in
Developing Countries: A Multi-Theory Conceptualization
SASBE201540
Ndaba, D Revising The South African Guidelines for Human Settlement
Planning and Design (The Red Book)
SASBE201529
Ndima, L Resident Demographics as Determinants of Household
Recycling Behaviour on Enclosed Housing Typologies in
Pretoria
SASBE201585
Neville, R Resident Demographics as Determinants of Household
Recycling Behaviour on Enclosed Housing Typologies in
Pretoria
SASBE201585
Ngowi, A Critical Success Factors for Smart and Sustainable Facilities
Management in a South African University of Technology
SASBE201589
Nice, J A Comparison of Predicted Design Efficacy and Environmental
Assessment for Tuberculosis Care Facilities in South Africa
SASBE201538
Nicolaou, G Resident Demographics as Determinants of Household
Recycling Behaviour on Enclosed Housing Typologies in
Pretoria, South Africa
SASBE201585
Ntoi, B K Sustainability in the Built Environment: Exploring Barriers in
South Africa
SASBE201503
Ntsimane, M Exploring Recycling Behaviours in Two Different Enclosed
Residential Typologies
SASBE201586
Ortlepp, R
Building Material Substitutes vs. Topsoil Harvesting – Technical
Considerations with a Focus on Developing Countries
SASBE201574
Ortlepp, R The Other “Half Of The City” – Analysis of Non-Residential
Building Stock and its Materials
SASBE201573
Page, P R Smart optimisation and sensitivity analysis in water distribution
systems
SASBE201522
14

Petzer, E Revising The South African Guidelines for Human Settlement
Planning and Design (The Red Book)
SASBE201529
Pieterse, A Revising The South African Guidelines for Human Settlement
Planning and Design (The Red Book)
SASBE201529
Qian, Q K Floor Area Concession Incentives as Planning Instruments to
Promote Green Building: A Critical Review of International
Practices
SASBE201595
Rajab, A
Revising The South African Guidelines for Human Settlement
Planning and Design (The Red Book)
SASBE201529
Ridley, I Reflections for sustainability: Capitalising on stakeholder
engagement for optimising outcomes
SASBE201517
Rijnaarts, H H M. Data Qualifications and Data Availability for Resource Flow
Analysis in Support of Urban Planning: Amsterdam’s Energy
Metabolism
SASBE201549
Rust, C A Rating Tool to Assess the Condition of South African
Infrastructure
SASBE201539
Santin, O G
An Integrated Design Process for a Zero-Energy Refurbishment
Prototype for Post-War Residential Buildings in The Netherlands
SASBE201572
Sarpin, N Guidelines for People Capability Enhancement in Support of
Sustainable Facility Management Practices
SASBE201564
Schiller, G Building Material Substitutes vs. Topsoil Harvesting – Technical
Considerations with a Focus on Developing Countries
SASBE201574
Schiller, G The Other “Half Of The City” – Analysis of Non-Residential
Building Stock and its Materials
SASBE201573
Schultmann, F Deconstruction Project Planning based on Automatic Acquisition
and Reconstruction of Building Information for Existing Buildings
SASBE201511
Sebesvari, Z Building Material Substitutes vs. Topsoil Harvesting – Technical
Considerations with a Focus on Developing Countries
SASBE201574
Senjak, I Model for Sustainability Evaluation of Existing Residential
Buildings
SASBE201535
Sesheba, L Exploring Recycling Behaviours in Two Different Enclosed
Residential Typologies
SASBE201586
Sevilmis, N Deconstruction Project Planning based on Automatic Acquisition
and Reconstruction of Building Information for Existing Buildings
SASBE201511
Silvester, S An Integrated Design Process for a Zero-Energy Refurbishment
Prototype for Post-War Residential Buildings in The Netherlands
SASBE201572
15

Simpeh, E K Factors Influencing the Growth of Green Building in the South
African Construction Industry
SASBE201581
Smallwood, JJ Factors Influencing the Growth of Green Building in the South
African Construction Industry
SASBE201581
Sole, T Smart Fuel Choices in Urban Households: Stories from Women
in Soshanguve
SASBE201583
Spiller, M Data Qualifications and Data Availability for Resource Flow
Analysis in Support of Urban Planning: Amsterdam’s Energy
Metabolism
SASBE201549
Stenberg, V A Strong Research Environment for Sustainable Renovation
Established in Sweden
SASBE201528
Steyn, J J Greening of Cement Stabilized Brickyard Industry for Supporting
Sustainable Building in Kuruman in the Northern Cape Province
SASBE201520
Stoffberg, G H Lowering Carbon Footprints and Embodied Energy Through
Innovative Design – A Bus Rapid Transit Case Study
SASBE201592
Straub, A Supply-Side Collaboration for Energy-Efficient Renovations SASBE201509
Stremke, S Data Qualifications and Data Availability for Resource Flow
Analysis in Support of Urban Planning: Amsterdam’s Energy
Metabolism
SASBE201549
Szewczuk, S Smart Sustainable Energy for the Rural Built Environment SASBE201525
Van den Brink, A Data Qualifications and Data Availability for Resource Flow
Analysis in Support of Urban Planning: Amsterdam’s Energy
Metabolism
SASBE201549
Van Heerden, Q Using Social Media Information in Transport- and Urban
Planning in South Africa
SASBE201536
Van Niekerk, W
Revising The South African Guidelines for Human Settlement
Planning and Design (The Red Book)
SASBE201529
Van Reenen, T The Creation of Cooling Degree (Cdd) and Heating Degree Day
(HDD) Climatic Maps for South Africa
SASBE201519
Van Rooyen, N A Thermal Performance Comparison of Six Wall Construction
Methods Frequently used in South Africa
SASBE201598
Vezilic Strmo, N Model for Sustainability Evaluation of Existing Residential
Buildings
SASBE201535
Visscher, H Effectiveness of Energy Efficiency Regulatory Tools
in the Housing Sector
SASBE201597
16

Volk, R Deconstruction Project Planning based on Automatic Acquisition
and Reconstruction of Building Information for Existing Buildings
SASBE201511
Voskamp, I M Data Qualifications and Data Availability for Resource Flow
Analysis in Support of Urban Planning: Amsterdam’s Energy
Metabolism
SASBE201549
Vosloo, P A Thermal Performance Comparison of Six Wall Construction
Methods Frequently used in South Africa
SASBE201598
Wagner, C Exploring Recycling Behaviours in Two Different Enclosed
Residential Typologies
SASBE201586
Wagner, C Factors Affecting Household Recycling Behaviour in
Townhouses in Pretoria, South Africa
SASBE201527
Wagner, C Smart Fuel Choices in Urban Households: Stories from Women
in Soshanguve
SASBE201583
Wall, K A Rating Tool to Assess the Condition of South African
Infrastructure
SASBE201539
Yang, J Guidelines for People Capability Enhancement in Support of
Sustainable Facility Management Practices
SASBE201564
Young, G The Emerging Role of a Landscape Based Strategy in the South
African Built Environment: A Case Study of the Johannesburg
Wemmer Pan Precinct
SASBE201593
17

18

SUSTAINABILITY IN THE BUILT ENVIRONMENT: EXPLORING BARRIERS IN SOUTH AFRICA
Fidelis EMUZE1
Basia Kevin NTOI2
Rasheed Babatunde ISA3 1 Department of Built Environment / Faculty of Engineering and Information Technology/Associate
Professor and Head of Department / Central University of Technology, [email protected] 2 Department of Built Environment / Faculty of Engineering and Information Technology/Graduate /
Central University of Technology 3 Department of Civil Engineering / Faculty of Engineering and Information Technology/ Doctoral
Student / Central University of Technology, [email protected] Keywords: Built Environment, Project Actors, Sustainability, South Africa
Abstract
Sustainability in the built environment has become an international imperative within the Architecture, Construction, and Engineering (AEC) sector. While much has been written about the barriers to sustainable construction in South Africa, the implementation of the concept is still a challenge. This study thus employs an interpretative paradigm to add to what is known about the issues in South Africa. The collection, categorization and analysis of interview transcripts and a review of the findings in relation to the literature led to salient insights. Such insights show that education and experience inform a designer’s understanding of sustainable design and construction. Designers’ understanding of sustainable design values affect their behaviour, attitude and likelihood to promote sustainable practice. Change strategy that equips a project actor with knowledge and skill needed to do things differently seems to be a major factor for embedding sustainability in the built environment. Solutions to barriers that were identified include improved knowledge of sustainable design, construction and the material usage. Most importantly, there is a need for a change in clients’ perception of the cost of going green.
1. Background
Sustainability in the built environment has become an international imperative within the Architecture, Construction, and Engineering (AEC) sector. Patterns of development in the past have largely neglected the reality of natural resources and environmental issues. The ecological footprint of the human race has exceeded the global carrying capacity of the Earth (Wackernagel & Rees, 1996). This “overshoot”, as a result of upstream activities, comes with diverse symptoms that affect various facets of daily living; environmental pollution, global warming, resource depletion and environmental degradation, ozone layer depletion and economic downtown. These revelations have changed the worldviews and spurred people across the globe to embrace paradigm shift towards environmental responsiveness. Environmental responsibility in the form of new values, change in belief, attitude or way of doing things became fundamental in the new worldview. This paradigm shift in the upstream activities as a whole towards best practices could lead to cleaner industries and creation of industry and resource sectors with a low environmental impact compared to its socio-economic impact. Sustainability is a growing economic development model based on the knowledge that aims to address the interdependence of economic growth and natural ecosystems and the adverse impact economic activities can have on the environment (Bangdome-Dery & Kootin-Sanwu, 2013). Various concepts and terminologies have been developed and promoted over the years to situate this new idea; ‘green business’, ‘green building’, ‘sustainable design’, ‘sustainable architecture’, ‘sustainable construction’, ‘ecological building’, ‘renewable energy’, and ‘sustainable materials’. These concepts, if implied correctly will significantly balance the state of the ecosystem and improve the built environment (Jones, 2008). It is never in doubt, the need for physical infrastructure and large-scale development in the built environment in developing countries (Du Plessis, 2007; Bangdome-Dery & Kootin-Sanwu, 2013). However, these needs need to be addressed in a way that is socially and ecologically responsible. Lessons from the developed world suggest that greater urgency is needed now in making sustainable interventions, while these built environments are being created, rather than try and change things after technically exceeding the ecosystem’s carrying capacity. Since the emergence of the sustainability concept: design and construction, adaptation of this production method and thinking has been slow in its uptake. The fragmented, complex and project-based nature of the construction industry poses as a hindrance to the implementation of sustainable
19

construction practices (Bygballe & Sward, 2014). While much has been written about the barriers to sustainable construction globally and in particularly in South Africa, the implementation of the concept is still a challenge. These barriers have limited adaptability within the industry and hence robbing the industries of the expected benefits associated with sustainable construction practices. Some of the associated benefits of sustainable construction, which make it worth pursuing are competitive advantage, meeting legislative framework, company reputation, client value creation, meeting client demand, overall financial incentive, and good community relation (Othman, 2011: Suresh, Bashir & Olomolaiye, 2012; Madu and Kuei, 2012). Nevertheless, implementation challenges continue to elude industry stakeholders. The development of certain enablers were indeed required to assist stakeholders to achieve sustainability objectives. Previous studies further suggested that although there is current drive towards sustainable design and construction, its frequency of application and the scope of sustainability tools is still poor and not all encompassing respectively (Aye, 2003; Kang & Guerin, 2009). These authors identified multiple barriers to the incorporation or attempts to mainstream sustainable design and construction into practice. These include perceived cost, time to source the right materials, education and training, understanding and in house experts. Studies also identified clients’ lack of demand and resistance, knowledge of materials, limited material selection and authenticity of suppliers of sustainable materials, along with clear understanding of the impact of non-conventional materials, accurate and accessible information and appropriate tools for sustainable design and construction (Mate, 2006: Kang & Guerin, 2009). Other barriers that were identified are client demands, client knowledge and call backs from clients, accurate and accessible information and appropriate tools (Davis, 2001).Based on this observation, the study set out to investigate the common barriers in South African Construction; the various forms of such limiting factors, and possible means of ameliorating them for an acceptable uptake within the industry. Preliminary investigation by the researchers shows that in Bloemfontein, sustainability still follows the policy path rather than conscious efforts by stakeholders to maximize it benefits, or an attempt to climate resilience. Unfortunately, stakeholders are not equipped with adequate information, skills, and motivation for holistic pursuit of sustainable design and construction, so as to harness the benefits and preserve the ecosystem. This gap is what is needed to be bridged. The general structure of this study is as follows: literature review; research methodology; research findings, tailored along the common barriers theme of cost, education and experience, stakeholders awareness, political and policy, and materials as derived from the data sources; followed by a discussion, based on sustainability drivers. These drivers are economic and ecological/societal concerns - of stakeholder’s demand, financial issues, environment sustainability, and social responsibility as postulated by Windapo (2014).
2. Literature Review
The energy crisis, environmental pollution and the climate change in the 1970s alerted the world of the need for a balanced ecosystem (Ghosh et al., 2014). This environmental concern later led to the world congress, which cumulated in the report of the World Commission on Environment and Development (WCED, 1987) that defines sustainable development as “a development which meets the needs of the present without compromising the ability of future generation to meet their own needs”. This is the most widely accepted definition for sustainable development. The Organization for Economic Co-operation and Development (OECD) in their report of sustainable building and construction in 2003 stated that the building sector is largely responsible for the pollution and energy deficit of the built environment. The International Energy Agency (IEA) released a publication which estimated that existing buildings are responsible for more than 40% of the world’s total primary energy consumption and for 24% of global carbon dioxide emissions (Howe, 2010). Therefore, in order to lessen the destructive impact of construction on the natural environment, OECD brought together experts to develop sustainable management and operational practices ranging from planning, design, development, construction, ownership, financing, management and utilization of built properties (OECD,2003). As a direct result of the aforesaid, a number of green tools for design and construction in the built environment have been developed to promote green/sustainable building practice throughout the world. The first being the Leadership in Energy and Environmental Design (LEED), followed by others such as, Building Environmental Quality Evaluation for Sustainability through Time (BEQUEST), Building for Environmental and Economic Sustainability (BEES), Building Research Environmental Assessment Method (BREEAM), etc. These tools are built on six (6) main principles namely; understanding place, connecting with nature, understanding natural processes, understanding environmental impact, embracing co-operative design processes and understanding people (Hui, 2002). According to Kibert (2008), the seven principles for sustainable construction include reduce resource consumption (reduce), reuse resources (reuse), use recyclable resources (recycle), protect nature (nature), eliminate toxics (toxics), apply life-cycle costing (economics) and focus on quality (quality). The successful application of these principles, in an integrated manner, will produce a sustainable architecture that will save money, increase comfort and create healthier environments for people to live and work by using improved indoor air quality, natural daylight and thermal comfort (OECD, 2003).
20

In Africa, sustainable building philosophy has been championed by pressure groups, and a number of private and public institutions and organizations. This is evident in the plethora of several reports, namely; Promoting Renewable Energy in Africa (PREA), South Africa Chapter of the Green Building Council (GBCSA), Holcim Foundation as well as Emerging Africa Infrastructure Fund (EAIF) (Bangdome-Dery and Kootin-Sanwu, 2013). GBCSA in 2008, developed a Green Star SA rating tool, to provide the commercial property industry with an objective measurement for green buildings and to recognize and reward environmental leadership in the built industry (Jacobs, 2011). South African government has made progress in establishing policy in favour of sustainable development through regulations guiding the built environment. At present, there are two South African National Standards which promote environmental sustainability and energy savings. These include SANS 204:2011 (SABS SANS 204 2011) which regulate energy usage in new buildings and SANS 10400-XA (SABS SANS 10400-XA 2011) which has two parts: i. Part X which concerns environmental sustainability, and ii. Part XA considers energy usage in buildings. Some researchers point to the need for the built environment professionals to begin utilizing sustainable building practices such as energy efficiency concepts and sustainable materials (Koranteng, 2010; Ashiboe-Mensah et al., 2011). Africa is considered a low risk area, as a result of availability of green building potentials in the zone, materials such as sun dried bricks, compressed earth blocks, lime stabilized earth blocks, laterite stones and pozzolana are in abundance but their use is so limited to have significantly increase global warming (Manu et al., 2009). Further suggestions from the research include the need for a policy direction, incentives and disincentives that encourage sustainable urban and rural development, environmental education and the use of renewable energy and green building materials to reduce emissions. Jacobs (2011) and Wilreker (2011) examine barriers for sustainable design and construction particularly in South Africa. These studies flag cost; lack of knowledge about sustainable practices; lack of knowledge about effects of non-sustainable practices in the environment; lack of training and education; availability / lack of availability of green resources; and attitude of professionals. The absence of a legislative instrument on sustainable development and political consideration – especially in public projects - in most developing countries remain a major barrier. Jacobs (2011) argues that the right policy formulation regulating the green building practice will drive construction professionals to utilize sustainable design principles on projects. Nilsson et al. (2011) assert the need for improvements in the knowledge base of both architect and client alike, for positive impact on sustainable design and construction in the industry.
3. Research Methodology
The purpose of this study is to contribute to the discourse on the topical issues of sustainability in the built environment by further examining the barriers hindering its full uptake by the stakeholders in infrastructural development in the South Africa. Within the construction context, the understanding of the barrier to sustainable design and construction, and the assessment of its possible enablers is of significance to sustainable development. This study employs an interpretative paradigm to add to what is known about the issues. The collection, categorization and analysis of interview transcripts and a review of the findings in relation to the literature, in Bloemfontein - South Africa in 2014, led to salient insights. The participants were selected based on ‘purposive sampling’, as this was vital to the success of the interviews. Purposive sampling means that participants are selected according to a defining characteristic that makes them role players of the data needed for the study (Nieuwenhuis, 2007). In particular, eleven stakeholders in infrastructure development were interviewed in five different entities (department of works, project managers, consultants, policy administrator and academia) with semi-structured questions that were initially sent to them by e-mail. A follow up telephone call was used to confirm the actual date of the interview. This was done to make the interview exercise consistent. The interviews were conducted over a period of two weeks. Interviews, generally, were between 20 to 25 minutes in duration. At the commencement of the interviews, each participant was reminded of the research problem and of the interview processes. Each interviewee was then provided with a covering letter to read, a confidentiality agreement to sign; on demand. This process was then followed by the actual interview during which the interview protocol was utilized as a guide. Each participant was asked about his/ her experience and perception of the numerous themes related to the phenomenon. All interviews were recorded and transcribed. As mentioned earlier, eleven interviewees participated in the study. The interview findings were further supported with secondary data from available information on completed projects from the department of works. The interviewees consisted of 4 women and 7 men between the ages of 30 and 54. The educational levels of the participants ranged from a national diploma to a master degree, and construction industry experience ranged from 5 to 31 years (see Table 1). The management levels of interviewees varied from junior management to senior management, with job titles ranging from site agent to managing director. In compliance with the confidentiality agreement, the identities of the interviewees were not revealed and only referred to as numbers 1-11 in the course of the study.
21

Table 1: The demographics of interviewees S/N Highest Level of
Education Entities Designations Years in
Industry
1. Bachelor’s Degree Works department Project supervisor 5
2. Bachelor’s Degree Consultant Project manager 9
3. National Diploma Project managers Site agent 10
4. Bachelor’s Degree Consultant Architect 25
5. Honours Degree Project managers Managing director 25
6. Master’s Degree academia Senior Lecturer 20
7. Honours Diploma Works department Junior manager 11
8. Honours Degree Project developer Director 31
9. National Diploma Policy administrator Director 8
10. Bachelor’s Degree Consultant Quantity surveyor 14
11. Bachelor’s Degree Consultant Civil engineer 9
4.0 Research Findings
From a critical review of the data available, five main themes were identified through the study, namely: stakeholder’s awareness and demand, cost implication, education and experience, political and policy issues, and materials.
Theme 1: Stakeholder’s awareness and demand
With several stakeholders such as government as a client and regulator, developers, investors, green building council, contractors, consultants, building materials manufacturers and tenants having different success determinants for a specific project, so also are their demands for the project. This need, along with the fragmented nature of project development, which is often one-off with different set of stakeholders is robbing the industry of the needed repetitiveness and sustainability experience over time. Most of the interviewees agree with interviewee No. 2 that says “you would have to almost do that study, come up with empirical evidence and show the benefits in terms of their core values, for stakeholders to dispense their resources or demand for such”. Clients with a report prioritizing long term economic savings, contractors maximizing the profit margin and company’s reputation, users are more concerned with comfort level and energy use. Respondents also see the lack of time and resources to do research that will reveal the empirical outcomes, of what materials and systems are environmentally dependable, strong enough to convince the stakeholders as a definite negative impact on the implementation of sustainability within the industry. Most participants also agree with the view of interviewee 6, who indicates that: “I don’t think that we are ready for total uptake of green materials in this country as yet” and “Everybody wants imported and sophisticated material, especially if clients can afford it, not minding the carbon footprint increases”. These can also be traced to the level of awareness, as most stakeholders are not even aware of the carbon footprint of products or their effects on the built environment.
Theme 2: Cost implication
The most significant barrier to sustainability in the built environment, reiterated by all the interviewees, has been the cost in monetary terms. The general question was ‘who is going to pay for the extra cost’, despite the stakeholders commitment to sustainable design and construction, and often the client’s intention to procure a sustainable infrastructure, the costs involved in opting for and implementing such a solution were usually an overriding barrier. Most interviewees state that less than 10% sustainable design projects in their books were eventually backed for completion due to perceived extra initial costs of procurement. The interviewees argue that environmentally responsible materials and systems carry initial cost implications, which made it more expensive in relation to the traditional design in a short time, so a client demand is needed for a chance of its actualization.
22

Theme 3: Education and experience
Sustainability, sustainable design and sustainable construction are new concepts currently undergoing a developmental phase within the industry and the academia alike. The new philosophy became prominent in the late 90’s, as a response to the effects of prolonged environmental degradation. Interviewee 10 said, “Sustainability was not taught during our time at the university” while others agreed, stating that “it was mentioned briefly”. Since the commencement of the sustainability discourse, the main promoters have been civil societies, professional bodies and relevant government agencies through; workshops, seminars, continued professional development (CPD) events and conferences. While the actual driver for its enlightenment, uptake and policy direction have been somewhat limited to government interventions and the current drive in the academia for its proper integration into the school curriculum. For this reason, most participants agreed to their lack adequate experience and knowledge of the practice thereof.
Theme 4: political and policy issues
An interviewee argues that political and policy issues are vital to decision making when it comes to sustainability issues, as its application can easily swing from being a driver to a major barrier. He further proffer that most a time’s political decisions are based on some inherent interests beyond the analysis of the socio-economic and environmental benefits. Interviewees’ agree that projects are often awarded to contractors, lacking in the right skill and competency for sustainable technology, due to political considerations. The state of policy development, sustainability tools and the capacity of the regulation body for effective monitoring is also a barrier. According to Interviewee 6 “most stakeholders are unwilling partakers in sustainability concept, unless driven by government regulations”. People tend to comply with legal issues especially for projects approval.
Theme 5: Materials
Material characterization, certification, selection, and sourcing have been identified as a major barrier to sustainability in the construction industry. Participants revealed that “most sustainable materials are relatively new and often manufactured by new small business” and information about new materials to warranty reliability comes from extensive research for proper characterization, which leads to product classification by manufacturers and suppliers. Classification is a criterion for material certification. Certification ensures that a product is indeed environmentally responsible and infrastructure designers find it hard to distinguish between what is authentic from that which is not. This opinion was almost unanimous among the interviewees seeking to specify environmentally sustainable products and materials. The interviewees further mentioned that due to the non-transparent nature of product suppliers and manufacturers, designer’s found it difficult to source and/or establish which products are authentic. Pertaining to selection of environmentally responsible materials interviewee 1 states that: “the range of green materials in the industry is limited, so it is quite a barrier, to freedom of selection”. Another major obstacle expressed in the literature is the inability to source locally produced environmentally responsible products. Considering that imported products carry a carbon footprint, consultants, where possible, should try to recommend locally available materials.
5. Discussion
The findings are herein discussed in line with drivers of economic and ecological/societal concerns of stakeholder’s demand, financial issues, environment sustainability, and social responsibility dimensions. This provides a platform to integrate the primary data and the literature for meaningful interpretation within the context, for the right insight into the phenomenon. These drivers normally manifest in the forms of the need to reduce building operating costs and acquire a competitive advantage, financial benefits of green building as a result of various incentives. Other manifestations occur in the following forms, namely; reduced operating costs, reduced environmental impact/need for environmental sustainability, and the need for corporate social responsibility.
5.1 Stakeholders Demand
The effectiveness of infrastructure development depends on meeting the varying needs of stakeholders, which is often, hinged on the level of their awareness of the activities and knowledge of the built environment. This knowledge serves as a driver for their demands and the ability to benchmark own determinant for sustainable infrastructure. Most interviewees agree with Bond (2010) that tenant demands are driving client’s involvement with green practices, despite the tenants’ unwillingness to pay extra to lease a Green rated building. Investors are also leaning towards building green for long term financial benefits, reduced maintenance costs and future sales of green rated properties. These developments in South Africa are not unconnected with the drive by the government. The drive by the government is seen through policies and rating systems, apart from the works of relevant civil societies serving as pressure groups, the academia in bringing the curriculum gap and academics seminars and conferences; and professional bodies through the CPD and membership. These activities bring benefits of sustainability to stakeholders, and also promote the needs for sustainable practices. The seemingly lack of demand is a human response to the level of awareness, and therefore management should take the necessary steps to counter it through
23
education and communication; participation and involvement; facilitation and support, and negotiation and rewards (Smit et al., 2011).
5.2 Financial issues
Whole life study is essential whenever the issue of sustainable design and construction is deliberated upon in relation to cost, as cost is always the bottom line. Researchers in one study argued that reduced operating costs are a primary motive for sustainable construction (Tzschentke et al., 2004). Buy and Hurbissoon (2011) further indicate that companies that integrate green initiatives as part of its policy, such as natural and renewable energy and sustainable design, are able to reduce energy-related operating costs. As energy cost is becoming more important in built environment discourse, it can be inferred from the interviewees’ transcript that the knowledge of financial benefits, even though in long term aid the stakeholders demand for sustainable designs and practices. Consultants must hence, certainly be up-to-date with the industry developments in order to present the needed facts and create options, for an easy decision for any investor and users alike.
5.3 Environmental sustainability
Sustainability is now a focal point of world debate due to the upstream activities and built environment re-creation. Ozone layer depletion, environmental degradation, carbon content and carbon footprint gradually became economic and political issues. Goals such as reducing a building’s environmental impact, decreasing the building’s contribution to greenhouse gas emissions, and providing a healthier work environment for occupants often factor into the decision for design and construction of today’s building (International Corporate Responsibility Report (ICRP), 2008). The interviewees affirmed the adoption by the designers of the 3R; reduce, reuse, and recycle, as a guide for resources such as land, energy, water and other materials, for more efficiency in green building as opposed to the case of conventional buildings, and with the prevalent use of natural lighting and improved indoor air quality, which contributes to the overall health, comfort, and productivity of its occupants (Kats, 2003). The Green Building Council of South Africa (GBCSA) has developed a policy for promoting sustainable development and energy saving, in line with other developed world rating systems such as LEED and BREEAM, to assist the built environment in becoming more sustainable. The Green Star rating system was developed and has been managed by the GBCSA, though, a voluntary tool that provides the property industry with “an objective measurement for green buildings”.
5.4 Social Responsibility
Sustainable design and construction practices are often adopted for ethical reasons and to promote moral believes, although such practices raise construction costs in most cases, investors and construction firms considered it an obligations to the community (Tzschentke et al., 2004). Respondents assert that the industry stakeholders prefer to be seen as being environmentally / socially responsible rather than the actual practice. Industry today now have a deliberate company policy of sourcing certain percentage of human and materials resources within the local community, to promote community relations and company’s image. It can also be inferred from the interviewee’s transcript that some industry players also have degradation and climate change resilience approaches, for ameliorating the effects of their upstream activities such as forestation, water purification and land reclamation within the operating areas. These practices are of mutual benefits, as most communities look to work with social and environmental responsible firms, and in addition, they tend to attract and keep the best human resources available in the industry (Yates, 2001 & Opoku and Ahmed, 2015).
6. Conclusion
Sustainability in the built environment is assuming wider dimensions, moving from technical / physical considerations that are evident in environmental impact to various forms of adaptations. While much has been written about the barriers to sustainable construction in South Africa, the implementation of the concept is still a challenge. The findings of this study resonate with previous work. It highlights the continuing challenges linked the uptake of sustainability ethos under the following themes, namely; awareness and demand, cost implications, education and experience, policy issues, and material. Therefore, overcoming these challenges is central to the full uptake of sustainable design and construction in South Africa. For instance, insights from this study show that education and experience inform a designer’s understanding of sustainable design and construction. In addition, project actors’ understanding of sustainable design values affect demand, behaviour, attitude and likelihood to practice in accordance with green building ethos. More so, the understanding of these values should placate the apathy brought about by the initial cost barriers. Change strategy that equips a project actor with knowledge and skill needed to do things differently seems to be a major factor for the promotion of sustainability in the built environment. Solutions to barriers that were established include improved knowledge of sustainable design and construction, a change in cost perception, improved knowledge and scope of materials and proper client enlightenment. However, it can be said that this paper is limited to Bloemfontein role player’s perspectives that generally affects its generalization, the dearth of data and knowledge of
24

stakeholders regarding the scope and the context of this study also calls for a wider study within South Africa.
References
Ashiboe-Mensah, N. A., Akuffo, F. and Fugar, F. 2011. Investigating the perceptions of architects in the Ghanaian building Industry with regard to photovoltaic energy technology. In: Laryea, S., Leiringer, R. and Hughes, W. (Eds) Procs West Africa Built Environment Research (WABER) Conference, 19-21 July 2011, Accra, Ghana, 675682. Aye, E. 2003. Taking the Pulse: Sustainability and the Interior Design Practice. Retrieved 11/08/2011, from Green Building Services: http://www.greenbuildingservices.com/news/releases/2003_13__55_pulse.pdf Bangdome-Dery, A. and Kootin-Sanwu, V. 2013. Analysis of barriers (factors) affecting architects in the use of sustainable strategies in building design in Ghana. Research Journal in Engineering and Applied Sciences (RJEAS), 2(6), pp. 418-426. Baygballe, L. E. and Sward, A. 2014. Implementing lean construction: a practice perspective. In: Proceedings of the 22
nd Conference of the International Group of Lean Construction (IGLC), Oslo,
Norway, pp. 3-14. Bond, S. 2010. Best of the Best in Green Design: Drivers and Barriers to Sustainable Development in Australia; Lincoln University Digital Dissertation: Cantebury, UK. Buys, F. and Hurbissoon, R. 2011. Green buildings: A Mauritian built environment stakeholders’ perspective. Acta Struct. 18, pp. 81–101. Davis, A. 2001. Barriers to Building Green. Retrieved on 11/06/2013, from http://www.architectureweek.com/2001/0822/ environment_1-1.html Du Plessis, C. 2007. A strategic framework for sustainable construction in developing countries. Construction Management and Economics, retrieved from http://www.tandf.co.uk/journals on 03/11/2014. GBCSA (Green Building Council of South Africa). ‘Vision and Mission [Sa]’. Retrieved on 04/10/2013, from Green Building Council of South Africa: http://www.gbcsa.org.za/about/ vision.php Ghosh, S., Bhattacharjee, S., Pishdad-Bozorgi, P. and Ganapathy, R. 2014. A case study to examine environmental benefits of lean construction. In: Proceedings of the 22nd Conference of the International Group of Lean Construction (IGLC), Oslo, Norway, pp. 133-144. Hakinson, M and Breylenbanch, A. 2012. Barriers that impact on the implementation of sustainable design. Northern World Mandate Conference, Culmulus Hensinki, 2012, May 24-26, Hensinki, Finland. Howe, J.C. 2010. Overview of green buildings. National Wetlands Newsletter, 33(1) Hui, S.C.M. 2002. Sustainable Architecture and Building Design. Retrieved from http://www.arch.hku.hk/research /sustain.htm on 11/03/ 2013. ICRR, 2008. Intel Corporate Responsibility Report. Retrieved on 11/05/2013 from http://www.intel.com/. Jacobs, E. 2011. Sustainable Building awareness in the Free State Province, South Africa. Proceedings of 6th Built Environment Conference. July – August 2011, JHB, South Africa. Jones, L. 2008. Environmentally responsible design: green and sustainable design for interior designers. New Jersey: John Wiley & Sons, Inc. Kang, M., Kang, J.H and Barnes, B. 2008. Interior Design Characteristics Influencing Sustainable Energy Awareness and Application. International Journal of Spatial Design & Research, 8(10), pp. 17-28. Kats, G.H. 2003. Green Building Costs and Financial Benefits. Massachusetts Technology Collaborative: Massachusetts, MA, USA. Kibert, C. J. 2008. Sustainable construction: green building design and delivery. New Jersey. John Wiley & Sons, Inc. Koranteng, C. 2010. Evaluation of occupants’ behaviour and preferences in office buildings in Ghana. Journal of Science & Technology, KNUST, 3 (30), pp 299 – 307. Madu, C.N. and Kuei, C. (2012). Introduction to Sustainable Management. In: Madu, C. N. and Kuei, C. (eds), Handbook of Sustainability Management. Singapore, World Scientific Publishing Co. Manu, F. W., Baiden-Amissah P.D, Adobor, D. C. I. and Danquah, J.A. 2009. Mitigating Global Climatic Change through The Use Of Green Building Materials. National Housing Conference Proceedings: 7th-8th October, 2009 at STEPRI. C.S.I.R (Building and Road Research Institute). ISSN 0855-1715 Pp208 -217.
25

Mate, K.J. 2006. Champions, Conformists and Challengers: Attitudes of Interior Designers as Expressions of Sustainability through Material Selection. Paper presented at Design Research Society International Conference. Wonderground, 1-4 November, Paper 0066, Lisbon, portugal. Nielson, C., Wolfe, C. B. and Conine, D. 2009. Green Building Guide: Design techniques, Construction Practices & Materials for Affordable Housing. Published by Rural Community Assistance Corporation (RCAC). www.rcac.org Nieuwenhuis, J. 2007. Qualitative research designs and data gathering techniques. First steps in research, 69-97. OECD, 2003. Environmentally Sustainable Buildings: Challenges and Policies. Organization of Economic Cooperation and Development (OECD), Paris. Opoku, A. and Ahmed, V. 2015. Drivers and challenges to the adoption of sustainable construction practices. In: Opoku, A. and Ahmed, V. (ed.) Leadership and sustainability in the built environment. Abingdon, Oxon, Taylor and Francis. Othman, A.A.E. 2011. Lean principles as a strategic option for delivering innovative sustainable construction projects: a client value driven approach. In: proceedings of 6th Built Environment Conference, Johannesburg South Africa 31 July – 2 August, pp. 174-187. Smit, P.J., Cronje, G.J., Brevis, T. and Vrba, M.J. 2011. Management Principles: A Contemporary Edition for Africa, 5th Edition. Epping, Cape Town: Juta South Africa. (2008). Department of Environmental Affairs and Tourism. People-Planet-Prosperity: A National Framework for Sustainable Development in South Africa. Retrieved on 10/01/2014, from South African Government Department of Environmental Affairs: http://www.environment.gov.za/HotIssues/2008/nfsd/nfsd.html# Suresh, S., Bashir, A.M. and Olomolaiye, P.O. 2012. A protocol for lean construction in developing countries. In: Ofori, G. (ed.) Contemporary Issues in Construction in Developing countries. London, Spon Press. Tzschentke, N.; Kirk, D. and Lynch, P. 2004. Reasons for going green in serviced accommodation establishments. Int. J. Contemp. Hosp. Manag. 16, pp.116–124. Wackernagel, M. and Rees, W. 1996. Our ecological footprint: reducing human impact on earth. Gabriola Island: New Society Publishers WCED, 1987. Our Common Future: Brundtland report of the world commission on environment and development (WCED), United Nations General Assembly, New York. Wilreker, H. 2011. Green – an architect’s perspective. Urban Green File, 15(6), pp. 6-7. Windapo, A.O. 2014. Examination of green building drivers in the South African construction industry: Economics versus ecology. Sustainability, 6, retrieved from http://www.mdpi.com/journal/sustainability. Yates, A. 2001. Quantifying the business benefits of sustainable buildings: Summary of existing research findings. Centre for Sustainable Construction, Watford: Building Research Establishment (BRE).
26

TRANSFORMING BLOEMFONTEIN CITY TO A SMART CITY- A SYSTEMS THINKING APPROACH
Dillip Kumar DAS1
1 Department of Civil Engineering, Faculty of Engineering and Information Technology, Central University of Technology, Free State, Bloemfontein, South Africa, Email: [email protected]
Keywords: Entrepreneurship, Governance, People’s participation, Public transportation, Information Communication Technology
Abstract
There is an argument for change in the perspectives of development of cities. Increasingly many countries in the West and some developing countries are making concerted attempts to transform their cities to smart cities. This paper presents how a city can be transformed to a smart city. Using Bloemfontein in South Africa, a case study was performed to evaluate the performance of important attributes under key sectors, such as economy, mobility, and governance to observe the opportunities and challenges the city offers to transform it to a smart city. Qualitative analytical logics were examined to understand the inter-linkage among the factors and attributes that would aid in developing policy interventions to prompt transformation of the city to a smart city. Findings indicate that there are encouraging indications in all the three sectors. The positive attributes of governance scenarios offer definite opportunities, however, there are challenges to be met in the economy and mobility. The causal feedback maps revealed (1) reinforcement of the inter-relationship among entrepreneurship, innovative spirit, productivity, economic image and international embeddedness will foster smart economy; (2) efficient public transportation and advancement of Information Communication Technology (ICT) system will strengthen local accessibility and ensure innovative, sustainable and safe transportation system that will result in smart mobility; and (3) effective participation of stakeholders in the decision making process alongside the elected city council, and transparency will aid smart governance. The complementary effect of these attributes should enable transformation of the city to a smart city.
1. Introduction
In the words of David Harvey renowned for urban geography, a city is a thing, but urbanisation is a process. However, both of them have the characteristics to evolve over time. Cities all over the world have been evolved and transformed from one state to another; for example, from a small and humble urban centre to a large or sometimes to a mega city. There have been also concerted and deliberate planned efforts to attain qualitative transformation of the cities; attempts were made to make the cities functional, liveable, sustainable, and most recently smart. In the process, different approaches have been attempted to augment various development attributes in the cities depending on the opportunities and potential they offer and their abilities to perform specific functions better than others. Consequently, concepts such as pioneer cities, digital cities, connected cities, entrepreneurial cities, liveable cities and so on have emerged. The recent technological advancements offer further opportunities and avenues to take the cities forward in a more qualitative manner. It has brought economic, social and infrastructural advantages as well as offered possibilities to combine safe and healthy living conditions. For example, it augments judicious resource-use, enhances connectivity, assists in reducing energy consumption and waste, and even helps in offering an enjoyable life style (Moussiopoulos, Achillas, Vlachokostas, Spyridi, Nikolaou, 2010). Thus, there is an argument that emerged to take the cities beyond sustainability and cities can be planned to make them smart. Although there is no definite definition as to what is meant by a smart city, yet some scholars argue that in order to make cities economically, socially and environmentally sustainable, they need to be transformed to smart cities, which warrants a change in planning perspectives and move from the normal planning process towards smart growth and development process based on smart city concept (Das, 2012; Das and Emuze, 2014; De Swardt, Puoane, Chopra, & du Toit, 2005; Farmer, Frojmovic, et al., 2006; UN - Habitat, 2009; Giffinger, Fertne, Kramar, Kalasek, Pichler Milanović, Evert, 2007; Hague, Harridge, Narang, Shishido, 2006; Horn, 2002; McGillivray, 2005; Naude, Rossouw, Krugell, 2009; Ramutsindela, 2002; Saff, 2001; Kotze & Donaldson, 1998; Lotter, 2002; Nomdo & Coetzee, 2002; Prinsloo & Cloete, 2002; Saff, 1995; Turok, 2001; Visser, 2001). Many of the South African cities offer potentialities for both economic advancements and appropriate spatial development. The Governance system of the country has also taken several proactive efforts for plausible sustainable developments of the cities. In consequence, many municipalities/metropolitan municipalities are making efforts to make their cities economically, socially and environmentally sustainable. However, the potential and opportunities these cities offer make them candidates to go beyond the sustainability agenda as envisaged by the city development authorities and can become smart cities, if appropriate policy interventions are made. Therefore, this paper explores how existing cities can be transformed to smart cities in South Africa. Using the case study of Bloemfontein of South Africa, this study examines the potentialities
27

and challenges of the city, and evolves analytical causal feedback logics to develop plausible policy interventions to transform it to a smart city. For this purpose a survey research method was followed for data collection, and discussion with stakeholders and experts. Performance evaluation of different development attributes relating to economy, mobility and governance of the city were conducted. Further qualitative causal feedback relations among the various development factors were developed based on the inter-linkage of their endogenous parameters by applying systems concept and using system dynamics (SD) modelling principles. The research findings indicate that the while the governance system and forward looking and proactive initiatives by the decision makers provide definite opportunities, and economic attributes of the city offers positive indications; local accessibility and lack of innovative, sustainable and safe transportation are the major mobility challenges to be met to transform the city to a smart city. The causal feedback relations among the developmental attributes indicate that policy interventions are needed (1) to reinforce the causal feedback relationship among entrepreneurship, innovative spirit, productivity, economic image and international embeddedness, which will foster smart economy; (2) to augment public transportation to strengthen local accessibility, and advancement of Information Communication Technology (ICT) system to ensure innovative, sustainable and safe transportation system that will result in smart mobility; and (3) to ensure effective participation of stakeholders in the decision making process alongside the elected city council, and transparency in governance. The complementary effect of the three attributes should enable transformation of the city to a smart city.
2. Smart City Perspectives
There is no standard definition of what a smart city is. According to scholars, the smart city concept is not considered in a holistic manner rather with reference to various aspects, which range from Information and Communication Technologies (Digital) districts to smart populace in terms of educational level. Use of modern technology in everyday urban life, which includes innovative transport systems, infrastructures and logistics as well as green and efficient energy systems are often integral part of a smart city. Besides, there is a strong relationship between city government and citizens in terms of good governance. Certain other factors of urban life associated with smart city are participation, security / safety and cultural heritage (Giffinger, 2007; Komminos, 2002; Lombardi, 2011; Shapiro, 2008). Smart city is a concept initiated in Europe in the recent past. According to the policy vision of European Union to develop smart cities in Europe, it is derived from the combination of concepts of the connected city (smart logistics and sustainable mobility), the entrepreneurial city (economic vitality), the pioneer city (social participation and social capital), and the liveable city (ecological sustainability) (Nijkamp, and Kourtik, 2011). Scholars like Giffinger, (2007) defined smart city as a well performing forward-looking middle size city built on the smart combination of endowments and activities of self-decisive, independent and participative responsive citizens. A number of important dimensions of a smart city are identified, which includes smart economy (related to competitiveness), smart mobility (related to accessibility and connectivity); smart environment (related to natural resources); smart human capital (related to people); smart living (related to the quality of life) and smart governance (related to participation) (Giffinger, Fertne, Kramar, Kalasek, Pichler and Evert, 2007; Komminos, 2002; Lombardi 2011; Shapiro, 2008; Van Soom, 2009). These dimensions are connected with regional competitiveness, transport and ICT economics, natural resources, human and social capital, quality of life, and participation of citizens in the governance of cities (Lombardi, 2011; Komminos, 2002; Giffinger et al., 2007; Shapiro, 2008; Van Soom, 2009). A few examples of such middle sized smart cities are Luxemburg, Aarhus (Denmark), Turku (Finland), Aalburg and Odense (Denmark). A performance evaluation of the six smart attributes of these indicate that each city has their specific strengths and performed exceedingly well in some attributes without compromising the performance of other attributes. For instance, Luxembourg, which is considered as the top ranked smart city has performed very well in economy and mobility, average in governance, and poor in smart environment, yet on aggregate it performed much better than many of the similar cities in Europe (Giffinger et al, 2007). In contrast, there are also a number of larger European and North American cities, which are considered as smart cities. Examples are Vancouver and Toronto in Canada, New York city, San Francisco, Boston city, and Washington DC in the USA, Vienna, London, and Amsterdam in Europe to cite a few (Cohen, 2013, Mercer study, 2014). Each of these cities demonstrate that they are performing well in one or more of their characteristics which range from entrepreneurial ecosystem, mobility and connectivity, ICT usage, innovation, governance, smart populace to environment. Further, the smart growth principles advocate that the growth of a city is to weave together the various discourses of physical and spatial issues into a rational sustainable development that integrates economic, environmental and social equity issues. The micro level design aspects, such as, neighbourhood patterns, streets, public spaces, and pedestrian zones, etc., that are traditionally not dealt at the macro level, which invokes the notions of urbanity, where density, proximity and the visual and physical integrity of cityscapes create a sense of coherent community (Calthorpe and Fulton, 2000; Kunstler, 2001; Turner, 2007) need to be incorporated. A strategy that targets the physical development of urban regions having strong social, economic and political components with public participation and inclusive multi-actor planning processes is to be followed (Jailly, 2008; Scot, 2007). Thus, a city can be termed as a smart city, if performs well in one or combination of its characteristics that can range from entrepreneurial ecosystem, innovation, ICT usage and connectivity, mobility, governance, environment and smart populace. In other words, it offers although not limited to a congenial environment for economic opportunities and entrepreneurial endeavours; uses the ICT and innovation improve the quality of life, provides safe, efficient and emission free mobility system; possess education system and facilities to support research and innovation, apposite health care delivery system; and most importantly have a
28

responsive governance system with effective participation of the citizens. However, it is not necessary that the cities need to perform incredibly well in all these aspects; rather they should perform well in any combination of these attributes depending on the potentials they possess, opportunities that are available and challenges they face to make the cities liveable and improve the quality of life.
3. Case Study: Bloemfontein City
Bloemfontein city of South Africa is taken as a case study for this investigation. It is one of the growing medium sized cities in the country the capital city of Free State province having a population of about 500 000 (Census, SA, 2011). It is located at the latitude of 29.133 and longitude of 26.214 and almost at the centre of the country. The judicial Appellate and Supreme Court of the country is located in the city and therefore treated as one of the three capitals of the country. Two of the country’s important universities are located in the city offering tertiary education to almost 50 000 students. A number of high level and advanced hospitals and health care centres are available in the private sectors in addition to a government managed hospital in the city. The city is well connected to the all parts of the country by all three modes of transportation such as road, rail and air. An international airports is also located in the city connecting flights to major cities of South Africa and abroad. Besides, it houses a number of regional centres of business corporate houses and professional institutions. Further, because of the availability of adequate basic urban infrastructure facilities including existence of transport and communication services, presence of skilled human resources and its proximity to Johannesburg - the largest city of South Africa and Pretoria - the administrative capital city of the country, it has attracted a number of domestic and multinational industrial companies. The presence of the Information and Communication sector and internet is well felt in the city as most of the area in the city are well connected through ICT. However, the growth of industrial activities, influx of population and enhancement of tertiary (service related) functions are increasingly creating pressure on the environment, urban infrastructures, and services. However, a thorough discussion with several stakeholders, members of the metro municipal council and urban development experts and review of the Integrated Development Plan (IDP 2012) suggested that three aspects in the development process such as, economy, mobility and governance are prioritised and could be the important considerations for transforming the city to a smart city.
4. Methods
4.1 Data and Analysis
The investigation was conducted by using a survey research method and developing causal feedback relations among the factors and attributes influencing development of the city by using SD principles. Survey was conducted to collect primary data regarding demographic, economic, transportation and communication, governance, environment, and living conditions of the city, which was used to evaluate the performance of the various development attributes of the city. For this purpose, household survey was conducted in six selected representative suburbs (such as, Hiededal in the East, Langenhovenpark in the South West, Fichardtpark and Fauna in the South, Petntagon park in the North, and CBD area at the centre) out of the 26 suburbs of the city. The suburbs for survey were selected based on their geographical location, population and demographic composition, level of development, and influence on the city development process. Systematic stratified random sampling survey method by using pre-tested schedule and semi-structured direct interview method were employed to collect the data. A sample size of 270 selected households was surveyed with the number of households varying from 40 to 50 households in each selected suburb. Secondary data (statistical and time series data) were also collected from authentic published and unpublished literatures, reports in addition to the review of Integrated Development Plan 2012 (IDP, 2012) for the Mangaung Metropolitan Municipality, (Metropolitan administrative authority of Bloemfontein city). The data collected from secondary sources were found to be scanty and were utilised only to check the correctness and adequacy of primary data wherever required. Besides, discussions with stakeholders, municipal officials and experts were conducted through semi structured interviewing process. The data was initially analysed through descriptive statistics to see the variations and consistency in the responses. Chronbach α test was conducted to test the reliability of the data set. The performance evaluation of various attributes and factors under the three most important sectors of the city – economy, mobility and governance was conducted by using the data set collected through primary survey. The factors under each attribute and attributes under each sector were decided (presented in Table 1, 2, and 3) based on their influence of the city development process as observed in published literature (Coe, Paquet, and Roy, 2001; Das and Emuze, 2014, Emuze and Das, 2015; Giffinger et al, 2007; Moussiopoulos, et, al., 2010; Odendaal, 2006; Shapiro, 2008) and discussions with stakeholders. Followed by, mathematical quantitative smart factor index (SFI) and smart attribute index (SAI) were developed on the principles of weighted average method to evaluate and understand the performance of the attributes that influence smart city development. Smart factor index evaluates the performance of each factor under different city development attributes. It is defined as the function of values assigned to a factor by the respondents in a scale of -3 to +3 (-3 representing the worse performance, +3 being the maximum performance and zero represents neutral) and the total number of respondents. The mathematical equation is presented in Equation (Eq.) 1. SFI= P*X/X .........................................................................................Eq.1
29

Where: P= Values assigned to each attribute by the respondents X = N of respondents assign a particular value Smart Attribute Index evaluates the performance of various developmental attributes of the city. It is a function of the cumulative smart factor indices under each attribute and wigthtages of each factor. It is also evaluated in a scale ranging from -3 to +3. Eq. 2 presents the mathematical equation used to evaluate SAI. SAI= SFI*W/W ...................................................................................Eq.2 Where SFI= Smart factor index W= Weightage of each Indicator in each factor The data analyses were followed by development of causal feedback relationships among the factors under each attribute by applying systems theory and using SD principles.
4.2 Epigrammatic outline of System thinking and SD principles
According to Von Bertalanffy, (1974), a system constitutes a set of subsystems or in other words components, which are interlinked and interdependent on each other to perform a function as a whole. The subsystems of the system can be systems themselves. In a system, if a subsystem performs at a higher efficiency than others or becomes defunct then the effect is felt on the whole system. As a result the whole system may perform at a lesser efficiency or even may become paralysed. In order to the system to perform at a higher efficiency all the subsystems of the system are to work in a coordinated manner. While planning a city as a whole can be considered as a system with its various components, such as people, economy, social aspects, movement and communication, other urban infrastructures, governance, environment, etc., as its subsystems. All these components are inter-linked and interdependent as the case may be and work in a coordinated manner for the sustainable development of the city. Wolstenholme, (1992) and Robinson, (2008) outlined a conceptual model based on causal feedback relations as a consistent and unifying theory of behaviour taken from bits of information about the real world. The rigorous structural framework provided by SD assists in eliciting and displaying information used to build causal feedback relations and consequent conceptual model (Forrester, 1994; Lane and Oliva, 1998). Essentially, SD methodology amalgamates ideas developed in various systems theories and is a result of cross-fertilisation of ideas from traditional management, cybernetics, and computer simulation (Shen et al 2009: 15-25) and is especially designed for large-scale, complex socio-economic systems to understand how and why the dynamics of concern are generated and to search for managerial and development policies to improve the situation. It is a theory of structure and behaviour of system (Forrester, 1968, 1969) and is characterised by the concepts of causal feedback loops and time delays, which represent the dynamic complexity of a system (Sterman, 2000). Causal loop maps are usually employed to describe the elements (Montibeller and Belton, 2006) of the system. The use of system dynamics in solving real world urban development related problems are rising since its early application by Forrester in 1969. It has been applied to develop policy interventions for alleviating urban problems or understanding the dynamics that flows in the urban areas (Chadwick 1971: 36-37; Checkland 1981; Lee, Choi and Park, 2005; Das and Sonar, 2013; Emuze and Das, 2015). Since, a city as a system has various subsystems (components) that are inter-linked and interdependent and relate to complex socio-economic problems, SD is observed to be an appropriate principle to analyse issues and evolve policy interventions for its development.
5. Prognosis of Bloemfontein as a Smart City: Findings, Causal Feedback Mechanisms and Discussion
The prognosis of smart city perspectives of Bloemfontein is set out based on the performance of three sectors, such as, economy, mobility and governance. The veracity of the data was checked through descriptive statistics, and Chronbach α. The low standard deviation in each factor show the consistency and high Chronbach α confirms the reliability of the data set used. The different development attribute scenarios are discussed as below.
5.1 Economy
Table 1 presents the performance of the current economic scenario of the city. Twelve factors under five attributes were used for the evaluation. It was observed that the employment rate in knowledge intensive sector and productivity (GDP) per employee is reasonably high and the un-employability rate is very low. The other factors like self-employment rate, new businesses registered, importance as decision-making centre, proportion in part-time employment, R & D expenditure and ICT connectivity have moderate positive indices implying their average performance. However, the performance of factors like patent applications per inhabitants, availability of company head quarter have very poor performance and it seems their presence is insignificant. Consequently, it is found that economic attributes like productivity and flexibility in the labour market has a strong influence in the city, whereas it lacks international embeddedness and economic image and trade mark. Entrepreneurship and innovative spirit observed to be not so strong, yet they have some presence in the city. Thus, although the economic attributes of the city indicate mixed performance, the positive influence of productivity, flexibility in labour market, entrepreneurship and innovative spirit offer opportunities for the economy of the city to strengthen further. However, there are challenges to enhance the economic image and trademarks and international embeddedness of the city.
30

Table 1 Performance of economic attributes of Bloemfontein city
Smart factors Mean SD SFI Smart attributes SAI
R&D expenditure 1.2 0.15 1.0 Innovative spirit 0.51 Employment rate in knowledge-intensive sectors
2.1 0.24 2.4
Patent applications per inhabitant
-2.2 -0.25 -2.5
Self-employment rate 1.3 0.15 1.2 Entrepreneurship
1.2
New businesses registered in proportion of existing companies
1.25 0.17 1.2
Importance as decision-making centre
-1.4 -0.14 -1.5
Economic image and trademarks
-1.5
GDP per employed person
2.1 0.30 2.0
Productivity 2.0
Unemployment rate 2.3 0.28 2.2 Flexibility in labour market
1.75 Proportion in part-time
employment 1.4 0.22 1.3
Companies with HQ in the city quoted on the national stock
-2.60 0.35 -2.75 International embeddedness
-0.5
ICT connectivity with the companies
1.6 0.25 1.5
ICT use by companies 0.5 0.10 0.5
Chronbach’α 0.925 Figure 1 presents a SD causal feedback relationship structure of the economic attributes of the city. Amongst influential economic factors, entrepreneurship is considered as the key factor, which defines the economic performance of a city. A higher level of enterprising activities in the city will lead to enhancement of the economy, which in turn would facilitate location of corporate offices or business decision making centres. The location of corporate offices will increase inter-(national) embeddedness enhancing both communication and business relations, which will have a positive influence on the enterprises located in the city as a feedback to the system as shown by the reinforced causal feedback mechanism ER1. Besides, entrepreneurship will bring in innovative spirit, which will positively influence productivity in the city. Higher productivity will enhance the economic image and trademark of the city creating a congenital environment for entrepreneurship development as a feedback through a mechanism presented the reinforcement loop ER2. Thus, entrepreneurship in the city is strengthened by both the mechanisms represented by reinforcing loops ER1 and ER2. Further on enhancement of entrepreneurial activities in the city with the aid of innovative spirit will lead to higher productivity and GDP per employee. The higher productivity, income, innovative spirit and entrepreneurship will enable the city as an important decision making centre for business, which will transform the economy to a smart economy through a feedback mechanism ER3. In the current scenario, although the scenario of self-employment rate and flexibility in labour market offer congenital environment to enhance entrepreneurship at the local level, the registration of new business needs encouragement. ICT use by the companies needs augmentation, and expenditure in R& D and intensification in possible application for patent registration are the other key areas, which need attention.
31

Figure 1 Casual feedback relationships for smart economy
5.2 Mobility
The mobility of the city was evaluated based on ten factors and four attributes. Table 2 presents the index values and performance of these mobility factors and attributes. The findings revealed that six of the factors, i.e., transport network per inhabitant, access to public transport, quality of public transport, green mobility share, use of economical cars and air transport of freight have moderate to high negative values. This implies that the performance relative to the above mobility factors is very poor. On the other hand, air transport for international passengers, local air transport for local people, traffic safety, and availability of computers in households have moderate to relatively high positive indices, although internet access in households has low index value indicating moderate positive performance of these factors. Consequently, the state of two of the four mobility attributes, such as, local accessibility and sustainable, innovative and safe transport systems are very poor. However, the state of attributes such as (Inter-) national accessibility (physical movement) and availability of ICT infrastructure in households are encouraging. This informs that local sustainable and innovative and efficient physical movement in the city is a challenge, however, encouraging scenario of international accessibility and ICT availability in the households offer opportunities for development of smart mobility in the city. Figure 2 depicts the causal feedback mechanism for development of smart mobility in the city. The mobility sector has been categorized into two significant elements such as physical movement and access through ICT at both the local and inters-(national) level. The development of smart mobility is envisaged to be based on four major reinforcing causal feedback mechanisms involving factors such as: (1) sustainable, innovative and transportation system, (2) local accessibility, (3) availability of ICT infrastructure and international accessibility and (4) availability in ICT infrastructure leading to reduction in local transportation needs. The sustainable, innovative and safe transportation system is actuated by the use of economical cars, green mobility and traffic safety at the local level. A sustainable, innovative and safe transportation system and effective local accessibility have a feedback relationship with enhanced and efficient mobility (MR1). Simultaneously, availability of ICT infrastructure and international accessibility by air transportation system reinforce international accessibility and consequently enhances the mobility of the city through a feedback mechanism (MR2). Thus, current mobility scenarios can be transformed to smart mobility through the reinforcing effect of both the mechanisms MR1 and MR2. However, local accessibility is a major component of smart mobility. So, enhancement of public transportation network, improvement in the quality of public transportation system and higher access to public transportation will facilitate physical local accessibility through a feedback mechanism MR3 improving the current plight of mobility in the city. In turn such a mechanism will also reinforce the mechanism developed by mechanism MR1 resulting the strengthening of sustainable, innovative and safe transportation system in the city. Further, the availability of ICT infrastructure and its higher use by households will lead to the reduction in the local transportation needs. Reduction of local transportation needs will have two significant impacts- increase in traffic safety and low carbon emissions, which consequently will lead to sustainable and innovative transportation system and
Smart economy
Entreprenureship
InternationalEmbeddedness
Setting up ofcorporate offices
Importance asdecision making
centre +
+
+
+
Economic imageand trademark
Innovative spirit
Productivity
+
+
+
+
+
Enhanced GDP peremployed person+
+
ICT use
ICTconnectivity
+
+
R & DExpenditure
Patent perinhabitants
+ +
Employment inknowledge intensive
sector
+
New Businessregistration rate
Self employmentrate
++
Flexibility inlabour market
+
Part timeemployment
Unemployment
+
+
ER1ER2
ER3
32

smart mobility through causal feedback mechanisms MR4A and MR4B. Therefore, feedback mechanisms MR4A and MR4B along with MR3 reinforce the feedback mechanism MR1 and MR2 and result smart mobility in the city.
Table 2 Performance of mobility attributes of Bloemfontein city
Smart factors Mean SD SFI Smart attributes SAI
Public transport network per inhabitant
-1.35 0.18 -1.5
Local accessibility Public transport
-1.68
Access to public transport -1.40 0.22 -1.5 Quality of public transport 2.20 0.35 -2.0
Air transport (local) 1.30 0.15 1.10
Air transport of passengers (international)
1.60 0.15 1.50 (Inter)national accessibility (physical movement)
1.11
Air transport of freight 1.10 0.12 -1.30 Green mobility share -1.90 0.28 -2.0 Sustainable,
innovative and safe transport systems
-0.45 Traffic safety 1.40 0.20 1.50 Use of economical cars -1.25 0.15 -1.5 Computers in households 1.80 0.22 2.0 Availability of ICT-
infrastructure Computers in households
1.25
Internet access in households
0.60 0.08 0.50
Chronbach’α 0.911
5.3 Governance
The performance of the governance system of the city was assessed based on ten governance factors and three attributes (Table 3). Four of the ten factors- city representative per resident, female city representatives in the city council, expenditure of municipality per resident, and perception of quality of schools have relatively high positive indicates. Three factors, such as perception of transparency of bureaucracy, perception of fighting against corruption and participation in voluntary and social works have moderately
International
acessibility
Local accessibility
Availability of ICT
infrastructure
Sustainable, innovative and
safe trasnporation system
Access to public
transportation
Public transport
network per inhabitants
Quality of public
transportation
Computers in
household
Internet connectivity
in households
Green mobility
Traffic safety
Use of
economical cars
Smart mobility
+
+
+
+
+
+
+
+
+
+
International flights
MR1 MR2
MR3
Reduction in local
transporation needs
Low carbon
emmission
MR4A
MR4B
Figure 2 Casual feedback relationships for smart mobility
33

positive indices. The moderate to high positive indices imply that the city governance system is performing reasonably well in these areas. However, three indicators, such as political activities of inhabitants, importance of politics for inhabitants and children in day care have moderate negative indices suggesting the poor performance of the governance system in these areas. However, it is seen that the governance system is performing reasonably well in all its three attributes, such as, in creating a transparent governance system, participation in voluntary works and participation of people in decision making. The positive performance of the governance attributes provides definite opportunities for developing a smart governance system in the city.
Table 3 Performance of governance attributes of Bloemfontein city
Figure 3
presents the causal feedback mechanisms for smart governance system in the city. People’s involvement in decision making processes is the most important attribute in the governance system. People’s participation in decision making and governance will lead to transparency in governance system. The transparency in the governance is influenced by transparency in bureaucracy and perception of fighting against corruption. A transparent government will encourage higher expenditure participation in public and social services like children day care, quality schools and civic services in the suburbs of the city. The whole process of participation, transparency in governance and public and social services strengthen governance system of the city through a feedback mechanism (GR1). Similarly, participation in decision making will positively influence political activities of inhabitants and provide opportunities for adequate city representatives including female representatives in the governance system, thereby reinforcing the participation in decision making through reinforcing feedback mechanism (GR2). This mechanism in turn reinforces the mechanism GR1; as a result the governance system developed is also further strengthened. Besides, as the governance system gets strengthened, it will enhance the importance of politics for the people resulting higher political activities by theme. The combination of these attributes and their reinforcing effects through feedback mechanisms ultimately create an environment for smart governance (GR2A). With a democratic set up and adequate local governance system, there is an opportunity for development of a smart governance system in the city, if policy interventions are made to make people politically active; create an environment to involve people in social and political activities by encouraging participation in voluntary works, child care, making equitable expenditure in suburban areas; more importantly allowing them to be a part of decision making process and build transparent bureaucracy.
Smart factors Mean SD SFI Smart attributes SAI
City representatives 2.4 0.25 2.5 Participation in decision-making
0.75 Political activity of inhabitants
-1.35 -0.15 -1.5
Importance of politics for inhabitants
-1.45 -0.17 -1.5
Female city representatives
2.1 0.25 2.0
Expenditure of the municipal per suburbs
1.8 0.30 2.0 Public and social services
1.025
Children in day care -1.4 -0.15 -1.2 Perception of quality of schools
2.2 0.28 2.0
Participation in voluntary works
1.2 0.15 1.3
Perception on transparency of bureaucracy
1.4 0.20 1.5 Transparent governance
1.5
Perception on fight against corruption
1.4 0.18 1.5
Chronbach’α 0.914
34

Figure 3 Casual feedback relationships for smart governance
6. Conclusion
A smart city is essentially regarded as a well performing city in one or more of its attributes based on potentials and challenges it offers, and if the development is based on self-decisive and citizen participation. The purpose of developing such a city is to enhance the capability of the potentials of the city and judicious resource management for optimal development of the city. In terms of maintaining the importance of Bloemfontein city in the central region of South Africa, this investigation provides an evaluation of the important influential factors and attributes of the city in the current scenario. Besides, it provides analytical causal feedback logics among the factors in three most important aspects, such as, economy, mobility and governance using SD principles based on systems thinking approach that would enable developing policy interventions for transforming it to a smart city. The evaluation suggests that there are positive indications in all three aspects, but there are challenges to be met particularly in terms of the economy and mobility. The positive attributes of governance scenarios offers definite opportunities. Lack of economic image and trademarks and international embeddedness are major challenges in the economy. Similarly, local accessibility, and sustainable, innovative and safe physical movement in the city are the major concerns. The process of rigorously extracting causal feedback mechanisms among the factors and attributes in each sector brought the influential inter-linkages and mechanisms to the light, which can assist in developing policy interventions to transform the city to a smart city. Most important of the mechanisms revealed that that policy interventions are needed (1) to reinforce the causal feedback relationship among entrepreneurship, innovative spirit, productivity, economic image and international embeddedness, which will foster smart economy; (2) to augment public transportation to strengthen local accessibility, and advancement of ICT to ensure innovative, sustainable and safe transportation system that will result in smart mobility; and (3) to ensure effective participation of stakeholders in the decision making process alongside the elected city council, and transparency in governance. Consequently, the complementary effect of the combined attainment of the three attributes of will enable transformation of the city to a smart city. From the methodological point of view, the analysis for development of smart cities poses specific modelling challenges. That include interdependency, inter-linkage and causal relationships among the various parameters influencing smart city development, compounded with the lack of adequate and reliable data, uncertainties, role of stakeholders, and other prominent aspects such as people, governance, environment, and living conditions, which are not easily amenable to quantification. This investigation shows that SD principles with its integrative nature are well suited to undertake such challenges. It has provided a framework to elicit the complex and dynamic inter-linkages based on which policies can be generated to augment the strengths and alleviate the weaknesses in an urban system (city) in order to facilitate development of smart cities. Therefore, application of SD methodology in this context is particularly valuable. However, there is a need to transform these conceptual models to computer simulation models, which would reveal the gaps between the desired condition and current scenario, and the extent to which various attributes need enhancement. Besides, it is also essential to critically examine the inter relationship among the above discussed three prominent subsystems of the city and how one subsystem behave on the influence of the others, which could provide a more critical and holistic insight to transform the city to a smart city. Both of these aspects are the next goals of this investigation. However, in the current state, the study provides a roadmap to guide the policy makers and planners for plausible actions for transforming Bloemfontein city or similar cities in South Africa to smart cities, which is perhaps the most significant contribution of this work.
SmartGovernance
Public and socialservices
TransperentGovernment
Participation indecision making
+
+
+
+
Political activity ofinhabitants
Cityrepresntatives
Adequate femalerepresentatives
+
+
+ +
Importance of politicsfor inhabitants
+
+
Perception on fightagainst curruption
Perception on transperencyof bureucracy
+ +
Participation involuntary works
Expenditures persuburbs
Children daycare
Perception of qualityof civic services
+
+
++
GR1
GR2
GR2A
35

References
Calthorpe P, and Fulton, W. 2000. The Regional City: Planning for the End of Sprawl Washington, DC: Island Press. Caragliu, A., Del Bo, C., Nijkamp, P. 2009. 3rd Central European Conference in Regional Science - CERS, 2009. Coe, A., Paquet, G. and Roy, J. 2001. “E-governance and smart communities: a social learning challenge”, Social Science Computer Review, 19 (1), pp. 80 - 93. Cohen Boyd (2013). The 10 Smartest Cities in North America http://www.fastcoexist.com/3021592/the-10-smartest-cities-in-north-america November 14, 2013. Emuze, F., Das, D. 2015. Regenerative ideas for urban roads in South Africa, Article number MUEN-D-14-00041R2: Municipal Engineer, (In press). Das D, Emuze F. 2014. Smart city perspectives of Bloemfontein, South Africa, Journal of Construction Project Management and Innovation, 4(2), pp. 930-950. De Swardt, C., Puoane, T., Chopra, M., and du Toit, A. 2005. “Urban poverty in Cape Town”, Environment and Urbanisation, 17(2), pp. 101- 112. Ezkowitz, H. 2008. The Triple Helix: University, industry and Government London: Routledge. Etzkowitz, H. and Zhou, C. 2006. “Triple Helix twins: innovation and sustainability”, Science and Public Policy, 33 (1), pp. 77 - 83. Farmer, P., Frojmovic, M., Hague, C., Harridge, C., Narang, S., and Shishido, D. (2006). “Reinventing planning: a new governance paradigm for managing human settlements”, In Position paper for the World Planners Congress, Vancouver. Glaeser, E.L. 2005. “A review of Richard Florida’s ‘The rise of the creative class”, Regional Science and Urban Economics, 35, pp. 593-596. Giffinger, R. 2007. Middle-sized cities are a fascinating focus group, Technical University (TU), Vienna. Giffinger, R., Fertne, C., Kramar, H., Kalasek, R., Pichler Milanović, N., and Evert, M. 2007. “Smart cities – Ranking of European medium-sized cities”, Final project report, pp. 1-25. Horn, A. C. 2002. “New perspectives on urban segregation and desegregation in post-resolution South Africa”, in: I. Schnell, & W. Ostendorf (Eds.) Studies in segregation and desegregation, pp. 247-284. Aldershot: Ashgate. http://www.wien.info/en/vienna-for/smart-city-vienna/smart-mobility IDP, 2012. Integrated Development Plan, City of Mangaung, Free State, South Africa, pp. 1-170. Jailly, E. B. 2008. “Vancouver: The Sustainable City”, Journal of Urban Affairs, 30(4), pp. 375 - 388. Kotze, N. J. and Donaldson, S. E. 1998. “Residential desegregation in two South African cities: a comparative study of Bloemfontein and Pietersburg”, Urban Studies, 35, pp. 467 - 477. Lotter, J. C. 2002. “Urban economic empowerment in the greater Pretoria area: the continuation of history?”, South African Journal of Economics, 70(2), pp. 347 - 368. Komninos, N. 2002. Intelligent cities: innovation, knowledge systems and digital spaces, London: Spon Press. Kunstler, J. H. 2001. The City in Mind: Notes on the Urban Condition, New York: Simon and Schuster, Lombardi, P. 2011. “Managing the green IT agenda”, Intelligent Buildings International, 3, pp. 41 - 45. Lombardi, P. 2011. “New challenges in the evaluation of Smart Cities”, Network Industries Quarterly, 13 (3), pp. 8-10. Lombardi, P., Giordano, S., Farouh, H. and Y. Wael. 2011. “An analytic network model for Smart cities” in: F. de Felice and A. Petrillo (Eds.), Proceedings of the 11th International Symposium on the AHP, Sorrento, Naples, IT, June 15 - 18. McGillivray, M. 2005. “Measuring non-economic well-being achievement”, The Review of Income and Wealth, 51(2), pp. 337 - 364. Mercer Study 2014. Quality of Living Worldwide City Rankings – Mercer Survey, 19 February 2014, United States, New York. Moussiopoulos, N., Achillas, C., Vlachokostas, C., Spyridi, D., and Nikolaou, K. 2010. “Environmental, social and economic information management for the evaluation of sustainability in urban areas: A system of indicators for Thessaloniki, Greece”, Cities, 27, pp. 377- 384. Nijkamp, P. 2008. “E pluribus unum”, Research Memorandum, Faculty of Economics, VU University, Amsterdam. Nijkamp, P. and Kourtik, K. 2011. Joint Programming Initiative (JPI) on Urban Europe. Global challenges and local responses in the urban century. A scoping document, VU University Amsterdam.
36
Naude, Wim., Rossouw, Stephanie., and Krugell, Waldo. 2009. The non-monetary quality of city life in South Africa, Habitat International, 33, pp. 319 - 326. Nomdo, C. and Coetzee, E. (2002). Urban vulnerability: Perspectives from Southern Africa, Stylus: Sterling VA. Odendaal, N. 2006. Towards the digital city in South Africa: Issues and constraints, Journal of Urban Technology, 13: 29-48. Prinsloo, D. A. and Cloete, C. E. 2002. “Post-apartheid residential mobility patterns in two South African cities”, Property Management. 20(4), pp. 264 - 277. Ramutsindela, M. 2002. “Second time around: squatter removals in a democratic South Africa”, GeoJournal, 57, pp. 49 - 56. Saavedra, C. and Budd, W. W. 2009. “Climate change and environmental planning: Working to build community resilience and adaptive capacity in Washington State, USA”, Habitat International, 33, pp. 246 - 252. Saff, G. R. 1995. “Residential segregation in South Africa: what can be learned from the United States experience?”, Urban Affairs Review, 30, pp. 782 - 808. Saff, G. R. 2001. “Exclusionary discourse towards squatters in suburban Cape Town”, Ecumene, 8, pp. 87 - 107. Saaty, T.L. 2005. Theory and Applications of the Analytic Network Process. Pittsburgh: RWS Publications. Scott, J. W. 2007. “Smart Growth as Urban Reform: A Pragmatic ‘Recoding’ of the New Regionalism”, Urban Studies, 44(1), pp. 15 - 35. Shapiro, J. M, 2008. “Smart cities: quality of life, productivity, and the growth effects of human capital”, The Review of Economics and Statistics, 88 (2), pp. 324-335. Smart London vision. (No date). Using the creative power of new technologies to serve London and improve Londoners' lives http://www.london.gov.uk/priorities/business-economy/vision-and-strategy/smart-london/smart-london-vision. Turner, M. A. 2007. “A simple theory of smart growth and sprawl”, Journal of Urban Economics, 61, pp. 21- 44. Turok, I. 2001. “Persistent polarization post-apartheid? Progress towards urban integration in Cape Town”, Urban Studies, 38, pp. 2349 - 2377. UN-Habitat. 2009. “Sustainable urbanisation: Revisiting the role of urban planning”, Global report on human settlements, Nairobi: UN-Habitat. Van Soom, E. 2009. Measuring levels of supply and demand for e-services and e-government: a toolkit for cities. Smart Cities Research Brief, N. 3 <http://www.smartcities.info/research-briefs>. Visser, V. 2001. “Social justice, integrated development planning and post-apartheid South Africa”, Urban Studies, 38(10), pp. 1673 - 1699.
37

38

SUPPLY-SIDE COLLABORATION FOR ENERGY-EFFICIENT RENOVATIONS
Ad STRAUB 1
Erwin MLECNIK 2 1 TU Delft, Faculty Architecture and the Built Environment, OTB Research for the Built Environment,
[email protected] 2 TU Delft, Faculty Architecture and the Built Environment, OTB Research for the Built Environment,
[email protected] Keywords: Business model, collaboration, nearly zero energy building (nZEB), renovation, supply-side
Abstract
The supply side for nearly zero energy building (nZEB) renovation of owner-occupied single-family houses in Europe is suffering from a severe image problem of lack of knowledge and trust, inefficient construction processes, insufficient quality assurance and communication difficulties with home-owners. Research was done in Austria, Belgium, Germany, the Netherlands and Norway as part of an Intelligent Energy Europe project, entitled “COHERENO - Collaboration for housing nearly zero-energy renovation” to understand the emergence of collaboration structures for nearly zero energy building (nZEB) renovation of owner-occupied single-family houses. The business model of Osterwalder and Pigneur (2010) is used as a reference of the project. Used research methodologies include desk research, explorative semi-structured interviews and focus groups. Based on this, barriers and opportunities for collaboration and business model development in this market segment were detected. Important barriers on the supply side are a lack of knowledge, particularly understanding the necessity for and approaches of collaboration, and to address customer values. Also, there is a lack of capacity to absorb knowledge in small enterprises. On the demand side, there is a lack of confidence in professionals’ experience. Home-owners expect independent advice and tailored pricing. Some of the home-owners expect one actor to take the lead and be the ‘reassuring’ contact point. The way how to collaborate was addressed in the second part of the COHERENO project by organising Business Collaboration Events and action research on business modelling of cooperation structures in the different countries.
1. Introduction
The European Union identified the need of reducing carbon emissions in residential sectors by 88-91% in 2050 compared to 1990 levels, to transform the current economy into a competitive low carbon one (EU, 2011). Europe’s new buildings and major renovations will be required to reach the level of “nearly zero-energy” (EU, 2010). For this immense transformation the mind-sets of clients asking for renovation solutions and suppliers offering these have to be changed. The existing housing stock in Europe is predominantly of poor energy performance and consequently in need of renovation work. However, only about 1.2 per cent of Europe’s buildings are renovated each year and it is unlikely that this 1.2 percent is renovated to the highest standards of energy efficiency (BPIE, 2011; Tofield and Ingham, 2012). Although more and more households implement single energy saving measures and renewable energy systems (PV-panels), to remain competitive with future new-build houses, house renovations need to go beyond implementing single energy saving measures and should be integrated major renovations or deep retrofitting (Haavik et al., 2012). This makes the market potential for especially privately owned single-family homes ‘nearly zero-energy’ (nZEB in the remaining text of this paper) renovation In Europe is very big Renovations are often constrained by financial and market barriers. However, the supply side for nZEB renovation of owner-occupied single-family houses in Europe is suffering from a severe image problem of lack of knowledge and trust, inefficient construction processes, insufficient quality assurance and communication difficulties with home-owners. Generally it is assumed that lower costs, lower burden for the client, limiting renovation time and guaranteed energy performance are preconditions for a volume uptake of nearly zero-energy renovation in the privately owned housing sector in Europe (Mlecnik et al., 2013). But, more is needed to build fruitful business models. The main objective of the Intelligent Energy Europe project entitled “COHERENO - Collaboration for housing nearly zero-energy renovation” (www.cohereno.eu) is to strengthen the collaboration of enterprises in innovative business schemes for realizing nZEB renovation in owner occupied single-family homes (SHF). To support this general goal, explanatory research was done in the partner countries Austria, Belgium, Germany, the Netherlands and Norway to better understand the experiences of existing and emerging collaboration structures for nZEB house renovation and to find key barriers and opportunities for stepping into collaboration for nZEB renovations. A basic assumption of COHERENO is that various types of professionals can collaborate in formal or informal structures: informing actors (for example non-profit organizations or municipalities), consulting actors (for example energy consultants, banks or insurance companies), contracting actors (these can be or not be executing actors/contractors) and quality assuring actors (to gain customer confidence). The way how to collaborate was addressed in the second part of the COHERENO project by organising Business Collaboration Events and action research on business modelling of cooperation structures in the different countries.
39
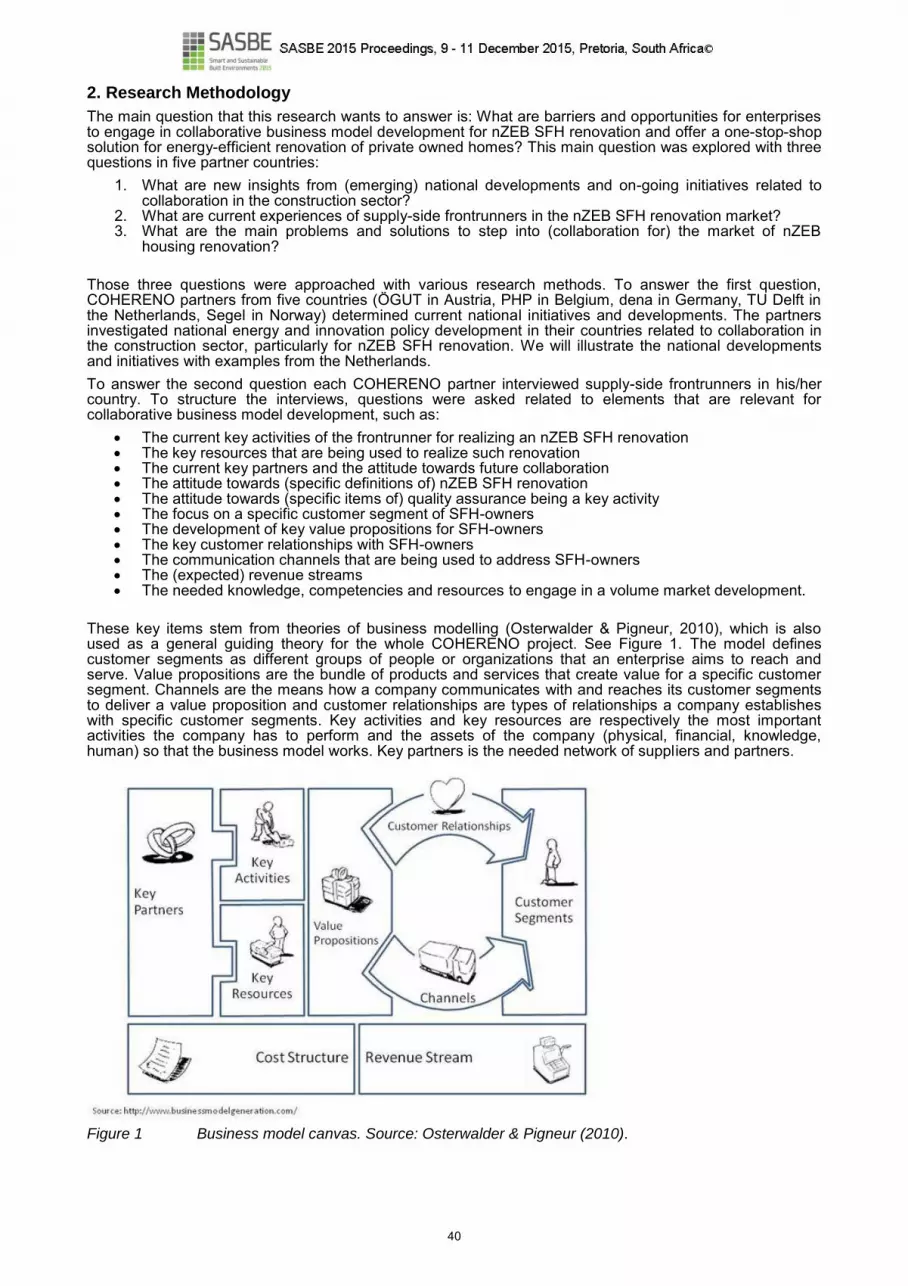
2. Research Methodology
The main question that this research wants to answer is: What are barriers and opportunities for enterprises to engage in collaborative business model development for nZEB SFH renovation and offer a one-stop-shop solution for energy-efficient renovation of private owned homes? This main question was explored with three questions in five partner countries:
1. What are new insights from (emerging) national developments and on-going initiatives related to collaboration in the construction sector?
2. What are current experiences of supply-side frontrunners in the nZEB SFH renovation market? 3. What are the main problems and solutions to step into (collaboration for) the market of nZEB
housing renovation? Those three questions were approached with various research methods. To answer the first question, COHERENO partners from five countries (ÖGUT in Austria, PHP in Belgium, dena in Germany, TU Delft in the Netherlands, Segel in Norway) determined current national initiatives and developments. The partners investigated national energy and innovation policy development in their countries related to collaboration in the construction sector, particularly for nZEB SFH renovation. We will illustrate the national developments and initiatives with examples from the Netherlands. To answer the second question each COHERENO partner interviewed supply-side frontrunners in his/her country. To structure the interviews, questions were asked related to elements that are relevant for collaborative business model development, such as:
The current key activities of the frontrunner for realizing an nZEB SFH renovation The key resources that are being used to realize such renovation The current key partners and the attitude towards future collaboration The attitude towards (specific definitions of) nZEB SFH renovation The attitude towards (specific items of) quality assurance being a key activity The focus on a specific customer segment of SFH-owners The development of key value propositions for SFH-owners The key customer relationships with SFH-owners The communication channels that are being used to address SFH-owners The (expected) revenue streams The needed knowledge, competencies and resources to engage in a volume market development.
These key items stem from theories of business modelling (Osterwalder & Pigneur, 2010), which is also used as a general guiding theory for the whole COHERENO project. See Figure 1. The model defines customer segments as different groups of people or organizations that an enterprise aims to reach and serve. Value propositions are the bundle of products and services that create value for a specific customer segment. Channels are the means how a company communicates with and reaches its customer segments to deliver a value proposition and customer relationships are types of relationships a company establishes with specific customer segments. Key activities and key resources are respectively the most important activities the company has to perform and the assets of the company (physical, financial, knowledge, human) so that the business model works. Key partners is the needed network of suppliers and partners.
Figure 1 Business model canvas. Source: Osterwalder & Pigneur (2010).
40

To answer the third question COHERENO partners organized a focus group with frontrunners in their country. External presenters from the supply-side showed inspiring national examples about successful nZEB SFH realizations and/or collaboration for realizing a nZEB SFH renovation. The COHERENO country partners then divided the participants into smaller groups and moderated an interactive group session per group. Questions addressed in each group were what goes less well during nZEB SFH renovation, especially regarding collaboration between the involved actors, and how can we avoid this. The discussions were facilitated using a poster. This poster shows general issues of concern related to five building phases (diagnosis & analysis, design & planning, execution of works, hand-over, use phase). Participants were motivated to discuss various items by using post-its. As a result of the discussion in each group top main problems and possible solutions were determined. Next the participants were asked to reflect on quality assurance and customer confidence (see Figure 2) and to fill in a questionnaire related to their use of quality assurance instruments. The discussion in this part also led to the experienced top three problems and solutions regarding customer confidence and quality assurance. After the reflections in the separate groups, exchange of experiences of the groups was organized. The workshop was rounded up by an external observer.
Figure 2 Poster on customer confidence and quality assurance. Source COHERENO.
Research Findings
All countries are concerned with the issue on how to restructure the collaboration between companies in order to reach home-owners more effectively to renovate their homes towards high energy efficiency. This concern results in national, regional or local initiatives that stimulate such transition in the construction sector.
Lead actors
The experiences in the partner countries illustrate that lead actors that organize their collaboration for the nZEB SFH renovation market can be general contractors, turnkey suppliers and project managers. It was found that also architects and planning offices, energy advisors, and renovation and hardware stores organize structures for nZEB SFH renovation. Various national, regional and municipal public and/or private initiatives were found to be able to facilitate collaboration structures. Contractors thus appear to compete with various other collaboration structures who take the lead for organizing nZEB SFH renovation. The actors that collaborate with the lead actors are mostly contractors that provide components or services, general contractors, installers, architects and planning offices and independent consultants. Some lead actors have found collaboration with more unusual partners such as banks, renovation brokers, marketing companies or specific suppliers. Furthermore, some structures have agreements with policy makers, or e.g. a non-profit organization to guarantee a high quality standard. Remarkable is also that some collaboration structures engage experienced home-owners in their collaboration structure as a marketing instrument.
Development and initiatives in the Netherlands
‘More with Less’ (in Dutch: ‘Meer met Minder (MmM)) is a covenant signed by the Dutch central government, building sector organisations and the umbrella organisation of housing associations Aedes to create a market for energy efficiency in buildings (www.meermetninder.nl). The MmM organisation has developed an
41

online ‘one-stop-shop’, an education program for suppliers and a registration system for the tradespeople. All MmM suppliers work according the same step-by-step plan. In 2014 MmM implemented a qualification scheme for the tradespeople/firms. This scheme holds also an assessment by clients. Approved ‘Meer met Minder’ suppliers market themselves as energy saving specialists. However, MmM is not directed at whole house renovation but especially the implementation of single measures. Collaboration to advise and carry out integrated solutions is not really the objective. Initiated by the Dutch Ministry of the Interior and Kingdom Relations and financed by the Innovation Agenda Energy and the organization Platform31 carries out a policy programme entitled ‘Energy Leap’ (In Dutch: ‘EnergieSprong’). This programme aims to develop the market by the use of experiments and deals. Within this programme several projects and campaigns address the collaboration of market players and the uptake of energy measures in home renovation by housing associations and private home-owners. One of the programs is called ‘Stroomversnelling’ targeting the refurbishment of owner-occupied single-family dwellings according to the ‘Energy bill = 0’ principle. Consortia of builders, architects, product suppliers and other professional actors are challenged to make renovation proposals for energy bill = 0 renovations, to be realised in ten working days and an investment of maximum 45.000 Euro (including VAT). Meanwhile, municipalities are asked to choose neighbourhoods with reference housing types that could be renovated. In a few years we will know if they succeeded to deliver the proposition (Van Renssen, 2014). Another program involved a competition to open renovation stores that can offer integral solutions to private home-owners. Seven stores across the country were opened in June 2014. Straub found that renovation stores differ a lot in customer segments, value propositions and service delivery, and their formalised or non-formalised relationships with supply-side professionals: building product and energy system suppliers, contractors, installers, energy consultants, etc. (Straub, 2014). The stores may combine consulting, informing, contracting and quality assurance services. Part of the renovation stores are founded as legally independent new organisations, others are related to e.g. general contractors. Part of the renovation stores are selling in the first place stand-alone energy efficiency measures and preferably taking them within the mainstream building work. However, implementing single energy saving measures makes a nZEB renovation of homes insure. Home-owners tend to start to make their house energy efficient without having the desired end result in mind. That may cause disinvestments. A clear end result and an outlined phased approach is needed, because not all home-owners are willing and able to invest in a major renovation as a one-of integrated concept. Renovation stores should provide such outlined phased approached, should work preferably independent from building products and energy systems providers, and should guarantee a common understanding on the aspired result and a collaborative and coordinated renovation process. A prerequisite is a secure selection of supply-side professionals to work with.
Barriers for collaboration
Both contracting and consulting actors highlight in the interviews in all countries the existence of poor on-site execution and the need for improvement regarding quality assurance. In particular, consulting actors see the need for energy performance guarantees and requirements for testing. Some contractors see problems with on-site coordination. Consulting actors notice the long realisation processes. Many interviewees think that such problems can be avoided with knowledge transfer during construction and planning processes and/or optimizing the information flow between professionals. Contracting actors appear to have difficulties organise their timing according to the home-owner situation. Consulting actors notice the lack of knowledge of the home-owner and the lack of information to the home-owner. This makes it difficult to convince home-owners to take decisions. We note that various contracting and consulting actors expect the home-owner to be responsible for maintenance or future works. Contracting actors observe that the market for nZEB SFH renovation is still small and that nZEB is yet to be defined. There is strong competition with companies that could be seen as bunglers in construction work. Therefore, contractors express a need to emphasize their strong points and differences with other companies. The growing competition between companies is also observed by consulting actors. They also see bunglers in this market as threats, companies bound by product suppliers offering free energy consultancy services to home-owners. This contradicts with the wish of clients for independent advice. Moreover, owners can contact a contractor directly without energy consultation before. Generally, home-owners are more interested in non-energy related issues than energy saving, and even can ask for lower ambition levels. According to the interviewees, home-owners show prejudices towards new ways of construction. Consulting actors are also confronted with home-owners that are not willing to pay for planning or project management services. This might be due to their lack of understanding of these services or to lack of communication with home-owners. Consulting actors express a fear of the home-owner towards long payback times and look for better ways to express the evaluation of energy saving measures. Contracting actors also have difficulties to communicate added value instead of added costs. The main issue for all actors is a lack of trust of the home-owner towards non-independent parties. This makes it challenging for both contracting and other actors to find the right balance between providing independent advice and delivering an integrated solution. Various collaboration structures do not have a clear customer segment that they address. Some regard the SFH renovation market already as a niche that does not have to be narrowed (not even up to energy-saving), while others have a clear view on the age, the income level, the family composition, the budget, the (energy) interest, the building type and the geographical location of customers that they want to address.
42

When looking at the mentioned customer values, especially the more ‘traditional’ collaboration structures appear to rely on their reputation and emphasize that customers easily find them and trust them. Newer forms of collaboration structures put more emphasis on their price-competitiveness, quality standards and knowledge about energy performance or ecological materials, even up to the level of delivery of guarantees and obligatory training of collaborating actors. Comfort, energy performance, sustainability, and unburdening - from assistance in grant applications to comparing offers to taking care of all aspects resulting in minimum inconvenience - are often reappearing as targeted customer values. The use of communication channels mostly reflects how well the collaboration structures have thought about the customer segment and the customer values. While some collaboration structures use sophisticated communication platforms and tools and energy labels, other (more ‘traditional’) collaboration structures still mainly rely on word-of-mouth and visibility of their projects. Some deliberately do not use any media, others do remarkable experiments with various media, door-to-door campaigns or guarantee contracts. Similar barriers reappeared during the national workshops with frontrunners. The various workshops in different countries had a different dynamic regarding the observation and discussion of challenges and solutions in the volume market of SFH nZEB renovation. Nevertheless, in all countries the top three problems to step into (collaboration for) the market of nZEB housing renovation in the partner countries related to lack of knowledge, inefficient planning and construction processes and lack of quality assurance.
Opportunities for collaboration
The national workshops provided many ideas from various countries how detected barriers could be eliminated. See table 1. Due to their limited competencies, knowledge or resources small companies do not really have an alternative but to collaborate with other actors. They can built partner trust in loose collaborations – for example engaging in concurrent engineering or morphological design sessions - before stepping into formal collaborations. In any case they should make use of networks of interested companies, professionals and experts to position themselves in this market segment. It is in practice difficult to balance independence and offering a total integrated solution and service. However, the home-owner only tends to trust independent advice. Independent knowledge can be found by collaborating with competence networks and by involving independent, experienced and certified advisers or offering labelled advice. The business model needs to make sure that advice is paid for. It is important to gain customer confidence as an actor operating in the region of the home-owner and to think in customer-oriented packages. The home-owner should be engaged in all information transfer to keep enthusiasm. Communication should run smoothly and knowledge between all involved actors should continuously transferred across disciplines. Education of actors is probably best organized on site or by using existing education initiatives. It is important to have a single trusted contact point for the home-owner; it can be recommended that this person fulfils specified goals (energy performance, timing, information transfer) and manages and coordinates the process. In any case, attention is needed for quality assurance and a performance-based approach, linked to sticks and carrots. The performances should be specified from the beginning and followed up with monitoring. To address home-owners with financing difficulties, collaboration structures can address opportunities to show the costs and benefits of a step-by-step renovation and by offering administrative unburdening to apply for loans, grants and so on. In communication the added values (also non-energy benefits) and life cycle cost could be emphasized.
Table 1 Market barriers and opportunities as observed from frontrunners
in collaborative structures for nZEB renovation (COHERENO, 2014; adapted)
Barriers Opportunities Home-owners are not willing to pay for consultation, planning and project management
Offer low-cost services and/or services for free if renovation decision is made
Budgetary constraint home-owners Offer step-by-step renovation Perception of costs and benefits of energy saving measures
Display the home-owner’s personal profit
Unfamiliarity with collaboration Organise knowledge-transfer related to interfaces of involved trades Use morphological design methods Develop a network of (local) interested companies and professionals
Limited capacity among the partners Collaborate in construction teams Competition with bunglers Gain confidence and trust as local actor Think customer-oriented
Make agreements with local policy makers Involve financial actors and quality assurance actors
43

in the collaborative structure Use (reviews) of experience home-owners in marketing
Discussion
The various examples from the five countries are quite different and at this stage there are no clear indications that one collaboration structure might be more successful than another in the volume market of SFH nZEB renovation. It seems that different models may function satisfactory, but at this stage all of the presented collaborative structures are still at an early phase in their development. Apparently the market for nZEB SFH renovation is just emerging, and the existing collaboration structures are not yet able to demonstrate “successful” long-term collaboration apart from their contribution to exemplary nZEB SFH renovation projects. Many collaborations still have to develop their understanding of the customer segment, their attitude towards value propositions, their customer relations or their knowledge, the efficiency of communication channels or their own resources and competencies. Obviously,in all countries new collaboration structures for nZEB SFH renovation are indeed emerging and that various types of actors can collaborate. Several collaboration structures take on a perspective that integrates informing the client, consultancy, execution and/or follow-up. It can be questioned if the integration itself is a success factor, since more ‘traditional’ and loose collaborations also prevail in a market that is still a niche where engaged home-owners find dedicated contractors. Instead, transparency and effective collaboration - beyond product development towards process innovation, customer intimacy and market development - appear to be key success factors. Stronger collaboration and trust-building is still needed between ‘traditional’ partners such as contractors, designers and consultants. Also, collaboration can be expected with new types of actors such as project managers, Energy Service Companies, renovation stores and hardware stores, product suppliers and non-profit organisations.
Conclusion and Further Research
The experiences in the various countries are very different. From the country experiences it is suggested that it is imperative that collaboration structures include or refer to ‘independent’ actors, such as architects, certified energy auditors, institutes, non-profit organisations, and so on. From on-going developments, the importance of One Stop Shops and customer web portals, Open House Days and physical renovation stores, is expected to increase. The research showed that the supply side for SFH renovation is suffering from a severe image problem of lack of knowledge, inefficient construction processes, insufficient quality assurance and communication difficulties with home-owners. Home-owners further expect independent advice and tailored pricing. While collaboration between supply-side actors is seen as a part of the solution to increase competitiveness, many SMEs are still largely unfamiliar with collaboration. The research showed that as the complexity of integrated renovation services increases, a shift in collaboration structures can be expected, likely towards quality assurance and performance contracting. Frontrunners have found opportunities to eliminate barriers for business collaboration in the nZEB SFH renovation market. These opportunities can be considered as ‘guidelines’ for actors who want to develop a way to collaborative business development for nZEB SFH renovation. The start-up of activities in nZEB SFH renovation is not obvious for the companies. An important barrier on the supply side is that not many contractors are experienced or have the right knowledge to deliver such renovation or to guarantee profitable energy savings. These companies need to understand the necessity for collaboration, the customer values and the role of different actors in collaboration. Also, the companies need to develop their own good examples of demonstration projects to attract customers for nZEB SFH renovation. Collaboration between companies requires complementary service portfolios and compatible business cultures. Collaboration with experienced professionals or consultants makes sense to attract the right knowledge and to develop first projects. One actor has to take the lead and act as the ‘reassuring’ contact point for the home-owner, maintaining a permanent relationship. Also, the awareness rising of customers and companies is key to the nZEB SFH renovation market development. The highest success for start-up can be expected when marketing is coupled with bottom-up initiatives, as costs for communication and convincing home-owners can be reduced. Today’s business models in the construction sector are still largely suboptimal and authorities in various countries still need to stimulate the supply-side and the demand-side by various informing and supporting instruments for high ambitions for nZEB SFH renovation. The national and local renovation market circumstances differ a lot between the EU-member states. Despite various exemplary actions, the market for nZEB SFH renovation is still too small. Additional demonstration of projects to home-owners is needed, and experiments and pathways to address the emergence of quality-oriented collaboration structures should be developed further. From experiences in the Netherlands it can be observed that in the volume market covenants with major companies and initiatives for group action organized by municipalities will play a larger role for renovating high volumes of housing. We can speculate that the existing mass-housing stock in Europe partly can be renovated to nZEB by standardised solutions by larger companies and partly renovated as niche markets depending on the characteristics of the housing stock and client segments by SMEs and voluntary
44

collaborative structures. The collaborative enterprises may evolve into a consortium, defined by Gruneberg and Hughes (2004) as an arrangement between a number of firms in which each firm contributes an equity stake in form of a risk capital or payment in kind in order to qualify as a member. However, this seems not to be a prerequisite. There is limited scientific knowledge about collaboration between small and medium-sized enterprises (SMEs), with other actors and the formation of consortia in the building sector. According to Janda and Parag (2013) low-carbon refurbishment is a new profession and/or jurisdiction, and existing professional roles may expand to encompass new competencies. Also, new roles and new competencies may be needed (Janda and Parag, 2013). Further research is needed into what these competencies are. House owners prefer to contact small and medium sized enterprises (SMEs) when renovating or planning to renovate their houses. Carlsson and Koch (2015) claim, based upon a local study of three craftsman contractors and their interaction with house owners as potential customers for renovating their home that conservative renovation actions are the result of both parties acting in a routinized play they cannot easily escape, which creates barriers for applying new green technologies and/or renovations in an energy saving manner. This may mean that contractors have to change this routinized behaviour and should approach the customer in another way or should collaborate with enterprises that sell the renovation to the customers. Further research has to done in relationship marketing, customer journeys and customer intimacy in the private house renovation market. Treacy and Wiersema (1992) state that companies that excel in in customer intimacy combine detailed customer knowledge with operational flexibility so they can respond quickly to almost any need, from customizing a product to fulfilling special requests. The ability to fulfil special request seems to be crucial in the owner-occupied renovation sector. Initiatives and projects related to energy efficient renovation in the European construction sector mainly either address dwellings owned by social housing organisations or single-family houses. The nZEB renovation market of apartment buildings with shared ownership is even more difficult to deal with because of the (lack of) awareness of the different owners, different customer segments and needed value proposition, the need to merge the interests of the owners and aligning their customer journeys and often financing obstacles. Collaboration between companies for informing, consulting, contracting and quality assurance is a necessity.
References
BPIE. 2011. Europe's Buildings Under the Microscope. Brussels: BPIE. Carlsson, V. and Koch, C. 2014. Shall we dance? Encounters for energy renovation of single family houses. In: Raiden, A. & Aboagye-Nimo, E. (Eds.) Proceedings 30th Annual ARCOM Conference, 1-3 September 2014, Portsmouth, UK, ARCOM, pp. 1163–1171. COHERENO (Mlecnik, E. and Straub, A.). 2014. Barriers and opportunities for business collaboration in the nZEB single-family housing renovation market. http://www.cohereno.eu/about/project-outcomes. European Commission. 2010. Directive 2010/31/EU on the energy performance of buildings (recast). Brussels: EU. European Commission. 2011. Roadmap for moving to a low-carbon economy in 2050. Brussels: EU. Janda, K.B. and Parag, Y. 2103. A middle-out approach for improving energy performance in buildings, Building Research & Innovation, 41(1), pp. 39-50. Gruneberg, S. and Hughes, W. 2004. Construction consortia: do they serve any real purpose? In: Khosrowshahi, F. (Ed.), Proceedings 20
th Annual ARCOM Conference, 1-3 September 2004, Heriot Watt
University, UK, ARCOM, Vol. 1, pp. 343-352. Haavik, T., Aabrekk, S., Mlecnik, E., and Kondratenko, I. 2012. Opportunities and barriers for business modelling of integrated energy renovation services, In: Andresen I. et al. (Eds.), PassivhusNorden 2012, Trondheim, Akademika Forlag, Tapir Akademisk Forlag, pp. 1-8. Mlecnik, E., Kondratenko, I., and Haavik, T. 2013. Opportunities and barriers related to supply chain collaboration for delivering integrated single-family home renovations, In: McCarthy J.V. (Ed.), CIB World Building Congress 2013, Brisbane, CIB, pp. 1-12. Osterwalder, A. and Pigneur, Y. 2010, Business Model Generation: A Handbook for Visionaries, Game Changers, and Challengers. New York: Wiley. Renssen, S. van (2014) Zero energy at zero cost: industrialising the building sector, Energypost September 12. Straub, A. 2014. E=0 Renovation stores. In: Burssens, D. (Ed.), NZEB Conference – 2014, Brussels, Passiefhuis-Platform, pp. 74-75. Tofield, B. and Ingham, M. 2012. Refurbishing Europe; An EU Strategy for Energy Efficiency and Climate Action Led by Building Refurbishment. Norwich: UK Low Carbon Innovation Centre and Build with CaRe. Treacy, M. and Wiersema, F. 1992. Customer Intimacy and Other Value Disciplines, Harvard Business Review, Harvard Business School Publishing, Boston.
45

46
DECONSTRUCTION PROJECT PLANNING BASED ON AUTOMATIC ACQUISITION AND RECONSTRUCTION OF BUILDING INFORMATION FOR EXISTING BUILDINGS
Rebekka VOLK
1
Neyir SEVILMIS 2 Frank SCHULTMANN 3
1 Karlsruhe Institute of Technology (KIT), Institute for Industrial Production (IIP), Email: [email protected] 2 Fraunhofer Institute for Computer Graphics Research (IGD), Email: [email protected] 3 Karlsruhe Institute of Technology (KIT), Institute for Industrial Production (IIP), Email: [email protected] Keywords: 3D building reconstruction, building auditing and acquisition, inventory, object detection, optimal deconstruction project planning
Abstract As energetic, health and environmental requirements for buildings are changing, deconstruction of buildings in the course of retrofits or replacing construction is increasingly important. To plan change measures in existing buildings, buildings have to be audited manually which is associated with great effort. In our contribution, we propose and describe a combined system of a hardware sensor with software modules for building information acquisition, reconstruction and project planning. Furthermore, technical requirements, the acquired data, user interaction and system architecture are discussed. Our tool enables planner, experts or decision makers to inspect a building and at the same time digitally audit the building room by room. For this purpose, point clouds are acquired, analysed and a 3D building model is automatically derived to record it. Furthermore, the acquired data is automatically analysed in real-time to detect construction elements that are saved in a database. Then, based on the generated building element database building reconstruction and planning algorithms use the information for building inventorying and project planning. This allows integrated planning of decontamination, site clearance, and deconstruction activities, as well as to coordinate secondary raw material recovery, resources, logistics, material storage and recycling options time and cost efficiently onsite. Results from first field tests on acquisition, reconstruction and deconstruction planning are presented and discussed. Finally, a summary and a conclusion are given. This is followed by an outlook on potential future research and application areas.
1. Introduction and motivation
Buildings are characterized by their immobility, heterogeneity and uniqueness. Due to their long lifecycles and changing users’, energetic, health, and environmental requirements, buildings are refurbished, retrofitted, remediated or modernized by generations of users, residents and proprietaries. During their lifecycles, different building elements and products are installed, removed or changed in the course of building modification. Often, these modifications of the building structure, equipment and fittings are not documented properly. At the end of their lifetime, buildings often undergo deconstruction (and replacement), remediation or modernization processes in spatially limited sites of dense urban areas and with limited resources available. To plan deconstruction or change measures in existing buildings, buildings have to be audited previously. And, planning and performance of change measures strongly depend on the quality of the acquired information. Often, the acquisition of building information of existing buildings is associated with expensive equipment and great acquisition and modelling effort of skilled staff. In the following section 2 of this paper, we present a short literature review on building information acquisition, reconstruction and project planning. Section 3 describes technical requirements of the hardware and software, the acquired data and the user interaction. Section 4 shows the general model architecture and the module interaction. Subsequently, a detailed module description and first results based on test cases are presented. This is followed by a summary, conclusion and outlook.
2. Literature Review
Research in this area can be divided into two major parts: building information acquisition and project planning in building deconstruction. Literature and recent approaches in these fields are described and analysed in the following sections:
47

2.1 Building information acquisition
If building information is insufficient for a specific purpose, comprehensive data has to be acquired to conduct (project) planning. If properly done, relevant information for deconstruction are captured such as existing building elements, site conditions, space availability, mass calculation and other conditions (Dt. Abbruchverband, 2015); (Rommel et al., 1999). Previous data capturing methods range from manual, semi-automatic or automatic, terrestrial or aerial techniques. Their application depends on the building or infrastructure size, complexity and budget. Terrestrial building auditing and acquisition is mostly carried out at individual building level, while aerial detection is only performed on larger building stocks, areas or infrastructures. Recently researched methods are manual measuring, image-based or range-based techniques (Volk et al., 2014). Image-based and range-based techniques extract spatial, colour and reflectivity information to digitally reconstruct a building. In practice, mainly manual auditing is applied including a site inspection, manual measurement of the building and its elements via tape measures or laser distance measures (callipers). Often, also other building-related or element-related information is acquired by deconstruction companies or experts via examination of existing building documentation, photographs, and checklists or in written form (Rommel et al., 1999); (Wangler et al., 2010); (LfU, 2001); (LfU, 2003); Dt. Abbruchverband, 2015). However, this kind of information acquisition is quite costly and leads to unstructured data that only can be processed for planning and inventorying purposes under great efforts. Also, semi-automated laser scanning techniques for documentation of historic buildings via immobile total stations are on the rise (Hajian and Becerik-Gerber, 2010). However, they are affected by great disadvantages yet such as high equipment cost and fragility, as well as difficulties in scanning reflective, transparent and dark surfaces (Klein et al., 2012); (Bhatla et al., 2012). Also, great effort and skills are necessary to process the data on conventional computers to a digital building model with all required data (Mill et al., 2013); (Tzedaki and Kamara, 2013); (Xiong et al., 2013); (Watson, 2011); (Brilakis et al., 2010); (Tang et al., 2010); (De Luca et al., 2006). And, current methods are restricted to rather low levels of detail. Furthermore, recent techniques do not compile an inventory of buildings’ (raw) materials yet e.g. for a buildings’ material pass or for deconstruction and recycling issues. Today, only costly semi-automated or manual acquisition techniques are available for building information acquisition. In most deconstruction projects, buildings are shortly inspected and the whole building size (gross volume or gross area) is roughly estimated. According to Dt. Abbruchverband (2015), deconstruction materials and masses are then derived manually e.g. via percentage of gross volume. And, exceptionalities like specific technical equipment such as swimming pools or air conditioning are noted. Buildings’ 3D structures are not acquired and reconstructed yet to calculate a buildings’ material inventory. This leads to deviations in expected deconstruction masses (on average ~10%, in some cases much more) and thus to uncertainties in deconstruction planning regarding time (deadlines, resource capacities over project makespan) and cost (increased deconstruction or disposal costs).
2.2 Project planning in building deconstruction
Literature on project planning is vast. However, project management approaches in deconstruction of buildings and infrastructures are limited to a relatively small number. Abdullah et al. (2003, 2008) provide project planning and decision making support in deconstruction via hierarchical multi-criteria decision-making (MCDM) approach. Their approach creates a ranking according to the highest benefit/cost ratio and estimate the demolition cost for the whole project according to the highest ranked demolition techniques per activity. Optimization-based project planning approaches include a building auditing support and an optimization tool for building deconstruction project planning in MS ACCESS 1998 (Schultmann et al., 1997); (Schultmann, 2003); (Schultmann and Rentz, 2001,2003). This work is based on manually pre-measured building element dimensions. Schultmann and Sunke (2007) extend the approach by additionally considering the recycling options of each building element and the related energy-saving effects due to different deconstruction activities. Spengler (1998) formulates an optimization problem (MILP) for the deconstruction of complex products in general, but restricts to deconstruction and recycling cost and maximization of the marginal return. Further related approaches are disassembly and fuzzy scheduling and capacity planning/optimization of complex products (with uncertain activity durations (Schultmann und Rentz, 2003), with uncertain capacities and cost (Spengler, 1998), with the deconstruction/disassembly of electronic devices and partly related uncertainties (Spengler, 1998); (Schultmann and Sunke, 2005, 2008), or related waste quantification and management (Li and Zhang, 2013); (Cheng and Ma, 2012); Akbarnezhad et al., 2012, 2014). However, only very few approaches account for uncertainties in deconstruction project planning (Schultmann und Rentz, 2003); (Spengler, 1998). Recent trends show the shift of BIM from design processes to retrofitting and deconstruction projects. Existing operative mass flow models are based on pre-existing BIM models and consider the deconstruction of single buildings (Cheng and Ma, 2012); (Akbarnezhad et al., 2012, 2014). Akbarnezhad et al., 2012, 2014) examine a scenario-based (not activity-based) sensitivity analysis of deterministic costs for deconstruction, shipping, reprocessing and disposal (landfilling) as well as of energy and carbon embodiments (Akbarnezhad et al., 2014). However, these works focus on the quantity takeoff, mass and cost calculation aim at ordering the exact number of hauling trucks and calculating the masses designated for recycling or disposal facilities. It becomes clear, that although there are some approaches in deconstruction project planning, only separate building information acquisition approaches and project planning (under uncertainty) approaches co-exist.
48
However, there is no approach that joins both to allow an effective way of documenting existing buildings and planning for their deconstruction, re-use and recycling. Also, approaches in literature refrain from modelling uncertainties. And, their approaches do not allow the automated acquisition of building information. Instead, their calculations are based upon manually pre-measurements onsite and assessments of building documentation (if existent). In practice, mainly checklists are applied to acquire building information and to document a buildings’ deconstruction. The project planning itself is performed by skilled and experienced staff, but at the same time underlies uncertainties and considerable deviations.
3. Technical and informational requirements
3.1 Requirements to hardware
In order to allow a deconstruction planner to carry out his building inspecting work in an as natural as possible manner, it is indispensable to setup a mobile and wearable building auditing system. The auditing system should also include a minimum of post-processing effort to generate building information, material inventory and project plans. In the design phase of the building auditing system, the following set of hardware requirements were specified in interviews with practitioners and experts:
Optical sensing system: During the walkthrough inspection of a building, an optical sensing system should acquire the geometry of the building, the floors, and the indoor scenes and should automatically identify building elements. The acquired 3D model should be consistent and persistent so post-processing building analysis steps can rely on high-quality data. Furthermore, the virtual 3D model of a building serves as a visual communication means for internal project planning, controlling or meetings. Ideally, the virtual 3D model serves as a basis to automatically calculate building inventories and to derive project plans from it.
Real-time: The system should provide real-time results so the planner can check for consistency and completeness during site inspection.
Enough battery capacity: The system should be energetically self-sustaining as electricity connections are cut and no other energy sources are available in buildings that will be deconstructed to run the system.
Robustness: The system should be robust to different illumination conditions, due to lacking electricity and lighting in buildings that will be deconstructed.
3.2 Requirements to software
It is mandatory for the software of the building auditing system to provide natural and comfortable interaction techniques to support intuitive and work-centered operations. This should be supported by non-invasive knowledge augmentation capability, including support for automatic object detection that can significantly influence the calculation of the building inventory. For an intuitive use, the software hides the underlying complex machinery from the end-user. The acquired images have to be interpreted adequately. For that purpose, images are systematically segmented and semantically analyzed in order to detect relevant objects such as walls, windows, doors or power outlets. Because geometry acquisition and reconstruction via depth cameras entails the creation of huge data volumes, efficient and adequate data filtering techniques are necessary to reduce the point clouds to the most significant points. Adequate interfaces need to be implemented to transfer the outcome of the acquisition and reconstruction to the planning module. The intuitive user interface allows a visual inspection of intermediate building reconstruction results and enables the planner to apply changes to the 3D model such as the later identification of undetected objects. For adequate deconstruction project planning, general building information has to be documented and parameters for inventorying and project planning are necessary. These information and parameters need to be included into the system and should be easily modifiable by a user. Furthermore, the system output (building inventory and project plan) should be easy accessible. This leads to the requirement for a graphical user interface to depict system results adequately.
4. System architecture and interactions
In the following section, the system architecture, the submodules and their interaction are described and discussed. Building information is generated in two ways: via sensor information and via user input (see Figure 1). Both types of information are processed separately. Sensor information is analyzed and major building elements are reconstructed (such as walls, windows, doors, floor and ceiling) while smaller building elements are detected (such as outlets, switches, lamps, sanitary objects). User input regarding the general building information such as address, construction type, year of construction, gross floor area, gross volume etc. are used to save the building in a database. The inventorying parameters can be manipulated via user input in a graphical user interface. Also, deconstruction and recycling parameters can be modified to define time and cost coefficients and to limit the number and capacity of available resources such as staff, hydraulic excavators, and handheld machinery etc. for the project in question. The entry of these parameters is supported by an underlying database that provides standard values. However, if necessary the user might change these values.
49

Figure 1 System architecture of ResourceApp prototype
Main elements of the ResourceApp system are the hardware modules and the software modules ‘A: Point and surface model’, ‘B: Object oriented room and building element model’, and ‘C: Deconstruction optimization model’. In the following subsections these parts of the model are further detailed.
4.1 Hardware modules
The ResourceApp hardware setup is a combination of a depth camera equipped with a RGB-D sensor and a laptop with a powerful graphics card to efficiently process the images acquired by the depth camera. In the following we describe both hardware modules: Microsoft Kinect - A depth camera equipped with a RGB-D sensor: With the release of the Microsoft
Kinect and other RGB-D sensors, depth cameras became available at reasonable prices to the public. Previous to this, devices such as time of flight (TOF), stereo vision and 3D LIDAR sensors were required for 3D perception. The low cost of the Kinect sensor coupled with its high quality sensing capabilities has proven to be an attractive alternative to previous more expensive 3D sensing systems. The Kinect contains two cameras (a RGB camera and an infrared camera), as well as an infrared projector which projects an infrared pattern onto the scene. The infrared camera acquires the pattern in 30Hz at VGA resolution (640 by 480 pixels) which is used to calculate the distance of the depth camera to the acquired object surface. The deformation of the pattern projected onto the three dimensional rooms is then used to infer their three dimensional shapes. This kind of depth sensor also works in poorly lit rooms, which was a main decision criterion for this technology. In the ResourceApp system, the Kinect sensor has been used to implement a real-time 3D reconstruction of rooms and buildings.
Figure 2 Microsoft Kinect: A depth camera equipped with a RGB-D sensor
Laptop equipped with the Nvidia GeForce GTX 780M graphics card: The real-time capability of the ResourceApp has been achieved by using a laptop with a powerful graphics card (Nvidia GeForce GTX 780M with 4GB RAM and 2,369 GFLOPS). The graphics processor unit (GPU) of the graphics card allows an efficient processing and manipulation of computer graphics and image processing, and its highly parallel structure makes it more effective than general-purpose CPUs for algorithms where processing of large amounts of data is done in parallel.
50
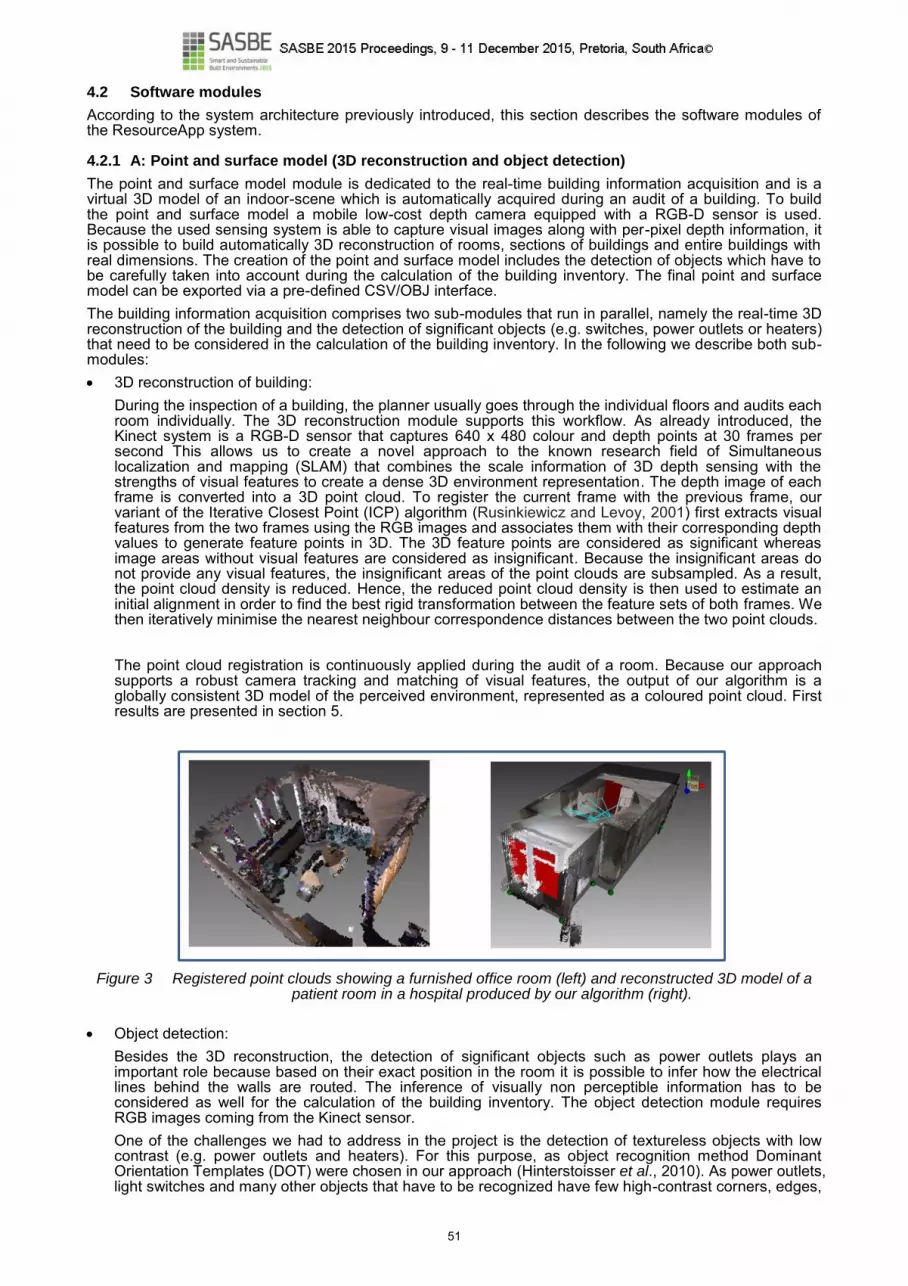
4.2 Software modules
According to the system architecture previously introduced, this section describes the software modules of the ResourceApp system.
4.2.1 A: Point and surface model (3D reconstruction and object detection)
The point and surface model module is dedicated to the real-time building information acquisition and is a virtual 3D model of an indoor-scene which is automatically acquired during an audit of a building. To build the point and surface model a mobile low-cost depth camera equipped with a RGB-D sensor is used. Because the used sensing system is able to capture visual images along with per-pixel depth information, it is possible to build automatically 3D reconstruction of rooms, sections of buildings and entire buildings with real dimensions. The creation of the point and surface model includes the detection of objects which have to be carefully taken into account during the calculation of the building inventory. The final point and surface model can be exported via a pre-defined CSV/OBJ interface. The building information acquisition comprises two sub-modules that run in parallel, namely the real-time 3D reconstruction of the building and the detection of significant objects (e.g. switches, power outlets or heaters) that need to be considered in the calculation of the building inventory. In the following we describe both sub-modules: 3D reconstruction of building:
During the inspection of a building, the planner usually goes through the individual floors and audits each room individually. The 3D reconstruction module supports this workflow. As already introduced, the Kinect system is a RGB-D sensor that captures 640 x 480 colour and depth points at 30 frames per second This allows us to create a novel approach to the known research field of Simultaneous localization and mapping (SLAM) that combines the scale information of 3D depth sensing with the strengths of visual features to create a dense 3D environment representation. The depth image of each frame is converted into a 3D point cloud. To register the current frame with the previous frame, our variant of the Iterative Closest Point (ICP) algorithm (Rusinkiewicz and Levoy, 2001) first extracts visual features from the two frames using the RGB images and associates them with their corresponding depth values to generate feature points in 3D. The 3D feature points are considered as significant whereas image areas without visual features are considered as insignificant. Because the insignificant areas do not provide any visual features, the insignificant areas of the point clouds are subsampled. As a result, the point cloud density is reduced. Hence, the reduced point cloud density is then used to estimate an initial alignment in order to find the best rigid transformation between the feature sets of both frames. We then iteratively minimise the nearest neighbour correspondence distances between the two point clouds. The point cloud registration is continuously applied during the audit of a room. Because our approach supports a robust camera tracking and matching of visual features, the output of our algorithm is a globally consistent 3D model of the perceived environment, represented as a coloured point cloud. First results are presented in section 5.
Figure 3 Registered point clouds showing a furnished office room (left) and reconstructed 3D model of a
patient room in a hospital produced by our algorithm (right).
Object detection:
Besides the 3D reconstruction, the detection of significant objects such as power outlets plays an important role because based on their exact position in the room it is possible to infer how the electrical lines behind the walls are routed. The inference of visually non perceptible information has to be considered as well for the calculation of the building inventory. The object detection module requires RGB images coming from the Kinect sensor. One of the challenges we had to address in the project is the detection of textureless objects with low contrast (e.g. power outlets and heaters). For this purpose, as object recognition method Dominant Orientation Templates (DOT) were chosen in our approach (Hinterstoisser et al., 2010). As power outlets, light switches and many other objects that have to be recognized have few high-contrast corners, edges,
51

or surface patterns, such as in the case of white light switches mounted on a white wall, classic feature-based methods such as SIFT are ill-suited. DOT was instead developed with the goal of recognizing untextured objects. Although methods based on machine learning, often used to recognize people or faces, can be more robust, they require large image databases consisting of many thousands of positive images containing an object as well as similarly large numbers of negative examples per object category that is to be recognized. As a large number of object categories have to be recognized this would be infeasible. The DOT method is better suited as 5 to 10 examples (templates) per category can be sufficient. To reduce false positives the method was extended to check object scales by using the Kinect’s depth to verify that an object’s size in the image matches its expected physical dimensions. As object detection relies on template matching, for each object category a set of DOT templates have been created. When parsing the RGB images, those categorized DOT templates are applied on the image stream to quickly find objects and label them according to their category. Since our algorithm maintains the correspondence between the colour and depth images through interpolation and averaging, the position of the detected objects in the 3D model is determined.
Figure 4 The DOT templates used in ResourceApp are robust to illumination change and can detect non-textured objects (here power outlets) in real-time without relying on feature point detection
Once the 3D reconstruction and the object detection is completed for a building or a section of a building, all acquired information are exported via the CSV/OBJ interface and is used in the downstream process steps to calculate the building inventory.
4.2.2 B: Object oriented room and building element model
The object-oriented room and building element model is based upon the point and surface model (A) that is transferred by the CSV/OBJ interface. Each captured building element is analyzed with respect to its kind and its material information. Depending on these, further invisible but nevertheless existing building elements are automatically inserted. Further, the building element masses are calculated of both visible and invisible objects. Then, the building inventories are created both for material/waste fractions and building elements. This allows further processing and project planning with respect to inventorying, necessary deconstruction and material/element separation activities. The detailed construction of the object-oriented room and building element model and calculation of the building inventory is depicted in Figure 5 and described in the following. The CSV/OBJ interface lists all detected and visible building elements with their coordinates and material information. Based on this list of building elements, further invisible building elements are derived. E.g. if the list presents a wall, in a first step plausible wall values (such as length, height) are checked on plausibility. However, if the building element information is not characteristic, it is adjusted to plausible values generated from standards. When it comes to technical building equipment, wiring, piping and tubes often are not visible to the eyes or to sensors. However, often their outlets such as switches, lamps, outlets, sanitary devices, etc. are visible and allow a reconstruction of their runs For example, if a power outlet is detected and listed in the interface, first the related type of equipment has to be clarified. Then, the respective wiring is created and its length is calculated. The reconstruction of the supply line starts that is calculated vertically or/and horizontally calculated depending on the type of technical equipment and the position of the technical outlet as well as on the position of the next technical distribution box for the apartment or building. The coordinates of the apartments’ distribution box as well as the house connection point can be manually assigned by the user to allow the reconstruction. Similarly to the wiring reconstruction, pipes and tubes are reconstructed and their volume and mass is calculated. Or, if a wall is a reinforced concrete wall, a steel reinforcement element and a concrete matrix element are automatically created by the software. If openings had been found on a wall, they are subtracted from the wall surface. Then, the wall surface is multiplied with an assumed wall thickness parameter (which cannot yet be acquired automatically) to calculate the volume of the wall. If the wall consists of a ‘single or homogeneous’ material (e.g. brick, concrete, timber), the wall volume is multiplied with its respective material density. Else if the wall is made of reinforced concrete, the reinforcement is calculated via standard reinforcement coefficients per square meter wall surface. Then, the reinforcement volume is subtracted from the total building element volume. For both reinforcement material and matrix material, masses are calculated with their densities and listed in the building inventory. Here, a further detailed calculation might be possible but is far more complex.
52

The generated building inventory consists of three major listings: aggregated inventory (= all building elements that were detected), detailed inventory (=all detected building elements plus all assumed (invisible) building elements) and material inventory (=aggregation of all building element masses according to their main material). The detailed building inventory is used to derive necessary separation, deconstruction and sorting activities during a deconstruction project. The activity derivation and the project planning are described in the following subsection.
Figure 5 Building inventory calculation logic and plausibility checks
4.2.3 C: Project planning in building deconstruction
Based on the building inventory, activities are derived that are necessary to deconstruct the building elements (see Error! Reference source not found., left). Deconstruction activities can be performed in different modes that differ in their resource usage of staff, machines, time and cost. These activities form the basis for the deconstruction optimization model that calculates an optimum schedule for the deconstruction project. Standard deconstruction activities include separation, deconstruction, crushing, sorting and loading operations that require different amounts of constrained resources (machines, staff, cost). As single activities can be performed in different modes (see Error! Reference source not found., right), e.g. deconstruction of a wall can be done with a hydraulic excavator, dragline excavator or pneumatic hammer, a simultaneous planning of activities in different modes on resources has to be done. Tabel 1 Exemplary deconstruction activities derived from CSV/OBJ interface (left) and considered modes
and their resource requirements (right)
ID Deconstruction activities Modes Resources
1 Start 1 – Grabbing Hydraulic excavator, sorting grabs, 2 W* 2 Deconstruction of Foundation 2 – Driving Cable excavator, steel mass, 2 W* 3 Deconstruction of (Exterior) Walls 3 – Pressing Hydraulic excavator, demolition stick, 2 W* 4 Deconstruction of (Interior) Walls 4 – Tapering Hydraulic excavator, steel cable, 2 W* 5 Deconstruction of Ceiling Slabs 5 – Tearing Hydraulic excavator, demolition stick, 2 W* 6 Deconstruction of Doors 6 – Mortising Hydraulic excavator, demolition hammer, 2 W* 7 Deconstruction of Windows 7 - Disassembling Hoist, 4 W* 8 Deconstruction of Small Distr. Boxes 8 - Manual deconstruction Hydraulic excavator (electric hammer), 1 W* 9 Deconstruction of Large Distr. Boxes *W=Worker
10 Deconstruction of Wiring 11 End
To calculate the optimum schedule, further information and parameters are necessary that have to be predefined by a user, such as available resources, technical applicability of modes on building elements and on materials, activity precedences based on technical constraints, as well as activity cost and activity duration per mode. Partly, this information is stored in a database such as the applicability matrices, precedence constraints, cost and duration and can easily be modified by the user. Also, the user can modify his individual resource constraints. Furthermore, technical constraints such as the activities’ precedence (see Figure 6, right) or the applicability of specific techniques on elements or materials are respected. Thus, in the developed model ResourceApp a multi-mode resource-constrained project scheduling problem (MRCPSP) is formulated with the objective of minimum project makespan. It is solved for the previously calculated building inventory and its derived activities plus dummy start and end activities with the durations and resource demand of zero. The model is implemented as a binary, linear integer problem (BILP) in
53

MATLAB R2015b. The commercial CPLEX solver from IBM ILOG Optimization Studio 12.5.1 is used to solve the problem. Then, an optimal deconstruction schedule is calculated for the derived deconstruction activities and the available resources and presented as Gantt diagrams (see Figure 6, left) and resource capacity plans. In first test it showed that this method is limited to smaller problem sizes due to high computational effort. Thus, the generated deconstruction activities were grouped and the time slices of the model were reduced to enable solvability or the system. Figure 6 Exemplary Gantt diagram with the scheduled activities (x-axis: time, y-axis: modes) (left) and the
underlying precedence graph (right) of a fictive deconstruction project with 11 activities on 8 modes
5. Summary, conclusion and outlook
In our contribution, we presented an innovative system consisting of a sensor and software modules on a laptop that allow data analyzing and project planning for building deconstruction projects. To audit a building designated for deconstruction, the mobile sensor records a buildings’ indoor condition. The recorded data is then analyzed to detect objects and building elements. This is followed by a 3D reconstruction of the building interior. Based on the analyzed sensor data, a building inventory is calculated and necessary data for building deconstruction are derived. Subsequently, deconstruction activities are generated and planned on constrained resources with the objective of minimum project makespan. This allows users to audit and document buildings efficiently and to automatically create deconstruction plans and bids. Building owners might also use this application to calculate the building inherent mass and waste fractions and its potential secondary raw materials. We investigated how the Microsoft Kinect, as a representative of low-cost depth cameras, developed mainly for gaming and entertainment applications can be used for the generation of dense 3D maps of buildings. The key insights can be summarised as follows: (i) a tight integration of depth and colour information can yield robust frame matching and 3D reconstruction, (ii) best practices in SLAM and computer graphics makes it possible to build and visualize accurate 3D maps with such cameras, and (iii) our variant of the ICP algorithm might fail in areas that lack visual information, such as very dark rooms. Further research work will be necessary to increase the robustness of our ICP algorithm. Furthermore, to extend the reconstruction capabilities of the ResourceApp prototype we plan to consider non-rectangular room geometries. The inclusion of further sensors in order to detect hazardous and carcinogenic substances such as asbestos into the ResourceApp prototype is envisioned for the future. Concerning the object detection, the DOT template representation based on locally dominant gradient orientation has shown that untextured 3D objects could be detected using few templates from different viewpoints in real-time. One notable advantage of the DOT approach is that it does not require a training set. However, since the creation of the DOT templates requires manual work further research is needed to investigate how the template creation can be automatized, possibly with a marker-based approach. With respect to the transferability of the ResourceApp system to mobile phones and tablets, we are following with keen interest the results of the Tango project where Google and Intel are developing a smartphone with an integrated depth camera. Our algorithms are based on the Point Cloud Library (PCL) which is cross-platform and has been successfully compiled and deployed on Android and iOS. Furthermore, uncertainties regarding the completeness of captured objects in a building and with respect to multiple layers and invisible building elements in older buildings need to be considered. Also, the variability of the optical information and the uncertainty in the identification of building elements has to be tested and statistically evaluated. In the course of our work, also system tests in larger case studies are planned in the near future. The project planning of building deconstruction is possible although the problem sizes that are solvable in a finite time frame are limited. Thus, a reduction of problem size by activity grouping or time slice reduction is necessary and will be further developed. Alongside the test, sensitivity analyses would be useful to identify influence factors on our system results. The named issues will be addressed in our further research in the course of our joint research project. As an outlook, this tools’ capability might be extended to facility management application or to building refurbishment and renovation/modernization projects of buildings and infrastructures. Also, the functionality might be extended to performance measurement in construction and deconstruction projects both in buildings, technical appliances and infrastructure. In these cases, further research and detailing on building elements and types of construction (e.g. regional differences) is needed. Furthermore, the ResourceApp systems’ functionality might be transferred to the deconstruction of infrastructure or large technical plants
Time
Activitiy ID
54

such as nuclear power plants. However, this will require further research on the inherent technical appliances, equipment and materials.
Acknowledgements
This paper resulted from our joint work in the research project ResourceApp (#033R092) funded by the Federal Ministry of Education and Research (BMBF) in Germany. Also, we like to thank our colleagues at Fraunhofer IGD Matthias Bein and Johannes Müller-Römer, and at Fraunhofer ICT Christian Stier and Ansilla Bayha for their contributions and the good collaboration.
References
Abdullah, A., Anumba, C., Durmisevic, E. 2003. Decision tools for demolition techniques selection. in CIB Report 287 ‘Deconstruction & Materials Reuse’ - Proceedings of the 11th Rinker International Conference on Deconstruction and Materials Reuse (ed. A. Chini) 55-72. Akbarnezhad, A., Ong, K., Chandra, L. & Lin, Z. 2012. Economic and Environmental Assessment of Deconstruction Strategies Using Building Information Modeling. in Proceedings of Construction Research Congress 2012: Construction Challenges in a Flat World 1730–1739. Akbarnezhad, A., Ong, K., Chandra, L. 2014. Economic and environmental assessment of deconstruction strategies using building information modeling. Automation in Construction 37, 131–144. Anumba, C., Abdullah, A., Ruikar, K. 2008. An Integrated System for Demolition Techniques Selection. Architectural Engineering and Design Management 4, 130–148. Bhatla A, Choe S, Fierro O, Leite F. 2012. Evaluation of accuracy of as-built 3D modeling from photos taken by handheld digital cameras. Automation in Construction 28:116–27. Brilakis I, Lourakis M, Sacks R, Savarese S, Christodoulou S, Teizer J, Makhmalbaf A. 2010. Toward automated generation of parametric BIMs based on hybrid video and laser scanning data. Advanced Engineering Informatics 24(4): 456–65. Chen Z, Li H. 2006. Environmental Management in Construction - A quantitative approach. New York: Taylor & Francis. De Luca L, Veron P, Florenzano M. 2006. Reverse engineering of architectural buildings based on a hybrid modeling approach. Computers & Graphics 30(2):160–76. Dt. Abbruchverband. 2015. Abbrucharbeiten - Grundlagen, Vorbereitung, Durchführung. 3. actual. and extended. Köln: Rudolf Müller. Hajian H, Becerik-Gerber B. 2010. Scan to BIM: Factors Affecting Operational and Computational Errors and Productivity Loss. Proceedings of the 27th International Symposium on Automation and Robotics in Construction (ISARC). Hinterstoisser, S., Lepetit, V., Ilic, S., Fua, P., Navab, N. 2010. Dominant Orientation Templates for Real-Time Detection of Texture-Less Objects. In: IEEE Conf. Computer Vision and Pattern Recognition. Kenley, R., Seppänen, O. 2010. Location-Based Management for Construction - Planning, Scheduling and Control. (Spon Press). Klein L, Li N, Becerik-Gerber B. 2012. Image-based verification of as-built documentation of operational buildings. Automation in Construction 21:161–71. LfU. 2001. Abbruch von Wohn- und Verwaltungsgebäuden - Handlungshilfe. Karlsruhe: Landesanstalt für Umweltschutz Baden-Württemberg. LfU. 2003. Arbeitshilfe Kontrollierter Rückbau: Kontaminierte Bausubstanz - Erkundung, Bewertung, Entsorgung. Augsburg: Bayrisches Landesamt für Umweltschutz. Li Y, Zhang X. 2013. Web-based construction waste estimation system for building construction projects. Automation in Construction 35:142–56. Mill T, Alt A, Liias R. 2013. Combined 3D building surveying techniques – terrestrial laser scanning (TLS) and total station surveying for BIM data management purposes. Journal of Civil Engineering and Management. 19(1): 23-32. Rommel T, Katzer W, Tauchert G, Huang J. 1999. Leitfaden für die Erfassung und Bewertung der Materialien eines Abbruchobjektes. Berlin: Deutscher Ausschuss für Stahlbeton. Rusinkiewicz, S; Levoy, M. 2001. Efficient variants of the ICP algorithm- 3-D Digital Imaging and Modeling. Third International Conference on 3-D Digital Imaging and Modeling, Proceedings. 145 – 152, IEEE Schultmann, F, Sindt, V, Ruch, M & Rentz, O. 1997. Schadstofforientierte Erfassung und Demontage von Gebäuden. Abfallwirtschaftsjournal 3, 38–42. Schultmann, F. 2003. Dealing with uncertainties in (de-)construction management - the contribution of fuzzy scheduling. in CIB Report 287 ‘Deconstruction & Materials Reuse’ - Proceedings of the 11th Rinker International Conference on Deconstruction and Materials Reuse (ed. A. Chini) 73–82. Schultmann, F, Rentz, O. 2001. Environment-oriented project scheduling for the dismantling of buildings. OR Spektrum 23:51–78.
55

Schultmann, F, Rentz, O. 2003. Fuzzy Scheduling for the Dismantling of Complex Products. in Operations Research Proceedings 2002, Selected Papers of the International Conference on Operations Research (SOR 2002), Klagenfurt (eds. Leopold-Wildburger, U., Rendl, F. & Wäscher, G.) 302–307 (Springer Verlag). Schultmann F, Sunke N. 2005. Planning Models for the Dismantling of Electrical and Electronic Equipment under Consideration of Uncertainties. Proceedings of the Conference Eco-X: ecology and economy in electronics – Future Challenges and Sustainable Solutions for the Electronics Sector, Wien, 247–73. Schultmann F., Sunke, N. 2007. Energy-oriented deconstruction and recovery planning, Building Research & Information, 35(6):602-615, Special Issue: Next generation Sustainable Construction Schultmann F, Sunke N. 2008. Planning models for the dismantling of electrical and electronic equipment under consideration of uncertainties. Progress in Industrial Ecology 5:82–101. Spengler, T. 1998. Industrielles Stoffstrommanagement - Betriebswirtschaftliche Planung und Steuerung von Stoff- und Energieströmen in Produktionsunternehmen, zugl. Karlsruhe, Universität, Habilitationsschrift, Dissertation 54, (Erich Schmidt Verlag (ESV)). Tang P, Huber D, Akinci B, Lipman R, Lytle A. 2010. Automatic reconstruction of as-built building information models from laser-scanned point clouds: A review of related techniques. Automation in Construction 19:829–43. Tzedaki V, Kamara J. 2013. Capturing As-Built Information for a BIM Environment Using 3D Laser Scanner: A Process Model, State College, Pennsylvania Volk R, Stengel J, Schultmann F. 2014. Building Information Modeling (BIM) for existing buildings – literature review and future needs. Automation in Construction 109–27. Wangler O, Opitz J, Gabriel S, Hawer M. 2010. Selektiver Abbruch und verwendungsorientierter Rückbau. Bundesanstalt für Arbeitsschutz und Arbeitsmedizin (BAuA). Watson A. 2011. Digital buildings - Challenges and opportunities. Advanced Engineering Informatics 25:573–81. Xiong X, Adan A, Akinci B, Huber D. 2013. Automatic creation of semantically rich 3D building models from laser scanner data. Automation in Construction; 31: 325–37.
56

SUSTAINABLE EDUCATION OF THE CONSTRUCTION SECTOR IN ZAMBIA
Carmen ANTUÑA ROZADO 1
Aapo HUOVILA 2
Hannele AHVENNIEMI 3
1 EcoEfficient Districts / VTT Technical Research Centre of Finland, Email: [email protected] 2 EcoEfficient Districts / VTT Technical Research Centre of Finland, Email: [email protected] 3 Intelligent Built Environment / VTT Technical Research Centre of Finland, Email:
[email protected] Keywords: Sustainable construction, capacity building, EcoCurriculum, sustainable education
Abstract
EcoLusaka (2013-2015) is a capacity building project funded by the Institutional Cooperation Instrument (ICI) under the Ministry for Foreign Affairs of Finland (MFA). During the project the Finnish partner, VTT, will strengthen the capacity of the Zambian partner, Thorn Park Construction Training Centre (TPCTC) based in Lusaka, to provide education on sustainable construction and disseminate the results for wider use in the Zambian construction sector. TPCTC is a vocational training institute registered with the Technical Education, Vocational and Entrepreneurship Training Authority (TEVETA) of Zambia. Its purpose is to educate future workers and also working professionals for the construction sector by providing targeted training courses on artisanal construction skills. The overall objective of EcoLusaka is to increase the supply of qualified workers capable of applying sustainable construction principles in response to the growing demand within the Zambian construction sector. To reach this objective, the main result to be achieved was the development an EcoCurriculum that could be integrated into TPCTC current programme of studies. However, during the project preparation phase it became clear that in order to secure the successful implementation of the Eco Curriculum, the continuation of the actions started during the project and the long-term viability of the impacts of EcoLusaka, a wider strategy was necessary. This paper discusses the main components of the EcoStrategy carried out during EcoLusaka project, as well as a critical evaluation of the outcomes that can be drawn upon by others in further research, training, policy development and project implementation.
1. Introduction
Since Zambia’s population is growing rapidly there is a huge need for artisanal construction workers. To such a degree, that there is a considerable in-flow of artisanal workers from neighbouring countries, in particular from Malawi and Zimbabwe. At the same time, there are environmental concerns within the construction process that need to be addressed. This situation led the Zambian partner, Thorn Park Construction Training Centre (TPCTC), to seek collaboration with VTT Technical Research Centre of Finland (VTT) with the objective of increasing the supply of qualified workers capable of applying sustainable construction principles in response to the growing demand within the Zambian construction sector. TPCTC is a vocational training institute registered with the Technical Education, Vocational and Entrepreneurship Training Authority (TEVETA) of Zambia. Its purpose is to educate future workers and also working professionals for the construction sector by providing targeted training courses on artisanal construction skills. VTT, the biggest multi-technological applied research organization in Northern Europe, has done research on different aspects of sustainable building for decades. This collaboration has crystalized in a capacity building project called EcoLusaka (2013-2015) funded by the Institutional Cooperation Instrument (ICI) under the Ministry for Foreign Affairs of Finland (MFA). The project is inserted in the context of the relationship between Finland and Zambia, a stable and transparent relationship based on development cooperation. Zambia is one of the main receivers of Finnish development support in Africa. Cooperation between Finland and Zambia aims at deepening and expanding the bilateral partnership in three key sectors: environment and natural resources, private sector development, and rural development and agriculture. The project can be also considered part of the wider framework established by VTT’s EcoCity concept for sustainable community and neighbourhood regeneration and development (Huovila & Antuña Rozado, 2014). The concept is built around a strong collaboration with reliable local partners in order to answer to clear local needs previously discussed and identified with them. As initially planned, EcoLusaka project was to focus on the construction phase and especially on the education of construction workers regarding environmental respect and protection, sustainable use of materials and management of natural resources, and improvement of the quality of finishing. In addition, VTT was to strengthen the capacity of TPCTC to provide education on sustainable construction and disseminate the results for wider use in the Zambian construction sector. As it has happened, the initial focus has widened to emphasize certain subjects that were perceived as of crucial importance like e.g. Occupational Safety and Health (OSH).
57

In this context, and in order to reach the main objective described above, the main result to be achieved was the development an EcoCurriculum that could be integrated into TPCTC current programme of studies. However, already during the project preparation phase it became clear that in order to secure the successful implementation of the EcoCurriculum, the continuation of the actions started during the project and the long-term viability of the impacts of EcoLusaka, a wider strategy was necessary. This paper discusses the main components of the EcoStrategy carried out during EcoLusaka project, as well as a critical evaluation of the outcomes that can be drawn upon by others in further research, training, policy development and project implementation. For a better understanding of the outcomes presented here, it should be stressed that this is not a research project, but a development one. The novelty of this work lies in the development of a strategy that is both feasible and meant to guarantee long-term impacts for TPCTC and for the construction sector at large, which is not commonly the approach of this type of development projects. It is also the result of close collaboration with the local partner and adaptation to the local context.
2. EcoStrategy and its main components
The purpose of TPCTC is to educate future workers and also working professionals for the construction sector by providing targeted training courses on artisanal construction skills, namely Bricklaying & Plastering, Carpentry & Joinery and Power Electrical Engineering (see Figure 1). The school arranges different education packages, ranging from shorter 2 week courses up to 2 year education programmes. The shorter courses are mainly aimed for people already working in the construction industry wanting to improve their know-how. The longer courses are mainly aimed for young people who have finished school and want to educate themselves to become talented construction workers. The number of students during a normal academic year is around 125. TPCTC staff consists of 11 people including teaching staff (8), administration staff (2) and support staff (1).
Figure 1 Structure of TPCTC (Carmen Antuña & Marko Nokkala, VTT).
As agreed, TPCTC would commit their personnel and their facilities to the project, whereas VTT experts would strengthen the capacity of TPCTC staff and lead the development and piloting of an EcoCurriculum, and possibly also other new courses, to be integrated into their current programme of studies. During the first workshops held for the preparation of the project document, it became evident that the “environmentally sustainable” approach intrinsically linked to the EcoCurriculum could be easily broadened to include other important aspects related to economic and social sustainability in response to the needs identified by VTT in collaboration with the local partner. Moreover, in order to secure the successful implementation of the EcoCurriculum, the continuation of the actions started during the project and the long-term viability of the impacts of EcoLusaka, a wider strategy was necessary. In addition, when reported about the outcome of the workshops mentioned, the International Labour Organization (ILO) Office in Zambia expressed a strong interest in establishing links between EcoLusaka and the Green Jobs Programme (ILO, 2015), a joint programme to enhance competitiveness and sustainable business among MSMEs in the Zambian building and construction industry.
58

Therefore, the methodological approach chosen was the definition of a more holistic framework, an EcoStrategy (see Figure 2) that goes beyond purely environmental issues and includes other components perceived as fundamental to achieve the project’s main objectives: Human Resource Development, Educational Curriculum, Business & Technology Development and Facility & Equipment Improvement. These four main components were to be complemented by a series of dissemination and awareness-raising actions among local stakeholders, and a system to monitor job opportunities for current and former TPCTC students. The EcoStrategy should also ensure effective links with ILO Green Jobs Programme through various project activities.
Figure 2 EcoStrategy proposed for EcoLusaka project (Carmen Antuña & Marko Nokkala, VTT).
To support the correct development and implementation of the designed EcoStrategy, an adequate organizational structure (see Figure 3) was also necessary. It should be agile enough to allow a quick reaction to unforeseen events that might occur during the project and to introduce changes in response to new opportunities identified. The proposed structure has relied on fluent communication between TPCTC staff and VTT experts, as well as on the instrumental role played by the Advisory Board (AB) providing advice and helping to disseminate the results of the project to as wide an audience as possible. EcoLusaka AB was integrated by representatives of ILO Office in Zambia, Lusaka Business and Technical College (LBTC) and the National Council for Construction (NCC).
Figure 3 EcoLusaka project organization (Carmen Antuña, VTT).
Finally, it should be stressed that EcoLusaka is a capacity building project and as such, the EcoStrategy developed should be in line with the four areas of emphasis of Finland’s Development Policy (Government of Finland, 2012): 1. A democratic and accountable society that promotes human rights (Results 1, 2 and 5) 2. An inclusive green economy that promotes employment (Results 1, 2, 3 and 6)
59
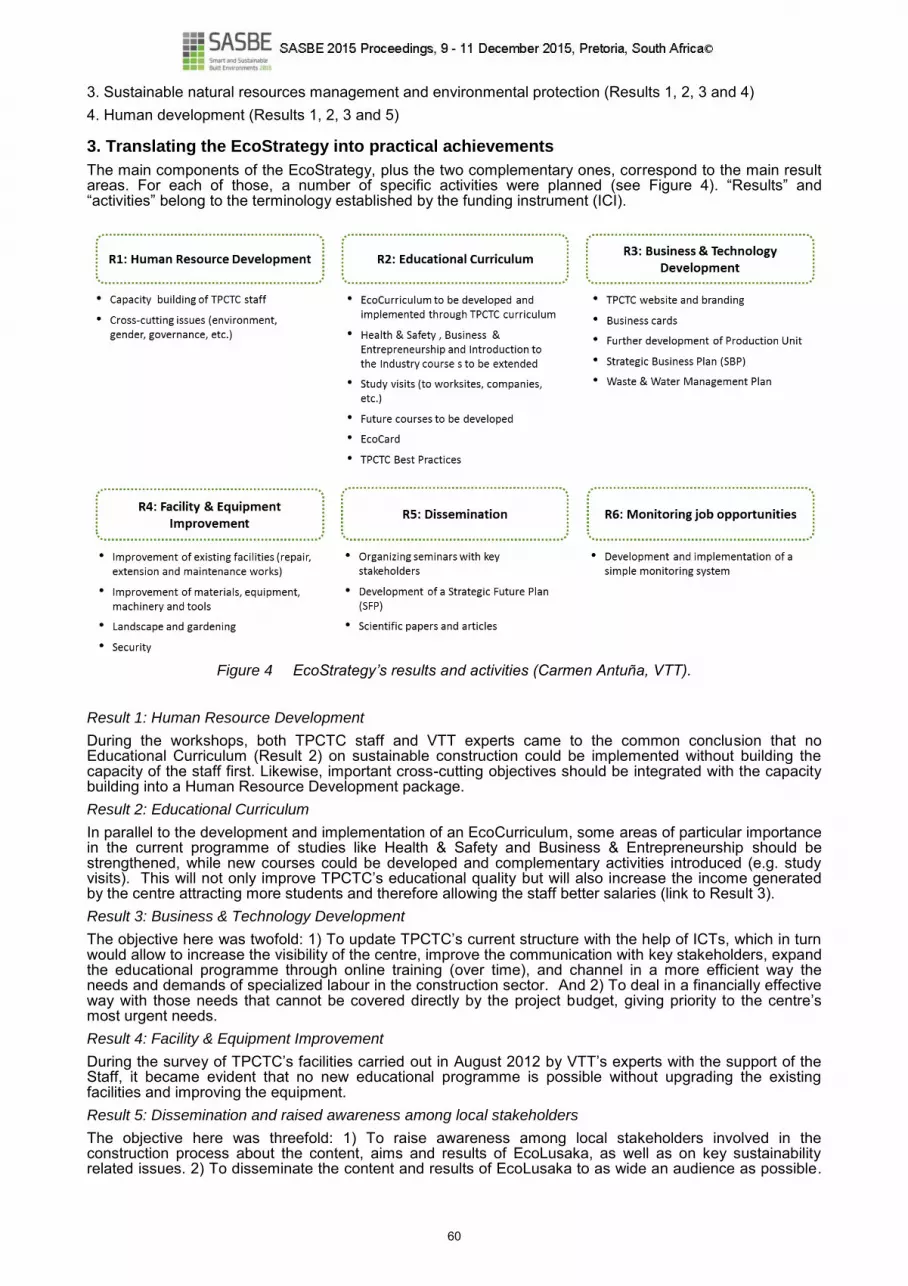
3. Sustainable natural resources management and environmental protection (Results 1, 2, 3 and 4) 4. Human development (Results 1, 2, 3 and 5)
3. Translating the EcoStrategy into practical achievements
The main components of the EcoStrategy, plus the two complementary ones, correspond to the main result areas. For each of those, a number of specific activities were planned (see Figure 4). “Results” and “activities” belong to the terminology established by the funding instrument (ICI).
Figure 4 EcoStrategy’s results and activities (Carmen Antuña, VTT).
Result 1: Human Resource Development
During the workshops, both TPCTC staff and VTT experts came to the common conclusion that no Educational Curriculum (Result 2) on sustainable construction could be implemented without building the capacity of the staff first. Likewise, important cross-cutting objectives should be integrated with the capacity building into a Human Resource Development package. Result 2: Educational Curriculum In parallel to the development and implementation of an EcoCurriculum, some areas of particular importance in the current programme of studies like Health & Safety and Business & Entrepreneurship should be strengthened, while new courses could be developed and complementary activities introduced (e.g. study visits). This will not only improve TPCTC’s educational quality but will also increase the income generated by the centre attracting more students and therefore allowing the staff better salaries (link to Result 3). Result 3: Business & Technology Development The objective here was twofold: 1) To update TPCTC’s current structure with the help of ICTs, which in turn would allow to increase the visibility of the centre, improve the communication with key stakeholders, expand the educational programme through online training (over time), and channel in a more efficient way the needs and demands of specialized labour in the construction sector. And 2) To deal in a financially effective way with those needs that cannot be covered directly by the project budget, giving priority to the centre’s most urgent needs. Result 4: Facility & Equipment Improvement During the survey of TPCTC’s facilities carried out in August 2012 by VTT’s experts with the support of the Staff, it became evident that no new educational programme is possible without upgrading the existing facilities and improving the equipment. Result 5: Dissemination and raised awareness among local stakeholders The objective here was threefold: 1) To raise awareness among local stakeholders involved in the construction process about the content, aims and results of EcoLusaka, as well as on key sustainability related issues. 2) To disseminate the content and results of EcoLusaka to as wide an audience as possible.
60

And 3) To enable an impact at a national level that might lead in the short term to a change in the Zambian construction regulatory framework towards a more sustainable construction process. Result 6: Monitoring job opportunities
At the beginning of the project TPCTC didn’t have a monitoring system for this purpose, so one of the aims of EcoLusaka was to establish a job matching system which can also provide the school with a possibility to monitor the employment of current and former students of Thorn Park.
4. Discussion
What follows is a critical evaluation of the outcomes so far in terms of what results and activities have been successfully implemented, what others have not been so successful, and why. In addition, those results and activities that have been modified or re-formulated in the course of the project will be also commented. The Human Resource Development (R1) package has been particularly successful. The positive impacts that can derive from seeing good sustainability practices as happened during the Summer Training Course held in Finland in August 2014 should be emphasized (see Figure 5). The knowledge acquired through the training modules provided and the visits to relevant Finnish companies and organizations, has inspired TPCTC staff to develop and implement a number of actions like e.g. collecting and selling the sawdust produced by the Carpentry & Joinery section instead of throwing it away. Further training on different aspects of sustainable construction and ICT has continued throughout the project clearly contributing to increase TPCTC’s know-how, self-confidence and professionalism. A huge improvement can be seen in the way the staff contacts and communicates with external stakeholders to enhance the visibility of the centre and create new collaboration opportunities. TPCTC staff has also become considerably more efficient in task management and allocation.
Figure 5 TPCTC staff from Power Electrical Engineering visiting ABB premises during their Summer Training Course in Finland (Photo: Pekka Huovila).
Looking back, a new Educational Curriculum (R2) has been instrumental in order to update and revitalize an outdated programme of studies inserted in a stagnated vocational training system. The existing Health & Safety and Business & Entrepreneurship courses have been extended as planned, and the future courses are already a reality. These include several short courses, namely AutoCad, Start & Improve Your Green Construction Business (in collaboration with ILO) and PV Panel Installation & Maintenance, and a longer course on Elevator Technology. The content and schedule of the EcoCurriculum to be integrated into TPCTC’s current programme of studies has been developed through a number of workshops and is now ready for implementation. Therefore, it’s too soon to report on its impacts both for TPCTC and for the construction sector at large. Unfortunately, the EcoCard has not been implemented yet. Granted after completing a pre-established set of courses and meant to be continuously upgraded through further training, the idea was that the EcoCard would become a symbol of quality and sustainable concern among the whole construction sector in Zambia and would be endorsed by educational authorities at a national level. A concept note developed together by VTT and TPCTC has been disseminated to key stakeholders. ILO Office in Zambia has seen great potential in the idea and is willing to support its implementation. Since it depends on the validation and endorsement of Zambian stakeholders and authorities, the EcoCard is a very ambitious goal, somewhat exceeding the project’s capacity. However, the stakeholders consulted agreed that the idea should be put forward for discussion. The main change in relation to the Educational Curriculum has been the decision to replace the initially planned Manual of Good Practices by an OSH Manual adapted to the Zambian context. This decision followed a proposal by TPCTC after assessing the importance of OSH during the informative session organized at the Finnish Institute of Occupational Health as part of the abovementioned Summer Training
61

Course (Antuña et al., 2013). Due to the scale and the impact of the initiative, ILO Office has taken the lead of the task in order to mobilize all the key stakeholders nationwide. A number of workshops have taken place around the country to validate and improve the content developed. The first comprehensive draft is now ready for final validation. Business & Technology Development (R3) was perceived from the beginning as fundamental to secure the continuity of the positive transformation envisioned by EcoLusaka. One of the biggest challenges for this type of projects is to ensure the financial sustainability and long-term viability of the project results also after the end of the project. Therefore, the improvement of the existing Production Units (one attached to Carpentry & Joinery, and the other one to Power Electrical Engineering) so that they can sell products and execute contracts with the industry and the public administration is already helping TPCTC to generate further income in order to face those costs that cannot be covered with their small basic funding. The Strategic Business Plan (SBP) developed is meant to enable TPCTC to cover the rest of their needs through sponsorship, donation and partnership programmes. For this purpose, a pilot action called Open Day has been designed to increase TPCTC’s visibility and to strengthen their collaboration with the industry. The two editions of the Open Day held so far have been a tremendous success including a student competition, demonstration activities, and even a Demo House displaying several eco-efficient technologies (see Figure 6).
Figure 6 TPCTC students carrying the PV panels to be installed in the Demo House inaugurated during the
2nd
Open Day, May 2015 (Photo: TPCTC).
In addition, a website and a Facebook site have been created for TPCTC to improve their communication with the students and the stakeholders. The website is managed by VTT and will be transferred to TPCTC at the end of the project. The Facebook site is managed by TPCTC and has become very popular being constantly updated with news, announcements, pictures, etc. A new logo for the institution has been designed and used in all branding materials. However, the Water & Waste Management Plan has not been fully developed even though some actions have been carried out in practice, like cleaning the centre’s back yard and collecting the sawdust produced by the Carpentry & Joinery workshop to be sold outside. Electrical waste is separated also in the Power Electrical section, but a more comprehensive approach is needed that considers the whole waste management process in Lusaka, not only waste separation at source. A common problem in vocational training in Zambia is the lack of proper tools and equipment to carry out practical training. This seems usually to result in simply theoretical training which doesn’t suit the needs of the industry. Therefore, the improvement of Facility & Equipment (R4) has been one of the major outputs of EcoLusaka project. This is probably one of the results where TPCTC and their students have shown their deep commitment to the project, since the construction materials, tools and equipment were covered by the project budget, but the works have been carried out by the Staff with the help of the students. The Dissemination (R5) package has included various activities to raise the awareness among local stakeholders, and also to share the findings of the project (including this paper). The most recent one, a seminar and workshop titled “Creating a sustainable future for Zambia”, organized in collaboration with the University of Zambia and attended by 31 students from different study programmes and several Faculty
62

members. This event turned out to be a very valuable learning experience for the students according to the positive feedback received. A better understanding of job seeking practices and employment opportunities has been obtained through a series of semi-structured interviews with former and current TPCTC students and company representatives. The system developed for Monitoring job opportunities (R6) relies on a database that collects information about job seekers and job opportunities managed by TPCTC. A form available online from their website or in paper from the school was generated for former and current students to fill when seeking for job opportunities. The same database also collects information about jobs that companies offer to enable efficient job matching. The database has been established and is now being tested after a short training has been provided to TPCTC secretary by a VTT expert. For the moment, no exact information about the increased recruitment among the students due to more visibility (e.g. Open Day) and a more structured job seeking system is yet available.
5. Conclusion and next steps
Through VTT’s experience not only from EcoLusaka project, but also from others like EcoNBC project in Egypt (Hedman et al., 2013), it has been proved that capacity building should be included as a key component of any project of this nature and considered a condition for its success. This has been also corroborated by numerous stakeholders participating in various workshops facilitated by VTT in different parts of the world. It is important to develop effective facilitation processes that can support the local partners and other important stakeholders in the definition of the problem and the design of adequate solutions that will be accepted by the community. Identifying reliable and committed local partners is essential for a successful implementation. Once the right local partner (or partners) have been selected, it is necessary to empower them in a way that enables them to unlock their innovation potential in the best interest of the project, and ultimately of the sector or the country. Appropriate communication and trust-building are also of great importance for a fruitful cross-cultural collaboration, and the lack of those is certainly a big obstacle in the implementation of this type of projects. One of the success factors of this project has therefore been the fluent and efficient communication between VTT and TPCTC built at the outset of the project. One reason for this might be the open and respectful attitude of both partners since the beginning. In this type of collaboration it is important not to impose “Western solutions” to the African culture and context. Based on the experience from EcoLusaka, the local partner can come up with great and creative solutions if they just see examples and receive adequate guidance and support for their ideas. There is a need for local adaptation of the solutions proposed in terms of available materials and technologies, existing techniques, and appropriateness for the specific social, economic and environmental local conditions. This is not only necessary from a practical point of view to guarantee a successful implementation, but also perceived by the local partner as a sign of deep understanding and, moreover, of respect. Therefore, deepening the research around this subject may offer many opportunities for effective cooperation with the developing world. Although the long-term impacts of the project and its approach cannot be evaluated yet, since at the time this paper was written EcoLusaka is still ongoing, some short-term impacts can be observed, like an increased visibility of TPCTC leading to more partnerships with the industry and also to better opportunities for the students in terms of industrial attachments and job offers. The quality of the education provided has certainly improved, as well as the awareness among the Zambian stakeholders on the importance of sustainable construction. Based on the positive results so far, the Zambian Ministry of Education has expressed an interest in collaborating with VTT for the improvement of the Zambian Vocational Training & Education System as a whole.
6. Acknowledgements
Thanks very much to the Ministry for Foreign Affairs of Finland, the Embassy of Finland in Lusaka, ILO Office in Zambia, LBTC, NCC and, very especially, to TPCTC.
7. References
Antuña, C., Huovila, P., Chitenge, B, Mwansa, J. & Mwanza. K. (2013). EcoLusaka project: sustainable education of the construction sector in Lusaka, Zambia. African Newsletter on Occupational Health and Safety. Finnish Institute of Occupational Health. Vol. 23, No. 68-71, 2013. Government of Finland (2012). Finland’s Development Policy Programme. Government Decision-in-principle 16 February 2012. Ministry for Foreign Affairs, Unit for Development Communications. Hedman, Å., Huovila, P., Tuominen, P., Reda, F., Antuña, C., Jantunen, J., Pajula, T., ElMahgary, Y., El Shazly, A., Tawfik, A., Shahin, M., Hamza, A. & Gamal, M. (2013). EcoCity capacity building in NBC: a collaboration project between Finland and Egypt. Democratic Transition and Sustainable Communities: Overcoming Challenges Through Innovative Practical Solutions, Sustainable Building Conference, SB13 Cairo, 5-7 November 2013, Cairo, Egypt. Conference Proceedings.
63

Huovila, P. & Antuña Rozado, C. (2014). Sustainable community and neighbourhood regeneration and development. Experiences from the approach and implementation of VTT’s EcoCity concept. World Sustainable Building Conference, WSB14, 28-30 October 2014, Barcelona, Spain. Conference Proceedings. International Labour Organization, ILO. (2015). Green Jobs Programme. Available at: http://www.ilo.org/global/topics/green-jobs/WCMS_213842/lang--en/index.htm Last checked on 21.08.2015
64

REFLECTIONS FOR SUSTAINABILITY: CAPITALISING ON STAKEHOLDER ENGAGEMENT FOR OPTIMISING OUTCOMES
Usha IYER-RANIGA
1
Trivess MOORE 2
Ian RIDLEY 3 Mary Myla ANDAMON 4
1 SBiLab, School of Property, Construction and Project Management, RMIT University, Email: usha.iyer-
[email protected] 2 Centre for Urban Research, School of Global, Urban and Social Studies, RMIT University, Email:
[email protected] 3 SBiLab, School of Property, Construction and Project Management, RMIT University, Email:
[email protected] 4 SBiLab, School of Property, Construction and Project Management, RMIT University, Email:
[email protected] Keywords: Engagement, occupant satisfaction, post occupancy evaluation, sustainability, university.
Abstract Universities are under pressure to ‘walk the talk’ in relation to sustainability. They are expected to not just teach students about sustainable built environments, but to also put this into practice for university assets. This paper presents the challenges, opportunities and lessons learned from the process of building a best practice green building at an Australian university. The aim for the building was to develop a 5 Star Green Star design outcome, reflecting Australian best practice outcomes. A case study approach was used with stakeholders interviewed to understand if sustainability outcomes were considered to be front and centre of the project brief and to what extent these were realized two years post-occupancy. A total of 17 stakeholders were interviewed, in addition to post occupancy evaluations undertaken using a Building User Satisfaction (BUS) survey targeting building occupants. There were a number of challenges encountered, and the project and wider stakeholder user groups dealt with these in their stride. A number of formal and informal learnings from the project have already been identified, which the stakeholders have implemented in other projects both within and outside the university. A key finding was that engagement with the various user groups occupying the building was critical to high levels of satisfaction post occupancy. For the building community, this level of engagement is not always possible, particularly for speculative developments. However, engagement cannot be underestimated for owner occupied buildings that can greatly benefit from engaging with their occupants so as to improve their satisfaction.
1. Introduction
Building upon the first conference recognising the role of sustainability and the importance of sustainable development (1972 United Nations Conference on the Human Environment), the Rio Conference that took place in 1992 spurred worldwide action leading to the development of Agenda 21 (UNEP, 1992). Agenda 21, signed by more than 178 governments led to a multi scale, multi layered plan of action in every area of life where humans impact on the environment. It was in Section IV of the Agenda 21 document that education and capacity building were included as an important aspect of sustainable development. More recently, Rio+20 Conference in 2012 acknowledged that insufficient progress was being made with regard to sustainable development and education was specifically included in the “Future we want” document (UN, 2012). Education for youth, formal and informal education, cross cutting all themes were included in the document as quoted below.
234. We strongly encourage educational institutions to consider adopting good practices in sustainability management on their campuses and in their communities, with the active participation of, inter alia, students, teachers and local partners, and teaching sustainable development as an integrated component across disciplines.
235. We underscore the importance of supporting educational institutions, especially higher educational institutions in developing countries, to carry out research and innovation for sustainable development, including in the field of education, and to develop quality and innovative programmes, including entrepreneurship and business skills training, professional, technical and vocational training and lifelong learning, geared to bridging skills gaps for advancing national sustainable development objectives.
It is in this context, that this research paper is situated. The aim of this research is to understand the challenges, opportunities and lessons learned from the process of building a best practice green building at an Australian university. The green building was designed to achieve a 5 Star Green Star Education Design
65

rating, with the aim of representing best practice design intent of the building in the Australian voluntary best practice rating system. The aspiration for the building was to therefore, provide operational outcomes representing this best practice design intent. The objective in understanding the challenges and benefits of such a new building was to understand how triple bottom line (TBL) outcomes may be achieved for the university assets as a whole—both in terms of new build and refurbishments. In undertaking this research, the team took a mixed methods approach to understanding how TBL outcomes may be achieved for the University. It was critical to examine both the performance outcomes matching the Green Star design intent as well as the approach(es) taken by the design and construction team to fast track future projects to maximize TBL outcomes. The mixed method approach involved examining the energy and water use of the case study building (see Iyer-Raniga et al., 2015 for utility performance analysis). It also included Building User Satisfaction (BUS) surveys. This was undertaken to understand if efficient practices for reducing use of energy and water in the building were aligned with occupant satisfaction and productivity. Furthermore, interviews were undertaken with the internal and external stakeholders to understand the approach(es) taken by the wider design, construction, project management and property services stakeholders within the university and consultants as appropriate to understand the relationships between the various parties in working together in the design, construction and operation of such a building. The following section explores in further detail the requirement for universities to be engaging in sustainability, not only for their built assets but also through teaching. The research methodology, including information about the case study is then presented, before a discussion of the results and analysis and finally a conclusion summarising the papers findings.
2. Education ‘for’ and ‘about’ sustainability
Universities have been teaching education for sustainability for decades. However, the focus of the education has typically been on either including sustainability education as part of the curriculum either as another course or integrating sustainability education as part of existing courses. In recent years, the importance of sustainability traversing disciplinary borders is seen to be essential (Nomura & Abe, 2011, Ryan et al., 2010, Desha & Hargroves, 2014). Not just in the educational sector, the importance of graduates being equipped with a range of skills, including soft skills has been highlighted by organisations such as the World Bank (2012), echoing the outcomes of the “Future we want” document. There is still a gap between curriculum outcomes and graduate outcomes. Current approaches to integration of sustainability in the curriculum are not yet hitting the mark. Focusing on Australian built environment professions, Lyth et al. (2007) indicated that:
There were skills gaps and professional education for climate change adaptation was urgently needed.
Government leadership and setting clear benchmarks are required. Education for and about sustainability needs to be a part of the core program for built environment
professions. Competency standards in climate change adaptation and mitigation need to be set. Monitoring and feedback need to be undertaken.
Both formal and informal education for sustainability are seen to be valid. Sustainability concepts need to be taught over a range of spatial and temporal scales and a range of different cultural and disciplinary perspectives. Amongst a number of practical measures of the UN’s Sustainable Development Goals, action-oriented was considered to be a critical component, implying not just theoretical underpinnings but also practical applications. Sanusi et al (2011) state that universities have a special role to play in dealing with the challenge of sustainable development, and they need to focus not just on the educational aspects. Universities need to take a long term view rising above local issues and politics to determine the course of our direction towards a sustainable planet, while at the same time, adapting to meet these long term goals so as to be resilient. Not just in terms of teaching, but all aspects of university life from buildings on campuses, purchasing policies, landscaping and the like will need to espouse the values of sustainability. In a recent book by Tanaka and Tabucanon (2014), the editors state that universities are critical links for nurturing professionals possessing the skills and knowledge to cope in a world that is increasingly complex, transdisciplinary and where employment may occur across differing geographic borders, yet recognising the natural limitations of the planet. The role of higher education to transform the way knowledge is created and shared is therefore, becoming increasingly significant. They say, “in a way, it is imperative to redefine learning systems, processes and contents across formal and non-formal education sectors that support the creation of sustainable societies” (Tanaka & Tabucanon, 2014, p9). To bring sustainability thinking front and centre of built environment disciplines, there is a need to not just bring that knowledge in the foundational years of teaching programs, but also to ensure that sustainability thinking and practice is integrated into the curriculum over all the years of teaching so that it is reinforced as an essential graduate attribute. Authors such as Tilbury & Cooke (2005) and Tilbury & Mula (2009) have focused on moving away from knowledge ‘creation and transmission’ to the ‘application of knowledge’. This approach is perhaps, most critical in the built environment disciplines as there are tangible results to be seen and gained at the end of a project. Inculcating such approaches to teaching in the program enables graduates to build upon foundational knowledge of sustainability in practice. Hence, the shift from merely “teaching” to “demonstrating” sustainability outcomes in recent years across the globe. Therefore, since the various conferences on
66

sustainability and the measures outlined since then, the focus has shifted from education ‘for’ sustainability to education ‘about’ sustainability and pressures are now being put on educational institutions to move into the practice of simply teaching about sustainability to putting into practice. In undertaking design and construction of this new building at the University, there was no engagement with the building and construction school academics, post graduate students or relevant research staff. However, in the setting up of the stakeholder user groups, academic staff were consulted as ‘clients’. As teaching and learning spaces within the building were considered to be new generation teaching and learning spaces, in addition to academic staff; students and other teaching and learning staff were also consulted. This consultation was undertaken in the form of stakeholder user groups (SUGs). While the university had overall goals of meeting sustainability targets, the relevant department tasked with meeting these targets focused on the ‘new building’, not on the ‘processes to achieve this new building’.
3. Research Methodology
Like many Australian Universities, RMIT University is committed to improving sustainability across all areas of activities including teaching and asset management. For example RMIT University strives to ensure that all university graduates are environmentally literate, and have the awareness and understanding to be ecologically responsible citizens, as per the context discussed above. RMIT University has made a commitment to reduce greenhouse gas emissions by 25% by 2020, from a 2007 baseline. A large part of achieving this outcome is through the development (or improvement) of sustainable built environment assets. In recent years, RMIT University has made progress towards this goal with a number of innovative and sustainable new buildings, which also deliver enhanced teaching and learning experiences for staff and students, and act as demonstrations of sustainability for students. While some of these buildings have received wider building and university sector recognition for their sustainability outcomes from a theoretical perspective, there has been no evaluation of these buildings to see how they were performing in reality. Post the construction of the Swanston Academic Building (SAB) therefore, the research team developed a proposal to undertake a detailed evaluation of the SAB with funding support from the RMIT University Sustainability Committee. The aim of the evaluation was to identify TBL learnings and opportunities from the SAB that can be applied across the University for all its new and refurbished assets. SAB is a $182 million, 12 level, 35,000m2 innovative learning and teaching facility with capacity for 6,000 students and office accommodation for 850 staff (Figure 1). In terms of sustainability outcomes, the building achieved a 5 Star Green Star design rating, and at the time was one of the first Australian University buildings to undertake the Green Building Council of Australia’s Education building rating. In this regard it was a pilot test, not only for RMIT University but all stakeholders involved, in applying the new sustainability rating framework under Green Star Education. The tool is used to assess the environmental attributes of new or refurbished education buildings across a range of criteria including indoor environmental quality, energy, water, transport and ecology. It can be applied in the design phase and up to two years from practical completion for a design rating or design and as-built rating. The SAB project achieved a design only rating and as such was not awarded a rating based upon the actual occupation of the building. There are also cost implications to be considered for getting an as-built rating. Other key highlights of the building and process include:
Design to engage next generation of teaching, learning and students, Creating a vertical campus, Using a design and construct guaranteed maximum price contract, Completion achieved 108 days (one teaching semester) ahead of schedule, Delivered $3.4 million under budget, Innovative design (including natural ventilation in parts) and materials (e.g. façade).
In recognition of the positive innovation and design outcomes, the SAB received a number of awards and wider recognition including (all awarded in 2013):
Australian Construction Achievement Award. Victorian Public Architecture Award. National Public Architecture Award. Victorian Premier’s Sustainability Award - Infrastructure and Buildings. Shortlisted World Building of the Year Award. Property Council of Australia's Innovation and Excellence Awards - Victorian Development of the
Year. Property Council of Australia's Innovation and Excellence Awards - John Holland Award for Best
Public Building.
67

Figure 1 External and internal photos of SAB. Source: RMIT University, Photographers: John Gollings and
Margund Sallowsky.
The evaluation was undertaken through two main methods: a Post Occupancy Evaluation (POE) and stakeholder interviews. The POE included the measured utility data of the building, and the occupant satisfaction levels through the BUS survey.
Post Occupancy Evaluation
An international standardised Building User Satisfaction (BUS) survey was undertaken in March 2014 for staff and higher degree by research students located in the SAB. The BUS is a three page survey containing sections on thermal comfort, noise, air quality, space and general amenities and takes approximately 10 minutes to compete. The BUS survey has been used on over 700 office POE studies. It is internationally recognised, with over 30 years of use, and allows the performance of the case study to be benchmarked against international buildings. The survey was distributed to all staff and higher degree by research students located in the SAB via email and then followed up one month later with a paper based reminder for those who had not completed the survey. The response for the BUS survey was 150 out of 689 staff and full time higher degree by research students, a response rate of 20%. Data from the survey was cross-checked with the performance analysis and stakeholder interviews to triangulate outcomes. Analysis of how the building was performing in terms of utility consumption and thermal comfort measurements was also undertaken, but is not reported in this paper. That analysis has been reported elsewhere (Iyer-Raniga et al., 2015).
Stakeholder interviews
Interviews were undertaken with 17 key internal and external stakeholders involved in the design, construction and/or occupation of the SAB including the project manager, builder, architect, Environmentally Sustainable Design (ESD) engineer, building facilities manager, and senior managers, advisors, directors and student representatives from within RMIT University Property Services and the School which predominantly occupies the building. Interviewees were identified by RMIT University Property Services as key people who had been, or continued to be, involved in the SAB development. The semi-structured interviews took about one hour and were conducted from April 2014 to February 2015 at the interviewee’s place of work or at RMIT University. Interview questions focused on the broad themes of: what worked well during the project, what the challenges were and what the interviewees thought the lessons for future projects were. Interviews were audio recorded and transcribed. Care was taken to reduce weaknesses of interviews such as interviewer bias, through techniques such as repeating key questions in different ways throughout the interview to allow answers to be correlated. Drawing upon these two main methods allowed for a more detailed, robust and holistic evaluation of the building. It also allowed a triangulation of data between the utility analysis, occupant survey and stakeholder interviews. Key similarities or differences between data sets were able to be identified and explored in further detail to understand why that was the case. For example analysis of the thermal performance of the dwelling allowed the questions about thermal comfort in the BUS survey to be put into context. Without this triangulation of data, the evaluation would have been incomplete, and could potentially have led to outcomes and recommendations, which did not match reality. Many evaluations of buildings tend to focus on one or two elements (e.g. utility performance or occupant feedback) due to limited time and resources. This project was afforded the time and resources to undertake the more detailed evaluation as it was to be used to inform the future development and renovation of the RMIT University stock, so the university was keen to get as much detailed information as possible.
4. Findings and Discussion
4.1 Building User Satisfaction survey
The main findings of the BUS survey are summarized in Figure 2 across 12 key variables. The results are presented in terms of a green marker (excellent performance), an orange marker (average performance) or a red marker (poor performance) based upon an international benchmark dataset. The SAB performed excellently in three categories: overall comfort, design and image to visitors. The building performed
68
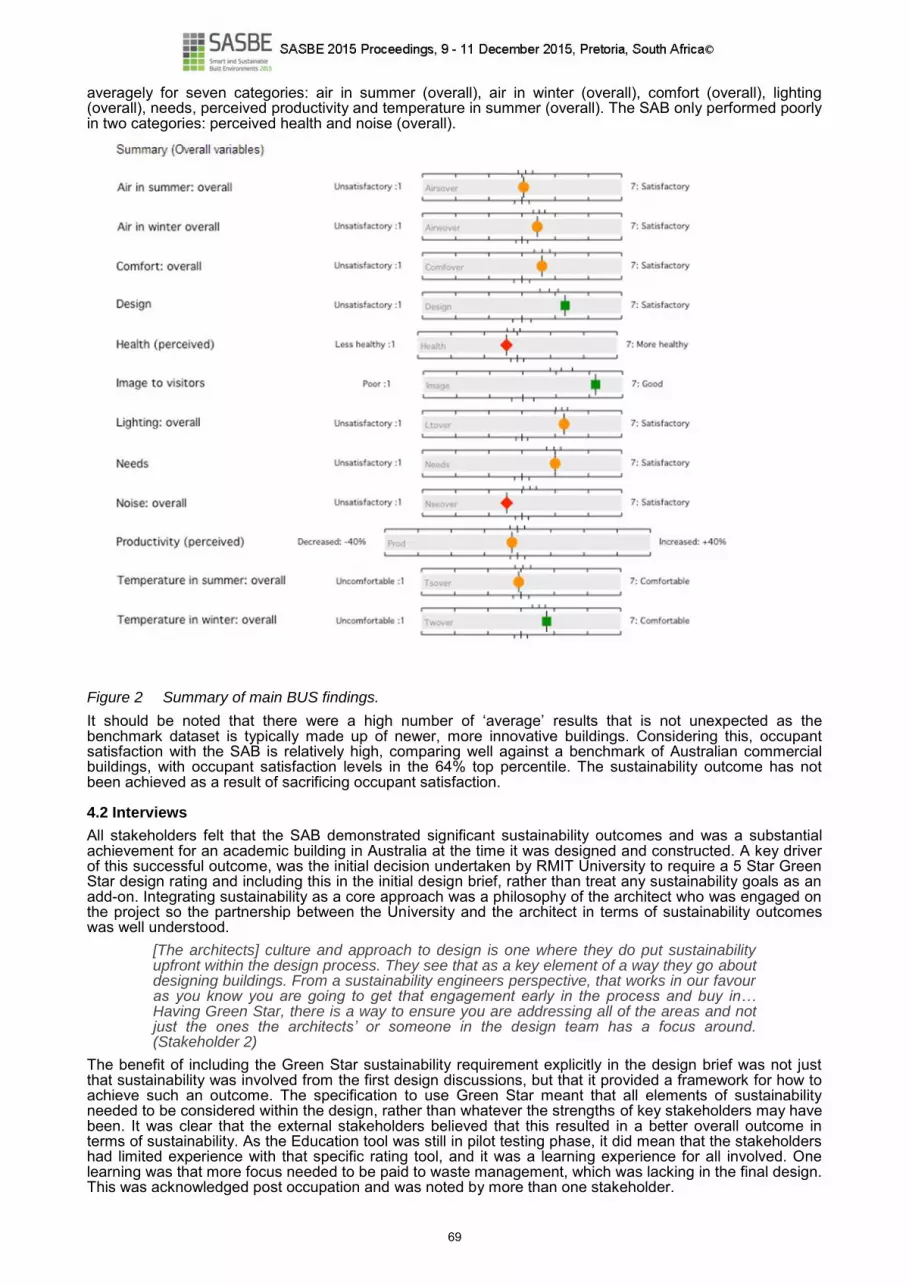
averagely for seven categories: air in summer (overall), air in winter (overall), comfort (overall), lighting (overall), needs, perceived productivity and temperature in summer (overall). The SAB only performed poorly in two categories: perceived health and noise (overall).
Figure 2 Summary of main BUS findings.
It should be noted that there were a high number of ‘average’ results that is not unexpected as the benchmark dataset is typically made up of newer, more innovative buildings. Considering this, occupant satisfaction with the SAB is relatively high, comparing well against a benchmark of Australian commercial buildings, with occupant satisfaction levels in the 64% top percentile. The sustainability outcome has not been achieved as a result of sacrificing occupant satisfaction.
4.2 Interviews
All stakeholders felt that the SAB demonstrated significant sustainability outcomes and was a substantial achievement for an academic building in Australia at the time it was designed and constructed. A key driver of this successful outcome, was the initial decision undertaken by RMIT University to require a 5 Star Green Star design rating and including this in the initial design brief, rather than treat any sustainability goals as an add-on. Integrating sustainability as a core approach was a philosophy of the architect who was engaged on the project so the partnership between the University and the architect in terms of sustainability outcomes was well understood.
[The architects] culture and approach to design is one where they do put sustainability upfront within the design process. They see that as a key element of a way they go about designing buildings. From a sustainability engineers perspective, that works in our favour as you know you are going to get that engagement early in the process and buy in… Having Green Star, there is a way to ensure you are addressing all of the areas and not just the ones the architects’ or someone in the design team has a focus around. (Stakeholder 2)
The benefit of including the Green Star sustainability requirement explicitly in the design brief was not just that sustainability was involved from the first design discussions, but that it provided a framework for how to achieve such an outcome. The specification to use Green Star meant that all elements of sustainability needed to be considered within the design, rather than whatever the strengths of key stakeholders may have been. It was clear that the external stakeholders believed that this resulted in a better overall outcome in terms of sustainability. As the Education tool was still in pilot testing phase, it did mean that the stakeholders had limited experience with that specific rating tool, and it was a learning experience for all involved. One learning was that more focus needed to be paid to waste management, which was lacking in the final design. This was acknowledged post occupation and was noted by more than one stakeholder.
69

RMIT University Property Services have learnt from this experience and are in the process of integrating a number of outcomes regarding design into the revision of the RMIT University Design Guidelines, such as where and when to seek a Green Star rating and moving to through-life considerations about upfront and operational costs as well as how well different materials/technologies last.
If you don’t get the design right… the operational impacts are huge; they’re massive. (Stakeholder 3)
Another difference identified by both internal and external stakeholders from the SAB project compared to other developments was that key stakeholders were engaged by the architect earlier in the project than typically occurs. This meant there was the opportunity for all stakeholders to have more influence on design outcomes and the overall process was more collaborative than otherwise might have been. This engagement included the development of stakeholder user groups (SUGs) for the various users of SAB. This engagement was driven by the architect in conjunction with RMIT University and identified as an innovation, not typically the norm on other projects. However, there were several reasons behind the SUGs. Firstly, it was such a large and complex project that the design needed to cater for a large range of occupant needs, not only for the current building and occupant outcomes, but into the future. The SUGs therefore provided advice about what the different groups required and wanted from the building. Secondly, it ensured buy-in from all user groups of the building. Once buy-in was achieved, it made the process of design and ultimately the cultural change RMIT University was aiming to achieve an easier transition for the users of the building. This buy-in was from the top senior manager—the Vice Chancellor; down across all the management structures at RMIT University. The architect said that it was not always the case for developments that there was buy-in from the very top. Having this buy-in from the top made a significant difference to what was able to be delivered and achieved for SAB. Furthermore, aligned with the most senior level of management support, the active support of the Pro Vice Chancellor Business was raised by several stakeholders as critical for not only driving the project, but gaining wider RMIT University stakeholder engagement. However, while there was buy-in across various levels of RMIT University governance, there were significant challenges around the consistent engagement, or lack of, from RMIT University Property Services at times throughout the different phases of the project (discussed further throughout the analysis).
It’s good to allow people the opportunity to comment and allow buy-in…especially when you are using architecture to drive cultural change, which this building is doing. (Stakeholder 4)
That was a very pleasing experience to actually engage in a dialogue with the architects and with some project management people. (Stakeholder 7)
Part of the engagement with the RMIT University community was through a detailed survey about what types of teaching and learning spaces staff would like to teach in for their courses, noting the strategic decision by the university to innovate these spaces. The architect developed a range of different teaching and learning spaces (~40 different spaces) and requested feedback from potential SAB users (staff) about what suited their requirements. The architect stated that this engagement process allowed for a 10% reduction in floor plate through more effective selection of spaces. The survey of space preferences with staff was undertaken in conjunction with RMIT University time-tabling developing a mock virtual timetable which helped to identify utilisation of spaces, not only in the immediate term but into the future based upon various growth (or contraction) scenarios. This was a key innovation in the project both from the RMIT University perspective but also across the wider university sector in Australia. The use of a virtual time-table has been picked up by other universities around Australia now after the approach was presented through various forums such as conferences and papers by Property Services staff. Stakeholder 9 stated that the alignment of space and utilisation matched so well in the end because the timetabling and space management teams are physically situated near to each other—this is not always the case at universities. This was particularly important when quick data was required during the design phase where RMIT University were still deciding on what school or schools to locate in SAB and the different implications had to be explored.
At $6,000 per m2, if you can save a couple of classrooms that saves you a lot of money.
(Stakeholder 9)
The architect added that they felt that signing the builder up for two years to manage the building post construction meant that a higher quality of care and finish was applied to the building during construction and therefore, more care applied to get the building completed with high quality standard of construction. The feedback during the first couple of years of occupancy to fine tune the building therefore, is a very novel and innovative approach that put this project well ahead of its time. This was also recognised within RMIT University.
That put them on the hook for a lot of the design outcomes as they had to manage the building for a period of time. (Stakeholder 10)
We got a good outcome that [the builder] were building it knowing they were going to be operating it. So that did put a level of check in that. (Stakeholder 16)
70

Another successful outcome from the development was the engagement with staff and students to prepare them for the transition to the new building. There was some mixed information with regards to who drove this change. Overall it was clear that this was one area where RMIT University Property Services had room for improvement in the context of planning how to, or when to, undertake this task. This task was meant to be undertaken by one of the SUGs, who had an initial aim to address building management when the building was occupied. However the group was full of Property Services staff, who were supposedly more focused on timetabling and how to move classes from the previously occupied building to SAB. Key stakeholders from the College of Business felt that the actual day to day operation in the building was overlooked, a point which was disputed by Property Services stakeholders, and that action was required. Whether Property Services was in fact beginning a change management approach is questionable. In the end, it appears that a small team within the College of Business (and in particular one key person) undertook the initiative to fill this gap by acting as an academic/professional champion and developing the Academic Development Group to help steer the change management of staff. This was a challenge from many respects but the main challenge was providing the information and education to staff about the cultural change that the new building was to deliver, particularly though the innovative teaching and learning spaces. The work that this key person/champion and their team did to ensure that the staff were ready to utilise the spaces in SAB was recognised across many of the stakeholders, including the external stakeholders (e.g. the architects, project manager) as being a key reason why building users were able to embrace the building from day one of occupation.
A gap from other buildings had been that while the building technically had been delivered very well the actual occupation and transition into the building was something which was sometimes a bit lacking. (Stakeholder 5)
The work that [X] and [their] group did with bringing users on board was great. (Stakeholder 3)
This work involved the development of significant PD (Professional Development), activities to engage staff and prepare them for the transition. Part of this involved the key champion developing their own reference group made up of academics from the College of Business to work through the challenges of the transition. Initially the group was to meet every three months but ended up becoming weekly meetings to meet a need for currency, communication and information about various issues associated with the SAB. Despite this work, it was stated by several stakeholders that there needed to be an earlier focus on the process of the staff transition and changes staff were expected to go through. There did not appear to be any formal plan for this from RMIT Property Services until this key champion took the initiative, although Property Services stakeholders suggested that they were working on this change management transition. This was a significant challenge as it involved cultural change for teaching and learning and changing default pedagogies, and had to be conducted within a short time-frame with limited resources. Since this process of change management was not planned sufficiently for, the champion had to learn the best way to plan and manage the change process. As indicated clearly from the quote provided below, lack of skills did not stop the champion from holding back. This champion focused on the end game, and did ‘what needed to be done to achieve this’. This person was focused on outcomes to be achieved and therefore, focused on the best way to achieve outcomes. Additionally, there were no set resources to assist with the professional development work, although a small grant was obtained at a later stage. The lack of any allocated resources from RMIT University Property Services was a major issue impacting on the ability of the champion to engage all staff with the professional development material. While Property Services stakeholders spoke of playing a larger role in the change management process than the College of Business stakeholders identified, it was clear that either more work was needed to be done by Property Services, or there needed to be clearer communications about what they were doing, or had done with regards to change management. This is an area that Property Services say they have learnt from and developed formal process for change management.
I realise that it did all come down to me and my team and what we were going to have to do was to develop a process to change people’s behaviour…I had to prepare people as best I could without having many resources. (Stakeholder 7)
To help educate staff and students about the building, a number of site walk-throughs were organised towards the end of construction phase. The purpose of these walk throughs was to familiarise staff and students with the building and how things were to operate so that come the first day (the building was open), there would be an understanding of what was required to make the building function. This built upon the work done with the prototype teaching, learning and offices spaces developed earlier in the project. The proof of the general success of this staff PD is evident when on the first day when staff moved into the building, was also the first day of classes in the building and there were few reports of staff who could not cope at all with the transition. As will be explored further below, there remains an ongoing challenge ensuring staff remain educated on how to use the building.
4.3 What were the key challenges?
There were a number of other key challenges relating to the design, construction and occupation of the SAB. While some of these were identified at the time, others have emerged in hindsight. A summary of key challenges are presented below:
The sheer scale of what was being attempted – at the time the largest innovative teaching and learning development in Australia.
71

How to future proof the building for changing pedagogies and staff requirements? Getting the balance of various room sizes right for current and future requirements. Some flexibility
was built into larger rooms to allow them to be made smaller in the future. With such a focus on innovation in the teaching and learning spaces, it was felt that the office areas
were overlooked and should have been more innovative. The building required a significant IT development program across the university to allow moving to
Bring Your Own Device (BYOD) outcomes. While communication between the key stakeholders was raised helping ensure efficient and
effective project outcomes, communication from RMIT University to various stakeholders was strongly criticised as being ad-hoc and limited in terms of detail.
It was a challenge to get the staff to ‘buy into’ the different requirements for teaching and learning that were implemented in the building.
Initial challenges around engaging the SUGs took longer to get going than was planned. No central repository to capture IP associated with the SAB within RMIT University.
5. Conclusion and Further Research
Universities have a key role to play in the transition to an environmentally sustainable future. This is both from the perspective of improving the environmental performance of their built assets and also through their position as teachers of the next generation of workers and innovators. RMIT University took this very seriously; it is documented in the Strategic Plan. In this context not just RMIT, but universities as whole, are bridging the gap between these two requirements by starting to use improvements to their built assets as part of the ‘active’ teaching and learning process to engage students with core principles of sustainability. While there has been significant progress in recent years from various Australian universities in terms of improving the environmental performance of their built assets, there has been limited evaluation of these developments to determine if outcomes have matched ambitions. This paper presents a holistic evaluation of an innovative 5 star Green Star university building in Melbourne Australia. The building, which was completed in 2012, was evaluated after the first two years of occupancy to explore the challenges, opportunities and lessons learned from the process inform future developments for RMIT University and the academic and building sector more broadly. The evaluation included undertaking a post occupancy evaluation which analysed measured utility data against predicted performance models and conducting a BUS survey with building occupants. In addition interviews with 17 key internal and external stakeholders were conducted. The BUS survey revealed that the building performed excellently in three categories: overall comfort, design and image to visitors but poorly in two categories: perceived health and noise (overall). Overall the building was well received by occupants, with satisfaction levels in the 64% top percentile. The stakeholder interviews helped in understanding the processes need to achieve outcomes for the designed building. It raised key lessons around ensuring that sustainability goals are integrated as core concepts in design briefs and that external stakeholder’s share the same philosophical sustainability viewpoint. The use of SUGs helped to ensure the building delivered space which generally met user requirements and led to high satisfaction levels and resulted in a reduced floor area saving significant capital costs. While there were many positive aspects to the process, one area for further attention is, the need to focus on managing change for staff and students. Getting the building right is important, but if users are not engaged with the changes, then this can negate some of the benefits of the sustainable building. Furthermore, there was a missed opportunity to involve students in the development and construction of this building through a more formal link to teaching outcomes, although some courses do draw upon the SAB and present it as a case study in practice since its completion. While high levels of engagement might not always be possible across the broader building industry, the results from this evaluation demonstrate that improved engagement can improve design and occupancy outcomes. Therefore, every development should seek to engage with potential occupants to ensure sustainable outcomes can be achieved. This should be done as early in the conception and design phase as possible and include the opportunity for input from a cross section of building users and wider stakeholders to ensure the most benefit can be obtained, especially if the building is being used to drive cultural or environmental sustainability change. This requires mapping of key stakeholders by the client or design team and then engaging these stakeholders in appropriate methods. It may be through the formation of user groups as with SAB, or it may be through other ways depending on the project and desired outcomes. Allowing for this engagement can help to identify building design and construction efficiencies as well as reduce dissatisfaction later on from users or other stakeholders. In terms of further research, the next steps are to undertake these more holistic building evaluations across other academic buildings, both at RMIT University and the broader Australian academic sector, so that a more detailed case book of evidence about challenges, lessons and solutions can be developed and drawn, not only for future academic, but also other owner-occupied developments.
6. Acknowledgement
The authors thank RMIT University Property Services for their funding and support of the research presented in this paper, in particular, Linda Stephenson, Senior Sustainability Advisor. The authors also thank the stakeholders for their time in undertaking interviews.
7. References
Desha, C.J. & Hargroves, K. 2014. Higher Education and Sustainable Development, London, Routledge.
72

Iyer-Raninga, U., Moore, T., Kashyap, K., Ridley, I. & Aandamon, M. M. 2015. Beyond buildings: holistic sustainable outcomes for university buildings. 15th International Australasian Campuses Towards Sustainability (21-23 October). Deakin University. Geelong, Victoria: Deakin University. Lyth, A., Nichols, S. & Tilbury, D. 2007. Shifting Towards Sustainability: Education for climate change adaptation in the built environment sector. A Report for the Australian Government Department of the Environment, Water, Heritage and the Arts (DEWHA). Sydney, NSW: The Australian Research Institute in Education for Sustainability (ARIES). Nomura, K. & Abe, O. 2011. Sustainability and Higher Education in Asia and the Pacific [Online]. Global University Network for Innovation. Available: http://www.guninetwork.org/resources/he-articles/sustainability-and-higher-education-in-asia-and-the-pacific [Accessed 30 July 2012 2012]. Ryan, A., Tilbury, D., Corcoran, P. B., Abe, O. & Nomura, K. 2010. Sustainability in higher education in the Asia-Pacific: developments, challenges, and prospects. International Journal of Sustainability in Higher Education, 11, 106-119. Sanusi, Z. A., Steele, R., Khelghat-Doost, H., Jegatesen, G. & Rosli, H. (eds.) 2011. Education for Sustainable Development: Issues, Principles and Practices for Global Application: United Nations University - Promotion of Sustainability in Postgraduate Education and Research (UNU-ProSPER.Net). Tanaka, A. & Tabucanon, M. T. 2014. ProSPER.Net: Transforming Higher Education and Creating Sustainable Societies. Yokohama, Japan: United Nations University - Institute of Advanced Studies (UNU-IAS). Tilbury, D. & Cooke, K. 2005. A National Review of Environmental Education and its Contribution to Sustainability in Australia: Frameworks for Sustainability. Canberra, ACT: Australian Government Department of the Environment and Heritage (DEH) and the Australian Research Institute in Education for Sustainability (ARIES). Tilbury, D. & Mula, I. 2009. Review of Education for Sustainable Development Policies from a Cultural Diversity and Intercultural Dialogue: Gaps and Opportunities for Future Action. Paris: United Nations Education, Scientific and Cultural Organization (UNESCO). UN. 2012. The Future We Want: Outcome document adopted at Rio+20 [Online]. United Nations Web Services Section, Department of Public Information. Available: http://www.un.org/en/sustainablefuture/ [Accessed 2 August 2015 2015]. UNEP 1992. Earth Summit Agenda 21. UN Conference on Environment and Development (UNCED). 23 April 1993 ed. Rio de Janeiro: United Nations Environment Programme (UNEP). WORLD BANK 2012. Putting Higher Education to Work: Skills and Research for Growth in East Asia (The World Bank East Asia and Pacific Regional Report). Washington, D.C.: The International Bank for Reconstruction and Development / The World Bank.
73

74

PERFORMANCE QUANTIFICATION OF BUILDING TECHNOLOGIES WITHIN THE SOUTH AFRICAN CLIMATIC REGIONS
Elsje C. BALZUN 1
Dirk C.U. CONRADIE 2
1 CSIR, Built Environment, Email: [email protected] 2 CSIR, Built Environment, Email: [email protected] Keywords: Climatic map, climatic regions, innovative building technologies, predictive building performance
Abstract
Developing countries’ advancement necessitates the construction of residential and social infrastructure at an ever-increasing rate. The progression should not only consider the rate of growth, but also the efficiency of the structures within its climatic context, to optimise occupant thermal comfort and alleviate energy consumption. Masonry building is predominantly used within South Africa, even though there are various certified innovative building technologies (IBT’s) available. A misconception exists within South Africa that IBT’s (certified building systems excluding masonry) have inferior overall performance to that of masonry building. The Decision Support Model for Innovative Building Technologies is a software tool which addresses this misconception, and assists planners and designers to select an appropriate building system for the climatic context and region of the proposed site. The newly developed CSIR Köppen-Geiger climatic map (14 climatic zones as opposed to the six-zone model of SANS 204) of South Africa was used in the Decision Support Model for Innovative Building Technologies to allow for a comprehensive understanding of the particular climate of the proposed site. A virtual model was created, and correlated to that of a measured notional building to ensure accuracy of the simulated data. Weather files were created for each of the identified Köppen-Geiger climatic regions as well as virtual models of each representative IBT and masonry building system. The various virtual models were simulated within each of the climatic regions to determine each system’s thermal performance. Constants (measured in kW/h) were derived from the simulations, and formed the quantitative segment of the software. The Agrément certification of each system was evaluated and graded qualitatively on a five point scale. This allows the user to evaluate the energy requirement, durability, acoustic performance, condensation and fire performance of the proposed building system. In conclusion, the software authoratively predicts the performance of each building system. It equips the user to select a warranted resolution/s for the proposed site, whether it be an IBT system or masonry construction, consequentially ensuring the design of comfortable and energy-efficient buildings within South Africa’s diverse climate.
1. Introduction
A building should enable the building occupants to conduct activities without the hindrance and/ or restrictions of the environment. This can be attained by adequate planning, functionality and durability of the building. Each component, including materials and services, should contribute to the over-all performance of the structure. It is therefore important to predict a building’s likely performance with regards aspects such as energy use, whilst providing a comfortable thermal environment for the building occupants. According to Van Straaten (1967) there are three primary aspects to consider when investigating the thermal performance in the design of a building within South Africa. Firstly, an assessment should be conducted to determine optimal interior conditions which are favourable for the health, safety, comfort and overall well-being of the occupant. Secondly, climatic conditions should be considered to enable an optimal design which best suits the distinct conditions of the region. Lastly, the physical properties of structural elements used and the design strategy should enable optimal control of the interior environment. The Decision Support Model for Innovative Building Technologies software was developed to provide an answer to the complex question of which building technology (IBT) would be appropriate for specific locations in South Africa. Along with other performance metrics the characteristics of the specific climate is very important. The objective of the research was to create a multi criteria decision support software that is easy to use by architects and designers to assess the suitability of various IBT’s in different locations. The research aim was to analyse the characteristics of 27 different IBT’s with regards thermal performance in specific climatic regions, building performance metrics (five factors) and construction supply chain management (five factors). The first step of the research was to quantify the South African climate by the development of a detailed new Köppen-Geiger climatic map of South Africa that delineated the different climatic regions. The second step was to build thermal performance models of 27 IBT’s currently available in South Africa and by means of predictive building simulation to determine their performance in the 14 Köppen-Geiger climatic regions found in South Africa.
75

2. Climatic classification
2.1 South African National Standards – SANS 204 and 10400XA
The current climatic classification in South Africa (Figure 1) is in the South African National Standard 204: Energy Efficiency in Buildings (SANS 204). This classification recognizes only six climatic zones. Each of the climate zones have representative tables which provide the solar exposure factors as well as the coefficients regarding overhang/ height (P/H) factors for the eight orientations stipulated in SANS 204 (SANS 204:2011). This classification enables basic climatic responsive design and attempts to regulate the maximum allowable energy consumption, demand and orientation of various building typologies.
Figure 1 Climatic zones of South Africa as per SANS 204:2011
It became evident during an analysis of this map and the standard that it is inadequate to optimally support passive design and the performance of different building technologies within different climatic regions. Accurate building performance requires the use of predictive building computational performance (simulation software). In addition simulation software also requires a comprehensive array of climatic data, which the SANS 204 climatic zones do not provide (Conradie et al., 2012a).
2.2 Köppen-Geiger climate classification
The first quantitative climatic classification was completed by Waldimir Köppen in 1900. Rudolf Geiger elaborated the map in 1961. More recently, in 2005, Austrian researchers produced a contemporary version of the Köppen-Geiger map (Kottek et al., 2006). The Köppen-Geiger type of climatic map is after more than a century still the prevailing and most extensively used map. In modern climatic work it is often used to map predicted climate change using different scenarios. The climate of a region refers to the development of weather conditions which are prevalent to an area for a duration such as 30 years (Conradie, 2014).
2.2.1 Classification of the Köppen-Geiger climatic map Köppen initially classified climatic regions in accordance with vegetation, as natural plant species are good indicators of climatic domains. The grouping was done according to the vegetation classification of the botanist, De Candolle (Kottek et al., 2006). The various zones were labelled alphabetically, those being: “A” - equatorial zone, “B” – arid zone, “C” – warm temperate zone, “D” – snow zone and “E” – polar zone A second and third letter was added by Köppen to the zone classification of De Candolle, to allow for a refined categorisation. The second letter represents the precipitation of the specified region, and the third letter indicates the temperature. Köppen combined the letters as described above, to define the various climatic regions of the world. The Council for Scientific and Industrial Research (CSIR) created a new Köppen-Geiger climatic map to accurately classify the climatic regions of South Africa, to support passive design and also the performance of different building technologies. The Köppen-Geiger climatic zones found in South Africa are outlined in Table 2 and illustrated in Figure 2.
76

Table 1 Köppen-Geiger categories (Conradie et al., 2012b)
Main climates Precipitation Temperature
Symbol Description Symbol Description Symbol Description
A Equatorial W Desert h Hot arid
B Arid S Steppe k Cold arid
C Warm temperate f Fully humid a Hot summer
D Snow s Summer dry b Warm summer
E Polar w Winter dry c Cool summer
m Monsoonal d Extremely continental
F Polar frost
T Polar tundra
Table 2 Köppen-Geiger climatic zones of South Africa
Colour code Type Description
Aw Equatorial, Winter dry
BWh Arid, Desert, Hot arid
BWk Arid, Desert, Cold arid
BSh Arid, Steppe, Hot arid
BSk Arid, Steppe, Cold arid
Csa Warm temperate, Summer dry, Hot summer
Csb Warm temperate, Summer dry, Warm summer
Cwa Warm temperate, Winter dry, Hot summer
Cwb Warm temperate, Winter dry, Warm summer
Cwc Warm temperate, Winter dry, Cool summer
Cfa Warm temperate, Fully humid, Hot summer
Cfb Warm temperate, Fully humid, Warm summer
Cfc Warm temperate, Fully humid Cool summer
.
Figure 2 CSIR Köppen-Geiger map of South Africa (Conradie et al., 2012a), modified by author
77

To address the shortcomings of abovementioned climatic map it was decided to create a new high resolution Köppen-Geiger climatic map using the formulas as described by Rubel et al. (2010) (Figure 2). Comprehensive (1 km x 1 km resolution) historic climatic data of 20 year’s temperature and precipitation was obtained from the South African Agricultural Research Council. The climatic map was created by means of the ArcMap GIS software, using the formulas as defined by Kottek (2006) (Conradie, 2012). The map provided a method to group cities and towns within similar climatic regions. In addition detailed weather files, obtained from the Meteonorm software, were used to run the detailed thermal simulations of the different IBT’s. The CSIR Köppen-Geiger map was inter alia developed to assist building designers to define building design strategies during the early design stages. This facilitates decision-support to create climatic responsive structures that use less energy and is thermally comfortable to the end-user. The climatic classification map was also utilised by the CSIR to study the prospective use of bioclimatic design tools to address the question of climatic responsive design.
3. Classification of Innovative Building Technologies (IBT’s) systems
The next research step was to classify the different IBT’s into groups of similar characteristics to facilitate detailed performance analysis. Within the context of this paper an IBT refers to a building system which has been certified by Agrément South African certification board. Furthermore the term IBT excludes masonry, which is currently predominantly used within the South African building sector. A misconception exists within South Africa that IBT’s are inferior when compared to masonry construction and that heavy weight construction is preferable due to the thermal mass it provides. The use of appropriate building structures and methods are neglected in social infrastructure, such as schools. Schools do not generally make use of air conditioning and appropriate building system selection is therefore imperative. The appropriate selection could advance the thermal performance and palpable thermal comfort of the building.
3.1 IBT classification
The holistic performance of a building system is important when selecting a building system. Each building system’s performance that includes factors such as thermal, condensation and durability differs significantly within the various climatic regions. Each climatic region poses different challenges. The IBT classification was developed to enable the quantification of various systems’ thermal and structural performance. The systems were categorised according to their technical composition. A quantative and qualitative investigation was conducted on each of the systems’ superstructure. Thermal simulation modelling was performed on the representative systems (Table 3 – highlighted in green) of each of the categories. Due to time and budget constraints the representative system’s findings were applied to the sub-group of each category. The categories were labelled alphabetically from “A” to “G”, ranging from light weight to heavy weight construction.
Table 3 Categorisation of IBT systems
Classification label Category Name of building system
A Light building system (LBS) with steel structural frame
Vela building system Amsa building system Alternative steel building system FSM building system Space frame building System
B Light building system (LBS) with structural steel frame and insulated foundations
Imison 3 building system Imison stud building system
C Light building system (LBS) with panels and light weight concrete
Goldflex 800 building system Goldflex 100 building system Goldflex 800 seismic building system
D Hybrid building system (HBS)
Automapolyblok building system Aruba building system Blast building system Insulated concrete panel building system Rapidwall building system Styrox building system
E Heavy weight building system (HWBS) with panels and dense concrete
Banbric building system Robust building system
F Heavy weight building system (HWBS) with building blocks
BESA 2 building system Hydroform building system Izoblock building system
G Masonry construction Masonry
The table above designates the categorisation and selection of building systems that were implemented within the Decision Support Model for IBT’s software.
4. Thermal performance simulations
Simulation software requires reliable and detailed climatic data to perform a quantified building performance analysis. There is still a lack of usable weather data (e.g. tmy. tmy2 and iwec) in South Africa, which is widely available in the USA. In the interim the Meteonorm software was used in this project to create weather files. This weather data is essential to inform and support climatic responsive design. The creation
78

of the CSIR Köppen-Geiger map was the first step to fill the void in South Africa regarding the necessity of detailed climatic data. A calibrated model of a typical classroom was developed using Ecotect
TM. To ensure accuracy, the results from the simulation model were compared with in-situ measured data. A detailed model was created for each of the representative IBT systems. A thermal simulation was conducted on each of the systems in 34 cities and towns in South Africa, for each of the climatic regions and grouped according to the Köppen-Geiger climatic classification that was created. The roof and the other elements of the virtual building were the same for all the systems. In each case the walls were changed to simulate the desired building system. A total of 238 simulations were undertaken. The annual cooling and heating (kWh) energy required were calculated, to determine the amount of energy needed to make the building interior comfortable within each of the climatic region. To facilitate processing the simulation results were grouped into corresponding climatic regions and normalized to a score out of five. Five denotes the best performance in the group of IBT systems and one the worst.
5. Decision Support Model for IBT’s
There are a large number of building systems and building products available on the market today. It is exceptionally difficult for architects of e.g. schools and hospitals (social infrastructure) to determine an appropriate building system for the specific climatic region and location. Furthermore it is unpractical to investigate each system’s properties every time to make an informed decision regarding the use of an appropriate system for the specific climatic region. There is therefore a need for a bespoke tool to assist architects and designers as to which building technology will be appropriate for the site and specific climate. The Decision Support Model for IBT’s is constituted of an essential set of related technologies and methods. The software was developed using Visual Basic for Applications (VBA). The development of the software was undertaken in five phases. Phase 1: The first phase was the creation of a new Köppen-Geiger climatic map, to quantify the climatic
conditions of South Africa. The climatic map provided a climatic grouping background as a basis for the subsequent detailed building system performance simulations.
Phase 2: This phase included the classification of set of 27 IBT systems according to their thermal performance and composition. The systems were arranged from light weight to heavy weight building systems. Figure 3 below illustrates the vast difference in U-values between the various building systems that range from light weight (Classification A) to heavy weight (Classification F) (Table 3).
. Figure 3 U-value comparison between various building systems
Phase 3: Detailed simulation models were created for each for the representative IBT systems (Table 3). The results of these simulations were programmed into the software as a normalized constant value. The software considers the selected climatic region and calculates the performance of the various systems according to the selected climatic region and other criteria..
Phase 4: A qualitative section was created by analysing various Agrément certificates for each of the building systems. This was achieved by rating each aspect of the systems on a scale of five. The aspects which were rated are acoustic performance, energy requirement, condensation, fire performance and durability. The predetermined values form part of the software. Figure 4 below
79

illustrates the default relative importance or weighting that was applied to the five performance ranking factors.
Figure 4 Performance ranking according to Agrément certificates, from the Decision Support Model for
IBT’s
Phase 5: The construction chain management was studied of each of the 27 systems. Suitability was determined for construction sites that vary from urban to inaccessible deep rural. The metrics included economies of scale, distance from suppliers, local labour force, lead time flexibility, distance from suppliers.
Figure 5 Construction supply chain management, from the Decision Support Model for IBT’s
The Decision Support Model for IBT’s therefore considers 11 factors before calculating which system would be appropriate for the user’s need. The process is as follows:
1. Factor 1: The user selects the relevant climatic region using a convenient CSIR Köppen-Geiger overlay on Google Earth.
2. Factor 2 – 6: The performance ranking is automatically calculated. Each of the five performance rankings has different weights. For example acoustic performance has a weight of 0.13 and durability 0.235.
3. Factor 7 – 11: The user can select the appropriate “Construction supply chain” management characteristic which is applicable to the specific site.
Once all the criteria have been selected, the score for each building system is calculated and immediately displayed. A colour-code is applied to the systems according to the total performance score of each system. The applied colour-coding, illustrated in Figure 6, assists the user to easily identify which building systems would be preferable according to the set of selected criteria.
80

Figure 6 Total performance ranking, of the Decision Support Model for IBT’s (modified by author)
The software is unique as it incorporates the results of a comprehensive climatic analysis, extensive simulation modelling, analysis of the relevant Agrément certificates and supply chain management decision-making in a single system as illustrated below.
Figure 7 Decision Support Model for IBT’s user interface
The software provides a convenient to use approach to examine multi-criteria regarding various climatic regions, multiple building systems and construction supply chain management. This has already assisted South African government departments to improve social infrastructure, without the necessity to undertake ab initio investigations of all the complex and interrelated factors before each project. The Decision Support Model for IBT’s therefore facilitates a multi-criteria decision-taking process within a complex environment.
6. Conclusion and Further Research
The Köppen-Geiger map provided a good method to group locations with similar climatic characteristics together. The detailed simulations were supported with weather files that were generated from the Meteonorm software. Due to the fact that the Köppen-Geiger climatic map is based on empirical functions of temperature and precipitation it cannot accurately predict the thermal comfort of the building occupant within a distinct climate. Thermal comfort is primarily determined by relative humidity and dry bulb temperature. To address this, CSIR is currently undertaking further research to create climatic maps that address the
81

shortcomings mentioned. Two maps have recently been created, i.e. a Standard Effective Temperature (SET) and a Degree Day map. The SET map incorporated dry bulb temperature and relative humidity, however it did not correlate well with the annual cooling and heating demand. Supplementary to the SET climatic map, a Heating Degree Day (HDD) and Cooling Degree Day (CDD) climatic map (based on hourly calculations) was developed which correlates well with the cooling and heating energy demand of a proposed structure. Passive design development is further assisted by the inclusion of summer and winter angles as well as humidity lines. The Decision Support Model for IBT’s can be improved by incorporating the newly created maps into the software, for greater accuracy of the thermal performance of the building systems and the thermal comfort the building provides. The research team is currently improving the software with the inclusion of more criteria that will lead to improved prediction accuracy.
7. References
Agrometeorology Staff. 2001. ARC-ISCW Climate Information System. ARC-Institute for Soil, Climate and Water, Pretoria. Conradie, D.C.U. 2014. The performance of Innovative Building Technologies in South Africa’s climatic zones. In Green Building Handbook, The Essential Guide, Vol 6. Conradie, D.C.U. & Kumirai, T. 2012a. The creation of a South African Climate map for the quantification of appropriate passive design responses. In Proceedings of the 4
th CIB International Conference on Smart and
Sustainable Buildings, June 2012, Sao Paulo, pp. 195-203. Conradie, D.C.U. & Kumirai, T. 2012b. Predictive performance simulations for a sustainable lecture building complex. In Proceedings of the 4
th CIB International Conference on Smart and Sustainable Buildings, June
2012, Sao Paulo. Kottek, M., Grieser, J., Beck, C., Rudolf, B., & Rubel, F. 2006. World Map of the Köppen-Geiger climate classification updated. In: Meteorologische Zeitschrift, Vol. 15, No. 3, pp. 259-263. SANS 204. 2011. South African National Standard. Energy efficiency in building, part 2: The application of the energy efficiency requirements for buildings with natural environmental control. SABS Standards Division. Van Straaten, JF. 1967. Thermal Performance of Buildings. Amsterdam, London, New York: Elsevier Publishing Company.
82

THE CREATION OF COOLING DEGREE (CDD) AND HEATING DEGREE DAY (HDD) CLIMATIC MAPS FOR SOUTH AFRICA
Dirk CONRADIE
1
Tobias van REENEN 2 Sheldon BOLE 3
1 Built Environment, Council for Scientific and Industrial Research, Email: [email protected] 2 Built Environment, Council for Scientific and Industrial Research, Email: [email protected] 3 Built Environment, Council for Scientific and Industrial Research, Email: [email protected] Keywords: Building Energy, Climate maps, Degree Day, Cooling, Heating, Köppen-Geiger map, passive design responses, Standard Effective Temperature (SET) map
Abstract
The current six climatic regions map used in the SANS 204 (2011) South African National Building Standards does not optimally support quantified design decisions within the built environment. It also does not give an indication of the amount of cooling and heating energy that would be required within a particular climatic region. To address this, the application of Standard Effective Temperature (SET) was assessed during the course of 2014 in an attempt to provide a rational and more accurate replacement for the current SANS 204, six zone climate map of South Africa. The intention was to create maps based on a set of factors that determine human comfort, such as relative humidity and dry-bulb temperature. The intention was also to create a system that could better support adaptive building design decisions in creating comfortable thermal environments. Over the last 100 years, many different heat strain indices have been proposed to indicate comparative thermal comfort levels. After reviewing these standards the team concluded that Standard Effective Temperature (SET), as proposed by Gagge, might be the best index as it considers the effect of humidity in the experience of thermal comfort. SET maps were produced using the same data as had been used to produce the Köppen-Geiger map. Verification of the SET maps showed weak to poor correlations between SET and the expected building heating and cooling energy demands. As a result of the poor correlation, the decision was made to create a set of maps based on interpreted degree days in order to establish if such an index would give a better correlation to building energy demand. A very large dataset of 21 years of hourly data, which assumes an A2 climate change scenario at a 50 km resolution, was used in the process. An algorithm was used to resample the source data from 50 km to 5 km. This 5 km grid dataset was used to produce heating and cooling degree day maps. An excellent correlation between degrees days and modelled building energy demand was found. This paper describes the data processing, creation of the degree day map and the subsequent verification processes in detail.
1. Introduction An analysis of the current SANS 204 (2011) six zone map highlighted that the map does not optimally support quantified design decisions within the built environment. This was because the map could not be related to actual energy usage, nor could it be used to support passive design strategies such as solar heating, thermal mass and natural ventilation. In addition the poor resolution of the map may have exacerbated the problem. The first quantitative classification of world climate was created by the German scientist Wladimir Köppen (1846-1940) in 1900. It has been updated by Rudolf Geiger (1894-1981). The Köppen-Geiger climatic map became the international de-facto standard (Kottek et al., 2006). As a first step the CSIR created a detailed Köppen-Geiger map to quantify the current climatic conditions as accurately as possible in South Africa using a well-known international climate map standard (Figure 1) (Conradie et al., 2012). The Köppen-Geiger climatic classification uses a concatenation of a maximum of three alphabetic characters that describe the main climatic category, amount of precipitation and temperature characteristics. This is based on a set of empirical formulas detailed in Tables 1 and 2. A detailed historic dataset of 20 years of temperature and precipitation spanning 1985 to 2005, based on a 1 km x 1 km grid, was obtained from the South African Agricultural Research Council (Agrometeorology staff, 2001). ArcMap Geographic Information System (GIS) was used to compile a climatic map using the algorithms as described by Kottek (2006) (Figure 1).
83

Figure 1 CSIR Köppen-Geiger map based on 1985 to 2005 Agricultural Research Council data on a very
fine 1 km x 1 km grid (authors) Table 1 lists the formulae that were used to derive the first two letters of the classification. The annual mean temperature is denoted by Tann and the monthly mean temperature of the warmest and coldest months by Tmax and Tmin, respectively. Pann is the accumulated annual precipitation and Pmin is the precipitation of the driest month. The values Psmin, Psmax, Pwmin and Pwmax are defined as the lowest and highest monthly precipitation values for the summer and winter half-years for the particular hemisphere considered. All temperatures are calculated in °C and monthly precipitation in mm/ month and Pann in mm/ year. In addition to the temperature and precipitation values, a dryness threshold Pth in mm is introduced for the arid climates (B), which depends on Tann, the absolute measure of the annual mean temperature in °C and on the annual cycle of precipitation. 2Tann if at least 2/3 of the annual precipitation occurs in winter, Pth = 2Tann + 28 if at least 2/3 of the annual precipitation occurs in summer, 2Tann + 14 in all other cases.
Table 1 Key to calculating the first two letters of Köppen-Geiger
Type Description Criterion A Equatorial climates Tmin ≥ +18 °C Af Equatorial rainforest, fully humid Pmin ≥ 60 mm
Am Equatorial monsoon Pann ≥ 25(100-Pmin) As Equatorial savannah with dry summer Pmin < 60 mm in summer Aw Equatorial savannah with dry winter Pmin < 60 mm in winter B Arid climates Pann < 10 Pth
BS Steppe climate Pann > 5 Pth
BW Desert climate Pann ≤ 5 Pth
C Warm temperate climates -3 °C < Tmin < +18 °C Cs Warm temperate climate with dry summer Psmin < Pwmin, Pwmax > 3 Psmin and Psmin < 40 mm Cw Warm temperate climate with dry winter Pwmin < Psmin and Psmax > 10 Pwmin
Cf Warm temperate climate, fully humid Neither Cs nor Cw D Snow climates Tmin ≤ -3 °C Ds Snow climate with dry summer Psmin < Pwmin, Pwmax > 3 Psmin and Psmin < 40 mm Dw Snow climate with dry winter Pwmin < Psmin and Psmax > 10 Pwmin
Df Snow climate, fully humid Neither Ds nor Dw E Polar climates Tmax < +10 °C ET Tundra climate 0 °C ≤ Tmax < +10 °C EF Frost climate Tmax < 0 °C
84

Table 2 indicates how the additional temperature conditions, i.e. the third letter, was determined for arid climates (B) as well as for warm temperate (C) and snow climates (D). In this table Tmon is the mean monthly temperature in °C.
Table 2 Key to calculating the third-letter temperature classification
Type Description Criteria h Hot steppe/desert Tann ≥ +18 °C k Cold steppe/desert Tann < +18 °C a Hot summer Tmax ≥ +22 °C b Warm summer not (a) and at least 4 Tmon ≥ +10 °C c Cool summer and cold winter not (b) and Tmin > -38 °C d Extremely continental like (c) but Tmin ≤ -38 °C
The Köppen-Geiger climatic map clearly highlighted the different climatic regions that proved valuable in the subsequent creation and verification of the Standard Effective Temperature (SET) and Cooling and Heating Degree maps. It also indicated that the maps would need to be of sufficient resolution so that important climatic variation and detail do not meld. A resolution of 5 km x 5 km cells was chosen. Some notable South African climatic characteristics are indicated by numbers on the map in Figure 1:
1) Very hot Limpopo river valley, classification BWh. 2) A tropical descender into the northern parts of the Kwa-Zulu province of South Africa, classification
Aw. 3) Pretoria has three climatic zones, i.e. BSh, Cwa and Cwb. 4) The climatic staircase effect starting from humid Durban, moving into the Natal midlands and
eventually the Drakensberg mountains corresponding to classifications Cfa, Cfb and Cwb respectively.
5) The very cold Lesotho highlands, classification Cfb, Cwb and Cwc. The latter is very nearly a snow climate.
6) The cold high lying area around Sutherland with a classification of BSk. 7) The arid climatic region lying north of Cape Town starting at Yzerfontein with a classification of BSk.
2. Some International precedents
Further analysis of the Köppen-Geiger map indicated that it would not be suitable to support energy efficient building design directly, because human comfort in a particular climatic region is determined by the environmental factors of air temperature (dry bulb), radiant temperature, air speed and humidity. (ASHRAE 55, 2004) The Köppen-Geiger functions are based on air temperature and precipitation. Furthermore it is also not suitable to estimate the anticipated amount of cooling and heating energy, because it is not taking account of the substantial diurnal variations in temperature normally experienced in South Africa. Other international energy map precedents were therefore studied.
2.1 Global Building Performance Network (GBPN)
The GBPN (GBPN, 2015) climate classification divides the world into 11 key regions such as Western Europe, Eastern Europe, Middle East and Sub-Saharan Africa. Within each region the different climate zones are considered in order to capture the difference in building energy use, caused by climate variations. The differentiation among different climate zones is based on several climatic factors in terms of their influence on building energy demand for space heating, cooling and dehumidification, namely:
Heating Degree Days (HDD) Cooling Degree Days (CDD) Relative Humidity of the warmest month (RH) Average Temperature of the warmest month (Tdb)
Abovementioned parameters were processed by means of the ArcMap™ Geographic Information System (GIS) software. The GIS analysis facilitated the combination of the parameters, according to a certain set of empirical criteria for each climate zone. Each selected geographical area corresponds to a certain climate zone categorized by energy needs for space heating, cooling and dehumidification. In this system there are a total of 17 climate zones. Each of them is characterized in terms of heating and/or cooling demand, which varies from “low” to “very high” depending on the amount of average annual HDD and CDD in each area. The need for dehumidification is determined on the basis of the combination of values for relative humidity and average temperature of the warmest month. It is assumed that if relative humidity of the warmest month is higher than 50% and average temperature of the warmest month is higher or equals 23°C, then dehumidification in buildings is needed. Such a climate split gives the opportunity to capture variation in energy needs for heating, cooling and dehumidification in different geographical locations.
85

2.2 USA International Energy Conservation Code (IECC) and Building America climatic regions
Prior to 2004, there was no single, agreed upon climate zone map for the United States for use with building codes. Four different methods for specifying climate-dependent requirements were used by the American Society of Heating, Refrigerating and Air-Conditioning Engineers (ASHRAE) and the International Energy Conservation Code (IECC) for their residential and commercial building standards. ASHRAE used 38 climate groupings identified for 240 cities, while the IECC used 33 different climate zones based on county boundaries. In most cases, the climate data needed to determine which requirements apply were not included in the standard or code documents. In the early 2000s, researchers at the U.S. Department of Energy’s Pacific Northwest National Laboratory (PNNL) created a simplified map of U.S. climate zones. The map was based on analysis of the 4 775 U.S.A. weather sites identified by the National Oceanic and Atmospheric Administration (NOAA) as well as widely accepted classifications of world climates that have been applied in a variety of different disciplines. This PNNL developed map divided the United States into eight temperature-oriented climate zones. These zones are further divided into three moisture regimes designated A, B, and C. The IECC map allows for up to 24 potential climate designations. The new climate zones were set along county boundaries, making it easier for builders to determine what climate zone applied to a specific building. The 2004 IECC Supplement was the first model energy code to adopt this new climate zone map. It first appeared in ASHRAE 90.1 (ASHRAE 90.1, 2004). The climate zone map was also adopted by ENERGY STAR for Homes in 2006. In 2003, with direction from the Building America teams, in particular Building Science Corporation, researchers at the Department of Energy National Renewable Energy Laboratory (NREL) further simplified the new IECC map for purposes of the Building America Program. They divided the map into eight climate zones based on temperature, precipitation, and heating and cooling degree days. The zones are hot-humid, hot-dry, mixed-dry, mixed-humid, marine, cold, very cold, and subarctic. Building America prepared a guide that includes detailed definitions of each climate zone and a listing of all U.S. counties by state, indicating the climate region in which each county is located.
2.3 Standard Effective Temperature (SET)
Victor Olgyay initiated the concept of bioclimatic design in 1963 (Olgyay, 1963). He was a leading researcher in the investigation on the relation between architecture and energy. Other researchers such as Givoni developed the concept further by changing the original square bioclimatic chart to overlays on a regular psychrometric chart (Givoni, 1969). Watson and Labs refined the principles further (Watson et al., 1993).
Figure 2 Strategies of climate control overlaid on a psychrometric chart (After Watson and Labs). The work of the bioclimatic researchers and Gonzalez (Gonzalez et al., 1974) indicated that Standard Effective Temperature (SET) is a very good heat strain index or indication of human comfort. SET is closely related to the New Effective Temperature (ET*) that has been used in the Watson and Labs climate strategies (Figure 2).
86
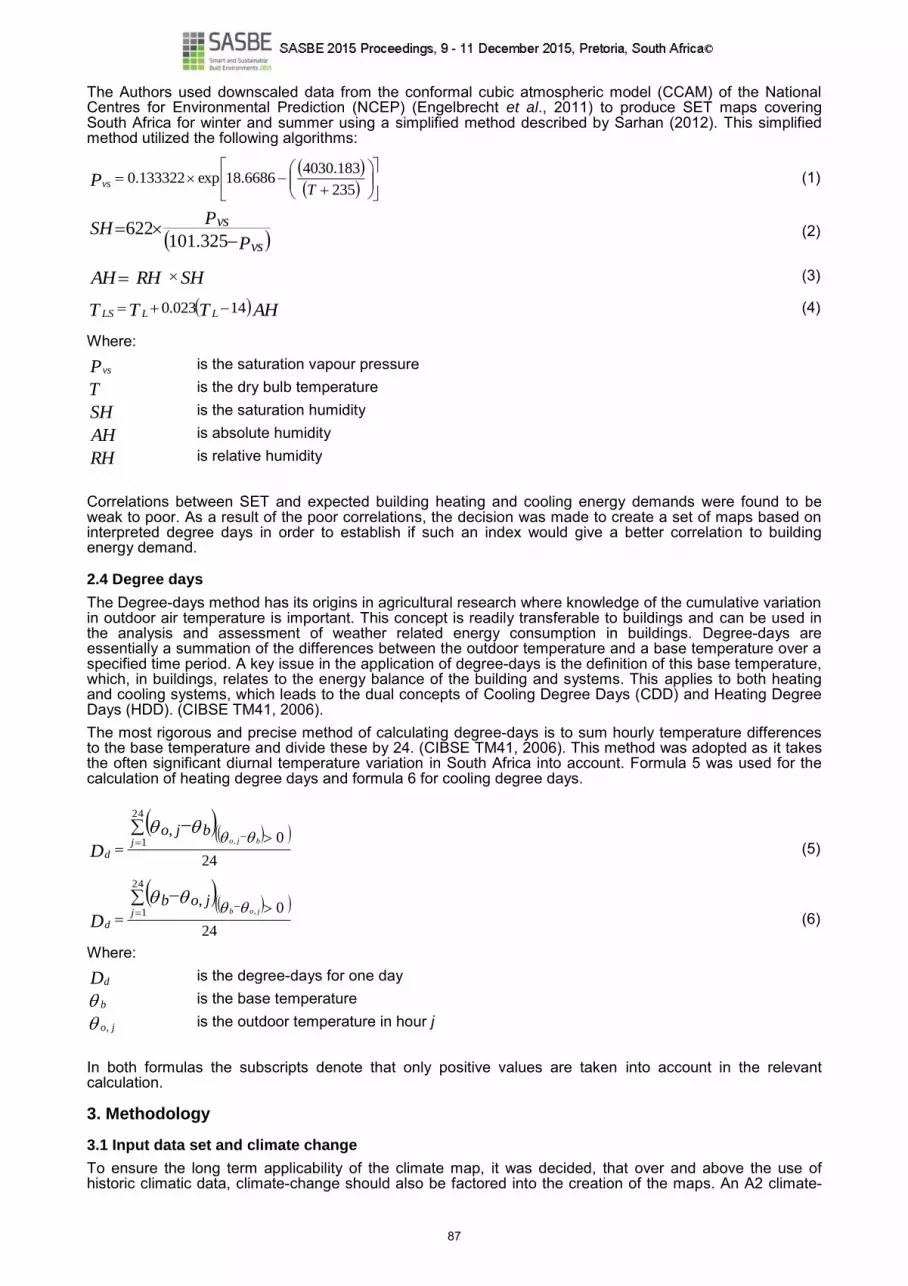
The Authors used downscaled data from the conformal cubic atmospheric model (CCAM) of the National Centres for Environmental Prediction (NCEP) (Engelbrecht et al., 2011) to produce SET maps covering South Africa for winter and summer using a simplified method described by Sarhan (2012). This simplified method utilized the following algorithms:
235
183.40306686.18exp133322.0
TPvs (1)
P
PSH
vs
vs
325.101622 (2)
SHRHAH (3)
AHTTT LLLS 14023.0 (4)
Where:
Pvs is the saturation vapour pressure
T is the dry bulb temperature
SH is the saturation humidity
AH is absolute humidity
RH is relative humidity Correlations between SET and expected building heating and cooling energy demands were found to be weak to poor. As a result of the poor correlations, the decision was made to create a set of maps based on interpreted degree days in order to establish if such an index would give a better correlation to building energy demand.
2.4 Degree days
The Degree-days method has its origins in agricultural research where knowledge of the cumulative variation in outdoor air temperature is important. This concept is readily transferable to buildings and can be used in the analysis and assessment of weather related energy consumption in buildings. Degree-days are essentially a summation of the differences between the outdoor temperature and a base temperature over a specified time period. A key issue in the application of degree-days is the definition of this base temperature, which, in buildings, relates to the energy balance of the building and systems. This applies to both heating and cooling systems, which leads to the dual concepts of Cooling Degree Days (CDD) and Heating Degree Days (HDD). (CIBSE TM41, 2006). The most rigorous and precise method of calculating degree-days is to sum hourly temperature differences to the base temperature and divide these by 24. (CIBSE TM41, 2006). This method was adopted as it takes the often significant diurnal temperature variation in South Africa into account. Formula 5 was used for the calculation of heating degree days and formula 6 for cooling degree days.
24
,0
24
1 ,
j
d
bjobjo
D
(5)
24
,0
24
1 ,
j
d
jobjob
D
(6)
Where:
Dd is the degree-days for one day
b is the base temperature
jo, is the outdoor temperature in hour j In both formulas the subscripts denote that only positive values are taken into account in the relevant calculation.
3. Methodology
3.1 Input data set and climate change
To ensure the long term applicability of the climate map, it was decided, that over and above the use of historic climatic data, climate-change should also be factored into the creation of the maps. An A2 climate-
87

change scenario of the Special Report on Emission Scenarios (SRES) for the period 1961-2100 (Engelbrecht et al., 2011) was used. The A2 scenario is where technological change is more heterogeneous than in an A1 scenario. Regions with abundant energy and mineral resources evolve more resource-intensive economies, while those poor in resources place a very high priority on minimizing import dependence through technological innovation to improve resource efficiency and make use of substitute inputs. The fuel mix in different regions is determined primarily by resource availability. High-income but resource-poor regions shift toward advanced post-fossil technologies (renewables or nuclear), while low-income resource-rich regions generally rely on older fossil technologies. Projections of future global climate change such as those described in Assessment Report Four (AR4) of the Inter-governmental Panel on Climate Change (IPCC), are based on coupled global climate models (CGCMs) that simulate the coupled ocean, atmosphere and land-surface processes. CGCMs are computationally very expensive and are typically run on super computers. When used to simulate climate over a period of a century these models are typically applied at horizontal resolutions of 100 – 200 km. However, more detailed simulations are required for regional climate-change impact studies and to drive application models such as required for energy use estimates to support passive design in the construction industry. Dynamic regional climate models (RCMs) are used to obtain such detailed projections. Present day computing power allows RCMs to be applied at resolutions of about 50 km. (Engelbrecht et al., 2011) In the application described in this paper the CSIR Natural Resources and Environment unit (NRE) used a conformal cubic atmospheric model (CCAM) of the National Centres for Environmental Prediction (NCEP) with cells of approximately 250 km. The sea-ice and bias-corrected sea-surface temperature (SST) of six CGCMs (CSIRO Mk 3.5, GFDL2.1, GFDL2.0, HadCM2, ECHAM5 and Miroc-Medres) were used to produce a dataset with cells of approximately 50 km. (Engelbrecht et al., 2011)
3.2 Lapse rate resampling procedure
In order to prevent the melding of climatic zones, the 50 km data received from the NRE was resampled to a 5 km grid through a lapse rate adjustment. Lapse rate is defined as the rate at which atmospheric temperature decreases with an increase in altitude. The terminology arises from the word lapse in the sense of a decrease or decline (Figure 3).
Figure 3 Lapse rate adjustment procedure to create 5 km resolution data
The 90 m resolution Shuttle Radar Topography Mission (SRTM) (Farr et al., 2007) digital terrain model and the 50 km climatic data were spatially aligned. The SRTM was then resampled to both a 50 km and a 5 km resolution (Figure 3). Data provided by NRE contained upper air temperature, surface air temperature and the height difference between these two points. This allowed the calculation of lapse rates for each month of each year for all 50 km cells using the following formula:
H
TTLR
Delta
UpperSurface (7)
Where:
LR is the lapse rate
T Surface is the surface air temperature
TUpper is the upper air temperature
H Delta is the difference in altitude between the upper air and surface air These calculated lapse rates were then used to adjust the dry bulb temperature as per the following formula:
TAltAltLRT kmkmkmkm 505505 (8) Where:
T km5 is the lapse rate adjusted temperature for the 5 km grid cell
88

LR is the lapse rate
Alt km5 is the altitude for the 5 km grid cell
Alt km50 is the altitude for the 50 km grid cell
T km50 is the temperature for the 50 km grid cell
In this way a higher resolution 5 km data set was synthetically created for use in the creation of the SET and CDD/HDD maps.
3.3 Map production
Hourly data for relative humidity and dry-bulb temperature covering a 21 year period (10 years historic, the current year and 10 years predictive) was converted to a raster dataset using ArcMap GIS. This raster dataset was then resampled to a 5 km grid using the method and formulas outlined above. An average year was then calculated by taking the average for each hour of the year across the 21 years data. From this “average year” HDD and CDD were calculated using the method and formulas described above. Two maps were produced, HDD and CDD, using 18 °C as the base temperature (Figure 4) with defined breaks of approximately 300 Degree Days used for delineating the map classes. These classes were then simplified further into Low, Medium and High (LMH) energy demand for both heating and cooling.
Figure 4 Separate Cooling and Heating degree maps before combination into a single map.
89

Figure 5 Heating and Cooling Degree maps combined into one map with summer and winter humidity lines.
The heating and cooling energy demand maps were then combined into a single total energy demand map (Figure 5) to make it more convenient to use in the National Standard. The combining of two different measures of LMH energy demand could possible result in nine different zones. In the South African context, however, only seven zones were realised.
4. Verification of HDD/ CDD map
After completion of the separate CDD and HDD maps (Figure 4) the results were verified to external climatic data sources and modelled building heating and cooling energy demand.
Figure 6 CDD and HDD correlation for Meteonorm data and values read from newly created maps.
Detailed weather files for 51 real weather station locations were extracted from Meteonorm v7, using temperature data for 2000 to 2009. HDD and CDD were calculated for these 51 locations by means of formulas (5) and (6) above. Using the geographic coordinates of each location, the HDD and CDD values were extracted from the maps illustrated in Figure 4. The HDD and CDD values extracted from the maps were correlated against the values calculated from the Meteonorm data (Figure 6). The HDD correlation was 83% and the CDD correlation was 84%. This was deemed acceptable as perfect correlation was not expected, since the Meteonorm data is purely historic (2000 to 2009) and the data used to produce the maps includes predictive values.
Figure 7 Correlation between CDD and HDD and building heating and cooling energy respectively
In order to correlate degree days to building heating and cooling demand, a notional building was modelled in Ecotect™. This model is validated to a real building for heating, cooling and indoor thermal conditions for Pretoria (Conradie et al., 2012). Figure 7 displays the correlation between annual building heating and cooling demand using the same weather files of the 51 locations described above. As expected, a very strong correlation was found between the heating degree days and the modelled annual heating demand (99%). The correlation between the cooling degree days and the annual cooling demand was not as strong (75%), possibly owing to the omission of latent heat energy from the cooling degree day algorithm. In addition no direct allowance is made for the effect of solar radiation in the CDD values. The outlier on the CDD correlation above is noted as being Upington. The HDD calculated for Upington from Meteonorm™ also seems quite high considering climatically similar locations. Equivalent hot arid climates are represented in the data set by locations such as Springbok, Kimberley and Jwaneng without producing similar discrepancies. A data set excluding stations with an annual CDD above 1574 (Thohoyandou) resulted in a
90

far better correlation of 84%. Coincidently this excludes many of the locations in South Africa’s northern neighbours.
5. Conclusions and Further Research
Although the SET map uses functions of dry bulb and humidity and should theoretically give a good indication of human comfort and energy requirement, it failed to correlate well with annual building heating and cooling demand. A number of analyses of heating and cooling energy demand and the HDD/ CDD proved that these correlate well if the calculation is based on hours. The inclusion of summer and winter solar angles and humidity lines give some support to passive design considerations. Further work is envisioned to obtain adequate correlation between a heat strain index and building heating and cooling demand.
6. Acknowledgements
The contribution of Christian Borchard from the Deutsche Gesellschaft für Internasionale Zusammenarbeit (GIZ) for funding and other colleagues in CSIR such as Francois Engelbrecht, Andre Breytenbach and Llewellyn van Wyk for their contributions to the production of the maps.
7. References
ASHRAE 55. 2004. Thermal Environmental Conditions for Human Occupancy. Atlanta, GA., p. 4. ASHRAE 90.1. 2004. Standard 90.1-2013 (I-P Edition) Energy Standard for Buildings Except Low-Rise Residential Buildings. Atlanta, GA. Agrometeorology Staff. 2001. ARC-ISCW Climate Information System. ARC-Institute for Soil, Climate and Water, Pretoria. CIBSE TM41. 2006. Degree-days: theory and application. The Chartered Institution of Building Services Engineers, London, p. 16. Conradie, D.C.U. & Kumirai, T. 2012. The creation of a South African Climate map for the quantification of appropriate passive design responses. In Proceedings of the 4th
CIB International Conference on Smart and Sustainable Buildings, June 2012, Sao Paulo, pp. 195-203. Engelbrecht, F.A., Landman, W.A, Engelbrecht, C.J. Landman, S., Bopape, M.M., Roux, B., McGregor, J.L. & Thatcher, M. 2011. Multi-scale climate modelling over Southern Africa using a variable-resolution global model. In: Water SA, Vol. 37 No. 5, WRC 40-Year Celebration Special Edition, pp. 647-658. Farr, T.G., Rosen, P.A., Caro, E., Crippen, R., Duren, R., Hensley, S., Kobrick, M., Paller, M., Rodriguez, E., Roth, L., Seal, D., Shaffer, S., Shimada, J., Umland, J., Werner, M., Oskin, M., Burbank, D. & Alsdorf, D, 2007. The Shuttle Radar Topography Mission, in Reviews of Geophysics 45 (2): RG2004. Gonzalez, R. R., Nishi, Y., & Gagge, A.P.1974. Experimental evaluation of standard effective temperature: a new biometeorological index of man’s thermal discomfort.In International journal of biometeorology, 18(1), 1–15. GBPN. 2015. Global Building Performance Network. http://www.gbpn.org/databases-tools/mrv-tool/methodology, Accessed on 18 June 2015. Givoni, B. 1969. Man, Climate and Architecture. Elsevier Publishing Co. Ltd., New York, NY. Kottek, M., Grieser, J., Beck, C., Rudolf, B. & Rubel, F. 2006. World Map of the Köppen-Geiger climate classification updated. In: Meteorologische Zeitschrift, Vol. 15, No. 3, pp. 259-263. Olgyay, V. 1963. Design With Climate: Bioclimatic Approach to Architectural Regionalism. Princeton University Press. SANS 204. 2011. South African National Standard. Energy efficiency in buildings, Annexure A: Climatic zones of South Africa . SABS Standards Division. Sarhan, A.M. 2012. The utilisation of Games Technology for Environmental Design Education. Thesis submitted to the University of Nottingham for the degree of Doctor of Philosophy. Watson, D. & Labs, K. 1993. Climatic Building Design: Energy-Efficient Building Principles and Practices. Mcgraw-Hill.
91

92

GREENING OF CEMENT STABILIZED BRICKYARD INDUSTRY FOR SUPPORTING SUSTAINABLE BUILDING IN KURUMAN IN THE NORTHERN CAPE PROVINCE
Gerhard BOSMAN
1
Das (J.J.) STEYN 2
1 Earth Unit, Department of Architecture, University of the Free State, Bloemfontein, Email:
[email protected] 2 Department of Urban and Regional Planning, University of the Free State, Bloemfontein, Email:
[email protected] Keywords: brick yards, cement earth blocks, development, social comparison theory
Abstract
The purpose of the paper is to illustrate the possibilities of greening existing small scale cement based brickyards. The support of cement stabilized earth block industries can improve quality and range of products. If product ranges are expanded, it can support a greener and more sustainable building culture. Past government supported efforts to introduce more sustainable techniques to manufacture building materials with a reduced carbon footprint was supported and accepted by the community near Kuruman. Often these efforts are focused on starting new businesses and not by approaching existing businesses. This paper argues that existing cement block industry should be targeted with green building training programmes. It is difficult for the building industry to accommodate these changes. The use of the social comparison theory regarding changes in worldviews and attitudes, show how the small scale cement stabilized industry can be supported. Several case studies conducted by the Earth Unit (EU) at the University of the Free State, support the successes of training programmes. These case studies are used to illustrate past efforts and this article is the conclusions of two decades of training and research at the EU. These efforts should continue to supported delivery of infrastructure in a more responsible way.
1. Introduction
For nearly 20 years researchers from the Free State University have been investigating how to make the building process more environmentally friendly. This paper will show how the cement stabilized brickyard industry can be used for supporting sustainable building practices. The existing small brickyards that successfully operate in the Kuruman area can be the starting point to the greening of the industry. With minimal means at their disposal and hard work these entrepreneurs have managed to run small businesses successfully. Workshop interventions can support these businesses to expand on green products. Successes of these interventions are limited since for the sake of job creation, unemployed and semi-skilled individuals are targeted. The work of the EU the past two decades has shown the limited success of training groups with no business skills in using earth construction techniques. The social contribution of many contemporary buildings in different earth construction techniques used worldwide (Bosman, 2006; Guillaud, 2010; Fontaine & Anger, 2009; Steÿn, 2009) suggests that, from a technical and a building systems typological point of view, individuals, groups and communities may be convinced by the advantages of contemporary earth construction. The many advantages of earth as building material are well known: 1) availability in large quantities, low price and ease of use by all, 2) good fire resistance, and 3) thermal and acoustic insulation properties contributing to interior comfort of dwellings. The shortcomings are mainly low mechanical characteristics, problems of erosion, abrasion and volume changes (Siyan Siwe, 1983: 43). Other challenges are connected to social perceptions. The social issues with acceptability and the status of traditional earth construction can make the application of contemporary earth construction techniques a greater challenge. Addressing social and technical issues only solves some of the problems at hand. The lack of business skill is often the cause for the early death of a newly formed business, even before the new block making group of trainees has completed their technical training. The involvement with the training and teaching activities at the EU in the Department of Architecture at the University of the Free State (since 1996), equipped the authors with practical experience. Working with small community groups in The Free State Province (Mangaung and Gariepdam) and in the Northern Cape Province (Kuruman), which were trained in contemporary earth construction techniques, provided practical experience on how to address concerns about compressive strength, erosion and abrasion. Building these small-scale public building projects (a prototype farm worker’s house, two day-care centres, four ablutions blocks, a workshop complex, a visitor’s centre and two school assembly halls) provided good building practice for detailing problem areas in earth buildings.
93

The following section will highlight the importance of greening the cement producing brick industry. This will be followed by theories on how to change beliefs regarding attitude systems. Case studies will be discussed briefly to illustrate the past successes in the Northern Cape Province. The role of architects and local governments will be stated for some recommendations before the concluding remarks.
2. Changes in the cement producing block industry
A study conducted in the clay soil areas of the Free State province (Steÿn, 2004; Steÿn & Jooste-Smit, 2006) showed the impact that informal small fire brickyards have on local economic development. These brickyards can have an even bigger impact if brickyard owners can be trained in the greening process of promoting the use of un-stabilized sundried block as part of their products. This training can only be successful if concerned efforts from local governments and municipalities support these brickyards and understand how changes in societies occur. In order to change the production of cement blocks to a more sustainable building process it is necessary to understand how change works in society.
Figure 1 Local small scale brickyard and transportation of blocks to a building site in Bankhara Bodulong
near Kuruman The global green-movement, together with growing local awareness of green issues, has helped to sensitise the public towards looking for more sustainable answers. Guillaud (2010: 15) emphasises support from developed countries and implementation in developing countries. Concerned efforts to support the many cement producing block brick yards can potentially make this industry more sustainable. Larger cement producing block yards that produce the majority of available stock on a fully mechanized scale, often monopolise the industry (Olivier, 2015). These centralized offset points/depots depend on formal road transport to deliver cement blocks to their clients and these suppliers often provide the best competitive prices, but do not provide a sustainable solution for local building cultures (Bosman, 2015: 100-104). The potential of supporting local brick yard entrepreneurs are not new. Both users of cement blocks should be targeted to show the advantages of supporting local brickyards (see Figure 1). Local government officials that can support these entrepreneurs and should also be targeted to provide the best possible local economic developmental support. To effectively achieve this, changes to existing funding structures, perceptions to local material quality should be considered in a developing and changing society. In a developing society, certain systems need to be taken into account. Context-driven actualisation of potential (CAP) entities have the potential to change in different ways under different contexts: 1) some aspect of this potential are actualised when the entity undergoes a change of state as a result of context encounter; and 2) the entity undergoes another change of state, and so on, recursively (Gabora & Aerts, 2005: 81). The CAP framework within culture is “an integrated network of knowledge, attitudes, ideas and so forth – that is, an internal model of the world, or worldview – and that ideas and artefacts are how a worldview reveals itself under a particular context” (Gabora & Aerts, 2005: 83). According to Nunn (2006: 183), the theory of change should consider time, and the experience of time, where sameness is persistence in time, and change is differences over time. Nunn (2006: 189) believes that two of the most important needs of humans are: 1) change; and 2) maintaining sameness. The brain is central to this process to construct and envisage the future and provide the critical faculty for adaptation to a changing environment. Changes to the built environment and the status of building materials are part of this worldview exposed to changes. Our opinion and that of others around us, goes through a process before it can be changed.
94

Figure 2 Analytical diagram of the social comparison theory (Zimbardo & Leippe, 1991: 166)
According to Zimbardo and Leippe (1991: 166), the social comparison theory is the process by which people actively collect persuasive information from others and assess validity of our opinions by comparing them with those of others. The six mental steps that must occur before a message can change behaviour are the following: the subject should 1) be exposed to a message, 2) pay attention to it, 3) understand it, 4) accept its conclusion as the new attitude, 5) remembers the attitude and, 6) use it to guide the behaviour (see Figure 2). Changing consumers attitude and behaviour to buying greener building product, such as compressed earth blocks with a smaller cement content, has been successful in the past (Bosman, 2015). Attitudes are difficult to change and not necessarily permanent, but can be modified, discarded or replaced, usually in response to new information. Many factors may result in change of attitude due to information (a message) that is communicated and received from others. When the individual (an audience) regards the communicator as credible, a greater immediate change is possible. As time passes, the message source is even less important that the message (Silverman, 1979: 502). Attitudes can be changed due to a message (new information) or inconsistency between attitudes, behaviour and the environment (Carocci, 2011: 370). Van den Berg (1974) defines his understanding of the theory of change as “metabletica”. He describes change as a process that people will first reject, then wonder about and later accept. New ideas will only bloom if the time for it is ripe, since it needs philosophical acceptance and appropriate technology to support its development. Concepts such as development and sustainability had to go through the same process. Rapoport (1977: 40) refers to the value filters that people look through at life. These filters can be parents and upbringing, culture and religion that have a worldview. These filters are sensitive and are especially influenced by the media.
3. The production of cement blocks and bricks in the central areas of South Africa
Since 1996 the researchers have been involved in the Free State, Northern Cape and Northern Province doing research on the use, production and acceptability of traditional and upgraded earth constructed material for walls of public and private buildings (Bosman & Steÿn, 2014). Three aspects have been found to influence the way people perceive and use available material for walls. Firstly, choice of material is determined by its acceptability (Bosman, 2015: 21), which is a combination of understanding of the built environment, (perceptions and beliefs), preferences (availability), behaviour (conformity and imitation) and price (upward social mobility). Secondly, the role of climate, especially rainfall influences the use and acceptability of more sustainable materials such as cement stabilized earth bricks or blocks (Bosman & Van der Westhuizen, 2014a; 2014b). Rationally the use of this type of material should be more acceptable in
Behaviour
Six Mental Steps:
Exposure
Attention
Comprehension
Acceptance
Memory
Guidance
Attitude
Attitude System
Change in beliefs
Consistency
95

drier areas like the Northern Cape and the North Western Province. However when research was done in Taung in the in the North Western Province during 2004-2006, it was found that floods just before the survey changed perceptions to the negative side due to the effect of exceptional heavy thunderstorms and flash floods (Steÿn & Bosman, 2010). Thirdly, the type of material available in different parts of the country should be considered. In the SANPAD study (Steÿn, 2009) it was found that in places where clay was found (central and eastern Free State Province areas) people tend to produce burn bricks for construction purposes of houses (Steÿn 2009, 2004, 10-12). In areas such as Kuruman, Bankhara Bodulong, Motibistad, Mapoteng (Northern Cape Province) and in Taung, Pampierstad, Manokwane (North Western Province) where only sandy soils were available brickyards mainly produce cement bricks or blocks (Steÿn, 2009).
Figure 3 Local small scale brick yard in Bankhara Bodulong.
In central South Africa, many small groups of entrepreneurs in poor communities have produced cement/concrete blocks (see Figures 1 and 3). In the settlement around Kuruman (Bankhara Bodulong, Motibistad and Mapoteng) in the Northern Cape, many local privately owned small brickyards produce cement stabilised for many decade without financial, technical or organizational support. With proper training programmes, these entrepreneurs could produce a bigger variety of blocks of a high quality (Bosman, 2003: 22-23; Bosman, 2006: 300-305; Jooste-Smit, 1998: 73). Cement stabilized industry in the Kuruman area can therefore be considered as the current building culture. Earth construction has more advantages than disadvantages for contemporary application in all possible climates and South African weather conditions (Bosman, 2015). In some projects/cases it might not be the best possible material option, for instance where no direct link between the building culture (local construction technique and available resources) and the surrounding context can be made. This, however, can be achieved over a longer period by proper training programmes, developing existing brick yards and business skills aimed at development, and sustaining communities. The role of the architect in this case is relevant for an impact on the sustainability of communities. The local governments and municipalities can play a critical role in the support of local building cultures.
4. The future role of the South African government
Figure 4 Training of a group in the production of cement stabilised compressed earth blocks (CEB) in
Bankhara Bodulong. The South African Government should give contemporary earth building technology with special reference to compressed earth blocks a clear position within the National Building Regulations. In the Kuruman settlement of Bankhara Bodulong the promotional earth construction projects and work of the Earth Unit, have shown that the community in the settlement have bought the idea of using compressed earth blocks
96

(CEB), by supporting and buying these blocks (see Figures 4 and 5) from a prototype brick yard established in 2003 (Bosman, 2003: 23; 2006: 300-301; Steÿn, 2009: 28). This supports the social comparison theory of Zimbardo & Leippe (1991), where the community collect persuasive information about CEB, since it was bought by several home builders for the construction of their own houses. Other local brick yards can also be trained in the production of CEB and local brick layers can be trained in the construction, implementing good bricklaying principles and construction detailing.
5. Discussion and Recommendations
More CEB production training programmes should be introduced and conducted by the local government to existing cement stabilised brickyards in the areas around Kuruman. These brickyards will be able to:
produce blocks with abundant and affordable raw material with less cement used than needed for conventional cement blocks or concrete hollow blocks (20% cement stabilization);
make use of higher compaction, by mechanically reducing voids between soil particles to reduce water absorption;
expand on the product range to their customers; create more job opportunities in the small scale block making industry.
These efforts will expand the existing concrete block industry, and will provide a more sustainable solution since the best qualities of the locally available soils will be used. Furthermore, the compressed earth blocks are compacted and contain less than half of the conventional 20% cement stabilisation, as in the case of the local block/brick yards that currently produce concrete blocks/bricks. If the commitment towards sustainable development is to be taken seriously, the importance of earth construction must not be overlooked, neither by government officials or professionals in the field. Cement stabilised CEB can be as effective and versatile and compares very well to other forms of wall construction, if not more so. It has the added advantage of making use of locally available resources, incurring less transport costs and producing very few waste products. Regional sustainability also means to create jobs for people in that region in order to make a living. The potential of the construction industry, small, medium micro-enterprises (SMME) and small brickyards for creating jobs, plays an important role in local economic development. These efforts to support small scale brick yards with training will tap into the context-driven actualization of the local brickyard industry (Gabora & Aerts, 2005: 83).
Figure 5 Use of CEB bought from local entrepreneurs for a self-help house and the local school in
Bankhara Bodulong Brickyard owners will need to be trained in some technical issues that may differ between the traditional cement stabilised block and the cement compressed earth blocks. Past feedback from groups trained by the Earth Unit has shown that the building culture to soil selection, soil preparation and to stabilise with cement is a clear link to existing knowledge. More accurate raw material proportioning and wet curing of block need more quality control with new training groups. According to Nunn (2006) will it be important to accommodate both sameness and change. The familiarity of the brickyard activities will be combined with the changes in raw material proportions, workability of brick presses and proper wet curing. Other issues to consider will be the marketing of a bigger product range to existing and new clients. Since 1995, several South African building professionals have constructed well-designed contemporary earth buildings in rural and urban areas with the help of locally trained construction teams (Bosman, 2006). Many projects used cement stabilised adobe and compressed earth blocks. These projects are well documented and available to the building industry. The reviews and debates about these often innovative earth constructed buildings enjoy the support of the South African and international green building movement (Buchanan, 2005). Excellent stabilisation results have been obtained on very different soil types with various stabilisers. It is important to guarantee quality, to choose a stabiliser adapted for the soil type, to study proper earth mix design and to carry out the work in compliance with well-established rules (Siyan Siwe, 1983: 43).
6. Conclusions
A slow but steady progress for the advantaged of CEB for private and public buildings in South Africa is evident. The technology as a credible indicator or communicator has shown the advantages as a more sustainable option. New information about contemporary earth construction will continue to change the
97

perception of more sustainable materials. Attitudes can be changed if there are inconsistency between attitudes, behaviour and the environment. The South African Government and all stakeholders in the built environment should evaluate their existing efforts to support local sustainable development by tapping into small scale brickyard operations. This will help to reduce the carbon foot print of the global and South African building industry, through the promotion of cement stabilized earth construction as a green building technology. Technical, social and business skills should be held as the three indicators to the success of intervention efforts (training). These efforts will also help the many existing entrepreneurs to expand their range of traditional cement stabilised blocks in areas around Kuruman in The Northern Cape Province.
7. References
Bosman, G. & Steÿn, J.J. 2014. Rethinking Contemporary Earth Construction for Housing. South African Housing Foundation (SAHF) International Conference. Affordable Housing Opportunities for Southern Africa. Cape Town, South Africa, 28 September-1 October. Bosman, G. & Van der Weshuizen, D. 2014a. The impact of climate phenomena on attitudes towards traditional earth construction and decoration. South African Journal of Art History. 29 (3) 65-76. Bosman, G. & Van der Weshuizen, D. 2014b. The effects of climate conditions on attitudinal change towards earth construction in South Africa. Acta Structilia. 21 (1) pp. 117-141. Bosman, G. 2003. Sustainability, involved ability, and the struggle for survival. Leading Architecture and Design, September/October, pp. 22-23. Bosman, G. 2006. Promoting sustainability of earth constructed private and public buildings in South Africa. In: Broadbent, G. & Brebbia, C. A. (Eds). Eco-Architecture: harmonisation between architecture and nature. (Southampton: WIT), pp. 297-306. Bosman, G. 2015. The acceptability of earth constructed houses in central areas of South Africa. Unpublished thesis (PhD). (Bloemfontein: The University of the Free State). Buchanan, P. 2005. Green culture and architecture. Journal of the South African Institute of Architects, March/April, pp. 6-7. Carocci, S. 2011. Social mobility and the Middle Ages. Continuity and Change, 26(3), pp. 367-404. Fontaine, L. & Anger, R. 2009. Bâtir en terre: du grain de sable à l’architecture. Belin, (Paris: Cité des sciences et de l’industrie). Gabora, L & Aerts, D. 2005. Evolution as context-driven actualisation of potential: towards an interdisciplinary theory of change of state. Interdisciplinary Science Reviews, 30(1), pp. 69-88. Guillaud, H. (Ed.). 2010. TERRAEducation 2010: proceedings of the seminar-workshop: summary of works. Grenoble, (France: CRAterre-ENSAG). Jooste-Smit, P. 1998. Earth construction: a changing tradition. Acta Structilia, 5(1/2), pp. 55-80. Ngowi, A.B. 1997. Virtues of construction training in traditional societies. Building and Environment, 32(3), pp. 289-294. Nunn, K.P. 2006. Neuro futurity: a theory of change. Clinical Child Psychology and Psychiatry, 11(2), pp. 183–190. Olivier, R. 2015. (Contractor and hardware store owner). Telephonic interview about the informal and formal cement brick industry in Kuruman. 10 March 2015. Bloemfontein Rapoport, A. 1977. Human aspects of urban form: towards a man-environment approach to urban form and design. (Toronto: Pergamon Press). Silverman, R.E. 1979. Psychology. 3rd Edition. (Englewood Cliffs, NJ: Prentice-Hall). Siyan Siwe, A. 1983. Stone, clay, earth, laterite. In: Appropriate building materials of low cost housing, African region: proceedings of a symposium, Nairobi, Kenia, 7-14 November 1983. Volume 2. (New York: Spon), pp. 40-49. Steÿn, J.J. & Bosman, G. 2010. The story of the great plans of men and mice: selling sustainable earth construction. Human Settlements Review 1(1) pp. 196-216. Steÿn, J.J. & Joost-Smit, P. 2006. Informal small brickyards in Free State townships are enhancing local economic development. Acta Structilia, 13(1) pp. 82-105. Steÿn, J.J. 2004. The role of small local brickyards in economic Development: a case study of Botshabelo, South Africa. (Seaford: U.K Regional Studies Association). pp. 10-12. Steÿn, J.J. (Ed.). 2009. Research report: a South African renaissance: acceptability of sustainable, high quality, earth constructed public and private buildings to support local sustainable economic development. (Bloemfontein: University of the Free State, Department of Urban and Regional Planning). Van den Berg, J.H. 1974. Metabletica of leer der veranderingen: beginselen van een historiche psychologie. 26th edition. (Nijkerk: Callenbach).
98

Zimbardo, P.G. & Leippe, M.R. 1991. The psychology of attitude change and social influence. (New York: Mc Graw-Hill).
99

100

SMART OPTIMISATION AND SENSITIVITY ANALYSIS IN WATER DISTRIBUTION SYSTEMS
Philip R. PAGE 1
1 Built Environment, Council for Scientific and Industrial Research, Pretoria, South Africa. Email:
[email protected] Keywords: model, network, pipe, sensitivity, water
Abstract
Parameter uncertainty in water pipe network models are studied using newly developed simplified mathematical notions. These enable studies to be done using public domain software, including EPANET. The results obtained can be easier to use and interpret than those obtained from more general mathematical notions. The general idea is to study how a flow- and pressure-related quantity varies as a set of state parameters are varied. The quantity considered here is the average pressure, enabling smart optimisation of a water distribution system by keeping the average pressure unchanged as water demands change, by changing the speed of the pumps. Another application area considered, using the same mathematical notions, is the study of the sensitivity of parameters. Two models are analysed as examples, showing how smart optimisation works, and what the sensitivity of various sets of parameters are. The various parameter categories have very different sensitivities to a given change in the average pressure that can be tolerated. The critical state parameters to determine accurately in the models depend on the network. For the combined schemes studied as examples, variation of the pressure with reservoir depths is only related to the reservoir depths, and the pressure does not vary with the tank diameters. There is a relationship between variations of the various pipe parameters for both the Hazen-Williams and Chezy-Manning pipe major friction loss formulas. It holds for any network where there are no pipe minor friction losses. Pipe diameters are the most sensitive, pipe roughness coefficients are medium sensitive, and pipe lengths are the least sensitive.
1. Introduction
In order to build a smart water distribution system, which optimises in real time in response to water demand variation, the underlying pipe network model that represents the system needs to be a robust representation of reality. This means that the uncertainty associated with input parameters of the model which are not exactly known should be small enough to lead to model-predicted water flow rates and pressures that are in an acceptable range consistent with reality. This is referred to as sensitivity of parameters. Input parameters that are not known with sufficient accuracy need to be determined more accurately. A smart water distribution system will optimise the water flow rates and pressures by changing one set of input parameters in response to a change in another set of input parameters. This is referred to as smart optimisation of parameters. For example, a change in water demands can lead to a change in pump characteristics, so that either the water flow rates or pressures remain unchanged (on average). The study of the sensitivity of parameters most generally involves various techniques that are computationally complicated to implement (see “literature review” later), and hence are not available unless specialised software is purchased or written. Here we propose a simplified, although generally less flexible, method to study sensitivity that can be implemented with public domain software like EPANET (Rossman, 2000). It studies sensitivity by looking at the effect a subgroup of parameters all changing in the same way, and its effect on, for example, the average of pressures. It will be shown that the mathematical notions defined for the study of the sensitivity of parameters can directly be used to study the smart optimisation of parameters, but are limited to cases where one set of input parameters changes in the same way in response to a another set of input parameters changing in the same way. For example, all water demands tend to rise or fall depending on the time of the day, and all pump rates can adjust by rising or falling accordingly. The advantage of the limitations on smart optimisation is that no specialised software is needed for the analysis. In summary, it will be shown that the mathematical notions enable the study of sensitivity, as well as smart optimisation, using public domain software. After defining the mathematical notions, both sensitivity and smart optimisation are studied for a simple network and one realistic network of a South African village. In the case of the sensitivity study, the influence of the uncertainty of various parameters sets is investigated. Specifically, reservoir water levels, tank dimensions, pump curves, as well as pipe types, diameters and lengths are considered. Such a study determines the accuracy needed for these sets of parameters, and motivates which sets of parameters should be determined more accurately. To the best of our knowledge, the mathematical notions have not been developed elsewhere. Although more general techniques are available, they cannot be implemented with public domain software, considerably reducing their use in the community.
101

This research is conducted within the context of the model being an accurate representation of reality when the network is accurately constructed, and the parameters are well chosen. Weaknesses of the modelling framework itself are beyond the scope of this work. The water distribution system concepts used are those in standard models like EPANET.
2. Literature Review
Sensitivity analysis (Frey et al., 2002) is a tool that may be used to ascertain Forward use: how much the outputs of a given model depend on each or some of the input
parameters; Backward use: how variation in the outputs of a model can quantitatively or qualitatively be
apportioned to different uncertain inputs. This work uses sensitivity analysis notions. Since nominal range sensitivity analysis (NRSA) is the easiest sensitivity analysis method to implement and understand (Frey et al., 2002), we develop a sensitivity analysis formalism based on this method. It is a mathematical, rather than a statistical, method. NRSA allows only a single state parameter to vary at a time. This work extends this to multiple parameters varying in a specific correlated way. A recent application of mathematical (as opposed to statistical) sensitivity analysis to the hydraulics of a water distribution system is a method for calibration, pipe diameter design, and input uncertainty assessment (Möderl et al., 2011). This GIS-based sensitivity analysis method, which is closely related to NRSA, is obtained from the mathematical notions developed here by applying Eq. 3 below, but allowing only one state parameter to scale. A mathematical sensitivity analysis method that allows individual parameters to vary independently, i.e. not correlated as in Eq. 3 below, was used for ranking the relative importance of pipes (Izquierdo et al., 2008). Such a sensitivity matrix analysis is computationally efficient (Izquierdo et al., 2008), and more general than NRSA, but is also considerably more complicated. There have been some recent studies about the hydraulics of a water distribution system, e.g. on water age via GIS-based sensitivity analysis (Sitzenfrei et al., 2014), and about demands via sensitivity matrix analysis (Sanz et al., 2015).
3. Mathematical Development
3.1 Parameter Variation
The analysis of a pressurised water distribution network involves the construction of a network with N internal nodes (junctions), and L links (or lines) joining the external and internal nodes. A link has water flowing at rate qk through it, and each individual node has pressure pj at the position of the node. Here
are solutions of coupled non-linear equations. Each flow rate is taken to be positive for the base-case solution, and a pressure is usually positive. (If a flow rate is not positive, is can be made positive by reversing the direction of the corresponding link). External nodes are by definition either reservoirs or tanks. To solve the equations, the state of the system must first be specified by a set of base-case parameters
Examples of such parameters are pipe lengths and water demands. (Note that in standard water distribution models, the demand at an internal node is a state parameter, not a flow rate qk). The solutions of the equations can formally be denoted as a non-linear function f, such that the solution vector (q,p) = f(x). Backward sensitivity analysis and smart optimisation both involve the inversion of f. Although complicated in general, a meaningful case where it is simple is presented in the formalism below. Consider the parameter state label set corresponding to all parameters. Let X be a subset of that parameter state label set 1,…,M and C (the complement) be the set containing the remaining elements. Define
Hence a subset of the state parameters is scaled by a common factor r (e.g. all pipe lengths can be scaled by a common factor, while other parameters are not scaled). Allowing scaling via a common dimensionless factor is a natural choice. For example, the reliability with which the length of a pipe is known may well be proportional to the length of the pipe; the amount with which water demand changes may well be proportional to the size of the water demand. Applications where the state parameters of all the pipes change together according to Eq. 3 have particular practical use. For example, if all pipe lengths are scaled, the pipe length of the entire network changes such that the length of each individual pipe changes in the same proportion. This hence captures "the length of the network changing". Similarly change of the roughness coefficients and diameters of the entire pipe network can be studied.
102

According to Eq. 3 the real number r is mapped into the solution vector according to
Hence as r varies a line is traced out in solution space. Consider a function g(q,p), mapping into a real number. Introduce the function h defined by
Although the full solution of backward sensitivity and smart optimisation problems involves the inversion of f, which maps a vector into a vector, these problems will be studied here as an inversion of the much simpler function h, which maps a number into a number. Assume the function h is defined on a region around r=1. In this work a meaningful choice of g will be studied for practical applications. Let T be a subset of the internal node label set 1,…,N, which has NT elements. Define the specific instance of g as gm, and the specific instance of h as P, such that
Here εj denotes a sign which can have the value -1 or 1. When all the εj are unity, gm is the average pressure in the selected internal nodes. If the average pressure is uncertain within certain limits, which uncertainty in the pipe lengths is allowed? To solve such backward sensitivity problems, the lower and upper uncertainty limits of h are specified to be respectively
which are then solved for the limits of r. This gives the limits of the state parameters by using Eq. 3. The solution procedure involves the inversion of the function h, which is assumed to be invertible.
3.2 Linearization
If some state parameters vary around the base-case parameters with r very near to 1, i.e.
using the Taylor expansion. Practically, this equation is used as follows. Choose state parameters satisfying Eq. 3 with r very near to 1. Calculate Δh using software (including the public domain software EPANET). Then deduce D from Eq. 8.
3.2.1 Smart Optimisation
The problem of interest is to scale a set of parameters together, and then to scale another set of parameters together, so that the average pressure remains unchanged. The smart optimisation applications in this work therefore use h=P from Eq. 6, with T the internal nodes with non-zero water demands and all signs equal to unity. However, the results in this section are for general h. The procedure for smart optimisation is as follows. Obtain D1 and D2 for two sets of scaling state parameters X1 and X2 respectively, representing deviations around the same base-case parameters. Then, given the scaling value r1, determine scaling value r2 such that
yielding
3.2.2 Sensitivity
Assume h(r) to be within the specified uncertainty limits
103

Then applying Eq. 8 the deduced uncertainty limits are
This gives limits of the state parameters according to Eq. 3. The procedure for a linear backward sensitivity study is as follows. Obtain D for a set of scaling state parameters X, representing deviations around the base-case parameters. Then, given the value Δh, determine Δr in accordance with Eq. 12. In order for the procedure to be meaningful, Δh must represent a tolerance that is allowable for the water distribution system. The sensitivity applications in this work assume that the "average" pressure has a certain tolerance. They therefore use h=P from Eq. 6, with T the entire internal node label set and the signs chosen in such a way that
This ensures that the pressure difference at each node contributes with the same sign, implying that the effect of some nodes cannot cancel that of others, meaning that the effect of each node is taken into account constructively. Eqs. 10 and 12 are the main results to be used. Even though they are only exact for r very near to 1, they will be used for values near to 1 as well.
3.3 Time Dependence
Time is not a state parameter. Most the quantities discussed here are in principle functions of time. For example, smart optimisation can be performed at various times as the hydraulic network evolves. For the examples discussed in this paper, the state parameters and network controls are assumed to be time-independent. Correspondingly, only the stationary solution is discussed. In practice, this means that the parameters are constant over a time scale longer than the timescale that the hydraulic network settles into a stable state (the relaxation time). Particularly, the water demands and reservoir levels are time-averaged quantities. Smart optimisation is performed over a timescale longer than the relaxation time.
4. Network Models
4.1 Idealised Model
Consider the model in Figure 1. Water is pumped from the two reservoirs by two pumps. The water pushes up into the tank, and stabilizes at a certain level in the tank. There are water demand points at nodes 3 to 6. The model is referred to as “idealised” because many parameters are chosen to be the same to enable the results to be easily understood. The base-case parameters are as follows. All elevations above sea level are at 200 metres (m) (including the water level of the reservoirs), except for the tank minimum water surface level at 230 m. The depths of the reservoirs are 10 m. Pumps 1 and 2 produce duty flows of respectively 40 and 20 litres/second (ℓ/s) at duty head 35 m (referred to as pump speed 1). The tank has a diameter of 20 m. The non-zero demands at nodes 3, 4, 5 and 6 are respectively 9, 12, 15 and 18 ℓ/s. All pipe lengths are 1000 m, all pipe diameters are 300 mm, and all pipe Hazen-Williams roughness coefficients are 100. All parameters are expressed in the units shown.
104

Figure 1 Idealized model. Unless shown otherwise, a link is a pipe. The flow rate along the links is
displayed in ℓ/s. The pressure at the nodes is displayed as pressure head in m. The tank level stabilizes at 3.4 m.
Parameters are varied from the base-case solution to obtain the derivatives D from Eq. 8. These derivatives are shown in Table 1. They are measured in m, and their size should be compared to the average pressure head of the internal nodes considered.
Table 1 Results for the idealized model.
† The deduced value of Δr is too large to be consistent with the Taylor expansion approximation used to obtain Eq. 12. However if average pressure variation significantly smaller than 5 m is considered, pipe length and roughness can vary widely to be consistent with the average pressure, so that these parameters are “insensitive” to the average pressure.
Assume all water demands rise from the base-case demands by 5.0%. Using the values of D from Table 1 and Eq. 10, it follows that the pump speed must be increased by 1.4% to keep the average pressure of the demand nodes the same. Similarly, if the water demands falls from the base-case demands by 5.0%, the pump speed must be decreased 1.4% to keep the average pressure of the demand nodes the same. In this way a smart water distribution system can be optimised to keep the average pressure of the demand nodes the same. For the sensitivity study, the influence of the uncertainty of all relevant parameters sets is investigated. The derivatives D from Eq. 8 are shown in Table 1. Assuming that the average pressure head at the internal nodes varies by +5 m from the base-case average pressure head of 34 m, Eq. 12 is used to obtain Δr, shown in Table 1. This level of variation is a fair representation of how accurate the average pressure head should be known in a real water distribution system. Requiring that the average pressure head at the internal nodes to be known by 5 m, implies the following extreme cases:
105

the pump speeds must be known extremely accurately (up to 5.3%); the pipe lengths do not have to be known accurately; the tank diameter does not have to be known at all.
From Δr the uncertainty in the parameter, Δx, is calculated from Eq. 3 and shown in Table 1. Requiring that the average pressure head at the internal nodes to be known by 5 m, implies that
the pump speeds (up to 0.053) and demands (up to 3.6 ℓ/s for the 18 ℓ/s demand node 6) must be known extremely accurately;
the pipe diameters (up to 95 mm) and reservoir depths (up to 5 m) are probably known to the required level of accuracy;
the pipe lengths and roughness coefficients do not have to be known accurately; the tank diameter does not have to be known at all.
The analysis shows that the critical parameters to determine accurately are the pump speeds and the demands.
4.2 Village Model
Consider the model in Figure 1, based on data for a South African rural village. As in the idealised model, water is pumped from the reservoir by a pump. The water pushes up into the tank, and stabilizes at a certain level in the tank. Some of the base-case parameters are as follows. Elevations above sea level vary in this hilly terrain and tend to decrease as the three pipe lines are followed away from the tank. The tank is at the highest elevation, and has a diameter of 10 m. The depth of the reservoir is 10 m. The pump produces a duty flow of 6.4325 ℓ/s at a duty head of 8 m (referred to as pump speed 1). The total demand from all the taps is 6.4325 ℓ/s. Pipe lengths vary: the total length is 7559 m. Pipe diameters vary in the range 50-90 mm, and almost all pipe Hazen-Williams roughness coefficients are 100. In the base-case solution obtained, the flow through the pipe equals 6.4325 ℓ/s.
Figure 2 Village model. The taps are indicated by “T”, and all have non-zero-demands. The pipes are
indicated by “P”. The tank level stabilizes at 3.0 m.
Assume all water demands rise (fall) from the base-case demands by 5.0%. From Table 2 it follows that the pump speed must be increased (decreased) by 8.0% to keep the average pressure of the demand nodes the same.
106

Table 2 Results for the village model.
Assuming that the average pressure head at the internal nodes varies by +5 m, the calculated values of Δr are shown in Table 2. Requiring that the average pressure head at the internal nodes to be known by 5 m, implies the following extreme cases:
the pipe diameters must be known extremely accurately (up to 6.9%); the demands must be known accurately (up to 15%); the reservoir depth and pipe lengths need to be known least accurately, and are probably known to
the required level of accuracy; the tank diameter does not have to be known at all.
The analysis shows that the critical parameters to determine accurately are the pipe diameters and the demands.
4.3 Relationship between various Pipe Parameters
Assuming that there are no pipe minor friction losses in a network, we have been able to show for the Hazen-Williams pipe major friction loss formula that the friction, and hence all flows and pressures in the network, will be the same if (Page, 2015)
Here three separate scaling possibilities are considered in Eq. 3, with X referring to either (1) all the pipe lengths in the network, (2) all the pipe diameters in the network, or (3) all the pipe Hazen-Williams roughness coefficients in the network. The scaling is denoted by rL, rD and rC respectively. The second relationship in Eq. 14, which only holds if Δr is very small, can then be used to obtain a relationship between the derivatives D in Eq. 8 for the three cases (noting that Δh in Eq. 8 is assumed to be the same for the three scaling possibilities) 1. In fact, if D is very accurately calculated in Eq. 8, and is derived from the same function h for the three classes of pipe parameters, then the values of Δr calculated from Eq. 12 (examples of which are listed in Table 1 and Table 2) should exactly satisfy the second relationship in Eq. 14. It can be verified that the values of Δr in Table 1 and Table 2 are well represented by this relationship. The same considerations to be above for the Chezy-Manning pipe major friction loss formula lead to
where N refers to the Manning roughness coefficient.
5. Findings and Discussion
In this paper research looking at water distribution networks from a novel angle is reported. The models demonstrate how much pump speeds need to be adjusted for the same variation of all the demands, in order to keep the average pressure the same. The various parameter categories have very different sensitivity to changes in the average pressure of the internal nodes. It is not currently known how the order of sensitivity
1 The first relationship in Eq. 14 is consistent with the values of D in the idealized model in Table 1 for r = 1.01 where the evaluations of D were performed, up to numerical differences which have known explanations. The same is true of the village model in Table 2, except that here additional numerical differences are caused by the fact that different P satisfying Eq. 13 were used for the different pipe parameters.
107

varies from one network to another. The critical parameters to determine accurately are hence network dependent. Both networks considered as examples are combined schemes (having operating pumps and demand balancing tanks). The idealised scheme is in a pump-network-tank configuration, while the village scheme is in a pump-tank-network configuration. Within the limits of the types of schemes analysed, the following salient features emerge about the derivative D: For variation in the reservoir depth, D equals the reservoir depth, independent of the network. D = 0 m for variation in tank diameter, independent of the network. There is a relationship between D for the various pipe parameters that holds exactly. Such a relationship exists for both the Hazen-Williams and Chezy-Manning pipe major friction loss formulas. It holds not only for combined schemes, but for any network where there are no pipe minor friction losses. The uncertainties in the pipe parameters, Δr, corresponding to the same pressure and/or flow uncertainty, satisfies the second relationship in Eq. 14 for Hazen-Williams, and the second relationship in Eq. 15 for Chezy-Manning. Pipe diameters are the most sensitive, pipe roughness coefficients are medium sensitive, and pipe lengths are the least sensitive. Further technical issues emanating from this research are: All parameters were taken to vary in the same direction in Eq. 3, which should be a reasonable condition
when X refers to parameters of the same nature. Are there certain parameter sets of the same nature in certain networks for which this will not give reliable results?
The case where g is the average pressure was employed in this paper (in Eq. 6). Which other choices of g have significant applications?
6. Conclusion and Further Research
The investigation originated from a desire to have a simple overview of state parameter sensitivity for the purpose of determining which parameters need to be determined more accurately during field work or from other sources of parameter data. Hence parameter uncertainty in water pipe network models is studied using newly developed simplified mathematical notions. These enable studies to be done using public domain software, including EPANET. The general idea is to study how a flow- and pressure-related quantity varies as a set of state parameters are varied. The quantity considered here is the average pressure. The sensitivity of parameters (i.e. which parameters need to be determined accurately) is studied. Smart optimisation of a water distribution system is also studied, using the same mathematical notions, by keeping the average pressure unchanged as water demands change, by changing the speed of the pumps. Two models are analysed with applications in the two areas. The results in this paper are specifically relevant to quick smart optimisation and sensitivity studies using public domain software. Further research could unearth how the sensitivity of various parameter sets depends on the network. It may also introduce emerging mathematical developments which lead to more robust conclusions than those presented here.
7. Acknowledgement
The village model was built by Mathabo Masegela, with assistance from myself, Frances A’Bear and Sonwabiso Yoyo.
8. References
Frey, H. C. & Patil, S. R. 2002. Identification and review of sensitivity analysis methods. Risk Analysis, 22, vol. 3, pp. 553-578. Izquierdo, J., Montalvo, I., Perez, R. & Herrera, M. 2008. Sensitivity analysis to assess the relative importance of pipes in water distribution networks. Mathematical and Computer Modelling, 48, pp. 268-278. Möderl, M., Hellbach, C., Sitzenfrei, R., Mair, M., Lukas, A., Mayr, E., Perfler, R., & Rauch, W. 2011. GIS based applications of sensitivity analysis for water distribution models. In Beighley, E. R. & Killgore, M. W., editors. World Environmental and Water Resources Congress 2011: Bearing Knowledge for Sustainability, pp. 129-136, American Society of Civil Engineers. Page, P. R. 2015. Scaling laws for sensitivity analysis of water distribution systems. In preparation. Rossman, L. A. 2000. EPANET 2 user manual. Technical Report EPA/600/R-00/057, U.S. EPA, pp. 1-200. Sanz, G. & Pérez, R. 2015. Sensitivity analysis for sampling design and demand calibration in water distribution networks using the singular value decomposition. Journal of Water Resources Planning and Management. Published 7 April 2015. Permalink: http://dx.doi.org/10.1061/(ASCE)WR.1943-5452.0000535. Sitzenfrei, R. & Rauch, W. 2014. Integrated hydraulic modelling of water supply and urban drainage networks for assessment of decentralized options. Water Science & Technology, 70.11, pp. 1817-1824.
108

SMART SUSTAINABLE ENERGY FOR THE RURAL BUILT ENVIRONMENT
Stefan SZEWCZUK 1
1 Built Environment, CSIR, P O Box 395, Pretoria, Email: [email protected] Keywords: Clean energy mini-grids, renewable energy, sustainable socio-economic development
Abstract
In his February 2015 State of the Nation Address, President Zuma stated that there are still 3.4 million households in South Africa without electricity. Most of these households are in the rural areas and are largely dependent on traditional biomass and coal for survival. South Africa has a dire need for safe, affordable and clean forms of energy to enable productive economic activities to generate much needed income. Based on international collaboration, this paper will cover the development of a robust methodology to adapt innovative and renewable smart grid technologies to deliver real and sustainable decentralised energy solutions for remote and rural communities, thereby improving livelihoods and opportunities for inclusive growth for the rural built environment. This shall be achieved not just through technical innovation, but importantly by integrating it with both social and business innovation to also address the wide-ranging impact of climate change. This international collaboration is amongst the Eastern Cape Provincial Government, CSIR, the Global Research Alliance, the United Nations Environmental Programme (UNEP), and the Carbon Trust, amongst others. The overarching objective is to influence South African national policy and the UN’s Sustainable Energy for All (SE4All) programme.
1. Introduction
It is generally recognised that access to energy services plays an important role in economic development. However, the linkages between the provision of energy and poverty alleviation through economic development are not fully understood and it can be argued that this lack of understanding contributes to the relatively slow pace of energisation of the African continent. Africa’s economic priorities are strongly formed by the need to alleviate poverty. With more than 500 million people currently without access to electricity and with more than 600 million people dependent on traditional biomass for survival on the African continent, Africa has a dire need for safe, affordable and clean forms of energy to enable productive economic activities to generate much needed income. The delivery of new energy services must be based on an integrated and holistic approach where Africa’s priorities such as potable drinking water, sanitation, food security and poverty reduction are included in any paradigm for development. Integrated thinking across the energy, water and carbon nexus is essential, as is the interplay between social, economic and environmental principles and policies. Even within the energy economy understanding the supply of energy and its use in a development context is complex as shown in Figure 1 that illustrates the linkages to various sectors of the economy and the associated cross cutting issues (Venter et al, 2004)
Figure 1 Holistic nature of the energy economy.
Two of the key crossing cutting issues within this landscape, namely access to good and validated information data and statistics, together with sound policy and how it intersects and implemented or
T
R
A
N
S
F
O
R
M
A
T
I
O
N
-Coal
-Oil
-Natural gas
-Biomass
-Solar
-Wind
-Hydro
-Nuclear
-Waves
-Geothermal
-Waste
-Conservation
Tra
nsp
ort
Agr
icult
ure
Indust
ry
Min
ing
Com
merc
e
House
ho
lds
Sectors of the Economy
Environment
Information, Data, Stats
Efficiency, Conservation
Policy
Energy Supply Energy Demand
Cro
ss c
utt
ing
Li quid Fuels
Electricity
Gas
Solids (Coal, Biomass, ..)
T
R
A
N
S
P
O
R
T
A
T
I
O
N
&
D
I
S
T
R
I
B
U
T
I
O
N
109

exemplified through an integrated smart sustainable energy solution for the household sector forms the rationale behind the clean energy mini-grid initiative described in this paper. Conventional centralised generation and distribution energy solutions that prevail at the top of the pyramid are being rapidly transformed by the introduction of smart grid technologies and large-scale renewable energy systems. For remote and rural communities at the base of the pyramid, however, the transformation has little value. The financial overhead and slow deployment of long-distance electrical transmission, the expense of large-scale renewables and the information and communication technologies (ICT) requirements of smart grid methodologies mean that many of the recent technical innovations in the energy space fail to yield impact where energy access is at its lowest. To date, the South African electrification programme has been extremely successful from a policy, institutional, planning, financing and technical innovation perspective as described by Bekker et al (2008). The focus on electrification and energisation, though, has moved from chasing numbers of connections mainly in the urban areas, to one of achieving sustainable economic and social benefits mainly in the rural areas. With approximately 80% of the urban areas and approximately 45% of the rural areas being electrified there are still approximately 3.4 million households without electricity – this being unevenly distributed amongst the provinces, and as mentioned between rural and urban areas.
1.1 Sustainable Energy for All (SE4All)
“Widespread energy poverty condemns billions to darkness, to ill health, to missed opportunities. Energy poverty is a threat to the achievement of the Millennium Development Goals. It is inequitable and unsustainable. Children cannot study in the dark. Girls and women cannot learn or be productive when they spend hours a day collecting firewood. Businesses and economies cannot grow without power. We must find a way to end energy poverty. And with climate change a growing menace to all, we must also rethink conventional energy solutions. We can no longer burn our way to prosperity. Fortunately, providing sustainable energy to all offers benefits for developed and developing countries alike. It can enable developing countries to leapfrog over the energy systems of the past and build the resilient, competitive, clean energy economies of the future.” Ban Ki-moon Secretary General UN Sustainable Energy for All (SE4ALL) is a global initiative led by the Secretary-General of the United Nations, Ban Ki-moon to achieve universal energy access, improve energy efficiency, and increase the use of renewable energy. It was launched to coincide with the designation of 2012 as the International Year of Sustainable Energy for All by the UN General Assembly in December 2010, (UN, 2015). The Sustainable Energy for All initiative is intended to attract global attention and public and private commitments to meeting three objectives by 2030:
Ensuring universal access to modern energy services Doubling the rate of improvement in energy efficiency Doubling the share of renewable energy in the global energy mix
The CSIR is collaborating with the United Nation Environment Programme (UNEP) to not only develop clean energy mini-grid projects for South Africa but also to have an impact on the UN’s SE4All initiative.
2. South Africa’s First Hybrid Mini-Grid Energy Systems
To gain first hand understanding of the complexity of smart sustainable energy for rural community development, CSIR undertook a three year investigative project to investigate the linkages between communities, energisation, the economy and the environment/ecosystem as well as identify any projects that could be implemented. Due to its impoverished state, particular attention was given to the Eastern Cape Province of South Africa in this project (Szewczuk et al., 2000). During this project an innovative analytical tool was developed that could be used to assist in identifying viable renewable energy opportunities in areas with no prospect of grid electrification in the Eastern Cape Province using wind, hydro and biomass-powered remote area power supply systems. The analytical tool utilises Geographical Information Systems (GIS) and provides the basis to investigate various scenarios. An outcome of the above described project was the identification of two renewable energy based projects in the Wild Coast region of the Eastern Cape Province of South Africa. With the endorsement of the South African Cabinet, the then Minister of Minerals and Energy mandated the then National Electricity Regulator (NER) to facilitate the implementation of hybrid mini-grids to inform decision and policy makers on this form of energisation to complement the South Africa electrification programme. The NER contracted the CSIR to develop an implementation plan for these hybrid mini-grid energy systems at Hluleka Nature Reserve and at Lucingweni village. The implementation was carried out by Shell Renewables (Szewczuk, 2006). Figures 2 and 3 show the hybrid mini-grid energy systems at Hluleka Nature Reserve and at Lucingweni village respectively on the Wild Coast region of the Eastern Cape Province.
110

Figure 2 Hybrid mini-grid system at Hluleka Nature Reserve
The electricity generation system for the nature reserve is provided by two small wind turbines, each being a Proven 1.5 kW machine, and a photovoltaic array consisting of 48 X 100 W solar panels. The electricity generation system has a nominal capacity of 11kW. Included in the electrical generation system is a control system, batteries for electricity storage and a diesel generator as a backup. This system provided the electricity for the electrical appliances for the nature reserve, namely lighting, office equipment etc. Solar power via photovoltaic panels is used for pumping water out of a nearby river before the water is treated in a filtration plant. Hot water for the chalets is provided by solar water heaters and liquid petroleum gas (LPG). Due to the erratic solar insulation of the nature reserve LPG is also used to supplement the solar water heaters in providing hot water. LPG is also used for cooking.
Figure 3 Hybrid mini-grid system at Lucingweni village
Electricity generation at Lucingweni village is achieved through the use of a combination of solar photovoltaic panels and wind generators and their associated control, accumulation and distribution equipment providing a nominal electricity generation capacity of 86kW. In brief this consists of the erection of six mast mounted wind generators (6 m tall), an array of 560 solar photovoltaic panels mounted on steel structures and a brick structure to house the batteries and control system. The hybrid mini-grid system at Lucingweni village is completely based on renewable energy and there is no diesel generator as a back-up. CSIR’s participation in the conceptualization and implementation of South Africa’s pilot hybrid mini-grid energy systems lessons have been learnt in obtaining practical know-how and experience towards developing appropriate integrated energy systems that will contribute towards the energisation of not only South Africa but Africa is general.
111

One of the major barriers to implementation of clean energy systems in rural areas is the sociological dimension of introducing new technologies to communities who are not aware of the benefits that such technology can provide. This sociological dimension is understood to be an extremely complex issue but is not yet fully investigated. To address the above issue the following drivers have been identified:
Energy & economic development are linked and the application of renewable energy in rural areas should be integrated into local economic planning activities.
Poverty and lack of capacity in rural communities and their governance structures requires that such energy introduction be integrated with community development and training programs.
An Integrated, support based systems approach is required, with emphasis given to relentless measurement of all processes.
An approach should be dynamic, systematic, subject to standards, responsive, and able to be duplicated throughout Africa.
Based on the above drivers the challenge of establishing new economic activities linked to renewable energy based systems was taken up and to assist in this challenge the author developed the Integrated Energy Economic Framework as a contribution to achieving sustainable socio-economic development. See Figure 4.
Figure 4 Integrated Energy Economic Framework
Key factors to note in the methodology outlined in Figure 4 are:
the linkage, via Cost Benefit Analysis (CBA) and Life Cycle Analysis (LCA), of economic activities (demand side) to energy (supply side)
intervention measures to stimulate new activities these intervention measures must take into account other conditions such as markets, water,
infrastructure, telecommunications, natural resources and industry. sociological facilitation to ensure community ownership and sustainable enterprise management. environmental externalities such as Green Certificates and Clean Development Mechanisms (CDM)
3. Decentralized and Smart Electrification
Increasingly, the technical opportunity for energising the developing world and in particular remote and rural areas is framed around the concept of mini-grids and decentralised power, as discussed comprehensively by Berry et al, (2010). The direction is well motivated, alleviating many of the encumbrances that have thus far inhibited the rapid, affordable, sustainable and reliable deployment of large-scale centralised energy systems. Indeed, at least to some extent, the notion of decentralised power has been embraced by the developing
112

world, with Nepal, India, Vietnam and Sri Lanka each hosting between 100 and 1,000 schemes and the World Bank funding more than 30 off-grid projects. There is an opportunity, then, to build on these important and pioneering first steps and move towards something bolder, more holistic and codified. However it also needs to be recognised that many mini-grid and decentralised energy efforts in the developing world are often narrow in scope, focussing on delivering meaningful, though very specific, outcomes for a single community rather than a scalable, replicable and financially sustainable solution. Moreover, many such systems become derelict due to poor community fit, inappropriate business models and technical maintenance complexities. Beyond decentralised electrification is smart electrification. There are truly impressive gains being made in the smart grids space that have not found optimal application in developing world mini-grids. Smart grid technologies that focus on dynamic demand management, automated battery control, low-cost solar forecasting, intelligent refrigeration, optimal grid planning and automated fault detection and diagnosis all have the potential to deliver significant savings, increased reliability and improved energy quality in a development and especially low carbon context. But integration of such technologies is non-trivial; it requires a reassessment of financial cost, an understanding of local energy needs, development of new business models and community engagement practices and an acknowledgement that many of the assumptions which hold in the developed or urban world are much less certain in a development context (i.e. communications availability and reliability; end-use appliances and behaviour patterns). There is an opportunity here to not only explore and qualify the nature of existing systems (and lessons learned), but to plot a course for widespread, sustainable and fit-for-purpose smart mini-grid solutions in a South African context. Insight and trialling of innovative community engagement practices that are married to small-scale smart grid technologies and decision support tools that highlight smart mini-grid options across the South African landscape (from both an environmental, economic and demographic perspective) will deliver methodologies and documentation for driving technical and policy innovation in this space. To satisfy the requirements for rural energy solutions, smart sustainable energy has to be done within the context of the complex green economy policy landscape. Within that landscape will be a network of actors and stakeholders. Such as CSIR and Risø DTU of Denmark, (Szewczuk et al., 2010), in investigating the development of a wind energy industrial strategy for South Africa that provides an example of how an analysis of stakeholders and theirs roles can be used by the intended target market (for instance the Department of Trade and Industry) as a reference document in the development of national sector development strategies. From a technical innovation perspective and in the area of mini-grids and micro-grids, prior work has focussed principally upon reviewing technologies, internal capability, developing fundamental science and gaining deployment and simulation experience. Outputs include works that describe the state and future of micro-grid systems and components, (Platt et al 2009 and Szewczuk et al., 2001), renewable resource availability in South Africa using geographic information systems (GIS), (CSIR et al., 2008) and the Wind Atlas for South Africa (Mortesen et al, 2012). Software decision support tools for distributed generation (Berry et al., 2009 and Kok et al., 2009) and micro-grid experiments, case studies and simulations (Szewczuk et al., 2011 and Berry et al., 2010), including pilot hybrid mini-grid energy systems in Hluleka Nature Reserve and Lucingweni village in South Africa. Socio-economic studies and reports have focussed upon identification of optimal tools for connecting poverty alleviation with energy availability, system dynamics modelling (Greben et al., 2005) and the development of economic assessment tools for local energy supply (TNO et al., on-going and Montalvo et al., 2012). The key to building upon the body of work out there is to move away from distinct and separated technical and socio-economic streams, as has principally been the case and to integrate, unify and extend prior work and then to present it in an engaging and thoughtful manner to a wide range of stakeholders.
4. Project Design and Methodology
The Smart Sustainable Energy for Rural Built Environment project builds on the preceding work described above and aims to capture, address and innovate around those challenges and perceptions regarding renewable and clean energy systems and their incorporation into a low carbon economy. With the dual challenge of alleviating poverty through establishing new economic activities based around energy access, the project plans to make use of various social, business model and technological innovations. The implementation of such innovation will be supported by good research, development and application, with an overarching objective being to gain insight and understanding of the linkages between energy, societal needs and the economy in developing communities with a view to replication into other communities. Figure 5 provides an overview of the Smart Sustainable Energy for the Rural Built Environment project and its various components. The main components of the project relate in particular to Technical Innovation, Social Innovation and Business Innovation. The Innovation Application and Spin-in Innovation spheres represent more the environment within which the project is planned to operate in.
113

Figure 5 Overview of Smart Sustainable Energy for the Rural Built Environment
4.1 Technical, Social, Business Spin-In and Application Innovation
The introduction of Smart Sustainable Energy involves technical, behavioural, socio-economic and policy aspects. Successful innovations for the Base-of-the-Pyramid (BoP) have to be:
Affordable: people with limited financial resources are able to purchase the innovation
114

Acceptable: the innovation fits with the belief system of people at the BoP Appropriate: the innovation provides a suitable solution for a user need Accessible: the innovation is readily available for BoP users, in terms of distribution network and
required knowledge to operate and maintain the innovation. Smart Sustainable Energy will deliver impact through three streams:
Social Innovation: all aspects related to users being able to adopt the innovation Business Innovation: all aspects related to the ecosystem of stakeholders that is involved in
delivering the innovation to the user Technical Innovation: all aspects related to the development and application of technologies to
enable sustainable and reliable power. Spin-in Innovation
The other opportunities presented by the Project are those technical innovations or future developments to energy systems that could be added on or “spun-in” to the Project during its lifetime. It must be recognised that the Project is not principally about developing new or cutting edge technologies on photo-voltaic systems or battery storage for instance, but rather the smart integration of existing renewable technologies in a mini-grid context. Innovation Application
On the periphery of the Project is the broader environment within which the Project operates, influences and is influenced by – namely what we have termed ”Innovation Application”. This includes the institutional and regulatory environments at different levels together with the services, enterprises, skills and job creation that electrification can benefit, as well as the broader sustainable development imperative of a nation – namely climate change, and the green economy.
5. Discussion and Conclusion
The foundation of the Smart Sustainable Energy for Rural Built Environment project is essentially “smart electrification” and integrating technical, social and business innovation in the solution and journey of engagement. Figure 5 provides the overview to the project. However it must be noted that Figure 5 is based on the combining of field experience based on previous projects that have been implemented. For example, CSIR’s contribution is based on field experience in South Africa’s first hybrid mini-grid energy systems at Hluleka Nature Reserve and Lucingweni village the experiences of the CSIRO of Australia and the TNO of the Netherlands also playing a major contribution.. There is a genuine opportunity for rural communities to leapfrog the conventional paradigm of power. Where conventional electricity delivery is reliant on expensive, slowly deployed, polluting and centrally controlled generation (with its spider web of infrastructure and dependence on decades-old technologies), these communities can harness innovative, low carbon, renewable, agile, smart and mini-grid/decentralised generation to rapidly deliver tailored, appropriate and sustainable energy, potentially with increased speed, reduced cost and importantly better societal and economic fit and outcomes. Such a marked paradigm shift requires technical, social, government and business innovation, engagement and buy-in. This Project will enable the corner-stones of such work to be established in South Africa with an ultimate vision of application into the broader and beyond via the United Nation’s Sustainable Energy for All (SE4All) initiative. In narrative form, the components of this design led innovation will be:
a living roadmap as a platform of knowledge and direction promoting universal energy access, supported by systemic modelling and simulation decision support tools that can assess the impact of
different policy interventions, exemplified by real-world trialling of pilot smart sustainable energy for selected rural communities in
and, deployment of smart sustainable energy solutions with modularity, scalability and associated
business cases and livelihood development impact. These components will be underpinned by an inclusive innovation engagement process with collaboration, cooperation, participation and co-creation across stakeholders at its core so as to engage and empower citizens, communities, private sector and local government. Together with mechanisms to strengthen the science-policy interface so that the Project can provide the necessary information for policies to be updated, implementation strategies to be developed and exemplified, and institutional capacity and decision making improved. Figure 6 illustrates the above mentioned narrative in an overarching research design for the Project - integrating social, technical business innovation in a policy landscape
115

Figure 6 Overarching design of Smart Sustainable Energy for the Rural Built Environment project
That integration will be reflected in the 5 main components of the research: Component 1 – Landscape & Roadmap to Promote Universal Access to Energy (review) Component 2 – Decision Support Tools to Assess Policy Interventions (analysis & modelling) Component 3 – Real world Trialling of Pilot Smart Sustainable Energy Solution (testing) Component 4 – Deployment of Smart Sustainable Energy Solution with business models Component 5 – Inclusive Innovation Engagement Process (co-creation and dissemination)
Currently the project team is using this paper as a basis to solicit funding to execute this project.
6. Acknowledgements
Alistair McMaster and Stanley Semelane both from the Eastern Cape Provincial Government. Stephanie von Gavel, Executive Manager of the Global Research Alliance (GRA), made the effort to travel to South Africa to obtain first-hand experience of the socio-economic developmental challenges facing the rural areas of the Eastern Cape Province of South Africa. Other team members from GRA who need to be acknowledged are Dr Adam Berry from CSIRO in Australia and Max Schreuder and Pieter Verhage, both from TNO in the Netherlands. Further acknowledgments go to Chris Cooper from the United Nations Environment Programme (UNEP) and Ian Cooke and Jon Lane, both from the Carbon Trust in the UK.
7. References
Berry, A. and Cornforth, D.J. and Platt, G.M., Multi-objective Optimisation and Mini-grid Planning. IEEE Power Engineering Society General Meeting, 2009, Calgary, Alberta, Canada. Berry, A., Chadwick, M., Cornforth, D., Lindsay, S., Lizier, J. and Prokopenko, M. (2010) Minigrid Deployment and Operation – Recommended Practices. For the Australian Commonwealth Government, Department of Environment, Water, Heritage and the Arts (DEWHA) Bekker, B., Eberhard, A., Gaunt, T. and Marquard, A., South Africa’s rapid electrification programme: Policy, institutional, planning, financing and technical innovations, Energy Policy, 2008, Vol. 36, pp 3125-3132. CSIR, Eskom and National Renewable Energy Laboratory, South African Renewable Resource Database and Electrification Planning Tool (RRDB), 2008, For the South African Government, Department of Minerals and Energy Greben J., Holloway J., Ramokgopa L. and Stylianides T., Sustainable Development Using Energy as a Catalyst – Technical Report TR-2005/24 – CSIR Centre for Logistics and Decision Support, 2005. Kok,J.K, Scheepers,M.J.J. and I.G. Kamphuis,I.G. Intelligence in Electricity Networks for Embedding Renewables and Distributed Generation in Intelligent Infrastructures, Springer, Intelligent Systems, Control and Automation, 2009, Science and Engineering Series Montalvo, C., Boons, F., Quist, J.N., Wagner, M., Sustainable innovation, business models and economic performance: An Overview, 2012, Journal of Cleaner Production. Mortensen, N, Hanses, J., Kelly, M., Szewczuk, S., Mabille, E. And Prinsloo, E., Wind Atlas for South Africa, 2012, Prepared for SANEDI
116

Platt, G., Cornforth D.J. and Berry, A. Review of Mini-grid Research and Development around the World. 2009, For the Australian Commonwealth Government, Department of Environment, Water, Heritage and the Arts (DEWHA) Szewczuk S, Fellows A, and van der Linden N, Renewable energy for rural electrification in South Africa, European Commission, FP5 Joule-Thermie Programme, 2000. Szewczuk S, Martens JW, de Lange T, Morris RM and Zak J, 2001, Strategy to accelerate the market penetration of renewable energy technologies in South Africa, European Commission DG XVII Szewczuk S, (2006), Hybrid mini-grid energy systems: A report for the National Electricity Regulator, CSIR Report No. 86CB/HEDDQ. Szewczuk, S., Markoe, H., Cronin, T., Lemming J.K. and Clausen, N.E., Investigation into the development of a wind energy industrial strategy for South Africa, 2010, Report prepared for the UNDP and Danida. Szewczuk, S., Cronin T., Cronje W., Dalglish, A. Modular form of electrification in rural communities in South Africa, Pre-feasibility report prepared for the South African Royal Danish Embassy, 2011. TNO, ICCO and the Fair Climate Fund, Sustainable Energy Potential Scan for CDM. Developed and tested in India and Ethiopia, 2007-ongoing UN, 2015, Sustainable Energy for All, http://www.se4all.org, accessed 7 November 2015 Venter G.P.N. and Manders P.T., Effective energy supply and use in development context, Industrial and Commercial Use of Energy, International Conference Towards Sustainable Energy Solutions for the Developing World, 10-11 May 2004, Somerset West, South Africa.
117

118

FACTORS AFFECTING HOUSEHOLD RECYCLING BEHAVIOUR IN TOWNHOUSES IN PRETORIA, SOUTH AFRICA
Jacques DU TOIT
1
Claire WAGNER 2
Lizelle FLETCHER 3 1 Department of Town and Regional Planning, University of Pretoria, Email: [email protected] 2 Department of Psychology, University of Pretoria, Email: [email protected] 3 Department of Statistics, University of Pretoria, Email: [email protected] Keywords: household recycling behaviour, townhouses, Theory of Planned Behaviour
Abstract
Municipalities worldwide are under increasing pressure to reduce the amount of solid waste ending up in landfills. One way of doing so is to increase household participation in recycling. Although existing research identifies several factors affecting household recycling behaviour, South Africa poses a unique situation with regard to attitudinal and spatial factors. Socio-political transformation arguably causes many South Africans to be less concerned about the environment, while increasing living costs and fear of crime drive many households into smaller enclosed housing developments, especially townhouses, where several factors may impact recycling behaviour. Using the Theory of Planned Behaviour, this paper examines the effect of three factors on household recycling in townhouses, including ‘attitude’ (about recycling), ‘subjective norm’ (peer pressure), and ‘perceived behaviour control’ (ability to recycle). A survey of 300 households using self-administered questionnaires was conducted in Equestria, an enclosed middle-income residential estate in Pretoria-east consisting of 13 different sub-estates, most of which are typical townhouse complexes. Both recyclers and non-recyclers showed positive attitudes toward recycling and felt peer-pressure to recycle. Non-recyclers, however, felt significantly less able to recycle. Most recyclers as well as non-recyclers indicated that various different interventions toward increasing recycling within townhouses may well cause them to recycle more, most notably a system where recycling companies collect recyclables from collection points inside the complex.
1. Introduction While recycling of solid waste is a well-established practice in many developed countries, South Africa unfortunately lags behind in this regard. For example, although the South African Department of Environmental Affairs and Tourism (DEAT, 2000) identified recycling as a strategic goal towards integrated waste management, only about 10% of waste is recycled (DEAT, 2012). Moreover, current legislation requires all major towns and cities to initiate programmes for waste separation at source by 2016. Household participation in recycling is evidently important if the latter is to be achieved. However, only 3.3% of households in South Africa currently recycle (Oelofse, 2012). Such a low level of participation requires closer examination of household recycling behaviour, especially in enclosed medium-density spaces such as townhouses – a housing type that has showed noticeable growth in South Africa over the last decade mostly due to rising living costs and fear of crime (housing 3.3% of the total population in 2004 to 3.5% in 2014 (Statistics South Africa, 2015)). International research on factors affecting household recycling behaviour abounds, highlighting the interplay of various factors, particularly moral or attitudinal (e.g., see Botetzagias et al., 2015; Park & Ha, 2014; and Pakpour et al., 2014). However, research in South Africa is limited – let alone research that focuses on recycling in townhouses. Anderson et al. (2013) examined household recycling behaviour in urban areas in South Africa, while Kamara (2006) examined recycling behaviour in the City of Tshwane Metropolitan Municipality (which includes Pretoria). Both found low levels of awareness about environmental implications of household waste and consequent low levels of participation in recycling, especially amongst African households. Oelofse and Strydom (2010) examined drivers of recycling both in a household- and industry context and found higher participation levels amongst households where members were better educated and more environmentally conscious. Given the South African context, as well as the unique features of townhouse complexes, a question arises about the relative effect of different social and physical factors on recycling behaviour in townhouses. To what extent are current levels of recycling in townhouses affected by different social and/or physical factors, and how may planners and designers best respond to facilitate recycling in townhouses? The aim of this paper is therefore to examine factors affecting household recycling behaviour in townhouses in South Africa. The challenges associated with socio-political transformation arguably cause many South Africans to be less concerned about the environment (Anderson et al., 2013). Moreover, townhouses pose a unique set of challenges to recycling. Kitchens and backyards are typically smaller than what many South Africans are used to, while the lack of communal facilities for recycling as part of the layout of complexes
119

may also hamper recycling. A further challenge is the restricted access to such complexes that may deter recycling companies, while managing agencies and house rules may also be unaccommodating of recycling. The setting under investigation in this study is Equestria, an enclosed middle-income residential estate of about 1 250 units located on the eastern edge of Pretoria. Equestria consists of 13 sub-estates, most of which are townhouse complexes that each have their own enclosure and controlled access. Thus, sub-estates in Equestria are effectively double-enclosed. Townhouse complexes in Equestria are typically of medium-density with either single- or double storey units averaging around 90 square meters. Outdoor spaces such as backyards and private gardens are generally small or non-existent. Communal spaces are usually limited to storage space and visitor parking. The subsequent section presents a theoretical model that incorporates both social and physical factors in the study of recycling behaviour.
2. Theoretical Model
Since its conception, Ajzen’s (1985) Theory of Planned Behaviour (TBP) has become a popular psychological theory for explaining environmental behaviour and is widely used in studies on recycling (e.g., see Botetzagias et al., 2015; Tonglet et al., 2004). Figure 1 depicts the TPB in terms of the interrelationships between its central constructs.
Figure 1 Theory of Planned Behaviour.
According to the TPB, three factors guide human behaviour, including: ‘attitude’ towards a certain behaviour (i.e., beliefs about the consequences of performing the behaviour), ‘subjective norm’ (i.e., perception of others’ expectations of one to perform the behaviour, notably peer pressure), and ‘perceived behavioural control’ (PBC) (i.e., how much control one believes one has to perform the behaviour, notably the ability to perform the behaviour). The interaction between these three factors leads to an intention to perform certain behaviour. If people’s attitude towards a certain behaviour is positive, there is enough peer-pressure, and they believe they are able to perform the behaviour, then their intention to perform that behaviour – in this case, recycling – should be strong (Ajzen, 2013). The subsequent section discusses how recycling behaviour was examined in Equestria using the TPB.
3. Research design and methods
A household survey was conducted in Equestria during August 2014. Data were collected by means of self-administered questionnaires at a single point in time in order to gain quantifiable data (Bryman, 2012). The research team first designed a questionnaire to capture basic socio-demographic characteristics of households and their recycling behaviour in terms of the TPB. The team formulated items to measure TPB constructs considering the literature as well as the South African social- and spatial context. Table 1 shows the items that were used to measure the constructs of ‘attitude’ (towards recycling), ‘subjective norm’ (peer pressure), and PBC (ability to recycle). ‘Attitude’ and ‘subjective norm’ were measured with normative statements about recycling and five-point Likert scales ranging from ‘agree completely’, ‘agree’, ‘neither agree nor disagree’, ‘disagree’ to ‘disagree completely. ‘PBC’ was also measured on a five-point Likert scale, albeit a different type that measured the extent to which households were able to recycle or not.
Attitude
Subjective norm
Perceived behavioural control
Intention Behaviour
120

Table 1 Questionnaire items used to measure TPB constructs
‘Attitude’ (about recycling)
‘Subjective norm’ (peer pressure)
‘Perceived behaviour control’ (ability to recycle)
“Please indicate the extent to which you agree or disagree with the following statements:”
“Please indicate the extent to which you agree or disagree with the following statements:”
“On a scale of 1 to 5, with ‘1’ being ‘not at all’, and ‘5’ being ‘to a large extent’, to what extent…”
Recycling is important for the sake of the environment. Recycling is not worth the cost incurred by recycling companies. Recycling is important to help reduce waste in municipal landfills. Recycling is not worth the effort incurred by households.
My family and friends would like me to recycle my household waste.
My neighbours would approve of me recycling my household waste.
My local authority (City of Tshwane) expects me to recycle my household waste.
…do you have information on what, where, when and how to recycle?
…is there sufficient space or facilities within your house to do recycling?
…is there sufficient space or facilities in your yard to do recycling?
…is there sufficient space or facilities inside your estate to do recycling?
…does your body corporate or resident association promote or support recycling inside your estate?
…do recycling companies have
access to your estate to collect recyclables?
…do you have access to a kerbside or collection point for recycling just outside your estate?
Actual recycling behaviour was determined by asking households whether they recycled any paper, glass, metal or plastic in the past three months. (No distinction was made between ‘intention’ and ‘behaviour’ in this study.) Following translation of the questionnaire to include an Afrikaans version, the questionnaire was piloted and submitted to a faculty committee for ethical clearance. After Equestria’s management agency granted permission for the survey, six students from the University of Pretoria negotiated with stakeholders to gain access to five sub-estates within Equestria. These five sub-estates exhibited typical design features of townhouse complexes in South Africa. The students surveyed 300 units across the five sub-estates using simple random sampling. They first had to identify the head of the household in each sampled unit, introduce the study, obtain informed consent, and then ask heads of households to complete the questionnaire in their presence. Upon completion of the survey, random spot-checks were conducted on each student’s batch of questionnaires (respondents were asked to provide anonymous contact details). After this procedure data were captured, cleaned, and analysed in IBM SPSS Statistics 22. As some Likert scales were reversed, the research team were able to identify a response set in two cases. These two cases were removed to yield a final sample of 298 valid responses.
4. Findings
Households in Equestria are predominantly headed by females, persons aged between 19 and 35 years, and persons with tertiary qualifications. The average household size is around three persons. There was no formal recycling system in Equestria at the time of the survey, while some residents indicated that previous attempts failed due to poor organisation and lack of participation. Households that do recycle probably use various other systems outside the estate. Consequently, only about 31% of households recycled paper, glass, metal or plastic in the past three months. The subsection below focuses on the determinants of recycling behaviour in Equestria, followed by possible interventions to increase household participation in recycling.
121

4.1 Determinants of Recycling Behaviour
A factor analysis was first conducted to evaluate the construct validity of ‘attitude’, ‘subjective norm’ and ‘PBC’ as per Table 1. Using SPSS, three factors were extracted employing the method of principal components, followed by an oblique rotation with Kaiser Normalization to account for correlations among the factors. Table 2 shows the results of the analysis.
Table 2 Factor analysis of the validity of TPB constructs (pattern matrix)
Questionnaire items
(See Table 1)
Factor
1
(PBC) 2
(Attitude) 3
(Subjective norm) ...do recycling companies have access to your estate to collect recyclables? 0.681
...does your body corporate or resident association promote or support recycling inside your estate?
0.660
...do you have access to a kerbside or collection point for recycling just outside your estate?
0.633
...is there sufficient space or facilities within your house to do recycling? 0.539
...do you have information on what, where, when and how to recycle? 0.468
Recycling is important to help reduce waste in municipal landfills 0.406 0.284
Recycling is not worth the effort incurred by households 0.665
Recycling is not worth the cost incurred by recycling companies 0.579
...is there sufficient space or facilities in your yard to do recycling? 0.536 -0.557
…is there sufficient space or facilities
inside your estate to do recycling? 0.471 -0.507
Recycling is important for the sake of the environment 0.463
My family and friends would like me to recycle my household waste 0.772
My neighbours would approve of me recycling my household waste 0.766
My local authority (City of Tshwane) expects me to recycle my household waste
0.651
‘Subjective norm’ showed good validity, as all three its items loaded clearly by themselves on a separate factor. ‘PBC’ and ‘attitude’ showed reasonable validity, as most of their items also loaded by themselves on separate factors. ‘To reduce waste in municipal landfills’ cross-loaded highly on PBC, indicating that this item may actually be a control factor. Similarly, two control items about ‘sufficient space’ cross-loaded highly, though negatively, on ‘attitude’. However, shaded factor loadings show that these three items still correlate reasonably well with their intended constructs, especially the two control items about ‘sufficient space’. The effect of different factors on household recycling behaviour in Equestria can now be examined in terms of the TPB. Table 3 shows composite mean ratings for each of the constructs of ‘attitude’, ‘subjective norm’ and ‘PBC’ for both recyclers and non-recyclers, coupled with T-test results for group differences.
122

Table 3 Group differences regarding TPB constructs
Construct Group N Composite
mean SD t-statistic p-value
Attitude Recyclers 91 1.619 0.528
-1.874 .062 Non-recyclers 199 1.750 0.596
Subjective norm
Recyclers 91 2.150 0.754 -1.954 .052 Non-
recyclers 197 2.354 0.952
PBC Recyclers 91 2.709 0.854
4.233 .000* Non-recyclers 199 2.264 0.781
Note: *Significant at the .05 level. (Equal variances not assumed.) Table 3 shows that there were modest differences between recyclers and non-recyclers with regard to ‘attitude’ and ‘subjective norm’ (0.05 < p <0.1). In fact, recyclers and non-recyclers feel almost equally positive about recycling, with little variation in responses amongst recyclers and non-recyclers themselves regarding their attitude towards recycling (SD = 0.528 and 0.596 respectively). Similarly, both recyclers and non-recyclers felt peer-pressured to recycle, although perhaps less so than what their own positive attitude may cause them to do so. However, there was a statistically significant difference between recyclers and non-recyclers with regard to ‘PBC’, with non-recyclers seeing significantly less opportunity to recycle within Equestria compared to recyclers (p < 0.001). Thus, the perceived ability to recycle (or lack thereof) appears to be the only factor in terms of the TPB foremost effecting household recycling behaviour in Equestria, at least with regard to whether households have recycled paper, glass, metal or plastic in the past three months or not.
4.2 Possible Interventions to Increase Household Participation in Recycling
The questionnaire concluded with five-point Likert scales that asked households about the extent to which four possible interventions may cause them to recycle more or not, with ‘1’ being ‘not at all’ and ‘5’ being ‘to a large extent’. The possible interventions included: #1 Provision of facilities for recycling as part of the kitchen layout (e.g., space for additional refuse
bins); #2 Provision of facilities for recycling as part of the backyard (e.g., space for containers or additional
wheelie-bins); #3 Provision of a system whereby the body corporate/resident association arranges access for a
recycling company to collect recyclables from collection points inside the complex/estate; and #4 Provision of a system whereby the body corporate/resident association arranges access for a
recycling company to collect recyclables from the kerbside (sidewalk) inside the complex/estate. Table 4 shows mean ratings for each intervention for both recyclers and non-recyclers, coupled with T-test results for group differences.
123

Table 4 Group differences regarding interventions
Intervention Group N Mean SD t-statistic p-value
#1
Recyclers 90 3.644 1.501
1.710 .089 Non-recyclers 195 3.313 1.566
Combined 285 3.418 1.551
#2
Recyclers 91 3.791 1.442
2.105 .037* Non-recyclers 194 3.397 1.541
Combined 285 3.523 1.519
#3
Recyclers 89 4.045 1.278
1.571 .118 Non-recyclers 193 3.782 1.359
Combined 282 3.865 1.338
#4
Recyclers 87 4.046 1.284
2.069 .040* Non-recyclers 192 3.698 1.339
Combined 279 3.806 1.330 Note: *Significant at the .05 level. (Equal variances not assumed.) Each possible intervention is likely to cause households overall to recycle more, albeit to some extent only, considering that all of the combined means fall between ‘3’ and ‘4’ on a five-point scale. However, standard deviations suggest considerable variation in responses amongst both recyclers and non-recyclers, suggesting that some households may now start to recycle, or recycle even more than they currently do, while others may still not recycle at all or recycle anything more than they currently do despite these interventions. Intervention #3 (providing collection points for recyclables inside the estate) is likely to increase recycling the most, while, in addition, there were no statistically significant differences in the ratings for Intervention #3 between recyclers and non-recyclers (p = .118). Intervention #4 (collecting recyclables from the kerbside (sidewalk) inside the estate) is second most likely to increase recycling, although there were significant differences in ratings between recyclers and non-recyclers (p = .040), with recyclers significantly more likely to recycle even more compared to non-recyclers. Interestingly, Intervention #1 (providing facilities for recycling as part of the kitchen layout) was rated least likely to increase recycling. Such an intervention may have been expected to increase recycling significantly as it is ‘closer to home’ compared to the other interventions. However, this result may have two possible explanations, if not more. On the one hand, households may think that kitchen layouts in townhouses are not so much the problem, and that recycling may better be served through other means. On the other hand, households may think that kitchens in townhouses cannot really accommodate any additional facilities, and that they would rather take recyclables to collection points inside the estate – perhaps even on a daily basis. Further research is needed to confirm these explanations.
5. Conclusion
This paper examined factors affecting household recycling behaviour in townhouses in Equestria, an enclosed middle-income residential estate in Pretoria-east. Using the Theory of Planned Behaviour, the paper examined the relative effect of three factors, including ‘attitude’, ‘subjective norm’, and ‘perceived behavioural control’. Both recyclers and non-recyclers showed positive attitudes toward recycling and felt peer-pressure to recycle. Non-recyclers, however, felt significantly less able to recycle. While households had access to recycling systems outside their estate, there was, in fact, no formal recycling system inside their estate at the time of the study. Proper planning and design of townhouse complexes to help facilitate recycling, coupled with the establishment of well-managed and accessible recycling systems, can therefore significantly increase household participation rates in recycling. Most recyclers as well as non-recyclers indicated that various different interventions toward increasing recycling within townhouses may well cause them to recycle more. These include the provision of facilities for recycling as part of the kitchen layout and backyard, as well as a system whereby recycling companies collect recyclables from either the kerbside or, more so, from collection points inside the complex. The stronger preference for collection points is probably due to a number of perceived benefits for households. Households can drop recyclables at collection points that are within walking distance from their units; thereby reducing the need to store recycles in kitchens or backyards, or to travel outside their complex to dispose of recyclables. Limiting recycling companies to collection points make them less of a nuisance or
124

security threat to households, while sidewalks are then also kept clean of recyclables. Collection points rather than kerbside collection are also likely to be more cost effective for recycling companies. Planners and designers can easily incorporate all of the above interventions in the development of townhouse complexes. However, much also depends on how well recycling programmes are managed within townhouse complexes, and how well households are informed to use them. It should be noted that the findings here are limited to a single residential estate consisting of different townhouse complexes. Further research is needed into household recycling behaviour in enclosed medium-density housing types, both in South Africa and abroad. The questionnaire items developed as part of this study provide a useful basis for such research, while further research can serve to test and refine questionnaire items.
6. Acknowledgement
The following students served as fieldworkers for this research whilst they were final-years in the Bachelor of Town & Regional Planning at the University of Pretoria: Jean-Pierre Adendorff, Kailash Chetty, Ryno Coetzer, Johan Herbst, Dineo Lesejane, and Zamanhlenga Mpanza.
7. References
Ajzen, I. 1985. From intentions to action: A theory of planned behaviour (Chapter 2). In: J. Kuhl, & J. Beckman, Action control: From cognition to behaviors. Springer: New York, pp. 11–39. Ajzen, I. 2013. Constructing a TPB questionnaire: Conceptual and methodological considerations. Downloaded from http://people.umass.edu/aizen/pdf/tpb.measurement.pdf Anderson, B., Romani, J., Wentzel, M. & Phillips, H. 2013. Recycling behaviour among urban South Africans: The role of race and social status. Downloaded from www.psc.isr.umich.edu/pubs/abs/8920 Botetzagias, I., Dima, A-F. & Malesios, C. 2015. Extending the Theory of Planned Behavior in the context of recycling: The role of moral norms and of demographic predictors. Resources, Conservation and Recycling, 95, pp. 58-67. Bryman, A. 2012. Social research methods (4
th ed.). Oxford University Press: New York.
Department of Environmental Affairs and Tourism (DEAT). 2000. White paper on integrated pollution and waste management for South Africa. Downloaded from www.environment.gov.za/sites/default/files/legislations/integrated_pollutionand_wastemanagement_0.pdf Department of Environmental Affairs and Tourism (DEAT). 2012. National waste information baseline report. Downloaded from www.sawic.environment.gov.za/documents/1880.pdf Kamara, A. 2006. Household participation in domestic waste disposal and recycling in the Tshwane metropolitan area: An environmental education perspective. Pretoria: University of South Africa. Oelofse, S. 2012. All South African households in large centres to separate household waste by 2016. Downloaded from http://www.csir.co.za/enews/2012_nov/01.html Oelofse, S.H.H. & Strydom, W.F. 2010. The trigger to recycling in a developing country – in the absence of command-and-control instruments. Proc. of Waste 2010: Waste and Resource Management – Putting Strategy into Practice, pp. 355-364. Pakpour, A.H., Zeidi, I.M., Emamjomeh, M.M., Asefzadeh, S. & Pearson, H. 2014. Household waste behaviours among a community sample in Iran: An application of the Theory of Planned Behaviour. Waste Management, 34, pp. 980-986. Park, J. & Ha, S. 2014. Understanding consumer recycling behaviour: Combining the Theory of Planned Behaviour and the Norm Activation Model. Family and Consumer Sciences Research Journal, 42, pp. 278-291. Statistics South Africa. 2015. Superweb interactive data. Downloaded from www.statssa.ac.za on 10 September 2015. Tonglet, M., Phillips, P.S. & Read, A.D. 2004. Using the Theory of Planned Behaviour to investigate the determinants of recycling behaviour: A case study from Brixworth, UK. Resources, Conservation and Recycling, 41, pp. 191-214.
125

126

A STRONG RESEARCH ENVIRONMENT FOR SUSTAINABLE RENOVATION ESTABLISHED IN SWEDEN
Kristina MJÖRNELL
1
Paula FEMENIAS 2
Jenny STENBERG 3
Dennis JOHANSSON 4
1 SP Technical Research Institute of Sweden and Lund University: [email protected] 2 Chalmers University of Technology, Gothenburg, Sweden: [email protected] 3 Chalmers University of Technology, Gothenburg, Sweden: [email protected] 4 Lund University, Lund, Sweden: [email protected] Keywords: Collaboration, research environment, sustainable integrated renovation
Abstract
A strong research environment for Sustainable Integrated Renovation (SIRen) has been established in Sweden, gathering scientists from the engineering and social sciences and from the real estate management sector all of which hail from a large number of academic institutions and institutes, together with committed industry and public actors. The focus of the research conducted within SIRen has been on the complexities of the renovation of existing buildings and the redevelopment of urban areas, along with the issues involved in conforming to objectives for reduced climate change, altered demographics, and democracy in planning, which are among the most important challenges for contemporary society to be handled within the economic context of construction, without the aid of national subsidies. The approach has been inter- and transdisciplinary, with a solid basis in disciplinary research. Contemporary practices which fail to integrate societal objectives with environmental protection have been challenged, and research which supports the sector’s ability to deliver increasing sustainability has been produced. The research has integrated technical, environmental, economic, architectural, and cultural issues in renovation, taking the social dimension as its starting point, and focused on multi-value approaches and multi-stakeholder involvement. Specific results achieved so far are: a resource bank of up-to-date knowledge; models for integrated sustainable renovation including specific methods and tools; Living Labs and demonstrations; a platform for a Triple Helix dialogue to support sustainable renovation; a basis for developing education in the field. The results are intended to maximise the probability of the replication of models and methods, and to trigger large-scale market uptake, targeting similar blocks, buildings, and districts in Sweden or Europe in need of renovation.
1. Introduction
Sweden, like many other nations, faces a large-scale and urgent need for the renovation of post-war building stocks which have reached the end of their technical service lives. To ensure quality and effectiveness from different perspectives – environmental, economic, and social – and to enhance the professional quality of renovation processes, a concretisation of models for integrated sustainable renovation and development is needed. Sustainability in the built environment calls for the coordination of a variety of actors and processes of interaction and negotiation, as well as institutional changes. Discrepancies between stakeholders, as well as diverse and sometimes contradictory discourses, agendas, and interests, can create communicative barriers and have been identified as some of the most significant obstacles to the realisation of sustainable practice (Häkkinen & Belloni, 2011). Sustainable Integrated Renovation (SIRen) is a recently established research environment which has gathered scientists from the engineering and social sciences and from the real estate management sector all of which hail from a large number of academic institutions and institutes in Sweden, together with committed industry and public actors. SIRen focuses on the complexities of the renovation of existing buildings and the redevelopment of urban areas, along with the issues involved in conforming to objectives for reduced climate change, altered demographics, and democracy in planning, which are among the most important challenges for contemporary society to be handled within the economic context of construction, without the aid of national subsidies. The approach is inter- and transdisciplinary, with a solid basis in disciplinary research. Contemporary practices which fail to integrate societal objectives with environmental protection have been challenged, and the aim has been to produce research which supports the sector’s ability to deliver increasing sustainability. The research integrates technical, environmental, economic, architectural, and cultural issues in renovation, taking the social dimension as its starting point, and focuses on multi-value approaches and multi-stakeholder involvement. Within SIRen, knowledge is gathered and methodologies for sustainable and integrated renovation are developed and implemented, with the aim of changing national renovation practice and strengthening the international competitiveness of Swedish renovation practice and research. This is realised by the following activities:
Establishing a knowledge base
127

Documenting and analysing earlier and on-going cases of renovation Testing and accelerating the diffusion of innovation through demonstrations and Living Labs Developing models, methods, and tools for integrated and sustainable renovation Communication, dialogue, and dissemination of results
The research environment functions in collaboration with the National Centre for Renovation at Lund University, and forms a foundation for the development of additional research, further innovation, and attracting new funding. The impetus to start a strong research environment came from a group of researchers from different disciplines and with different backgrounds and experience. More researchers were invited to participate in a core steering group, and others were invited to join a resource pool of experts. In November 2013, the research environment was granted 2.5 million Euro to be received over the course of five years, by the Swedish Research Council, on the condition that the Swedish construction industry took part and contributed in the form of in-kind resources corresponding to an equal amount of money. During 2014, a great deal of effort was made to convince the industry to write contracts and join the research environment. At present, SIRen consist of 11 researchers in a core and steering group, and an additional 16-20 researchers in the expert pool, all of whom contribute to the work. The participants belong to: Lund University, Chalmers University of Technology, The Royal Institute of Technology, Luleå University, SP Technical Research Institute of Sweden, Umeå University, University of Dalarna, Gotland University, and Malmö University. Most of the researchers belong to the fields of engineering and architecture, but some come from real estate management, and social sciences related to construction. By May 2014, no less than 27 companies and organisations had joined the initiative:
Four municipal housing owners, of which one is a parent organisation for all of the municipal housing in Gothenburg, together owning and managing over 100,000 apartments.
Three large nationally and internationally active contractors (Skanska, NCC, and PEAB). Eight consultancies: Two large technical consultancies; one large architectural consultancy and one
small; one consultancy in the built environment, one specialising in renovation, and one in post-war housing stock; a small design consultancy.
Three suppliers: One of solutions for façades, one of ventilation systems, and one of bath and kitchen renovation concepts.
Sector organisations: The Swedish Client Construction Forum, The Construction Industry's Organisation for R&D, The Sector Organisation for Ventilation and Plumbing Companies, and the Swedish Tenant’s Association.
Municipal agencies: The City of Malmö, The Energy Agency of Skåne, The City Museum in Gothenburg, and Region Västra Götaland (division for heritage) as well as one governmental agency; The National Board of Housing, Building and Planning.
2. Literature review
The refurbishment of existing buildings is a top priority in order to reach climate goals. In 2011, the Building Performance Institute Europe, (BPIE) emphasised the critical role of refurbishment in relation to various pathways to achieving the 2020 decarbonisation goals (Europe's Buildings under the Microscope, 2011). To reach the 2050 target, renovation must be doubled or tripled as compared to the current situation. Sweden, like many other nations in Europe, faces a large-scale and urgent need for the renovation of post-war building stocks which have reached the end of their technical, economic, and service lives. The government and the building sector, however, are not prepared for these challenges. There is no policy with which to tackle both the housing shortage and affordability, at the same time as regulations push for reduced energy use. In the building sector, knowledge in renovation is highly fragmented and difficult to access for professionals, and the production of new constructions is normative. The training programmes of engineers, architects, and construction workers often focus on new construction, and there is also an identified lack of manpower. Furthermore, new competences are needed in order to handle the complexity of the renovation process, particularly with regard to social aspects. The pragmatic reality of the market, political visions and objectives, municipal and private services, and the needs of inhabitants and citizens must be reconciled so as to create socially, environmentally, and economically sustainable built environments. A short-term and reductionist view which favours low costs and efficiency could lead to devastating and irrevocable losses to existing and functioning social values and architectural/cultural-historical qualities. The SIRen research environment has focused on the five research areas described below.
2.1 Dynamics of Property Management and the Role of the Client
In this area, the participants in the SIRen research environment research the renovation process from technical and economic perspectives, along with social framing. Few scholarly papers have focused on renovation and its specific challenges in relation to sustainability (Thuvander et al., 2012). As compared to new constructions, renovation is a process which is framed by uncertainties and risks. In recent decades, renovation and energy efficiency has been neglected and not prioritised due to low energy prices. Existing methods for facility and property management do not reflect the complexity of reality. Current practices are reactive rather than proactive, and knowledge of the long-term effects of renovation and maintenance strategies is lacking. The changing role of the client in delivering integrated renovation is also studied. A
128

primary challenge for integrated renovation is the necessity for the client to manage the broader involvement of stakeholders representing different interests and other influential or powerful groups such as local authorities, residents, the local community, the property owner, etc. The role of the client should be expanded to include the users, so as to address the complex settings of current construction (Newcombe, 2003).
2.2 Integrated Holistic Design and Effective Renovation Process
In renovation, it is necessary to analyse the building as a whole, factoring in users, managers, technical systems, cultural aspects, and economics (Thuvander et al., 2013). This relates to not only the choice of technologies, but also to renovation methods, design, and socio-economic issues. The design phase affects the whole value chain. Energy-saving should be a natural factor to consider when prioritising different renovation actions. It is rare for renovation to be preceded by necessary analysis. At the same time, there exist methodologies that analyse energy optimisation with respect to profitability, life-cycle assessment, life-cycle cost, and indoor environment (Ostermeyer et al., 2013). Furthermore, renovation is not without its risks. Even simple actions can alter the building function, affect moisture balances, cause comfort concerns, and affect aesthetic qualities (Fink et al., 2015). Another area is energy equipment and systems, with a focus on advanced heating and cooling as well as domestic hot water solutions. Technique is evaluated, but there is a need to integrate results into a holistic design. A multi-scale, cross-disciplinary approach fostering interactions between actors needs to be set up. A validated cross-disciplinary “design for affordable sustainability” framework may support refurbished construction projects, according to the EeB PPP Multi-annual Roadmap (European Commission, 2010).
2.3 Economic Challenges Concerning Renovation
Economic challenges are related to the contemporary practice of calculating profitability and the incentive structure for sustainable and energy-efficient renovation, and to the overcoming of an energy-efficiency gap if one exists. The design of policy tools in relation to decision-making is an identified research question, based on knowledge of how decisions are made and on what basis they are taken (Högberg, 2011). Other important questions relate to the timing of decisions; for example, the question of when certain renovation and energy savings measures should be applied in order to reduce economic burdens during a specific period.
2.4 Citizen/Tenant Empowerment and Democratic Decision-Making
In recent years, the importance of the social dimension as relates to realising sustainability goals has been emphasised. Contemporary housing renovation lacks a relevant discussion related to affordability, the housing shortage, and social stability and cohesion in housing areas, resulting in social exclusion and gentrification. Dissatisfaction with traditional approaches has led to an interest in involving citizens in design and planning. Social inclusion issues closely relate to ‘empowerment’ – a process in which inhabitants/tenants gain knowledge and skills and so play a meaningful role in decision-making, with the purpose of improving the environment and thus becoming producers, rather than mere consumers, of the urban environment. Improving a dialogue to the point of empowerment, however, requires more than simple tool development, and requires systematic changes to e.g. planning offices and housing companies, which entails the need to include such institutions as knowledge producers in research processes (Fung, 2006).
2.5 Innovation and Learning
One common problem in construction relates to good practices not being adopted on a broad scale; another to the fact that broader visions for sustainability are seldom a goal in renovation. In order to support the implementation of integrated sustainable renovation, there is a need to understand the building sector in relation to innovation. Learning and innovation should be understood with respect to social and cultural perspectives (Harty, 2005) and organisational capabilities (Davies & Brady, 2000). There is a need to rethink the roles of all actors, from the management down to the level of construction workers. New construction is normative in both the industry at present and in the training of new professionals; thus, changes to training and education which emphasise learning and collaboration are of great importance.
3. Research Methodology
The SIRen research environment includes disciplinary and interdisciplinary knowledge-building, which function as important complements to transdisciplinary research. In traditional academic research, knowledge is often fragmented in its relation to theory and practice, whereas in action-oriented, transdisciplinary research approaches, the aim is often to link research and practice and create new theory, tools, and practices. A transdisciplinary approach implies joint knowledge production, in which all involved actors are considered to be producers, carriers, and users of knowledge (Carew & Wickson, 2010). Implementation has therefore been an integral part of the research process. Connected to the project are PhD, as well as master’s degree, students, who have facilitated the spread of knowledge to the academic sector. The research methodology has involved openly discussing the approach and/or the research design, data collection, and data analysis to be adapted in the research. One of the most important issues has been the choosing of the most appropriate of a range of possibilities, as well as discussing the appropriateness of the selected methodology. This has been an opportunity for the authors to demonstrate their awareness and understanding of the research tools commonly used in their field, and of how this knowledge is used to inform them in constructing a robust methodology with which to tackle the research problems and questions.
129

Even if there has been a focus on residential buildings, other building types, such as schools, are included in the project. The work has been carried out across five parallel work packages (WP), which are interlinked by the five research focus areas (RA) (Figure 1).
Figure 1 The connections between the five research areas (RA) and five work packages (WP).
4. Findings and Discussion
4.1 Creating a Knowledge Base
Results from earlier research have been collected, evaluated, and structured through the mapping of on-going and recently concluded research projects among the members of the research environment and other actors. Furthermore, a series of easily accessible booklets, each summarising the existing knowledge in a specific field which is of relevance to all actors who deal with renovation, have been produced on various themes. These include the financial or social aspects of renovation, rent control, the renovation of bath rooms the history of housing renovation in Sweden, and results from earlier renovation strategies, as well as a report on existing regulations concerning the technical aspects of renovation, how they are interpreted and implemented, and their effect on cost, environment, social sustainability, etc. Research has also focused on the role of the architect and the contribution of architectural strategies to sustainable and integrated renovation (Femenías & Thuvander, 2015). A compilation of information and evaluation of results from previous renovation projects has been made in order to identify knowledge and information gaps so as to ensure the quality of data. One example is a synthesis of studies on renovation profitability (Farsäter et al., 2015), and another is a literature review on the renovation of multi-family houses built in Sweden between 1950 and 1975, focusing on experiences and results (Femenías, 2015). The mapping of the state of existing building stock in Sweden, consideration of the future needs for renovation, and identification of knowledge gaps through surveys, interviews, literature reviews, statistics, and international data has recently started and will be based on national building stock statistics collected by Statistics Sweden, Lantmäteriet (the Swedish Mapping, Cadastral and Land Registration Authority) the Swedish Energy Agency, and the National Board of Housing, Building and Planning. The data will be used as input in urban strategy models.
4.2 Analysing Renovation Cases
In one study, information regarding concluded renovation projects has been collected and analysed. The aim was to gather, evaluate, and structure existing information, results, and experiences from real renovation projects in cooperation with industry and networks which coordinate efforts to facilitate e.g. energy-efficient renovation, etc. Another study collected quality-assured data from real renovation projects. The research questions focused on what data is required to successfully conclude the follow-up stage and the evaluation and comparison of completed renovation projects, as well as how lack of documentation can influence the renovation process and final results. The data collection was based on questionnaires and interviews with project managers involved in concluded renovation projects in Sweden. Another study analysed the renovation of an office building which was designed and constructed in the 1960s as the head office for one of the main newspapers in Sweden, and was subsequently transformed into an energy-efficient, environmentally-adapted, open office building for the consulting company Sweco. The objective was to perform research on further building system technologies, construction solutions, and potential additional improvements to the thermal performance of the building envelope. This was achieved
WP1
Creating a
knowledge
base
WP2
Analysing
renovation
cases
RA1. Dynamics of property management and the role of the client
RA2. Integrated holistic design and effective renovation process
WP3
Demonstra-
tions and
Living Labs
WP4
Developing
models, tools,
and methods
WP5
Communication
and
dissemination
RA3. Economic challenges related to renovation
RA4. Citizen/tenant empowerment and democratic decision-making
RA5. Innovation and learning
130

through meetings with designers and engineers, the evaluation and processing of collected information, a literature review of possible solutions, an IDA-ICE-based parametric study, and analysis and comparison of results. The results consisted of a comprehensive analysis of the renovation of the Sweco office and an overview of potential alternative high-performance energy systems and building service solutions which would make use of innovative and cost-efficient technologies available on the market.
4.3 Demonstrations and Living Labs
No less than four so-called ‘Living Labs’ were established and studied, in which new methods and tools were implemented in the renovation process and stakeholders were involved in order to achieve a more sustainable and integrated renovation. The Living Labs are located in Hammarkullen and at Siriusgatan in Gothenburg, at the Ulriksberg School in Växjö, and the Tjärna Ängar residential area in Borlänge. The first Living Lab is still on-going, and is being carried out in the suburb of Hammarkullen in Gothenburg – see Figure 2 (Stenberg & Fryk, 2015). This Lab is focused on sustainable property management and maintenance” and how this may affect renovation requirements. It aims to (a) develop methods for the integration of knowledge from the tenants early in the process; (b) discuss with all actors what different lifestyles imply in the context of sustainable renovation; and (c) find forms of participation for tenants in the decision-making process during renovation. Thus, ambitions are high concerning the sharing of power. However – for better or worse – no actual renovation process is taking place, as it was felt that, without the stress involved in a real renovation process for all parties, it would be possible to focus on the learning process. To emphasise these priorities, the project was labelled ‘Learning Lab Hammarkullen’. The involved actors are Bostadsbolaget (municipal housing company), D Carnegie & Co/Graflunds/Real Holding (private housing companies), the Swedish Union of Tenants, SP Technical Research Institute of Sweden, Chalmers University of Technology, the Faculty of Engineering at Lund University, Gothenburg University, Stamfast, and Rotpartner (the last two being private companies for renovation and financing). The actors meet on a regular basis for planning and implementation of the project, and also collaborate closely with university students who, in dialogue with tenants, contribute in an organised manner with work. The challenge is how to organise the common learning process: How can it be formed so as to allow the participants to act on local community reactions and responses in a manner that integrates produced knowledge from all actors, and use it to form proposed new renovation strategies? In August 2015, 65 people in the area were interviewed; 18 were tenants living in buildings owned by a private housing company, 25 lived in municipality-owned apartments, and 22 were interviewed as they passed through the square in Hammarkullen. The comments from the interviews conducted in the apartments dealt with overcrowded apartments, the need to upgrade the bathrooms and balconies, and feelings of lack of security and problems with dirt in staircases and laundry rooms; the comments from the interviews conducted at the square dealt with feelings of lack of security and littering in playgrounds, car parks, and other common areas. 25 people were interested in becoming involved and contributing to the process of improving sustainable property management and maintenance.
Figure 2 The on-going Living Lab Hammarkullen in Gothenburg.
The second Living Lab is the Ulriksberg School in Växjö, which was built in 1950 and is now (as of 2015) in need of adaption so as to meet current and future living requirements. The project is in an early decision phase in which all possible solutions, from varying degrees of renovation of the existing building to the demolishing of the building and construction of a new one, are equally possible. A plan has been made on the municipal level relating to the demands of space and localities, which will serve as a foundation for forthcoming briefs and design documents. Until the time of writing, the study has consisted of meetings between researchers, the owner, and a representative for the municipality who is also a tenant with the aim of designing the research project; in Autumn 2015, however, a study of the preliminary decision-making
131

processes will begin, together with an evaluation of the method and tools to be used to analyse the sustainability of the building. The third Living Lab is the Tjärna Ängar residential area in Borlänge, situated in mid-Sweden, Figure 3. A large part of the study will focus on measures for comfort improvement. In addition, an evaluation will be conducted of the housing organisation's role and actions as relates to the owner's participation and incentives for implementation. A 36-apartment building has been selected as the research subject, and the renovation measures will be implemented and the goals evaluated before 2017.
Figure 3 The Living Lab in Tjärna Ängar, Borlänge.
The fourth Living Lab is Siriusgatan, a residential area which is owned by the public housing company Familjebostäder, in Gothenburg. Here, there are great challenges, as there is a great demand for the technical renovation of the suburban housing stock but a conflicting need to keep rents low, rather than raise them. The plan is to densify the area in order to meet the demands of a more varied housing provision in terms of size, form, and tenure, and find creative methods of upgrading the existing stock. Siriusgatan will be used as a Living Lab for implementing the methodology for sustainable and integrated renovation developed within SIRen. An internship position has been tasked with examining social values and, later, a master’s student and a PhD student will focus on enduser/tenant demand, etc.
4.4 Developing Models, Tools, and Methodologies
A structure of models, methods, and tools such as existing useful templates/checklists (practical methods) is to be set up and distributed so as to make the constituents available and well-known to the renovation sector. Following this, it will be possible to identify the gaps and new tools required to facilitate the inclusion of actors of different backgrounds in the renovation process. The intention is to organise the models, methods, and tools into a scheme, following the renovation process with tools intended for different stakeholders/actors in a manner analogous to former methodologies, e.g. the industry standard ByggaF, which focuses on moisture safety design in the building process, etc. (Fuktcentrum, 2013). Work is on-going to gather information and create tentative models for an enhanced renovation process, building on earlier work in the field (Thuvander et al., 2011; Mjörnell et al., 2014). One area that is in need of further study relates to how to handle existing architectural and cultural-historical values in the renovation, as well as with respect to more everyday functional architecture. Researchers within the disciplines of architecture and heritage engage in developing definitions and assessment methods, as well as simplified methods for the integration of architectural and heritage values in guidelines, tools, and integrated methods for sustainable renovation.
4.5 Communication and Dissemination
One of the earliest research results yielded by the SIRen environment was two debate articles, the first undersigned by 11 professors and assistant professors (Dalenbäck et al., 2014) and the second undersigned by no less than 11 of the involved researchers and actors from the industry (Muld et al., 2015). A number of events and seminars have been arranged, including breakfast meetings, the annual renovation day, which is arranged by the national renovation centre and which gathers together all of the stakeholders in the renovation sector, seminars focusing on specific aspects such as the social, economic, or technical aspects of renovation, contributions to national and international conferences, and other events, such as exhibitions and fairs. Representatives of SIRen also had the opportunity to meet the Minister for Housing, Urban Development and Information Technology and his State Secretary and discuss challenges, possibilities, and positive examples of large-scale renovation, as well as to present work performed in the research environment.
132

Additionally, a number of papers have been published and presented at international conferences (Mjörnell et al., 2014). A series of papers are to be written and published within the strong research environment, the first two entitled “Economic aspects of renovations of housing” and “Do the rental rules lead to the right renovations, analysis and proposals?”, authored by Hans Lind of KTH, and two others have already been published (Lind, 2014; 2015). These are the first in a series of reports which take the construction industry as a target group, and which summarise the state of knowledge in different areas related to sustainable renovation. Courses in the field of renovation will be arranged for master’s and PhD students, as well as training courses for actors active in the renovation sector. A website has been set up to disseminate the results and information generated by the project. http://www.renoveringscentrum.lth.se/siren/
5. Conclusions and Further Research
The strengths of the SIRen research environment are the broad interdisciplinary setting, which gathers together a large number of researchers and forms of expertise in Sweden, and strong industry commitment, as well as the large network which connects all parties. The setting provides an established platform for complementary research and answering calls for proposals from national and European funders. Workshops and seminars have so far resulted in personal connections which support informal knowledge exchange and form a basis for spin-off activities. The involvement of the industry enhances the relevance and usability of research, and will support up-take in the sector. The presence of representatives of municipalities and governmental agencies will potentially decrease the gap between practice, research, and policy-making. There are also a number of challenges for the research environment. While its broad level of participation is a strength, this also leads to issues regarding coordination, administration, and work ethics. The need for the establishing of a series of ethics to govern the sharing of knowledge and ideas, along with collaboration in publications, has been highlighted, and guidelines for behaviour as relates to research have been presented on several occasions. The involvement of both academia and the industry presents challenges regarding reporting, which means that outcomes need to be adapted both to scientific publications and to industry-relevant reports and innovation support. Further, the broad distribution of resources among institutions reflects the inter- and transdisciplinary approaches, but further findings will be needed for more in-depth studies to be conducted. At present, the SIRen research environment focuses mainly on post-war housing stock, which is a reflection of contemporary societal challenges but also the potentially limited skillsets of researchers and participating property owners who represent housing owners. This has been brought forward as a limitation by some industry partners. A broadening of the scope will be solved mainly by additional projects and funding in the future. In action-oriented research projects, such as investigations based on Learning Labs, it is not a huge leap to organise common learning processes to facilitate analysis and theorising. This phase is perhaps the one in which it is of the greatest importance to transfer power from those actors with the most, to those with the least. Such an approach, however, puts high demands on the design of the learning process, as tenants, employees in housing companies, and academics have very different prerequisites as regards their exercising of power, and so the design of the process must be able to handle these inequalities. Ultimately, such an approach could open up for a Learning Lab which creates cultures of capacity-building, where tenants’ everyday lives and difficulties are at the heart of the learning process. The tenants of both Hammarkullen and Siriusgatan have their roots in many countries, and often retain strong connections, in the form of relatives and friends, to these countries. What can they, with their many different experiences of housing and renovation, contribute with in a learning process focusing on sustainable renovation in Sweden? Such interest from authorities and estate owners, not only in terms of joint knowledge production relating to housing, but also to a changed balance of power for inhabitants, would radically change procedures and require entirely new skills and competences from experts and from inhabitants. These are modes of behaviour which must be developed.
6. Acknowledgements
The authors would like to thank The Swedish Research Council Formas, for financial support in actualising the research environment for sustainable and integrated renovation.
7. References
Atkin, B., Skitmore, M. 2008. Construction Management and Economics. Special issue on Stakeholder Management in Construction, 26, pp. 549-676. Carew, A.L. and Wickson, F. 2010. The TD Wheel: A Heuristic to Shape, Support and Evaluate Trans disciplinary Research. Futures, 42: pp. 1146–1155. Dalenbäck, J-O, Johansson, D, Lind, H, Martinac, I, Bröchner, J, Arfvidsson, J, Malaga, K, Mjörnell, K, Gustavsson, L, Jagemar, L, Femenias, P, Olander, S. & Olofsson, T, 2014. Ställ tekniska egenskapskrav och använd deklarationerna. Energi & Miljö (1101-0568). Vol. 2014 (2014), 4, pp. 40-41. Davies, A and Brady, T. 2000. Organisational capabilities and learning in complex product systems: towards repeatable solutions. Research Policy, 29, pp. 931–953. Europe's Buildings under the Microscope, 2011. BPIE Building Institute Europe founded in 2010 by Climate Works, the European Climate Foundation and the European Council for Energy Efficient Economy (ECEEE).
133

Energy-efficient Buildings PPP beyond. Multi-annual Roadmap and longer term strategy, prepared by the Ad-hoc Industrial Advisory Group, 2010. European Commission, Directorate-General for Research, ISBN 978-92-79-15228-3 ISSN 1018-5593. Farsäter, K, Wahlström, Å, Mjörnell, K. & Johansson, D. 2015. A synthesis of studies on renovation profitability, published in CEO 2015 - Proceedings of the 8th Nordic Conference on Construction Economics and Organization. Tampere University of Technology. Department of Civil Engineering. Construction Management and Economics. Report 16. Femenías, P. 2015. Effekter av renovering och bostadsförnyelse: En översikt över tidigare utvärderingar. Centre for Management in Construction and Chalmers University of Technology. SIRen report 2015:02. Femenías, P and Thuvander, L. 2015. Strategies for integrated and sustainable renovation: A stronger voice for architectural knowledge. In Architecture and Sustainability: Critical Perspectives for Integrated Design, (eds) Khan, Ahmed Z., Allacker, Karen, Verbeeck, Griet. pp 133-140. ACCO: Leuven (Belgium)/Den Haag. Fink, M., Holm, A., Antretter, F., Practices and guidelines. 2015. Annex 55 Reliability of Energy Efficient Building Retrofitting - Probability Assessment of Performance & Cost (RAP-RETRO), Report 2015:6 ISSN 1652-9162, published by Chalmers University of Technology, SE-412 96 Göteborg, Sweden. Available at: http://www.ecbcs.org/annexes/annex55.htm. Fung, A. 2006. Varieties of Participation in Complex Governance. Public Administration Review (Special Issue): pp. 66-75. Harty, C. 2005. Innovation in construction: A sociology of technology approach, Building Research & Information, 33, pp. 512-522. Häkkinen, T. and Belloni, K. 2011. Barriers and drivers for sustainable building. Building Research & Information, 39, pp. 239-255. Högberg, L. 2011. Incentives for energy efficiency measures in post-war multi-family dwellings, KTH, Stockholm. Industry standard ByggaF– method for moisture safety of the construction process. 2013. Fuktcentrum. Available at http://www.fuktcentrum.lth.se/verktyg-och-hjaelpmedel/fuktsaekert-byggande/byggaf-metoden/. Access date 22 June 2015. Lind, H. 2014. Ekonomiska aspekter på renoveringar av bostäder, en översikt. ”Economic aspects on renovation of residental housing, a overview”, SIRen publication, Report 1. http://www.renoveringscentrum.lth.se/fileadmin/renoveringscentrum/SIRen/Publikationer/Hans_Lind_Ekonomiska_aspekter_nov_2014.pdf. Access date: June 22, 2015. Lind, H. 2015. Leder hyreslagens regler till rätt renoveringar: analys och förslag, “Does the rental rules lead to the right renovations, analysis and proposals”. SIRen publication, Report no 2. http://www.renoveringscentrum.lth.se/fileadmin/renoveringscentrum/SIRen/Publikationer/Leder_hyreslagens_regler_till_ratt_renovering.pdf. Access date: June 22, 2015. Muld, A., Dalenbäck, J-O., Elmroth, A., Faaborg, K., Gustafsson, B., Johansson, D., Kling, R., Martinac, I., Mjörnell, K., Nobs, M., Olofsson, T. 2015. Dags för handling – hög tid att renovera äldre byggnader! ”Time for action - high time to renovate older buildings”. Energi & Miljö, March, 10th, 2015. Available at: http://www.energi-miljo.se/debattartikel/dags-for-handling-hog-tid-att-renovera-aldre-byggnader/. Access date 22 June, 2015. Mjörnell, K., Boss, A., Lindahl, M. and Molnar, S. 2014. A tool to evaluate different renovation alternatives with regard to sustainability. Sustainability. 6, pp. 4227-4245. Mjörnell, K., Femenias, P., Stenberg, J.& Johansson, D. 2014. A Strong Research Environment for Sustainable Renovation Established in Sweden. Proceedings of WSB14, World Sustainable Buildings conference 2014 in Barcelona. Newcombe, R. 2003. From client to project stakeholder. Construction Management and Economics, 21, pp. 841-848. Ostermeyer, Y, Wallbaum, H. & Reuter, F, 2013. Multidimensional Pareto optimization as an approach for site specific building refurbishment solutions applicable for LCSA. The Int. Journal of Life Cycle Assessment, 2013, 18, pp. 1762-1779. Stenberg, J. & L. Fryk. 2015 in preparation. "Local Community Responses". In: Housing Regeneration. Hadjri. Barcelona, Oikonet.org. Thuvander, L, Femenías, P. & Meiling P. 2011. Strategies for an Integrated Sustainable Renovation Process: Focus on the Swedish Domestic Building stock ‘Folkhemmet’. Sustainable Building Conference in Helsinki 17-21 October 2011. Thuvander, L., Femenías, P., Mjörnell, K. & Meiling, P. 2012. Unveiling the process of sustainable renovation, Sustainability. 4 (6), pp. 1188-1213.
134

REVISING THE SOUTH AFRICAN GUIDELINES FOR HUMAN SETTLEMENT PLANNING AND DESIGN (THE RED BOOK)
Willemien VAN NIEKERK
1
Engela PETZER 2 Dumisani NDABA 3 Amy PIETERSE 4
Azra RAJAB 5
Tinus KRUGER 6
1 Built Environment, Council for Scientific and Industrial Research, Email: [email protected] 2 Built Environment, Council for Scientific and Industrial Research, Email: [email protected] 3 Built Environment, Council for Scientific and Industrial Research, Email: [email protected] 4 Built Environment, Council for Scientific and Industrial Research, Email: [email protected] 5 Built Environment, Council for Scientific and Industrial Research, Email: [email protected] 6 Built Environment, Council for Scientific and Industrial Research, Email: [email protected] Keywords: human settlements, planning and design guidelines, Red Book
Abstract
The Guidelines for Human Settlement Planning and Design, commonly known as the Red Book, is a South African publication aimed at providing practical guidance to built environment professionals in support of the creation of sustainable and vibrant human settlements. The most recent set of guidelines, published in 2000, are currently in the process of being updated and revised. This revision has been necessitated by a range of factors, including the need to align the guidelines with recent policies and strategies and with current thinking regarding sustainable and resilient human settlements. Also, socio-political changes and global challenges, especially climate change and its impact on the built environment, need to be acknowledged, while new technological innovation in materials and processes should be incorporated. This paper presents the background to the current Red Book, including its nature, purpose and how it is being applied. The reasons why a revision of the guidelines is required are described, and the process and method to be followed in updating and revising the Red Book presented. This is followed by a discussion of the progress made with this initiative and a summary of preliminary findings, including those related to possible enhancements to existing content, new themes that may have to be addressed and potential structuring elements. The paper concludes with an outline of the remaining components of this process to revise and update the Red Book.
1. Introduction
Throughout history, settlements have been shaped by the most powerful forces of the time, and today’s settlements are no exception (Madanipour, 2006). A number of significant local and global transitions have started to unfold simultaneously in recent years, among them environmental, economic, urban, demographic and socio-political (UN-Habitat, 2014). The various emerging global and local issues need to be addressed in the planning and design of settlements. These include climate change adaptation, infrastructure planning, planning for informality, settlement economies and land markets, and issues of spatial justice. Climate change has emerged as a major global threat to both the planet and to people. Settlements, with their high concentration of people, are exposed to the impacts of climate change and are vulnerable to disaster risks, with informal settlements being particularly vulnerable. Climate change impacts on all aspects of human settlement planning and design, urging planning professionals to specifically change their approach to the provision of infrastructure and the use of resources within settlements (Van Niekerk, 2013). But settlements, as incubators of innovation, can also serve as a space where new climate friendly and resilient building technologies can be developed and replicated, thereby playing an important role in the mitigation of and adaptation to climate change (Hamin et al., 2009). The last decade has seen many social, economic and environmental changes across the globe. In response to this there has been a move towards approaches aimed at the creation of sustainable human settlements. With the international development agenda emphasising settlement principles of integration, inclusivity, resilience and sustainability, it has been largely accepted by state institutions and built environment practitioners that similar principles be applied to the South African context. In addition to the global challenges and emerging issues mentioned above, South Africa also has to address a number of context specific issues with respect to the country’s cities and towns. Since the first democratic elections held in 1994, these issues have regularly been highlighted. For instance, in the Comprehensive Plan for the Development of Sustainable Human Settlements (Department of Housing, 2004), commonly referred to as Breaking New Ground (BNG), the following is stated:
“After the 1994 elections, Government committed itself to developing more liveable, equitable and sustainable cities. Key elements of this framework included pursuing a more compact urban form,
135

facilitating higher densities, mixed land use development, and integrating land use and public transport planning, so as to ensure more diverse and responsive environments whilst reducing travelling distances. Despite all these well-intended measures, the inequalities and inefficiencies of the apartheid space economy, have lingered on.”
The reasons for this, according to BNG, include the “…lack of integration between housing delivery and land use, transportation and bulk municipal infrastructure investment planning has meant that the existing spatial fabric has shown little change. Housing for low-income urban dwellers is still provided on the periphery and very limited delivery has taken place in rural areas” (Department of Housing, 2004). In 2011, similar concerns are again described in the National Development Plan 2030 (NDP) (National Planning Commission, 2011):
“A great deal of progress has been made since 1994, but South Africa is far from achieving the Reconstruction and Development Programme (RDP) goals of ‘breaking down apartheid geography through land reform, more compact cities, decent public transport and the development of industries and services that use local resources and/or meet local needs’. Despite reforms to the planning system, colonial and apartheid legacies still structure space across different scales.”
Numerous documents have been developed since 1994 in support of the transformation of the South African urban landscape, including the Guidelines for Human Settlement Planning and Design, commonly known as the Red Book. Sharing a “…mutual concern for the quality of the built environment and the country’s natural resources, as well as a common recognition of the role that human settlement planning and the provision of engineering services plays in its protection or destruction…”(CSIR, 2000), several government departments, under the auspices of the (then) Department of Housing, commissioned the CSIR to take responsibility for the development of the Red Book. This document was published in 2000. Since then, substantial shifts in priorities, values and the understanding of human settlements have occurred globally as well as in South Africa, and the national Department of Human Settlements has again contracted the CSIR, as the custodian of the Red Book, to update and revise the document. The process commenced in March 2015 and will be completed towards the end of 2017. This paper describes the planned initiative to update and revise the current Red Book and, this being an ongoing project, discusses the progress made to date. It commences with a brief background to the current Red Book. The reasons why a revision of the guidelines is required are described and the process and method to be followed in updating and revising the Red Book presented. This is followed by a discussion of the progress made with this initiative and a summary of preliminary findings, including those related to possible enhancements to existing content, new themes that may have to be addressed and potential structuring elements. The paper concludes with an outline of the remaining components of this process to revise and update the Red Book.
2. The Need to Revise the Guidelines for Human Settlement Planning and Design
2.1 Background
The current Red Book represents the latest in a series of guideline documents that have played a significant role in the development of South African residential townships. These documents were originally developed in recognition of the fact that the cost of providing engineering services forms a significant component of the overall cost of housing. As such, they were essentially aimed at optimising the provision of engineering services by ensuring that they are of sound quality and also acceptable (both financially and technologically) to the recipient communities (CSIR, 2000). The effect of layout planning on the cost of providing engineering services became increasingly evident, and the guidelines evolved over time to acknowledge this reality. The first set of guidelines, the Guidelines for the Provision of Engineering Services in Residential Townships (Blue Book) was published in 1983. It was followed by the publication of Towards Guidelines for Services and Amenities in Developing Communities (Green Book) in 1988. In 1994 the first Red Book, entitled Guidelines for the Provision of Engineering Services and Amenities in Residential Township Development, was published. Subsequent to the publication of the first Red Book in 1994, South Africa experienced significant political and societal changes and it soon became evident that these guidelines “…have a number of shortcomings which restricted its usefulness in the drive to produce sustainable and vibrant human settlements, as opposed to mere serviced townships” (CSIR, 2000). This led to the publication of the current Red Book in 2000.
2.2 The Current Version of the Red Book
The intention and purpose of the Red Book published in 2000 is summarised as follows in the document itself (CSIR, 2000):
“The intention of the new Red Book is to provide performance-based guidelines for informed decision making. The purpose is essentially to indicate the qualities that should be sought in South African settlements, and to provide practical guidance on how these qualities can be achieved.”
The Red Book is primarily aimed at the various built environment professional and others responsible for planning and designing human settlements, in particular engineers (civil, transportation, electrical etc.), town and regional planners, urban designers, architects, landscape architects, and energy specialists. It is aimed at practitioners and decision makers from both the private and public sectors. The Red Book contains a set of guidelines rather than standards or regulations. It provides guidance on appropriate practices and technologies and it does not replace the need for professional experience and
136

judgement. The guidelines are also not legally enforceable. Furthermore, the Red Book is intended to supplement guidelines developed by national and provincial government departments, statutory bodies and local authorities. The guidelines are focused on residential areas and associated developments and are specifically concerned with ‘local’ services and planning issues. Bulk services and amenities (for instance main water supply pipelines, outfall sewers, treatment works, landfills, freeways, etc.) are not addressed. The document is divided into two volumes. The first volume introduces a guiding philosophical framework for settlement making and the spatial and structural principles that support it, with chapters that provide guidelines on planning and urban design aspects such as movement networks, transport systems, open spaces, public facilities and land subdivision. Cross-cutting issues that are applicable to both planning and engineering, such as environmental design for safer communities, ecologically sound urban development; and fire safety are also addressed in this volume. The second volume contains guidelines that outline technical engineering requirements, engineering principles and technology choices that should be considered for the provision of various engineering services. These guidelines are informed by the planning and urban design principles in volume one, and they pertain to stormwater management, roads, water supply, sanitation, solid waste management and energy (CSIR, 2000).
2.3 Motivation for Updating and Revising the Red Book
In essence, a revision of the Red Book is required in order to: Reflect society’s altering values and give guidance on local responses to global challenges, especially
climate change and its relation to the built environment; Bring the theoretical approach to settlement-making in line with current thinking as reflected in the latest
research and in various policies and strategies developed by government since 2000; and Update the planning and design guidelines with the latest technical information, standards and costs and
incorporate the most recent technological advances in processes and materials.
2.3.1 A changing context There are growing arguments internationally for linking spatial planning and infrastructure, with roads and transport infrastructure being the most important in shaping the form of urban areas for they influence land values and accessibility. “Spatially efficient investment choices in both economic and basic infrastructure spending can make a significant impact on the equity, efficiency and sustainability of human settlements” (Coetzee et al., 2014). There are many arguments for the inclusion of ‘green infrastructure’, which preserves land for agriculture, environmental purposes, and open space. Important in this debate is infrastructure that promotes sustainability, for example informal settlement upgrading, improving urban safety and redeveloping land (Todes, 2011). The South African spatial context has changed substantially during the last 15 years. New spatial forms and processes impact on social and economic behaviour. “Most South African cities have experienced some degree of spatial deconcentration and dispersal of formal economic activity over the last two decades” (Sinclair-Smith & Turok, 2012). The resulting spatial form is in many places no longer arranged monocentric, but increasingly has a multi-centred or polycentric pattern. Alongside other driving forces such as globalisation, this has resulted in a major shift in the way settlement economies work. For example, city spaces are increasingly used for income generation, resulting in street vendors becoming one of the most visible economic actors (Hansen et al., 2014). The issue of informality is receiving increasingly more attention. Al-Sayyad and Roy (in Watson, 2009) argue that recent economic trends have given rise to an exploding informality in the cities of the Global South. For a long time associated with illegality and marginalisation, informality in its many forms (income generation, settlement and housing, negotiating life in the city) has become a dominant mode of behaviour in our cities (Watson, 2009). But informality is not only relevant as an urban organising logic (where do things belong?); it is particularly relevant in understanding wealth distribution (whom do things belong to?) (Roy, 2005). The critical role of land markets in human settlement development has been emphasised by recent rapid urbanisation in South Africa. The issue of land and specifically the identification of and investment in appropriate land for government intervention is a key consideration to local planners (Todes, 2011). Social and spatial justice in the planning and design of South African settlements is also a growing concern among planners. The distribution of wealth, opportunity, health, educational attainment, job creation, and virtually all of the metrics of quality of life are not distributed equally across space (Bromberg et al., 2007), causing inevitable spatial injustices across the geographic landscape. Spatial justice can be described as the equal distribution of resources (public goods and services) and the spatial distribution of people such that there is a balance between who gets what. Furthermore, spatial justice is concerned with equal access to and distribution of public services such as schools, jobs, health care, transport and other economic opportunities, and the accessibility of these public services (determined by the freedom of movement and proximity to services) (Amer, 2007).
2.3.2 Recent government policies and plans for sustainable settlement-making The theoretical approach and normative framework of the existing Red Book need to be aligned with current thinking regarding sustainable settlement-making as reflected in various recent government policies, plans and strategies. Some of the key documents that have contributed significantly to shaping recent thinking regarding settlement planning and design are briefly discussed below. These are the National Development
137

Plan 2030 (NDP) (National Planning Commission, 2011), the draft Integrated Urban Development Framework (IUDF) (Department of Cooperative Governance and Traditional Affairs, 2014) and the Comprehensive Plan for the Development of Sustainable Human Settlements, or Breaking New Ground (BNG) (Department of Housing, 2004). The National Development Plan 2030 (NDP) provides a long term vision and perspective for the entire country by defining the desired destination of the country in 2030. It also identifies the roles different sectors as well as society will have to fulfil to achieve the vision. Chapter 8 of the NDP addresses the transformation of human settlement and the national space economy, and identifies five overarching principles to guide spatial development in the country. They are spatial justice, spatial sustainability, spatial resilience, spatial quality, and spatial efficiency. The Plan argues that planning in South Africa should be guided by this set of normative principles to create spaces that are liveable, equitable, sustainable, resilient and efficient, and support economic opportunities and social cohesion. In the chapter an urban vision is introduced and promotes the establishment of well performing human settlements that are vibrant, diverse, safe and valued places. The qualities identified to achieve this include densification, affordable housing on well-located land, retrofitting in support of sustainability, focussing development around transport corridors and nodes, using public transport to link the urban poor with mainstream city life, in situ upgrading of well-located informal settlements and increasing the quality design of public spaces (National Planning Commission, 2011). Following the adoption of the National Development Plan, government, in 2014, developed an urban policy framework to ensure that urban spaces are well planned and managed. The draft Integrated Urban Development Framework (IUDF) sets out a policy framework on how the urban system in South Africa can be reoriented so that cities and towns can become increasingly liveable, inclusive and resource efficient over the next 20 to 30 years. The IUDF also recognises that urban and rural areas operate on a continuum and proposes measures to strengthen the rural-urban linkages. To achieve this vision the IUDF identifies four strategic goals, namely “to ensure people have access to social and economic services, opportunities and choices, to harness urban dynamism for inclusive, sustainable economic growth and development, to enhance the capacity of the state and its citizens to work together to achieve social integration, and to forge new spatial forms in settlements, transport, social and economic areas” (Department of Cooperative Governance and Traditional Affairs, 2014:9). The Comprehensive Plan for the Development of Sustainable Human Settlements, or Breaking New Ground (BNG) was developed by the then Department of Housing in 2004 and represents a shift in emphasis after 1994 from building houses to developing human settlements. The key elements of the plan is to pursue a more compact urban form, facilitate higher densities and mixed land use development, and integrate land use and public transport planning, so as to ensure more diverse and responsive environments whilst reducing travelling distances (Department of Housing, 2004). The concept Master Spatial Plan for Human Settlements articulates the principles and approaches that are aligned with those of the Spatial Planning and Land Use Management Act of 2013 (SPLUMA) and Chapter 8 of the NDP. In addition, the plan introduces spatial targeting principles that can be applied at the various planning levels and include increasing densities through compaction; restructuring and transforming space through connections; and integrating settlements by providing mixed use environments and choice. It also proposes short, medium and long term strategic phases in the delivery of human settlements. It is premised on the creation of a spatial plan for human settlements investment, where state intervention in the residential property market is seen as one of the catalysts of transformation (Department of Human Settlements, 2014). The Habitat III National Report by the Republic of South Africa for the Third United Nations Conference on Housing and Sustainable Development (Habitat III, 2014) promotes a new model of urban development that is able to integrate all facets of sustainable development to promote equity, welfare and shared prosperity, by introducing a new Urban Agenda (Habitat III n.d). The new Urban Agenda includes supporting urbanisation, integrating equity into the development agenda, fostering national urban planning, supporting development goals through sustainable urbanisation and aligning institutional arrangements to ensure effective delivery of the new Urban Agenda (Habitat III n.d). The National Report encourages an integrated approach to human settlement planning which is based on a sustainable livelihoods approach and promotes higher densities in good locations, universal design, an emphasis on the green economy, and spatial economic inclusivity. The 17 Sustainable Development Goals adopted by the United Nations General Assembly are intended to stimulate action over the next fifteen years. The revised Red Book could make a significant contribution in supporting South Africa with reaching the targets related to the goals. The shifts in institutional thinking around sustainable settlement planning has largely been focussed around addressing past imbalances by promoting development that supports equity, justice, integration and economic growth.
3. Methodology
The project is divided into two phases. The first phase involves a range of assessments aimed at gaining a thorough understanding of the weaknesses of the current Red Book, the context within which the revised guidelines will be implemented, the needs of the potential users and the themes or topics to be considered for inclusion in the new Red Book. The second phase will involve more studies of the themes or topics identified during phase one and the preparation of the revised guidelines. The extent and nature of the revision will vary, depending on the theme or topic under review. The content of some of the existing chapters/themes may require only minor revisions and amendments, while others may be subject to more intensive enhancements and could require the addition of new information. Entirely new
138

sections may also have to be developed containing guidance on issues/themes not previously addressed in the Red Book (e.g. housing typologies, informality and climate change). The revisions and updates will be guided by a range of information sources. A series of assessments will be conducted, including a rapid assessment to determine the key issues to be addressed and a situational analysis to identify gaps in the current content and to gain an understanding of the context within which the updated guidelines would have to be implemented. The assessments include various desktop studies to gain an understanding of international and national trends and the policy environment. This will be supported by a comprehensive consultation process that includes semi-structured interviews with selected role players, including officials from relevant government departments and entities, municipal officials and councillors, academics, researchers and built environment professionals including engineers, urban designers, town and regional planners, architects and landscape architects. A limited number of case studies may be included to serve as examples of environments that demonstrate the concepts and principles outlined in the guidelines. A conceptual framework will be developed to structure the document in a systematic and logical way. Once the assessments have been completed, specialist teams will take responsibility for the themes and topics identified for inclusion in the revised document. These teams will be supported by two structures, namely a Project Steering Committee (PSC) and Thematic Reference Groups (TRGs). The PSC will provide strategic guidance with respect to the approach to settlement planning, design and development that the Red Book should be advocating. It will also assist in defining the nature, purpose and objectives of the revised Red Book, and, based on current and envisaged policy directions, advise the project team on the philosophy and principles that should underpin settlement planning and design in South Africa. The PSC will comprise of individuals with appropriate experience representing the DHS and its entities, key government departments, the CSIR and councils for the various built environment professions. A number of TRGs will be established to provide practical, domain-specific guidance to the project team. Separate TRGs will be responsible for the respective themes to be addressed in the Red Book (e.g. settlement planning and design, housing, energy, stormwater management, roads, water supply, sanitation, etc.). They will advise the project team on the revisions to be made and the content to be included in the different sections dealing with each of the themes identified. They will also be responsible for ensuring that the revised technical content is appropriate and accurate by providing information and input and commenting on the draft and final versions of the relevant sections prepared by the project team. TRG membership will consist of an experienced representative of each of the relevant government departments responsible for the different themes identified, institutes representing relevant built environment professionals and recognised local or international specialists (e.g. academics, researchers, practitioners) in the field related to each of the themes identified.
4. Discussion
The initial assessments conducted thus far as part of the first phase have confirmed that a comprehensive revision and update of the Red Book is indeed required. A rapid assessment indicated that all the chapters in the current document need to be amended. Some chapters would require fairly minor changes, while others would need substantial revisions. Furthermore, it emerged that the purpose, nature and scope of the new Red Book should be clearly defined to ensure that it provides relevant and practical guidance that will result in noticeable changes in the built environment. The structuring framework and arrangement of the content need to encourage and facilitate integrated planning and design. The updated Red Book may have to be less permissive (at least in certain sections) so as to provide more concrete guidance. Tasan-Kok (2008) calls for ‘guided flexibility’ to make planning more realistic and fair. The dissemination method and packaging should allow the new Red Book to be accessible to as wide a readership as possible, and an internet-based version as well as a printed version may have to be produced. The findings of the rapid assessment would be explored further as the revision process unfolds. The initial findings of the ongoing situational assessment have proved useful in guiding the revision process. A range of relevant international and local publications have been accessed, including policy and strategy documents, regulations, standards, guidelines, toolkits, studies, and research articles. These publications serve different purposes – for instance, some provide information regarding the latest international thinking and planning and design approaches to the development of sustainable settlements, others provide local contextual information, while some will be used as supporting documentation in the new Red Book. The assessments have resulted in the identification of emerging theoretical constructs in, and approaches to, settlement planning and design. One of the key issues that emerged relate to climate change. It is clear that the revised Red Book should aim to address some of the challenges faced by human settlements as a result of climate change. The National Climate Change Response Policy lists the following challenges related to settlements in urban settings (Government of the Republic of South Africa, 2011): Climate change may exacerbate the problems caused by poor urban management. For example, poor
storm water drainage systems and urban-induced soil erosion result in flash flooding. Increased storm intensity due to climate change would exacerbate such problems.
Cities are particularly vulnerable to climate change because they are slow to adapt to changes in the environment and they have entrenched dependencies on specific delivery mechanisms for critical services.
The effective management of the interface between urban residents and their surrounding environment producing sustainable social-ecological systems needs to the addressed. Similarly the concept of climate resilience in the context of urban social-ecological systems needs to be further developed.
139
South Africa’s cities still reflect apartheid planning with the poorest communities tending to live far away from services and employment. Our cities are relatively spread out and these two factors contribute to increased transport emissions.
Water demand in urban centres is growing rapidly, placing undue stress on water supply systems. Investment in waste water treatment works has not remained in line with the growth in demand and use.
Informal settlements are vulnerable to floods and fires, exacerbated by their location in flood- or ponding-prone areas and on sand dunes; inferior building materials; and inadequate road access for emergency vehicles.
Cities and dense urban settlements consume large amounts of energy. According to the strategy, responses that could be considered include the promotion of climate-resilient urban infrastructure, densification, the use of climate-resilient technologies, water-sensitive urban design and providing low-income developments with access to affordable lower-carbon public transport systems. The revised Red Book should incorporate guidelines that focus on vulnerabilities at a neighbourhood level and could deal with closed loop systems, energy efficiency, resource flows, low carbon infrastructure, green infrastructure zero emission settlements etc. Some of the other issues emerging from the situational assessments are briefly discussed below: The strategic role of urban centres in enabling the necessary conditions for achieving government outcomes has gained local prominence recently. An urban networks approach is aimed at facilitating the eradication of spatial inequality to enable the creation of liveable, sustainable, resilient, efficient and integrated human settlements. The focus of this approach is to shift infrastructure investments towards the creation of efficient and effective urban centres through an approach of spatial targeting of public investment, primarily infrastructure. An urban network is then created through a city-wide interconnected hierarchy of strategic nodes and public transport links between and within nodes. Transit oriented development recognises the importance of maximising access to public transport. Promoting mixed land uses and higher densities, such an approach claims to reduce traffic congestion and air pollution. Approaches such as non-motorised transport also need to be considered. Related to this is the concept of the compact city, which attempts to concentrate growth and avoid sprawl by advocating walkable neighbourhoods with mixed land uses and ‘complete streets’ with a range of housing choices and improved access to public transport. In recognition of the key role of housing in the creation of sustainable human settlements, the revised Red Book should provide guidance on issues related to housing typologies. The guidelines could indicate how to approach and plan for mixed incomes, mixed tenure and mixed typologies. Within the perspective of creating more resilient settlements, the revised document could provide guidance on the planning for transitional low income rental accommodation areas and emergency housing. Guidance could also be given on how to structure investment in housing projects to make them viable ventures. Guidance could be given to municipalities on strategies to improve the supply of (good) land for housing, thereby contributing to a functional and accessible property market. Detail on land readjustment and land value capture approaches as possible funding sources for urban investment could be provided. The development of townships into more economically and socially sustainable communities has been the subject of growing interest in South Africa. As a key driver for development, guidance could be given on how township economies work, with practical examples of how this will inform decision-making. Guidance could be given on how individual settlements fit into the broader township economy and should provide for on-site and off-site opportunities for income generation. Planning guidelines could look at planning for economic activity along main roads including trading spaces for informal traders. Sometimes referred to as inclusive design, universal design creates buildings and environments that are accessible to everyone, paying special attention to older people and to people with physical disabilities. By designing for diversity, universal design makes things safer, easier and more convenient for everyone. Detail guidelines could be included on the implications of designing for universal access at a neighbourhood level. Given the changed thinking and the need to adapt settlement development practices to manage, minimise or adapt to the impacts of climate change and respond to other, often associated, resource pressures such as water and energy scarcity, there is a need to consider the incorporation of alternative, appropriate technologies for housing and municipal service delivery. This would require a balance between the implementation of established practices and new ideas and innovative technologies. The updated guidelines also need to take into account advances in existing technologies and infrastructure, for instance in the field of communication.
5. Conclusion
This paper introduced an initiative to update and revise the Guidelines for Human Settlement Planning and Design (Red Book) published in 2000. This publication was intended to identify the qualities to be strived for in South African settlements and provide guidance on how these qualities could be achieved. The reasons why the current version of the Red Book needs to be updated and revised were outlined, particularly the fact that the international and local understanding of settlement making has evolved significantly and priorities have shifted, primarily due to challenges brought about by climate change. The method to be employed in revising and updating the guidelines were discussed, highlighting the focus on thorough assessments aimed at guiding the nature and structure of the revised guidelines and assisting in identifying potential themes and topics to be included in the new Red Book. Some of the preliminary key findings of the assessments to date were summarised, including, amongst others, the need to specifically address issues related to climate
140

change, resource efficiency, sustainability, resilience, water sensitive urban design, informality, social and spatial justice and the role of housing in the creation of sustainable human settlements. The next phase of this project will involve the finalisation of a structuring framework for the revised Red Book, agreeing on the themes and topics to be included and writing the new set of guidelines. This will involve further focussed studies to ensure that the information provided on each of the themes or topics is current and appropriate for the South African context. It is anticipated that the final publication will be made available online and in hard copy to ensure that it is accessible to all. The ultimate aim with this new Red Book is to lead to significant, visible changes in the built environment that would result in vibrant, safe and resource-efficient settlements that are economically, physically, environmentally and socially integrated.
6. Acknowledgement
The project to revise and update the Red Book is funded by the Department of Human Settlements.
7. References
Amer, S. 2007. Towards Spatial Justice in Urban Health Services Planning. Enschede: International Institute for Geo-Information Science and Earth Observation. Bromberg, A., Morrow, G.D. & Pfeiffer, D. 2007. Editorial note: Why spatial justice? UCLA Journal of Urban Planning, Volume 14, pp. 1-4. Coetzee, M., Waldeck, L., Le Roux, A., Meiklejohn, C., Van Niekerk, W. & Leuta, T. 2014. Spatial policy, planning and infrastructure investment: Lessons from urban simulations in three South African cities. Town and Regional Planning, Volume 64, pp. 1-9. CSIR (Council for Scientific and Industrial Research). 2000. Guidelines for Human Settlement Planning and Design Volume 1. Report No. BOU/E2001. Pretoria, CSIR Building and Construction Technology. Department of Cooperative Governance and Traditional Affairs. 2014. Integrated Urban Development Framework: Draft for discussion. Department of Housing. 2004. Breaking New Ground: A Comprehensive Plan for the Development of Sustainable Human Settlements.
Department of Human Settlements. 2014. Concept Document: Master Spatial Plan for Human Settlements. Government of the Republic of South Africa. 2011. The National Climate Change Response White Paper. Habitat III. 2014. National Report by the Republic of South Africa for the Third United Nations Conference on Housing and Sustainable Urban Development.
Habitat III. n.d. About Habitat III: The New Urban Agenda. Online available at: https://www.habitat3.org/the-new-urban-agenda, accessed 25 August 2015. Hamin, E. & Gurran, N. 2009. Urban form and climate change: Balancing adaptation and mitigation in the U.S. and Australia. Habitat International, Volume 33, pp. 238-245. Hansen, K.T., Little, W.E. & Milgram, B.L. (eds.) 2014. Street Economies in the Urban Global South. Advanced Seminar Series. Santa Fe: School for Advanced Research Press. Madanipour, A. 2006. Roles and challenges of urban design. Journal of Urban Design, Volume 11 (2), pp. 173-93. National Planning Commission. 2011. National Development Plan 2030.
Roy, A. 2005. Urban informality: Toward an epistemology of planning. Journal of the American Planning Association, Volume 71 (2), pp. 147-58. Sinclair-Smith, K. & Turok, I. 2012. The changing spatial economy of cities: An exploratory analysis of Cape Town. Development Southern Africa, Volume 29 (3), pp. 391-417. Tasan-Kok, T. 2008. Changing interpretations of ‘flexibility’ in the planning literature: From opportunism to creativity. International Planning Studies, Volume 13 (3), pp. 183-95. Todes, A. 2011. Reinventing planning: Critical reflections. Urban Forum, Volume 22, pp. 115-133. Turok, I. 2013. Transforming South Africa’s divided cities: Can devolution help? International Planning Studies, Volume 18 (2), pp. 168-187. UN-Habitat (United Nations, Human Settlements Programme). 2014. The state of African Cities 2014: Re-imagining sustainable urban transitions. Online available at: http://unhabitat.org/books/state-of-african-cities-2014-re-imagining-sustainable-urban-transitions/, accessed 31 August 2015. Van Niekerk, W. 2013. Translating disaster resilience into spatial planning practice in South Africa: Challenges and champions. Jàmbá: Journal of Disaster Risk Studies, Volume 5 (1), pp. 1-6. Watson, V. 2009. Seeing from the South: Refocusing urban planning on the globe’s central urban issues. Urban Studies, Volume 46 (11), pp. 2259-75.
141

142

THE FUTURE OF THE BUILT ENVIRONMENT IN THE INFORMATION AGE: INTEGRATING CONCEPTS OF SUSTAINABILITY, INFORMATION AND COMMUNICATION TECHNOLOGY,
AND ARCHITECTURE.
Marco MACAGNANO 1
1 Bentel Associates International, Johannesburg, South Africa, Email: [email protected] Keywords: built environment, information age, knowledge societies, sustainable development
Abstract
The Information Age represents an era where conscientious effort is required to ensure our built environments are responsive to the evolved needs of our knowledge-based societies. The digital revolution has evolved the concept of ‘form follows function’ forever, since function is no longer bound by physical parameters. Physical space is supplanted by cyberspace, and our perceived reality is augmented and digitized to the point where the future of the architect appears in danger of ‘virtual’ disappearance. Built environments can play an active role in enabling knowledge-exchange by recognizing that sustainable development requires an integrated approach. Architecture represents an industry borne of integration, serving as among the most inclusive of all disciplines by combining aspects of art, engineering, and psychology into design process, and converging possibilities towards a final solution. In order to achieve this suitably, a specific version of sustainable development for the built environment for today’s world is required. This version recognizes the importance of context and scale of approach, replacing vagueness of concepts with focused strategy. This provides the basis for a human-centric approach for enabling knowledge-exchange through ICT integration within the context of a flexible built environment, while responding to real-world restrictions such as infrastructure, policy, literacy, and the digital divide. In this paper the author will investigate the changing face of sustainable development, how SD is affected by the requirements of today’s knowledge societies, and the integration of the shared goals of sustainable development and ICT in the establishment of an architectural implementation strategy for tomorrow’s built environment.
1. Introduction
This paper aims to evaluate the understanding of sustainable development design approaches in architecture, and propose advancements to current theory and methodology. Through investigation of various interpretations of sustainability and the associated difficulties of implementation, opportunities will be identified for a more appropriate and focused architectural process in the context of today’s knowledge-based societies. For the purpose of this paper, the concept of sustainable development as introduced by the United Nations in 1972, “The ability of an environment to meet the needs of current and future generations” (WCED, 1987), will be considered a basis of sustainability theory. Over the course of the past four decades, numerous and competing theories have evolved regarding appropriate implementation of sustainability principles in the built environment. This paper identifies a number of these theories, and identifies that their generic nature fosters difficulty of implementation and a loss of touch with important requirements of the twenty-first century. In investigating this, the question emerges: Since sustainability’s inception as a concept, how have the needs of humankind changed in today’s world: the Information Age? This new Age has brought with it a cultural shift whereby the realms of the physical and the digital have been merged and overlaid. It is no longer a minimum requirement to be provided with a physical place of work in order to do business, for example, and this has far reaching consequences to the role of the architect. Humankind finds itself living within a context of ‘knowledge societies’ whereby a sustainable future hinges on the ability to efficiently operate in an ever-evolving, information-charged world. Knowledge is the new commodity to which sustainability and intergenerational equity are linked for fear of falling wayside of the ‘digital divide’. Understanding this new dependence on information and communication is required in defining the scope of its role in our daily lives. This investigation will thus seek to assess the concept that, in the context of this Information Age, it is a responsibility of our built environments to cater to our knowledge requirements in addition to the accepted criteria of sustainability (economy, society, ecology). The author proposes that while it is important to aim to create and support healthy environmental, economic and social conditions in pursuit of a sustainable future, supporting access to information and knowledge transfer is of equal importance. This is a principle that should be entrenched in architectural process or risk side-lining the profession to the periphery of a world where the digital realm is attributed equal, if not greater importance than the physical. In pursuit of investigating the development of integrated architectural process, this paper seeks to investigate that that information and communication is a staple requirement sustainable development sharing influence
143

in all of the recognised realms of sustainability as per the 2005 UN Summit Report 60/1: Ecological, Economical and Social realms. This investigation will be unpacked in the following chapters:
Evolution of Sustainable Development (SD) concepts. Understanding the challenges of SD implementation. Reimagining Sustainable Development in the Information Age. Implications on architectural process and product.
Through this investigation, the current state of sustainable development theory for the built environment will be explained and a sufficient theory base be demonstrated to exist to support future research.
1.1 The Problem and its Setting
The built environment today can be commended for embracing the importance of energy efficient architecture, yet a deficiency in implementation of true sustainable architecture is prevalent. Buildings were defined by le Corbusier in 1923 as ‘machines for living in’ on the premise that these buildings facilitated our day to day operations. Currently architectural process is largely limited to correctively monitoring the architectural design and construction process as a fixed moment in time due to the prevalence, and guided implementation of quantifiable rating systems based on principles of energy efficiency and ‘green building’. The 2005 World Summit accepted, within UN Resolution 60/1, the foundation for sustainable development upon ‘three pillars’, namely ecological, social and economic. The definition of sustainability in this regard was purposefully developed to remain generic enough for implementation in a variety of industries, yet this implicit vagueness has resulted in difficulty of focused implementation. What is required is a scale of approach specific to architecture that takes into consideration a capacity for future flexibility and continued appropriateness of product. A return of focus to the implementation of contextually appropriate sustainable design principles is required. Humankind has progressed to the point where constant access to information and communication has changed the way we live and work at an exponential rate in what have been termed ‘knowledge-based societies’, yet architectural approach and tangible effect on building product is largely lagging, propagating an inefficient culture of reactively retrofitting and renovating. Through inadequate implementation and integration of knowledge and information-based infrastructures and ideals, intergenerational equity of knowledge is compromised and subsequently potential sustainable social, environmental and economic benefits are detrimentally affected. The main problem is therefore delineated as follows: Access to information and communication through ICT is integral to approaches for sustainable development in the built environment in the pursuit of adaptive and flexible use over its lifespan as well as enabling the equitable use and access to knowledge resources for current and future generations.
2. Literature Review
Theory building through objective literature review will serve as the basis for all assumptions and hypotheses to be made in the course of this paper. Hypotheses will be derived from personal experience and applications in the working environment pertinent to the topic of this paper, as well as rigorous research in the field by means of referencing publications, as well as interviews with contributors to the field of research. Theory testing will serve to assist in directing the data collected through research by placing the collected data into context for evaluation of the implied successes and short-comings. However, this paper seeks to derive its conclusions through a majority weighting on theory application. The findings will serve as theoretical basis upon which a revised model of sustainability can be developed to advance not only the architectural product, but also the architectural process. The research conducted in this study can be classified as applied research with an open-ended approach to the problem. The researcher acknowledges the description of applied research and accepts certain principles of sustainability in the built environment, taking into consideration that integration of different forms of research aid informed application in the built environment. In order to address the research problem effectively, this paper proposes the following:
The model of sustainable development as proposed by the Brundtland Report is in need of additive elaboration in order to make it applicable to our current context.
Information and communication technology is an enabler of optimum user experience and operations within our current and future built environments.
The role and responsibility of the architect must evolve to successfully integrate information and expertise from all scopes if the concepts of sustainability are to be successfully applied.
A revised methodology of sustainable design is therefore required for use by architects and other built environment professionals as a basis for integration in the process
3. Research Strategy
The scientific method of approach proposed for this topic of research will begin by defining the problem, deducing related hypotheses, the data collection and evaluation followed by introduction of new theory. This approach method, while standard in its schedule, will be seen to demonstrate a number of positivistic characteristics.
144

The fact that the proposed methodology as a product will be best developed in a scenario where it is context-free and will be best described in a voice that is unbiased and objective reinforces this assumption. Information and findings represented in the study will assert themselves to be accurate and reliable through analysis of current industry standards and phenomena, yet generalisations are to be accounted for in the aims of providing a basis for prediction of applicable future trends and feasibility of the contained paper product.
3.1. Method of study
A combination of qualitative and quantitative research is undertaken for formulation of a methodology for specific application by built environment professionals. This theoretical methodology will be the product of evaluation of the causal and symbiotic relationships that exist between social, economic, ecological and technological factors. While deductions are sought to be made from empirical sources and experience, observations through qualitative literature review will also be seen to contribute to data gathering processes while heuristically interpreting that these relationships are affected by societal and contextual influence.
3.2. Data collection
Data collection is primarily derived from literature review via industry specialists and formalisers of related evaluation models and methodologies. The reasons selection of this data gathering method is due to the fact that since a theoretical methodology is proposed, deductive reasoning on the part of the writer is to be implemented on a basis that incorporates a combination of a descriptive analysis of current environmental conditions of varying contexts, as well as normative interpretation for evolution of those contexts.
4. Findings and Discussion
4.1 Evolution and Interpretation of Sustainability Concepts
The purpose of this chapter is to demonstrate that various sustainability concepts are in abundance and continue to be devised, with some proving more popular than others. As a basis to providing an argument for a need for a more focused approach, reasons for alteration and evolution of concepts will be investigated. Sustainability is the subject of many opinions and variations. At the core of the debate lies the issue of capacity versus potential. Should sustainable development be characterised by seeking to define the limits that ecology poses to humankind within this planet of finite resources, as Meadows postulated in “Limits to Growth” (1972), or should the concept be driven by the potential for contribution to this planet and its inhabitants? To comply with the former argument, as stated by Gibberd (2005: 300), sustainability can be described as a state in which humankind is living within the carrying capacity of the earth. The UN Commissioned Brundtland report of 1987, however, based its approach on de-emphasising the environment while underlining human need to be realised through development. This created an ethical paradox since sustainability describes the characteristic ability to maintain a process indefinitely, while development inherently relies on environmental modification and natural resources to occur at all. ‘Sustainability’ was therefore originally devised as a concept to represent the field of ecology and ecosystem longevity without alteration. Upon inclusion of the scope of ‘development’, the concept was advanced to include the values of society and the capital economy (Jabareen, 2008: 181) and thereby seek moderation of this paradox. The paradox of sustainable development is a theme that has given rise to a multitude of varying theory and approach within many industries. Yet while there are theories that are inclined on providing emphasis to either capacity of ecology or the needs of humankind, a deeper understanding of an integrated systems approach has emerged. Gibberd (2005: 310) states that sustainable development cannot be seen in isolation from the end-users and their social context and should be responsive to local needs and opportunities. This development should thus be seen as “systems of physical and non-physical aspects to work together in an efficient and integrated way”. The success of sustainable development relies on the continued success of humankind. Sustainable development concepts centre on people and will have the same underpinning of time, quality and cost as with key management principles (Yang, 2005, xiii). The following chapter outlines the impact that varying theories have had on broad scale implementation, as well as specifically to the built environment. In investigating this, impetus is given to the requirement for further refinement of the concept.
4.2 Understanding the Challenges of Implementation
Since the emergence of numerous frameworks and concepts, as introduced above, it has long been observed that the bridge from theoretical concept to applicable implementation has been somewhat challenging. By virtue of the fact that newer concepts are continually emerging and evolving demonstrates the difficulty for implementation that the concept poses to practitioners, professionals and scholars in their respective fields. For example, while a number of definitions of sustainability are currently used, many convey the notion of a state in which humankind lives within the carrying capacity of the Earth (Cole, 2012: 44), while others refer to the common contribution possible to the three pillars. Du Plessis (2012: 7) furthermore argues that the current and dominant concepts of sustainability have instead reached a limit to their usefulness due to their conceptual foundation in an inappropriate mechanistic worldview and their tacit support of a modernisation project that prevents effective engagement with a complex, dynamic and living world.
145

Critical review shows that definitions of sustainable development are vague, lack of operative definitions fraught with contradictions over what should be sustained (Jabareen, 2008: 179). The inherent vagueness of the concept of sustainability and sustainable development has resulted in a political battle for influence by attaching varied interpretation to the concept (Mebratu, 1998: 503). This widespread interpretation has resulted in a large variety of definitions that are personalised and specific towards institutional and group prerogatives rather than a pursuit of the general essence of the concept (Mebratu, 1998: 493).In this case, appropriateness surpasses performance as a key to technological success. According to McCullough, this is further understood through the fact that appropriateness is almost always a matter of context. “We understand our better contexts as places, and we understand our better design for places as architecture” (2004: 3). A product, therefore, cannot be sustainable in an absolute sense. Rather it must be considered in the context of the supply chain and the market (Fiksel, 2003: 5330). This evolution of thought is therefore stating that sustainability and sustainable development is best achieved when specific understanding of what is required is linked to the context for which it is intended. While the basis for departure is agreed based on the previously discussed broader goals, versions of sustainability theory are thus required to be developed. Within the industry of the built environment and architecture, Cole (2012: 43) reiterates a concept similarly addressed by Gibberd (2005: 300) in stating that it is inappropriate to consider buildings as being sustainable. A building is an element set within wider human endeavours and is necessarily dependent on this context. Thus, an individual building’s performance is more substantially understood by the contribution it makes to the social, ecological and economic health of the place it functions. This thus places the built environment in the category of approach of sustainability that is not bounded by limits of growth or capacity, but rather in the context of a system and its potential contribution to continued human and ecological benefit. In the realm of the built environment, while it can be seen that industries are keen to advance in search of appropriate mechanisms for delivering a final outcome that is environmentally sustainable (Yang, 2005: xii), a recent trend has emerged in the form of ‘green design’ and the establishment of ‘eco form’, i.e. technologies and ideas relating to ecology and sustainability such as alternative building materials, renewable energy, organic foods, conservation and recycling. A lasting and predominant view among scholars, planners and policy makers is that energy efficiency is key to achieving ecological form through design (Jabareen, 2008: 185). This approach has been somewhat contradictory to the holistic vision embraced by the greater community due to the fact that design for energy efficiency bears emphasis on ecological capacity. Cole (2012: 40) states that ‘green design’ has been used fairly consistently over the past decade or so to emphasise the environmental performance of a building and is primarily directed at reducing the degenerative consequences of human activity on the health and integrity of ecological systems. Performances are evaluated relative to a benchmark, rather than their absolute consequence on human and natural systems. Process-related criteria are incorporated alongside performance issues (2012: 41) to be applied to a specific product or intervention. A sustainable society is one that continues to satisfy the current needs of its population without compromising quality of life for future generations, while continuing to develop and adapt to meet the needs of its shareholders and stakeholders. In recognition of this, a sustainable product should embody those same common principles. Social responsibility is a characteristic of the enterprise, not just of the product or service, and requires constant adaptation to ensure transparency and responsiveness to the changing needs of its stakeholders. In comparison, ‘green building’ approach, ecological integrity, and quality of life are often influenced by characteristics of a product or service and thus can be addressed through sustainable design principles (Fiksel, 2003: 5332). A parallel trend to ‘green design’ is required in the built environment focusing on the holistic approach through endeavouring to achieve sustainability through creation of open and adaptive systems. This approach is observed by the author to be embodied in the form of two complimentary concepts: design for resilience, and regenerative design. In designing for resilience, it is understood that complex systems are dynamic, non-linear and capable of self-organising to sustain their own existence. The law of thermodynamics states that closed systems will gradually decay from order into chaos, tending towards maximum entropy. However, living systems are open in the sense that continually draw upon external sources of energy and maintain a state of low entropy. The essence of sustainability is resilience, the ability to resist disorder. Characteristics of resilient systems are defined as embodying (Fiksel, 2003: 5333):
Diversity – existence of multiple forms and behaviours Efficiency – performance with modest resource consumption Adaptability – flexibility to change in response to new pressures Cohesion – existence of unifying forces or linkages
System evaluation quantifies selected performance criteria that portray consequences of design choices through quantifiable performance indicators as part of its guideline for sustainable reporting (Fiksel, 2003: 5337). Through designing for adaptability (DFAD), products are conceptualised and modelled as dynamic systems with feedback control strategies to respond or adapt effectively to changes in product performance criteria. This approach takes into consideration changing performance requirements based on physical, cultural, environmental or economic considerations among others (Kasarda 2007: 727). Through the introduction of adaptability as a key feature of a product it is assumed that through this inherent ability to resist obsolescence, product design for extended life which would have a high impact on sustainability goals. DFAD seeks to characterise a product as a dynamic adaptable system, and models the product as a
146

controllable system with a feedback loop. Control and feedback can therefore be used to modify system performance. In comparison, ‘regenerative’ design and development emphasises a co-evolutionary, partnered relationship between humans and the natural environment, rather than a managerial one, building social and natural capital (Cole, 2012: 39). In contrast to the human-centric approaches of sustainable development mentioned previously, this instead places emphasis on carrying capacity of the environment through creation of products and systems that require little ecological input to be self-sustaining. While resilient and regenerative design is actively pursued, other research under the sustainable design ‘umbrella’ includes focus on increasing product life through flexible design, design for remanufacture, design for disassembly, and product reliability (Kasarda, 2007: 728). This takes into consideration the fact that a design product should not solely be in a position to ‘resist chaos’, but be sufficiently self-diagnostic in order to validate its continued existence. Buildings are designed and then assembled through a rigorously controlled series of processes, yet we participate in social and ecological processes that are not at all designed. The requirement is thus to design policies and interventions that influence system behaviour and evolution (Fiksel, 2003: 5334). To bridge current gaps, the next stages of development must incorporate a more integrated approach (Yang, 2005: xiv) which requires an understanding of the contextual contribution required. In the aim of an appropriate systems design approach for sustainability, Fiksel (2003: 5338) lists the following:
Requirements will include system behaviours rather than just outcomes Productive modelling will give way to exploratory scenario building Design strategies will rely on intervention rather than control Robustness will be achieved through resilience rather than resistance Risk management will draw upon new concepts such as adaptability and diversity System state indicators will be based on fundamental energy attributes.
“The old Newtonian view of an orderly, machine-like world is giving way to a new view of a chaotic, evolving world. Designing systems that are inherently resilient will support our collective quest for sustainability in this ever-changing, unpredictable universe” (Fiksel, 2003: 5338). The increasingly seamless debate and investigation of scale and industry specific performance issues and the development of tools to evaluate them has strengthened the need to understand buildings and their physical, social and ecological context as a nested system with intrinsic hierarchy (Cole, 2012: 42). Additionally it is stated that the designing of future buildings with embedded adaptive reuse potential is a useful criterion for sustainability and self-regulation. Criteria can be weighted according to physical, economic, functional, technological, social, legal and political categories to calculate adaptive reuse (Conejos, 2012: 95). It is not the intention of the author to place emphasis on one form of approach over the other, but instead to recognise that many evolved concepts towards sustainable development exist, and continue to be devised. While each has basis in the goal of sustainable development to create environments that provide current and future benefit equitably across the scope of human and ecological need, certain decisions are taken in their formulation that make these concepts more or less appropriate to certain applications, contexts, and criteria. The role of this paper is therefore to demonstrate that it is in fact a requirement of sustainability theory to evolve and adapt with the times. In doing so current theories become future lessons from which to determine the most appropriate response to the challenges of the time. The way forward will require a new philosophical and comprehensive approach, as opposed to existing technical approaches to the phenomena of sustainability. A rationalised, structured, and integrated process should replace ad-hoc applications and impatient deployment of technologies aimed at immediate benefits and returns. The stage is thus set for a focused and unique approach to sustainable design for the industry. The following chapter seeks to briefly outline how the evolved needs of humankind in recent decades bring with them a need to evolve the concept of SD itself, recognising that development of focused variations are dependent on the industry for which they are intended.
4.3 Reimagining Sustainable Development in the Information Age
Before embarking on an investigation of future concepts for implementation within in the built environment, it is necessary to briefly understand the world to which sustainable development is now required to cater. Following the development and adoption of the guiding principles of sustainable development, the world experienced a digital revolution. This brought with it previously unimagined access to information and changed the future of humankind forever. The Information Age encompasses the economic, social and cultural changes brought about by access to information through transformed communications technologies and processes. At its inception in most global societies, more people could were already observed to be employed collecting, handling, and distributing information than in any other occupation (Mason, 1986: 5), with trend continuing to grow exponentially in recent decades. While networks are an antiquated form of organisation, digital networking technologies – characteristic of this Information Age – powered social and organisational networks to foster limitless expansion and adaptability (Castells, 2010: 1969). In the realm of the digital age, we also inevitably find ourselves immersed and operating in a ‘digital economy’. This represents more than just an economy conducted on the internet but is instead defined in the pervasive use of information and communication technologies (ICT) in all aspects of the economy, including
147

organisational and inter-organisational operations and transactions. ICT serves as the enabler of the digital economy and the Information Age, providing the means to create, manipulate, organise, transmit, store, and act on information in new ways (Atkinson, 2007: 7). ICT represents more than computers and the Internet, as was understood when the digital divide and issues of internet governance were much of the focus since the first World Summit of the Information Society in 1993. The WSIS declaration outlined commitment to building a “people-centred, inclusive and development-oriented Information Society, where everyone can create, access, utilize and share information and knowledge, enabling individuals, communities and peoples to achieve their full potential in promoting their sustainable development and improving their quality of life, premised on the purposes and principles of the Charter of the United Nations and respecting fully and upholding the Universal Declaration of Human Rights (WSIS, 2003: 1).” It is in recognition of these goals that ICT exists as a concept for continued future development. Access to information has thus resulted in the formation of a new paradigm of society, known as the ‘knowledge-based society’ (Mansell, 1998: 1). Individuals, companies and communities are linked through worldwide systems of communication, transportation and commerce. This connectivity presents daunting challenges to the design and commercialisation of new systems. Yet we live in a divided world: between rich and poor, healthy and sick, literate and ignorant, between empowered and deprived. A new label of our time which threatens sustainable development is the “digital divide” which describes the development of countries and groups within countries in terms of their “capacity to harness the power of Information and Communications Technology” (Tongia, 2004: 15). In their study, “Digital Prosperity”, produced for the Information Technology and Innovation Foundation (ITIF), Atkinson and McKay state that in the new global economy ICT is the major driver, not just for improved quality of life, but also of economic growth. Indications also point towards ICT continuing to drive growth for the foreseeable future (2007: 1). It is furthermore observed that new technologies exceed initial expectations in the moderate to long-term in the digital revolution. Integration of ICT into almost all aspects of the economy and society has created a digitally enabled economy which is responsible for a large part of current economic growth (2007: 1). As a mechanism through which ICT is pervading global business, it is observed that increasing numbers of businesses are investing in the development and management of online resources directed to consumers, in support of the fact that the World Wide Web is perhaps the most rapidly developing new medium in history. As congruently enforceable concepts, sustainable development and information and communication technologies share commonality in their goals: sustainable development seeks to highlight the importance of ensuring current benefits extend towards generations of the future while ICT, in ideological terms, seeks to ensure that equitable benefit is offered to all without environmental, sociological, or economic constraint. It is observed by the author that a commonality of Sustainable Development and ICT goals for human development exist in the establishment of the conditions for intergenerational equity and prosperity, and an important factor in achieving long-term equity is empowering current generations to guide those that follow. Without transfer of knowledge, the successful ideas and products of today would be short-lived when deprived of the means to sustain themselves or adapt to future conditions. It is for this reason that, in the information age, sustainable development is improperly pursued without integrating the means to foster and transfer knowledge with equal diligence as the triple-bottom-line pursuit of social, environmental and economic principles.
4.4 Understanding the Implications on Architectural Process and Product
Today the context of a digital task extends beyond the world of work, play, travel and dwelling. Whether features are understood and applied depends on context in which they are encountered. The role of computing has changed by virtue of the fact that ICT has become ambient social infrastructure, and this therefore allies it with architecture. Computing is not just made of objects, it now consists of situations (McCullough, 2004: 21). Formerly, architecture assembled form through the creation of variations in closure and storing an energy that could only circulate in rigid relationships of space (Beckmann, 1998: 13). Architecture is now required to emerge in dual form, through emergence of an architecture that “casts no shadows (Beckmann, 1998: 15).” Linked realities are driven by rapid advancements in computing and communication technologies. In this era, people will be seen to spend more time ‘linked in’ to the digital world than experiencing their immediate physical surroundings (Moravec, 1998: 92) – access to technology permitting. While the debate of accessibility due to factors of affordability exist, the trend and demand for broad-reaching global availability of this digital realm in prevalent. With the development of immersive and augmented environments we have reached a new stage of evolution in the human condition through transition from analogue to digital modalities. These are zones of simulation, instant electronic transmission and simultaneity, removing all representations of the physical (Beckmann, 1998: 4).
148

Figure 1 Microsoft HoloLens creates augmented reality experiences by visibly overlaying interactive
information onto our physical environments. Image source: http://www.theverge.com/2015/1/21/7868251/microsoft-hololens-hologram-hands-on-experience.
We are now in the age of new technologies such as Google Glass and Microsoft HoloLens. An age where it is proposed to the mainstream consumer society that we are able to function better than ever in spite of our physical environments, rather than because of them. As can be observed in the above figure, these devices represent a segment of the information and technology sector that recognise the importance of integration and overlay of information on our daily lives as an enabler of progress and a facilitator of a new age of social interaction. To ignore this places architecture and the built environment in the ‘background’, and with it a missed opportunity to create physical environments rich in digital immersion. What is clear is that the architect is being left out of the loop in how these ubiquitous digital environments are being overlaid and integrated with our more traditional physical environments. One only has to think back to the 2013 launch of Google Glass and the fluid musical marketing video1 that captured the world’s imagination. In this promotion, a first person perspective showed of a typical day in the life of a Glass user and the endless possibilities of being constantly connected through augmented reality. What was most notable, watching this from the point of view of an architect, was the sequence involving the user’s navigation to and within a building. The crowd cheered as it was demonstrated that we can finally find our way around cumbersome or confusing interior spaces symptomatic of the building’s original design. Should architects be blamed that we now have buildings in need of virtual ‘retrofit’ in order to once again serve an efficient purpose? It is likely that the building function has undergone changes from the original design intent, but had the architect of that building known that it would one day be used to showcase that technology now replaces architecture in creation of optimised usage, would the design of this building have been different? It is conceivable it would have. These are questions we, in the industry of the built environment, must now ask ourselves and recognise that the game has irrevocably changed. In order to remain relevant to the perpetuating lifecycle of a building, architects must embrace a systems design approach that welcomes adaptable re-use, a link to information networks, and an overlap with the digital landscape.
Figure 2. The architect's scope, and the building's influence rarely escape the confines of the site boundary.
Image source: http://thumbs.dreamstime.com/x/cityscape-model-3d-red-skyscraper-10876651.jpg
Towards this purpose, the author observes that one of the greatest challenges to architects and built environment designers is the manner with which new projects are undertaken. New projects are bound by 1 The Google Glass Project: https://www.youtube.com/watch?v=JSnB06um5r4
149

physical limitation, as symbolically conceived in the figure above. The current mandate to design and build requires confinement to a singular site due to legalities of proprietorship, a perceived unimportance of larger planning frameworks, and budgetary restrictions. In an information age, where knowledge is passed freely without limitation irrespective of locality or other constraints of the physical dimension, buildings remain relics to a fixed point in time as soon as the planning process attempts to exclude the greater context. The fact of the matter is that no client should be expected to pay for the design of a greater urban framework within which the building resides if there is to be no economic benefit, guarantee of successful implementation, or buy-in from the surrounding sites and buildings. This mandate therefore cannot be taken singularly, but instead a greater system of inter-site collaboration is required. Architecture in its primary sense is concerned with statics, resistance of materials, equilibrium, and gravity. Architects are trained to work with the mass and energy of a building and its structure. However, in terms of information, the author observes that architecture consistently remains behind the present development. While architectural mass might always have a site and be bound by those constraints, a building is more than a structure, it is a system. A building represents a localised intervention, while the author proposes that architecture ideally represents an integrated system that derives and provides benefit to its grater context, in keeping with sustainable development principles. Architects need to recognise that the digital footprint is as integral to successful implementation and operation as the physical footprint. Currently the building and urban design process is benefitted by Building Information Modelling (BIM), the means of creating 3D virtual representation of buildings prior to actual construction. BIM runs deeper than 3D representation however, as it also provides a digital representation of a building in an accessible database of quantifiable data. This can be in the form of construction area, materiality quantities, spatial volumes, energy efficiency etc. What is effectively created is a digital avatar of a building, yet following the planning stages this virtual representation and all the information it contains is resigned to the hard drives of the design practitioner. Globally the construction industry is taking firm steps to recognise the importance of this role, as can be currently observed in Dubai whereby it municipality has legislated that all new large-scale buildings must be designed using BIM2. This new chapter in design, and the possible beginning of a new global trend, opens up some interesting possibilities. Intelligent buildings represent an era of architecture whereby built environments are provided with the means to self-regulate, monitor and adapt (to limited degree). An intelligent building, with a building management system (BMS) as its brain, is able to evaluate how different internal spaces are being utilised and control the artificial intervention to supplement or adapt to conditions. This can be in the form of lighting and HVAC control, the positioning of external shading devices, and CO2 regulation to name a few. Intelligent buildings, however, are limited to implement regulation to the function for which the building was originally designed. An intelligent building does not a guarantee of successful or sustainable implementation since quantification of building performance is not holistically adequate to properly integrate concepts of economics, society, environment, knowledge and user-experience. Smart Cities are currently being realised in varying manners in municipalities around the world. These cities will make use of ubiquitous communication networks, highly distributed wireless sensor technology and intelligent management systems in order to solve challenges and create new services (Clarke, 2013: 1). Smart Cities provide an opportunity for buildings, city-wide users, and infrastructure to participate in a dialogue for constant growth and renewal. However, the author proposes that since buildings are implemented as ‘islands’ in the greater context, by being limited to their singular sites, this dialogue often excludes the building and the architect. At present, when municipal approval is sought to initiate construction, the potential for inner-city participation is never interrogated. Instead, compliance to outdated zoning restrictions is applied, providing a static evaluation of context at a past point in time within which development is required to occur. This is not conducive to sustainable environments, but instead slows the process for growth and development which at their core require agile and flexible approaches to the evolving needs of their populace. Our buildings need to ‘plug-in’ to the digital context and in order for this to happen digital oversight is required. The future sustainable environment requires recognition that the physical world is complemented by the digital world. In lieu of this, the role of municipalities should therefore evolve from that of a fixed-point approval of design, to that of constant oversight to include the digital landscape as a means to interrogate and better our physical environments. Imagine, therefore, a digital city built of BIM-based avatars (provided by the architect or engineer) that are able to communicate in real-time with a smart-city central management system (municipal governing body), providing the means to make informed real-world decisions. Through this communication, quantifiable data such as building occupancy levels, user comfort and happiness, economic activity, traffic and pedestrian intensity, electrical consumption, etc., could all be received and interpreted. Neighbourhoods could be identified to be dwindling in economic prosperity, for example, prompting a broader scale recognition in demand for amenities of certain nature that could cater to the particular social requirements of the area. Buildings in an area that are deemed to be decreasing in popularity and population can be re-evaluated in their function and re-use suggested. This would be of benefit to building owners, users, as well as the continued involvement of construction industry. This actionable data could also even be extended to design practitioners currently designing buildings in the area – on the assumption that the project is registered as 2 As featured in online news article “Dubai to make BIM software mandatory for major projects”, source: http://www.arabianindustry.com/construction/features/2014/may/25/a-model-approach-4708613/#.VbOyQ_mqqkq
150

being developed with BIM data provided to the central oversight system during development – so that real-time adjustments can be made prior to finalising the design. In the realm of software and simulations, where it is possible to artificially reconcile contributing factors to change within one ecosystem of information availability, developers have for many years recognised that the most effective means for sustaining effective city-scale functionality and operations is to use all available data from macro and micro scales to affect decision-making. This same ideology logically applies to an era of information availability that knowledge societies are currently experiencing. Yet what is required is overall legislative support and on-the-ground implementation strategies to make for contributing information feed-back loops.
Figure 3. The popular city-management simulator SimCity 5, provides the ability to evaluate and adapt
planning to the evolving dynamics of a city and its occupants. Population happiness is related to provision of infrastructure, services, and amenities. Source: http://www.primagames.com/games/simcity/strategy/simcity-road-happiness.
The future of sustainable built environments is therefore not achieved through isolation of approach. It requires an integrated systems approach. This approach is therefore inclusive of the architect, the client, the single site, the greater urban and environmental context, and the urban over-seer (municipality). It is required to recognise that the job is not done when construction is complete, but rather that a building remains as a contributor to the greater sustainable context. Inclusion of these stakeholders therefore importantly requires the framework for inclusion of a feedback loop. Integration of information and communication technologies and processes that allow for real-time simulation and evaluation of the physical world in a digital realm. For the first time in our existence, this technology is available to make this a reality, all that is required is the impetus and know-how to implement. Sustainability in the Information Age is therefore possible to achieve in recognition of the needs and opportunities that our knowledge societies present.
5. Conclusion and Further Research
In this paper it has been discussed that the core concept of sustainable development remains a globally recognised concept of importance. It has also been discussed that the concept has proven to be sufficiently vague to create a barrier for implementation, giving rise to variations and evolution of the concept over time. These variations demonstrate that sustainability theory is not equal in all sectors, but rather substantiates that specific versions of sustainability theory are required depending of the intended scope of influence in order to provide a greater focus of approach and greater ease of implementation. It has also been discussed that while the concept of sustainability as originated in the 80’s remains relevant, this was developed at a before the information revolution. Hence the economy and society of today have emerge with new needs that were previously inconceivable prior to the digital revolution. Sustainable development must therefore recognise humankind’s requirements in the information age, in what are termed today’s ‘knowledge societies’. In this new information age, the built environment remains a key contributor of sustainable development, but risks losing influence at the expense of immersion a digital world that is succeed in supplanting the real with the virtual. The greatest risk to architecture is the current prevailing approach that design is applicable to fixed point in time, whereby buildings are designed to be isolated on a site, approved by a municipal authority at a fixed point in time, and left to their own devices to be retrofitted by technology to prolong their usefulness over time – a process that is often removed of architectural input. The onus is therefore on built environment practitioners and designers, building users, and municipal authorities to recognise that sustainability requires the means to facilitate and preserve knowledge transfer with equal importance as catering to the combined needs of economy, society and ecology. This new version of sustainability for the built environment therefore provides the framework for an adaptable new urban environment built on actionable information that recognises that the responsibility of planning built environments extends beyond the stages of planning and construction, but must recognise a lifespan intertwined with and contributing to a larger urban context. Establishing building feedback loops that leverage on principles of digital building representations through BIM, intelligent building’s capacity for self-evaluation and self-regulation, and smart city capacity for infrastructural monitoring create the building blocks
151

for an evolved and sustainable built environment that is able to adapt to the ever-changing socio-economic context. While this paper refers to the Millennium Development Goals of 2000, 25 September 2015 saw the inception of the UN Sustainable Development Goals as replacement. This new programme will require further investigation into the potential applicability of these newly established goals and milestones. In recognition that future sustainability concepts in the built environment require integration of ICT principles in process and product, it is thus important that a methodology for implementation be developed. Focused methodology will assist in providing a quantifiable basis according to which interventions can be assessed, as well as remove the vagueness of sustainable development theory that has led to difficulties of implementation.
6. Acknowledgements
This paper forms a part of the research currently being conducted as part of an on-going PhD candidacy with the University of the Pretoria. The paper provides a more comprehensive investigation into the nominated categories of this paper, with the aim of introducing a methodology of approach for architects in creating sustainable built environments to cater to the needs of our knowledge societies. This paper is being conducted under the mentorship of Dr Arthur Barker (Faculty of Architecture, University of Pretoria), and Dr Jeremy Gibberd (CSIR).
7. References
Beatley, T., & Manning, K. 1998. The ecology of place: Planning for environment, economy and community. Washington, DC: Island Press. Beckmann, J. 1998. The virtual dimension – architecture, representation and crash culture. New York, USA: Architectural Press. Charter, M., & Clark, T. 2007. Sustainable Innovation: Key conclusions from sustainable innovation conferences 2003-2006 organised by The Centre for Sustainable Design. The Centre for Sustainable Design, University College for the Creative Arts (http://bic-innovation.com/static/bic/knowledge_base/documents/T160433.pdf, accessed on 15 April 2013). Castells, M. 2010. The rise of the network society. In: The Information Age: economy, society, and culture. Malden, MA. Blackwell Publishers. Clarke, R. Y. 2013. Smart cities and the internet of everything: the foundation for delivering next-generation citizen services. Alexandria, VA, Tech. Rep. Cole, R. 2012. Transitioning from green to regenerative design. Building Research & Information, 40(1), 39-53. Conejos, S., Langston, C., & Smith, J. 2012. AdaptSTAR model: A climate-friendly strategy to promote built environment sustainability. Habitat International, 37, 95-103. Crosbie, T., Dawood, N., & Dawood, S. 2011. Improving the energy performance of the built environment: The potential of virtual collaborative life cycle tools. Automation in Construction, 20(2), 205-216. Du Plessis, C. 2012. Towards a regenerative paradigm for the built environment. Building Research & Information, 40(1), 7-22. Farmer, G., & Guy, S. 2010. Making morality: sustainable architecture and the pragmatic imagination. Building Research & Information, 38(4), 368-378. Fiksel, J. 2003. Designing Resilient, Sustainable Systems. Environment Science and Technology, 37(23), 5330 -5339. Gibberd, J. 2005. Developing a sustainable development approach for buildings and construction processes, in: Smart and Sustainable Built Environments. 300-310. Oxford, UK: Architectural Press. Guy, S., & Farmer, G. 2001. Reinterpreting sustainable architecture: the place of technology. Journal of Architectural Education, 54(3,) 140-148. Hine, J., Swan, D., Scott, J., Binnie, D., & Sharp, J. 2000. Using technology to overcome the tyranny of space: information provision and wayfinding. Urban studies, 37(10), 1757-1770. Jabareen, Y. 2008. A New Conceptual Framework for Sustainable Development. Environment, Development and Sustainability, 10(2), 179-192. Kalay, Y. E. 2006. The impact of information technology on design methods, products and practices. Design Studies, 27(3), 357-380. Kasarda, M. et al. 2007. Design for adaptability (DFAD)—a new concept for achieving sustainable design. Robotics and Computer-Integrated Manufacturing, 23(6), 727-734. Mansell, R., & When, U. 1998.Knowledge Societies: Information Technology for Sustainable Development. New York, USA: Oxford University Press. Mason, R. O. 1986. Four ethical issues of the Information Age. MIS Quarterly, 10(1), 5-12. McCullough, M. 2004. Digital Ground: Architecture, Pervasive Computing, and Environmental Knowing. Massachusetts, USA: The MIT Press, 2005.
152

Mebratu, D. 1998. Sustainability and sustainable development: historical and conceptual review. Environmental Impact Assessment Review, 18(6), 493-520. Moravec, H. 1998. The senses have no future. In: Beckmann, J. 1998. The virtual dimension – architecture, representation and crash culture. New York, USA: Architectural Press. Pohl, J. 2011. Building Science: concepts and application. Oxford, UK: Wiley-Blackwell Publishing Ltd. Tongia, R. et al. 2004. Information and Communications Technology for Sustainable Development: Defining a Global Research Agenda. Bangalore, India: Allied Publishers Pvt. Ltd. Smith, P. 2003. Sustainability at the Cutting Edge: Emerging technologies for low energy buildings. Oxford, UK: Architectural Press. United Nations Conference on Environment and Development (UNCED). 1992. Agenda 21. New York, USA: Oxford University Press for the United Nations World Commission on Environment and Development. United Nations (UN). 2000. Resolution 55/2 United Nations Millennium Declaration. New York, USA: Oxford University Press for the United Nations General Assembly. Yang, J., Brandon, P., & Sidwell, A. 2005. Smart and Sustainable Built Environments. Oxford, UK: Blackwell Publishing Ltd. World Commission on Environment and Development (WCED). 1987. Our common future (The Brundtland Report). New York, USA: Oxford University Press for the United Nations World Commission on Environment and Development.
153

154

MODEL FOR SUSTAINABILITY EVALUATION OF EXISTING RESIDENTIAL BUILDINGS
Nikolina VEZILIC STRMO1
Ivana SENJAK2
Silvio BASIC3
1 Department of Buildings / Faculty of Civil Engineering / University of Zagreb, Email: [email protected] 2 Department of Buildings / Faculty of Civil Engineering / University of Zagreb, Email: [email protected] 3 Department of Buildings / Faculty of Civil Engineering / University of Zagreb, Email: [email protected] Keywords: contemporary use-value, durability, existing residential buildings, functional obsolescence, physical deterioration
Abstract
Existing residential buildings and its renewal carries considerable potential in achieving the goals of sustainable development. This is due to the fact that annually only 1-2% buildings are newly built but also to the fact that the dwelling carries a great symbolic and material value both for the individual and society as a whole. Like other countries in transition (former socialist countries), Croatia is facing serious problems in terms of physical and functional obsolescence of the existing housing stock. In order to solve these problems and meet the needs of modern living, it will be required a large-scale intervention in residential architecture. However, in order to determine priorities and strategies of renewal, as well as to facilitate rational allocation and use of available resources, it is primarily necessary to make an evaluation of the existing residential buildings. In order to form an evaluation model of existing residential buildings, the durability is used as a prism for the selection of sustainability indicators. Durability is thereby viewed not only through its temporal aspect but also in a broader context of environmental, economic and social consequences resulting from it. Through analysis of the durability problems, such as physical deterioration and obsolescence, the most important factors affecting the durability and buildings contemporary use value have been identified. Following the completion of an extensive and systematic analysis of all aspects of the existing residential buildings, a framework for evaluation model was formed. Furthermore, in order to achieve the practical value of this evaluation study, the problem must be placed within clearly defined spatial and temporal settings.
1. Introduction
Buildings, as utilitarian objects, have the task of satisfying a wide range of human needs and activities. Because of their long physical life, buildings are faced with numerous changes of technological, economic, social and political conditions as well as the laws that affect the growth and changing of needs and requirements. If the building does not have the ability to adapt to new conditions and tasks it becomes obsolete. The obsolescence is trying to be delayed by regular and systematic maintenance, but at some point, it is necessary to restore the building. In the renewal process it is possible to choose between different strategies: to renovate the building in order to meet the growing needs and demands, to convert the building, or to demolish it and build anew. However, in order to determine priorities and strategies of renewal, as well as to facilitate rational allocation and use of available resources , it is primarily necessary to make an evaluation of the existing residential buildings. Renovation represents an opportunity for the application of sustainability principles. „Sustainable renovation“ is thus not just reduced to the care for the environment but it involves cultural, social, economic, and institutional aspects of renovation projects. The aim of building renovation is to make a contribution to sustainable development in wider context (having in mind future generation as well) by the improvement of economic, tehnical, social, functional and environmental characteristics of a building. Construction activity is an important field to achive the goals set within the sustainable development framework since it affects all three aspects of sustainability: economic and social development as well as environmental protection. A building has an effect on its surroundings throughout all stages of its life cycle: from raw materials and their processing into complex products to design, construction, use, maintenance, conversion, and finally, demolition. The result is an excessive use of land and resources, huge amount of waste, greenhouse and other gas emission and most of all, energy consumption. Sustainable construction aims to reduce the consumption of natural resources as well as the emission of harmful gases but also to create desirable characteristics of buildings that would meet the needs and requirements of their users and owners. Housing construction, as an important segment of the total construction activity, shows great potential for the realization of the sustainable development goals. Owing to the fact that only 1-2% of new buildings are constructed annually, it becomes evident that the existing housing stock is of considerable importance. Home as "the greatest material and symbolic value of every household" is a key element of human dignity, and therefore the problems of housing construction directly affect the main objective of sustainable development: do not compromise the ability of future generations to meet their own needs. In order to meet this objective the housing has to be adoptable to the modern way of life and users’ needs and their changes over time. As the number of housing units is on the increase approaching the number of households, so the
155

construction of new buildings is becoming less important while the renovation of the existing housing stock is becoming all the more important. Taking into account the above facts, the aim of this study is to contribute to science-based decision-making in the phase of renewal. This is particulary important for Croatia because it is like other countries in transition (former socialist countries), facing serious problems in terms of physical and functional obsolescence of the existing housing stock. In order to solve these problems and meet the needs of modern living, it will be required a large-scale intervention in residential architecture.
2. Existing tools for building sustainability evaluation
A review of existing literature gives insight into a large number of various systems and tools focusing on multiple aspects of buildings’ sustainability, designed for various types of projects. (Lorenz et al., 2011) Since they have been developed for various needs, they greatly differ in terms of terminology, structure, construction evaluation methods, relative importance of the environmental factors and documents required for the certificate. (Ness et al., 2007; Fowler et al., 2006; Pope et al., 2004) They are designed for evaluation of various types of buildings with emphasis on different stages within the building's life cycle and are based on various legal acts, rule books, norms and instructions. (Segnestam, 2002) Some of them are international, national or local. Besides the existence of many different systems for sustainability evaluation, they are also constantly being changed. As a result, it is hardly possible to compare them. A obvious shortcoming of most of the existing evaluation models systems from their ample scope and comprehensiveness as well as the level of detail wich require great expertise and thus led to a long-lasting evaluation process. (Ohemeng, 1998) The existing models may serve, however, as a basis for the establishment of the possible criteria wich would be relevant for the sustainability of the existing housing stock. Considering the subject of the research , i.e. the specific features of the particular houses, it is necessary to select only a small number of factors as a basis for an evaluation model. In order to facilitate its practical application, it is necessary to set a particular problem in the given time and spatial framework. The proposed model should be multicriterial, integrated, based on a small number of carefully selected indicators considering the area and the objective of the research.
3. Durability as a measure of sustainability
A review of existing sustainability measures noted that durability is one of the inevitable measures of sustainability as all the other measures quantify the impact on the environment and resources, depending on the length of the life cycle buildings. For this reason, the durability is used as a prism for the selection of sustainability indicators. Durability is thereby viewed not only through its temporal aspect but also in a broader context of environmental, economic and social consequences resulting from it. For this purpose, it is necessary to observe the building at all levels, from the smallest detail, the entire project to the interaction with the environment.
3.1 Problems of durability
Buildings and other facilities are planned, designed, constructed and maintained to ensure the protection and meet the needs of its users and owners. (Committee on facility design to minimize premature obsolescence, 1993) Over time, the quality of service declines as a result of wear, poor performance and materials, unexpected events, aging, or a combination of those factors. The aforementioned decline was largely expected, but after a while, there comes a moment when services are no longer appropriate and renovation or demolition and replacement of buildings is needed. At the beginning of building operation, its performance approximately meets the requirements. The gap between the performance and the requirements increases simultaneously with the aging of buildings. (Figure 1)
Figure 1 Building performance/requirements over time
156

The gap between the requirements and performance created for two reasons (Aikivuori, 1996): 1. The level and character of the requirements is changing over time. Generally, the requirements grow
over time, creating the foundation of obsolescence. In addition to the period of change, there are periods when the requirements are relatively stable.
2. Simultaneously with the change of the requirements comes to the physical deterioration due to wear and tear because of use or external influences. The level of deviation depends on the level of maintenance over time.
When we talk about durability, we distinguish the terms of obsolescence and physical deterioration. Any object or piece of equipment can meet the basic requirements, but to be old and out of date. In another case, the latest and most advanced product may break or not to be sufficient, especially in case of poor maintenance. At some point, the gap between the performance and the requirements can no longer be tolerated, and the building is no longer appropriate for the same purpose or for some other purpose without major interventions. These interventions may include the renovation of the building to meet the evolving needs and requirements, the conversion of the building or tear it down and build anew.
3.1.1 Physical deterioration Physical deterioration refers to the deterioration of the external building envelope, bearing structures, the final floor finish and installation, because of aging, use and unforeseen events. Looking at the lifetime of the building components, we can see a difference in their durability, both between components as well as within each assembly or system. Besides, to the structural elements of the building all other components require different maintenance, repairs or replacement during the buildings lifetime. (National Association of Home Builders, 2007) Construction elements of residential buildings can be divided into two groups:
1. those that last as long as the whole building - without renewal (eg. primary load-bearing structure - foundations, walls, floor structures, etc.).
2. those which must be partially or completely replaced several times during the life of the entire building
The causes of physical deterioration come from the building, but also outside of it. Such as (Bernard Williams Associates, 1994.): - neglect and lack of maintenance - impact of weathering: the effect of snow, rain, wind, atmospheric pollution and chemical influences which causes erosion and corrosion of the material of the outer shell of the building - general wear as a consequence of aging and the use intensity - the sudden appearance such as fire, earthquake or storm - design and construction defects
Figure 2 Durability as a function of service quality and service life
157

In the last 20 years a large number of standards, guidelines and methods for predicting the physical life of building materials and elements, has been developed, at the national, international and individual level. (Rudbeck, 2002) Looking at the physical lifetime, there are three important level of quality (Kesik et al., 2005) (Figure 2) - specified quality - provided by the designer, the prescribed norms and standards - minimum acceptable quality - requires repair and replacement - failure - material or assembly is considered unserviceable The extent of the physical deterioration of residential buildings therefore primarily depends on the level of initial quality of construction, as well as the quality and frequency of maintenance.
3.1.2 Obsolescence
The obsolescence is usually caused by the change and increase of the requirements or expectations in the facility use. In most cases, things or concepts that are outdated continue to function, but at levels below modern standards. A key feature of obsolescence is shortening the life of the equipment because of rising expectations. (Figure 3)
The buildings are usually captured in a certain physical, social, technological and environmental framework, which limits their ability to adapt to change. This is the foundation of obsolescence. Figure 3 Increasing expectations and optimum performance over time
The building obsolescence is very broad and complex subject as proven by the large number of interpretations and aspects found in the literature. Golton (1989) cites several forms of obsolescence such as structural, financial, geographic location, functional, control, style and perceptual. Ashworth (1996) also lists several aspects of obsolescence including physical, economic, functional, technological and location. U.S. Committee on facility design to minimize premature obsolescence (1993) divides the factors affecting increase expectations and obsolescence in four categories: Functional - related to the expected use of the building or its premises (eg. changing users) Economic - primarily refers to the costs continuing to use the existing building, subsystems or components in comparison to the cost of replacement with an alternative (eg. if the building can no longer attract and retain customers in competition with some new buildings) Technological - refers to the efficiency of the services offered by existing technologies in comparison with the new and improved solutions (eg, some types of buildings - hospitals, research laboratories - have become "obsolete before construction is complete") Social, legal, political or cultural - wide impact of social goals, political agenda or lifestyle changes (eg. If the building cannot meet the requirements, resulting from the law on accessibility for disabled persons) Obsolescence is usually the result of a combination of several of the above factors. To avoid obsolescence or to reduce the costs of obsolescence, it is necessary to effect throughout the buildings’ life cycle. The most important thing is to anticipate changes and enable them before the costs of obsolescence become prohibitive. Unfortunately, buildings often are not sufficiently flexible and adaptable to meet the changing needs over a long period. So when it comes to the obsolescence before the expiry of the projected useful life, the building becomes a huge designing and control problem. As a result, the demolition is more likely a result of obsolescence than physical decay. (Sarja, 2000)
158

Obsolescence depends primarily on the potential of initial use value and increasing expectations (requirements and needs).
4. Durability factors of existing residential buildings
By analyzing the problems of durability, like physical deterioration and obsolescence, we have established that the durability of the existing building, in spite of a number of factors, is primarily affected by its potential of initial use value, increasing expectations, the level of initial quality of construction and the quality and frequency of maintenance.
4.1 Use value
Use value is often identified with the utility, which is defined as a characteristic of a good to meet any human need or desire. (Ekonomski leksikon, 2011) The buildings are primarily utilitarian objects, created to meet a wide range of human needs and activities. Broadbent (1984) states that the building function as a container for activities, economic investment, environmental filter, a cultural symbol, a historical symbol, a symbol of prestige and image, social investment, and part of the built environment. In general, the buildings are of great importance to individuals, organizations, societies and nations. Buildings represent a large part of many countries wealth. In addition to the economic impacts, the building creates a physical environment for many human activities. Thus, the value of the building depends on the objectives of its owners and its ability to support the activities of its users. Apartment, as well as other products, serves to its users, ie. provides a service. Wenzel et al. (1997) report that the service (meeting the needs of users) is the reason for the existence of the product. In his doctoral dissertation, Poljanec (2001) claims that there is not only one housing value, but it is the sum of individual values, and each property of the house in the broad sense represents the value. As a basis for research and defining the properties, it is necessary therefore to start from human needs and their satisfaction. Tomic and Canak (1974) state that the architectural and urban heritage according to its fundamental character can be divided into three specific groups: - heritage that over time obtained on the importance and value (valuable architectural monuments and historical units) - heritage that over time maintains its initial significance (some artificial environments) - heritage that over time lost in importance and use value (utilitarian objects which include housing) Because of its long physical life the buildings are faced with a number of changes to the social, economic, technological and political conditions that affect the change or increase in needs and requirements. If the buildings cannot adapt to the new conditions, they limit their customers to meet their needs, and thus directly affect the main objective of sustainable development. This loss of the use value of residential buildings represents a loss of original properties over time. In doing so we take into account loss of: - strength, toughness and resistance of building elements caused by the harmful effects of the environment (resistance to humidity, resistance to frost, biological resistance, corrosion resistance) - insulating properties (thermal insulation, noise protection, air permeability) - the loss of the external appearance (plastering, painting, etc.). However, besides these objective home values, there are those harder to capture, but equally important to determine the use value of modern apartment. Thus to determine the contemporary use value of the existing residential buildings it is necessary to identify their existing properties and check the level of their compliance with modern requirements and needs that are placed on residential construction.
4.1.1 Building properties Definition of a product is that it serves to the user, provides a service. The service provided by a building can be described by building properties. In order to compare the properties of the product, we must be able to define and quantify them. If we are unable to quantify properties, they should be at least classified into category so the required services could be expressed and compared among similar products. In this case, we can compare the individual categories due to the potential environmental, economic and social impacts. In order to get insight into the potential building properties and the way in which they can be measured and compared, a certain number of existing assessment models were analyzed (Table 1), and several major categories of properties were found. (Table 2) Classification of properties within the category depends on the interpretation. Properties can meaningfully be allocated to more than one category. For example, the individual properties that fall into the category of health and comfort can be classified under the functional and social properties.
159

Table 1 Building assessment models and evaluation areas
Name State Evaluation area
Environmental impacts Housing properties SBTool International BREEAM UK
LEED US
Housing quality indicator system UK Housing performance indication system Japan
QUALITEL France
evaluation area
main evaluation area
Table 2 Building properties
Categories Properties
functional
spatial suitability adaptability organization of the apartment supporting facilities of the apartment availability, support and technical potential of the system handling technical systems thermal comfort acoustic comfort visual comfort air quality availability of services and facilities near the building traffic accessibility of buildings accessibility for people with disabilities
technical
bearing capacity stability interchangeability of equipment and installations durability reliability thermal insulation of the building envelope
economic
costs of planning and design construction costs cost of ownership costs of demolition and disposal total cost of ownership the value of the property income from real estate return on investment
environmental energy efficiency consumption of resources environmental Impacts
social
protection and safety
access control and protection firefighting safety in use identity
integration of the building on the land and environment cultural and historical value of the building inclusion, participation and identification aesthetics, image, appearance
160
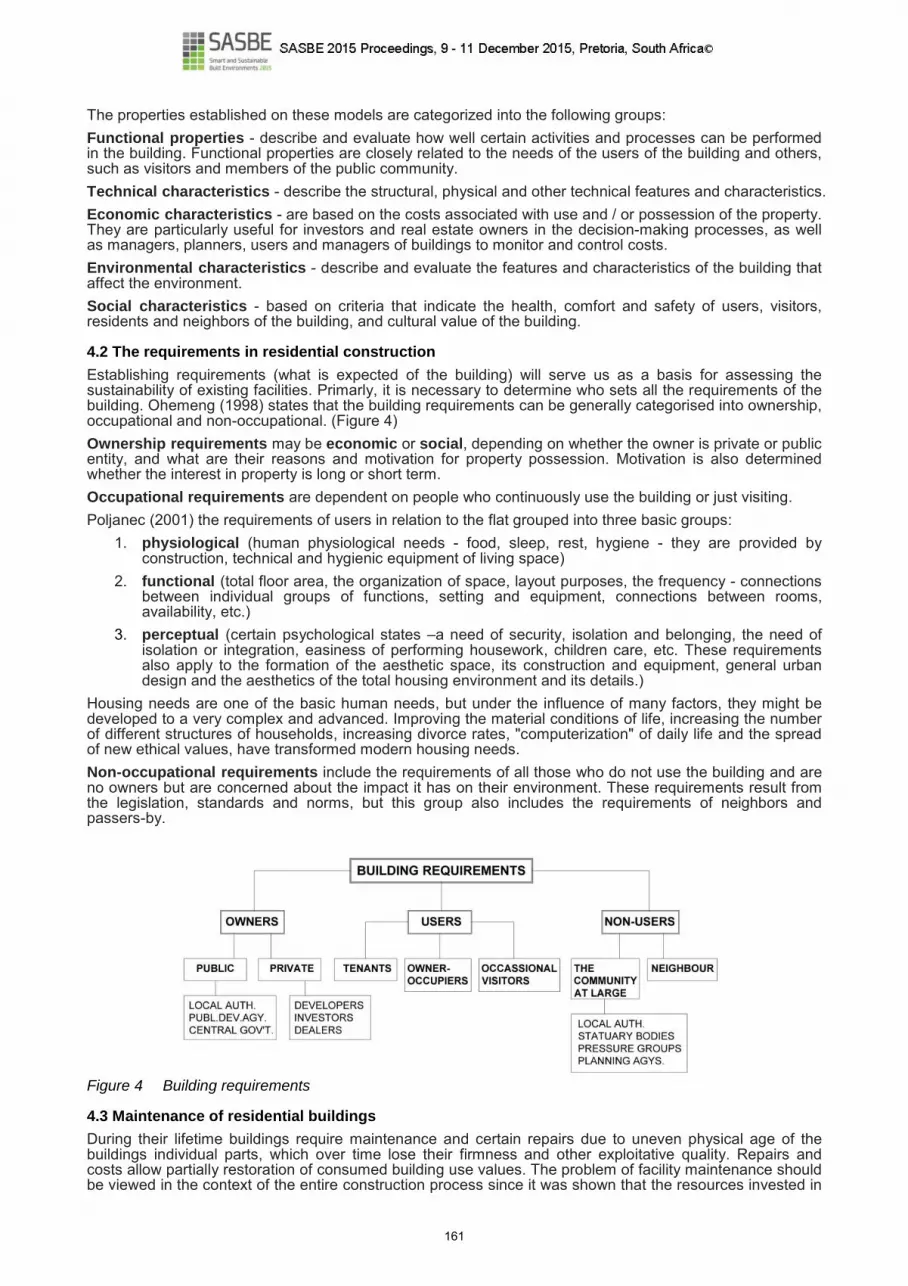
The properties established on these models are categorized into the following groups: Functional properties - describe and evaluate how well certain activities and processes can be performed in the building. Functional properties are closely related to the needs of the users of the building and others, such as visitors and members of the public community. Technical characteristics - describe the structural, physical and other technical features and characteristics. Economic characteristics - are based on the costs associated with use and / or possession of the property. They are particularly useful for investors and real estate owners in the decision-making processes, as well as managers, planners, users and managers of buildings to monitor and control costs. Environmental characteristics - describe and evaluate the features and characteristics of the building that affect the environment. Social characteristics - based on criteria that indicate the health, comfort and safety of users, visitors, residents and neighbors of the building, and cultural value of the building.
4.2 The requirements in residential construction
Establishing requirements (what is expected of the building) will serve us as a basis for assessing the sustainability of existing facilities. Primarly, it is necessary to determine who sets all the requirements of the building. Ohemeng (1998) states that the building requirements can be generally categorised into ownership, occupational and non-occupational. (Figure 4) Ownership requirements may be economic or social, depending on whether the owner is private or public entity, and what are their reasons and motivation for property possession. Motivation is also determined whether the interest in property is long or short term. Occupational requirements are dependent on people who continuously use the building or just visiting. Poljanec (2001) the requirements of users in relation to the flat grouped into three basic groups:
1. physiological (human physiological needs - food, sleep, rest, hygiene - they are provided by construction, technical and hygienic equipment of living space)
2. functional (total floor area, the organization of space, layout purposes, the frequency - connections between individual groups of functions, setting and equipment, connections between rooms, availability, etc.)
3. perceptual (certain psychological states –a need of security, isolation and belonging, the need of isolation or integration, easiness of performing housework, children care, etc. These requirements also apply to the formation of the aesthetic space, its construction and equipment, general urban design and the aesthetics of the total housing environment and its details.)
Housing needs are one of the basic human needs, but under the influence of many factors, they might be developed to a very complex and advanced. Improving the material conditions of life, increasing the number of different structures of households, increasing divorce rates, "computerization" of daily life and the spread of new ethical values, have transformed modern housing needs. Non-occupational requirements include the requirements of all those who do not use the building and are no owners but are concerned about the impact it has on their environment. These requirements result from the legislation, standards and norms, but this group also includes the requirements of neighbors and passers-by. Figure 4 Building requirements
4.3 Maintenance of residential buildings
During their lifetime buildings require maintenance and certain repairs due to uneven physical age of the buildings individual parts, which over time lose their firmness and other exploitative quality. Repairs and costs allow partially restoration of consumed building use values. The problem of facility maintenance should be viewed in the context of the entire construction process since it was shown that the resources invested in
161

the maintenance increasingly outweigh the resources needed for the construction of new buildings. (Radojević et al., 2007) (Table 3)
Table 3 The life cycle costs of the building by stages
Design Construction Use and maintenance Demolition Total
4% 26%
maintenance and use 35% ? %
100% ownership
cost repairs 20% replacement of materials 10%
1 year 2 years 50 years 1 year Total There is a direct connection between the age of residential buildings and the level of repair costs and maintenance. From the very beginning of exploitation there is no real restoration of basic structures and devices, and even the cost of ongoing repairs in the initial period of building exploitation are primarily related to preventive device repairs. The actual cost of repairs and maintenance of apartments, which are changing over the years, may be replaced by average annual cumulative costs for a given limited period. Indicators of average annual cumulative cost of repairs and maintenance are essential for economic calculations when selecting the optimal lifetime of residential buildings and their components, and the calculations to determine the future needs of the new construction and maintenance of existing housing. To preserve the existing housing stock it is necessary to improve its maintenance and repair, and thus prolonging its economic useful life. It is useful to connect with works of repairs and remodeling by increasing the level of interior design for the existing facilities, ensuring comfort and lifespan of modern residential buildings.
4.4 The framework for developing sustainability evaluation model of existing residential buildings
Table 4 The framework for developing sustainability evaluation model of existing residential buildings
162

Starting from the fact that sustainability of existing buildings depends on its contemporary use value the framework for developing sustainability evaluation model of existing residential buildings was formed. After analyzing a number of existing systems potential building properties have been established, and classified into categories. The research of building requirements, their priority to interest parties and possible ways of verifying the compliance were also conducted. Formed framework can serve as a base for the development of more than one evaluation model depending on case studies. Since it was established that the values vary from group to group and from person to person, it is impossible to create a model based on a single set of criteria that can be applied in all situations. Only locating the problem in a clear set of spatial and time frames it is possible to reduce the current list of properties and achieve practical value of research.
5. Conclusion and Further Research
Existing residential buildings and its renewal carries considerable potential in achieving the goals of sustainable development. Sustainable renewal aims not only to reduce environmental impacts and increase economic efficiency, but also to create desirable building features that will improve the quality of life of its users and owners. Due to the long physical life of residential buildings, their deficiencies affect not only the present but also the future users, which is in direct relation with the primary objective of sustainable development - non-restriction of future generations to meet their own needs. In order to meet this objective the housing has to be adoptable to the modern way of life, users’ needs and their changes over time. In order to determine the best way to evaluate sustainability of existing buildings, an analysis of existing evaluation methods was conducted, and some common advantages and disadvantages are observed. As the major shortcoming imposed the lack of definitive targets of evaluation leading to the excessive number evaluation criteria. For this reason, systems become too extensive, comprehensive and detail which requires great expertise and longevity in the evaluation process. In order to avoid one-dimensional approach and keep a broad view of the concept of sustainable development and a complex housing issues, durability was chosen as a prism for the selection of sustainability indicators. Durability is thereby viewed not only through its temporal aspect but also in a broader context of environmental, economic and social consequences resulting from it. By analyzing the problems of durability, like physical deterioration and obsolescence, we have established that the durability of the existing building, in spite of a number of factors, is primarily affected by its potential of initial use value, increasing expectations, the level of initial quality of construction and the quality and frequency of maintenance. Thereby, building durability depends on its contemporary use value that can be defined as the degree of alignment between the modern and the required properties of the existing building. After research of building properties and interest parties’ requirements and needs, the framework for developing sustainability evaluation model of existing residential buildings was formed. Formed framework can serve as a base for the development of a larger number of evaluation models depending on a chosen construction.
7. References
Aikivuori, A., (1996.), „Periods and demand for privat sector housing refurbishment“, Construction Management and Economics, 14; 3-12 Ashworth, A., (1996.), Pre-contract Studies: Development Economics, Tendering and Estimating, Addison Wesley Longman Limited, Edinburgh Bernard William Associates, (1994.), Facilities Economics: Incorporating 'Premises Audits' , Building Economics Bureau, Bromley, Kent, UK Broadbent, G., (1984.), „Architectural Quality“, in: Powell, J.A. i Brandon, P.S., Quality and Profit in Building, E&FN Spon: 38-50 Committee on Facility Design to Minimize Premature Obsolescence, Building Research Board, National Research Council, (1993.), The fourth dimension in building: strategies for minimizing obsolescence, National academy press, Washington, D.C. Ekonomski leksikon, (2011.), editors: Mikic, M., Orsag, S., Poloski Vokic, N., Leksikografski zavod Miroslav Krleza, Masmedia, Zagreb Fowler, K.M., Rauch, E.M., (2006.), Sustainable Building Rating Systems, Summary, Pacific Northwest National Laboratory Golton, B.L., (1989.), „Prespectives in Building Obsolescence“, in: Grover, R., editor, Land and Property Development: New directions, E&FN Spon, London GSKG, (2001.), Upravljanje zgradama, Prirucnik za suvlasnike Kesik, T., Saleff, I., (2005.), „Differential Durability, Building Life Cycle and Sustainability“, 10
th Canadian Conference on Building Science and Technology, Ottawa Lorenz, D., Lützkendorf, T., (2011.) "Sustainability and property valuation: Systematisation of existing approaches and recommendations for future action", Journal of Property Investment & Finance, 29 (6): 644 – 676 National Association of Home Builders, (2007.), Study of Life Expectancy of Home Components, Bank of America Home Equity, US Ness, B., Urbel-Piirsalu, E., Anderberg, S., Olsson, L., (2007.), „Categorising tools for sustainability assessment“, Ecological Economics, 60 (3); 498-508
163

Ohemeng, F.A., (1998.), Rehabilitation versus Demolition and Redevelopment, Doctoral thesis, TIME Research Institute, Department of Surveying, University of Salford, Salford, UK Poljanec, G., (2001.), Pozeljna svojstva stana, Doctoral thesis, Faculty of Architecture, University of Zagreb, Croatia Pope, J., Annandale, D., Morrison- Saunders, A, (2004.), „Conceptualising Sustainability Assessment“, Environmental Impact Assessment Review, 24; 595-616 Radojevic, M., Devetakovic, M., Kosic, T., (2007.), „Facility management – Teorijski okviri i primena u praksi“, Istrazivanje i projektovanje za privredu, 18(2007) Rudbeck, C., (2002.), „Service life of building components: making it operational in economical assessment“, Construction and Building Materials, 16 (1); 83-89 Sarja, A., (2000.), „Integrated Life cycle design as a key tool for sustainable construction“, Integrated Life-Cycle of Materials and Structures, ILCDES 2000, Proceedings of the RILEM/CIB/ISO International Symposium; 1-5 Segnestam, Lisa, (2002.), „Indicators of Environment and Sustainable Development, Theories and Practical Expirience“, Environmental Economics Series, Washington Tomic, R., Canak, M., (1974.), „Problematika prilagodjavanja postojeceg stambenog fonda suvremenim zahtevima i potrebama“, Informativni bilten, Centar za stanovanje ims, 15 Vezilic Strmo, N. (2012.), Model procjene odrzivosti postojecih stambenih zgrada – na primjeru visestambene izgradnje u Zagrebu od 1945. do 1975. godine, Doctoral thesis, Faculty of Architecture, University of Zagreb, Croatia Vezilic Strmo, N.; Delic, A.; Kincl, B. (2013.), Uzroci problema postojeceg stambenog fonda u Hrvatskoj, „Prostor“, 2 (46): 340-349; Zagreb
164

USING SOCIAL MEDIA INFORMATION IN TRANSPORT- AND URBAN PLANNING IN SOUTH AFRICA
Quintin VAN HEERDEN
1
1 Built Environment, Council for Scientific and Industrial Research, Email: [email protected] Keywords: data-mining, social media, transport planning, urban planning
Abstract
Transport- and urban planning often involves the use of large-scale simulation modelling with data sources that include, among others, the national census, the National Household and Travel Survey (NHTS) as well as trip diaries. Many of these sources of data are costly and time consuming to obtain, clean, and analyse. This paper explores the significance of social media platforms as a source of open, more accessible data to infer people’s movement and land-use patterns, by focussing on the City of Tshwane Metropolitan Municipality in the Gauteng Province of South Africa. Users of social media platforms, such as Twitter, Foursquare and Flickr, post millions of publicly available updates each day. Some of these postings have spatial-temporal characteristics in the form of geo-tagged, time-stamped metadata fields. In this paper, data-mining techniques are used to obtain, extract, and analyse data from social media to illustrate the usefulness of such open data in the transport- and urban planning domains in South Africa.
1. Introduction
Transport- and urban planning are vital to ensure appropriate spending of funds for infrastructure development and maintenance, to ensure sustainability in cities, and to enhance a country’s economic competitiveness. To do effective planning for enhanced service delivery and to influence urban policy, transport- and urban planners endeavour to understand how different parts of the transport- and urban systems affect one another. A common tool used in these environments is that of simulation modelling, which allows one to evaluate the effect of changes in the transport- and urban systems on, for instance, expected travel times and land-use patterns in the future. In both transport- and urban simulation models, the required data are vast and often very difficult to obtain. Data which might be more easily obtainable through, for instance, surveys, tend to be very expensive. The time and effort involved in collecting data on travel behaviour from trip diaries is also cumbersome. Furthermore, these large-scale simulation models are notorious for the long time needed to develop it and due to its complexity often has a simulation run-time of several days. The time it takes to develop and run these models is, however, justified seeing that these models should inform multi-billion rand infrastructure investment decisions. Yet, we need to find alternative, quicker, cheaper and reusable ways to gain insight into people’s movement and land-use, which could complement existing methodologies that produce the input to these simulation models as well as provide other insights relating to the transport- and urban planning domains. It is possible to exploit publicly available data in the form of social media. Millions of postings are made every day on social media networks such as Twitter, Foursquare, Flickr, and Instagram. The metadata linked to these postings contain very detailed information that could be utilised once it is reworked into a usable format. While many studies have been conducted abroad using social media as a source of information for research purposes, South Africa has yet to catch up with this trend, especially in the transport- and urban planning domains. One of the major reasons often cited for this phenomenon is that a large portion of the South African population is very poor (StatsSA, 2011), hence chances are that cellular phone usage, and more specifically the use of social media on cellular phones, would not be high enough, or else biased towards the higher income groups. According to the Social Media Landscape 2015 report by World Wide Worx (2015), a large portion of the South African population still accesses Facebook by means of a basic cellular device (not a smartphone). However, in the same report it is stated that Twitter had an increase of 20% in its user base from South Africa, with a total of 6.6 million users at the end of 2014. For this reason, this paper explores whether social media, specifically Twitter, can be used to obtain insights into the transport- and urban planning domains in South Africa through the development of smart and sustainable procedures. The main focus of this paper is to evaluate how publicly available data from social media can be extracted and used with other datasets to gain insight into people-movement and land-use patterns in both the transport- and urban planning domains. A secondary focus is to evaluate the usefulness of such data in a developing country, such as South Africa, where smartphone user growth is slower than in developed countries. The next section gives an overview of the literature relating to social media data mining in the transport- and urban domains. Thereafter the methodology is described of how the datasets were obtained and prepared for use in this paper. Section 3 sheds light on the usefulness of the data obtained from Twitter by means of analyses, illustrations, and a machine learning model, by using the City of Tshwane
165
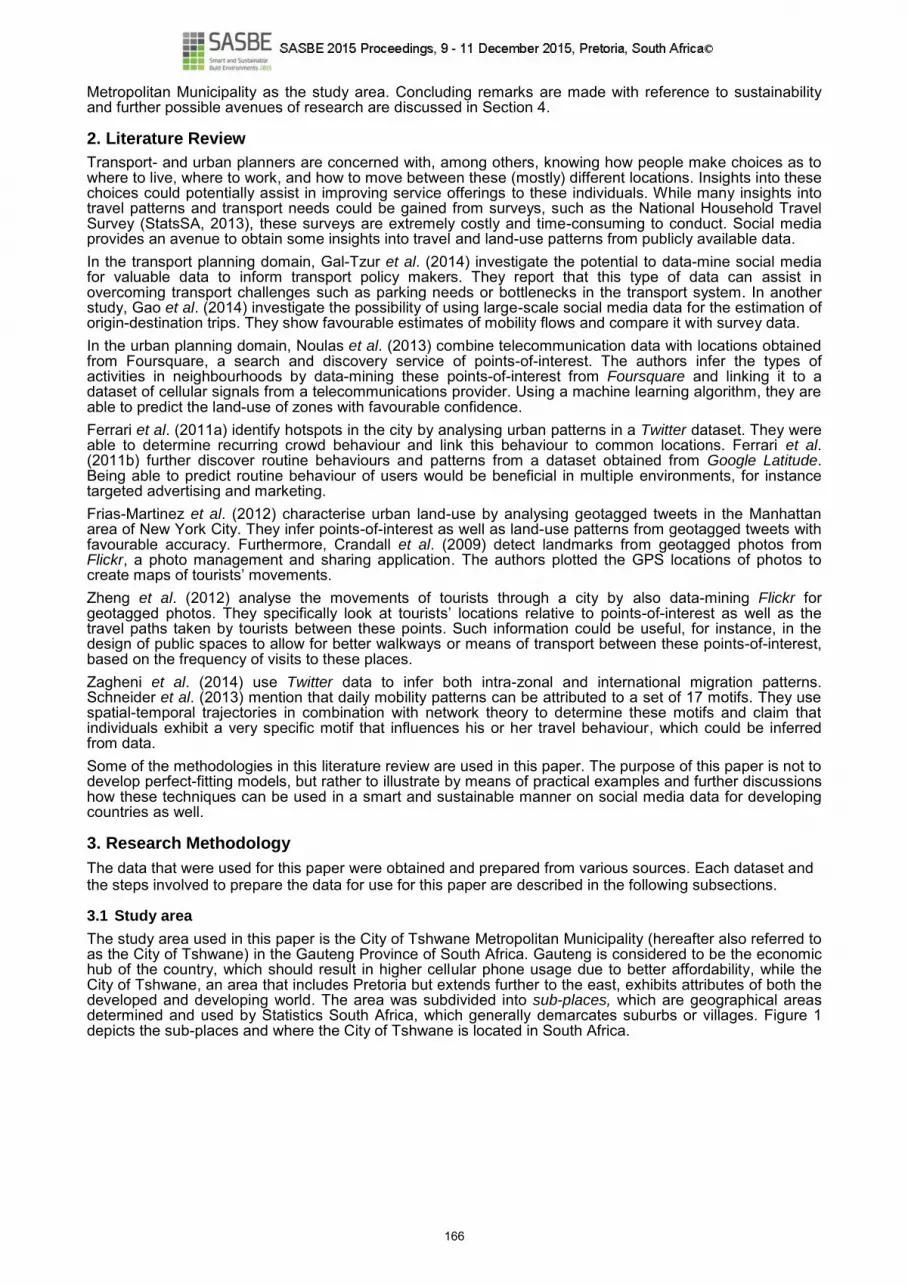
Metropolitan Municipality as the study area. Concluding remarks are made with reference to sustainability and further possible avenues of research are discussed in Section 4.
2. Literature Review
Transport- and urban planners are concerned with, among others, knowing how people make choices as to where to live, where to work, and how to move between these (mostly) different locations. Insights into these choices could potentially assist in improving service offerings to these individuals. While many insights into travel patterns and transport needs could be gained from surveys, such as the National Household Travel Survey (StatsSA, 2013), these surveys are extremely costly and time-consuming to conduct. Social media provides an avenue to obtain some insights into travel and land-use patterns from publicly available data. In the transport planning domain, Gal-Tzur et al. (2014) investigate the potential to data-mine social media for valuable data to inform transport policy makers. They report that this type of data can assist in overcoming transport challenges such as parking needs or bottlenecks in the transport system. In another study, Gao et al. (2014) investigate the possibility of using large-scale social media data for the estimation of origin-destination trips. They show favourable estimates of mobility flows and compare it with survey data. In the urban planning domain, Noulas et al. (2013) combine telecommunication data with locations obtained from Foursquare, a search and discovery service of points-of-interest. The authors infer the types of activities in neighbourhoods by data-mining these points-of-interest from Foursquare and linking it to a dataset of cellular signals from a telecommunications provider. Using a machine learning algorithm, they are able to predict the land-use of zones with favourable confidence. Ferrari et al. (2011a) identify hotspots in the city by analysing urban patterns in a Twitter dataset. They were able to determine recurring crowd behaviour and link this behaviour to common locations. Ferrari et al. (2011b) further discover routine behaviours and patterns from a dataset obtained from Google Latitude. Being able to predict routine behaviour of users would be beneficial in multiple environments, for instance targeted advertising and marketing. Frias-Martinez et al. (2012) characterise urban land-use by analysing geotagged tweets in the Manhattan area of New York City. They infer points-of-interest as well as land-use patterns from geotagged tweets with favourable accuracy. Furthermore, Crandall et al. (2009) detect landmarks from geotagged photos from Flickr, a photo management and sharing application. The authors plotted the GPS locations of photos to create maps of tourists’ movements. Zheng et al. (2012) analyse the movements of tourists through a city by also data-mining Flickr for geotagged photos. They specifically look at tourists’ locations relative to points-of-interest as well as the travel paths taken by tourists between these points. Such information could be useful, for instance, in the design of public spaces to allow for better walkways or means of transport between these points-of-interest, based on the frequency of visits to these places. Zagheni et al. (2014) use Twitter data to infer both intra-zonal and international migration patterns. Schneider et al. (2013) mention that daily mobility patterns can be attributed to a set of 17 motifs. They use spatial-temporal trajectories in combination with network theory to determine these motifs and claim that individuals exhibit a very specific motif that influences his or her travel behaviour, which could be inferred from data. Some of the methodologies in this literature review are used in this paper. The purpose of this paper is not to develop perfect-fitting models, but rather to illustrate by means of practical examples and further discussions how these techniques can be used in a smart and sustainable manner on social media data for developing countries as well.
3. Research Methodology
The data that were used for this paper were obtained and prepared from various sources. Each dataset and the steps involved to prepare the data for use for this paper are described in the following subsections.
3.1 Study area
The study area used in this paper is the City of Tshwane Metropolitan Municipality (hereafter also referred to as the City of Tshwane) in the Gauteng Province of South Africa. Gauteng is considered to be the economic hub of the country, which should result in higher cellular phone usage due to better affordability, while the City of Tshwane, an area that includes Pretoria but extends further to the east, exhibits attributes of both the developed and developing world. The area was subdivided into sub-places, which are geographical areas determined and used by Statistics South Africa, which generally demarcates suburbs or villages. Figure 1 depicts the sub-places and where the City of Tshwane is located in South Africa.
166

3.2 Twitter dataset
The process to obtain the Twitter dataset involved an implementation of the Streaming application program interface (API) of Twitter, which is essentially a means to obtain data from a live Twitter feed. This API was used to capture tweets in near real-time during the period of 24 April 2015 – 25 June 2015, which equalled 63 days. A total of 2 821 338 tweets was obtained. Each tweet contains a large amount of metadata in JSON format, but for the purposes of this paper only four parts from each tweet were stored for further analysis: the unique tweet identification number, the username (anonymised on receipt) of the user that posted the tweet, the longitude and latitude of the tweet (if the user enabled the geotag option), and the date stamp. For the tweets that contained a coordinate, the location of the tweet was used to determine within which sub-place the tweet originated from. The sub-place ID was subsequently also stored with the tweet. Table 1 contains a summary of the fields that were stored for each tweet.
Figure 1 Sub-places in the City of Tshwane, Gauteng, South Africa
167
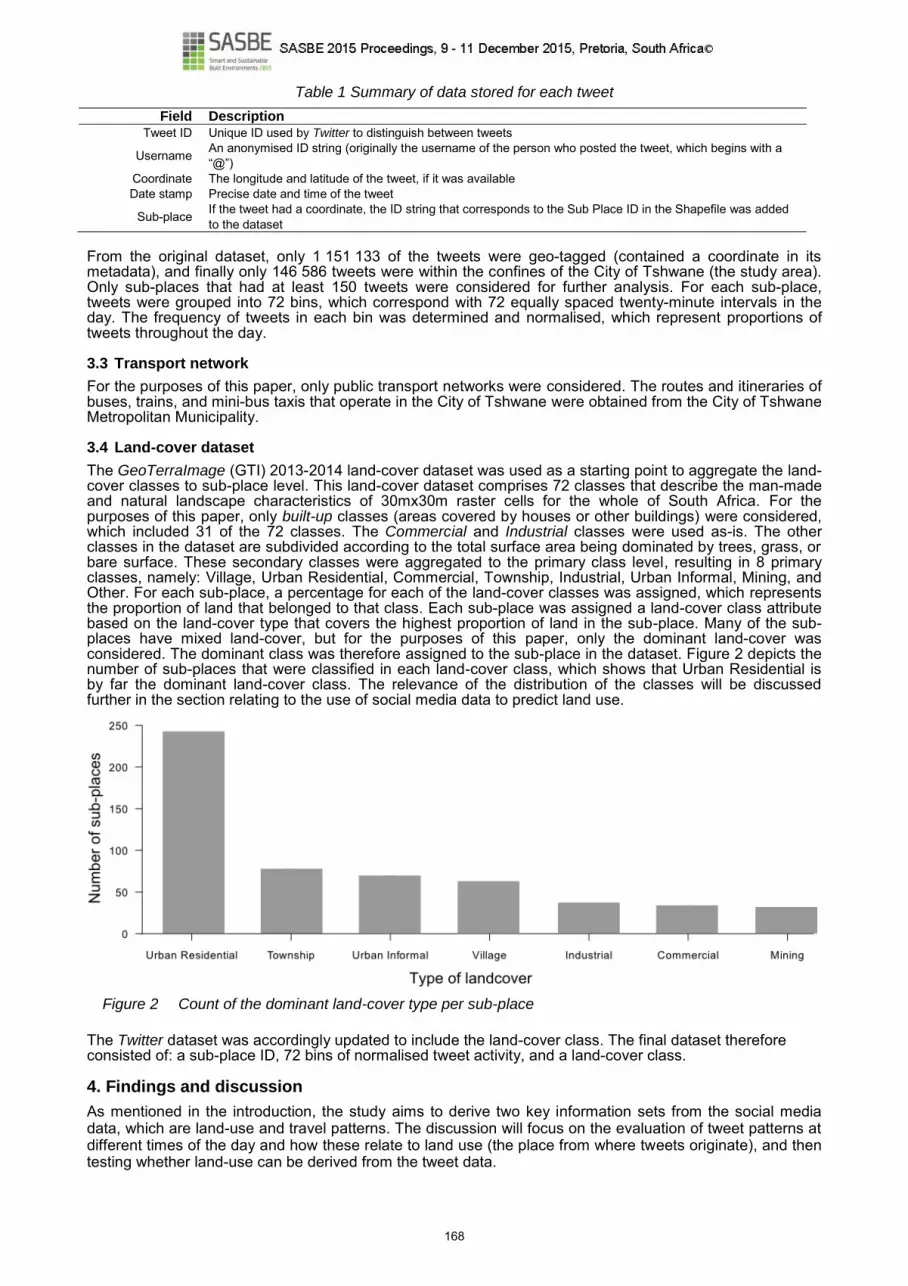
Table 1 Summary of data stored for each tweet
Field Description
Tweet ID Unique ID used by Twitter to distinguish between tweets
Username An anonymised ID string (originally the username of the person who posted the tweet, which begins with a “@”)
Coordinate The longitude and latitude of the tweet, if it was available Date stamp Precise date and time of the tweet
Sub-place If the tweet had a coordinate, the ID string that corresponds to the Sub Place ID in the Shapefile was added to the dataset
From the original dataset, only 1 151 133 of the tweets were geo-tagged (contained a coordinate in its metadata), and finally only 146 586 tweets were within the confines of the City of Tshwane (the study area). Only sub-places that had at least 150 tweets were considered for further analysis. For each sub-place, tweets were grouped into 72 bins, which correspond with 72 equally spaced twenty-minute intervals in the day. The frequency of tweets in each bin was determined and normalised, which represent proportions of tweets throughout the day.
3.3 Transport network
For the purposes of this paper, only public transport networks were considered. The routes and itineraries of buses, trains, and mini-bus taxis that operate in the City of Tshwane were obtained from the City of Tshwane Metropolitan Municipality.
3.4 Land-cover dataset
The GeoTerraImage (GTI) 2013-2014 land-cover dataset was used as a starting point to aggregate the land-cover classes to sub-place level. This land-cover dataset comprises 72 classes that describe the man-made and natural landscape characteristics of 30mx30m raster cells for the whole of South Africa. For the purposes of this paper, only built-up classes (areas covered by houses or other buildings) were considered, which included 31 of the 72 classes. The Commercial and Industrial classes were used as-is. The other classes in the dataset are subdivided according to the total surface area being dominated by trees, grass, or bare surface. These secondary classes were aggregated to the primary class level, resulting in 8 primary classes, namely: Village, Urban Residential, Commercial, Township, Industrial, Urban Informal, Mining, and Other. For each sub-place, a percentage for each of the land-cover classes was assigned, which represents the proportion of land that belonged to that class. Each sub-place was assigned a land-cover class attribute based on the land-cover type that covers the highest proportion of land in the sub-place. Many of the sub-places have mixed land-cover, but for the purposes of this paper, only the dominant land-cover was considered. The dominant class was therefore assigned to the sub-place in the dataset. Figure 2 depicts the number of sub-places that were classified in each land-cover class, which shows that Urban Residential is by far the dominant land-cover class. The relevance of the distribution of the classes will be discussed further in the section relating to the use of social media data to predict land use.
The Twitter dataset was accordingly updated to include the land-cover class. The final dataset therefore consisted of: a sub-place ID, 72 bins of normalised tweet activity, and a land-cover class.
4. Findings and discussion
As mentioned in the introduction, the study aims to derive two key information sets from the social media data, which are land-use and travel patterns. The discussion will focus on the evaluation of tweet patterns at different times of the day and how these relate to land use (the place from where tweets originate), and then testing whether land-use can be derived from the tweet data.
Figure 2 Count of the dominant land-cover type per sub-place
168

4.1 Tweet activity signatures and land-use patterns
It is possible to distinguish between different regions in a study area based on the tweet activity in the region, which can also be referred to as the tweet activity signature (Frias-Martinez, 2014). Regions with similar social network behaviour should have similar tweet activity signatures. Similarly, regions with differing social network behaviour should have different tweet activity signatures. Two land-cover types, Commercial and Urban Residential, were analysed. For both these land-cover types, the tweet frequencies for all sub-places with the corresponding land-cover class were aggregated and normalised to obtain an overall view of daily tweet activity. Error! Reference source not found. depicts the social profiles/tweet activity signatures for these two land-cover classes.
Figure 3 Tweet profiles of different land-cover types
From Error! Reference source not found., it is evident that the tweet activity signatures for Commercial regions differ from that of Urban Residential regions. In Commercial regions, peak tweet activity is observed in the late morning hours between 09h00-11h00, which corresponds with the time that people arrive at work. Secondary peaks are observed between 11h00-13h00 and 17h00-18h00, which could relate to lunch time breaks and people leaving work to return to their homes. The Urban Residential tweet activity signature sees a peak activity in the early to mid-evening hours, which is when many of the prime-time series appear on television. A simple text-mining procedure was followed to extract and clean the text from the tweets in these two regions. Two word-clouds were generated from the text to compare the content of the tweets, as is shown in Error! Reference source not found.. Words that occurred more often appear larger and darker. It is evident that the tweet content of these two land-cover classes is similar with many of the most frequent words present in both word-clouds. There are, however, some differences: place names such as “Pretoria” and “Hatfield” are more prominent in the Commercial area, whereas in the Residential area, more colloquial language is found, for example “lol” (which normally means “laugh out loud”). This information could be used for sentiment analysis and to track opinions of citizens that could in turn be used for enhanced service delivery.
169

Figure 4 Word-clouds of tweet content in Commercial (left) and Urban Residential (right) areas
4.2 Connectivity and information flow
Using the techniques from the previous section, it would be possible in future research to develop a complex network that describes the connectivity between different users in different regions. Furthermore, taking tweet content into account would allow researchers to gain a better understanding as to the subject matter of conversations between different users and areas. These insights could be used to better understand prominent role players in the social network as well as how information flows throughout the network and how individuals influence one another in the network.
4.3 Predicting certain land-use classes
In the previous subsections, a distinction was made graphically between tweet activity signatures of different land-cover classes. In the case where the land-cover class of an area is not available, there would be value in being able to predict the land-cover class given a certain tweet activity signature. To show how one could typically go about doing this, a classification model was developed. The Twitter dataset containing the tweet patterns per sub-place as well as the dominant land-cover class was used as an input to the model. Stratified cross-validation was used with a 10-fold cross-validation in the WEKA software (Hall et al., 2009). That is, the dataset is randomly partitioned into 10 samples of equal size, of which 9 samples are used to train the model and the remaining 1 sample to test the model. Table 2 contains the confusion matrix, which shows the results of the model by comparing the predicted number of sub-places classified per land-cover type versus what the actual land-cover of the sub-places is. From Table 2, it is evident that the Urban Residential land-cover class was predicted with almost 100% accuracy. Unfortunately, this model could not accurately predict other classes, except for the Commercial class that had an accuracy of 20%. This could be due to the fact that many of the sub-places have mixed land-use and when one land-cover type is specified as the dominant type, the second most prominent type may still cover a fairly large percentage of the sub-place. Furthermore, 213 of the sub-places have a dominant land-cover of Urban Residential, which equates to 62% of the total number of sub-places that were used in the model. Furthermore, many sub-places were omitted from the model, since they contained fewer than 150 tweets (the threshold that was used to include or omit sub-places). Frias-Martinez et al. (2012) similarly only focused on the main land use in each of the clusters in their study and obtained a classification accuracy of between 50%-70%. Future models would need to consider and predict mixed land-use.
Table 2 Confusion matrix
Actual class
Classified as
Village Urban
Residential Commercial Township Industrial
Urban Informal
Mining
Village 31 Urban Residential 1 212
Commercial 4 1 Township 48 Industrial 7
Urban Informal 40 Mining 1
Another possible explanation for the error in classification of the Township, Urban Informal, and Village classes could be that they exhibit a similar tweet activity pattern to that of the Urban Residential class. While
170

a distinction is often made between these land-use classes in terms of demographics or household characteristics, the social media activity patterns tend to be quite similar. Frias-Martinez et al. (2012) use an unsupervised learning approach to detect different classes from Twitter activity patterns. They show that traditional land-use classes can be extended to include new classes such as night life. Using such an approach could bring interesting new classes to the fore. An unsupervised learning approach could also assist in understanding whether there are indeed similarities in the tweet activity patterns between different classes, such as Urban Residential, Townships, Villages, and Urban Informal regions. While the model only predicted the Urban Residential class with favourable accuracy, there is still merit in developing such classification models if more data are used and the dominant land-cover class is split into mixed land-use classes. In the urban modelling domain, multiple datasets are used as input into urban growth simulation models, of which one is a cadastre dataset that contains information on all parcels of land in an area. The cadastre dataset is sometimes incomplete. Being able to predict land-use from tweet activity patterns would be beneficial in such a case to complement an incomplete dataset. However, cadastres are typically very small, hence enough data would be needed that fall within the confines of the cadastre in question to be able to accurately predict the land-use from the tweet activity.
4.4 Travel patterns
The users who posted tweets were anonymised before further analyses were done on the dataset. One user was randomly chosen from the dataset and the locations of the tweets of this user were extracted into a subset with which to determine travel patterns. Firstly, these tweets were subdivided into three parts based on the time-of-day that the tweets were posted. All tweets between 19h00-08h00 were grouped, pre-empting that these would typically be generated from home. This group will be referred to as the night-time tweets. Next, all tweets between 09h00-17h00 were grouped, pre-empting that these tweets would typically be generated from a place of work during normal working hours, if the person in fact is employed. These tweets will be referred to as day-time tweets. Finally all other tweets were grouped into a miscellaneous group. For the night-time tweets, the locations were repeatedly found in the same vicinity. For this reason the locations were clustered and a heatmap was generated from these locations. This heatmap is shown in blue on Error! Reference source not found.. The darker the colour, the higher the frequency of tweets per square kilometre. This area is in fact classified as an Urban Residential area from the land-cover dataset, therefore one can infer that the user’s place of residence ought to be in this area. Further investigation revealed that this is also a lower-income residential suburb. The same methodology was used for the day-time tweets since recurring locations were found in the dataset of the user during the day as well. The cluster and corresponding heatmap is shown in red in Error! Reference source not found.. This area is classified as a Commercial area from the land-cover dataset and upon further investigation it was determined to be the Central Business District (CBD) in the City of Tshwane. From these two clusters, it can be inferred that the person resides in the residential area west of the CBD and is possibly employed in the CBD. Next, the remaining tweets were analysed to ascertain how the person travels between these probable locations of residence and employment. A layer was added to the map that contains the minibus taxi and bus service routes. The locations of tweets close to the user’s probable residence were in close proximity to public transport services. Subsequent tweets (indicated by the numbers 1 and 2 on Figure 5) were also in close proximity to public transport services that operate towards the CBD. The location of tweets close to the user’s probable place of employment was also in close proximity to the public transport services. Due to the fact that the user resides in a lower-income residential area, the chances are higher that the user utilises public transport to commute between place of residence and employment and if this is the case, it is possible that the user makes use of a combination of taxi and bus services.
171

Figure 5 Travel pattern of 1 person
By analysing the tweet locations of this user, it was possible to construct a possible scenario of the mobility patterns of the user over a 2-month period. It might be that the user was merely seeking employment or that this was a temporary pattern. By observing these patterns over longer time-periods, one might be able to detect migration patterns if the locations of the users change. Zagheni et al. (2014) for instance, utilise such movement to infer migration patterns both internally and internationally. While the authors could not infer migration rates at specific points in time, they were indeed able to predict turning points in the migration trends. These mobility patterns can further be analysed by distinguishing between typical weekdays and weekends such as in the study of Herder & Siehndel (2012). The authors show how activity patterns differ between these periods by using GPS logs. It is also shown that one of the users in the study moves mostly between 4 different locations of which the 2 most prominent locations would generally be the residence and employment locations. Similarly, this could be applied to distinguish between the mobility patterns of multiple Twitter users if enough data are available. Being able to predict routine behaviour of users would be beneficial in multiple environments, for instance, targeted advertising and marketing. In the 2011 National Census in South Africa, locations of employment were not captured. Therefore, another useful application would be to determine people’s places of employment from Twitter data, as was shown in this section.
5. Conclusion and possible further research
Proper transport- and urban planning are required to ensure urban growth, economic competitiveness, and sustainability in cities. To test different policy scenarios, large-scale transport and urban simulation models are often used, which require vast amounts of data and intricate modelling skills. Datasets are sometimes difficult to source, expensive to obtain through surveys, or incomplete. For these reasons alternative sources of data should be explored. Data-mining of social media is a common avenue to extract such datasets from publicly available data. This paper gave an overview of some of the techniques that exist in the literature to obtain data from social media and to gain insights from such data. The techniques included supervised and unsupervised machine learning approaches, which range from classification of land-use classes to gaining insights into people’s mobility between points of interest. This paper aimed at illustrating how some of these techniques, and combinations thereof, can be used in a developing country such as South Africa as well. The focus was on the transport- and urban planning domains with a case study of the City of Tshwane Metropolitan Municipality in Gauteng, South Africa. It was shown that different land-use classes have different tweet activity signatures that distinguish them from one another. Furthermore, a classification model could predict the Urban Residential land-cover class
172

with almost 100% accuracy, but due to limited Twitter data in the other land-cover classes, the prediction did not perform that well in the other cases. This work can be extended firstly with a larger dataset, and secondly with an unsupervised approach, such as in the study of Frias-Martinez et al. (2014), to obtain areas with similar or different tweet activity signatures, purely based on the activity signatures of the areas. These classes can then be compared with actual land-cover classes to determine which classes share similar patterns. A complex network approach could also be followed in future research to understand the connectivity between both individuals in the social network and areas that are geographically separated. It would further be possible to determine the influence and roles in the network by using graph theory. Similar techniques could be used to mine data from Strava, a social network that allows cyclists and joggers to upload their geo-enabled exercise activities to a platform for further analysis. It is possible to obtain the GPS logs of athletes from Strava and infer movements from these in an area. Such analyses would be useful, for instance, for Non-Motorised Transport (NMT) projects. One drawback might be that developing countries would not have enough cyclists or joggers that track and upload their activities to such a service due to affordability constraints. The techniques that were discussed as well as those that were demonstrated all use data that were obtained from social media through data-mining. These procedures are smart since they are innovative means to obtain publicly available data and rework these to a usable format, which in turn could be used in models that inform transport- and urban planning. Since many social media services provide APIs with which to connect to the service and obtain data from it, standard and automated procedures could be developed to obtain, reformat, and use the data. These procedures would be sustainable since they can be reused with minimal intervention. The derived information from these procedures could then be used to inform and influence management of services in the built environment.
6. Acknowledgement
The author wishes to thank Pierre du Plessis and Andre Breytenbach for their assistance with the land-cover dataset and their inputs as well as Gerbrand Mans for his input.
7. References
Crandall, D.J., Backstrom, L., Huttenlocher, D., & Kleinberg, J. 2009. Mapping the world's photos. In: Proceedings of the 18th international conference on World wide web (WWW '09). ACM, New York, NY, USA, 761-770. DOI=10.1145/1526709.1526812 Ferrari, L., Rosi, A., Mamei, M. & Zambonelli, F. 2011a. Extracting urban patterns from location-based social networks. In Proceedings of the 3rd ACM SIGSPATIAL International Workshop on Location-Based Social Networks, pages 9–16. ACM, 2011. Ferrari, L. & Mamei, M. 2011b. Discovering daily routines from google latitude with topic models. In Pervasive Computing and Communications Workshops (PERCOM Workshops), 2011 IEEE International Conference on, pages 432–437. IEEE, 2011. Frias-Martinez, V., Soto, V., Hohwald, H., & Frias-martinez, E. 2012. Characterizing Urban Landscapes Using Geolocated Tweets. In: International Conference on Social Computing (SocialCom) and Privacy, Security, Risk and Trust (PASSAT), pp 239-248, ISBN: 978-1-4673-5638-1. Gal-Tzur, A., Grant-Muller, S.M., Minkov, A., and Nocera, S. 2014. The Impact of Social Media Usage on Transport Policy: Issues, Challenges and Recommendations, Procedia - Social and Behavioral Sciences, Volume 111, 5 February 2014, Pages 937-946, ISSN 1877-0428, http://dx.doi.org/10.1016/j.sbspro.2014.01.128. Gao, S., Yang, J-A., Yan, B., Hu, Y., Janowicz, .K. and McKenzie, G. 2014. Detecting Origin-Destination Mobility Flows From Geotagged Tweets in Greater Los Angeles Area. Working Paper. Hall, M., Frank, E., Holmes, G., Pfahringer, B., Reutemann, P., Witten, I.H. 2009. The WEKA Data Mining Software: An Update; SIGKDD Explorations, Volume 11, Issue 1. Herder, E. & Siehndel, P. 2012. Augmented User Modeling UMAP 2012, Montreal, Canada Noulas, A., Mascolo, C., & Frias-Martinez, E. 2013. Exploiting Foursquare and Cellular Data to Infer User Activity in Urban Environments. 14th International Conference on Mobile Data Management (MDM), Vol 1, pp 167-176, ISBN: 978-1-4673-6068-5. Schneider, C.M., Belik, V., Couronné, T., Smoreda, Z., González, M.C. 2013. Unravelling daily human mobility motifs. Journal of the Royal Society: Interface 2013. DOI: 10.1098/rsif.2013.0246. StatsSA (2011). Poverty Trends in South Africa: An examination of absolute poverty between 2006 and 2011. Available online: <http://beta2.statssa.gov.za/publications/Report-03-10-06/Report-03-10-06March2014.pdf> [Accessed: September, 2015]. StatsSA (2013). National Household Travel Survey. Available online: <http://www.statssa.gov.za/publications/P0320/P03202013.pdf> [Accessed: September, 2015]. World Wide Worx. 2015. Executive Summary of the South African Social Media Landscape 2015. Zagheni, E., Garimella, V.R.K., Weber, I., State, B.: Inferring international and internal migration patterns from twitter data. In: WWW (Companion Volume), pp. 439–444 (2014).
173

Zheng, Y-T., Zha, Z-J., & Chua, T-S. 2011. Mining travel patterns from geo-tagged photos. ACM Transactions on Intelligent Systems and Technology. Vol 3(3): pp 1—18.
174

A COMPARISON OF PREDICTED DESIGN EFFICACY AND ENVIRONMENTAL ASSESSMENT FOR TUBERCULOSIS CARE FACILITIES IN SOUTH AFRICA
Jako NICE
1
Tichaona KUMIRAI 2
Dirk CONRADIE 3
Jan-Hendrik GROBLER 4
1 Built Environment / Architectural Engineering, CSIR, Email: [email protected] 2 Built Environment / Architectural Engineering, CSIR, Email: [email protected] 3 Built Environment / Architectural Engineering, CSIR, Email: [email protected] 4 Defence Peace Safety and Security, CSIR, Email: [email protected] Keywords: CFD, Health Care, Natural Ventilation, Sustainable, TB, design
Abstract
The impact of Tuberculosis (TB) is of epidemic proportions in South Africa (SA) being one of the developing countries. Furthermore, studies seem to indicate that health care facilities are contributing to the spread of Mtb (Eshun-Wilson et al. 2008). The contribution that the built environment has on airborne transmission, combined with erratic energy supply and the international sustainable agenda raised the need for research investigation for passive design building response for airborne contagion. Natural ventilation uses buoyancy or wind as the driving forces for air movement. In this paper Computational Fluid Dynamics (CFD) models were used to find out the optimum design for naturally ventilated Tuberculosis (TB) ward designs. Natural ventilation can reduce the concentration of airborne pathogens through removing and diluting airborne droplet nuclei. The effect of different parameters such as roof angle, window type and size, positioning of closures in the permanent ridge ventilators on natural ventilation performance were studied. The results indicated that the correct combination of the parameters mentioned can significantly improve the natural ventilation effectiveness. Tracer gas tests using carbon dioxide (CO2) were subsequently conducted for the real spaces with natural ventilation systems as designed using CFD to establish the actual ventilation rates achieved. The ventilation rates results indicate generally good to excellent ventilation rates especially in the coastal regions. These rates are in line with the recommended rates as per the World Health Organisation (WHO) and Centres for Disease Control (CDC). A Post Occupational Evaluation (POE) was undertaken through qualitative questionnaire and site assessment to evaluate the impact and potential success of the as built modelled design. It is evident though the various staff interviews and project team discussions that the new facilities have improved nursing standards and patient ward standards.
1. Introduction
The obligate aerobe nature of Mycobacterium tuberculosis (Mtb) transmitted by airborne, impacts environments with an immune deficiency disease i.e. Human Immunodeficiency Virus (HIV), unsuspected patients, healthcare workers and healthy people at risk of contagion, with the emphasis on immunosuppressed persons. In 2008 the World Health Organisation (WHO) ranked South Africa (SA) as the worst infected country in the world (per capita) for Mtb. A WHO assessment in 2008 indicated the epidemiological burden of TB and HIV co-infection in SA at an estimated 70%. WHO estimates that in SA, out of every 100 000 people approximately 768 are Mtb positive and 5.5 million people in SA have HIV Aids. These facts point to alarming risk exposure in hospital environments. The airborne nature for the spreading of TB makes TB disease difficult to control in health care facilities. The WHO and CDC identifies sufficient ventilation as one of the ways for controlling the spread of TB in health care facilities. Ventilation can reduce the concentration of airborne pathogens through removing and diluting airborne droplet nuclei (WHO, 2009 pp. 19). Ventilation in this paper is defined as the introduction of “fresh” air from a “safe” source (preferably outdoor air) to continually replenish indoor air. There are three strategies for ventilation namely natural ventilation, mixed mode ventilation and mechanical ventilation. Examples of natural ventilation strategies are windows, doors, turbine ventilators, door grills etc. Mixed mode ventilation strategy refers to mechanically assisted natural ventilation strategies e.g. motorised turbine ventilator. Mechanical ventilation system uses electric fans to drive airflow through a building. There are many advantages to reliance on natural ventilation for infection control such as low cost of installation, operation and maintenance which reduces the reliance on electricity supply, which is erratic and constrained in many certain areas, especially deep rural areas of South Africa.
175
This paper reports on natural ventilation systems design using CFD and results of field tests and experiments on ventilation rates achieved by the real spaces with natural ventilation systems as designed using CFD. This paper discuses a recent research investigation conducted by the Council for Scientific and Industrial Research (CSIR) for the design and commissioning of TB care facilities in South Africa in considering natural ventilation as a viable sustainable design solution for airborne contamination control using contaminate dilution. A recent Global Fund M(X) DR-TB Infrastructure Project initiated by the SA National TB Control Programme aimed to provide 312 additional M(X) DR-TB beds for long-term inpatient care at eight hospitals in seven provinces (Nice et al., 2012). This project presented the opportunity to investigate modelling design methodologies to present a design by research based outcome. Furthermore the project contributed to developing and consolidate guidelines for accommodating long-term patients within the broad policy framework developed by the National TB Control Programme at the time, subsequently focused has shifted to home based care. Facilities ranged from DR-TB and MDR units, to dedicated Multiple Drug Resistant (MDR) & Extensive Drug Resistant (XDR) units, dependant of disease catchment areas and disease profile. To effectively address the public health crisis at the time (2008), the National Department of Health (NDoH) determined that all confirmed XDR and MDR-TB patients are to be hospitalised at specialised M(X)DR-TB units for the primary treatment period (usually 6-18 months). Existing long-term care facilities for the treatment of TB patients are, however, poorly designed to address needs of MDR and XDR-TB patients and of healthcare workers. Paving the way for new facilities which could reduce the risk of cross infection to patients and staff and create a more conducive healing environment. The project required developing a research methodology based on key design principles that would on completion be measured by both quantitative means (CO2 decay) or qualitatively (by questionnaires and other). One of the driving design principles was utilising natural ventilation as far as possible in all patient areas to achieve maximum air changes at all times. The target was set at 12 – 16 air changes per hour (ACH) as per the CDC and WHO recommendation at the time (this has evolved to include occupancy and now measured by L/p/s). There are many advantages to reliance on natural ventilation for infection control such as the low cost of installation, operation and maintenance which reduces the reliance on electricity supply, which is erratic and constrained in many certain areas, especially deep rural areas in South Africa. Due to the many factors affecting natural ventilation as a design solution, it must be considered during the early stages of a facility’s design development. Retro fitment is not ideal and could be very costly, with suboptimal performance. When developing the design concept for a naturally ventilated building the following basic steps must be considered (Parsons et al., 2010):
“The desired airflow patterns from inlets to outlets through the occupied spaces need to be defined. This is related to the particular climatic region, site configuration, form and organisation of the building as well as the use patterns. All openings such as through windows, roof ventilators and other ventilators need to be considered.”
“Ventilation systems need to be omnidirectional as wind is highly variable in direction and strength and it is almost impossible to quantify it precisely.”
“The principle driving forces, which enable the desired airflow pattern and air changes, are to be identified. In good design the dominating driving forces are in sympathy with the intended flow rate and distribution.”
“The size, type and location of the openings such as windows so that the required flow rates can be delivered under all operating conditions.”
It was clear from abovementioned that there are really only two ways that the airflows could be quantified, i.e. in a low speed wind tunnel or by means of Computational Fluid Dynamics (CFD). In order to provide technical assistance to design teams, the CSIR Building Performance Laboratory1 provided decision support for natural ventilation design. The proverbial ‘proof of the pudding is in the eating’ was carefully considered. The opportunity to test the various design decision iterations established by CFD modelling results could be implemented in built form. This afforded the opportunity to physically, by experimentation, test the efficacy of the elected design solutions two years post occupation of the facilities. The assessment technique selected for this assessment was the CO2 decay technique, tested under various site conditions. Combined with a qualitative POE questionnaire and program assessment gave the design team insight into the efficacy of the suggested solutions, the success in the proposed methodology and the user experience.
2. Research Background
This paper presents the process of developing a design methodology that can be used in the design for natural ventilation buildings; firstly that incorporates CFD modelling to inform design planning and secondly conduct performance analysis through site experiments to test the ‘real world’ performance. When considering the project objective: ‘to reduce the burden of tuberculosis and HIV in South Africa’ a built environment approach was conceived: built environment intervention through design measures that could potentially advance the development of effective airborne infection control by natural ventilation, and lead to 1 The Building Performance Laboratory is a specialized focus area located in the Building Science and Technology research programme at the CSIR which uses predictive modelling of building performance towards achieving environmentally, functionally and operationally appropriate and affordable design solutions for the built environment.
176

the development of Norms and standards for TB facilities not only in and for South Africa, but also other infected parts of the world. We consider the three part methodology:
1) Computational Fluid Dynamics (CFD) 2) Ventilation performance indicators – review of techniques and final selection 3) The Post Occupancy evaluation
2.1 Computational Fluid Dynamics (CFD)
Figure 1 Methodology followed to simulate ventilation performance. CFD simulations in the built environment are complex, because the external airflows are highly turbulent due to the interference of different structures and a significant amount of ground effect. Furthermore the accurate quantification of climatic conditions such as wind direction and strength, temperature and humidity is extremely difficult. In this project CFD was used both as a qualitative and quantitative tool. The former was used to experiment with different roof monitor configurations and the latter to determine the actual ventilation effectiveness. At the time when the research was undertaken the team had little prior experience of CFD. An Ansys Airpak CFD package was acquired to undertake the CFD analysis, because it was easier to master than Ansys Fluent. The methodology that was adopted in the CFD modelling was essentially a two-stage approach (Figure 1) where an external CFD site model was first created to study external airflows and to determine the boundary conditions for a detailed zoom-in model to determine the ventilation performance. The former contained block models of all the buildings on the site as accurately as possible whilst the latter contained all the detailed building detail such as walls, windows, roof and roof ventilators. In the case of this project analysis types 200 and 500 (Figure 1) were not done as it is not applicable.
2.2 Ventilation performance indicators
2.2.1 Air Changes per Hour (ACH) – (The preliminary approach) The most widely used performance indicator for a ventilation system is air change per hour (ACH). ACH is the number of times per hour that a volume of air equal to the enclosed space volume is exhausted. For a positive pressure mechanically ventilated space ACH is calculated using equation 1.
3600qACH =
V (1)
q is the fresh supply air flow (m³ / s)
V is the volume of the space 3(m ) WHO (2009) and CDC (2003) recommend 12 (ACH) in mechanically ventilated one bed TB isolation wards. Recently emerging guidance for healthcare buildings such as the Building engineering services guideline authored by the CSIR in collaboration with the National Department of Health has moved from expressing ventilation requirements from air-changes per hour (ACH) to volume flow rates per capita (L/ s/ person). The minimum requirement is 80 L/s/person for high risk areas such as waiting areas and TB treatment rooms.
177
The ventilation requirements for naturally ventilated spaces according to the WHO 2009, p.21 guidelines are as follows:
Minimum of 80 L/s/per person for airborne precaution rooms, 60 L/s/per person for general wards and outpatient departments and 2.5 L/s/ m³ for corridors and other transient spaces without a fixed number of patients.
The ventilation rates as calculated in Tables 3-5 were compared against the recommended ventilation rates specified in the WHO (2009) guideline.
2.2.2 Mean age of air (Gao and Lee, 2011) used mean age of air as the ventilation performance indicator in their studies on evaluating the influence of openings configuration on natural ventilation performance of residential units in Hong Kong. Age of-air is a technique for evaluating ventilation that has been actively used for over 20 years. Age-of-air quantifies the time it takes for an elemental volume of outdoor air to reach a particular location or zone within the indoor environment. Age-of-air is often also used to quantify the ventilation effectiveness with respect to indoor air quality (Sherman, 1997). The mean age of air in a point is defined as the mean time that the air particles contained in a differential volume around the point have stayed inside the room. The youngest air will be found at outdoor air inlets, while the oldest air can be found at any other point, not necessarily at the outlets. For instance, if there is a stagnation region or a recirculation one, the mean age of air will be high in these areas and the ventilation will be poor (Mendez, et al., 2008). Mean age of air represents the average time that air spends in the same place till extraction. Mean age of air was also considered, especially in the design iteration phase; the aim was to obtain a design that exhibited the lowest mean age of air.
2.2.3 Ventilation rate measurement- tracer gas tests Tracer gas techniques for measuring ventilation rely on the possibility of differentiating air already within the test room from new air coming into the space. The user should be able to either mark the air already in the space and follow how the marked air is replaced by new ventilation air; or mark the incoming air and measure how this marked ventilation air is distributed through the space. REHVA (2004) describes different tracer gas techniques for evaluating ventilation effectiveness:
Tracer step down (concentration decay) Tracer step up method Pulse method Homogeneous constant emission method.
In this study the concentration decay method was used. CO2 was used as the tracer gas. ASHRAE (1997) states that the calculations for ventilation rate using results of tracer gas concentration decay are based on a mass balance of the tracer gas within the space.
2.3 The Post Occupancy evaluation
According to (but not limited to) Meir et al. (2009) in their paper the authors define POE as: both qualitative and quantitative approach, but more importantly the value of design analysis post construction and in use, “Post-occupancy evaluation (POE) is a platform for the systematic study of buildings once occupied, so that lessons may be learned that will improve their current conditions and guide the design of future buildings. Various aspects of the occupied buildings’ functioning and performance can be assessed in a POE, both chemo-physical (indoor environment quality (IEQ), indoor air quality (IAQ) and thermal performance) as well as more subjective and interactional (space use, user satisfaction, and other).” It is from this very same perspective that a POE was undertaken to not only review the success of the intervention, but measure the success and acceptance by the user. The POE becomes a critical design feedback tool not only for analysis, or assessment but for critical design review. The POE in this research process incorporated the experimental test, observational assessment, and user qualitative response. The holistic POE outcome is not described in detail in this paper as more attention is given to the development of a design methodology as a tool for naturally ventilated building design.
3. Research Methodology
3.1 The CFD process and methodology
Using CFD software, a virtual model of four2 of the Global Fund facilities were created, in order to simulate, visualize and analyse the ventilation performance of the initial design proposals. Subsequently the Brooklyn Chest Hospital in Cape Town was also simulated. The simulations developed from purely qualitative to quantitative as the process was refined. The simulation results led to revisions to the design proposals and directly informed the design development. The ventilation efficiency of naturally ventilated buildings is complicated dependent on (Parsons et al., 2010):
Climate zone – wind direction, speed and availability, temperature, humidity;
2 Jose Pearson, Manguzi, Catherine Booth and Modimole
178

Wind direction and profile; Site topography and latitude; Building geometry and roof angles; Interior obstructions and flow paths; Inner and outer temperature (buoyancy); Indoor air temperature which relates to incident solar radiation and thermal performance of building
materials; Type and degree of envelope and building permeability; Adjacent structures and building location; Terrain; and Complimentary ventilation systems.
One of the most critical aspects for building performance testing is the creation of appropriate simulation models (Parsons et al., 2010). In the various case studies drawings were provided in different electronic formats. The most sophisticated drawings were created by the Autodesk Revit 2009 Building Information System (BIM). In all cases the working drawings contained far too much geometric information for the simulation purposes. Building performance simulation models created for Ecotect or Airpak normally consist of simple and symbolic geometry that are supported by a significant amount of alphanumeric technical information. The emphasis is, therefore, more on the technical alphanumeric attributes than the detailed geometric representation. For example a simple multi-layered wall is represented by a simple geometric surface in simulation software and a set of technical/ engineering alphanumeric values that handle inter alia values such as U-value (W/m².K) and Admittance (W/m².K). At the time of the project the interoperability between CFD and CAD was a key barrier to the general technology uptake of CFD in the built environment. Figure 2 illustrates the measures that were taken to maximise the air flow through the spaces. These were qualitatively simulated by CFD. The roof angle was specifically made 25° so that when air moves across the roof the windward side would develop a positive pressure and the leeward side negative pressure. This
Figure 2 The natural ventilation design of the wards for maximising natural ventilation (authors). directly improves the ventilation efficiency of the roof ridge ventilation. A literature study (ASHRAE, 2005) and CFD simulations indicated that this pressure difference phenomenon would be fully developed at a roof angle of approximately 25°. Due to the unpredictability of the wind direction and in an attempt to make the ridge ventilation more effective various literature studies, CFD simulations, field studies and laboratory tests were undertaken. Conventional wisdom at this stage was that wind driven roof ridge turbines, also known as “whirlybirds” would be adequate. The findings of field tests and a laboratory study (Salie, 2014) clearly indicated that the installation of the turbine ventilator did not increase the ventilation flow rate in all natural ventilation configurations. Further CFD simulations were undertaken and it was discovered that permanent ridge ventilation with alternating closures would be the best solution (Figure 2). This solution combined with a roof angle of 25° proved to be omnidirectional and effective. Other interventions are a very large openable window area (25% of floor area) in a cross ventilated configuration. To ensure an omni-directional and effective flow of air horizontal pivot and hopper openable windows were extensively used in the various projects. This was enhanced by permanent eaves ventilation slots and a gap for free airflow in the roofs of the covered walkways. The total volume of the space is 61.4 m³. This is a very large volume for a single patient.
179

3.2 The Carbon Dioxide (CO2) decay methodology
The tests and experimental measurements were done in the following stages: 1) The CO2 concentration was first measured in the room and the outside ambient air. This was done to determine the background CO2 concentration in the room air and to check for unknown sources of carbon dioxide nearby. 2) CO2 gas was injected into the ward from the CO2 cylinder. Mixing fans were used to disperse and mix the injected carbon dioxide gas. The concentration of CO2 in different parts of the ward was monitored at two points at 1.1m height above finished floor level that would be the breathing zone for sleeping patient by a SENTRY ST-303 non-dispersive infrared CO2 gas sensor. This was done to confirm uniformity of concentration of the tracer gas in the ward as stipulated by REHVA (2004) and ASHRAE (1997). Demmers, et al. (2001) suggests that the best sampling points of the tracer gas is at the outlets, if inlets and outlets are well defined. However, in naturally ventilated buildings an air opening can be an inlet or outlet depending on the prevailing wind direction. Therefore the average tracer gas concentration taken at the two points in the ward was assumed to be the exhaust concentration. 3) When a uniform and sufficiently large concentration (less than 5 000 ppm) of carbon dioxide gas was achieved, the fans and carbon dioxide injection were stopped. The openings associated with the respective test scenarios (See Table 2 key for different test scenarios) were opened, and the tracer gas was allowed to decay naturally.
3.2 The Post Occupancy Evaluation (POE) methodology
A Post Occupation Evaluation assessment was developed to gage the expected projected outcome versus the factual final site outcome. The CSIR developed a prototypical design layout as guidelines to facilitate architects and the consultant team with the added benefit to communicate the architectural philosophy and spatial layout for airborne diseases design to hospital staff. Computer aided air movement modelling (computational fluid dynamics) was used during the development of both passive and natural ventilation systems to ascertain an effective cross ventilation design. The methodology of assessment required both testing and interviews
1) Firstly: a formal meeting was held with all relevant staff members within the new facility, provincial department representatives and members of the consulting team. Individual interviews were conducted with staff members; and a debriefing interview was done with the architect/principle agent.
2) Secondly, but simultaneously: a scientific test was done in one of the new patient bedrooms, using tracer gas methodology by means of CO2 release to saturation (±5000 ppm) and measuring the decay rate in assessing the number of air changes achieved within the hour. Comparing these rates to world standards and thus the effectiveness of the design specifically with regards to air change rates as described in detail in section 3.1
4. Findings and Discussion
4.1 Findings from the CFD modelling
Figure 3 Qualitative and quantitative CFD studies undertaken for the Modimole project. The left illustrates
the development of an efficient roof ventilator and right the ventilation effectiveness in terms of MAA.
180

Figure 4 Pressure development over the Brooklyn Chest roof on the left and external wind studies to
determine the boundary conditions for the detailed interior models on the right.
Figure 3 (left) illustrates the CFD simulations that were used in the Modimole project to improve the effectiveness of the permanent roof ventilation. Various roof ventilation designs were explored to ensure proper mixing of the fresh outside air with the interior contaminated air. It was also used to test the ventilation effectivity of the windows. In the particular example an outside air speed of 4 m/s was used. Figure 3 (right) illustrates an analysis of Mean Age of Air (MAA). In the particular example the MAA varies from 77 s on the windward side to 154 s in the far side of the room (leeward side). Figure 4 illustrates CFD simulations that were undertaken at the Brooklyn Chest project. Figure 4 (left) illustrates the effect of air movement over the building with a roof angle of 25°. On the windward side a positive pressure of 3.78 and 9.35 N/m² develops and on the leeward side negative pressures between -12.9 and -1.78 N/m², relative to atmospheric pressure. The alternating closure method that was developed for the Modimole project (Figure 1) was used in the Brooklyn Chest rectangular roof ventilator. Figure 4 (right) illustrate one of many external wind studies that were used to determine the boundary conditions for the detailed interior CDF models under various wind directions, strengths and heights. In this case it was a wind of 6 m/s from a south-easterly direction.
Table 1 ACH analysis for Brooklyn Chest
Air Change per Hour Analysis for Brooklyn Chest
Block Name Wind Direction ACH with wind speed 1 (6 m/s) ACH with wind speed 2 (1.5 m/s)
South Block South-east 58.368 19.293 Middle block South-east 50.685 8.278 West 54.185 17.347 North-wind 63.500 18.560 Consultation Room
South-east 3192.931
West 4142.723
4.2 Findings from the Carbon Dioxide (CO2) experiment
The decay in concentration of the carbon dioxide was plotted as illustrated in the graph of Figure 5. The exponent of the equation of the graph of Figure 5 was multiplied by 60 to obtain ventilation rate in ACH. All the results for the test scenarios are shown in Tables 3-5.The value of ventilation rate in L/s in the last row of Tables 3-5 was calculated using the formulae in equation 3.
3ACH × roomvolume(m )Ventilation rate(l / s)=
3600×0.001 (3)
3 This number is very high because it was assumed that the door is open. If the door is closed then open able windows will have to be provided at lower level. 4 As in 2 above the number is very high because the door was assumed open.
181

Table 2 Key for ventilation scenarios
Key Definition
AWDC
RMO
SGO
AWDO
3GO
AWOEDO
THDO
MWBSO
BWWSO
4TWWSO
3TWBSO
HTDO
ABSWC WSWDO
All Windows and Door Closed Roof Monitor Operational Side Grills Operational All Windows and Door Open 3 Grills Operational All Windows Open External Door Open Top Half Door Open Middle Windows Bathroom Side Open Bottom Windows Ward Side Open 4 Top Windows Ward Side Open 3 Top Windows Bathroom Side Open Half Top Door Open All Bathroom Side Windows Closed Ward Side Windows and Door Open
Figure 5 Tracer gas concentration decay for mostly closed ventilation openings at Modimolle hospital See
Table 3.
Table 3 Quantified ventilation performance for mostly closed ventilation openings
Hospital Jose-Pearson Catherine Booth Modimolle
Climatic region Bsh (E.C) Csa (KZN) Bsh (Limpopo) Wind speed (m/s) 8.4 5 0.8 Wind direction SW N NW Ward type 1 bed En-suite 2 bed En-suite 1 bed En-suite Ventilation system Natural Natural Natural Openable area 6.95 11.9 9.35 Floor area 13.8 24.94 17.82 Ventilation scenarios investigated AWDC,RMO AWDC, SGO, RMO AWDC, SGO, RMO Ward volume (m
3) 59 68 61
Measured ventilation rate (ACH) 17.4 14.2 4.1
Ventilation rate (l/s/patient) 285 133.7 69
Table 4 Quantified ventilation performance for mostly opened ventilation openings
Hospital Jose-Pearson Catherine Booth Modimolle
Climatic region Bsh (E.C) Csa (KZN) Bsh (Limpopo) Wind speed (m/s) 8.4 2 0.9 Wind direction SW N NW Ward type 1 bed En-suite 2 bed En-suite 1 bed En-suite Ventilation system Natural Natural Natural Openable area 6.95 11.9 9.35 Floor area 13.8 24.94 17.82 Ventilation scenarios investigated AWDO,RMO AWDO, SGO, RMO AWDO, SGO, RMO Ward volume (m
3) 59 68 61
Measured ventilation rate (ACH) 38.9 25.1 20.5
Ventilation rate (l/s/patient) 638 237.1 347
182

Table 5 Quantified ventilation performance for typical ventilation opening scenarios.
Hospital Jose-Pearson Catherine Booth Modimolle
Climatic region Bsh (E.C) Csa (KZN) Bsh (Limpopo) Wind speed (m/s) 8.4 2 0.9
Wind direction SW N NW
Ward type 1 bed En-suite 2 bed En-suite 1 bed En-suite
Ventilation system Natural Natural Natural Openable area 6.95 11.9 9.35 Floor area 13.8 24.94 17.82 Ventilation scenarios investigated THDO,RMO,MW
BSO, BWWSO AWDO, SGO, RMO AWDO, SGO, RMO
Ward volume (m3) 59 68 61
Measured ventilation rate (ACH) 21.3 25.1 20.5
Ventilation rate (l/s/patient) 349 237.1 347
4.3 Findings from the Post Occupancy Evaluation (POE)
The research process developed by the CSIR through various design criteria, modelling and user experience studies have produced improved the air quality of the facilities, created safer patient and nursing spaces and set a minimum standard for future designs. Thermal comfort was a noted concern with numerous comments on the driving rain through the roof top ventilations and the cold conditions in the ward rooms. These challenges can be overcome without compromising the project and airflow design. Potential solutions included utilising weather louvres at the roof ridge and installing infrared heaters in the ward rooms with additional supply of blankets to patients. The project allowed for the development of a baseline design standard to be built upon and improved for future facilities.
5. Conclusion and Further Research
When considering the various scenarios studied the following observations have been made: For the case where ventilation openings are mostly closed, for example, the ventilation rate for Modimolle did not comply with the WHO (2009) guidelines (Table 3). Therefore the ward natural ventilation systems for Modimolle hospital must never be operated as outlined in row 9 of Table 3. This is largely due to the low ambient wind conditions and climatic region. For the case where ventilation openings are mostly closed, the ventilation rate for both Jose Pearson and Catherine Booth hospitals complied with the WHO (2009) guidelines (Table 3). Therefore for the external wind speeds recorded (see row 4 Table 3), the natural ventilation systems for these hospitals can be operated as outlined in row 9 of Table 3. Lastly, for the case where ventilation openings are mostly opened, the ventilation rate for all the hospitals complied with the WHO (2009) guidelines (Table 4). The ventilation rate is proportional to the external wind speed where windows where mostly open. Therefore it can be concluded that the higher the opening area (openings which separate the air in the ward interior to outdoor air), the higher the ventilation rate (number of ACH). This conclusion is evidenced by larger ventilation rates for scenarios where ventilation openings were mostly opened when compared to the scenarios where ventilation openings are mostly closed. Therefore it is highly recommended for optimum ventilation performance of the wards that all openings to the exterior environment to be permanently opened. The results of the study indicate that the CFD methodology and various iterations of design solutions did add value and contributed to the improved ventilation rates found in the various facilities. The roof ridge design and top-light air ventilators are a direct outcome of iterative CFD analysis. This played a governing role in the improved airflow and rates in especially ‘closed’ environments, where it otherwise would have been little to no ventilation. Utilizing CFD simulation is a viable option for both testing design options towards predicting natural ventilation flow patterns for built environment design. The POE indicated that the implementation of a built environment design by research solution for high risk areas of TB infection. The research created indicators and valuable data in a series of design initiatives employed within a variety of climatic regions and wide spectrum of patient demographics. It is evident though the various staff interviews and project team discussions that the new facilities have improved nursing and patient ward standards.
6. Acknowledgement
This paper acknowledges the research contribution under the late Dr Sidney Parson, the Global Fund TB program and National Department of Health with specific thanks to Peta De Jager, Geoff Abbott and Faatima Salie and funding contribution by the CSIR parliamentary grant to draft and present this paper.
7. References
Ashrae, 1997. Heating Ventilation & Air Conditioning fundamentals Handbook. ASHRAE. 2005. 2005 ASHRAE Handbook Fundamentals. Atlanta, GA. P. 16.5.
183

Centre for Disease Control and Prevention (CDC), 2003. In guidelines for environmental infection control in health-care facilities (Morbidity and Mortality Weekly Report, 2003, 52 RR-10).USA Atlanta: CDC. CSIR and National Department of Health, 2014. IUSS facility guides: TB services [pdf] Pretoria: National Department of Health. Available at: http://www.iussonline.co.za/iuss/wp-content/uploads/2014/01/2014_07_02-IUSS-TB-Services-Proposal-V2a.pdf [Accessed 15 August 2015]. CSIR and National Department of Health, 2014. IUSS health facility guides: Building Engineering Services [pdf] Pretoria: National Department of Health. http://www.iussonline.co.za/iuss/wp-content/uploads/2012/09/2013_03_10-IUSS-Building-Engineering-Services-proposal-V1.1-NHC-approved.pdf. Accessed on 15 August 2015. Demmers, T.G. M.; Phillips, V.R.; Short, L.S., Burgess, L.R.; Hoxey, R.P.; Wathes, C.M., 2001. Validation of ventilation rate measurement methods and the ammonia emission from naturally ventilated dairy and beef buildings in the United Kingdom. Journal of Agricultural Engineering Research, 79(1), pp.107–116. Eshun-Wilson, I., Zeier, M.D., Barnes, J. ,et al. 2008, TB infection among staff at Tygerberg Academic Hospital, South Africa. South African Journal of Epidemiology Infection, vol. 23, no. 4 Federation of European Heating and Air-conditioning associations (REHVA), 2004. In ventilation effectiveness guidebook number 2. Brussels, Belgium. Gao, C.F. and Lee, W.L., 2011. Evaluating the influence of openings configuration on natural ventilation Me´ndez, C., San Jose, J.F., Villafruela, J.M. and Castro, F., 2008. Optimization of a hospital room by means of CFD for more efficient ventilation. Energy and Buildings 40 (2008), pp.849–854. Meir, A.I., Garb, Y., Jiao, D. ,et al. 2009, Post-Occupancy Evaluation: An Inevitable Step Toward Sustainability, Advances in building energy research, vol 3, pp. 189-220. Nice, J.A., 2012, Tuberculosis Control Programme Department of Health - The Global Fund M(X)DR-TB Project, Post Occupancy Evaluation Final Project Report. CSIR, Building Engineering, Programme Grant number: SAF-202-G05-C-00. Parsons, S., Abbott, G., de Jager, P., Conradie, D.C.U. & Bole, S. 2010. Researched solutions for long-term accommodation units for drug-resistant tuberculosis patients in South Africa. In Proceedings of the CSIR 3rd biennial conference: science real and relevant, September 2010, Pretoria. http://www.conference2010.csir.co.za/speaker/geoff-abbott, Accessed on 16 September 2015. performance of residential units in Hong Kong. Building and Environment 46 (2011). Salie, F. 2014. An Investigation into Turbine Ventilators as a Potential Environmental Control Measure to minimise the Risk of Transmission of Tuberculosis – A Laboratory and Field Study. Thesis submitted to the Faculty of Health Sciences, University of Cape Town for the degree of Master of Science in Medicine (Biomedical Engineering). Sherman, M.H.,1997. Multizone age-of-air analysis. International Journal of Ventilation 7(2). WHO., 2013. South Africa, Tuberculosis profile, WHO. www.who.int/tb/data. World Health Organisation (WHO), 2009. Natural ventilation for infection control in health-care settings. Geneva Switzerland: WHO.
184

A RATING TOOL TO ASSESS THE CONDITION OF SOUTH AFRICAN INFRASTRUCTURE
Kevin WALL 1
Chris RUST 2 1 Department of Construction Economics, University of Pretoria, Email: [email protected] 2 CSIR Built Environment, Email: [email protected] Keywords: asset management, condition, infrastructure, rating, South Africa
Abstract
In 2006 the South African Institution of Civil Engineering (SAICE), in partnership with the Council for Scientific and Industrial Research (CSIR), released the first ever “report card” assessment rating of the condition of engineering infrastructure in South Africa. The purpose of the report card was to draw the attention of government, and of the public at large, to the importance of maintenance, and to factors underlying the state of repair of infrastructure. Its success was such that the CSIR and SAICE brought the next report card out in 2011, and are again working together to prepare a new edition, to appear in 2016.
1. Introduction
Many factors enable a city to be a liveable and viable entity, a desirable place for working, investing and living. The condition of the built environment infrastructure, i.e. that part of the public sector capital stock producing services utilised by households, such as hospital services, drinking water, sanitation, electricity, or which facilitates economic activity, such as electricity, roads and ports, is a very important such factor. Well-maintained infrastructure underpins quality of life and economic development. Studies are increasingly showing that dysfunctional sanitation facilities, for example, or unreliable water supplies, constitute not only threats to health and economic activity, but can – and do – also trigger service delivery protests. National-level attention has over the years been given to policies and strategies to improve the maintenance of infrastructure, and hence its quality and reliability. Among other measures have been the National Infrastructure Maintenance Strategy, the Government Immovable Asset Management Act, the National Water Services Infrastructure Maintenance Strategy, and the "Green Drop" (wastewater) and "Blue Drop" (drinking water) quality assessments of the Department of Water Affairs (now the Department of Water and Sanitation (DWS)). The importance of well-maintained infrastructure to the economic health of nations is clear. Indeed the positive relationship between gross fixed capital formation (GFCF) and economic growth, is well documented (Investec, 2005, Kumo, 2012), and is the basis for sustained economic and social development. If maintenance is inadequate, social and economic growth will be impeded – something that cannot be afforded. In 2006 the South African Institution of Civil Engineering (SAICE1), in partnership with the Council for Scientific and Industrial Research (CSIR)2
, released the first ever “report card” assessment rating of the condition of engineering infrastructure in South Africa (SAICE, 2006). The purpose of the report card was to draw the attention of government, and of the public at large, to the importance of maintenance, and to factors underlying the state of repair of infrastructure. Its success was such that the CSIR and SAICE brought the next report card out in 2011, and are again working together to prepare a new edition, scheduled to appear in 2016. The intent of the report card work has throughout been to inform the public about the importance of infrastructure in their daily social and economic intercourse, by highlighting the current status of its condition. Furthermore, many decision makers are technical lay-people. The report cards should enable better informed decisions to be made, especially regarding maintenance management and planning for new expenditure. It is anticipated that the findings of this next report card will be widely debated, because in the last few years’ service delivery problems, particularly those attributable to operation and maintenance of infrastructure, have received heightened attention across the country. This paper:
1 SAICE has more than 9000 individual members in government, contractors, designers, education and other fields related to civil engineering, and is the largest learned society in the built environment. Its members collectively are very well placed to give an "insider" perspective of all aspects of the performance of engineering infrastructure. 2 The largest research organisation, public or private sector, in Africa, has more than 2000 professional staff, many of them the leaders in the field of built environment matters.
185

describes the process of research and compilation of the report cards; describes the origins and development of the methods – the assessment tools, indices and rating
systems – which have been employed; reflects on the condition of infrastructure in South Africa as revealed by the 2006 and 2011 report
cards, and the key factors and trends revealed, and begins to speculate what the 2016 report card might find in this regard; and
recommends that the new report card be prepared along the lines of the previous, because their methodology worked well.
2. Infrastructure Report Cards
Infrastructure report cards are a reflection at a point in time on the state of built environment infrastructure, i.e. that part of the nation’s public sector capital stock that produces services that are consumed by households, such as hospital services, drinking water, sanitation, electricity, or facilitates economic activity, such as electricity, roads and ports. This infrastructure is a public asset. All in a nation have a stake in its upkeep and operation, and all share in the expense of its construction and its ongoing maintenance. Institutions in many countries publish infrastructure reports, but these are mostly in relation to commercial activity in the construction sector or on the general condition of infrastructure to the extent that it supports commercial activity. They generally do not attempt to grade the condition of the infrastructure or to comment on the trends in condition, or the constraints preventing improvement. They are also seldom prepared by the professionals intimately involved with the design, construction and maintenance of these assets. Infrastructure Report Cards (IRC) have since the 1990s been published at regular intervals by three other countries in the English-speaking world. The American Society of Civil Engineers (ASCE) has produced the ‘Report Card on America’s Infrastructure’
3, the Institution of Civil Engineers (ICE) (UK) the ‘State of the Nation’ reports – both of these more or less annually – and Engineers Australia has published a national Infrastructure Report Card at less frequent intervals. They are intended to draw the attention of both government and the public at large to the importance of maintenance, and to factors underlying the state of repair of infrastructure – factors such as skills and finance, for example. In themselves, these reports have little technical value to infrastructure professionals, but they may be put to good use in macro level planning, lobbying for infrastructure funding, stimulating debate and highlighting the actions that civil engineers believe are needed to improve the state of a nation´s infrastructure. By publishing them, learned societies and institutions provide more than information – they commit to a role of advocacy. These report cards do not comment on backlogs as expressed in the absence of infrastructure to serve certain areas and communities. It is the condition of existing infrastructure which is the focus, together with the effect of that condition on service delivery (e.g. that a badly operated and maintained water treatment works is sometimes unable to supply the town for days at a time). Also important, but not the main focus, are the factors which lead directly to this infrastructure being in the condition that it is. To reiterate: the focus of each report card is on the then current condition of existing infrastructure. The pertinent service delivery is the service which that infrastructure directly delivers. Thus, for a school for example, the infrastructure report card focuses on the condition of the infrastructure – in particular on the buildings and the water and sanitation facilities. The quality of the teaching and learning which takes place in the school is not of interest to the report card.
3. The South African Infrastructure Report Cards
Before embarking on the first IRC in 2006, the authors took the view that it would be a reflection at a point in time on the condition of public infrastructure in the built environment, and would not comment on the legacy of apartheid. This was not a decision made lightly. The inherited backlogs are large, but the past cannot be managed. Only the present can be managed in the hope and with the objective of creating a brighter future. It was also decided that the reports would not highlight the stated intentions of many agencies to improve infrastructure in the future, even when these are accompanied by plans with budgets – these intentions would instead be reflected through improved grades in future report cards. The focus would be entirely on the contemporaneous condition of infrastructure. Since democracy in 1994, massive strides have been made by the government to correct infrastructural imbalances. Drinking water, sanitation, energy and transportation access have received focused attention, and, acting on its mandate, the government is continuing to invest at rapid pace in infrastructure for disadvantaged communities. However the combination of limited resources for the demands of existing infrastructure, priority provision for the previously disenfranchised, public sector restructuring, and shortages of key skills has led to extreme pressure on the condition of the public infrastructure asset base. The answers to many issues posed in the report are neither simple nor easy. All the more reason for the public to be better informed about the serious decisions that must be taken about our infrastructure and, where appropriate, to change our behaviour. It is imperative that we do not continue to build only to permit decay. On the contrary, adequate budgets and maintenance management plans are required for existing and new additions to the infrastructure asset base.
3 The early editions of the ASCE report cards were subtitled "A Voter’s Guide to Renewing America’s Infrastructure", and were punted as "a means of empowering citizens to lobby government" to address infrastructure issues. ASCE took the view that if citizens had the facts at hand, this should lead to closer and more informed collaboration between civil society and the various tiers of government.
186

SAICE decided about 10 years ago that the widely-reported condition of engineering infrastructure, and the effect which poor condition was having on quality of life and economic development, was of sufficient concern that it should compile a "report card" of the condition of infrastructure. It approached the CSIR for assistance with the research component – which assistance was readily given – and, in 2006, the first "National Infrastructure Report Card" was published. This, the first ever report card of the condition of engineering infrastructure in South Africa, highlighted “the observations of the professionals responsible for the planning, construction, operation and maintenance of our nation’s life-support system”. It graded infrastructure (water, sanitation, solid waste, roads, airports, ports, rail, electricity and hospitals and clinics) on a scale from "A+" ("in excellent condition"), through to "E-" ("infrastructure has failed or is on the verge of failure, exposing the public to health and safety hazards"). Overall, it gave the infrastructure a D+ grade. In 2009 the decision was taken that, whereas so much construction had been taking place in preparation for the Soccer World Cup, the next edition of the IRC should be published late in 2010 or early in 2011. This would allow a reasonable period for the new infrastructure to be used before being graded. The acceleration of projects required for the 2010 Soccer World Cup – highways, mass transit, airports and the many stadiums – provided South Africa with a welcome buffer from the negative consequences of the global financial crisis since 2008. The downside is that this appears to have distracted authorities from the core business of maintenance and upgrading of other infrastructure – with predictable consequences4. The modest resources available to a learned society such as SAICE motivated the development of a partnership for the research component of the process. As in 2006, for the 2011 report card SAICE recognised the CSIR as the organisation best placed to assemble and analyse the body of data required. Thus an understanding was in 2009 reached between SAICE and CSIR – CSIR would draw up the research reports across all sectors. SAICE would then refine and interpret these findings through the input of its network of engineering professionals and technical divisions, perform the grading, and publish and publicise the report. The new Report Card was launched in April 2011, weeks before local government elections. Once again, skill shortages and lack of maintenance across all sectors were highlighted. Two new key themes also emerged, viz. holistic systems and sustainability. The 2011 IRC covered ten sectors5, one more than in 2006. These were further divided into 27 sub-sectors, six more than the previous time. It was found that, in comparison to 2006, nine of the sub-sectors showed improvement, twelve remained unchanged and four had deteriorated. The Public Schools sector and the Fishing Harbours sub-sector were new and therefore did not have trend indicators. Overall, a grade of C- was awarded. This overall improvement from a grade of D+ in 2006 reflected marginal improvement in the average condition of South Africa’s infrastructure over the past five years, influenced by the heavy investment in, especially, national assets such as ports, rail, airports and national roads, much of this in preparation for the 2010 FIFA Soccer World Cup. The authors strongly cautioned, however, against a perception that the rise to C- represented a blanket improvement. On the contrary, “the quality and reliability of basic infrastructure serving the majority of our citizens is poor and, in many places, getting worse. Urgent attention is required to stabilise and improve these” (SAICE, 2011).
4. Research Methodology 2006 and 2011
The IRC2006 was published under intense time pressure and without the comfort of a defined budget. As a first initiative, the work was executed by a small, mostly voluntary, team. Access and (usually) generous assistance was gained from various key executives in public sector infrastructure bodies from whom strategic information was gleaned. Maximum use was made of research already undertaken by SAICE experts, and of some peer review. SAICE also took the view that a synthesis of the perception of field experts is at least as credible and informative as primary research data. The grading was uneven to the extent that it was in some areas based on extensive primary and secondary research, whereas in other areas the grading relied heavily upon the expert opinion of a small number of key SAICE members practising in those areas. 4 A more recent very major example of the long-term effect of the World Cup has proved to be the ongoing power crisis in South Africa. This has been caused by a number of factors, prominent among which, it must be noted, is the neglect of maintenance because of the imperative that "the lights stay on during the World Cup", as admitted by the CEO of Eskom at his widely-reported and most revealing press conference in January 2015. (Matona, 2015) 5
Water and sanitation services infrastructure. Solid waste management. Roads. ACSA-owned airports. Commercial ports. Rail permanent way and structures. Electricity generation infrastructure. Health care infrastructure. Public ordinary schools infrastructure. The large-scale water resources infrastructure owned by DWS.
187

The process towards the 2011 report card had the comfort of a more formal agreement between SAICE and the CSIR, a much bigger budget and longer timeframe, and a more formal and more intensive process of peer review. In summary the following research methodology has in the past been followed by the CSIR:
Drafting sector reports (desk top work) for infrastructure sectors to be identified and for which it has the required in-house expertise;
Endeavouring to arrange for the drafting of reports for selected sectors where it does not have sufficient expertise itself; and
Contributing to the process of grading and, particularly, to the drafting of the report card itself. SAICE has then used a number of peer review groups, selected for their knowledge and expertise in each subsector, to review the CSIR output and use a consensus grading of the condition of infrastructure in each of the subsectors as mentioned above. The same principal research questions have been posed to the 2016 report card team as were posed to the earlier teams. These questions are simply stated:
What is the condition of key elements of South Africa's bulk infrastructure? How does this compare with the 2006 and 2011 assessments? What is the overall trend, and what
are the trends by sectors? What contributes to the condition and its trends? What recommendations can be made?
The methodology used in 2006 and 2011 has worked well, and therefore the 2016 report card will be prepared following more or less the same principles.
5. Key Findings, 2006 and 2011
In both 2006 and 2011, two key themes ran as a thread through all the grades. The first is the extreme shortage of skills and the impact of this on planning, procurement, design, construction and care of infrastructure. The second is the lack of adequate funding for the maintenance of the existing asset base and the new assets that come on-stream each day. South Africa suffers an acute skills shortage in the infrastructure sector. Just two illustrations should highlight how serious this is. Firstly, a survey undertaken by SAICE some years ago showed that more than one-third of all 231 local municipalities did not have a single civil engineer, technologist or technician – vacancies in local government for engineering practitioners exceeded 1000. Secondly, while the link between engineering infrastructure and economic growth may be clear, it is not always clear that a similar link exists with social health. It is obvious, though, that cleaner drinking water, proper sanitation, better shelter, access to transport and electricity, all improve the quality of life. Indeed, SAICE research indicates that, in general, developing countries have more doctors than engineers, whereas the opposite is true in developed countries. The reason is obvious: proper infrastructure prevents disease and sickness. It is concerning then, that South Africa has only half as many engineers as doctors. By comparison, Australia, North America, Western Europe and even China and India, have a similar number of engineers to doctors, or more engineers than doctors. Furthermore, the ratio of population to engineer in South Africa is of the order of 3200 to 1, twenty times less than some of the countries just mentioned. Furthermore, while the average ratio is 3200 to 1, the ratio amongst the white population is approximately 300 to 1, similar to America and Western Europe, while the ratio in the black population is in the order of 50 000 to 1, amongst the worst in Africa or the world. The case for transformation cannot be clearer. The links between technology professionals, infrastructure provision and quality of life must be recognised. The provision and maintenance of infrastructure that performs well and is sustainable into the future also depends on the quality of human capital and technological capacity in a country. Thus the technology achievement index (TAI) in South Africa, as defined by the United Nations, is an important indicator of infrastructure provision. The UN indicated that a direct positive relationship exists between the TAI and both GDP and the Human Development Index (HDI) (Roux, 2007).
188
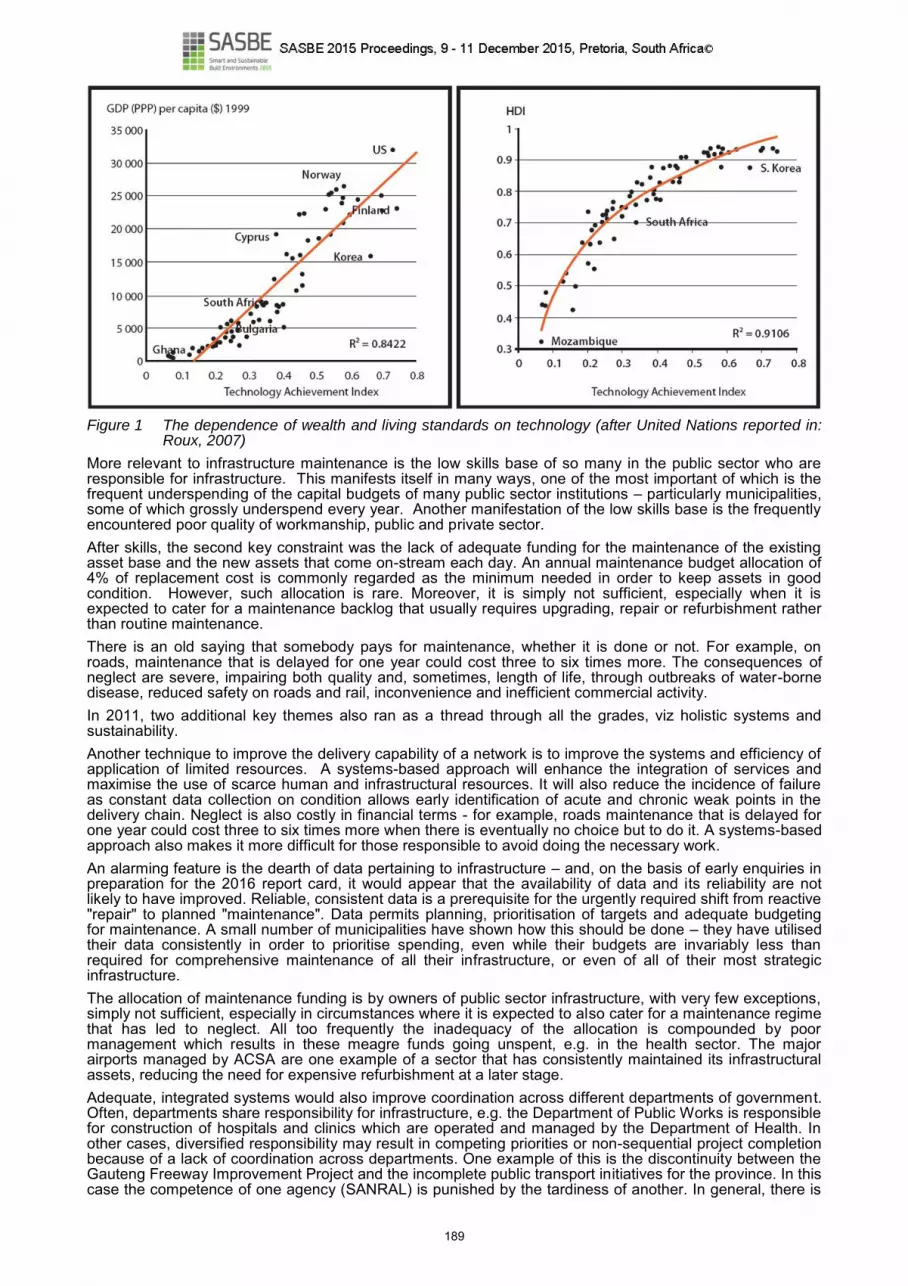
Figure 1 The dependence of wealth and living standards on technology (after United Nations reported in:
Roux, 2007)
More relevant to infrastructure maintenance is the low skills base of so many in the public sector who are responsible for infrastructure. This manifests itself in many ways, one of the most important of which is the frequent underspending of the capital budgets of many public sector institutions – particularly municipalities, some of which grossly underspend every year. Another manifestation of the low skills base is the frequently encountered poor quality of workmanship, public and private sector. After skills, the second key constraint was the lack of adequate funding for the maintenance of the existing asset base and the new assets that come on-stream each day. An annual maintenance budget allocation of 4% of replacement cost is commonly regarded as the minimum needed in order to keep assets in good condition. However, such allocation is rare. Moreover, it is simply not sufficient, especially when it is expected to cater for a maintenance backlog that usually requires upgrading, repair or refurbishment rather than routine maintenance. There is an old saying that somebody pays for maintenance, whether it is done or not. For example, on roads, maintenance that is delayed for one year could cost three to six times more. The consequences of neglect are severe, impairing both quality and, sometimes, length of life, through outbreaks of water-borne disease, reduced safety on roads and rail, inconvenience and inefficient commercial activity. In 2011, two additional key themes also ran as a thread through all the grades, viz holistic systems and sustainability. Another technique to improve the delivery capability of a network is to improve the systems and efficiency of application of limited resources. A systems-based approach will enhance the integration of services and maximise the use of scarce human and infrastructural resources. It will also reduce the incidence of failure as constant data collection on condition allows early identification of acute and chronic weak points in the delivery chain. Neglect is also costly in financial terms - for example, roads maintenance that is delayed for one year could cost three to six times more when there is eventually no choice but to do it. A systems-based approach also makes it more difficult for those responsible to avoid doing the necessary work. An alarming feature is the dearth of data pertaining to infrastructure – and, on the basis of early enquiries in preparation for the 2016 report card, it would appear that the availability of data and its reliability are not likely to have improved. Reliable, consistent data is a prerequisite for the urgently required shift from reactive "repair" to planned "maintenance". Data permits planning, prioritisation of targets and adequate budgeting for maintenance. A small number of municipalities have shown how this should be done – they have utilised their data consistently in order to prioritise spending, even while their budgets are invariably less than required for comprehensive maintenance of all their infrastructure, or even of all of their most strategic infrastructure. The allocation of maintenance funding is by owners of public sector infrastructure, with very few exceptions, simply not sufficient, especially in circumstances where it is expected to also cater for a maintenance regime that has led to neglect. All too frequently the inadequacy of the allocation is compounded by poor management which results in these meagre funds going unspent, e.g. in the health sector. The major airports managed by ACSA are one example of a sector that has consistently maintained its infrastructural assets, reducing the need for expensive refurbishment at a later stage. Adequate, integrated systems would also improve coordination across different departments of government. Often, departments share responsibility for infrastructure, e.g. the Department of Public Works is responsible for construction of hospitals and clinics which are operated and managed by the Department of Health. In other cases, diversified responsibility may result in competing priorities or non-sequential project completion because of a lack of coordination across departments. One example of this is the discontinuity between the Gauteng Freeway Improvement Project and the incomplete public transport initiatives for the province. In this case the competence of one agency (SANRAL) is punished by the tardiness of another. In general, there is
189

a need for departments to communicate with one another more effectively through better systems, in order for infrastructure to be more efficiently and cost-effectively managed. The importance of life-cycle costing cannot be overemphasised. Although departmental-specific policies or legislation often support this idea, this does not translate to implementation, especially in early stages such as procurement, which is so often performed in a way that ignores life-cycle costing. That is, the bid with the lowest capital price is favoured, although accepting this bid usually means significantly more expensive maintenance and repair costs in the long term. Although government’s infrastructure-related deficiencies have been outlined above, all South African citizens are responsible for sustainability, and urgently need to recognise this. Infrastructure is human-made and subject to technological advances multiplying its quantity and quality; however it is built on a foundation of scarce natural resources that is finite and generally speaking defies any attempt at its multiplication.
6. Impact of the South African Report Cards
In brief, the following might be regarded as the primary positive achievements of the previous report cards: The first publication in South Africa (or Africa) of consolidated reports on the condition of a broad
range of infrastructure by a credible institution, drawing attention to its condition and importance by headlining issues in a manner understandable to technical, decision making and lay persons. It provides the headline issues requiring attention and a benchmark for further monitoring.
The primary objectives of informing the public and decision makers achieved through the numerous live interviews and presentations, print, visual and audio media exposure and discussions with client and sector organizations.
The credibility of SAICE and the CSIR as institutions with the authority, indeed the duty, to comment broadly on engineering infrastructure has been enhanced.
The role of civil (and all) engineering professionals as creators and custodians of all aspects of infrastructure brought to the attention of the public.
The awareness raised of the public, parents, learners, educators and government to the urgency of the infrastructural crisis in South Africa.
Compared to the 2006 experience, in the preparation for the 2011 report card it was found that some infrastructure owners had in the interim become very sensitive to criticism, irrespective of whether they perceived it to be fair or unfair. One of their "defence mechanisms", it seemed, was to restrict access to information. The 2011 IRC research team consequently found great reluctance on the part of professionals in certain areas to share information with the team. Another disappointment and concern in 2011 – but it must be made clear that this was in respect to a minority of infrastructure sectors – was the discovery that less monitoring of the state of infrastructure was taking place than had been the case a few years before. On the other hand, it was pleasing to report that condition monitoring had greatly improved, both in breadth and in quality of coverage, in at least one sector – viz. the water services sector.
7. The Next Report Card
When each of the 2006 and 2011 report cards appeared, the interval until the next report card should appear was left undefined – this was left for the future leaders of the CSIR and SAICE to decide upon. Several years have since passed, and the process is now underway to prepare a new report card, to appear in 2016. The agreements between the CSIR and SAICE are at the time of writing (September 2015) being finalised. Once again, as in previous years, the key roles of the two parties will be:
The CSIR takes responsibility (including carrying its costs) for compilation of the basic research reports, and initial gradings; whereas
SAICE takes responsibility (including carrying its costs) for moderation of the gradings and determination of the final gradings to be published, and for everything to do with writing of the report card itself, its launch, and any following up.
In addition, and subject to the availability of additional funding, and perception at the time of the importance of this work, the CSIR is considering undertaking:
Research of, and reports on, topics material to the condition of infrastructure. (For example opportunity cost of not doing maintenance, and selected issues around supply chain management.)
The design, conduct and analysis of a perception survey, and reporting on the findings. (This survey will solicit opinions regarding the current state of infrastructure and what this implies for priorities to be addressed.)
As emphasised earlier, the focus of these report cards is on the condition of the infrastructure. However increasing importance has over the years been accorded to recognising the factors which lead directly to this infrastructure being in the condition that it is. The writers of the sector reports are currently being briefed to include material of this type in their research. (Annexure A.) There is little doubt that skills factors and financial factors will be shown to be playing an important role in the condition of infrastructure. Studies over the years, highlighting the inadequacy of the current technical skills base in the public sector (in some areas much more than in others) have regrettably made little difference (e.g. the far-reaching study of technical skills in municipalities which was published in Lawless, 2007). More recently, work undertaken on behalf of the Water Research Commission (WRC), and as yet unpublished, has come up with findings on the skills encountered in a small sample of water services institutions. The
190

worst-performing municipality was found to have a "skills gap" of 92% – i.e. A gap determined by comparing the number of the current staff who possess the minimum qualification and years of experience against the "required staff" as determined by the infrastructure which the municipality is supposed to be taking care of. (And, yes, allowance is made for the extent to which the municipality outsources its responsibilities.) (Vienings, awaiting publication) The same study also looked at a larger sample of municipalities and other water services institutions (e.g. catchment management agencies), and found that people get appointed to technical posts without having the necessary qualifications. Particularly scary is that "40% of respondents said the minimum requirements of job profiles were overridden when recruiting staff". (Ibid) The effect of this lack of skills on the condition of infrastructure, due to inadequate operation and maintenance of the infrastructure, can be imagined. On the financial side, National Treasury has of late increasingly been voicing its concern about the financial sustainability of municipalities, and about factors which undermine that sustainability. For example, in the most recent of its annual assessments (a report which came out at the end of 2014), Treasury classified 86 of the 278 municipalities as "financially distressed". Nine of them, it said, are "in serial distress", having been on the list four years in a row. (Bruce, 2014) Financial distress of this type is likely to affect residents’ quality of life quite profoundly. Shortage of finance could (and usually does) result in repairs and maintenance being neglected (sadly, this is often a favoured target for municipal cost-cutting). It could also result in inability to operate services, to send accounts and collect revenue due, and to pay bulk suppliers. (It was at the same time reported that 60 of the municipalities owed Eskom R 4 billion, which has since threatened to bypass municipalities and instead supply electricity directly to consumers (Lund 2015).) Furthermore, shortage of financial and technical skills has been a direct contributor to the inability of many municipalities and provincial government departments responsible for infrastructure to spend the whole of their capital budgets each year. It is disturbing that many of the interventions to support ailing small municipalities and help them to function seem to have borne little fruit. The same Treasury report stated that: "Over the last number of years, national government has made available substantial amount of money for capacity building. Yet there is very little indication that such funds … have yielded the intended outcomes." (Bruce, 2014.)
8. Conclusion
The intention behind the infrastructure report card initiative has been for engineering professionals to provide a public opinion on the condition of infrastructure in the manner of “expert witness”. By the professionals highlighting the current status of the condition of infrastructure, the public is informed about the importance of infrastructure in their daily social and economic intercourse. Furthermore, whereas many decision makers are lay people, and not technical, the reports will empower those responsible to make better informed decisions, especially decisions regarding maintenance management and planning for new expenditure. At the same time, the report cards highlight the role and relevance of civil engineers and the professional engineering institutions. Reception of the previous report cards by the media and the general public, and in official circles, can be described as “mature”. For example, there was only minimal questioning of the credibility of the report card findings, and no serious criticisms were received. There was in 2006 and 2011 broad recognition that the process had provided the first national-scale credible benchmark against which progress (or regress) can be measured. SAICE and the CSIR agree that the initiative should be sustained and extended, but that at the same time the independence of the benchmarking process should not be compromised. The future of the project must also consider embracing the participation of partners such as aid agencies, and SAICE’s own partners such as statutory institutions, Voluntary Associations, the African Engineers Forum, the World Federation of Engineers Organisation, UNESCO and others. Future cooperation might include the promotion of the process in other developed and developing countries as a leadership initiative by societies of engineers. The reports and the indicated trends from 2006 to 2011 made it possible to conclude that, while government should not change its drive to provide new infrastructure to address backlogs, the challenge is to supplement this by at the same time also focusing on the maintenance of both new and old infrastructure. If this is not done, the already considerable legacy of that infrastructure which is dysfunctional for want of sound operation and adequate maintenance in the past, and which therefore needs rehabilitation or replacement at considerable cost, will increase rapidly. Infrastructure, once created, is unrelenting in its demand for maintenance, and this demand will escalate increasingly the longer it is ignored. As a developing nation, South Africa's engagement in the global economy, and the upliftment of its citizens, are constrained by the infrastructure capabilities. The challenges revealed by the infrastructure report cards are no less acute because they are chronic in many parts of the country, but they can be overcome. Skills and budgetary constraints notwithstanding, bold leadership and effective management are irreplaceable ingredients for a successful and sustainable infrastructure services delivery. The public in general, as well as many civil engineering professionals, have over the years increasingly expressed concerns about the state of our infrastructure. A new infrastructure report card will, as its
191

predecessors were, be of interest and value to all tiers of government, business, industry and the general public. The work of the Presidential Infrastructure Coordinating Commission (PICC) has thrown further light on the condition of infrastructure and the reasons why this condition ranges from excellent through to very poor. The PICC Technical Task Team has followed up on this with proposals to Cabinet (with which Cabinet has agreed) for a greater focus on infrastructure maintenance. Responsibility for the design of a process to improve maintenance has since been assigned to the Municipal Infrastructure Support Agent (MISA). While there is no doubt that a new report card is needed, and that it will be a valuable resource for government and civil society alike, the current Cabinet and PICC sentiment increases the importance of this proposed partnership between the CSIR and SAICE. Indeed, the PICC Technical Task Team has already indicated that it wishes to keep in close touch with progress on the new report card. The CSIR and SAICE feel that government needs to be aware of the opinion of the professions (as represented by SAICE and the infrastructure professionals within the CSIR) on where maintenance or replacement is most needed, such as where infrastructure is ageing or approaching obsolescence, and what needs to be done to improve the condition of infrastructure and thereby service delivery. This thinking is in line with government’s National Infrastructure Maintenance Strategy. (Public Works et al., 2006)
9. References
Bruce, P. 2014. Editorial: municipalities in dire straits. Business Day. 11 December 2014. Department of Public Works, Construction Industry Development Board, and CSIR. 2006. National Infrastructure Maintenance Strategy. Lund, T. 2015. Municipalities: ignoring the warnings. Financial Mail. 7 May 2015. Investec. 2005. Prospects 2004-2009: Gross Domestic Fixed Investment Outlook, SA Economic Research 1st Quarter 2005. Matona, T. 2015. Media presentation (by the Chief Executive of Eskom). 15 January 2015. Kumo, W.L. 2012. Infrastructure Investment and Economic Growth in South Africa: A Granger Causality Analysis. Working Paper Series, African Development Bank, No 160, November 2012. Lawless, A, 2007. Numbers and needs in local government. Civil engineering -- the critical profession for service delivery. SAICE, Midrand. Republic of South Africa. 2006.Constitution of the Republic of South Africa, 2006 Pretoria.. Roux, A. 2007. Business Futures 2007. Institute for Futures Research, University of Stellenbosch, South Africa. SAICE. 2006. The SAICE infrastructure report card for South Africa: 2006. The South African Institution of Civil Engineering, Midrand. (November 2006). (Refer to the SAICE website (www.civils.org.za) for the full report.) SAICE, 2011. The SAICE infrastructure report card for South Africa: 2011. The South African Institution of Civil Engineering, Midrand. (April 2011). (Refer to the SAICE website (www.civils.org.za) for the full report.) Vienings, A, and Lima, M. 2014. Integrated water sector skills intervention map based on a sector skills gap analysis. Water Research Commission, project K5/2113. In press.
Annexure A. Summary of the ground to be covered in the sector reports
In brief, the sector research reports will draw from interviews and suitable research documentation which can be sourced, on relevant material that can be gleaned on:
In the broadest of terms, who owns what. Also in the broadest of terms, what has been done to monitor condition of infrastructure. The condition of infrastructure. (The primary focus – all others are secondary.) Generic comments about contributors to the condition of infrastructure (e.g. in respect of roads,
vehicle overloading might prove to be a factor). The state of management of the infrastructure (including comments about resources, skills,
leadership, etc.). Trends since 2006 and 2011, and observations on these. Observations on the stability of the current condition. Anything which drives current operation and maintenance practices, including, particularly:
o issues to do with the owner of the infrastructure, such as financial stability, or political infighting, which affect all operations, and not just maintenance of infrastructure;
o standards – including whose standards, how valid and/or useful it is for those standards to be applied, and why and in what way these standards influence current operation and maintenance practices;
192

o measuring and monitoring, whether internal, or external (e.g. Green Drop and Blue Drop, citizen monitoring, media); and
o legal and/or regulatory compliance requirements (for example, in respect of airports, the International Civil Aviation Organisation standards; for another example, the standards for drinking water quality).
If information is not available: o Does it actually exist, but is being withheld? o Does it not exist at all? And/or that it is unreliable and/or incomplete? o What does this say about the owners of the infrastructure? And what does it say about
the authorities whose responsibility includes monitoring the owners of this infrastructure? The range of conditions that the infrastructure is in, and if any patterns which can be discerned
within that (e.g. urban versus rural; e.g. municipalities in a certain area as opposed to municipalities in a different area), while pointing out that grading major infrastructure investments on their average condition unfortunately conceals this range.
If any policies or mechanisms are discerned which are used by infrastructure owners to assist them to cope with the difficulties they face, or in order to make best use of the resources they have available, these policies or mechanisms will be recorded. (For example that some provincial roads authorities are said to be consciously focusing their resources on the more highly trafficked roads, and have in effect, because of insufficient budget allocations, abandoned maintenance of the least important roads.)
193

194

ADAPTING TO ENVIRONMENTAL SUSTAINABLE CONSTRUCTION IN DEVELOPING COUNTRIES: A MULTI-THEORY CONCEPTUALIZATION
Sarfo MENSAH 1
Joshua AYARKWA 2 Gabriel NANI 3
1 Department of Building Technology, Kumasi Polytechnic, Email: [email protected] 2 Department of Building Technology, Kwame Nkrumah University of Science and Technology, Email:
[email protected] 3 Department of Building Technology, Kwame Nkrumah University of Science and Technology, Email:
[email protected] Keywords: construction organizations, developing country, ecological modernization theory, environmental sustainable construction, resilience theory
Abstract
Environmental sustainability remains foundational to the achievement of the overall goals of sustainable construction and ultimately, sustainable development goals. However, systemic challenges as well as framework and knowledge gaps contribute to the ad-hoc manner in which Environmental Sustainable Construction (ESC) is practiced. Few sustainable construction frameworks available have not been able to propel the development of construction industry policies to establish recognized practices of ESC across developing countries. Further, little has been done with regards to the adoption of theories to enhance understanding and advance knowledge in the issues that could be responsible for fostering regularized sustainable construction practices in developing countries. Resilience theory and ecological modernization theory have been used for sustainability studies in the developed world context. In this paper, they have been hybridized for adoption to aid conceptualization and understanding of the issues regarding the application and regularization of ESC by construction organizations in developing countries. Ghana is used as the study area. A face-to-face semi-structured in-depth interview of 20 Built Environment (BE) professionals in 20 construction organizations was conducted to facilitate gaining deeper understanding of the ramifications of construction organizations’ adaptation to ESC. The adaptive capacity and rationality of construction organizations concerning the use of modern technologies to manage environmental challenges have emerged as some of the issues surrounding adaptation to ESC.
1. Introduction
Environmental sustainability is one of the three traditional pillars of sustainable development (Borland, 2009). It is regarded as foundational to the achievement of sustainable development goals globally (Du Plessis, 2002). Hill and Bowen (1997), Ofori (1998) and Bon and Hutchinson (2000) have shown that inequalities regarding economic development, implementation framework and resources between developed and less-developed countries pose barriers to adapting to sustainable construction in developing countries. Recently, Kaygusuz (2012), Reid (2011) and Du Plessis (2007) have also confirmed this menace of developing countries’ construction industry and stakeholders’ inability to establish sustainable construction. Hence, little has been done to achieve environmental sustainability in developing countries. As far as the existence and operations of the construction industry are concerned, construction organizations remain significant stakeholders (Wong, 2013). Hence, their ability to adapt to sustainability requirements is paramount to the achievement of sustainable development goals globally. Ghana, a developing county, has a huge infrastructure gap to fill as part of economic development challenges (Ministry of Finance and Economic Planning, 2011). In pursing such economic development goals, care has to be taken not to compromise on sustainable development requirements. A lot of unsustainable development practices exist in Ghana. Some of these include deforestation through illegal felling of timber, not reclaiming land after sand weaning and illegal mining contaminating water bodies (Ospina et al., 2012). However, awareness about sustainability issues in developing countries such as Ghana is low even among built environment professionals (Mensah and Ameyaw, 2012). To reverse this trend, it is crucial to create awareness and further develop knowledge to promote sustainability practices in the construction industry. Cabezas and Fath (2002) have emphasized the importance of utilizing more theories to underpin sustainable systems studies in order to improve awareness and advance knowledge. However, the application of relevant theories to advance implementation of sustainability practices, especially in the developing world, has been less exploited (Sarkis et al., 2011). This paper responds to the important call to advance knowledge in sustainability practices in the construction industry applying relevant theories. Hence a hybrid of resilience theory and ecological modernization theory has been applied to empirically understand the complications of construction organizations adaptation to environmental sustainable construction in developing countries. These theories have been selected in view of their relation to sustainability and system
195

adaptability studies. Ghana is used as the study area in view of the presence of unsustainable practices and recipe for more occurrence due to the huge infrastructure gap to be filled.
2. Resilience Theory conceptualization of ESC
According to Folke et al. (2010:3) and Walker et al. (2004:2) “Resilience is the capacity of a system to absorb disturbance and reorganize while undergoing change so as to still retain essentially the same function, structure, identity and feedbacks”. Thus the capacity of a social-ecological system to change in a changing world while maintaining its functionality as well as its ability to resist and recover from disturbances come to play (Walker and Salt, 2006; Chapin et al., 1996). Resilience Theory (RT) has grown to be multidisciplinary since its inception by the ecologist, Hollings (1973). Awareness of the importance of resilience theory in sustainable development studies have been on the increase (Folke et al., 2002). The discourse on the importance of resilience theory in achieving sustainable development goals has developed for over three decades and continues to develop (Pisano, 2012; Folke et al., 2010; Folke, 2006; Walker et al., 2004; Hollings, 1973). However empirical studies of RT in the context of sustainable construction in developing countries are rare. The CI has a basic function, which borders on contributing to infrastructure and economic development through routine construction business activities while generating and maximizing profit for the benefit of humans within. There is an integrated system of ecosystems and human society with reciprocal feedback and interdependence (Tan et al., 2011; Folke et al., 2010). The CI is therefore considered as a social-ecological system in which construction organizations are actors. Thus, construction activities of the construction organizations lead to deforestation and emission of Green House Gases (GHG) (Ospina et al., 2012). This trend has high tendency to thrust the resilience of the ecosystem, as well as social systems within it, beyond bearable limits if not checked. Application of RT would require the construction industry, as a social system, to possess skills, abilities, knowledge and insights needed to enhance its capacity to adapt to changes in construction practices It is expected that adaptation to the changes, brought about by SD demands, should take place while the CI still maintains its functionality, competence and energy. Going beyond sustainability, the construction industry should be enabled to pursue and achieve a resilient social-ecological system. RT is very relevant to explaining the dynamics involved in the achievement of resilience by the CI in the developing country context such as Ghana.
2.1 Adaptive Cycle in RT
An important feature of the concept of adaptive capacity in RT is the adaptive cycle of a social-ecological system. This cycle, referred to as Resilience Alliance by Holling and Gunderson (2002) has been discussed and explained further by Walker et al. (2004), Walker and Salt (2006), Folke et al. (2010) and Pisano (2012). Figure 1 depicts the four phases of the adaptive cycle. The four phases represent four growth stages through which a social-ecological system that is adapting to changing external conditions would go. This feature of RT requires a normal movement from the r-phase to the K-phase, to the Ω-phase and to the α-phase, after which the cycle would commence again. Some movements result in high adaptability of the system whilst others result in low adaptability. This is dependent on the strategy that is adopted. K-negative feedback strategy, which depicts a systemic movement from the r-phase to the K-phase is advocated for attaining increased resilience and capability (Holling and Gunderson, 2002). This movement is preferred to a movement from the conservation to the release phase which results in low resilience and loss of accumulated resources. Movement of a social-ecological system from one phase to the other depends on certain situations. For the construction industry to adapt to the K-negative feedback movement while resisting movement into the release phase, a typical situation such as loss of built environment professionals and other human resources within a construction organization for the purpose of establishing their own firms should be avoided. Also, diversification of capital of construction organizations into other business ventures could be another resilience-weakening situation that should be guarded against. However, these need to be empirically verified in the CI.
Figure 1 The Adaptive Cycle Source: Pisano (2012) and Walker and Salt (2006)
196

2.2 Adaptive Capacity of the construction industry
Adaptive capacity is a key theme in resilience thinking (Pisano, 2012). It is “the capacity of actors in a system to influence resilience” (Pisano, 2012:20; Walker at al., 2004:2). Possessing adaptive capacity, a system such as the construction industry, should have the “ability to reconfigure itself with minimum loss of function” (Gonsalves and Mohan, 2012: 343). As the environment in developing countries changes due to rapid urbanization, the construction industry as a social-ecological system, should possess the required adaptability that will enable it to deal with such changes through integrated actions of observation, learning and altering interactions (Folke et al., 2004; Gunderson and Holling, 2002). Thus, construction organizations, as actors within a social-ecological system, should be able to develop the capacity and attain resilience in a manner that will lead to effective adjustment to the demands of ESC. Construction organizations should be able to observe and learn about changes within the construction industry, both local and international, in order to be able to alter practices towards meeting changing demands, especially the ones emanating from the concept of sustainable development. A social-ecological system should possess adaptability to demonstrate resilience. Networking with other similar construction organizations to learn and store knowledge and experience could be an effective way for construction organizations in developing countries to gain adaptability for creation of a resilient CI. This is very important since the knowledge of even some large construction organizations in the GCI, with regards to ESC practices and SD requirements, has been found to be low (Mensah et al., 2015)
3. Ecological Modernization Theory (EMT) Conceptualization of ESC Much academic research works on the application of EMT, especially with regards to sustainability of the ecology, has been carried out (see Lockie et al., 2013; Spaargaren et al., 2009; Young, 2001; Mol and Sonnenfeld, 2000). However, little has been done with respect to its application in the CI in developing countries. According to Rosa (2003:273), EMT theorizes that “continued industrial development, rather than inevitably continuing to degrade the environment, offers the best option for escaping from the global ecological challenge”. Another proposition of EMT is that, to ensure efficiency in resource usage, ‘ecological rationality’ percolating all aspects on society is required (York et al., 2010; Mol, 2001). Ecological rationality involves matching the structure of bounded rational decision mechanisms to the structure of information in the ecology (see Gigerenzer and Todd, 1999). The objective here is to ensure that the best decision that will favour the ecology should always be acted on by society.In this paper, emphasis is placed on the three approaches EMT focuses on. The first approach is that modern societies themselves possess reflexivity which drive them to use processes to achieve environmental sustainability. The second aspect focuses much more on environmental approaches at the micro level to solve environmental problems rather than emphasizing on macro theories that offer economy-wide process solutions. Micro level solutions focus on using the dynamics of small-scale interactions that happens at the individual and organizational level rather than large-scale social-ecological processes that happens at the national or international economy-wide level. Thirdly, EMT argues that modern societies that are affluent, especially heavily industrialized societies, can achieve sustainability as there is evidence of such trends across the world (York et al., 2010; Mol, 2001; Mol and Spaargaren, 2000). Among Chinese manufacturers, Green Supply Chain Management (GSCM) has been indicated as an emergent ecological modernization tool (Zhu et al., 2011). More investigations into the ability of ESC to foster environmental performance among construction organizations in developing countries is crucial to the achievement of ecological rationality. To balance environmental performance with productivity and business performance gains, construction organizations within the context of a developing countries like Ghana may have to fall on improving capacity and using modern methods, as per international standards, to be able to match up with the competitive environment (Laryea, 2010). To this end, advancing knowledge and building capacity through the application of EMT is critical to construction organizations adaptation to ESC.
3.1 Potential EMT challenges in the CI
In spite of EMT’s ability to advance knowledge towards achievement of ecological rationality, York and Rosa (2003) raise some relevant challenges that face EMT, which are worth examining. Significant among the challenges raised is whether every organization necessarily modifies to deal with environmental problems. They found out that the challenge has not been well addressed. This study seeks to investigate purpose of construction organization’s modification of existing practices. Another key challenge revealed by York and Rosa (2003) is that EMT should go beyond the mere introduction of efficient forms. They argue that the rate of efficiency introduced within organizations should exceed the overall level of production to ensure sustainability. The challenges identified in their study emerged out of macro level observation of institutions. However, it is also necessary to investigate at the micro level, as advocated by York et al. (2010). It is required to verify whether construction organizations in GCI modify in order to increase the rate of efficiency. How these modifications occur or how and why they do not occur also requires interrogation in the developing world context.
3.2 Similarity between RT and EMT
RT and EMT converge at a point where a system’s increased ability to overcome environmental challenges becomes dependent on conservation of economic resources. The adaptive cycle of RT indicates that increased resilience to adapt to changing conditions of a social-ecological system is obtainable by means of increasing and conserving resources. This ability to conserve resources is typical of highly industrialized and modernized societies, which are also tagged by EMT as having the ability to achieve prudent environmental
197

management. It is such a hybridization of RT and EMT that is employed in this study to foster understanding of the ramifications surrounding construction organizations’ adaptation to ESC in the developing world context.
4. Research methods
The theoretical reviews formed basis of the issues to be empirically investigated. The purpose was to promote understanding of the issues underlying adaptation to ESC in the construction industry in a developing country context through in depth investigation. Also, data on why unsustainable practices are still prevailing in the construction industry were collected. The strategy used to gather and analyse data was exclusively qualitative. This was to allow deeper investigations into the characteristics of the phenomenon under investigation and also facilitate usage of the theories for advancing knowledge in ESC as aimed in this study. Through the qualitative strategy, a platform that enabled respondents to provide in-depth discussions, was provided (Creswell, 2013). Using purposive sampling, a selection criteria was developed to select the organizations. This sampling approach was carried out in order to avoid the situation where a selected respondent would not be able to speak to the issues bordering on the characteristics of the phenomenon under study (Tansey, 2007). The criteria related to: the Ghana government’s financial classification for construction organizations (D1/K11 class used in this study); use of heavy construction equipment that have tendencies of emitting Green House Gases (GHG); and presence of a designated qualified built environment professional who would be the interviewee. Moreover construction activity in progress during the time of interview, to allow for visual observation of construction practices, and the presence of an organizational structure to enhance effective assessment of organizational adaptability, were part of the criteria. An in-depth face-to-face semi-structured interview was conducted with BE professionals within the organizations that met 100% of the set criteria. Before and during the interview, participants were assured of confidentiality via letters seeking appointment for the interview. This ethical step allowed participants’ openness and willingness to permit audio recordings, which were transcribed verbatim during the analysis. With the use of open-ended questions in an interview guide, data was received from 20 construction organizations. Analysis of the qualitative data obtained from the interview was carried out by means of data matrices and template analysis techniques (King, 2012; King, 2004; Nadin and Cassell, 2004). The template analysis is particularly employed due to its allowance for the use of both theory driven codes set a priori and data-driven codes obtained after further coding and categorization typically performed in a qualitative data analysis (Naoum, 2012; King, 2004).
5. Findings and discussion
All of the twenty construction organizations that participated in the study had construction activities in progress during the time of interview. This paved way for observation of some of the construction practices to help gain better understanding and interpretation of the qualitative data obtained from the interviews.
Table 1 Thematic template analysis revised template
CATEGORIES
(Higher order codes)
THEORY-DRIVEN AND DATA DRIVEN CODES
(Lower order codes)
Organizational ESC
Adaptability
Adaptability growth stage –RT Growth factor – RT Growth Enabler – RT
ESC knowledge and
practices
Environmental damage recovery mechanisms – EMT SC modern technologies – EMT ESC learning means – RT Social networks utilization – DD
ESC empirical barriers Organizational flexibility – RT
Ecological efficiency of modern technology – EMT Locally existing construction technology sufficiency – EMT External pressure barriers – DD Local peculiar ecological barriers – EMT Local peculiar social barriers – DD Local peculiar economic barriers – EMT
Organizational ESC
enablers
Environmental disturbance prevention construction methods – EMT Environmental restoration construction methods – EMT Ability to introduce specific changes to unsustainable practices – RT Individual skills utilization to minimize environmental challenges – DD Overall organizational capacity enhancement – RT Modifying existing practices purposefully to minimize environmental
1The highest financial classification given to a building and civil engineering construction organization by the Ministry of Water Resources Works and Housing of the Republic of Ghana.
198

challenges – EMT Ability to maximize business profit while practicing ESC – RT Improving rate of efficiency through ESC – EMT
Organizational ESC
drivers
Specific organizational ESC driver – DD Environmental resource conservation, regeneration and usage
efficiency technology driver – EMT Organizational Networking influencer – DD Benchmarking organizational best practices – RT Governmental role – DD Market or client situations /conditions – DD
LEGEND [- RT = code relates Resilience Theory; - EMT = code relates Ecological Modernization Theory; - DD = code is Data-Driven]
The data matrix analysis technique was used to organize the large qualitative data, according to themes set a priori. This enabled better overview paving way for subsequent coding and categorization. Triangulating with the template analysis, subsequent analysis (coding and categorization) was performed. This yielded the revised template labelled as Table 1. It is the final template and contains both theory-driven and data-driven codes.
5.1 ESC adaptability of construction organizations
Out of the twenty construction organizations that participated in the study, thirteen described their organizations as exploiters of the construction business. Attributions to this claim relate to the relatively shorter period of existence and the situation of low jobs ascribed to poor economic conditions. Some of these organizations indicated that workers are normally laid off in view of low or diminishing construction jobs acquisition trend. Some of the organizations indicated that they see their organizations as having large conserved resources due to longer period of regular and heavy construction activities. These descriptions of the organizations are an indication of the stages of the adaptive cycle they belong to; the former being at the r-phase (exploitation stage) and the latter description indicating a conservation stage. Considering the RT postulations, the K negative feedback strategy of the adaptive cycle needs to be adopted by most of these organizations to ensure movement into the conservation stage where resilience would be high to be able to adapt to ESC (Holling and Gunderson, 2002). Analysis of the data revealed three main growth enablers; general economic improvement, investment into new or modern technological and human resources and continuous delivery of quality jobs to the satisfaction of clients. Realizing the need to invest in resources agrees with the adaptive capacity concept, which calls for increased or conserved resources as a means of gaining resilience in order to meet the demands of sustainable construction. The reliance on economic well-being for growth indicates existence of less or lack of internal organizational controls required to propel movement into high adaptability state. While this is a demonstration of weaker strategy, it is also a revelation of an aspect of the EMT; highly modernized societies having the ability to realize ecological rationality (York et al., 2010). Here, the poor economic conditions that characterize developing countries have been revealed as a challenge to achieving ESC. Nonetheless, other organizations posited that delivery of quality jobs to the satisfaction of clients would enable them have more jobs, increase resources and consequently obtain higher capability to deal sufficiently with environmental challenges amidst the economic challenges characteristic of the developing world. This finding seem to raise some challenges to an aspect of the EMT that favours highly modernized societies in terms of achieving environmental sustainability.
5.2 ESC knowledge and practices of construction organizations
For an organization to practice ESC effectively, means of minimizing environmental challenges, applying sustainable construction (SC) modern mechanisms, continuously learning about ESC changing practices and engaging in useful networking among relevant organizations could foster improvement in ESC knowledge and practices. All participants were of the view that construction activities cannot be carried out without some form of damage to the environment and therefore effective means of minimizing these challenges have to be adopted. However, from the analysis, knowledge of modern technologies required to deal with some of these environmental challenges in construction activities mostly centred on advocating for the use of other types of formworks to replace excessive use of timber formwork in the construction industry. The irony is that while there is a general acknowledgement that some of these newer technologies are useful in practicing ESC, field observations confirmed that most of the organizations were still using the traditional timber formworks extensively. Low or lack of capital resources to invest into more modern formworks such as geo-panels, metal and reinforced fibre glass, was cited as the main challenge. This emphasizes the presence of low-resilient state of most of the construction organizations. Being in a social network and continuously learning about ESC practices at the organizational level came out strongly as a means of improving knowledge and experience in ESC practices. Some of the organizations indicated that they form part of a network of construction organizations internationally, where there is
199

periodic engagement in sustainability issues in the construction industry for purpose of improving daily construction practices. A common trait that was realized among these organizations was their foreign roots2. The absence of a construction organization being in a social network as a common characteristic among majority of the organizations raises the issue of lack of collaborative working. The competitive nature of job seeking in the construction industry was cited among the reasons leading to the inability of construction organizations in the country to be in a working social network. Meanwhile, Tan et al. (2011) have found sustainability performance as an important feature for improving organizational competitiveness. The fear of becoming less competitive was realized as a challenge against construction organizations learning about ESC practices through social networks. This ‘fear-of-becoming-less-competitive’ can be seen as an essential feature that calls for the need to intensify awareness creation about sustainability benefits to the CI.
5.3 Barriers to ESC in construction organizations
Other studies on barriers to the practice of sustainable construction have been carried out (see for instance Adegbite et al., 2012; Fonseca, 2010; European Network of Construction Companies for Research and Development, ENCORD, 2010). Barriers identified by the authors include: corporate and individual indifference to environmental issues; Lack of knowledge about sustainability issues in businesses; and lack of effective planning to reduce electricity and fuel usage towards carbon emission reduction. However, empirically determining these barriers in the context of developing country’s construction industry seems to be lacking. From the analysis, four issues emerged as barriers to ESC in developing countries: organizational flexibility; ecological efficiency of modern technologies available; adequacy of locally existing construction technologies; and ecological challenges peculiar to developing countries. Table 1 indicates the relation between these findings and RT and EMT, and brings to bear the role of these theories in understanding the barriers to realization of sustainability in the CI. To overcome these barriers, flexibility of a system or the actors within to learn and adapt to new ways of doing things is required, as posited by the RT. It was realized that lack of flexibility would not be a challenge in a situation where the need for modification towards ESC practices becomes legally necessary. On the other hand, doubts about organization’s flexibility to allow sustainability-oriented modification to existing unsustainable practices were expressed. It was confirmed that modifications in organizational construction practices that had taken place over the years were not intended to overcome environmental challenges. While EMT theorizes that reflexivity of modern societies encourages ecological rationality, this did not come out clearly from the analysis. One of the participants summarized this posture of stakeholders in the developing world context: “…in Ghana where we have virtually the same weather throughout the year and a lot of greens, we tend to think that because of all these things we have they cannot be extinct. We have been taking a lot of things for granted and now we have realized they are getting extinct.” With urbanization taking place at a greater speed in developing countries and its associated industrialization, as noted by Du Plessis (2014), the EMT postulations would have made one expect a corresponding increase in ability to deal with the emerging environmental challenges. The findings from this study indicate otherwise
5.4 Enablers of ESC
ESC enablers are conditions that enhance effective adaptation to ESC practices. It was recognized that an organization’s ability to enhance capacity and resources is an essential quality for improving upon its adaptive capacity. Capacity building, particularly, training of human resources in sustainable technologies, was recognized as necessary for improving upon a construction organization’s ability to practice ESC. Thus, a mere increment in the human and plant resources cannot be regarded as adequate, as portrayed in the adaptive cycle of RT; intensive awareness creation, education and training are also essential. A business organization mostly aims at profit maximization (Bowen, 2013). However, this should not be pursued at the expense of the society and the natural resources it depends on. Bowen (2013) indicates that corporate Social Responsibility (CSR) has been repurposed as an instrument for profit maximization. Nonetheless some organizations disregard this responsibility. Traces of such quality was found in the statement of one of the respondents: “Modifying our practices was for decreasing cost and to increase profit. If we will get profit and the extent of damage to the environment is minimal we will go ahead and do it.”
With the manifestation of such tendencies, the adaptive capacity of a construction organization becomes weaker.
5.5 Drivers of ESC
Analysis of the data revealed factors necessary for driving ESC among construction organizations in developing countries, even after an enabling situation is created. ESC drivers that came out relate to: Governmental roles, client and market situations, intra organizational drivers, technological drivers, networking and benchmarking. Considering the postulations of RT, the participating construction organizations should be able to adapt to the trend of networking among themselves (see for instance ENCORD, 2010) without losing the essential
2 The presence of all or one of the owners of a locally established construction organization being a non-national (particularly from a developed country)
200

quality of competitiveness. The need for Governmental roles regarding formulation of policies and regulations to institute and guide the practicing of ESC by construction organizations came out strongly in the analysis. It is important to note that introduction of such ESC practices should not result in falling out of businesses from the construction industry or, resistance to new entrants. Rather, standardized practicing of ESC should be facilitated. Participants recognized this and emphasized on the importance of governmental role in creating favourable economic conditions for the importation and usage of sustainable technologies to drive ESC. Thus, technological ESC driver emerged as necessary for a construction organization’s prudent ecological management. This is an essential feature of EMT.
6. Conclusion and further research
The adaptive capacity of the RT calls for the need to have negative feedback strategy, which refers to movement into the K-phase where resilience is high. The situation observed among the construction organizations show the need for application of this strategy to ensure an improvement in the adaptability of the organizations. EMT puts emphasis on the higher ability of modernized society to achieve ecological rationality in view of reflexivity of such a society. A hybridized view of these two organizational theories have shed light on the ramifications surrounding practicing of ESC by construction organizations in developing countries. A template analysis of data obtained through a semi-structured face-to-face in-depth interview of BE professionals in purposively selected construction organizations has added to how RT and EMT interplays in fostering ESC in developing countries. The analysis revealed adaptability, knowledge and practices, barriers, enablers and drivers of construction organizations’ ESC. Most of the organizations are relying on economic well-being as an enabling condition for achieving ability to adapt to ESC. Thus, less or lack of internal organizational control required for movement into high adaptability state exists. This is a revelation of an aspect of the EMT which indicates that highly modernized societies have the ability to realize ecological rationality (York et al., 2010). It has also emerged that to attain higher capability to deal sufficiently with environmental challenges amidst economic challenges, construction organizations need to deliver quality jobs to the satisfaction of clients and also win the confidence of available market. The organizations have knowledge of some sustainable construction technologies but are not practicing them in view of economic challenges, lack of governmental support and inability to learn through social networks. There is the view that social attitude could play a role in the inability of the construction organizations to adapt to measures needed for effective ecological management. Some construction organizations have been found to prioritize profit maximization over ecological management. Thus, high awareness creation about the long term benefits of sustainability practices is critical to the achievement of sustainable development goals in the construction industry. Flexibility in modifying conventional construction practices to meet sustainable development demands is recognized as an essential quality to be exhibited by the construction organizations. Apparently, management body of a construction organization would have to embrace professional advice that promotes organizational flexibility in order to smoothen the path towards adapting to ESC. Governmental involvement, in terms of instituting and monitoring sustainability policies and regulations has also been found to be a critical ESC enabler. Collaboration with government initiated by construction organizations, would be required to awaken the support of governments in developing countries towards improving the adaptive capacity of construction organizations. Achieving resilience for effective adaptive capacity of the organizations as well as utilizing available technologies that come along with modernized societies has been found to be very crucial to achieving ecological rationality in developing countries. However, further research to explain the function of social networks and collaborative working attitudes in fostering sustainability practices in the construction industry in developing countries has become evident.
7. References
Adegbite, A. A., Amiolemen, S O., Ologeh, I. O. and Oyefug, I. O. 2012. Sustainable Development Policy and Corporate Social Responsibility in Business Organisations in Nigeria, Journal of Sustainable Development; Vol. 5, No. 6; 83 – 89 Bon, R., & Hutchinson, K. 2000. Sustainable construction: some economic challenges. Building Research & Information, 28(5-6), 310-314. Borland, H. (2009) "Conceptualising global strategic sustainability and corporate transformational change", International Marketing Review, Vol. 26 Iss: 4/5, pp.554 – 572 Bowen, H. R. 2013. Social responsibilities of the businessman. University of Iowa Press. Cabezas, H., and Fath, B. D. 2002. Towards a theory of sustainable systems. Fluid Phase Equilibria, 194, 3-14. Carpenter, S.R., Walker, B.H., Anderies J.M. and Abel. N. 2001. From metaphor to measurement: resilience of what to what? Ecosystems 4, pp.765–781 Chapin, F. S., Torn, M. S. and Tateno, M. (1996, December). Principles of ecosystem sustainability. The American Naturalist 148(6): 1016-1037 Creswell, J. W. 2013. Research design: Qualitative, quantitative, and mixed methods approaches. Sage.
201

Du Plessis, C. 2014. Adapting the built environment to climate change in a post-sustainable world In: Laryea, S. and Ibem, E. (Eds.) Proceedings 8th Construction Industry Development Board (cidb) Postgraduate Conference, 10-11 February 2014, University of the Witwatersrand, Johannesburg, South Africa, 51-54 Du Plessis, C 2007. A strategic framework for sustainable construction in developing countries, Construction Management and Economics (January 2007) 25, 67-76 ENCORD, European Network of Construction Companies for Research and Development 2010. Construction CO2 Measurement protocol (First Issue Rev. K.) ENCORD Folke, C., Carpenter, S. R., Walker, B., Scheffer, M., Chapin, T., & Rockström, J. 2010. Resilience thinking: integrating resilience, adaptability and transformability. Ecology and Society, 15(4), 20. Folke, C. 2006. Resilience: The emergence of a perspective for social–ecological systems analyses. Global environmental change, 16(3), 253-267. Folke, C., Carpenter, S., Walker, B., Scheffer, M., Elmqvist, T., Gunderson, L., & Holling, C. S. 2004. Regime shifts, resilience, and biodiversity in ecosystem management. Annual Review of Ecology, Evolution, and Systematics, 557-581. Folke, C., Carpenter, S., Elmqvist, T., Gunderson, L., Holling, C. S., & Walker, B. 2002. Resilience and sustainable development: building adaptive capacity in a world of transformations. AMBIO: A journal of the human environment, 31(5), 437 440. Fonseca, A. 2010. Barriers to strengthening the Global Reporting Initiative (GRI) Framework: an exploration of the perceptions of consultants, practitioners, and researchers, CSIN Conference, 02.Mar.10 (available online at: http://www.csin rcid.ca/downloads/csin_conf_alberto_fonseca.pdf, accessed: 07th April, 2014) Gigerenzer, G., & Todd, P. M. (1999). Fast and frugal heuristics: The adaptive toolbox. In Simple heuristics that make us smart (pp. 3-34). Oxford University Press. Gonsalves, J., & Mohan, P. (Eds.). 2012. Strengthening Resilience in Post-disaster Situations: Stories, Experience and Lessons from South Asia. International Development Research Center (IDRC). Gunderson, L. H., and Holling C. S. 2002. Panarchy: understanding transformations in human and natural systems. Island Press, Washington, D.C., USA. Hill, R. C., & Bowen, P. A. 1997. Sustainable construction: principles and a framework for attainment. Construction Management & Economics, 15(3), 223-239. Holling, C. S. 1973. Resilience and Stability of Ecological Systems, Annu. Rev. Ecol. Sys., 4: 1 - 23 Holling, C. S., and Gunderson, L. H. 2002. Resilience and adaptive cycles. Panarchy: Understanding transformations in human and natural systems, 25-62. Kaygusuz, K. 2012. Energy for sustainable development: A case of developing countries. Renewable and Sustainable Energy Reviews, 16(2), 1116-1126. King, N. 2012. Doing template analysis. Qualitative organizational research: Core methods and current challenges, In: Symon, G and Cassell, C, Sage, UK. King, N. 2004 Using Templates in the Thematic Analysis of Text, In: Cassell C, and Symon, G., 2004, Essential guide to qualitative methods in organizational research, Sage, London. Laryea, S. 2010. Challenges and opportunities facing contractors in Ghana. West Africa Built Environment Research (WABER) Conference, 27th -28th July 2010, Accra, Ghana. 215 – 226 Lockie, S., Sonnenfeld, D. A. and Fisher, D. R. (eds) 2013. The Routledge International Handbook of Social and Environmental Change, London and New York: Routledge Mensah, S., Ayarkwa, J. and Nani, G. 2015. Understanding Environmental Sustainable Construction Practices of Construction Contractors in Ghana, In: Badu E. Ayarkwa J. Ahadzie D. Adinyira E. Owusu- Manu, D. Kwofie T. 4th International Conference On Infrastructure Development In Africa March 25 – 26, 2015, pp: 329 – 340. Mensah, S and Ameyaw, C. 2012. Sustainable procurement: the challenges of practice in the Ghanaian construction industry In: Laryea, S., Agyepong, S.A., Leiringer, R. and Hughes, W. (Eds) Procs 4th West Africa Built Environment Research (WABER) Conference, 24-26 July 2012, Abuja, Nigeria, 871-880 MOFEP (2011). National Policy on Public Private Partnership (PPP). Private Participation in the Infrastructure and Services for Better Service Delivery. Note No. 4, PPIAF. Mol, A. P. J. 2001. Globalization and environmental Reform, Cambridge, MA: MIT Press Mol, A. P. J. and Sonnenfeld, D. A. 2000. Ecological modernization around the world: An introduction; In Mol A. P. J. and Sonnenfeld D. A. (eds), Ecological modernization around the world: Perspective and critical debates, London. Frank Cass, pp. 3 – 14. Mol A. P. J. and Spaargaren, G. 2000. Ecological Modernisation Theory in Debate: A Reply, Society in Natural Resources, 17 pp. 261 - 265 Nadin, S and Cassell, C. 2004. Using Data Matrices, In: Cassell C, and Symon, G., 2004, Essential guide to qualitative methods in organizational research, London, Sage
202

Naoum, S. (2012) Dissertation Research and Writing for Construction Students, Taylor and Francis, Hoboken, ISBN: 9780080467047 Ofori, G. 1998. Sustainable construction: principles and a framework for attainment comment. Construction Management & Economics, 16(2), 141-145. Ospina, A V, Bueti, C, Dikerson, K and Faulkner, D. 2012. ICTs and Climate Change adaptation and mitigation, the case of Ghana, available at: www.itu.int/itu-t/climatechange; accessed on: 27-12-13 Pisano, U. 2012. Resilience and sustainable development. Theory of resilience, systems thinking and adaptive governance. European Sustainable Development Network (ESDN) Quarterly Report, September, 2012. Reid, D. D. A. 2011. Environment & Sustainable Development. Available at SSRN 1981400. Sarkis, J., Zhu, Q., and Lai, K. H. 2011. An organizational theoretic review of green supply chain management literature. International Journal of Production Economics, 130(1), 1-15. Spaargaren, G., Mol, A. P. J. and Sonnenfeld, D. A. (eds.) 2009. The Ecological Modernization Reader, Environmental Reform in Theory and Practice, London, Routledge Tan, Y., Shen, L., & Yao, H. 2011. Sustainable construction practice and contractors’ competitiveness: A preliminary study. Habitat International, 35(2), 225-230 Tansey, O. 2007. Process tracing and elite interviewing: a case for non-probability sampling. PS: Political Science & Politics, 40(04), 765-772 Walker, B. and Salt, D. 2006. Resilience thinking: sustaining ecosystems and people in a changing world. Washington: Island Press. Walker, B., Hollings C. S., Carpenter, R. S. and Kingzin, A. 2004. Resilience, Adaptability and Transformability in Social-Ecological Systems, Ecology and Society, 9(2), 5 Wong, P. S. P., Thomas Ng, S. T. and Shahidi, M. 2013. Towards understanding the contractor’s response to carbon reduction policies in the construction projects, International Journal of Project Management, 31(2013) 1042 – 1056 York, R. and Rosa, E. A. 2003. Key challenges to ecological modernization theory, Organization & Environment; Sep 2003; 16, 3; ABI/INFORM Global, pp. 273 - 88 York, R., Rosa, E. A., and Dietz, T. 2010. Ecological modernization theory: theoretical and empirical challenges. The international handbook of environmental sociology, 77-90. Young, S. (ed.) 2001. The Emergence of Ecological Modernization, London, Routledge Zhu, Q., Geng, Y., Sarkis, J., and Lai, K. H. 2011. Evaluating green supply chain management among Chinese manufacturers from the ecological modernization perspective, Transportation Research Part E: Logistics and Transportation Review, 47(6), 808 - 821
203

204

DATA QUALIFICATIONS AND DATA AVAILABILITY FOR RESOURCE FLOW ANALYSIS IN
SUPPORT OF URBAN PLANNING: AMSTERDAM’S ENERGY METABOLISM
Ilse M. VOSKAMP 1, 2
Sven STREMKE 1, 3
Marc SPILLER 2 Adri VAN DEN BRINK 1
Huub H.M. RIJNAARTS 2, 3 1 Landscape Architecture Chair Group, Wageningen University and Research Centre, Email:
[email protected] 2 Sub-department of Environmental Technology, Wageningen University and Research Centre 3 Amsterdam Institute for Advanced Metropolitan Solutions (AMS) Keywords: data quality, Material Flow Analysis (MFA), resource flow dynamics, urban metabolism, urban planning
Abstract
Sustainable urban resource management gains importance due to ongoing urbanization. Cities increasingly show commitment to reduce their environmental pressure. Amsterdam, for instance, has the ambition to generate twenty percent more renewable energy per capita in 2020 than in 2013. To reach Amsterdam’s sustainability objectives, a detailed understanding of the city’s resource flows is required. At what level temporal and spatial resolution should resource flows be analysed to support urban managers in choosing planning interventions, what is the availability of data needed for such analyses and is there a gap between data needed and data available? This research addresses abovementioned question from an Urban Metabolism (UM) and Material Flow Analysis (MFA) perspective, with particular focus on planning and design practice. A case study on the energy objectives of Amsterdam is presented, which is threefold. Firstly, the energy targets of the City of Amsterdam were translated into data needs. Secondly, the status quo of data availability was assessed. Thirdly, data gaps were identified. Results show that two types of data needs can be distinguished: 1) data required for assessment (benchmarking) of the objectives, strategies and corresponding indicators, and 2) data required to inform the interventions that put the strategies into practice. Detailed knowledge of space-time dynamics, up to hourly data on building block level, showed to be essential to inform interventions that relate to the coupling of supply and demand and the sourcing of secondary resources. For Amsterdam, limited monitoring data is available. Especially data with a high temporal resolution is lacking.
1. Introduction
Sustainable urban resource management gains importance due to ongoing urbanization. Globally, urban areas accommodate more than half of the world’s population and they are estimated to be responsible for 70% of the current pollution and resource depletion (Rees and Wackernagel, 2008). Growth of urban resource demands will not only accelerate resource depletion, but it will also add to direct and indirect environmental impacts associated to resource extraction and use (Agudelo-Vera et al., 2011). Many city authorities are dedicated to reduce the environmental pressure of their cities. For example the Aalborg Charter, signed by over 2700 European local authorities from more than forty countries, declares that the associated cities and towns shall move towards sustainability (European Commission, 1994). Likewise, the global C40 Cities network, to which seventy cities are affiliated, aims to collectively take measures to mitigate climate change. The network constitutes of megacities and so-called innovator cities, which are leaders in the field of taking climate change mitigation and adaptation measures and environmental sustainability (C40Cities, 2015). One of the cities that have shown willingly to reduce its environmental pressure is Amsterdam. The city signed the Aalborg Charter, represents a C40 innovator city and has formulated ambitious objectives and related transition pathways in becoming a more sustainable city (City of Amsterdam, 2014a; City of Amsterdam, 2014b). For energy the targets are to generate twenty percent more renewable energy per capita in 2020 than in 2013, whilst decreasing energy consumption per capita by twenty percent. In terms of waste management, Amsterdam aims for an increase in municipal solid waste separation from 19% (2013) to 65% in 2020. To inform the strategies formulated to reach the city’s sustainability objectives, a detailed understanding of the city’s resource flows is required. This raises one main research question: At what level temporal and spatial resolution should resource flows exactly be analysed to support urban managers in choosing interventions to put the city’s sustainability agenda in place, what is the availability of data needed for such analyses and is there a gap between data needed and data available? The objective of this paper is
205
to respond to the question above, by means of a case study on the energy objectives of the City of Amsterdam from an Urban Metabolism (UM) and Material Flow Analysis (MFA) perspective, and considering planning and design practices.
2. Urban Metabolism and Material Flow Analysis
The notion of urban metabolism (UM) is increasingly used to analyse resource flows in cities and to develop sustainable urban resource management concepts and practices (Kennedy et al. 2011). It fuelled the idea that urban areas should become more self-sufficient and resource demands of cities should not exceed the carrying capacity of their hinterlands. This advocates a shift from the current linear metabolism of cities -using inputs only once- to a circular metabolism that incorporates recycling of resources (Castán Broto et al. 2012). While UM is being used by a range of disciplines (Castán Broto et al., 2012), most research originates from urban ecology, industrial ecology and related disciplines (Barles, 2010). Urban ecologists laid the theoretical base of UM, with Wolman (1965) being the first to characterize the city as an ecosystem (Barles 2010; Castán Broto et al. 2012). Wolman used the term metabolism to describe how cities process the “materials and commodities needed to sustain the city’s inhabitants” (Wolman, 1965), whereas other urban ecologists used UM as a metaphor for the city as an organism (e.g. Odum 1989) (Barles, 2010; Castán Broto et al., 2012). From these process analytical studies of urban metabolic processes (Zhang 2013), a quantitative approach developed primarily within the discipline of industrial ecology (Castán Broto et al., 2012). This discipline commonly defines UM as “the sum total of the technical and socio-economic processes that occur in cities, resulting in growth, production of energy, and elimination of waste” (Kennedy et al. 2007). Related research encompasses mainly empirical studies that quantify resource flows to disclose how a particular city functions at a specific moment in time (Kennedy et al., 2011). A variety of accounting and assessment methods have been used for these studies, including Material Flow Analysis, Energy Flow Analysis, and ecological footprint assessment (Barles, 2010; Zhang, 2013). Material Flow Analysis (MFA) is extensively used for quantitative assessment of urban metabolism (Castán Broto et al., 2012; Zhang, 2013). MFAs allow to systematically assess the inputs and outputs of selected resources of a predetermined system as well as the flows and stocks within the boundaries of that system. Although MFA is often referred to as if it is a specific methodology for UM research, it should be considered rather a procedure for systematic assessment than a detailed method. That is, MFA theory does not prescribe how to determine system boundaries, nor what flows to and stocks to consider. Consequently, MFA studies range from analyses of particular elements (like phosphorous) to comprehensive analyses of the UM (Kennedy et al. 2011). In particular studies that provide a comprehensive analysis of the UM are of importance to inform sustainable urban resource management, planning and design practices. Only with a systematic assessment of all resource flows and stocks of an urban system, resource management practices can be developed that consider the interconnectedness between different resource flows, like the energy-water-food nexus (Villarroel Walker et al., 2014). The complete and integrated picture of a city’s resource flows that such MFAs provide can be used to “identify environmental problems and to design more efficient urban planning policies” (Castán Broto et al., 2012).
2.1 Urban metabolism research for urban planning and design
Although it is increasingly argued that UM analyses can contribute to sustainable urban planning and design, few examples of application in practice are reported (Kennedy et al., 2011). One possible reason for this is that UM is mainly used in a technological paradigm that fails to acknowledge the interplay between society and biophysical processes influencing the actual metabolism of cities (Wachsmuth, 2012). Such a version of UM excludes socio-economic indicators (e.g. lifestyle) that are crucial for achieving sustainability (Kennedy et al. 2011). Another reason could be caused by a mismatch of the scale levels at which UM studies are performed, i.e. that of the city or regional scale, and that of urban planning and design practice (district, neighbourhood, building block) (Spiller & Agudelo-Vera, 2011). Literature on comprehensive MFAs of European cities indicates that the great majority of these studies are performed on the level of the city or metropolitan region whilst employing a method that represents the urban system as a ‘black-box’, not providing a thorough insight of resource flows needed by planners and designers (Barles, 2009; Browne et al., 2011; Hammer and Giljum, 2006; Niza et al., 2009; Rosado et al., 2014). Furthermore, MFAs do not provide information on the spatial organisation of the flows and processes they describe and the concept of time is not properly dealt with either (Moffatt & Kohler 2008). Yet, knowledge of the variability of resource provision and consumption through time and space is essential to design more self-sufficient cities. One has to consider when and where resources are available to couple supply and demand or to enable sourcing of secondary and renewable resources (Agudelo-Vera et al., 2012). Knowledge of space-time dynamics is also important because it provides insight in the interconnectedness of flows. Understanding the linkages between flows is essential when aiming to propose effective interventions, and not those that simply shift the burden of resource extraction and use from one flow to another (Kenway et al., 2011). It also supports the development of synergetic solutions that have greater potential to reduce urban environmental pressures like pollution and resource depletion (Villarroel Walker et al., 2014).
3. Research Methodology
The approach taken in this case study on data qualifications for analysis of Amsterdam’s energy metabolism comprised three elements. Firstly, the energy targets of the City of Amsterdam were translated into data needs. Secondly, the status quo of data availability was assessed. Thirdly, data gaps were identified.
206

3.1 From Energy Objectives to Data Needs
The energy objectives of the City of Amsterdam were translated into data needs using a literature review and stakeholder consultation. The stakeholders involved were the waste-to-energy company AEB Amsterdam, the City of Amsterdam (department of Urban Planning and Sustainability) and the water cycle company Waternet. Firstly, the strategies, indicators and targets that are set to realize the city’s two energy objectives were determined by a review of policy documents. Secondly, for each of the objectives the strategies were selected that require analysis of resource flows to inform implementation, as well as the planning interventions that put these strategies into practice. Because the strategies “Increase sustainability of the existing housing stock” and ”Reduce energy consumption of the commercial and social sector” are rather generic and have no specified indicators or targets, one particular measure was chosen to illustrate the data needs for those strategies. Thermal energy recovery from wastewater, a measure considered by the water utility Waternet, was selected as intervention that can contribute to reduced residential energy consumption and/or to a reduction of energy consumption by commercial and public buildings. Recovery of thermal energy from wastewater and subsequent usage as source for heating of residential and office buildings seems a promising intervention for Amsterdam to reduce energy consumption. In the Netherlands, about 23% of the gas demand is used to heat water (Frijns et al., 2013). Due to this water heating, on a yearly basis 8 GJ per house is lost via the sewer. This implies that in theory there is a potential 2.560 TJ/year can be recovered from all 320,000 households in Amsterdam (Van Der Hoek, 2012). Thirdly, we identified at what temporal and spatial resolution energy flows have to be analysed to provide the information needed to 1) evaluate if the objectives and strategies are met (benchmarking), and 2) decide upon implementation of the selected interventions. Stakeholders were interviewed and stakeholder workshops were held to find out which analyses are necessary. Finally, the stakeholder consultations were also used to determine what spatial and temporal resolution data are required to perform these analyses. Data requirements were classified on spatial and temporal resolution, using a qualitative scale. In terms of temporal resolution, this scale ranges from decades (low resolution) to seconds (high resolution), whereas the spatial scale ranges from the Netherlands (low resolution) to exact GPS coordinates.
3.2 Assessment State of the Art Data Availability
Stakeholder commitment played a crucial role in identifying and obtaining the datasets necessary to assess data availability. The transdisciplinary research approach of the larger project this research is part of provided the commitment of relevant stakeholders that enabled us to obtain the required data. Affiliations of the stakeholders involved in this project are: AEB Amsterdam, City of Amsterdam (department of Urban Planning and Sustainability), Port of Amsterdam, Waag Society- institute for art, science and technology, Wageningen University and Research Centre (sub-department of Environmental Technology; Laboratory of Geo-information Science and Remote Sensing; Landscape Architecture Group), and Waternet. The data provided by the stakeholders were analysed on their temporal and spatial resolution. Subsequently, these data were classified in terms of spatial and temporal resolution, using the same qualitative scale that was used to classify the resolution of data required.
3.3 Identifying Data Gaps
Data available could then be compared with data required on spatial and temporal resolution because data needs and data availability were classified using the same qualitative scale. Accordingly, data gaps were identified: differences between the spatial-temporal resolution of data available and the qualifications of the data that are needed to assess and benchmark the energy targets set and data needed to perform the analyses that inform the choice for interventions to put the city’s sustainability agenda in place.
4. Findings and Discussion
4.1 From Energy Objectives to Data Needs
To reach the two energy objectives that the City of Amsterdam has formulated to make the more sustainable, three strategies per objective are formulated. Both objectives and four out of the six strategies have indicators and corresponding targets. These are the following (City of Amsterdam 2014b): 1. Objective: Generate per capita in 2020 twenty percent more renewable energy than in 2013
Indicator: Yearly amount of renewable energy generation per capita (GJ/ca) Targets: 3.3 GJ/ca in 2013, 3.5 GJ in 2016, 3.7 GJ/ca in 2018 and 4.0 GJ in 2020 1.1. Strategy: Increase the amount of electricity generated from solar energy (PV)
Indicator: Installed capacity PV (MW) Targets: From 9MW in 2013, towards 25 MW in 2016, 75 MW in 2018 and 160 MW in 2020
1.2. Strategy: Increase the amount of electricity generated from wind energy Indicator: Installed capacity wind turbines (MW) Targets: From 67 MW in 2013, towards 76 MW in 2018 and 85 MW in 2020
1.3. Strategy: Increase the usage of district heating Indicator: Number of house equivalents connected to the district heating network Targets: From 62.000 in 2013, towards 70.500 in 2016, 81.000 in 2018 and 102.000 in 2020
207

2. Objective: Energy consumption per capita in 2020 is twenty percent less than in 2013 Indicator: Yearly energy consumption per capita (GJ/ca) Targets: 68 GJ/ca in 2013, 61.9 GJ/ca in 2016, 57.8 GJ/ca in 2018 and 54.4 GJ/ca in 2020. 2.1. Strategy: Increase sustainability of the existing housing stock 2.2. Strategy: Reduce energy consumption of the commercial and social sector 2.3. Strategy: Stimulate energy-neutral building
Indicator: Number of net-zero energy buildings Targets: From 0 in 2013 towards 1000 in 2018
4.1.1 Required analyses and data to benchmark objectives and strategies In order to assess all indicators (both these related to objectives and strategies), yearly analyses have to be performed. The relevant spatial scale for benchmarking the objectives and strategies is the municipal scale level, because the indicators and corresponding targets are formulated at municipal level. Yet, to inform these yearly, municipal numbers, analyses at the building level are required. This is the level at which PVs and wind turbines are installed, connections to the district heating network are made and energy-neutral buildings are realized. As such, these analyses provide the information needed to determine the total numbers for Amsterdam as a whole.
4.1.2 Required analyses and data to inform strategies To inform the strategies 1.1, 1.2 and 2.3 (i.e. where to implement PV panels, wind turbines and energy-neutral buildings) primarily data on city and climate characteristics is required, like data on land use, building protection status, roof top orientation and angle, building restrictions and distance to dwellings at building level. Conversely, assessing the options to realize strategy 1.3, 2.1 and 2.2 clearly also requires analyses of resource flows. For strategy 1.3 different assessments are required. On the one hand, an analysis of building characteristics is required to assess which houses are suitable for connection to district heating, including ownership of the building, building typology (low-rise or high rise buildings), function (residential, industrial, commercial, etc.), existing or newly built houses. Likewise an analysis on neighbourhood characteristics is needed to know if implementation of new infrastructure (i.e. the district heating network itself) is possible. Moreover, the heat demand and potential supply have to be assessed. In Amsterdam the main elements on the supply side of the district heating system are two centralized combined heat and power (CHP) plants, which are Amsterdam’s waste-to-energy plant and a gas-fired CHP-plant in Diemen, a smaller biogas turbine, several small fossil fuel based cogeneration turbines and heat storage facilities. When aiming to extend the district heating network, one needs to know whether these suppliers are able to meet the future demand. High time-space resolution data is required to get a good impression of the heat demand, considering that heat demand is seasonal and variable during the day, but also dependent on a building’s function. This means that data on hourly demand at building block level is desirable for optimal system layout. Because heat can be stored up to several days, supply data of lower temporal resolution suffices (about 72-hourly). Supplier-specific data is required because each supplier feeds the heating network within a particular geographic area of the city. In order to identify favourable locations to install heat exchangers that collect heat from the sewer network and transfer the heat from the sewer into the heating network (intervention for strategy 2.1 and 2.2), data with a high spatial and temporal resolution is of crucial importance. In particular because options to store the recovered thermal energy are limited. To enable the balancing of heat supply and demand, hourly data at neighbourhood level on quantity and temperature of the wastewater in the sewer as well as on heating demand are required.
4.2 Data Availability
4.2.1 Data to assess objectives and strategies Table 1 Locally generated energy in Amsterdam Municipality in 2012, in total and per capita
(TJ) (GJ/ca) Locally generated energy 21.040 26,6
Renewable energy 19.199 24,3
Electricity 2.501 3,1
Wind energy 560 0,7 Solar energy: PV 12 0,0 Incineration of green waste 1846 2,3 Biogas combustion 83 0,1 Heat and cold 16.698 21,2
Solar heat Unknown Unknown (Geo)thermal 288 0,4 Incineration of green waste 231 0,3 Biogas combustion 214 0,3 Biomass fuelled stoves and boilers 15.815 20,0
208

Cold extracted from surface water 150 0,2 Energy recovered from waste 1.842 2,3
Electricity from waste incineration 1.637 2,1 Heat from waste incineration 205 0,3
The recently performed comprehensive MFA of Amsterdam provides insight in data availability for evaluation of Amsterdam’s yearly renewable energy generation and consumption per capita (GJ/ca). The comprehensive analysis revealed the amount of locally generated renewable energy in Amsterdam Municipality in the year 2012 and it identified the amount of energy recovered from waste as other major category of local energy extraction within Amsterdam (shown in table 1). Note that not all categories included in the MFA are also considered in the calculation of Amsterdam’s energy targets. Although these numbers provide insight in the Amsterdam’s renewable energy generation per capita (GJ/ca), only few are based on actual measurements of energy provision. A look at the data sources behind the figures on renewable energy generation shows that only the amount of cold extracted from surface water and the amount of electricity and heat produced from biogas combustion rely on actual measurements (AEB, 2015;Nuon, 2015). Wind and solar energy figures are based on installed capacity (City of Amsterdam, 2015; Windstats, 2015), whereas numbers for geothermal energy are estimates based on licensed ATES (Aquifer Thermal Energy Storage) capacity (City of Amsterdam, 2014c). Although electricity and heat production from waste incineration is measured (AEB, 2015), the biogenic waste fraction of the incineration waste in Amsterdam is unknown. Therefore the Dutch average percentage of the biogenic fraction in incinerated waste (Agentschap NL, 2013) was taken as a value for calculations. For the heat generation by biomass fuelled stoves and boilers, no Amsterdam-specific data were available. Therefore, top-down extrapolations from national data were used, provided by the Dutch Ministry of Infrastructure and the Environment (Klimaatmonitor, 2015). Data on the sourcing of solar thermal energy by solar heat collectors are lacking entirely. So, for evaluation of Amsterdam’s yearly renewable energy generation per capita (GJ/ca) data are generally available. Yet, these data rely on calculations and estimations rather than on monitoring data of actual energy generation.
The MFA results do not show the yearly energy consumption per capita (GJ/ca). Nonetheless, these data can be derived from the restricted access data of the energy utility on Amsterdam’s yearly energy consumption (EnergieInBeeld, 2015).
4.2.2 Data to inform strategies Concerning data availability for the extension of the district heating network and the implementation of thermal energy recovery from wastewater, a distinction can be made between demand-specific and supply-specific data. In terms of demand specific data, data on energy (electricity and gas) consumption are available with a high spatial resolution, namely on building block level. Figure 1 shows these data for electricity consumption. Data with a higher temporal resolution than yearly are not available. Regarding the potential future demand for district heating in Amsterdam, a study on prospective additional connections has
209

been performed (AEB and Nuon, 2012). Based on an analysis of building and neighbourhood characteristics, it has been determined for which buildings connection to the district heating network is feasible. For supply-specific data, data qualifications of the information available are diverse. As regards to district heating, the heat flow and its temperature is monitored at different places in the district heating network, including at the heat source, at boosters and transfer stations and at (particular) consumers. Depending on the location, data is recorded every minute up to every month (Nuon, 2015). Supplier-specific, validated monthly totals of the amount of heat supplied are reported (AEB, 2015). For the implementation of thermal energy recovery from waste water, essential data on sewer characteristics are available. For the entire municipality the drains and sewers with a diameter of at least one meter, which is the minimum required width for heat recovery from wastewater to be cost-effective, are known and mapped out (City of Amsterdam, 2014c). However, measurements on quantity and composition of the wastewater flow only occurs at the wastewater treatment plant. These influent characteristics are reported on yearly basis, but wastewater temperature is not recorded (Waternet, 2014).
4.3 Data Gaps
The analysis on data gaps uncovers that only for the assessment of (the indicators of) all strategies the data available meets the data qualifications (Figure 2). The data available for assessment of the objectives as well as for informing the planning interventions of strategies 1.3, 2.1 and 2.2 is of insufficient temporal resolution, except for some data on heat supply by the district heating network. The data available to assess the objectives partially lacks the required spatial resolution (such as data on heat from biomass fuelled stoves and boilers), whereas data on heat supply by the wastewater network (for 2.1 and 2.2) is lacking entirely.
Figure 2 Comparison of data qualifications and availability for Amsterdam’s energy objectives
5. Conclusion and Further Research
The case study of the energy metabolism of Amsterdam shows that we can distinguish between two types of data needs to inform the city’s sustainability objectives: 1) data required for assessment of the actual, yearly renewable energy generation and consumption (status quo) and 2) data required to inform the interventions that put the strategies into practice (potentials). A comprehensive MFA study on the scale level of Amsterdam Municipality can provide the data needed to assess yearly renewable energy generation, whereas data on yearly energy consumption is available at the energy utility. Nonetheless, limited monitoring data is available that relies on measurements of actual yearly renewable energy production. Data qualifications to inform the strategies are highly dependent on the planning interventions envisioned. Detailed knowledge of space-time dynamics up to hourly data on building block level showed to be essential to inform interventions that relate to the coupling of supply and demand and the sourcing of secondary resources. For Amsterdam especially data with a high temporal resolution are hardly available. Accordingly much additional data of a high temporal and spatial resolution has to be obtained to perform the UM analyses that are needed to inform sustainable management, planning and design. Further research is needed that identifies and weighs different means to close the identified data gaps.
6. Acknowledgement
Present article is an outcome of the research project Urban Pulse that takes place in the context of the Amsterdam Institute for Advanced Metropolitan Solutions (AMS). In Urban Pulse academic, societal and private partners aim to acquire understanding of the flow patterns of the resource flows of the Amsterdam.
210

7. References
AEB, 2015. Monthly reporting statistics 2009-2012 AEB and Nuon, 2012. Westpoort Warmte. De realistische potentie van een stad zonder gas [Westpoort heat. The realistic potential of a city without natural gas]. Amsterdam: Westpoort Warmte B.V. Agentschap NL, 2013. Bio-energy 2012. www.rvo.nl/sites/default/files/2013/10/Statusdocument%20bio-energie%202012.pdf. Accessed June 2015 Agudelo-Vera, C.M. et al., 2012. Harvesting urban resources towards more resilient cities. Resources, Conservation and Recycling, 64, pp.3–12. Agudelo-Vera, C.M. et al., 2011. Resource management as a key factor for sustainable urban planning. Journal of environmental management, 92(10), pp.2295–303. Barles, S. 2009. Urban Metabolism of Paris and Its Region. Journal of Industrial Ecology 13(6): 898–913. Barles, S., 2010. Society, energy and materials: the contribution of urban metabolism studies to sustainable urban development issues. Journal of Environmental Planning and Management, 53(4), pp.439–455. Browne, D., B. O'Regan, and R. Moles. 2011. Material flow accounting in an Irish city-region 1992-2002. Journal of Cleaner Production 19(9-10): 967–976 C40Cities, 2015. www.c40.org. Accessed April 2015. Castán Broto, V., Allen, A. & Rapoport, E., 2012. Interdisciplinary Perspectives on Urban Metabolism. Journal of Industrial Ecology, 16(6), pp.851–861. City of Amsterdam, 2014a. De Circulaire Metropool Amsterdam 2014 - 2018 [The circular Metropolis Amsterdam 2014 - 2018], Amsterdam. City of Amsterdam, 2014b. Duurzaam Amsterdam, Agenda voor duurzame energie, schone lucht, een circulaire economie en een klimaatbestendige stad [Sustainable Amsterdam,Agenda for sustainable energy, clean air, a circulair economy and a climate-proof city], Amsterdam: City of Amsterdam. City of Amsterdam, 2014c. Energy Atlas. Amsterdam Southeast Amsterdam: City of Amsterdam, department of Urban Planning and Sustainability City of Amsterdam 2015. www.zonopdekaart.amsterdam.nl/11/de-statistieken/. Accessed June 2015. EnergieInBeeld, 2015. www.energieinbeeld.nl. Accessed July 2015 European Commission, 1994. Charter of European Cities & Towns Towards Sustainability. Available at: http://ec.europa.eu/environment/urban/pdf/aalborg_charter.pdf. Accessed April, 2015. Frijns, J., Hofman, J. & Nederlof, M., 2013. The potential of (waste)water as energy carrier. Energy Conversion and Management, 65, pp.357–363. Hammer, M. & Giljum, S. 2006. Materialflussanalysen der Regionen Hamburg, Wien und Leipzig [Material Flow Analysis of the regions of Hamburg, Vienna and Leipzig]. NEDS Working Papers #6 (08/2006). Hamburg. Van Der Hoek, J.P., 2012. Climate change mitigation by recovery of energy from the water cycle: A new challenge for water management. Water Science and Technology, 65(1), pp.135–141. Kennedy, C., Cuddihy, J. & Engel-Yan, J., 2007. The Changing Metabolism of Cities. Journal of Industrial Ecology, 11(2). Kennedy, C., Pincetl, S. & Bunje, P., 2011. The study of urban metabolism and its applications to urban planning and design. Environmental pollution, 159(8-9), pp.1965–73. Kenway, S.J. et al., 2011. The connection between water and energy in cities: A review. Water Science and Technology, 63, pp.1983–1990. Klimaatmonitor, 2015. www.klimaatmonitor.databank.nl/. Accessed June 2015 Moffatt, S. & Kohler, N., 2008. Conceptualizing the built environment as a social–ecological system. Building Research & Information, 36(3), pp.248–268. Niza, S., L. Rosado, and P. Ferrão. 2009. Urban Metabolism. Journal of Industrial Ecology 13(3): 384–405. Nuon, 2015. Personal communication with Raymond van Bulderen, business manager Nuon Heat. Hoekenrode 8, 1102 BR Amsterdam. 10 July 2015. Odum, E.P., 1989. Ecology and our endangered life-support systems, Sunderland, US: Sinauer. Rees, W. & Wackernagel, M., 2008. Urban ecological footprints: why cities cannot be sustainable – and why they are a key to sustainability. In: Marzluff, J.M., Schulenberger, E., Endlicher, W., Alberti, M., Bradley, G., Ryan, C., Simon, U, Urban Ecology: An International Perspective on the Interaction Between Humans and Nature, Springer US, pp. 537-555 Rosado, L., S. Niza, and P. Ferrão. 2014. A Material Flow Accounting Case Study of the Lisbon Metropolitan Area using the Urban Metabolism Analyst Model. Journal of Industrial Ecology 18(1): 84–101.
211

Spiller, M. & Agudelo-Vera, C.M., 2011. Mapping diversity of urban metabolic functions – a planning approach for more resilient cities. In 5th AESOP Young Academics Network Meeting 2011, 15-18 February 2011, Delft, the Netherlands. pp. 1–14. Villarroel Walker, R. et al., 2014. The energy-water-food nexus: strategic analysis of technologies for transforming the urban metabolism. Journal of environmental management, 141, pp.104–15. Wachsmuth, D., 2012. Three Ecologies: Urban Metabolism and the Society-Nature Opposition. The Sociological Quarterly, 53(4), pp.506–523. Waternet, 2014. Technisch Jaarverslag Drinkwater en Afvalwater 2013 [Technical Annual Report Drinking water and Wastewater 2013]. Amsterdam: Waternet Windstats, 2015. http://windstats.nl/turbines.php?gemeente=Amsterdam. Accessed June 2015. Wolman, A., 1965. Scientific American Magazine. The metabolism of cities, 213(3), pp.156–174. Zhang, Y., 2013. Urban metabolism: a review of research methodologies. Environmental pollution, 178, pp.463–73.
212
THE CITY-ZEN APPROACH FOR URBAN ENERGY MASTER PLANS ADDRESSING TECHNICAL OPPORTUNITIES + NON-TECHNICAL BARRIERS
Siebe BROERSMA
1
Michiel FREMOUW 1 1 Chair of Climate Design & Sustainability / Department of Architectural Engineering + Technology / Faculty
of Architecture and the Built Environment / Delft University of Technology, Email: [email protected] Keywords: Built environment, Energy Potential Mapping, Energy transition methods, Renewable energy planning, Urban energy systems
Abstract
European cities and municipalities usually have considerable goals in becoming more energy self-sufficient, but are often not on track towards their short-term (e.g. EU2020) targets. The pathways to move forward in the transition towards a sustainable built environment however are complex to outline. Cities use different and often fuzzy methods to define sustainable measures, actions and interventions. Several layers of influence can be distinguished that either allow for or obstruct sustainable interventions in the built environment. This paper describes the City-zen approach which serves to define both short and long term sustainable interventions within a broader urban Energy Master Plan; stake holder wise both from top-down and bottom-up perspectives. These layers of influence are implemented to define barriers and opportunities for interventions. The Delft method of Energy Potential Mapping (EPM) already structurally exposes the geographical-physical and technical layers into local layers of energy potentials. This technical-spatial quantification of demand, reduction potential and renewable supply forms the first analytical step of the approach.. However, other layers may affect the realisation of this technical potential on a non-technical and non-quantifiable level. Technically feasible interventions have to be assessed on barriers and opportunities on economic, social and political-legal levels and to take away barriers, strategic interventions have to be defined. To develop a full Energy Master Plan in the next steps, the future has to be envisioned in different scenarios followed by defining future targets and goals. A roadmap can finally be created combining interventions on a timeline, both on the technical and strategic level. Abbreviations: CHP: Combined Heat and Power; City-zen: City Zero (carbon) ENergy; COP: Coefficient of Performance; DHW: Domestic Hot Water; EMP: Energy Master Plan; EPM: Energy Potential Mapping; EC: European Commission; EU: European Union; EU2020: Europe 2020 strategy; FP7: EU/EC Seventh Framework Programme; LES: Leidraad Energetische Stedenbouw (Amsterdam Guide to Energetic Urban Planning); MUSIC: Mitigation in Urban Areas: Solutions for Innovative Cities; PV: Photovoltaic; REAP: Rotterdam Energy Approach & Planning; SEAP: Sustainable Energy Action Plan; SREX: Synergy between Regional Planning and Exergy; STEP-UP: Strategies Towards Energy Performance and Urban Planning; TRANSFORM: TRANSFORMation agenda for low carbon cities.
1. Introduction and background
European cities are both required and willing to speed-up the transition towards a sustainable energy system in the built environment, for reasons that can be assumed well-known. Many cities commit themselves to targets and goals such as the EU2020 targets. ‘Sustainable energy action plans’ and ‘transformation agendas’ are made to direct to the cities with technical and strategic actions towards these goals. These documents however often only address relatively short-term goals within the energy transition. Furthermore, cities generally have a limited influence on certain conditions: proposing incentives or standards for the industry, building codes etc. (Kloppenborg, 2014). Although the national level is key to address these questions, they are often heavily influenced by international developments; such as European Union (EU) processes and politics that, however, represent a level of complexity that few cities in Europe can match. In addition, city budgets are limited and manpower is often insufficient in terms of competencies, mandates and organisational support to deal with identified challenges. This means that cities and city planners can only limitedly influence the transition. City governments are however able to direct towards desired developments and facilitate processes. Long-term future goals and perspectives can be set out; subsidies can be given and pilot projects initiated to raise awareness of solutions and challenges and boost energy saving measures or energy producing technologies. The complexity of these issues does not enable a simple strategy and demands for a structured approach to define actions suitable for the city both short and long term, and acceptable to its citizen: Rogers et al. (2008) for example state that there should be a higher degree of public participation in local energy planning.
213

The EU project City-zen aims to provide methodologies and tools to cities and their citizens to realize and boost the transition towards 2020 and beyond. As part of this project, the authors are developing a theoretical framework and methodology to address the above described issues, not only for and from city planners’ point of view, but also to be of used by other stakeholders: citizens. This involves not just making technical and economic aspects accessible, but taking into account social and societal aspects as well. Furthermore, the efforts to continuously improve energy performance requirements for new buildings will have a limited impact, as the majority of buildings present in 2050 will already have been built today (assuming an average build rate of 1% per annum). Therefore, special attention will be given to refurbishment other systemic measures to improve the current building stock. The transition to a fully renewable energy system has a significant effect on the communities involved. Although there are numerous examples of successful individual renewable energy projects, there are also issues. An example of this is the mind-set towards wind turbines. In several countries, local opposition to these is significant. Neighbouring countries the Netherlands and Germany provide contrast here, as 51% of the 63.000 MW of German installed land wind power is owned by citizens (either fully owned or a partial stake in a turbine/park) (Nestle, 2014), whereas about 10-15% of the 250 MW of installed wind capacity in the Netherlands is operated by cooperatives (Wind-works, 2015), matching equally divergent public opinions on both sides of the border. Based on German and French experiences however, Jobert et al. (2007) suggest a solution to improve on acceptance can be influenced in the key areas of visual impact, ownership, information and participation, by involving the right stakeholders. A transition also involves significant investments, which in the present economic climate is not likely to originate with a single or few parties. Furthermore, even though a ‘Manhattan Project’ type of high cost transformation over a very short period of time may result in a renewable energy system with highly attuned components, a limited workforce and manufacturing capabilities make this an unlikely event for large urban areas. From an investor’s point of view therefore Wüstenhagen and Menichetti (2012) emphasise the importance of strategic choices.
2. Transition methodologies
The aim of tackling the discrepancy between urban renewable energy targets and implementation is not new. Various initiatives and methodologies with similar goals and with different levels of usability already exist. A few of them, with aspects of particular interest and suitability for integration in the City-zen framework, will be discussed next, starting with general instruments and ending with more integrated approaches. The REAP (Rotterdam Energy Approach & Planning) methodology improves on the Trias Energetica and its successor the New Stepped Strategy by including spatial scales, ranging from the individual building, through neighbourhoods and districts, to the city and beyond. This provides a basic framework that facilitates energy exchanging and cascading, and therefore implicitly includes energy networks and their opportunities. (Tillie et al, 2009) LES (Leidraad Energetische Stedenbouw, or the Amsterdam Guide to Energetic Urban Planning) builds upon the REAP methodology by additionally providing a catalogue of technical measures, tied to the local energy atlas (Dobbelsteen et al., 2011). Although REAP makes it possible to choose those interventions that are the most efficient throughout these scales and can be used to both make immediate decisions and construct a long term vision, and LES provides a catalogue of means to achieve these, they do not include the temporal scale of a transition methodology. The Covenant of Mayors is the mainstream European movement involving local and regional authorities, voluntarily committing to increasing energy efficiency and use of renewable energy sources on their territories (Covenant of Mayors, 2015). By committing, these cities aim to meet and exceed the European Union 20% CO2 reduction objective by 2020, for which Sustainable Energy Action Plans (SEAP) are made. These SEAPs range from simple documents with a few goals to more elaborated ones with specific interventions. STEP-UP is an energy and sustainable city planning programme that aims to assist cities enhance their sustainable energy action plans and integrate energy planning into their sustainable city planning (STEP-UP, 2015). The nine step methodology developed revolves around providing enhanced SEAPs, essentially producing a detailed localised manual on how to achieve EU2020 targets. As the STEP-UP defined future is relatively near (and therefore all the stakeholders known), and the EU2020 goal limited, specific interventions can be defined. A more distant timeline is not taken into account. The same applies to the European TRANSFORM project (TRANSFORM, 2015), in which a framework for Transformation Agendas was developed, for cities to improve on their existing energy policies (e.g. SEAPs). It can be seen as a small transformation cycle to check and monitor if a city is on track towards their initially set targets. It focuses on the short-term and helps to define short-term actions. The MUSIC project aims to catalyse and mainstream carbon and energy reduction in the urban context (MUSIC, 2015). MUSIC takes on the urban sustainability issue from a multi actor perspective, using a transition management approach. Strong focus is given to social sustainability and the interaction between the many different actors over the course of the transition period. This result in four types of interventions: orienting, agenda-setting, activating and reflecting. There are similarities with the TRANSFORM project, both in the cyclic nature of the interventions, ending with a recalibration phase, and the inclusion of a GIS based Decision Support Tool (DST).
214

The five-step approach (Stremke, 2012) as developed for the SREX (Synergy in regional Planning and Exergy) research project (SREX, 2011) serves to develop robust long-term energy visions for regions. A focus in this approach is that critical uncertainties are taken into account by developing long-term visions for different scenarios and abstacting the most robust interventions for an integrated vision. The successive steps and the questions behind them are: Step 1: Present conditions: How does the present region function and how can it be evaluated in comparison with other regions? Step 2: Near future developments: How will the region change in the near future? Step 3: Possible far futures: What kind of possible long-term developments are expected in the study region, and at which locations? Step 4: Developing integrated visions: How can a possible future be turned into a desired future? Step 5: Identifying spatial interventions: Which possible interventions should be implemented? In the last step, the interventions that are found in many of the different scenarios are considered robust and therefore fit in short term visions. Local stakeholders are involved in a final adjustment cycle of the developed visions. The five-step approach defines visions for city-planners. In ‘urban planning for renewable energy futures: methodological challenges and opportunities from a design perspective’, Vandevyvere and Stremke (2012) propose an analytical framework to address the challenges of renewable energy based planning. 2 levels of analysis are proposed: environmental assesment and integrated sustainable evaluation, with for example social, economical, policy/process realms, which complement each other. Herman Dooyeweerd already identified 15 law spheres, from determinative to normative, in the multimodal system theory. Almost all of these spheres concern sustainable development is concluded and a multidisciplinary framework is needed to properly asses these layers, such as socio-cultural, economical, juridical. Although not a transition method in itself, the Delft method of Energy Potential Mapping (Broersma et al, 2013) facilitates energy based planning, and within City-zen it provides the basis with which the Energy Atlas (mentioned below) can be built. EPM focuses on the strong spatial relation between sinks (demand) and sources (supply) in a fully renewables based energy system, and investigating which types of energy are involved (heat/cold, electricity and fuels). The resulting spatially quantified data can be applied towards local and regional energy based planning, as shown in the Oostland study below.
3. Methodological framework of the City-zen Approach
Sustainable development in the built environment requires a transformation process over a longer period of several decades or more. To direct and speed up this process, strategic approaches and long term visions help city planners to set targets and appoint directions to get there. But citizens and other stakeholders must also be able to find the best solutions for the improvement of their energy systems, not only because they are willing to, but also because their contributions will often be a necessity to get to the cities’ set targets. This is part of the goal of the City-zen approach: to increase the usability of such a theoretical framework which enables more participation of different stakeholders not only top-down yet also bottom-up; from city planners to citizen. For city planners the City-zen approach must also contribute to, and improve the outline of the path towards the set targets over the period of time that the roadmap covers by defining individual, but coherent interventions at technical and strategic levels. To define a theoretical framework for energy master plans for cities, several approaches, methodologies and projects on energy planning have been studied so far. As a basis, some of the steps of the theoretical framework of the SREX five-step approach (SREX, 2011) have been adapted. Even though the five-step approach mainly focuses on technical measures in integrated visions, both TRANSFORM and STEP-UP do show that measures on the strategic level (often to remove barriers) are equally important. Vandevyvere’s study also stresses the importance of a multimodal system analysis to achieve integrated sustainability. We refer to these modals as ‘layers of influence’. Within the City-zen approach the basis of the five-step approach will therefore be expanded addressing non-technical barriers and opportunities at 4 levels (the condensed modals Vandevyvere refers to). The local stakeholders involved may not be able to significantly influence technological development, but can change the political, legal, social and economic situation, thus accelerating the transition to renewable energy. As Figure 1 shows, a division can be made between ‘hard’ aspects summarised in the energy atlas, and ‘soft’ aspects, to which societal mapping relates. The energy atlas uses the Energy Potential Mapping method mentioned earlier in order to spatially quantify renewable potentials, combining these with present and future demand (reduction potentials) and the energy systems present. Societal mapping will augment this atlas with the barriers and opportunities on the social, political and legal layers. The implicit temporal component of these two categories is the identification of these barriers, and which opportunities will be additionally unlocked if these are removed, which can subsequently be made explicit as interventions.
215

Figure 1 Diagram visualising the analysis of the present system in layers of influence, showing
opportunities and barriers for the present and (near) future
In order to facilitate the step from potentials to actions, a City-zen catalogue of measures will be introduced in which these layers are integrated. Measures will not only technically be assessed but also at the political/legal, economic/financial and social levels. This will result in new measures (being solutions for barriers) at these non-technical levels. With this, the catalogue will contain sustainable energy measures both on a technical and a strategic (non-technical) level. Finally, strategies will be integrated in the City-zen approach to define the right and most suitable interventions from this catalogue for the city and its stakeholders and a roadmap towards a future vision. Used terms
In the context of this paper, measures can be technologies, legal instruments, social models and many more generic devices, which during the project will be collected in the City-zen Catalogue of Measures. Assigning an area, budget and a period of time in which to apply these turns them into interventions. Realised projects (both within and outside of City-zen) with exemplary value are considered case studies, which are collected in the Atlas of Case Studies and may serve as both local and international inspiration for a city’s vision and the roadmap that leads to it. Scenarios refer to socio-economic projections and other external influences that affect the city, the vision is a set of long term targets and indicators of the city’s choosing (rather than being a specific blueprint) that it aims to achieve, the roadmap connects the present with this future vision (and will be elaborated, with specific interventions, in the near future, while providing more a general direction in the far future) and milestones are future actions at set intervals where progress is evaluated and the roadmap adjusted accordingly.
3.1 The framework of the City-zen approach
The basics behind the various (successive) steps and elements of the City-zen framework and methodology will be explained in Figure 2. As the City-zen approach is part of a European FP7 project that won’t be finished until 2019, the methodology is under construction and still needs to be expanded, tested and improved.
216

Figure 2 City-zen approach framework
Step 1 Map the present and near future The first step involves mapping the present and near future in several layers of influence: making an energy atlas and mapping the society as schematically shown in Figure 2. The length of the supply chain of the current energy system should be considered when assessing its sustainability and resilience. A gas based power plant may for example get its natural gas from a distant source in another country, something that occasionally applies to more renewable wood pellet based CHP plants as well. Next follow the sub-steps of mapping the present and near future: 1.1 Collect data on the geographical-physical environment In order to build the energy atlas, the available data on the city’s climate, infrastructure, including the existing energy system, energy usage (patterns), built environment and underground needs to be collected. A high detail level for each layer (for example energy demand or roof photovoltaic potential) is desirable but not required, and individual layers can always be improved upon at a later moment. If suitable, the influences of the social, legal and economical layers may be included in these layers. An example of this is the influence of risk zoning on wind turbine placement potential, a regulatory issue with a strong spatial effect. 1.2 Map and analyse the technical energy potentials The base data collected in 1.1 can be used to project various renewable energy techniques and other interventions in order to determine both the technical maximum potentials and their geographic spread of a city: the energy atlas. For the sub-steps 1.1 and 1.2 the EPM methodology will be applied, with some additional information of 1.3 and 1.5. Adding any information still missing or increasing its resolution will be a first strategic step to be taken by the city government. 1.3 Analyse and map the economic system and financial barriers and opportunities This step involves exploring those local and national economic and financial aspects that impede realisation of the maximum technical potentials explored in the energy atlas, and interventions that may increase this realisation. Examples may be changing municipal taxation schemes, vouching for investment loans or providing temporary subsidies. 1.4 Analyse the social environment The main question here is which local stakeholders will be involved in the transition process, either directly or indirectly and what their mind-set is. Although social changes may have the longest temporal horizon, these may be accelerated significantly by identifying key actors and actively engaging them. 1.5 Analyse the political and legal environment As with 1.3, this step will both have local and national aspects, and may either identify room for local measures or issues that need to be raised on the national agenda. Calculating the unrealised technical potential resulting from these barriers may provide incentive for national politics to address them. Both the
217

legal environment and the responsibilities of the governmental stakeholders involved need to be mapped as these may differ significantly between cities and countries. 1.6 Map the near future This last part involves cataloguing ongoing and planned projects within the city. Step 2 Determine scenarios A range of possible far futures can be illustrated with the help of regional, national and international scenario studies, which will have an effect on the city. Conversely the city itself has a limited influence on them, therefore they provide the future environment that the city’s vision will be based in. Step 3 Select potentially suitable measures Available measures (either single techniques, for example PV panels or combinations like solar district heating, but also legal, financial and social measures) will be collected from the Catalogue of Measures, useful references to The Atlas of Case Studies may provide additional inspiration here, showcasing built examples. Step 4 Create a vision The ambitions for the city can be defined by setting targets, goals and milestones (rather than a specific blueprint) in a future vision. Indicators (for example the share of renewables, the amount of CO2-exhaust, exergetic efficiency or the resilience of the energy system) need to be defined in order to allow tracking progress towards this vision (see also step 6). If the set targets are ambitious, the temporal horizon for the vision may be distant (for example 2065), in order to provide a suitable time frame to achieve them. Step 5 Define the roadmap Various strategies and approaches can be used to define suitable interventions over time, both on the strategic (i.e. processes) and the technical level. The various stakeholders involved will have different temporal horizons (political changes versus social ones for example, the former may be months to years whereas the latter may take a generation), which needs to be taken into account when defining these interventions. Because at this step the present, near future and desired far future are known, back-casting principles can be used to formulate a pathway between these, which will provide the actual steps – focusing on a detailed palette of interventions for the near future, while defining more general directions for later periods. Step 6 Re-calibrate and adjust Outside of the effects of planned interventions, both the environment and the actors can change over time, which may result in a deviation from the roadmap. To counter this effect, progress needs to be monitored, and at set intervals (milestones) compared to the targets set using the indicators defined in step 4. Developing the roadmap, which can be seen as an extended version of a SEAP, is the most important and difficult part of the methodology. An essential aid here is the use of the Catalogue of Measures together with the Atlas of Case Studies. The roadmap will mainly be developed for city-planners, whereas the Catalogue will be designed to also be useful for and usable by citizens and other stakeholders. In here the different layers of influence will get an important place as well. Each technical measure may have barriers or opportunities in either the technical, economic, social or political/legal field. Strategic actions will remove the barriers, so subsequently new technical measures can be implemented. Single approaches can be applied for different measures, to define whether or not a measure is suitable and if so, where and when the measure fits in a city and with these local interventions can be defined. Considering these factors, shaping an intervention involving a district heating expansion could consist of the following steps:
- Map heat demand by end use (domestic hot water and space heating) and (current) temperature level
- Map building energy efficiency levels and current heating systems (block heating being particularly attractive)
- Map ownership (to identify housing corporations, collectives and larger companies) - Map planned renovations - Map planned road/sewer works
This would not only highlight areas of interest, but also provide a time table. The Catalogue of Measures will include these steps for each measure, allowing cities to simply collect the desired data and subsequently formulate suitable local interventions and finally a roadmap. In order for the roadmap to achieve the maximum gain in CO2 reduction per euro spent, the short and long term impacts of each measure have to be considered, therefore providing comparative insight in their benefits. An essential part of this is understanding the supply chains involved in both the present day situation and the available measures, including extraction and generation, transport, distribution and final conversion. Making the right short term investments may drastically reduce the amount of funds required over the next 50 years to reach the goals set in the vision. Furthermore, investments in measures that are less favourable in the
218

short term may actually reduce the ability to achieve CO2 reduction in the long term, or be highly dependent on measures taken at a larger scale, outside of local control. There may for example be tension between investments (and the associated recovery period) in district heating networks (transport and distribution) and large scale improvements of thermal insulation (reducing the amount of final conversion needed). In this case the generation sources will have to be considered, as well as which quantities they will be able to supply 50 years from now. Industrial residual heat for example is at present largely dependent on a supply of fossil fuel sources, so if a decline is expected and local renewable heat sources may only be able to supply at lower temperatures, perhaps the network temperature will need to be adjusted. Another example is in the application of heat pumps for space heating and domestic hot water (DHW). Assuming a current supply chain using natural gas (Amsterdam), given an average COP of 2.5 and retaining a small gas fired boiler for DHW, the short term effect will be changing the physical location of most of the associated CO2 exhaust from individual houses to large power plants outside of the city (electricity in the Dutch national grid is at present predominantly generated by fossil fuels (CBS, 2015)). However, if this electricity mix expected to increasingly change towards (local) renewables, even this remote CO2 exhaust will drastically be reduced, therefore making the earlier change in local conversion technology a significantly more sustainable one in the long term.
4. Related projects
As both the City-zen methodology and framework are still under development, no specific results from the applied City-zen approach can be shown yet. For this reason, this chapter showcases two existing studies and projects in order to explain some of the steps or principles that can be found in the City-zen approach.
4.1 Oostland
For the Dutch region of Oostland (near Rotterdam), an urban energy study was carried out in 2013 (Broersma, 2014), in order to start a regional energy atlas (of demand and renewable supply potentials). This ‘catalogue of energy potentials’ served as a base document, containing principles for defining suitable interventions for the local energy system. For the city of Pijnacker, an Energy Master Plan was proposed, which included a roadmap for a future district heating network as shown in the next figure. The level of detail for this roadmap was basic, outlining self-contained building blocks and future connecting and upgrading principles rather than defining an explicit time line. A study of the local energetic characteristics of Pijnacker revealed heat demand in the built environment predominantly fell in the low and mid-temperature ranges, the majority related to horticulture. Fortunately, several potentially suitable sustainable sources were also identified in the area, which could be connected to demand areas using small scale district heating networks. Several of these are already present in the area and more are planned. As all rely on separate, single sources, both with limited resilience and expansion capabilities, it would be valuable to eventually interconnect them, creating a larger, more resilient multisource network in the process. This will also make it far easier to eventually connect new sources that may not be financially feasible at present but may become so in the future. A fixed temperature will have to be chosen for the main network, the exact level of this however depends on the present and expected future types of demand, using heat pumps to increase temperature level in small island subsections where necessary. The network has to be strategically dimensioned to cater for future throughput though. If the required temperature for the majority of demand lowers even further (refurbishment of energy inefficient older homes and the addition of well insulated new homes), the network temperature could in the future be changed to follow suit.
219

Figure 3 concept for an organically expanding district heating infrastructure for a self-sufficient Pijnacker
(Broersma, 2014)
220

4.2 Sustainable Amsterdam
The City of Amsterdam recently published their Sustainable Agenda (Municipality of Amsterdam, 2015), adopted by the municipal council in March 2015. This agenda can be seen as a S.E.A.P. for the current governmental period (2014-2018) with clear targets, actions, budget and a timeline, as summarised in the visual roadmap below.
Figure 4 Amsterdam SEAP overview
The report does not explain the methodology used to define the specific interventions, however several steps coincide with the City-zen methodology, e.g. mapping energy demand, CO2 emissions, renewable energy potentials and to a certain extent, stakeholder mapping.
5. Conclusion, discussion and outlook
The majority of the steps of the City-zen methodology are more or less present in many of to the subject related studies, several of which being described in this paper. City-Zen however aims to combine provision of a broad, long term urban energy transition methodology focusing on not just using opportunities, but identifying and removing barriers. As the name implies, active public participation is an integral component both from social acceptance and financial investment points of view. Furthermore, existing buildings are emphasised, as these form the majority of most cities’ building stock, and therefore an important opportunity to increase urban sustainability. As an important part of City-zen is to not just provide long term sustainability goals but also a roadmap leading to these, the various parts of the methodology will be enhanced and refined over the next years in order to provide practical implementation tools and strategies for the stakeholders involved. During the City-zen project, a more extensive long term roadmap towards fully sustainable partner cities Amsterdam and Grenoble will be developed (guided by the authors), applying the elaborated City-zen methodology and in return help evolve practical matters. As different cities have different goals, what exactly ‘fully sustainable’ is, needs to be decided locally, as described in step 4. The Sustainable Agenda of Amsterdam that was mentioned before, will in this case serve as a list of ‘near future’ plans (step 1), rather than be modified into a long term roadmap, as the latter will most likely cover 2050 and beyond. In order to be able to build these roadmaps, sets of generic principles and approaches need to be defined in the Catalogue of Measures, for which both City-zen partners and past projects (for example other FP7 ones and the REAP, LES, SREX and Oostand studies) will serve as input.
221

6. References
Broersma, S. 2014. Urban energy interventions in Oostland, Netherlands: bottom-up towards sustainability. In: World Sustainable Building 2014. 28-30 Oct 2014, Barcelona: World Sustainable Building, 2014. Pp. 41-54. Broersma, S., Fremouw, M.A., & Dobbelsteen, A.A.J.F. van den. 2013. Energy Potential Mapping:Visualising energy characteristics for the exergetic optimization of the built environment. Entropy, Volume 15, pp. 490-506. CBS. 2015. Elektriciteit in Nederland. Den Haag: Centraal Bureau voor de Statistiek. Covenant of Majors. 2015. http://www.covenantofmajers.eu/ (accessed 2015). Dobbelsteen, A.A.J.F. van den, Tillie, N.M.J.D., Kurschner, J., Mantel, B.& Hakvoort, L. 2011. The Amsterdam guide to energetic urban planning. In: MISBE proceedings, 20-23 june 2011, Delft, Delft University of Technology. European Union. How to develop a sustainable energy action plan. European Union, 2010. Jobert, A., Laborgne, P. & Mimler, S. 2007. Local acceptance of wind energy; Factors of success identified in French and German case studies. Energy Policy, volume 35, pp. 2751-2760. Kloppenborg, E. Transformation Agenda for Copenhagen (draft version). Copenhagen, 2014. Municipality of Amsterdam, department of urban planning and sustainability. 2015. Sustainable Amsterdam. Amsterdam. MUSIC. The MUSIC Project. 2015. http://themusicproject.eu/. Nestle, U. 2014. Marktrealität von Bürgerenergie und mögliche Auswirkungen von regulatorischen Eingriffen. Leuphana Universität Lüneburg. Rogers, J.C., Simmons, E.A., Convery, I. and Weatherall, A. 2008. Public perceptions of opportunities for community-based renewable energy projects. Energy Policy, Volume 36, pp. 4217-4226. SREX. SREX: Synergie tussen Regionale Planning en Exergie. 2011. http://exergieplanning.nl/. STEP-UP. Energy Planning for Cities. 2015. http://www.stepupsmartcities.eu/. Stremke, S. 2012. Integrated visions (part 1): methodological framework for long-term regional design. European Planning Studies, Volume 20:2, pp. 305-3019. Tillie, N.J.M.D., Dobbelsteen, A.A.J.F. van den, Doepel, D.,Joubert, M., Jager, W. De & Mayenburg, D. 2009. Towards CO2 neutral urban planning: Presenting the Rotterdam Energy Approach and Planning (REAP). Journal of Green Building, Volume 4, issue 3, pp. 103-112. TRANSFORM. Transformation agenda for low carbon cities. 2015. http://urbantransform.eu/. Vandevyvere, H. & Stremke, S. 2012. Urban planning for a renewable energy future, methodological challenges and opportunities from a design perspective. Sustainability, volume 4, pp. 1309-1328. Wind-works. 2015. http://www.wind-works.org/cms/index.php?id=61&tx_ttnews[tt_news]=506&cHash=fcb13537bd5b8ec990858ce72560f0e2. Wüstenhagen, R., and E. Menichetti. 2012. Strategic choices for renewable energy investment: Conceptual framework and opportunities for further research. Energy Policy, volume 40, pp 1-10. The research leading to these results has received funding from the European Union’s Seventh Framework Programme (FP7/2007-2013) under grant agreement N° 608702.
222

COMPARING PERTIRNENT INTERNATIONAL STANDARDS FOR PERMISSIBLE WINDOW AIR LEAKAGE OF MECHANICAL OR NATURALLY VENTILATED BUILDINGS WITH
EQUIVALENT SOUTH AFRICAN STANDARDS
Jacques LAUBSCHER 1
1 Department of Architecture / Faculty of Engineering and the Built Environment / Tshwane University of
Technology, Email: [email protected] Keywords: Air leakage, Building Regulations, SANS 10400:Part XA, SANS 204
Abstract
Buildings have to be energy efficient and properly ventilated. The selection and functioning of a specific ventilation system has a direct bearing on the well-being, health and comfort of the buildings’ users and occupants. For artificial ventilation, a building that seals well mostly result in a more effective system. On the other hand, a leaky building might not compromise a natural ventilation strategy to the same extent as for a mechanically ventilated building. With the promulgation of SANS 10400-XA: 2011 (Energy Usage in Buildings), much needed sustainability aspects were incorporated into the National Building Regulations of South Africa. Among others, SANS 10400:Part XA sets the performance standard for building ventilation while defining the permissible air leakages. However, the current minimum statutory requirements for permissible air leakage in South Africa have their origin from a voluntary American fenestration registration council. Focusing on the permissible air leakage for wall openings, this paper presents a desk review of the new South African ventilation standards in comparison with three pertinent international standards, namely America, Australia and India. Using the air leakage performance requirements at a pressure of 75 Pa, the paper concludes that the South African standard is more onerous than that of Australia and India. This inadvertently contributes to an increase in building and operational costs, while promoting hermetically sealed buildings in South Africa.
1. Introduction
Regardless of whether immediate action is taken to limit the effects of climate change, a certain degree of global warming remains inevitable. People are spending longer periods inside buildings, while requiring greater levels of comfort. As a result direct result, building services are consuming energy at an ever increasing rate. In an effort to address this, various regulations focusing on energy efficiency in buildings have been implemented worldwide. Building services could be described as everything that make a building safe and comfortable (CIBSE, 2015). One of these building services is ventilation. The choice of a building’s ventilation systems is often the result of a balance between the performance of the building envelope and/or skin, the extent and form of ventilation required as well as the climatic conditions prevalent on a specific site. The selection and functioning of a specific system has a direct bearing on the well-being, health and comfort of the buildings’ users and occupants (Fisk, 2000: 539; Bone et al., 2010: 233). Sundell et al. (2011: 191) argue that “… increasing ventilation rates above currently adopted standards and guidelines should result in reduced prevalence of negative health outcomes”. Focusing on the statutory requirements of the National Building Regulations (NBR) for permissible air leakage (AL) through wall openings, this paper presents a desk review of the South African ventilation standards by comparing it with three pertinent international standards. This paper includes a synoptic comparison between the AL requirements for wall openings of North America, Australia, India and South Africa. This comparison translates technical documents into a summarized and legible format. With the paper as background, the table could be used by policy makers and technical committees alike to determine the appropriateness of the current performance requirements for permissible AL in South Africa.
2. Building ventilation
The American Society of Heating, Refrigerating and Air-Conditioning Engineers (ASHRAE) Standard 62.1 (ASHRAE, 2013) and the ASHRAE Handbook (ASHRAE, 2005) define ventilation as the air used for providing acceptable indoor quality. Whether the climatic control system is mechanical, natural or dual, the designer should strive towards a careful balance between:
• The actual performance of the building envelope, • the extent of natural ventilation used and • the prevalent climatic conditions on the particular site.
The combined effort and resultant effect of these factors promote the well-being, health and comfort of the buildings’ users and occupants.
223

2.1 Natural and mechanical ventilation
Natural ventilation was largely abandoned during the late 20th Century when the use of air conditioning became more prevalent. With mechanical ventilation systems becoming cheaper and more available. As technology improved, these systems increasingly incorporated in buildings. Coupled with the then relative low electricity costs, the use of mechanical Heating Ventilation and Air Conditioning (HVAC) systems increased dramatically worldwide. A building that seals well mostly result in a more effective artificial ventilation system. On the other hand, a leaky building might not compromise a natural ventilation strategy to the same extent as for a mechanically ventilated building. According to Kuindersma (2013:10), it is impossible to construct a completely hermetically sealed building and no external building skin is completely airtight. This leaking skin directly affects the optimal performance of an HVAC system. Kleiven (2003: iii) states that despite the dominance of mechanical ventilation and air conditioning in the 20th Century, “many of the mechanical systems do not manage to deliver the desired indoor climate … because of this contradiction, the focus has again been put on simpler, more robust and less energy consuming solutions”. Kleiven (2003:10) argues that most historic buildings were ventilated naturally, using the available forces to circulate air in the enclosed spaces. Currently, this ventilation method is observed with renewed interest. Given the generally temperate climatic conditions of South Africa, this is of great importance for social infrastructure (i.e. hospitals, clinics, prisons and schools) where air conditioning is often too expensive and difficult to maintain. The purpose of any ventilation system is to provide an acceptable micro-climate. A properly designed naturally ventilated system could be implemented as an energy-efficient alternative for reducing energy consumption in buildings. Kumar (2012:79) argues that “[t]he result of hermetically sealed buildings often are deteriorated indoor air quality and an increased the incidence of respiratory illness, among others”. This is mainly caused by the “construction of tightly sealed buildings, the reduction of ventilation rates (for energy saving) and the use of synthetic building materials and furnishings as well as chemically formulated pesticides and household cleaners” (Kumar, 2012:79).
2.2 Dual ventilation
In a publication on the thermal comfort and energy design challenges of the 21st Century against the background of climate change, Holmes and Hacker (2007:802) highlight “the dual challenge of designing sustainable low-energy buildings while still providing thermal comfort under warmer summer conditions produced by anthropogenic climate change”. As a possible solution, Holmes and Hacker (2007:802) propose ‘free running’ buildings that employ natural ventilation in summer, or alternatively a mixed-mode (with mechanical cooling only when absolutely necessary). The major challenge lies in how buildings are sealed to accommodate a dual ventilation mode. A dual ventilation is a combination of natural ventilation and air conditioning, or where air conditioning assists with natural ventilation or other derivations thereof. The dual ventilation mode almost requires two conditions that are mutually exclusive.
2.3 Air leakage in buildings
During the last decade, the drive to reduce carbon emissions through more energy efficient buildings have led to increasing levels of air tightness in the building envelope (Howieson, 2014:318). This strategy has dramatically reduced what could be considered as fortuitously high, historical air infiltration rates (Howieson, 2014:318). Air permeability is the physical property used to measure the air tightness of the building fabric (National Building Specification, 2015:7). It is defined as the air leakage rate per hour per square metre of the envelope area, using a test pressure as reference across the building envelope (National Building Specification, 2015:7). AL takes place when air passes through the building envelope. Infiltration is the term used to describe leakage to the interior, while ex-filtration describes air leaking to the exterior. “Excessive air movement significantly reduces the thermal integrity and performance of the envelope and is, therefore, a major contributor to energy consumption in a building … In addition to causing energy loss, excessive air leakage can cause condensation to form within and on walls. This can create many problems including reducing insulation R-value, permanently damaging insulation, and seriously degrading materials” (Bureau of Energy Efficiency, 2009:18). Prof. Mark Brandt Luther from the Deakin University in Australia reviewed international literature and standards on AL in buildings for the Australian Council of the Built Environment Design Professions (BEDP) in 2007. According to Luther (2007:1), various testing methods for AL in colder climates, like Canada, Germany, United Kingdom, Sweden, Japan and the USA have been established. Primarily, the purposes of these testing methods are energy savings through an improved building envelope construction. Luther (2007:1) argues that Australia has to research appropriate construction and tightening methods to suit the unique Australian climate. This is equally applicable to the South African built environment.
224
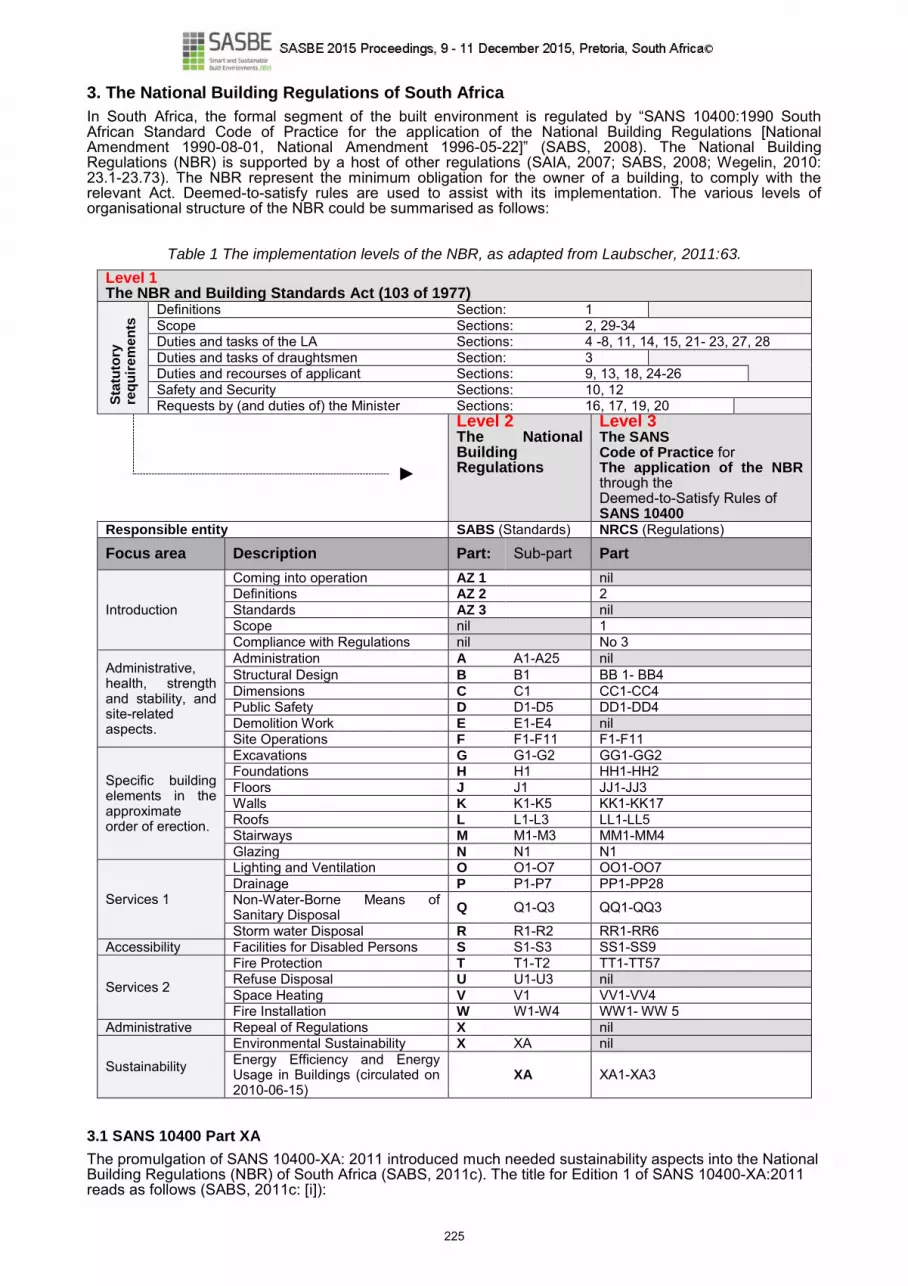
3. The National Building Regulations of South Africa
In South Africa, the formal segment of the built environment is regulated by “SANS 10400:1990 South African Standard Code of Practice for the application of the National Building Regulations [National Amendment 1990-08-01, National Amendment 1996-05-22]” (SABS, 2008). The National Building Regulations (NBR) is supported by a host of other regulations (SAIA, 2007; SABS, 2008; Wegelin, 2010: 23.1-23.73). The NBR represent the minimum obligation for the owner of a building, to comply with the relevant Act. Deemed-to-satisfy rules are used to assist with its implementation. The various levels of organisational structure of the NBR could be summarised as follows:
Table 1 The implementation levels of the NBR, as adapted from Laubscher, 2011:63.
Level 1 The NBR and Building Standards Act (103 of 1977)
Sta
tuto
ry
req
uir
em
en
ts Definitions Section: 1
Scope Sections: 2, 29-34 Duties and tasks of the LA Sections: 4 -8, 11, 14, 15, 21- 23, 27, 28
Duties and tasks of draughtsmen Section: 3 Duties and recourses of applicant Sections: 9, 13, 18, 24-26
Safety and Security Sections: 10, 12 Requests by (and duties of) the Minister Sections: 16, 17, 19, 20
Level 2 The National Building Regulations
Level 3 The SANS Code of Practice for The application of the NBR through the Deemed-to-Satisfy Rules of SANS 10400
Responsible entity SABS (Standards) NRCS (Regulations)
Focus area Description Part: Sub-part Part
Introduction
Coming into operation AZ 1 nil Definitions AZ 2 2 Standards AZ 3 nil Scope nil 1 Compliance with Regulations nil No 3
Administrative, health, strength and stability, and site-related aspects.
Administration A A1-A25 nil Structural Design B B1 BB 1- BB4 Dimensions C C1 CC1-CC4 Public Safety D D1-D5 DD1-DD4 Demolition Work E E1-E4 nil Site Operations F F1-F11 F1-F11
Specific building elements in the approximate order of erection.
Excavations G G1-G2 GG1-GG2 Foundations H H1 HH1-HH2 Floors J J1 JJ1-JJ3 Walls K K1-K5 KK1-KK17 Roofs L L1-L3 LL1-LL5 Stairways M M1-M3 MM1-MM4 Glazing N N1 N1
Services 1
Lighting and Ventilation O O1-O7 OO1-OO7 Drainage P P1-P7 PP1-PP28 Non-Water-Borne Means of Sanitary Disposal Q Q1-Q3 QQ1-QQ3
Storm water Disposal R R1-R2 RR1-RR6 Accessibility Facilities for Disabled Persons S S1-S3 SS1-SS9
Services 2
Fire Protection T T1-T2 TT1-TT57 Refuse Disposal U U1-U3 nil Space Heating V V1 VV1-VV4 Fire Installation W W1-W4 WW1- WW 5
Administrative Repeal of Regulations X nil
Sustainability
Environmental Sustainability X XA nil Energy Efficiency and Energy Usage in Buildings (circulated on 2010-06-15)
XA XA1-XA3
3.1 SANS 10400 Part XA
The promulgation of SANS 10400-XA: 2011 introduced much needed sustainability aspects into the National Building Regulations (NBR) of South Africa (SABS, 2011c). The title for Edition 1 of SANS 10400-XA:2011 reads as follows (SABS, 2011c: [i]):
225

SOUTH AFRICAN NATIONAL STANDARD
The application of the National Building Regulations
Part X: Environmental sustainability
Part XA: Energy usage in buildings
SANS 10400:Part XA (2011c: 10) states the minimum R-value for masonry and non-masonry external walls, while all other walling requirements have to be in accordance with SANS 10400:Part K (SABS, 2011a:10). Additionally, SANS 10400:Part XA (SABS, 2011c:10) lists the energy performance requirements for wall openings as follows:
4.4.4 Fenestration
4.4.4.1 Buildings with up to 15% fenestration area to nett floor area per storey comply with the minimum energy performance requirements.
4.4.4.2 Buildings with a fenestration area to nett floor area per storey that exceeds 15% shall comply with the requirements for fenestration in accordance with SANS 204.
4.4.4.3 All fenestration air infiltration shall be in accordance with SANS 613.
This paper focuses on buildings with a fenestration area to nett floor area per storey that exceeds 15%. As stated above, these wall openings have to comply with the requirements of SANS 204 with the air infiltration adhering to the testing requirements of SANS 613. Additionally, SANS 10400:Part XA (2011c: 6) states that building “services that use energy or control the use of energy, including heating, air conditioning and mechanical ventilation [has to be designed] in accordance with SANS 204”.
3.2 SANS 204
Titled “Energy efficiency in buildings”, SANS 204 was published in September 2011 with a scope stating that “[t]his standard specifies the design requirements for energy efficiency in buildings and of services in buildings with natural environmental control and artificial ventilation or air conditioning systems” (SABS, 2011d: 3). The standard is voluntary, except for the sections used by other compulsory standards. The requirements of the standard include site orientation, building orientation, building design, building sealing, services as well as mechanical ventilation and air conditioning (SABS, 2011d: 7-29). SANS 204 defines mechanical ventilation as the “movement of air through mechanical means” (SABS, 2011d: 5). Natural environmental control is defined as the “application of passive measures of environmental control”, while the “net floor area” is the “sum of all areas between the vertical building components (walls or partitions), excluding garages, car parks and storerooms” (SABS, 2011d: 5). Under the heading building sealing, SANS 204 states that “the building envelope and any opening such as windows and doors in the external fabric shall be constructed to minimize AL” (SABS, 2011d: 22). The permissible AL for glasing and roof lights are as follows (SABS, 2011:22):
4.4.3.1 Glasing and roof lights
4.4.3.1.1 Maximum permissible AL for openable glasing shall be 2,0 L/s m2 with a pressure
difference of 75 Pa, when tested in accordance with SANS 613.
4.4.3.1.2 Maximum permissible AL for non-openable glasing shall be 0,31 L/s m2 with a pressure
difference of 75 Pa, when tested in accordance with SANS 613.
4.4.3.1.3 For glazed double action swing doors and revolving doors, the maximum permissible AL shall be 5,0 L/s m2
with a pressure difference of 75 Pa, when tested in accordance with SANS 613.
Apart from requesting a seal to restrict any AL through external doors serving an air conditioned space or habitable rooms in particular climate zones, SANS 204 makes no further reference to doors (SABS, 2011d: 22-23). For the purposes of this paper the requirements for windows in external walls are accepted as the same for doors in externals walls. In terms of mechanical ventilation systems and/ or air conditioning, the selected system has to be “designed to best practice and using the best available technology” (SABS, 2011d: 23) Additionally, it is stated that “Buildings shall be so designed that in the event of failure of an air conditioning or mechanical ventilation system (or both), an alternative means of natural ventilation shall be provided” (SABS, 2011d: 23).
4. Pertinent international standards for wall openings
The following section identifies the performance standards (and the associated AL requirements) used in the United States of America, Australia and India. The selection of countries were based on various factors, but the most important aspect was that all of them needed to be signature countries to the Agreement on Technical Barriers to Trade (TBT) of the World Trade Organization (WTO) (WTO, 2015). The Agreement on Technical Barriers to Trade (TBT) was issued by the WTO in 1997. As part of the Uruguay Round of Multilateral Trade Negotiations, Article 2 titled the Preparation, Adoption and Application of Technical Regulations, states that “Members shall ensure that in respect of technical regulations, products imported from the territory of any Member shall be accorded treatment no less favourable than that accorded to like products of national origin and to like products originating in any other country” (WTO, 2015). Clause 2.8 ensures that “Wherever appropriate, Members shall specify technical regulations based on product requirements in terms of performance rather than design or descriptive characteristics” (SABS: 2014: 1;
226

WTO, 2015). The aim of this agreement is to free the building regulatory system from unnecessary trade barriers (SABS, 2014, 1). America was selected as recognised as a world leader in this field, but more importantly the current requirements of SANS 204 are largely based on the guidelines of the National Fenestration Registration Council (NFRC) (SABS, 2011d: 62). Although the NRFC is a voluntary American association, SANS204 cites nine of its publications (SABS, 2011d: 62). Among others, the bibliography of SANS 2014 lists the “NFRC 400, Procedure for determining fenestration product air leakage” (SABS, 2011d: 62). The remaining references of SANS 204 are made up of four references to South African standards and two Volume 1 and 2 of the Building Code of Australia (BCA) is referenced in SANS 204 (SABS, 2011d: 62). The Australian climatic conditions show a large degree of similarity to the prevalent climatic conditions of South Africa (O'Meagher, 1998, 231; Tennant, 2005), resulting in its inclusion. As a member of the Brazil, Russia, India, China and South Africa (BRICS) association of emerging national economies, India was the third and final choice for comparison.
4.1. United States of America
In America, the corresponding standard is titled AAMA/WDMA/CSA 101/I.S.2/A440-11 North American Fenestration Standard/Specification for windows, doors, and skylights. This standard is the result of a joint publication by the American Architectural Manufacturers Association (AAMA), together with the Window & Door Manufacturers Association and the Canadian Standards Association (CSA Standards) (AAMA et al., 2011: [1]). This voluntary standard defines the requirements for windows, doors, and secondary storm products for four different buildings classes, ranging from least stringent to most stringent, namely (AAMA et al., 2011: 2):
Performance Class R: The requirements and performance levels are commonly used in one- and two-family dwellings. Performance Class LC: The requirements and performance levels commonly used in low-rise and mid-rise multi-family dwellings and other buildings with larger sizes and higher loading requirements are expected. Performance Class CW: The requirements and performance levels commonly used in low-rise and mid-rise buildings where larger sizes, higher loading requirements, limits on deflection, and heavy use are expected. Performance Class AW: The requirements and performance levels commonly used in high-rise and mid-rise buildings to meet increased loading requirements and limits on deflection, and in buildings where frequent and extreme use of the fenestration products is expected.
This standard employs “gateway performance requirements” as a minimum performance levels for different products being used in different classes. After successfully passing through this “gateway”, the product will be rated within the applicable performance class (AAMA et al., 2011:2).
Table 2 Specific gateway requirements of the relevant North American Standard: (AAMA et al., 2011:6)
Product type Product designation Pressure
difference (Pa) AL resistance
(L/s m2)
Awning, hopper, projected window (AP)
Class R-PG15-AP 720 1.5 Class LC-PG25-AP 1200 1.5 Class CW-PG30-AP 1440 1.5 Class AW-PG40-AP 1920 0.5
Casement window (C) Class R-PG15-C 720 1.5 Class LC-PG25-C 1200 1.5 Class CW-PG30-C 1440 1.5 Class AW-PG40-C 1920 0.5
Legend: PG = Performance Grades AP = Awning, hopper, projected window C = Casement window
The range and intensity of pressure difference used for different product types are noteworthy. Among others, the performance of architectural terrace doors, awnings, hoppers, projected windows, basement windows, casement windows and double side-hinged doors are evaluated in the standard.
4.2. Australia
Together with the Australian Government, each State and Territory Government and the Australian Building Codes Board (ABCB) produce and maintain the National Construction Code (NCC) (Australian Window Association, 2015; ABCB, 2015a: 2). Using the NCC as umbrella, the Building Code of Australia (BCA) is a uniform set of technical provisions for the design and construction of buildings and other structures all over Australia, while incorporating different climate, geological and/ or geographic conditions (Australian Window Association, 2015, 4). The performance requirements of Section J (titled Energy Efficiency) states that “A building, including its services, must have, to the degree necessary, features that facilitate the efficient use of energy appropriate
227

to … the sealing of the building envelope against air leakage…” (ABCB, 2015a: 35, 48). Part 3.0, Section 3.6.0 of Volume 2 of the BCA, states that the relevant performance requirements (P2.1 and P2.2.2) are satisfied if wall openings are designed and constructed according to Australian Standard (AS) 2047 (ABCB, 2015b: 225). For glased assemblies not covered by AS 2047 compliance to AS 1288 is required (ABCB, 2015b: 225). The title of AS 2047 is AS 2047:2014: Windows and External Glazed Doors in Buildings, and the title of AS 1288 is AS 1288:2014: Glass in Buildings: Selection and Installation. Australia follows a site specific approach where a design wind pressure for each window and door assembly should be nominated or specified (Australian Window Association, 2015, 4). The broad categories for nomination is housing, other residential and commercial buildings. As stated in Appendix C of AS 2047:2014, the manufacturer of the window assemblies should verify, using visible product labelling, that each product meet the specified window rating or design wind pressures (Australian Window Association, 2015, 4). For the purposes of this paper only residential and commercial buildings were included. The AL requirements of AS 2047:2014 are summarised in the table below.
Table 3 The standard conditions as defined Australian Standard (2014:10)
Building type or window type Pressure direction Maximum air infiltration, L/s m2
Test pressure
75 Pa 150 Pa Air-conditioned Positive, negative 1.0 1.6 Non air-conditioned Positive 5.0 8.0 Louvre window Positive 20.0 Not applicable Adjustable louvers, residential and commercial buildings
Positive 20.0 32.0
An Industry Code of Practice (ICP) for windows and doors was developed as an alternative to the 1999 edition of AS 2047. Although voluntary, the ICP specifies the following additional two performance levels (AWA, 2007:2):
Level 1: Standard for low air infiltration (i.e. air-conditioned with a required 1.0 L/s m2) Level 2: All other buildings (for which the requirement is 5.0 L/s m2)
4.3. India
In India, the Energy Conservation Building Code (ECBC) is obligatory for all new commercial buildings. Titled the Energy Conservation Building Code 2009, it covers the envelope, HVAC, fenestration, and mechanical equipment. Item 4.2.1.3 of the code requires that “AL for glazed swinging entrance doors and revolving doors shall not exceed 5,0 L/s m2. AL for other fenestration and doors shall not exceed 2,0 L/s m2
” (Bureau of Energy Efficiency, 2009: 18). The Code specifically mentions that “[p]oorly sealed buildings can cause problems for maintaining comfort conditions when additional infiltration loads exceed the HVAC assumptions. This can be a significant problem in high-rise buildings due to stack effect and exposure to stronger winds.” (Bureau of Energy Efficiency, 2009: 18). This standard is compulsory for commercial buildings and/or building complexes with a connected electricity load of 500 kW or greater or a contract demand exceeding 600 kVA (Bureau of Energy Efficiency, 2009: x). Although the standard is recommended for all buildings, it is obligatory for all buildings with an air conditioned floor area larger than 1,000 m2 (International Institute for Energy Conservation, 2006: 6). For an enclosed building envelope, Item 4.2.3 states that joints around fenestration and door frames, as well as all other openings in the building envelope should be sealed, caulked, gasketed, or weather-stripped to minimise AL (Bureau of Energy Efficiency, 2009: 6). No testing standard is prescribed in this standard.
5. Comparing the South African requirements with international standards
For the purposes of this paper, the performance requirements at a pressure of 75 Pa was selected as common denominator, because it is the only pressure used as performance requirement for South Africa used in SANS 613 (SABS, 2011e: 8). The following table summarises the respective requirements of the different standards for operable- and non-operable glased wall openings used in South Africa against that of the United States of America, Australia and India.
228

Table 4 Comparing the pertinent international standards with the applicable South African standards
Country Relevant Performance Standard
Testing Standard
Maximum permissible AL through wall openings
Ventilation type:
Mechanically- or Naturally ventilated
Notes
Operable glasing
Non-operable glasing
Pressure difference
North America
AAMA/WDMA/CSA 101/I.S.2/A440-11 North American Fenestration Standard/Specification for windows, doors, and skylights
ASTM E283 (04) 2012
1.5 L/s m2 720 – 1920 Pa Not specified
Different performance standards are used for different window types. An additional, but more stringent, voluntary performance standard is issued by National Fenestration Rating Council (NFRC)
Australia
AS 2047:2014: Windows and External Glazed Doors in Buildings AS 1288:2014: Glass in Buildings: Selection and Installation
AS 4420.4
1.0 L/s m2 75 Pa Mechanically ventilated
The two performance standards represent the mandatory minimum specification for windows and doors used in Australia and voluntary industry standards.
5.0 L/s m2 75 Pa Naturally ventilated
20.0 L/s m2 75 Pa Louvre windows
20.0 L/s m2 75 Pa Adjustable louvers, residential and commercial buildings
India Energy Conservation Building Code (ECBC) 2009
Not specified
5.0 L/s m2 for glazed swinging entrance doors and revolving
doors
2.0 L/s m2for all other fenestration
and doors N
ot s
peci
fied
Not specified
The standard is mandatory for commercial buildings or building complexes that have a connected load of 500 kW or greater or a contract demand of 600 kVA or greater. The standard is applicable to all buildings with a conditioned floor area of 1,000 m2 or greater. The standard is recommended for all other buildings.
South Africa
SANS 10400-Part O SANS 10400:Part XA SANS 204
SANS 613
2,0 L/s m2
0,31 L/s m2 75 Pa Not specified
Except where it is specifically included in a compulsory code, SANS 204 remain a voluntary performance standard for energy efficiency in South Africa.
229

6. Findings and Discussion
North American Fenestration Standard/Specification uses gateway performance requirements to define a minimum performance level for a specific product serving different occupations. Using a permissible AL of 1,5 L/s m2 at a pressure difference ranging from 720 - 1920 Pa, the North American Fenestration Standard/Specification specify different performances for different window types This standard does not distinguish between operable and non-operable. These standards are equally applied to naturally- and mechanically ventilated buildings. The American gateway approach of defining a minimum performance level for a specific product serving different occupations could be applied in the South African built environment and this should contribute towards greater energy efficiency. The Australian standard distinguish between mechanical ventilated, naturally ventilated, louvre windows, residential and commercial buildings. Australia employs a site specific approach nominating the wind design pressure of each window and door assembly. Using a pressure difference of 75 Pa, the permissible AL for mechanically ventilated spaces is 1 L/s m2, for naturally ventilated spaces the permissible AL is 5 L/s m2, while louvres have a requirement of 20 L/s m2. South Africa could benefit by implementing specification categories similar to that used in Australia, i.e. housing, other residential and commercial buildings. A visible labelling system of installed products, similar to that of Australia, could furthermore assist in verifying product performance in South Africa. The Indian Energy Conservation Building Code of 2009 distinguishes between operable glasing and non-operable glasing. The Code specifies a permissible AL of 2,0 L/s m2 through non-operable glasing. For operable glasing, a permissible AL of 5 L/s m2 is specified. The relevant Indian code does not specify any pressure difference when measuring. The current permissible AL requirements for South Africa are 2,0 L/s m2 for openable glasing, and 0,31 L/s m2 for non-openable glasing at a pressure difference of 75 Pa. This requirement for openable glasing in South Africa is higher than the respective codes of Australia and India. These requirements apply equally to naturally and mechanically ventilated areas because no distinction between different ventilation types are made. This universal approach is also followed in both America and India. Australia on the other hand, uses three ventilation types, namely naturally ventilated, mechanically ventilated and louvred wall openings. When the above are compared with the purpose of a ventilation system, it is evident that the statutory minimum requirements in South Africa not only leads to an increase in building costs, but also promotes the use of mechanical ventilation systems. This will ultimately result in an increase in energy consumption. At the same time, the importance of a healthy indoor climate is not addressed in the standard.
5. Conclusion and Further Research
Currently, the South African requirements for permissible air leakage (AL) through wall openings are largely based on that of the National Fenestration Registration Council (NFRC), an American voluntary organisation. In South Africa, the present statutory requirements do not consider site specific climatic conditions, differences in building occupations and/ or occupant behaviour. South Africa uses one standard requirement for the AL in both naturally ventilated and mechanically ventilated buildings. Given the large need for social infrastructure and socio-economic reality in South Africa coupled with spiralling energy consumption of buildings, these onerous requirements have to be revised. This paper notes a limited evidence base on the effects of poor indoor air quality if natural ventilation is insufficient. South Africa has to research appropriate construction and tightening methods to suit the unique South African climate. These studies should focus on the relationship between the performance of the building envelope, the extent and form of ventilation required for the particular occupancy and the climatic conditions prevalent on a specific site. Additionally, the relationship between energy consumption and occupant well-being for naturally ventilated, mechanically ventilated and dual ventilated buildings should be investigated. Subsequently, the current standard and it associated requirements should be revised bearing in mind the different entry and compliance methods that are used internationally.
6. Acknowledgement
This paper is a part of a larger research project, financed by ArcellorMittal South Africa and the Steel Window and Door Association of Southern Africa (SWADASA). The author acknowledges the continued assistance and contributions of Mr Gary Rogoff from SWADASA, as well as that of Mr Mostert van Schoor and Mr Pieter Jonkers from the Department of Architecture, at the Tshwane University of Technology.
7. References
American Architectural Manufacturers Association, Window & Door Manufacturers Association, CSA Standards. 2011. North American Fenestration Standard/Specification for windows, doors, and skylights (AAMA/WDMA/CSA 101/I.S.2/A440-11). Schaumburg, IL, USA. American Society for Testing and Materials (ASTM). 2012. Standard test method for determining the rate of AL through exterior windows, curtain walls, and doors under specified pressure differences across the specimen (ASTM E 283-04). West Conshohocken, PA: ASTM. American Society of Heating, Refrigerating and Air-Conditioning Engineers, Inc. (ASHRAE), 2005. ASHRAE Handbook Atlanta, GA, USA. [Online]. Available: https://www.ashrae.org/.
230

American Society of Heating, Refrigerating and Air-Conditioning Engineers, Inc. (ASHRAE). 2013 Standard 62.1: 2013 Ventilation for Acceptable Indoor Air Quality (Atlanta, USA: ASHRAE) Australian Building Codes Board (ABCB). 2015a. National Construction Code (NCC): Performance Requirements Extract. ABCB: [Online]. Available: http://services.abcb.gov.au/NCCOnline/Publications/2015. Australian Building Codes Board (ABCB). 2015b. National Construction Code (NCC): Volume 2: Building Code of Australia: Class 1 and Class 10 Buildings. ABCB: [Online]. Available: http://services.abcb.gov.au/NCCOnline/Publications/2015. Australian Standard (AS 4420.4). 1996. Windows - Methods of test. Method 4: Air infiltration test. [Melbourne]: Council of Standards Australia. Australian Window Association (AWA), and the Window Association of New Zealand (WANZ), 2007. Industry code of practice. External windows and doors in buildings performance specifications. [Melbourne]: AWA & WANZ. Australian Window Association (AWA), 2015. Australian Window Association guide series: A guide to window and door selection, Pymble, NSW: AWA. Bone, A., Murray, V., Myers, I., Dengel, A., Crump, D. 2010. Will drivers for home energy efficiency harm occupant health? In: Perspectives in Public Health September 2010 130: pp. 233-238. Bureau of Energy Efficiency. 2009. Energy Conservation Building Code: User Guide. New Delhi: Bureau of Energy Efficiency. Cambridge Dictionaries Online, 2015. Cambridge Dictionaries Online. [Online] Available at: http://dictionary.cambridge.org/dictionary/english/hermetically-sealed?a=british [Accessed 10 November 2015]. Chartered Institution of Building Services Engineers (CIBSE), 2015. What is Building Services? [Online] Available at: http://www.cibse.org/Building-Services/What-is-Building-Services [Accessed 8 November 2015]. Christopher B. F., Vicente R. B., Katharine J. M., Michael D. M., 2013. Intergovernmental Panel on Climate Change. [Online] Available at: http://www.ipcc.ch/report/ar5/wg2/ [Accessed 8 November 2015]. City of Greater Bendigo (CoGB). [2011]. Sustainable building design guidelines. Bendigo, Australia: CoGB. Dada, R., 2015. Responding to climate change in South Africa. [Online] Available at: http://mg.co.za/article/2015-03-20-00-responding-to-climate-change-in-south-africa#.Vj5fbeoQ_GM.mailto [Accessed 8 November 2015]. Fisk, W.J., 2000: Health and productivity gains from better indoor environments and the relationship with building efficiency. In: Annual Review of Energy and the Environment. Vol. 25 (1), pp. 537-566. Goddard Institute of Space Studies, 2015. National Aeronautics and Space Administration (NASA) Goddard Institute of Space Studies (GISS). [Online] Available at: http://data.giss.nasa.gov/gistemp/graphs_v3/ [Accessed 8 November 2015]. Holmes, M.J., Hacker, J.N., 2007. Climate change, thermal comfort and energy: Meeting the design challenges of the 21st Century. In: Energy and Buildings, Vol 39. Howieson, S.G., 2014. Are our homes making us ill? The impact of energy efficiency on indoor air quality. In: Perspectives in Public Health. November 2014, Vol. 134 No. 6. Howieson, S.G., Sharpe, T., Farren, P. 2014. Building tight – ventilating right? How are new air tightness standards affecting indoor air quality in dwellings? In: Building Services Engineering Research & Technology. Vol. 35(5), pp. 475–487. International Institute for Energy Conservation. 2006. Energy Building Conservation Code 2006. New Delhi: Bureau of Energy Efficiency. International Monetary Fund, 2015. International Monetary Fund. [Online] Available at: http://www.imf.org/external/pubs/ft/weo/2015/01/weodata/weorept.aspx [Accessed 6 November 2015]. Kleiven, T. 2003. PhD Thesis: Natural ventilation in buildings: Investigating the architectural concepts, consequences and possibilities of. Trondheim: Norwegian University of Science and Technology. Kuindersma, P., 2013. Bouwregels in de Praktijk, Jaargang 8 Maart 2013. Kumar, S. (ed), 2012. Air Quality - Monitoring and Modelling [Online]. Available: http://koeppen-geiger.vu-wien.ac.at/. Laubscher, J. 2011. PhD Thesis: An investigation of the National Building Regulations to promote uniformity and sustainability in the South African built environment. Pretoria: University of Pretoria. Luther, M. B., 2007, AL in buildings - Review of international literature and standards. In: BEDP environment design guide, Vol. 23, Royal Australian Institute of Architects [Online]. Available: http://hdl.handle.net/10536/DRO/DU:30007494. Mitchell, C.M., Zhang, J., Sigsgaard, T., Jantunen, M., Lioy, P.J., Samson, Karol M.R. Current State of the Science: Health Effects and Indoor Environmental Quality. In: Environmental Health Perspectives, Vol 115, No 6.
231

National Building Specification. 2015. The National Building Regulations 2010: Ventilation. [Online] Available at: http://www.planningportal.gov.uk/uploads/br/BR_PDF_AD_F_2013.pdf Niang, I., O.C. Ruppel, M.A. Abdrabo, A. Essel, C. Lennard, J. Padgham, and P. Urquhart, 2014: Africa. In: Climate Change 2014: Impacts, Adaptation, and Vulnerability. Part B: Regional Aspects. Contribution of Working Group II to the Fifth Assessment Report of the Intergovernmental Panel on Climate Change [Barros, V.R., C.B. Field, D.J. Dokken, M.D. Mastrandrea, K.J. Mach, T.E. Bilir, M. Chatterjee, K.L. Ebi, Y.O. Estrada, R.C. Genova, B. Girma, E.S. Kissel, A.N. Levy, S. MacCracken, P.R. Mastrandrea, and L.L. White (eds.)]. Cambridge University Press, Cambridge, United Kingdom and New York, NY, USA, pp. 1199-1265. O'Meagher, B. du Pisani L., White, D.H., 1998. Evolution of drought policy and related science in Australia and South Africa. Drought Policy, Assessment and Declaration, July, 57(3), p. 231–258. Rogoff, G. 2013. Personal communication, 3 March 2011. Legislative development and amendment of the NBR. Pretoria: [Author]. South African Institute of Architects (SAIA), 2007. SAIA: Practice Manual. 1st edn. Johannesburg: SAIA. Sharpe, R.A., Thornton, C. R., Nikolaou, V. and Osborne, N. J., 2014. Higher energy efficient homes are associated with increased risk of doctor diagnosed asthma in a UK subpopulation. In: Environment International. Vol. 75, February 2015, pp. 234–244. South African Bureau of Standards (SABS) Standards Division, 2011a. SANS 10400-K The application of the National Building Regulations. Part K: Walls. Edition 3. Pretoria: SABS. South African Bureau of Standards (SABS) Standards Division, 2011b. SANS 10400-O:2011 The application of the National Building Regulations. Part O: Lighting and ventilation. Edition 3. Pretoria: SABS. South African Bureau of Standards (SABS) Standards Division, 2011c. SANS 10400-XA:2011 The application of the National Building Regulations. Part X: Environmental sustainability. Part XA: Energy use in buildings. Edition 1. Pretoria: SABS. South African Bureau of Standards (SABS) Standards Division, 2011d. SANS 204:2011 Energy efficiency in buildings. Edition 1. Pretoria: SABS. South African Bureau of Standards (SABS) Standards Division, 2011e. SANS 613:2011 Fenestration products - Mechanical performance criteria. Edition 1.2. Pretoria: SABS. South African Bureau of Standards (SABS), 2008. Standards Bulletin: June 2008. Pretoria: SABS. Sundell, J., Levin, H., Nazaroff, W. W., Cain, W. S., Fisk, W. J., Grimsrud, D. T., Gyntelberg, F., Li, Y., Persily, A. K., Pickering, A. C., Samet, J. M., Spengler, J. D., Taylor, S. T. and Weschler, C. J., 2011. Ventilation rates and health: multidisciplinary review of the scientific literature. In: Indoor Air, International Journal of Indoor Environment and Health. Vol. 21(3), pp. 191–204. Tennant, W., Reason C.J.C., 2005. Associations between the Global Energy Cycle and Regional Rainfall in South Africa and Southwest Australia. Climate, Volume 18, pp. 3032–3047. United Nations Environment Programme (UNEP), 2009. Submission of the United Nations Environment Programme (UNEP) Sustainable Building Initiative (SBCI) to the Ad Hoc Working Group on Long-Term Cooperative Action under the Convention (AWG-LCA), s.l.: UNEP. Wegelin, H., 2010. Construction specifications & standards 6.0 for Southern Africa. Pretoria: Author. World Trade Organization, 2015. World Trade Organization. [Online] Available at: https://www.wto.org/english/thewto_e/whatis_e/tif_e/org6_e.htm [Accessed 6 November 2015]
232

GUIDELINES FOR PEOPLE CAPABILITY ENHANCEMENT IN SUPPORT OF SUSTAINABLE FACILITY MANAGEMENT PRACTICES
Norliana SARPIN
1
Jay YANG 2 1 Department of Construction Management, Faculty of Technology Management and Business, Lecturer,
Universiti Tun Hussein Onn Malaysia, Email: [email protected] 2 Science and Engineering Faculty, Profesor, Queensland University of Technology, Email:
[email protected] Keywords: Capabilities, Facility Management, Guidelines, Life-cycle, Sustainability
Abstract
Facility managers can have a major influence on the sustainability agenda through operational and strategic management functions during the post construction phase. Sustainable practices in facility management can bring substantial benefits such as reducing energy consumption and waste, while increasing productivity, financial return and corporate standing in the community. Despite the potential, facility management practices have yet to embed sustainability ideas holistically. The lack of capabilities and skills and the existing knowledge gaps are believed to be among the barriers. Capabilities are vital to foster the competency of an organisation. To support sustainable practices, facility managers need to be empowered with the necessary knowledge, capabilities and skills. This research investigates the potential people capabilities factors that can assist in the implementation of sustainability agenda in facility management practices. Twenty three critical people capability factors were identified through a questionnaire survey. An interpretive structural model for people capability was then developed to identify the priority of critical factors and provide a hierarchical and interrelational structure among the factors. This paper focuses on the findings of three case-studies of professional facility management practices to develop guidelines to assist facility managers through appropriate actions of developing their capabilities. A set of guidelines for action and potential effects of each critical people capability factor was developed through the identification and integration of the different perceptions and priority needs of the experts. The guidelines helps provide directions for facility management personnel seeking to encapsulate the sustainability agenda in their practice.
1. Introduction
The construction industry is facing major environmental challenges worldwide due to its significant impact on the environment. To generate an effective built environment and achieve sustainable construction along the project life-cycle, more attention should be paid to the occupancy phase especially in facility management practices. Sustainable facility management is a significant environmental challenges and requires a concerted response from all construction industry players. The energy usage for power and maintenance during operation phase of a built asset alone account for approximately 45%, compared to 5% used during construction phase (CIOB, 2004). This scenario has increase the demand for sustainable FM to protect ecological processes and protect the wellbeing of future generation. Moreover, sustainability endeavours in FM practices will not only contribute to reducing energy consumption, waste and running costs, but also help improve organisational productivity, financial return and community standing of the organisation (Hodges 2005; Nielsen et al., 2009; Lai and Yik, 2006). However, despite the growing awareness of sustainability in FM, very few facilities managers and built asset owner positively uptake the sustainability idea and implement them in their operation due to the infancy of sustainability practice in the FM sector (Elmualim et al., 2008). This drawback has lead to a lack of understanding and skills that required to put the sustainability agenda into action (Elmualim et al., 2008). Proper capabilities and skills among FM practitioners can contribute hugely to the success implementation of the sustainability agenda in the FM sector (Hodges, 2005; Shah, 2007). Yet, FM practitioners still suffer from the lack of capabilities and inconsistency of skills to implement sustainability in their routines. Furthermore, issues such as the lack of sustainability knowledge and also knowledge gap add to the difficulty (Shah 2007; Elmualim et al., 2009; Elmualim et al., 2010). Transition to sustainability will not materialise until facility manager were empowered with the necessary knowledge and capabilities in order to face the sustainability challenges. This situation highlights the importance of considering capabilities, skills and knowledge approach as a pathway to enable the management of sustainability agenda. Therefore, in line with the potential of the FM and sustainability in construction industry, this research investigates the potential people capabilities factors that can assist in the implementation of sustainability agenda in facility management practices. Through a questionnaire survey done earlier, twenty three critical people capability factors were identified. An interpretive structural model for people capability was then developed to identify the priority of critical factor and provide a hierarchical and interrelational structure among the factors using pair-wise comparison study.
233

This paper focuses on the findings of three case-studies of professional facility management practices in order to develop a guidelines to assist facility managers developing their capabilities. A set of guidelines for action and potential effects of each critical people capability factor was developed through the identification and integration of the different perceptions and priority needs of the experts. The guidelines help provide directions for facility management personnel who are seeking to encapsulate the sustainability agenda in their practice.
2. Literature Review
FM professionals are at the forefront of integrating sustainable practices through their operational and management activities. In addition to their technical and operational skills, FM professionals have a great opportunity to make a valuable strategic contribution towards their organisation’s sustainable business. However, the concerning issue of limited capabilities in achieving this vision has risen an alarming situation and solutions were needed (Shah, 2007; Elmualim, 2013; Hodges, 2005). Due to this, the FM professionals need to understand and recognise how the growing importance of sustainability is influencing the way they discharge their duties, roles and responsibilities. FM personnel must become professionally competent and knowledgeable about the sustainability issues that will impact on their business environment, both operationally and strategically (Elmualim, 2013). In establishing a theoretical knowledge base guide through the data collection and analysis, a background review was conducted to understand what are the people capability (PCap) factors that would impact on the consideration of sustainability measures in facility management practice. This understanding contributed to the establishment of a basis to equip facility managers with the right knowledge, to continue education and training and to develop new mind-set, that in turn influences the sustainability endeavour in their practices. Twenty Three (23) critical people capability factors were identified as the important factors in the promotion of sustainability agenda in FM practices (Sarpin and Yang, 2013a; Sarpin and Yang, 2013b). These twenty three factors were grouped into five categories based on Wiek et al. (2011)’s classification for a similar application, including interpersonal capabilities, system thinking capabilities, anticipatory capabilities, normative capabilities and strategy capabilities. In this research context, interpersonal capability relates to enabling FM personnel to solve issues and respond to challenges of sustainability applications. System thinking is about being able to analyse complex systems across three different pillars of sustainability and over different scales. Anticipatory capability will facilitate analysis and evaluation of sustainability actions and consequences. Normative capability is to map, apply and resolve sustainability values and principles in a person that should either be discarded or maintained to sustain the balance of nature. Finally, strategic capability will contribute to specific sustainability implementation strategies in an organisation. Table 1 shows the 23 critical people capability factors.
Table 1 23 critical people capability factors for enhancing sustainability measures in FM practices
No. People capability (PCap) factors
Strategic capability
1 Understand the LCC and TCO technique 2 Understand whole-life value concept 3 Develop good relationship with the organisation's top management 4 Understand the organisation’s financial strategy 5 Ability to optimise the building space and equipment operations 6 Understand the design and construction issues related to FM practice 7 Familiar with the building system 8 Develop organisation's sustainability strategies 9 Ability to monitor and maintain equipment efficiency 10 Ability to specify the energy and environmental goals to associated stakeholders
Anticipatory capability
11 Take a long-term perspectives 12 Identify short-term and long-term consequences of any decision/plan 13 Vision for a better future 14 Identify direct and indirect consequences to people and ecosystems
Interpersonal capability
15 Ability to work across disciplines 16 Ability to motivate other stakeholders 17 Self-motivated 18 Communication skills 19 Collaboration skills 20 Ability to plan and implement sustainability efforts 21 Courage to make changes
System thinking capability
22 Understand the meaning, goal and issues of sustainable development 23 Understand the bigger picture of significant aspect of sustainable development
234

A three-level hierarchical conceptual framework (Figure 1) for people capability enhancement to support sustainable facility management practices has been designed as a basis for coordinating the systematic enhancement of sustainability measures (Sarpin and Yang, 2014). This three-level framework includes the expected outcome in the first level, the four groups of people capabilities in the second level and the significant people capability factors expanding from the survey in the third level. This figure shows the influence level of the people capability factors. In the basic level (Level 3), all the critical factors were positioned. These factors can impact on the factors in the next level (Level 2), which is the category of people capability factors. Following this, if the factors in Level 2 and Level 3 are achieved, then there is a chance to implement sustainability in FM practices. It is expected that this framework can provide the right foundation to equip the FM personnel with the tools necessary to develop the right knowledge, education, training and mind-set to support the implementation of the sustainability agenda in FM practices.
Figure 1 Conceptual framework for people capabilities in promoting sustainability in FM practices
3. Research Methodology
Three case studies were conducted to further investigate the issues of people capability in supporting sustainability in FM especially at the project level. The selected projects are all related to the FM sector and had a sustainability agenda to reflect the purpose of the research. Two of the projects were located in Malaysia, (Perak and Johor) and the third was located in Brisbane, Australia. The building function in each project was different and this provided interesting comparisons. The variety in the project characteristics made the case studies more thorough, since they could indicate the applicability of the developed framework for any type of FM project. Table 2 summarises the characteristics of each case study project.
Level 1 : Outcome
Level 2 : PCap
Category Level 3 :
PCapFactors
Mechanism to obtain the right
knowledge, education,
training and mind-set to
promote sustainability agenda in FM
practices
Strategic capabilities
Anticipatory capabilities
Interpersonal capabilities
System thinking
capabilities
1. Understand the LCC and TCO technique 2. Understand the whole-life value concept 3. Develop good relationship with the organisation's top
management 4. Understand the organisation’s financial strategy 5. Ability to optimise the building space 6. Understand the design and construction issues related to
FM practice 7. Familiar with the building system 8. Develop the organisation's sustainability strategies 9. Ability to specify the energy and environmental goals to
associated stakeholders 10. Ability to monitor and maintain equipment efficiency
1. Take a long-term perspective 2. Identify short-term and long-term consequences and risk
of any decision/plan 3. Vision for a better future 4. Identify direct and indirect consequences to people and
eco-systems
1. Ability to work across disciplines 2. Ability to motivate other stakeholders 3. Self-motivated 4. Communication skills 5. Collaboration skills 6. Ability to plan and implement sustainability efforts 7. Courage to make changes
1. Understand the meaning, goal and issues of sustainable development
2. Understand the bigger picture of significant aspects of sustainable development
235

Table 2 Characteristic of case study projects
The main purpose of this case study was to help to complete and to validate the people capability factors framework in promoting sustainability in FM practices as well as to set as the foundation to develop a set of guidelines of action and potential effect for each of the critical people capability factors. Accordingly, two main collection methods were used in the case study, namely, interviews and document analysis.
3.1 Semi-Structured Interviews
Semi-structured interviews were used to explore detailed information for each critical factor identified in previous stage. The questions were pre-formulated based in the framework developed. In semi-structured interviews, a number of interviewer questions are prepared in advance, however, such prepared questions are designed to be relatively open, which means that subsequent questions must be improvised in a careful and theorised way (Wengraf, 2001). The flexibility of semi-structured interviews gave additional space to the interviewee to provide detailed information based on their capability. It also allowed the researcher to guide and focus on achieving the research objectives. As a result, the interviewees could answer the questions in depth and detail. The questions asked to the respondents were including; (1) Question 1: focused on how to improve the proposed framework and model and ensure its comprehensiveness, (2) Question 2: for validation of framework and (3) Question 3 sought the respondent’s opinions in order to develop the guidelines. Ten respondents were selected as the participant in the semi-structured session. These ten respondents were key players in FM with various roles and responsibilities in the three selected case study projects. These interviewees held senior positions in the project, namely, directors, chief operating officers, FM consultants and senior engineers. Before the interview was conducted, invitation letter, consent form, research framework and main questions were sent to the potential respondents to make sure they agreed to participate and to give them general ideas about the objectives of the interview. This is important to reduce interview time and to allow respondents to answer the questions more accurately.
3.2 Qualitative Content Analysis
There are numerous approaches for analysing qualitative data. Content analysis is used in many studies in communication, journalism, sociology, psychology, business and nursing (Neundorf, 2002). Berg (2009) defined content analysis as a careful, detailed, systematic examination and interpretation of a particular body of material in an effort to identify patterns, themes, biases and meanings. The purpose of content analysis is to describe the content of the respondents’ comments in a systematic way and to classify the various meanings expressed in the material that has been recorded (Elo and Kyngäs, 2008). This research adopted the qualitative content analysis approach in order to obtain clear concepts and propositions. To provide valid and reliable inferences, qualitative content analysis using the inductive approach generally follows six systematic steps in processing the data, (1) prepare the data, (2) define the unit of analysis, (3) perform open coding, (4) create categories (5) abstract the content, and (6) report the findings. These steps were followed in this research to analyse the content of the data from the interviews and document review. Twenty three critical issues were evamined and analysed from the semi-structured interview. The researchers extracted information from the interviews by using codifying and categorising technique for qualitative data. In order to facilitate the implementation of the people capabilities that support sustainable FM practices, a set of guidelines to demonstrate the actions and potential effects of each people capability factor were formulated. The result of this process is discussed in the next section of this paper.
4. Research Findings
Semi-structured interview was used as the tool to validated and explored in depth the critical factors of people capability that have the potential to support the implementation of sustainable practice in FM. This method allowed the respondents to have an overall view of the objectives of this research. As a result, Table 3 summarises the main findings extracted from 3 case projects selected in relation to each of the critical people capability factors. A set of guidelines to demonstrate the strategic actions and potential effects of each critical factors were then developed as discussed in the next sub-section.
Project Criteria Characteristics
Case Project A Case Project B Case Project C
Location Perak, Malaysia Johor, Malaysia Brisbane, Australia
Sustainability agenda in the project
Have a sustainable design/practice
Have a sustainable design/practice
5 Star Green Star - Office As-Built v2 Certified Rating.
Participation Agreement to participate by all respondents
Agreement to participate by all respondents
Agreement to participate by all respondents
Project characteristics Higher education institution buildings
Custom and Immigration buildings
Commercial and office building
236

Table 3 Main findings from case projects
No. People Capability Factor Findings 1 Understand the LCC and TCO technique Client’s need statement is translated
Designer uses client’s need as the term of reference in designing
Advantageous characteristics of the PFI model Planning for the long-term and future use of the facility
2 Understand the whole-life value concept An important consideration to avoid unnecessary wastage and unnecessary loss of opportunity
The whole-life value concept can be employed as FM inputs are considered during the design stage
The whole-life value concept can be considered in the value management exercise
3 Develop good relationships with the organisation’s top management
A structured system and process of communication can assist the relationship with the top management.
Kick-off meeting is the best platform to build a good relationship
Good relationships help to influence the decision-maker in infusing sustainability in the project
4 Understand the organisation’s financial strategy Helps to convince the decision-maker to invest financially in the sustainability efforts
The proposed sustainability effort should tally with the project’s financial budget
5 Ability to optimise the building space and equipment operations
Value for money concept; each space in a building must be fully utilised
Built for a purpose A simulation can identify the space required for a certain
facility in order to optimise the space usage Building audit to analyse the building’s capacity to
support the current and future needs Use of software such as Computer-Aided Facility
Management software can help in building space optimisation
6 Understand the design and construction issues related to FM practice
Help to solve the problem related to design (e.g. the usage of the standard design or drawings) that will lead to maintainability issues in the future
FM personnel involvement during the design and construction stage will support the sustainability effort
In a PFI project, the FM personnel are given a fair chance to contribute to the design
FM personnel’s input during the design and construction stage needs to be appreciated, so that the agenda of sustainability is taken into consideration
Even a small consideration such as the selection of the water tap can have a big impact on the sustainability agenda of the facilities
7 Familiar with the building system FM personnel must understand the function, operating parameters and limitations of the building system and the basic requirements to run the building system that will suit the user’s needs and requirements
Many issues related to the building system can be prevented at the earliest stage by using the right equipment for the right purpose
By understanding the building system, FM personnel can be creative in modifying the system’s operation in order to promote sustainability such as saving the energy used for the operations.
The implementation of an automated system such as Building Automation System
8 Develop the organisation's sustainability strategies
Involved in three aspects, namely, policy, process and procedures
Starting point of sustainability efforts Structured the strategy towards sustainability practices
9 Ability to monitor and maintain equipment efficiency
What you can measure, you can manage FM personnel must know the equipment well in order to
identify any problem; then they can measure and compare the resources used so that, the use of the building equipment and installation is at the optimum level
Use the computerised system to assist the monitoring and maintenance
10 Ability to specify the energy and environmental goals to associated stakeholders
FM personnel need to strategically specify all of the stakeholders involved in order to get their agreement in supporting the sustainability efforts
11 Take a long-term perspective Sustainability is for a long-term benefit
237

Ability for projected future hurdles, potential risks or problems that can probably become an issue in the future
12 Identify short-term and long-term consequences of any decision/plan
Anticipate the future and prepare for the events that have been anticipated
13 Vision for a better future The vision of FM personnel will influence the future Related to the awareness of sustainability among the
project stakeholders 14 Identify direct and indirect consequences to
people and ecosystems The predicted consequences to people and ecosystems
were considered first hand in the project (e.g. environmental impact assessment)
15 Ability to work across disciplines FM personnel must have a holistic view
16 Ability to motivate other stakeholders Relates to a good relationship with the project stakeholders
Focus on how all the stakeholders can teach each other about sustainability
17 Self-motivated In order to motivate others, FM personnel themselves must be motivated to do their jobs with a sustainability focus
FM personnel must be self-motivated to put his/her effort into thinking about what needs to be done in order to push the sustainability effort forward
18 Communication skills How to explain, defend the sustainability proposal, speaking confidently
19 Collaboration skills Collaborate with other stakeholders and help to motivate each other to implement sustainability
20 Ability to plan and implement sustainability efforts
Drive the FM personnel to be self initiators, work independently, understand the case and make their voices heard by the decision-maker.
Drive the sustainability effort in the project 21 Courage to make changes Will give FM personnel the courage to express their
opinion, and drive them to defend their stance on sustainable issues and speak up
Courage comes from the FM personnel’s interest, so the interest in sustainability can give the courage to stand by your opinion
22 Understand the meaning, goal and issues of sustainable development
Build the awareness of sustainability implementation in FM practices
The basics and the beginning of the sustainability effort in FM
23 Understand the bigger picture of significant aspects of sustainable development
Sustainability must be seen in the widest view
4.1 Guidelines
The information and ideas from the respondents in semi-structured interview sessions are important to get an insight view about the issues and factors in improving sustainability practice in FM. A set of questions were asked to the respondents on how can the people capability factors promote sustainability in FM practices. During the interviews session, the experts were asked about the people capability factors in relation to: (1) what can be done to acquire capabilities to deal with these factors, and (2) how these factors can support the application of sustainability in their practice. Qualitative content analysis helped to analyse the informations and facilitate the formulation of actions and potential effects guidelines for each of the critical people capability factors. Due to the limitation of number of pages allowed for this paper, Figure 2 shows the example of guideline for one of the 23 factors investigated in this research, which is “Familiar with the building system”. The full set of guidelines can be obtained in the author’s PhD thesis entitled “Developing People Capabilities for the promotion of Sustainability in Facility Management Practices”. The guidelines were formulated based on the codifying and categorising technique from the findings of the interviews. The Actions and Effects Guidelines were considered highly valuable in improving sustainability in FM practices. The guidelines can provide direction for FM personnel seeking to encapsulate the sustainability agenda in their practice.
238

Guideline 2: Familiar with the building system
Category Strategic actions Potential effects
Strategic capabilities
Involve the building operators during the design phase to prevent design problems that might lead to operation and maintenance issues over time
Involve the building operators in new sustainability initiatives such as retro commissioning, energy conservation and pollution prevention to provide learning opportunities
Collaborate between building operators and senior staff or project consultants to provide skill building and cross-training
Consider the client's operational needs Apply the Computer-Aided Facility
Management (CAFM) system to assist in facility maintenance and sustainability initiatives
Increase the FM professionals’ creativity in the
way they modify the system operation Improve energy efficiency Improve water efficiency Improve waste reduction Encourage the application of the automated
building systems that support sustainability practice
Enhance the building system design in terms of the capacity and flexibility to meet the building usage load or building requirement
Figure 1 Example of the Actions and Effects Guidelines
5. Conclusion
While there is an increasing level of awareness to incorporate sustainability principles into FM practice, this research found that, the industry professionals need to be equipped with proper knowledge, skills and capabilities to undertake the challenges associated with pursuing sustainable practice since these elements have been identified as their drawback. With such a background, people-centred approaches which have a good prospective to assist facility manager in this context are discussed in this paper. 23 critical people capability identified in the early stage of this research were further explored using semi-structured interviews.This research has identified what can be done to acquire capabilities to deal with the critical people capability factors and how these factors can support the application of sustainability in their practice. Through the identification and integration of the different perceptions and priority needs of the experts, a set of guidelines was developed. In this paper, one of the factors, Familiar with the building system, is shown to demonstrate an effectiveness of guidelines developed in improving FM professionals’ capability in implementing sustainability in their practices. It is expected that these guidelines can provide direction for FM personnel seeking to encapsulate the sustainability agenda in their practices.
6. References
Berg, B.L. 2009. Qualitative research methods for the social sciences. 7th edition ed: California State University, Long Beach. CIOB. 2004. Sustainability and construction. Ascot: Chartered Institute of Building. Elmualim, A.A. 2013. "Sustainability in FM: Trends in policy and FM competence consequences." Paper presented at the World Building Congress 2013, Brisbane Convention & Exhibition Centre, Brisbane, Queensland. Elmualim, Abbas, A Czwakiel, Roberto Valle, Gordon Ludlow and Sunil Shah. 2008. "Barriers for implementing sustainable facilities management." In World Sustainable Building Conference September 2008, Melbourne, Australia, edited: CSIRO, Australia. Elmualim, Abbas, A Czwakiel, Roberto Valle, Gordon Ludlow and Sunil Shah. 2009. "The Practice of Sustainable Facilities Management: Design Sentiments and the Knowledge Chasm." Architectural Engineering and Design Management 5: 91-102. Elmualim, Abbas, Daniel Shockley, Roberto Valle, Gordon Ludlow and Sunil Shah. 2010. "Barriers and commitment of facilities management profession to the sustainability agenda." Building and Environment 45 (Compendex): 58-64. Elmualim, A.A. 2013. "Sustainability in FM: Trends in policy and FM competence consequences." Paper presented at the World Building Congress 2013, Brisbane Convention & Exhibition Centre, Brisbane, Queensland. Elo, Satu and Helvi Kyngäs. 2008. "The qualitative content analysis process." Journal of advanced nursing 62 (1): 107-115. Hodges, P. 2005. "A facility manager's approach to sustainability." Journal of Facilities Management Vol. 3 (Iss; 4): pp.312 - 324.
239

Lai, J.H.K. and F.W.H. Yik. 2006. "Knowledge and perception of operation and maintenance practitioners in Hong Kong about sustainable buildings." Facilities 24 (3/4): 90-105. Neundorf, K. 2002. The content analysis guidebook: Sage Publications Inc., Thousands Oaks, CA.Neundorf (2002)?? Nielsen, Susanne Balslev, Jesper Ole Jensen and Per Anker Jensen. 2009. "Delivering Sustainable Facilities Management in Danish Housing Estates." In 2nd International Conference on Sustainibility Measurement and Modelling ICSMM 09 © CIMNE,Barcelona. Sarpin, Norliana and Jay Yang. 2013a. "Enhancing people capabilities for the promotion of sustainability in facilities management practices." In 38th AUBEA International Conference, University of Auckland, New Zealand. Sarpin, Norliana and Jay Yang. 2013b. "People capabilities for promoting sustainability in facilities management practices." In World Building Congress 2013, 5-9 May, Brisbane, Australia, International Council for Research and Innovation in Building and Construction (CIB). Sarpin, Norliana & Yang, Jay (2014) “A framework for people capability enhancement to support sustainable facility management practices”. In World Sustainable Building Conference 2014, Barcelona, Spain. Shah, Sunil. 2007. Sustainable Practice for the facilities manager: Oxford; Malden, MA: Blackwell Publishing, 2007. Wengraf, T. 2001. Qualitative research interviewing: SAGE Publications, Inc., London. Wiek, A., L. Withycombe and C.L. Redman. 2011. "Key competencies in sustainability: a reference framework for academic program development." Sustainability Science: 1-16.
240

LESSONS LEARNED FROM SOLTRAIN, SOUTH AFRICA'S ONE MILLION SOLAR WATER HEATERS INITIATIVE AND FROM INTERNATIONAL CHAMPIONS - HOW TO IMPROVE
MARKET PENETRATION IN SOUTH AFRICA
Dieter HOLM 1
1 Regional coordinator SOLTRAIN, Email: [email protected] Keywords: Solar Water Heater (SWH), legislation, success factors, market penetration, Southern African Solar Thermal Training and Demonstration Initiative (SOLTRAIN), kWth (kilowatt thermal) Abstract
The study identifies the success factors of the four world champions in per capita solar water heating market penetration. These are Cyprus, Israel, Austria, and Barbados with 780, 546, 537, and 457 m2 glazed SWH per 1000 inhabitants, respectively, in 2012. The 58-nation average is only 90.1 m2/ 1000 inhabitants. Despite an ideal climate and the chronic power crises, South Africa ranks only 42nd with 10 m2 per 1000, or one-hundredth square metre per person. The champions' success factors are compared with the policy and implementation by Eskom of the South African One Million, (plus Four) Million SWH initiatives that attained 40% of the limited target by the due date. The comparison highlights what worked well, and what improvements for future solar thermal initiatives are suggested in order to reach a South African market penetration, within 15 years, that would be comparable to that of Barbados three years ago. Bearing in mind that SWH normally provides at least 24-hour energy storage, the beneficial impacts on the national grid, economy, job creation, and environment, are provided.
1. Introduction
This study is based on more than six years' experience with the SOLTRAIN initiative (www.SOLTRAIN.co.za), and compares the local lessons learned with those of international SWH champions, using the descriptive-deductive research methodology (Leedy & Omrod, 2015). Key success factors of the world champions as identified in the international literature are listed, adding the local South African lessons from the Department of Energy's (DoE) initiatives, as well as the author's own experience with SOLTRAIN. Common traits and barriers are identified and ranked, including the impact of climate, leading to conclusions and recommendations for local application. This methodology is believed to be apposite because it can be replicated and verified by others without deleterious policy experiments at the expense of the recipients.
Figure 1 SWH capacity installed per 1000 inhabitants. South Africa's SWH capacity per 1 000 inhabitants
is only 7kWth, less than one ninth of the 58-nation average. South Africa trails in the 42nd position out of 58, and is sliding back. Cyprus, an island with less sunshine than South Africa, has 546kWth/1000 inhabitants (or 780 m
2 per 1000 inhabitants). That is 78 times more than South
Africa's installed capacity in the year 2012. (After Mauthner & Weiss, 2013).
Sunny South Africa ranks far below 63.1 kW th/1000 inhabitants average in the world league of 58 SWH nations. Its installed thermal SWH capacity per 1000 capita equals about one ninth of the global average
241

(green line in Figure 1). The installed glazed SWH area per inhabitant equals the size of a postcard. Cyprus sports 78 times South Africa's glazed SWH area per inhabitant.
2. Lessons learned from world champions
2.1 Cyprus, the world champion since records were taken
Cyprus (http://www.eurobserv-er.org) is a Mediterranean island (35ºN), further removed from the equator than Cape Town. Its area of 9 251 km2 is less than half of Gauteng's 18 855 km2. The population is 1.14 million, or 9.3% of Gauteng's 12.3 million. During winter, the daily solar irradiation on an optimally inclined surface is 3.59 kWh/m2, while Johannesburg's is 6.18 kWh/m2 (1.7 times as much), while the cold-water temperature is about the same. The first locally fabricated SWHs were installed in 1960. As expected, there were teething problems like water leakages, clogging of pipes and poor municipal water supply. As a result of high imported fuel prices, and a national striving for autonomy, the penetration recently reached 93.5% for residences, 50% for hotel apartments, and 44% for hotels. The typical residential unit is mounted on a four-legged metal tank-stand with a coldwater reservoir at the top (municipal supply intermittency), a hot water geyser below, and two 3-m2 collectors in series feeding the hot water tank via a thermosyphon system. A 3 kW electric resistance heater completes the installation. Direct systems are common in areas below 370 m altitudes where frost risk is reduced. Success factors, in order of priority, are:
1. The enterprising Cypriot SWH industry took the lead without any state subsidies, except a subsidised SWH test centre. The latter helped with improving the quality, and with building user confidence. Neighbouring islands with similar climatic, energy and finance conditions have not achieved comparable results;
2. The summer tourism season coincides with maximum solar radiation. This was exploited in the industry promotion targeted at hotels. Again, comparable countries have not reached Cypriot achievements.
3. Government (Department Commerce, Industry and Tourism) cooperated in SWH promotion by - providing technical support (test facilities), product improvement, consumer advice on efficient
SWH utilisation, and R&D that is generally unaffordable, even to established small, medium and micro enterprises (SMMEs);
regulating duty free raw materials; assisting via technical standards (Solar Keymark); enforcing SWH installations on state-built housing; simplifying legislation, without local content enforcements (Large-Scale Utilization of Solar
Energy in Cyprus. http://old.insula.org/islandsonline/cyprus-1.pdf.). Cyprus retains its multi-year world leadership by a considerable margin. Their success is first and foremost ascribed to the entrepreneurship of industry, good promotion, and policy support by government in places where the private sector cannot cope.
2.2 Lessons from Israel
This Mediterranean country occupies an area of 20 855 km2, which is only 14% larger than Gauteng, South Africa's smallest province. The daily winter insolation on an optimally inclined surface in Jerusalem is 3.99 kWh/m2, that is 35.5% less than Johannesburg's, while their water supply temperature is 3 K colder than Johannesburg's. Hence, climatic conditions are slightly better than those of Cyprus, but much less favourable than Johannesburg's. The market penetration per household in the residential sector is more than 90%. In Israel it is neither industry nor environmentalism that was the initial driver of SWH, but the experience of the 1950s energy crisis, and the political will of a country on a political island. Israel's first Prime Minister, David Ben Gurion, had a SWH installed on his home, demonstrating leadership by example (Sternman, 2009). In 2008, the Israeli Knesset promulgated a law that all water heating of the top nine storeys of all buildings shall be SWH. Understanding its situation, Israel's population accepted and supported this rigorous top-down approach. By 1983, as many as 60% of the population used SWH (Metaefficient.com, 2015). The success of this very simple, if draconian, measure is stunning, and only comparably to China's state intervention that forbids the use of electric water heaters in certain areas. Today, 80% of the local market is replacements, and 20% new installations (Hardi, 2011). The average economic payback period is currently four years. What is a noteworthy lesson - and well worth emulating - is that this policy has remained in place for 35 years, surviving many government changes. It should also be mentioned that this success is achieved without any overt or covert subsidies. Government only supports R&D and SWH exports, which is a significant contribution.
2.3 Lessons from Austria
Austria debunks the myth that favourable climate conditions drive SWH market penetration. Its capital city, Vienna, receives only 1.54 kWh/m2.d on an optimally inclined collector during a typical winter day (Johannesburg: 6.18 kWh/m2.d), and the average Viennese winter air temperature is 0.1 ºC. Yet, this land-
242

locked country, that has an area of 83 855 km2 (65% of South Africa's Western Province area) has consistently occupied position member three in global ranking. Its SWH history is very different from the first two countries: A 700 MW nuclear reactor had been built in 1972 near Zwentendorf on the Danube, 30km upstream of Vienna. The conservative catholic and the liberal youth groups joined forces in environmentally motivated anti-nuclear demonstrations that reached such intensity that their Prime Minster, Kreisky, called for a referendum that was held on 5 November 1978. Approximately two thirds of the potential electorate voted with a 50.5% ballot against. Consequently the nuclear power station, that had been designed to provide 10% of Austria’s power and was ready to go into production, was switched off and dismantled. The Austrian protesters, and the population, accepted responsibility to find, develop and implement viable alternatives by using sustainable energies. A do-it-yourself (DIY) SWH building movement was born. Equipment was borrowed to DIY SWH builders, on condition that they pass on the knowledge received from the Train-the-Trainer team. This initiative morphed into local Austrian SWH industries and research institutes that are globally competitive. Today, approximately one half of Austria's solar thermal equipment production is being exported, earning foreign currency and creating local jobs. Austria is also working intensively on solar district heating and the solar thermal upgrading of the existing building stock. About 800 000 oil burners have to be replaced with solar thermal devices, as this will have the greatest impact on reducing Green House Gases and on Austria's energy autonomy. The core lesson from Austria is that an environmentally conscious and committed grassroots culture overcomes very adverse political decisions and difficult climatic conditions, eventually leading to world-class industries, jobs, expertise, and - eventually - persistent political endorsement.
2.4 Lessons learned from Barbados
"Barbados" is Portuguese for the "The Bearded Ones", presumably derived from the air roots of local trees. This eastern-most Caribbean island had been a British sugar plantation for a long time (The British Union Oil Company has drilling rights, and there is a contention for rights with Venezuela). It covers 431 km2 and it is situated 13º 10' N, with an all-year mild humid climate. An optimally faced solar collector will receive 5.10 kWh/m2.d in winter (3.3 times the Viennese solar irradiation), and the average municipal water supply temperature in winter is a lukewarm 26 ºC. During the 1950s, the renowned South African solar pioneer, Austin Whillier, did SWH experiments in Barbados. Canon Andrew Hatch, who made a SWH out of an old oil drum for his church, followed him. In 1973 James Husbands convinced Prime Minister, Tom Adams, to install a SWH on his home, saving 70% on his home gas consumption. During 1974, full tax exemption was granted on SWH material (-20%), and 30% was levied on electric geysers. In 1977 SWH was mandated on all government houses. 1980-92: SWH installations were fully tax deductible (maximum amount: $1750.00). Credit unions joined in, helping to overcome the initial investment barrier. A key lesson is similar to Israel’s: "It was very important that successive governments were consistent in their support" (Nurse, 2015).
3. South Africa
The 1 219 090 km2 country in the southern tip of Africa (22ºS to 35ºS) is rich in minerals and sunshine. Winter sunshine of 6.18 kWh/m2.d on an optimally tilted surface exceeds the insolation of all the world's solar champions. World-leading solar pioneer, Austin Whillier, best known for the textbook Hottel-Whillier formula, worked at South Africa's Building Research Institute in the early 1970s with D.N.W. Chinnery. The country was politically an island. After the oil crisis, South Africa moved into coal-generated electricity with Eskom becoming the fifth largest global utility. The pioneer spirit waned after 1994, when the South African economy transmuted from an industry-based economy to an urbanised consumer economy, with both the state and the private sector increasingly living on debt. Neither the population nor the leadership had any experience of the environmental revolution of the 1970s that had such a strong impact on Europe, including Austria. The state-owned vertically integrated utility providing over 90% of the country's electricity from coal and nuclear-based sources was run from a power surplus into a chronic shortage within the space of about one decade, in spite of the country’s power consumption having decreased as a result of de-industrialisation, energy efficiency, localized generation and global economic decline.
3.1 The Renewable Energy Independent Power Producer Procurement Programme (REIPPPP) by the DoE
A Renewable Energy Feed-in Tariff was developed by the Department of Energy in lengthy consultations with experts, the public, and industry. It was abandoned over night by the Department in 2012 to be replaced by the REIPPPP, a highly successful initiative that reduced both renewable energy prices as well erection times to about half of new coal-generated electricity. Social upliftment programmes were integrated, and 40% local value content ("localization") was prescribed, resulting in the establishment of indigenous
243

industries. For unknown reasons solar thermal energy was excluded. Lead by a project team consisting of recognized local and international experts, unfettered by red tape, the local financing sector was actively and successfully involved. Part of the initial success is ascribed to the coincidence that the programme was started during a time when there was a lull in international renewable energy activities (Eberhard et al., 2014). Large enterprises that had grown as a result of the Feed-in Tariff in their home countries could offer competitive prices. The REIPPP programme is aimed at large companies, excluding SMMEs.
3.2 One million (by 2014) and four million (by 2020) SWH targets by the DoE
On 23 June 2009, the Minister of Energy announced in her budget speech: "The Department will ensure that one million solar water heaters (SWHs) are installed in households and commercial buildings over a period of five years" [emphasis added]. This was followed by another promise of "Four Million SWHs by 2020". The implementation contract was given to Eskom, the state-owned utility that was already battling "to keep the lights on". Eskom's "SWH Rebate Scheme" started late, and was subject to many changes, most significant of which was the sudden introduction of a 70% local content demand of the collector and tank, respectively. This was almost double the percentage prescribed to REIPPPP contractors. About 40% of the one million target, or 8% of the total 5 million target was installed by the target date, the end of 2014, when Eskom handed the project and remaining money back to DoE during the Christmas festive season. "The government's ambitious solar water heating rebate programme has fallen dismally short of its target" (Mail and Guardian, 2015). The project had been monitored and verified by Deloitte & Touche, while the system tests, as well as the the local content verification, were assigned to the South African Bureau of Standards (SABS). In addition, the Gesellschaft für Internationale Zusammenarbeit (GIZ) provided a handheld Geographic Information Systems (GIS) instrument that could identify each unit as provided by Eskom. Verified details of installed units and their positions have been promised to be put in the public domain on a future date. Decisions were increasingly taken unilaterally, consulting neither industry nor recipients of the systems. There were no international advisors. The committments of the One Million SWH programme and the Four Million SWH programme "ensured" by the Minister of the DoE have not been fulfilled, nor have they been resumed by the DoE since Decemder 2014 until the time of writing. The main lessons from the DoE's Five Million SWH Initiatives were that Eskom should not have been placed in this invidious position, an independent executive panel should have been appointed as for the successsful REIPPPP, stakeholders should have been consulted prior to the start, and regularly during the course, the policy should not have been changed mid-stream, recordings should have been done transparently in the public domain using electronic devices like the one developed by GIZ, rebate payments should have been effected within 30 days, quality control should have been exercised over installations with service contracts in place.
4. The Southern African Solar Thermal Training and Demonstration Initiative (SOLTRAIN)
4.1 Background
SOLTRAIN, an initiative sponsored by the Austrian Development Agency (ADA) and OFID, aims to contribute to an accelerated transition to sustainable energies, specifically solar thermal in Lesotho, Namibia, Mozambique, South Africa and Zimbabwe. SOLTRAIN 2 (01/11/2012 to 28/02/2016) follows on the success of its three-year predecessor. Austrian experts transferred their experience in 13 high-level Train-the-Trainer workshops. Trainees then held 41 Dissemination Workshops with 925 participants. The Austrian-trained persons were invited to submit entries for partially subsidised large installations within the Solar Thermal Flagship Districts of the partner countries. These installations serve to create awareness with policy decion makers who can readily visit installations and interact with end users. 98 large systems averaging more than 20m2 have been installed to date, with a special booklet covering the essential information. 11 policy workshops have been held for 292 participants. 5 Solar Demonstration trailers have been built to be taken to energy related events. A SWH test site has been partially sponsored by SOLTRAIN at the Centre for Renewable Energy of the University of Stellenbosch (CRSES) where Research and Development (R&D) can be conducted. As a result of the positive feedback of SOLTRAIN 1 & 2, a next three-year SOLTRAIN 3, with more participating countries in southern Africa, is in the offing (AEE INTEC et al., 2014).
4.2 Lessons learned in SOLTRAIN 1 and 2
Some of the salient lessons learned in SOLTRAIN1 were that the four consecutive key barriers to SWH market penetration were:
A lack of Awareness, followed by A lack of Acceptance or Aspiration, followed by A lack of Accessibility , and A lack of Affordability or Financing
To create more awareness, it was decided to create concentrated Solar Thermal Flagship Districts in SOLTRAIN 2 where stakeholders, including government participants, have the advantage of being able to
244

visit many installations within one-day trips, with direct access to large and small installations, and to talk to their users (Figures 2 and 3).
Figure 2 Solar Thermal Flagship District, Gauteng within a 50 km radius around Centurion Gautrain
station. Various colours represent existing clusters of solar thermal systems. The Flagship District was placed in the area of highest concentration. (Image: GIZ)
Figure 3 Solar Thermal Flagship District Western Cape within 100km radius around Stellenbosch. The
area covered equals 37% of the entire area of Austria, including water bodies and the Alps. The relatively large area was motivated by the lower density
4.2.1 Solar thermal scope Another lesson about awareness was for the public and policy makers to comprehend the true scope of solar thermal energy, and what had already been achieved elsewhere. It became clear that about half of the final energy (the energy used at the point of consumption) is in the form of heat, a substantial part of which can be served on site by solar thermal energy (Figure 4).
245

Figure 4 About half of the national final energy is heat
Solar thermal energy includes solar heating, cooling and processing in the residential, commercial, agricultural and industrial sectors. It is much more than small solar water heaters on residential roofs. Solar thermal installations of enormous scale have been implemented (Figure 5).
If large-scale solar thermal with annual energy storage is viable in Canada (Figure 6), then there is no reason why it should not be in Southern Africa.
Heat 50%
Transport 30%
Electricity 20%
Figure 5 Biggest installation worldwide in Saudi Arabia 36 000m2 or 25MWth (photo: AEE-Intec)
246

Figure 6 Solar district heating with annual heat storage. Drakes Landing, Canada (photo: AEE-Intec) As a result of the SOLTRAIN programme, large solar water heating installations were implemented in South Africa (Figures 7 & 8)
Figure 7 The 700m2 SWH system at Onderstepoort, University of Pretoria doubles up as protected parking
(photo: HolmsandFriends)
247
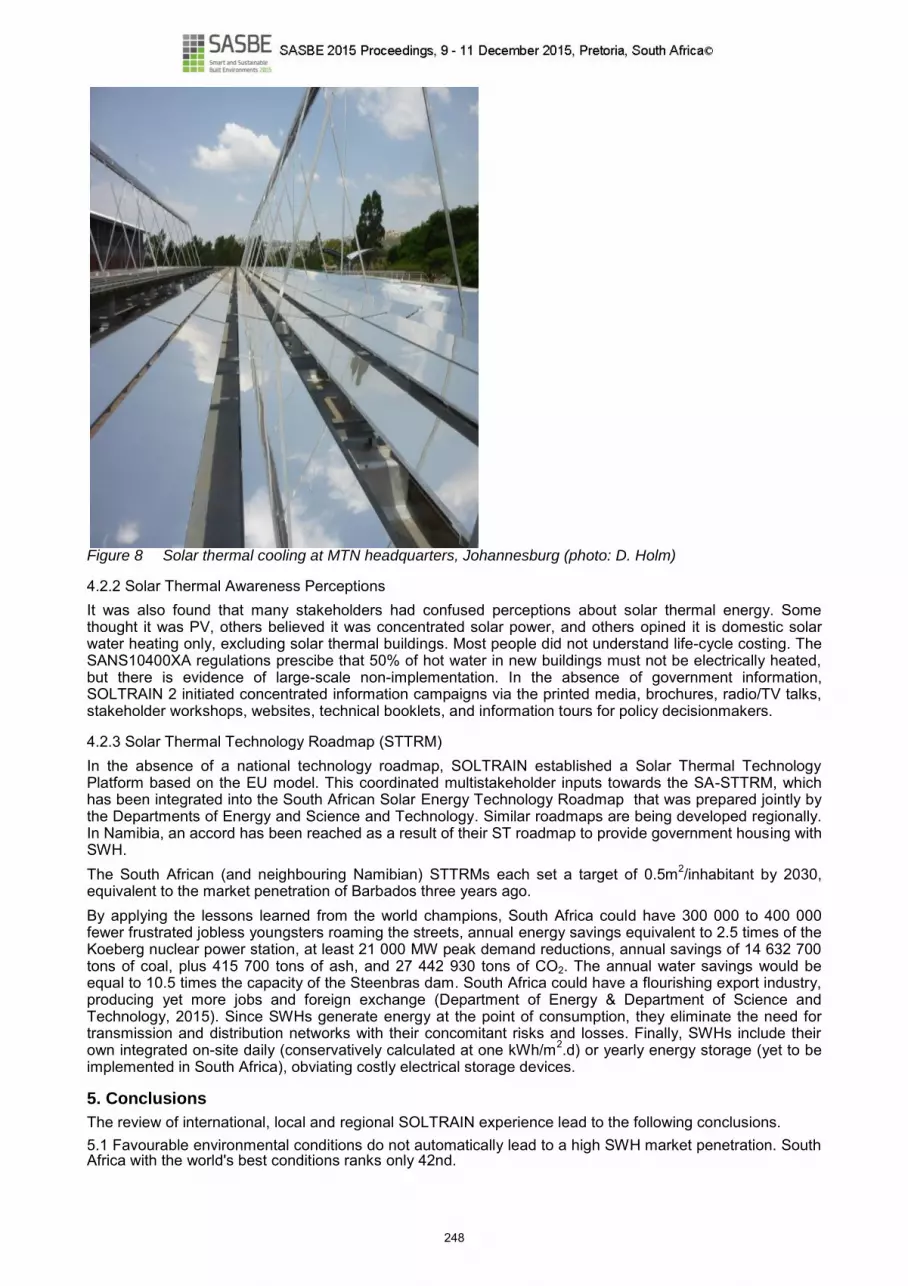
Figure 8 Solar thermal cooling at MTN headquarters, Johannesburg (photo: D. Holm)
4.2.2 Solar Thermal Awareness Perceptions It was also found that many stakeholders had confused perceptions about solar thermal energy. Some thought it was PV, others believed it was concentrated solar power, and others opined it is domestic solar water heating only, excluding solar thermal buildings. Most people did not understand life-cycle costing. The SANS10400XA regulations prescibe that 50% of hot water in new buildings must not be electrically heated, but there is evidence of large-scale non-implementation. In the absence of government information, SOLTRAIN 2 initiated concentrated information campaigns via the printed media, brochures, radio/TV talks, stakeholder workshops, websites, technical booklets, and information tours for policy decisionmakers.
4.2.3 Solar Thermal Technology Roadmap (STTRM) In the absence of a national technology roadmap, SOLTRAIN established a Solar Thermal Technology Platform based on the EU model. This coordinated multistakeholder inputs towards the SA-STTRM, which has been integrated into the South African Solar Energy Technology Roadmap that was prepared jointly by the Departments of Energy and Science and Technology. Similar roadmaps are being developed regionally. In Namibia, an accord has been reached as a result of their ST roadmap to provide government housing with SWH. The South African (and neighbouring Namibian) STTRMs each set a target of 0.5m2/inhabitant by 2030, equivalent to the market penetration of Barbados three years ago. By applying the lessons learned from the world champions, South Africa could have 300 000 to 400 000 fewer frustrated jobless youngsters roaming the streets, annual energy savings equivalent to 2.5 times of the Koeberg nuclear power station, at least 21 000 MW peak demand reductions, annual savings of 14 632 700 tons of coal, plus 415 700 tons of ash, and 27 442 930 tons of CO2. The annual water savings would be equal to 10.5 times the capacity of the Steenbras dam. South Africa could have a flourishing export industry, producing yet more jobs and foreign exchange (Department of Energy & Department of Science and Technology, 2015). Since SWHs generate energy at the point of consumption, they eliminate the need for transmission and distribution networks with their concomitant risks and losses. Finally, SWHs include their own integrated on-site daily (conservatively calculated at one kWh/m2.d) or yearly energy storage (yet to be implemented in South Africa), obviating costly electrical storage devices.
5. Conclusions
The review of international, local and regional SOLTRAIN experience lead to the following conclusions. 5.1 Favourable environmental conditions do not automatically lead to a high SWH market penetration. South Africa with the world's best conditions ranks only 42nd.
248

5.2 One world champion (Austria) reached the world's third highest SWH market penetration, despite a decidedly difficult climate. It is neither a physical nor a political island. 5.3 The long-term success of all the world champions relies on a broad-based grassroots support by the population, whether this came in the form of spontaneous entrepreneurs (Cyprus, Barbados, Greece), public protests (Austria) or from public support of a top-down government emergency law (Israel). 5.4 Stable, long-term government policies are an absolute prerequisite for investor confidence, and for the growth of domestic SWH use, manufacturing, installation, maintenance and export industries. 5.5 Short-term, stop-go government interventions, like subidies without a sustainable source of funding have been shown to destabilize the market, thereby breaking down the confidence of consumers, and harming the domestic industry.
6. Recommendations
If South Africa wishes to address its long-term challenges of unemployment, crime, energy, and business confidence, then it is recommended that government 6.1 urgently ratify the Solar Thermal Energy Roadmap; 6.2 initiate and sustain a comprehensive awarenss campaign at least until 2030, regularly monitoring and reporting on progress in Stats SA and on a monthly website; 6.3 increase the stringency of the National Energy Efficiency Building Regulations (SANS10400XA) pertaining to SWH, and implement these consistently on private sector and government buildings, for example housing, hospitals, penetentiaries, orphanages; 6.4 support solar thermal R&D and demonstration that is outside the scope of industry; 6.5 interact regularly with other stakeholders (end users, industry, training institutions, financial institutions) to remove barriers and enhance implementation and export; 6.6 introduce a 30% ad valorem tax on all new and existing electric water heaters (see Barbados), ringfencing revenue for the promotion of solar thermal energy; 6.7 introduce competition into the testing of solar thermal equipment, endorsing component testing; 6.8 ensure long-term job creation and value addition by maintenance agreements on ST installations on government facilities; 6.9 empower local authorities and metros to implement ST by removing legislative barriers to these bodies, and 6.10 encourage, by concessions, financial institutions towards ST support (soft green bonds).
7. Further study
The following further studies could guide enlightened decisionmaking: 7.1 An updated life cycle study on externality costs of coal/nuclear power generation and distribution, including dismantling costs; 7.2 A study on overt and covert subsidies to non-renewable energies in South Africa; 7.3 A detailed comparative study on direct, indirect and induced job creation in solar thermal manufacturing, installation and maintenance industries in South Africa.
9. References
AEE INTEC, SESSA, CRSES, REEEI, UEM, DSH & BBCDC. 2014. 2nd Activity Report - SOLTRAIN II - 30 August. Gleisdorf. Department of Energy & Department of Science and Technology. 2015. Solar Energy Technology Roadmap. Draft: Pretoria. Eberhard, A.,Volker J., & J. Leighland. 2014. South Africa's Renewable Energy IPP Procurement Program: Success Factors and Lessons. World Bank, Washington. Hack, S. 2006. Promotion of Solar Water Heaters at Household-Level. ISBN 970-9983-12-1. Mexico City: GIZ. Hardi, M. 2011. Developing SA's Solar Water Heater Industry: Identifying Key Success Factors for the Future Growth. Master's thesis. University of Stellenbosch. http://www.eurobserv-er.org - accessed 2015/06/23 Large - Scale Utilization of Solar Energy in Cyprus. http://old.insula.org/islandsonline/cyprus-1.pdf. - accessed June 2015. Leedy, P.D. & Jeanne Ellis Omrod. 2015. Practical Research: Planning and Design. Pearson. Mail and Guardian - 19 January 2015. Mauthner, F., Weiss, W. 2014. Solar Heat Worldwide: Markets and Contributions to the Energy Supply 2012. Solar Heating and Cooling Programme. International Energy Agency. Gleisdorf.
249

www.metaefficient.com/hot-water-systems- accessed Jun 2015. Nurse, L. in www.energy.gov/sites/prod/files/2015/03/f20/phase3-barbados.pdf) - accessed June 2015 Sternman, D. 2009. Israel's Solar Industry: Reclaiming a History of Success. Intl. Action www.solarwaerme.at/efh/foerderungen 2015 - accessed May 2015
250

1
THE DEVELOPMENT OF A POST OCCUPANCY EVALUATION TOOL FOR PRIMARY SCHOOLS: LEARNER COMFORT ASSESSMENT TOOL (LCAT)
Lorato MOTSATSI
1
1 Built Environment, Council for Scientific and Industrial Research, Email: [email protected]
Keywords: Comfort, Indoor environment, Functional performance, Post occupancy evaluation, Primary schools
Abstract
Students spend majority of their time indoors, in school buildings or classroom. A poor and unsatisfactory indoor environment can affect health, productivity and comfort of occupants. Hence, a satisfactory indoor environment quality is important in order to facilitate teaching and learning. The aim of this study was to develop a Post Occupational Evaluation (POE) tool to assess learner comfort in relation to indoor environmental quality in the classroom. The development of POE tool followed a critical evaluation of international POE tools/methods commonly used in school environment. The methodologies and concepts are drawn from the evaluated POE tools to develop a POE tool for the assessment of primary schools. The POE tool targets learners aged 10-14 at Grade 3-7 level and their teachers. It focuses on the functional performance of the school classrooms, i.e. how the classroom supports the user aspirations and needs. There is a knowledge gap in analysing and assessing comfort, health and safety of the indoor environment in South African primary school classrooms, which plays an important role in the achievement of quality education. The study will also contribute to the Department of Basic Education (DBE) research on post-occupancy evaluation in school. The conduct of POE will enable stakeholder awareness of school conditions and inform school administrators on whether the school complies with health and safety regulations.
1. Introduction
Existing studies show a direct link between physical environment in which learners are taught, learning effectiveness and student learning outcomes (Schneider, 2002). Poor learning environments have been found to contribute to irregular student attendance and dropping out of school, teachers’ absenteeism and the ability to engage in the teaching and learning process. The physical appearance of school buildings is shown to influence students’ achievements and teachers’ attitude towards school (Department of Education, 2008). Indoor environmental factors such as light, noise and air quality need to be assessed in learning/school environments, to determine whether indoor environment / conditions meet the recognised standards’ minimum recommendations; as well as the learner and teacher expectation and needs. Studies on public schools in South Africa confirm that the indoor environment factors were not considered in the design of most South African public school and that most South African school are built without scientific basis (Candiotes, 1997; South Africa. Department of Basic Education, 2012). This is despite clear guidance in the South African constitution, which states that environments should promote health and wellbeing (SA. Constitution of South Africa, 1996). Concurring with these studies is a post occupational evaluation study by Gibberd & Motsatsi (2013) and Motsatsi (2015), which found that the studied South African classrooms indoor environments failed to provide an environment that promotes productivity and comfort for summer conditions Little work has been found with respect to the feedback of school buildings performance from users in completed and occupied school buildings. This information is important because it feeds into the procurement system, improving school building designs as well as the construction process. The South African Education Department has however, conducted a study on the conditions of public school infrastructure in South Africa which resulted in reports such as the National Education Infrastructure Management System (NEIMS), the School Register of Needs (SRN) (2000) and the South African Infrastructure Report Card (SAICE, 2011) (SRN, 2000; SA Department of Basic Education 2009). NIEMS determined that in 2011 most schools in South Africa did not have the essential physical resources, i.e. classrooms, furniture, toilets, electricity and telephones, needed for quality teaching and learning and that massive backlogs existed (NEIMS, 2011).The school condition assessments were limited to a subjective classification of overall school building condition. Current statistics from the South African Department of Basic Education show public primary schools constitute a majority of all schooling facilities (South Africa. Department of Basic Education 2015). However, there is no evidence that these schools have undergone post occupancy evaluation. This means that indoor conditions that growing and developing children are subjected to are unknown.
251

2
The aim of the study is therefore, to develop a structured POE tool for the assessment of primary school (indoor) environments, through critical evaluations of tested school building assessment methods. The research questions for the study are therefore:
What methodologies are followed in POE? What is the appropriate POE tool for the assessment of primary school?
The methodology of the study is therefore to do the following: Conduct a literature review of POE methods used to assess buildings; Develop and standardised POE methodology that can be used in government primary schools to
assure consistency in data gathering and allow for development of benchmark and best practices.
2. Post Occupation Evaluation (POE)
The field of POE or building performance evaluation has been conducted in commercial / office building (Clements-Croome, 2000; Walden, 2005). However school buildings are different from office buildings / spaces, as they have different occupants, culture / routine / activity, management style / administrative processes and operational processes; different budgets, different decision-making structure during design and construction phases (Baker, 2011). Research in the learning environment approaches the POE from perspective of how the building impacts learners’ academic performance, comfort and health (Mendell and Heath, 2005; Scheider, 2002; Woolner, Hall, Higgins, McCaughey, Wall, 2007). The research methodologies followed in the study of school facilities varies from the assessment of building design to functional performance during operation. Observation and survey methods are mainly used and different audiences involved in the assessment school environment are mainly designers, teachers, school administrators (Tanner, 2009; Sanoff, 2002; Earthman & Lemasters, 2009; Uline & Tschannen-Moran, 2008). These researchers seek to quantify the effect that facilities have on effective learning and teaching (Baker, 2011). Therefore, this study will focus on the methodologies used to assess school building functional performance using protocols targeting learners at primary school level.
2.1 POE definition, objective and benefits
POE is broad in scope and purpose; and means any activity that originates out of interest in learning how a building performs once it has been built and how satisfied building users are with the environment that has been created (Vischer, 2001).There is no industrial definition accepted for POE; nor is there a standardised method for conducting a POE because it focusses on the requirements of building occupants, including health, safety, functionality and efficiency, psychological comfort, aesthetic quality and satisfaction. POE is also made complex by the fact that it is evolving towards more process oriented evaluations for planning, programming and capital asset management (Federal Facilities Council 2000). The objective of POE is to feed forward ‘lesson learned’ from the review of completed capital projects into a process that would ensure that best practices are applied in future projects. It is used to test generic and specific aspects of the planning and detailed design of buildings; as well as, test the impact of buildings on users with respect to several parameters such as: health and safety, security, indoor environment quality and functions (Zimmerman and Martin, 2001). The POE benefits the building industry by supporting policy development as reflected in design and planning guides; and provides to the building industry with information about the building performance of buildings in use by quantifying occupant perception and physical environmental factors. POE enables the testing of new concepts to determine how well they work in occupied building and allows for identification and remedy of building problems such as uncontrolled leakages, deficient air circulation / poor circulation. POE also assists in generating information for future decision making (Federal Facilities Council, 2000) The Post occupancy evaluation (POE) process includes an interlinked POE approaches, phases, focus areas, review periods & methods as articulated below. These processes are driven by the project, stakeholder and institutional goals.
METHODOLOGYMETHODOLOGYAPPROACH PHASES FOCUS AREAS REVIEW PERIODS
IndicativeInvestigativeDiagnostic
PlanningConductApply
ProcessFunctional performanceTechnical performance
ObservationInterview focus groupWorkshopQuestionnairesBenchmark measurements
OperativePerformanceStrategic
Figure 1 Post occupancy evaluation (POE) processes
252

3
The POE processes are comprehensively summarised and described in Nawawi and Khalil’s proposed guideline for government and public buildings in Malaysia (2008) from initial, process and recommendation phase. The POE process is divided into three phases followed by six strategic steps on how to conduct POE.
2.2 Established POE methods
Several POE tools have been developed for the assessment of buildings. Table 1 below adopted and adapted from the Higher Education Funding Council of England (HEFCE) (2006) POE guide, summarises suitable techniques for each review stage. This guides one in selecting an efficient technique which is useful in terms of gathering data.
Table 1 Established POE methods (HEFCE) (2006)
Tool Method Focus How long does it take?
Review period
PROBE
(Post Occupancy Review of Building Engineering)
Questionnaires Focus groups Visual surveys Energy
assessments Environmental
performance of systems
User satisfaction/ occupant survey – on productivity
System performance
Benchmarks developed
Process varies 2 day -2 months
A year after occupation (Performance
review)
Building Use
Studies(BUS)
Walk through of buildings
Questionnaires Focus groups
Occupant satisfaction
Productivity
10-15 minutes to complete questionnaire
A year after occupation(Performa
nce review)
Design quality
indicators
Questionnaires (online)
Functional performance
Building quality Impact
20-30 minutes At design stage & after completion (Operative /
Performance review) De Montfort
method
Forum Walk-through of
buildings
Process Review Functional
performance
1 day A year after occupation (Performance
review) Energy
Assessment &
reporting
methodology
Energy use survey Data collection
(energy bills)
Energy use Potential savings
1 week(1 person) Anytime / A year after occupation (Operative /
Performance /
Strategic Review)
American Society
for testing and
material (ASTM)
ASTM Standards
for Whole Building
Functionality and
Serviceability
2 matching Questionnaires (Multiple-choice)
Functional performance (Occupants requirements)
Technical performance (Serviceability of buildings)
Process varies
Anytime / A year after occupation (Operative /
Performance /
Strategic Review)
Serviceability Tools
& Methods (ST&M)
Questionnaires User / stakeholder satisfaction, perception of quality
Functional performance
Design requirements
Process Technical
performance
Process varies
Anytime / A year after occupation (Operative /
Performance /
Strategic Review)
2.3 Tested school buildings assessment methods
The following tested school building assessment methods are assessed for usability and applicability in primary school context:
Sanoff’s methods (2001) in School building assessment methods - (United States of America); Tanner’s methods in the article ‘Effect of school design on student outcomes’(2008)(United States of
America), Cohen,Gilbert, Bodass and Leaman’s methods in the article ‘Assessment of building performance
in use: PROBE process 1’ (2001) (United Kingdom) Leaman’s and Bodass methods for Building Use Studies (BUS) from the article ‘Assessment of
building performance in use: PROBE occupant survey and their implications’ (2001) (United Kingdom)
253

4
The methods are described based on the POE processes i.e., the approach, phase, focus area methodology and review periods. The main purpose of all methodologies is to collect data based on research goals. See the above methods in Table 2 below:
Table 2 School buildings assessment methods
Methods Probe/BUS Sanoff methods Tanner methods
Purpose The purpose of PROBE process is to provide feedback to building stakeholders, service engineers, designers/ occupants etc. The focus on non-residential building using various ventilation modes.
The school building manual is a guide for communities anticipating the expansion of existing/construction of a new school. It aims identify what works and what fails in American school.
The purpose of the study was to identify and test school design that influence student outcomes.
POE Focus Process, Functional and Technical performance
Functional performance Functional performance
Tools Occupant survey methods developed by the Building Use Studies (BUS) Ltd. The aim of the occupant survey is to gauge occupant satisfaction with the building and its internal conditions;
Energy Assessment and Reporting (EARM) / Office Assessment Methods (OAM). For the analysis of energy use.
A collection of different surveys and discussion tools.
School design and planning instruments Occupant survey methods (with 10-point Likert scale)
Information
collected
Background (age, gender, etc.) The building overall (its design
and how well it meets perceived needs)
Personal control (over heating, cooling, lighting etc. together with the speed of response)
Speed and effectiveness of management response after complaints have been made
Temperature Air movement Air quality (winter & summer) Lighting Noise Health Overall comfort Productivity at work
School building Checklist (assessing occupants’
perception on Context, massing,
interface, wayfinding, social
spaces and comfort)
School building observation form School Building Rating Scales
(Physical features, outdoor
areas, Learning Environment,
Social areas, Media access,
Transition, spaces and
circulation routes, Visual
appearance, Degree of security
and security, Overall impression
& personal information)Photo questionnaires (Informal social
spaces, dining spaces etc.)
Measuring occupants’
perception on : Movement & circulation Day lighting Views
Methodology Qualitative & Quantitative Observation Interviews Focus group Workshops Questionnaires Measurement Benchmarks
Qualitative Direct observation Interviews Simulation Walk-throughs Questionnaires
Qualitative Questionnaires (with 10-point Likert scale)
POE Approach Diagnostic Indicative, investigative & Diagnostic Investigative & Diagnostic Review period Strategic (2-3 years after
occupation) Operative, Performance & strategic (from 3 month to 5 years after occupation)
Performance & strategic ( 1-5 years after occupation)
Target group Building occupants School administrators, teachers, students and parents.
Students
2.4 Critical evaluation of POE methods
The POE methods presented in Table 2 are critically evaluated for applicability and usability in environments occupied by children. The focus is on the functional performance of the building, that is, the comfort and satisfaction of occupants.
2.4.1 PROBE and Building Use Studies (BUS) The PROBE undertook post-occupancy surveys of commercial and public buildings after 2-3 years (Strategic review) after completion. The aim is to provide feedback on generic and specific information on factors for success, difficulty and failure in design, construction, operation and use of buildings (Cohen et al. 2001).
254
5
The occupant survey methods used in the project are sourced from the Building Use Studies (BUS).The BUS was developed from the occupant survey for the Sick Building Syndrome (SBS) study in offices. The occupant survey includes two types of questions based on comfort (summer and winter temperature, air quality, lighting, noise, and overall comfort), and satisfaction (design, needs, productivity and health).
2.4.2 School building assessment methods The American school building assessment methods aim to guide communities anticipating the expansion of existing or construction of new school facilities, through surveys and discussion tools (Sanoff, 2001). Sanoff makes suggestions about the assessment process, emphasising the importance of inclusive planning, cultural appropriateness and design for different learning styles. The questionnaire is lengthy and follows a qualitative approach (Baker, 2011). The protocol is highly subjective and does not involve objective measurements or means for determining whether the school building meets any defined and achievable standard (Baker, 2011). The protocol is recommended for the design process rather than assessing how an existing building can be improved (Baker, 2011).
2.4.3 The impact of school design on student outcomes Tanner’s methods in the article ‘Effect of school design on student outcomes’ (2008) aims to compare student achievements with three school design classifications (movement and circulation, daylighting and view). The design classification is based on the theoretical work of Christopher Alexander’s 1979 book ‘The timeless way’. The method is highly subjective and it requires experienced facility planners to properly conduct the assessment (Baker, 2011).
2.5 Summary
The POE methods followed in the studies above focused on the functional performance of the buildings, that is, on how well the building supports the institution’s organisational goals and aspirations and how well the user needs to be supported. The methods fell within the 3 POE approaches i.e. indicative approach (indicating of major strengths and weaknesses the building’s performance), investigative approach (evaluating criteria in the functional program of a facility or guidelines, performance standards, and published literature) and diagnostic approach (correlating physical environmental measures with subjective occupant response measures). Quantitative and qualitative methods were used to collect data in the studies. The qualitative methods used in Sanoff (2001) and Tanner (2008) were highly subjective and did not assist in determining whether the school building met any defined standards, as well as, explain how an existing building can be improved. The qualitative methods mainly contribute to the design process of school buildings. Quantitative methods used in Probe / BUS gave an objective input on how the weaknesses and strengths of the building and determined if building met benchmarks or standards. The quantitative methods followed in the Probe / BUS studies for the assessment functional performance for buildings is therefore an appropriate guide in the development of POE tool applicable for the assessment of indoor conditions in primary schools classrooms that is the Learner Comfort Assessment Tool (LCAT).This is because of its objective and controlled approach, and its focus on the comfort, health, and productivity of occupants. The BUS methodology uses a structured questionnaire designed to extract as much information as possible from as few questions as possible. Respondents rate various aspects of performance on a scale of 1-7 and can provide comments so both quantitative and qualitative feedback is obtained. Over 45 key variables are evaluated covering aspects such as thermal comfort, ventilation, indoor air quality, lighting, personal control, noise, space, design, image and needs (Occupant Satisfaction Evaluation, 2015).The Probe/BUS method relates the occupant survey to actual measurement and benchmarks, and can be used as a guide for the development the Learner Comfort Assessment Tool (LCAT).
3. Development of the Learner Comfort Assessment Tool (LCAT)
3.1 Research design
A quantitative strategy of enquiry which is a structured method of data collection will be followed as it allows for the research to be objective, replicable, and to be conducted on a large scale. Qualitative data is captured in comments made by leaners in questionnaires. Since the LCAT aims to collect functional performance of buildings, a descriptive research method, which aims at finding out "what is" the condition in the classrooms, is used. Structured survey methods (i.e. close-ended questionnaires) are used to collect descriptive data. Through descriptive research, data is gathered so that the comfort data can be described and organised / tabulated and depicted. A longitudinal or cross-sectional study can be carried out on the selected schools and classrooms, using the LCAT depending on the goal of the study. The goal will also determine the POE approach, how long the assessment will take (review process) and methods to be used as presented in Table 3 below.
255

6
Table 3 POE approach & focus table
POE Approach Review period Focus/ Process
Expected outcome Functional performance
Indicative Operative review (3-6 months after hand over)
Methods
Observation, Interviews
An awareness of issues in building performance
Investigative Operative / Performance review (12-18 months after hand over)
Observation, Interviews, Focus groups, Workshops, Questionnaires, Measurement, Benchmarks
An understanding of the causes and effects of issues in building performance.
Diagnostic Strategic Review (3-5 years after hand over)
Observation, Interviews, Focus group, Workshops, Questionnaires, Measurement, Benchmarks
The creation of new knowledge about aspects of building performance
3.2 Learner Comfort Assessment Tool (LCAT)
3.2.1 Documents The documents required for the LCAT are design plans from the selected schools and classroom designs, along with building specification. The plans and building specifications are required, to analyse and understand the building structure and to mark positions where readings will be taken and map occupancy (furniture and furniture use – desk / table layouts and seated students). The classroom layout plans form part of observation and analysis. Using plans, enables mapping patterns of seating arrangements, learner activity and behaviour and capture how the teacher controls the environment (opening / closing window).
3.2.2 Instruments The instruments used to collect the quantitative data from learners are indoor environment assessment questionnaires. The learners and teachers were requested to fill in questionnaires daily. Learners rate various aspects of building performance on a scale of 1-5 and can provide comments so both quantitative and qualitative feedback is obtained. The presentation and the type of questions presented in questionnaires must consider the children’s ability to respond to survey questions; the development of their cognitive skills and language barriers that may exist is in the South African primary school context. Therefore the questionnaires must be simplified and easy to comprehend (Borgers, Leeuw & Hox ,2000; Haddad, King, Osmond & Heidari, 2012; Motsatsi, 2015).Simplicity and clarity of questionnaires can be achieved by using pictures and colour and using scales for children e.g. Likert scales with facial expression as in Figure 2. The questionnaires employ the 5 point Likert Scale to rank responses for comfort and satisfaction. The scales ranged from—least to most—asking students to indicate how much they agree or disagree, approve or disapprove. The scales were given a numerical value for analysis purpose, i.e. 0 is Ok or acceptable condition and scales -2/2 were the most uncomfortable.
My classroom is HOT!!
I strongly agree / 2 I agree / 1 It is Ok /0 I disagree /-1 I strongly disagree /-2
Figure 2 Likert scales with facial expression (Motsatsi, 2015)
Other instruments that were used to collect the quantitative data are data loggers, which record indoor temperature, relative humidity and light levels data over time with the built-in sensors. The data loggers are programmed and left unattended to automatically collect data at the same time during teaching hours, for the
256

7
duration of the study at the schools. This allowed for a comprehensive, accurate picture of the environmental conditions being monitored.
3.2.3 Benchmarks The occupants’ perceptions (questionnaire) are required to be correlated with indoor environment measurements. Minimum indoor environment quality benchmarks for classrooms conditions are found in international and national guidelines as summarised in the minimum indoor environment in the Gibberd and Motsatsi (2013) study. The study suggests lux levels above 200 lux on working surfaces, Carbon dioxide level concentrations below 942 ppm and temperature level of 25.0 °C to 28.0 °C (at 0.5 Clo, 20% RH).
3.2.4 Field work protocol The field work protocol standardises the qualitative (Questionnaires) and quantitative (Environmental measurement) processes followed in the assessment of primary schools, to assure consistency in data gathering.
4. Testing the LCAT - findings and discussion
The LCAT was tested in two case studies in Mamelodi Township, City of Tshwane - South Africa. The case studies were Botlhabatsatsi Primary school in Mamelodi West and Meetse-A-Bophelo Primary in Mamelodi East. Air temperature data was collected from 8 classrooms and 359 learners were surveyed in total. The temperature measurements were related to temperature benchmarks and learner satisfaction.
4.1 Findings
The study found the LCAT to be an appropriate POE tool for the assessment of primary schools, because its consideration of cognitive levels of learner in the questionnaires and the classroom design, furniture layout and size for environmental measurements. The study also found that LCAT can be improved by assessing what the learners preferred and found acceptable in the classrooms; as well as observing how learners adapt to the conditions they are subjected to.
4.2 Discussion
POE methods for schools focus on both qualitative and quantitative methods. However, for a study to yield important data that address research question, such as ‘Is the classroom indoor environment comfortable or suitable for learning?’, the emphasis is on the impact of the indoor environment on learners and must therefore be quantitatively assessed and compares with qualitative responses. The use of the qualitative approach to such questions can broaden the scope of the study due to the subjective nature of open ended questions. Therefore, the qualitative approach is ideal for the initial stages in the building design process. The use of POE established phases such as planning, establish parameters for the study. These parameters determine the cost and manpower needed, as well as protocols for data collection and quantities of data to be collected. This impacts presentation, length and detail of survey which can determine the success of POE study. The consideration of tailor made surveys for the targeted audience is important, because it can contribute to the success of participant response. Therefore, age and context appropriate questionnaires are important for POE.
5. Conclusion and Further Research
Quality education can be impeded by environments that are not conducive to learning. Using the LCAT to assess comfort, health and safety of the indoor environment in South African primary school classrooms may assist the Department of Basic Education (DBE) in achieving its mandates. And most important of all, it will ensure that learners’ human right to ‘an environment that promotes health and wellbeing’ is fulfilled, as indicated in the Bill of rights Section 24(a) in the South African constitution. With further research the LCAT can be improved and standardised as POE methodology that can be used in primary schools to assure consistency in data gathering and allow for development of benchmark and best practices. Furthermore, The LCAT can be developed further into a school classroom user’s manual, to enable learners to manage their indoor thermal conditions and for the DBE school inspectors to inspect the classrooms’ health and safety compliance.
6. Acknowledgements
The Council for Scientific and Industrial Research (CSIR), Built Environment (BE), Building Science and Technology, and the Young Researcher Establishment Fund (YREF), for funding the study ;The Gauteng Department of Education(GDE), Research Co-ordination Department, for permitting the research to be conducted at their institutions; Principals, teachers and learners of Bothlabatsatsi and Meetse-a-Bophelo primary school, class of 2013, who welcomed the author to their school and participated in the research.
257

8
7. References
ASHRAE.2004. ANSI/ASHRAE Standard 55-2004: Thermal environmental conditions for human occupancy. American Society for Heating, Refrigeration and Air conditioning Engineers. Atlanta.GA ASHRAE.2004. ANSI/ASHRAE Standard 62.1-2007: Ventilation for acceptable Indoor air quality residential building. American Society for Heating, Refrigeration and Air conditioning Engineers. Atlanta.GA Baker, L., 2011.What School Buildings Can Teach Us: Post-Occupancy Evaluation. MS Thesis, Dept. of Architecture. University of California, Berkeley. Borgers, N, Leeuw, ED & Hox, JJ. 2000. Children as respondents in survey research: Cognitive development and response quality. Bulletin de Méthodologie Sociologique, volume: 66 (2000), pp. 60 – 75. Association Internationale de Méthodologie Sociologique. Candiotes, G. 1997. The provision of schools by the DET in South Africa during 1983-1994. PhD (Architecture) in the Faculty of Science, University of Pretoria, 1997. Clement-Croome,D. (ed).2000. Creating the productive workplace. E&FN Spon Cohen, R, Standeven, M, Bordass, B & Leaman ,A (2001) Assessing building performance in use 1: the Probe process. Building Research & Information, 29:2, 85-102, DOI: 10.1080/09613210010008018 Earthman GI and Cash LK. 2009. Teacher attitudes about classroom conditions. Journal of Educational Administration 47(3):323-335 · May 2009. DOI: 10.1108/09578230910955764 Federal Facilities Council, 2002. Learning from Our Buildings: A State-of-the-Practice Summary of Post-Occupancy Evaluation. Federal Facilities Council, Board on Infrastructure and the Constructed Environment, National Research Council.ISBN: 0-309-51004-X. http://www.nap.edu/catalog/10288.html accessed 27/08/2015 Gibberd, J & Motsatsi, L. 2013. Are Environmental Conditions in South African Classrooms Conducive for Learning? SB13 Southern Africa, 15-16 October 2013. Cape Town, South Africa. Proceedings ISBN 978-1-920508-23-4 Haddad,S, King,S, Osmond,P & Heidari,S. 2012. Questionnaire Design to Determine Children’s Thermal Sensation, Preference and Acceptability in the Classroom. PLEA2012 - 28th Conference, Opportunities, Limits & Needs Towards an environmentally responsible architecture Lima, Perú 7-9 November 2012. Higher Education Funding Council for England (HEFCE) .2006.Guide to Post Occupancy Evaluation. http://www.smg.ac.uk/documents/POEBrochureFinal06.pdf. Accessed 17/08/15 Leaman,A & Bordass, B.2001. Assessing building performance in use 4: the Probe occupant surveys and their implications, Building Research & Information, 29:2, 129-143, DOI: 10.1080/09613210010008045 Mendell, M. J. and Heath, G. A. 2005. Do indoor pollutants and thermal conditions in schools influence student performance? A critical review of the literature. Indoor Air, 15: 27–52. doi: 10.1111/j.1600-0668.2004.00320.x Motsatsi, L. 2015. The development and critical evaluation of Learner Thermal Comfort Protocol for applicability to two primary schools in Mamelodi, City of Tshwane. Masters dissertation, University of Pretoria. URI: http://hdl.handle.net/2263/48952 Nawawi, A.H., Khalil, N.2008. Post-occupancy evaluation correlated with building occupants' satisfaction: An approach to performance evaluation of government and public buildings. Journal of Building Appraisal (2008) 4, 59–69. doi:10.1057/jba.2008.22 Occupant Satisfaction Evaluation, 2015. Retrieved from http://www.busmethodology.org.uk/media/5625/2013.04.30_BUS_methodology_brochure_web_vsn.pdf. Sourced from website www.busmethodology.org.uk .Accessed 23/09/15 Sanoff, H.2001. School Building Assessment Methods, NCEF, Washington,D.C. http://www.ncef.org/pubs/sanoffassess.pdf accessed 27/08/2015 Schneider,M.2002. Do school facilities affect academic outcome? (Report No.EF006238). Washington,DC:National Clearinghouse for Education Facilities. Eric Document production service No ED470979. South Africa. The Constitution of South Africa, 1996. Constitution of the Republic of South Africa No. 108 Of 1996 South Africa. Department of Basic Education. 2012. Education statistics in South Africa 2010.
South Africa. Department of Education. 2008. National Policy for an Equitable Provision of an Enabling School Physical Teaching and Learning Environment. GOVERNMENT GAZETTE, 21 NOVEMBER 2008. South Africa. Department of Basic Education. 2009. NEIMS (National Education Infrastructure Management System) PDF report 2009. http://www.education.gov.za/LinkClick.aspx?fileticket=p8%2F3b6jxko0%3D&tabid=358&mid=1802 (Accessed 9 June 2014) South Africa. Department of basic education 2015.Education Statistics in South Africa 2013 Published by the Department of Basic Education March 2015 ISBN: 978-1-4315-2050-3).
258

9
SAICE. 2011. The Infrastructure Report Card for South Africa Publication. Civil Engineering, May 2011.http://www.saice.org.za/downloads/monthly_publications/2011/2011-Civil-Engineering-may.pdf. and http://www.saice.org.za/uploads/news/articles/3.pdf (Accessed 27/11/2012) Tanner CK.2009. Effects of school design on student outcomes. Journal of Educational Administration Vol. 47 No. 3, 2009 pp. 381-399 .Emerald Group Publishing Limited 0957-8234 DOI 10.1108/09578230910955809 Uline CL and Megan Tschannen-Moran,M. 2008. The walls speak: The interplay of quality facilities, school climate, and student achievement.Journal of Educational Administration 46(1):55-73 · February 2008.Doi: 10.1108/09578230810849817 Vischer, J. 2001,Post-Occupancy Evaluation: A Multifaceted Tool for Building Improvement, Learning from our Buildings: A State-of-the-practice Summary of Post-occupancy Evaluation , National Academy Press, Washington, DC, pp. 23-34 Walden, R.2005. Assessing the performance of offices of the future.In:. Editors Preiser WFE & Vischer JC. Book Title: Assessing building performance. Elsevier 2005,PP.118-126. ISBN 0750661747 Woolner (It reads Woolmer on page 2) P, Hall E, Higgins S, McCaughey C , Wall, K,. 2007. A sound foundation? What we know about the impact of environments on learning and the implications for Building Schools for the Future, Oxford Review of Education, 33:1, 47-70, DOI: 10.1080/03054980601094693:// To link to this article: http://dx.doi.org/10.1080/03054980601094693 Zimmerman, A & Martin, M. 2001. Post-occupancy evaluation: benefits and barriers, Building Research & Information, 29:2, 168-174, DOI: 10.1080/09613210010016857
259

260

AN INTEGRATED DESIGN PROCESS FOR A ZERO-ENERGY REFURBISHMENT
PROTOTYPE FOR POST-WAR RESIDENTIAL BUILDINGS IN THE NETHERLANDS
Thaleia KONSTANTINOU 1*
Tillmann KLEIN 1
Olivia Guerra SANTIN 2 Stella BOESS 2
Sacha SILVESTER 2 1 Department of Architectural Engineering and Technology/ Faculty of Architecture and the Built
Environment / Delft University of Technology, Email: [email protected]*, [email protected] 2 Department of Industrial Design / Faculty of Industrial Design Engineering / Delft University of Technology,
Email: [email protected], [email protected], [email protected] Keywords: Building envelope, building services retrofitting, design approach, refurbishment, zero-energy
Abstract Although refurbishment is a necessary step to reach the ambitious energy and decarbonisation targets for 2020 and 2050, which require an eventual reduction up to 90% in CO2 emissions, the rate of renovation is still relatively low. There is an increasing demand to upgrade both the physical condition and the performance of the building, with the minimum disturbance to the interior, so that the occupants do not have to be relocated during construction. Thus, the role of the occupant becomes essential not only in terms of performance during the post-refurbishment phase, but also in terms of the design and planning of the refurbishment. Furthermore, the traditional design and delivery processes are fragmented and are not efficient to take on the challenges ahead. To address these issues, the 2ndSkin-BTA project brings different stakeholder together, aiming at reversing the traditional decision-making process, to integrate their expertise and objectives into an innovate building technology concept. The objective is to design, construct and monitor a renovation project that achieves zero energy use of a dwelling, while providing upscaling possibilities and broad adoptability of the process. This paper presents the first project phase, which is the integrated design process. To this end, the development of the preliminary design of the refurbishment strategy is based on a reference building. It proceeds in parallel with the prototypes’ development and it benefits from the test results. Nevertheless, the proposed design is not a one-project solution but rather an approach that highlights the underlying argumentation line for different retrofitting measures, in different cases.
1. Introduction
Being one of the biggest energy users (Eurostat, 2013), the residential building stock needs to be upgraded in order to improve performance, reduce energy demand and eventually reach the ambitious energy and decarbonisation targets for 2020 and 2050 that require an eventual reduction up to 90% in building sector related CO2 emissions (European Commission, 2011). This reduction is larger than in other sectors such as transportation, agriculture and industry, indicating the importance of the building sector and the urgency of the measures to be taken. In order to achieve this significant reduction, the recast of the EPBD in 2010 suggests that new buildings should be low- or zero-energy buildings (DIRECTIVE, 2010/31/EU). As a greater challenge, however, the European Commission (2011) stated the refurbishment of the existing buildings, suggesting that over the coming decade investments in energy-saving building components and equipment will need to be increased by up to € 200 billion. While new buildings can be constructed with high energy performance levels, the existing stock is predominantly of poor energy performance and consequently in need of renovation work (Atanasiu and Kouloumpi, 2013). In this context, the depth of refurbishment needs to grow. Superficial renovations, as opposed to deep renovation, significantly increase the risk to miss the climate targets and leave huge absolute savings untapped (Hermelink and Muller, 2011). The depth of the refurbishment is related to the level of energy or greenhouse gas emission savings that are achieved when refurbishing a building. A renovation is specified as “deep” when energy savings of 60-90% are achieved. An effective renovation plan has to be long-term, target the deep transformation of the existing building stock, and to significantly improve its actual energy performance towards nearly zero energy levels (Atanasiu and Kouloumpi, 2013). This level of energy saving typically requires a holistic approach, viewing the renovation as a package of measures working together (BPIE, 2011). Renovation with a zero energy objective can be achieved through high envelope insulation, air tightness, triple glazing, efficient heating and ventilation systems and renewable energy installations, such as photovoltaic. Several European exemplary renovation projects demonstrate that it is possible for renovation to achieve the zero energy objective (Attia, 2015, NeZeR, 2014). Even though the need for refurbishment is urgent, the rate of renovation and the resulting energy savings are relatively low. Main barriers identified are related to the available investment funds, awareness, advice
261

and skills and the separation of expenditure and benefit (BPIE, 2011). The role of the occupant becomes essential not only for the performance in the post-refurbishment phase, but also in the design and planning of the refurbishment, particularly since the demand increases to upgrade both physical condition and performance of the building, with the minimum disturbance to the interior, so that the occupants do not have to be relocated during construction. The satisfaction of the occupants is also important for the application and upscaling of the refurbishment (Cozijnsen et al., 2015). Furthermore, refurbishment of the building stock is a complex task with a lot of aspects to be considered, which determine the way each building is approached. In this sense, research (SHELTER, 2013, OneStopShop, 2012) has shown that current design and delivery processes are very often fragmented and not efficient and still contain a high level of uncertainty concerning long term performance. The envelope of a building can be the medium both for fabric and building serviced upgrade, combined with generation of energy with renewable sources, combining both passive and active measures (Konstantinou, 2014). In this way, it is possible to achieve improved performance and quality of the dwelling without interfering severely with the interior. Prefabrication of the retrofitting components can pose the potential to achieve high performance solutions, while minimising on-site construction time (IEAAnnex50, 2012).There are several examples of projects limiting construction time along with the energy demand, using methods such as prefabrication of the components (TES Energy Façade, 2014, EnergieSprong, 2014, Stroomversnelling, 2014). However, research is still underway for apartment buildings, which constitute an important part of the stock while they are particularly challenging in becoming energy neutral. This is due to their ratio of number of apartments versus available skin surface for energy generation. Additionally, a large amount of such buildings are social housing estates, with their particular groups of tenants and the specific ways of financing. To address these issues, the “2ndSkin” project brings different stakeholder together, aiming at reversing the traditional decision-making process, in order to integrate their expertise and objectives into an innovate building retrofitting concept that achieves zero energy use of a dwelling, while offering upscaling possibilities and broad adoptability of the process. The objective is not only to find a successful refurbishment strategy for a specific building type, but also determine the framework within which the proposed solution can be adjusted. If the result of the 2ndSkin strategy is extracted on a nation-wide Dutch level, this would suggest 300.000 energy-neutral dwelling that are within the direct target group. This paper presents the first project phase, which is the integrated design process, aiming not only at finding a successful refurbishment strategy for a specific building type, but also determining the framework and criteria within which the proposed solution can be adjusted and up-scaled. To this end, the development of the strategy is based on a reference building. It proceeds in parallel with the prototypes’ development and it benefits from the test results. Furthermore, an important part in the process was the development of performance criteria, regarding energy consumption, inhabitants’ disturbance and comfort, robustness, simplicity, etc. Finally, the preliminary design for a reference building was developed based on those criteria.
2. The Methodology and the Scope of the project
One of the main developments of the project was to determine a methodology that addresses the objective, but also the challenges of the project. It aimed not only at providing a solution to refurbish the case study buildings, but most importantly delivering knowledge and results that can be used in the refurbishment task on a national and European level. The development of the strategy integrates different aspects that determine the performance of the refurbished building. These are the building envelope, the building services and the occupant. The strategy development is based on a reference building, as it has been determined to serve the scope of the research. Furthermore, the design and implementation is tested in prototypes and the results are used to improve the reference building design. Finally, the project aims at extrapolating the reference design for more building types than the initial scope.
2.1 Methodology for prototyping and up-scaling
The relationship between the 2ndSkin final strategy and prototyping is one of the main project innovations. The 2ndSkin team has realised that a direct replication of the prototyping to the up-scaling strategy may be a factor that hinders the project and decision-making. This is because some of the technologies to be implemented need to be further proven before applied and used on a large scale. More flexibility should be brought into the prototyping strategy, meaning that the prototypes will be used to test the construction, performance and the user interaction with technologies to be implemented in the upscaling of the 2ndSkin strategy. For this reason the development of the 2ndSkin strategy is based on a reference building. It proceeds in parallel with the prototypes’ development and it benefits from the test results. The process of the project consists of the following steps:
A. Setting the scope of the refurbishment strategy B. Design the solution based on reference building C. Test specific aspects on Prototype 1 D. Consider test results and revise refurbishment strategy E. Apply refurbishment in Prototype 2 - Up-scaling F. Evaluate Prototype 2 and suggest up-scaling methods
262

In principle, there are two axis of the strategies development, shown in Figure 1. Steps B, D, F focus on the 2ndSkin strategy on the reference building, while steps C and E include the construction and testing of prototypes.
2.2 Reference building
The target group for the present investigation are the post-war apartment buildings in the Netherlands. After World War II, most European countries experienced a large housing shortage due to war devastation, population increase and economic growth. This shortage was answered with a high level of building activities, focusing on quantity rather than quality (Andeweg et al., 2007), with a large degree of prefabrication and industrialised methods (Priemus, 1986). As a result, the European housing stock originating from this period accounts for a considerable share of the total stock, while it lacks technical and functional performance. Moreover, being 50 years old, the building envelope has reached its end of life while generally the structure is sound (Andeweg et al., 2007). Due to the circumstances of its development, the post-war housing stock has specific characteristics in terms of neighbourhood design, construction and problems. To understand why this building type is particularly interesting in the Dutch context, the primary focus of this project, some data on the building stock is presented. The building stock in the Netherlands accounts for 7.5 million dwellings (CBS). During the period 1946-1974 more than 2 million dwellings were constructed in the Netherlands. As a result, dwellings of the post-war period account for approximately 1/3 of the residential stock. However, these buildings were generally poorly insulated at the time of construction and there is a need for renovation (Itard and Meijer, 2008). Of these 1.3 million are social housing (Platform31, 2013). Housing associations are an important stakeholder in this context. There are approximately 400 housing associations in the Netherlands that manage 2,4 million residential properties, constituting 34% of the total housing stock (AEDES, 2013). A large amount of those properties are in need of renovation, as the housing associations have the ambition to achieve energy label C for 80% of their properties and an average label B by 2020 (AEDES, 2012), while currently the average label for post-war buildings according to AgentschapNL (2011) is D-E.
Table 1 The Dutch building stock in numbers (source:Platform31, 2013).
Total residential stock
Post-war residential stock (1946-1974)
Total apartment flats
Post-war apartment flats
Industrialised systems (all dwelling types
no. dwellings 7300000 2600000 878000 381000 450000 % of the total stock in the NL 36% 12% 5% 6%
Analysis and evaluation of the existing building is an essential first step in every refurbishment project. In the context of 2ndSkin, the building stock analysis is necessary in order to identify the building type into which the pilot refurbishment prototype will be implemented. Moreover, the specific characteristics of the construction can be important in shaping the retrofitting solution. About 15% of the post-war construction was carried out in a precisely defined, modular system that was replicated for thousands of dwellings. They were characterised as non-traditional and industrialised systems, because prefabrication, new materials and ways of constructions were predominant and they are well documented in the literature (Priemus and Elk, 1971). However, dwellings that were not constructed with industrialised systems still show a high degree of similarity, in terms of material, techniques and layout (Platform31, 2013). The analysis on the post-war residential stock is based on the non-traditional systems, as they are representative of the period and better documented. They serve the purpose of the research better, which is to identify the important building characteristics that determine the refurbishment strategy. These characteristics include floor plan layout, location of utilities spaces, balcony type, wall construction, connection with the slabs, and window-to-wall ratio.
Figure 1 Timeline of the strategies’ development, showing that the reference 2ndSkin strategy is developed in parallel to the prototypes, exploiting the input by construction and testing of prototypes.
263

Next to literature research, on-site investigation was carried out in the area of Rotterdam-Zuid. Observation and documentation concluded different building types in terms of wall, window, roof type, balcony location, the existence and construction of the parapet, staircase etc. Based on the building stock literature research and on-site analysis, a reference building type was determined, which is considered the most common type in the area of investigation while having typical characteristics found in the building stock analysis. The reference building is shown in Figure 2. The basic characteristics are as follows:
Mid-rise apartment block Central staircase, accessible from the front façade, leading to two apartments per storey Massive wall with reinforced concrete slabs Brick cladding with cavity and no/little/out-dated insulation Large windows, incorporating lightweight parapet Continuous floor slabs in the balconies
Figure 2 Reference building
3. Design criteria
Next to the primary goal, which is the design, construction, monitoring and up-scaling of innovate building technology concepts that can achieve zero energy use of a dwelling, the requirements for the design where developed, addressing the different aspects of the refurbishment. These requirements will be eventually used as criteria to evaluate the solution. The requirements of the prototype, meaning the goals the refurbishment aims at achieving, can be related to the design of the strategy and user. An issue as complex as refurbishment needs to fulfil requirements on different levels. The 2ndSkin design addresses considerations such as upgrade of thermal performance of the components, together with airtightness, thermal bridges, comfort, efficiency, installation and control of building systems. The production and construction aspects, such as modularity, flexibility and prefabrication, are very important for the concept, as well as the added value of the concept for the dwelling, e.g. the addition of extra space or improved architectural appeal. To organise this complexity, the following aspects have been specified during the design investigation of the 2ndSkin team. They were concluded as part of the project objectives or issues that emerge during the design elaboration. Some of the aspects can be translated into quantified design criteria. For aspects that are more qualitative, such as the robustness of the solution, Table 2 defines levels that allow to translate quantification into design criteria. The target of zero-energy refurbished building, while ensuring occupants’ comfort, is the primary consideration. Keeping the investment at standard refurbishment costs, the possibility for new business in the supply chain and the flexibility of the solution are also very important for the concept application in the future and they constitute a big part of the investigation. Furthermore, defining and facilitating the role of the occupants is part of the design consideration. Table 3 provides an overview of the criteria quantification.
3.1 Zero-energy consumption
The main objective of the retrofitting is to achieve zero-energy consumption. To define a zero-energy building, the metric of the balance, balancing period and the type of energy use included in the balance are important issues (Marszal et al., 2011). The proposed metrics of the balance is Primary Energy (PE) demand. Primary energy demand is in accordance to the EPBD and takes into account differences between energy sources, which can help to make decisions during the design phase, for example selecting between the use of a small quantity of gas or renewable electricity for heating. An annual balance is preferred; otherwise the zero-energy targets would be difficult to reach given the differences of energy demand between summer and winter. This is the most favoured period of balance in current methodologies. Two types of energy end uses have been defined: building related and user related. There is a direct correlation with occupants’ comfort and the building-related energy consumption, as it is the energy used by HVAC systems, as well as lighting and other auxiliary energy, which are needed to ensure comfort. This
264

consumption is influenced by the occupants’ needs (indoor temperature setting) and lifestyle (retired, working at home, full-time working) and the type of household (single adult, couple, family, etc.). On the other hand, user-related energy consumption is made up by the end uses of domestic hot water (DHW), appliances and cooking. The zero-energy solution should cover at least all of the building-related energy consumption for all types of households. The building-related energy consumption per household type will be calculated through building simulations based on statistically defined occupancy patterns. Given that user-related energy consumption is less related to satisfying a need originated by occupying a space, and it may vary not only across different household types but also within the household type, the zero-energy solution could cover only the average energy consumption per household type. The system boundary considered for the zero-energy calculation, systems’ dimensioning and calculation on expected energy consumption can be based on one group of three to six flat units, accessed by a central staircase. Following phases of the research will focus on the feasibility of assessing the performance of the building on either a building level (a determine number of units), or neighbourhood level (all refurbished buildings belonging to the housing association). At this point it is important to make a clear distinction between the design and calculation phase and the evaluation phase. The design and calculation phase could be based on a building level since it implies the dimensioning of the systems, and it is determined by the occupancy in individual units (flats); while the evaluation phase could be made on the basis of building blocks or neighbourhoods since the focus of the zero-energy performance could be based on the property of the housing association (the investor, developer and manager of the buildings).
3.2 Costs
The targeted cost per dwelling is 50 000 euro, excluding VAT. This estimation is based on the current situation of the Dutch market, such as requested by housing association MITROS (2014). This is considered an average investment for standard refurbishment, even though the 2ndSkin concept aims at a more advanced solution, resulting in zero-energy consumption.
3.3 Possibility for new business model
For the concept design and most importantly the realisation, the supply chain plays a critical role. Proposing a new business model for the construction and delivery of the retrofitting components is part of the objectives. In the Netherlands, general contractors (GC’s) are involved in almost all projects. They have a major role in facilitating a project and carry responsibilities towards the client. The architect makes general design specifications, but the real execution design is left to GC. A huge number of competing products is available on the market. Suppliers try to compete on quality and price levels. In many cases the façade builder gets bypassed and the GC has direct relations to the suppliers. This model works well when known building methods are applied. General contractor and façade builder focus on improving building methods and on reducing costs. There is no incentive for completely new approaches in this competitive market, simply because the costs pressure is high, stakeholders work from project to project and financial risks must be minimized. Innovation only slowly finds its way into the process by incrementally improved products. Products that demonstrate a real innovative leap and do not comply with the traditional fragmented structure are difficult to introduce. The 2ndSkin projects aims at combining traditionally separated disciplines (Facades and Building Services), which are designed and built by different entities.
Figure 3 Scheme of the typical supply chain (source:Klein, 2013)
3.4 Up-scaling possibilities
The solution should be flexible to give the possibility for adaptation to different buildings. The main points of attention are the wall and window dimensions and their ratio, roof type, balcony location, the existence and construction of the parapet, staircase location and other.
265

3.5 Innovative character
As explained in the methodology, some of the technologies and their integration need to be further proven before applied and used on a large scale. Therefore, the project consists of three stages. The first prototype tests systems with available technologies. Secondly, we use the test results to develop future, more innovative solutions and, thirdly, we provide an outlook of an improved version that includes promising technologies available in the near future.
3.6 Inhabitants’ disturbance
One of the starting points of the project development was that the occupant would not have to be relocated. To achieve that, the renovation has to be realised from the outside as much as possible, so that the occupants can continue living in the house, or need to vacate just for a few days. Renovation should not take more than 10 days for each apartment and noise and dust should be kept to a minimum. Prefabrication of the components can support these objectives.
3.7 Robustness, simplicity
Given the potential for mass-implementation, the concept needs to provide a simple and robust solution, to address users with different backgrounds and lifestyles. The control possibilities, ease of operation and maintenance will require limited user involvement, in order to minimise the chance of errors and unsuccessful performance.
Table 2 Levels used to quantify the qualitative aspects. Levels in general scale up from minimal actions to bigger engagement of the user
Aspect Level A Level B Level C Level D
User position
user stays in house, limited dust and noise
disturbance user will leave
house for less than a week
user will have to leave house for
more than a week user relocated
User control no possibility basic and limited control full control
Maintenance or exchange components
independent from interior use
done by layman/user
by all technical personnel by specialist
Operation no active operation needed by user
simple operation with clear choice of
limited options
need to read simple manuals and understand
choices
need to read manuals,
comprehensive understanding
and regular adjustment
The following table (Table 3) shows how the determined aspects are translated into design parameters and criteria. Moreover, those parameters are relevant to different levels of the solution, from material to components or building level. The prototype will help to determine the values for some of the criteria, to be applied in the upscaling.
266

Table 3 List of parameters, requirements and quantified criteria of the 2ndSkin refurbishment concept. The criteria can be influenced by different levels, from material to component, or whole-building solution.
Parameters Criteria Value Unit
Material (e.g.
cladding, insulation
type)
Sub-component (e.g. window frame)
Component
(service system, façade)
Building (2ndSkin solution)
Energy
Energy performance
Energy consumption 0 kWh/dwel/yr X
Energy generation: Not fixed kWh/dwel/yr X X
Comfort
Thermal comfort
Temperature living spaces
20-25/ 23-26
oC X
Temperature aux. spaces 16-25 oC X
Relative humidity: 25-60 % X
Indoor air quality/ Airflows
Air flow
7 l/s/person X X X
0,7 l/s/ m2
(external envelope) X X X
Min air flow during occupied periods
0.05 - 0.1 l/s/ m2 X X
Air change per hour (estimated for space
height 2.5m)
0,6
ach
Air speed (draft) 0,2 m/s X Lighting
Illumination levels 100-
200 lux X
Daylight Factor (DF) 2 to 5 % X X Noise level (Not to be exceeded)
Living room 25-40 dB(A) X X X
Bedroom 20-35 dB(A) X X X
Renovation from the outside as much as possible
Inhabitants’
disturbance
User position A level X Building duration
max. 10 days X X X
Robustness, simplicity User control level B level X X Ease of operation A-B level X X Ease of maintenance A level X X
Facade
Façade construction
Roof 5 m2K/W X X Facades 5 m2K/W X X Glazing: 0,8 W/m2K X X X Window frame 0,8 W/m2K X X Airtightness: 0,4 dm3/s.m2 X Construction depth 30 cm X X Costs
Investment cost
Costs for the whole apartment renovation 50000 €/dwel X X X X
4. Preliminary design
Based on the design criteria explained in the previous section, the preliminary concept design was developed. The design was conducted around three axes, corresponding to three design teams; one focussing on the skin (building envelope), another on building services (ventilation, space heating energy production and water) and a third on user interaction (monitoring, acceptance & interfaces). The design elaboration process has resulted in a number of options on a component and sub-system level. Based on
267

the systematic organisation and evaluation of options, the design teams have come up with combinations for the 2ndSkin preliminary design. The 2ndSkin design principle to reach zero-energy dwellings is based on the “Trias Energetica”; first prevent the use of energy (prevention), then use sustainable energy sources as widely as possible (renewable) and, finally, use fossil fuels as efficiently as possible. Particularly for zero-energy buildings, if the use of finite (fossil) energy sources is inevitable, the third step suggests using them very efficiently and compensate with 100% renewable energy (AgentschapNL, 2013). It becomes evident that the concept needs to be integrated, combining the building envelope upgrade, the use of efficient building systems and the generation of energy. As a first step, the building envelope retrofit needs to reduce the energy demand for heating and cooling, by increasing the thermal resistance and the air-tightness of the envelope components. This is achieved by replacement of existing windows and the addition of insulation on the opaque elements of the façade and roof. Moreover, energy generation is necessary to reach the zero-energy target; thus, PV panels are installed on the roof, while installations to improve ventilation are also integrated.
Figure 4 Exploded view demonstrating the production sequence of the 2ndSkin concept (illustration SPEE Architecten)
Finally, the architectural appearance of the retrofitted buildings needs to be refreshed and modernised. Figure 5 shows the new architectural language developed for the 2ndSkin concept, comprising upgraded façade components, as well as building services replacement. Based on this concept design, the production plans are realised, in collaboration with the architect, the contractor and the product suppliers.
Figure 5 Impressions of 2ndSkin Reference Building (illustration SPEE Architecten)
Throughout the design investigation, as well as the options evaluation workshop, the choice of ventilation system is considered critical in order to determine the refurbishment strategy. To this end, it has been decided to test three ventilation concepts with Prototype 1. Retrofitting the other systems and components will adjust respectively. The choice of ventilation strategy has proven crucial for the development of refurbishment concepts. Therefore Prototype 1 will test different ventilation concepts and the respective incorporation in the building envelope. Table 4 shows the concepts to be tested.
268

Table 4 Preliminary concepts to be tested in Prototype 1
Ventilation system Advantages Considerations SKIN
Heat recovery, collective air in via facade
Collective installation
Easy maintenance
Limited flexibility Likely unsatisfactory because users will
circumvent the system.
Ducts running through facade
External insulation Replace windows with
HR++ Integrate air inlet/outlet
into window frame
Heat recovery from inside the building, decentral ventilation
per apartment
Ventilation system
4 is safer and could be
implemented next year
Well-known, robust
Limited flexibility Not expressing 2nd Skin approach as parts are inside
Ducts running through facade
External insulation Replace windows with
HR++ Integrate air inlet/outlet
at staircase
Heat recovery decentralised per room
Flexible Innovative
Difficult to develop such a system anew and upscale it to 20 units within a year
Rooms not adjacent to façade
External insulation Replace windows with
HR++ Integrate ventilation
unit into window frame or wall
5. Conclusion and Further Research
Given the need to upgrade the existing housing stock in the Netherlands and achieve low energy consumption, the research project 2ndSkin sets out to propose a concept to achieve zero-energy retrofitting in post-war apartment buildings. Defining the objective, the scope and, most importantly, the requirements of the project was an essential step to lead to the 2ndSkin strategy. Moreover the methodology specifies the development of the strategy on two axes: the reference strategy that will result in the 2ndSkin refurbishment approach, and the prototyping that tests technologies and user interaction. The evaluation of the prototypes supports the development of the final strategy. The investigation of building stock in the Netherlands was a necessary step to set the project scope, in order to identify the typical reference building, on which the 2ndSkin strategy development is based. Most importantly, it enables the identification of the characteristics that can differ and determine the 2ndSkin strategy modification in the up-scaling phase. Finally, the paper presents the preliminary design, which integrates the building envelope upgrade with efficient building services, to ensure comfort and low energy demand. The choice of ventilation strategy has proven crucial for the development of refurbishment concepts. Therefore Prototype 1 will test different ventilation concepts and the respective incorporation in building envelope. The project development described in the paper corresponds to methodology steps A and B described in the methodology section, which refers to the scope of the refurbishment strategy and the preliminary design of the solution. The next step is to build the first prototype. Before it is applied in an actual building, a mock-up will be constructed. Even though the energy performance of the 2ndSkin renovation cannot be determined by the mock-up, its design, construction, assembly and testing can provide insights into technical aspects, logistics and user related aspects. The technical aspects that are tested in the mock-up include constructional principles and materials, alternative cladding materials, panel dimensions in relation to integrated installations, integration of pipes (central unit on roof), horizontal and vertical pipes etc. Moreover, it will be an important step towards defining the level of prefabrication that the solution can have, the time needed for construction and assembly on-site and the supply chain. Finally, tests can be conducted to determine some user related aspects, such as user preferences for windows dimensions and acceptance for altered apartment floor area and thicker building walls, after the existing envelope upgrade and services integration.
6. Acknowledgement
The project presented in the current paper is co-funded by Topconsortia voor Kennis en Innovatie (TKI) and Climate KIC-EIT Flagship BTA/Innovative Facades. The authors would like to thank all the members of the consortium (BAM, ENECO, Hogeschool Rotterdam, Spee Architects) for their contributions to the project development.
7. References
AEDES. 2012. Energieconvenant: in 2021 naar energielabel B [Online]. Available: http://www.aedes.nl/content/artikelen/bouwen-en-energie/energie-en-duurzaamheid/energieconvenant--in-2021-naar-energielabel-b.xml [Accessed 17-03 2014].
269
AEDES. 2013. AEDES- Vereniging van woningcorporaties [Online]. Available: http://www.aedes.nl/content/feiten-en-cijfers/feiten-en-cijfers.xml - corporation-system [Accessed 20-05 2014]. AgentschapNL. 2011. KOMPAS Energiecijfers [Online]. Available: http://senternovem.databank.nl/ [Accessed 03-10 2011]. AgentschapNL 2013. Infoblad Trias Energetica en energieneutraal bouwen. In: Zaken, A. M. V. E. (ed.). Utrecht. Andeweg, M. T., Brunoro, S. & Verhoef, L. G. W. 2007. Cost C16- Improving the quality of existing urban building envelopes: State of the art, IOS Press. Atanasiu, B. & Kouloumpi, I. 2013. Boosting building renovation. An overview of good practices Brussels: Buildings Performance Institute Europe (BPIE). Attia, S. 2015. Screening and analyzing retrofit systems for zero energy renovation and their potential application in Liège, Belgium. In: Intec, A. (ed.) International conference on high-quality retrofit and redensification with timber construction systems. Graz, Austria: AEE – Institute for Sustainable Technologies. BPIE 2011. Europe’s buildings under the microscope, Brussels, Building Performance institute Europe. CBS. Centraal Bureau voor de Statistiek [Online]. Available: http://www.cbs.nl/nl-NL/menu/home/default.htm [Accessed 20/02 2011]. Cozijnsen, E., Leidelmeijer, K., Borsboom, W. & van Vliet, M. 2015. Resultaten uit monitoring over: Tevreden bewoners. Energiesprong | Platform31. DIRECTIVE 2010/31/EU. on the energy performance of building. Brussels: THE EUROPEAN PARLIAMENT AND OF THE COUNCIL. EnergieSprong. 2014. Inspirerende projecten [Online]. Den Haag: Platform31. Available: http://energiesprong.nl/blog/category/inspirerende-projecten/ [Accessed 14-11 2014]. European Commission 2011. A Roadmap for moving to a competitive low carbon economy in 2050. COMMUNICATION FROM THE COMMISSION TO THE EUROPEAN PARLIAMENT, THE COUNCIL, THE EUROPEAN ECONOMIC AND SOCIAL COMMITTEE AND THE COMMITTEE OF THE REGIONS. Brussels. Eurostat. 2013. "Consumption of energy" - Statistics Explained [Online]. Available: http://epp.eurostat.ec.europa.eu/statistics_explained/index.php/Consumption_of_energy [Accessed 04/08 2013]. Hermelink, A. & Muller, A. 2011. Econimics of deep renovation. Berlin: Ecofys by order of Eurima - European Insulation Manufacturers Association. IEA Annex 50 2012. Project Summary Report. In: Zimmermann, M. (ed.). United Kingdom: AECOM Ltd. Itard, L. & Meijer, F. 2008. Towards a sustainable Northern European housing stock, Amsterdam, IOS. Klein, T. 2013. Integral facade construction: towards a new product architecture for curtain walls. S.n. Konstantinou, T. 2014. Facade Refurbishment Toolbox: Supporting the Design of Residential Energy Upgrades. PhD, Delft University of Technology. Marszal, A. J., Heiselberg, P., Bourrelle, J. S., Musall, E., Voss, K., Sartori, I. & Napolitano, A. 2011. Zero Energy Building – A review of definitions and calculation methodologies. Energy and Buildings, 43, 971-979. MITROS. 2014. Flat met toekomst: Initiele vraag [Online]. Available: http://www.mitros.nl/flatmettoekomst/de-uitvraag/initiele-vraag/ [Accessed 10-03 2015]. NeZeR. 2014. Promotion of smart and integrated NZEB renovation measures in the European renovation market [Online]. IVL Swedish Environmental Research Insitute Ltd. Available: http://www.nezer-project.eu/2.1f96676d145d7c93741c57.html - .Val-z8aqqko [Accessed 18-06 2015]. OneStopShop. 2012. One Stop Shop: From demonstration projects towards volume market: Innovations for sustainable renovation [Online]. Passiefhuis-Platform vzw. Available: http://www.one-stop-shop.org/ [Accessed 25-07 2014]. Platform31 2013. DOCUMENTATIE SYSTEEMWONINGEN ’50 -’75. Bouwhulp Groep. Priemus, H. 1986. Post-war public high-rise housing estates: what went wrong with housing policy, with the design and with management. Netherlands Journal of Housing and Environmental Research, 1. Priemus, H. & Elk, R. 1971. Niet-traditionele woningbouwmethoden in Nederland, Alphen a/d Rijn, Samsom. SHELTER 2013. The Guide for Integrated Design. SHELTER: Promoting Energy Renovation.
Stroomversnelling. 2014. Maak de Stroomversnelling mee! [Online]. 2014]. TES Energy Façade. 2014. SmartTES [Online]. Munich: Technische Universität München. Available: http://www.tesenergyfacade.com/index.php [Accessed 10-07 2013].
270

THE OTHER “HALF OF THE CITY” – ANALYSIS OF NON-RESIDENTIAL BUILDING STOCK AND ITS MATERIALS
Regine ORTLEPP
1
Karin GRUHLER 2 Georg SCHILLER 3
Clemens DEILMANN 4 1 Research Area Resource Efficiency of Settlement Structures, Leibniz Institute of Ecological Urban and
Regional Development (IOER), Dresden, Germany, Email: [email protected] 2 Research Area Resource Efficiency of Settlement Structures, Leibniz Institute of Ecological Urban and
Regional Development (IOER), Dresden, Germany, Email: [email protected] 3 Research Area Resource Efficiency of Settlement Structures, Leibniz Institute of Ecological Urban and
Regional Development (IOER), Dresden, Germany, Email: [email protected] 4 Research Area Resource Efficiency of Settlement Structures, Leibniz Institute of Ecological Urban and
Regional Development (IOER), Dresden, Germany, Email: [email protected] Keywords: building stock, material composition indicators, non-residential buildings, resource efficiency, Urban Mining
Abstract
The building sector consumes large quantities of resources and generates high levels of C&D waste. From the perspective of Urban Mining, the building stock is seen as a repository of secondary resources. To better manage this repository, we require knowledge of its quantity and dynamics. While a wide range of data is available on residential buildings, little is known about non-residential buildings. Taking the example of Germany, a method is presented to quantify the material stock of non-residential buildings using a Bottom-up approach. The Bottom-up approach includes three parts: First, material composition indicators (MCI) with respect to various building types; second, the country’s total floor space, and finally, the total material stock. The paper presented here focusses on the calculation method to obtain building type specific MCIs. The main results are MCIs for each building type as well as the material mass in total. In Germany the total material mass of non-residential buildings is approximately 6.8 billion tons, accounting for 44% of the entire building stock. These results indicate the significance of the embedded natural resources. Thus, a greater focus on the non-residential building stock would improve the efficient use of resources.
1. Introduction
One of the greatest challenges of our time is to preserve our natural resources and ensure that we consume these as efficiently as possible. The building stock plays a crucial role in this respect as it is one of the most significant energy consumers (e.g. D&R, 2012; Economidou et al., 2011), represents a vast amount of societal wealth, constitutes one of the largest anthropogenic repositories of raw materials (e.g. Kovacic, 2007) and generates high levels of construction and demolition (C&D) waste. Current discussions on the building stock generally focus on energy consumption (e.g. Rickaby & Gorgolewski, 2000), with considerations of resource efficiency taking a back seat. The concept of Urban Mining can help to shift this focus by viewing buildings as raw material repositories whose intelligent management has tremendous potential for conserving our reserves of raw materials (Kleemann et al., 2014; Brunner, 2011; Lichtensteiger, 2006). Urban Mining aims to bring the materials released by buildings back into circulation. This requires information on the stock and its dynamics (e.g. Kohler & Hassler, 2002; Kohler & Yang, 2007). A great deal of research has already been undertaken on the material stock and flows of residential buildings (RB) (e.g. Gruhler et al., 2002; Kohler & Hassler, 2002, Bergsdal et al., 2007; Kohler & Yang, 2007; Deilmann, et al., 2009; Hu et al., 2010). By contrast, little is known about non-residential buildings (NRB), although they account for approximately half of the total building stock (in terms of floor space) in many European countries (Kohler et al., 2009; see section 2). Reflecting the range of functions they provide, non-RBs are heterogeneous in terms of types of construction, rendering their systematic description more difficult. This background provides the motivation for the research presented in this article. A method is described to quantify the material stock of the national NRB stock, illustrated here by analysing the situation in Germany. The biggest hurdle to be overcome in any such attempt is the lack of empirical data. For example, in Germany there are no official statistics serving to quantify the NRB stock such as floor space in m². The same is true for material types and amounts. To resolve this problem, a method was developed to indirectly quantify the material stock of NRBs. This can be broken down into three steps: First, material composition indicators are calculated in t/m² floor space with respect to various NRB types. The building typology used for this reflects the different forms of use of NRBs (e.g. office blocks, agricultural buildings, factories, hospitals, etc.) as specified by official statistics. Second, the total floor space of NRBs is estimated and broken down according to the defined building types. Third, the total material stock is determined by combining the results of the previous two steps. In the following, this method is described in detail. Then
271

results are discussed concerning their plausibility and validity, the significance for Urban Mining considering resource efficiency aspects and the method’s applicability to analysing materials in the NRB stocks at European and indeed global level. The paper ends with some conclusions regarding the use of findings to support strategic planning issues, the need for additional knowledge on the NRB stock as well as ways in which the presented research and methods can help to move the discussion forward. However, the paper first gives an overview of the current state of research into the stock of NRBs and its material composition.
2. Literature Review
2.1 Classifying and quantifying the NRB stock
In contrast to the RB stock, the NRB stock encompasses a wide variety of uses and construction types. One possible approach to describing the heterogeneous NRB stock is to construct a typology of buildings (de Haan et al., 2001). The literature provides a number of different examples of this, which differ according to the objectives pursued with respect to reference area, structural types and system boundaries, e.g. Rußig (1999): three groups of buildings; Gierga & Erhorn (1993): 21 heated non-residential type buildings; Brown et al. (2000); Steadman, Bruhns & Gakovic (2000): construction-based types for England/Wales with focus on the building envelope, Deilmann et al. (2013) eight main heated NRB categories. Because such typologies and forms of classification have been developed for a range of purposes, they do not provide for easy comparison of data and findings. In most cases, such typologies were devised to investigate questions of energy efficiency or to provide a classification by forms of use. Material-specific typologies in the strict sense are currently unavailable. While national statistical agencies provide information on the RB stock, there is a general lack of data on the stock of NRBs (e.g. Rußig, 1999). Only a small number of studies have attempted to fill this gap by providing estimates of building stocks, for example in Austria, Switzerland, Germany, France, United Kingdom, Italy, Spain and New Zealand. In most cases, these studies have focused on a particular building sector such as heated NRBs or social infrastructure rather than the entire stock. A few studies have investigated Germany’s entire NRB stock. Kohler et al. (1999) estimated the floor space in Germany’s entire building stock in 1991 at 2,713 million m². Fleckenstein et al. (1989) extrapolate from workplace-specific area data taken from sample studies by considering the number of employed persons and estimated the floor space of Germany’s NRB stock of 1,534 million m² in 1989. Using data on the gross stock of fixed assets from national accounts1, Gruhler & Böhm (2011) have quantified Germany’s NRB stock for the year 2000 as 2.4 million buildings with a gross volume of 12,777 million m³ and total floor space of 2,146 million m². In addition to various statistics, geodata are also used to estimate parts the stock (e.g. Bischoff & Kohler, 2003; Deilmann et al., 2013). Behnisch & Ultsch (2009) provide an estimate of 38 million buildings for the total number of RBs and NRBs in Germany. In summary, we can say that, owing to the lack of hard data, it is necessary to make estimates of the existing stock of NRBs.
2.2 Material composition indicators
Current estimates of the material stock in existing buildings are either derived from macroeconomic statistics (top down) or extrapolated from building-specific data (bottom up). Top-down approaches (e.g. Müller, 2006; Fishman et al., 2014) provide almost no classification by type of materials and are unable to distinguish between different forms of building stock such as RBs and NRBs. By contrast, Bottom-up approaches supply much more detailed information on the constitution of the building stock. The basic principle of the Bottom-up approach is to define indicators that describe characteristic material compositions of typical buildings (material composition indicators – MCIs2) as well as indicators to estimate the physical size of the building stock in terms of some particular measure (e.g. floor space). The total amount of the material stock can then be calculated by multiplying the MCIs with the sum total of the respective stock (e.g. Schiller, 2007; Gruhler & Deilmann, 2015). In the field of industrial ecology, a number of studies have already been undertaken in different countries on the material stock of buildings. Tanikawa et al. (2015) provided a good overview of research over the past decade. Despite these diverse approaches to investigating the nature of the building stock and its dynamics (Kohler & Hassler, 2002), the material composition of the stock is still unclear (Kohler & Yang, 2007). This is especially true for the NRB stock (Kleemann et al., 2014). The researchers use a number of different terms to describe the composition of the material stock. The authors believe that the term “material composition” best fits the context of the current paper. Up to now most studies in the literature, have only investigated the residential stock (e.g. Bergsdal et al., 2007). However, there is a lack of research on MCIs for the analysis of NRBs. Some studies have distinguished between residential and NRBs without further classification of NRB types (e.g. Hong et al., 2014). Other studies have only considered individual materials of particular economic interest such as copper or steel, or have focused on the vast bulk of mineral materials. Differentiated MCIs for various NRB types are available e.g. for Germany, Austria, France and Japan. However, the Austrian and French studies (Kleemann et al., 2014 and Michel et al., 2012) are limited to city scale. Research on the material composition at national level has only been undertaken in Japan and Germany (Tanikawa et al., 2015; Gruhler & Deilmann, 2015). The Japanese statistical office provides MCI data for different types of construction. As such official statistics are still lacking in Germany, MCIs must be 1 Germany’s national accounts (Volkswirtschaftliche Gesamtrechnung, VGR) (Destatis, 2012) are included in the federal statistical
yearbooks (Statistische Jahrbücher des Bundes) (e.g. Destatis, 2011b). 2 The authors define MCI as a specific weight of the materials in kg/m².
272

derived from other sources of data. Thus, Fleckenstein et al. (1989) adopt two general raw-material coefficients to analyse non-residential stock, dividing the NRBs only into two groups. They provide coefficients in form of summed non-metallic mineral material quantities without further differentiation. Based on studies of the building stock of a small town, Bischoff & Kohler (2003) provide information on typical materials of building elements, but without any attempt at quantification. In summary, currently there is a lack of detailed knowledge of the material composition of building stocks in many countries. One central aim of this paper is to provide a method to create such information in the form of detailed indicators to describe the material composition of NRB types taking the German building stock as an example.
3. Estimating the floor space
As previously mentioned, the Bottom-up approach is generally suited to calculating materials in the building stock, classified by at least two main categories of use, i.e. residential and non-residential use. Two specifications are required for this Bottom-up approach:
1. a practical measure of the total stock (e.g. m² floor space) and 2. indicators for characteristic material compositions (MCI).
Clearly, the data quantifying the total stock must correlate in some way with the reference quantities captured by the MCIs. In the following subsections, we discuss the applicability of different reference quantities before providing details of the calculation of MCIs for NRBs. As previously mentioned, in Germany, official data is only available on the stock of RBs. No statistical data exists on the stock of NRBs. Therefore, the authors generated data by a newly developed model using as base data the gross fixed assets of structures as indicated in the national accounts system of Germany and other sources (Schiller et al., 2015). For 2010, their estimate of the total floor space of NRBs in Germany was approximately 3 billion m².
4. Material composition indicators for NRBs
The research presented in this paper adopts a three-stage concept to calculate material composition indicators (MCIs) for NRBs (Figure 1).
Synthetic building type
Office
building
Factory
buildingAgricultural
building
School
Foundation Exterior
wallInterior
wall
Ceiling Roof
…
Masonry Reinforced
concreteSandwich
element
Mullion -
transom …
MCIb
per m² floor space (fs)
general MCIe
per m² lement surface (es)
specific MCIe
per m² element surface (es)
frequency ofoccurrence [%]
area relationm² es / m² fs Synthetic building element
Construction variants of building elements
Figure 1 Modular concept for describing material composition indicators (MCIs)
The input data is an object database of newly constructed NRBs, compiled and published by the Building Cost Information Centre of the German Chamber of Architects (BKI, 2010, 2012). All BKI data is based on information provided by the planners of these new objects. The BKI database includes about 1,000 NRBs, classified into 38 categories. A date sheet is provided for each object construction plans, general information such as the year of construction, location and type of use, as well as data on areas and volumes, building element descriptions and costs. Eight of these 38 categories (representing 252 objects) were analysed in order to calculate MCIs. The selection was based on a rough estimate of the quantitative relevance (floor space) of the BKI building categories given by Deilmann et al. (2013) from an analysis of geodata from four of Germany’s federal states. Michel et al. (2012) use a similar approach to select the most relevant building to represent the vast bulk of material in Orléans, France. The analysed objects were built in the period 1976 to 2010. The data was supplemented by existing case study findings. Based on these data and density parameters, the first stage involves the determination of MCIs for structural variants of building elements (e.g., exterior wall designed as mullion-transom construction – see Error! Reference source not found.).
273

Table 1 Composition of the synthetic building element “exterior wall of factory building”
construction frequency of occurrence [%]
brickwork, plaster and thermal insulation 3 brickwork, metal cladding, facing masonry 12 steel/reinforced concrete construction + brickwork + metal cladding 35 steel/reinforced concrete construction + sandwich elements / steel sheet cassettes 35 mullion-transom construction + insulation glazing 10 glass band / insulation glazing 5 total 100
The second stage gives a description of general MCIs for building elements by considering the frequency of occurrence of the structural variants within a building element of a specific building type (e.g. exterior wall of a factory building – see Eq. (1)) (Gruhler and Deilmann, 2015). This results in general MCIs for synthetic building elements. A synthetic building element (e.g. exterior wall) represents the average composition of the existing building elements (e.g. concrete wall, brick wall etc.) in a defined building type (e.g. factory building).
general specific n
e e
i i
i
MCI MCI (1)
with general eMCI ... MCI of synthetic building element [kg/m² es] i ......................... index of construction type n ........................ number of construction types
i ....................... frequency of occurrence [-] specific e
iMCI .. MCI of specific building element of construction type i [kg/m² es] The third stage is to calculate the MCIs for an entire object. This is achieved by considering the ratio of the area of the structural element (m² element surface) to complete building area (m² floor space). The total material indicator of a synthetic building type is the sum of the individual MCIs (correlated to floor space) of each building element (Eq. (2)).
general m
jb e
j
j
esMCI MCI
fs (2)
with bMCI ................ MCI of synthetic building [kg/m² fs] j ........................ index of synthetic building element m ....................... number of synthetic building elements general e
jMCI ... MCI of synthetic building element j [kg/m² es] jes ..................... element surface of synthetic building element [m² es]
fs ...................... floor space of synthetic building [m² fs] Error! Reference source not found. is an example of a datasheet summarizing the general MCIs of the synthetic building element “exterior wall of factory building” in relation to element surface (m² es) and to the floor space of the entire building (m² fs). According to the database, the mean element surface is 1,764 m² and the mean floor space of factory buildings is 2,535 m² (a ratio of 0.696). In order to use the MCIs for Bottom-up calculation analyses of material compositions of the stock, it is necessary to describe the interface between BKI building types and building types specified by official statistics. Germany’s official statistics on buildings classifies the non-residential stock into seven main types. Figure 2 gives the resulting MCI values for these building types. There is considerable variation in these values for the different building types (up to a factor of three). Building types that tend to require hall-like constructions, for example agricultural buildings, are marked by considerably lower MCIs than buildings with massive interior walls and ceilings, such as office buildings. The extent of circulation areas within the buildings, such as staircases and corridors, is a further influence. These are not considered to be part of the floor space. Hence, buildings with high ratios of circulation areas such as schools or sports facilities show remarkably high MCIs in relation to floor space. Figure 4 also shows significant differences in the material composition of the MCIs. Thus, the MCI of agricultural buildings consists to 67% of concrete (cf. Ortlepp & Schiller, 2014); for trade and storage buildings, the proportion is 25%.
274

Table 2 General MCI of the synthetic building element “exterior wall of factory building” referred to element
surface and to floor space
material general MCI [kg/m² es] [kg/m² fs]
lime mortar, lime-cement mortar 93 4.39 standard concrete B25 567 66.07 clinkers 13 1.06 vertically perforated bricks 101 11.69 sand-lime bricks 72 8.35 aerated concrete blocks 194 22.54 fibre cement boards 1 0.09 timber boards 3 0.41 timber scantlings 11 1.43 polystyrene rigid foam 6 0.88 mineral wool 59 8.84 PVC film 2 0.08 Glass 47 2.57 Steel 86 13.11 aluminium 13 1.07 total 1,269 143
0 1 2 3 4
Plaster, screed, mortarConcreteMasonryBuilding boardsWood, engineered woodInsulation materialsRoof coveringFloorings, sealing sheetingsOther materials, fillsMetals
Institutional buildings
Office and administrative buildings
Agricultural commercial buildings
Factory and workshop buildings
Trade and storage buildings
Hotels and restaurants
Other non-residential buildings
MCI [t / m² fs]
2.1
2.6
1.1
2.5
2.4
2.0
3.2
Figure 2 Material compositions of NRBs by usage types of the official building statistics
5. Total material mass in Germany’s NRB stock
By combining MCIs with figures on floor space, it is possible to calculate the total material stock in NRBs classified in various ways:
By material group and building type (Eq. (3)) – the mass M of a building material group i of a building type j is determined by multiplying the total floor space FS(j) of the building type j with the respective specific material coefficient MCI(i,j).
, , ,i j synth i i synth jM NRB FS NRB MCI NRB (3)
with M .......absolute mass [million t] i ..........index of building material group j .........index of synthetic NRB type (NRBsynth) FS ......floor space [million m²] MCI ...material composition indicator [t/ m² fs]
By material group (Eq. (4)):
7
,
1
i i j
j
M NRB M NRB
(4)
By building type (Eq. (5)):
10
,
1
j i j
i
M NRB M NRB
(5)
275

Mineral materials clearly make up a much larger proportion of the material stock than organic and metallic building materials. The dominant mineral material is concrete (Figure 3). Analyses of RBs (e.g. Schiller et al., 2015) show similar orders of magnitude for the material distribution. The most striking difference is concerning the proportion of metals (primarily constructional and reinforcing steel), which are much higher for NRBs than for RBs (8% of mass as opposed to 1% – 4%). This can be explained by the existence of steel-frame NRBs (in Germany there is no tradition of steel-frame RBs).
13.4 %
36.7 %
19.5 %
19 Mt, 0.3 %152 Mt, 2.2 %
59 Mt, 0.9 %17 Mt, 0.3 %
186 Mt, 2.7 %
16.0 %
7.8 % Plaster, screed, mortar
Concrete
Masonry
Building boards
Wood, engineered wood
Insulation materials
Roof covering
Floorings, sealing sheetings
Other materials, fills
Metals
2,492 Mt
1,325 Mt
1,088 Mt
912 Mt532 Mt
Figure 3 Material composition of the German NRB stock (own calculation)
The allocation of total material mass to building type (Figure 4) resembles the distribution of floor space. An exception must be made in the case of agricultural buildings: While agricultural buildings provide 15% of total floor space, they contain only 6% of the stock of building materials. This type therefore ranks fifth in the relative stock of material mass, behind office buildings and the other buildings (schools, etc.).
258
1,002
473
1,548
2,614
120
766
0
500
1,000
1,500
2,000
2,500
3,000
Mat
eria
l mas
s [m
illio
n t]
Inst
itutio
nal
build
ings
Ofic
e an
d
adm
inis
trativ
e bi
ldin
gs
Agr
icul
tura
lco
mm
erci
albu
ildin
gs
Fac
tory
an
d w
orks
hop
build
ings
Trad
e an
d st
orag
e bu
ildin
gs
Hot
els
and
rest
aura
nts
Oth
er n
on-
resi
dent
ial
build
ings
Figure 4 Material stock in existing German NRBs by building types
The total material mass of the NRB stock can be derived as the sum of the masses of the individual materials calculated by Eq. (4), or as the sum of the masses of the individual building types calculated by Eq. (5). Both calculations yield the same result of approximately 6.8 billion tons of total building material in Germany’s NRB stock. By comparison, according to Schiller et al. (2015) the material stock in German RBs is in the range 8.4 to 9.3 billion tons. The material bound in Germany’s NRB stock thus comprises approximately 42% – 45% of the total stock of material contained in German buildings.
6. Discussion
6.1 Material composition indicators
The heterogeneity of NRBs represents an enormous challenge to any attempt to quantify material stocks and flows using material composition indicators. The various uses of these buildings determine their physical structures, which can range from small buildings such as workshops to the facilities of large industrial companies, from lightweight storage facilities to massive buildings with complex fittings. This suggests that indictors must be sufficiently differentiated in order to limit errors in the estimation of material stocks and flows. The analyses presented here confirm this requirement. There are marked differences in the total specific masses of building types as well as their material composition. Regarding the building stock as a potential stock of secondary resources, the presented MCIs are suitable to describe this heterogeneity. In the context of urban mining, a finer differentiation between material categories should enable the development of more recycling options (e.g. Schiller et al. 2015). Thus, it is not sufficient to merely distinguish between basic material groups such as minerals, plastics, metals, wood and others. It is rather difficult to ensure that calculated MCIs are both valid and representative. Solid base data is required for this as well as sufficient transparency in underlying methods of calculating MCIs. A review of the
276

literature shows that these requirements are rarely met in full. Some of the few studies that have used MCIs to analyze material flows of NRBs provide little documentation on the underlying method. The presented work attempts a more precise formulation of the adopted approach to calculating MCIs than other studies (e.g. Wang et al., 2004; Yang & Kohler, 2008; Hong et al., 2014). If information is available, case studies and analysis of sets of individual buildings are presented as a confirmation (e.g. Michel et al., 2012; Kleemann et al., 2014). Comprehensive databases are generally lacking. One exception is the case of Japan, were material figures are available in the form of official statistics (Tanikawa et al., 2015). Thus a basic challenge is to improve the empirical database for MCIs, a step to which this paper can be considered a contribution. However, the adopted database can be further refined by statistical analysis to improve the validity of MCIs. Data availability varies from country to country. It has been pointed out that official statistical data is available in Japan to permit the determination of MCIs (Tanikawa et al., 2015). Any review of such data should consider whether all building elements are taken into account or (as is the case in Germany) only the load-bearing structure is considered (Destatis, 2011a). In the latter case, additional assumptions must be made in the calculation of MCIs, clearly at the expense of validity. Similar efforts to improve base data should be undertaken in other countries. In the United Kingdom, for example, one possibility would be to use available data from quantity surveys to qualify MCIs for NRBs. Currently there are only very few studies which could supply data to evaluate the presented method of determining MCIs. Currently there are no benchmarks suitable to validate the MCIs presented in this paper. The most serious barriers to validation are the various definitions of building types, reference features and regional requirements on specific constructions designs (e.g. to meet earthquake resistance guidelines). Therefore, validation can only be undertaken for specific building types by considering variations in regional construction types and other design requirements. In the data on Japan’s building stock used by Tanikawa et al. (2015), for example, the definitions of building types overlap with those adopted in this paper. Another notable fact is that Japanese buildings are generally heavier due to the stronger load-bearing structure, presumably to ensure sufficient resistance to seismic activity. Regarding agricultural buildings, the definition of building type in the Japanese study closely matches that adopted here; indeed, both typologies use the same reference feature (m² floor space). This permits a comparison of MCI for agricultural buildings. The data used by Tanikawa et al. (2015) classifies agricultural buildings according to various types of construction, so that the MCI ranges from 1.0 t/m² for wooden frame constructions to 3.9 t/m² for reinforced concrete constructions. The MCI for agricultural buildings determined here is 1.1 t/m². Considering that wooden frames are the dominant form of construction in Germany for agricultural buildings, and that the country’s building code stipulates lower strength requirements (reflecting the lower earthquake risk), these figures for wooden frame constructions as well their relationship to other forms of construction seem plausible. However, this indication of the validity of the approach does not remove the need for more detailed evaluation and research.
6.2 Estimating the total material mass of Germany’s NRBs
In the presented bottom-up approach, the estimation of total material mass is based on the derived MCIs and floor space as input data. Since both of these variables suffer from uncertainties, the final value for total material mass must be viewed as tentative. Schiller et al. (2015) have attempted to quantify the disparity between the results of bottom-up and top-down approaches. Since top-down approaches provide data solely on annual flows, such comparison is only possible for flows rather than stock. Comparing the results of the top-down and bottom-up methods for groups of materials and goods, we see that the material flows obtained from top-down methods are generally higher than those obtained from bottom-up methods, although divergences can exist in both directions. For example, in the case of steel the top-down value is lower than the value determined by the bottom-up method. Hence, it is not always the case that the top-down values form an upper boundary; the determining factor is the specific data at hand. Future research should look at appropriate forms of data qualification (e.g. determination of the spread of values).
6.4 Relevance to Urban Mining and resource efficiency
Proponents of Urban Mining argue that capital and consumer goods contain valuable materials that should be recovered. Here the focus is mostly on rare earths and precious metals. However, while such materials make up a considerable proportion of the mass of consumer and production goods, they are only a small proportion of building materials (Schiller et al. 2015). Buildings also contain economically interesting raw materials such as metals. As shown here in the case of Germany’s stock of buildings, these materials are present in considerably higher proportions in NRBs than in RBs. In practice, recycling paths are already well organized due to the financial savings that can be made by reusing such valuable materials. While the options for the recovery, recycling and reuse of mineral building materials (regulated by the EU Waste Framework Directive) are considerably more limited, these should certainly be exhausted, in line with policy goals (e.g. BMUB, 2012). In such cases environmental arguments hold sway rather than questions of economic efficiency. Every effort should be made to use secondary materials in order to minimize the exploitation of the natural environment while satisfying the demand for natural resources (BMUB, 2012). In Germany more than 90% of the documented mineral construction waste is already recovered, a large proportion of this in surface mining sites as part of recultivation measures. In some cases these measures may conflict with soil and water protection legislation if pollutants leach out from recycled waste used for recultivation or for construction. Both at the national level and at the level of the federal states, stricter limits are being discussed and already partly implemented to limit the use of construction waste as a recultivation material. The impact will be to place the future resource recovery of such mass waste on an uncertain footing. More generally, it is clear that greater knowledge is required of the quantity and quality of materials
277

within the built environment in order to accurately calculate output flows and thus to support resource recovery and waste management strategies at both the national and regional levels (e.g. Hiete et al., 2011). The method discussed in this paper can help quantify the physical capital of our building stock viewed as a resource. Efficient use of this stock cannot be limited to waste flows and the potential of recovering secondary materials. In the hierarchy of waste management, care and maintenance of the stock must be the primary goal before any consideration of the reuse, recovery and recycling of materials. All strategies of material conservation should not only aim to consume as little material as possible (to be measured by minimum MCI values) but also to ensure the longevity of buildings. This means, for instance, encouraging a wide diversity of use to extend the lifespan of buildings and revising building codes to require stronger structures in order to accommodate new load-bearing requirements or environmental impacts. Of course, such considerations may appear to contradict efficiency objectives. For example, agricultural buildings in Japan have a substantially higher material intensity (larger MCI) than such buildings in Germany due to the more stringent requirements for earthquake resistance. In this way, the longevity of the building stock is extended in Japan, confirming the argument that an overly narrow focus on resource efficiency concerning input materials can in the end lead to higher consumption of materials. This can be described as a misinterpretation of resource efficiency (e.g. Hassler & Kohler, 2014). To sum up, quantification of the building stock is a prerequisite for any resource-oriented discussion of stock development.
6.3 Transferability of the proposed method
Differences in the definition of MCIs are generally related to underlying variations in the selected building typologies. In general, building types are defined along types of use, each of which can include various types of construction. There are indications that MCIs can be more easily transferred when based on construction types rather than types of use, as load-bearing structures generally obey international norms, at least in developed countries (e.g. “Eurocodes” for Europe, American (ACI) or British Standards (BS)). Differences in the actual construction may sometimes reflect an individual country’s guidelines on building physics, such as ratings for energy consumption. Other considerations, such as earthquake protection, can also affect the type of construction selected to meet the required use. In order to improve transferability of MCI in the global context, further research should attempt to define MCIs for construction types that resist MCI analysis based on type of use. It is only possible to conjecture on the potential for the transferability of methods for stock estimation. This will largely depend on the availability of required data. However, as non-residential stocks and their changes are currently rarely documented in official statistics, methods to estimate the size of this stock are indispensable.
7. Conclusions
NRBs account for 44% of the total building stock in Germany. Clearly, a similarly level of attention must be paid to this stock as is currently paid to RBs concerning the issue of resource efficiency. In this paper, we describe a first attempt to quantify Germany’s stock of NRBs by estimating its total size and the material masses contained within. One general problem in studying the NRB stock is a lack of comprehensive data. For this reason, the paper takes an indirect approach, using financial data and records of the intensity of building activity to make estimates of national floor space. Another difficulty to be overcome is specifying the material composition of the NRB stock in view of its heterogeneity and the patchy availability of data. The database employed in the case at hand suffers from such gaps, undermining the general validity of final stock estimates. However, the authors are unaware of any other publication that has pursued this specific strand of research. Hence, the paper’s value added is in the determination of material composition indicators to supplement existing lists of material composition indicators in the literature. Nevertheless, future research is required to improve the reliability of empirical findings and to provide results that are more detailed. The presented research forms a basis for discussion and further work in the analysis of material stocks. Findings can be used to improve the strategic planning of governmental authorities or to revise the business plans of companies in the construction and waste management sector.
8. References
Behnisch, M., & Ultsch, A. (2009). Estimating the number of buildings in Germany. In: Fink, A., Lausen, B., Seidel, W., & Ultsch, A. (Eds.). Advances in Data Analysis, Data Handling and Business Intelligence. Berlin: Springer, pp. 311–318. Bergsdal, H., Brattebø, H., Bohne, R.A., & Müller, D.B. (2007). Dynamic material flow analysis for Norway’s dwelling stock. Building Research & Information 35, 557–570. Bischoff, W., & Kohler, N. (2003). DFG-Projekt Validierung eines integrierten, dynamischen Modells des deutschen Häuserbestandes. [DFG project Validation of an integrated, dynamic model of the German house stock]. BKI Baukosteninformationszentrum (Ed.) (2010). Stoy, Ch., Beusker, E.: BKI Objektdaten NK1 [BKI object data user costs indicators 1]. Stuttgart: BKI. BKI Baukosteninformationszentrum (2012). BKI KOSTENplaner 15 Basisversion – Neu-/ Altbau, Freianlagen Kostenermittlungsprogramm und Kostendaten zu 1./2. Ebene DIN 276 [Computer software]. http://bki.de/kostenplaner.html. Including object database [data set].
278

Bundesministerium für Umwelt, Naturschutz, Bau und Reaktorsicherheit (BMUB) (Ed.). (2012). Deutsches Ressourceneffizienzprogramm (ProgRess) [German resource efficency program]. Retrieved from http://www.bmub.bund.de/fileadmin/Daten_BMU/Pools/Broschueren/progress_broschuere_de_bf.pdf. Brown, F. E., Rickaby, P. A., Bruhns. H. R., Steadman, J. P. (2000). Surveys of non-residential buildings in four English towns. Environment and Planning B: Planning and Design 27, 11–24. Brunner, P. H. (2011). Urban Mining: A Contribution to Reindustrializing the City. Journal of Industrial Ecology, 15, 339–341. D&R International, Ltd. (Ed). (2012). Buildings Energy Data Book: Prepared for the Buildings Technologies Program Energy Efficiency and Renewable Energy. U.S. Department of Energy. Retrieved from http://buildingsdatabook.eren.doe.gov/docs%5CDataBooks%5C2011_BEDB.pdf. de Haan, G., Lantermann, E.-D., Linneweber, V., & Reusswig, F. (Ed.). (2001). Typenbildung in der sozialwissenschaftlichen Umweltforschung [Typification in sociological environmental research]. Opladen: Leske + Budrich. Deilmann, C., Effenberger, K.H., & Banse, J. (2009). Housing stock shrinkage: vacancy and demolition trends in Germany. Building Research & Information 37, 660–668. Deilmann, C., Behnisch, M., Dirlich, S., Gruhler, K., Hagemann, U., Petereit, R., ... Petereit, K. (2013). Systematische Datenanalyse im Bereich der Nichtwohngebäude – Erfassung und Quantifizierung von Energieeinspar- und CO2-Minderungspotenzialen [Systematic data analysis in the area of non-residential buildings – recording and quantification of energy saving and CO2 reduction potentials]. BMVBS-Online-Publikation 27/2013. Destatis (2011a). Bautätigkeit und Wohnungen: Fachserie 5, Reihe 1, Bautätigkeit 2011 [Building activity and flats: Technical series 5, vol. 1, building activity 2011] [data set]. Destatis (2011b). Statistisches Jahrbuch 2011 für die Bundesrepublik Deutschland mit Internationalen Übersichten [Statistical yearbook 2011 for the Federal Republic of Germany with international overviews] [data set]. Destatis (2012). Volkswirtschaftliche Gesamtrechnungen (VGR). Fachserie 18, Anlagevermögen nach Sektoren 2011 – Arbeitsunterlage [National accounts (VGR). Technical series 18, stock of fixed assets by sectors 2011 – working document] [data set]. Economidou, M. et al. (2011). Europes Buildings Under the Microscope: A country-by-country review of the energy performance of buildings. Buildings Performance Institute Europe (BPIE). Retrieved from http://www.institutebe.com/. Fishman, T., Schandl, H., Tanikawa, H., Walker, P., & Krausmann, F. (2014). Accounting for the Material Stock of Nations. Journal of Industrial Ecology 18, 407–420. Fleckenstein, K., Hochstrate, K., Knoll, A., & Billek, B. (1989). Prognose der mittel- und langfristigen Nachfrage nach Baurohstoffen [Forecast of the medium- and long-term demand for constructional raw materials] (research report). Bonn: BBR, Issue 85. Gierga, M., & Erhorn, H. (1993). Bestand und Typologie beheizter Nichtwohngebäude in Westdeutschland [Stock and typology of heated non-residential buildings in West Germany]. Sub-report No. 5-14 of research project IKARUS. Stuttgart. Gruhler, K., & Böhm, R. (2011). Gruhler, K., & Böhm, R. (2011b). Ressourcenbezogene Kennwerte von Nichtwohngebäuden – Analyse und Aufarbeitung von Daten der Statistik „Bauen und Wohnen“ [Resource-related indicators of non-residential buildings – analysis and presentation of data of the statistics “building and habitation“]. Stuttgart: Fraunhofer IRB. Gruhler, K., Böhm, R., Deilmann, C., Schiller, G. (2002). Stofflich-energetische Gebäudesteckbriefe – Gebäudevergleiche und Hochrechnungen für Bebauungsstrukturen [Material and energy profiles for buildings – comparison of buildings and extrapolations for urban structure types]. IÖR-Schriften, Vol. 38. Gruhler, K., & Deilmann, C. (2015). Materialkennwerte von Nichtwohngebäuden [Material composition indicators of non-residential buildings]. Stuttgart: Fraunhofer IRB. Hassler, U. & Kohler, N. (2014). The ideal of resilient systems and questions of continuity. Building Research & Information 42, 158–167. Hiete, M., Stengel, J., Ludwig, J., Schultmann, F. (2011). Matching construction and demolition waste supply to recycling demand: a regional management chain model. Building Research & Information 39, 333-351. Hong, L., Zhou, N., Fridley, D., Feng, W., & Khanna, N. (2014). Modeling China’s Building Floor-Area Growth and the Implications for Building Materials and Energy Demand. ACEEE Summer Study on Energy Efficiency in Buildings, 10-146–10-157. Retrieved from http://aceee.org/files/proceedings/2014/data/papers/10-230.pdf. Hu, M., van der Voet, E., & Huppes, G. (2010). Dynamic Material Flow Analysis for Strategic Construction and Demolition Waste Management in Beijing. Journal of Industrial Ecology 14, 440–456. Kleemann, F., Lederer, J., Aschenbrenner, P., Rechberger, H., & Fellner, J. (2014). A method for determining buildings’ material composition prior to demolition. Building Research & Information, Early View.
279

Kohler, N., & Hassler, U. (2002). The building stock as a research object. Building Research & Information 30, 226–236. Kohler, N., Hassler, U., & Paschen, H. (1999). Stoffströme und Kosten in den Bereichen Bauen und Wohnen [Material flows and costs in the areas of building and habitation]. Berlin Heidelberg: Springer. Kohler, N., Steadman, P., & Hassler, U. (2009). Research on the building stock and its applications. Building Research & Information 37, 449–454. Kohler, N., & Yang, W. (2007). Long-term management of building stocks. Building Research & Information 35, 351–362. Kovacic, I. (2007). Building performance evaluation on “dynamical building” model - towards strategy for sustainable planning. Schrenk, M., Popovich, V., & Benedikt, J. (Eds), REAL CORP 007: To plan is not enough (pp. 185–193). Wien-Schwechat: CORP. Lichtensteiger, T. (Ed.). (2006). Bauwerke als Ressourcennutzer und Ressourcenspender in der langfristigen Entwicklung urbaner Systeme [Structures as resource users and resource providers in the long-term development of urban systems]. Zürich: Vdf Hochschulverlag AG. Meinel, G., Hecht, R., & Herold, H. (2009). Analyzing Building Stock using Topographic Maps and GIS. Building Research & Information 37, 468-482. Michel, P., Serrand, M., Montfort-Climent, D., Jayr, E., & Papinot, P.E. (2012). Projet ANR ASURET: Analyse de flux de matière du secteur de la construction à l’échelle de l’ouvrage et du territoire [Project ANR ASURET: Analysis of material flows of construction sector on work and territory scale] (final report). BRGM/RP-61849-FR. Retrieved from http://infoterre.brgm.fr/rapports/RP-61849-FR.pdf. Müller, D.B. (2006). Stock dynamics for forecasting material flows: Case study for housing in The Netherlands. Ecological Economics 59, 142–156. Ortlepp, R., & Schiller, G. (2014). Baumaterialien in deutschen Nichtwohngebäuden – eine Analyse [Building materials in German non-residential buildings – an analysis]. Bautechnik, 91, 414–424. Rickaby, P. A., & Gorgolewski, M. T. (2000). A classification system for services in nondomestic buildings. Environment and Planning B: Planning and Design, 27, 695–708. Rußig, V. (1999). Gebäudebestand in Westeuropa: Fast 17 Mrd. m² Wohn- und Nutzfläche, Ausgewählte Ergebnisse der Studie „EUROPARC – Der Bestand an Gebäuden in Europa“ [Building stock in Western Europe: almost 17 billion m² of floor space, selected results of the study “EUROPARC – the stock of buildings in Europe”]. ifo-Schnelldienst 12/1999. Schiller, G. (2007). Urban infrastructure: challenges for resource efficiency in the building stock. Building Research & Information, 35, 399-411. Schiller, G., Ortlepp, R., Krauß, N., Steger, S., Schütz, H., Fernández, J. A., Reichenbach, J., Wagner, J., Baumann, J. (2015, in press). Kartierung des anthropogenen Lagers in Deutschland zur Optimierung der Sekundärrohstoffwirtschaft [Mapping the anthropogenic stock in Germany to optimise the secondary raw material economy]. Steadman, P., Bruhns, H. R., & Gakovic, B. (2000). Inferences about built form, construction, and fabric in the nondomestic building stock of England and Wales. Environment and Planning B: Planning and Design 27, 733–758. Tanikawa, H., Fishman, T., Okuoka, K., Sugimoto, K., (2015). The Weight of Society Over Time and Space: A Comprehensive Account of the Construction Material Stock of Japan, 1945-2010: The Construction Material Stock of Japan. Journal of Industrial Ecology, Early View. Tanikawa, H., Managi, S., & Lwin, C. M. (2014). Estimates of Lost Material Stock of Buildings and Roads Due to the Great East Japan Earthquake and Tsunami. Journal of Industrial Ecology 18, 421–431. Wang, J.Y., Touran, A., Christoforou, C., & Fadlalla, H. (2004). A systems analysis tool for construction and demolition wastes management. Waste Management 24, 989–997. Yang, W. & Kohler, N. (2008). Simulation of the evolution of the Chinese building and infrastructure stock. Building Research & Information 36, 1–19.
280

BUILDING MATERIAL SUBSTITUTES VS. TOPSOIL HARVESTING – TECHNICAL CONSIDERATIONS WITH A FOCUS ON DEVELOPING COUNTRIES
Regine ORTLEPP
1
Georg SCHILLER 2 Zita SEBESVARI 3
1 Research Area Resource Efficiency of Settlement Structures, Leibniz Institute of Ecological Urban and
Regional Development (IOER), Dresden, Germany, Email: [email protected] 2 Research Area Resource Efficiency of Settlement Structures, Leibniz Institute of Ecological Urban and
Regional Development (IOER), Dresden, Germany, Email: [email protected] 3 Environmental Vulnerability & Ecosystem Services Section, UNU-EHS, Bonn, Germany, Email:
[email protected] Keywords: building material, substitution, sustainable buildings, sustainable land use, urban rural nexus
Abstract
Due to the acceleration in processes of urbanization in developing countries, especially in Africa and Asia, large quantities of building materials are needed to construct the built environment (infrastructures and buildings). This entails the extraction of raw materials such as gravel, sand, clay, etc around the world, frequently in peri-urban areas. In particular, the mining of gravel (largely for concrete production) and the extraction of clay (brick production), e.g. by topsoil harvesting, lead land-use conflicts, undermine livelihoods and food security and degrade the environment. There is an increasing recognition that: i) more research is needed to understand and assess the impacts of this material extraction; and ii) alternatives must be explored, such as substitutes in the production of building materials. Integrated approaches that combine impact assessments on soils and more generally on the environment with technical issues regarding the requirements of building materials and buildings are currently lacking. The paper on hand introduces the first conceptual considerations, how to potentially bridge the gap between discussions on soil and land use by geologists, environmental scientists on the one hand, and the concerns of civil engineers or town planners on the other hand. The focus lies on structuring the problem and trying to adopt a cross cutting technological perspective with the aim to open the discussion on this highly relevant topic.
1. Introduction
1.1 Problem statement
Rising populations and higher prosperity levels around the world are accompanied by a growing demand for resources. Developing countries present a particular problem due to their exploding populations and ongoing processes of urbanisation, which lead to a higher than average demand for raw materials for the construction of housing and infrastructure. In particular, it is the rural periphery of cities that suffer under the extraction of raw materials. This is where severe conflicts can arise with the interests of agriculture as well as tourism (e.g. Rahman et al., 2015, Weigand, 2015, Schiller & Wirth, 2015). Studies in this field often have a narrow research focus: They address geological (Rahman et al., 2015) or agricultural problems (Weigand, 2015), are primarily interested in the extraction of raw materials and associated conflicts in land use, or focus on technical issues while ignoring the local supply and demand of materials (Shakir & Mohammed, 2013). The concept presented by Schiller and Wirth (2015) attempts to bring both sides together by integrating discussions on the demand for building materials with regional planning issues and the question of how to deal with the extraction of raw materials. Developed countries (EU, U.S. etc) try to address these environmental issues e.g. by green building certification systems. However, such initiatives have not yet applied to developing countries. The paper on had outlines a research concept which attempts to fill this gap. The idea is to systematize regional-specific construction methods and technological requirements, taking into account the local supply and demand of raw materials. Starting from technical considerations, we ask what are the specific requirements regarding the quality of building materials in terms of structural safety and resistance to climatic conditions (local demand), and what potential substitute materials exist that exploit local resources in order to contribute to a reduction in the extraction of natural raw materials, i.e. the likely impact that such substitution will have on, for example, topsoil harvesting due to traditional brick constructions. A major aspect is the availability of alternative resources that can serve as potential substitutes for conventional building materials (local supply).
281

1.2 Literature review
1.2.1 Research into topsoil removal and food security In many countries with high population growth and/or urbanization rates, such as Bangladesh, Vietnam and India, there is a high demand for affordable construction materials to meet the needs for new infrastructure. Despite the availability of many innovative building materials, the conventional brick is still a popular material for the construction of buildings. Clay bricks, in particular, are a widely used traditional building material. In many developing countries a common method to obtain the clay needed for brick production is by removing the topsoil (Rahman et al., 2015). Yet the stripping of such a fertile layer threatens soil quality and fertility as well as reducing the retention of irrigation water. Thus the removal of topsoil threatens food security and livelihoods in densely populated and rapidly urbanizing parts of South and Southeast Asia (Sebesvari et al., 2015). As well as degrading soil, which is one of our planet’s practically non-renewable resources, large amounts of biomass (mainly firewood and rice straw) burnt in brick kilns pollute the air and account for a significant share of greenhouse gas emissions (Chen et al., 2010). Kathuria & Balasubramanian (2013) state that brick kilns in India are unfortunately largely situated on fertile agricultural land, as here brick manufacturers encounter good drainage conditions and the required silty clay loam to silty clay soils. In their paper they quantify the agricultural impacts of topsoil removal by brick manufacturers on Tamil Nadu, a southern state of India. According to their findings, it is economically rational for farmers to sell soil in the short run. This decision is strengthened when the farmers’ income is low and they are offered high prices for their soil. In view of the unpredictability of all agriculture activities, the option of selling soil seems particularly attractive. The proximity of the plots to the brick kilns with suitable road links and the need to level the field to provide surface irrigation by gravity flow are the other important factors that induce the farmers to sell soil. Moreover, the prices offered by the operators of the brick kilns for good quality soil have increased significantly in recent years due to increased demand and low supply. However, the opportunity cost of selling topsoil for brick production is likely to rise in the long run in view of the increasing scarcity of good quality soils for agriculture. In Bangladesh, population growth paired with a lack of alternative building materials has boosted demand for bricks (World Bank, 2010), leading to more and more paddy fields being use for clay extraction (BUET, 2006). The spread of soil selling is partly due to a relaxation in governmental controls over the last few years (Rahman, personal communication, 2014; current Professor at Dhaka University). Brick production in Bangladesh has also been boosted by a sharp increase in demand for bricks in India, where the government has already acknowledged topsoil removal as a problem and implemented restrictions to protect soil resources (NGT 288/2013, decision of The National Green Tribunal of India). Simultaneously, India lifted the custom duty on brick imports in 2009, thereby generating lucrative opportunities in Bangladesh and encouraging the establishment of new kilns for increased exports (Thaindian News, 13.08.2009; Bangladesh News, 24.08.2009). While concentred along the Indian border and around urban centers, brick kilns can nowadays be found all over Bangladesh (World Bank, 2010). In recent years the use of topsoil for brick production has been recognized as one factor undermining food security in densely populated and rapidly urbanizing South and Southeast Asia (Lal, 2013). Topsoil removal not only reduces land fertility while shrinking stocks of agricultural land; it also serves to lower groundwater tables (Santhosh et al., 2012). Despite these severe repercussions, only a small number of studies have investigated clay extraction and its impact on land productivity (e.g. Heierli and Maithel 2008) and poverty. In fact, the extent of topsoil removal around the world (and its regional distribution) is unknown; potential yield gaps are only occasionally quantified; the vulnerability of different soil types is unknown; the social and economic aspects of soil selling have not been analysed; and soil removal is not specifically considered in land degradation assessments. More dedicated research is required to create a solid body of scientific evidence to support the establishment of monitoring programmes, recommendations and regulations, and ultimately the development of alternative solutions. One such solution is the replacement of clay by more sustainable materials such as waste (e.g. fly ash) for brick production. Without suitable substitutes for bricks, it is unlikely that soil mining can be avoided in the future. Arable land that has been degraded through soil extraction for brick production needs to be rehabilitated if crops are once again to be cultivated (Sebesvari, 2015).
1.2.2 Research into waste as a substitute material
The rapid growth in the construction industry in many developing countries has forced civil engineers to search for alternative building materials such as those derived from forms of waste (ubuntublox, 2015, ecobricks, 2015). However, such projects are mostly still at the test stage. Research on potential material substitutes generally focusses on the use and handling of solid waste from industry and agriculture. Examples of such waste materials are sewage sludge (Liu et al., 2011, Cusidó & Cremades, 2012), recycled tea leaves (Demir, 2006), kraft pulp production residues (Demir et al., 2005), cotton and recycled waste from paper mills (Rajput et al., 2012, Raut et al., 2012) as well as rice husk ash (Raut et al., 2013) or PET bottles (Barman et al., 2015). However, such projects are mostly at the testing stage, and the traditional means of bricks production with its hazardous repercussions has not yet been changed or replaced by a more efficient and sustainable one (Shakir & Mohammed, 2013).
1.2.3 Engineering-related research Civil engineering studies on building materials still have a narrow focus on mechanical properties, i.e. the enhancement of material strength, performance and quality, with only minor considerations of environmental
282

impact. The trend of research into building materials has been towards properties at the nanoscale level (Pacheco-Torgal et al., 2013). Alwood et al. (2001) have pointed out that researchers have paid too little attention to the crucial issue of materials efficiency. Only a handful of published scientific papers has addressed environmental concerns in some fashion or other, indicating that the eco-efficiency concept has not yet successfully entered this field. In addition, the Millennium Development Goals (MDGs) of the UN are generally not acknowledged in this scientific field (Pacheco-Torgal & Labrincha, 2013). Developments in the construction industry are towards prestige projects (ever larger bridges and taller buildings, etc.) against a backdrop of high economic pressure. This is true of both developing and developed countries. Architects and civil engineers are required to meet functional and structural requirements. The choice of building materials is largely determined by these factors as well as a consideration of the overall cost. Structural engineers are only concerned with the mechanical properties of building materials and do not care about their origin in terms of which natural resource is extracted for their manufacture.
1.2.4 Interdisciplinary research Most of the research previously undertaken in this field has focussed on the environmental impact of topsoil removal such as reduced land fertility, the consequent reduction in agricultural output and the cost of replacing the lost nutrients. This has led to suggestions for appropriate policy interventions to discourage the sale of topsoil for brick production as well as the need to find alternative sources of raw materials for bricks. Here an integrated approach is needed, one that considers the nexus of factors associated with soil removal and the technical requirements of building materials and buildings. This paper aims to bridge this conceptual gap by proposing a line of research that encompasses both of these aspects: bringing together the more soil- and land use-oriented discussion of geologists, environmental scientists and regional planners on the one hand, and the concerns of civil engineers, architects and town planners on the other. The aim is to understand and describe the interrelationships between the different disciplines, building a solid foundation on which to develop target-oriented research and eventually derive sensible recommendations for action.
2. Scope and research methodology
The goal of the proposed research activities is to obtain greater insight into the interrelationships within the nexus of influential factors (i.e. cause-and-effect relationships) in brick production, specifically regarding soil removal and the technical requirements of building materials. The first step is to pinpoint the separate forces and factors, and to describe their relations and dependencies. Figure 1 provides an initial outline of the methodology. It is necessary to describe the chain of factors linking supply and demand in order to be able to bring together diverse disciplines and to uncover potential substitute building materials that can be used in practice. At the centre of Figure 1 we see the interconnected forces that determine the intensity of supply and demand. Between the socially-influenced factors of urbanization and mining lie the building- and economically-oriented factors of the construction sector and producers of building materials. These latter two sectors are generally believed to show little concern for the wider environmental and social repercussions of their activities. It is precisely this problem that must be remedied so as to ensure the closer involvement of the construction sector in resolving long recognised social problems in the socio-economic, health and ecological fields.
Figure 1 Sketch of cause-and-effect relationships according to the envisaged research methodology
The authors suggest that changes in the mining of raw materials, which originally were driven by wider socio-economic trends (urbanization and increasing prosperity), cannot be mediated solely by social or political actions. In fact, there are additional constraints on likely forms of construction and building materials that strongly determine the substitution potential of a range of materials. One particular focus of the paper will therefore be on a discussion of forms of construction in relation to tradition and innovation as well as structural, geographic, climatic and economic factors.
urbanization
construction
material
miningland use managementgeology, resources
mining technology
supply
demand
civil engineeringproduction technology
mechanical / physical properties
architecture / civil engineeringrequirements & codes
(use, statics, climate, costs)
settlement policysettlement structures
building types
mountains ↔ river banks ↔ alluvial land
top-soil ↔ deep-soil
clay bricks ↔ concrete ↔ steel
traditional ↔ innovative
massive ↔ lightweight
simple ↔ earthquake-resistant
advanced ↔ conventional
urban ↔ rural
antagonisms
disciplinesinfluencing factors
283

The individual driving forces will be described in more detail in the following sections along with selected examples from various developing nations. Changes to any of these forces, e.g. the transition from simple buildings to earthquake-resistant structures, can have wider implications, such as encouraging the use of alternative building materials (demand). These forces can be located in different disciplines, and are clearly influenced by diverse factors. Thus the presence of raw materials for extraction will determine the range of available building materials (supply). Clearly the various issues cannot be sufficiently captured through a narrow research approach but require a wide-ranging analysis. The authors believe that an interdisciplinary approach must therefore be adopted.
3. Driving forces (demand)
3.1 Urbanization and prosperity
At the social level it is possible to discern two main forces driving the demand for building materials, particularly in developing countries. The first of these is a rapidly increasing population, primarily in cities, contributing to the ongoing process of urbanization. The other is growing prosperity and the accompanying desire to adopt a more western style of life. Both of these developments, which are illustrated below in the cases of Bangladesh, Pakistan and Vietnam, serve to boost the demand for building materials, although in different ways. In Bangladesh, for example, the process of urbanization is just getting underway, so that the vast majority of the population still live in rural areas (Table 1). In Pakistan, in contrast, already approx. 40% of the population live in cities (Figure 2), a figure that will increase to over 50% over the next half-century.
Table 1 Household and Population acc. to Bangladesh Population and Housing Census 2011
Absolute number Percentage Household and Population Total Rural Urban Rural Urban Total Households 3,707,047 3,114,437 592,610 87% 13% Total Population 15,386,663 12,953,935 2,432,728 88% 12%
In Vietnam it is forecast that the population will increase by 40% in the four decades to 2055. This corresponds to an annual rise of around 1% (Figure 3). This increase will largely be concentrated in urban areas, for which an increase of 177% is predicted over four decades (4.4% annually). Over the same period the rural population is forecast to decrease. As a clear indication of increasing urbanization, it is predicted that in only 25 years the majority of the Vietnamese population will be living in cities. An increasing population in itself will stimulate the building sector due to the rising demand for housing and infrastructure, which will consequently drive demand for building materials.
Figure 2 Trends in Pakistan’s population distribution (data: Pakistan Bureau of Statistics (1998), The World Bank (2015))
Figure 3 Population projections for Vietnam (data: Vietnam General Statistics Office (2011), p. 33)
Increasing prosperity can also be illustrated using the example of Vietnam. A drop in the number of persons in the average household indicates a shift in the style of life (Figure 4) towards more living space per person. Furthermore, rising prosperity boosts the expectation of higher standards in building construction, which drives the market for high quality building materials.
284

Figure 4 Population forecasts for Vietnam (data: Vietnam General Statistics Office (2011), p. 33)
3.2 Construction types
3.2.1 Trends in building materials for construction The shift in types of construction will be examined more closely in the following using the examples of Bangladesh and India. Clearly, such changes influence the demand for building materials: alongside a general increase in demand (with rising population) there can be a shift in the relative demands for various materials. Table 2 shows how the typical forms of construction have changed in the two countries over the past years. Alongside the process of urbanization, which in India reflects population growth that between 2001 and 2011 was twice as high in the cities as in rural areas, there is a clear trend towards more robust building materials. However, this trend shows regional differences between urban and rural areas. Whereas stones are preferred for the construction of floors in cities, burnt bricks are gaining favour in rural areas. In Bangladesh solid materials such as brick and cement (masonry) are increasingly replacing mud as the material of choice.
Table 2 Trends in construction materials for Indian and Bangladeshi housing (sources: Census of India (2001, 2011), Bangladesh Population and Housing Census (2011))
India change from 2001 to 2011
Bangladesh change from 1991 to…
Construction Material Total Rural Urban 2004 2011 Total number of census houses +22% +16% +37%
Floor material:
Mud +1% +2% -6% - -19.8% Wood/bamboo +13% +15% +5% - -0.5% Burnt brick +25% +33% +11% - +18.6% Stone +65% +51% +83% Cement +41% +50% +31% Mosaic/floor tiles +74% +85% +71% - +1.7% Any other material +49% +16% +79% - -
Wall material:
Straw/bamboo/polythene/plastic/canvas -11.8% -42.3% Grass/thatch/bamboo etc. +17% +19% -2% Plastic/polythene +52% +60% +37% Mud/unburnt brick -10% -11% +2% -2.7% -6.0% Tin (CI sheet) +23.0% +40.6% Wood -13% -10% -22% -11.5% -11.4% Stone +71% +41% +188% G.I./metal/asbestos sheets +17% +45% -5% Burnt brick +31% +33% +28% +2.9 % +18.1% Concrete +68% +64% +70% Other materials +211% +210% +213% - +1.0% India
change from 2001 to 2011 Bangladesh change from 1991 to…
Construction Material Total Rural Urban 2004 2011
285

Roof material:
Straw/bamboo/polythene/plastic/canvas -18.8 % -42.9% Grass/thatch/bamboo/wood/mud etc. -12% -12% -7% Plastic/polythene +77% +118% +22% Tin (CI sheet) +18.4 % +34.4% Tally - +1.5% Hand-made tiles -47% -45% -57% Mass-produced tiles +841% +750% +1,324% Burnt brick/cement -34% -20% -54% -0.5 % +6.1% Stone/Slate +92% +93% +90% G.I./metal/asbestos sheets +193% +189% +204% Concrete +71% +82% +64% Other materials -21% -28% -2% +0.5 % +0.4%
Stones are increasingly being used for the construction of walls in India’s cities, whereas in rural areas simpler materials such as plastic or polythene or even galvanised iron (G.I.), metal or asbestos sheets are more common. In both areas concrete is gaining in popularity. In Bangladesh simple materials such as straw, bamboo, polythene, plastic or canvas are being replaced by tin sheets, bricks and cement in the construction of walls. Regarding roof construction, in India we find a growth in the use of industrially produced materials. Thus the use of hand-made tiles is decreasing at the same time as demand for mass-produced tiles has hugely grown. This is particularly evident in urban areas. In Bangladesh there has also been a clear fall in the use of natural and plastic materials in favour of more robust tin roofing.
3.2.2 Typical forms of construction In the centres of large cities and conurbations, a wide range of construction methods can already be found, ranging from lightweight steel, lightweight concrete and hybrid building systems to heavy concrete panels and building blocks, especially for social infrastructure and office buildings. Despite the trend towards innovative construction methods, traditional methods are still much preferred, so that traditional materials still make up the vast bulk of structural elements. In Pakistan, for example, 62.3% of the built environment is constructed as brick masonry. Buildings of this type are common in rural, suburban and urban areas. Brick masonry is widely used in the most populated states of Punjab and Sindh (east and south-south east) (EERI & IAEE, 2013). The load-bearing structure is generally in the form of brick masonry walls constructed using either sun-dried or fired bricks with mud or cement as mortar. Brick masonry buildings can range from single storey houses common to rural areas to three-storey buildings more frequently found in urban areas. The foundations, which extend beyond the walls, are generally constructed using brick masonry with cement sand mortar. From plinth level, the walls are constructed of either mud mortar or cement sand mortar. Various types of materials are used for the roofing, which rests directly on the walls without any connections. Construction of this type of housing takes place in stages over many years. Typically, the larger end form of the building does not correspond to the original design. Due to the rapid urbanization that Pakistan has undergone over the recent past, builders have been forced to turn to reinforced concrete to construct both commercial and residential buildings. Such buildings can be most frequently found in the wealthier urban centres of major cities (EERI & IAEE, 2010) in view of the better economic conditions, higher population and high land values. While reinforced concrete is also used to construct buildings in city suburbs, here the primary function is to accommodate commercial facilities. Such buildings are usually not taller than 3 to 4 stories. The ratio of reinforced-concrete buildings in suburban areas is only 1 to 2% of the total building stock. RC buildings are typically moment-resisting frame constructions with infill walls, designed to be earthquake resistant. The infills for the frames are usually of brick and block masonry.
3.2.3 Structural and building-technology requirements Structural and other building-technical requirements are determined by regulations such as building codes (e.g. for earthquake resistance) and other standards (e.g. thermal insulation) as well as climatic conditions. Security against the effects of seismic activity is in many countries one of the main structural requirements of buildings. The various buildings codes that most developing countries have adopted are largely based on the American ACI Code or British standards. In Pakistan, for example, the code governing the most typical forms of mass construction is limited to ensuring the structural integrity of reinforced concrete constructions. There are no design or structural guidelines governing brick masonry buildings; local masons rely on their experience, while engineers or architects are generally not involved. This type of construction is non-engineered and not regulated by land-use controls. Thus building permits are not required to construct masonry houses and they are not addressed by the building codes/standards of the country. Buildings constructed from masonry were badly damaged by Pakistan’s recent earthquakes due to inherent weaknesses in the load-bearing structure and the use of poor quality materials. In regions that are regarded as earthquake prone, engineers prefer to
286

design steel-frame or reinforced concrete structures, as brick buildings offer little resistance to such seismic forces. The Uniform Building Code (UBC-97) regulates the type of permissible construction for each seismic zone. While ordinary RC moment-resisting frame (OMRF) buildings are considered adequate for Seismic Zone 1, civil engineers have to construct Intermediate RC moment-resisting frames (IMRF) in Zone 2 (as a minimum measure) and Special RC moment-resting frames (SMRF) in Zones 3 and 4. These stipulations become increasingly stringent for higher zones. For example, code ACI-318 has specific provisions regarding size of column and beams, lap length and developments of reinforcement, joints of beams and columns for SMRF, in addition to those stipulated for IMRF; it also requires that the flexural strength of columns be greater than beams. Further, the code regulates the static load-bearing behaviour of the brick infill walls by designing them as shear walls. The end result is to set minimum wall thicknesses and minimum strength requirements. However, the particular level of earthquake resistance applying to a building will largely depend on the budget allocated to the project and, to some extent, on the building’s importance. Thus, typical low- to mid-rise buildings are generally OMRF, while taller buildings with a higher level of importance are designed as SMRF or dual systems. A further major consideration is resistance to climatic conditions. Particularly in very hot regions, it is essential to use heat-insulating building materials with a large heat storage capacity. This requirement is met by all heavy materials such as concrete or brick walls as the traditional form of construction. Because brick masonry has excellent physical properties regarding heat insulation, it is a natural choice for most people in Pakistan. In areas where temperatures can often soar above 38-40°C, accompanied by strong, dry gusts of air, brick walls can ensure that the interiors of homes stay relatively cool and well-ventilated. Bricks trap heat during the daytime, and slowly dissipate it at night as temperatures fall. Similarly, they also protect against extreme cold in areas where temperatures can fall below zero. In theory, wooden structures can meet these requirements while making use of a naturally replenishing raw material. However, climatic conditions in Pakistan favour the proliferation of termites, whose activities can quickly weaken and destroy wooden buildings. Thus wooden structures are generally avoided.
3.3 Building materials
Depending on the calculation of the structural specifications of a building, planning engineers require building materials with particular characteristics in regard to strength, density or ductility. The construction of SMRF concrete buildings, for instance, needs high quality cement and aggregates (sand and gravel or crushed rock) for the concrete as well as large amounts of standardised ductile steel as reinforcement. Slightly lower requirements are demanded of smaller concrete buildings that use less steel and concrete. The strength of standard concrete depends on the quality of the aggregates. High-strength concrete requires good quality cement and a precisely designed grading curve (mix of aggregates). Further, some types of sand and gravel are not suitable for use in reinforced concrete as they can induce undesirable chemical reactions that degrade quality. For example, chlorides in desert sand can corrode steel reinforcements while silicic acid in river gravel causes a harmful alkali-silica reaction (ASR). Today large amounts of clay soils are consumed to supply bricks for the huge number of buildings still constructed with masonry. The specification for the clay content in the soil is solely based on the required quality of the burnt brick. Thus the soil should contain a minimum proportion of clay and as little organic matter as possible as these reduce the final strength through oxidisation during the sintering process of the bricks. From this point of view, topsoil is a poor choice as raw material for brick production.
3.4 Mining of raw materials
The end users of a building material normally do not specify where raw materials be sourced. For them the only decisive factors are the quality and the price of the final product. Yet in view of the fact that the distance between the building site and the location where a material is extracted significantly determines the price (due to high transport costs of the heavy mineral materials), mining takes often place nearby fast-growing cities. Aggregates for concrete production are mainly taken from riverbanks, gravel pits and, increasingly, from the seabed. The raw material for bricks may be extracted from clay soils, which can be found in various soil layers in alluvial lands.
4. Driving forces (supply)
The availability of raw materials varies greatly from region to region, and thus is a major factor in the type of construction favoured in each country. This can be illustrated using the example of Bangladesh. Bangladesh can be divided into three physiographic units: Around 80% of land is made up of recently formed floodplains, while 8% is Pleistocene terraces and 12% Tertiary hills (Rahman et al., 2015). Due to these geological conditions, the country lacks the stone aggregates such as sand and gravel needed for concrete production (especially for ceilings, which are difficult to construct using other materials). The country’s small hill ranges provide little stone chip to be used as aggregates. Therefore, it is necessary either to import aggregates or to produce them from other available raw materials. Due to the high cost of importing aggregates, the common solution in Bangladesh is break bricks manually or by using a brick crusher to obtain an alterative coarse aggregate for concrete. The geology of Bangladesh offers different types of soils that can be used to extract material for brick production. These are alluvial soils, topsoils, silty clay loam and silty clay soils. While topsoil is only one source, it is a commonly exploited due to the prevalence of simply hand-mining techniques. Deep soils,
287

which consume less arable land, are also an option. However, the extraction of deep soils requires mechanical equipment available only to large mining companies. The supply of building materials produced from secondary raw materials such as building rubble and other forms of waste (e.g. plastic bottles and bags, packing materials, polystyrene) cannot be sufficiently quantified at the present time.
5. Technical considerations on the potential for building material substitutes
Cost-efficient building material for the construction industry usually takes the form of cheap, locally-sourced raw materials. The use of burnt bricks on a massive scale can be reduced in certain areas by a change in construction methods. However, substitution is limited by the need to maintain structural integrity and other physical parameters. These are basically determined by the loads a building is expected to bear and the environmental influences it must resist. The most severe test of a building’s load-bearing structure is certainly an earthquake, as here the structure must resist not merely vertical, static loads but also lateral, dynamic loading. Buildings newly constructed in earthquake-prone regions must obey existing standards and guidelines in order to withstand such forces. South Asia is one such region with many seismic zones. Brick buildings are particularly susceptible to earthquake damage as they are little able to resist lateral loads. This has motivated countries such as Pakistan to reconsider their building codes: tall buildings are now constructed with reinforced concrete frames. However, as the necessary raw materials are lacking to produce large amounts of concrete, these frames are still infilled with masonry panels. The question now arises: To what extent can materials be substituted? Building planners already attempt to optimise the use of material in their structural calculations (when building codes apply) in order to keep down construction costs. Thus it can be expected that a building’s load-bearing capacity will not be designed with much redundancy. Regarding the substitution potential of load-bearing elements, three questions must be answered regarding structural safety:
1) Earthquake-prone regions (seismic zones 3 & 4): UBC-97 requires that special moment-resisting frames be used to construct buildings, i.e. steel or reinforced concrete frames, in which the infill panels function as load-bearing shear walls. Possible substitute materials for bricks are concrete blocks, reinforced concrete or alternative steel constructions that provide the load-bearing function.
2) Regions with low or medium earthquake activity (seismic zones 1 & 2): Buildings in these regions also have to be constructed with a moment-resisting frame. Fewer load-bearing shear walls are specified than in zones 3 & 4. This offers a higher potential for material substitution while preserving structural safety. Additional safety aspects, however, apply to the exterior walls, thus limiting the substitution potential.
3) Regions with no earthquake activity: Here few restrictions apply to the substitution of materials for brick walls. Thus solid bricks in load-bearing walls can be replaced by hollow bricks. Another option is to use breezeblocks or sand-lime bricks. In buildings with only a few storeys, it is also possible to use porous or lightweight concrete, or indeed diverse innovative waste materials (e.g. ecobrick, ubuntublox) without compromising stability.
From the perspective of structural safety, it should be pointed out that the properties of substitute materials for masonry walls such as ecobricks or ubuntublox currently do no meet valid standards or guidelines. In rural areas where building codes generally do not apply, a substitution potential exists. However, it should be added that the strength of these building materials are only suitable for the construction of simple one-storey buildings. No structural-safety requirements apply to non load-bearing elements such as masonry dividing walls. Non load-bearing interior walls only serving to enclose rooms can be replaced by light dividing walls made of materials such as plasterboard or derived timber products. Substitutes made from simple waste materials can also be used. However, additional technical aspects must be considered in the case of (non load-bearing) exterior walls. These are, for example, heat and cold insulation with simultaneous water resistance, characteristics that not every building material displays. Hence, strongly water-absorbing materials cannot be used in wet regions, and lightweight materials offer little protection against summer heat as they have insufficient thermal storage.
It is not always possible to replace bricks as a building material. Availability of alternatives is generally determined by the local supply of raw materials, such as in Bangladesh, where brick chips are until today the most widely used aggregate for concrete. A substitute for split brick aggregates in concrete is difficult if not impossible to find due to the lack of alternative aggregates. One possible substitute is to use recycled masonry to produce lightweight expanded clay aggregates for concrete. However, an important limiting factor here is the presence of gypsum in the masonry waste, which can serve to weaken the concrete. Some researchers suggest, for example, using fly-ash from thermal power plants to produce a kind of concrete brick (e.g. Flyash Bricks, 2012), which is certainly a viable technical solution. In principle, it is possible to substitute topsoils with deeper layers of soil. The quality of the resulting brick may even improve due to a lower proportion of organic material in such soil. Burnt bricks from deep soil can achieve higher strengths than standard bricks. This means that an equivalent strength can be achieved with
288

less raw material. Hence the use of deep soil not only contributes to the substitution of topsoil but also to a reduction in the consumption of natural resources.
6. Conclusion and Further Research
Building activity is governed by a mix of innovation and tradition. The research concept presented in this paper should push-start a discussion on possible research methodologies, i.e. integrated approaches which combine impact assessments on raw material extractions on the environment with technical issues regarding the requirements of building materials and buildings. The first lines of thought concerning this problem reflected upon have revealed opportunities as well as limits to the substitution of traditional masonry in buildings while taking account of the local supply and demand for raw materials as well as technical requirements, in particular the need to produce safe load-bearing structures. The desire of people in developing nations to secure a prosperous life for themselves, which includes the wish for high quality housing along the lines of developed countries, restricts the options of replacing traditional building materials with simple or inferior materials. Presumably, such technical innovations as ecobricks or ubuntu-blocks that make use of waste materials conflict with this aim of better living standards (problem of acceptance). Instead, these can usefully serve members of the poorest sections of society who are forced to make use of simple building materials and construction methods. Waste bricks alone will certainly not solve the serious global problem of resource scarcity. From a technical perspective, it is largely the requirements of structural safety and resistance to climatic influence that determine the substitution of topsoil with alternative raw materials. The structural requirements of buildings vary greatly depending on the local level of seismic activity. The higher these requirements, the more limited the permissible forms of construction, and thus the potential for substituting masonry walls. Also the requirement of resisting climatic influence can mean that certain raw materials are not suited as substitutes. This was discussed in relation to the susceptibility of wood to termite attack. Similarly, lightweight constructions are not good solutions in hot regions, at least for the exterior walls of buildings, and can also serve to compound other environmental problems (for example, high energy consumption for air-conditioning). Even if a technically feasible substitute material exists, a limiting factor can be the supply of raw materials. Such supply, which can vary greatly from region to region, depends not only on local resources but also on the availability of suitable extraction equipment. Clearly, the supply of building material determines the types of possible construction. In a country such as Bangladesh, where clay soil is virtually the only natural raw material for construction, structures made of burnt bricks will dominate the built environment as well as building activities for the foreseeable future. Furthermore, the lack of aggregate material impedes the trend towards more reinforced concrete structures. In this context it is also important to investigate whether the import of raw materials such as gravel and sand is a feasible option for the substitution of local raw materials (clay soils), both in regard to the economic and ecological impact. The availability of extraction technologies and associated costs is the primary factor in determining the type of raw material used. As long as topsoil mining is easier and cheaper than mining other kinds of soil (e.g. deep soil), the manufacturers of building materials will continue to supply burnt bricks made from this valuable resource. Summarising, we can say that in view of the many regional influential factors, no general conclusions can be drawn regarding the nexus of diverse driving forces behind the problem of topsoil harvesting. Instead, more detailed regional studies are required. The extraction of topsoil in a number of Asian countries strongly impairs current and future agricultural productivity as well as the functioning of irrigation schemes, thereby endangering livelihoods and food security. Today there is a lack of detailed information on the extent of topsoil harvesting around the world as well as how this impacts the quality and productivity of farmland and indeed the livelihoods that depend on these. Research is therefore needed to quantify the availability of secondary materials as well as to examine the possible use of recycled (waste) products or other potential substitutes in different types of construction and in diverse forms of settlement, while meeting a range of load-bearing and climatic requirements. Such quantification of feasible substitutes will form the basis for the development of management options or recommendations for action and, not least, determine how well these solutions can be transferred around the world. To sum up, further research will be necessary in the future, especially in collaboration between researchers of different disciplines by using interdisciplinary approaches to overcome the outlined problem.
7. References
Allwood, J., Ashby, M., Gutowski, T. & Worrell, E. 2011 Material efficiency: a white paper. Resource Conservation and Recycling, 55, pp. 362–81. Bangladesh News, 24 August 2009. http://www.independent-bangladesh.com/2009082411233/business/bangladesh-exports-to-india-to-reach-bln-by-2011.html, accessed 27 July 2015 Barman, K. N., Bhattacharya, S. S. & Mandot, A. 2015. Mechanical properties of melt-spun monofilaments produced from virgin and recycled poly(ethylene terephthalate) blends. International Journal of Recent Scientific Research 6, pp. 4517–4525. BUET. Chemical Engineering Department 2006. Desk Study of Brick Manufacturing in Bangladesh. Final Report.
289

Chen, Y, Okudan, G. E. & Riley, D. R. 2010. Sustainable performance criteria for construction method selection in concrete buildings. Automation in Construction, 19 (2), pp. 235–244. Cusidó, J.A., Cremades, L.V., 2012. Environmental effects of using clay bricks produced with sewage sludge: Leachability and toxicity studies. Waste Management 32, 1202–1208. Demir, I., 2006. An investigation on the production of construction brick with processed waste tea. Building and Environment 41, 1274–1278. Demir, I., Serhat Baspınar, M., Orhan, M., 2005. Utilization of kraft pulp production residues in clay brick production. Building and Environment 40, 1533–1537. Earthquake Engineering Research Institute (EERI) (ed.) & International Association for Earthquake Engineering (IAEE) (ed.). 2010. HOUSING REPORT: Reinforced concrete buildings in Pakistan. World Housing Encyclopedia, an Encyclopedia of Housing Construction in Seismically Active Areas of the World, Report #159. Earthquake Engineering Research Institute (EERI) (ed.) & International Association for Earthquake Engineering (IAEE) (ed.). 2013. HOUSING REPORT: Brick masonry construction in Pakistan. World Housing Encyclopedia, an Encyclopedia of Housing Construction in Seismically Active Areas of the World, Report #173. ecobricks (2015). http://www.ecobricks.org/ Flyash Bricks (2012). http://www.ecobrick.in/waste_Utilization_in_Brick_Making.aspx Kathuria, V. & Balasubramanian, R. 2013. Environmental Cost of Using Top-soil for Brick-Making: A Case Study from Tamil Nadu, India. Review of Market Integration, 5 (2), pp. 171-201. Lal, R. 2013. Food security in a changing climate. Ecohydrology & Hydrobiology 13, 8–21. Liu, Z., Chen, Q., Xie, X., Xue, G., Du, F., Ning, Q., Huang, L., 2011. Utilization of the sludge derived from dyestuff-making wastewater coagulation for unfired bricks. Construction and Building Materials 25, 1699–1706. Vietnam General Statistics Office (2011). Population projection for Vietnam 2009-2049, Part 2: Projection result tables. Pacheco-Torgal, F., Labrincha, J.A., 2013. The future of construction materials research and the seventh UN Millennium Development Goal: A few insights. Construction and Building Materials 40, 729–737. Pacheco-Torgal, F., Miraldo, S., Ding, Y. & Labrincha, J.A. 2013. Targeting HPC with the help of nanoparticles: An overview. Construction and Building Materials 38, pp. 365–370. Rahman, M., Ahmed, F., Nafi, F. & Ahmed, S. U. 2015. Use of Topsoil by Brick Fields threatened for Agricultural Production of Bangladesh. In: Dresden Nexus Conference (DNC 2015), 25–27 March 2015. Rajput, D., Bhagade, S.S., Raut, S.P., Ralegaonkar, R.V., Mandavgane, S.A., 2012. Reuse of cotton and recycle paper mill waste as building material. Construction and Building Materials 34, 470–475. Raut, S., Ralegaonkar, R., Mandavgane, S., 2013. Utilization of recycle paper mill residue and rice husk ash in production of light weight bricks. Archives of Civil and Mechanical Engineering 13, 269–275. Raut, S.P., Sedmake, R., Dhunde, S., Ralegaonkar, R.V., Mandavgane, S.A., 2012. Reuse of recycle paper mill waste in energy absorbing light weight bricks. Construction and Building Materials 27, 247–251. Santhosh, V., Padmalal, D., Baijulal, B. & Maya, K., 2012. Brick and tile clay mining from the paddy lands of Central Kerala (southwest coast of India) and emerging environmental issues. Environmental Earth Sciences 67, 1–12. Schiller, G. & Wirth, P. 2015. Analyzing Material Flows of Urbanization – a Basis of the Management of Mining Activities in Ha Noi City and its Hinterland. In: Dresden Nexus Conference (DNC 2015), 25–27 March 2015. Sebesvari, Z., Kruse, J., Renaud, F., Rahman, M. & Amelung, W. 2015. Selling the future? Top soil removal in South and South East Asia. In: Dresden Nexus Conference (DNC 2015), 25–27 March 2015. Sebesvari, Z. 2015. Brick production, industrial development and land degradation. UNU Institute for Environment and human Security. http://ehs.unu.edu/blog/articles/conference-report-brick-production-industrial-development-and-land-degradation.html Shakir, A. A. & Mohammed, A. A. 2013. Manufacturing of Bricks in the Past, in the Present and in the Future: A state of the Art Review. International Journal of Advances in Applied Sciences, 2 (3), pp. 145–156. The World Bank (2015). http://data.worldbank.org/indicator/SP.URB.TOTL.IN.ZS/countries ubuntublox (2015). http://ubuntublox.com/ Thaindian News, 13.08.2009. http://www.thaindian.com/newsportal/business/bangladesh-to-export-bricks-to-northeast-india_100231881.html, accessed 27 July 2015 Weigand, S., Kruse, J., Sebesvari, Z., Amelung, W., Guong V. T., 2015. Topsoil selling in Vietnam: current knowledge and examples. In: Dresden Nexus Conference (DNC 2015), 25–27 March 2015. World Bank. 2010. Introducing Energy-Efficient Clean Technologies in the Brick Sector of Bangladesh. Report No. 60155-BD. Washington DC: Environment, Climate Change and Water Resource Unit.
290

THE HEALTH IMPLICATIONS OF REPLACING COMMON BUILDING MATERIALS WITH NATURAL FIBRE REINFORCED COMPOSITES
Naa Lamkai AMPOFO-ANTI
1
1 Built Environment, Council for Scientific and Industrial Research, Email: [email protected] Keywords: Building materials, embodied toxicity, health effects, NFRC, pesticides
Abstract
This paper highlights the need for a non-chemical approach to the cultivation of fibre crops intended for building applications in South Africa. A case study considered four fibre crops – flax, industrial hemp, kenaf and sisal – that are currently cultivated in South Africa on a commercial or trail basis. The investigation was limited to the synthetic pesticides that are approved for use in South Africa. A toxicity profile was developed for each natural fibre on the basis of the chronic health effects of the selected pesticides. Common building materials are associated with non-renewable resource depletion, embodied energy use and embodied toxicity. Replacing common building materials with natural fibre reinforced composites (NFRCs) is a strategy known to save materials and their embodied energy and reduce greenhouse gas (GHG) emissions. However, the current fibre crop cultivation practices rely heavily on inputs of synthetic pesticides, a significant proportion of which have been linked to chronic health effects in humans and ecosystems. From the case study results, an input of pesticides is not a prerequisite for the cultivation of sisal. However, the synthetic pesticides that are routinely used to manage diseases, insect pests and weeds in flax, kenaf and industrial hemp cultivation are all implicated in human cancer, endocrine disruption, eco-toxicity or a combination of the three. Thus, scaling up the production of natural fibres based on current cultivation practices for flax, kenaf and industrial hemp would increase the burden of disease and contribute to bio-diversity loss. Improvement efforts should primarily focus on a shift to organic agriculture.
1. Introduction
As much as 50% of all raw materials extracted from the earth’s crust are transformed into building and construction materials (Koroneos and Dompros, 2007). The transformation activities, which include materials processing and materials manufacturing, result in embodied energy use and contribution to a range of environmental problems, including greenhouse gas (GHG) emissions and acid deposition. Furthermore, modern building materials are fabricated with a broad range of synthetic chemicals, most of which have never been tested to determine their hazard status (Liddell et al, 2008). The human health consequences of exposure to these building materials when they are used indoors can vary from sensory irritation to toxic reactions, for example, cancer (Ampofo-Anti, 2015). Efforts aimed at reducing the environmental impact of building materials use should therefore give equal attention to three issues, namely, material resource depletion, embodied energy and embodied toxicity. However, the sustainable material strategies of the building sector generally focus on materials and energy but pay little attention to the issue of toxicity. Thus, in the last three decades, a change in feedstock - from non-renewable to renewable raw materials derived from fibre crops - has been encouraged and promoted. For example, the building industry represented the largest uptake globally of natural fibre reinforced composites (NFRCs) in 2005 (Sharma el al, 2007). Replacing common building materials with NFRCs can yield environmental benefits which are generalizable across all NFRCs (Joshi et al, 2004). The advantages include: Safeguarding non-renewable material stocks that are currently being depleted faster than nature can
replenish them Low embodied energy of natural fibres, due to the dependence of the fibre crop on solar energy during
the growth phase Sequestration of carbon dioxide from the atmosphere during cultivation of the fibre crop, which helps to
off-set the GHG emissions attributable to the final product, that is, the NFRC In the South African context, the material-intensive industry sectors – automobiles and buildings – have responded to the global shift towards NFRCs. In 2001, Daimler-Chrysler South Africa successfully replaced the glass fibre reinforced rear shelf of the Mercedes-Benz C-Class with a sisal-cotton rear shelf (WBCSD, 2007). In 2007, a joint venture between Seardel Investment Corporation (SIC) and the Industrial Development Corporation (IDC) resulted in the commissioning of an 8000 square metre kenaf fibre processing plant in Winterton, Kwazulu Natal (Farmers Weekly, 2007). Brits Automotive Systems (BAS), a subsidiary of SIC, uses the kenaf fibres to produce NFRCs for automotive applications. The Bio-composites Centre of Competence (CoC) strategy framework was formulated in 2011 by the Council for Scientific and Industrial Research (CSIR) Built Environment (BE) in response to government’s IPAP2
1 which identified
1 Industrial Policy Action Plan 2010/11 to 2012/13
291

advanced bio-composites2 as a key industry development cluster. The initial focus of the CoC is to develop bio-composites for building and construction applications in order to reduce embodied energy and GHG emissions. However, the current practices for fibre crop cultivation rely heavily on synthetic pesticides, a significant proportion of which are hazardous. While it may be true that most people are exposed to complex mixtures of chemicals, not just pesticides, in their daily lives, there is a growing body of research on the known and suspected health effects of pesticides. Thus, substitution of common building materials with NFRCs may save virgin raw materials and their embodied energy, but may exacerbate the health consequences of pesticide exposure. Therefore, this paper highlights the need for a non-chemical approach to the cultivation of fibre crops intended for building and other industrial applications in South Africa. The intended audience for this paper includes all key decision-makers in the natural fibre value chain, in particular, “green” building material specifiers, and the custodian of South African pesticide policy – the National Department of Agriculture. Box 1: embodied toxicity defined
Embodied toxicity is the quantifiable amount of toxic emissions released into the environment as a result of the building product life cycle activities including extraction and processing of raw materials, product fabrication, product installation on site, product maintenance, product disposal at end-of-life and all transportation in between the activities. Likewise, embodied energy is the quantifiable amount of energy consumed as a result of each life cycle activity. The word embodied as used in this definition refers to attribution or allocation in an accounting sense as opposed to true physical embodiment. Thus, the concern highlighted in this paper is not that traces of toxic pesticides would remain in natural fibres which have been used in the fabrication of building products. Indeed, when Webber (1996) investigated this question, he found that the natural fibres were toxin-free. The concern – documented in the remainder of this paper – is that frequent exposure to traces of toxic pesticides in the environment (air, water and soil) could significantly contribute to chronic health effects in both humans and ecosystems.
2. Research Methodology
Section 3 provides an overview of agricultural pesticides and summarises the data linking exposure to certain pesticides to human and ecosystem health effects. Section 4 briefly reviews the key agreements and guidelines adopted internationally in an effort to limit the human and environmental exposures and health risks arising from the widespread production and consumption of hazardous chemicals, including pesticides. Section 5 identifies and describes the major tools that inform the decision-making of authorities concerning which pesticides to authorise for use, or to severely restrict or to ban within their national or regional territory. The tools include (i) classification guidelines which assist decision-makers in the toxicity assessment and ranking of pesticides according to either the acute effects or specific, chronic health effects; and (ii) Hazard Lists that link specific pesticides to specific human and/or ecosystem health effects. Section 6 presents a case study on four fibre crops – flax, industrial hemp, kenaf and sisal – that are currently produced either on a commercial or a trial basis in South Africa. Other than kenaf, for which limited South African data were found, no information could be found on the pesticides approved and registered for the cultivation in South Africa of the other three case study fibre crops. Therefore, the pesticides commonly used in the cultivation practices of the case study fibres were selected from literature sources and evaluated for toxicity as an illustrative example. Each pesticide was selected in consideration of whether it is included on the National Department of Agriculture’s (NDA’s) Lists of approved pesticides. The case study results are presented in Appendix 1. Section 7 discusses the findings emerging from conducting the investigation so far and Section 8 summarises the whole discussion presented in the paper.
3. Agricultural pesticides and their health risks
A pesticide is a chemical intended to kill or control pests including insects, rodents, weeds, fungi and micro-organisms such as bacteria or viruses (USEPA, 2015a). Although the agricultural sector accounts for the highest demand, pesticides are also used for other purposes including personal care (for example eradication of head lice) and to control or eradicate vector-borne diseases. Three groups of agricultural pesticides, also known as plant protection products, are of interest in the context of fibre crop cultivation. Fungicide treatments protect crops from disease. The purpose of herbicide treatments is to kill or inhibit the growth of weeds (USEPA, 2015b) in order to prevent the weeds from competing with the growing crops. Insecticide treatments control insect pest infestations which if left unchecked could result in economic damage to crops. A pesticide typically contains an active ingredient designed to kill the targeted pest which is a living organism (USEPA, 2015c). It is therefore not surprising that pesticides have been linked to a range of adverse health effects in humans, in particular cancer (PANNA3, 2015a; Fleming et al, 1999) endocrine disruption (PANNA, 2015b; Colborn et al, 1993; Benbrook, 1996) and reproductive and developmental toxicity (PANNA, 2015c;
2 Bio-composite is used interchangeably with natural fibre reinforced composite 3 Pesticide Action Network North America
292

Colborn et al, 1993). Similarly, it has been shown that pesticide exposure represents a significant health risk for non-targeted aquatic and terrestrial species (Colborn et al, 1993; WWF, 2015). The risk of a pesticide depends on two things, exposure (how much?) and toxicity (how poisonous?). The exposure is the amount you get in or on your body, or the amount that is released into the environment (NPIC, 2015). The toxicity of a pesticide is measure of how poisonous it is to humans and other non-targeted living organisms. Exposure to an agricultural pesticide may result in acute or chronic toxicity. Acute toxicity refers to the immediate effects (0-7days) of exposure to a pesticide (PANNA, 2015d). Highly acutely toxic agricultural pesticides can be lethal even at very low doses. Acute pesticide poisoning will affect 3 million people and account for 20 000 unintentional deaths every year (WHO, 1990). Chronic toxicity refers to the long term health risks, such as cancer, of low-level exposure to toxic pesticides (Fleming et al, 1999). As compared to the general public, farmers and agricultural workers are more likely to die from specific cancers (CHEMTrust, 2010). These include prostate cancer (Fleming et al, 1999) and a range of other cancers including skin, stomach and brain cancer (Blair and Freeman, 2009). There is an increasing incidence of childhood cancer and this trend has been linked to parental exposure to agricultural pesticides (Flower et al, 2004; Wigle et al, 2009). The general public is directly exposed to agricultural pesticides through spray drift from farmlands (IARC, 2015; Wigle et al, 2009), through food, particularly, residues on fruits and vegetables (EFSA, 2015; PAN Europe, 2011) and through domestic use. On the one hand, the IARC (2015) and EFSA4 both consider this non-occupational level of exposure for the general public to be too low to result in adverse, chronic health effects. On the other hand: Living on or near farms may increase the risk of childhood cancer (Rull et al, 2009; Meinert et al, 2000); Community residents experienced an increase in blood markers of chromosomal damage after
glyphosate5 was sprayed nearby (IARC, 2015). Glyphosate has subsequently been classified by the IARC as probably carcinogenic to humans; and
Agricultural pesticides have the potential to contaminate drinking water supplies. They are applied to farmlands, gardens and lawns and can make their way into ground water or surface water systems that feed drinking water supplies (USEPA, 2015d). Whether these contaminants pose a health risk depends on how toxic the pesticides are, how much is in the water, and how much exposure occurs on a daily basis.
4. Regulating hazardous pesticides
Pesticides are generally exported from developed countries – that have sophisticated health risk evaluation and regulatory systems in place – to developing countries where chemical policy is lacking or may not be adequately implemented (FAO, 2005). In response to these concerns, the United Nations Food and Agricultural Organisation (FAO) and the United Nations Environment Programme (UNEP) initiated an international chemicals policy process from the 1980s to promote shared management responsibility between exporting and importing countries in order to protect human and environmental health. The UN initiative outcomes of greatest relevance to pesticides are briefly discussed below.
4.1 International Code of Conduct on the distribution and use of pesticides
The overall aim of The Code, initiated by the FAO and adopted in 1985, is to support food security while protecting human health and the environment. The Code established voluntary codes of conduct for all public and private entities associated with, or engaged in the use and distribution of pesticides. The Code was amended in 1989 to include the principle of Prior Informed Consent (PIC) on a voluntary basis but this principle is now implemented under the legally binding Rotterdam Convention. The number of countries without pesticide regulation decreased markedly in the wake of the adoption of The Code. However, major weaknesses in pesticide management practice persist in the developing countries, in particular (FAO, 2005): Local pesticide regulation is not widely enforced; Some highly hazardous pesticides are cheap and are therefore still distributed and used; and The end-users typically lack awareness of the grave health risks of pesticide exposure
4.2 Rotterdam convention on the prior informed consent procedure for certain hazardous chemicals
The Convention promotes shared responsibility and cooperative efforts among the Parties in the international trade of certain hazardous chemicals in order to protect human health and the environment from potential harm; contribute to the environmentally sound use of hazardous chemicals through information exchange about their characteristics; provide for a national decision-making process on the import and export of hazardous chemicals; and disseminate these decisions to the Parties (FAO/UNEP, 2005). To achieve its objectives the Convention includes two key provisions, namely, the (PIC) procedure and the Information Exchange procedure. The PIC procedure is a mechanism for formally obtaining and disseminating the decisions of importing Parties as to whether they wish to receive future shipments of
4 European Food Safety Authority 5 Glyphosate is a herbicide
293

chemicals that have been listed in Annex III of the Convention6; and for ensuring compliance with these decisions by exporting Parties. The Information Exchange procedure requires each Party to notify the Secretariat when taking a domestic regulatory action to ban or severely restrict a chemical. The Convention entered into force in 2004. Annex III currently lists 47 chemicals of which 33 are pesticides remainder are industrial chemicals.
5. Toxicity ranking of pesticides
The decision as to which pesticides can be used at a local level with minimum human and environmental health risks rests with national authorities. The sections below provide brief reviews of the major health hazard classification guidelines and listings for agricultural pesticides.
5.1 Acute toxicity: the World Health Organisation
The World Health Organisation (WHO) chemical hazard classification system is concerned only with acute toxicity, that is, the immediate health risk that might be accidentally encountered when a pesticide or industrial chemical is handled, stored or transported in accordance with manufacturer instructions (WHO, 2010). The WHO hazard classification of a chemical is primarily determined by means of oral and dermal LD50 tests conducted on mammals, with the rat as surrogate as illustrated in Table 1. The tests are carried out only on individual active ingredients, not on the final product that is sold to consumers. Thus, toxicity of the final product may vary, depending on the formulation. More appropriate exposure routes are used as a basis for testing and classification in special cases where the oral and dermal LD50 values are deemed inappropriate (WHO). The FAO recommends in its Pesticide Code of Conduct that WHO Class 1a and Class1b pesticides should not be used in developing countries, and if possible, Class 2 pesticides should also be avoided (FAO). Most national authorities rely on WHO acute rankings which can produce conflicting results. For example, a pesticide initially ranked as “U” (Unlikely to be hazardous) based on acute toxicity evaluation could later be re-classified as a highly hazardous pesticide (HHP) after it has been in use for years and the chronic health effects have had time to become evident.
Table 1 WHO acute hazard classification system - Adapted from WHO, 2010.
WHO Hazard Class LD50 for the rat
(mg/kg body weight)
Oral Dermal 1a Extremely hazardous <5 <50
1b Highly hazardous 5-50 50-200 2 Moderately hazardous 50-2000 200-2000 3 Slightly hazardous Over 2000 Over 2000 U Unlikely to be hazardous 5000 or higher
5.2 Chronic toxicity: human cancer
For the purposes of this paper, a carcinogen is a pesticide or a mixture of pesticides which induce human cancer or increase its incidence. Just how many people die from chronic effects such as cancer is not known with any certainty. However, as discussed in the sections above, (i) there is an association between pesticide exposure and certain cancers in farmers and other agricultural workers; and (ii) exposure to pesticides prior to conception, or during pregnancy or during childhood increases the risks of childhood cancer. To prevent or limit the contribution of agricultural pesticides to the incidence of human cancer, it would be best to identify, ban and replace cancer causing pesticides with benign pesticides. The three organisations playing a leadership role in the evaluation and ranking of pesticides according to carcinogenicity are the international Agency for Research on Cancer (IARC); the United States Environmental Protection Agency (USEPA); and the European Chemicals Agency (ECHA). The sections below are limited to reviews of the work of the IARC and USEPA.
5.2.1 International Agency for Research on Cancer The international Agency for Research on Cancer (IARC) is an agency of the WHO and the lead international organisation specialising in chronic human toxicity: cancer. According to the IARC, most cancers are directly or indirectly linked to environmental factors – including exposure to pesticides – thus, cancers are preventable. The IARC relies on biostatistics and results of human epidemiological and
6 The candidate chemicals for Annex III of the Convention are those chemicals that have been banned or severely restricted by the national regulatory action of two or more Parties in two different regions of the world. Ideally, other Parties should avoid the use and distribution of Annex III listed chemicals, but they are not obliged to do so. For example, parathion and parathion ethyl have been banned in the EU and Australia, but are still used legally in South Africa
294

laboratory animal studies to evaluate and classify identified chemicals, including pesticides, into one of the cancer hazard groups described in Table 2.
Table 2 IARC cancer hazard classification system – Adapted from IARC, 2006
IARC Group Description
Group 1: Carcinogenic There is strong evidence in exposed humans that the chemical causes cancer; and sufficient evidence of carcinogenicity in experimental animals
Group 2A: Probably carcinogenic
There is limited evidence of carcinogenicity in humans; and sufficient evidence of carcinogenicity in experimental animals
Group 2B: Possibly carcinogenic
There is limited evidence of carcinogenicity in humans; and less than sufficient evidence of carcinogenicity in experimental animals
Group 3: Not classifiable as to carcinogenicity
There is inadequate evidence of carcinogenicity in humans; and inadequate or limited evidence of carcinogenicity in experimental animals
Group 4: Not carcinogenic
There is evidence suggesting lack of carcinogenicity in both humans and experimental animals
5.2.2 United States Environmental Protection Agency As the federal agency responsible for the protection of human health and the environment, the United States Environmental Protection Agency (USEPA) has come to play an important role internationally as a reliable source of data on the carcinogenic potential of most high volume pesticides. This is because USEPA screens all chemicals proposed for registration as pesticides for their carcinogenic potential prior to registration. The final toxicity ranking of the pesticide is informed by a weight-of-evidence approach. The first version of the USEPA guideline on the carcinogenicity classification of pesticides was developed in 1986. The guideline was updated in 1996, 1999 and 2005 to reflect an increasing understanding of the human cancer risks arising from exposure to toxic chemicals, including pesticides. USEPA does not re-evaluate previously assessed pesticides when a new version of the guideline is developed – therefore, the pesticides in the USEPA database reflect all the four versions of the guideline on classification. The 1986 and 1999 versions of the guideline, which are applicable to the case study pesticides, are described in Table 3 below. Table 3 USEPA guideline on the carcinogenicity classification of pesticides Adapted from USEPA 2012
1986 classification guideline 1999 classification guideline Group A: Human carcinogen Group 1: Human carcinogen Group B: Probable human carcinogen Group 2: Likely to be carcinogenic to humans
Group C: Possible human carcinogen Group 3: There is suggestive evidence, but it is not enough to assess human carcinogenic potential
Group D: Not classifiable as to human carcinogenicity
Group 4: Not likely to be carcinogenic to humans
5.3 Chronic toxicity – Endocrine disruption and/or reproductive and developmental toxicity
The endocrine (hormone) system is a complex network of glands, hormones and receptors found in all mammals, birds and fish (USEPA, 2011). The endocrine system regulates all biological processes, including growth and development during childhood, brain and nervous system function and reproductive functions during adulthood. Since the early 1990s there has been a growing concern about endocrine disrupting chemicals, including pesticides (Duis et al, 2012) because these chemicals are able to interfere with the functions of natural hormones, leading to adverse health effects in living organisms or their progeny (Kavloch et al, 1996). The health effects associated with exposure to EDCs include reproductive toxicity 7 and developmental toxicity8, neurotoxicity9, mutagenicity10 and cancer (Duis et al, 2012). The main evidence suggesting that exposure to specific EDCs can lead to the disruption of endocrine function comes from studies that focussed on wildlife and fish species ((Duis et al, 2012); USEPA, 2011). In humans, endocrine disruption is an emerging and somewhat controversial science. The roles being played by various organisations and individual scientists in the international effort to identify, evaluate, stop the use of existing EDCs or prevent new EDCs from entering the global market place are discussed in the sections below.
7 Reproductive toxicity means a deviation from normal reproductive ability or capacity, for example, infertility, that may result from exposure to hazardous chemicals. 8 Developmental toxicity is the occurrence of adverse effects in the offspring that may result from exposure (of either parent) from the time before conception until birth; or exposure of the offspring from birth to sexual maturation. Developmental toxicity can include birth defects or altered growth. 9 Neurotoxicity is an adverse change in the structure or function of the nervous system, during development of offspring or at maturity, following exposure to hazardous chemicals. 10
295

5.3.1 European Commission list of endocrine disrupting chemicals In December 1999, the European Commission adopted a strategy for addressing the problem of endocrine disrupting chemicals. Establishing a priority list for further evaluation for their role in endocrine disruption in either wildlife or humans was at the core of the strategy. A working list of suspected EDCs was compiled from literature sources. The initial working list of 564 chemicals included 147 high production volume (HPV) chemicals which were prioritised for evaluation, testing and ranking according to the category guidelines described in Table 4 below (EC, 2015). 118 out of the 147 HPV chemicals have to date been ranked as Category 1 or Category 2 EDCs. Table 4 European Commission endocrine disruptor classification guideline
Category Description 1 Evidence of endocrine disrupting activity in at least one species using intact animals 2 At least some in vitro evidence of biological activity related to endocrine disruption 3 No evidence of endocrine disrupting activity or no data available
5.3.2 United States Environmental Protection Agency list of endocrine disrupting chemicals In response to compelling evidence confirming endocrine disruption in certain fish and wildlife exposed to chemical contaminants, the United States Congress passed the Food Quality Protection Act and the Safe Drinking Water Amendment Act in 1996 mandating USEPA to screen pesticide chemicals for their potential to cause ED in humans, fish and wildlife. To date, USEPA has developed an Endocrine Disruptor Screening Programme (EDSP) and compiled a working list of 10,000 chemicals (USEPA, 2011). However, the prioritised chemicals are now undergoing a multi-step screening process therefore no final results are as yet available.
5.3.3 Other Lists of endocrine disrupting chemicals In addition to the lists of EDCs compiled at the organisational level, individual scientists have over the years studied, compiled and published lists of known and suspected EDCs in the scientific literature, namely: The Benbrook List which forms part of a report compiled by Benbrook (1996) for the USA National
campaign for pesticide policy reform. The Colborn List, which was first published in a journal article by Colborn et al (1993) and republished in
the seminal book Our Stolen Future by Colborn et al, 1996. The Keith List which is published in the book by Keith (1997) that summarises the endocrine disrupting
effects of specific chemicals including pesticides.
5.4 Chronic toxicity: Eco-toxicity
Eco-toxicity is a reference to the impact of toxic substances on freshwater, marine and land-based ecosystems. Eco-toxicity can further be split into three sub categories, namely, aquatic eco-toxicity, marine eco-toxicity and terrestrial eco-toxicity. The OSPAR Convention, the USEPA and the World Wildlife Fund (WWF) evaluate and categorise chemicals, including pesticides, according to their known or suspected contribution to eco-toxicity.
5.4.1 OSPAR Convention lists of hazardous chemicals The OSPAR Convention11 is a regional agreement adopted in 1992 by governments of the western coasts and catchments of Europe as well as the European Union. The primary objective of the OSPAR Convention is to prevent and eliminate pollution of the North-East Atlantic from three major sources – land-based, off-shore and dumping or incineration. The Convention’s hazardous substances strategy defines hazardous substances as those chemicals that are persistent and bio-accumulative toxicants (PBTs) or give rise to an equivalent level of concern in the marine environment. OSPAR maintains two lists of hazardous chemicals. The list of “Chemicals for Priority Action” covers chemicals which are being monitored to assess progress towards a cessation target. There are currently 42 chemicals on this list of which 18 are pesticides. The list of “Substances of Concern” includes two major categories – chemicals that are being adequately addressed by other international initiatives; and chemicals that are not yet used in sufficiently large quantities to pose a threat in the OSPAR area. This list currently includes 62 pesticides.
5.4.2 USEPA list of hazardous chemicals The USEPA measures eco-toxicity on the basis of pesticide impact on honey bee populations (PANNA, 2015) This is because on the one hand, honey bees pollinate 40% of the world’s major food crops but on the other hand, exposure to certain pesticides can interfere with honeybee reproduction, or ability to navigate, or temperature regulation, any of which can have an effect on long-term survival of honeybee colonies. Indeed, honey bee populations have fallen dramatically around the world in recent years and the major contributing factors include pesticide use, disease and unfavourable weather conditions (PAN, UK, 2009). A number of pesticides have now been withdrawn in Germany, France, Italy and Slovenia due to concerns about their role in ongoing bee deaths. 11
The Convention for the Protection of the marine environment of the North-East Atlantic
296

5.4.3 The World Wildlife Fund list of endocrine disrupting chemicals WWF’s mission is to conserve nature and ecological processes, and to address this in a way which benefits human needs and livelihoods. This includes alternative approaches for managing agricultural pests. According to WWF, Wildlife and toxicology studies provide solid evidence that EDCs have contributed to dwindling wildlife populations by disrupting hormone activity, altering sexual development, impairing reproduction, and undermining the immune system (WWF, 2000). WWF strategies seek to address EDCs in the aquatic, marine and terrestrial environments. The initiatives take many forms and include promoting a phase out of known EDCs in the marine environment and encouraging fruit and vegetable farmers to reduce or avoid the use of known EDCs as agricultural pesticides. The WWF maintains a list of pesticides that are suspected or known wildlife EDCs.
6. Case study of four natural fibres
Both food and non-food crops can be successfully produced using organic agriculture (ISU12, 2003). The FAO is now promoting a return to organic agriculture through Integrated Pest Management (IPM) which is an approach to crop production and protection with minimum inputs of synthetic pesticides. Organic Agriculture involves a crop production management system based on the ecological principles of nutrient cycling, biotic regulation of pests and biodiversity. Thus, inputs of synthetic fertilizers and pesticides are not necessary. Farmers have relied on such organic approaches for more than 10 000 years to successfully meet the food and fibre needs of society. The use of synthetic pesticides in agriculture only emerged in the 1950s with global pesticide use virtually doubling every decade between 1945 and 1985, when it reached three million metric tons (CHEMTrust, 2010). Currently, the global agricultural industry relies almost exclusively on synthetic chemical inputs to fertilise crops; to protect crops from weeds, disease and insect pests; and generally secure and boost yields. In the sections below, the synthetic pesticides that are currently used in the production of each of the four case study fibre crops is identified and thereafter the chronic health effects of each pesticide is highlighted using the hazard classification guidelines and hazard lists discussed in section 5. Other than a list of recommended synthetic herbicides for kenaf production in South Africa, there is a lack of information on the pesticides specifically registered for South African production of the four case study fibre crops. The majority of the evaluated pesticides were therefore selected from published literature on the cultivation practices for flax, kenaf, industrial hemp and sisal.
6.1 Flax
Flax, Linum Usitatissimum L., has been cultivated for both its fibre and seed since prehistoric times. Two distinctive varieties of the flax plant have emerged – fibre flax and seed flax. Fibre flax is highly suited for the development of NFRCs for building applications. The seed flax variety is used to produce linoleum flooring. Flax does not compete well with weeds, thus a flax crop may be treated up to three times per growing season and principally with synthetic herbicides (Turunen and van der Werf, 2006). A pre-emergent herbicide is applied prior to sowing of seeds; followed by two post-emergent herbicide applications. In some flax growing areas, it is a common farming practice to carry out a fourth, pre-harvest treatment in order to kill tall weeds and to also desiccate the flax crop prior to harvesting. Five commonly used pre and post emergent herbicides (bromoxynil, 2,4-DB, linuron, triallate and trifluralin) and one pre-harvest herbicide (glyphosate) were selected and evaluated. As indicated in Appendix 1, all of the selected herbicides are associated with endocrine disruption and/or reproductive and developmental toxicity; and human cancer. Furthermore, glyphosate, linuron and trifluralin are suspected groundwater contaminants. In-crop treatment of flax with an insecticide may be necessary up to three times in a growing season (Turunen and van der Werf, 2006) to prevent serious yield losses due to the presence of insect pests. Four commonly used insecticides - Lambda-cyhalothrin, parathion, phosalone and pyrethrin - were selected evaluated for toxicity. As indicated in Appendix 1, parathion and phosalone are now banned in the EU. Furthermore, parathion is on the PIC List. The remaining two insecticides - Lambda-cyhalothrin and pyrethrin - are listed by the WWF as wildlife EDCs. Flax is susceptible to two major diseases - Rust and Fusarium wilt. Of the two diseases, Fusarium wilt is economically of greatest significance because it is a soil-borne disease which affects both the immediate and future crops. Furthermore, flax is susceptible to seedling disease. The most important measures to guard against disease in flax are development of disease resistant cultivars and crop rotation. However, flax seeds intended for sowing are routinely pre-treated with synthetic fungicides - Dimethoate, thiram and mancozeb to prevent the outbreak of seedling disease. Benomyl, carbendazim and thiabendazole are the three synthetic fungicides most commonly used for in-crop treatment of Fusarium wilt. The seed protectants dimethoate, thiram and mancozeb are all potential human carcinogens. All three fungicides are listed by the EU, WWF and OSPAR as EDCs. The toxicity profile of the three fungicides is indicated in Appendix 1. Of the three fungicides suitable for treating Fusarium wilt, carbendazim and thiabendazole are possible carcinogens, both chemicals are on the EU List and Colborn List of EDCs; and both have been banned in the EU. Furthermore, carbendazim, is one of the “Filthy Four” pesticides identified by Friends of the Earth. The third fungicide – benomyl – has been linked to human developmental and reproductive toxicity; and is likely to be a human carcinogen - depending on the dosage used.
12 Iowa State University
297

6.2 Industrial hemp
Industrial hemp, Cannabis Sativa L., has been cultivated for millennia principally for three reasons. The bast fibres are mainly used for making fine textile fabrics and paper. The oilseed serves as human food, animal feed and lighting oil. The THC13 content, due to which hemp is often referred to as “marijuana” or “dagga”, has been used for medicinal purposes since ancient times. Industrial hemp is currently produced in South Africa on an experimental basis by the Agricultural Research Council (ARC) - the commercial growing of hemp is prohibited in South Africa because of the THC content. Potential future building and construction applications for the fibre hemp variety would include hempcrete, hemp fibre reinforced concrete and plastic composites, insulation materials and carpets. Industrial hemp has been shown to effectively suppress weeds (Van der Werf, 1995) – herbicides are therefore not required for its cultivation. Insecticide use may not always be necessary and would therefore need to be determined on a case by case basis. Mc Partland (1997) asserts that industrial hemp can be planted as a companion crop to safeguard other crops by preventing insect infestations; and that dried hemp leaves were used successfully to repel weevils in stored grain. However, when Dippenaar et al (1996) planted hemp on a trial basis near Rustenburg, insect pests caused extensive damage to the crop. They concluded that promising hemp varieties should be evaluated for resistance to local insect pests prior to commercial production in South Africa. The fully grown hemp plant is susceptible to the disease Botrytis cinerea when it is exposed to continuous periods of rain and damp weather conditions (Van der Werf, 1995). Hemp is also susceptible to seedling disease. The development of disease resistant cultivars generally helps to guard against hemp disease. However, seeds that have been pre-treated with synthetic fungicides are usually planted to avoid seedling disease. Therefore, commonly used seed protectants such as dimethoate, thiram, macozeb would influence the toxicity profile of industrial hemp in a manner similar to that previously discussed for flax. Van der Werf (1995) found that Botrytis cinerea, which can cause significant economic damage to hemp, was effectively controlled through treatment with the synthetic fungicide vinclozolin. As indicated in Appendix 1, Vinclozolin is a potential human carcinogen; it is on the EU, OSPAR and WWF lists of EDCs; and it has been banned in the EU (2003) as a plant protectant product.
6.3 Kenaf
Kenaf, Hibiscus Cannabinus, originated in Africa, but because of its wide ecological adaptability, it is now grown commercially in more than 20 countries. The potential South African “green” building applications of kenaf include fibre reinforced concrete, particleboard, floor-covering (linoleum), paints and varnishes. Malan (2011) identified six synthetic herbicides suitable for use under South African production conditions. They are 2,4-DB, bentazone, imazethapyr, m-methanearsonate, pendimethalin and s-metolachlor. The WHO acute toxicity rankings of the six herbicides range from “unlikely to be toxic” to “moderately toxic”. However, as indicated in Appendix 1, all six recommended herbicides represent significant chronic human and ecosystem health hazards. M-methanearsonate, 2,4-DB, pendimethalin and s-metolachlor have been linked to human carcinogenicity. 2,4-DB, imazethapyr, pendimethalin and s-metolachlor appear on the EU and other lists of EDCs. S-metolachlor is a known ground water contaminant while 2,4-DB, imazethapyr and m-methanearsonate are potential ground water contaminants. Furthermore, a chemical-specific study on bentazone has now linked this pesticide to long-term high risk of eco-toxicity in respect of bird populations in Europe. The established kenaf cultivation practices entail some inputs of fungicides and insecticides. According to Le Mahieu et al (1991) the adult kenaf plant is resistant to most diseases. However, kenaf seedlings require protection from fungal/bacterial attack (Cook et al, 1992), and protecting kenaf seeds with the fungicide metalaxyl increased the survival rate of the seedlings. However, as indicated in Appendix 1, metalaxyl is a potential ground water contaminant; and a suspected EDC. Le Mahieu et al (1991) further assert that the kenaf plant can tolerate a high population of insects without economic damage. However, insect pests have proven to be a limitation to commercial production of kenaf in some parts of the world including Australia, Southern Florida, Malaysia and Japan. The literature indicates that the insecticide carbaryl is potentially suitable for use in kenaf production. Carbaryl is however a probable human carcinogen; it appears on several lists of EDCs; it is highly toxic to bees; and it is banned in the EU.
6.4 Sisal
Sisal fibres are obtained from the leaves of the Agave Sisalana Perrine which is native to the Yucatan Peninsula, Mexico. The Mayans and Aztecs are said to have made fabrics and paper from sisal fibre. The current world production capacity is mainly used for production of paper, rope, binder twin and high grade carpets. The ARC has conducted extensive research on the potential of commercial farming of A. Sisalana and finds that the optimum areas for growing sisal in South Africa are the Northern Province and Kwazulu Natal. The Potential building and construction applications of sisal fibre in South Africa include sisal fibre reinforced composites for walling and roof covering applications. As indicated in Appendix 1, an input of pesticides is not a prerequisite for the cultivation of sisal (van Dam and Bos, 2004). Both herbicides and insecticides are not needed because the seedlings are able to outgrow weeds; and the plant is not susceptible to attack by insect pests. The adult plant is highly resistant to disease therefore in-crop fungicide treatments are not required. Furthermore, A. Sisalana is propagated not by seeds,
13 Delta-9 tetrahydrocannabinol (THC)
298

but by means of bulbils and suckers that are produced by the mature plant, thus, chemical seed protectants are unnecessary.
7. Findings and Discussion
This paper has investigated the human and ecosystem health implications of pesticide exposure when common building materials are replaced with NFRCs. The investigation was conducted on the basis of four case study fibre crops – flax, industrial hemp, kenaf and sisal. All four fibre crops are currently cultivated in South Africa. Kenaf is grown on a commercial basis; and the remaining three on a trial basis by the Agricultural Research Council (ARC). The investigation was limited to selected agricultural pesticides, namely, fungicides, herbicides and insecticides that are likely to be used for cultivation of the case study crops in the South African context. A toxicity profile was developed for each case study fibre crop on the basis of the chronic health effects of the selected pesticides. Replacing common building materials with NFRCs can yield environmental benefits which are generalizable across all NFRCs. However, a significant proportion of the pesticides used for fibre crop cultivation have been conclusively linked to a range of acute and chronic health effects in humans and wildlife. Acute toxicity refers to the immediate effects of pesticide exposure which may be poisoning or unintended death. Chronic toxicity refers to the long term health risks arising from low-level exposure to toxic pesticides. The chronic health risks of highest concern are human cancer; endocrine disruption and/or reproductive and developmental toxicity in both humans and wildlife; and eco-toxicity. Acute toxicity mainly affects farmer workers in developing countries such as South Africa. Chronic toxicity has implications for farm workers, the general public, the unborn child, drinking water contamination and bio-diversity. From the case study results, an input of pesticides is not a prerequisite for the cultivation of sisal. However, the established flax, hemp and kenaf cultivation practices entail the use of pesticides, namely: Herbicides: Industrial hemp effectively suppresses weeds, but flax and kenaf do not compete well with them. Crop rotation offers a chemical-free solution to weed control. However, the farming practices for flax and kenaf rely heavily on herbicide use. As illustrated in Appendix 1, the herbicides commonly used in flax and kenaf cultivation can be linked to human cancer, endocrine disruption, water contamination or any combination of the three Fungicides: Flax, hemp and kenaf are susceptible to disease. The use of crop rotation and the development of resistant cultivars offer a chemical-free solution to disease control. However, the current farming practices rely on the use of fungicides. As illustrated in Appendix 1, the fungicides commonly used in flax and kenaf cultivation can be linked to human cancer, endocrine disruption, water contamination or any combination of the three. The most highly hazardous of these fungicides are now banned in the European Union. Insecticides: insect pest attacks can lead to severe yield losses in flax. The use of insecticides in hemp and kenaf cultivation is not always necessary and would therefore need to be determined on a case by case basis. The development of pest resistant cultivars provides a chemical-free approach to avoid or limit economic damage to any of these three fibre crops. However, the current farming practices rely solely on insecticides that are implicated in human cancer, endocrine disruption and eco-toxicity. The most highly hazardous of these insecticides is now banned in the European Union.
8. Conclusion and Further Research
The substitution of conventional building materials with NFRCs would reduce the embodied energy, non-renewable materials demand and GHG emissions associated with South African building materials. However, the production of natural fibres based on established pesticide intensive farming practices would increase the embodied toxicity attributable to building materials; increase the burden of human disease and contribute to bio-diversity loss. The improvement efforts should focus on the following:
Research and development of disease and pest resistant cultivars A shift from chemical intensive to chemical-free cultivation of fibre crops Raising awareness, within the natural fibre supply chain, of the grave health risks of pesticide
exposure Banning or severe restriction of the use of highly hazardous pesticides Enforcement of international agreements and implementation of national policy
9. References
Ampofo-Anti, N.L. 2015. A brief introduction to chemical hazards in the life cycle of building materials with floor coverings as a case study. The Green Building Handbook South Africa, Vol. 8, The Essential Guide Benbrook, C.M. 1996. Growing doubt: A primer on pesticides identified as endocrine disruptors and/or reproductive toxicants, Tucson, AZ, The Campaign (1996). Blair, A. and Freeman, L.B. 2009. Epidemiologic studies in agricultural populations: observations and future directions. Journal of Agromedicine 14(2) 125-131. CHEMTrust, 2010. A review of the role pesticides play in some cancers: children, farmers and pesticide users at risk? http://www.chemtrust.org.uk/pesticides-and-cancer/ Colborn, T., Vom Saal F.S. and Soto, A.M. 1993. Developmental effects of endocrine-disrupting chemicals in wildlife and humans. Environmental Health Perspectives, 101 (1993) 378-384.
299

Cook, C.G, Hickman, M.V., Webber, C.L., Sij, J.W. and Scott, A.W.1992. Fungicide treatment effects on kenaf seed germination and stand establishment. Industrial Crops and Products. 1(1992) 41-45. Dippenaar, M.C., du Toit, C.L.N. and Botha-Greef, M.S. 1996. Response of hemp (cannabis sativa L.) varieties to conditions in Northwest Province, South Africa. Duis, K., Scheider, J., Warnecke, D., van der Veen, A., Coors, A., Knacker T. 2012. Substances of very high concern under REACH – an evaluation of uncertainties in the environmental risk assessment of endocrine active substances. http://www.reach-info.de/dokumente/umweltrisikobewertung_endokriner_stoffe.pdf EFSA, 2015. The 2013 European Union report on pesticide residues in food. European Food Safety Authority Journal 2015 13(3) 4038. http://www.efsa.europa.eu/en/efsajournal/pub/4038 European Commission. 2015. European Commission priority list of EDCs. http://ec.europa.eu/environment/chemicals/endocrine/strategy/substances_en.htm FAO/ UNEP, 2005. Rotterdam Convention - Operation of the Prior Informed Consent (PIC) procedure for banned or severely restricted chemicals: decision guidance document, parathion. www.archive.pic.int/en/Table7Files/En/ParatENamended.doc FAO, 2005. International code of conduct on the distribution and use of pesticides. www.fao.org/docrep/018/a0220e/a0220e00.pdf Fleming, L.E, Bean, J.A, Rudolph, M. and Hamilton, K. 1999. Mortality in a cohort of licensed pesticide applicators in Florida. Occupational and Environmental Medicine. 56(1) 14-21. Flower, K.B., Hoppin J.A., Lynch, C.F., Blair, A. Knott, C., Shore, D.L. and Sandler, D.P. 2004. Cancer risk and parental pesticide application in children of agricultural health study participants. Environmental Health Perspectives. 112 (5) 631-635. Farmers Weekly 2007. SA kenaf fibre processing plant ready for lift off http://www.farmersweekly.co.za/article.aspx?id=672&h=SA-kenaf-fibre-processing-plant-ready-for-lift-off IARC, 2015. IARC monographs volume 112: evaluation of five organophosphate insecticides and herbicides. http://www.iarc.fr/en/media-centre/iarcnews/pdf/MonographVolume112.pdf IARC, 2006. IARC monographs on the evaluation of carcinogenic risks to humans – preambles. http://monographs.iarc.fr/ENG/Preamble/CurrentPreamble.pdf ISU, 2003. Fundamentals of organic agriculture. http://extension.agron.iastate.edu/organicag/pubs.html Joshi, S.V., Drzal, L.T., Mohanty, A.K.and Arora, S. 2004. Are natural fibre composites superior to glass fibre reinforced composites? Composites: Part A 35 (2004): 371-376. Kavlock RJ, Daston GP, DeRosa C, Fenner-Crisp P, Gray LE, Kaattari S, Lucier G, Luster M, Mac MJ, Maczka C, Miller R, Moore J, Rolland R, Scott G, Sheehan DM, Sinks T, Tilson HA (1996). Research needs for the risk assessment of health and environmental effects of endocrine disruptors: a report of the U.S. EPA sponsored workshop. Environ. Health Perspect. 104, 715-740. Keith, L.H. 1997. Environmental Endocrine Disruptors: A Handbook of Property Data. New York, Wiley Inter-science. Koroneos, C. and Dompros, A. 2007. Environmental assessment of brick production in Greece. Building and Environment. 42 (2007), pp. 2114-2123. Liddell, H., Gilbert, J. and Halliday, S. Design and detailing for toxic chemical reduction in buildings. http://www.seda.uk.net/assets/files/guides/dfcrb.pdf Le Mahieu, PJ., Oplinger, ES and Putnam, DH. 1991. Kenaf - University of Wisconsin. www.corn.agronomy.wisc.edu/crops/kenaf Malan, A.S. 2011. Herbicide evaluation for weed control in kenaf. repository.up.ac.za/bitstream/handle/2263/29979/dissertation.pdf? McPartland, JM. 1997. Cannabis as repellent and pesticide. Journal of the International Hemp Association 4(2): 87-92 Cannabis http://www.druglibrary.net/olsen/HEMP/IHA/jiha4210.html NPIC, 2015. Understanding pesticide risks. http://npic.orst.edu/health/risk.html PAN Europe, 2011. Factsheet carbendazim. pan-europe.info/.../PAN%20Europe%20factsheet%20on%20Carbendazim PANNA, 2015a. Human toxicity – carcinogenicity www.pesticideinfo.org/Docs/ref_toxicity3.html PANNA, 2015b. Human toxicity – endocrine disruptors www.pesticideinfo.org/Docs/ref_toxicity5.html PANNA, 2015c. Human toxicity – reproductive and developmental toxicity www.pesticideinfo.org/Docs/ref_toxicity4.html PANNA, 2015d. Human toxicity - acute toxicity www.pesticideinfo.org/Docs/ref_toxicity2.html Rull, R.P., Gunier, R., Von Behren, J., Hertz, A., Crouse, V., Buffler, P.A. and Reynolds, P. 2009. Residential proximity to agricultural pesticide applications and childhood acute lymphoblastic leukemia. Environmental Research 109 (7) 891-899
300

Sharma, R.S., Raghupathy, V.P., Sashank Rao, S. and Shubhanga, P. 2007. Review of recent trends and developments in biocomposites. Available at www.sashankrao.webs.com/REVIEW%20OF%20RECENT%20TRENDS%20 accessed on 20/07/2015 Turunen, L. and van der Werf, 2006. Life cycle analysis of hemp textile yarn. www.rennes.inra.fr UNEP, 2015. The Rotterdam Convention, Annex III Chemicals. Available at http://www.pic.int/TheConvention/Chemicals/AnnexIIIChemicals/tabid/1132/language/en-US/Default.aspx USEPA, 2015a. What is a pesticide? www.epa.gov/pesticides/about USEPA, 2015b. Why we use pesticides. http://www2.epa.gov/safepestcontrol/why-we-use-pesticides USEPA, 2015c. What is the balance between the risks and benefits of pesticides? www.epa.gov/pesticides/about/#balance USEPA, 2015d. Drinking water and pesticides http://www2.epa.gov/safepestcontrol/drinking-water USEPA, 2011. Endocrine primer. http://www.epa.gov/endo/pubs/edspoverview/primer.htm USEPA, 2012. Evaluating pesticides for carcinogenic potential. http://www.epa.gov/pesticides/health/cancerfs.htm Van der Werf, H.M.G.1995. Agronomic research on hemp (Cannabis Sativa L) in Netherlands from 1987-1993. http://www.hempfood.com/IHA/iha02107.html Van Dam, J.E.G. and Bos, H.L. 2004. The environmental impact of fibre crops in industrial applications. WBCSD, 2007. Teaching an old fibre new tricks. http://oldwww.wbcsd.org/Plugins/DocSearch/details.asp?DocTypeId=24&ObjectId=MjMxOTk&URLBack=%2Ftemplates%2FTemplateWBCSD2%2Flayout.asp%3Ftype%3Dp%26MenuId%3DMjY0%26doOpen%3D1%26ClickMenu%3DLeftMenu Webber, C.L. 1996. Kenaf (Hibiscus cannabinus L.) herbicide uptake and weed competition. Proceedings of the First International Kenaf Association Conference, Irving, Texas 1996 8:110–118.
WHO, 2010. The WHO recommended classification of pesticides by hazard and guidelines to classification 2009. http://www.who.int/ipcs/publications/pesticides_hazard_2009.pdf Wigle, D.T., Turner, M.C and Krewski, D. 2009. A systemic review and meta-analysis of childhood leukemia and parental occupational pesticide exposure. Environmental Health Perspectives. 17(10) 1505-1513.
WWF, 2000. Endocrine Disrupting Chemicals: WWF Position Statement. www.panda.org/downloads/toxics/edclpc.doc
301

APPENDIX 1: TOXICITY PROFILE OF CASE STUDY NATURAL FIBRES
Pesticide category
Pesticide
Acute toxicity
Chronic toxicity Human cancer Endocrine disruption Eco-toxicity International conventions
WHO Class. IARC USEPA EU OTHER OSF USEPA WWF PIC POP Flax: Linum Usasitatisimum L.
Fungicide
Benomyl U C Ban Carbendazim 3 C Ban Dimethoate 2 C 2 Mancozeb U B2 1 Thiabendazole 3 2 Ban Thiram 2 3 1
Herbicide
2,4-DB 2 2B C 1 Bromoxynil 2 C 2 Glyphosate 3 2A Linuron 3 3 C 1 Trifluralin U 3 C 1 Triallate 3 C
Insecticide L-cyhalothrin 2 1 Parathion 1A 3 C 2(Ban) Phosalone 2 Ban Pyrethrin 2 2
Industrial hemp: Cannabis Sativa L. Fungicide
Dimethoate 2 C 2 Mancozeb U B2 1 Thiram 2 3 1 Vinclozolin U 3 C 1(Ban)
Herbicide Insecticide
Kenaf: hibiscus Cannabis L. Fungicide Metalaxyl 3 Herbicide
2,4-DB 2 2B C 1 Bentazone 2 Imazethapyr U Ban M-methanearsonate 1 Pendimethalin 2 C S-metolachlor 3 C
Insecticide Carbaryl 2 2 1(Ban) Sisal: Agave Sisalana
Fungicide Herbicide Insecticide
302

CRADLE-TO-GATE ENERGY AND GREENHOUSE GAS EMISSIONS OF SOUTH AFRICAN CONCRETE AND REBAR
Nozonke DUMANI 1
Naa Lamkai AMPOFO-ANTI 2
1 Building Science and Technology, CSIR Built Environment, Pretoria, Email: [email protected] 2 Building Science and Technology, CSIR Built Environment, Pretoria, Email: [email protected] Keywords: CO2 equivalent, embodied energy, greenhouse gas emissions, concrete, rebar
Abstract
This paper examines the embodied energy and associated GHG emissions of two commonly used South African structural building materials, namely, concrete and rebar. About 50% of global primary energy is used in buildings. Furthermore, the building industry is, after the food industry, the greatest consumer of raw materials. The dominant, operational energy component of total life cycle energy was targeted for improvement, making low-energy buildings a reality. However, in low-energy buildings, embodied energy dominates the total life cycle energy. Thus, greenhouse gas emissions reductions strategies for buildings should give equal attention to both operational and embodied energy. Cradle-to-gate life cycle inventories were compiled for concrete and rebar using SimaPro 8.1. As it was difficult to obtain South African LCI data, the relevant datasets of the eco-invent Database version 3 were “localised” by changing the electricity mix to South African country mix. The results suggest that reducing the embodied energy and associated GHG emissions of South African concrete should focus on cement replacement with supplementary cementitious materials (SCMs). Similar environmental improvements in respect of rebar should focus on the use of alternative fuels to fire the blast furnace; and the production of steel from scrap instead of virgin raw materials.
1. Introduction
Globally, primary energy consumption contributes to a range of environmental problems, including greenhouse gas (GHG) emissions, ozone layer depletion and acid deposition. Up to 50% of this primary energy is used to produce building materials; construct buildings; and heat, light, ventilate and maintain buildings. Furthermore, the building sector accounts for 50% of all raw materials extracted from the earth’s crust annually (Koroneos and Dompros, 2007). Thus, the building sector represents a major target for both energy and material efficiency strategies. To date, operational energy use has been prioritized due to its dominance of the total life cycle energy of buildings. Numerous measures have been undertaken such as better building designs, and the use of advanced and effective insulation materials to reduce the energy needed for the operation of buildings. This has resulted in more energy efficient buildings that are also known as low-energy buildings (Thormark, 2002; Dixit et al., 2010). However, in low-energy buildings, the embodied energy of building materials can account for as much as 9-46% of the total life cycle energy (Bribian et al., 2011). Therefore, from an energy use perspective, the relative importance of the building life cycle stages is changing, as the GHG emissions associated with the embodied energy of materials gains in importance. Thus, embodied energy is becoming a significant area on which to focus in order to maximize GHG emissions reductions from the building sector. In South Africa, the building sector contributes approximately 28% of the total national GHG emissions with the operational energy of the commercial and residential sectors accounting for 23% while the manufacturing energy of selected major building materials1 accounts for the remaining 5% (see Figure 1) (CIDB, 2009). South Africa, like the rest of the world, is currently focused on reducing the GHG emissions associated with the operation of buildings. However, now that embodied energy is starting to play a significant role in the total life cycle energy of buildings, more research needs to be undertaken to better understand the effects of this shift in life cycle energy distribution on the energy use and life cycle GHG emissions of South African building materials.
1 The selected major building materials are cement, steel, masonry, roofing and vertical cladding
303

Figure 1 Carbon dioxide emissions per sector in South Africa (adapted from CIDB, 2009) This paper aims to evaluate how two major building materials – concrete and rebar - contribute to the embodied energy and life cycle GHG emissions of the South African building sector. This study will identify improvement options of each material from an environmental perspective.
2. Embodied energy of building materials
Globally, the building industry is, after the food industry, the greatest consumer of raw materials (Dimoudi and Tompa, 2008; Tudora, 2011). Each building material consumes energy and releases GHG emissions during its production. The entire life cycle of a building is divided into three phases, namely, the pre-use phase, the use phase and post-use phase. The pre-use phase is dominated by material processes from raw materials extraction through building material manufacturing to on-site construction all of which contribute to the initial embodied energy. The use phase contributes to operational energy use (lighting, heating, ventilation and use of appliances) and recurring embodied energy (maintenance, repair or replacement of materials). The post-use phase refers to the end-of-life (EOL) options for materials disposal which includes materials recovery (reuse or recycling) and/or landfill (Figure 2).
Figure 2 The building life cycle stages (Huberman-Meraiot, 2013)
The embodied energy implications of building materials have been somewhat neglected (Menzies, 2011; Dixit et al., 2012; Thiel et al., 2013). This is because the subject matter of most published research is conventional buildings; and invariably, the results show that the operational energy accounts for approximately 80-90% of the total life cycle energy, while the total embodied energy2 accounts for the remaining 10-20% of the total life cycle energy. However, recent research has emphasized the importance of embodied energy as more buildings become energy efficient (Dixit et al., 2012). Keoleian et al. (2001) found that a significant reduction in life cycle energy, namely, 60% was achieved by an
2 Total embodied energy is equal to initial embodied energy plus recurring embodied energy plus post-use energy
Manufacturing other 35%
Transport 16%
Mining 11%
Other 10%
Commercial sector 10%
Residential sector 13%
Building materials
5%
304

energy efficient3 home over an equivalent conventional home. Additionally, the embodied energy increased from 9% for the conventional home to 26% for the energy efficient home, while the operational energy decreased from 91% for the conventional home to 74% for the energy efficient home.
Figure 3 Embodied energy of some building materials (Tudora, 2011)
Thormark (2007) found that the embodied energy of a low-energy house could be equal to 40-60% of the total life cycle energy. Sartori and Hestnes (2007) have concluded that as the operational energy component is reduced, total life cycle energy is also reduced; but then the embodied energy component starts to dominate the total life cycle energy. Achieving an energy optimised building therefore requires the ability to investigate both the operational and the embodied energy implications of alternative design options. The embodied energy of some building materials is shown in Figure 3.
3. Building materials
The environmental sustainability of building materials is important. This is because the choice of building materials determines the energy required for the construction of buildings as well as other environmental implications (Dimoudi and Tompa, 2008), in particular, maintenance requirements and heating/cooling needs. The production processes of most conventional materials that are used in modern buildings are energy intensive and associated with high environmental emissions. Numerous LCA studies have been carried out to evaluate the environmental impact of different building materials as well as to propose solutions to reduce these impacts. Most studies have limited the scope to structural and envelope materials as well as external works (see Figure 4) as these components typically account for up to 90% of the initial embodied energy and associated GHG emissions (RICS, 2012). A number of cradle-to-gate LCA studies have shown that generally, the structural materials represent more than 50% of the initial embodied energy of a building (Asif et al., 2007; Dimoudi and Tompa, 2008; Bribian et al., 2011). 3 In this paper, energy efficient building is used interchangeably with low-energy building
305

Figure 4 Conventional building materials and their contribution to cradle-to-gate GHG inventories
The study of Dimoudi and Tompa (2008) focused on the role of different construction materials in office buildings. They found that two structural building materials, namely, concrete and steel, accounted for about 70% of the initial embodied energy; and the total GHG emissions. They also observed that the building envelope materials represented a lower but significant proportion of the initial embodied energy and GHG emissions of the case study building. It is therefore important to evaluate the environmental impacts associated with South African structural and envelope materials.
3.1 Structural building materials
Common structural building materials include concrete, steel, masonry and timber. The production of concrete and steel in particular is energy intensive with concrete alone accounting for more than 60% of the initial embodied energy of a house (Asif et al., 2007). The sections below are limited to a review of the literature on concrete and steel building materials.
3.1.1 Concrete Concrete is the most widely used construction material. The basic constituents of plain concrete are cement, aggregate4, and water. In some cases, chemical additives and mineral components (cement extenders) are included. Reinforced concrete is plain concrete with steel reinforcement. In South Africa, like any developing country, the amount of concrete consumed continues to increase due to economic growth and population growth. Since concrete is used in large quantities, it is one of the largest contributors to the environmental impact of buildings. As a result, the GHG emissions associated with the production of concrete have been of interest. In 2013, the estimated production of concrete in South Africa was about 9.1 million m3 (LHA Management Consultants, 2014). Although aggregate and water account for about 90% of a concrete mix by volume, the cement component accounts for about 80% of the total GHG emissions of concrete. Studies have been done to evaluate the environmental impact of concrete. When Asif et al. (2007) conducted a cradle-to-site LCA study of five main construction materials5 for a dwelling home in Scotland, the two assessment criteria for the study were embodied energy; and contributions to GHG emissions. They found that concrete accounted for 61% of the initial embodied energy of the home. Furthermore, concrete was responsible for 99% of the total GHG emissions of the studied materials. The results of Asif et al. (2007) confirm the previously discussed findings of Dimoudi and Tompa (2008).
3.1.2 Reinforcing steel Steel reinforcement, also known as “rebar”, is an essential component in reinforced concrete. Steel is commonly used as reinforcement in concrete slabs, beams and columns (Vares and Hakkinen, 1998). Although concrete has a high compressive strength, steel reinforcement is added to improve the strength (Gonzalez et al., 1995). Steel rebar is the most common reinforcing material used in South African concrete. Other, less commonly used materials include plastic fibres and glass fibres (InEnergy, 2010). Steel rebar is used to support concrete as it has a similar thermal expansion (Using rebar, 2014).
4 Aggregate is a combination of gravel, crushed stone and sand. 5 Wood, aluminium, glass, concrete and ceramic tiles
Structural materials
Concrete in foundations,
floor slabs, roof slabs, stairs, beams and
columns, Steel in columns, beams, roof
structure and as rebar.
Clay and concrete
masonry units, Timber in
columns, beams, roof structure and frames
Envelope materials
Concrete, steel or fibre cement roof covering,
glass in façades,
aluminium, steel and timber
door and window frames,
cement and sand in mortar,
plaster and screed. Building
insulation - EPS, XPS, glass fibre
External works
Concrete, clay
or steel in boundary walls, driveways, and
walkways
Finishing materials
Wall, floor and ceiling finishes
Building services
Heating, cooling and ventilation
system, electrical system, plumbing
system
Up to 90% Life cycle GHG
inventory Up to 10% Life cycle GHG
inventory
306

Steel production results in very large amounts of GHG emissions and this is attributed to the energy intensive production process (El Maaddawy and Soudki, 2003). The internationally accepted emission factor for steel, based on scrap steel, is approximately 1.52 t CO2e per ton of steel (Wright, 2011). As compared to this, South African steel is produced primarily from virgin raw materials resulting in a significantly higher emissions factor of approximately 2.98 t CO2e per ton of liquid steel (ArcelorMittal, 2013).
4. Research questions
This paper aims to answer the following key research questions, namely: How do major structural building materials, in particular, concrete and steel, contribute to the embodied
energy and life cycle GHG emissions of the South African building sector? How do the constituent materials of concrete contribute to its embodied energy and GHG emissions?
5. Research methodology
In order to achieve the purpose of the study, an LCA study was performed. LCA is a method for evaluating the environmental impacts associated with a product by quantifying the resources consumed (energy, materials, water, and land) and the emissions to the environment (air, water and soil) at all stages of the product life cycle. It considers environmental impacts from all life cycle stages starting from raw material extraction to manufacturing, use and maintenance and disposal. According to the international standards ISO/SANS 14040:2006 and ISO 14044:2006, an LCA study entails four mandatory steps, namely: Goal and scope definition which states the objective of the study; and defines the system boundaries
and the unit of analysis Life cycle inventory (LCI) analysis which involves data collection and calculation of an inventory of
materials, energy and emissions related to the system being studied Life cycle impact assessment (LCIA) which involves analysis of the LCI results to evaluate contributions
to environmental impact categories Life cycle interpretation which entails evaluation of the LCI and LCIA results in consideration of the goal
and scope in order to reach conclusions and make recommendations
5.1 Goal and scope definition
5.1.1 Goal The primary objective of the study is to quantity the initial embodied energy and the associated GHG emissions in respect of two major South African structural building materials, namely, concrete and reinforcing steel. The secondary objective is to identify viable improvement options on the predicted performance of each material.
5.1.2 Scope The study addresses only concrete and reinforcing steel due the important contribution that these two structural materials are known to make to embodied energy and environmental impacts characteristics of buildings. The scope of the study is limited to a cradle-to-gate analysis as shown in Figure 5. This will cover all the GHG emissions and energy consumption resulting from the extraction of materials, and the processing and manufacturing stages of each structural building material.
Figure 5 Generic life cycle stages of construction product
The impact categories to be analysed in this study were selected consideration of the energy and environmental problems in South Africa as well as in the world. Out of all the environmental impacts, the one with the highest profile currently is global warming, that is, GHG emissions. Therefore, the impact categories considered in this study are global warming and non-renewable energy use (fossil depletion). The unit of analysis for all the structural building materials is one kg of material.
5.2 Life cycle inventory
The life cycle inventory phase (LCI) phase of the study is concerned with the collection of the data and calculation procedures. The inventory is prepared first qualitatively, then quantitatively for all the processes
4. Use and
maintenance
stage
5. End-of-life
stage
2. Building material
production
stage
3. On-site
construction
stage
A1. Raw material acquisition
stage
Cradle-to-gate analysis
Cradle-to-grave analysis
307

involved in the cradle-to-gate life cycle of the materials. The LCA software tool SimaPro 8.1 was used to compile the LCI dataset for each material and then to perform the LCIA. South African- specific LCI data for each of the materials was difficult to obtain and therefore European industry average data obtained from ecoinvent Database 3 were modified and used in this study. The datasets were ‘localised’ by changing the electricity mix to the South African county mix. Water, coal, and natural gas were also “localised”.
Figure 6 Concrete CO2 process emission sources (adapted from Flower and Sanjayan, 2007)
When considering the GHG emissions from the concrete industry each activity needs to be examined individually and then combined to determine the overall emissions of the concrete (Figure 6).
6. Findings and discussion
The energy consumption and the CO2 equivalent emissions of concrete and reinforcing steel are shown in Table 1. The CO2 equivalent emissions and energy consumption of Portland cement is greater than that of concrete. This is attributed to the fact that mixing cement with less energy intensive materials (fine and coarse aggregates) reduces the impact. These results are similar to the findings by Flower and Sanjayan (2007) who observed that Portland cement generates the majority of GHG emissions during the production of concrete, primarily due to the clinker production stage. The production of rebar results in very large amounts of GHG emissions and this is attributed to the energy intensive nature of the steel production process. Therefore, the GHG emissions of reinforced concrete are much higher than that of plain concrete because the inclusion of rebar increases the emissions significantly.
Table 1 Results for structural building materials
Material Fossil depletion
6
(kgOileq/kg)
Global warming
(kgCO2eq/kg)
Portland cement 0.0995 0.974
Coarse aggregate 0.00346 0.0136
Fine aggregate 0.0014 0.00514
Concrete 0.0199 0.148
Reinforcing steel 0.456 2.23
6 Fossil depletion and energy consumption are used interchangeably
Fine aggregates production
Transport of raw
materials to concrete batching plants
Portland cement
production
Coarse aggregates production
Concrete production
Explosives
Electricity
Diesel fuel
LPG Fuel
GHG emissions
Concrete Unexploited resources
System boundary
308

Figure 7 Contribution of constituent materials of concrete to global warming and fossil depletion
As mentioned, clinker production is the most energy intensive stage in the production of cement. Therefore, reduction of the environmental impact of concrete should focus on the clinker production process. In order to reduce the energy consumed and GHG emissions released during cement production, alternative materials and fuels could be used to replace conventional materials and fossil fuels (Bribian et al., 2011). When Flower and Sanjayan (2007) investigated methods by which the amount of GHG emissions generated by concrete could be reduced, they used supplementary cementitous materials7 (SCMs) to replace a portion of cement in the concrete mix. They found that the use of SCMs can significantly reduce the GHG emissions associated with concrete. Reinforcing steel contributes significantly to the embodied energy of structural building materials. To reduce the energy consumed and GHG emissions released during steel production, improvement efforts in South Africa should focus on producing new steel from scrap steel instead of from virgin raw materials.
7. Interpretation and conclusions
The primary objective of this study was to quantify the embodied energy and GHG emissions associated with concrete and rebar. LCA methodology was applied to quantify environmental impacts during cradle-to-gate production of concrete and rebar. The results suggest that the manufacture of concrete and rebar contribute significantly to the embodied energy and GHG emissions of the South African building sector. The largest contribution to the GHG emissions of concrete originates from cement production. In order to reduce this, the focus has to be on increasing the percentage of SCMs used to replace the cement in concrete. The results also suggest that use of reinforcing steel contributes significantly to the embodied energy and GHG emissions associated with structural building materials in South Africa. It was concluded that the use of alternative fuels to fire the blast furnace; and the production of steel from scrap instead of virgin raw materials could significantly reduce the embodied energy and emissions factor associated with South African steel. It can be observed from the results that structural building materials contribute significantly to the embodied energy and associated life cycle GHG emissions of buildings.
8. References
ArcelorMittal South Africa, 2013, Towards recovery – Sustainability report Asif, M., Muneer, T., and Kelley, R., 2007, Life cycle assessment: A study of a dwelling home in Scotland. Building and Environment 42, 1391-1394
Bribian, I.Z., Uson, A.A., and Scarpellini, S., 2009, Life cycle assessment in buildings: state-of-the-art and simplified LCA methodology as a complement for building certification. Building and Environment 44, 2510-252 Bribian, I.Z., Capilla, A.V., Uson, A.A., 2011, Life cycle assessment of building materials: comparative analysis of energy and environmental impacts and evaluation of the eco-efficiency improvement potential. Building and Environment 46, 1133-1140 CIDB, 2009, Greenhouse Gas Emission Baselines and Reduction Potentials from Buildings in South Africa, Construction Industry Development Board, Pretoria
7 The most commonly used SCMs in South Africa are fly ash and ground granulated blast furnace slag (GGBFS)
0.
10.
20.
30.
40.
50.
60.
70.
80.
90.
100.
Global warming Fossil depletion
%
Analysing 1 p 'Concrete'; Method: ReCiPe Midpoint (H) V1.10 / World Recipe H / Characterisation
Fine aggregate ZA
Coarse aggregate ZA
Portland cement ZA
309

Dimoudi, A., and Tompa, C., 2008, Energy and environmental indicators related to construction of office buildings. Resources, Conservation and Recycling 53, 86-95 Dixit, M.K., Fernandez-Solis, J.L., Lavy, S., and Culp, C.H., 2010, Identification of parameters for embodied energy measurement: A literature review. Energy and Buildings 42, 1238-1247 Dixit, M.K., Fernandez-Solis, J.L., Lavy, S., and Culp, C.H., 2012, Need for an embodied energy measurement protocol for buildings: A review paper. Renewable and Sustainable Energy Reviews 16, 3730-3743 Dixit, M.K., Culp, C.H., Fernandez-Solis, J.L., 2013, System boundary for embodied energy in buildings: A conceptual model for definition. Renewable and Sustainable Energy Reviews 21, 153-164 El Maaddawy, T.A., and Soudki, K.A., 2003, Effectiveness of impressed current technique to simulate corrosion of steel reinforcement in concrete. Journal of Materials in Civil Engineering 15, 41-47 Flower, D.J.M., and Sanjayan, J.G., 2007, Greenhouse gas emissions due to concrete manufacture. International Journal of Life Cycle Assessment 12(5), 282-288 González, J. A., Andrade, C., Alonso, C. and Feliu, S., 1995, Comparison of rates of general corrosion and maximum pitting penetration on concrete embedded steel reinforcement. Cement and Concrete Research, 25 (2), 257-264 Gursel, A.P., Masanet, E., Horvath, A., Stadel, A., 2014, Life cycle inventory analysis of concrete production: A critical review. Cement and Concrete Composites 51, 38-48 Huberman, N. and Pearlmutter, D., 2008, A life cycle energy analysis of building materials in the Negev desert. Energy and Buildings 40, 837-848 Huberman-Meraiot, N., 2013, Development of a database for embodied energy of building materials in Israel, and Applications in LCA studies. Available online at: http://www.industry.org.il/_UploadsCl/dbsAttachedFiles/Development.pdf, accessed: 13 July 2015 InEnergy, 2010, Cement and Concrete Institute concrete industry greenhouse gas emissions, Northcliff Keoleian, G.A, Blanchard, S. and Reppe, P., 2001, Life-cycle energy, costs, and strategies for improving a single family-house. Journal of Industrial Ecology 4(2), 135-156
Koroneos, C. and Dompros, A., 2007, Environmental assessment of brick production in Greece. Building and Environment 42, 2114-2123
Lemay, L., 2011, Life cycle assessment of concrete buildings. Concrete sustainability report, National ready mixed concrete association, CSR04-October 2011
LHA Management Consultants report, 2014, Building industry statistics. Pretoria Menzies, G.F., 2011, Embodied energy considerations for existing buildings. Technical Paper 13, Heriot Watt University, Scotland Monahan, J., and Powell, J.C., 2011, An embodied carbon and energy analysis of modern methods of construction in housing: a case study using a life cycle assessment framework. Energy and Buildings 43, 179-188 Pargana, N., Pinheiro, M.D., Silvestre, J.D., and de Brito, J., 2014, Comparative environmental life cycle assessment of thermal insulation materials of buildings. Energy and Buildings 82, 466-481 Sartori, I., and Hestnes, A.G., 2007, Energy use in the life cycle of conventional and low –energy buildings: a review article. Energy and Buildings 39, 249-257 RICS, 2012, Methodology to calculate embodied carbon of materials. Available online at: http://www.rics.org/Documents/Methodology_embodied_carbon_final.pdf, accessed: 03 August 2015 Thiel, C.L., Campion, N., Landis, A.E., Jones, A.K., Schaefer, L.A., and Bilec, M.M., 2013, A materials life cycle assessment of a net-zero energy building. Energies 6, 1125-1141 Thormark, C., 2002, A low energy building in a life cycle – its embodied energy, energy need for operation and recycling potential. Building and Environment 37, 429-435 Thormark, C., 2007, Energy and resources, material choice and recycling potential in low energy buildings. In: CIB Conference, SB07 Sustainable Construction, Materials and Practices Tudora, A-C., 2011, Assessment of criteria of building materials form ecological point of view. Buletinul Institutului Politehnic Din Iaşi, Tomul LIV (LVIII), Fasc. 4 Using Rebar, 2004, Information, advice, and how-to on Using rebar Vares, S., Häkkinen, T., 1998, Environmental burdens of concrete and concrete products. Technical Research Centre of Finland, VTT Building Technology, Available online at: http://www.betong.net/ikbViewer/Content/739021/doc-21-10.pdf, accessed: 23 July 2014 Venta, G.J., Venta, P.E., and Glaser & Associates, 1998, Life cycle analysis of brick and mortar products, the Athena Sustainable Materials Institute, Canada Wright, M.A, 2011, Carbon dioxide equivalent emissions from the manufacture of concrete in South Africa, MSc thesis, University of Witwatersrand, Johannesburg
310

FACTORS INFLUENCING THE GROWTH OF GREEN BUILDING IN THE SOUTH AFRICAN CONSTRUCTION INDUSTRY
Eric Kwame SIMPEH
1
John Julian SMALLWOOD 2 1 Department of Construction Management, Nelson Mandela Metropolitan University, PO Box 77000, Port
Elizabeth 6031, South Africa, Email: [email protected] 2 Department of Construction Management, Nelson Mandela Metropolitan University, PO Box 77000, Port
Elizabeth 6031, South Africa, Email: [email protected] Keywords: Construction, green building, South Africa, sustainable
Abstract
This research paper aims at examining the concept of green building with the objective of identifying the key factors that affect the growth of green building in the South African construction industry. A comprehensive literature review was undertaken to provide an overview of the factors limiting the growth of green building globally and in South Africa. A quantitative approach was adopted and data was collected via a questionnaire survey of randomly selected construction professionals in the South African construction industry. Descriptive (mean) and inferential (One way analysis) statistics were used to analyse the data. The results show that key factors hindering the growth of green building are lack of incentives for promoting green building, inadequate cost data for green buildings, and inadequate information regarding the financial and economic benefits and opportunities of green buildings. The study also divulges that there is no significant difference regarding the perceptions of respondents and the major factors inhibiting the growth of green building. Actions towards promoting the green built environment require resolute actions and drive from various parties. Therefore, the identification of key factors will result in the development of effective strategies to enhance the growth of green building in the South African construction industry. Given the benefits derived from green building principles, the paper will add value to construction industry stakeholders who have limited information regarding factors limiting the growth of green building.
1. Introduction
The construction industry is important because of the outputs and outcomes of its activities. It contributes to national socio-economic development by providing the buildings, which are used in the production of all goods and services in the economy (Ofori, 2012). However, how a building is designed, the way and manner it is constructed, and where it is located clearly affects the users of the building, the community, and the environment (Choi, 2009). Thus it can be implied that the construction industry can influence the competitiveness of enterprises within the economy. Construction can also affect the ability of the nation to attract foreign investment. For these reasons, efforts should be made to ensure the continuous improvement of the industry especially in this era of globalisation since all nations are competing nations in order to attract foreign investment. Notably, the construction industry performs poorly with regards to environmental considerations (Ofori, 2012). Construction activities in developing countries may involve excessive resource consumption, and cause land degradation, loss of habitats, air and water pollution, and involve high energy usage and produce approximately 23-40% of the world’s greenhouse gas emissions (Ofori, 2012; Gunnell, 2009). The substantial negative environmental impacts of buildings have led to the emerging concept of ’green buildings’ (Gunnell, 2009). According to Gunnell (2009), green buildings are designed to be energy and water efficient, use non-hazardous materials and provide healthy productive environments. Green building is defined “as a construction project that is either certified under any recognised global green rating system or built to qualify for certification” (Bernstein & Mandyck, 2013:5). Green building is growing rapidly across the world as it becomes viewed as a long-term business opportunity. A recent study conducted by McGraw-Hill Construction and United Technologies Climate, Controls, and Security, reveals that 51% of international firms, including architects, engineers, contractors, building owners, and building consultants around the world are focusing on sustainable design and construction as at least 60% of their projects were ‘green’ by 2015, up from 28% in 2012 (Bernstein & Mandyck, 2013). For instance, it is anticipated that the percentage of construction firms in South Africa incorporating green practices in their business, will rise from 16% in 2012 to a planned 52% by 2015 (Bernstein & Mandyck, 2013). This is the strongest growth among all the survey respondents, indicating a market conducive to green building (Bernstein & Mandyck, 2013). Despite this progress, significant obstacles however remain, erected by the inertia of the building professions and the construction industry and compounded by the difficulty of changing building codes, information asymmetry regarding the possibilities, techniques and potentials of green building solutions, cultural / behavioural, and financial barriers. Against this backdrop, this paper was developed to identify the major factors that inhibit the growth of green building in the construction industry and to determine whether there is a significant difference between the participants’ perceptions and the factors inhibiting the growth of this sector.
311

1.1 The problem
While the construction industry has made some inroads into promoting green building in South Africa, the industry has experienced a slight growth in adopting green practices. The slow adoption and poor performance of green building is besieged with significant obstacles such as conflicting building codes, and fears of liability and litigation over the performance of new products and systems. Industry professionals, in both the design and construction disciplines, are generally slow to change and tend to be risk-adverse (Osec, 2010). A further key problem facing green building is a lack of knowledge, experience, and understanding of how to apply ecology to construction design (Hankinson & Breytenbach, 2012). Furthermore, the environmental or economic benefit of some green building approaches has not been scientifically quantified, despite their often intuitive and anecdotal benefits (Osec, 2010).
2. Review of factors limiting the growth of green building
2.1 Capacity barriers
One of the most critical challenges to building green is the lack of industry skill of the construction sector to actually design and implement green practices. Hankinson & Breytenbach (2012) contend that the industry is hampered by a lack of technical expertise to actually develop and implement green practices. Hankinson & Breytenbach report that professionals within the built environment are not yet fully trained in green construction principles and thus lack education and experience to properly carry out such practices. This is because it was not studied or comprehensively covered at tertiary institutions, since it is a specialised field of study. Jacobs (2011) also identifies lack of knowledge about green practices, lack of knowledge about the effects of non-green practices on the environment, lack of training and education as the main barriers to the implementation of green building. This is further reiterated by Häkkinen & Belloni (2011) that green building practices can be hindered by ignorance or a lack of common understanding about sustainability. Rydin et al. (2006) argue that not only are professionals supposed to be knowledgeable, professionals need to form an integrated team from conception to inception comprising of the developer / owner, project manager, contractor, architect, services engineer, structural engineer, civil engineer, environmental engineer, landscape consultant, cost planner, and building surveyor. This team needs to have the best available information on products and tools to achieve sustainable construction, however, Williams & Dair (2007) lament that, this was not the case. In their research, evidence of hindrance due to a lack of information was an experience common to most stakeholder groups. In several cases, stakeholders admitted to not being aware of sustainable measures or alternatives that fall within their remit. Similarly, installing green technologies and materials requires new forms of competencies and knowledge, yet it was evident from the research that not all those with responsibilities in this area had the necessary experience or expertise to meet the challenge. This view is supported by the International Labour Orginasiation (ILO) (2011) that the main reason for labour shortages and lack of industry skill in this area is that skill requirements change as green building designs, technologies and practices are introduced or changed, so that previously satisfactory skills sets are no longer adequate.
2.2 Cultural and social resistance
The South African construction industry process has not evolved over the past decades. As a result, Djokoto et al. (2014) contend that the industry presents itself as a sector which is traditionally very difficult to change especially with respect to construction methods practiced and building materials used. Besides, firms follow the consumption patterns of clients who normally worship modernity and the development model of developed countries with its vices and problems. Furthermore, the construction sector in developing countries such as South Africa is dominated by firms that are not interested in technology changes that involve risks and extra costs (Du Plessis et al., 2002). Construction in South Africa favours the use of ’brick and mortar’ and discourages any other alternative to these building materials and services. As a result, communities, clients, and stakeholders do not demand innovative building solutions, relying instead on conventional methods (Housing in Southern Africa (HISA), 2014). According to Djokoto et al. (2014), this illustrates typical resistance to change, and thus a major barrier.
2.3 Lack of incentives for promoting green building
According to Ndihokubwayo, Crafford & Buys (2013), green building principles have recently gained momentum in the South African construction industry. Despite this progress, there is a lack of incentives for demonstrating best green practice. Diyana & Abidin (2013) contend that motivational factors and grounds of expectations derived during the forethought process will influence stakeholders in the construction industry to commit and decide to venture into new practice such as green construction. Therefore, understanding of what can initiate the commitment of ‘first-time’ developers or to maintain the interest of ‘experience’ developers for green construction can generate further recommendations to create a viable environment to induce wider acceptance on the practice. Peterson (2007) concurs that incentive can inspire, encourage, and stimulate individuals and project teams to achieve great accomplishments. Barbour (2005) affirms that the economic rationale for incentives seeks to correct market failures including, information asymmetries, the public good nature of investment in research and development, and infant industry protection. In the context of South African construction industry, infant industry could be seen as the adoption of green principles, which are not yet widely implemented across various professional participants in construction project (Ndihokubwayo, Crafford & Buys, 2013).
312

2.4 Inadequate cost data for green buildings
The lack of attention to the costs associated with green construction seems to be a global phenomenon. Choi (2009) states that one of the major barriers is the need for reliable cost information for green features, without this information, it is difficult for the market to justify the occasionally higher up-front costs for a green development project. Kats & Capital (2003) reveal that there is still little published data about actual cost premiums for green buildings. For instance in the United States this information gap is exacerbated by the fact that the USGBC does not require that cost information be included with submissions for LEED certification. Many developers keep cost information proprietary. As a result, Nelson (2008) acknowledges that there are more ways to expand the four pillars of sustainability and one of the ways is to expand Full-Cost Pricing to True-Cost Pricing. Debatably, the True-Cost Pricing goes beyond covering the costs of the infrastructure and includes long-term environmental and community externalities, such as for example, energy savings, green space, and green job creation. While there has been a plethora of research seeking to determine the direct or tangible costs of green building, the indirect or intangible costs remain unexplored in construction. Love (2002) argues that this is because it is difficult, if not impossible to quantify such costs in purely monetary terms. As a result, Choi (2009) emphasises the need to look at the indirect costs as well when determining the total costs of green construction.
2.5 Inadequate information regarding the financial and economic benefits and opportunities of green buildings
Another significant issue of concern is the availability of information regarding the full benefits that green building can offer, which is deemed to be worrisome in the South African construction industry (Bernstein & Mandyck, 2013; Cruywagen, 2013). Milne (2012) is of the view that the valuation industry relies on past evidence of sales prices to determine the appropriate capitalisation rates to use when valuing a property. The author laments that until there are a greater number of rated green buildings in South Africa that have been transacted, the full benefits of green buildings may not be reflected in their valuations. According to Häkkinen & Belloni (2011), this barrier persists due to the lack of quantitative documentation of benefits and uncertainties associated with green buildings. Choi (2009) dictum that if green development is to move from being a niche market to the norm for construction projects there is a need for reliable cost and benefit information of green building. Therefore, the benefits and performance of green buildings must be documented and communicated to expand the market for green development. Further, there should also be tools that help brokers, appraisers, property search specialists who are directly involved in marketing green properties to be able to easily communicate the benefits to clients (Choi, 2009).
2.6 Limited range of green products and materials
Reliability of information from product suppliers and manufacturers is a major concern as well, “for instance, product suppliers and manufacturers are developing and marketing products that are environmentally responsible. However, without certifications ensuring that a product is indeed environmentally responsible, designers find it hard to decipher what is authentic from that which is not.” (Hankinson & Breytenbach, 2012: 4-5). According to Tam, Hao & Zeng (2012), if the design team members do not have sufficient time and funding to search for new green products, components and technologies, green building designs cannot be implemented. Therefore, a limited range of green products and materials may restrict the opportunities to create cost efficient designs.
2.7 Delays in obtaining certification and permits for green buildings
Inadequate or conflicting government regulation (Milne, 2012) coupled with the difficulty in gaining green certification is the main barrier to implementing green building features (Nurick & Cattell, 2013). Empirical evidence suggests that revision of many building codes impede and delay the process of implementing green building. For instance, the process of reaching agreement on the vision and goals of a design requires lots of public review meetings, working with community and building code officials to agree on a design (Garman et al., 2011).
3. Research Methodology
An exploratory research approach was adopted for the study. The mixed-mode quantitative survey was used to elicit information from the respondents through a structured questionnaire that, inter-alia, requested for information relative to the factors impeding the growth of green building in the South African built environment. Respondents included architects, construction managers, construction project managers, contractors, consulting engineers, and quantity surveyors. A total of 344 questionnaires were sent out by e-mail, 71 were duly completed and returned, representing a response rate of 21%. The data was encoded using the Statistical Package for the Social Science (SPSS) and results were carefully analysed statistically using the descriptive statistics. The one-way analysis of variance (ANOVA) was applied to determine the statistically significant difference between the perceptions of respondents’ and factors impeding the growth of green building. The ANOVA is the commonly used method to evaluate the differences in means for more than two groups. The level of significance for the ANOVA was 0.05.
4. Findings and Discussion
The respondents were given the opportunity to rate statements with regard to the factors impacting negatively on the growth of green building in the South African built environment on a five-point likert-scale question of strongly disagree to strongly agree.
313
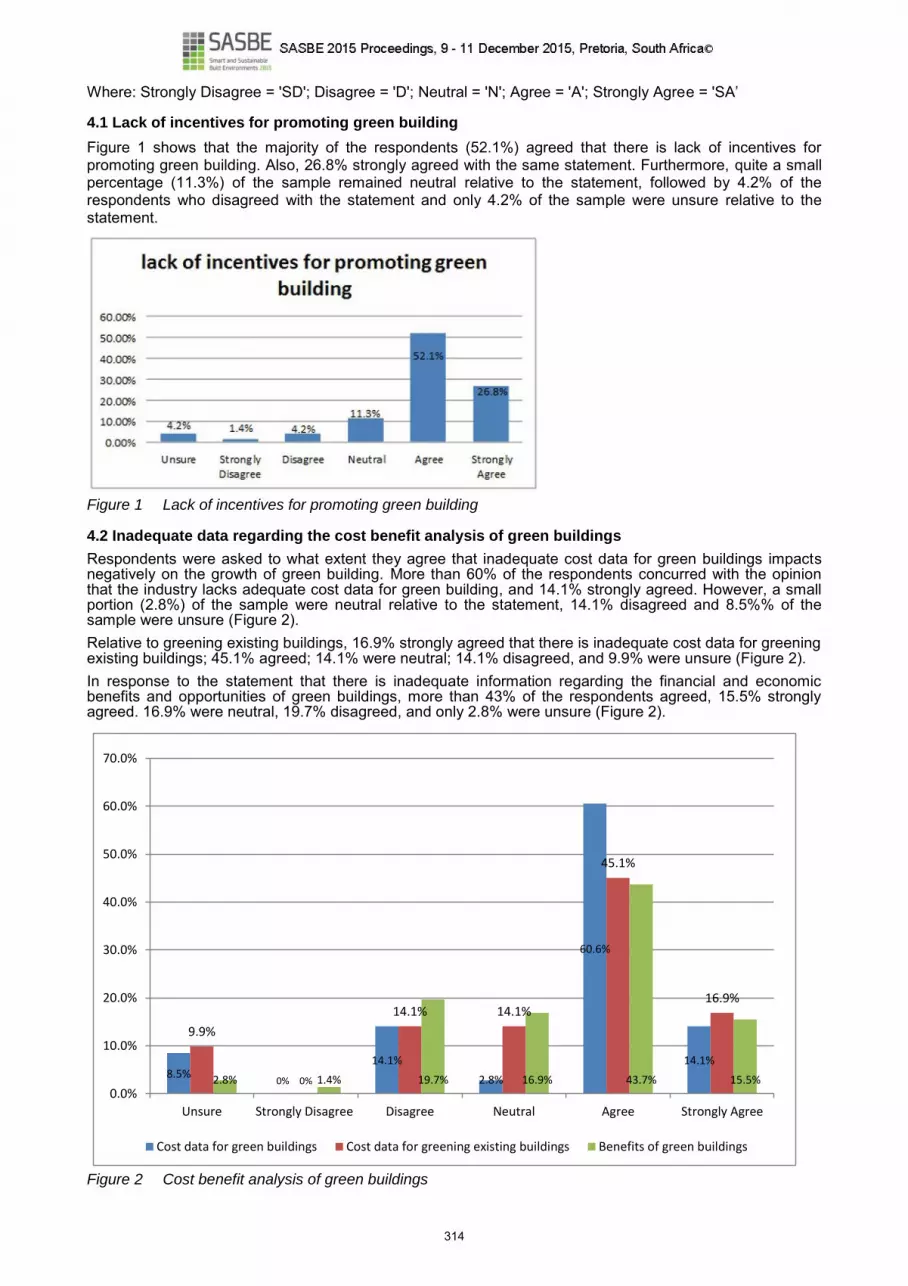
Where: Strongly Disagree = 'SD'; Disagree = 'D'; Neutral = 'N'; Agree = 'A'; Strongly Agree = 'SA’
4.1 Lack of incentives for promoting green building
Figure 1 shows that the majority of the respondents (52.1%) agreed that there is lack of incentives for promoting green building. Also, 26.8% strongly agreed with the same statement. Furthermore, quite a small percentage (11.3%) of the sample remained neutral relative to the statement, followed by 4.2% of the respondents who disagreed with the statement and only 4.2% of the sample were unsure relative to the statement.
Figure 1 Lack of incentives for promoting green building
4.2 Inadequate data regarding the cost benefit analysis of green buildings
Respondents were asked to what extent they agree that inadequate cost data for green buildings impacts negatively on the growth of green building. More than 60% of the respondents concurred with the opinion that the industry lacks adequate cost data for green building, and 14.1% strongly agreed. However, a small portion (2.8%) of the sample were neutral relative to the statement, 14.1% disagreed and 8.5%% of the sample were unsure (Figure 2). Relative to greening existing buildings, 16.9% strongly agreed that there is inadequate cost data for greening existing buildings; 45.1% agreed; 14.1% were neutral; 14.1% disagreed, and 9.9% were unsure (Figure 2). In response to the statement that there is inadequate information regarding the financial and economic benefits and opportunities of green buildings, more than 43% of the respondents agreed, 15.5% strongly agreed. 16.9% were neutral, 19.7% disagreed, and only 2.8% were unsure (Figure 2).
8.5%0%
14.1%
2.8%
60.6%
14.1%
9.9%
0%
14.1% 14.1%
45.1%
16.9%
2.8% 1.4% 19.7% 16.9% 43.7% 15.5%0.0%
10.0%
20.0%
30.0%
40.0%
50.0%
60.0%
70.0%
Unsure Strongly Disagree Disagree Neutral Agree Strongly Agree
Cost data for green buildings Cost data for greening existing buildings Benefits of green buildings
Figure 2 Cost benefit analysis of green buildings
314
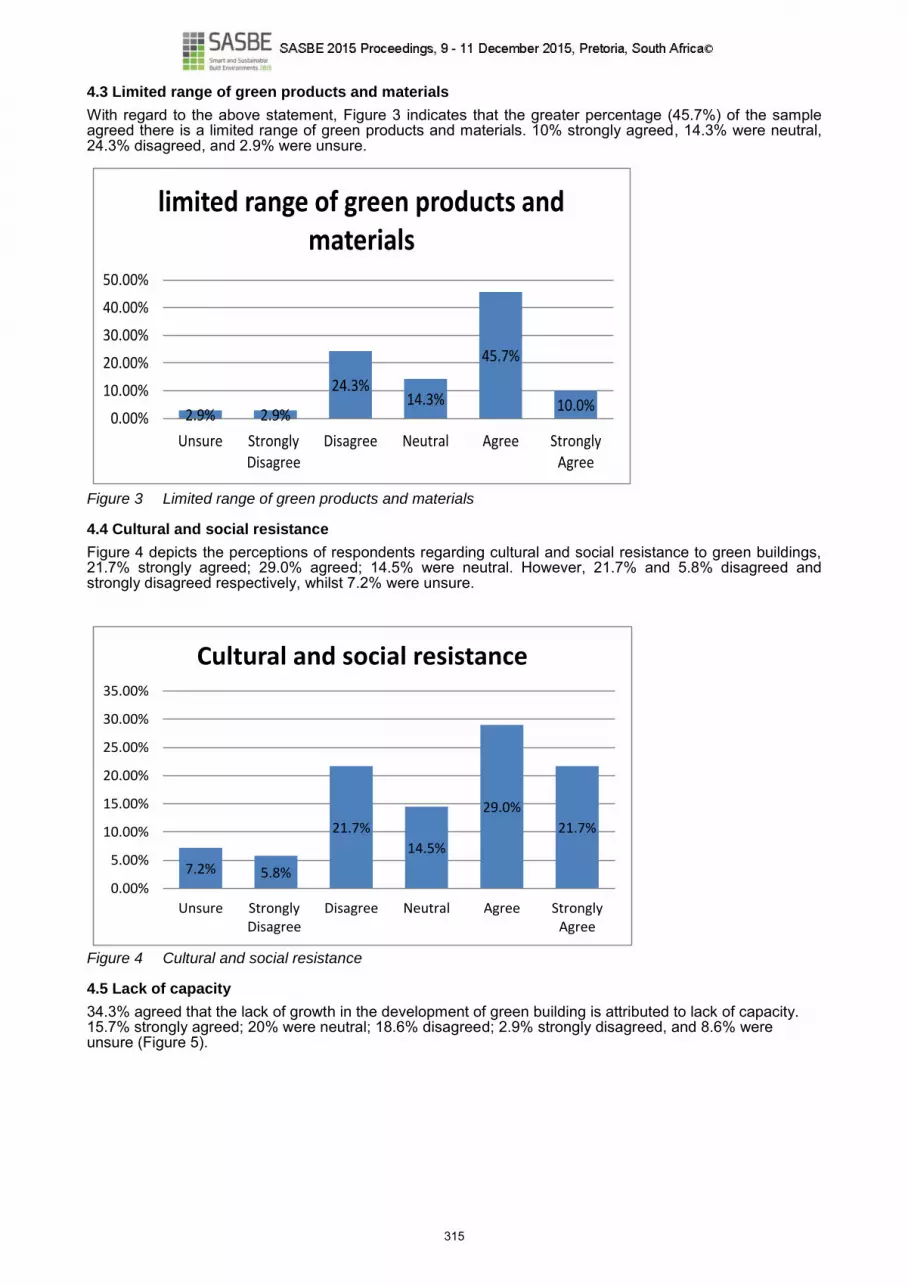
4.3 Limited range of green products and materials
With regard to the above statement, Figure 3 indicates that the greater percentage (45.7%) of the sample agreed there is a limited range of green products and materials. 10% strongly agreed, 14.3% were neutral, 24.3% disagreed, and 2.9% were unsure.
2.9% 2.9%
24.3%14.3%
45.7%
10.0%0.00%
10.00%
20.00%
30.00%
40.00%
50.00%
Unsure StronglyDisagree
Disagree Neutral Agree StronglyAgree
limited range of green products and materials
Figure 3 Limited range of green products and materials
4.4 Cultural and social resistance
Figure 4 depicts the perceptions of respondents regarding cultural and social resistance to green buildings, 21.7% strongly agreed; 29.0% agreed; 14.5% were neutral. However, 21.7% and 5.8% disagreed and strongly disagreed respectively, whilst 7.2% were unsure.
7.2% 5.8%
21.7%
14.5%
29.0%
21.7%
0.00%
5.00%
10.00%
15.00%
20.00%
25.00%
30.00%
35.00%
Unsure StronglyDisagree
Disagree Neutral Agree StronglyAgree
Figure 4 Cultural and social resistance
4.5 Lack of capacity
34.3% agreed that the lack of growth in the development of green building is attributed to lack of capacity. 15.7% strongly agreed; 20% were neutral; 18.6% disagreed; 2.9% strongly disagreed, and 8.6% were unsure (Figure 5).
315

8.6%2.9%
18.6% 20.0%
34.3%
15.7%
0.00%
5.00%
10.00%
15.00%
20.00%
25.00%
30.00%
35.00%
40.00%
Unsure StronglyDisagree
Disagree Neutral Agree StronglyAgree
Figure 5 Lack of capacity
4.6 Delays in obtaining certification and permits for green buildings in terms of statutory permits
Figure 6 shows that 25.4% of the sample agreed that delays in obtaining certification and permits for green buildings in terms of statutory permits impacts negatively on the growth of green building, and 15.5% strongly agreed. However, 22.5% were neutral, 15.5% disagreed, and 19.7% were unsure. A percentage of 1.4% was recorded for strongly agree.
19.7%
1.4%
15.5%22.5%
25.4%
15.5%
0.00%
5.00%
10.00%
15.00%
20.00%
25.00%
30.00%
Unsure StronglyDisagree
Disagree Neutral Agree StronglyAgree
Figure 6 Certification and permits for green buildings
The responses to the survey were subsequently ranked using a mean score (MS) ranging between 1.00 and 5.00 to rank the factors that impede the growth of green building in the industry (Table 1). It is notable that all the eight factors listed in Table 1 have MSs above the midpoint of 3.00, which indicates that in general the respondents can be deemed to agree with all the statements. Lack of incentives for promoting green building, which is ranked first with a MS of 4.86, may have the greatest negative impact on the growth of green building, followed by inadequate cost data for green buildings (4.49), inadequate information regarding the financial and economic benefits and opportunities of green buildings (4.44), inadequate cost data for greening existing buildings, (4.35), and a limited range of green products and materials (4.27). Given that the MSs of the aforementioned are > 4.20 ≤ 5.00, the concurrence is between agree to strongly agree / strongly agree. Cultural and social resistance with (4.17), lack of capacity (4.16), and delays in obtaining certification and permits for green buildings (3.79) have MSs > 3.40 ≤ 4.20, which indicates the concurrence is between neutral to agree / agree.
316

Table 1 Ranking of the factors impacting negatively on the growth of green building
Factor Mean SD Rank
Lack of incentives for promoting green building (e.g. financial and non-financial incentives) 4.86 1.16 1
Inadequate cost data for green buildings 4.49 1.36 2
Inadequate information regarding the financial and economic benefits and opportunities of green buildings
4.44 1.18 3
Inadequate cost data for greening existing buildings 4.35 1.44 4
Limited range of green products and materials 4.27 1.19 5 Cultural and social resistance 4.17 1.50 6 Lack of capacity 4.16 1.43 7 Delays in obtaining certification and permits for green buildings 3.79 1.69 8
4.7 Lack of incentives for promoting green building
The findings of this study confirmed that there are inadequate mechanisms in place for promoting green building in South Africa. More than half of the respondents agreed that there are a lack of incentives for promoting green building. This result confirms Ndihokubwayo, Crafford & Buys’ (2013) contention and it is consistent with that of Milne (2012) who asserts that the South African construction industry seems to be lagging behind in terms of the provision of incentives to developers who meet green ratings, and consultant team members who engage in green design practices on their projects and the lack of incentives for demonstrating best green practice. The provision of incentives will undoubtedly reduce the high up front cost for green projects. Arditi & Yasamis (1998) support this notion by asserting that incentive provisions are used in construction contracts to reduce contract costs, to minimise contract duration and to maintain acceptable levels in health and safety, productivity, technological progress, innovation, management efficiency, and quality of construction.
4.8 Inadequate cost data for green buildings
The responses indicated that inadequate cost data for green buildings is one of the major factors hampering the growth of green building. This view is supported by Cruywagen (2013), Milne (2012), and Kats & Capital (2003). The authors argue that there is still little published data regarding the actual costs and cost premiums for green buildings. This may imply that it is not always clear what the initial impact green buildings will have on construction costs. This finding may in part explain the resistance to green building that exists in the industry (Hoffman & Cowie, 2014), which may subsequently impact negatively on the growth of green building given that investors and developers are unlikely to change behaviour if information on the cost of green building is fragmented. This is corroborated by Nurick & Cattell (2013: 92) that the cost of implementing green building features is the main barrier to implementing green building. As a result, green building is perceived to be more expensive than conventional building making green building less competitive and attractive to investors.
4.9 Inadequate information regarding the financial and economic benefits and opportunities of green buildings
The study also revealed that there is inadequate information regarding the financial and economic benefits and opportunities of green buildings. This finding also ties in with findings from Milne (2012) who reported that while there seems to be consensus on the environmental benefits of green buildings, there is a lack of accurate and thorough financial and economic supporting information. According to Kats & Capital (2003), there is a consistent concern, both within and outside the built environment, over the lack of accurate and thorough financial and economic information regarding the benefits of green building. Naumann et al. (2011) argue that the benefits of green building projects are much more difficult to value since benefits are often assessed in purely qualitative terms, or quantified only in terms of the extent of green infrastructure protected or maintained.
4.10 The one-way analysis of variance (ANOVA) Test
The ANOVA test was performed to determine whether the perceptions concerning the first three factors impacting negatively on the growth of green building differ among construction participants. The test in Table 2 reveals no significant difference between construction participants’ perceptions for lack of incentives (p = 0.748), inadequate cost data for green buildings (p = 0.949), and inadequate information regarding the financial and economic benefits and opportunities of green buildings (p = 0.707). Therefore, it can be concluded that perceptions on the predominant factors impacting negatively on the growth of green building do not differ among construction participants.
317

Table 1 ANOVA Test
Factor Degrees of Freedom
F Sig
Lack of incentives for promoting green building (e.g. financial and non-financial incentives)
Between groups Within groups Total
22 47 69
0.766 0.748
Inadequate cost data for green buildings
Between groups Within groups Total
22 47 69
0.524 0.949
Inadequate information regarding the financial and economic benefits and opportunities of green buildings
Between groups Within groups Total
22 47 69
0.802 0.707
5. Conclusion and Recommendation
This paper examined some of the critical factors affecting green building implementation for the local construction industry. The study identified eight factors including; lack of incentives for promoting green building; inadequate cost data for green buildings; inadequate information regarding the financial and economic benefits and opportunities of green buildings and inadequate cost data for greening existing buildings. The others are limited range of green products and materials; cultural and social resistance; lack of capacity and delays in obtaining certification and permits for green buildings. The research findings reveal that all the factors have MSs above the midpoint of 3.00, which indicates that in general the respondents can be deemed to agree with all the statements. It is apparent from the research findings that the lack of incentives for promoting green building, inadequate cost data for green buildings, and inadequate information regarding the financial and economic benefits and opportunities of green buildings are the three major factors affecting the growth of green buildings. The ANOVA test was conducted to check if perceptions of respondents differ with regard to the major factors inhibiting the growth of green building. However, the test revealed no significant difference, implying that there is a consensus on the part of the respondents that the factors identified are indeed critical factors hampering the progress of green building. These impediments lead to a range of consequences that affect stakeholders’ (developers, client, consultants & contractors) understanding, values, behaviour, and attitudes toward green building. Based on the perceptions expressed in the responses to the research, the following measures are recommended to improve the implementation of green buildings in the local construction industry. The government needs to initiate a strategy by establishing various incentives schemes that will serve as a catalyst to enhance the growth of green building. The green building sector could be incentivised either through monetary or non-monetary incentives. There is a need to create a co-ordinated knowledge hub to document and provide the existing and emerging information on the true cost of going green, the benefits and performance of green building, market and environmental trends, as well as monitoring and evaluation data. This can significantly build up the industry confidence in expanding the market for green development. The results of this study are based on perceptions of built environment stakeholders in South Africa and may differ to some extent from respondents elsewhere in the world. This creates an opportunity for further research to obtain a wider perspective on the factors limiting the growth of green buildings globally.
7. References
Arditi, D. & Yasamis, F., 1998. Incentive / Disincentive Contracts: Perceptions of Owners and Contractors, Journal of Construction Engineering and Management, 124 (5), 361-373 Bernstein, H. & Mandyyck, J., 2013. World Green Building Trends, Smart Market Report. New York: McGraw-Hill International Edition. Barbour, P., 2005. An Assessment of South Africa’s Investment Incentive Regime with a Focus on the Manufacturing Sector, Economic and Statistics Analysis Unit (ESAU), ESAU Working Paper 14, Oversee Development Institute – London. Choi, C., 2009. Removing Market Barriers to Green Development: Principles and Action Projects to Promote Widespread Adoption of Green Development Practices. JOSRE, 1(1), 107-138. Cruywagen, J.H., 2013. The cost of “going green” – A case study, In: Proceedings of 6th Annual SACQSP Research Conference on “Green Vision 20/20”, Cape Town, South Africa, 20 – 21 June 2013, 79-91. Diyana, N.A. & Abidin, Z.N., 2013 Motivation and Expectation of Developers on Green Construction: A Conceptual View, International Scholarly and Scientific Research & Innovation, 7(4), 208-212. Djokoto, S., Dadzie, J. & Ohemeng-Ababio, E., 2014. Barriers to sustainable construction in the Ghanaian construction industry: consultants’ perspective, Journal of Sustainable Development, 7(1), 134-143. Du Plessis, C., Hassan, A.S., Laul, A., Shah, K., Adebayo, A., Ebohon, O.J., Irurah, D.K., Rwelamila, P.D., Agopyan, V., Arruda, M.P., John, V.M., Sjöstrom, C., Sara, L.M., Beyers, C., Chimbuya, S., Napier, M., Shafii, F., Sattler, M., Ofori, G. & Giyamah, O., 2002. Agenda 21 for Sustainable Construction in Developing Countries, CSIR Report BOU/E0204, CSIR, CIB & UNEP-IETC, Pretoria.
318
Garman, J., Bowyer, J., Bratkovich, S., Frank, M., Fernholz, K. & Howe, J., 2011. Building codes: barriers to green innovation. Minneapolis: Dovetail Partners, Inc. Gunnell, K., 2009. Green building in South Africa: emerging trends, Paper prepared for Department of Environmental Affairs and Tourism (DEAT) Directorate: Information Management, 1-21. Häkkinen, T. & Belloni, K., 2011. Barriers and drivers for sustainable building, Building Research & Information, 39(3), 239-255. Hankinson, M. & Breytenbach, A., 2012. Barriers that impact on the implementation of sustainable design, In: Proceedings of Cumulus conference, hosted by Aalto University School of Art and Design, Helsinki, Finland, 24-26 May 2012, 1-11. Hoffman, D.J. & Cowie, D., 2014. Property developers’ perspective on the current status of green building in South Africa, In: Proceedings of 8th Built Environment Conference, Durban, South Africa, 27-29 July 2014,1-12. Housing in Southern Africa (HISA), 2014. Going green, Eco housing, April 2014 edition, 1-44. International Labour Office (ILO), 2011. Greening of the building sector is held back by skill shortages, Research brief for Skills and occupational needs in green building, Geneva, 1-12. Jacobs, E., 2011. Sustainable Building awareness in the Free State Province, South Africa. In: Proceedings of 6th Built Environment Conference, Johannesburg, South Africa, 31 July–2 August 2011, 215-225. Kats, G., & Capital, E., 2003. The cost and financial benefits of green buildings: A report to California’s sustainable building task force, developed for the Sustainable Building Task Force, California, USA. Love, P.E.D., 2002. Auditing the indirect consequences of rework in construction: a case based approach, Managerial Auditing Journal, 17(3), 138–146. Milne, N., 2012. The Rands and Sense of Green Building: Re-visited. Building the Business case for Green Commercial buildings in South Africa. Green Building Council, Cape Town, South Africa. Ndihokubwayo, R., Crafford, G.J. & Buys, F., 2013. Consultant team members’ performance evaluation against incentives towards the achievement of green building principles, In: Proceedings of 6th Annual SACQSP Research Conference on “Green Vision 20/20”, Cape Town, South Africa, 20–21 June 2013, 21-31. Naumann, S., Davis, M., Kaphengst, T., Pieterse, M. & Rayment, M., 2011. Design, implementation and cost elements of Green Infrastructure projects. Final report to the European Commission, DG Environment, Ecologic institute and GHK Consulting, 1-64. Nelson, V.I., 2008. Sustainable Infrastructure Management, Coalition for Alternative Wastewater Treatment White Paper. Nurick, S.D. & Cattell, K.S., 2013. An investigation into the mechanisms driving large property owning organisations to implement green building features, In: Proceedings of 6th Annual SACQSP Research Conference on “Green Vision 20/20”, Cape Town, South Africa, 20–21 June 2013, 92-104. Ofori G., 2012. Developing the construction industry in Ghana: The case of a central agency, Contribution to the deliberations in Ghana on how to improve the performance of the construction industry, 1-19, Discussion Paper, Accra. Osec Business Network Switzerland, 2010. Sustainable Construction in Southern Africa, Market Review, 1-54. Peterson, T.M., 2007. Motivation: How to increase Project Team Performance, Project Management Journal, 38(4), 60-69. Rydin, Y., Amjad, U., Moore, S., Nye, M., & Withaker, M., 2006. Sustainable Construction and Planning, The Academic Report, Centre for Environmental Policy and Governance, The LSE SusCon Project, CEPG, London School of Economics, London, United Kingdom. Tam, V.W.Y., Hao J.L. & Zeng, S.X., 2012. What affects implementation of green buildings? An empirical study in Hong Kong, International Journal of Strategic Property Management, 16(2), 115-125. Williams, K., & Dair, C., 2007. What is stopping sustainable building in England? Barriers experienced by stakeholders in delivering sustainable developments. Sustainable Development, 15(3), 135-147.
319

320

INSTRUMENTS AND CAPACITY FOR SUSTAINABLE BUILT ENVIRONMENTS
Jeremy GIBBERD 1
1 CSIR / University of Pretoria, Email: [email protected]
Keywords: sustainable built environments, policy, instruments, capacity
Abstract
The lack of appropriate policy, regulations, standards, guidance and capacity has been identified as a major limiting factor in the development of more sustainable built environments. While work has been carried out by the United Nations Environmental Programme (UNEP) and other organizations there is limited guidance on the nature of instruments, such as policy and legislation, and the type of human capacity, such as technical skills, that has to be in place in order develop more sustainable built environments. This paper reviews literature in the field in order to understand the nature of instruments and capacity that are required to support sustainable built environments. Drawing on the review, a simple assessment framework is devised. This framework is tested by applying it to South Africa, and the results are analyzed and discussed. The paper finds that the assessment framework could be effective in identifying gaps within policy frameworks, and in human capacity within a national context. It also finds that the framework provides insight into the prioritization and sequencing of sustainable built environment instruments, such as policy, strategy, and standards. This may be valuable in countries with limited resources and capacity, or where improvements in built environment sustainability need to be achieved rapidly. However, the paper also notes that the framework developed is outline in nature and will have limited applicability in its current form. The paper, therefore, makes recommendations for the framework to be developed further.
1. Introduction
Appropriate, comprehensive and effective policy, guidance, regulations, standards and capacity has been identified as a major factor in the development of more sustainable built environments (Simmons, 2015; Melchert, 2007; Berke & Conroy, 2000; Huntzinger et al, 2007). In this paper, the term ‘instruments’ is used to refer to policy, strategy, standards, regulations and guidance by which more sustainable built environments are developed and supported within a national context. The term ‘capacity’, is used to refer to human capacity required to achieve sustainable built environments and includes technical capacity as well as appropriate awareness and understanding in specified role players. Together, instruments and capacity are important in national contexts as they are the ‘means’ by which more sustainable built environments are developed and maintained. In developed countries, instruments and capacity have been specifically developed to support the creation and management of more sustainable built environments (Melchert, 2007). In these environments, a comprehensive system of strategies, policies, legislation (such as building regulations), standards, rating and certification systems, financial incentive and penalty schemes, training, guidance and awareness programmes have been used to improve the sustainability of built environments. Established institutions and structures ensure capacity is in place and develop instruments to ensure that they support the achievement of international commitments and national objectives, such as carbon emission reduction targets. On an ongoing basis, processes are also in place to adapt capacity and update instruments to ensure that technological advances and legislative changes are reflected (Simmons, 2015). The picture in developing countries is often very different. Policies and instruments in developing countries related to the built environment are often out-of-date and may not reflect sustainable development goals and climate change objectives or current technological advances. A lack of institutional structures and limited capacity means that it is difficult to develop new instruments and update existing ones. As a result, many instruments, such as building regulations, are not effective at supporting the development of more sustainable built environments (Melchert, 2007). Mounting pressures in developing countries mean that effective and up-to-date instruments to support a more sustainable built environment are becoming increasingly necessary. Global populations have doubled since 1950 and most of this growth is taking place in developing countries. Over 60% of the world’s fastest growing larger cities (750,000-plus) are in developing countries (UNEP 2003). Twenty to thirty percent of this growth has occurred in informal settlements consisting of self-built and illegal housing (UNEP 2003). The scale of development in developing countries and the lack of guidance mean that it is important to understand the nature of instruments and the type of capacity required to support sustainable built environment (Melchert, 2007). This paper addresses this issue and aims to investigate how instruments and capacity can be developed to support sustainable built environments. It carries out a literature review to establish key principles required for the development of effective and appropriate sustainable built environment policy and instruments. This review is used to create a simple framework that can be used to carry out high-level national assessments of sustainable built environment instruments and capacity. To test
321

this framework, it is applied to South Africa. Results of these assessments are then analysed to evaluate the relevance and usefulness of the framework, and to reflect on the implications of findings developed using the tool. Finally, the paper draws conclusions and makes recommendations on the development of the framework.
2. Sustainable Built Environment Instruments and Capacity
A wide range of examples of sustainable built environment instruments and capacity now exist internationally. This section of the paper briefly reviews an example of one of these instruments as well as work by the United Nations Environmental Programme (UNEP) which provide guidance on the development of instruments and capacity. An instrument developed specifically to promote sustainable built environments is the UK’s ‘Strategy for Sustainable Construction’. This was developed by the UK government to provide policy direction to the construction industry (HM Government, 2008). It draws together a range of policy, legislation and initiatives to develop a comprehensive framework for addressing sustainability in construction. The strategy sets specific targets and allocates timelines and responsibility for their achievement. Targets are not only set for the government but also, for industry bodies. The mechanisms, or the ’means’ for implementing a more sustainable built environment can be summarized under the headings of procurement, design, innovation, people, and better regulation, and are listed below (HM Government, 2008). Procurement can be used to achieve sustainable built environments in the following ways.
Supporting the development of local products and services. Driving innovation and improved performance in buildings and building products.
Design can be used to achieve sustainable built environments in the following ways. Setting, and achieving, challenging sustainable performance targets for buildings. Developing integrated design approaches that ensure all aspects of the building work together to
achieve high levels sustainable performance in an effective and efficient manner. Taking into account, and responding to, local conditions and opportunities to ensure that built
environment developments enhance local sustainability. Incorporating targets related to international and national commitments on climate change and
achieving these. Incorporating targets related to local sustainable development objectives and achieving these. Drawing in key stakeholders in building development and management processes and ensuring that
they subscribe to, and support, sustainability performance objectives set for the building. Innovation can be used to achieve sustainable built environments in the following ways.
Developing new technology and approaches which enable improved sustainability performance. Using, and modifying, existing technologies and approaches to enhance sustainability performance. Drawing on indigenous knowledge and technology to develop responsive, locally appropriate
solutions which support high sustainability performance. People can be used to achieve sustainable built environments in the following ways:
Demanding more stringent sustainability performance in buildings. Developing understanding and skills to be able to plan and design more sustainable buildings. Developing understanding and skills which enable buildings to be operated in a more sustainable
manner. Modifying behaviour and working with building systems and processes to improve sustainability
performance. Better regulation can be used to achieve sustainable built environments in the following ways.
Setting minimum performance standards in the design and operation of buildings and making sure these are achieved.
Support the introduction of technologies and approaches which achieve increased sustainability performance.
Define performance targets and standards that buildings will be required to achieve over time (for instance over the next 3, 5 and 10 years) to enable industry to plan for these requirements.
The strategy, however, has a very specific focus on the UK and responds to local needs identified at the time it was developed. It, therefore, may not provide a suitable model that can be replicated and used in other countries. It is, therefore, useful to also review more generic guidance on the development of instruments and capacity for sustainable built environments. An example of work carried out in this area is guidance developed by the United Nations. The United Nations Environment Programme (UNEP) and the United Nation Human Settlements Programme (UN-HABITAT) have developed a wide range of guidance on sustainable built environments (UNEP, 2010; UNEP, 2011; UNEP SBCI, 2007; UNEP SBCI, 2009a; UNEP SBCI, 2009b; UN-HABITAT,
322

2012a). One of these guides, the ‘Assessment of Policy Instruments for Reducing Greenhouse Gas Emissions from Buildings’ aims to assess and compare policy instruments which can be used to improve energy efficiency in buildings and reduce related carbon emissions (UNEP SBCI, 2007). In particular, the assessment evaluates instruments in relation to the extent to which they are successful at improving energy efficiency and are cost effective. It also identifies key factors which must be in place to ensure that policies are effective. The assessment includes a number of findings and recommendations for the development of instruments to support energy efficiency and reduced carbon emissions. These include:
Building regulations and appliance standards are an effective and cost effective way of achieving improved energy efficiency and reduced carbon emissions. However sufficient resources must be allocated to implementation and enforcement. In addition, regulations must be updated regularly to track industry improvements.
Subsidized energy audits are an effective way of addressing existing buildings and identifying cost effective tailored ways of improving performance.
Procurement is an effective way of stimulating demand for energy efficient products. Government can play a valuable role model and take a lead in initiating programmes. Capacity development and access to finance is particularly important for energy efficiency
programmes in developing countries (UNEP SBCI, 2007) Another instrument developed by UNEP, is the ‘Sustainable Building Policies in Developing Countries (SPoD)’ guide. This aims to support the development of sustainable building and construction practices by assisting local and national government develop and implement policies that support sustainability in the built environment sector (UNEP, 2011). A number of tools are included in the guide such as the Quick-Scan Tool (QST) and the Handbook of Policy Building Blocks. The Quick Scan Tool is a web-based policy evaluation tool that can be used to analyze and improve national policies related to the built environment (UNEP, 2011a). The Handbook of Policy Building Blocks describes the sequencing of policies and other initiatives that are required to implement more sustainable built environments. The SPoD approach is based on the following principles:
Solutions and technologies to improve the building sector’s sustainability performance exist worldwide.
Sustainable buildings can deliver important environmental, social and economic benefits, including reduced energy, water and resource consumption, reduced operation costs, and improved living conditions.
A market shift towards sustainability creates new market and employment opportunities, and supports innovation and competitiveness.
Policy instruments can support this transition. Appropriate policies support increasing awareness and capacity for the uptake of sustainable solutions, encourage the use of appropriate financing mechanisms, and ensure that costs and savings are distributed along the life cycle of buildings.
Figure 1 Sustainable building policy building blocks (Boza-Kiss et al., 2013).
In terms of this paper, guidance on the policy building blocks within SPoD is of particular interest. The guide suggests that it is important to sequence and structure sustainable built environment initiatives and policy
323

correctly and defines ‘precursory building blocks’, ‘core building blocks’ and ‘subsequent building blocks’ (Boza-Kiss et al., 2013). These are described briefly below.
Precursory building blocks provide the initial stepping stones on which core policy and legislation can be built. This aims to ensure that that leadership in government and the private sector understand the requirement for more sustainable built environments and practice and develop road maps and strategies to achieve this.
Core building blocks drive the implementation of more sustainable built environments and consist of a range of measures including awareness and education, voluntary labeling of products, as well as mandatory standards and labels and incentives for enhanced sustainability performance.
Subsequent building blocks are the final stage and are designed to cement sustainable building practices. This is carried out through procurement and building regulations, certification and financial support in the form of tax relief and grants and access to carbon trading projects.
The structure and sequencing of these policy building blocks is illustrated in Figure 1, above.
3. Sustainable Development Goals and Environmental Limitations
An interesting aspect of the sustainable built environment strategy and the guidance reviewed is that it does not provide a detailed description of the type of sustainable built environments being targeted. This may be because this is now thought to be ‘common knowledge’, and implicitly taken to mean built environments that reduce negative environmental impacts and have social benefits such as creating jobs and providing healthier indoor environments. However vague descriptions and implicit references in the development of instruments and capacity may not be helpful as a diversity of interpretation may result and cohesion may not be achieved. A clear set of objectives and targets, therefore, are likely to be important in the development of instruments and capacity, as this provides direction and supports cohesion (Gibberd, 2014). While a range of suitable targets can be selected, in this paper, two sets of objectives are identified. These address social and economic developmental and environmental limitation goals (Rydin, 1998). Within these areas, objectives related to the Sustainable Development Goals developed by the United Nations, and global environmental limits or planetary boundaries that have been identified by earth scientists are considered. The Sustainable Development Goals (SDGs) are goals being developed by the United Nations to supersede the Millennium Development Goals which expire at the end of 2015 (United Nations, 2015). Sustainable Development Goals include: inclusive and equitable quality education and promote life-long learning opportunities for all, ensuring availability and sustainable management of water and sanitation for all, ensuring access to affordable, reliable, sustainable and modern energy for all, promoting sustained, inclusive and sustainable economic growth, full and productive employment, and decent work for all, building resilient infrastructure, promote inclusive and sustainable industrialisation, and foster innovation, making cities and human settlements inclusive, safe, resilient and sustainable and ensuring sustainable consumption and production patterns. UN member countries are expected to adopt the Sustainable Development Goals and use them to guide the development of national targets, policy and strategy. Work on planetary boundaries aims to understand the extent to which human development and lifestyles can be maintained in the light of environmental constraints. This work identifies, and quantifies, risks of abrupt shifts in Earth systems as a result of rapidly increasing human pressures. Seven key planetary boundaries, such as climate change, biosphere integrity, biogeochemical flows, land-system change and fresh water systems have been identified and their status charted (Steffen et al, 2015). This shows that planetary boundaries have been exceeded in the areas of climate change, biosphere integrity, biogeochemical flows, and land-system change and, as a result, there is an increasing risk of destabilization of earth systems (Steffen et al, 2015).
4. Principles for the Development of Sustainable Built Environment Instruments and Capacity
From the brief review of sustainable built environment instruments and capacity and sustainable development goals and environmental limitations, a number of principles can be derived. These are presented in table 1, which also provides examples, to illustrate the relevance of the principle.
Table 1 Principles for the development of sustainable built environment policy and instruments
Aspect Principle Examples
Environmental limitations and human development objectives
Sustainable built environment policy and instruments targets and objectives must align with ‘required by science’ targets related to environmental limitations and ‘international accepted human right-based’ human development objectives.
Global environmental limits have been defined by science in relation to aspects such as carbon emissions (Steffen et al, 2015,). Minimum human development achievement targets and sustainable development goals have also been defined by the United Nations (United Nations, 2015). Sustainable built environment instruments and capacity must respond to these targets and ensure that the built environment supports their achievement.
International and National Objectives
Sustainable built environment policy and instruments must be designed to support the achievement of international commitments as well as national development objectives related to sustainability.
Where countries have committed to international commitments such as United Nations carbon emission reduction targets or International Labour Organisation policies, these should be reflected in sustainable built environment instruments. Similarly, where countries have a national development plans with targets; this should be reflected in sustainable built environment instruments and capacity.
324

Procurement and financial incentives and penalties
Sustainable built environment policy and instruments must be explicitly supported through procurement, financial incentives and penalties.
Procurement policies can be used to support sustainable built environments by requiring that built environments rented and constructed for government achieve minimum sustainable standards. Financial incentives can be used to encourage the adoption of sustainable technologies.
Required minimum standards
Sustainable built environment policy and instruments must define clear minimum standards that must be achieved by law. A process should be in place to ensure these standards are raised over time.
Building regulations could define minimum standards in relation to, for instance, water and energy performance in all new buildings or buildings undergoing a major refurbishment. Minimum standards can be used to establish a base for improved performance in all areas of the built environment.
Institutions and structures
Sustainable built environment policy and instruments must be developed and updated by effective institutions and organisational structures.
The development of new standards for sustainable built environment can be supported through working groups that assist a national standards authority develops standards.
Modelling and guidance
Sustainable built environment policy and instruments must be explained and illustrated through guidance and modelling.
Comprehensive information about sustainable built environments can be made available on a website and simple downloadable guides be provided. A simple interactive online modelling tool can be used to illustrate environmental, social and economic impacts of different built environment options.
Research innovation, piloting
Sustainable built environment policy and instruments must be underpinned by rigorous research. It should encourage innovation and piloting as a means for informing mainstream practice.
Local research can be used to ensure instruments such as building regulations related to energy are appropriate and effective. Research and innovative approaches can be implemented in pilots where learning can inform the development guidance and other instruments (Simmons, 2015).
Awareness and technical capacity
Sustainable built environment policy and instruments must enable public awareness and ensure that there is adequate technical capacity for implementation.
Awareness about the need for, and value of, sustainable built environments can be reinforced through media and publicity. Technical capacity can be created through integrating sustainable building elements into built environment professional tertiary and continuous professional development (CPD) training.
Given the principles in Table 1, can these be used to shape sustainable built environment instruments and capacity? What are a minimum set of instruments and capacity required to achieve a sustainable built environment? While acknowledging the complexity of the field, an attempt can be made to outline a minimum set of instruments and capacity that may be used. This is presented in the next section and in Table 2.
5. A Minimum Set of Instruments and Capacity for Sustainable Built Environments
A set of built environment instruments and capacity required to support sustainable built environments has been developed and are presented in Table 2. The table lists the instrument or capacity required, their purpose, and provides the rationale for its inclusion.
Table 2 Sustainable built environment policies and instruments
Sustainable Built Environment
Instrument / Capacity
Purpose Rationale
A. Sustainable Built Environment Review
1. To review existing built environment policies, legislation and guidance.
2. To review existing institutions and organisational structure.
3. To review existing awareness and technical capacity in relation to sustainable built environments.
4. To review sustainable development goals and environmental limitation targets.
5. To review international sustainability commitments and national sustainable development targets and objectives that affect the built environment.
6. To use 1-5, to develop recommendations that will be addressed in the Sustainable Built Environment Strategy.
Sustainable built environments policy and instruments should respond to the local situation and reflect international and local objectives.
B. Sustainable Built Environment Policy
1. Sets out national commitments and process for achieving a sustainable built environment in broad terms.
2. To indicates clear support by key government departments and relevant ministers.
3. To set out the mechanisms and structures, that will be used to coordinate the implementation of the strategy.
A government policy which provides clear objectives and details institutional arrangements for implementation can be valuable in ensuring that different organisational structures work together. Endorsement of the policy by senior government officials and ministers also indicate strong intent and leadership by government.
C. Sustainable Built Environment Strategy
1. To draw on Review (A) to develop a strategy which coordinates and integrates actions that will support the development of a more sustainable built environment.
Sustainable built environments policy and instruments should be developed efficiently and in the right sequence. A strategy enables coordination and integration. A monitoring and
325

2. To set out clear sustainable built environment targets, timelines and responsibilities.
3. To ensure that adequate institutional structure, capacity and resources are in place to achieve required actions.
4. To include a monitoring and evaluation process that ensures implementation occurs.
evaluation process improves the chances of successful implementation.
D. Sustainable Built Environment Guidance
1. Provide guidance that defines sustainable built environments, describes why this is important and shows how this can be achieved.
2. Guidance can be provided through websites, publications, checklists and rating systems.
3. Guidance should be designed for specific role-players including government officials, built environment professionals, developers, building users and the general public in order to ensure each party contributes to the development of a more sustainable built environment.
The achievement of a more sustainable built environment requires the support of a wide range of role-players including developers, professionals, government officials and the general public. Clients, users and a public that understand the need for a more sustainable built environment are likely to demand more sustainable built environments and support sustainable features, such as recycling systems, where these are included.
E. Sustainable Built Environment Capacity
1. Ensure that skills and experience are in place to plan, design, construct and operate more sustainable built environments.
2. Ensure that awareness and knowledge existing in key built environment role-players in order to support the development of sustainable built environments.
Built environment professionals who understand climate change and sustainable development and have the skills to develop more sustainable built environments are necessary for the development and operation of more sustainable built environments.
F. Sustainable Built Environment Planning
1. Ensure that macro planning processes related to land use, urban development, transportation and town planning support sustainable built environments.
2. Ensure that detailed guidance such as land use plans, spatial development frameworks, Integrated Development Plans (IDPs) and town-planning schemes is in place and supports more sustainable built environments.
Sustainable macro planning and the development of more sustainable cities, urban areas and transportations systems will support the development of more sustainable urban environments.
G. Sustainable Built Environment Standards and Codes of Practice
1. Provide detailed technical definitions and requirements for aspects such as materials, equipment and processes, which promote sustainability.
2. Provide documentation that can be readily referenced in existing documentation such as design specifications and construction contracts.
Detailed technical definitions of quality and processes that can be readily referenced make it easy to integrate sustainability performance requirements into existing planning, design, construction and operational processes.
H. Sustainable Built Environment Legislation
1. Sets out compulsory minimum standards for sustainability in new buildings and the refurbishment of existing buildings.
2. Enables all new buildings and refurbishments to achieve minimum building standards.
3. Provides a means for enforcing minimum sustainability standards and improving these over time.
Requiring all new buildings and refurbishments to achieve minimum sustainability standards, for instance in relation to water and energy efficiency, is a highly effective way of beginning to create a more sustainable built environment. It also provides a simple cost effective way of ensuring that sustainability begins to be addressed by the building industry.
I. Sustainable Built Environmental Financial
1. To demonstrate government’s commitment to sustainable built environment by using its purchasing power to favour more sustainable products, technologies and processes.
2. Use financial incentives to promote more efficient equipment and products, locally produced products, more labour intensive processes and small local businesses, which is supportive of a more sustainable built environment.
Substantial and ongoing funding for more sustainable products and materials and processes provide a strong incentive for manufacturers and service providers to adopt and promote these in response to market opportunities. Preference for locally manufacture, more environmental friendly and labour intensive production can prompt manufactures to develop local production and adapt existing processes to support sustainability.
In turn, this table can be developed into a diagram to illustrate the relationship between sustainable built environment instruments and capacity and global and national sustainability objectives (Figure 2). Sustainable built environment instruments and capacity therefore aim to support global and national sustainability objectives and proposed sequence in which they may be implemented, starting with a policy and finishing with financial mechanisms.
326

Figure 2 Sustainable built environment policy and instruments (by author)
This outline framework can be tested by applying it to the case of South Africa. The framework can be structured as a simple table against which sustainable built environment instruments and capacity within a country can be evaluated. In this case, assessments are simple and only an indication of whether the instrument or capacity is in place is given along with some brief comments. This is shown in table 3.
Table 3 Outline assessment of sustainable built environment policy and instruments in South Africa
Sustainable Built Environment Policy and Instrument
In Place? Yes / No / Partially
Comments
A. Sustainable Built Environment Review Partially Some studies and reviews have been carried out that relate to this field, such as the Long Term Mitigation Scenarios (LTMS). There is however no single review that focusses solely on sustainable built environment policy and instruments (Department of Environment 2007).
B. Sustainable Built Environment Policy Partially A number of green building policies have been developed, by organisations such as Department of Public Works and the City of Tshwane. These policies however only address certain sectors (government buildings and building within the City of Tshwane) and therefore do not address the wider built environment.
C. Sustainable Built Environment Strategy Partially There is a National Framework for Sustainable Development (Department of the Environment 2008). This partially addresses sustainable built environment but is not comprehensive.
D. Sustainable Built Environment Guidance Partially A range of guidance has been developed by municipalities, green building rating councils and non-governmental organisations. Guidance does not necessary align with national sustainable development objectives or with environmental limitation targets.
E. Sustainable Built Environment Capacity Partially The extent to which university and continuous professional development (CPD) built environment courses address sustainability varies. Generally, there has been a focus on energy while other aspects, such as water efficiency and social sustainability objectives have not been addressed.
F. Sustainable Built Environment Planning Partially A number of environmental, transport and land use instruments address sustainability. These however do not comprehensively address sustainable development goals or environmental limitation targets.
G. Sustainable Built Environment Standards and Codes of Practice
Partially Built environment standards and codes of practice have been developed for energy in areas such as solar water heaters, lighting and energy audits. Standards however have not been developed for other aspects of the sustainable built environment such as water efficient systems.
H. Sustainable Built Environment Legislation Partially The building regulations have been updated and include a section that addresses energy. Other issues, such as water efficiency, however have not been addressed yet.
I. Sustainable Built Environmental Financial Partially Government procurement has been developed to promote sustainability in a number of areas. This includes preference for small emerging companies, local manufacture and for more labour intensive processes. Other sustainability aspects which could be used to support a more sustainable built environment are not included.
327

6. A National Sustainable Built Environment Instrument and Capacity Assessment Framework
The outline assessment of sustainable built environment instruments and capacity for South Africa indicates that the framework could be useful in identifying gaps which need to be addressed. In particular, it shows that it may be possible to improve the alignment of instruments and capacity with national and international objectives and commitments. It also indicates that instruments and capacity in South Africa tend to have a strong emphasis on energy and that other aspects such as water and materials, are not addressed in much detail. A review of the South African situation can be used to improve the assessment framework by developing sub-questions which can be used to improve alignment of instruments and capacity with international and national sustainable development goals and environmental limitation targets and ensure improved policy cohesion. In addition, questions can also be used to ascertain whether a comprehensive approach has been developed by checking whether the different scales and life-cycle stages of built environments have been addressed. This improved framework is presented in table 4.
Table 4 National sustainable built environment policy and capacity assessment framework
Sustainable Built Environment Instruments and Capacity Assessment
A. Sustainable
Built Environment
Review
1.Has a sustainable built environment review been undertaken? 2.Does this address global and national sustainable development goals and environmental limitation targets? 3.Does this include a review of the local built environment context, in terms of state, capacity and legislation? 4.Have the different scales of the built environment (large-scale to detailed) been addressed? 5.Has the full built environment lifecycle from planning to demolition been addressed?
B. Sustainable
Built Environment
Policy
1.Has a sustainable built environment policy been developed? 2.Does this align with recommendations of A. the Sustainable Built Environment Review? 3.Has the policy been endorsed by appropriate senior government officials, such as a minister? 4.Does the policy clearly identify the parties that are responsible for implementation and delineate how they will work together? 5.Does the policy provide clarity on institutional and resourcing arrangements?
C. Sustainable
Built Environment
Strategy
1. Has a sustainable built environment strategy been developed? 2.Does the strategy align with the recommendations of A. The Sustainable Built Environment Review? 3. Does the strategy provide clear overarching long-term goals and provide detailed actions required to achieve these goals? 4.Are all actions allocated to responsible parties, and have resources and timeframes for implementation been allocated? 5.Has overall responsibility for driving the strategy and undertaking monitoring and evaluation been allocated ?
D. Sustainable
Built Environment
Guidance
1.Has sustainable built environment guidance been developed? 2.Does the strategy align with the recommendations of A. The Sustainable Built Environment Review? 3.Has guidance been developed for all of the key role players including; government officials, developers, building owners, facilities managers, funders, built environment professionals, and building users? 4.Does guidance provide an clear indication of the consequences of different choices? Does it include modelling or projections showing the impact of particular choices? 5.Is the guidance updated regularly and easy to access?
E. Sustainable
Built Environment
Capacity
1.Has a sustainable built environment capacity been developed? 2.Does the strategy align with the recommendations of A. The Sustainable Built Environment Review? 3.Has sustainable built environment knowledge and skills been integrated into all built environment university courses? 4.Has sustainable built environment knowledge and skills been developed in built environment technical trade courses such as plumbing and for particular sustainable technologies such as solar water heating installation? 5.Are short sustainable built environment courses available that built environment professionals and technical personnel can use for continuous professional development and ongoing learning?
F. Sustainable
Built Environment
Planning
1.Have sustainable built environment planning instruments been developed and put in place? 2.Do the planning instruments align with the recommendations of A. The Sustainable Built Environment Review? 3.Is there an effective plan for ensuring that instruments are applied and updated? 4.Is planning based on effective research and modelling that investigates the consequences of different choices? 5.Is there a link between planning instruments and built environment training?
G. Standards and Codes of Practice
1.Have sustainable built environment standards and codes of practice been developed? 2.Do the standards and codes of practice align with the recommendations of A. The Sustainable Built Environment Review? 3.Has a plan for the development of key sustainable built environment standards and codes of practice been developed? 4.Have the relevant intuitions and bodies for the development been identified and is an efficient mechanism in place to develop standards and codes of practice? 5.Is there a link between standards and codes of practice development and built environment training?
H. Sustainable
Built Environment Legislation
1.Has a sustainable built environment legislation, such as building regulations, been developed? 2.Does the legislation align with the recommendations of A. The Sustainable Built Environment Review? 3.Do building regulations include minimum sustainable built environment standards for water, energy and materials? 4.Have building control officers been trained on the sustainability requirements of building regulations? 5.Is there a link between building legislation development and built environment training?
I. Sustainable
Built
1.Have sustainable built environment financial incentives and penalties been developed? 2.Do the financial incentives and penalties align with the recommendations of A. The Sustainable Built Environment Review? 3.Does government procurement policy and processes support sustainable built environments?
328

Environmental Financial
4.Are there financial incentives for more sustainable technologies and processes? 5.Are there financial penalties for less sustainable technologies and processes?
7. Discussion
A number of criticisms of the approach can be made. Firstly, the review indicated that innovation and indigenous knowledge should be included in instruments and capacity for sustainable built environments. The framework proposed in this paper does not advocate these aspects directly, leading to the possibility that opportunities in these are areas being missed. This could be addressed by ensuring that indigenous knowledge and skills are identified in sub-question 3 ‘Does this respond to the local built environment context?’. Similarly, it may be possible to address innovation within D. ‘Sustainable Built Environment Guidance’. Here, sub-questions could be developed in relation to research, piloting and innovation within the built environment, to ensure that this was considered. A second criticism of the approach is that even if appropriate instruments and capacity are developed, these may not be effective in addressing built environments in developing countries where growth of urban areas, such as informal housing and slums, has been rapid and uncontrolled. This is valid argument as the instruments and capacity proposed in this framework may not be able to influence this type of development. However over time, these developments will become established and can be upgraded for improved sustainability performance by drawing on the instruments proposed in this framework. In addition, it may be possible to use strong sustainable built environment planning instruments to ensure that uncontrolled development at least occurs in appropriate locations and that dangerous sites, such as flood plains, are avoided. A third criticism is that the framework is that it is too high level and not useful for undertaking detailed assessments. This is a limitation of the framework and needs to be addressed. A more detailed and comprehensive set of sub-questions could be used to improve the value of assessments. For instance, more detailed questions related to specific instruments, such as procurement policies and building regulations, would help ensure that assessments were more comprehensive. A fourth criticism is that while the approach refers to ‘sustainable development goals’ and ‘environmental limitations’ it does not show how these are effectively translated into appropriate sustainable built instruments and capacity. For instance, a sustainable development goal mentioned is ‘ensuring sustainable consumption and production patterns’, however the implications of this objective for the built environment is not explored. This criticism is fair as the paper does not analyse the built environmental implications of sustainability objectives, which would be highly complex exercise. Instead, it aims to provide a framework of built environment instruments and capacity through which the detailed actions required to achieve sustainability objectives can be implemented. The actual type and nature of detailed built environments actions required has to be determined in a separate exercise.
8. Conclusions and Recommendations
The findings in this paper are high level and outline and more detailed work is required. The approach however provides a useful initial framework in a field where there has been limited research. The application of the assessment framework suggests that it is useful for identifying sustainable built environment instrument and capacity gaps at a national level. It may also be used to identify, prioritise and sequence the development of instruments and capacity in a way that ensures that an effective and comprehensive system for sustainable built environments is put in place. The following recommendations aim to address the criticisms made in the discussion of the paper and indicate how work presented in the paper could be developed further.
Further research on the role of research, piloting and innovation on sustainable built environments should be undertaken. This should define the type of research developed and determine how this influences instruments and capacity for sustainable built environments.
Specific investigation of uncontrolled informal urban development is required. This should determine what type of instrument and capacity will be effective in developing more sustainable built environments in these types of situations.
A generic set of sustainable built environment instruments and capacity ‘templates’ should be developed. After a testing and refinement process, these instrument and capacity templates could be made available as guidance for countries wishing to improve the sustainability of their built environments.
Detailed analysis of the Sustainable Development Goals and the work on planetary boundaries is required in order to understand the implications of these for built environments. This work should ensure that implications are translated into specific actions and requirements that can be addressed in built environment and construction processes.
9. References
Boza-Kiss, B., Moles-Grueso, S., and Petrichenko, K. 2013. Handbook of Sustainable Building Policies. Composing Building Blocks, Eds: Tatiana de Feraudy, Tess Cieux, United Nations Environment Programme, accessed from http://www.unep.org/sustainablebuildingpolicies. Department of Environment, 2007. Long Term Mitigation Scenarios: Scenario Document, Department of Environment Affairs and Tourism, Pretoria.
329

Department of Environment, 2008. A National Framework for Sustainable Development in South Africa, Department of Environment Affairs and Tourism, Pretoria. Gibberd, J., 2014. Measuring capability for sustainability: Built Environment Sustainability Tool, Building Research and Innovation, Volume: 43, pp. 49-61. HM Government, 2008. Strategy for Sustainable Construction, accessed from http://www.tinyurl.com/yua68g Huntzinger, D., Huchins, M., Gierke, J. & Sutherland, J. 2007. Enabling Sustainable Thinking in Undergraduate Engineering Education, Int. J. Engng Ed. Vol. 23, No. 2. Melchert, L. 2007. The Dutch sustainable building policy: A model for developing countries? Building and Environment 42, pp. 893–901. Berke R. & Conroy, M. 2000. Are We Planning for Sustainable Development? Journal of the American Planning Association, 66:1, pp. 21-33. Rydin, Y., 1998. Land Use Planning and Environmental Capacity: Reassessing the Use of Regulatory Policy Tools to Achieve Sustainable Development. Journal of Environmental Planning and Management, 41(6), pp 749-765. Simmons, R. 2015. Constraints on evidence-based policy: insights from government practices, Building Research & Information, 43:4, pp. 407-419 Steffen, W., Richardson, K., Rockström, J., Cornell, S. E., Fetzer, I., Bennett, E. M. & Sörlin, S. 2015. Planetary boundaries: Guiding human development on a changing planet. Science, 347(6223), 1259855. UNEP, 2010. UNEP: Ecosystem Management Policy Series - Policy Brief 2: The Role of Ecosystems in Developing a Sustainable ‘Green Economy’ Available at: http://www.unep.org/ecosystemmanagement/Portals/7/Documents/policy%20series%202%20-%20small.pdf (Accessed: 10 February 2013). UNEP, 2011. Sustainable Building Policies in Developing Countries (SPOD): Promoting sustainable building and construction practices, Paris: UNEP. UNEP, 2011a. The Quick Scan Tool, accessed from http://sustainable-buildings-policy-assessment-tools.net/home.aspx/index/En UNEP SBCI, 2007. Assessment of policy instruments for reducing greenhouse gas emissions from buildings: Report for the UNEP – Sustainable Buildings and Construction Initiative, Budapest: Central European University UNEP SBCI, 2009a. Buildings and climate change: Summary for decision-makers. Paris: UNEP DTIE. UNEP SBCI, 2009b. Greenhouse Gas Emission Baselines and Reduction Potentials from Buildings in South Africa: A Discussion Document. Paris: UNEP DTIE. United Nations, 2015. Sustainable Development Goals, accessed from https://sustainabledevelopment.un.org/topics/sustainabledevelopmentgoals
330

SMART FUEL CHOICES IN URBAN HOUSEHOLDS: STORIES FROM WOMEN IN SOSHANGUVE
Tebogo SOLE
1
Claire WAGNER 2 1 Department of Psychology, University of Pretoria, Email: [email protected] 2 Department of Psychology, University of Pretoria, Email: [email protected] Keywords: Household energy managers, household fuel choices, multiple fuels, narrative analysis, new energy solutions
Abstract Due to a number of complex interactions between economic, social and cultural factors some households consume a portfolio of energy sources such as coal, biomass fuel, paraffin, liquid petroleum gas (LPG) and solar power at different points. This phenomenon has been shown to characterise these households irrespective of their electrification status. Women are regarded as household energy managers because they perform most of the household duties which require the use of energy, yet research on women’s fuel choices has not received much attention in the literature. The aim of this paper is to present women’s stories on how they utilise multiple fuels within the household and how they allocate these fuels to various household activities. Nine women were purposefully selected from the Soshanguve area in the City of Tshwane. Data was collected through individual in-depth interviews and narrative analysis was used to generate findings in the form of themes which emerged from the stories. Five themes about women’s decision-making with regards to using multiple fuels in their households were identified: the availability of a choice of fuels in the vicinity, various challenges with using electricity (including free basic electricity), strategies for managing the use of household fuel, the safety of using various fuels, and the choice of fuel for cooking certain foods. The participants’ stories portray how household fuel choices can contribute towards changing residential behaviour related to energy production and consumption. Also, they show how women could employ local knowledge in the design of new energy solutions.
1. Introduction
Research indicates that residential energy use plays an important role in achieving greater sustainable development especially when focusing on the provision of adequate, reliable and affordable energy. This has created interest amongst researchers to explore various dimensions of household energy use in order to design strategies to provide secure access to modern energy services (Kowsari & Zarriffi, 2011). Multiple fuel usage has become a norm due to households consuming a portfolio of energy sources at different points (Heltberg, 2005). Despite the significant investment in understanding multiple fuel transition patterns in households through the use of various economic models, there is still a neglected question pertaining to reasons why households might prefer to make choices to utilise multiple fuels. Hence the current study is based on the energy transition model which attends to various reasons shaping the environment in which households make their decisions on fuel use including household income, family size, cultural preferences, taste, dependability of supply (fuel availability), cooking and consumption habit (Mekonnen & Kohlin, 2009). There are other factors, excluding household income, that contribute to understanding multiple energy fuel use in households. A review of the literature has indicated that the majority of studies have used quantitative methods (mostly surveys) to generate findings about household fuel choice patterns in urban areas (Brouwer & Falcao, 2004; Campbell et al., 2003; Davis, 1998; Department of Mineral Resources (DMR), 2012; Heltberg, 2004; Kerekezi & Majoro, 2002; Martins, 2005; Mekonnen & Kohlin, 2009; Rao & Reddy, 2007). These studies provide valuable information; however, there is still a need for more in-depth analysis. Furthermore, there is a need to study women in particular because they are the main consumers of household energy in developing and industrial countries. They not only influence or make family purchases related to energy (Ceceiski, 2000, 2002; Farhar, 1998), but they take critical decisions about fuel substitution based on their fuel preferences and budget constraints. Therefore, this study specifically focused on women. Through their shared stories, women can reveal their everyday experiences and this would enable a better understanding of household fuel choices and fuel stacking practices. Although stories do not provide a transparent account through which we learn truths, storytelling stays closer to actual life events than methods that elicit explanations (Kirkman, 2002). Within the context of the above, the objective of this study is to present women’s stories on how they utilise multiple fuels within the household and how they allocate these fuels to various household activities. The study used a narrative inquiry and purposefully selected nine women from Soshanguve. Data was collected through individual in-depth interviews and narrative analysis was used to generate findings in the form of themes which emerged from the stories. The study area (Soshanguve) is situated about 25 km north of Pretoria in Gauteng. The population of Soshanguve was projected in 2006 to stand at 509, 094 people with a fairly balanced gender distribution of 51.1% males and 49.8% females. Most of the residents in this area are black and 40% of the population is younger than 20 years (Prinsloo, 2008). Sixty one percent of the total
331

population lives in formal houses (Prinsloo, 2008). The formal areas have standard services like water, electricity, sewage systems and tarred roads while the informal areas only have basic services (Mjoli-Mncube, 1998). Infrastructure development is said to be good with 53.1% of the population having access to telephone connections in their homes, 96.9% sanitation and 90.2% having electricity (GPS Architects, see work in Nkemngu, 2012). However, challenges faced by residents are closely linked to their vulnerabilities such as crime, environmental hazards including fire and flood, and general conditions associated by poverty (Weakley, 2012). In the researcher’s observation many households in Soshanguve make use of various energy sources (e.g. electricity, solar power, wood, paraffin and liquid petroleum gas) in order to meet their basic needs. The latter context was deemed ideal to study fuel choices and multiple fuel use. People who stand to benefit from the findings of this study are those interested in residential behaviour related to energy production and consumption, also those who have the desire to either develop or design new energy solutions which can contribute towards sustainability of energy in the urban residential sector.
2. Understanding residential energy use in the context of South Africa
Residential energy use represents about 35% of global energy use (Daioglou et al., 2012). Energy use in this context can play an important role in achieving greater sustainable development. Researchers have been exploring various dimensions of household energy use in order to design strategies to provide secure access to modern energy services (Kowsari & Zarriffi, 2011). Hence the provision of adequate, reliable and affordable energy has been considered a cornerstone of development. Multiple fuel use is the choice to use a combination of traditional solid fuels (e.g. wood) and modern non-solid fuels (e.g. paraffin); this concept has also been termed fuel stacking (Heltberg, 2005). Multiple fuel usage has become a norm and remains common in developed and developing countries worldwide, both within industrial and residential sectors, and among richer and poorer households (Winkler, 2006). Therefore, the promotion of modern fuels may not necessarily displace traditional fuels (Heltberg, 2005). Since the democratic government of South Africa assumed office in 1994, it was faced with a myriad of infrastructural and service delivery backlogs. The apartheid government deliberately neglected provision of basic services to black people, including electricity (Madubansi & Shackleton, 2007). This resulted in paraffin, gas and wood serving as the main source of domestic energy in the country well into the 20th century. Whilst the rest of the developing world continues to be primarily dependent on wood for fuel (Madubansi & Shackleton, 2007), South Africa’s situation cannot be viewed in the same way, given the efforts and funds that have been injected into infrastructure development since 1994. According to the Integrated National Electrification Programme 87% of households in South Africa are currently electrified (DMR, 2012). Historically, in South Africa energy demand has been dominated by heavy industry and mining sectors. These energy intensive industries have become an important cornerstone of the economy (DMR, 2012). South African consumers came to benefit from some of the most inexpensive electricity in the world. This simply means electricity prices have been low and have not kept up with inflation (DMR, 2012). Winkler (2006) predicted that due to a lack of knowledge about the market structure and the absence of specific data, the country’s low energy price conceals inefficient energy use and accelerates national reserve depletion. Low energy costs also have the effect of retarding the development of new energy sources, thus limiting the diversity of the fuel mix, its associated supply security, and possible efficiency improvements (Winkler, 2006). South Africa relies mostly on coal to generate electricity. Although coal is not a clean form of energy the country continues to invest in it (evidenced by the construction of the new Kusile and Medupi coal-fired power stations). In producing electricity, the increased extraction and transformation processing have led to significant increases in pollution which damages the environment through carbon emissions. Eskom’s (the country’s primary supplier for electricity) existing fleet is aging, and some stations will need to be de-commissioned in the 2020s requiring new capacity to replace them (Eskom Factor Report, 2011). Eskom recently announced that they plan on providing maintenance for their existing power stations that will result in unplanned power outages. This means that the utility will struggle to keep South Africa powered up (Mantshantsha, 2014). The pricing of electricity has become a critical topic in the national dialogue (DMR, 2012). The National Electricity Regulator of South Africa (NERSA) announced that the price of electricity will increase 8% each year for the next five years (from 2013-2018). The approved tariff increase allows Eskom revenue of R906.6-billion between 2013 and 2018. This means that many residents and businesses will pay a higher rate for electricity as they purchase electricity from local municipalities who in turn purchase from Eskom. Studies conducted on household fuel choice and fuel stacking practices are based on two energy models. First, the energy ladder theory which focuses on the empirical findings on the correlation between household income and fuel switching. The energy ladder model predicts that households switch from the use of traditional biomass fuels because of economic growth which is associated with urbanization and industrialization (Kowsari & Zarriffi, 2011). The energy ladder model stipulates that households move from using primitive fuels (i.e. firewood and animal waste), to transition fuels (i.e. coal and kerosene) and end up using advanced fuels (i.e. electricity and LPG) because of the increase in their socio-economic status. The theory provides valuable insight regarding the significance of income acting as a foundation or a starting point towards understanding the complexity of household fuel choices. However, the cause and effect relationship have proved difficult to establish (Elias & Victor, 2005). It is also suggested that the linkages between fuel choice and income level are rarely as strong as assumed by the energy ladder model. The theory provides only a limited view of reality in actual households (Masera et al., 2000). Fuel choice is not determined purely by economic factors. There is a need to look beyond cost factors to understand household energy choice patterns.
332

The second model, called the energy transition argues that household income is not the determining factor in household’s decision making to fuel switch, but there are other factors as well that should be taken into consideration such as availability/accessibility, family size, high costs of electrical appliances, increase security supply, minimizing risk strategy and occupation of the head of the household. The latter factors may affect the willingness of households to switch from the traditional bio-fuels to commercial alternatives. Transition theory believes that multiple energy sources are employed in complex ways, each for specific purposes. Modern fuel uptake should be viewed as complementing the traditional fuel, rather than abandoning them altogether (Hiemstra-van der Horst & Hovorka, 2008). The energy transition model advocates that households do not necessarily switch from one fuel to another, but they prefer using a combination of primitive fuels, transition fuels and advanced fuels for varying reasons. Therefore, traditional fuels are not abandoned but they are used to complement advanced fuels. . Households tend to choose a combination of high-cost and low-cost fuels, depending on their budgets, preferences, and needs (DMR, 2012; Farsi et al., 2007; Heltberg, 2005; van der Kroon et al., 2013). Culture and traditions also play a role in constraining a complete transition to modern fuels. The potential contribution made by the transition model was that households do not switch to cleaner fuels as their income rises, but rather increase the number of fuels used (Mekonnen & Kohlin, 2009). However little attention has been devoted to the decision context, a neglected question pertain to reasons why households might prefer to make choices other than those predicted by income alone (Farsi et al., 2007). It is for this reason that the current study works from the transition model and seeks to explore various reasons shaping the environment in which households make their decisions. This is because multiple fuel use results from a number of complex interactions between economic, social and cultural explanations (Masera et al., 2000). Recent research on women’s fuel choice in urban areas (Mekonnen & Kohlin, 2009; Rao & Reddy, 2007) suggests that households headed by women are either more likely to choose traditional fuels over modern fuels or vice versa. The studies cited earlier (conducted in a survey format) clearly indicate that women make decisions on fuel choices and use a variety of fuels in their households. These studies provide valuable information regarding women’s fuel choice, however, there is still a need for a deeper, holistic understanding of women’s explanations for their fuel choice and fuel stacking practices in urban households. Literature has yet to tap into such a perspective.
3. Research Methodology
3.1 Research Design
A qualitative methodology was used for the purpose of this study. This approach provides an in-depth understanding of people’s experiences. It occurs in a natural setting, enabling the researcher to acquire rich and detailed data (Willig, 2008). The objective of a qualitative methodology is to describe and possibly explain events and experiences from participants’ viewpoint, but never to predict (Williams, 2007). Therefore both participants’ (and researcher’s) interpretation of events itself contributed to this process (Willig, 2008). The particular qualitative methodology is a narrative inquiry. Narrative inquiry denotes the study of stories themselves and the use of the story to capture phenomena overlooked or only partly apprehended by science. Narrative inquiry is a way of understanding and inquiring into experience through collaboration between researcher and participants, over time and in social interaction with milieus (Clandinin & Connelly, 2000). The method consists of three commonplaces, namely: I Temporality It entails that “events under study are in temporal transition” (Connelly & Clandinin, 2006, p.479). In the quest of understanding the nature of human experience, narrative researchers need to think of events as happening over time; each event or thing has a past, present as it appears to us, and implied future (Clandinin, 2007). Temporality is “the notion of continuity of experience; meaning every experience both takes up something from the present moment and carries it into future experiences” (Clandinin, 2007, p. 69). II Sociality Narrative inquirers attend to both personal conditions and, simultaneously, to the social conditions. People are always in interaction with their situations in any experience. Personal conditions for the purpose of the study refer to “feelings, hopes, desires, aesthetic reactions and moral dispositions” (Connelly & Clandinin, 2006, p.480) of the inquirer and the participants. Social conditions in this study refer to the environment, the conditions under which people’s experiences and events are unfolding. After all, describing the way people go about making sense of their experience lies within various contexts. III Place Place is “the specific concrete, physical and topological boundaries of place or sequences of places where the inquiry and events take place” (Connelly & Clandinin, 2006, p.480). This commonplace draws attention to the centrality of place. For narrative inquirers, the specificity of location is important. In addition, the quality of place and the impact of places on lived and told experiences are essential (Clandinin, 2007, p.70). These commonplaces specify dimensions of an inquiry and serve as a conceptual framework. Commonplaces are our check points and direct one’s attention in conducting a narrative inquiry. Inquirers are able to study the complexity of people’s lived experiences. Therefore attending to experience through inquiry into all three commonplaces is, in part, what distinguishes narrative inquiry from other methodologies (Connelly & Clandinin, 2006). Through the use of narratives, the researcher was able to capture women’s explanations for their fuel choices and fuel stacking practices in urban households. Hence their narratives became an effective and powerful method of transferring and sharing such knowledge. Hiemstra-van der
333

Horst and Hovorka (2008) argued that multiple energy sources are employed in complex ways and each for specific purposes. Therefore the researcher aimed to uncover other forms of explanations which are difficult to incorporate in quantitative methods or explanations which are not quantifiable (Davis, 1998). Understanding how women make choices to utilise multiple fuels and how they allocate multiple fuels to various household activities was crucial for this study.
3.2 Sampling
A purposive sampling method was used to select a sample for this study. This method entails that selection into the study requires a specific predefined group (target sample) that will meet the criteria determined by the research study (Newig, 2011). The criteria for selection included the following:
That participants identified themselves as female. Participants were 18 years and older. Participants lived in a household that used two or more energy fuels. So, multiple fuel use in this
context was a deliberate choice, it was used in parallel and not as a back-up plan. The dwelling type was a brick house. Most brick houses encompass basic components of what is
called a passive solar design. A passive solar design is a type of a brick house that has a high thermal mass, which makes it capable to store heat during the day and release this heat slowly at night. Therefore brick houses of such design achieve thermal comfort with minimal conventional energy input. Some of the basic components of a passive solar design include the orientation of the house, optimizing the use of direct natural sunlight and utilizing thermally efficient building materials. The researcher was interested in using these types of brick houses as they are said to be energy efficient (Klunne, 2002).
The electricity supply within each respective dwelling was legal and supplied by the municipality of the area.
Households used prepaid electricity. Households using prepaid electricity are provided with the opportunity to monitor their electricity usage on a daily basis as they buy electricity as needed and do not have to wait for the municipality to inform them about their electricity usage at the end of the month.
The household consisted of two or more permanent residing members (excluding the participant, and this related to a spouse, a partner, children or relatives).
A sample of nine participants was included in the study. According to Rietchie et al. (2003), a small qualitative research project consists of not more than 50 participants in the sample. Hence, the chosen sample size was not too big to prohibit the researcher from extracting thick, rich data; nor was it too small to achieve data saturation (Collins & Onwuegbuzie, 2007).
3.3 Data Collection Strategies/Procedures
The researcher approached participants by going door-to-door, explained the purpose of the study to them and asked them to participate in the study. Once permission was granted by the participant a face-to-face interview took place at the participant’s home. Through the use of an open-ended interview discussion guide, it was possible to obtain women’s stories about their fuel choices and fuel stacking practices. In addition, socio-demographic data (such as age, employment status, type of dwelling, number of household occupants and the types of fuels utilised in the household) were collected during the interview session. The interviews were conducted in the participants’ preferred language (English, Sotho and Nguni languages spoken in the area and languages that the researcher was fluent in). The interviews lasted for a maximum of 60 minutes. All interviews were tape-recorded to have accurate details of the participants’ responses (Opdenakker, 2006). The interviews were transcribed verbatim and translated into English. The purpose of translating the interview transcripts was to create uniformity and allow a wide audience to read and understand the material presented.
3.4 Data Analysis
The researcher used narrative analysis to obtain the main narrative account and to convey detail and tenor of the stories (Smith, 2003). According to Birch (2011), narrative analysis also focuses on the sequence of stories, the structure of the speech a narrator selects, the audience, the local context that generated the narrative and the complexities of transcription. Hence, narrative analysis was used as a strategy to recognize the extent to which stories told by participants provided insights on their everyday fuel use practices. Analysis of data was divided into three phases: firstly, a basic description of the socio-demographic information of the sample, secondly, a short descriptive summary of all the narratives and the key features such as the beginning (past), the middle (present) and the end (future). In generating the main issues (in the form of themes), a coding frame similar to that of thematic analysis was used. The first four steps from the six steps Braun and Clarke (2006) proposed were used:
Step 1. Familiarizing yourself with your data: transcribing data (if necessary), reading and re-reading the data, noting down initial ideas.
Step 2. Generating initial codes: Coding interesting features of the data in a systematic fashion across the entire data set, collating data relevant to each code.
Step 3. Searching for themes: Collating codes into potential themes, gathering all data relevant to each potential theme.
Step 4. Reviewing themes: Checking if the themes work in relation to the coded extracts and the entire data set, generating a thematic ‘map’ of the analysis.
334

Thirdly is the interpretative phase which connects the narrative with the broader theoretical literature in order to interpret the story, meaning it goes beyond the descriptive phase to develop the interpretation.
4. Findings and Discussion
4.1 Demographic Data
The study consisted of nine female participants who used various types of fuels in their households. These fuels which included amongst others wood, solar geyser, paraffin, Liquid Gas Petroleum (LPG), electricity and coal. All participants used electricity. The most commonly used fuels (excluding electricity) by the participants was paraffin and wood. The least used fuels were the solar geyser and coal. The minimum age for participants was 32 years and the maximum was 69 years. Five of the nine participants were employed either on a full- time or part-time bases while four out of nine were unemployed. Regarding the participants’ highest level of education, only four participants obtained a tertiary qualification.
4.2 Core Narratives
Overall, there are five common or core narratives that emerged from the study. Three of the narratives address how women utilise multiple fuels in their households: the availability of fuels in their vicinity, challenges of using electricity and the safety of using various fuels. Two of the narratives address the allocation of various fuels to household activities: the strategies for managing the use of household fuel and the choice of fuel for cooking certain foods, in this case traditional foods. Each of these core narratives (stories) will specifically address what happened in the participants’ pasts, how that lead to what they are doing presently and what the future holds.
4.2.1 Availability of multiple fuels The participants mentioned using various fuels like coal, electricity, LPG, paraffin, solar and wood. In the past they had to travel for distances to obtain some of these fuels; hence not all fuels were in the near vicinity. Skills which were learned from using multiple fuels in the past are now transferred into the present household fuel decision making. Today, various fuels are easily accessible from the local spaza/tuck shops, garages and at the industrial side (were gas is refilled). Wood fuel is freely available in the yard or the area in which the participants live and is therefore not purchased. Typically, participants would trim or chop the trees at their households, break them into pieces and leave them to dry in the sun. Electricity was described to be fast, ever ready, convenient and forming part of today’s life. Using multiple fuels in this context is about “your roots and where you come from”. Therefore ‘...it’s a way of practicing old ways of doing things”. It is also about conserving the cultural heritage: “eh you know I am an African woman, African girl and I am not ashamed…I am where I am now because of my culture” and that is why... I am saying you cannot remove that rural child in me”. Hence, participants are satisfied with having various fuels available in the area and they are likely to continue with this practice.
4.2.2 Challenges of using electricity Electricity usage was introduced to a number of participants when they moved to the Soshanguve area because it was connected to the electricity grid, unlike the areas they came from. The quantity of units they received when they first moved to Soshanguve was enough to sustain their household needs for the month. Electricity was considered to be reasonable and cheaper. Currently, there are a number of challenges regarding the use of electricity which the participants identified. Firstly, the demand of electricity is too much due to heavy usage, hence this results in power outages. Secondly, electricity finishes quickly due to units being minimised, “...it is not the same as the past and it does not last when used on its own”. Thirdly, electricity will not last when used to cook foods which require time to cook. When cooking using an electric stove, it is necessary to constantly check the meter, be conscious about cooking time and end up removing food from the stove even when it’s not cooked properly (to satisfaction). Lastly, electricity is expensive and one of the participants said that she is “running away from using it”. This is because household money is used up to pay expensive electricity bills and one cannot save money. Using electricity is said to be strenuous especially for the unemployed. Houses can even sometimes find themselves in the dark without electricity. The lack of affordability for purchasing electricity continues to be problematic, money is not enough and many households have to adjust their budgets to accommodate electricity increases. It is for that reason that most of the participants continue to use other fuels in their households to save electricity. Multiple fuel use is a coping mechanism for all the challenges listed earlier, in particular, the price/cost of electricity, minimised electricity units and the power outages. The participants suggested that the government can assist by reducing the rent payments, increasing the electricity units and also allowing them as consumers to purchase electricity directly from Eskom as it was said to be cheaper compared to buying from the municipality.
4.2.4 Safety of using various fuels In the past, a number of participants’ households used mostly traditional fuels such as coal, wood, paraffin and cow dung. There were stories regarding the use of mbaula (brazier) inside the household, like that of the smoke killing one’s children once inhaled. One of the participants was a victim of inhaling the smoke when she was asleep with the mbaula inside the house, however she survived. From that incident, her household never used the mbaula again in the house. Today both traditional fuels and modern fuels (i.e. electricity, gas and solar) are used in combination. Participants are knowledgeable about the safety of using various fuels.
335

For example, when using paraffin stove inside the house, they open windows. However, the paraffin stove was reported to be used mostly outside the house because of the smell it leaves in the house. Furthermore, one of the participants mentioned that “smoke from the paraffin stove used in the house will cause asthma”. There are also stories currently going around about gas fuel being dangerous and explosive. Therefore, participants using gas fuel indicated that they always have that in mind (the potential danger of gas fuel). Safety precautionary measures adopted by the participants include amongst others, heating either the paraffin stove or wood outside and once the smoke is finished, it is taken inside the house. Next, when using the gas stove, participants make sure that the gas does not leak and that it is closed tightly. The latter indicates ways in which various fuels are used carefully within the household. The use of fossil fuels in the household environment can be dangerous, however the participants indicated that they are educated on various safety measures they can utilise to minimise the potential hazards. It was not clear where they received this information from. Therefore understanding good practices regarding fuel safety measures will see many households in this context utilising such fuels in the near future.
4.2.3 Strategies for managing use of household fuel Managing household fuel use in the past meant that some of the participants’ mothers had to use other fuels (those that they do not purchase, like wood and cow dung) in order to save fuels which they had to purchase or fuels which were temporarily unavailable like coal, paraffin and in some instances electricity. Coal stoves were used in the house for heating, especially in winter. Presently, various fuels (except for electricity) are used to cook foods which require time to cook and to boil water. Electricity is only used to cook lighter meals which do not require much time to cook, for lighting and for appliances (i.e. television). For heating purposes, blankets and water bottles are mostly used in winter by the participants to warm up themselves. In heating up the water for bathing purposes, participants mentioned using direct sunlight, solar geysers and coal stoves. Another strategy used by the participants relates to informing or encouraging other household members to use multiple fuels. This includes “...educating children to save electricity and to use it wisely”. Learning in this context takes place through observation and by practically engaging others to use such fuels themselves. Using various strategies to save energy creates a better living situation in the household. The participants are able to actively manage the household fuel consumption. As such, the participants stated that they will continue educating the future generation on such practices. One of the participants said she is in the process of installing the fire place (which will use wood fuel) and to build a coal stove outside the house. The fire place together with the coal stove will be used only in winter for heating. Some of the participants mentioned that the government can assist also with installing solar geysers.
4.2.5 The choice of fuel for cooking certain foods Cooking traditional foods requires time to prepare; hence the participants opted to use LPG, paraffin and wood. Wood fuel was mostly preferred to cook traditional foods such as cow feet, beans, samp and tripe. Food prepared in that way is said to be “...fully cooked/ well prepared, tastier, enjoyable, superb and cooked to perfection”. Cooking traditional foods requires low heat to cook; hence such foods cook slowly and do not require constant checking. A three legged pot “drie voet” is usually preferred by the participants when cooking traditional foods. The latter practice is also observed at various local events such as weddings, parties and funeral ceremonies. Although some of the participants did not like the smell of food cooked using wood fuel, they stated that usually the smell is due to the type of tree one uses; “...if the tree itself smells, it will usually make your cooked food smell”. One of the participants also identified trees such as Moselesele (sickle bush), Mogonono/Mosusu (silver cluster leaf) and Mosehla (weeping wattle) as suitable for cooking and not creating the wood smell in the food. She learned to differentiate between usable and non-usable types of trees while growing up in the rural areas. Another participant who usually collects wood from the veld indicated that trees which are not suitable for cooking can poison the food. She has experience in working with trees as a fuel for cooking hence she feels fairly knowledgeable and can confidently identify suitable trees in the veld to use for cooking. Therefore using wood fuel to cook traditional foods is not only about saving electricity, but it is about the unique taste it produces that no other fuel can produce.
4.3 Connecting narratives with the broader theoretical literature
4.3.1 The effects of rising electricity costs on the household level All participants reported that electricity was expensive with the situation being worst for households which are characterised by unemployment. Hence, the use of multiple fuels in this context is seen as a way of coping with the electricity price hikes and being unable to afford electricity. Cassim et al. (2012) argued that having alternative sources of energy imposes an additional cost on the household and that various households will respond differently to the increase in the price of electricity. Households are characterised differently especially in terms of the economic and living conditions and consumption patterns. Hence, a minimal increase in the electricity price is likely to result in a negative effect on those at the lower end of the income spectrum whose electricity expenditure is expected to be significantly affected. Therefore households with low and medium living standards typically report higher energy expenditure shares than those with high living standards (Farsi et al., 2007; Mzini & Lukamba-Muhiya, 2014). In the event of electricity increases, it can be expected that the higher-income households will continue to use electricity for all activities until the point where further increases will make alternative fuels attractive and lead them to switch fuels; while poorer households that depend on free basic electricity are likely to continue using it and lowering any electricity consumption in excess of the free provision. Furthermore, electricity usage also differs by income. Poorer households opt to use electricity for lighting and cheaper substitutes, like wood and paraffin for cooking and heating purposes. Higher income households are likely to select fewer and costlier alternative fuels (such as gas) compared to the lower-income homes that complement electricity usage with
336

cheaper sources of fuel. In contrast to the latter argument, Sepp (2014) stated that fuel stacking does provide a sense of energy security because dependence on a single fuel can leave households vulnerable to price variations and unreliable services. The survey conducted by the DMR (2012) also found that the strategy employed by most South Africans to cope with the rising electricity costs was to reduce the amount of electricity used. In a quarter of cases, energy price increases encouraged energy switching and multiple energy use. In the current study, multiple sources of energy were used by household with different income levels for various household activities. Therefore, in South Africa, multiple fuel use remains an enduring feature of the energy consumption patterns of both electrified and non-electrified households (DMR, 2012).
4.3.2 The preference for using wood fuel to cook traditional foods Behavioural and cultural practices, lifestyles and food preferences are important in the continued reliance on fuel wood as a cooking energy form (Remigios, 2014). The participants in the current study preferred to cook traditional foods using wood fuel. A study conducted by Akpula et al. (2011) indicated that a household will buy a relatively higher quantity of a specific fuel on the basis that it contributes to the taste of food cooked. There are clear fuel preferences by cooking practices. Elias and Victor (2005) found that taste preferences and the familiarity of cooking with traditional fuels and technologies contribute to the tendency of cooking to be the last energy service supplied by modern fuels. In India, for example, many wealthy households retain a biomass stove for baking traditional breads (Malhotra et al., 2000). Bank (2010) also observed that the type of fuel used in the preparation of a particular meal is frequently determined by the content and nature of the meal itself. For instance among wood users in Botswana, 68% use wood fuel mainly for cooking traditional foods such as hard beans. Although wood fuel remains a preferred cooking energy due to the cultural connotations associated with it, there are a number of serious environmental challenges which will result from this practice (Remigios, 2014). Other types of fuels participants use in their households consist of biomass (i.e. firewood and coal) and petroleum (paraffin and gas). Schlag and Zuzarte (2008) stated that there are numerous hazards associated with the latter like the toxicity, flammability, indoor pollution from burning of solid fuels for either cooking or heating, death or illnesses which disproportionately affect women and children in developing regions. Furthermore, biomass and petroleum products also have negative environmental impacts because of their carbon emissions. If the latter fuels are not managed properly, the environment and human health can be harmed in many ways (Akpula et al., 2011).
4.3.3 Strategies used by the participants to manage and save household electricity Participants mentioned that electricity needs to be managed properly in the household for it to last longer. Some of the strategies utilised to heat spaces and to keep warm included using hot water bottles, wearing warm clothing and using blankets in contrast to using electric heaters. This mainly occurs in winter. According to the DMR (2012), the energy needs for end-uses such as space heating are likely to be influenced by prevailing climatic conditions, especially during winter months. A number of the current study’s participants who opt not to use the electric geyser for heating water for bathing purposes instead use wood fuel, paraffin and sunlight. There are benefits which could be derived from installing solar heaters for these types of households. Solar water heaters would contribute positively to the alleviation of energy poverty through providing a constant source of heated water (Wlokas, 2011). Educating other members of the household about using energy wisely in order to save electricity was another strategy used by the participants. The participants were well informed and aware about the potential danger of using various fuels like paraffin and gas inside the house. Farsi et al. (2007) stated that educated households are better aware of the negative health impacts associated with the use of wood fuel and also the advantages of modern fuel use, in terms of efficiency and convenience.
4.4 Recommendations
From the latter discussion, it is recommended when planning and building residential spaces to built-in alternative fuels like gas stoves and solar thermal system. Solar thermal system is energy efficient and it can supply the household with hot water and space heating. Investing in this kind of technology is not only cost effective (especially for long-term), but reduce overreliance of using one fuel for various household activities which require the use of energy.
5. Conclusion and Further Research
This paper presented women’s stories on how they utilise multiple fuels within the household and how they allocate these fuels to various household activities. Five core narratives which represented the participants’ journeys and took into consideration past, present and future events on fuel choices and fuel stacking practices were identified from in-depth interviews conducted with the participants. This study does not dispute the importance of factors proposed in literature such as income, education and household size as important determinants of energy choice in Soshanguve households, but also indicated the importance of behavioural, cultural attributes, preferences, practices and lifestyles which tend to be neglected in understanding the household energy environment. Multiple fuel use is not a new concept as it also existed in the past; the differences lie with the combination of varying energy mixes in specific contexts. Household energy mix is not static but constantly changes. The study’s limitations pertain to the small sample size and the specific context used and thus the findings cannot be generalised. Future research in this area can investigate the topic on a larger scale, using quantitative methods to reach conclusive evidence and to generalise the findings. Researchers can make use of the indigenous knowledge derived from women (who are regarded as household energy key informants) to inform future energy solutions or technologies designed towards sustainable energy in residential households.
337

6. Acknowledgement
I appreciate the University of Pretoria’s support of knowledge development in my professional academic years, in particular the provision of outstanding supervisors, information services and funding from the National Research Foundation (NRF- Innovation category) which contributed towards the success of this project. This paper is based on research for a Master’s dissertation currently in process of submission.
7. References
Akpalu, W., Dasmani, I. & Aglobitse, P. B. 2011. Demand for cooking fuels in a developing country: To what extent do taste and preferences matter? Energy Policy, 10 (39), pp. 6525–6531. Bank, L. 2010. On and Off Grid: energy provision. East London: Fort Hare Institute of Social and Economic Research. Birch, L. J 2011. ‘Telling stories: A thematic narrative analysis of eight women's experiences’, EdD thesis, Victoria University, Melborne Australia, accessed 29/7/2015, Dissertations & Theses (vu.edu) research repository. Braun, V. & Clarke, V. 2006. Using thematic analysis in psychology. Qualitative Research in Psychology, 2 (3), pp. 77-101. Brouwer, R. & Falcao, M. P. 2004. Wood fuel consumption in Maputo, Mozambique. Biomass and Bioenergy, 1 (27), pp. 233-245. Campbell, B. M., Vermeulen, S. J., Mangono, J. J. & Mabugu, R. 2003. The energy transition in action: urban domestic fuel choices in a changing Zimbabwe. Energy Policy, 1 (31), pp. 553-562. Cassim, A. Ewinyu, A. & Sithebe, T. 2012. Weighing up the effect of current electricity pricing and additional environmental regulation on household electricity expenditure, In: Economic Regulators Conference, 21 - 22 August 2012, South Africa, NERSA, pp.1-25. Cecelski, E 2000. Household energy: new perspectives, gender perspectives?, accessed 29/7/2015, www.energia.org/resources/newsletter/index.html Cecelski, E. 2002. Enabling equitable access to rural electrification: current thinking on energy, poverty, and gender.Energia News, 3 (5), 20-22. Chambwera, M 2004. ‘Economic Analysis of Urban Fuelwood Demand: the Case of Harare in Zimbabwe’, EdD thesis, Wageningen University, Nederland, accessed 29/7/2015, Dissertations & Theses (WebQuery) database. Clandinin, D. J. & Connelly, F. M. 2000. Narrative inquiry: experience and story in qualitative research. San Francisco: Jossey-Bass Publishers. Clandinin, D. J. & Rosiek, J. 2007. Mapping a landscape of narrative inquiry: borderland spaces and tensions. In: D. J. Clandinin, Handbook of narrative inquiry: mapping a methodology, Thousand Oaks, CA, Sage Publications,pp. 35-37. Collins, K. M. & Onwuegbuzie, A. J. 2007. A typology of mixed methods sampling designs in social science research. Qualitative Report, 1(12), pp. 281-316. Connelly, F. M. & Clandinin, D. J. 2006. Narrative inquiry. In: J. L. Green, G. Camilli, & P. Elmore, Handbook of complementary methods in education research, 3rd edn, Mahwah, NJ, Lawrence Erlbaum, pp. 477-487. Daioglou, V., van Ruijven, B. J. & van Vuuren, D. P. 2012. Model projections for household energy use in developing countries. Energy, 1(37), pp. 601-615. Davis, M. 1998. Rural household energy consumption: the effects of access to electricity: evidence from South Africa. Energy Policy, 3 (26), pp. 207-217. Department of Minerals Resources. 2012. A survey of energy-related behaviour and perceptions in South Africa: the residential sector, South Africa. Elias, R. J. & Victor, D. G. 2005. ‘Energy transitions in developing countries: a review of concepts and literature’, Working Paper no. %23240, accessed 29/7/2015, http://iis-db.stanford.edu/pubs/20910/energy_transitions.pdf Eskom 2010, Annual report, viewed July 29 2015, <http://www.eskom.co.za/OurCompany/SustainableDevelopment/Documents/EskomFactor.pdf>. Farhar, C. B. 1998. Gender and renewable energy: policy, analysis, and market implications. Renewable Energy, 1-4 (15), pp. 230-239. Farsi, M., Filipini, M. & Pachauri, S. 2007. Fuel choices in urban Indian households. Environment and Development Economics, 1(12), pp. 757-574. Heltberg, R. 2004. Fuel switching: evidence from eight developing countries. Energy Economics, 1(26), pp. 869-887. Heltberg, R. 2005. Factors determining household fuel choice in Guatamala. Environment and Development Economics, 1 (10), pp. 337-361.
338

Hiemstra-van der Horst, G. & Hovorka, A. 2008. Reassessing the "energy ladder": Household energy use in Maun, Botswana. Energy Policy, 1(36), pp. 3333-3344. Karekezi, S. & Majoro, L. 2002. Improving modern energy services for Africa's urban poor. Energy Policy, 1 (30), pp. 1015-1028. Kirkman, M. 2002. What's the plot? applying narrative theory to research in psychology. Australian Psychologist, 1 (37), pp. 30-38. Klunne, W. E. 2002. Energy efficient housing to benefit South African households. Boiling Point, 1 (48), pp. 27-29. Kowsari, R. & Zarriffi, H. 2011. Three dimensional energy profile: a conceptual framework for assessing household energy use. Energy Policy, 1 (39), pp. 7505-7517. Madubansi, M. & Shackleton, C. 2007. Changes in fuelwood use and selection following electrification in Bushbuckridge lowveld, South Africa. Journal of Environmental Management, 1(83), pp. 416-426. Malhotra, P. Soma, D. Pal, R. C. Shishupal, S. & Venkata, R. 2000. Rural energy matters: the dhanawas experience. New Delhi: Energy Research Institute. Mantshantsha, S 2014, ‘Eskom’s power crisis is far from over’, Financial Mail, 13 March, accessed 29/07/2015, http://www.financialmail.co.za/coverstory/2014/03/13/eskom-s-power-crisis-is-far-from-over Martins, J. 2005. The impact of the use of energy sources on the quality of life of poor communities. Social Indicators Research, 3 (72), 373-402. Masera, O. R., Saatkamp, B. D. & Kammen, D. M. 2000. From linear fuel switching to multiple cooking strategies: a critique and alternative to the energy ladder model. World Development,12 (28), pp. 2083-2103. Mekonnen, A. & Kohlin, G 2009, ‘Determinants of household fuel choice in major cities in Ethiopia’, Working Paper no. D11, O12, accessed 29/7/2015, http://www.rff.org/RFF/Documents/EfD-DP-08-18.pdf Mjoli-Mncube, N 1998, Case study of gender impacts of alternative sanitation system on the lives of women in South Africa: a case study of Soshanguve, viewed July 29 2015, <http://www.globenet.org/preceup/pages/ang/chapitre/capitali/cas/southaf.htm>. Mzini, L. & Lukamba-muhiya, T. 2014. An assessment of electricity supply and demand at Emfuleni Local Municipality. Journal of Energy in Southern Africa, 3 (25), pp. 20-26. Mzini, L. & Lukamba-Muhiya, T. 2014. An assessment of electricity supply and demand at Emfuleni Local Municipality. Journal of Energy in Southern Africa, 25(3), pp. 12-20. Newig, H. 2011. Conducting research in conservation: a social science perspective. London and New York: Routledge Publishers. Nkemngu, P. 2012. Community benefit from tourism: myth or reality a case study of the Soshanguve township. Journal of Tourism Hospitality, 1 (5), pp. 1-6. Opdenakker, R. 2006. Advantages and disadvantages of four interview techniques in qualitative research. Qualitative Social Research, 4 (7). pp. 1438-5627. Prinsloo, DA 2008, Soshanguve south Doreen road for tritan developments, viewed July 29 2015, <http://www.tritangroup.co.za/newsletter/DirkPrinsloo.pdf>. Rao, M. N. & Reddy, B. S. 2007. Variations in energy use by Indian households: an analysis of micro level data. Energy, 2 (32), pp. 143-153. Remigios, M. V. 2014. The Significance of Culture as a Household Energy Determinant : The Case of Chiwundura Communal Area, Zimbabwe. Journal of Human Ecology, 3(46), pp. 343–349. Ritchie, J., Lewis, J., & Elam, G. 2003. Designing and selecting samples. In: J. Ritchie, & J. Lewis, Qualitative research practice. a guide for social science students and researchers, Thousand Oaks, CA: Sage, pp. 77-108. Schlag, N. & Zuzarte, F. 2008. ‘Market Barriers to Clean Cooking Fuels in Sub-Saharan Africa: a Review of Literature’, Working Paper no 8, accessed 29/7/2015, http://www.sei-international.org/mediamanager/documents/Publications/Climate/market_barriers_clean_cooking_fuels_21april.pdf Sepp, S 2014, Multiple household fuel use: a balanced choice between firewood, charcoal and LPG, accessed 29/7/2015, https://cleancookstoves.org/binary-data/RESOURCE/file/000/000/287-1.pdf Smith, J. A. 2003. Qualitative psychology: a practical guide to research methods. London: Sage. van der Kroon, B., Brouwer, R. & van Beukering, P. J. 2013. The energy ladder: theoretical myth or empirical truth? results from a meta-analysis. Renewable and Sustainable Energy Reviews, 1(20), pp. 504-513. Weakley, D. 2012. Kya sands informal settlement: Vulnerability and Resilience. In: L. Poulsen, & M. Silverman, The South African Informal City, Johannesburg, Architects’ Collective. Williams, C. 2007. Research methods. Journal of Business and Economic Research, 3 (5), pp. 65-72. Willig, C. 2008. Introducing qualitative research in psychology, 2nd edn. Buckingham: Open University Press.
339

Winkler, H 2006. Energy policies for sustainable development in South Africa: options for the future, viewed July 29 2015, <http://www.iaea.org/OurWork/ST/NE/Pess/assets/South_Africa_Report_May06.pdf>. Wlokas, H. L. 2011. What contribution does the installation of solar water heaters make towards the alleviation of energy poverty in South Africa? . Journal of Energy in Southern Africa, 2(22), pp. 27–39.
340

RESIDENT DEMOGRAPHICS AS DETERMINANTS OF HOUSEHOLD RECYCLING BEHAVIOUR IN ENCLOSED HOUSING TYPOLOGIES IN PRETORIA, SOUTH AFRICA
Gabriella NICOLAOU
1
Rachel NEVILLE 2
Lungelwa NDIMA 3 Jacques DU TOIT 4
1 Department of Psychology, University of Pretoria, Email: [email protected] 2 Department of Psychology, University of Pretoria, Email: [email protected] 3 Department of Psychology, University of Pretoria, Email: [email protected] 4 Department of Town and Regional Planning, University of Pretoria, Email: [email protected] Keywords: enclosed housing typologies, household demographics, recycling behaviour, Theory of Planned Behaviour
Abstract
Increased household participation in recycling is critical if national waste management objectives are to be met. However, several factors influence recycling behaviour, while different housing typologies pose different challenges to effective participation, especially in enclosed typologies where access is controlled and space is more limited. Using the Theory of Planned Behaviour and a multiple regression, this paper explores the predictive value of resident demographics on household recycling behaviour in two enclosed housing typologies. A survey of 600 randomly selected households was conducted in Silver Lakes – a high-income ‘golf estate’ with a recycling system, and Equestria – a middle-income townhouse complex with no recycling system. Overall participation in recycling was 57%, with 82% of households in Silver Lakes having recycled in the past three months compared to 31% in Equestria. Using the subsample of 329 households that recycled, a multiple regression was conducted that explored the predictive value of age, gender, and level of education on three determinants of recycling behaviour, including ‘attitudes’ (toward recycling), ‘subjective norms’ (peer pressure to recycling), and ‘perceived behavioural control’ (ability to recycle). Although statistically significant predictions were found, the percentages of variance predicted were small (4.1% for subjective norms, 5.3% for attitudes, and 10% for perceived behavioural control). Age was the largest contributor to subjective norm and perceived behavioural control, while gender was the largest contributor to attitudes. Some recommendations are made as to how recycling programmes may be better implemented and enclosed residential spaces may be better planned and designed considering resident demographics. Level of education, however, appears irrelevant for recycling initiatives in formal residential settings.
1. Introduction
Recycling has been identified as a strategic goal towards integrated waste management. Current legislation requires that by the year 2016, all main towns and cities must develop programmes for recycling (Barr, 2007; Department of Environmental Affairs and Tourism (DEAT), 2012, 2000). Recycling has beneficial effects on both the environment and the economy as it can reduce the amount of waste going into incinerators and landfills and enable the creation of new products from old materials (Vicente & Reis, 2008). Despite these attempts, the South African Department of Environmental Affairs and Tourism (2012) reported that only 10% of waste is recycled.. Although most developed countries have initiated well-established recycling programmes, household waste is a growing concern in both the developed and developing world (Barr, 2007). In South Africa, initiatives need to be put into place in order to promote and encourage recycling in households. The success of any recycling programme implemented depends on household involvement, as the correct collection and separation of waste products requires active and sustained participation by household members (Vicente & Reis, 2008). Current household participation is seemingly low in South Africa, evident by the fact that only 3.3% of households participate in recycling (Oelofse & Strydom, 2010). It is widely acknowledged that the development of technical solutions and economic instruments, particularly more landfill and incineration disposals, will impact waste disposal in a positive direction (Barr, 2007; Vicente & Reis, 2008). However, the decisions made by consumers themselves regarding what products to buy, how to use these products and, most importantly, how to dispose of these products are most influential (Barr, 2007; Vicente & Reis, 2008). Therefore, an alternative solution to the management of waste disposal would be a strategy based on identifying, understanding and promoting both societal and individual recycling decisions and behaviours (Vicente & Reis, 2008). In order to contribute towards a smarter and more sustainable built environment through increased participation in recycling, stakeholders, such as recycling companies and local authorities, can be more targeted in the design and implementation of recycling programmes. Built environment professionals, such as planners and architects, can take greater cognisance of the demographic profile and behavioural characteristics of households – especially within enclosed housing typologies that may inhibit participation in recycling. This study therefore aims to determine the effect of different demographics, including gender, age,
341

and level of education, on the determinants of recycling behaviour in two enclosed housing typologies where participation in recycling is especially difficult. The ‘determinants’ of recycling behaviour are conceptualised in terms of the Theory of Planned Behaviour.
2. The Theory of Planned Behaviour
Recycling is a behaviour that, in many cases, requires some degree of effort on the part of the individual to sort and discard recyclables into appropriate systems. The Theory of Planned Behaviour (TPB), developed by Ajzen in 1985, provides a theoretical framework for systematically identifying a number of factors that influence an individual’s propensity to behave in a certain way (Tonglet et al., 2004). Figure 1 shows the central constructs of the TPB and how they are associated with each other.
Figure 1 Theory of Planned Behaviour.
The TPB proposes that behaviour is guided by three constructs, including (1) ’attitudes’, which involves beliefs about the likely consequences of the behaviour, (2) ’subjective norms’, which involves beliefs about peer pressure to either perform the behaviour or not, and (3) ‘perceived behavioural control’, which involves beliefs about the presence of factors that may enable or hinder performance of the behaviour (Ajzen, 2013). The interaction between these three constructs influences an individual’s behavioural intention, consequently influencing their actual behaviour. According to Ioannou et al. (2013), the general rule is; the more favourable the attitude and the subjective norm, and the greater the perceived behavioural control, the higher the probability of an individual behaving in a certain way (Ajzen, 2013). Applied to this study, the more favourable a person’s attitude towards recycling, the greater the pressure he/she feels to recycle, and the more abled he/she feels to recycle, the greater the likelihood of him/her actually recycling. The subsequent section focuses on the effect of different demographics on recycling behaviour.
3. Demographics and Recycling Behaviour
Extensive research has revealed that the TPB constructs play an important role in determining intentional and actual behaviour, including individuals’ propensity to recycle or not (Botetzagias et al., 2015; Du Toit et al., 2015; Hashim et al., 2015; Prati et al., 2014; Tonglet et al., 2004; Willuweit, 2009). Equally important are factors, such as demographics, that in turn influence the TPB constructs that underlie actual behaviour. Both psychological and situational variables have been explored and found to be influential for most behaviours, including recycling behaviour (Barr, 2007). Psychological variables describe personality characteristics of the individual and their perceptions of the behaviour itself (Barr, 2007). Situational variables describe the individual’s behavioural context, knowledge and experience of a behaviour (Barr, 2007). The interaction between situational variables and the TPB constructs has not been well documented in the literature focusing on environmental behaviour (Botetzagias et al., 2015). Situational variables, such as demographics, including age, gender, education level, household position, income level, occupation, marital status, religion, etc., are convenient to conceptualise and measure, and should therefore be further explored in research on recycling behaviour (Botetzagias et al., 2015). As indicated above, this study aims to explore the effect of key demographic variables, including age, gender and level of education on the TPB constructs of ‘attitudes’, ‘subjective norms’, and ‘perceived behavioural control’. Previous literature that has explored the effects of demographic variables on TPB constructs has confirmed both direct and indirect effects on recycling intention (Botetzagias et al., 2015). In the study by Botetzagias et al. (2015), demographic variables were indirectly related to recycling intention, through TPB constructs. A similar but separate study by Ioannou et al. (2013) found that a demographic model consisting of age, gender and education level predicted 49% of the variance in recycling behaviour and intentions, with age and education level being the only statistically significant unique predictors. Various studies have found a strong positive correlation between recycling attitudes and recycling behaviour, as well as between perceived behavioural control and recycling behaviour (Hashim et al., 2015). Attitudes towards recycling depend on a person’s overall assessment of the advantages and the disadvantages of performing the recycling behaviour. The person is therefore more likely to behave in a certain way if he/she believes that the outcome of that behaviour will be favourable (Hashim et al., 2015). One study found that recycling behaviour significantly increased with age and education level; while another study found similar results where demographic factors such as education and income influenced recycling behaviour (Guerin et al., 2001; Ioannou et al., 2013). Recycling attitudes and attitudes towards the environment have been conceptualised in the literature as “environmental concern” (Hirsh, 2010). The importance of demographic variables in predicting environmental
Attitude
Subjective norm
Perceived behavioural control
Intention Behaviour
342

concern has been examined and it was found that age, education, residential location and political affiliation played an influential role in environmental concern (Fransson & Garling, 1999; Hirsh, 2010). Not only have significant relationships been found between demographic variables and the TPB constructs, but also between demographics and environmental concern. Nord et al. (as cited in Fransson & Garling 1999) found a strong relationship between age and environmental concern. Another study also found that age was positively correlated with environmental concern (Hirsh, 2010). These findings can be attributed to the fact that a decrease in enthusiasm ensues once students leave primary school and commence high school (Busteed, et al., 2009). The fostering of personal norms that favour environmental concern into adulthood can be achieved through environmental awareness training beginning at an early age (Minton and Rose, 1997). Not only has age been associated with recycling attitudes, but the age of a household member has also been found to determine the fulfilment of recycling roles related to social norms (Meneses & Palacio, 2005). Prati et al. (2014) found that perceived behavioural control and behavioural intentions decreased with age and a separate study found a positive correlation between age and perceived behavioural control (Willuweit, 2009). This could be attributed to the fact that younger individuals might perceive themselves as less able to make valuable changes regarding environmental problems, and consequently do not engage in pro-environmental behaviour (Prati et al., 2014; Willuweit, 2009).
4. Research Design and Methods
A household survey was conducted in two enclosed residential developments on the eastern fringes of Pretoria, South Africa. A total of 300 households from Silver Lakes, a high-income ‘golf-estate’, were surveyed over a three-week period from 29 July 2013 to 16 August 2013. Another 300 households from Equestria, a middle-income townhouse complex, were surveyed over a two–week period from 1 August 2014 to 13 August 2014. Silver Lakes had a weekly co-mingled kerbside collection system in place at the time of the survey, whereas Equestria had no system in place requiring residents to make use of recycling facilities outside their complex. The benefit of this balanced yet duel sample is that it covered two different enclosed housing typologies (Silver Lakes with larger stand-alone houses on individual plots, and Equestria with smaller townhouses without individual plots), as well as both the presence and absence of a recycling system. The study rested on the assumption that different residential spaces will affect recycling behaviour differently, and that having access to a recycling system will also affect recycling attitudes and actual behaviour differently as opposed to not having access to a system. Both developments were surveyed by students from the University of Pretoria who were granted access via the respective managing agencies and body corporates. The sample that was surveyed was chosen using simple random sampling. The students first had to identify the head of the household or household member responsible for recycling in each sampled unit, explain the purpose of the study, obtain informed consent and then ask the person to fill in a questionnaire in their presence. The questionnaire included questions that captured respondents’ age, gender, level of education, as well as information regarding recycling. Recycling attitudes and subjective norms regarding recycling were measured by providing normative statements, requiring the residents to respond on a five point Likert-type scale ranging from “agree completely” to “disagree completely”. Perceived behavioural control to recycle was measured by providing normative statements about the ability to recycle, requiring the resident to respond on a five point Likert-type scale ranging from “not at all” to “to a large extent” (see questionnaire items in Du Toit et al. (2015)). Random spot-checks were conducted on each student’s batch of questionnaires, after which data were captured, cleaned and analysed using IBM SPSS Statistics 23. Because some Likert scales were reversed, the research team were able to identify a response set in ten cases which were removed, yielding a final sample of N = 590 (292 responses from Silver Lakes and 298 from Equestria).
5. Findings
5.1 Demographic Profile of Residents and actual Household Recycling Behaviour
As indicated above, the study aims to determine the effect of different demographics, including gender, age, and level of education, on recycling behaviour. Table 1 below therefore provides a demographic profile of Silver Lakes and Equestria in terms of these demographics. This is followed by a brief outline of actual recycling participation rates in both developments.
343

Table 1 Demographic profile of residents and actual household recycling behaviour
Demographics Silver Lakes Equestria Total
Count % Count % Count %
Gender
Female 191 65.4 182 61.1 373 63.2
Male 101 34.6 116 38.9 217 36.8
Total 292 100.0 298 100.0 590 100.0
Age
19 – 35 Years 49 16.8 201 67.4 250 42.4
36 – 59 Years 193 66.1 91 30.5 284 48.1
60 + years 50 17.1 6 2.0 56 9.5
Total 292 100.0 298 100.0 590 100.0
Level of education
Matric/Grade 12 or less
63 21.6 62 20.8 125 21.2
Certificate or diploma
73 25.0 92 30.9 165 28.0
Bachelor or honours
105 36.0 121 40.6 226 38.3
Masters or doctoral
55 18.8 23 7.7 78 13.2
Total 292 100.0 298 100.0 590 100.0
Recycled in past three months?
Yes 238 82.4 91 31.4 329 56.8
No 51 17.6 199 68.6 250 43.2
Total 289 100.0 290 100.0 579* 100.0
Note: *Eleven respondents did not indicate whether their households recycled or not. Table 1 shows that, overall, households in the entire sample are predominantly headed by females, persons aged between either 19 and 35 or 36 and 59 years, and persons with tertiary qualifications. Silver Lakes though has a noticeably larger proportion of household heads older than 35 years and 59 years, as well as a larger proportion with postgraduate qualifications compared to Equestria. The questionnaire also asked respondents whether their households have recycled any paper, glass, metal or plastic (i.e., any dry items that could be co-mingled) in the past three months. Overall, 329 of 590 households (about 57% of all households in the entire sample) indicated that they have recycled in the past three months. However, as expected, participation in recycling is considerably higher in Silver Lakes (82%) compared to Equestria (31%) due to the presence of a recycling system in Silver Lakes at the time of the survey.
5.2 Predictors of Recycling Behaviour
Three standard multiple regressions were used to determine the extent to which age, gender and level of education predicted (1) attitudes, (2) subjective norms and (3) perceived behavioural control amongst the subsample of 329 households who indicated that they recycled at the time of the survey. Further analyses, including independent samples t-tests and a one-way analysis of variance (ANOVA), were conducted to explore the direction of influence of gender, age and level of education on each of the three constructs. Preliminary analyses were conducted to ensure no violations of the assumptions of normality, homogeneity of variance, linearity, multicollinearity, and homoscedasticity had occurred. Table 2 shows the results from the multiple regressions.
344

Table 2 Multiple regression results
Construct Prediction
model R squared T Beta Part
Unique
contribution
Attitude
Demographics 0.053* Constant = 14.268
Age -2.479 -0.135 -0.134 1.79%
Gender 3.328 0.180* 0.180 3.24%
Education -0.396 -0.022 -0.021 0.04%
Subjective norm
Demographics 0.041* Constant = 10.928
Age -2.946 -0.161* -0.160 2.56%
Gender 1.944 0.106 0.106 1.12%
Education 1.126 0.062 0.061 0.37%
Perceived behavioural control
Demographics 0.100* Constant = 15.106
Age 5.574 0.296* 0.294 8.64%
Gender -1.858 -0.098 -0.098 0.96%
Education 0.348 0.018 0.018 0.03% Note: *Significant at the .05 level. The demographic model consisting of age, gender and level of education, to some extent predicted all threeconstructs of attitudes, subjective norms, and perceived behavioural control. The demographic model managed to predict 4.1% of the variance in subjective norms , 5.3% of the variance in attitudes, and up to 10% of the variance in perceived behavioural control (R squared = 0.041, F(3, 324) = 4.638; R squared = 0.053, F(3, 325) = 6.054; and R squared = 0.100, F(3, 324) = 12.062 respectively). The regression models for subjective norms, attitudes, and perceived behavioural control were all statistically significant (p = 0.003, p = 0.01, and p = 0.00 respectively). However, all three yielded very small effect sizes (Cohen’s f squared = 0.002, 0.003, and 0.01 respectively), indicating that although the prediction met the assumptions for being statistically significant, the ability to assertively predict whether or not one will recycle based on one’s gender, age or level of education is limited.
5.2.1 Gender ‘Gender’ had the largest effect on the model’s prediction of recycling attitudes (3.24% of 5.3%), the second largest effect on subjective norms (1.12% of 4.1%), and the smallest effect on perceived behavioural control (0.96% of 10%). Further analyses revealed that there was no statistically significant difference in perceived behavioural control when comparing genders, indicating that both males and females feel the same level of control over their ability to recycle. It was found, however, that males scored higher on attitudes and subjective norms regarding recycling compared to females, both with small to moderate effect sizes (t (186.422) = -3.137, mean difference = 0.02, p = 0.002, eta squared = 0.029 and t (326) = 2,898, mean difference = 0.31, p = 0.004, eta squared = 0.025 respectively). This suggest that males experience more positive attitudes towards recycling in that they view recycling as more important for the sake of the environment and municipal landfills, and as an action that is worth the effort by households and companies. The findings also suggest that males are more likely to be influenced by peer-pressure to recycle.
5.2.2 Age ‘Age’ had the largest effect on the model’s prediction of perceived behavioural control (8.64% of 10%) and subjective norms (2.56% of 4.1%), and the second largest on attitudes (1.79% of 5.3%). Further analyses revealed that older residents (36 years and older) felt they had the ability to recycle considering a medium to large effect size (t (326) = -5.71. mean difference = 0.72, p = 0.00, eta squared = 0.091). This suggests that older residents were more likely to feel they had enough information regarding what, where, when and how to recycle, had enough space, had the support by their body corporate, as well as suitable collection facilities. It was also evident that younger residents (35 years and younger) were more likely to be influenced by subjective norms. This suggests that younger residents are more susceptible to peer pressure to recycle. These younger residents also showed more positive attitudes considering a small to moderate effect size (t (327) = 2.623, mean difference = 0.17, p = 0.009, eta squared = 0.021). This could be due to recycling campaigns promoting pro-environmental behaviour are usually targeted at the youth through the schooling system as well as through the media, which are designed to promote a safer and more sustainable environment for younger generations.
345

5.2.3 Level of Education ‘Level of education’ had the weakest effect on attitudes (0.04% of 5.3%), subjective norms (0.37% of 4.1%), and perceived behavioural control (0.03% of 10%). Despite the demographic model yielding statistically significant predictions of all three TPB constructs, education on its own did not influence the prediction to any large extent. This is confirmed by the fact that when comparing the scores for attitudes, subjective norms, and perceived behavioural control, there were no statistically significant differences across different levels of education. However, it should be noted that the respective subsample was fairly homogenous with regard to education. Inclusion of the subsample that do not recycle, or replicating this study amongst samples with more varied levels of education, may well yield different results as evident from the literature.
6. Conclusion
The results suggest that demographics as a whole do predict recycling behaviour, through influencing one’s attitudes about recycling, perceived pressure to recycle, and one’s perceived ability to recycle. However, the findings also suggest that different demographics influence recycling behaviour to a different degree. Stakeholders and professionals could use the results from this study to better design enclosed housing developments and individual units, and to implement recycling programmes more effectively. It is possible for attitudes to be influenced in various ways through marketing campaigns, edutainment, schooling programmes and the media. This would be necessary for females and older individuals who had less favourable attitudes towards recycling and could thus stand to gain from pro-recycling initiatives. However, it is also important to focus on those with more favourable recycling and environmental attitudes (males and younger individuals) by designing spaces that make recycling more accessible and easier. It is also possible to change residents’ perceived ability to recycle through explicitly providing them with information as to what, where, when and how to recycle and by ensuring that there is sufficient space, resources and facilities within residential developments. Younger residents who had a lower perceived ability to recycle could be targeted in these ways; one such example is to provide kerbside recycling programmes at schools, universities, student accommodations, and residential areas housing younger residents. Males and younger residents appear to feel more pressured to recycle. Understanding how demographics influence the decision to recycle or not can assist these stakeholders and professionals with more targeted interventions, as well as how to design spaces to accommodate the peculiar recycling habits and behaviours of residents’ different demographic backgrounds. Similar research is necessary in different housing typologies and areas of different socio-economic standing.
7. Acknowledgement
The following students served as fieldworkers at Silver Lakes whilst they were final-years during 2013 in the Bachelor of Town & Regional Planning at the University of Pretoria: Gideon Allison, George Allison, Dané Botha, Marius Buskes, Marthinus Kotze, Herman Kruger, Charné Stevens, Wiehann van den Berg, Rochelle van Rooyen, and Andries van Wyk. The following students served as fieldworkers at Equestria whilst they were final-years during 2014 in the Bachelor of Town & Regional Planning at the University of Pretoria: Jean-Pierre Adendorff, Kailash Chetty, Ryno Coetzer, Johan Herbst, Dineo Lesejane, and Zamanhlenga Mpanza.
8. References
Ajzen, I. 2013. Constructing a TPB questionnaire: Conceptual and methodological considerations. Available: http://people.umass.edu/aizen/pdf/tpb.measurement.pdf [2015, 20 May]. Barr, S. 2007. Factors Influencing Environmental Attitudes and Behaviours: A U.K. Case Study of Household Waste Management. Journal of Environment and Behaviour, 39, pp. 435–473. Botetzagias, I., Dima, A.F. & Malesios, C. 2015. Extending the Theory of Planned Behavior in the context of recycling: The role of moral norms and of demographic predictors. Resources, Conversation and Recycling, 95, pp. 58–67. Busteed, M., Palkhiwala, K. Roma, M. & Shah, B. 2009. Recycling attitudes and behaviours of students at Carlos Pascua Zuniga high school. Research Project Report. Carlos Pascua Zuniga High School. Department of Environmental Affairs and Tourism (DEAT). 2012. National waste information baseline report. Department of Environmental Affairs. Pretoria, South Africa. Available: http://sawic.environment.gov.za/documents/1880.pdf [2015, 2 June]. Department of Environmental Affairs and Tourism (DEAT). 2000. White paper on integrated pollution and waste management for South Africa. Department of Environmental Affairs. Pretoria, South Africa. Available: http://sawic.environment.gov.za/documents/1880.pdf [2015, 2 June]. Du Toit, J., Wagner, C. & Fletcher, L. Factors affecting household recycling behaviour in townhouses in Pretoria, South Africa. Draft conference paper at the Smart and Sustainable Built Environments (SASBE) conference, 2015, South Africa. Fransson, N. & Garling, T. 1999. Environmental concern: Conceptual definitions, measurement methods, and research findings. Journal of Environmental Psychology, 19, pp. 369–382. Guerin, D., Crete, J. & Mercier, J. 2001. A multilevel analysis of the determinants of recycling behaviour in the European countries. Social Science Research, 30, pp. 195–218.
346

Hashim, Z. Alias, R. Mariam, S. & Farzana, N. 2015. Understanding recycling behaviour using personality traits. Global Journal of Business and Social Sciences, 1, pp. 581–587. Hirsh, J.B. 2010. Personality and environmental concern. Journal of Environmental Psychology, 30, pp. 245–248. Ioannou, T. Zampetakis, L.A. & Lasaridi, K. 2013. Psychological determinants of household recycling intention in the context of the Theory of Planned Behaviour. Fresenius Environmental Bulletin, 22, pp. 2035–2041. Meneses, G.D. & Palacio, A.B. 2005. Recycling behaviour, a multidimensional approach. Environment and Behaviour, 37, pp. 837–860. Minton, A.P. & Rose, R.L. 1997. The effects of environmental concern on environmentally friendly consumer behavior: An exploratory study. Journal of Business Research, 40, pp. 37–48. Oelofse, S.H.H. & Strydom, W.F. 2010. The trigger to recycling in a developing country – in the absence of command-and-control instruments. Proc. of Waste 2010: Waste and Resource Management – Putting Strategy into Practice, pp. 355–364. Prati, G. Mazzoni, D. & Zani, B. 2014. Perceived behavioural control, subjective norms, attitudes and intention to use condom: A longitudinal cross-lagged design. Psychology and Health, 29, pp. 1119–1136. Tonglet, M. Phillips, P.S. & Read, A.D. 2004. Using the Theory of Planned Behaviour to investigate the determinants of recycling behaviour: A case study from Brixworth, UK. Resources, Conversation and Recycling, 41, pp. 191–214. Vicente, P. & Reis, E. 2008. Factors influencing households’ participation in recycling. Waste Management and Research, 26, pp. 140–146. Willuweit, L. 2009. Promoting pro-environmental behavior: An investigation of the cross-cultural environmental behavior patterns, the case of Abu Dhabi. Unpublished masters thesis. Department of Human Geography, Stockholm University, Stockholm, Sweden.
347

348

EXPLORING RECYCLING BEHAVIOURS IN TWO DIFFERENT ENCLOSED RESIDENTIAL TYPOLOGIES
Lizanda MARAIS
1 Linah SESHEBA 2
Matlhogonolo NTSIMANE 3 Claire WAGNER 4
1 Department of Psychology, University of Pretoria, Email: [email protected] 2 Department of Psychology, University of Pretoria, Email: [email protected] 3 Department of Psychology, University of Pretoria, Email: [email protected] 4 Department of Psychology, University of Pretoria, Email: [email protected] Keywords: Enclosed residential estates, housing typologies, qualitative research, recycling behaviours
Abstract The number of people living in enclosed residential areas in South Africa has increased significantly over the years. The aim of this paper is to explore the qualitative responses that were collected as part of a survey about recycling behaviours in two different enclosed residential typologies situated in the east of Pretoria (City of Tshwane), namely Silverlakes Golf Estate and Equestria Estate. Silverlakes is an enclosed security estate with an established recycling programme whereas Equestria is an enclosed townhouse complex without a recycling programme. Of the 600 residents that participated in the study a subset of 182 respondents (83 respondents in Silverlakes and 99 respondents in Equestria) provided data through an open-ended question on the questionnaire. In the process of comparing the two different typologies it became evident that fundamental differences exist between them with regards to: 1) the space available for recycling, 2) the resources the residents have and do not have available for recycling, 3) their particular needs in their respective environments, and 4) the resources that residents believe will improve recycling. In the housing typology without a programme the residents expressed needs about recycling with regards to more education, visibility, awareness and encouragement. In the estate with a recycling programme in place, aspects of the programme need to be addressed. Recommendations are made concerning the layout of housing typologies in enclosed areas, the facilities residents use for recycling, as well as creating opportunities for educating residents about the process and importance of recycling.
1. Introduction
The waste industry has seen increasing pressure in recent years due to a steady rise in waste production (Burnley, 2007), fuelled by increasing population growth, rapid urbanisation (Agdag, 2008) and the need for more sustainable and environmentally acceptable waste management strategies, particularly in households (Hazra & Goel, 2008). However, due in part to the fact that developing countries often have more pressing issues to address such as unemployment, poverty and HIV/AIDS just to name a few, there has been a failure to adequately address waste reduction by government (Kamara, 2006). In addition, community participation in recycling has generally been low. A review of the literature revealed that few studies specifically look at people’s experiences as a main theme in understanding recycling behaviours. Thus it is evident that the waste produced by households is an area of research that demands attention. For this reason this paper undertakes a qualitative approach to investigate the possible ways that South Africans believe they can reduce the amount of waste generated in their homes. This could further improve our understanding of recycling behaviours and the physical contexts that accommodate these behaviours.
2. Issues surrounding waste management in South Africa
Increased production of human waste due to rising urbanisation and rapidly changing life styles has created a critical problem especially in developing countries such as South Africa (Troschinetz & Mihelcic, 2009). The National Waste Information Baseline Report (2012) revealed that Gauteng (the province in which this study is situated) generates 45% of the municipal waste produced in South Africa and, to make matters worse, only a few landfills in the province have a lifespan of 10 years remaining. The over production of solid wastes is putting increasing pressure on municipalities that are struggling to effectively manage waste. The decline in necessary resources, such as funding, and lack of efficient organization has resulted in a non-sustainable waste management system (Nahman& Godfrey, 2009). This is further exacerbated by the increase in land prices as well as impeding government regulations which make it challenging to construct new landfill sites (Mangizvo & Wiseman, 2012).There are specific regulations and guidelines for governing solid waste landfills in South Africa (Mangizvo & Wiseman, 2012; Simelane & Mohee, 2012). The South African constitution, by means of the Municipal Structures Act, Act 117 of 1998, places the responsibility of waste management on local governments (Mangizvo & Wiseman, 2012). Additionally the National Environment Management Waste Act, 2008, Act 59 of 2008, regulates waste management (De Vos, 2011; Mangizve & Wiseman, 2012; Simelane & Mohee, 2012).South Africa’s National Waste Management strategy suggests that municipalities should endorse an integrated waste management plan. This would require functioning within the waste managing hierarchy (Nahman & Godfrey, 2009). This hierarchy provides an
349

alternative for disposing of waste at landfills by rather promoting reducing and recycling of waste (De Vos, 2011; Simelane & Mohee, 2012). For this to be efficient, however, education and awareness is fundamental (Simelane & Mohee, 2012).Godfrey (2008) suggests that waste management in South Africa can be improved by means of implementing a more efficient waste information system. This would include not only collecting regular information on waste practices in the country, but also by making this information available to all relevant stakeholders. The aim of such a waste information system would be to use this information to support government in aspects such as informed planning and decision-making, ensuring adherence, monitoring as well as enforcing of waste management regulations, and affording the public an opportunity to be part of this process by allowing access to information, resources and policy development (Godfrey, 2008). Hence there is an opportunity to do research on waste management systems in South Africa at all levels, including local government, which includes household and residential waste management.
2.1 Formal and informal waste management practices in South Africa Recycling in South Africa is done primarily through formal programmes by municipalities or privately owned companies (Karani & Jewaskiewitz, 2007). Primary collectors may take away the waste from the source. For example, collection of bins from households to collection points which are known as secondary sources. Alternatively, the waste can be sent by individuals directly to secondary collection sites. This is likely to happen in residential areas where there are no recycling programmes (Karani & Jewaskiewitz, 2007). Private recycling companies offer recycling facilities in order to avoid reusable waste going to landfills. These companies collect customers’ recyclable waste products for a fee, they then proceed to sort and sell the recyclables for a profit (De Vos, 2011). Informal recycling activities include street pickers who collect material that has been discarded by households, some of which is reusable. In some cases street pickers take waste from dumpsters, community containers or secondary collection sites. There are also a number of street pickers who work and may even live on landfills or dumpsites who inspect and then convert material dumped by the formal recycling sector for selling and re-use (Scheinberg et al., 2010). Bjerkli (2005) and Nzeadibe (2008) argue that government’s failure to acknowledge the informal system of recycling, ignores the importance of transforming the waste management system. The interaction between the two is important in a developing country like South Africa because it has economic implications such as job creation. Household waste is defined as waste that is produced by normal household activities (Troschinetz & Mihelcic, 2009). Household waste is one of the main sources of municipal solid waste to which the majority costs of municipal waste management are allocated (Karak et al., 2012). A study in another developing country, Iran showed that one way to alleviate pressure from landfills is to minimise the generation of waste. Additionally, the Council for Scientific and Industrial Research (CSIR) revealed that only 3.3% of the country's urban population regularly recycled household waste in 2010 (Oelofse & Strydom, 2010). Another study also conducted by the CSIR showed that of the estimated 19 million tons of municipal waste generated in South Africa in 2011, about 25% were mainline recyclables such as glass, paper, tin and plastics (Oelofse, 2012). Ueta and Koizumi (2010), however, maintain that the success of household recycling programs strongly depends on citizens’ participation in the source separation process which requires people to separate distinctive products in their household waste.
2.2 International qualitative research on recycling practices
Some qualitative research that highlights reasons why people do and do not recycle has been done internationally. In Havering, east of London some of the concerns households raised about their ability to recycle were the frequency of collection of waste, the availability of resources to accommodate the range of material collected, and the type of method of collecting waste (Lyas et al., 2005). This study concluded that the success of recycling schemes depends on an adoption of systems that are tailored for their specific needs. A study conducted in Portugal revealed that people are more likely to participate in recycling activities if they are better informed about the existing programmes, which materials are recyclable and if they know where the nearest recycling points are (Vicente & Reis, 2004). In-depth interviews conducted by Miafodzyeva et al. (2013) revealed that households in Jarva, Sweden complained about the safety and organisation of recycling facilities. Furthermore, the vast majority of interviewees reported that they did not have an idea about the availability of recycling facilities and those who knew, thought that the system was not convenient enough. A study to examine the problems of household waste and to study the level of awareness regarding household waste utilization conducted in Pradesh, India revealed that waste recycling awareness was higher in communities that were more educated. Additionally, the study found that amongst both higher and lower educated communities, adoption of waste recycling and re-use practices was low. This might be due to the labour-intensive nature of recycling and the communities’ attitudinal factors, such as readiness to recycle. Creating an environmental consciousness amongst people is paramount for reducing household waste (Kaundal & Sharma, 2007).
2.3 Research on recycling practices in South Africa
Research on waste management is gaining popularity in South Africa, but at this stage only quantitative studies have been published. De Vos (2011) found that inadequate recycling activities in residential areas were associated with the following problems: lack of education on environmental issues including the benefits of recycling; people not being aware of existing recycling programmes; not being able to tell the difference between recyclable and non-recyclable materials and not knowing where to take recyclable material for those who are aware of the benefits. De Vos recommended that even though recycling is starting to take shape within South African communities, the management thereof has to be improved and information and facilities need to be directed to those who need it. The study did not, however, gather the opinions of participants on how they feel the systems could be improved to accommodate their needs. A
350

survey conducted by the CSIR which aimed at gaining an understanding of households recycling behaviour in South Africa, revealed that urban South Africans have a poor attitude towards recycling which is also clearly evident in their recycling behaviour, or a lack thereof (Oelofse, 2012). The study revealed the reasons why urban household in South Africa do not recycle, are fivefold: there is a lack of space; people feel they do not have the time to recycle; it is messy to recycle; people are not well informed regarding what can and cannot be recycled; the available facilities are inconvenient (Oelofse, 2012). In addition, the study revealed that the participants would be more likely to engage in recycling behaviour if it were more convenient for them to do so. A study by Kamara (2006) focused on household participation in waste disposal and recycling carried out in four suburbs in the City of Tshwane, specifically Waterkloof, Lynnwood, Sunnyside and Mamelodi. The findings of this study suggested that there is a low level of awareness regarding the environmental consequences of household waste management in general in the City of Tshwane. As a result there were low levels of participation in household waste sorting, disposal and recycling. In addition, the study revealed that factors such as level of environmental education as well as income of the household, also affect participation.
2.4 Problem statement
It is apparent that waste produced by households is increasing and will continue to increase (Anderson et al., 2013). These authors further maintain that there has been little research with a specific focus on recycling behaviour in developing countries. Thus, the need for further research on household recycling is evident. Oelofse (2012) suggests that research is needed in order to understand exactly what guides recycling behaviour as well as what motivates people to recycle. This understanding, can be gained through qualitative data as it affords an empathetic, interpretive understanding of people in context (Willig, 2013).
3. Research Methodology
A survey design using a questionnaire was employed to collect quantitative and qualitative data about recycling behaviours. The quantitative questions on the questionnaire aimed to explore participants’ attitudes and subjective norms regarding recycling, as well as their perceived control over their ability to recycle. The final question on the questionnaire asked the respondents to share any further thoughts they may have on recycling in residential developments. The aim of this paper is to analyse the responses of residents to this open-ended qualitative question. Data was collected in two different enclosed residential typologies situated in the east of Pretoria (City of Tshwane), namely Silverlakes Golf Estate and Equestria Estate. Silverlakes is a high-income enclosed security estate with an established recycling programme whereas Equestria is a middle-income enclosed townhouse complex without a recycling programme. The predominant housing typology within Silverlakes Golf Estate is free standing houses (see appendix A). The overall housing structure is expansive with relatively large gardens and abundant communal open space areas within the estate. Equestria Estate differs in its layout as it consists of a cluster of enclosed town house complexes in one large enclosed estate (See appendix B). It also has a small outside area, thus the space within and outside the individual units is smaller than at Silverlakes. The data was collected at different times at each estate. Silver Lakes Golf Estate was surveyed over a three week period from 29 July 2013 to 16 August 2013 during which a total of 300 questionnaires were completed. Equestria Estate was surveyed over a time span of roughly two weeks stretching from 1 August 2014 to 13 August 2014 during which a total of 300 households were surveyed (Coetzer, 2014). Of the 600 residents that participated in the survey a subset of 182 respondents (83 respondents in Silverlakes and 99 respondents in Equestria) shared their additional thoughts about recycling in enclosed residential areas. Overall, more females responded to the open-ended question with similar proportions in both estates with regards to gender as per Figure 1. The ages of the respondents were mostly in the 36-59 category for Silverlakes, and for Equestria, the respondents’ average age was in the 19-35 age group as per Figure 2. Finally, most respondents have a bachelors/honours degree in both estates as per Figure 3.
Figure 1 Comparison between Silver Lakes and Equestria with regards to gender
0
10
20
30
40
50
60
70
80
Females Males
Gender
Silver lakes Equestria
351

Figure 2 Comparison between Silver Lakes and Equestria with regards to age
Figure 3 Comparison between Silver Lakes and Equestria with regards to level of education
The data from the open-ended question was analysed using the constant comparison analysis method as formulated by Boeije (2002). Boeije outlines five steps that can be used when working with the constant comparison method. However, due to the nature of the data, only steps two and three were utilized. These two steps are as follows:
Step 2 requires a comparison between interviews in the same group - that is persons who share the same experience. This consists of formulating a criterion for comparing participants’ responses and also hypothesising about possible patterns and types. The aim is to conceptualise the subject and produce a typology. The responses from each of the enclosed estates (Silverlakes and Equestria) were analysed and compared within each group.
Step 3 consists of comparing the interviews from groups with different perspectives who are involved in the subject under investigation. This is done in order to triangulate the data sources as it will enrich the data gathered. The data from each of the enclosed estates (Silverlakes and Equestria) were compared with each other.
4. Findings and Discussion
In this section, the experiences of the respondents with regards to recycling in each estate are presented. A comparison between Equestria and Silverlakes is subsequently discussed to gain insight on the different perspectives each group may have. The comparison of the residential areas is made along four dimensions found within the data. Theme 1 describes the opinions that the participants expressed about the state of recycling within their respective residential areas. Theme 2 refers to participants’ perceptions about the facilities and resources that are available and assist with recycling activities. Theme 3 concerns the resources and facilities that the participants perceive as lacking or which they believe may hinder recycling activities. Theme 4 refers to the participants’ expressed needs that they feel could improve the recycling programme in their respective residential areas. For each theme, verbatim quotes from the data are used to substantiate the findings. The quote is labelled as follows; the first letter refers to the gender of the participant, followed by the letters that identify the
0
10
20
30
40
50
60
70
19-35 36-59 60+
Age
Silver Lakes Equestria
0
10
20
30
40
50
60
No/ someeducation
Matric Certificate/Diploma
Bachelors/Honours
Masters/Doctorates
Education
Silver Lakes Equestria
352

location. Thus they were either labelled M (male) or F (female) and SL (which refers to Silverlakes) or Eq (which refers to Equestria).
Step 2: Comparing experiences within Silverlakes and Equestria
i. Experiences in Silverlakes Golf Estate
Theme 1: Opinions about the state of recycling Participants expressed both negative and positive opinions about recycling in their particular gated community. The participants who expressed a positive view on recycling also acknowledged the importance of recycling and expressed a general state of satisfaction with the current systems that are in place.
SL, M: “Silver Lakes really makes it easy to recycle.” SL, M: “Recycling is already going extremely well in Silver Lakes.” SL, M: “Recycling in enclosed spaces works and should be continued.” SL, M: “Recycling in enclosed spaces works well at the moment.”
Conversely, the opinions of those who expressed negativity centred on problems with the system. This was highlighted through phrases such as:
SL, M: “no support from the body corporate that promote recycling.” SL, M: “Should be done! Should be made easier to comply!”
Theme 2: Perceptions about the facilities and resources available
Participants in Silverlakes highlighted several facilities and resources which they felt facilitate recycling practices in their particular gated community. More specifically, participants emphasised the fact that they have a collection company that picks up their recycled waste from the curb; that they are provided with bags in order to recycle their waste; and that all the residents in the estate received the same information regarding how and where they can recycle their waste. In addition, participants felt that recycling is being promoted by the estate.
SL, F: “I’m happy with our recycling companies.”
SL, F: “I think it is very important and we need to educate more people to recycle. It is wonderful to live in Silver Lakes where the environment is kept beautifully and recycling is encouraged and made simple. Thank you!”
Theme 3: Perceptions about the facilities and resources that are lacking
The main issue that came to light with regards to participants who feel that they do not have certain resources that would help them to recycle, was the fact that the system was limited in terms of only being able to recycle plastic and paper. Furthermore, there are no facilities to recycle household toxins (i.e. batteries). It was also mentioned that recycled goods are not collected consistently with regards to frequency. In addition, responses indicated that residents would prefer recycling bins while they are currently provided only with plastic refuse bags. The reason for this was that; the plastic bags look untidy, the bags tear when too much waste is placed in them. The bags get blown away by the wind after they have been emptied and they get torn by dogs in the vicinity. Thus, they are not convenient or easy to use.
M, SL: “bin for paper, too heavy for bags.” M, SL: “needs to be easier disposal of waste products like oil, solvent, paint and chemicals.” M, SL: “would like pickup to be weekly – build-up of materials becomes a nuisance when collected
only 2x monthly.”
Theme 4: Expressed needs Explicit suggestions made by residents as to what they need to enable them to recycle included raising more awareness, providing more education and information, as well as a better functioning system. In addition participants also expressed the desire for legislation that will enforce recycling practices.
F, SL: “Should educate people more about the pros and cons about recycling.” M, SL: “Recycling needs to be mandatory in enclosed spaces.” M, SL: “It should be further implemented.”
353

ii. Experiences in Equestria Estate
Theme 1: Opinions about the state of recycling
Participants living in Equestria Estate expressed more negative than positive opinions regarding recycling in their particular gated community. In particular, participants expressed the lack of interest from collection companies, that the estate generally has no culture of recycling and furthermore residents tend to disregard recycling practices.
Eq, F: "At the moment there is no recycling system. A system should be put in place.” Eq, M: “I've never really been conscious about recycling and how important it is because I've never
really seen people in my complex do it.” Eq, F: “Recycling is too hard, contacted recycling company for bags twice with no response.”
Although participants conveyed negative perceptions about the current state of recycling in their gated community, their general perception about recycling is not necessarily negative. This is clearly evident in their desire to recycle.
Eq, M: “It would be great to have a system in place to enable us to recycle.” Eq, F: “Need to encourage recycling in the complex.” Eq, F: “If our complex had an area for recycling then we would make an effort to recycle our refuse.” Eq,F: “If there was recycling facilities in this complex or estate-recycling would be compulsory in my
home.” Eq,F: “It would sure be awesome to have facilities for recycling. Hopefully this will encourage more
people to recycle.”
Theme 2: Perceptions about the facilities and resources available Participants conveyed that information on recycling as well as facilities for recycling are provided by the local schools that make a drop-off point for recycling paper available. These facilities are, however, located outside of the estate’s area. Other than this resource no other facilities exist to enable recycling.
Eq, F: “Schools provide dropping point.” Eq, F: “We teach the children at school to recycle and we should carry it through by doing it at home
as well.”
Theme 3: Perceptions about the facilities and resources that are lacking Residents expressed a lack of facilities and resources that they felt ultimately contributed their inability to recycle within the gated community. More specifically, participants conveyed that there is a lack of sufficient space within their residence for recycling, that they currently only have general refuse dustbins and not separate bins for different waste, that they are not well educated on factors relating to recycling and that they are not being made aware of recycling practices within the gated community.
Eq, F: “Lack of space may be a problem.” Eq, F: “It would be appreciated if the complex can provide recycling bins, as of now we are mixing waste!” Eq, M: “More education regarding recycling is needed.” Eq, M: “Recycling is usually ignored due to inaccessibility.”
Theme 4: Expressed needs
The specific suggestions that the residents in Equestria made regarding the factors that would assist in recycling, included; the estate should provide designated areas for recycling, educational needs such as instituting information meetings for residents and the one that featured the most in the data was that the estate must provide more space for recycling (both inside and outside their homes).
Eq, F: “It is impractical to recycle due to: 1. limited space in a small home. 2. Issue to drop off vs. companies collect @ your home. Note: If it would be easier I would definitely make space and do recycling.”
Eq, F: “Education on how to recycle, space + containers to assist sorting + collection.” Eq, F: “They can make the residents more aware by having a COMPULSARY info meeting.”
Step 3: Comparing experiences between Silverlakes and Equestria
As previously mentioned, Silverlakes Golf Estate has a recycling programme in place whilst Equestria Estate does not. This has several implications for the subsequent issues that arise from the responses. For example, the opinions expressed by the Silverlakes Golf Estate participants centred on satisfaction with regards to the system they have in place. Even though some negative views were expressed, more participants expressed views that were positive. However, for Equestria Estate the opinions expressed were of a much more negative nature. In most instances, the negativity seems to stem from the fact that there is no system in place.
354

A recycling programme is a more feasible venture for Silverlakes for the following reasons: they are provided with various forms of recycling resources including refuse bags and information regarding the recycling within the complex; collection companies have access to the estate; there is a support structure from the body corporate and more physical space within and outside their homes for recycling purposes. In terms of space, appendix A shows that Silverlakes is designed in such a way that it makes the implementation of a recycling programme within the home a more feasible endeavour. This is because there is more space (particularly in the kitchen) to place different bags for different waste types and so forth. The external enclosed area is also designed in such a way that there is ample space for sorting different waste materials and storing different waste bins. Equestria is not so fortunate. As can be seen in Appendix B it is more confined and does not necessarily have a space outside the residence for recycling purposes. This would obviously have the implication of hindering the implementation of a recycling programme that requires space within individual residences. This is intensified by the fact that they are not provided with the necessary resources which, as mentioned before, includes information as well as awareness about how to recycle, recycling facilities and support from their body corporate.
5. Recommendations
The data illustrates that certain provisions need to be put in place in order to implement an effective recycling system in housing typologies such as the ones included in this study. These include building enclosed estates with recycling facilities as a consideration. This does not necessarily refer only to the residence itself, but can include having an accessible drop-off area for recyclable materials or facilities within the complex where all residents can dispose of their recyclable waste. Sufficient education on environmental issues, increased awareness on recycling and the benefits thereof and provision of opportunities for residents to sort recyclable waste from non-recyclable waste, should be implemented. For a programme to be successful, it is important that the residents that live in these gated communities, who have first-hand insight into how things work within the estate, be actively involved in the design and implementation of the recycling programme.
6. Conclusion
This paper explored the qualitative responses of a sample of residents in order to better understand their experiences of recycling in two enclosed housing typologies. From the findings of this study it is evident that the participants do realize the importance of recycling even though recycling has not yet been prioritised in residential areas in South Africa. Residents of Silverlakes, who have a current curb side recycling system in place, expressed more positive opinions about the state of recycling in their gated community whereas the residents of Equestria, who have no recycling system in place, expressed more negative opinions about the state of recycling in their gated community. The participants from Silverlakes highlighted the fact that they all have the same information regarding where and how to recycle as well as access to facilities that enable recycling in their estate. Conversely, participants from Equestria revealed that the resources available to them included only a general waste bin and a drop-off point located outside of the estate’s area. Silverlakes residents emphasised the fact that they were limited in the materials that they could recycle while Equestria emphasised the lack of space, facilities and education amongst other things. Additionally, Silverlakes felt that legislation would aid in improving recycling in gated communities whereas Equestria placed more emphasis on the need for education and space. A comparison between the two groups showed that a recycling programme was more feasible in Silverlakes for a number of reasons such as more space available for recycling purposes, support from their body corporate and the provision of various recycling resources. Both housing typologies highlighted the need for more awareness and education on the environmental consequences of household waste management. This links with previous literature discussed earlier in the paper. The concerns highlighted in the De Vos (2011) and Oelofse (2012) studies, notably education, awareness, space and messiness were also evident in our study. The qualitative data for the study was gathered by asking the residents to share thoughts they may have with regards to recycling in enclosed housing typologies. Due to the open-ended question being part of a larger survey it was very general and therefore open to many interpretations by the respondents. Additionally, there was no further probing in the responses given to enrich the qualitative data. It would be invaluable to the body of knowledge that exists to further add to the qualitative research regarding the reasons why people recycle (or do not recycle) by using qualitative methods such as individual in-depth interviews and focus groups to generate richer data.
7. References
Agdag, O.N. 2009. Comparison of old and new municipal solid waste management systems in Denizli, Turkey. Waste Management, 29, pp. 456-464. DOI:10.1016/j.wasman.2008.01.012. Anderson, B.A., Romani, J.H., Wentzel, M. & Phillips, H.E. 2013. Recycling behavior among urban South Africans: The role of race and social status. Available: http://www.psc.isr.umich.edu/pubs/pdf/rr13-790.pdf [2015, 22 June]. Bjerkli, C. L. 2005. The cycle of plastic waste: An analysis of the informal plastic recovery system in Addis Ababa, Ethiopia. Masters Thesis. Norwegian University of Science and Technology, Trondheim. Available: http://urn.kb.se/resolve?urn=urn:nbn:no:ntnu:diva-1410 [2015, 22 May]. Burnley, S.J. 2007. A review of municipal solid waste composition in the United Kingdom. Waste Management, 27(10), pp.1274-1285. DOI:10.1016/j.wasman.2006.06.018. Coetzer, R.H. 2014. The primary determinants of recycling behaviour within two different enclosed housing typologies, i.e., a town house complex and a security estate. University of Pretoria, Pretoria.
355
Collins, A., O’Doherty, R. & Snell, M.C. 2006. Household participation in waste recycling: Some national survey evidence from Scotland. Journal of Environmental Planning and Management, 49(1), pp. 121-140. DOI:10.1080/09640560500373253. Department of Environmental Affairs. 2012. National waste information baseline report, Department of Environmental Affairs. Pretoria, South Africa. Available: http://sawic.environment.gov.za/documents/1567.docx [2015, 3 May]. De Feo, G. & De Gisi, S. 2010. Public opinion and awareness towards MSW and separate collection programmes: A sociological procedure for selecting areas and citizens with a low level of knowledge. Waste Management, 30(6), pp. 958-976. DOI:10.1016/j.wasman.2010.02.019. De Vos, H. 2011. Residential recycling: An industrial engineering approach to strategic waste collection. Masters Thesis. University of Pretoria, Pretoria. Available: http://repository.up.ac.za/bitstream/handle/2263/17952/DeVos_Waste(2011).pdf?sequence=1 [2015, 12 March]. Godfrey, L. 2008. Facilitating the improved management of waste in South Africa through a national waste information system. Waste Management, 28(9), pp. 1660-1671. DOI:10.1016/j.wasman.2007.06.002. Guerrero, L.A., Maas, G. &Hogland, W. 2013. Solid waste management challenges for cities in developing countries. Waste management, 33(1), pp. 220-232. DOI:10.1016/j.wasman.2012.09.008. Hazra, T. & Goel, S. 2009. Solid waste management in Kolkata, India: Practices and challenges. Waste Management, 29(1), pp. 470-478. DOI:10.1016/j.wasman.2008.01.023. Kamara, A.J. 2006. Household participation in domestic waste disposal and recycling in the Tshwane metropolitan area: An environmental education perspective. Masters Dissertation. University of South Africa, Pretoria. Available: http://uir.unisa.ac.za/bitstream/handle/10500/1460/dissertation.pdf [2015, 29 April]. Karak, T., Bhagat, R.M. & Bhattacharyya, P. 2012. Municipal solid waste generation, composition, and management: The world scenario. Critical Reviews in Environmental Science and Technology, 42(15), pp. 1509-1630. DOI:10.1080/10643389.2011.569871. Karani, P. &Jewasikiewitz, S.M. 2007. Waste management and sustainable development in South Africa. Environment, Development and Sustainability, 9(2), pp. 163-185. DOI:10.1007/s10668-005-9010-7. Kaundal, R. & Sharma, A. 2007. Problems of household waste disposal. Journal of Human Ecology, 21(3), pp. 199-201. Available: http://www.krepublishers.com/02-Journals/JHE/JHE-21-0-000-000-2007-Web/JHE-21-3-000-000-2007-Abstract-PDF/JHE-21-3-199-201-2007-1519-Kaundal-R/JHE-21-3-199-201-2007-1519-Kaundal-R-Tt.pdf [2015, 31 August]. Lyas, J.K., Shaw, P.J. & Van Vugt, M. 2005. Kerbside recycling in London borough of Havering: Progress and priorities. Resources, Conservation and Recycling, 45(1), pp. 1-17. DOI: 10.1016/j.resconrec.2004.12.001. Maluleke, P. H. 2014. A review of solid waste management practices in Polokwane city. Masters Dissertation. University of South Africa, Pretoria. Available: http://uir.unisa.ac.za/xmlui/bitstream/handle/10500/13385/dissertation_maluleke_ph.pdf?sequence=1 [2015, 22 June]. Mangizvo, R.V. & Wiseman, M. 2012. The management, practice and environmental health implications of the municipal solid waste dump site in Alice, South Africa. Online Journal of Social Sciences Research, 1(5), pp. 125-131. Available: http://jss.onlineresearchjournals.org/JSS/pdf/2012/aug/Remigios%20and%20Mupindu.pdf [2015, 15 April]. Miafodzyeva, S., Brandt, N. & Andersson, M. 2013. Recycling behaviour of householders living in a multicultural urban areas: A case study of Järva, Stockholm, Sweden. Waste Management & Research, 33, pp. 39-47. DOI:10.1177/0734242X13476746. Nahman, A. & Godfrey, L. 2010. Economic instruments for solid waste management in South Africa: Opportunities and constraints. Resources, Conservation and Recycling, 54(8), pp. 521-531. DOI:10.1016/j.resconrec.2009.10.009. Nzeadibe, T.C. 2009. Solid waste reforms and informal recycling in Enugu urban area, Nigeria. Habitat International, 33(1), pp. 93-99. DOI:10.1016/j.habitatint.2008.05.006. Oelofse, S.H.H. &Strydom, W.F. 2010. The trigger to recycling in a developing country – in the absence of command-and-control instruments. Proceedings of Waste 2010: Waste and Resource Management – Putting Strategy into Practice, pp. 355-364. Available: http://0-researchspace.csir.co.za.innopac.up.ac.za/dspace/bitstream/10204/4702/1/Oelofse5_2010.pdf [2015, 21 May]. Oelofse, S. 2012. All South African households in large centres to separate household waste by 2016. Available: http://www.csir.co.za/enews/2012_nov/01.html [2015, 2 April]. Pakpour, A.H., Zeidi, I.M. Emamjomeh, M.M. Asefzadeh, S. & Pearson, H. 2014. Household waste behaviours among a community sample in Iran: An application of the theory of planned behaviour. Waste management, 34(6), pp. 980-986. DOI:10.1016/j.wasman.2013.10.028.
356

Scheinberg, A., Spies, S. Simpson, M.H. &Mol, A. P. 2011. Assessing urban recycling in low-and middle-income countries: Building on modernised mixtures. Habitat International, 35(2), pp. 188-198. DOI:10.1016/j.habitatint.2010.08.004. Simelane, T. &Mohee, T. 2012. Future directions of municipal solid waste management in Africa. African Institute of South Africa, Pretoria. Available: http://dspace.africaportal.org/jspui/bitstream/123456789/33818/1/No.-81.-Future-Directions-of-Municipal-Solid-waste-Management-in-Africa.pdf [2015, 6 May]. Troschinetz, A.M. &Mihelcic, J. R. 2009. Sustainable recycling of municipal solid waste in developing countries. Waste management, 29(2), pp. 915-923. DOI:10.1016/j.wasman.2008.04.016. Ueta, K. & Harumi Koizumi, H. 2010. Reducing household waste: Japan learns from Germany. Environment: Science and Policy for Sustainable Development, 43(9), pp. 20-32. DOI:10.1080/00139150109604512. Vicente, P. & Reis, E. 2008. Factors influencing household’s participation in recycling. Waste Management & Research, 26, pp. 140-146. DOI:10.1177/0734242X07077371. Willig, C. 2013. Introducing qualitative research in psychology. 3rd ed. Berkshire: McGraw-Hill Education.
Appendix A Silverlakes Golf Estate
Appendix B Equestria Estate
357

358

PERFORMANCE BASED STANDARDS: A SUSTAINABLE SOLUTION FOR TRANSPORTATION IN SOUTH AFRICA
Robert BERMAN
1
Richardt BENADE 2 1 CSIR Built Environment, Email: [email protected] 2 CSIR Built Environment, Email: [email protected] Keywords: Fuel efficiency, Payload efficiency, Performance Based Standards, Road wear, Vehicle Safety
Abstract
The costs of logistics in South Africa are dominated by high transportation and fuel costs which are ultimately carried by consumers. An alternative regulatory framework for governing heavy vehicles is explored as a means to not only decrease the costs of transportation amongst heavy vehicles, but also to regulate safety of those vehicles. South Africa has one the highest rates of road deaths in the world, with the 2013 State of Logistics Survey estimating the cost of road accidents to the economy to be in excess of R15bn for 2012. A performance-based standards approach to regulating heavy vehicles allows for increased payload, whilst specifying stringent safety performance measures. This paper presents a comparative study between a current legal vehicle and a proposed PBS vehicle. The PBS combination, with a payload of 51 400 kg, was shown to meet all safety requirements for level two road access according to the South African Smart Truck program. In addition to vehicle safety, the PBS vehicle was found to cause 9.2% less road wear per tonne of payload than the legal vehicle. The PBS combination was shown to achieve an 11.4% reduction in fuel consumption per tonne of payload compared to the legal vehicle, on a return trip from the harbour in Durban to City Deep in Johannesburg and back. The potential savings that PBS vehicles offer exceed tens of billions of Rands each year in fuel savings, reduced damage to roads as well a reduced number of heavy vehicle accidents.
1. Background and Introduction
The 2013 State of Logistics Survey (CSIR et al, 2013) reports the costs of logistics for 2013 and 2014 totalling 12.5% and 12.8% of South African GDP, respectively. The overwhelming majority of those costs are attributed to transportation at 58.8 % for 2014, totalling R227bn. South Africa also has a disproportionately high road accident rate when compared to global standards, further adding to cost and reliability of transporting freight by road. Addressing these costs, as well the many other challenges South Africa faces in the transportation sector will not be elementary. The Performance-Based Standards (PBS) pilot project in South Africa is being run as an alternative framework for regulating heavy vehicles. Section 81 of the Road Traffic Act, 1996 (Act 93 of 1996)1 currently governs all vehicles using prescriptive limits, with the two main limits placed on heavy vehicles being overall vehicle length and mass. The PBS approach to heavy vehicle regulation, by contrast, specifies on-road performance and safety requirements, allowing a relaxation of vehicle mass and geometry. Prescriptive regulation, is simple to understand and easy to enforce, but does not adequately address the dynamic performance and efficiency of vehicles on the road. The PBS pilot project (or Smart Truck project) has been operational since 2007 (CSIR Built Envoronment, July 2015). The Smart Truck project) currently boasts 160 PBS vehicles on dedicated routes across South Africa, with a total of 55 million kilometres travelled to date2. These Smart Trucks have shown significant benefits with respect to vehicle safety as well as fuel and payload efficiency. PBS vehicles are classified into four levels of road access - level one having the most stringent performance requirements and level four the most lenient. Level one allows unrestricted road access, while level four is typically for road trains that operate on very specific, remote roads. The aim of PBS is achieving a better match between a vehicle’s performance and the road it operates on (NTC, 2008). The majority of PBS vehicles in South Africa operate with level two road access.
2. Literature Review
The University of Michigan Transport Research Institute (UMTRI) have done extensive research into the area of vehicle safety, finding that heavy vehicle rollover accidents cause, on average, greater damage and injury than other accidents. Heavy vehicle rollover is also strongly associated with accident severity and injury to both the driver and other road users (UMTRI, 2000). In the United States, UMTRI found that approximately one in four heavy vehicle accidents involved rollover, while more than twelve percent of 1 The legal dimensions and mass limits for vehicles operating on public roads are specified in the National Road Traffic Act, 1996 (Act 93 of 1996) and the National Road Traffic Regulations (2000). 2 CSIR monthly Smart Truck monitoring data
359

fatalities due to heavy vehicle accidents involved rollover. The percentage is even greater for fatalities to the truck driver at 58% (UMTRI, 2000). The high incidents of heavy vehicle rollover are attributed to the low level of roll stability for heavy vehicles. The Static Rollover Threshold (SRT) of a vehicle is a direct measure of a vehicle’s roll stability, defined as the steady state lateral acceleration that a vehicle can sustain without rolling over (NTC, 2008). Most passenger cars have SRT values greater than 1 g, while light trucks, vans and SUVs typically range from 0.8 to 1.2 g, however heavy vehicles typically have SRT values of less than 0.5 g due to their relatively high centre of gravity. UMTRI found that heavy vehicle drivers regularly operated their vehicles at well over 0.2 g (UMTRI, 2000). De Pont et al. present the relative crash rate versus SRT for rollover and loss-of-control crashes involving heavy vehicles in New Zealand, shown in Figure 1. The figure shows that vehicles with low stability (SRT less than 0.3 g) have a crash rate of over four times the average.
Figure 1 Relative Crash Rate vs SRT (De Pont et Al., 2002)
The National Road Transport Commission (NTC) of Australia published a study of vehicle safety for their heavy vehicle fleet, finding that the SRT values ranged from 0.24 g to 0.55 g, with a mean value of 0.39 g (NTC, 2002). There are therefore numerous vehicles operating well below the defined safety margin of 0.35 g and are thus not fit for service. A 2011 OECD study reported the truck fatalities per 100 million vehicle kilometres travelled per country, shown in Table 1 (OECD, 2011). The relative rate for South Africa is inordinately high and illustrates some of the challenges facing heavy vehicle transportation in the country. The majority of the R227bn cost of logistics in South Africa for 2013 was comprised of fuel costs, having increased from approximately R40bn to R110bn between 2009 and 2013. These figures, however, do not take into account externality costs incurred by the public as a result of freight transportation, such as accidents, emissions and congestion. The externality costs estimation for road accidents in 2012 are in excess of R15bn (CSIR et al, 2013). There is therefore a significant benefit that can realised for the entire South African economy by reducing both the fuel costs for moving freight, as well the accident rates of heavy vehicles. The 2013 state of logistics survey reported that between 2011 and 2012, the proportion of freight transported by rail was 11.4%, compared to 86.6% being transported via road, when comparing tonnage of freight transported. There has been growth in the market share of rail freight year-on-year for the past three years, however to continue this trend, a significant and sustained investment is required (CSIR et al, 2013). For the forseeable future, there will still be a substantial demand and market for transposrtation of freight by road.
Table 1 persons killed in truck crashes per 100 million km travelled (OECD, 2011)
Country Truck Fatalities per 100 million vehicle
kilometres travelled Year Country
Truck Fatalities per 100 million vehicle
kilometres travelled Year
South Africa 12.5 2005
Australia 1.7 2005
Switzerland 0.8 2005
Canada 2 2005
Belgium 1.9 2005
Sweden 1.6 2005
United States 1.5 2005
Great Britain 1.7 2005
France 2 2005
Denmark 3 2004
Germany 1.5 2006
360

PBS vehicles are not appropriate for all road freight operations due to the key benefits of PBS only being realised for high payload trips. PBS is therefore are best suited for primary distribution networks and are not ideal for intra-city, final delivery of retail products. A 2003 survey of the Australian road freight reported that the market penetration of PBS vehicles was 15% of all road freight (Bureau of Transport and Regional Economics, 2003). It is therefore reasonable to assume that a similar market penetration can be expected for South Africa in the coming years.
3. Research Methodology
This study compares the performance of an existing legal baseline vehicle to that of a proposed PBS combination in terms of vehicle safety, road wear, fuel efficiency and emissions.
3.1 Baseline and PBS Vehicle Designs
The Baseline combination used in the analysis is a typical 7-axle B-double, with a combination mass of 56 000 kg and overall length of 22 m, as shown in Figure 2. The truck-tractor chosen for the baseline vehicle was a Volvo FH 440 as it is an equivalent industry standard vehicle.
Figure 2 Schematic of the legal baseline vehicle (Courtesy of Afrit)
The PBS combination is an adaptation of the baseline vehicle, and employs one additional axle per trailer as shown in Figure 3. The added axles allows the PBS vehicle to have a combination mass of 73 500 kg, without exceeding legal axle loads. The overall length of the PBS combination is 22 250 mm. The truck-tractor for the PBS combination is a Volvo FH 520. The PBS combination exceeds the permissible maximum combination mass limit of 56 000 kg and the maximum length limit of 22 m, and would have to be operated under an exemption permit that is issued in terms of Section 81 of the Road Traffic Act, 1996 (Act 93 of 1996). Table 2 below summarises the vehicle parameters for both vehicles.
Figure 3 Schematic of the PBS combination (Courtesy of Afrit)
361

Table 2: Vehicle Parameters
Baseline PBS Tractor Volvo FH 440 Volvo FH 520 Tractor tare mass (kg) 9 484 9 661 Leader tare mass (kg) 4 500 6 550 Follower tare mass (kg) 5 400 5 900 Tare mass (kg) 19 384 22 111 Payload (kg) 36 600 51 400
3.2 Vehicle Safety Analysis
Vehicle safety for both the baseline and proposed PBS vehicles were assessed in line with the rules of the Australian Performance-Based Standards (PBS) Scheme as compiled by the Australian National Transport Commission (NTC) and governed by the Australian National Heavy Vehicle Regulator (NHVR). The definitions and requirements used are as per the “Standards and Vehicle Assessment Rules” document
3 (NTC, 2008), subject to the additional requirements and amendments prescribed by the South African Smart Truck Review Panel. The manoeuvres/tests considered and the associated safety standards assessed are shown in Table 3. TruckSim® 8.1, a multi-body vehicle dynamics software package, was used to analyse vehicle performance for the PBS standards given below.
Table 3: Manoeuvres/tests and associated performance standards
Manoeuvre Performance Standards
Accelerate from rest on an upgrade (1) Startability
Maintain motion/speed on an upgrade (2) a. Gradeability A (maintain motion) b. Gradeability B (maintain speed)
Cover 100 m from rest (3) Acceleration Capability High speed travel on a straight and uneven road (4) Tracking Ability on a Straight Path
Low-speed 90° turn
(5) Low-Speed Swept Path (6) a. Frontal Swing
b. Maximum of Difference (semitrailers only) c. Difference of Maxima (semitrailers only)
(7) Tail Swing (8) Steer-Tyre Friction Demand
Constant radius turn (increasing speed), or tilt-test (9) Static Rollover Threshold
High-speed lane-change (10) Rearward Amplification (11) High-Speed Transient Offtracking
Pulse steer input (12) Yaw Damping Coefficient
3.3 Road Wear Analysis
Road wear calculations are based on the determination of a Load Equivalency Factor (LEF) for a vehicle combination. The LEF expresses the road wear in terms of the number of Standard Axles that would cause the same road wear. A Standard Axle is defined as a single axle, with dual wheels, with a total mass of 8 200 kg (80 kN) and a tyre contact stress of 520 kPa. The LEF for a vehicle is calculated as the sum of the ratio of the estimated critical pavement layer life under each individual axle of the vehicle relative to the Standard Axle bearing capacity for each of the typical road pavement structures analysed. The mePADS
4 software package developed by the CSIR, based on the SA Mechanistic Pavement Design Method, was used to assess road wear for each combination. Eight pavement structures, considered representative of the South African road network, were analysed. For each pavement structure, the critical pavement layer life and bearing capacity were calculated using the software. In order to compare the road wear caused by different vehicles, the concept of payload efficiency is applied. Applying this concept, the road wear caused by a vehicle is expressed as a ratio of the payload that such a vehicle transports.
3 Available at https://www.nhvr.gov.au/files/resources/0020-pbsstdsvehassrules.pdf 4 Mechanistic Empirical Pavement Design and Analysis Software. CSIR Built Environment (CSIR BE), Pretoria, South Africa, 2008. See website: http://asphalt.csir.co.za/samdm/
362

3.4 Fuel Efficiency and Emissions
TransSolve is a software suite of analysis modules for analysing various aspects of the road logistics industry. The Performance module was used to simulate both the baseline and PBS vehicle combinations on a return route from the Durban harbour in Bayhead Road, to City Deep on Heidelberg Road, Johannesburg. The analysis considered the characteristics of the proposed route, including intersections and elevation changes as well as the specific engine and drivetrain parameters of each truck-tractor. The analysis considered the distance of each leg, average speed, fuel consumption as well as CO2 emissions.
4. Findings and Discussion
4.1 PBS Results
The results of the PBS analysis for both the PBS and baseline combinations are summarised in Table 4.
Table 4: PBS Results
The PBS combination performs well in all standards, meeting the requirements for level 2 road access, limited by performance in the Gradeability A and high-speed transient offtracking standards (HSTO). The baseline combination performs well in most standards however only achieves level 2 performance in the low-speed swept path (LSSP) standard and fails the maximum of difference standard (MoD). The baseline combination therefore fails the PBS assessment. The baseline outperforms the PBS combination in the longitudinal standards, as well as the static rollover threshold. This is firstly due to the difference in combination mass of the two vehicles and secondly as a result of the PBS combination being able to load more payload onto the same deck space, meaning that the centre of gravity (CoG) of the payload is higher than on the baseline combination.
4.2 Road Wear Results
The mePADS analysis was performed per vehicle for each of the eight pavement structures in a relatively dry state and in a relatively wet state. An average value was then calculated per vehicle per pavement structure, as well as an overall average for the eight pavement structures per vehicle. These results are summarised in Table 5 for the LEF per vehicle, as well as the LEF per 1 000 kg payload. Table 5 shows that the PBS combination causes on average 29.0% more road wear than the baseline combination, when considering absolute LEF per vehicle. However considering the payload efficiency, the PBS combination causes 9.2% less road wear than the baseline combination. The PBS combination uses 24.4% more fuel than the baseline combination for the round trip, resulting in 465 kg of additional CO2. Considering payload efficiency however, the PBS combination consumes 11.4% less fuel than the baseline vehicle per tonne of payload transported, and thus 11.4% less CO2 emissions. The average speed of the PBS combination for the return trip is 7.3% lower than that of the baseline vehicle, resulting in an increase in trip time of 80 minutes.
15 Level 1 17 Level 1 ≥ 15% ≥ 12% ≥ 10% ≥ 5%
19 Level 2 20 Level 1 ≥ 20% ≥ 15% ≥ 12% ≥ 8%
85 Level 1 86 Level 1 ≥ 80 km/h ≥ 70 km/h ≥ 70 km/h ≥ 60 km/h
17.6 Level 1 16.8 Level 1 ≤ 20.0 s ≤ 23.0 s ≤ 26.0 s ≤ 29.0 s
2.9 Level 1 2.9 Level 1 ≤ 2.9 m ≤ 3.0 m ≤ 3.1 m ≤ 3.3 m
7.3 7.2 Level 1 7.7 7.6 Level 2 ≤ 7.4 m ≤ 8.7 m ≤ 10.6 m ≤ 13.7 m
0.6 0.6 Level 1 0.4 0.4 Level 1n/a n/a Level 1 0.17 0.18 Level 10.37 0.34 Level 1 0.54 0.53 Fail
0.08 0.08 Level 1 0.02 0.02 Level 1 ≤ 0.30 m ≤ 0.35 m ≤ 0.35 m ≤ 0.50 m
35 28 Level 1 28 29 Level 10.35 Level 1 0.39 Level 11.21 Level 1 1.14 Level 10.7 Level 2 0.5 Level 1 ≤ 0.6 m ≤ 0.8 m ≤ 1.0 m ≤ 1.2 m
0.28 Level 1 0.28 Level 12.00 2.22
≤ 5.7·SRT_rrcu*
≥ 0.15
Load condition: Laden Unladen Level 4Level 3Level 2Level 1
Maximum of Difference (m)Tail Swing (m)
Startability (%)
Low Speed Swept Path (m)
Required performance
≤ 0.20 m
≤ 0.7 m
≥ 0.35·g
≤ 80%
≤ 0.40 m
BaselineBaseline
ResultLaden Unladen
PBS
Result
PBS
* 5.7·SRT_rrcu (g)
Gradeability A (Maintain motion) (%)Gradeability B (Maintain speed) (km/h)Acceleration Capability (s)Tracking Ability on a Straight Path (m)
Steer-Tyre Friction Demand (%)Static Rollover Threshold (g)Rearward AmplificationHigh-Speed Transient Offtracking (m)Yaw Damping Coefficient @ 80 km/h
Frontal Swing (m)Difference of Maxima (m)
363

Table 5: LEFs for PBS combination and baseline combination
Pavement LEF/vehicle
Difference: Baseline vs
PBS Combination
LEF/1 000kg payload
Difference: Baseline vs
PBS Combination
Baseline PBS Baseline PBS
Pavement A ES100 4.67 5.76 23.5% 0.13 0.11 -13.0% Pavement B ES100 4.43 5.36 21.0% 0.12 0.10 -14.8% Pavement C ES0.1 5.61 7.13 27.1% 0.16 0.14 -10.5% Pavement D ES0.1 9.78 14.42 47.4% 0.27 0.28 3.8% Pavement E ES30 6.50 8.27 27.2% 0.18 0.16 -10.4% Pavement F ES1.0 5.12 6.42 25.5% 0.14 0.12 -11.6% Pavement G ES10 7.03 8.87 26.2% 0.19 0.17 -11.1% Pavement H ES0.3 7.15 9.12 27.6% 0.20 0.18 -10.1% Average 6.29 8.11 29.0% 0.17 0.16 -9.2%
4.2 Fuel Efficiency Results
Durban to JHB JHB to Durban Total
Baseline PBS Baseline PBS Baseline PBS Distance (km) 562.6 563.7 1126.3 Fuel used (L) 393 486 333 417 726 903 Fuel used (L/tonne) 10.7 9.4 9.1 8.1 9.9 8.8 Fuel Consumption (L/100km) 69.8 86.3 59.1 74.0 64.5 80.2 Fuel Cons per tonne payload (L/100km.tonne) 1.907 1.680 1.616 1.440 1.761 1.560 CO2 (kg) 1 031 1 275 875 1 096 1 906 2 371 CO2 (kg/100km) 18 23 16 19 16.925 21.057 CO2 per tonne payload (kg/100km.tonne) 0.501 0.441 0.424 0.378 0.462 0.410 Average Speed (km/h) 57.8 53.9 58.8 54.2 58.3 54.1
Assuming a 10% market penetration of PBS vehicles for freight transport in South Africa, the 11.4% increase in fuel efficiency of the PBS combination over the baseline vehicle would result in a fuel saving of R9.7bn relative to the 2013 fuel costs of R110bn for a single calendar year. Much of the costs that heavy vehicle operators are able to save can be passed on to their clients and ultimately onto consumers. This would have a direct impact on both the costs of living as well as to the cost of doing business in South Africa. The increase in payload that the PBS combination is able to achieve will result in a reduction in the number of trips required to transport a fixed load. In many current PBS applications, this is evidenced by a reduction on the fleet size of vehicles required for a specific operation. This reduction in number of vehicles also leads to a reduction in traffic congestion.
5. Conclusions and Further Research
The proposed PBS combination is capable of transporting a payload of 51 400 kg with the following benefits: The PBS combination meets the requirements for level 2 road access, and thus vehicle safety is not
compromised. A 9.2% decrease in road wear is achieved in relation to the baseline vehicle An 11.4% increase in fuel efficiency is achieved over the baseline vehicle leading to a potential
R9.7bn saving in fuel in a year if PBS vehicles are able to reach a 10% market share. Performance based standards as a regulatory framework for governing heavy vehicles offers a
viable, sustainable and cost saving alternative to the current prescriptive NRTA. PBS vehicles display the potential to reduce congestion on main transport corridors, reduce the
damage done to roads, increase fuel efficiency and save the South African economy tens of billions of Rands each year.
PBS safety assessments are time-consuming to conduct, and require a specialised skillset, resulting in an assessment fee of over R60 000 per vehicle design. The CSIR, in partnership with the University of the Witwatersrand, are in the process of developing a semi-prescriptive, or pro-forma approach for assessing Smart Trucks. For a specific vehicle configuration class, a pro-forma design specifies limits on vehicle design
364

parameters, such that within the specified envelope, the vehicle will meet all PBS requirements. One such pro-forma design is the low-speed car-carrier design (Benade et al., 2015). Benade et al. estimate that pro-forma designs would save the car-carrier industry R1.2m in PBS assessment fees per year. Future work will involve the development of a high-speed PBS pro-forma design for various vehicle combinations, such as car-carriers, as well as for the seven and nine axle B-double combinations presented in this paper.
7. References
Benade, R., Berman, R., Kienhofer, F., & Mordengen, P. (2015). A Pro-Forma Design for Car-Carriers: Low-Speed Performance-Based Standards. 34th South African Transport Conference, ISBN: 978-1-920017-63-7, (pp. 253 - 265). Pretoria. Bureau of Transport and Regional Economics. (2003). Working Paper 60: An Overview of the Australian Road Freight Transport Industry. Canberra, Australia: Bureau of Transport and Regional Economics, ISBN 1-877081-44-2. CSIR Built Envoronment. (July 2015). Smart Truck Programme - Rules for The Development and Operation of Smart Trucks as Part of The Performance-Based Standards Research Programme in South Africa ver 17. Pretoria: CSIR Built Envoronment. CSIR, Stellenbosh University, Imperial Logistics. (2013). 10th Annual State of Logistics Sutvey for South Africa. Pretoria: CSIR. de Pont, J. J. (2012). High productivity motor vehicles – New Zealand’s approach. Proceedings of the Twelfth International Symposium on Heavy Vehicle Transport Technology. Stockholm, Sweden. de Pont, J., Baas, P., Hutchinson, D., & Kalasih, D. (2002). Including Performance Measures in Dimensions and Mass Regulations. 7th International Symposium on Heavy Vehicle Weights and Dimensions, vol. 41001, July, pp 349-358. mePADS. (2008). Mechanistic Empirical Pavement Design and Analysis Software. Pretoria, South Africa: CSIR Built Environment (CSIR BE). National Road Transport Commission. (2002). Performance Characteristics of the Australian Heavy Vehicle Fleet: Summary. Melbourne: National Road Transport Commission, ISBN 1 877093 06 8. Nordengen, P. A. (2014). The Development and Evaluation of a Performance-Based Standards Approach for Regulating the Use of Heavy Vehicles in South Africa. Durban: College of Agriculture, Engineering and Science University of KwaZulu-Natal. NTC. (2008). Performance based standards scheme – The standards and vehicle assessment. Melbourne, Australia: National Transport Commission. OECD. (2011). Moving Freight with Better Trucks: Improving Safety, Productivity and Sustainability. Paris, France: OECD Publishing, ISBN 978-92-821-0293-0. UMTRI. (2000, December). Rollover of Heavy Commercial Vehicles. UMTRI Research Review, Volume 31, Number 4, Volume 31, Number 4.
Appendix A. The Performance Based Standards
Startability (ST) is the maximum upgrade on which the vehicle can start from rest. Gradeability A (GraA) is the maximum upgrade on which the vehicle can maintain forward motion. Gradeability B (GraB) is the maximum speed that the vehicle can maintain on a 1% upgrade. Acceleration Capability (Acc Cap) is the time taken for the vehicle to cover 100 m, starting from rest on a 0% grade. Tracking Ability on a Straight Path (TASP) is the total amount of road width used by the vehicle when travelling at high speed along a straight road with an uneven and cross-sloping surface as the trailing units deviate from the path of the hauling unit. Low-Speed Swept Path (LSSP) is the amount of road width required by the vehicle when executing a prescribed low-speed 90° turn as the trailing units track inside of the path followed by the hauling unit. Tail Swing (TS) is the amount which the rear outside corner of a vehicle unit swings out at the commencement of the prescribed low-speed 90° turn. This may cause collisions with objects in adjacent lanes or on the roadside. This is of particular concern for vehicle units with a large rear overhang. Frontal Swing (FS) is the amount that the front outside corner of the hauling unit swings outside of the path followed by the widest section of the vehicle in the exit region of the low-speed 90° turn. For semitrailers, Maximum of Difference (MoD) and Difference of Maxima (DoM) pertain to the amount by which the front outside corner of a semitrailer swings out beyond that of the hauling unit or preceding semitrailer.
365

Steer-Tyre Friction Demand (STFD) is the proportion of the available friction that is used by the vehicle’s steer tyres when performing the low-speed 90° turn. This is of particular concern for vehicles with a tri-drive prime mover. Static Rollover Threshold (SRT) is the maximum steady state lateral acceleration that can be sustained in constant-radius high-speed turn and directly measures the vehicle’s rollover stability. SRT is alternatively measured using a tilt-table test. Rearward Amplification (RA) is a measures of the degree to which the lateral acceleration of the towing unit is amplified in the trailing units in a high-speed single lane-change manoeuvre. This is important for predicting the likelihood of rollover of the rearmost unit during a rapid avoidance manoeuvre. High-Speed Transient Offtracking (HSTO) is the excess lateral displacement, or overshoot, of the rearmost axle of the vehicle when performing the same prescribed lane-change manoeuvre as used for the Rearward Amplification test. This indicates the amount which the vehicle will deviate out of its own lane. Yaw Damping Coefficient (YD) is the rate at which yaw oscillations or “snaking” decay after a severe steering input at high speed.
366

REFLECTIVE PRACTICE AS BASIS FOR SUSTAINABLE TRANSFORMATION A PEDAGOGICAL CHALLENGE
Lindokuhle MATSEBULA1
Chrisna DU PLESSIS2
1Department of Construction Economics, Faculty of EBIT, University of Pretoria, Email: [email protected]
2Department of Architecture, Faculty of EBIT, University of Pretoria, Email: [email protected] Keywords: sustainability, ecological worldview, experiential learning, education for sustainable education, regenerative sustainability
Abstract It is becoming clear that shifting towards a more sustainable global social-ecological system will require not just changes in technological and economic systems, but also deep-seated personal transformation that can drive alternative behaviours. This level of transformation requires a shift towards a relational worldview that sees the world as interconnected and interdependent complex system in which small actions can have large effects. This, in turn, introduces a range of values, beliefs and practices that differs from the reductionist worldview that is criticised for creating current unsustainable conditions and practices. Education remains a critical tool for changing attitudes and beliefs and the field of education for sustainable development is promoting experiential educational methodologies with their emphasis on reflective practices, as one of the more effective ways of affecting this transformation. The paper will explore this pedagogical approach further in the context of built environment education, drawing on the course VKN 320 presented at the University of Pretoria, to ask how to effect this transformation through pedagogical interventions in the teaching of sustainable construction. The course itself is a quasi-experiment and the paper investigates its success in affecting a shift in worldview.
1. Introduction A concept introduced in the global political discourse with the Cocoyoc Declaration (UNEP/UNCTAD, 1974), the issue of sustainability continues to grow in importance. Twenty years after Cocoyoc, Orr (1994:3) wrote that there are three crises looming: a food crisis, a crisis caused by the ending of the era of cheap energy and lastly, a crisis based on exceeding ecological thresholds and the limits of natural systems. Move forward another couple of decades, and current scientific findings on climate change and other ecological thresholds (e.g. Steffen, et al., 2015)indicates that early warnings have largely fallen on deaf ears, with a lot of lip service paid to sustainability, but very little action taken at meaningful scales.The result being that, as Winston Churchill (1936) put it: “we are entering a period of consequences”. While the sustainability debate has cycled repeatedly through technological, political and economic solutions (Du Plessis, 2012), there is a growing realisation that these approaches will only succeed if there is a change of heart; if people’s values, beliefs and other constructs are aligned to sustainable practices. Sustainability needs to begin with self. Murray (2011:x) suggests that people are aware of what sustainability entails, but that information is not permeating and influencing their personal choices. On the professional side, they can tick the boxes regarding the comprehension of the concept, but on the personal side, their practices indicate a lack of personal development regarding the sustainability agenda. Furthermore, Murray suggests that personal values, attitudes and beliefs are central in determining our response to sustainability. Education remains a critical tool for changing attitudes and beliefs, and inspiring action for change (Anderson 2012:193). It therefore features prominently in the sustainability agenda. In 2002, the United Nations General Assembly declared 2005 to 2014 as the United Nations Decade for Education for Sustainable Development (DESD), with the intention of asserting the role of education in realising a more sustainable world (Wals, 2014:8). Higher Education Institutions (HEIs) have also embraced education for sustainable development (ESD) through adding modules or courses with ESD content or through integrating ESD in existing ones (Wals, 2014:10). Nevertheless, despite all this education on sustainability, there is a growing concern about the lack of progressin reducing the negative ecological impact of humankind on planetary support systems. Orr (1994:7-15) attributes this to the kind of education we have, suggesting that it is premised on epistemologies promoting fragmentation and mutual exclusivity. This thinking is attributed to Galileo and Descartes, the former esteeming the analytical mind over the creative and emotive part, and the latter separating mind and matter (Du Plessis and Brandon, 2014;Capra, 1997). This kind of thinking that sees the world as divisible into mutually exclusive components is reflected in our education systems through courses that are discipline orientated (Orr 1994:11), with little interdisciplinary interaction. It is also reflected in our unsustainable development models that allow the exploitation of the Earth’s resources without understanding the ecological relationships. We therefore need a different kind of education - atransformational approach to education that will develop a new relational worldviewto replace the mechanistic one that has created the
367

current unsustainable development model(Hes & Du Plessis 2015:24).The challenge is to develop such an educational approach. In 2013 the Department of Construction Economics at the University of Pretoriaintroduced a course in Sustainable Construction which implemented a hybrid teaching model, combining instructional teaching and experiential education, to address this challenge. The success of this model in instilling an ecological worldview is the focus of this study.
2. Literature review The development of this model required exploration of three different aspects: the concept of an ecological worldview and the skills set it would require; the idea of the ‘sustainable self’ (Murray, 2011) and the required personal transformation; and an investigation into suitable pedagogical approaches.
2.1 The ecological worldview Capra (1997:4) proposes that many environmental and social problems are facets of a greater concern, the crisis of perception. He states that we are instructed by an outdated worldview that cannot handle the reality of an overly populated and globally interconnected world, and need a new paradigm that can deal with this reality. A shift in worldview, from a mechanistic to a holistic and integrated one is required to change the detrimental course of the current development trajectory and this shift is already happening (Du Plessis, 2009:102,344). Capra (1997:6)proposes that “the new paradigm may be called a holistic worldview, seeing the world as an integrated whole rather that a dissociated collection of parts”. Goldsmith (1988) decided to use ‘ecological’ to describe this emergent, holistic and integrated perspective. He stated that ‘ecology’ is, among other things, a non-disciplinary study, holistic, subjective and emotional. The ‘ecological worldview’ then becomes a perspective that appreciates the interconnectedness of the world, and that whole is more than the sum of its parts (Smuts 1987). Capra (1997:6) concurs and suggests that ‘ecological’ be used instead of ‘holistic’, as holistic speaks of components and their interdependencies while ecological also includes environment, as all systems exist within a context. This allows our global image to shift from a fragmented world to one founded upon whole systems thinking (Du Plessis, 2009:4), and specifically relevant to living systems (Capra, 1997:35). In this view, the world can be seen as “a fundamentally interconnected, complex, living and adaptive social-ecological system that is constantly in flux” in which humans are seen as “an integral part of nature and partners in the processes of co-creation and co-evolution instead of being merely users or clients of various ecosystem services” (Du Plessis, 2012:15). Senge (1999:69) describes systems thinking as a framework for seeing wholes, interrelationships, and patterns of change; and, as Capra (1997:30) explains, it is contextual – meaning that, to understand something, it has to be put into the context of a larger whole. Wilber (2001:113) suggests the term ‘holographic paradigm’ to refer to his understanding of an emerging worldview that sees the whole in the part. He refers to this as an integral paradigm that would “include not only the ‘hard-ware’ of physical sciences but also the ‘software’ of philosophy and psychology and the ‘transcendental ware’ of mystical-spiritual religion” (Wilber, 2001:1). From these positions it can be argued that the most important skills to develop, enable and support an ecological worldview are systems thinking and integral thinking – seeing relationships and flows, seeing wholes and the self as part of the whole; and the psychological re-integration of humans into nature.
2.2 Developing the sustainable self We are beings whose existence is based on systems (Hes & Du Plessis, 2015:27), from respiration to digestion; our cognitive functioning is no different. Behaviour is inspired by attitude, and attitude is inspired by information (Maio & Haddock, 2010). This information is not held remotely by our cognitive functioning, but is intertwined with and informed by our values, religious inclinations, locality, history, emotions, etc. in an equally interconnected system. Experiential learning looks at education in this manner, in a holistic, systems-based approach, focusing on developing the individual - it seeks to develop the sustainable self. To change society, change must begin with self as in understanding the complexities of self, and the systems understanding that can be brought into practice(Pappas & Pappas 2014:12-13). This position is not without opposition, as some commentators state it brings us to the place of autonomous self, thus working contrary to the interdependent and systemic approach needed for sustainability (Jucker, 2012). Sustainability in the self means the embodiment of ecological values, and reflecting these in the way we live, think and work. It is about acknowledging that external barriers to change exist, but working to change the internal ones, ones that each of us can work on (Murray 2011:2). Du Plessis (2013) identified 10 such values, acknowledging that these are not the only ones underlying the ecological worldview, but appreciating that they are fundamental. During 2012 a series of in-depth interviews were conducted with over fifty people from around the world to understand the change that needs to occur in the way practitioners live, think and work (Hes & Du Plessis,2015:10). These interviews highlighted a number of lessons in three key areas: 1) how to change professional practice; 2) the different role the practitioner has to play in the project over its lifetime; 3) and the personal development that is necessary to become an effective regenerative development and design practitioner. Five lessons were identified that points to the personal transformation that is required. The first is that practitioners must be prepared to integrate levels and cross lines. These levels are those of development, in which the practitioner moves from the baseline of green building to regenerative work, and from thinking in dualities (e.g. interior-exterior; humans-nature; us-them) to thinking in wholes. The second lesson learnt is
368

that practitioners must live like impeccable warriors. This means that they must be willing to express their emotions, to share feelings and thus allowing collaboration of a higher order. The third lesson is that practitioners need to put roots down that will anchor and sustain them. There is a need to take care of self, to nurture not only the body but also the soul and spirit. It also means connecting with nature and the communities where they live, to remain conscious of the interconnectedness that they must bring into their work. The fourth lesson learnt is living with integrity. This means that one must behave consistent with an internal framework of principles and integrate elements of self into a harmonious whole. The last lesson identified is not being a lazy thinker. Practitioners need to put the time in to thoroughly apply their minds to be able to deal with complexities. They need a reflective contemplative approach to the information they deal with, and extend this critical reflection to what others have done. This is to safeguard against fallacies, dangerous assumptions and inaccurate argumentation. Hes and Du Plessis (2015:215–225) further discuss how one can be part of the change without being overcome by the daunting scale of action needed. They suggest that one must look at individual actions as dropping a pebble in the pond. This is to say that we just need to do what we can, that through leveraging the power of self-organisation, small actions can cause ripple effects in the lives of others and bring about great change. These kinds of actions include doing random acts of kindness; senseless acts of beauty (e.g. yarn bombing, guerrilla transformations of objects in public spaces, certain graffiti types and art installations in downtrodden spaces), guerrilla gardening and tactical urbanism.These lessons also form the basis for the experiential learning approach that was developed, as described in Section 3 below.
2.3 Pedagogical approaches Having understood the worldview and skills set we desire to develop in people, we need to find an educational approach fit for purpose. Our current dominant approach consists largely of instructional learning, which is designed to teach the individual from outside inward. Students are subjected to a mechanistic learning environment, which limits their participation in the learning process. Educators alike are forced to adhere to elaborate teaching guides and teaching material, aimed at channelling them into a specific paradigm(Duobliene 2013:41). The success of students is measured in their ability to do rigorous note taking and regurgitate that information in assessments, with the learning environment non-conducive for participation or creativity (Owens 2013). Sterling (2003:205) calls instructional learning a transmissive educational methodology (practice), which he states is all about transferring knowledge. Furthermore, he states that change in education is imposed through direction and is non-participative, unlike the transformative (experiential) educational methodology. Historically, the basic goal of education has been to teach students how to think (Wilke, 1993:32). The general critique of instructional learning is that it does not afford much opportunity for critical thinking. Critical thinking is an important element in sustainability education, in allowing a student to create knowledge for themselves with guidance from the educator. Ketlhoilwe (2010:144) suggests that sustainability education was designed to develop critical thinking as a means to induce behavioural and attitude change. Duobliene (2013:41-43) further states that instructional learning is a unilateral process, allowing no feedback. Feedback, in this regard is dialogue (understanding from group interactions) and critical thinking (understanding from individual reflection). This is reiterated by Sterling (2003:205) where he states that a transformative (experiential) educational methodology allows students to create and own meaning. Instructional learning functions in disciplines, in neat boxes, and this very approach creates the impression that the world is like that (Orr, 1994:23). Experiential learning, also known as phenomenological learning, aims to teach an individual from the inside out. It is important to draw a distinction between experiential education and experiential learning. Experiential learning, more commonly known as ‘learning by doing’, is but a subset of experiential education (Roberts 2013:3). The Latin root for the word education is ‘educere’, which means ‘to draw out’. Ketlhoilwe (2010:146) states that whichever learning approach is used, it must offer experiential learning opportunities which will draw out the socio-ecological experiences of students that will complement the theoretical framework of the teaching and learning process. Both instructional and experiential learning are utilised in sustainability education, but the argument is for more of the latter and less of the former. It is an argument for subsuming rather than one of negating (Sterling, 2003:206). In developing an ecological worldview, a systemic approach is required and this is best satisfied by experiential learning. Our understanding and application of experiential learning is largely attributed to the works of David A. Kolb (Kolb, 1984), with regards to his experiential learning theory (ELT) model and his learning styles inventory (LSI). Kolb proposed that learning happens in a four-step cycle (ELT), and that learners prefer to learn in one of four styles (LSI). Kolb refers to three models of experiential learning.First is the Lewinian Model of Action Research and Laboratory Training, based on work done by Kurt Lewin. This model is the more commonly used one, due to its comprehensiveness. The second is John Dewey’s Model of Experiential Learning. Lewin expanded on this model in creating his own, and included group dynamics and action research to Dewey’s framework. Dewey expounds more on the developmental nature of the learning process, and how experiences of our environment are ultimately transformed into purpose (Kolb, 1984:22). The third is Jean Piaget’s Model of Learning and Cognitive Development – Piaget is the founder of the Theory of Constructivism. Piaget’s focus is on the stages of cognitive growth that an individual goes through. These four stages span the years one to fourteen. He highlights that individuals develop from a phenomenal worldview, characterized by individuals fascinated by stimuli e.g. a child playing with toys, encountering fire for the first time etc. Ultimately, they possess an abstract constructionist worldview, where the individual is making sense of their world through reflection e.g. finding the moral of a story (Kolb, 1984:23–25).
369

These three models are similar in several aspects. The first aspect is that all reflect the cyclical nature of learning: we experience, reflect, draw conclusions and then test those conclusions. There is therefore no pinnacle in learning because our environment is always changing. This means that what was an accepted theory a while ago, may fail in application today. The second aspect is that the models indicate that learning is developmental in nature. Learning changes not only the mind, but alters our value systems, our perceptions, beliefs and emotional condition. The third aspect is that underpinning such learning is an interaction between the individual and the environment. All three indicate that learning cannot be done in isolation, as is the case with instructional learning. Information requires context to truly bring understanding. This is why there is a drive for teaching with locality in mind. What is taught by educational programmes should take into consideration the prevailing local conditions (Ketlhoilwe, 2010:143).
3. The Course Module With the above lessons and pedagogical approaches in mind, a quasi-experiment was conducted to investigate the effectiveness of using an experiential and reflective educational model in developing an ecological worldview. The vehicle for this experiment was theSustainable Construction (VKN 320) module, which focuses on sustainability education or education for sustainable development (ESD).The module consists of three themes: a) Sustainability Literacy; b) The Sustainable Self; and c) Becoming a sustainability practitioner. While there was a component of instructional teaching in all three themes, the main focus was on reflective individual and group exercises. Group exercises included in-class systems thinking exercises and reflections. The individual exercises (tasks) are grouped into assignments structured as described in Table 1.
Table 1VKN 320 Individual assignments
ASSIGNMENT AND TASKS DESCRIPTION
Assignment 1: My contribution to the problem Task 1: My ecological footprint The tasks in this assignment were intended to make the students aware of their direct
relationship with the natural resource base through calculating their ecological footprints; keeping track of their waste; and experiencing what it feels like to live on five litres of water a day.
Task 2: Waste not, want not
Task 3: Understanding scarcity
Assignment 2: Exploring alternate futures Analysing a dystopian/post-apocalyptic novel
In this assignment students were made aware of the behaviours of complex systems by identifying patterns of self-organization and chaos theory in the literature example. They were also asked to reflect on the likelihood of their futures playing out in a dystopian society, with reference to climate change, socio-economic fault lines and technological development, and their own readiness for living in such a world. The intention of this exercise was to introduce complex systems thinking and its real world applications and develop basic scenario thinking skills, identifying critical factors in social and technological development that shape future development pathways and the possible unintended consequences of these.
Assignment 3: Seeing the world differently Rice experiment This assignment built on the work of Masaru Emoto and the intention was to challenge
students’ perceptions and open their minds to the possibility that we may be connected to each other and the world around us in ways we do not yet understand, that our consciousness can influence the world around us, as implied by the theories of quantum physicists such as David Bohm, Ervin Lazlo and Frijtof Capra, and to think about what this could possibly mean for how we should behave.
Assignment 3: Connecting to change the world Task 1: Mindful eating These series of tasks relate directly to the development of the sustainable self; developing
the students’ skills in mindfulness and the ability to reflect on their own thought processes, and develop emotional and physical states that will help them to change their own behaviour in ways that will increase both personal and planetary wellbeing.
Task 2: Going barefoot
Task 3: Being grateful
Task 4: Random acts of kindness
Task 5: My ten commitments 1 Dr Masaru Emoto was a Japanese scientist who investigated the effect of a number of factors, including emotions, prayer and exposure to images and music, on water, and by extension, living cells
4. Research Methodology This study compared the sustainability consciousness of students before and after the intervention (VKN 320 classes). The population comprised of the 2013 class for the VKN 320 module, comprising of 139 students. A questionnaire was disseminated during the beginning of the semester (July) and again at the end of the semester (October). It comprised of 22 questions using a 5-point Likert scale. The questionnaire was based on the New NEP (New Ecological Paradigm) scale (Dunlap, et al., 2000), with some adapted questions and
370

some additional questions to test systems thinking. The questions adapted from the New NEP scale were questions 9, 10, 12 and 22. These in the New NEP scale are questions 10, 4, 9 and 7 respectively. New NEP question 10 focuses on Ecocrises, while 4, 9 and 7 all focus on Anti-exceptionalism. The other questions focus on values associated with the ecological worldview. The questionnaire is available in Annexure A. In collecting the data, the completion of the questionnaires was done during class time. Students participating signed consent forms and each chose their own pseudonym, which was used in both questionnaires. This was to enable a comparative analysis to be conducted without revealing the identities of the students. Students were requested to record their pseudonym, to be able to use it again in the second round of questionnaires. Of the 139 students in the class, 139 completed the July questionnaire and 85 completed the October one. Of all the respondents, 42 cases could be matched, as they had the same pseudonym in both July and October. These form 30% of the population, are reflective of the population and were used to do the comparative analysis. The unmatched cases were used for a descriptive statistics analysis. Data analysis was performed on IBM SPSS 22. The questionnaire had disproportional directionality. Of the 22 questions, only 3 were in the ‘anti-ecological worldview direction’. These are questions 2, 12 and 16. For analytical purposes, the three questions were changed to a ‘pro-ecological worldview’ direction in SPSS. The reliability test of the questionnaire was conducted. Forty two of the responses permitted a comparative study, where a two related samples t-test was conducted to evaluate more accurately the effect of the intervention. The data failed to meet the assumptions of the parametric dependant t-test. So the non-parametric Wilcoxon Signed Ranks Test was used to determine if there was a significant difference between the first and second questionnaires, thus determining the effectiveness of the intervention. The Chronbach alpha for both the July and October populations was adequate, being 0.867. For questionnaires, an acceptable value is α≥0.7. Therefore, this alpha value is relatively high. Occasions reliability and factor analysis were not conducted.
5. Findings and Discussion
5.1 Descriptive statistics Table 2Descriptive statistics
JULY DESCRIPTIVE STATISTICS OCT DESCRIPTIVE STATISTICS
N
Med
ian
Mod
e
Std
. D
evia
tion
N
Med
ian
Mod
e
Std
. D
evia
tion
Val
id
Mis
sing
Val
id
Mis
sing
Q1 138 1 1.00 1 1.188 Q1 85 0 1.00 1 1.393 Q2 138 1 2.00 1 1.275 Q2 84 1 2.00 2 1.310 Q3 136 3 3.00 3 1.003 Q3 84 1 3.00 2 1.153 Q4 137 2 3.00 3 1.007 Q4 85 0 3.00 3 1.126 Q5 138 1 3.00 4 1.116 Q5 85 0 4.00 4 1.140 Q6 138 1 2.00 2 1.224 Q6 83 2 3.00 2 1.094 Q7 137 2 3.00 4 1.204 Q7 85 0 3.00 4 1.269 Q8 137 2 2.00 2 1.233 Q8 85 0 3.00 2 1.160 Q9 137 2 3.00 4 1.232 Q9 83 2 4.00 5 1.272
Q10 137 2 3.00 4 1.326 Q10 85 0 3.00 3 1.268 Q11 136 3 2.00 2 1.211 Q11 85 0 3.00 2 1.238 Q12 138 1 4.00 5 1.227 Q12 85 0 4.00 4 1.161 Q13 135 4 2.00 2 1.164 Q13 84 1 2.00 1 1.262 Q14 138 1 4.00 5 1.295 Q14 85 0 4.00 4 1.270 Q15 137 2 2.00 2 1.170 Q15 84 1 2.00 2 1.144 Q16 138 1 4.00 4 1.352 Q16 85 0 4.00 4 1.284 Q17 138 1 2.00 2 1.243 Q17 85 0 2.00 2 1.297 Q18 138 1 3.00 3 1.171 Q18 85 0 2.00 2 1.181 Q19 137 2 2.00 2 1.245 Q19 84 1 2.00 2 1.249 Q20 137 2 2.00 1 1.233 Q20 84 1 2.00 1 1.342 Q21 138 1 2.00 1 1.151 Q21 85 0 2.00 1 1.280 Q22 138 1 1.00 1 1.156 Q22 85 0 1.00 1 1.499
The descriptive statistics for July and October are shown below in Table 2. The frequency tables for each are available in Annexure B and C respectively. From the descriptive statistics, it can be seen that there is little variance between the modes and medians of the July and October results. Regarding the modes, only questions 2, 3, 9, 10, 12, 13, 14 and 18 (eight of twenty-two or 36%) are different and they are different by one point up or down. Regarding the medians, only questions 5, 6, 8, 9, 11 and 18 (six of twenty-two or 27%) are different, by one point up or down as well. The descriptive statistics at face value indicate that the intervention (hybrid teaching model) was not successful. However, the data also indicate that the students started off with a high level of environmental awareness
371

(the main test of the NEP scale). This small difference between the cases can also be attributed to the lack of validation of this questionnaire as a measurement tool, as no pilot test was conducted. In Table 3 each question is discussed individually in a qualitative manner using the data and modes in Table 2.
Table 3Qualitative Analysis QUESTION DESCRIPTION CHANGE
Q1 We can understand something by breaking it down into its component parts.
Most students strongly agreed with the statement initially, indicating a reductionist worldview. There was no change in the mode, indicating that there was no improvement.
none
Q2 The whole of something is no more than the sum of its parts.
The directionality of this question was changed. Initially the mode indicated that students strongly agreed with the statement. The mode changed to them agreeing somewhat. This indicated a slight improvement in their stance.
better
Q3 Most processes are linear and characterised by cause and effect.
Initially most students were not sure, but later changed, indicated by the mode, to somewhat agreeing with the statement. This shows that they did not fully understand the concept of feedbacks.
worse
Q4
Most issues and events are fundamentally discrete (separate) or may be regarded as such and may be dealt with adequately in a segregated way.
Again, this question looked at the understanding of systems thinking. Students initially were not sure, and remained not sure; the mode did not change. none
Q5 It is ethically acceptable to draw your circle of attention or concern quite tightly, as in ‘that is not my concern’.
This question looked at values around ecological thinking, which include social justice. Most students disagreed somewhat with the statement initially, and even after the course, still disagreed somewhat.
none
Q6 We can define something or value something by distinguishing it from what it is not, or from its opposite.
This question speaks to the interrelatedness of things. Initially students agreed somewhat with the statement. The mode did not change, meaning they still agreed somewhat.
none
Q7 We can understand things best through a rational response. Any other response (e.g. intuition) is irrational.
Students somewhat disagreed with the statement. This supported the ecological worldview perspective which posits the validity of multiple sources of knowledge over and above the scientific method. The mode did not change.
none
Q8 If we know what the state of something is now, we can usually predict future outcomes.
This question tests the understanding of complex system behaviours. Students initially somewhat agreed with the statement, and the mode did not change.
none
Q9 I think the reports of climate change are exaggerated.
Initially students somewhat disagreed with the statement. Their understanding improved as they ended up strongly disagreeing with the statement; this was an improvement
better
Q10 I believe that technology will find a solution to any environmental problems we may face
The question looks at the belief that human ingenuity would be able to manage nature. Initially students somewhat disagreed with the statement. After the course, students were not sure, indicating that their stance worsened.
worse
Q11 My personal contribution to any environmental problem is very small
The ecological worldview’s values include taking responsibility for one’s personal impact. Students somewhat agreed with the statement, indicating an understanding of the value. The mode did not change, so they still somewhat agreed after the course.
none
Q12 My personal welfare does not depend on the welfare of the natural world
The directionality of this question was changed. This question looks at understanding that we are dependent on natural systems that have limits, and that by damaging them, we put our own livelihood in jeopardy. Initially students strongly disagreed, this changed to somewhat disagreed, indicatingan improvement.
better
Q13 I think of the natural world as a community to which I belong
This question looks at one’s understanding that humans are not superior, but another part of the web of life. Students initially somewhat agreed with the statement. Later students strongly agreed, indicating an improvement.
better
Q14 I feel disconnected from nature. Sustainability education aims to teach people that we are an integral part of nature. Students initially strongly disagreed with the statement. They later somewhat disagreed, meaning that their stance worsened.
worse
Q15 I have a deep understanding of how my actions affect the natural world.
The question looks whether we understand the impact we have on nature e.g. carbon footprint, waste production. Initially students somewhat agreed with the statement. The mode did not change; students still somewhat agreed with the statement.
none
Q16 Whilst plants and animals are essential to human existence, I have no personal bond with most of them.
This question looks at the interconnectedness of life. Students initially somewhat disagreed with the statement, and continue to somewhat disagree, indicating some level of connection with nature.
none
Q17 I feel that all the inhabitants of Earth, human and non-human, share a common life force
This question looks at humankind being part of the web of life. Initially students somewhat agreed with the statement. The mode did not change, and they still somewhat agreed with the statement.
none
Q18 Like a tree can be part of a forest, I feel embedded within the broader natural
This question refers to holism, that we are embedded in the environment around us. Students were initially not sure. After the better
372
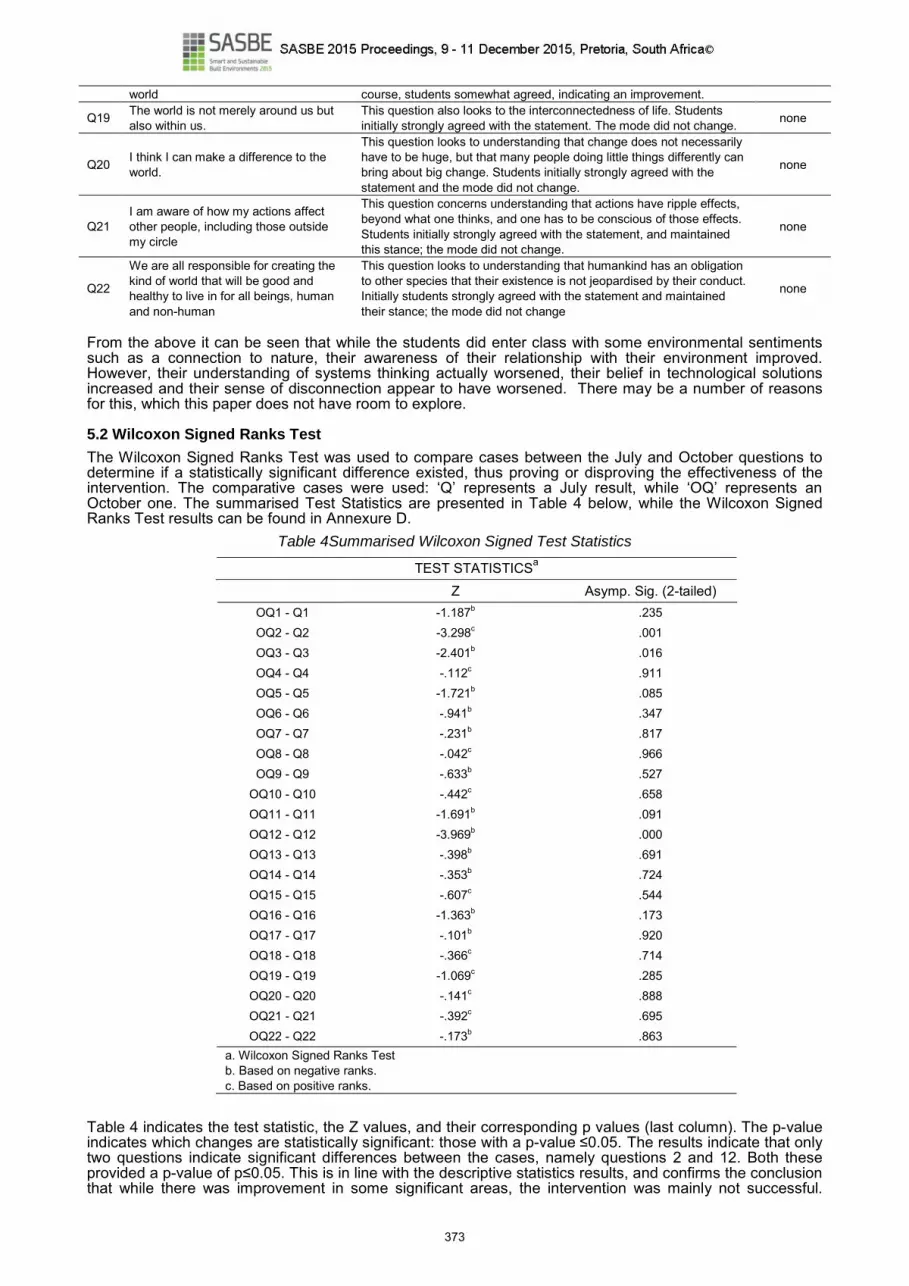
world course, students somewhat agreed, indicating an improvement.
Q19 The world is not merely around us but also within us.
This question also looks to the interconnectedness of life. Students initially strongly agreed with the statement. The mode did not change. none
Q20 I think I can make a difference to the world.
This question looks to understanding that change does not necessarily have to be huge, but that many people doing little things differently can bring about big change. Students initially strongly agreed with the statement and the mode did not change.
none
Q21 I am aware of how my actions affect other people, including those outside my circle
This question concerns understanding that actions have ripple effects, beyond what one thinks, and one has to be conscious of those effects. Students initially strongly agreed with the statement, and maintained this stance; the mode did not change.
none
Q22
We are all responsible for creating the kind of world that will be good and healthy to live in for all beings, human and non-human
This question looks to understanding that humankind has an obligation to other species that their existence is not jeopardised by their conduct. Initially students strongly agreed with the statement and maintained their stance; the mode did not change
none
From the above it can be seen that while the students did enter class with some environmental sentiments such as a connection to nature, their awareness of their relationship with their environment improved. However, their understanding of systems thinking actually worsened, their belief in technological solutions increased and their sense of disconnection appear to have worsened. There may be a number of reasons for this, which this paper does not have room to explore.
5.2 Wilcoxon Signed Ranks Test The Wilcoxon Signed Ranks Test was used to compare cases between the July and October questions to determine if a statistically significant difference existed, thus proving or disproving the effectiveness of the intervention. The comparative cases were used: ‘Q’ represents a July result, while ‘OQ’ represents an October one. The summarised Test Statistics are presented in Table 4 below, while the Wilcoxon Signed Ranks Test results can be found in Annexure D.
Table 4Summarised Wilcoxon Signed Test Statistics
TEST STATISTICSa Z Asymp. Sig. (2-tailed)
OQ1 - Q1 -1.187b .235 OQ2 - Q2 -3.298c .001 OQ3 - Q3 -2.401b .016 OQ4 - Q4 -.112c .911 OQ5 - Q5 -1.721b .085 OQ6 - Q6 -.941b .347 OQ7 - Q7 -.231b .817 OQ8 - Q8 -.042c .966 OQ9 - Q9 -.633b .527
OQ10 - Q10 -.442c .658 OQ11 - Q11 -1.691b .091 OQ12 - Q12 -3.969b .000 OQ13 - Q13 -.398b .691 OQ14 - Q14 -.353b .724 OQ15 - Q15 -.607c .544 OQ16 - Q16 -1.363b .173 OQ17 - Q17 -.101b .920 OQ18 - Q18 -.366c .714 OQ19 - Q19 -1.069c .285 OQ20 - Q20 -.141c .888 OQ21 - Q21 -.392c .695 OQ22 - Q22 -.173b .863
a. Wilcoxon Signed Ranks Test b. Based on negative ranks. c. Based on positive ranks.
Table 4 indicates the test statistic, the Z values, and their corresponding p values (last column). The p-value indicates which changes are statistically significant: those with a p-value ≤0.05. The results indicate that only two questions indicate significant differences between the cases, namely questions 2 and 12. Both these provided a p-value of p≤0.05. This is in line with the descriptive statistics results, and confirms the conclusion that while there was improvement in some significant areas, the intervention was mainly not successful.
373

However, the validity of the tool is still a major factor, possibly distorting the results. In further analysis, the high number of questions in which there was no change indicated a high baseline agreement with ecological paradigm values, which further skews the data.
6. Conclusions and Further Research The study aimed to evaluate the success of a hybrid teaching approach aimed at shifting students towards an ecological worldview. Statistically speaking, the data indicate that the model was not successful. However, a high baseline agreement with ecological paradigm values was indicated, which may skew perceptions of success, and important aspects such as a greater awareness of the relationship with nature did improve. However, the students’ perception of the world remains largely reductionist, and one can therefore argue that the intervention was mostly unsuccessful. There were also some problems with the data. Participants forgetting pseudonyms affected the sample sizes, which affects the results and conclusions to be drawn. Secondly, the measurement tool used must be validated through a pilot test before administering to participants, as it affects the conclusion greatly. The experiment was repeated in 2014 and 2015 with another pseudonym formula and slightly revised course content and presentation, but retaining the same questions. This data still needs to be analysed. The question remains whether it is possible to encourage a shift towards a more holistic and ecological worldview through education alone. Qualitative feedback from the assignments indicates that for some individuals there was a significant shift in thinking. Future research may want to do away with the NEP scale and make use of psychological testing of cognitive development such as that developed by Clare Graves (Beck & Cowan, 1996) or Suzanne Cook-Greuter (2013), which can test movement towards what Wilber refers to as higher developmental altitudes with a more holistic, systemic and worldcentric worldview (Wilber, 2000:5).
7. Acknowledgements The financial assistance (Grant no. 78649) of the National Research Foundation (NRF) is hereby acknowledged. Opinions expressed and conclusions arrived at, are those of the authors and cannot be attributed to the NRF
8. Annexures The annexures are available from https://www.dropbox.com/s/5vr68mo9xx4tn1q/SASBE2015-REFLECTIVE_PRACTICE_Supplementary_material.docx?dl=0
9. References Anderson, A., 2012. Climate Change Education for Mitigation and Adaptation. Journal of Education for Sustainable Development, 6(2), pp.191–206. Beck, D. E. & Cowan, C. 1996. Spiral dynamics. Oxford: Blackwell. Capra, F. 1997. The Web of Life: A new Synthesis of Mind and Matter, London: Flamingo. Cook-Greuter, S.R. 2013. The Nine Stages of increasing embrace in Ego Development Theory. Available at: http://www.cook-greuter.com/ [Accessed November 12, 2015]. Churchill, W.L.S. 1936. The Locust Years. Speech to the House of Commons, 12 November. Available at: http://www.churchill-society-london.org.uk/Locusts.html [Accessed November 12, 2015]. Dunlap, R., Liere, K. V., Mertig, A., & Jones, R. E. (2000). Measuring endorsement of the new ecological paradigm: A revised NEP scale. Journal of social issues, 56(3), 425-442. Duobliene, L. 2013. Phenomenological versus Instructional Approach to Curriculum Formation for Sustainable Development: A Lithuanian Case Study. Journal of Education for Sustainable Development, 7(1), pp.39–49. Du Plessis, C. 2009. An approach to studying urban sustainability from within an ecological world view.Doctoral thesis, University of Salford. Du Plessis, C. 2012. Towards a Regenerative Paradigm for the Built Environment.Building Research and Information, 40(1), 7-22. Du Plessis, C. 2013. Using the long lever of value change. In Crocker, R and Lehmann, S. (eds.) Motivating Change: Sustainable Design and Behaviour in the Built Environment, Oxon, UK: Routledge Earthscan series. Pp. 92-108. Du Plessis, C. and Brandon, P.S. 2015.An ecological worldview as basis for a regenerative sustainability paradigm for the built environment.Journal of Cleaner Production. Available online October 2014 DOI: 10.1016/j.jclepro.2014.09.098 Goldsmith, E. 1988. ‘The Way: An ecological worldview.’ The Ecologist, 18:4/5. Available at: http://www.edwardgoldsmith.com/page138.html [Accessed September 21, 2015]. Hes, D. and Du Plessis, C. 2015.Designing for Hope: Pathways to Regenerative Sustainability. London: Earthscan for Routledge. Jucker, R. 2012. The Sustainable Self: A Personal Approach to Sustainability Education. Journal of Education for Sustainable Development, 6(1), pp.157–158.
374
Ketlhoilwe, M.J. 2010.Education for sustainable development in higher education.International Journal of Scientific Research in Education, 3(December), pp.141–150. Kolb, D.A. 1984. Experiential learning: experience as the source of learning and development, Prentice-Hall. Maio, G.R. & Haddock, G. 2010.The psychology of attitudes and attitude change, London: Sage. Murray, P. 2011. The sustainable self: a personal approach to sustainability education, London: Earthscan. Orr, D.W. 1994. Earth in Mind: On Education, Environment, and the Human Prospect, Washington DC: Island Press. Owens, S. 2013. We Teach How We’ve Been Taught: Expeditionary Learning Unshackling Sustainability Education in U.S. Public Schools, Journal of Sustainability Education, 5(May). Available: www.susted.org [Accessed September 27 2015] Pappas, J.B. & Pappas, E.C. 2014. The Sustainable Personality: Values and Behaviors in Individual Sustainability. International Journal of Higher Education, 4(1), pp.12–21. Roberts, J. 2013. Experiencing Sustainability : T hinking Deeper About Experiential Education in Higher Education.Journal of Sustainability Education, 5(May). Available: www.susted.org [Accessed September 27 2015] Senge, P.M. (1999). The Fifth Discipline. London: Random House. Smuts, J.C. (1987). Holism and evolution. Cape Town: N&S Press. [1st edition 1926]. Steffen, W., Richardson, K., Rockström, J., Cornell, S. E., Fetzer, I., Bennett, E. M., & Sörlin, S. (2015). Planetary boundaries: Guiding human development on a changing planet. Science, 347(6223), 1259855. Sterling, S. (2003).Whole systems thinking as a basis for paradigm change in educatio n: Explorations in the context of sustainability. Doctoral thesis: University of Bath, UK. UNEP (United Nations Environment Programme)/UNCTAD.(1974). Cocoyoc Declaration.UNEP/UNCTAD Symposium on Patterns of Resource Use, Environment and Development Strategies, Cocoyoc, Mexico, 8-12 October.United Nations General Assembly, 29th Session, Second Committee, Agenda item 46. A/C.2/292. Wals, A.E.J. 2014. Sustainability in higher education in the context of the UN DESD: A review of learning and institutionalization processes. Journal of Cleaner Production, 62, pp.8–15. Wilke, R. J. ed. 1993.Environmental Education Teacher Resource Handbook: A Practical Guide for K-12 Environmental Education, New York: Kraus International Publications. Wilber, K. 2000. A brief history of everything. Boston: Shambala. 2nd edition. Wilber, K. 2001. Eye to eye – The quest for the new paradigm. Boston: Shambala. 3rd edition.
375

376

CRITICAL SUCCESS FACTORS FOR SMART AND SUSTAINABLE FACILITIES MANAGEMENT IN A SOUTH AFRICAN UNIVERSITY OF TECHNOLOGY
Bankole AWUZIE
1
Fidelis EMUZE 2 A. NGOWI 3
1 Department of Built Environment/ Engineering and Information Technology/ Postdoctoral Research Fellow/
Central University of Technology, Bloemfontein, Email: [email protected] 2 Department of Built Environment/ Engineering and Information Technology/ Associate Professor and Head
of Department/ Central University of Technology, Bloemfontein, Email: [email protected] 3 Department of Built Environment/ Engineering and Information Technology/ Professor and Dean/ Central
University of Technology, Bloemfontein, Email:[email protected] Keywords: Critical Success Factors, Facilities Management, Higher Education Institutions, Sustainable Development.
Abstract
The integration of Sustainable Development (SD) principles into various facets of Higher Education Institutions’ (HEIs) activities is seemingly becoming the norm, globally. One of these facets, Facilities Management (FM) holds a potential for tremendous SD gains. As such, this study seeks to identify the Critical Success Factors (CSFs) required for smart and sustainable FM in South African HEIs. The study adopts a qualitative case study research strategy. Interviewees were selected from the FM directorate at the Central University of Technology (CUT) as well as other stakeholder groups. Barriers confronting successful integration of FM in organisations were gathered from an extensive review of the literature. These barriers were used in the development of pre-set themes and the emergent data analysed through qualitative content analysis. CSFs identified from preliminary findings for smart and sustainable FM include effective knowledge management, presence of required skill sets and enhanced top level management support. It is expected that the identification of these CSFs would contribute towards the development of a robust mechanism for delivering smart and sustainable FM at CUT.
1. Introduction
Society’s quest to attain sustainable development has gained momentum in recent times (Sarpin and Yang, 2012, Sharp, 2009). Governments and businesses are currently in the processes of redesigning and modifying their business models to ensure significant contribution to Sustainable Development (SD). Such efforts have focused on the triple bottom-line, namely; environmental, social, economic sustainability. Given their reputation as societal change agents, Higher Education Institutions (HEIs) have been challenged to assume a leading role in implementing SD (Cortese, 2003). HEIs appear to be gradually picking up this gauntlet. Literature is replete with studies highlighting the role of HEIs in mainstreaming SD ethos into their core activities (Lozano-García et al., 2009, Ferrer-Balas et al., 2008). These activities usually consist of teaching and learning; research; and operations. The advent of Education for Sustainable Development (ESD) can be traced to such efforts of HEIs (Lukman and Glavič, 2007). The management of facilities within an HEI has been identified as one facet through which SD can be integrated into an HEI’s operations (Lozano-García et al., 2009, McMillin and Dyball, 2009). Facilities Management (FM) possesses immense potentials for the attainment of sustainability gains in organisations (Elmualim et al., 2010). The Central University of Technology (CUT) is one of such HEIs within the South African context which has reiterated its vision to attain the status of a Sustainable University (SU) by the turn of the decade (CUT, 2012). Expectedly, CUT is concerned with the embodiment of SD ethos not only as it pertains to its teaching and learning and research activities but also its operations of which FM forms an integral part. Scholars state the need for this to be done in a manner analogous to the principles of systems thinking hence allowing for experiences obtained in any of the aforementioned aspects to be shared with others (Stephens et al., 2008, Sammalisto and Lindhqvist, 2008, Ralph and Stubbs, 2014). Unfortunately, despite the recognition of significance of FM in an HEI’s bid to become an SU, a paucity of studies exploring the state-of-the-art situation concerning FM’s role in enabling the attainment of an SU status for HEIs has been observed. This paucity is quite pronounced within the South African context, hence necessitating this study. In contributing to the resolution of this imbroglio, this study seeks to identify the Critical Success Factors (CSFs) for smart and sustainable FM in HEIs, relying on CUT as an exemplar. It is expected that the findings would contribute to extant literature through an adumbration of proposed guidelines for engendering smart and sustainable FM in South African HEIs. This paper is structured into the following sections, namely; a review of literature relating to themes such as the place of HEIs in the implementation of the sustainability agenda, CUT’s SU project, a case for smart and 1 [email protected]
377

sustainable FM in HEIs, and CSFs; a description of the strategy adopted in data collection and analysis, the presentation and discussion of preliminary findings, and finally, a conclusion section.
2. Literature Review
2.1 Sustainability and HEIs
Extant literature unanimously explicates the leadership role of HEIs in the quest of contemporary societies to achieve SD (Cortese, 2003, Sharp, 2002). SD is premised on the need to ensure that prime consideration is given to sustainability across several societal activities (Fernández-Sánchez and Rodríguez-López, 2010). Over the past decade, studies have sought to highlight the place of HEIs in spearheading SD (Ralph and Stubbs, 2014, Velazquez et al., 2006). This has seen to the emergence of various aspects of the sustainability agenda in HEIs, of which the Education for Sustainable Development (ESD) assumes significant importance (Lozano-García et al., 2009). According to Cortese (2003), HEIs are expected to lead in the pursuit for a sustainable society by demonstrating the sustainability ethos through their daily activities as well as in the creation and dissemination of knowledge accordingly. This, he insists, would help in providing all students and staff alike with an educational experience which is aligned to the ethos of SD. Furthermore, it has been observed that many HEIs seem to be focused on the mainstreaming of sustainability into its teaching and learning, and research activities hence relegating operations and procurement functions to the background (Velazquez et al., 2006). They reiterate the need for the adoption of a systematic approach in order to ensure the optimal integration of these principles into all facets of the HEI’s institutional activities. McMillin and Dyball (2009) admit the complexity associated with the component parts of an HEI based on its mini-city status. They posit that HEIs should be able to ensure the uniform integration of these component parts into the sustainability agenda through the adoption of a systems approach.
2.2 Sustainability@CUT Agenda
The Central University of Technology (CUT) had, in 2010, launched a decade long sustainability-oriented strategy tagged Vision 2020. According to the CUT sustainability development report (CUT, 2012), the strategy is centred on the desire to turn the university into a Sustainable University (SU) focusing on the production of quality social and technological innovations in socio-economic development. An SU has been described as a university which applies the concept of SD as its central philosophical and operational guiding principle (Shriberg, 2002). Revolving around 4Ps namely; People, Plan, Product, and Pennies, CUT’s Vision statement seeks to transform the university. Comprehensive implementation of the Vision 2020 commenced in 2012. To this effect, the University Sustainability Framework was developed as a guidance tool towards the attainment and measurement of the sustainable outcomes sought; especially the creation and dissemination of sustainability knowledge, the development of the next generation of sustainability experts through teaching, learning and research and finally, the integration of sustainability principles into all procurement processes. Suffice to say that the effective implementation of the sustainability framework should position CUT as a sustainability champion. However, FM remains very strategic to the successful implementation of the framework, especially as it has to do with incorporation of SD ethos in the delivery of new infrastructure and the maintenance of the existing buildings within its two campuses at Bloemfontein and Welkom.
2.3 Need for Smart and Sustainable FM in HEIs
Barret and Baldry (2009) describe FM as an integrated approach for engendering the maintenance, improvement, and adaptation of an organisation’s buildings to create the desired ambience required to support the attainment of the organisation’s core objectives. Yim Yiu (2008) reiterates that FM marks a shift from operational services towards strategic resource management thus distinguishing it from property management. Consequently, he identifies four strategic roles of FM, namely: sourcing of supporting services; sourcing of workspaces; sourcing of funds from infrastructure facilities, and ensuring continuous assessment of quality and performance of facilities and institutional arrangements. Judging from these strategic roles, the salient nature of FM within contemporary organisations cannot be undermined. Organisations require effective FM to survive the competitive market place. Yim Yiu opines that FM be seen as a hybrid between strategic management and project management within organisations and as such should be accorded a pivotal role at the strategic level of organisations. Effective FM practices wield a major influence on organisational success factors such as profit determination, productivity, management of energy and waste, employee welfare and public perception(Awang et al., 2014). Accordingly, various scholars have called for the incorporation of the SD ethos into FM at organisational level. Arguably, if such ethos is incorporated into organisational FM, it would inadvertently contribute to the attainment of the organisation’s SD objectives. Ikediashi et al. (2012) trace the advancement of the sustainable FM concept to the need to contribute to the reduction of the built environment’s impact on the environment. Over the past few decades, a trend signalling this growing recognition of FM in HEIs has been observed by Amaratunga and Baldry (2000). Perhaps this recognition can be attributed to the views similar to those espoused by Price et al. (2003) wherein they observe the potential of the facilities available to an HEI to considerably impact upon student choices. They also add that the kind of work environment provided by HEI’s could limit its ability to attract the kind of personnel it so wishes. CUT’s organisational vision of becoming an SU by 2020 is largely dependent on its FM department’s ability to apply SD tenets to its entire operations. These operations consist of the four cardinal roles of FM identified by Yim Yiu previously. As part of a wider study commissioned to assess the implementation of CUT’s SD agenda, this study seeks to identify the CSFs for engendering smart and
378

sustainable FM within the HEI. Such an exercise is premised on the established role of FM in enabling the attainment of organisational objectives like CUT’s SU/SD agenda(Velazquez et al., 2005, Sharp, 2002).
2.4 Critical Success Factors
Rockart (1982:4) describes CSFs as “those key areas of activity in which favourable results are absolutely necessary for a manager to reach his/her goals”. Based on this definition, CSFs for the institutionalisation of smart and sustainable FM in CUT will entail a summation of those aspects which if properly executed would lead to smart and sustainable FM practice. Undoubtedly, identifying the CSFs for smart and sustainable FM within CUT would contribute in no small measure to the sustenance of SD within the HEI. Therefore, the identification of CSFs for smart and sustainable FM within the context of a South African HEI as exemplified by the CUT from the perspective of various stakeholders is indeed pivotal to the embodiment of SD therein. Often times, certain objectives are associated with a unique set of CSFs (Chua et al., 1999). A deficiency of studies seeking to identify CSFs for smart and sustainable FM in South African HEIs has been observed, hence making this particular study, imperative. It is expected that this study’s findings will contribute to obliterating this gap.
3. Research Methodology
This study seeks to identify the CSFs necessary for the embodiment of a smart and sustainable FM practice within a South African HEI context (CUT). This implies the in-depth study of a phenomenon (identification of CSFs for smart and sustainable FM) within a natural context (CUT). This scenario seems analogous to the definition of case study by Yin (2009). Furthermore, the need to develop rich context-dependent knowledge serves as a rationale for the use of the case study research strategy for this study (Eisenhardt and Graebner, 2007, Flyvberg, 2006). Therefore, a qualitative case study strategy was utilised for the study. The exploratory nature of this study makes the qualitative approach most apposite as it is reported as being pivotal to the creation of new knowledge. This attribute of the qualitative approach is engendered by the use of data collection techniques such as interviews and focus groups as well as document analysis, all of which allow for the collation of individualistic perspectives pertaining to a particular phenomenon (Kvale, 1996, Denscombe, 2007). Matter-of-factly, these techniques enable the social construction of reality (knowledge) (Denzin and Lincoln, 2008). Based on the forgoing, this study adopts a qualitative case study strategy to achieve its aim. A mixture of face-to-face semi-structured and structured interviews was carried out with a cross-section of stakeholders within CUT. Purposive snow-balling and convenience sampling techniques were adopted for the selection of interviewees (Denscombe, 2007). Thus far, interviews are still on-going and this study reports only on the preliminary findings. To this moment, eleven (11) interviews have taken place since June, 2015. For information relating to the interviewees’ background, see Table 1.
Table 1 A Description of Interviewees
No. Stakeholder Group Position/Job Description
Code
1. Procurement/Project Management Office)
Sustainability Manager SM
2. FM Department Director DFM 3. FM Department Clerk of Works CoW 4. FM Department Assistant Clerk of Works ACoW 5. Infrastructure Delivery
Partner Consultant CIDP
6. Contractor Representative Foreman FC 7. Academic Staff Lecturer LAS 8. Academic Staff Senior Lecturer SLAS 9. Contractor Sub-contractor SCC 10. Student Post graduate PGS 11. Student Undergraduate US Source: Authors’ Field Work (2015) Besides questions pertaining to the interviewees’ bio data, interviewees were asked to state what they considered as factors which were critical for the enthronement of smart and sustainable FM practices at CUT. These interviews lasted for an average of forty-five (45) minutes each and were transcribed. Ordinarily, studies sharing similar inclinations with this one as it concerns the identification of CSFs have commenced with a review of the extant CSF’s identified in related literature and attempted to contextualise same with the support of the actors within the given scenario. This kind of scenarios abound within the literature. See Zhang (2005) Hardcastle et al. (2005) Zhou et al. (2011) Babatunde et al. (2012) and Sanvido et al. (1992). Hence, it would appear appropriate for previously identified CSFs for smart and sustainable FM in other sectors to be gathered and an attempt made to situate them within the context of FM in South African HEIs. Yet, this was not the case in this study owing to the seeming paucity of studies detailing such CSFs. Therefore, the authors relied on a list of barriers to the implementation of sustainable FM practices in organisations as compiled by Sarpin and Yang in deriving their potential CSFs (Sarpin and Yang, 2012). See Table 2 below. Therefore, these became the initial categories of CSFs and were adopted a pre-set themes for the study. See Table 3 for a list of these pre-set themes. Interviewees’ responses to questions concerning what they thought was necessary for achieving successful smart and sustainable FM performance at the CUT were analysed according to these pre-set themes mentioned in Table 3. It is
379

expected that emergent themes would evolve from the any further noticeable patterns observed from the data available to the authors during the course of data analysis (Yin, 2009, Taylor-Powell and Renner, 2003).
Table 2 Barriers to the Implementation of Sustainable FM practices in Organizations
Barriers Past research Main Barriers
1 Knowledge Elmualim et al. (2010) Lack of knowledge Nielsen et al. (2009) Limited knowledge regarding environmental themes Elmualim et al. (2009) Knowledge chasm Shah (2007) Management of sustainability knowledge Lai and Yik (2006) Low knowledge level regarding sustainability Hodges (2005) Discrepancy in Knowledge 2 Capability Shah (2007) Lack of Capabilities/Skills Shafili (2006) Lack of professional capability Hodges (2005) Lack of capabilities/skills 3 Management Elmualim et al. (2010) Time constraint, Lack of senior management commitment, Diversity of
FM roles, Undervaluation of contribution to organization success Nielsen et al. (2009) Lack of incentives to create routines on environment issue,
Too little time and few resources to implement Shah (2007) Awareness on whole-life value, Increasing liability Hodges (2005) Unwillingness to implement sustainability, Lack of financial support 4 Authority Nielsen et al. (2009) Limited data on local consumption of energy, water, Shah (2007) Performance Indicators Bosch and Pearce
(2003) Lack of guidance documents
Source: Sarpin and Yang (2012)
4. Discussion of Preliminary Findings
CSFs identified from the data are shown in Table 3. Table 3 Classification of CSFs Identified from the Data
Theme CSFs Identified Interviewees
Effective Management of SD related Knowledge between stakeholders
Establishment of proper framework for sharing SD based knowledge between various stakeholders within the University.
CIDP, SLAS, LAS, ACoW
Consultative forums to debate new developments and for the development of SD based knowledge within CUT
CIDP, SLAS, LAS, PGS
Improved face-to-face communication about the use of facilities
US, PGS, SLAS, SM, ACoW
Effective information systems to provide up to date information on the use of existing and new structures
SLAS, DFM, CIDP, LAS
Proper communication of the CUT’s SD Policy guidelines, if any, to various stakeholders within CUT
CIDP, SLAS, SM, CoW DFM, US, PGS
Constant site meetings with contractors and FM department to share lessons learnt as it pertains to SD in their respective projects.
DFM, CIDP, CoW, FC, SCC,
Presence of a well-articulated FM plan for specified intervals
CIDP, SLAS, LAS,
Support from Top-Level Management
Integration of Smart and Sustainable FM principles into planning stages for the procurement of new infrastructure projects as well as maintenance at CUT.
DFM, CIDP,
Development and dissemination of a set of clear SD policy guidelines to be adopted in the maintenance and delivery of infrastructure projects.
CIDP, SLAS,
Provision of Incentives for proper use of workspaces and other types of building stock
SLAS, LAS, SM, CIDP
Demand for adherence to the tenets of the SD agenda in the selection of supply chain members (Sustainable procurement)
CIDP, DFM, FC, SCC
Provision of financial and organisational support for knowledge and capability development workshops on SD within the FM department.
SM, SLAS
Theme CSFs Identified Interviewees Presence of Required SD based Competencies
Presence of required competencies for delivering on smart and sustainable FM
CIDP, SLAS, LAS,
Presence of a sustainability champion at CUT CIDP
380

Emergent Themes Use of appropriate Contracting strategy for project delivery and maintenance
CIDP, DFM,
Adoption of a set of standards to ensure compliance by end users and contractors alike.
CIDP
Early engagement of contractors during the procurement of new infrastructure or during the planned phased maintenance of existing building stock
CIDP, DFM
Development of a skills database for CUT’s supply chain CoW, CIDP,DFM Adequate timespan for the budget implementation DFM Adequate funding DFM, CIDP
Source: Authors’ Field work (2015)
Table 3 highlights the preliminary CSFs identified by the various stakeholders interviewed and the groups into which they were classified. The term ‘emergent CSFs’ are those CSFs identified by the interviewees which did not fall into any of the categories created earlier to serve as pre-set themes.
4.1 Effective Management of SD related Knowledge between stakeholders
Elmualim et al. (2010) posit that most of the issues confronting integration of the SD agenda into the FM practices of organizations were knowledge-based. According to Easterby‐Smith et al. (2008), organizations such as CUT should be able to effectively manage knowledge within between its departments to engender successful attainment of its strategic objectives. The management of knowledge entails the creation of knowledge and its sharing and/or transfer within and outside the organisation through knowledge flows. There appeared to be a consensus among all interviewees that adequate management of knowledge, particularly as it pertains to the knowledge flow between the FM department on one hand and other stakeholder groups was pivotal for smart and sustainable FM at the HEI.
4.2 Support from Top-Level Management
Previous studies have highlighted the importance of support from the top level management of HEIs in driving successful implementation of smart and sustainable FM in such institutions(Sharp, 2002, Velazquez et al., 2005). Whilst concurring with the opinions of Sharp and Velazquez et al., various interviewees mentioned the need for support from CUT’s top-level management as being a CSF for the attainment of sustainable FM practices in the HEI. This support can take several forms as can be seen in Table 3.
4.3 Presence of Required SD based Competencies
The implementation of smart and sustainable FM practices within any organisation requires the presence of particular skill sets (Sharp, 2002, Shah, 2007). Such skills have been described as imperative for engendering optimal FM performance. This is not different from the case at CUT as maintained by interviewees such CIDP, SLAS, and LAS.
4.4 Emergent Findings
A range of CSFs which could not be classified under the existing pre-set CSFs. These CSFs so identified are indeed crucial for the embodiment of smart and sustainable FM at CUT. For instance, the choice of an appropriate contracting strategy has been described as imperative for the successful attainment of project objectives (Kumaraswamy and Dissanayaka, 1998).
5. Conclusion and Further Research
In what appears as an apparent recognition of the strategic role FM has to play in the implementation of CUT’s SD agenda (CUT, 2012), this study set out to identify the CSFs for engendering smart and sustainable FM at the HEI. This objective was premised on the basis that such identification would enable stakeholders understand the key activities that have to be performed to contribute to the attainment of an SU status by CUT. Using CUT as a case study, the authors identified various stakeholders whose activities contribute to the delivery management and usage of facilities within the CUT. This shows a systems approach to the identification of CSFs for smart and sustainable FM. An extensive review of the literature indicated a paucity of studies seeking to identify CSFs for FM in HEIs, especially in South Africa. This led the authors to rely on a list of barriers espoused in the literature (Sarpin and Yang, 2012) as pre-set CSF categories. A mixture of semi-structured and structured interviews was carried out with eleven stakeholder representatives and analysed using thematic analysis. Based on the data, twenty (20) CSFs were identified and subsequently categorised into pre-set themes namely; effective management of SD based knowledge, support from top-level management, and presence of required SD-based competencies respectively. CSFs which did not belong to any of these categories were categorised as emergent. This study is still on-going and it is expected that in the not so distant future, these CSFs so identified should be regarded as preliminary CSFs. Upon the completion of the interviews, the CSFs so identified would be validated using a survey strategy to gain statistical generalisation.
381

7. References
Amaratunga, D. & Baldry, D. 2000. Assessment of facilities management performance in higher education properties. Facilities, 18, 293-301. Awang, M., Mohammad, A. H., Sapri, M. & Rahman, M. S. A. 2014. Requisite Facilities Management Competencies For Sustainable Development At Higher Education Institutions. Journal of Sustainability Science and Management, 9, 71-89. Babatunde, S. O., Opawole, A. & Akinsiku, O. E. 2012. Critical success factors in public-private partnership (PPP) on infrastructure delivery in Nigeria. Journal of facilities management, 10, 212-225. Barrett, P. & Baldry, D. 2009. Facilities management: Towards best practice, John Wiley & Sons. Chua, D. K. H., Kog, Y.-C. & Loh, P. K. 1999. Critical success factors for different project objectives. Journal of construction engineering and management. Cortese, A. D. 2003. The critical role of higher education in creating a sustainable future. Planning for higher education, 31, 15-22. CUT 2012. Sustainability Development Report. Bloemfontein: Central University of Technology Denscombe, M. 2007. The good research guide for small-scale research projects, Berkshire- England, McGraw-Hill Education. Denzin, N. K. & Lincoln, Y. S. 2008. Collecting and interpreting qualitative materials, Sage Publications, Incorporated. Easterby‐Smith, M., Lyles, M. A. & Tsang, E. W. 2008. Inter‐organizational knowledge transfer: Current themes and future prospects. Journal of management studies, 45, 677-690. Eisenhardt, K. M. & Graebner, M. E. 2007. Theory Building from Cases: opportunities and challenges. Academy of Management Journal, 50, 8. Elmualim, A., Shockley, D., Valle, R., Ludlow, G. & Shah, S. 2010. Barriers and commitment of facilities management profession to the sustainability agenda. Building and Environment, 45, 58-64. Fernández-Sánchez, G. & Rodríguez-López, F. 2010. A methodology to identify sustainability indicators in construction project management—Application to infrastructure projects in Spain. Ecological Indicators, 10, 1193-1201. Ferrer-Balas, D., Adachi, J., Banas, S., Davidson, C., Hoshikoshi, A., Mishra, A., Motodoa, Y., Onga, M. & Ostwald, M. 2008. An international comparative analysis of sustainability transformation across seven universities. International Journal of Sustainability in Higher Education, 9, 295-316. Flyvberg, B. 2006. Five Misunderstandings about Case study Research Qualitative Inquiry, 12, 27. Hardcastle, C., Edwards, P., Akintoye, A. & Li, B. 2005. Critical success factors for PPP/PFI projects in the UK construction industry: a factor analysis approach. Construction Management and Economics, 23, 459-471. Ikediashi, D. I., Ogunlana, S. O., Oladokun, M. G. & Adewuyi, T. 2012. Assessing the level of commitment and barriers to sustainable facilities management practice: A case of Nigeria. International Journal of Sustainable Built Environment, 1, 167-176. Kumaraswamy, M. M. & Dissanayaka, S. M. 1998. Linking procurement systems to project priorities. Building Research & Information, 26, 223-238. Kvale, S. 1996. Interviews: An introduction to Qualitative Research Interviewing London, Sage. Lozano-García, F. J., Huisingh, D. & Delgado-Fabián, M. 2009. An interconnected approach to incorporate sustainable development at Tecnológico de Monterrey. International Journal of Sustainability in Higher Education, 10, 318-333. Lukman, R. & Glavič, P. 2007. What are the key elements of a sustainable university? Clean Technologies and Environmental Policy, 9, 103-114. McMillin, J. & Dyball, R. 2009. Developing a whole-of-university approach to educating for sustainability linking curriculum, research and sustainable campus operations. Journal of Education for Sustainable Development, 3, 55-64. Price, I., Matzdorf, F., Smith, L. & Agahi, H. 2003. The impact of facilities on student choice of university. Facilities, 21, 212-222. Ralph, M. & Stubbs, W. 2014. Integrating environmental sustainability into universities. Higher Education, 67, 71-90. Rockart, J. F. 1982. The changing role of the information systems executive: a critical success factors perspective, Massachusetts Institute of Technology Boston. Sammalisto, K. & Lindhqvist, T. 2008. Integration of sustainability in higher education: a study with international perspectives. Innovative Higher Education, 32, 221-233. Sanvido, V., Grobler, F., Parfitt, K., Guvenis, M. & Coyle, M. 1992. Critical success factors for construction projects. Journal of construction engineering and management, 118, 94-111.
382

Sarpin, N. & Yang, J. 2012. The promotion of sustainability agenda for facilities management through developing knowledge capabilities. Proceeding of APSEC 2012 & ICCER2012, 1, 602-607. Shah, S. 2007. Sustainable practice for the facilities manager, John Wiley & Sons. Sharp, L. 2002. Green campuses: the road from little victories to systemic transformation. International Journal of Sustainability in Higher Education, 3, 128-145. Sharp, L. 2009. Higher education: the quest for the sustainable campus. Sustainability: Science, Practice, & Policy, 5, 1-8. Shriberg, M. P. 2002. Sustainability in US higher education: organizational factors influencing campus environmental performance and leadership. The University of Michigan. Stephens, J. C., Hernandez, M. E., Román, M., Graham, A. C. & Scholz, R. W. 2008. Higher education as a change agent for sustainability in different cultures and contexts. International Journal of Sustainability in Higher Education, 9, 317-338. Taylor-Powell, E. & Renner, M. 2003. Analyzing qualitative data. Wisconsin: University of Wisconsin--Extension, Cooperative Extension. Velazquez, L., Munguia, N., Platt, A. & Taddei, J. 2006. Sustainable university: what can be the matter? Journal of Cleaner Production, 14, 810-819. Velazquez, L., Munguia, N. & Sanchez, M. 2005. Deterring sustainability in higher education institutions: An appraisal of the factors which influence sustainability in higher education institutions. International Journal of Sustainability in Higher Education, 6, 383-391. Yim Yiu, C. 2008. A conceptual link among facilities management, strategic management and project management. Facilities, 26, 501-511. Yin, R. K. 2009. Case study research design and methods, Thousand Oaks, Ca, Sage Publications. Zhang, X. 2005. Critical success factors for public–private partnerships in infrastructure development. Journal of construction engineering and management. Zhou, Q., Huang, W. & Zhang, Y. 2011. Identifying critical success factors in emergency management using a fuzzy DEMATEL method. Safety Science, 49, 243-252.
383

384

KEY PERFORMANCE INDICATORS FOR PROJECT SUCCESS ON INNOVATIVE BUILDING TECHNOLOGY PROJECTS
Cathy MPHAHLELE 1
1 CSIR Built Environment/ Building Science and Technology, Email: [email protected]
Keywords: KPIs, IBTs, Project Success, Project Management
Abstract
The South African government, through the Presidential Infrastructure Coordinating Commission has resolved to deliver social infrastructure such as schools, early childhood centers, clinics and student accommodation using Innovative Building Technologies (IBTs). IBTs by definition are, “unconventional methods of building, employing the use of unconventional building materials which are not covered by the National Building Regulations and Building Standards Act 107 of 1977. According to this act unconventional building methods can only be deemed to satisfy by way of rational design or Agrèment certification”
1. Delivering projects through IBTs has introduced a construction environment that has different procurement, supply chain management, building methods and stakeholder management requirement. The technologies employed in an IBT project are not only alternative to brick and mortar, but the certification framework for IBT also impacts the relationships between the various stakeholders of a construction project and this may have an impact on project success. Because such extensive use of IBTs is a relatively new idea in the South African construction industry, it is not clear whether these projects are successful. The aim of this paper is to provide a model conceptual framework which puts forward Key Performance Indicators (KPIs) that can be used to measure project success on IBT projects. In order to identify KPIs for measuring project success, literature focusing on the definitions and parameters of project success has been evaluated. The Project Excellence Model was identified as the optimal measure for project success2. The model recognizes that in order for any projects to be successful, project success factors-which are termed “key organizational areas”- and project success criteria- which are termed “key result areas”-must be satisfied. The key result areas can be measured upon completion of the project and are standard. However the key organizational areas must be decided upon at the beginning of the project and monitored throughout the project duration. According to the Project Excellence Model the key organizational area for a construction project is “stakeholder management”. A framework for successful stakeholder management is presented in this paper.
1. Introduction
Innovative Building Technologies (IBTs) are becoming a popular alternative to conventional brick and mortar in South Africa. Agrèment South Africa has seen a 67% increase in certifications of building systems (CSIR, 2014). The increase in certifications can be attributed to an anticipated increase in demand. This increase in demand is a a result of the government’s resolution to adopt the use of IBTs in their social infrastructure construction projects (CSIR, 2013). In 2013 the Presidential Infrastructure Coordinating Commission (PICC) made a resolution that at least 60% of social infrastructure such as schools, early childhood development centers and clinics be delivered with the use of IBTs by the year 2017 (CSIR, 2013). The PICCs resolution was motivated by a CSIR study which revealed that IBTs introduce benefits such as waste reduction, skills improvements and speedy delivery to construction projects. IBTs introduce various challenges to a construction project which are often a result of the certification framework, supply chain changes and new building methods. An IBT project requires that suitable building systems be selected from Agrèment’s database of certified systems (CSIR, 2013). Agrément’s database of active certificates provides a list of unconventional building products certified by them as suitable for use and the areas such products can be used. This is in direct contrast to a conventional project where brick, steel or concrete manufactures are readily available. Upon certification, the conditions of certification stipulated by Agrément outline that the manufacture, erection, design and quality of the final product is the responsibility of the certificate holder. Once an appropriate building system has been identified on the database, the system must be run through a climatic tool developed by the CSIR to determine whether these systems are suitable for the climatic area in which the project is to take place. The system must also be evaluated from a supply chain perspective where considerations such as whether the system can be transported on the local roads without damage, the 1 CSIR (2013) Innovative Building Technologies: The Value Proposition, Pretoria: CSIR. 2 Wetserveldt (2003) The Project Excellence Model: linking success criteria and critical success factors. International Journal of Project Management, Volume 21, pp. 411-418.
385

labour skill requirement for erection and whether such skill can be sourced from the local community and lastly the lead time for manufacturing. Once all these steps have been undertaken, the most suitable building system will be selected and the certificate holder will be appointed to manufacture, design and erect the building systems in accordance with the conditions of certification (IDT, 2014) The procurement of the building system and subsequent engagement with the Certificate Holder introduces a new dimension to the project management practice and has ramifications for project success. In this paper the Project Excellence Model will be put forward as a method for measuring project success. The paper will put the problem into context and present the literature review that led to the development of the conceptual framework.
2. Problem in Context
The adoption of IBTs for more government projects has presented several challenges and opportunities for academics, professionals and other role players in the construction industry. These issues include educating those implementing IBTs on behalf of government on the various innovations and the certification framework. The CSIR has undertaken the task of demystifying IBTs as an alternative to conventional construction through various interventions. These include developing training guides for IBT project delivery, proposed procurement protocols and best practice guidelines. There is, however an opportunity to understand whether success on IBT projects is being achieved. The CSIR undertook a study where the value proposition for IBTs was put forward. The study investigated the golden triangle aspect of project success which includes the parameters of “time, quality and cost”. It was found that these aspects of the project are being achieved and exceed those of conventional construction projects. Mbachu and Nkado (2007) also undertook a study where they evaluated factors constraining successful building implementation in South Africa. These two studies provide a window through which one can begin to gain an understanding of the success of conventional and IBT projects in South Africa. However, the picture provided by these studies is not holistic. The CSIR study provides success measurement from a “Success Criteria” perspective and does not consider whether project stakeholders’ objectives were met. Mbachu and Nkado’s (2007) study focused on the client’s perspective of critical success factors but did not measure the end result of the project. Evaluation of project success literature revealed that there is a lack of consensus regarding the parameters and evaluation methods in this area of project management. If there is to be an understanding of project success, variables and indicators of what constitutes project success need to be agreed upon. Authors such as Chua et al. (1999), Alias et al. (2014), Chan et al. (2004) and Cooke-Davies (2002) have focused on project success factors. These are the conditions that need to be created during the duration of the project in order for the project to be completed successfully. Authors such as De Wit (1987) and Adinyira et al. (2012) focus on project success criteria. They maintain that project success can be measured at the end of the project by way of the project management triangle. This refers to the parameters of cost, time and quality. Typically, stakeholder satisfaction is also considered as additional to the project management triangle. Westerveldt (2003) developed a Project Excellence Model that recognizes that project success factors and criteria must be measured in order to have a holistic view of project success. This paper will discuss the Project Excellence Model and the framework that has been developed for the evaluation of project success on IBT projects.
3. Background to the Project Excellence Model
The Project Excellence Model is developed from the European Foundation for Quality Management EFQM Excellence Model. The EFQM model was designed to help organization improve their outcomes. The Project Excellence Model links project success criteria and project success factors in one coherent model. This model was selected following a literature review which revealed that studies evaluating project success adopted either a “critical project success factors” or “project success criteria” view. These views on project success are one dimensional and do not present a holistic picture of project success. Several authors have agreed that indeed the successful implementation of success factors on a project will result in the achievement of success criteria when the project is completed. The Project Excellence Model recognizes that in order for projects to be undertaken successfully, key result areas (project success criteria) and key organizational areas (critical success factors) must be focused upon (Westerveldt, 2003; Turner and Zolin, 2012) Westerveldt (2003) divides the projects into five typological categories. The categories are divided into aspects of organizational and result areas. The areas that are to be the focus of each project are based on the complexity of the project.. The typical construction project is recognized as a “Total Project Management” project. This kind of project requires that the project manager focuses on “stakeholder management” as an organizational area. The following result areas are the focus of a Total Project Management project:
Project results (cost, quality, time) Appreciation by some of the stakeholders, namely client project personnel users
386

contracting partners Outside of the project results criteria, the “appreciation” criteria refers to the various project participants’ satisfaction that their individual objectives in the project have been met. Objectives are set at the beginning of a project and will vary from stakeholder to stakeholder. According to the model, stakeholders who have met their objectives will consider the project successful. In other words, if stakeholders are satisfied with their subjective outcomes of the project, the project can be considered successful The model is clear on the key result areas; however it is not clear what the parameters for successful stakeholder management entails. In order to complete the theoretical framework, literature providing definitions and frameworks for successful stakeholder management had to be evaluated.
4. Relating Stakeholder Management to Project Success
IBTs inadvertently introduce an entire group of new stakeholders to a construction project (CSIR, 2013). As such, in an IBT project it becomes paramount for the project management fraternity to understand and prioritize stakeholder management. Stakeholder management is defined by Olander (2007), Newcombe (2003), Bryson (2007) as “The management of groups or persons with a vested interest in the success or failure of the project”.
Figure 1 A framework for successful stakeholder management in construction projects. Adapted from
Yang et al. (2009)
The management of stakeholders must result in the minimization of conflict for the duration of the project. The activity is one similar to that of risk management, as it involves predicting certain behaviours (risks) and ensuring that they do not negatively impact on the objectives of the project (Yang et al., 2010). The framework for successful stakeholder management was proposed by Yang et al., (2010). The framework provides an outline of the factors that should be present in order to manage stakeholders successfully and is presented in Figure 1. Figure 1 illustrates the factors that need to be present in order for stakeholder management to be considered successful. The first consideration will be whether the project is well within the parameters of social acceptance. This means that in the case of social infrastructure, the economic considerations must be in line with the community and the government’s objectives. Further to this, the projects should not endanger the environment and must have the interests of the community. This could be job creation (community interest) or having a sound environmental management plan. These preconditions must be evaluated in the undertaking of the study. If the preconditions are satisfied, the first steps to successful stakeholder management are “Information Inputs” and “Stakeholder Estimation”. These two activities in the framework are in line with stakeholder literature and are referred to as stakeholder mapping or identification. Stakeholder mapping and identification results in a stakeholder estimation parameter which is termed the “Stakeholder Impact Index” which affects decision making strategies and the type of support offered to stakeholders. Stakeholder impact (or Influence) is given by the equation (Olander, 2007; Nguyen et al., 2009): 𝑆𝐼𝐼 = 𝑉𝑖𝐼𝐼 ∗ 𝐴 ∗ 𝑃𝑜𝑠 (1) Where:
387

SII= Stakeholder Impact Index ViII= Vested Interest Impact Index which is a measure of the probability of impact (v) and the interest impact levels (i). (Olander, 2007; Nguyen et al., 2009). It is given by the equation: 𝑉𝑖𝐼𝐼 = √𝑣 ∗ 𝑖/25 (2) A = Stakeholder Attribute is the sum of all stakeholder attributes such as Power, Legitimacy, Urgency, Knowledge and Proximity to the project. The sum of weighted attributes is equal to 1. Nguyen et al., (2009) refers to this as I (Impact). Olander (2007) only considers the attributes of Power (P), Legitimacy (L) and Urgency (U) in his study. However, Nguyen et al., (2009) note that Knowledge and Proximity to the project are also important attributes. However, in his study Nguyen (2009) does not factor Impact into the overall SII equation. For purposes of this study Knowledge (K) and Proximity (D) will be included in the Attribute variable. Each attribute will be given an equal weighting of 0.2 because both Nguyen (2009) and Olander (2009) agree that attributes will likely have similar impact. Therefore A can be computed as follows: 𝐴 = 𝑃 + 𝐿 + 𝑈 + 𝐾 + 𝐷 (3) Pos = Stakeholder Attitude which can be numerically assessed as active opposition (Pos=-1), passive opposition (Pos = -0.5), not committed (Pos = 0), passive support (Pos = 0.5) and active support (Pos = 1) (Olander, 2007; Nguyen et al., 2009) The total stakeholder impact for the project is given by SIIproj= ƩSIIi (Olander, 2007) The first hypothesis is that if ƩSII is negative then key result areas will not be met. The second condition for project success on an IBT project relates to the other two components of the framework. If the factors of sustainable support and effective decision making are not present during the project, then the key result areas of The Project Excellence Model will not be met. The stakeholders of an IBT project have been identified according to the categories given by Turner and Zolin (2012). In an attempt to standardize stakeholder identification Turner and Zolin (2012) identified “groups” of stakeholders from literature and recognizes all the relevant parties who have a vested interest in the project. The stakeholder groups identified were as follows: I. The Owner/ Investor: Provides financing for the project and becomes the ultimate custodian of the
finished product. Their objectives will revolve around time, cost and quality II. The Project Sponsor: Recognizes the need for a product or project and garners financial and
political support from the project owners or supporters. They are typically employed by the owner or user organization
III. The Consumer: The person who buys or will benefit from the finished product. IV. The Operator or the User: Operates the product on behalf of the owner. They are usually employees
of the Investing/ Owner entity V. The Project team/ Project Manager: This group is consists of individuals who are assembled to
perform activities that will result in the completion of the project. They are typically appointed by the owner or investor either as employees in the organization or on consultative basis. Their interest revolves around time, quality and cost. They are also concerned with the career prospects with having been involved in the project. Career prospects include issues such as learning, future moves and personal wellbeing.
VI. The Senior Supplier: this is senior management in the lead contractors company or a consultant, managing or prime contractor usually appointed by way of a standard agreement such as FIDIC. This group is usually interested in time and cost and the profit made from the project. They will also be concerned with safety and risk record of the project
VII. The Other Suppliers also fall under this group. They are responsible for supplying the goods, materials, works or services during the project. An example of an “Other Supplier” would be the ready-mix company. Their concern is completion of the project on time so that they can receive prompt payment as well as the profit they are making from the project
VIII. The Public: Their concern with the project will typically revolve around the social and environmental impact the project has.
5. Methodology
Following the literature review, a research methodology for evaluating project success KPIs on IBT projects must be developed. The KPIs are an amalgamation of the successful stakeholder management framework and the project excellence model. Stakeholders of a typical IBT project were evaluated against those of a conventional construction project from the CSIR (2013) study and the IDT (2014) training manual. The evaluation was done in light of Turner and Zolin’s stakeholder categories. It was found that the stakeholders facing the greatest shift as a result of IBT projects fall under the “The project team/ Project Manager, Senior Supplier and Secondary Supplier Categories”. These categories include professional consultants, contractor, certificate holder, licensees, and senior management in the client organization.
388

Because of the extensive scope of stakeholders in any construction project and the limited time in which the study is to be completed, the groups most affected by the implementation of IBTs will be the focus of the study. The study will employ a mixed method approach where quantitative and qualitative data will be collected in order to determine whether KPIs as identified in the literature review are met on an IBT project. A government department that has completed social infrastructure projects as per the PICC resolution will be approached to provide historical data about the project. This will be in the form of procurement or contractual arrangements, the extent to which the parameters of cost, quality and time were satisfied, as well as the environmental and social targets set at the onset of the project. The data will be used to determine the following information:
Project results (cost, quality, time) Appreciation by the client Project stakeholders and their areas of interest Project missions Established pre-conditions as per the framework for successful stakeholder management
.A questionnaire issued to stakeholders will seek to evaluate the stakeholder impact (SII). This will require that participants rank stakeholders attributes, impact of interest and attitudes. The outcome of remaining factors not contained in the Impact equation in the “successful stakeholder management” framework will also be interrogated on a scale that will provide quantitative data which will provide a full picture regarding the presence of critical factors for successful stakeholder management. Stakeholders will also be asked whether their objectives in the project have been achieved in order to test the hypothesis: “If SII is negative, then the key result areas of the Project Excellence Model will not be satisfied”. Key result areas will be evaluated from the perspectives of the participants to the study.
6. Discussion
The aim of this paper was to provide an overview of KPIs identified for successful IBT projects. As the study is ongoing, an overview of the research methodology is provided. A literature review revealed that research in the areas of project success focused on one area of project success. Researchers typically focussed on the factors or criteria aspects of project success. However, it is not clear whether critical factors to project success lead to the achievement of project success criteria. The project excellence model maintains that satisfying key project organisational areas (factors) will lead to the achievement of result areas (criteria) and presents a more holistic view of project success. As such the model will be adopted in the study as a method that can be used to evaluate project success. The KPIs put forward by the model include overall stakeholder satisfaction, cost, time and quality as key result areas. Satisfaction is a measure of the stakeholder achieving their objectives on the project. The model also argues that for a project as complex as a construction project, stakeholder management is the key organisational area. However, the definitions were not provided and had to be inferred from further literature review. The successful stakeholder management framework was selected as it measured factors. The factors include pre-conditions, information inputs, sustainable support and decision making. These KPIs will be tested on completed social infrastructure projects undertaken by a government body. It is expected that IBT projects that do not satisfy the stakeholder management KPIs will not meet the key result areas KPIs.
7. Conclusion
It is expected that the study will provide a holistic view of the achievement of project success and the constraints to project success on an IBT project from the perspective of the Project Excellence Model. The study should culminate in KPIs that are suitable for IBT projects. These KPIs can be applied to IBT projects to determine if they are adequate. This body of knowledge will add to CSIRs endeavours in developing best practice guidelines for IBT project guidelines.
8. References
Bryson, J., 2007. What to do when stakeholders matter. Public Management Review, Volume 23, pp. 622-629. CSIR, 2013. Innovative Building Technlogies: The Value Proposition, Pretoria: CSIR. Mbachu, R. & Nkado, R., 2007. Conceptual framework for assessment of client needs and satisfaction in the building development porcess. Construction Management and Economics, Volume 24, pp. 31-44. Newcombe, 2010. From client to project stakeholders: A stakeholder mapping approach. International Journal of Project Management, Volume 21, pp. 841-848.
389

Nguyen, N., Skitmore, M. & Wong, J., 2009. Stakeholder impact analysis of infrastructure project management in developing countries: a study of perception of project managers in state-owned engineering firms in Vietnam. Construction Management and Economics, 27(11), pp. 1129-1140. Olander, S., 2007. Stakeholder impact analysis in construction project management. Construction Management and Economics, 25(3), pp. 277- 287. Trust, I. D., 2014. Delivering projects through the use of IBTs. Pretoria: IDT . Turner, R. & Zolin. R., 2012. Forecasting Success on Large Projects: Developing Reliable Scales to Predict Multiple Perspectives by Multiple Stakeholders Over Multiple Time Frames. Project Management Journal, 43(5), pp. 87-99. Westerveldt, E., 2003. The Project Excellence Model: linking success criteria and critical success factors. International Journal of Project Management, Volume 21, pp. 411-418. Yang, J. et al., 2011. Stakeholder Management in Construction: An empirical study to address research gaps i n previous studies. International Journal of Project Management, 910(29), p. 900.
390
LOWERING CARBON FOOTPRINTS AND EMBODIED ENERGY THROUGH INNOVATIVE DESIGN – A BUS RAPID TRANSIT CASE STUDY
J HUGO 1
GH STOFFBERG 2 A BARKER 3
1 University of Pretoria / Mathews and Associates Architects, Email: [email protected] 2 Department of Environmental Sciences, University of South Africa, Email: [email protected] 3 Department of Architecture, University of Pretoria, Email: [email protected] Keywords: Carbon Footprint, Climate Change, Design Process, Embodied Energy, Life Cycle Analysis
Abstract
The 2013 International Panel on Climate Change (IPCC) Fifth Assessment Report (AR5) indicates that current global climate change will adversely impact on vulnerable communities and projects that future local weather anomalies will affect all continents. The AR5 estimates that the Building Sector currently contributes 19% of energy related Global Greenhouse Gas (GHG) emissions thus identifying its transformation as fundamental to climate change mitigation strategies. Architects are therefore pivotal in minimising GHG emissions, Carbon Footprints (CF) and Embodied Energy (EE) in the Building sector. Emission reductions in individual architectural projects can, effectively, lower the collective impact of the sector. In 2011, an iterative architectural design project, using existing Bus Rapid Transport (BRT) station precedents’ and a newly designed prototype –Switch – as examples, simulated a methodology to lower the CF and EE of new buildings through construction material use. Specific mitigation strategies were identified to inform alternative design configurations. These strategies were based on existing and new life cycle analyses (LCA) of the CF and EE data for materials and precedents. Iterative qualitative and quantitative design cycles - alternating at various scales of material use, structural systems, sectional and plan layouts, spatial movement and energy use - enabled CF and EE reductions while utilising conventional construction materials. Design improvements were assessed through benchmarking with existing local and international BRT station precedents, revealing substantial carbon footprint intensity (CFI) savings of 34% (378.6 vs 574.7kgCO2m2) and 31% (378.6 vs 548.5kgCO2m2), respectively, when compared to the MyCiti (Cape Town, South Africa) and Tube (Curitiba, Brazil) stations. This paper outlines the design process followed which, through optimized empirical material selection and trade-offs in CF and EE improvements, created a distinct and efficient design. The study proposes this design methodology for the architectural industry to foster the production of new buildings that mitigate climate change.
1. Introduction
The Fifth Assessment Report by the International Panel of Climate Change (IPCC) predicts a series of negative effects impacting societies worldwide and those that create the least impact are, unfortunately, the most vulnerable (IPCC, 2014:547). It is estimated that 78% of the total global Greenhouse gas (GHG) emission increases since 1970 are caused by industrial processes and fuel combustion (IPCC, 2014:04). These increases had resultant total anthropocentric GHG emissions of 44.5 – 53.5 GtCO2eq/yr in 2010 of which the built environment is responsible for 19% of direct energy related GHG (IPCC, 2014:04 & 677). It is therefore imperative that the carbon footprint of the built environment be minimised in both operation and production phases. Although there have been improvements in limiting GHG emissions for the operation phases of buildings as well as the manufacturing of certain construction products; excessive consumption and emissions generated during the construction and refurbishment of buildings remains a problem and requires drastic changes (Zimmerman et al., 2005:1155). Professionals in the built environment should, therefore, take leading roles in specifying materials with low carbon footprints, generating efficient designs and employing sustainable strategies. These initiatives must be initiated at project inception and should not be ignored only to receive futile attention at end of the design process (Ding, 2006:456 & 335; Basbagil et al., 2013:81-82). As part of a previous, and larger study, initiated in 2010, which analysed the role that architecture can play in the mitigation of Climate Change, this article describes a methodology used to assess and minimise the CF associated with new buildings. Using the data generated from previously published life cycle assessments (LCA) of South African Bus Rapid Transit (BRT) precedents and a prototype developed during the study, this article aims to unpack an iterative design process that integrates qualitative design and quantitative LCA of the CF and EE of construction materials to minimise the environmental impact of the final product. As result the current article focuses on this process, rather than the final results.
391
The study postulates that in order for design strategies, and their adoption, to be successful it is important to quantify their potential impact on climate change. Only once it is measured and proven can wide spread adoption of climate change mitigation strategies be expected (Ortiz et al., 2009:29-30 and Swim et al., n.d.:141-145). Therefore, it is important to continually assess the CF and EE of construction materials throughout the design process to achieve significant savings. While the research findings of this paper provide insight in terms of the CF and EE impacts, they also reveal significant improvements in CF and EE compared to the existing Bus Rapid Transit (BRT) trunk route stations analysed. These improvements can be extrapolated to the entire built environment, demonstrating its potential climate change mitigation impact.
2. Assessing Designs and their Impacts
Due to the increased demand for environmentally responsive buildings, there has been a marked growth in LCA tools and environmental rating systems (Haapia & Viitanicmi, 2008:469). As a result, conducting LCA’s has matured into an established specialist field with various companies providing these services. Although the recent development of computer programs, such as ECO2 or CUB2D, have aided and accelerated the analysis process - real time analysis and iteration is still lacking (Ding, 2006:456 & Basbagil et al., 2013:81-82). An exception is the recent innovation, Tally, which is integrated with BIM modelling, assisting with the design process in 'real time' - once the sketch design stage has been completed. Unfortunately, within developing countries, these LCA’s has been hampered by the lack of access to accurate CF and EE data of construction materials and related systems (Gibberd, 2014 & Ortiz et al., 2009). This has resulted in limited establishment and benchmarking of specific binding targets, as critical steps to successfully minimise the CF and EE of the built environment (Ortiz et al., 2009:30 & 148). As a direct response, this study uses a single wide ranging CF and EE dataset1 to develop a comparative CF and EE LCA analyses to assist in the development of localised data (Hugo et al., 2014:54-56).
3. Design to Mitigate Climate Change
Design, as a process, can be defined as the mediation between various and seemingly opposing elements, systems or role players which often require the careful balancing of a project vision with associated constraints (Brown, 2008:3). Similarly, the design and construction of low CF architecture responds to the dual necessity for development and a limited ecological impact. The process adopted for this study can be characterised as an open-ended holistic approach, where theory (design choices) developed from the data collected and outcomes generated (Groat & Wang, 2002:179-180), result in a process that employs both quantitative and qualitative design methods. The use of an LCA method allows for the objective comparison of different products and outcomes through quantitative analysis (Fay et al., 2000:32 & Rai et al., 2011: 2271-2273), after which qualitative interpretations and subsequent design choices give form to the quantitative results (Hugo et al., 2014). This multi or mixed method process allows for new outcomes and different results adapted for individual projects (Bryman, 2006:97), allowing a systematic assessment of the impacts of design decisions such as comfort, function and aesthetics on the overall CF and EE of the final product.
4. Conveying the Design Process
In 2011 an iterative architectural design project was undertaken as outcome of a M(Prof) dissertation at the Department of Architecture at the University of Pretoria and focussed on architectural strategies that mitigate climate change. The project was initiated as a direct response to an umbrella research project, initiated by the United Nations Development Programme and Global Environment Facility. Their focus was on Sustainable Transportation and Sport and had as the main intentions the building of capacity and strengthening of institutions to develop sustainable transportation models. The research project focussed on the BRT transportation systems, currently being implemented throughout South Africa. The BRT as public transport system has been increasingly implemented worldwide as a cost effective system, with limited community disruptions (Wirasinghe et al. 2013:21&26). As a result the BRT system has proven to provide environmental, social and economic benefits – specifically lowering GHG emissions associated with urban transportation (Wirangshe et al. 2013:16-23). The dissertation project involved the design of a low CF and EE BRT trunk route station, Switch, located within the Tshwane TRT System (Hugo, 2010). Using comparative LCA and iterative design methods various BRT trunk route stations were evaluated to assess the differing design resolutions of similarly functioning buildings (Hugo et al., 2012:25). This comparison process became vital to guiding future design development. The LCA scope of analysis focused only the cradle to gate phase2, this ensured an objective comparison was made between the precedents from different contexts. In addition, as these station buildings are highly efficient in terms of operational energy consumption and a high refurbishment rate due to commuter use - the LCA focus shifted to the CF and EE of the construction materials and structure rather than GHG
1 The study used the “Embodied Carbon. The Inventory of Carbon and Energy (ICE)” developed by CI Jones (2011). 2 Cradle to gate: Calculation includes the input and output flow (applicable within system boundary) of a material or product up to the point where it leaves the factory that manufactures it (Jones 2011:38).
392

emissions and energy consumed as result of the building operation (Bribian et al., 2009:2518; Rai et al., 2011: 2272 & Hugo et al., 2014:57). Transportation and on-site construction were excluded as negligible from the LCA studies as confirmed by Blegini & Di Carlo (2010:876) and Mithraratne & Vale (2003:488-489). Recycling rates of specific materials were only included in the CF and EE calculations if it is a proven industrial practice. Any potential recycling opportunities were only accounted for the second phase project – being the project that actually recycles existing building components (Fay et al., 2000:34 and Blegini & Di Carlo 2010:872). The iterative design and assessment method followed a cyclical development process. Therefore to ensure overall project progress, the focus alternated between distinctly different design stages and scales as outlined in Figure 1. This resulted in identifying and developing certain design options based on data generated from previous designs and precedents in the project. This iterative design and assessment method was continuously documented to allow for the evaluation of the design progress and its outcomes. To present this design method the process was refined to a linear procedure similar to traditional design methods. Yet in reality the addition of the real time assessment to this design method resulted in a more cyclical design process.
Figure 1 Graphic representation of the iterative design process followed. Source: Own drawing
5. Unpacking the Design Process.
The design process has been separated into six phases within which the various iterations are documented, analysed and discussed.
5.1 Analysing the Context and Design Problem.
Similar to all architectural projects, this design started with a context and problem analysis to understanding the project needs and stakeholder requirements. In addition, this process was extended to identifying the threats and opportunities posed by climate change and its mitigation. From this analysis, building specific solutions and strategies were derived and adopted to the local context and needs (Du Plessis et al., 2003:255). The outcomes from the analysis can be summarised in three important strategies as highlighted by Williamson, Radford and Bennetts (2003:121):
1) Respond to local climatic condition changes predicted to be caused by climate change. 2) Reduce the CF of a new building during the construction process. 3) Lower the GHG emissions caused during a building’s operation phase.
The project incorporated all three strategies, but only calculated the impact of aspect 2 which was deemed the most important due to the nature of the building’s function (Hugo et al., 2014:56-57). It was concluded from the analysis that the building needs to respond to a higher ambient temperature and solar irradiance (Chow et al., 2002:231-233), increasingly high volume rainfall over short periods (Awuor, 2008:235 & Kovats & Ackhtar, 2008:161), rise in drought periods and lower soil moisture content (Reason et al., 2006:38 & Thomas et al., 2007:307) and the increased impact of urban heat island effect (Haselbach, 2008:08) (Figure 2). To reduce the CF during construction, required the use of the low CF materials, the dematerialisation of the structure and the use of decarbonising materials (Van Ryn and Pena, 2002:233 & 243). Recycled and locally sourced materials (GBCSA, 2008:31&228) as well as integrating vegetation with the structure were also included (Dimoudi & Nikopoulou, 2003:70-75). Finally the design has to take cognisance of differing lifecycle requirements of building components (Bisch, 2002:262 and Kilbert et al., 2002:18). To limit the GHG emissions during the building operation phase, a holistic energy use plan was required considering both on site energy generation and energy conservation strategies (Kilbert et al., 2002:18).
393

Figure 2 Strategies to improving the response of architecture to climate change. Source: Hugo, 2010:43
5.2 Assessing Comparable Precedents to set a Design Premise.
Similar precedents with shared characteristics such as function, size or material were identified for the comparative LCA study and evaluated using carbon footprint per square meter (CFI) and embodied energy per square meter (EEI) as comparable variables. The BRT trunk route stations were suitably comparable as they functioned and were located within similar BRT systems. To accommodate project variables in specialist equipment and due to the lack of data available regarding their energy consumption, the following delimitations were established: Only the cradle to gate lifecycle assessment was analysed excluding operation and demolition phases. All the specialist electronic equipment, kiosks, doors and doorframes were excluded due to the lack of data available and little opportunity of improving the CF and EE of these elements. The precedent study highlighted the various opportunities and risks related to this building type at the project inception, increasing the possibility of success in limiting its CF and EE (Hugo et al., 2014:52). The four resultant guidelines for the project were: 1) Achieve spatial economy – the CFI of the Retro Tram station (Tshwane) was 21% higher than the MyCiti station’s (Cape Town), yet its resultant CF was only 3% more compared to that of the MyCiti station (Hugo et al., 2012:40), due to a substantially smaller building footprint. 2) Simplify the station structure through dematerialising the wall and roof structure - a simplified lightweight portal frame saved 35% CFI and EEI compared to a complex cantilevering I beam structure (Hugo et al., 2012:40). 3) Merge the separate roof columns, wall structure and envelope into a single structure saves 45% CFI (78 vs 143 kgCO2/m2) as revealed in the MyCiti vs Tube comparison. 4) Use in situ cast concrete instead of steel - steel boarding plates had an increased CF of 534% more than similar in situ cast concrete types (3.94 vs 20.06 kgCO2) (Hugo et al., 2012:42).
5.3 Assigning Structural Systems and Material Choices.
During this initial design phase, low CF structural systems were identified. Using a table or inventory illustrating the CF and EE of materials per weight provides an inaccurate reflection of material use and their respective impacts. Therefore the study tested different materials in smaller empirical construction systems, ensuring that the structural properties of materials were taken into account (refer to figures 3 – 6). The choice of structural systems analysed in the study was primarily informed by the precedent study and the developed design guidelines. Therefore the decision to use a portal framed lightweight roof structure for the design was informed by the design guidelines (Guideline 2 – see section 5.2). Subsequently the study continued by analysing smaller elements such as columns, walls and floor systems to inform the design.
394

Figure 3 The CF and EE of different column type calculated as 4m high columns. Source: Hugo, 2010
In contrast to the precedent studies, the assessment of different construction materials revealed steel columns to be the most efficient. A steel H-column has an improved CFI of 28% compared to a masonry column (33.88 vs 46.98 kgCO2/m), and a lighter steel cold formed steel section resulted in an even greater saving of 50% (23.36 vs 46.98 kgCO2/m).
Figure 4 The CF and EE of different heavy weight wall systems calculated a 5m length of a typical BRT
station envelope (12 m²). Source: Hugo, 2010
395

Figure 5 The CF and EE of different light weight wall systems calculated over a 5 m length of a typical
BRT station envelope (12 m²). Source: Hugo, 2010
The concrete block wall proved to be the most effective of the three heavyweight construction methods (Figure 4), resulting in 32% and 44% CFI (64.62 vs 96.14 vs 115.2 kgCO2/m2) reduction compared to masonry and in situ cast concrete respectively. Compared to the heavyweight construction methods, the lightweight structures proved to be the most efficient (Figures 4 and 5), resulting in using these for the wall and roof structure of the station design3. The lightweight wall analyses tested CFI and EEI performance of laminated glass, steel mesh and PMMA. The PMMA performed the best in terms of CFI (49.38 kgCO2/m2), while the steel mesh proved to be the most efficient EEI choice (600 MJ/m2). Therefore the wall materials were chosen for their strength, robustness and improved ventilation rates.
Figure 6 The CF and EE of different floor structures calculated over 1 m² floor area. Source: Hugo, 2010.
Having established the wall choice for the project, an analysis of different floor applications was undertaken. The analyses revealed masonry pavement on soil infill to be the most CFI effective, being 53% and 46% more efficient than steel floor (60.07 vs 128.5 kgCO2/m2) and reinforced concrete (60.07vs 112.8 kgCO2/m2) respectively (Figure 6). Even though lightweight walls structures are more CF and EE efficient; lightweight and hanging floor systems are not. A heavyweight wet construction system was therefore used for the station base and a lightweight steel and mesh-like structure for the roof and envelope.
5.4 Developing and Assessing the Typical Section.
Once the structural systems and initial material choices were established, the different impacts and choices of the building form, volume enclosure and structural system were assessed. This entailed the use of a typical design sections as initial LCA study. 3 Visibility was deemed to be more important than thermal and acoustic insulation in this building type. In other applications the choice of heavy weight wall structure might be the more efficient option.
396

Different flooring systems were assessed (Figure 7) and a composite concrete block and soil infill system (case study A) improved the existing in situ cast concrete system of choice (case study D) with 46% (112.08 vs 209.17 kgCO2/m2). A second viable option was precast concrete floor panels with in situ cast concrete beams and columns (case study B), improved Case study D by 34% (138.45 vs 209.17 kgCO2/m2).
Figure 7 The CF and EE of different station base structures calculated over the 8 meter length of a typical
BRT station base (36 m²). Source: Hugo, 2010
As a subsequent iteration, the impact that geometry has on the CFI and EEI of the station roof and envelope was assessed (Figure 8). The study revealed that by slanting the wall to limit the roof area, reduced roof beam spans and purlin numbers saving 40% (2657 vs 4464.1 kgCO2) in steel consumption (case studies A vs D). This saving was further evident even when doubling the roof height (case studies C vs D) - revealing a 7% CF saving (4151.05 vs 4464.1 kgCO2).
397

Figure 8 The CF and EE of different typical section types calculated over similar floor areas. Source: Hugo,
2010.
5.5 Iterations on the Complete Design
Through the iterative design process and assessment a final design was developed. As revealed in the precedent studies, the simplification of the façade design into a compact entity was vital to improve the design’s EEI and CFI (Hugo et al., 2012:41). Therefore the design dematerialised building elements and condensed the façade and structure into a single plane. As shown in figure 9, the iterations of the envelope design changed the wall from a truss-like structure to a portal frame structure, subsequently shifting the shading devices to be flush with the building envelope. This improved the CF of iteration 4 vs 1 by 41% (395.32 vs 669.78 kgCO2).
Figure 9 Iterations of the roof and envelope structure. Source: Own Drawing.
Additional improvements (iterations 4 vs 2) changed the mono pitch roof to a slightly arched roof and further simplified the shading structure. By changing the geometry a 10% CF saving (374.89 vs 419.07 kgCO2) in terms of steel use was achieved.
398

Figure 10 Iterations of kiosk position. Source: Own Drawing
.
Figure 11 Iterations of entrance and bracing structure. Source:Own Drawing.
The positioning of the concrete block kiosk within the station volume resulted in the simplification of the structure and wall envelope as well as savings in roof and wall materials. It also provided the benefit of additional solar protection through the use of louvres. In addition to simplifying the structure, the entrance functions as structural bracing for the whole station, saving 8% on the station structure (513.9 kg CO2 and 7075 MJ) (Hugo et al., 2014:62). The analyses of the typical section of the entrance structure (figure 10) revealed an overall saving in material use of 36% in terms of its EE (14733 vs 9332 MJ) and 40% on its CF (1075.03 vs 639.1 kgCO2). In the overall analysis the revised entrance structure as a whole, resulted in a 9% improvement for both the CFI and EEI (405.002 vs 447.32 kg CO2/m2 & 4392 vs 4819 MJ/m2) (Figure 11).
399

Figure 12 Shortening of the Enclosing Structure.Source: Own Drawing.
The final design iteration removed 20 m2 of the enclosed station volume at the far end of the platform as it was considered to be non-functional space due to the planned movement patterns in the station. This resulted in saving 9.5% of the wall and roof structure’s CF and EE (165.3 GJ & 12 t CO2 vs 181 GJ & 13.1 t CO2) (Hugo et al., 2014:61).
5.6 Final assessment and comparison of design.
The final assessment and comparison compared the overall CF and EE of the design with the precedents analysed at the project inception. This is imperative to reveal design progress while also revealing areas in need of improvement. In addition, assessing numerous projects over time ensure continual improvement and development over a series of projects. The final assessment compared the CF and EE of the the Switch prototypical station, the Myciti Station from Cape Town, South Africa (implemented in 2010), and the Tube Station from Curitiba, Brazil (implemented in 1974) (Hook, 2009:26). The Myciti station was used as it was identified as the most efficient station in a previous study (Hugo et al., 2012), while the Tube station as iconic station provided an international comparison (Figures 13 and 14).
Figure 13: Two precedents and prototypical station analysed. Source: Switch and Myciti Stations: Own picture and drawing Tube Station: Great Buildings, www.greatbuildings.com (accessed on 14 March 2010).
Figure 13 Figure 14: Plans and sections of the Tube, Myciti and Switch stations. Source: Own Drawing.
Sections redrawn from information supplied by architects; Rendall, 2011: Personal communication and sourced from Ruano & De Valicourt, 1999:40.
The overall analysis reveals the Tube station to be significantly more efficient in terms of its overall CF and EE, though it is important to note that the Tube station only provides 33,2 m2 platform area, while the Switch station encloses 339m2 of platform area. Although three stations differ significantly in terms of enclosed
400

platform area, all three precedents can accommodate articulated busses and function along the trunk or direct routes (Goodman et al., 2005:76 & Hugo et al., 2012:30). Within a functioning BRT system, each station will be adapted to accommodate a certain projected peak hour commuter load, therefore station platform areas always differ. Though the Tube station is smaller and spatially efficient, in recent years there have been complaints regarding overcrowding and inadequate protection from heat and rain (Halais, 2012:01 & Reed, 2015:01). Therefore the different station designs were evaluated using CFI and EEI as comparable variables. The Switch station design proved to be the most efficient as it improved the respective CFI and EEI by 34% (378.56 vs 574.68 kgCO2/m2) and 35 % (4080.67 vs 6282.71 MJ//m2) compared to the Myciti station (Hugo et al 2014:66). It also improved the CFI and EEI of the Tube station by 31% (378.56 vs 548.52 kgCO2/m2) and 41% (4080.67 vs 7005.51 MJ/m2) respectively (Table 1). Table 1 Summary of Life cycle analysis of the three stations: Switch, Myciti and Tube Stations.
Source: Own table.
6. Findings and Discussion.
The iterative use of a quantitative LCA method with a qualitative interpretation resulted in successfully limiting the CF of the BRT Station. This can be attributed to a thorough comparative LCA of precedent studies informing design decisions as well as continual benchmarking and assessment to ensure that the project progresses in line with its design intentions. While the study did not have access to a regional specific CF and EE inventory, the use of a comprehensive inventory allowed for in-depth comparisons ensuring that CF and EE savings be documented and subsequently achieved. As many sustainable building rating systems require and reward projects that limit their CF and EE (BREEAM, 2014 & LEED, 2015:90), this comparative design process will allow practitioners and professionals in developing countries to quantify comparative CF and EE of new buildings and document the outcomes for others to use. Although the comparative or iterative design process has been demonstrated on BRT stations; it does not only apply to these building types. The value lies in the possibilities for application in other building typologies and functions. Unfortunately this design and assessment process can be a lengthy and needs to be streamlined. If time is limited, the following guidelines can become the initial steps in improving the CF and EE of new projects:
A) Optimise volume and spatial use. B) Simplify and adapt the building form to improve structural efficiency. C) Use multifunctional and flexible building components to increase the material consumption efficiency
of the components. D) Optimise the innate quality of different material types and use these in an interdependent manner. E) Identify and specify low carbon footprint materials.
7. Conclusion and Further Research
The study set out to document the design process to reduce the CF and improve the EE of new buildings. Using the CF and EE as informants resulted in substantial CF and EE savings while still using conventional construction materials. The process started by identifying strategies which could adapt to and mitigate climate change after which a series of comparable precedents were analysed to reveal successful and adverse design choices. The CF
401

and EE of a series of construction systems and materials were also assessed in an empirical manner. The design was intermittently compared to existing benchmarks to assess the design progress and ensure that project outcomes were achieved. Clear improvements were made in terms of the CF and EE in the final design. This emphasises the potential of design to improve the CF and EE of architecture and the change that architects and professionals in the built environments can bring about to mitigate climate change. Further research requires the establishment of an online repository that allows practitioners to assess and upload CF and EE of projects. This will improve the identification and analysis of precedents while also assessing design progress.
Acknowledgments
The authors would like to thank Wilfried Bohm (ARG Design), Pieter Mathews (Mathews and Associates Architects) and Carl von Geyso (structural engineer) for their advice during the design of the prototypical BRT station; ARG design for giving consent to the analysis of the Myciti station, David Ingham for his assistance with the study and the United Nations Development Programme (UNDP) and Global Environment Facility (GEF) for sponsoring this study. The authors would like to thank the reviewers for their valuable feedback and suggestions.
References
Awuor, C.B. Orindi, A.O. Adwera, A.O. 2008. Climate change and coastal cities: the case of Mombasa, Kenya. Environment and Urbanization, 2008:20, pp. 231-242. Basbagil, J. Flager, F. Lepech, M. & Fischer, M. 2013. Application of life-cycle assessment to early stage building design for reduced embodied environmental impacts. Building and Environment, 60(0), pp. 81-92. Bisch, J. 2002. Natural metabolism as the basis of “intelligent” architecture. In: Construction Ecology. Nature as the basis for green buildings. C.J. Kibert, J. Sendzimir & G.B.Guy [eds.]. London: Spon Press, pp. 37-72. Blegini, G.A. Di Carlo, T. 2010. The changing role of life cycle chases, subsystems and materials in the LCA of low energy buildings. Energy and Buildings 42 (2010), pp. 869-880. Bribian, I.Z. Uson, A.A. & Scarpellini, S. 2009. Life cycle assessment in buildings: State-of-the-art and simplified LCA methodology as a complement for building certification. Building & Environment 44(2009), pp. 2510-2520. Building Research Establishment Environmental Assessment Methodology (BREEAM). 2014. BREEAM UK New Construction. Non-domestic Buildings (United Kingdom) 2014.Technical Manual. 2014. BRE Global. [online]. Available from: [http://www.breeam.org/BREEAMUK2014SchemeDocument/#09_material/mat01_nc.htm%3FTocPath%3D9.0%2520Materials%7C_____1] [Accessed on 16 Feb 2015]. Brown, T. 2008. Design Thinking. Harvard Business Review. June 2008, pp. 01-10. Chow, D.H.C. Levermore G. Jones, P. Lister, D. Laycock, P.J. & Page, J. 2002. Extreme and near-extreme climate change date in relation to building and plant design. Building Servc. Eng. RES. TECHNOL 23,4 (2002), pp. 233-242. Dimoudi, A.& Nikopoulou, M. 2003. Vegetation in the Urban Environment: Microclimatic Analysis and Benefits. Energy &Building, pp. 69-76. Ding, G.K.C. 2008. Sustainable Construction – The role of Environmental assessment tools. Journal of Environmental Management 86(2008), pp. 451- 464. Du Plessis, C. Irurah, D.K. & Scholes, R.J. 2003. The built environment and climate change in South Africa. Building Research & Information (2003) 21 (2-4), pp. 240-256. Fay, R. Treloar, G. & Lyer-Raniga, U. 2000. Life-cycle energy analysis of buildings: A case study. Building Research & Information, 28(1), pp. 31-41. Gibberd, J. 2014. Sustainability impacts of building products: An assessment methodology for developing countries. Acta Structilia 2014:21(2), pp. 69-84. Goodman, J. Laube, M. & Schwenk, J. 2005. Curitiba’s Bus system is model for Rapid Transit. Poverty, Race and the Environment. Vol.12, No. 1, pp. 75-76. Green Building Council of South Africa (GBCSA). 2008. Green Star SA – Office Design and Office – As Built v1 2008. 1st Edition. GBCSA. Groat, L. & Wang, D. 2002. Architectural Research Methods. John Wiley & Sons, N.Y., USA. Haapia, A. & Viitanicmi, P. 2008. Environmental Impact Assessment. Environmental Impact Assessment Review 28(2008), pp. 469-482. Halais, F. 2012. Has South America’s most sustainable city lost its edge? Home page of The Atlantic City Lab. [Online]. Available from: [http://www.citylab.com/commute/2012/06/has-south-americas-most-sustainable-city-lost-its-edge/2195/] [Accessed on 19 Sept 2015]. Haselbach, L. 2008. The Engineering Guide to LEED – New Construction. New York: McGraw-Hill.
402

Hook, W. 2009. Bus Rapid Transit. A cost-effective Mass transit Technology. EM: Air & Water Management Association Magazine for Environmental Managers JUN( 2009 12 01), pp. 26-30. Hugo, J. 2010. Switch, a BRT terminal as change generator at Pretoria Main Station. Unpublished MArch(Prof) dissertation. Pretoria: University of Pretoria, Department of Architecture. Hugo, J., Stoffberg, H., Barker, A. 2012. Mitigating climate change by minimising the carbon footprint and embodied energy of construction materials: A comparative analysis of three South African Bus Rapid Transit (BRT) stations. Acta Structilia 2012:19(2), pp. 21-45. Hugo, J., Stoffberg, H., Barker, A. 2014.The carbon footprint and embodied energy of construction material: A comparative analysis of South African BRT Stations. Acta Structilia 2014:21 (1), pp. 45-78. Intergovernmental Panel on Climate Change (IPCC). 2013. Climate Change 2013: The Physical Science Basis. Contribution of Working Group I to the Fifth Assessment Report of the Intergovernmental Panel on Climate Change. [Stocker, T.F., D. Qin, G.-K. Plattner, M. Tignor, S.K. Allen, J. Boschung, A. Nauels, Y. Xia, V. Bex and P.M. Midgley (eds.)]. Cambridge University Press, Cambridge, United Kingdom and New York, NY, USA, 1535 pp. Intergovernmental Panel on Climate Change (IPCC). 2014. Climate Change 2014: Mitigation of Climate Change. Contribution of Working Group III to the Fifth Assessment Report of the Intergovernmental Panel on Climate Change. [Edenhofer, O., R. Pichs-Madruga, Y. Sokona, E. Farahani, S. Kadner, K. Seyboth, A. Adler, I. Baum, S. Brunner, P. Jones, C.I. 2011. Life cycle energy consumption and environmental burdens associated with energy technologies and buildings. Unpublished thesis (Ph.D.). Bath, UK: University of Bath. Kibert, C.J., Sendzimir, J. & Guy, G.B. 2002. Defining an ecology of construction. In: Construction Ecology. Nature as the basis for green buildings. C.J. Kibert, J. Sendzimir & G.B.Guy [eds.]. London: Spon Press. pp. 7-28. Kovats, S. Akhtar, R. 2008. Climate, Climate Change and Human Health in Asian cities. Environment and Urbanization, 20, 2008, pp. 165-175. Leadership in Energy and Environmental Design (LEED). 2015. LEED V4 For Building Design and Construction.[online]. Available at: [http://www.usgbc.org/resources/leed-v4-building-design-and-construction-current-version] [Accessed on 10July 2015]. Mithraratne, N. & Vale, B. 2003. Life cycle analysis model for New Zealand houses. Building and Environment, 39(4), pp. 483-492. Ortiz, O. Castells, F. and Sonnemann, G. 2009. Sustainability in the construction industry: A review of recent developments based on LCA. Construction and Building Materials 23(2009), pp. 28-39. Rai, D.E. Sodagar, B. Fieldson, R. & Hu, X. 2011. Assessment of CO2 emissions reduction in a distribution warehouse. Energy, 36(4), pp. 2271-2277. Reason, C.J.C. Engelbrecht, F. Landman, W.A. Lutjeharms, J.R.E. Piketh, S. De W. Rautenbach, C.J. & Hewitson, B.C. 2006. A Review of South African Research in Atmospheric Science and Physical Oceanography during 2000-2005. South African Journal of Science, 102, January/February 2006, pp. 35-45. Reed, D. 2015. How Curitiba’s BRT stations sparked a transport revolution – a history of cities in 50 buildings, day 43. Homepage of The Gaurdain. [Online]. Available from: [http://www.theguardian.com/cities/2015/may/26/curitiba-brazil-brt-transport-revolution-history-cities-50-buildings] [Accessed on 16 Sept 2015]. Rendall, A. ([email protected]). 7 April 2011. Re: Request for Cape Town BRT station plans. Email to A Barker (arthur.barker@ up.ac.za). Ruan, M. De Valicourt, CS. 1999. Eco Urbanism. Sustainable Human Settlements: 60 Case studies. Barcelona: Gustavo Gilli. Swim, J. Clayton, S. Doherty, T. Gifford, R. Howard, G. Reser, J. Stern, P. and Weber, E. n.d. Psycology and Global Climate Change: Addressing a Multi-Faceted Phenomonon and Set of Challenges. American Psycology Association. Thomas, D.S.G. Twyman, C. Osbahr, H. & Hewitson, B. 2007. Adaptation to Climate Change and Variability: Farmers Responses to Intra-seasonal Precipitation Trends in South Africa. Climatic Change (2007) 83, pp. 301-322. Van der Ryn, S. & Pena, R. 2002. Ecologic analogues and architecture. In: Construction ecology: Nature as the basis for green buildings. Kibert, C.J., Sendzimir, J. & Guy, G.B. (eds.).. London: Spon Press, pp. 231-248. Williamson, T. Radford, A. Bennetts, H. 2003. Understanding Sustainable Architecture. London: Spon Press. Wirasinghe, S.C. Kattan, C. Rahman, M.M. Awbhell, J. Thilakaratne, R. Anowar,S. 2013. Bus Rapid Transit – A Review. International Journal of Urban Sciences, Vol. 17, No. 1, pp. 1-31. Zimmerman, M. Althaus, H.J. and Haas, A. 2005. Benchmarks for sustainable construction a contribution to develop a standard. Energy & Buildling 37(2005), pp. 1147-1157.
403

404

THE EMERGING ROLE OF A LANDSCAPE BASED STRATEGY IN THE SOUTH AFRICAN BUILT ENVIRONMENT: A CASE STUDY OF THE JOHANNESBURG WEMMER PAN
PRECINCT
Graham YOUNG 1
1 Landscape Architecture Program / Department of Architecture / Faculty of Engineering Built Environment
and Information Technology / University of Pretoria and Newtown Landscape Architects, Email: [email protected]
Keywords: Landscape urbanism, landscape architecture, green infrastructure, Corridors of Freedom, Wemmer Pan
Abstract
Past spatial planning practices have left Johannesburg with sprawling, low-density areas of settlement, lacking viable public transport systems. The “Corridors of Freedom” approach to urban renewal is one of the ways in which the City of Johannesburg (CoJ) wishes to transform entrenched unsustainable settlement patterns that have kept many marginalised communities at the outskirts of the city, away from economic opportunities and access to jobs and growth. The CoJ envisages a compact city which is energy efficient, provides residents with greater access to the inner city and economic opportunities, promotes social cohesion and creates a vibrant urban environment. This urban strategy is focused around a Transit Orientated Development agenda but it tends to overlook the importance of landscape as a fundamental basis for sustainable urban form generation. The paper considers the importance of landscape as a primary ordering device in the strategic planning of Johannesburg and suggests that it will continue to develop as a driver for economic, ecological and social regeneration. The discussion draws on landscape urbanism theory and the Wemmer Pan Precinct case study to support the argument and illustrate how the precinct’s landscape, under threat due to pollution, when understood within the context of other CoJ urban design strategies, becomes a fundamental structuring element and catalyst for the sustainable urban development of the area.
1. Introduction
Previous spatial planning initiatives have left Johannesburg with unsustainable urban settlement patterns that rely on inefficient transportation systems to move people around. The majority of working class and poor citizens are still living on the fringes of the city, commuting daily, often at considerable cost with long distances to access work and economic opportunities. The “Corridors of Freedom” approach to urban renewal as conceived by the City of Johannesburg (CoJ, 2013) is one of the ways in which the CoJ wishes to transform entrenched settlement patterns that have kept many marginalised communities at the outskirts of the city. Future growth in and around these corridors is envisaged as medium to high-rise residential developments growing around transit nodes, gradually decreasing in height and density as it moves further away from the core. Social infrastructure, schools, clinics, police stations and government offices are proposed to be strategically located to support the growing population. For the average Johannesburg resident, the option to live in close proximity to public transport facilities with easy access to the city and to make use of an improved transport system can be a life-changing experience. The idea behind the Corridors of Freedom is therefore to usher a new era of access (in all its connotations) and a choice for residents to work, stay and live within the same space without the inconvenience and high costs of travelling over long distances every day. This urban strategy is driven by a Transit Orientated Development (TOD) (Calthorpe, 1993) agenda with its backbone being the Rea Vaya Bus Rapid Transport (BRT) system. This approach is valid and will encourage use of the public transportation facilities and new development, but unfortunately it tends to overlook the importance of landscape as an essential form giving strategy to structure precincts within the corridors and a necessary component of healthy and sustainable urban form. Using a case study1 methodology, the paper will contend that by using landscape as the departure point and building on the Corridors of Freedom agenda, a thriving living environment can be created in the Wemmer Pan precinct that will systematically alter current negative perceptions of the area and encourage people to move into it. It is argued that this approach would lead to the regeneration and densification of the area and secure the landscape as a catalyst for future urban development. The paper will explore this normative 1 Case studies are widely used in most professions, including medicine, law, engineering, business, planning and architecture. Case studies have a long and well-established history and are frequently used in landscape architecture education and research, and practitioners have also utilized them to a more limited extent. “As the profession develops more of its own theory and knowledge base and communicates this more broadly, the case study method promises to be an effective way to advance the profession” (Francis
2001:15)
405

position through the lens of landscape urbanism theory and the presentation of the Wemmer Pan case study to address issues and unlock inherent and innovative possibilities for the precinct.
2. Landscape: the basic building block of sustainable urban design
“Humans’ survival as a species depends upon adapting ourselves and our …settlements in new, life-sustaining ways, shaping contexts that acknowledge connections to air, earth, water, life, and to each other, and that help us feel and understand these connections, landscapes that are functional, sustainable, meaningful, and artful” (Spirn, 1998:26).
2.1 The notion of landscape
The concept of landscape has multiple meanings and many different disciplines are involved in its study. According to Antrop (2014:2),
The origin of the word landscape comes from Germanic languages. One of the oldest references in the Dutch language dates from the early thirteenth century and ‘lantscap’ (‘landschap’) refers to a land region or a specific environment. It is related to the word ‘land’, meaning a particular territory, but its suffix –scap or -scep refers to land reclamation and creation, as is also found in the German ‘Landschaft’ (‘schaffen’ = to make) (Zonneveld, 1995), and also to the English –ship, pointing to a relationship (Olwig, 2002). In the 16th century the concept is broadened and includes a historical region or territory as well as the visual aspects that characterise it. The shift in meaning from ‘organised territory’ to ‘scenery’ is obvious. Olwig (1996) argued that landscape ‘need not be understood as being either territory or scenery; it can also be conceived as a nexus of community, justice, nature, and environmental equity’. Thus, landscape is also the scene of action and an expression of human ideas, thoughts, beliefs and feelings.
Indeed there has been much critical engagement around the idea of landscape as process or entity, and as a consequence there has been a trend of re-conceptualizing it. Crouch suggests that at the “centre of these challenges and opportunities is the rethinking of landscape as process rather than object; subjectively ‘in the making’ rather than as an assemblage of physical features” (Howard, 2013:119) as in the viewed picturesque sense. Wylie (2007) is clear about this point and argues that when the concept of landscape is divested of assumptions regarding observation, distance and spectatorship, it “ceases to define a way of seeing, an epistemological standpoint, and instead becomes potentially expressive of being-in-the-world itself: landscape as milieu of engagement and involvement. Landscape as ‘lifeworld’, as a world to live in, not a scene to view” (Wylie, 2007:149). Shannon (2011:626) contents that “over the course of the twentieth century, there has been a change from landscape as a negotiated condition between ‘natural’ and ‘artificial’, towards landscape as a richer term, embracing urbanism, infrastructure, strategic planning, architecture and speculative ideas; landscape has evolved from the pictorial to the instrumental, strategic and operational”. Amidon (2012) adds that as we move forward in the era of sustainability, landscape will continue to emerge as an engine for economic, ecological and social revitalization. She suggests that client and consumer-driven priorities such as efficiency, affordability, multi-functionality and resiliency will be balanced within the design and planning of meaningful places. “Landscape and urbanism will serve as a laboratory for applied models of economic and ecological change in an energetic return to their deep, tangled roots in the fusion of art, environmental infrastructure and social staging” (Amidon, 2012:24). Among the authors articulating this newfound relevance of landscape and making claims for the potential of it as a model for urbanism, is architect and educator Stan Allen. He emphasises that
Increasingly, landscape is emerging as a model for urbanism. Landscape has traditionally been defined as the art of organising horizontal surfaces …. By paying close attention to these surface conditions – not only configuration, but also materiality and performance – designers can activate space and produce urban effects without the weighty apparatus of traditional space making” (Sarkis:124).
Waldheim contends that for many, across a range of disciplines, “landscape has become both the lens through which the contemporary city is represented and the medium through which it is constructed” (2006: 10). Weller suggests that the landscape “is the infrastructure of the future” as it is the “medium through which all ecological transactions must pass” (Waldheim, 2006:11). And Koolhaas submits, “Architecture is no longer the primary element of urban order, increasingly urban order is given by a thin horizontal vegetal plane, increasingly landscape is the primary element of order” (Waldheim, 2006:11).
2.2 Landscape Urbanism – an alternative approach to urbanism
“Public space in the city must surely be more than mere token compensation or vessels for this generic activity called ‘recreation’. Public spaces are firstly the containers of collective memory and desire, and secondly they are places for geographic and social imagination to extend new relationships and sets of possibilities” (Corner, 2005:32). An urbanist theory with the emphasis on landscape has evolved over the past 15 to 20 years. Charles Waldheim coined the phrase landscape urbanism, a concept that developed along with fellow landscape architect James Corner and architect Mohsen Mostafavi during the 1990’s. It was first publically introduced during a landscape urbanism conference and exhibition held at the University of Illinois in 1997. Charles Waldheim organized the event “to describe the forces and events which he and others had seen coalescing
406
over the course of the previous decade to form this new brand of urbanism, which was being practiced, at the time, by a small cohort of North American and European designers including Stan Allen, James Corner, Adriaan Geuze, and Rem Koolhaas” (in Howard et al. 2013:439). The theory promotes an agenda of landscape architecture and urbanism that goes “beyond conventional park and garden design on the one hand and avant-garde topographical landscape manipulations on the other” (Shannon 2011:626). Much of the discourse on landscape urbanism focuses “upon the challenges posed by post-industrial urban voids and concerns that are congruent with the politically correct, ecological biases …. The recovery of brownfields sites and the reintroduction of natural processes and habitats are key issues linked to landscape urbanism” (Shannon, 2011:627). Advocates of landscape urbanism theory have critiqued conventional urbanism. Anderson (2010: 83) writes that “the contemporary city seems to be positioned in a deadly crossfire between nostalgic New Urbanism, Koolhaasian bigness, neo-liberal sprawl and hardcore late modernist segregated planning”. Tully (2013) suggests Landscape Urbanism has emerged as a robust alternative to the failures of modernist urban planning.
Its followers …. believe that the medium of landscape, because it necessarily privileges ecology over form, is the most able organizer of a healthy, post-industrial urbanity. The result is a landscape-based urbanism that seeks to radically realign traditional disciplinary boundaries in the design professions while it breaks down the established dualisms between the synthetic and the natural, the urban and the wild. This is different from the ancient concept of rus in urbe, transferring the ‘countryside into the city,’ in that it is not simply erasing the city in favour of the country (Howard, 2013:438).
Proponents of the theory argue that landscape, rather than architecture and infrastructure, is more capable of organizing the city, enhancing the urban experience and creating a platform for sustainable urban form. Waldheim (2006), contents that Landscape Urbanism is a call to turn the traditional practice of urban design inside out, starting with open spaces and natural systems to structure the city, instead of buildings and infrastructure systems. Durack (2004) adds that “it’s most powerful contribution, however, may be that it recalls nature’s restorative cycles and tries to put them back to work in the city”. While the premise of using landscape as the primary medium for organizing our cities may seem straightforward, defining Landscape Urbanism has proven to be elusive, and many iterations and interpretations abound. A carefully nuanced definition is provided by Julia Czerniak,
Landscape urbanism, a phrase taken here to be the conceptualization of and design and planning for urban landscapes that draw from an understanding of, variously, landscape’s disciplinarity (history of ideas), functions (ecologies and economies), formal and spatial attributes (both natural and cultural organizations, systems, and formations), and processes (temporal qualities) impacting many scales of work. Landscape urbanism also suggests a particular culture of and consciousness about the land that refrains from the superficial reference to sustainability, ecology, and the complex processes of our environments in favour of projects that actual engage them. Embedded in landscape urbanism is concern not only with how landscape performs … but how it appears … (Howard, 2013:440).
Bridging the gap between man and his environment, landscape urbanism offers insight into ways of creating healthy and sustainable urban environments by regenerating decaying urban fabric and reusing post-industrial sites. Importantly, James Corner suggest that landscape urbanism is more than a style, rather it is an ethos, an attitude, a way of thinking and acting (Moshen et al., 2003).
3. Wemmer Pan Case Study – Leading with Landscape
As modern cities have concealed the natural substrate of their sites, it is the duty of landscape architects and urban planners concerned about issues around sustainable urban form, to recover and then remediate the remaining voids, creating spaces of discovery, relaxation, and human and ecological health. The recovered landscape, understood as the primary element of urban order, can then become a catalyst for development and be employed as an instrument to integrate new development and amenity into the urban fabric. Herein lays the potential of a ‘leading with landscape’ approach to the reordering of the Wemmer Pan precinct to establish an integrated system of built and unbuilt structures that can grow over time.
3.1 The study area
The Wemmer Pan precinct is located on the southern edge of the Mining Belt which separates it from the city. The area provides a unique opportunity within the current urban context and challenges confronting the City of Johannesburg. It is uniquely positioned relative to the inner city and its associated economic and social opportunities; it is proximate to an established, albeit declining, complex of residential opportunities, including La Rochelle, Turffontein and Rosettenville. Figure 1 below illustrates the study area.
407

Figure 1 The Wemmer Pan Precinct indicated with the red outline (Aerial photograph courtesy of the CoJ GIS Department)
3.2 The Wemmer Pan
The Wemmer Pan was originally a brick field quarry, owned by Sam Wemmer. The pan itself was, however, subject to mining water rights held by several mining companies. Water was drawn from the pan, which also held run-off from the slimes dams. Rights to use the pan and the land were allocated under a Notarial Agreement signed on 22 June 1923. The Agreement allocated surface water use rights for ‘recreation and boating purposes’ together with the foreshore land (Barbir, 2010). Residential development was attracted to the area south of the pan, in the late 1800’s with the establishment of La Rochelle suburb in 1895 and the Pioneers suburb in the 1920’s. In 1920 the Turffontein Race Course was built and over subsequent years Pioneers Park, on the southern side of the pan was developed as a regional recreation facility for the city. The precinct also developed as a sporting node with the establishment of the Hector Norris Park (1926), the Wembley Ice Rink and Stadium (1938) and the Rand Stadium in 1949 (Barbir, 2010). In its heyday Wemmer Pan and Pioneer Park were one of Johannesburg’s major outdoor venues. People from all over the city went there to spend a family day near the water, visit attractions such as Santarama Miniland, miniature railways and illuminated musical fountains. However, since the early 1990’s the number of visitors dwindled and the area slowly started to decay to the point where it is now synonymous with crime, vandalism and pollution. Current urban, mining and other land use activities have put extreme pressure on the natural systems of the study area, specifically industrial and mining developments to the north and north-west of the pan (refer to Figure 1).
3.2.1 Pollution and water management Over time the pan has been subjected to a dramatic alteration into its flow regime. Every rain event tends to flush dirt, debris, heavy metals, and animal faeces from mining and industrial sites, streets and parking lots into the storm-water system, ultimately reaching the pan. Recent studies (Iyer and NLA, 2015) found that water within the pan is high in E. Coli load and is unsuitable for both full contact and intermediate contact recreational activities. Water pollution problems and challenges are generally well understood and their causes and effects well known, but that knowledge is seldom applied to the effective management of water in the urban landscape. Managers, planners and designers unfortunately treat these problems of flooding, storm water drainage, water pollution, water use, and water supply separately and in an ‘industrial’ manner. According to Lyle (1994) the industrial approach to landscape water management bypasses and replaces the natural processes with a concentrated, energy intense system that causes flooding and exacerbates pollution. Fortunately, the commonly held ‘industrial’ perspective about designing and managing urban waterways has begun to shift to an approach that makes full use of basic landscape processes and which provides very real benefits to society. Lyle (1994:147) adds that
408

We face the challenge of providing human needs while at the same time providing for the needs of other species and maintaining the healthy and sustainable functioning of the system. Accomplishing all of these simultaneously requires that we make full use of the natural processing capacities of the land. In using them well, the principles of natural ecosystems provide guidance.
To this end an integrated ecological approach of the study area’s drainage systems is necessary.
3.3 Approach: Leading with landscape
Landscape, in particular that associated with Wemmer Pan and its tributaries, is the most important resource to consider when advocating a landscape urbanism approach to developing a framework for the precinct. This landscape is one of the defining features of the study area and needs to be established as a healthy natural focus for future development that would enhance design responses to broader challenges of the precinct’s sustainability and would have the potential to increase connectivity, multi-functionality, and landscape performance. The strategy is to develop a model of urbanism in which ecological function and health can be imbedded in or at least be integrated with the shape of the study area’s urban fabric. It envisages weaving nature and city together into a new hybrid that functions like a living ecosystem in which the ecological forces and flows that support urbanism are considered as part of the project area as opposed to external to it. The new landscape would process and remediate the land and the water, while simultaneously creating a highly dynamic, green public realm that extends from the pan like green fingers into the surrounding urban fabric and around which new development could be centred. A large-scale urban landscape like Wemmer Pan and its associated systems is thus integral to the sustainable development of the area and would be central to regeneration initiatives, especially when brownfield sites can be developed adjacent to or near it. It would offer the opportunity to stake out a new and unique identity for the precinct by promoting the peculiarities of the local ecology, history and cultural identity in the area. This new landscape would be fundamental to assuring the competitive attractiveness of the study area, retaining and attracting new talent, new residents and businesses, and promoting economic development. The notion of leading with landscape to regenerate city environments is a successful concept that has been implemented in a number of cities around the world and which is proposed for the project. According to Hes and Du Plessis (2015) the term ‘regenerate’ has a number of meanings, not only does it mean reinvigorating or reviving a system, or restoring it to a better state or condition; but to changing the system into something different and better, as well as to bringing about a thorough moral change or improvement. The Toronto Waterfront, which was originally envisaged in the 70’s is today an area of largely publicly owned land focused around open space systems along the edge of Lake Ontario and the mouth of the Don River. Paris’s city administrators commissioned numerous parks in the 80’s and 90’s on post-industrial land as the focus for new development, while at the same time providing successful recreation and tourism facilities. Parc Andre Citroen is one of the more famous of these. Melbourne developed the old industrial and railway lands adjacent to the Yara River; the focus of the new developments turned the central part of the city into a hive of activity. Federation Square, an important element in this system, created a new urban order on a site that never existed before as it was built over railway lines. The High Line development in New York’s West End has gained international acclaim for its simple yet extremely successful approach in bringing life back to a section of the city through the regeneration of a disused, raised railway line. The central component of these projects is the essential role that landscape played in re-appropriating post-industrial sites as catalysts for development. The planning and design of large urban landscapes is faced with a number of significant challenges, such as multiple competing stakeholders, phased financing, segmentation, conflicting development goals, inaccessibility and difficult implementation, especially on brownfield or contaminated sites. Corner (2009:18) states that “Consequently, the design of large parks today must inevitably be strategic and time-based. Design initiatives cannot simply be wilful, subjective or formal approaches, but need instead to be intelligent and flexible with regard to what is inevitably a complex field of dynamic variables”.
3.4 Towards a landscape framework
The idea of leading with landscape therefore opens the way for a new hybrid urbanism for the study area that builds on the already proposed TOD and BRT initiatives and recognizes the importance of the existing open space system as the basis of an emergent new public realm which must not be a passive or a benignly naturalistic place. It should be green and living, but it should also be beautifully designed for people, for varied social uses and for infinite forms of experience. The planning of the area cannot solely rely on conventional practices that privilege buildings over landscape or infrastructure over ecology. Therefore the urban design proposal for the precinct simultaneously contains a bold vision and a strong commitment to nature and green ecology, and of an urban culture that is vibrantly social, interactive and dynamic. Landscape, and a creatively conceived public realm, are essential to achieving these aspirations and anchor the strategy for the Wemmer Pan Precinct and its capacity to shape the identity of the study area. This approach accomplishes a multiple of things; it can meet many goals simultaneously. In this sense it’s easier to hybridize the agenda — to mix infrastructure, landscape, urbanism, ecology — because in this way efficiencies can be created that could result in cost savings in both the short and long term. The landscape must perform utilitarian as well as ecological functions — it must process storm water, produce energy (perhaps), grow food, and provide amenity.
409

Existing biodiversity areas and ecological support areas would form the basis of distinct ‘water fingers’ (Figure 2) which emanate from and connect back to the pan creating a network that extends into the study area and which would:
Enhance urban ecosystem functionality to improve landscape performance; Allow for soils, water and biodiversity to function as integrated components of broader
landscape processes to deliver ecosystem services; Improve connectivity; Encourage access to and interaction of people with the natural environment leading to
improving human health and well-being and Contribute to enhancing the precinct’s response to climate change.
Figure 2 The Landscape Framework and BRT Route and TOD nodes (adapted from Iyer and Newtown
Landscape Architects)
3.4.1 Water fingers The water fingers, and the natural areas around the pan, would be expanded out to create a larger ecosystem and structural ‘buffer zone’ that would allow for the introduction of natural water filtration systems such as constructed wetlands and floating wetlands (Figure 2). An ecological support area also needs to be considered to link the western inlet of the pan to the defined support area, west of it, as well as to ultimately link with the Robinson Deep landfill site, which, when rehabilitated, has huge potential as a biodiversity ‘hot-spot’ to the immediate west of the study area. The current storm water channels that feed directly into the pan at this inlet would need to be retrofitted to improve their ecological potential. A number of ameliorating actions must be taken to improve the ecological qualities of the channel and to reconnect the stream to the earth to re-establish the natural drainage pattern, provide refuge for riverine fauna and a rooting area for aquatic plants. In conjunction with the rehabilitation of the channels, is the attempt to bring people closer to the river – to fulfil man’s natural desire to recreate beside water. To this end walkway and bikeway systems would be introduced, which ultimately connect to the planned bicycle lanes in the precinct. Upstream of the existing channels, west of the pan, where the original streams have been buried and where storm water pipes enter the system, a network of constructed wetlands would be created to filter out silt and other pollutants before they reach the pan. The water finger extending northwest of the pan also plays the important ecological role of filtering and cleaning water coming off industrial and mining areas. Together, these fingers, west and north of the pan, would function as innovative water-quality infrastructures and indigenous parkland inclusive of social systems and future neighbourhood parks. The resultant open space system along with the new urban fabric adjacent to it would generate a range of interconnected territory offering diverse land use, cultural and recreational features and a series of unique interconnected greenways that ultimately tie back to and focus on Wemmer Pan.
410
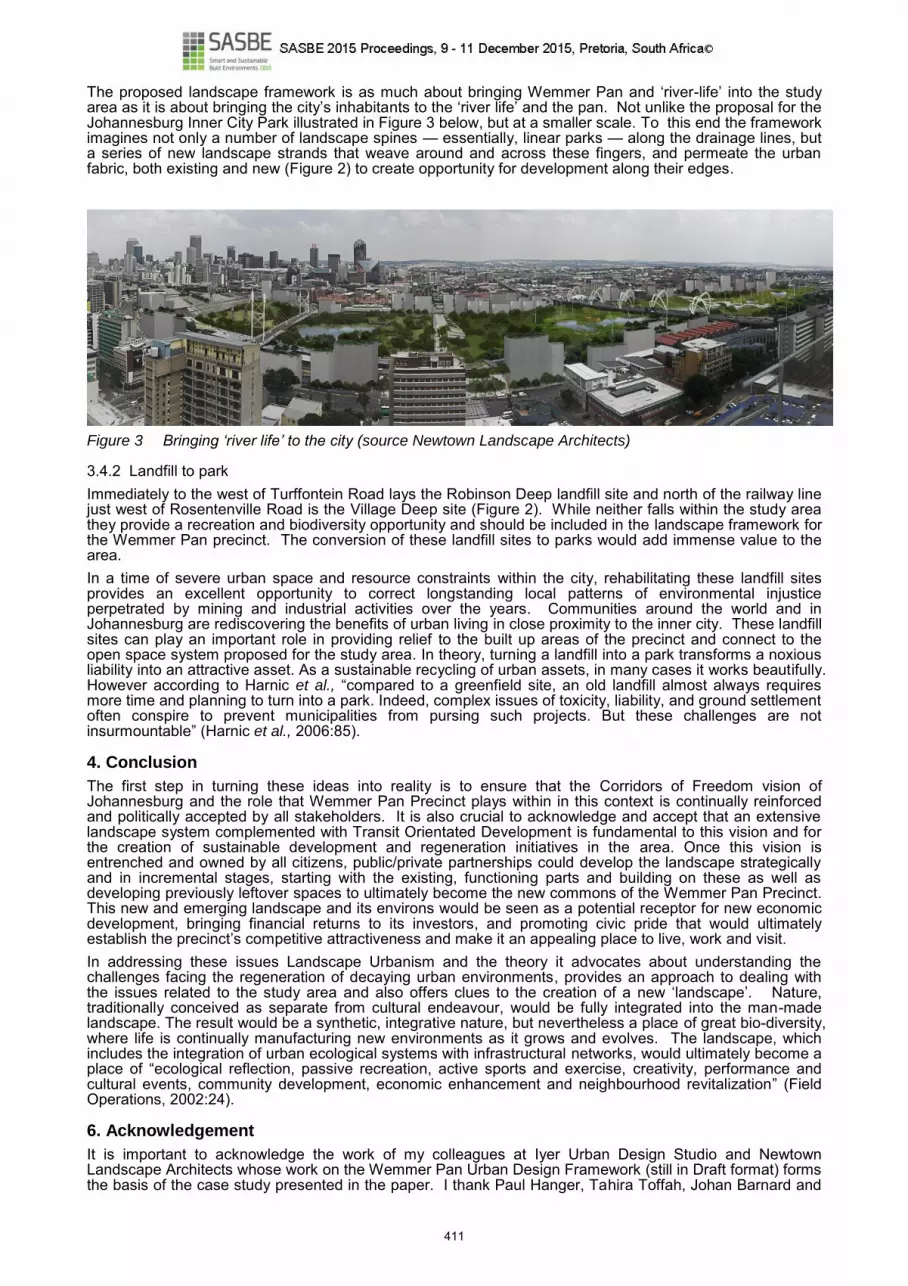
The proposed landscape framework is as much about bringing Wemmer Pan and ‘river-life’ into the study area as it is about bringing the city’s inhabitants to the ‘river life’ and the pan. Not unlike the proposal for the Johannesburg Inner City Park illustrated in Figure 3 below, but at a smaller scale. To this end the framework imagines not only a number of landscape spines — essentially, linear parks — along the drainage lines, but a series of new landscape strands that weave around and across these fingers, and permeate the urban fabric, both existing and new (Figure 2) to create opportunity for development along their edges.
Figure 3 Bringing ‘river life’ to the city (source Newtown Landscape Architects)
3.4.2 Landfill to park Immediately to the west of Turffontein Road lays the Robinson Deep landfill site and north of the railway line just west of Rosentenville Road is the Village Deep site (Figure 2). While neither falls within the study area they provide a recreation and biodiversity opportunity and should be included in the landscape framework for the Wemmer Pan precinct. The conversion of these landfill sites to parks would add immense value to the area. In a time of severe urban space and resource constraints within the city, rehabilitating these landfill sites provides an excellent opportunity to correct longstanding local patterns of environmental injustice perpetrated by mining and industrial activities over the years. Communities around the world and in Johannesburg are rediscovering the benefits of urban living in close proximity to the inner city. These landfill sites can play an important role in providing relief to the built up areas of the precinct and connect to the open space system proposed for the study area. In theory, turning a landfill into a park transforms a noxious liability into an attractive asset. As a sustainable recycling of urban assets, in many cases it works beautifully. However according to Harnic et al., “compared to a greenfield site, an old landfill almost always requires more time and planning to turn into a park. Indeed, complex issues of toxicity, liability, and ground settlement often conspire to prevent municipalities from pursing such projects. But these challenges are not insurmountable” (Harnic et al., 2006:85).
4. Conclusion
The first step in turning these ideas into reality is to ensure that the Corridors of Freedom vision of Johannesburg and the role that Wemmer Pan Precinct plays within in this context is continually reinforced and politically accepted by all stakeholders. It is also crucial to acknowledge and accept that an extensive landscape system complemented with Transit Orientated Development is fundamental to this vision and for the creation of sustainable development and regeneration initiatives in the area. Once this vision is entrenched and owned by all citizens, public/private partnerships could develop the landscape strategically and in incremental stages, starting with the existing, functioning parts and building on these as well as developing previously leftover spaces to ultimately become the new commons of the Wemmer Pan Precinct. This new and emerging landscape and its environs would be seen as a potential receptor for new economic development, bringing financial returns to its investors, and promoting civic pride that would ultimately establish the precinct’s competitive attractiveness and make it an appealing place to live, work and visit. In addressing these issues Landscape Urbanism and the theory it advocates about understanding the challenges facing the regeneration of decaying urban environments, provides an approach to dealing with the issues related to the study area and also offers clues to the creation of a new ‘landscape’. Nature, traditionally conceived as separate from cultural endeavour, would be fully integrated into the man-made landscape. The result would be a synthetic, integrative nature, but nevertheless a place of great bio-diversity, where life is continually manufacturing new environments as it grows and evolves. The landscape, which includes the integration of urban ecological systems with infrastructural networks, would ultimately become a place of “ecological reflection, passive recreation, active sports and exercise, creativity, performance and cultural events, community development, economic enhancement and neighbourhood revitalization” (Field Operations, 2002:24).
6. Acknowledgement
It is important to acknowledge the work of my colleagues at Iyer Urban Design Studio and Newtown Landscape Architects whose work on the Wemmer Pan Urban Design Framework (still in Draft format) forms the basis of the case study presented in the paper. I thank Paul Hanger, Tahira Toffah, Johan Barnard and
411

Dayle Shand for their valuable contribution and creative insights. Also, the City of Johannesburg needs to be commended on their ‘Corridors of Freedom’ initiative, which when successfully implemented will make a huge difference to many of Johannesburg’s citizens.
7. References
Anderson, T. 2010. Landscape Urbanism versus landscape design. Topos 71: Landscape Urbanism: 80-83 Amidon, J. 2012. Two Shifts and Four Threads. Topos 80: 18-19 Barbir, J. et al. Detailed Urban Development Framework including management and implementation plan for Wemmer Pan and surrounds. Report for City of Johannesburg, 14 May 2010. Bouras, E. 2010. Landscape Urbanism: A Brief. Internet: http://hearsight.com/speculations.html Calthorpe, P. 1993. The Next American Metropolis: Ecology, Community, and the American Dream. New York: Princeton Architectural Press. City of Johannesburg, Group Communication and Tourism Department, 2013. Corridors of Freedom – Restitching our city to create a new future. Available at http://www.joburg.org.za/images /pdfs/corridors%20of%20freedom_s.pdf (Accessed: 28 August 2015) Corner, J. 2005. Terra Fluxus. In Waldheim (ed.) 2006. The Landscape Urbanism Reader. New York: Princeton Architectural Press, pp. 23-34. Durack, R. 2004. Shrinking Smart the promise of Landscape Urbanism in Cleveland Urban Design Collaborative Quarterly, 3:3/4 – Winter 2004. Available at http://www.cudc.kent.edu/e-cudc-Quarterly/viewpoint/durack4.html (Accessed 14 March 2012) Field Operations. 2002. Lifescape. Praxis 4: 20-28. Francis, M. 2001. A Case Study Method for Landscape Architecture. Landscape Journal 20:1-01: 15-29. Hes, D. and Du Plessis, C. 2015. Designing for hope – pathways to regenerative sustainability. London: Routledge. Howard, P. et al. (eds.) 2013. The Routledge Companion to Landscape Studies. London: Routledge Iyer and Newtown Landscape Architects. 2015. Draft: Wemmer Pan Precinct Urban Design Framework. Johannesburg: City of Johannesburg Unpublished Report. Mohsen, M. and Najle, C. (eds.) 2003. Landscape Urbanism: A manual for the Machinic Landscape. London: Architectural Association. Knoll, C. 1995. Landscaping and Ecological Rehabilitation of Urban Riverway - Liesbeek River. EPM. May 2015: 22-27. Harnik, P. et al. 2006. From dumps to destinations: The conversion of landfills to parks. The Forum, published by The Trust for Public Land. Available at http://cloud.tpl.org/pubs/ccpe-landfills-to-parks-Places2006.pdf (Accessed 17 June 2015). Howard, P. et al. (eds). 2013. The Routledge Companion to Landscape Studies. London: Routledge. Lyle, J.T. 1994. Regenerative Design for Sustainable Development, New York: John Wiley and Sons Inc. Shannon, K. 2011. Landscapes. In Crysler, C. G. et al. 2011. The Sage Handbook of Architectural Theory. London: Sage, pp. 625-637. Shane, G. 2006. The Emergence of Landscape Urbanism. In: Waldheim, C. (ed.). 2006. The Landscape Urbanism Reader. New York: Princeton Architectural Press, pp. 57-65. Spirn, A.W. 1998. The Language of Landscape. New Haven: Yale University Press. Allen, S. 2001. Mat Urbanism: The Thick 2-D, in Sarkis, H. (ed.). 2001. CASE: Le Corbusier’s Venice Hospital. Munich: Prestel. Statistics South Africa. 2013. National Household Travel Survey 2013 - Statistical Release P0320. .Pretoria, Statistics South Africa. Waldheim, C. 2006. The Introduction - A Reference Manifesto. In: Waldheim, C. (ed). 2006. The Landscape Urbanism Reader, New York: Princeton Architectural Press, pp 15-19.
412

FLOOR AREA CONCESSION INCENTIVES AS PLANNING INSTRUMENTS TO PROMOTE GREEN BUILDING: A CRITICAL REVIEW OF INTERNATIONAL PRACTICES
Ke FAN 1
Queena K. QIAN 2 Edwin H.W. CHAN 3
1 Building and Real Estate Department/ Faculty of Construction and Environment, The Hong Kong
Polytechnic University, Email: [email protected] 2 OTB Research for the Built Environment /Faculty of Architecture and the Built Environment, Delft
University of Technology, The Netherlands, Email: [email protected] 3 Building and Real Estate Department/ Faculty of Construction and Environment, The Hong Kong
Polytechnic University, Email: [email protected]
Key words: GFA incentive scheme, green building, case study, Hong Kong, Singapore
Abstract
The Gross Floor Area (GFA) Concession Scheme, as a planning incentive, developed from the notion of “make developers pay” in the UK in 1990. It rewards developers additional GFA in exchange for public amenities so that government could save that amount of money. This paper reviews the GFA concession schemes in Hong Kong and Singapore to synergize the key features and success factors of its implementation. Reasons for its effectiveness were discussed from the perspective of political, economical, and business issues. Based on case studies, the key features of “Floor Area Concession Schemes” are discussed, including 1) very effective in places with high land value; 2) influencing built environment positively and negatively; 3) ensuring the buildings get certified by green building (GB) rating system. This paper identifies key success factors, comprising 1) common goal but different interests shared by developers and governments; 2) a bonus cap; 3) regular review and revision of the scheme; 4) links between planning objectives and GB technology and design practice, which will be discussed. These help formulate a general approach or model of “Floor Area Concession Schemes” for promoting green building.
1. Introduction
The GFA (Gross floor area) concession incentive scheme is intended to reward developers additional GFA for providing public amenities. It has been widely applied to government programs, such as affordable housing program in US, Australia and UK (Fox et al., 1995; Gurran et al., 2008), and renewable energy of buildings in New Zealand, Japan, France and US (Paetz & Pinto-Delas, 2007). The GFA concession incentive scheme is about the idea to leverage on private investment for providing public amenities (Tang & Tang, 1999). In recent years, the idea has been applied to green building (GB) promotion in several countries and regions, such as US, Singapore and Hong Kong. There are some different terminologies like GFA concession and density bonus in these countries and regions, but sharing the same meaning. In Hong Kong, GFA concession means the floor area of certain building features are allowed to be discounted from the total GFA of the development, with the prerequisite of BEAM Plus certification and energy efficiency data, and fulfilling Sustainable Building Design Guidelines (SBDG) (Council for Sustainable Development, 2010). In Singapore, Green Mark (GM) GFA incentive Scheme rewards developers additional GFA for constructing GM Platinum and Goldplus buildings. Density bonus and FAR (floor area ratio) bonus are used in North American. In the US, any developments guaranteeing LEED (Leadership in Energy and Environmental Design) could increase allowable density by increasing permitted building height or floor area ratio. Overall, all these concepts serve the purpose of promoting GB by rewarding extra GFA on a site. Even if the application of GFA concession to green building is very new, it has achieved success to some extent. For example, in Hong Kong, after the GFA concession incentive scheme was launched, developers actively joined the incentive scheme and the numbers of registered GBs increased almost one third within one year (Liu & Lau, 2013). In the US, density bonus is one of the most popular incentive schemes among developers (Miller et al., 2008). Paetz and Pinto-Delas (2007) and Chan et al. (2009) conducted international case studies and claimed that planning incentives work best as part of a suite of incentives, including subsidies, grants, and development contribution discounts, fast permitting process and education programs. This paper aims to explain the reasons for applying GFA bonus to promoting green building, and explore its key features and success factors. First, the reasons for its effectiveness is analysed from the perspective of political, economical, and business issues, which justifies the advantages of GFA bonus as the incentive scheme. Next, case studies of Hong Kong and Singapore are conducted to identify the achievements and side effects of this scheme. Three key features and four success factors are identified, which indicate that how to apply the GFA incentive scheme is more cost-effective. Findings could be generalized to other regions and countries.
413

2. Reasons for its Effectiveness
2.1 Political Issues
The GFA incentive scheme is essentially a planning incentive essentially, in the form of a GFA bonus, to promote green building (Paetz & Pinto-Delas, 2007). For developers, they are motivated by more profits through selling additional GFA. From governments’ perspective, this scheme generates environmental benefits for the public by positive externality of green building. In this sense, developers and governments share common goals but different interests. Thus, the essential bargaining resource for governments achieving their own interest is their willingness to use public authority to assist business and their ability to create political support for specific programs (Kantor & Savitch, 1993). If the incentive is insufficient, developers will not be engaged in the transaction, while if it is too much, additional social costs will be imposed (Feiock et al., 2008). This leads to another role of GFA inventive schemes, a tool to balance public interests and market efficiency. Regarding GB promotion, it means to reduce additional GFA’s influence on physical environment and promote GB efficiently. Additionally, GFA concession incentive scheme is politically appealing for there are no requirements for financial subsidies or grants from the governments and it doesn’t matter whether governments have strong financial power or not.
2.2 Economical Issues
Typically, regardless of whether in residential, commercial or industrial sector, developers of GB projects, are seldom the end-users, but pay all the initial costs and risks with few benefits of energy savings (Paetz & Pinto-Delas, 2007, Qian et al., 2015). They only benefit if green buildings enjoy higher price or become more marketable than traditional buildings (Paetz & Pinto-Delas, 2007). Therefore, it is essential to implement incentives, like GFA concession that could benefit developers directly, especially at the stage that market doesn’t generate a premium on green buildings. With this incentive scheme, developers are able to make profits from sale of additional lots. Therefore, they consistently participate. For example, in Ashland US where buildable lands are expensive and relative scare, density bonus is very successful and has been used in most of subdivisions (Sauer & Siddiqi, 2009).
2.3 Business Issues
A GFA bonus is essentially a business transaction between government and developers. Private developers are expected to take the responsibility of providing servicing facilities and public infrastructure (Tang & Tang, 1999). For example, US cities usually acquire public benefits from private developers (Sagalyn, 1997). Then these cities governments compensate developers through planning incentives, like density bonus. This strategy has been applied in providing low and moderate cost housing, constraining urban sprawl, and promoting green building (Fox et al., 1975; Ottensmann, 1977; Abair, 2008). On one hand, government save the cost of provision of public servicing amenities. On the other hand, developers have possibility to gain more benefits from the development. For example, in Hong Kong, GFA concession incentive scheme motivated developers to construct green buildings that improve energy and water efficiency. With the increasing of GB market share, more and more electricity and water would be saved in the future. That means government could save the cost of infrastructure extension.
3. State of the art
3.1 Hong Kong
3.1.1 Criteria to grant a GFA concession There are three types of GFA concession, including disregarded GFA, exempted GFA and GFA bonus. Developers could sell more GFA from this scheme. However, it is not mandatory instrument to force developers build green building. To facilitate the development of green and innovative building, Lands Department, Building Department and Planning Department issued two Joint Practice Notes (JPNs) in 2001 and 2002. JPNs illustrate what features could be exempted or disregarded from maximum GFA. They cover twelve green and innovative features (Council for Sustainable Development, 2009). In 2010, the Building Department reviewed the incentive scheme and assess its effectiveness. After that, they issued Sustainable Building Design Guidelines that became the pre-requisite of GFA concessions (Building Department, 2012). This guideline requires 3 key building design elements, including building separation or permeability, building setback, and site coverage of greenery. In the same year, BEAM Plus (building environmental assessment methods) together with energy efficiency data became another prerequisites for granting GFA concessions (Hong Kong Green Building Council, 2015a). These documents are formulated to balance environmental performance and comfort requirements of buildings.
3.1.2 Achievement of incentive scheme and side effects The BEAM Plus is a voluntary scheme, tailored for sub-tropical and high-density urban development (Ng, 2013). From 1996 to 2010, the BEAM experienced a slow movement (Figure 2) that only 210 projects acquired certificates within 14 years. This situation changed dramatically when Hong Kong government claimed that the BEAM Plus certification was the prerequisite of GFA concession in 2011. To April 2015, the registered projects have increased to 641 already (Hong Kong Green Building, 2015b). Hong Kong is a high-density city that has very limited land provision each year (Li, 2006). That means the scale of new development is fixed every year. Therefore, the gross floor area concession is very attractive to developers.
414

That is why after the GFA concession incentive scheme implemented, more BEAM Plus projects were registered.
Figure 1 Number of BEAM Plus Projects in Hong Kong (Source: Liu and Lau, 2013)
Besides, the GFA concession scheme also brings environmental benefits by motivating developers to construct building with green features. The Joint Practice Notes (JNP) is the package of incentives to green building design. Their goal is to maximize use of renewable energy resources and green building material, to minimize the use of non-renewable energy and to reduce the construction waste (Leung, 2002). This guide also illustrates the green features that could be exempted from the GFA calculation. In this way, fixed green features suitable for Hong Kong built environment are promised. JNP encourages developers to provide public open space, such as communal sky or podium garden, and to satisfy the residents’ needs. Providing these gardens in high-density place could enhance building amenity, allow more daylight and better ventilation, improve visual effect, and provide a green area for recreational activities. These features benefit occupants numerously and include better personal and communal space, balconies, etc. (Tam et al., 2013). Also, maintaining these facilities adds values to the buildings that bring long-term economic benefits. On the contrast, the GFA concession scheme generates some side effects as well. The additional GFA increased building height and bulk that have negative impacts on the built environment. Development Bureau (2010) conducted a survey to review 97 projects constructed in 2001 since GFA concession policy implemented. The findings show that GFA concessions for the residential buildings contributed to additional 40% GFA in high-density areas, 67% in medium-density zones, and 57% in low-density zone. Regarding the non-domestic developments, GFA concession added 37% of building bulk (Development Bureau, 2011). In a high-density city like Hong Kong, increased building height or bulk may bring negative influence to built environment (Council for sustainable development, 2009), such as visual impact and negative influence on air ventilation. Figure 3 illustrates the canyon effect that reduces the effectiveness of air ventilation and strengthens the concentration of pollutant at a pedestrian level. The vehicles on the street emitted pollutants that are transported towards leeward side, while the windward side is exposed to the background pollution.
Figure 2 Canyon effect (Source: Berkowicz, 2000)
Apart from the negative impacts on the built environment, there was inflated building issues due to developers’ speculation. To encourage developers to provide more liveable environment, GFA concession incentive scheme regulates that green and amenity features like balconies, wide corridor, and sky gardens, called inflated areas, are not accounted for total allowable GFA. Thus developers do not have to pay government for inflated areas but they could receive payment from consumers. This leads to the phenomenon that some features such as non-structural prefabricated external walls and projecting windows (known as “bay windows”) become developers’ tools to make inflated profits. For example, in Figure 4, the area of external wall could be exempted. Hence developers increased the thickness of wall to 300mm that is too much for a sub-tropical climate city like Hong Kong. Same phenomenon also appeared in Singapore. Singapore Urban Redevelopment Authority pointed out that 500mm projecting windows (the extent of projection in Figure 5) have greatly contributed to building bulk, influenced building design, and generally
415

discouraged energy efficiency (Hong Kong Institute of Architect, 2012). Therefore, the incentive scheme should be designed carefully to avoid the speculation.
Figure 3 Bay window of inflated building (Source: Hong Kong Institute of Architecture, 2012)
3.1.3 To review the incentive scheme Considering the defects of this incentive scheme, the Hong Kong government reviewed it and conducted public engagements attended by 4000 participants from various sectors (i.e. professional institutes, developers, general public) in 2010 (Development Bureau, 2011). After over 65 in-depth public engagements, government decided to tighten the policy, including doing away with concessions for certain features, lowering the level of concessions for car parks, utility platforms, balconies, and residents’ recreational facilities, etc. (GovHK, 2014). Tightening policy aims to seek a proper balance between the comfort requirements of buildings and environmental performance (Tam et al., 2013). According to Development Bureau (2011), tightened policy has a positive effect on the control of building height and bulk, and a significant reduction of GFA concession could be reached, compared with previous policy. It proves that to review the scheme and gather feedback from the stakeholders in time is necessary and essential.
3.2 Singapore
3.2.1 Criteria to grant GFA concession In 2005, the Building Construction Authority (BCA) in Singapore issued the Green Mark (GM) Scheme to facilitate sustainable development of built environment. This scheme encourages developers to adopt an integrated design approach, incorporating passive design and various green building technologies (BCA, 2009). In 2009, BCA and the Urban Redevelopment Authority (URA) jointly released a set of the Green Mark GFA incentives. Developers or building owners could acquire the additional GFA allowed beyond Master Plan if buildings achieve higher-tier GM ratings of Platinum and Goldplus. Achieving the GM Platinum level could claim for up to 2% GFA bonus (subject to a cap of 5,000 sqm.), while reaching the GM Goldplus could claim for up to 1% GFA bonus (subject to a cap of 2,5000 sqm) (BCA, 2009). The Gold and Certified level of projects assessed by GM, cannot get GFA bonus.
3.2.2 Achievement of incentive scheme and side effects Singapore started green building at later time compared with other developed countries, but experienced large growth of green building from 2006 to 2012 (Figure 5). When Green Mark was launched in 2005, only a few projects registered. In the following years, government implemented a lot of policies to promote GB, such as the 1st Green Building Master Plan in 2006,the Green Mark Incentive Scheme in 2006,the Green Mark GFA Incentive Scheme in 2009, etc. By 2012, the registered Green Mark building has reached to 1274. Figure 5 shows the dramatic increase clearly. In terms of the GM GFA Incentive Scheme, after it’s implemented in 2009, the number of the GM Platinum and Goldplus projects had increased from 82 to 125 within 3 years (BCA, 2014). When its effective period ended in 2014, government extended for another five years.
416

Figure 4 Number of Green Mark Projects in Singapore (Source: Liu and Lau, 2013)
The GM GFA incentive scheme in Singapore benefits environment in the same way as that in Hong Kong. It provides some prerequisite requirements for the building design criteria according to the features of built environment. For example, if developers would like to acquire the GM Platinum rating of residential building that indicates GFA bonus, it is required to use ventilation simulation modelling and analysis to identify the most effective building design and layout. The simulation consequence and recommendations derived are to be implemented to guarantee quality natural ventilation (BCA, 2013). The Green Mark Platinum requires that minimum 70% selected typical dwelling units have good natural ventilation. Common areas, such as lift lobbies, corridors, and staircases, are to be designed for natural ventilation (BCA, 2013). In this way, the environmental benefits of GB could be guaranteed. On the other side, it also brings some side effects. As bonus GFA are allowed over the Master Plan (MP) gross plot ratio (GPR) for a site, they increase the development bulk and intensity beyond what was regulated for (BCA, 2015).The bay window and planter boxes are typical products of this scheme that influences building bulk and intensity significantly. At the beginning, the bay window was exempted from the GFA calculations because it was regarded as raised window ledges and not floor slab (BCA, 2008). However, providing bay window is usually intended to increase saleable strata space. What’s more, in order to overcome standard façade appearance of bay window, some architects provide cladding to decorate bay windows that leads to immense building bulk and influences design consequence of developments (BCA, 2008). In 2008, URA reviewed the incentive scheme, collected feedback from industry, and announced the changes of the GFA guidelines for bay windows and planter boxes.
4 Key features and success factors
4.1 Key features
According to the above analysis, there are three key features of GFA concession incentive scheme.
4.1.1 Very effective in high land price area Hong Kong and Singapore enjoy high land price and housing rent. More saleable GFA means more profits for developers. In high-rent place, a density bonus could be easily used to encourage developers (Küçükmehmetoğlu and Büyükgöz, 2013). In Hong Kong where housing price and building density are higher, GFA is closely related to profitability of a project, concerned very much by developers (Liu, 2013). Unlike China Mainland, Hong Kong has limited land provision each year (Qian, 2010). Land sales could not exceed 50ha each year (Li, 2006). Therefore, the total gross floor area concession is very attractive to developers.
4.1.2 Influencing built environment positively and negatively Both of Hong Kong and Singapore link the GFA concession incentive scheme to the building design to guide developers to construct green buildings. Thus implementing this incentive scheme could benefit their unique built environment, such as more daylight. On the other hand, the additional GFA would increase building bulk and height, which influence visual effects and air ventilation of surroundings. Therefore, government should be careful to decide how much GFA bonus could be granted.
4.1.3 To ensure building get certified by green building rating system Both Hong Kong and Singapore require green building label to reward GFA bonus. For example, in Hong Kong, BEAM Plus certification is the prerequisite of GFA concession, and in Singapore, only Green Mark Goldplus certification or above could get bonus. These requirements largely promote GB development.
417

4.2 Success factors
4.2.1 Developers and government have common goals but different interests To promote green building, governments should build strong relationship with developers (Qian et al., 2013). The GFA incentive scheme makes governments and developers share common goals but different interests. Developers get compensation from GFA bonus for they are usually not end-users and cannot enjoy the benefits of energy efficiency but have to pay all the initial costs and risks, while governments could save the money to reduce the energy consumption and deal with environmental protection issues by promoting GB.
4.2.2 Setting a cap on bonus Both Singapore and Hong Kong have set a cap on GFA bonuses to reduce the impacts of increased building bulk and height on built environment, as well as developers’ speculation. By setting a cap, inflated buildings are prevented and building bulk and height get controlled. After all, the key point to build the relationship between developers and government is to motivate developers with the GFA concession and to minimize its negative impacts on the built environment in the meanwhile.
4.2.3 Reviewing the scheme and assessing the effectiveness As the GFA concession incentive scheme for green building is very new, governments usually lack of experience, as well as of information about the incentive scheme design. Therefore, they need to review the scheme and collect feedback from industry regularly. In Singapore, they reviewed the incentive scheme after two years of implementation to adjust some details, such as streamlining GM GFA application process and revising the definition of some terminology. In Hong Kong, governments also gathered some feedbacks from the market and industry to assess the effectiveness and improve the scheme. For example, they conducted survey and public engagements to collect information about inflated buildings and feedbacks from stakeholders including professionals, developers, and general public, and revised the GFA concession incentive scheme. Figure 6 illustrates the history of the GFA concession in Hong Kong.
Figure 5 History of GFA concession incentive scheme in Hong Kong (Constructed by author)
4.2.4 Linking the GFA concession scheme with planning objectives Linking the GFA concession scheme with various planning objectives GB technology and design practice Planning objectives, certain GB technology, and the green design practice could be realized by setting the requirements of achieving GFA concession. For example, in Singapore, bonus GFA incentives help realize various planning objectives for the city, such as balcony scheme encouraging tropical architecture, and lighting incentives scheme enhancing city image (URA, 2011). In Hong Kong, the innovative green design could get additional points of BEAM Plus, and the GFA of green features are allowed to be exempted.
5. Conclusion
The GFA incentive scheme, which is developed from the notion of “make developer pay” in UK in 1990, is widely used in the world and applied in many programs to reward developers in exchange for provision of
418

public amenities. This paper lays emphasis on its application in promoting green building and analyse the reasons from political, economic, and business perspective. In terms of political issues, the GFA incentive scheme makes government and developers share common goals but different interests. Governments could be proactive to promote green building. And the extent of promotion depends on their willingness to use public authority to assist business and their ability to create political support for the program. Additionally, governments do not have to spend money such as providing grants or subsidies. Therefore, it does not matter whether the government has strong financial power or not. Regarding economic issues, as developers are usually not the end-users and cannot enjoy the benefits of energy efficiency, but they have to pay all the initial costs and risks, GFA bonus could benefit developers directly. From business perspective, developers acquire additional GFA from government by the provision of amenities, while governments save the money of public service provision. Even if the GFA incentive scheme has long history, it is still new to apply it to the GB promotion. Hong Kong and Singapore as leading regions have achieved success to some extent. This paper conducts case studies of the two places to analyse the key features and success factors to help formulate a general approach or model of GFA incentive scheme for GB promotion. Key features include 1) very effective in places with high land value; 2) influencing built environment positively and negatively; 3) ensuring the buildings get certified by GB rating system. Success factors include 1) common goal but different interests shared by developers and governments; 2) a bonus cap; 3) regular review and revision of the scheme; 4) links between planning objectives and GB technology and design practice.
6. Acknowledgements
This study is supported by the Construction Industry Council of Hong Kong.
7. Reference
Abair, J.W. 2008, "Green Buildings: When It Means to Be Green and the Evolution of Green Building Laws", Urb.Law., vol. 40, pp. 623. BCA, 2008, Changes to Gross Floor Area (GFA) Exemption Guidelines – (1) Bay Windows in all Developments; and (2) Planter Boxers within a Residential Unit, Building and Construction Authority, Singapore. BCA, 2009, Green Mark Gross Floor Area Incentive Scheme for private developments that achieved higher-tier Green Mark Ratings, Building and Construction Authority, Singapore. BCA, 2012, AMENDMENTS TO BUILDING CONTROL (ENVIRONMENTAL SUSTAINABILITY) REGULATIONS TO REQUIRE GREEN MARK GOLDPLUS CERTIFICATION FOR DEVELOPMENTS ON AN ADDITIONAL STRATEGIC GROWTH AREA UNDER GOVERNMENT LAND SALES (GLS) SITES, http://www.corenet.gov.sg/einfo/uploads/circular/cbca120803.pdf BCA, 2013, Green Mark for new residential buildings version RB/4.1, http://www.bca.gov.sg/greenmark/others/gm_resi_v4.1.pdf BCA, 2013, Singapore built environment, Building and Construction Authority, Singapore. BCA, 2015, Building and Construction Authority, Singapore. http://www.bca.gov.sg/greenmark/green_mark_criteria.html, Berkowicz, R. (2000). OSPM—a parameterised street pollution model. In Urban Air Quality: Measurement, Modelling and Management (pp. 323-331). Springer Netherlands. Building and Construction Authority (2008c). BCA Green Mark for Residential Buildings (Version RB/3.0). http://www.bca.gov.sg/GreenMark/others/gm_resiV3.pdf Building Department Hong Kong, 2001, http://www.bd.gov.hk/english/index.html Building Department Hong Kong, 2012, http://www.bd.gov.hk/english/documents/pnap/APP/APP152.pdf Chan, E.H.W, Qian, Q.K., & Lam, P.T. I., 2009, The Market for Green Building in Developed Asian Cities – the Perspectives of Building Designers, Energy Policy (37), pp.3061-3070. Council for Sustainable Development, 2009, http://www.susdev.org.hk/susdevorg/archive2009/en/irdoc/irdoc_4.html Council for Sustainable Development. (2010). Building design to foster a quality and sustainable built environment, Council for Sustainable Development, Hong Kong Government, Hong Kong. Cuthbert, A.R. 2008, The form of cities: Political economy and urban design, John Wiley & Sons. Development Bureau. (2009). A sample study on gross floor area (GFA) concessions granted to buildings, Development Bureau, Hong Kong Government, Hong Kong. Development Bureau, 2011, Measures to foster a quality and sustainable built environment, Hong Kong Government, Hong Kong.s Feiock, R.C., Tavares, A.F. & Lubell, M. 2008, "Policy instrument choices for growth management and land use regulation", Policy Studies Journal, vol. 36, no. 3, pp. 461-480. Fox, G.M. & Davis, B.R. 1975, "Density bonus zoning to provide low and moderate cost housing", Hastings.Const.LQ, vol. 3, pp. 1015.
419

GovHK, 2014, http://www.gov.hk/en/residents/environment/sustainable/buildings.htm Gou, Z., Lau, S.S. & Prasad, D. 2013, "Market readiness and policy implications for green buildings: case study from Hong Kong", College Publishing, vol. 8, no. 2, pp. 162-173. Gurran, N., Milligan, V., Baker, D.C., Bugg, L.B. & Christensen, S.A. 2008, "New directions in planning for affordable housing: Australian and international evidence and implications",Research and Policy Bulletin, vol. 105, no. Final Report: No. 120, pp. 1-143. Hong Kong Green Building Council, 2015 a, https://www.hkgbc.org.hk/eng/beamplus-certlabel.aspx Hong Kong Green Building Council, 2015 b, https://www.hkgbc.org.hk/eng/BEAMPlusStatistics.aspx Hong Kong Institute of Architects, 2012, Health and safety controls on private residential buildings in Hong Kong. Kantor, P. & Savitch, H.V. 1993, "Can politicians bargain with business? A theoretical and comparative perspective on urban development", Urban Affairs Review, vol. 29, no. 2, pp. 230-255. Kayden, J.S. 2000, Privately owned public space: the New York City experience, John Wiley & Sons. Küçükmehmetoğlu, M. & Büyükgöz, A. 2013, "Consensus Building Via Cooperative Game Theory In The Process Of Urban Redevelopment", ERSA conference papersEuropean Regional Science Association, . Legislative Council Panel on Development, 2008, Public Engagement on Measures to Foster a Quality and Sustainable Built Environment http://www.legco.gov.hk/yr08-09/english/panels/dev/papers/dev1219cb1-396-5-e.pdf Leung, C., Chung, C., Hui, M. & Lau, M. 2002, "The Green building initiatives", International Conference onSustainable Building, Oslo, Norway, pp. 23. Li, L. 2006, Development appraisal of land in Hong Kong, Chinese University Press. Liu, Y. & Lau, S. 2013, "WHAT IS A GREEN POLICY AN ANATOMY OF GREEN POLICY THROUGH TWO ASIAN CITIES: HONG KONG AND SINGAPORE", The World Sustainable Building (SB) ConferenceResearch Publishing., , pp. 323. Miller, N., Spivey, J., &Florance, A. (2008). Does green pay off? Journal of Real Estate Portfolio Management, 14(4), 385-400. Ng. J. (2013). Cream of BEAM Plus: A general case review of green buildings. The HKIE Environmental Division Annual Seminar. Ottensmann, J.R. 1977, "Urban sprawl, land values and the density of development", Land Economics, , pp. 389-400. Paetz, M.M.D. & Pinto-Delas, K. 2007, "From Red Lights to Green Lights: Town planning incentives for green building", Talking and Walking Sustainability International Conference February. Planning Department, Hong Kong, 2006, http://www.pland.gov.hk/pland_en/tech_doc/hkpsg/full/ch11/ch11_text.htm#12 Qian, Q.K., Chan EHW, Visscher, H.J., Lehmann S., 2015, Modeling the Green Building (GB) Investment Decisions of Developers and End-users with Transaction Costs (TCs) Considerations, Journal of Cleaner Production (In Press, available online 29 April 2015, doi:10.1016/j.jclepro.2015.04.066) Qian, Q.K., 2010, Government Measures in China for Promoting Building Energy Efficiency (BEE): A Comparative Study with Some Developed Countries, The International Journal of Construction Management,Vol.10.No.4, pp.119-138. Qian Q.K, Chan, E.H.W., & Choy, L.H.T., 2013, How transaction costs affect real estate developers entering into the Building Energy Efficiency (BEE) market? Habitat International, Volume 37, pp. 138-147. (Available online 23 February 2012: http://www.sciencedirect.com/science/journal/aip/01973975). Sagalyn, L.B., 1997, "Negotiating for Public Benefits: The Bargaining Calculus of Public-Private Development", . Sauer, M. & Siddiqi, K. 2009, "Incentives for green residential construction", Construction Research Congress 2009, pp. 578. Singapore Urban Redevelopment Authority. (2008). Singapore Urban Redevelopment Authority circular 2008/7: Changes to GFA examption guidelines—Bay windows, Singapore Urban Redevelopment Authority, Singapore. Tam, V.W., Fung, I.W. & Chan, H.H. 2013, "Efficacy of Gross Floor Area Concession Policy: Empirical Study in Hong Kong", Journal of Professional Issues in Engineering Education and Practice, vol. 140, no. 3. Tang, B. & Tang, R.M. 1999, "Development control, planning incentive and urban redevelopment: evaluation of a two-tier plot ratio system in Hong Kong", Land Use Policy, vol. 16, no. 1, pp. 33-43. URA, 2011, DEVELOPMENT CONTROL PARAMETERS FOR RESIDENTIAL DEVELOPMENT, Urban Redevelopment Authority, Singapore,http://www.ura.gov.sg/circulars/text/dchbr/generalconsideration-dchbr.pdf
420

EFFECTIVENESS OF ENERGY EFFICIENCY REGULATORY TOOLS IN THE HOUSING SECTOR
Henk VISSCHER
1
1 OTB Research for the Built Environment / Architecture and the Built Environment / Delft University of
Technology, Email: [email protected] Keywords: Building Control, Building Regulations, Housing Stock, Energy Performance, Energy Saving
Abstract
The urgent need for a dramatic reduction of fossil fuels in the built environment is without any doubt. The energy saving potential of the building stock is considered to be large and to be the most cost efficient sector to contribute to the CO2 reductions. Goals set by the European Union are to build net zero energy buildings in 2020 and to reach an energy neutral building stock by 2050. The current practice shows that the energy saving goals can only be reached by strict and supportive governmental policies. In Europe the Energy Performance of Buildings Directive and the Energy Efficiency Directive are driving forces for EU Member States to develop and strengthen energy performance regulations controlled within the building permit procedures for new buildings and energy performance certificates (labels) for the building stock. This paper analyses the consequences of these developments for the systems of building regulations and control. It appears that these very ambitious goals require a review and innovation of the regulatory systems and tools. The current approaches seem to be inadequate to deal with the new challenges. This is concluded from ongoing research that shows that aims of regulations in general and energy saving goals in particular, are hardly realized in practice.
1. Introduction
Climate change mitigation is maybe the most important driver for the ambitions to reduce the use of fossil fuels. There are also other reasons for implementing energy efficiency policies in the EU and its Member States. These include the wish to diminish the dependency on fuel imports, the increasing costs and the fact that fuel resources are limited. The European building sector is responsible for about 40% of the total primary energy consumption. To reduce this share, the European Commission (EC) has introduced the Energy Performance of Buildings Directive, the EPBD (2010/31/EC) and more recently the Energy Efficiency Directive (EED – 2012/27/EU). These frameworks require Member States to develop energy performance regulations for new buildings, a system of energy performance certificates for all existing buildings and policy programmes that support actions to reach the goals like building only ‘Nearly Zero Energy Buildings (NZEB)’ by 2020 and realizing an almost carbon neutral building stock by 2050. Formulating ambitions and sharpening regulations are relatively easy to do. Technical solutions are currently available to realise the NZEB standard in building projects and more and more projects of this kind are being build. However, there is quite some evidence that the mainstream of building projects do not have the expected energy performance in practice. What is perhaps even more important in this respect is that the focus predominantly should be on the existing building stock. About 75% of the buildings that will make up the housing stock in 2050 have already been built today. For this purpose it is of importance to consider if the energy performance certificates give reliable information and contribute to the energy saving goals. This paper describes the main developments in the field of building regulatory systems and building practice in the context of the increasing energy saving target, both for new as well as for existing dwellings. The main question addressed is whether the current regulations and forms of building control are adequate to realize the energy saving goals set by the EU and its Member States.
2. Developments in building regulatory systems
In the Netherlands as well as in many other countries, the building regulations are a recurring subject in the debate of governmental reviews. On the one hand regulations should be minimized to reduce the administrative burden on citizens and businesses. On the other hand, new quality themes emerge that require regulatory intervention. Energy reduction and climate change are such themes. The European Union and its Member States have developed regulations and enforcement schemes that ensure very energy efficient new buildings and instruments that stimulate the improvement of the existing stock. Although the general development in the European countries leads to less governmental intervention in the building sector, in the field of energy efficiency the number of regulations increases and they become more stringent. Currently in the Netherlands the debate is very intense. The desire for deregulation leads to the opinion that greater emphasis should be put on the responsibility of property owners and the actual building control will be transferred from the municipalities to private parties.
421

However, the existing quality control by most actors in the Dutch building industry appears to be not adequate enough nowadays. Incidents occur and the physical quality sometimes falls short of the requirements. As the CO2 reduction and energy efficiency targets increase, stronger regulations and accurate building control seem to be required.
3. The realisation of required energy performances in practice
In 1995 energy performance regulations for space heat and cooling of newly built constructions were introduced in the Netherlands. It consists of a standard (norm) for the calculation method which is called the Energy Performance Norm. The standard results in a non-dimensional figure called the Energy Performance Coefficient (EPC). Every few years the level of this Energy Performance Coefficient was decreased, representing a lower energy use demand for the building related energy use. In 2020 new dwellings must be energy neutral according to the EPBD. Since the introduction of the energy performance regulations only a few studies were carried out to assess the effect of the regulations on the actual energy use in the houses in reality. The samples were of limited size as well. Two studies found no statistical correlation between the energy performance coefficient level and the actual energy use per dwelling or per square meter. Analysis of the WoON (2009) survey, (that was carried out on behalf of the Dutch government in 2006 containing a representative sample of 5000 dwellings), also found no correlation between the different levels of the energy performance coefficient and the actual energy use per dwelling and per square meter (see Figure 1). Guerra Santin (2009, 2010) compared the actual and expected energy consumptions for 313 Dutch dwellings, built after 1996. The method included an analysis of the original EPC calculations that were submitted to the municipality as part of the building permit application, a detailed questionnaire and some day-to-day diary’s. These combined approaches generated very detailed and accurate data of the (intended) physical quality of the dwellings and installations, about the actual energy use (from the energy bills) and of the households and their behaviour. The dwellings were categorised according to their EPC. In energy inefficient buildings with a high EPC, actual energy consumption for heating was almost two times lower than expected. Whereas in buildings with a high energy efficiency, the expected and actual energy use are much closer. Due to the relatively small sample size, the differences between the actual heating energy of buildings with different EPC values were insignificant. Nonetheless the average consumption was consistently lower in buildings with lower EPC. Guerra Santin found that building characteristics (including heating and ventilation installations) were responsible for 19% to 23% of the variation in energy used in the recently built building stock. Household characteristics and occupant behaviour seemed to be responsible for 3% to 15% of the total variance. This is partly the so called rebound effect: if the conditions improve and the people have the idea that the building is more energy efficient, they become less carefull in their energy use behaviour and for instance use higher temperature settings and wear thinner clothing. On the basis of this study and other literature one can state that building characteristics, household characteristics and occupant behaviour altogether are responsible for at most 38% of the variation on energy consumption of dwellings built after 1995. Therefore at least 62% of the variation in energy use was unexplained by theoretical performance and behaviour and must be caused by other reasons.
Figure 1 Yearly gas consumption in m3 in Dutch dwellings (WoON, 2009)
422

Figure 2 Actual energy use in relation the Energy Performance Coefficient per Type of dwelling (Guerra
Santin, 2009)
There are also indications that the gap is related to design and construction faults and that heating services operate in very different conditions than assumed beforehand. Nieman (2007) showed that in a sample of 154 dwellings, 25% did not meet the energy performance requirements in the design phase because of mistakes in the calculations. Nevertheless the building permit was issued. In 50% of the dwellings, the realization was not in accordance with the design. These results comply with other findings about inadequate performance the building industry but also of the building control authorities in the Netherlands and other countries (Meijer e.a. 2002, 2006, 2008). Taking into account the above findings, one can have some doubts if further tightening of the energy performance regulations will lead to a better energy performance in practice. Perhaps there are other and more efficient solutions to decrease the energy consumption of newly built dwellings in practice. Important ingredients of the solution are: ensuring that appliances and installation are correctly installed, monitoring the calculated performances in practice; enlarging the know-how and skills of building professionals and putting in place an effective and efficient building control and enforcement process. Checking the actual performance in the finished building becomes more important.
4. Policies and instruments for energy reduction in existing dwellings
The largest energy saving potential is in the existing building stock. On average new dwellings add less than one per cent per year to the housing stock. The most important policy tool required by the EPBD in the European Member States is the issuing of Energy Performance Certificates (or EPC’s). The EPC g ives an indication of the energy demand that is required to realise a certain average temperature in the building and depends on physical characteristics of the building. The certificate has no mandatory implications in the sense that owners could be forced to improve their buildings to certain levels. Nonetheless it is a crucial instrument for benchmarking and formulating policy goals. Building owners in all Member States have to obtain an EPC for a building at the moment it is sold or rented out to a new tennant. This is not yet current practice everywhere, mostly due to lacking of enforcement. This especially applies to the private housing stock.
Figure 3 Distribution of the energy labels of the non-profit rented housing sector in SHAERE database
(Filippidou, F, et al., 2014)
423

In the Netherlands however, the whole social housing stock is labelled with an EPC. The social sector in the Netherlands is still relatively large (35%) and well organised. For the social housing stock the EPC’s are collected in a database called SHAERE. With this database the progress of the renovation practices can be monitored. Besides that the relation between the EPC’s (with the calculated energy use) and the actual energy use can be studied. A few years ago the sector formulated ambitious programmes, but these have been scaled down because of several reasons. The economical crises reduced the financial capacities of the housing associations. The housing market also dramatically slowed down which also affected the funding for renovations because this largely depends on the sales of property. Also it proved to be difficult to get approval of tenants for renovations that require an increase of the rents (70% of the tenants have to agree). It is hard to assure the saving of energy costs resulting of the improvement of the dwellings. All in all the progress of renovations and energy upgrading measures stays far behind expectations and formulated ambitions in 2008 when most of the policies, covenants and improvement programmes were set up. The social housing sector agreed with the government and the national tenants union to a covenant about energy renovation goals. Most important goal is to reach an average label B in 2020 for the whole sector, which comprises 2.3 million dwellings (35% of the total stock). Research with the SHAERE data base shows the progress in renovation. Figure 3 demonstrates the label steps over the years 2010 to 2013. It can be noted that most of the renovations lead to small improvements. If the current figures are extrapolated to 2020, we can see that the goals of an average label B will not be reached (see Figure 4). The label indexes relate the calculation of the Energy Index, which is for label B 1,25.
Figure 4 Development of the EI in the Dutch non-profit housing sector since 2010, (Filippidou, F, et al.,
2015)
The actual domestic energy use is besides the physical characteristics of a dwelling, largely influenced by the use and behaviour of the tenants. Some preliminary figures demonstrate the difficulty in ‘forcing’ reduced energy use by improvements of dwellings. The dwellings with the worst EPC (G) in practise use far less energy as expected, while the most advanced dwellings (A) use much more. This is probably due to a combination of the rebound effect and an increase in comfort level of the dwellings (Majcen et al 2013a, 2013b, 2015) and underperformance of the buildings and installations. The large difference between theory and practice is called the performance gap and is recognised in more and more international studies. Figure 5 shows the actual and theoretical gas consumption per dwelling per EPC.
Figure 5 Actual and theoretical gas consumption in Dutch dwellings (Majcen et al., 2013a)
In the homeowner sector the issuing of EPC’s is still very limited. This means that the intended purposes are not reached. When EPC’s become common practice they could affect the sales price. There is no
424

enforcement system in place to guarantee that only buildings with an EPC can be traded on the housing market.
5. Impact on the systems of building regulations and control
Without any doubt there is a necessity to drastically reduce the use of fossil-fuel energy sources by reducing the demand for energy and switching from fossil to renewable sources. Buildings account for 40% of Europe’s energy consumption and three-quarters of the floor area of the building stock is residential. The targets are clear and the technical solutions are available. Good insulation and product innovations can reduce the energy demand for heating and cooling for a large part. The remaining energy demand can be delivered by renewables like sunlight and heat, district heating, heat pumps, etc. The remaining electricity demand for appliances can in the first place be reduced by further product innovation and then be provided by photovoltaic panels. There are no reasons not to apply these solutions in new buildings at a large scale on the short term. Evaluations of the current practice show however that there is a lot to be gained here. To improve this situation it has to be assured that constructions and installations are installed properly and in such way that they are not vulnerable for unpredictable or misuse by the occupants. This will set demands on both the construction industry as on the control and enforcement process (and the parties responsible). Better quality control during the whole process is essential. It is quite feasible to give the building professionals this task. Our international comparative research into building regulatory systems shows a tendency to put more emphasis on the responsibilities of owners and private parties (instead of local authorities) to control and ensure the minimum quality of construction works. For a successful transition towards energy neutral construction stricter demands must be set on the knowledge and skills of these building professionals (designers, engineers, installers, constructors, etc.). They will have to use new techniques and improve the quality and accuracy of the work. This means that they not only will have to improve their operating procedures but also have to implement performance guarantees. Owners and users will require quality guarantees from the designers, installers and constructors. Certification and accreditation of parties, processes and products will become more important for building processes in general. For the realization of high energy performance standards, a reliable quality assurance system will be very important. In most countries that have some experiences with passive houses some form of performance guarantee and associated quality assurance scheme exists. It is important to study these examples. The improvement of the existing building stock forms a big challenge. The potential energy savings are large, but the barriers to overcome are also high. As stated before, almost three quarters of the future housing stock (2050) has already been built. Studies show however that it is hard to increase the rate and depth of energy renovations of the existing stock. Actual energy (and financial) savings in renovated dwellings stay behind expectations because of rebound effects. There are important barriers. Many owners believe that the benefits of the measures do not outweigh the costs. Besides that, the cost of improving the energy performance of a dwelling does not (proportionally) increase the value of the dwelling. We are faced with the difficult task to increase the energy renovation pace. The question is how this process can be accelerated. Maybe there is still room for further smart product development. Innovative products that that contribute significantly to the reduction of energy demand, that are cheap, easy to apply and to handle by occupants and users. The fast decrease of the price of PV cells is promising. Climate change and the related demands on buildings will have a profound impact on the design of building regulatory systems. The past few years OTB – Research for the Built Environment has been involved in studying alternative visions on building regulatory systems in international comparative projects. What we see in most countries are discussions (or sometimes even concrete developments) where the balance slowly shifts from:
Command and control regulations towards more economic incentive based policies; Public control and enforcement towards a more dominant role of private parties/building
professionals (together with the materialisation of far more robust and reliable certification and accreditation schemes);
A strong focus on control of the design to monitoring of the building process and testing of the quality of the final building and post occupancy monitoring.
At the same time the role of regulations for existing buildings come under scrutiny and from a range of stakeholders attempts are undertaken to search for solutions. Instant solutions are not easy to give. None the less along the most probable solutions will move in the directions sketched above.
6. References
Filippidou, F, Nieboer, N, Visscher, H, 2014, The Pace of Energy improvement in the Dutch non-profit housing stock, in Proceedings of SB 14, World Sustainable Building Conference, Barcelona. Filippidou, F, Nieboer, N, Visscher, H, 2015, Energy efficiency measures implemented in the Dutch non-profit housing sector, ECEEE conference, France Guerra Santin O., Itard L. and Visscher H.J. 2009, The Effect of Occupancy and Building Characteristics on Energy Use for Space and Water Heating in Dutch Residential Stock, Energy and Buildings, 41, 1223-1232. Guerra Santin O. and Itard L. 2010, Occupant behaviour in residential buildings in the Netherlands: Determinants and effects on energy consumption for heating, Building Research & Information, 38:3, 318-338
425

Meijer, F.M., Visscher, H.J. and Sheridan, L., 2002, Building Regulations in Europe, part I: A Comparison of systems of building control in eight European countries, Housing and Urban Policy Studies 23, Delft, Delft University Press. Meijer, F.M. and Visscher, H.J., 2006, ‘Deregulation and privatisation of European building-control systems’, Environment and Planning B: Planning and Design, Volume 33 (4), pp. 491-501. Meijer F.M. and Visscher H.J., 2008, ‘Building regulations from an European perspective’, in Proceedings of COBRA 2008 - The construction and building research conference of the Royal Institution of Chartered Surveyors, RICS, London. Majcen, D., Itard, I. and Visscher, H.J. 2013a, Theoretical vs. actual energy consumption of labelled dwellings in the Netherlands: Discrepancies and policy implications, Energy Policy 54, 125 – 136. Majcen, D., Itard, L., Visscher, H.J. 2013b, Actual and theoretical gas consumption in Dutch dwellings: What causes the differences? Energy Policy, 61, 460-471. Majcen, D., Itard, L., Visscher, H.J. 2015, Statistical model of the heating prediction gap in Dutch dwellings: Relative importance of building, household and behavioural characteristics, Energy and Buildings, 105, 43-59. Nieman 2007, Final report Housing quality indoor environment in new built dwellings, Vrom inspectie Regio Oost, Arnhem. WoON Energie, 2009, Woononderzoek Nederland, module energie, VROM.
426

A THERMAL PERFORMANCE COMPARISON OF SIX WALL CONSTRUCTION METHODS FREQUENTLY USED IN SOUTH AFRICA
Neels VAN ROOYEN 1
Piet VOSLOO 2 1 Department of Architecture / University of Pretoria, Email: [email protected] 2 Department of Architecture / University of Pretoria, Email: [email protected] Keywords: energy usage, thermal comfort, thermal performance, wall construction type
Abstract
In this paper, we assess the thermal performance of six conventional wall types most frequently used in South Africa. The impact of the energy efficiency of walling can be modelled in terms of heating and cooling energies required to maintain the human environmental comfort condition. The main impact of the walling component of buildings during their operational phase is the efficacy with which they moderate the external environment and provide thermal comfort to building occupants. If thermal comfort is provided with a minimum of heating and cooling, the walling system can be considered to be more energy efficient. The energy usage for heating and cooling for various relevant walling systems in use are compared using suitable, internationally accepted and Agrément South Africa approved thermal modelling software. Three different building typologies are analysed; two residential; a standard 40m² house which is typical of subsidised housing in South Africa, a 130 m² house design based on an earlier CSIR study and a small office development of approximately 2000 m², which is intended to represent a wider range of commercial and institutional places of work. Each wall construction type is simulated within each of the six climatic zones in South Africa and each of the three typologies. The results of this modelling indicate that solid clay brick masonry walling is the most thermally and energy efficient walling system considered for day-time or non-residential occupancy buildings. The clay brick masonry cavity walls are the most thermally and energy efficient walling system considered for all day or residential occupancy buildings. A clay brick masonry cavity wall is a suitable choice for universal application in the South African regulatory built environment (SANS 10400 Part XA) as a first step towards more efficient wall construction in South Africa, particularly as a replacement for the 140 mm hollow concrete block which is found to be universally the worst performer of the wall construction methods that were examined. The low-mass light steel frame and timber frame wall construction methods are not as thermally or energy efficient as clay brick masonry walling methods and the SANS 517 and 10082 standards should be amended to reflect the required increase in effective thermal insulation via reduced heat bridging, and/or greater thicknesses of thermal insulation.
1. Introduction
A Life Cycle Assessment (LCA) of clay bricks in South Africa was conducted by the Department of Architecture at the University of Pretoria (UP) for the Clay Brick Association of South Africa (CBA). The LCA reviewed all environmental impacts associated with the production and use of clay bricks and brick structures from mining of the raw materials through all life cycle stages to the recycling and/or disposal of brick masonry in land-fill – “cradle to cradle” (Vosloo et al., 2015) The need for a thermal performance study arose from the need in the LCA methodology to determine the environmental impacts that stem from the operational lifespan of clay brick structures. This study addresses the calculation of the energy usage anticipated for clay brick buildings in South Africa during its operational phase. An important consideration is that the necessary detailed assumptions to be made in any such a modelling exercise are numerous; that these are often not fully disclosed and thus a comparison of performance against alternative building systems is made difficult and unreliable. As a consequence of this difficulty the thermal performance of walling materials in South Africa was not thoroughly and objectively differentiated until the publication of the CR-Method and the publication of SANS 204:2011 that deals with energy efficiency in buildings. It is expected that this Thermal Performance Study (TPS) will add to a better understanding of walling energy efficiency, particularly in relation to the contributions of thermal mass (capacity) and thermal resistance. The CBA has therefore requested that an exemplary model be developed that can be used by others, and to conduct a comparative study to investigate the thermal performance of clay brick walls as installed in buildings in South Africa and compared with the thermal performance of alternative wall construction methods typically used in South Africa.
427

1.1 Aim of this study
It is envisaged that the data gathered in this TPS will inform the LCA on the energy requirements of clay brick walls during its operational life, and assist in the development of National Standards for energy usage and energy efficiency in buildings.
2. Methodology
2.1 Rationale for an appropriate TPS methodology
The operational energy usage in buildings attributable to the walling of such buildings is the sum of all heating, cooling and ventilation energies accumulated over the four seasons in a year. These energies can be estimated by a simulation of heating, cooling and ventilation energy requirements as indicated in an energy model developed with suitable energy modelling software and appropriate climate data file (Holm, 2011). The climate files capture some of the variations which are possible in a particular year in terms of variability of seasonal climates, yet build in the averages of climatic parameters recorded in the longer term. The comparison between the various walling systems is conducted through thermal modelling using appropriate thermal modelling software. The selection of the correct software tool for the building energy modelling is an important part of this project, as is the development of assumptions appropriate for on-going comparative work.
2.2 Operational environmental impacts of walling
The main environmental impact of the walling component of buildings during their operational phase depends on the efficacy with which they moderate the external environment and provide thermal comfort to building users. If thermal comfort is provided with a minimum of heating and cooling, the walling system can be considered to be energy efficient (Holm & Engelbrecht, 2004).
2.3 Software selection
The accuracy, in absolute terms, of the estimation of heating and cooling energy usage is a pre-requisite for the choice of appropriate software. Hence the physics employed by the various software offerings have been scrutinised by Johannsen through a review of the calculation methods utilized when simulating unsteady-state heat transfer through walling systems in computer based software (2012). This was performed in a separately commissioned study of the different heat transfer functions applied in calculating the energy flows through the walling of three building energy modelling software offerings. This analysis has informed the decisions regarding the choice of most appropriate software to be used to compare the thermal performance of the various selected walling systems (Johannsen, 2012).
2.4 Generating a typical energy usage for walling in South Africa
Three different building typologies are analysed. A standard 40 m² residential building which is typical of subsidised housing in South Africa. A 130 m² residential building based on an earlier unpublished CSIR study and as published in the Green Buildings Handbook Volume 1 (published periodically by Alive-to-Green). An office building of approximately 2000 m², which is intended to represent a wide range of commercial and institutional places of work. All of these typologies have been used as notional buildings for earlier South African energy modelling research for the Department of Mineral and Energy Affairs, with minor alterations. The floor plans, elevations and specifications of these three buildings are set out in Appendix A. In this study, three different clay brick wall construction methods are compared to three alternative wall construction materials. The walling materials which were compared are listed below and are detailed in Appendices B, C and D. The walling systems compared in this analysis are:
Double clay brick solid wall (nominally 220 mm thick) Double clay brick cavity wall - un-insulated (nominally 270 mm thick) Insulated double clay brick wall (nominally 280 mm thick) 140mm hollow core concrete block (150 mm thick with a single external layer of plaster) Light steel frame, insulated and cladded with fibre board to SANS 517 (nominally 145 mm thick) Timber frame, insulated and cladded with fibre cement board (nominally 145 mm thick)
Each of these construction methods were analysed for each of the three building typologies, and across the six different climatic zones in South Africa, in terms of SANS 10400 Part XA: Energy Usage in buildings, (Figure 1)
428

Figure 1 Climate zones of South Africa in terms of SANS 10400 Part XA
2.5 Isolation of walling impacts
All aspects which might affect heating or cooling, other than the walling of each design, are held constant at levels, which are considered to not detract from the walling performance. The comparative references are made only to the building walling systems and the operational aspects studied are confined to the building heating, cooling and ventilation energy consumption response to the climatic variation. As the focus of this research is on the performance of walling systems, the type of exterior walling construction and the corresponding internal walling are the only variables. The floor, roof, windows, fenestration type, doors, and occupancy patterns of all permutations are kept constant to yield comparable results.
3. STANDARDISATION OF MODELLING
3.1 Review of suitable building physics in modelling software
Thermal performance modelling methodology requires that the different walling systems and their effect on the calculation of annual energy requirements of the residential & non-residential buildings should be taken into account by the selected modelling software. One of the key requirements for energy modelling software is to accurately simulate the unsteady-state heat transfer through the walling systems under varying external conditions. The so-called unsteady state applies as a consequence of the hourly changes in diurnal temperature, radiation and wind speed in combination with the variations in internal temperature, in part as a consequence of outside air temperature, internal loads and ventilation rates, but also as a consequence of the degree of delay in heat transfer as the heat diffuses into and through the walling systems. Traditional analyses of heat flows were assumed to occur under conditions of steady state where a constant temperature profile exists across the walling system, which is a condition that is not frequently achieved in high mass walling due to the high thermal capacity and attendant low thermal diffusivity. This Thermal Performance Study has considered the fundamental equations governing heat conduction through walls and different methods of solving these equations for multi-layer walling systems. The suitability of these methods for simulating annual energy performance of buildings was reviewed independently by Johannsen (2012) in a separate report.
429

3.2 Building energy modelling software selection
The software packages considered for selection for this TPS are confined to programmes which implement appropriate heat transfer functions and which meet other recommended international norms. International software validation norms and procedures for evaluating software offerings are contained in ASHRAE Standard 140 and the ‘Bestest’ system which are also observed in the software selection. Software packages that have been certified by Agrément South Africa, in terms of the protocol for accrediting energy modelling software, will also satisfy the ASHRAE and Bestest requirements. The two programmes which were approved by Agrément SA at the time of writing, and which have been confirmed as implementing the Conduction Transfer Function (CTF) method as well as the use of the State Space method, are Design Builder Version 3.1 and BSIMAC Version 9. Design-Builder Version 3.1 was selected for the TPS (Johannsen, 2012).
3.3 Input standardisation
3.3.1 Climate data files The climate data files selected are those in use in South Africa for building energy usage assessments and rational designs in terms of SANS 10400 Part XA and are as provided for use in Agrément SA approved software. All six climate zones in SANS 10400 Part XA are individually analysed. As the climate data files are in general use, the modelling results could be reproducible and comparable with other similar work. The nature of the climate data files is such that the dry bulb and wet bulb temperatures, radiation levels, wind speeds over all 8760 hours of a typical year are simulated, even to the extent of reproducing the effects of the passage of frontal systems over the African sub-continent and the variability of the weather in the region.
3.3.2 Modelling stipulations
3.3.2.1 Measurement The gross floor area (GFA) is to be treated as a single zone, and the gross floor area (external dimensions and including internal walling areas) are to be held constant for each typology. By holding the GFA constant, the effect of wall thickness variations causes the net floor area (NFA) to vary slightly; however, the heat losses and gains then take place over constant and hence comparable external walling areas. The influence on NFA is most acute for the smaller building designs, but this does not invalidate the comparison and could be adjusted for. The differences between energy usages with NFA held constant versus GFA being held constant are of the order 1-2% and are therefore not considered material.
3.3.2.2 Metrics The Annual Energy Intensity and Average Demand Intensity are the reporting metrics of SANS 204 and SANS 10400 Part XA; these express energy usage per square metre of usable internal area. The Annual Energy Intensity in this report is presented as the Annual Energy Intensity per square metre of external walling area for the building typology. This is in line with the overall objective of arriving at the typical operating energy attributable to the walling of each building model.
3.3.2.3 Air infiltration The air infiltration rate is assumed to be 0.57 AC/h (air-changes per hour) to be aligned with an unpublished CSIR research project for residential buildings and the 7.5 litre per second per person as per SANS 10400 Part O requirement for offices.
3.3.2.4 Occupancy hours The buildings are occupied in accordance with Tables 4, 5 and 6 of SANS 10400 Part XA; these occupancy hours are:
24 hours per day for a seven day week for residential buildings 12 hours per day for a five day week for office and institutional buildings
3.3.2.5 Occupancy density Occupancy density is taken as two persons per bedroom or 15m² per person for working spaces at 75W per person.
3.3.2.6 Lighting energy Lighting is assumed at a level corresponding with the requirements of SANS 10400 Part XA & SANS 204, i.e. 5 W/m² for residential buildings and 15 W/m² for commercial and institutional buildings during occupancy hours, and thus will reduce heating energy usage in winter, and increase cooling requirements in summer.
3.3.2.7 Occupant operational energy usage The occupant driven energy impacts of non-fixed appliances are allowed for as per occupancy stipulations of SANS 10400 Part XA and are assumed to be a constant 5 W/m² for residential occupancies and 15W/m² for non-residential buildings. This stipulation is to compute an influence of the overall daily plug-load, appliance
430

usage and cooking energy which is to be voided via cooling systems or otherwise contributing to reducing the heating requirements of the internal environment. The impact is not modelled on a usage schedule.
3.3.2.8 Set points for heating and cooling The set points selected for heating and cooling are 19 – 25 °C as per SANS 10400 Part XA. Heating and cooling are assumed to take place at all times when called for, if the building is operating outside of a dead-band of +/- 2.0 K about 22 °C. An increase in Relative Humidity (RH) has an effect on human discomfort at elevated air temperatures. Climate zones at low altitude and in proximity to the coastline show high RH values. Thermal Neutrality can account for RH by adopting a TnET (Effective Temperature) rather than TnDBT (Dry Bulb Temperature). Much of the hot regions of Southern Africa experience heat in combination with low RH and this is well known to ameliorate the effects of elevated temperature.
3.3.2.9 Thermal resistances calculation conventions The conventions applied to the selection of appropriate thermal conductivities of the building envelopes are the coefficients as per CSIR and NBRI publication X-Bou 2.1 are to be used preferentially and thereafter the software data bases as supplied with the software are used.
3.3.2.10 Internal wall selection Internal walling is an essential part of all designs. In general in practice the use of lightweight internal walling partitioning systems are used with like external walling systems, and masonry partitions are used for structures with external masonry walling. The tendency may be towards light-weight partitioning for rented office construction as a result of the flexibility in catering for tenant fit-out. The thermal performance of high mass external walling systems is greatly enhanced by the use of internal masonry walling. Lightweight partitioning walling adds little to the thermal performance of buildings built with these systems, as is evident from the sub-study described below. It has been determined via a sensitivity study within this energy modelling project that the extent of potential energy savings in the RSA by way of using masonry partitioning over light-weight partitioning across the three typologies and building sizes used in this study, and across an equal number of warm and cool climate zones, could lead to a reduction in energy usage of on average 25%. The range of extra energy usage for light-weight structures over masonry varies from a maximum deterioration of 52.4% for mild to warm climate zone 5 for the 120m² home to the smaller 3.8% premium for office buildings in hot climate zone 6. In general the premium of energy usage as a consequence of using light-weight partitioning is between 20 and 30% over the masonry solutions.
3.3.2.12 Window design and optimisation thereof The thermal capacity of high mass elements and the optimisation of north facing window sizes can, if used in conjunction with one another, give rise to an improvement in relative performance of pure masonry solutions. However, in order to preserve a comparison of walling which excludes other influences, the window sizes are not varied in this study. The convention applied is to use a window size as determined by SANS 10400 Part O for ventilation and lighting, i.e. not less than 10% of the net floor area of rooms which are served to be glazed. By placing the living room and bedrooms on the north elevation there is a larger area of fenestration on the north side.
3.4 Building typologies
3.4.1 Blending of walling in different typologies
Data sources provided by Milford (Holm, 2011) indicate that the current stock of South African buildings (expressed in m² built) consists of the following mix of building typologies:
±40 m² low income residential: 7% ±130 m² middle income residential: 43% ±2000 m² non-residential (daytime occupancy): 50%
The operational energy and environmental impacts of the operation phases of the three building typologies are blended in this ratio in order to determine the environmental impact of an average wall on an average built square metre of building structure.
3.4.2 Materials selected
Material selection for the three designs and six walling systems are detailed on the plans for each building and are summarised as follows:
3.4.2.1 All roofs The modelled roof construction consists of 30 mm concrete tiles with a 38 mm air space created by the battens, a 0.2 mm polyolefin tile underlay, a ceiling airspace of between 0 and 608 mm and with 140 mm fibreglass insulation on a 6.4 mm gypsum ceiling board.
431

3.4.2.2 All floors A 25 mm screed on a 75 mm concrete surface bed on compacted soil fill.
3.4.2.3 All windows Windows are constructed from 4 mm clear glass in aluminium frame casement windows without thermal breaks.
3.4.2.4 External wall Type 1 Nominal 220mm solid clay brick masonry consisting of two 106 mm skins plastered both sides with 15 mm of mortar.
3.4.2.5 External wall Type 2 Nominal 270 mm clay brick cavity masonry wall as above but with 50 mm air-cavity in mid-wall.
3.4.2.6 External wall Type 3 Nominal 280 mm clay brick cavity wall with cavity insulation of R=1.0, as for Type 2 above but with insulation of 30mm extruded polystyrene/ 40 mm of expanded polystyrene.
3.4.2.7 External wall Type 4 Nominal 140 mm hollow concrete block wall plastered and painted externally and bagged internally.
3.4.2.8 External wall Type 5 Light steel frame wall structure in accordance with SANS 517 with 75 mm fibreglass insulation, externally cladded with 9 mm fibre cement, a 0.2 mm polymer vapour membrane, a 20 mm Orientated Strand Board, with 0.8 mm steel studs intruding through the insulation, and cladded internally with 15 mm gypsum board, in climate zones 2, 3, 4 and 5 with attendant heat bridging allowances. As above, with 100 mm glass wool insulation batts in combination 0.8 mm steel studs with heat bridging for climate zones 1 and 6, with attendant heat bridging allowances.
3.4.2.9 External wall Type 6 Timber Frame construction in accordance with SANS 10 082.The thermal insulation thickness is as for External Wall Type 5 above, with external ship-lapped timber or weather-board fixed to 20mm Oriented Strand Board and internal cladding of 15mm gypsum plasterboard, with attendant heat bridging allowances.
3.4.2.10 Internal wall Type 1 High density 110 mm clay brick single skin wall covered both sides with 15 mm plaster for wall types 1 to 3 and bagged for the 110 mm hollow concrete block in the case of wall type 4.
3.4.2.11 Internal wall Type 2 15 mm gypsum board fixed to 76/102 mm steel studs with 75/100 mm fibre sound insulation.
4. Modelling results
4.1 Graphical presentation of modelling results
The results of the energy modelling of the gross annual energy usage for each of three types of building are presented in graphical format below. The analysis of these results follows thereafter.
432

Figure 2 Comparative annual heating and cooling energy usage in kWh per square metre of walling for a
40 m² house for six walling systems over six climate zones of the RSA
Figure 3 Comparative annual heating and cooling energy usage in kWh per square metre of walling for a
130 m² house for six walling systems over six climate zones of the RSA
0.00
10.00
20.00
30.00
40.00
50.00
60.00
70.00
22
0m
m
So
lid
Z
on
e 1
27
0m
m C
avit
y
Zo
ne
12
70
mm
Cav
ity
Ins
Zo
ne
11
40
mm
Ho
llow
Co
nc
Zo
ne
1Li
ght
Stee
l Fra
me
Z
on
e 1
Tim
ber
Fra
me
Z
on
e 1
22
0m
m
So
lid
Z
on
e 2
27
0m
m C
avit
y
Zo
ne
22
70
mm
Cav
ity
Ins
Zo
ne
21
40
mm
Ho
llow
Co
nc
Zo
ne
2Li
ght
Stee
l Fra
me
Z
on
e 1
Tim
ber
Fra
me
Z
on
e 2
22
0m
m
So
lid
Z
on
e 3
27
0m
m C
avit
y
Zo
ne
32
70
mm
Cav
ity
Ins
Zo
ne
31
40
mm
Ho
llow
Co
nc
Zo
ne
3Li
ght
Stee
l Fra
me
Zon
e 3
Tim
ber
Fra
me
Zo
ne
3
22
0m
m
So
lid
Z
on
e 4
27
0m
m C
avit
y
Zo
ne
42
70
mm
Cav
ity
Ins
Zo
ne
41
40
mm
Ho
llow
Co
nc
Zo
ne
4Li
ght
Stee
l Fra
me
Zon
e 4
Tim
ber
Fra
me
Z
on
e 4
22
0m
m
So
lid
Z
on
e 5
27
0m
m C
avit
y
Zo
ne
52
70
mm
Cav
ity
Ins
Zo
ne
51
40
mm
Ho
llow
Co
nc
Zo
ne
5Li
ght
Stee
l Fra
me
Zo
ne
5Ti
mb
er F
ram
e
Zo
ne
5
22
0m
m
So
lid
Z
on
e 6
27
0m
m C
avit
y
Zo
ne
62
70
mm
Cav
ity
Ins
Zo
ne
61
40
mm
Ho
llow
Co
nc
Zo
ne
6Li
ght
Stee
l Fra
me
Zo
ne
6Ti
mb
er F
ram
e
Zo
ne
6
Cooling Heating
0.00
10.00
20.00
30.00
40.00
50.00
60.00
22
0m
m
So
lid
Z
on
e 1
27
0m
m C
avit
y
Zo
ne
12
70
mm
Cav
ity
Ins
Zo
ne
11
40
mm
Ho
llow
Co
nc
Zo
ne
1Li
ght
Stee
l Fra
me
Z
on
e 1
Tim
ber
Fra
me
Z
on
e 1
22
0m
m
So
lid
Z
on
e 2
27
0m
m C
avit
y
Zo
ne
22
70
mm
Cav
ity
Ins
Zo
ne
21
40
mm
Ho
llow
Co
nc
Zo
ne
2Li
ght
Stee
l Fra
me
Z
on
e 1
Tim
ber
Fra
me
Z
on
e 2
22
0m
m
So
lid
Z
on
e 3
27
0m
m C
avit
y
Zo
ne
32
70
mm
Cav
ity
Ins
Zo
ne
31
40
mm
Ho
llow
Co
nc
Zo
ne
3Li
ght
Stee
l Fra
me
Zon
e 3
Tim
ber
Fra
me
Zo
ne
3
22
0m
m
So
lid
Z
on
e 4
27
0m
m C
avit
y
Zo
ne
42
70
mm
Cav
ity
Ins
Zo
ne
41
40
mm
Ho
llow
Co
nc
Zo
ne
4Li
ght
Stee
l Fra
me
Zon
e 4
Tim
ber
Fra
me
Z
on
e 4
22
0m
m
So
lid
Z
on
e 5
27
0m
m C
avit
y
Zo
ne
52
70
mm
Cav
ity
Ins
Zo
ne
51
40
mm
Ho
llow
Co
nc
Zo
ne
5Li
ght
Stee
l Fra
me
Zo
ne
5Ti
mb
er F
ram
e
Zo
ne
5
22
0m
m
So
lid
Z
on
e 6
27
0m
m C
avit
y
Zo
ne
62
70
mm
Cav
ity
Ins
Zo
ne
61
40
mm
Ho
llow
Co
nc
Zo
ne
6Li
ght
Stee
l Fra
me
Zo
ne
6Ti
mb
er F
ram
e
Zo
ne
6
Cooling Heating
433

Figure 4 Comparative annual heating and cooling energy usage in kWh per square metre of walling for a
2000m² office or institutional building for six walling systems over six climate zones of the RSA
4.2 Analysis of the results
The results show the variation of heating and cooling energy modelled for the three building typologies, with six walling construction methods compared in each of the six climate zones of South Africa as set out in SANS 10400 Part XA. The results can be summarised as follows: 4.2.1 For the two residential typologies and across all climatic zones, the lowest energy usage per square metre of walling is the thermally insulated 280 mm clay brick cavity walling solution. 4.2.2 For the non-residential building and in all climate zones except climate zone 1 (but only marginally so), the lowest energy usage per square metre of walling is the 220 mm solid clay brick wall. 4.2.3 In all cases the highest energy usage per square metre of walling for residential buildings is the hollow concrete block wall. 4.2.4 The highest energy usage per square metre of walling of the non-residential typology for all climate zones is either mostly the light steel frame walling method or alternatively in one case the timber frame wall. 4.2.5 For the residential walling the trend within the masonry walling is evident and indicates those masonry walls with increasing thermal resistance have increasingly lower energy usage.
4.3 Discussion of the results
Although the three clay brick masonry walling solutions offer the lowest energy usage for all building typologies, clearly the patterns of energy usage are very different for the two 24 hour occupancy residential typologies (Figure 2 & 3) as opposed to the 12 hour daytime occupancy of the office/institutional typology (Figure 4). For the non-residential typology the 220 mm solid clay brick masonry wall system shows the lowest energy usage in five climate zones and hence can be considered to be the most suitable for this typology, provided the occupancy type remains the same throughout the building's life cycle (Figure 4). The energy generated through the occupants The dominance of cooling requirements in South African non-residential buildings is evident in Figure 4 and is interesting, because the modelling assumptions do not account for the lighting and other occupancy loads in these buildings. There should be consensus over the proposal that South African non-residential buildings should employ opportunities to dissipate daytime gained heat and to effect night-time cooling of the structure (including the walls) for the greatest energy efficiency. The pre-eminence of the 220 mm solid clay brick masonry wall for lowest energy usage in this building typology is evidence for such a proposal. For the two residential typologies (Figures 2 & 3) the walling systems with lowest energy usage and hence greatest thermal comfort are consistently the 280 mm insulated clay brick cavity wall. In the residential category the trend of lower energy usage favours the masonry solutions with greatest thermal resistance. This is in line with increasing CR-value as per the SANS 204 methodology, which is simply the product of thermal capacity and thermal resistance. The evidence of the value of thermal insulation in the cavity of a 280 mm clay brick masonry wall for residential buildings begs the question as to whether this type of wall should be the deemed-to-satisfy solution, and that non-masonry solutions should have a higher effective thermal resistance, an attribute which might be required in subsequent revisions of SANS 10400 Part XA, SANS 517 and SANS 10082.
0.00
50.00
100.00
150.00
200.00
250.00
300.00
22
0m
m
So
lid
Z
on
e 1
27
0m
m C
avit
y
Zo
ne
12
80
mm
Cav
ity
Ins
Zo
ne
11
40
mm
Ho
llow
Co
nc…
Ligh
t St
eel F
ram
e…
Tim
ber
Fra
me
Z
on
e 1
22
0m
m
So
lid
Z
on
e 2
27
0m
m C
avit
y
Zo
ne
22
80
mm
Cav
ity
Ins
Zo
ne
21
40
mm
Ho
llow
Co
nc…
Ligh
t St
eel F
ram
e…
Tim
ber
Fra
me
Z
on
e 2
22
0m
m
So
lid…
27
0m
m C
avit
y
Zo
ne
32
80
mm
Cav
ity
Ins
Zo
ne
31
40
mm
Ho
llow
Co
nc…
Ligh
t St
eel F
ram
e…
Tim
ber
Fra
me…
22
0m
m
So
lid…
27
0m
m C
avit
y
Zo
ne
42
80
mm
Cav
ity
Ins
Zo
ne
41
40
mm
Ho
llow
Co
nc…
Ligh
t St
eel F
ram
e…
Tim
ber
Fra
me
Z
on
e 4
22
0m
m
So
lid…
27
0m
m C
avit
y
Zo
ne
52
80
mm
Cav
ity
Ins
Zo
ne
51
40
mm
Ho
llow
Co
nc…
Ligh
t St
eel F
ram
e…
Tim
ber
Fra
me
Z
on
e 5
22
0m
m
So
lid
Z
on
e 6
27
0m
m C
avit
y
Zo
ne
62
80
mm
Cav
ity
Ins
Zo
ne
61
40
mm
Ho
llow
Co
nc…
Ligh
t St
eel F
ram
e Z
on
e 6
Tim
ber
Fra
me
Z
on
e 6
Cooling Heating
434

5. Conclusions
The important conclusions to be reached in this paper relate primarily to the environmental impacts which will result from the energy usage of the various walling construction methods used in the South African building stock in the foreseeable future. The modelling of the six building typologies informs the actual energy usage required to maintain thermal comfort in such buildings and by extension the environmental performance during the operating phase of the life of these buildings as might be extrapolated into the future. Based in the evidence presented in this study, architects, private and public sector walling specification developers can make informed decisions as to what future walling specifications should be used, with indications of the positive impact on the environmental performance of buildings. The evidence presented points to a wisdom in continuing to build day-time occupancy buildings with clay brick masonry and other high mass solutions in view of the predominantly cooling requirement. The evidence also points to necessary changes in the South African regulatory built environment requirements which would necessitate the use of higher levels of thermal resistance in residential construction, including both masonry and non-masonry solutions. The results across all South African climatic zones consistently demonstrate the following comparative thermal performance: 5.1 That the most efficient South African walling system for residential buildings is a 270 mm insulated cavity clay brick masonry wall. 5.2 That the most efficient South African walling system for a commercial or institutional building is a 220 mm solid clay brick masonry wall (or for Climate Zone 4: a 270 mm clay brick cavity wall, as is the norm for the Southern Cape condensation problem areas) 5.3 That for residential typologies clay brick masonry wall constructions increase in performance as their thermal resistance increases with insulation added into a cavity wall. It may point to the interim proposal, and as a low cost intervention, that for residential construction in all climate zones of South Africa, all masonry walling should be built with a cavity construction. This has the additional advantage of improved moisture resistance. 5.4 That light steel frame wall construction and timber frame walls (as presently specified in SANS 517) are not as thermally efficient and, as demonstrated, do use more heating and cooling energy compared to clay brick masonry cavity walls in all climate regions, and will need to relook the thermal resistance requirements and heat bridging requirements of SANS 517 and SANS 10082 if they are to contribute to reducing energy usage in the built environment in South Africa. 5.5 That the 140mm hollow concrete block wall is significantly the worst thermal performing or energy using wall, and will need to be re-evaluated in the regulatory environment. This raises the question that the 140 mm hollow concrete block wall requires to be investigated for the social impacts of providing a low quality walling system for subsidised low income housing, and further promoting energy poverty by permanently burdening the poor with excessive heating costs and discomfort during the hot season. 5.6 That there is a significant energy cost premium associated with the use of light-weight partitioning systems in all three building typologies modelled.
6. Acknowledgement
We would like to thank Mr Howard Harris and Prof Dieter Holm for their valuable contributions, expertise and knowledge about thermal performance in buildings.
7. References
ASHRAE Handbook Fundamentals. 2009. Zone Method, Ch27.5. Energetics Pty Ltd. 2010. LCA of Brick Products. Life Cycle Assessment Report. Prepared for ThinkBrick Australia. Brisbane: Energetics. Harris, H.C., Van Rooyen, CJ. 2013. A parametric study of the thermal response of three software programmes to various walling products. Unpublished report prepared for the Clay Brick Association of South Africa. Holm. D., Murray, H.M., Pauw, C.J. & Van Niekerk, A.S. 2004. Project to fast track the implementation of energy efficiency standards in South African housing for improved comfort, health and reduced carbon emission. Pretoria: NRF THRIP Project ID 2689. Holm, D. & Engelbrecht, F. 2004. Practical choice of thermal comfort scale and range in naturally ventilated buildings in South Africa. Journal of the SA Inst of Civil Eng. Vol 47 (2): 10-14 Holm, D. 2011. Green buildings – A possible Regulatory Scenario. Pretoria: Unpublished report prepared for the CIDB. Johannsen, A. 2012. A review of computer-based calculation methods for simulating unsteady-state heat transfer through walling systems. Unpublished report for the Clay Brick Association of South Africa
435

Milford, R. 2007. Greenhouse Gas Emissions Baselines and Reduction Potentials from Buildings in South Africa. Paris: United Nations Environment Programme. National Building Research Institute, CSIR. 1981. Guidelines K61 for factory building design. NBRI (Formerly a division of the CSIR, 1971. Technical Note Series leaflet X-Bou 2.1, October 1971. Rice, G.A. 2012. An investigation into South African clay brick manufacturing processes to identify aspects that may improve their sustainability. University of Pretoria: Honours RFP 700 research paper. Rice, G.A. 2012. LCA as a tool to promote sustainability in the Built Environment of South Africa. University of Pretoria: Honours RFS 700 research paper. Rice, G.A. 2014. A life cycle assessment of the “cradle to gate” Phases of clay brick production in South Africa. University of Pretoria: Dissertation submitted for Master of Applied Science: Architecture degree. CDM Executive Board. 2005. Simplified modalities and procedures for small-scale CDM project activities. Appendix A1 to the ref: http://cdm.unfccc.int/Reference/Documents/SSC_PDD/English/SCCPDD_en.doc Clean development mechanism simplified project design document for small scale project activities (SSC-PDD) Version 14a (28 February 2005). South African National Standards. 2006a. Environmental management Series:-Life cycle assessment-principles and framework. SANS 14040: 2006.Pretoria: Standards South Africa. South African National Standards. 2006b. Environmental management-Series: Life cycle assessment-requirements and guidelines. SANS 14044:2006. Pretoria: Standards South Africa Johannsen, A. 2012. A review of computer-based calculation methods for simulating unsteady-state heat transfer through walling systems. Unpublished report prepared for the Clay Brick Association of South Africa. South African National Standards (SANS). 2011 Edition 1. SANS 10400-XA:2011. Part X: Environmental Sustainability, Part XA: Energy Usage in Buildings. SABS Standards Division. United Nations Environmental Programme. 2007. Buildings can play a key role in combating climate change. Online available at http://www.unep.org/Documents. Multilingual/Default.Print.asp?DocumentID=502&ArticleID=5545&l=en (Accessed 14 November 2013). Vosloo, P.T., Harris, H.C., Holm, D., Van Rooyen, C.J. & Rice, G.A. 2015. A thermal performance comparison between six wall construction methods frequently used in South Africa: The Clay Brick Association of South Africa: Technical Report 7B. Prepared by the Department of Architecture, University of Pretoria. In press. WSP Green by Design. 2010. External Walling Types Assessment for a 130 m² Residence. Johannesburg: Unpublished report
Appendix A
A standardised 40m² residential building design
436

Appendix B
A standardised 130m² residential building design
Appendix C
A standardised 2000 m² office or institutional building design
437

438

439