Embed Size (px)
Citation preview
10/06/1436
1
University of Hail College of Engineering
ME 418 – Quality in ManufacturingISE 320 - Quality Control and Industrial Statistics
CHAPTER 05
PROCESS CAPABILITY ANALYSIS
Professor Mohamed Aichouni
Process Capability AnalysisProcess capability analysis is performed to answer the Process capability analysis is performed to answer the fundamental question: “Is our process capable to meet customer requirements or specifications?”Before this analysis can be done, we must ensure that the process is in a state of statistical control.Tolerances : Specifications Limits
design specifications reflecting product requirementsProcess capability
range of natural variability in a process what we measure with control charts.
10/06/1436
2
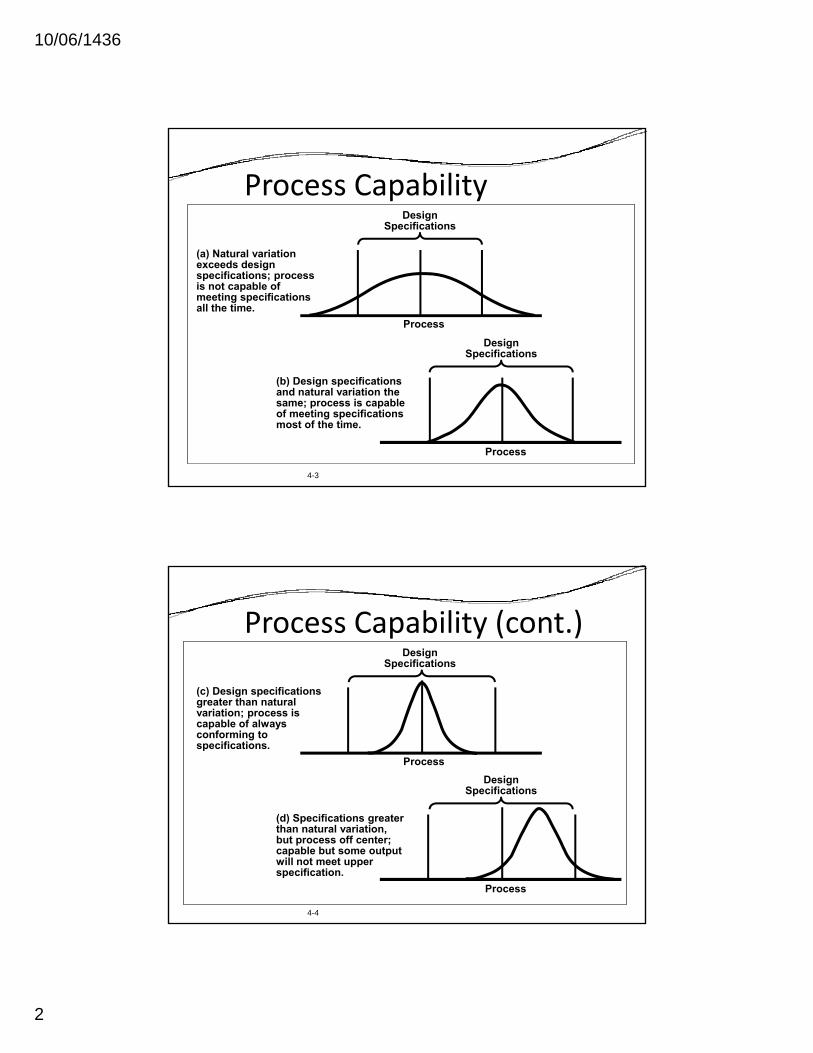
Process CapabilityDesign
Specifications
Design Specifications
(a) Natural variation exceeds design specifications; process is not capable of meeting specifications all the time.
Process
4-3
(b) Design specifications and natural variation the same; process is capable of meeting specifications most of the time.
Process
Process Capability (cont.)Design
Specifications
(c) Design specifications greater than natural variation; process is capable of always conforming to specifications.
ProcessDesign
Specifications
4-4
(d) Specifications greater than natural variation, but process off center; capable but some output will not meet upper specification.
Process
10/06/1436
3
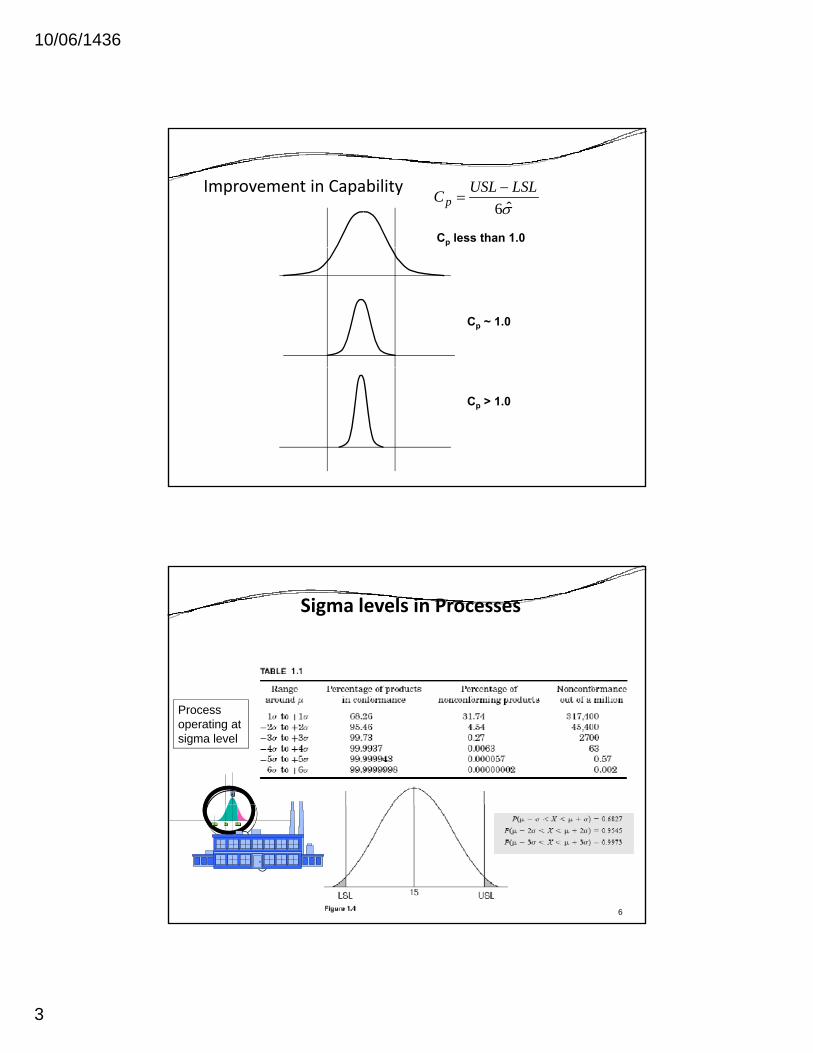
Improvement in Capability
Cp less than 1.0
σ̂6LSLUSLCp
−=
Cp ~ 1.0
Cp > 1.0
Sigma levels in Processes
μ
Process operating at sigma level
6
USLTLSL
10/06/1436
4
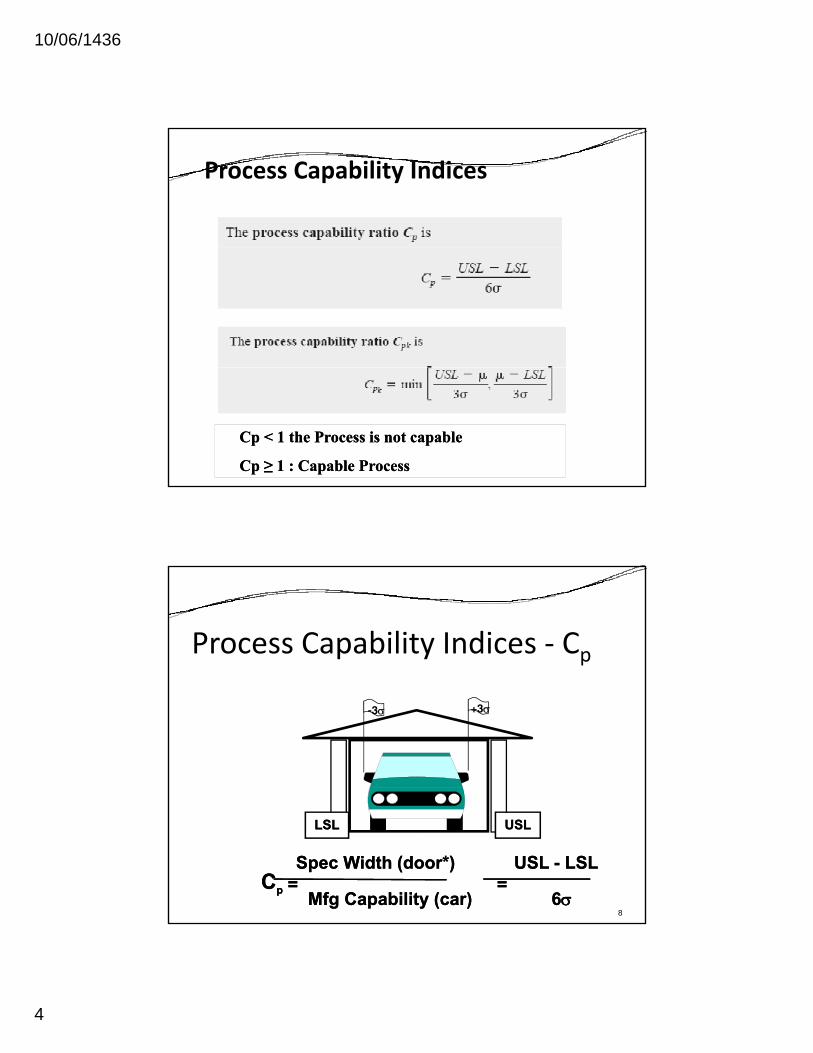
Process Capability Indices
Cp < Cp < 1 1 the Process is not capable the Process is not capable
Cp ≥ Cp ≥ 1 1 : Capable Process: Capable Process
Process Capability Indices ‐ Cp
+3σ-3σ
8
USLUSLLSLLSL
Spec Width (door*) USL Spec Width (door*) USL -- LSLLSLCCpp = =
Mfg Capability (car) Mfg Capability (car) = =
66σσ
10/06/1436
5
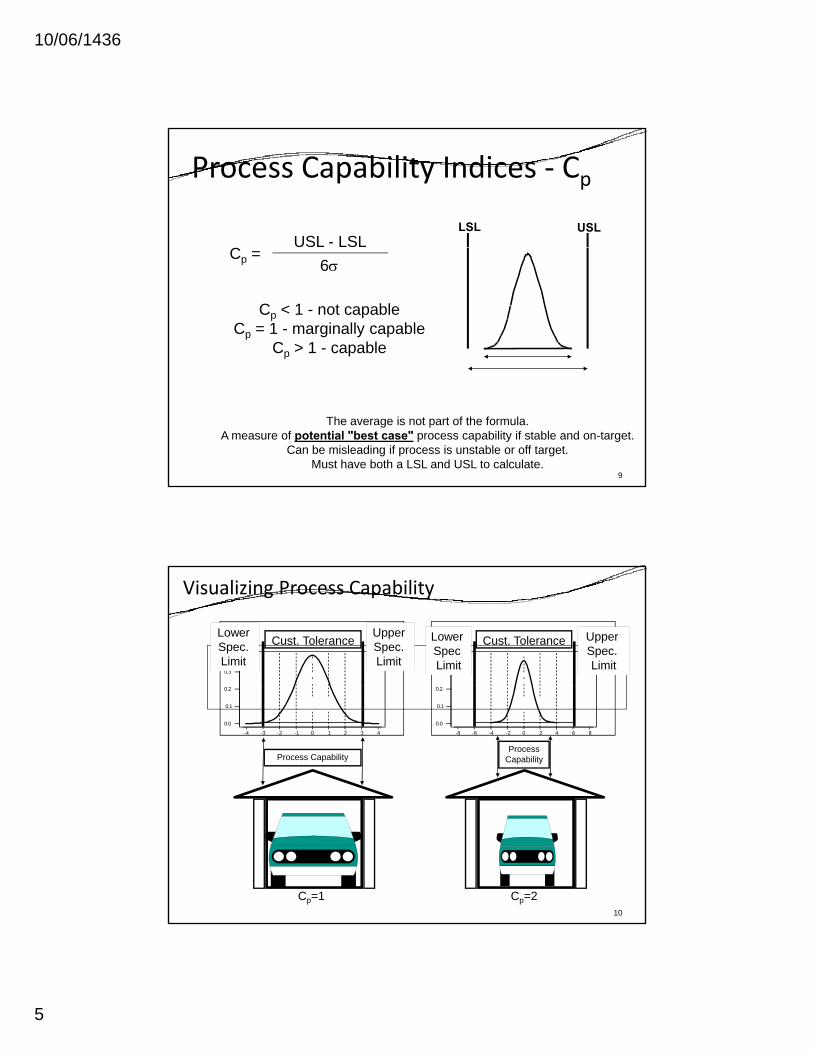
Process Capability Indices ‐ Cp
CUSL - LSL
LSL USL
Cp =6σ
Cp < 1 - not capableCp = 1 - marginally capable
Cp > 1 - capable
9
The average is not part of the formula.target.-process capability if stable and onpotential "best case"A measure of
Can be misleading if process is unstable or off target.Must have both a LSL and USL to calculate.
Visualizing Process Capability
0.4
0.3
Lower Spec. Limit
Upper Spec. Limit
Cust. Tolerance0.4
0.3
Lower SpecLimit
Upper Spec.Limit
Cust. Tolerance
43210-1-2-3-4
0.2
0.1
0.0
Process Capability
86420-2-4-6-8
0.2
0.1
0.0
Process Capability
10
Cp=1 Cp=2
10/06/1436
6
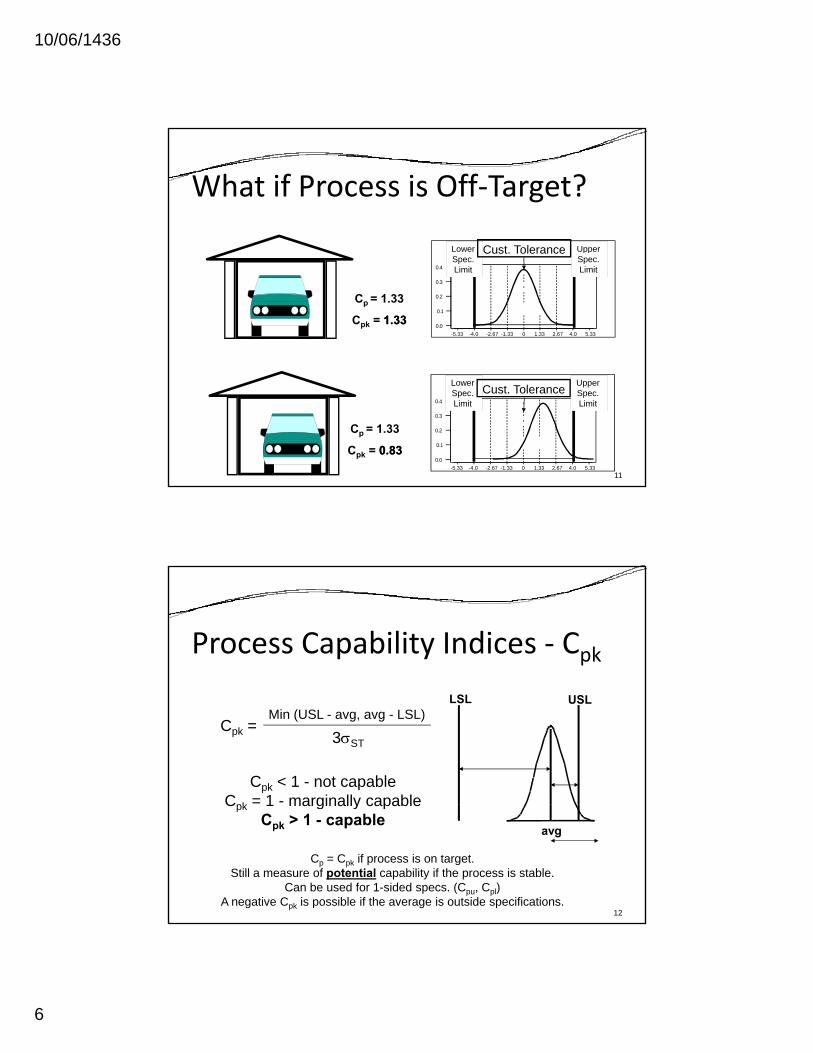
What if Process is Off‐Target?
Lower UpperCust Tolerance
Cp = 1.33
Cpk = 11..33335.334.02.671.33-1.33-2.67-4.0-5.33 0
0.4
0.3
0.2
0.1
0.0
Lower Spec. Limit
Upper Spec. Limit
Cust. Tolerance
110
0.4
0.3
0.2
0.1
0.05.334.02.671.33-1.33-2.67-4.0-5.33
Lower Spec. Limit
Upper Spec. Limit
Cust. Tolerance
Cp = 1.33
Cpk = 00..8383
Process Capability Indices ‐ Cpk
Cpk =Min (USL - avg, avg - LSL)
3σST
Cpk < 1 - not capableCpk = 1 - marginally capable
LSL USL
12
Cpk 1 marginally capableCpk > 1 - capable
Cp = Cpk if process is on target.capability if the process is stable.potentialStill a measure of
Can be used for 1-sided specs. (Cpu, Cpl)A negative Cpk is possible if the average is outside specifications.
avg
10/06/1436
7
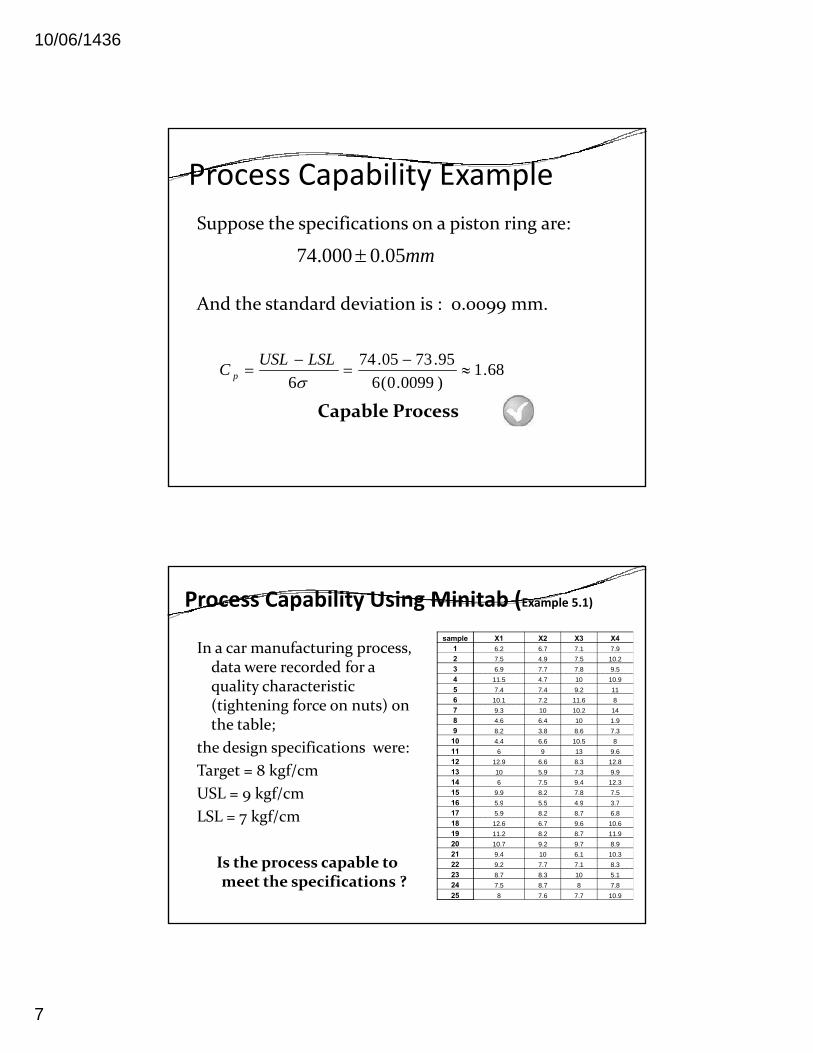
Process Capability ExampleSuppose the specifications on a piston ring are:
And the standard deviation is : 0.0099 mm.
mm05.0000.74 ±
68195.7305.74 −− LSLUSLC
Capable Process
68.1)0099.0(66
≈==σ
C p
Process Capability Using Minitab (Example 5.1)
In a car manufacturing process, data were recorded for a quality characteristic
sample X1 X2 X3 X41 6.2 6.7 7.1 7.92 7.5 4.9 7.5 10.23 6.9 7.7 7.8 9.54 11.5 4.7 10 10.9quality characteristic
(tightening force on nuts) on the table;
the design specifications were:Target = 8 kgf/cmUSL = 9 kgf/cm
5 7.4 7.4 9.2 116 10.1 7.2 11.6 87 9.3 10 10.2 148 4.6 6.4 10 1.99 8.2 3.8 8.6 7.3
10 4.4 6.6 10.5 811 6 9 13 9.612 12.9 6.6 8.3 12.813 10 5.9 7.3 9.914 6 7.5 9.4 12.315 9.9 8.2 7.8 7.516 5.9 5.5 4.9 3.7
LSL = 7 kgf/cm
Is the process capable to meet the specifications ?
16 5.9 5.5 4.9 3.717 5.9 8.2 8.7 6.818 12.6 6.7 9.6 10.619 11.2 8.2 8.7 11.920 10.7 9.2 9.7 8.921 9.4 10 6.1 10.322 9.2 7.7 7.1 8.323 8.7 8.3 10 5.124 7.5 8.7 8 7.825 8 7.6 7.7 10.9
10/06/1436
8
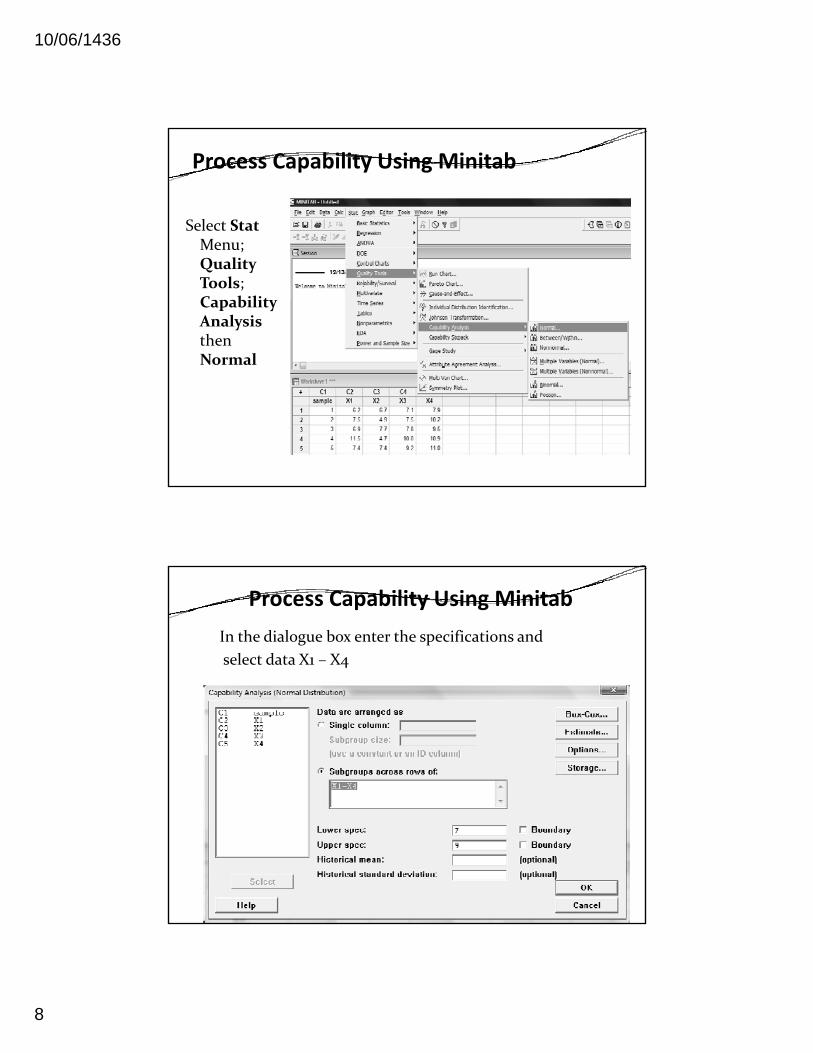
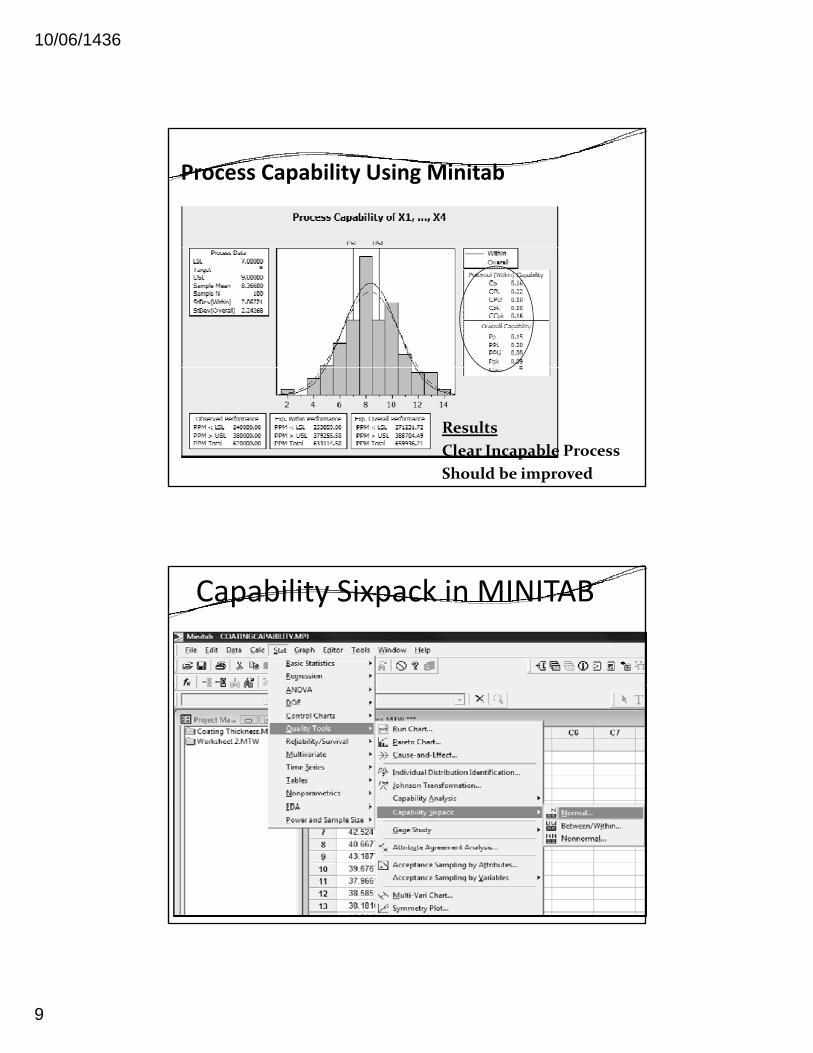
Process Capability Using Minitab
Select StatMenu; Menu; Quality Tools; Capability Analysis then Normal
Process Capability Using Minitab
In the dialogue box enter the specifications andselect data X1 – X4
10/06/1436
9
Process Capability Using Minitab
ResultsClear Incapable ProcessShould be improved
Capability Sixpack in MINITAB
18
10/06/1436
10
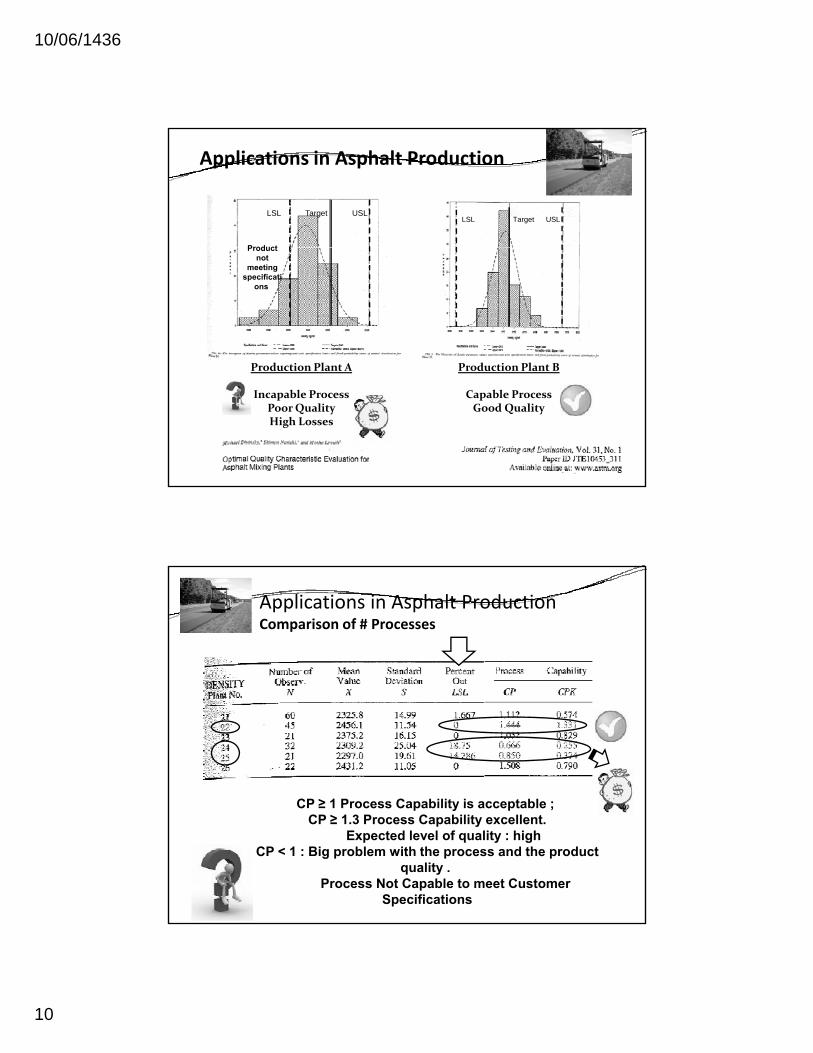
Applications in Asphalt Production
LSL Target USL
Product
LSL Target USL
Product not
meeting specificati
ons
Production Plant A Production Plant BProduction Plant A
Incapable ProcessPoor QualityHigh Losses
Production Plant B
Capable ProcessGood Quality
Applications in Asphalt ProductionComparison of # Processes
CP ≥ 1 Process Capability is acceptable ;CP ≥ 1 Process Capability is acceptable ; CP ≥ 1.3 Process Capability excellent.
Expected level of quality : highCP < 1 : Big problem with the process and the product
quality . Process Not Capable to meet Customer
Specifications
10/06/1436
11
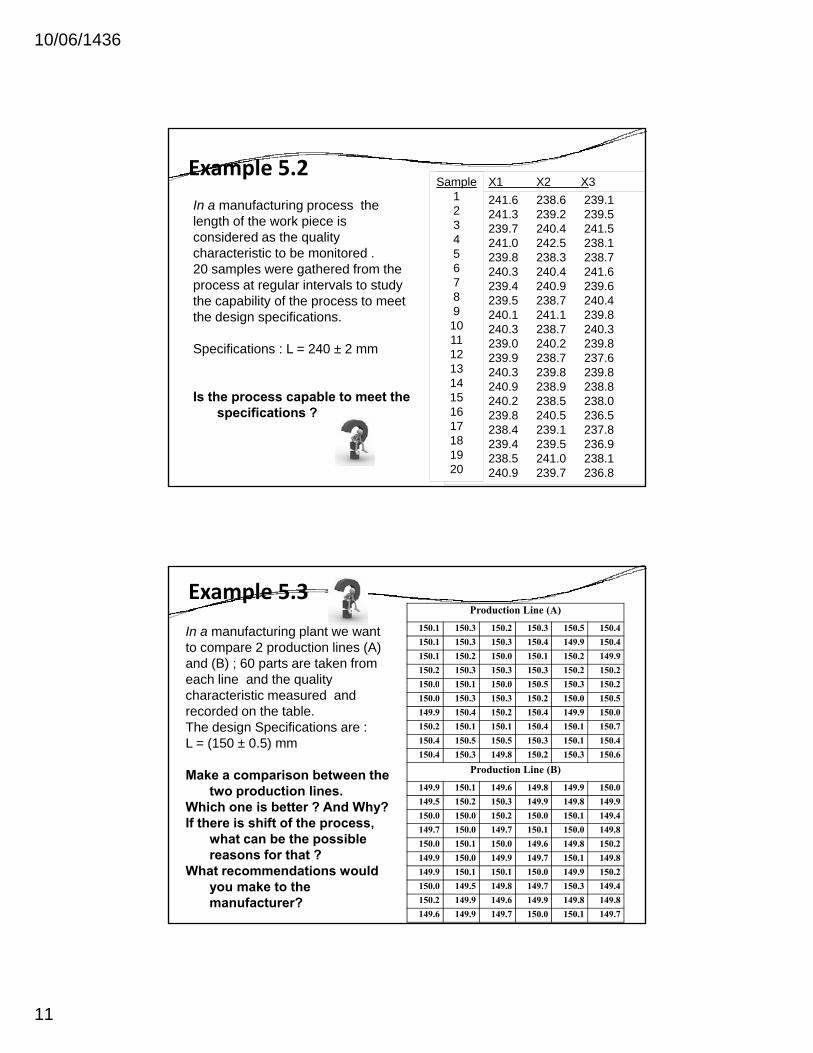
Example 5.2
In a manufacturing process the length of the work piece is considered as the quality
241.6 238.6 239.1241.3 239.2 239.5239.7 240.4 241.5241.0 242.5 238.1
3X2 X1 XSample1234
characteristic to be monitored .20 samples were gathered from the process at regular intervals to study the capability of the process to meet the design specifications.
Specifications : L = 240 ± 2 mm
239.8 238.3 238.7240.3 240.4 241.6239.4 240.9 239.6239.5 238.7 240.4240.1 241.1 239.8240.3 238.7 240.3239.0 240.2 239.8239.9 238.7 237.6
5678910111213
Is the process capable to meet the specifications ?
240.3 239.8 239.8240.9 238.9 238.8240.2 238.5 238.0239.8 240.5 236.5238.4 239.1 237.8239.4 239.5 236.9238.5 241.0 238.1240.9 239.7 236.8
1314151617181920
Example 5.3
In a manufacturing plant we want to compare 2 production lines (A) and (B) ; 60 parts are taken from each line and the quality
Production Line (A)
150.4150.5150.3150.2150.3150.1150.4149.9150.4150.3150.3150.1149.9150.2150.1150.0150.2150.1150.2150.2150.3150.3150.3150.2150 2150 3150 5150 0150 1150 0q y
characteristic measured and recorded on the table. The design Specifications are : L = (150 ± 0.5) mm
Make a comparison between the two production lines.
Which one is better ? And Why?
150.2150.3150.5150.0150.1150.0150.5150.0150.2150.3150.3150.0150.0149.9150.4150.2150.4149.9150.7150.1150.4150.1150.1150.2150.4150.1150.3150.5150.5150.4150.6150.3150.2149.8150.3150.4
Production Line (B)
150.0149.9149.8149.6150.1149.9149.9149.8149.9150.3150.2149.5Which one is better ? And Why?
If there is shift of the process, what can be the possible reasons for that ?
What recommendations would you make to the manufacturer?
149.4150.1150.0150.2150.0150.0149.8150.0150.1149.7150.0149.7150.2149.8149.6150.0150.1150.0149.8150.1149.7149.9150.0149.9150.2149.9150.0150.1150.1149.9149.4150.3149.7149.8149.5150.0149.8149.8149.9149.6149.9150.2149.7150.1150.0149.7149.9149.6
10/06/1436
12


