Embed Size (px)
Citation preview
Consumer Energy Alliance
PO Box 118
Exeter, NH 03833
June 25th, 2021
Jared Chicoine
Director, NH Office of Strategic Initiatives
Johnson Hall, 3rd Floor, 107 Pleasant Street
Concord, NH 03301
Dear Director Chicoine,
On behalf of Consumer Energy Alliance (CEA) and our membership across New Hampshire and
the United States, we write today to share our comments on New Hampshire’s State Energy
Strategy
Founded in 2006, CEA is a nonpartisan, nonprofit organization advocating for balanced energy
and environmental policies and responsible access to resources. CEA represents virtually every
sector of the U.S. economy – from the iron and steel industry to truckers, airlines, agriculture,
labor organizations, restaurants, chemical manufacturers, small businesses, and families all
across the nation – that are concerned about U.S. energy policies, energy security and
affordability, environmental stewardship, and long-term price and supply reliability. CEA has
more than 550,000 individual members and almost 300 academic, non-profit, corporate, and
union affiliates throughout the United States. Our members support a rational, all-of-the-above
energy policy that utilizes all of our domestic natural resources – both traditional and renewable
– while ensuring aggressive environmental protections and solutions are put in place.
CEA supports carbon and emission reduction strategies as we move towards a greener and
cleaner future that keep the cost and reliability needs of the consumer in mind. We believe in
bolstering new technologies that help consumers and business owners receive safe, cost-effective
and reliable energy across the board. Using an “all-of-the-above” energy mix ensures that this
service for families and households does not become a luxury item as it touches every aspect of
our lives and economy.
New Hampshire should build upon its existing Energy Strategy by continuing to support policies
that are in the best interests of New Hampshire consumers; and avoid costly mandates and
prohibitions that could restrict the individual choices of Granite State families and businesses to
choose how they power their homes and operations.

Thank you for the opportunity to submit these comments. CEA looks forward to working with
OSI and the soon-to-be New Hampshire Department of Energy in advancing CEA’s goals of
ensuring that every family and business has access to affordable, reliable and environmentally
sound resources.
Sincerely,
Marc Brown
Executive Director, New England


Tu Anh Tran Reinhausen Manufacturing 2549 North 9th Avenue, Humboldt, Tennessee 38343
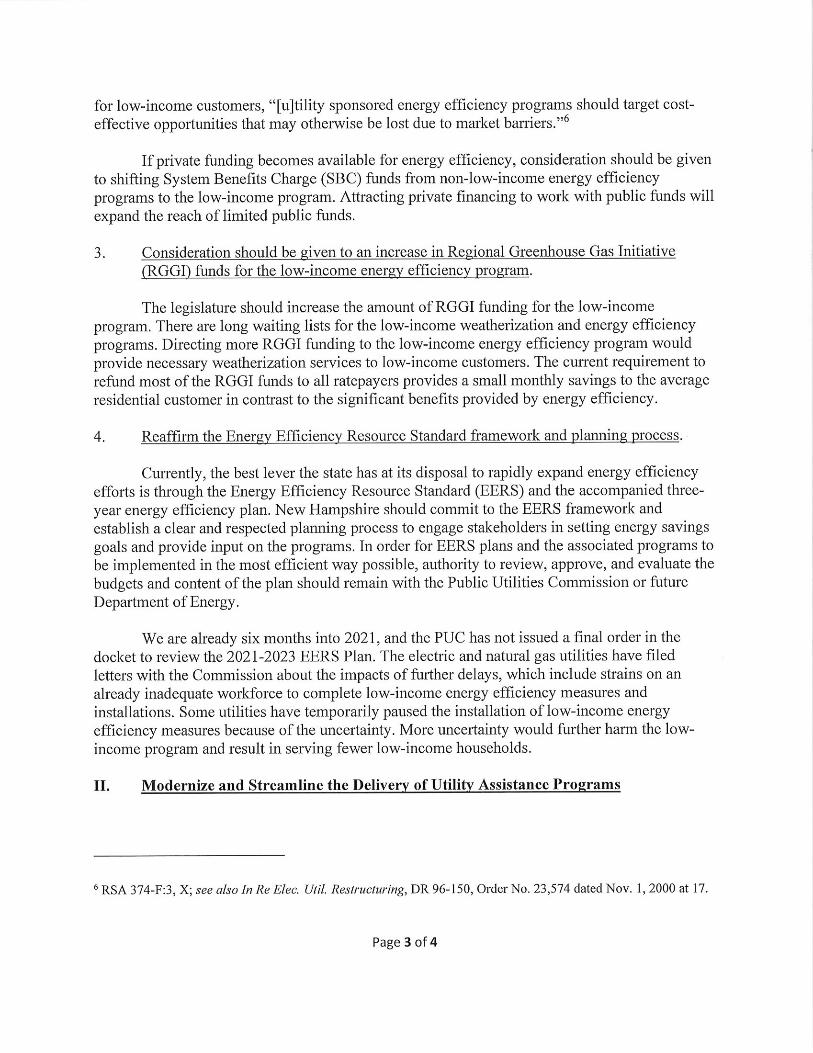
June 25, 2021 New Hampshire Office of Strategic Initiatives Governor Hugh J. Gallen State Office Park Johnson Hall, 3rd Floor 107 Pleasant Street Concord, NH 03301 Re: New Hampshire 10-Year State Energy Strategy Update - Public Comment To whom it may concern, We respectfully submit our comments to the New Hampshire Office of Strategic Initiatives in response to the New Hampshire 10-year State Energy Strategy. We commend the OSI on your efforts to update energy policies and initiatives for the state of New Hamsphire and we appreciate the opportunity to submit our comments. With the advancement of distributed generation, new development in low carbon technologies (LCT) and positive momentum towards an electrification movement, these trends encourage and fuel the growth of distributed energy resources (DERs), electric vehicles and their associated EV charging infrastructure, the distribution grids must evolve to accommodate for this growth. The US electric grid is aging, with the majority of the lines and power equipment approaching 30 years or older. In particular, the distribution grid continues to experience effects from growth of DERs and LCT loads. A report by the NE ISO indicated that New Hampshire is headed toward a large increase in the amount of solar panels, and the ISO predicts that by 2030 there will be 300 megawatts nameplate capacity of solar feeding the NH grid. This forecast does not include forward-looking PV projects greater than 5 mW in nameplate capacity. In addition to DERs, as electric vehicles and electrification efforts become more commonplace, utilities must undertake equipment upgrades and replacements to ensure optimal performance of distribution grids. Further, as preparation for more frequent and extreme weather events, these activities are also critical to maintain a reliable electric grid. These movements require a new perspective in our understanding of the electric grid. For example, in the traditional grid, conventional power flow is understood as unidirectional. Electricity flows from generation plants down to transmission, into distribution and onto the meters of connected consumers. In contrast, our modern grid looks vastly different. Looking at the distribution grid in the figure below, we recognize that power flow is no longer unidirectional. We must account for the effects of reverse power flow scenarios and voltage fluctuation due to increased loads. Yet, much of the older distribution equipment still need to be upgraded in anticipating for future forecasts.

A central topic in this conversation is also voltage control. Let us take a closer look at each movement and their effects on the distribution grid.
Movements Impacts Solutions
Distributed Energy Resources
(DERs)
DERs cause reverse pow er f low ,
voltage f luctuation and challenge
to grid hosting capacity.
Distribution transformers w ith
sophisticated voltage regulation
can solve all of these issues
EV and EV charging EV adoption increases peak
demand and low ers voltage during
peak consumption
Electrif ication (Heat Pumps) Electric appliances increase
energy consumption and peak
demand.
Energy Eff iciency Conservation voltage reduction
(CVR) is a subset of volt-var
optimization (VVO). CVR reduces
energy consumption and peak
load for connected customers
passively.
Smart Grids Utilities need enhanced visibility
into the distribution grids as part of
a smart grid.
To overcome these challenges, a modern grid requires modern distribution equipment with sophisticated voltage regulation capabilities. A new class of voltage regulating distribution transformers may enable New Hampshire utilities to better prepare for what is ahead and to better serve New Hampshire ratepayers. Only with the right regulatory policies, planning and investment, NH will be able to create and maintain a distribution grid that is robust, reliable and ready for the energy future. Sincerely yours, Tu Anh Tran Business Development Manager Reinhausen Manufacturing Inc. Reinhausen Group References:
[1] Aging grids drive $51B in annual utility distribution spending
https://w ww.utilitydive.com/new s/aging-grids-drive-51b-in-annual-utility-distribution-spending/528531/ [2] Solar Pow er in New England: Concentration and Impact
https://w ww.iso-ne.com/about/w hat-w e-do/in-depth/solar-pow er-in-new -england-locations-and-impact
Uncoordinated trouble? Electric vehicles can be a grid asset, but only w ith planning and investment
https://w ww.utilitydive.com/new s/uncoordinated-trouble-electric-vehicles-can-be-a-grid-asset-but-only-
w ith/515787/

June 25th, 2021
Office of Strategic Initiatives
Re: State Energy Strategy
107 Pleasant Street
Johnson Hall, 3rd Floor
Concord, NH 03301
The Appalachian Mountain Club (AMC) appreciates the opportunity to provide
comments to the Office of Strategic Initiatives (OSI) as they advance their required update to
the New Hampshire 10-Year State Energy Strategy in 2021. The AMC is the nation’s oldest
outdoor recreation and conservation organization with over 12,000 members in NH. We are
dedicated to fostering the protection, enjoyment, and understanding of the outdoors. Our
region’s current energy profile and usage, transportation infrastructure, and continued
dependence on fossil fuels create significant air pollution and greenhouse gas emissions that
impact the enjoyment and safety of outdoor recreationists, and the vitality of the natural and
recreational resources AMC works to protect.
The time is now to focus NH’s energy strategy on a path to net zero carbon emissions by
2050. We cannot afford to wait. By focusing on achieving net zero NH can benefit from:
reductions in climate-harming emissions, the co-benefits of cleaner air and water, transition to
renewable and distributed energy generation, improved and cleaner transit options, strategic
investment in communities that have been disproportionately impacted by fossil fuel pollution,
and expanded outdoor active transportation infrastructure which has significant health
benefits. New Hampshire’s Office of Strategic Initiatives (OSI) must use this 2021 update to
New Hampshire’s 10-Year State Energy Strategy to design a pathway to net zero no later than
2050 and bolster the policies and initiatives that will make this possible.
AMC supports the following key policies to set NH on the path to net zero:
• Adopt ambitious science-based emission reductions goals and benchmarks to ensure
ongoing progress to achieve net zero by 2050.

• Develop integrated energy systems modeling to identify the least cost pathway to
achieve net zero.
• Ensure that BIPOC and other marginalized communities such as rural and low-income
communities can easily participate in and benefit from existing and new programs and
address the historic patterns that result in over-burdening these communities with
energy-related pollution impacts and costs.
• Prioritize energy efficiency and energy conservation to minimize energy demand and
use, particularly during peak hours.
• Work with utilities to expand existing residential, commercial, and industrial energy
efficiency programs to incorporate beneficial electrification.
• Work with utilities to develop a more resilient grid system in NH through comprehensive
planning to upgrade transmission and distribution systems to handle the expected
increase in electrical capacity from technologies such as high-performance heat pumps
and electric vehicles.
• Increase energy efficiency savings goals in the Statewide Energy Efficiency Plan.
• Maintain and extend participation in the successful Regional Greenhouse Gas Initiative.
• Build a cleaner and more equitable transportation system by joining the Transportation
and Climate Initiative Program and invest in cleaner and active transportation options
with consideration of unique needs in overburdened, underserved, and rural
communities.
• Recommend, support, and maintain a net metering cap of a least 5 MW, group net
metering, behind the meter solar, and expand overall investment in distributed energy
projects. Compensation rates for net metering should be set by the Public Utilities
Commission and should be inclusive of grid and environmental benefits provided to all
ratepayers.
• Improve the stability and functionality of the Renewable Energy Fund to ensure progress
on delayed solar installation projects.
• Maintain NH’s Renewable Portfolio Standard goal of 25% renewable energy generation
by 2025 and add a 45% carbon emissions reduction target for 2030. Qualifying

renewable energy sources must meet rigorous criteria to protect the functioning of
natural systems and avoid undue impacts on BIPOC and other marginalized
communities.
Climate Change Urgency
The International Panel on Climate Change (IPCC) report of October 2018 makes very
clear that limiting global warming to 1.5 degrees Celsius (2.7°F) is crucial if we are to avert
climate disaster. The report finds that limiting global warming to 1.5°C would require “rapid and
far-reaching” transitions in land, energy, industry, buildings, transport, and cities. Global net
human-caused emissions of carbon dioxide (CO2) would need to fall by about 45 percent from
2010 levels by 2030, reaching ‘net zero’ around 2050. The urgency could not be clearer, and the
need for a strong and robust approach to reducing carbon emissions from all sources has never
been more timely or important.
AMC’s own climate analysis found that even the highest peak in New Hampshire, Mount
Washington, is experiencing climate changes including overall warming temperatures, a longer
growing season, fewer cold days, and more frost days1. While northern mountain regions of New
Hampshire could provide some cold refugia relative to other areas, the trends at mid-elevation
Pinkham Notch indicate we are losing snow earlier in spring and have fewer snow making days
before the economically important Christmas holiday. NH’s north country data are similar to
changes seen across New England. Our region is warming faster and experiencing more extreme
events – heavy precipitation and intense storms – than the rest of the nation. The average annual
temperature has already warmed 2 degrees F over the last century in the Northeast2, resulting in
warmer and longer summers, which increases the number and geographic range of human
disease-carrying insects and ticks3. Longer autumns favor winter ticks as they seek hosts,
contributing to moose calf die-off that has been particularly severe in recent years4. Nuisance
plants and organisms such as poison ivy, water borne pathogens, and blue-green algae in lakes
1 Murray et al. 2021 Climate Trends on the Highest Peak of the Northeast: Mount Washington, NH Northeast Naturalist 28
(Special Issue 11):64–82 2 NOAA https://www.ncdc.noaa.gov/cag/regional/time-series/101/tavg/12/12/1895-
2019?trend=true&trend_base=100&firsttrendyear=1895&lasttrendyear=2018&filter=true&filterType=binomial 3 https://www.cdc.gov/climateandhealth/pubs/VECTOR-BORNE-DISEASE-Final_508.pdf 4 https://tspace.library.utoronto.ca/bitstream/1807/93137/1/cjz-2018-0140.pdf

and ponds are expected to increase due to warmer weather and increased run-off during storms.
Disruptive and disease-causing land and aquatic organisms are not only a problem for hikers,
campers, and swimmers, but monitoring and preventing their spread is another resource
management concern and cost.
Weather events once considered to happen every ten- or one hundred-years are
occurring with greater frequency and impacting recreation. Maximum daily rainfall in the
Northeast has increased 27% from 1901 to 20165. More downed trees and washed-out trails
and bridges put untold stress on trails in the Northeast—and, by proxy, the land managers and
trail crews who restore them for public use. AMC’s trails department is spending more time
clearing trails from windstorms and repairing the erosion caused by the heavy rains. More
frequent and more extreme storms are making it harder to keep up with trail maintenance and
are driving a shift in strategy towards building and rerouting trails capable of withstanding
intense wind and rain events, an effort that itself takes significant resources. Trail networks in
the Northeast are heavily used because of their proximity to major urban areas. In a warmer
climate, with longer summer and shoulder seasons, trail use will expand even more, requiring
more human resources and services. Added to this are the more frequent extreme storms and
floods can also destroy access roads, and other recreational infrastructure. Access to
backcountry recreation areas and lodges can be compromised or lost, and recreationists and
ecosystems can be put at risk from extreme weather.
Our region’s winters are changing dramatically. One study coauthored by AMC’s
Director of Research found dramatic changes across 100 years of weather data: We are losing
the cold, with 18 fewer freezing nights6. We are losing the snow, with 21 fewer days of snow
cover. And in the Northeast, winters have become 3 weeks shorter over the past 100 years,
which can have huge economic impacts. A 2018 report The Economic Contributions of Winter
Sports in a Changing Climate found that low-snow seasons result in 5.5 million fewer visitors to
ski towns than average, resulting in close to $1 billion in reduced economic activity and 17,400
5 https://science2017.globalchange.gov/chapter/7/ 6 Contosta et al. 2019. Northern forest winters have lost cold, snowy conditions that are important for ecosystems and human
communities. Ecological Applications 29(7):
https://esajournals.onlinelibrary.wiley.com/doi/pdf/10.1002/eap.1974

fewer jobs7. In the Northeast, the continued warming is expected8 to further limit winter
sports, and particularly those relying on natural snow, to regions furthest north. Shoulder
seasons are also at risk with the important holiday season economic pulse becoming more
uncertain, even with snowmaking, because of the increased likelihood of rain rather than snow.
Winter fishing and other ice-dependent sports are also impacted by shorter and less reliable
lake ice. Even within winter, we are seeing dramatic back-and-forth shifts in weather
conditions, like the record-breaking warmup we saw this winter, followed by a return to more
normal cold conditions. These “winter weather whiplash” events can set us up for major
flooding, harm crops and vegetation, and cause problems for winter recreation9. With the
shortening of the winter season, ski area demands on water for snowmaking also become
compressed and magnified, impacting water resources.
NH is working to grow its recreational opportunities with the Office of Outdoor
Recreation Development. The recent establishment of this office recognizes the many benefits
of outdoor recreation, which is already significant including the more than 37,000 jobs and $2.8
billion in consumer spending, $1.3 billion in wages and salary, in the state of NH10. Yet the
ongoing cumulative impacts of climate change are working against these efforts and threaten
existing and growing recreational infrastructure and businesses. AMC believes the cumulative
impact from climate change on recreational resources and related business articulated
underscores the critical need to achieve net zero by 2050 and the deepest reductions possible
within the next 10 years.
Adopt TCI-P and Emphasize Active Transportation
Investments in active transportation can not only reduce greenhouse gas emissions
from vehicles but can result in the co-benefit of reducing ozone and fine particulates, creating
7 Burakowski and Hill, 2018. https://www.semanticscholar.org/paper/Economic-Contributions-of-Winter-Sports-in-
a-Burakowski-Hill/3aeffd109ac4625d962c0aa49c8638f20c3f40fa 8 Grogan et al. 2020. https://iopscience.iop.org/article/10.1088/1748-9326/abbd00 9 Casson et al. 2019. Winter Weather Whiplash: Impacts of Meteorological Events Misaligned With Natural and Human Systems
in Seasonally Snow-Covered Regions. Earth’s Future. Vol 7, Issue 12. https://doi.org/10.1029/2019EF001224 10 OIA Outdoor Recreation Economy Report 2017. https://outdoorindustry.org/resource/2017-outdoor-recreation-
economy-report/

healthier outdoor air for New Hampshire residents to breathe. Further, well designed bike and
pedestrian paths increase outdoor time, physical activity, and opportunities for building
community connections and cohesiveness. The health benefits of active transportation are well
documented11 and studies looking at the Transportation and Climate Initiative program (TCI-P)
have reinforced previous work by showing a strong connection between increasing pedestrian
and biking opportunities, addressing climate change, and improving public health.
According to a recent study by the Transportation, Equity, Climate, and Health (TRECH)
Project that analyzed the possible investments under the burgeoning TCI-P, the dual benefits of
mitigating climate change pollution and realizing health benefits can be achieved through
investments in biking and walking. If TCI-P was fully realized across the 12 Northeast and Mid-
Atlantic states and the District of Columbia, with transportation carbon emission reductions of
25% by 2032, the region could see monetized health benefits of upwards of $13.5 billion
dollars. The study estimated that a large portion of these health benefits, $7.4 billion, would
result from a modest investment in active transportation of 16% of proceeds. While authors of
the TRECH study point to it being illustrative of possible outcomes of TCI-P, other studies have
found that small investments in walking and biking have big health benefit payoffs. Specific to
NH, TRECH found monetized health benefits from reduced air pollution and increased physical
activity were estimated to be $40 million by 2032 at a 25% reduction in CO2 emission cap. With
regional collaboration, such investment can far outweigh any cost of the TCI program and
provide sustainable revenue to be invested in ways that not only reduce greenhouse gases, but
improve public health and safety, and expand connections within and among communities.
As with other investments under TCI it will be of utmost importance to incorporate
equity and inclusion in active transportation projects. This would begin by evaluating regional
and local underserved resident mobility, safety, and connectivity needs. This process should
include community residents of all demographic backgrounds, incomes, and physical abilities
early in the process. Information gathered from evaluations should then be used to develop
solutions that can serve all residents and users and address any potential negative impacts from
11 Mueller et al. 2015, Health impact assessment of active transportation: A systematic review. Preventive Medicine Vol 76
Pages 103-114

active transportation development such as housing affordability. With deliberate and inclusive
community-based planning and responsiveness, projects can not only improve mobility but can
also support local economic development, equity and inclusion, and realize physical health
benefits across all community members.
Pollution from cars and trucks is the leading source of carbon pollution in New
Hampshire, contributing 48% of greenhouse gas emissions. Cars and trucks also remain a
significant source of ozone and fine particulates that cause health problems like asthma,
cardiovascular disease, increased susceptibility to respiratory infection, and premature death.
According to the US Dept. of Transportation, nearly 81% of New Hampshire workers are driving
to get to work, and more than 76% do this alone, leaving other modes of travel or work at
home at about 12% of the work force. We urge OSI to recommend NH join TCI-P where regional
collaboration with benefit all.
AMC also strongly encourages NH to be a leader in providing an open and inclusive
process around developing targeted investments and working collaboratively with communities
to maximize program benefits to all. We applaud the prioritization in TCI-P’s proposed model to
expand low-carbon and clean mobility options in urban, suburban, and rural communities,
particularly for populations and communities that are disproportionately adversely affected by
climate change and transportation pollution, and those that are currently underserved by the
transportation system.

Meet the Challenges in Rural Areas
Many rural areas in the TCI region are experiencing a boom in their outdoor recreation
economies, and some more remote recreation destinations are being used above their capacity
by outdoor enthusiasts (Franconia Notch in New Hampshire is but one example) which can
include too many vehicles and not enough parking. Expanding mass transit to some of these
destinations, as well as looking at active transportation possibilities for recreation and
connectivity, could reduce emissions and alleviate the overcrowding, spurring growth in local
businesses and economies as well. New Hampshire agencies should coordinate to integrate
planning for bike and pedestrian pathways and other active transportation infrastructure with
regional and state-wide comprehensive recreation planning efforts, smart zoning, and other
planning efforts to improve community resiliency, mobility, and safety.
A recent New Bridge Poll12 of 1,059 rural and small-town voters in Northeastern and
Mid-Atlantic states found that 75% were in favor of the creation of a state clean transportation
fund like TCI. For New Hampshire specifically the top two investment options selected were
“Providing better options to shop and work from home with improved high-speed internet
access” and “Increasing clean public transportation options such as trains and low-emission
buses and van services to smaller towns beyond major cities”. Improving internet access and
speed is an important strategy to help rural residents improve their connectivity with the added
benefits of reducing their need to drive. This could be especially helpful to low-income
residents and those with few mobility options. The survey also found that all investment
options proposed were well supported by at least 69% or more of NH respondents, including
expanding transit options and increasing EV infrastructure. Rural drivers tend to drive more
miles overall with dispersed services and longer distances to places of work. Transitioning to
electric vehicles could be more economically beneficial to these drivers, and transit to common
destinations or services could aid in both mobility and emissions reductions. There is a current
lack of EV level 2 and DC Fast Charging stations in northern NH and Maine (See US Dept. of
Energy’s Alternative Fueling Station Locator). Therefore, it will be important for New Hampshire
12 https://www.nature.org/en-us/newsroom/transportation-climate-initiative-polling/

and other TCI states to consider rural community needs to successfully foster EV growth and
target investments in infrastructure for EV charging that supports rural travel and commuting.
Thank you for the opportunity to comment.
Susan Arnold
Vice President for Conservation
Appalachian Mountain Club

•
•
•
•

•
•
•

Ray Brousseau Vice President & Deputy General Manager BAE Systems Electronic Systems 65 Spit Brook Road Nashua, NH 03061 June 25, 2021 New Hampshire Office of Strategic Initiatives 107 Pleasant Street Johnson Hall, 3rd Floor Concord, NH 03301 RE: State Energy Strategy Dear Office of Strategic Initiatives: BAE Systems is pleased to submit these brief comments for consideration as the Office of Strategic Initiatives (OSI) updates the state’s Energy Strategy. As you know, BAE Systems is the state’s largest manufacturer and a major consumer of energy. The company has roughly 6,800 employees at our facilities in New Hampshire, and thousands more at other locations throughout the country. This provides us with a unique perspective on the cost of energy, its impact on New Hampshire’s economy, and the best strategies to employ to meet the state’s energy needs and challenges. BAE Systems believes the state should devise a balanced, “all of the above” strategy to ensuring businesses and individuals have a reliable, affordable baseload supply of energy while prudently, over a reasonable period of time, moving away from fossil fuels and to renewable sources of energy. This includes the careful consideration of the fuel mix of baseload generation, and the siting of the infrastructure needed to bring existing and future sources of energy to consumers – all with an eye on maximizing ratepayer benefit and avoiding costly subsidies. Equally important, the company believes emphasis on energy efficiency initiatives with a demonstrated return on ratepayer investment should remain an important part of any strategy. Our company has recently committed to Net Zero by 2030, and must do so without jeopardizing our commitments to our customers or increasing costs that make us less competitive. Similarly, the state’s energy strategy should move us closer to a zero-carbon emission state, but in a manner that does not lead to policies and regulations favoring or investing in unreliable, costly energy sources unless those sources prove dependable and economical for baseload generation. Moreover, the state energy strategy should not erect barriers which prohibit the siting of energy infrastructure that otherwise balances environmental stewardship with the energy needs of the state and region.

Thank you for your consideration of BAE Systems’ comments regarding the state energy strategy. Should you have any questions, please feel free to contact me, or our Concord representative, David Cuzzi or Prospect Hill Strategies (603-716-0569). Sincerely,
Ray Brousseau Vice President & Deputy General Manager BAE Systems Electronics Systems


June 25, 2021
Office of Strategic Initiatives
107 Pleasant Street
Johnson Hall, 3rd Floor
Concord, NH 03301
BROOKFIELD RENEWABLE
COMMENTS ON THE
10-YEAR STATE ENERGY STRATEGY UPDATE
Brookfield Renewable1 appreciates the opportunity to comment on the New Hampshire Office of
Strategic Initiatives’ (OSI) request for written comments on the review of the 10-Year State
Energy Strategy.
Small-Scale Hydropower in New Hampshire’s RPS
Due to restrictive eligibility requirements, the majority of New England’s small-scale
hydropower facilities, including many New Hampshire-located hydropower units, are unable to
participate in New Hampshire’s RPS programs. The lack of adequate inclusion of this important
asset class in the pursuit of New Hampshire’s clean energy policy goals overlooks the significant
contributions existing small-scale hydropower provides New Hampshire and the region and fails
to consider the reliability and economic value associated with the retention of the region’s legacy
renewable energy fleet.
1 Brookfield Renewable’s New Hampshire portfolio includes 8 hydropower facilities, a wind energy
project (sale pending) and a distributed solar system, representing 144 MW of installed capacity – enough
to power close to 73,000 New Hampshire homes. Brookfield Renewable has more than 15 employees in
New Hampshire and indirectly supports more than 55 jobs through local vendors and contractors.
Brookfield Renewable pays more than $3.5million in property taxes in New Hampshire annually.

To support retention of the region’s small-scale hydropower portfolio, and to allow the
achievement of expanded renewable energy goals at lowest costs, Brookfield Renewable
encourages OSI to explore RPS program changes that broaden the role of New England’s
existing small-scale hydropower fleet. This includes consideration of both resource eligibility
and program demand.
I. Class IV Eligibility
Brookfield Renewable urges OSI to consider whether more appropriate Class IV eligibility
criteria should be implemented by the Legislature. Current statute requires that Class IV
hydropower resources must be 5 MW or less and “has actually installed both upstream and
downstream diadromous fish passages and such installations have been approved by the Federal
Energy Regulatory Commission”.2 However, increasing the size threshold to up to 10 MW, for
example, as well as implementing more nuanced fish passage requirements may facilitate more
optimal program participation and resource retention.
Regarding the fish passage requirements, specifically, it is important to consider that several
existing New England hydropower facilities operate without diadromous fish passage because
operations have limited impacts on diadromous species and/or because projects operate outside
of the historical habitats of such species. Operating without fish passage for diadromous species
is often the case even after issuance of a new FERC license – a process which includes
substantial analysis and state and federal agency consultation and coordination. Therefore,
requiring the installation of costly infrastructure as a condition for program participation,
regardless of whether such infrastructure is adequately justified, needlessly prevents participation
of hydropower facilities that otherwise could assist New Hampshire in achieving its policy goals
at lowest costs.
II. Class IV Program Demand
Achieving the goals of resource optimization and retention requires that any discussions
regarding Class IV eligibility criteria be accompanied by consideration of program demand. This
2 RSA 362-F:4
prevents counterproductive outcomes whereby expanded resource eligibility has harmful impacts
on resources currently eligible. Therefore, Brookfield Renewable urges OSI to include in its
recommendations that any future Class IV eligibility changes aimed at broadening reliance on
the region’s small-scale hydropower fleet be accompanied by a substantial increase to annual
Class IV program demand. This would facilitate a low-cost expansion of New Hampshire’s
renewable energy goals while also limiting displacement of existing small-scale resources
currently relied on to meet Class IV compliance requirements.
Energy Storage
The regional grid is currently experiencing a substantial shift in resource mix, due in large part to
neighboring state policies aimed at reducing carbon emissions in the electricity sector. This
evolution highlights a growing need for the retention and development of dispatchable and load-
following resources, including existing pumped hydropower and new battery storage. To
mitigate potential cost impacts to New Hampshire ratepayers resulting from the expanding role
of intermittent resources, Brookfield Renewable recommends OSI consider policies that promote
the development of new strategically-located grid-scale battery storage. In particular, Brookfield
Renewable recommends that OSI explore the establishment of property tax exemption(s) for new
distribution or transmission-connected grid-scale energy storage systems (20 MW or less). This
exemption would incentivize necessary resource additions that enhance local grid reliability and
resiliency and would increase the availability of necessary ancillary services for the benefit of
New Hampshire ratepayers.
Thank you for the opportunity to comment. Please contact me directly with any questions or
comments related to these issue or Brookfield Renewable’s work in New Hampshire.
Sincerely,
Steve Zuretti
Senior Director, Government Affairs and Policy

June 2, 2020
Office of Strategic InitiativesRe: State Energy Strategy107 Pleasant StreetJohnson Hall, 3rd FloorConcord, NH 03301
Dear Director Chicoine,
Clean Energy NH is pleased to submit the following comments and recommendations regardingthe 2021 update to the State of New Hampshire’s 10-Year State Energy Strategy.
This round’s statutorily required update to the Energy Strategy is very timely based on theregional and national focus on rapidly expanding the clean energy economy. In addition, thegrowing industry is poised to provide significant economic growth, new jobs and investments,and a stronger, more resilient, and more accessible and affordable energy system. New sectorssuch as offshore wind, existing opportunities such as building out electric vehicle (EV)infrastructure, and proven technologies such as energy efficiency upgrades all play a role inNH’s energy future. Therefore, NH’s Energy Strategy should reflect the new and existingopportunities available to the state’s municipalities, businesses, and residents. Furthermore, theEnergy Strategy should provide a framework for the state to keep pace with the region’saggressive energy efficiency and clean energy targets to ensure the Granite State does not fallbehind or get exposed to avoidable new costs.
Our comments and recommendations are organized by sections that align with the 2018 EnergyStrategy Update as well as proposed new sections, accompanied by supporting descriptionsand references where appropriate.
Thank you for the opportunity to submit these comments and recommendations. Please feelfree to contact me with any questions or to further discuss any of the content described in thisdocument.
Sincerely,
Madeleine MineauExecutive [email protected]
14 Dixon Avenue, Suite 202 | Concord, NH 03301 | www.cleanenergynh.org | 603.226.4732

Section 1: Energy Policy Goals
Below, we summarize the current Energy Policy Goals as defined in the 2018 Energy StrategyUpdate and include comments on each:
1. Prioritize cost-effective energy policies.We agree that NH should support cost effective energy policies. Too often we have seenshortsighted avoidance of short term investments in NH energy resources even when there areclearly documented longer term savings or avoided costs. NH should invest in clean techsolutions such as energy efficiency, demand response, distributed energy resources, andenergy storage to tackle cost drivers such as peak demand. Peak demand drives overallelectricity system costs as well as increases in wholesale electricity costs and the allocation ofregional costs.
It is also important to distinguish between electricity rates and electricity costs. While NH’selectricity rates are consistent with the rest of New England’s traditionally high rates, overallelectricity costs are not among the highest in the nation, notably due to investments in energyefficiency that reduce waste and lower bills. Energy efficiency consists of proven technologiesthat can save money for everyone due to lower system demand, but in particular, lower theenergy burden for low-income households and those on fixed incomes. In addition, theinstallation of small, distributed renewable energy projects such as on-site solar allowsbusinesses stable, predictable energy rates and to increase their energy independence,strengthening the business community from the volatile pricing mechanisms of imported fueland the regional electric grid. Consistent, robust investment in energy efficiency and cleanenergy policies should be prioritized as an effective method to control energy prices. Therefore,it this goal should be revised to read: “Strengthen cost-effective energy policies that provideboth direct and indirect benefits to NH municipalities, businesses, and residents”
Finally, the concern over electric rates is sometimes used to oppose programs and energypolicies that are investments that result in known benefits or cost savings. However, the statedoes not seem to equally critically evaluate other cost components of utility rates such as utilityauthorized rates of return on equity (ROE). The graph below shows that utility ROE have mostlyheld steady since the 1990s while other market based indicators of the cost of borrowing havedeclined (Fowlie, 2021). Utility shareholders are therefore receiving disproportionately high ratesof return which is a cost directly paid by ratepayers. NH should support a shift to innovativeutility regulation including performance based regulation as well as continue to support revenuedecoupling.
14 Dixon Avenue, Suite 202 | Concord, NH 03301 | www.cleanenergynh.org | 603.226.4732

2. Ensure a secure, reliable, and resilient energy system.CENH supports this goal but recommends it be revised to read: “implement the policies andprocedures to accelerate NH’s transition to a secure, reliable, resilient energy system andeconomy”. This encompasses the urgent need to bring stakeholders together to buildconsensus and an action plan to ensure the electricity system and our energy system, includingtransportation, are strengthened and modernized to both provide for the needs of NewHampshire while being prepared for new and emerging threats, such as cybersecurity risks andthreats from climate change.
In addition, CENH strongly recommends that the Energy Strategy outline a timeline for gridmodernization in the state. Efforts to modernize the electric grid have been stalled since therelease of the 2017 Grid Modernization Working Group report, hindering the ability of the state’sutilities and stakeholders to move forward with comprehensive planning and discussionssurrounding this vital aspect of our energy future. Guidance is needed regarding the dual goalsof grid modernization of both increased reliability and a smart grid that can better hostdistributed energy resources. NH would benefit from developing streamlined and efficientinterconnection application and review procedures and providing hosting capacity information torenewable energy developers. Such work should be done proactively as to avoid bottlenecksand delays to interconnection seen in other states.
14 Dixon Avenue, Suite 202 | Concord, NH 03301 | www.cleanenergynh.org | 603.226.4732

3. Adopt all-resource energy strategies and minimize government barriers to innovation.CENH generally agrees that we should minimize government barriers to innovation and that nosingle energy resource is the solution. However, in an energy system dominated by monopolyutilities, government regulation and policies is sometimes needed and warranted to create acheck on utilities and a balance to their power in the industry. Although the government shouldnot pick winners and losers, there is a role for the government to play to ensure fuel diversity,protection of our environment, and benefits to our local economy and communities.
4. Maximize cost-effective energy savings.Energy efficiency is the cheapest form of energy and should be encouraged by the state as away to lower energy costs for residents, businesses, and municipalities. Currently, the best leverthe state has at its disposal to rapidly expand energy efficiency efforts is through the EnergyEfficiency Resource Standard (EERS) and the accompanied three-year energy efficiency plan.NH should commit to the EERS framework and establish a clear and respected planningprocess to engage stakeholders in setting energy savings goals and provide input on theprograms.
In order for EERS plans and the associated programs to be implemented in the most efficientway possible, authority to review, approve, and evaluate the budgets and content of the planshould remain with the Public Utilities Commission or future Department of Energy.
5. Achieve environmental protection that is cost-effective and enables economic growth.It is important to recognize that not all environmental benefits are easily identifiable nor easilyquantifiable. These are commonly referred to as “externalities”. Therefore, this goal should beclarified given that it can be difficult, potentially even impossible, to evaluate thecost-effectiveness of environmental protection. CENH recommends reframing this goal to read:“Prioritize environmental protection in-line with state goals including land and waterconservation, greenhouse gas emissions reductions targets”. NH should acknowledge thatreducing greenhouse gas and other harmful emissions is in the best interest of its residents andbusinesses. Therefore, NH should work to develop emission reduction goals as a state policy.
With likely continued interest and growth in the development of renewable energy and the needto maintain existing resources, environmental protection should be balanced with controllingproject costs and establishing realistic and consistent standards. For example, NHDES isworking towards initiating rulemaking to establish Alteration of Terrain permitting rules for largeground mounted solar development. We hope those standards will strike the right balance toprotect water quality and effectively manage potential stormwater runoff while not being overlyburdensome or significantly increase project costs. Existing renewable energy resources canalso be negatively financially affected by new environmental requirements, for example somedemands of small hydropower relicensing can be very difficult and costly to satisfy.
14 Dixon Avenue, Suite 202 | Concord, NH 03301 | www.cleanenergynh.org | 603.226.4732

6. Government intervention in energy markets should be limited, justifiable, andtechnology-neutral.It is crucial to recognize that government intervention in energy markets is inherent. Investorowned utilities are regulated monopolies, justified by their duty to provide safe, reliable, costeffective electricity to ratepayers. As regulated entities, they are restricted in many areas,making government guidance and support sometimes necessary to outline important policygoals. It is important to note that all other New England states have signed-on to a visionstatement for New England’s energy future that strongly urges ISO-NE to develop new ways ofincorporating clean energy into their planning and operating procedures. Therefore, governmentintervention in energy markets is already existing, and New Hampshire should be a part of theconversation to ensure our interests are represented and we are involved in decisions that affectus.
Regarding the “technology-neutral” position of this stated goal, again policy is needed to ensurefuel diversity and a mix of energy resources that minimize impact on the environment andbenefit our residents and communities. Therefore, NH energy policy should continue to supportthe resources included in the Renewable Portfolio Standard.
7. Encourage market-selection of cost-effective energy resources.Energy markets are highly competitive and regulated entities that are structured in an outdatedway, when energy systems were designed around centralized, usually fossil-fueled, powerplants. The modernized electric grid features two-way flows of electricity from decentralized,local generation resources. New Hampshire should participate in any and all discussions thatinvolve revising energy markets to ensure all resources, including new renewable resources,are allowed an equal opportunity to compete. This should include consideration of externalitiesand any state environmental or economic goals associated with the energy resource.
8. Generate in-state economic activity without reliance on permanent subsidizationof energy.All forms of energy are subsidized in one form or another, whether at the local, state, or federallevel. Therefore, this goal should be revised to read: “generate in-state economic activity byprioritizing energy opportunities that reinvest our energy spending locally, contribute to new jobsand investment opportunities”. This is discussed further below in the offshore wind section.
9. Maximize the economic lifespan of existing resources while integrating new entrantson a levelized basis.This goal, as stated, falls outside the boundaries of the state’s control, electric generatingresources are privately owned and new generating resources connecting to the grid largely fallunder the purview of ISO-NE. NH should actively participate in regional discussions on theapproach taken by ISO-NE to either sustain economic viability of existing resources and/orencourage the development and interconnection of new resources, including distributed energyresources.
14 Dixon Avenue, Suite 202 | Concord, NH 03301 | www.cleanenergynh.org | 603.226.4732

10. Protect against neighboring states’ policies that socialize costs.Rather than protecting against other states’ policies we should work more collaboratively withNew England states to together evolve our regional grid and energy system to better serveratepayers. Our neighboring states are moving forward with aggressive policies to reform theregional energy system. New Hampshire should be a part of these discussions to ensure ourresidents and businesses reap the benefits of the transition to the clean energy economyinstead of watching the benefits accrue to other states.
11. Ensure that appropriate energy infrastructure is able to be sited while incorporating input andguidance from stakeholders.CENH feels this goal is adequate but should include a discussion of funding for the SiteEvaluation Committee (SEC), which is the government entity responsible for energy siting andproviding a forum for stakeholders to engage. Currently, the SEC is experiencing funding andstaffing challenges, which might impair its ability to perform the duties necessary to ensure theenergy siting process is timely and accessible.
Section 2: Fuel Diversity
a. Renewable EnergyThe state energy strategy should highlight the important role clean energy technologiesare playing, and will perform, in the energy transition. Fossil fuel investments are beingphased out in favor of low-carbon, clean, and renewable technologies including solar,hydro, biomass, and onshore and offshore wind, which will be discussed in more detailbelow. Every other state in New England has set ambitious goals to transition torenewable energy or even total net-zero carbon emissions whereas NH has a dismalgoal under the Renewable Portfolio Standard (RPS) of 25.2% by 2025. As a result, ourportion of the electric grid is not being upgraded with modern technologies, ourworkforce is seeing fewer new jobs in the clean energy industry, and our communitiesare not receiving the tremendous benefits of clean energy investments. The state isfalling behind in the energy transition.
In fact, in the latest edition of the Regional Electricity Outlook, regional grid operatorISO-NE heavily emphasizes the importance of preparing for the clean energy transition.Therefore, the state energy strategy should encourage robust clean energy goals andlong-term, well-funded clean energy policies and programs.
As 2025 is rapidly approaching it is time for the state to revisit the RPS goals beyond2025 and plan for the future.
14 Dixon Avenue, Suite 202 | Concord, NH 03301 | www.cleanenergynh.org | 603.226.4732

b. Net MeteringThe energy strategy should recognize net energy metering as an appropriatecompensation mechanism for small scale renewable energy producers. Group netmetering is also an important mechanism to enable shared electricity transactions.Compensation rates should be set by the rate experts at the Public Utilities Commissionand should be inclusive of grid and environmental benefits provided to all ratepayers. Asdiscussed above, net metering should not be subject to arbitrary governmental limits andshould instead be consistent with other regional restrictions, such as the ISO-NE 5 MWlimit.
Expanding the net metering project cap size can save NH ratepayers on currenttransmission costs, as net metering helps reduce peak electricity demand. As regionaltransmission costs are allocated to each state based on its share of the region’s peakdemand, the more power a state produces locally by net metering, the lower their portionof regional costs. NH is currently losing ground to our neighboring states that haveencouraged the development and net metering of distributed energy resources andinvested in energy efficiency.
In fact, the ISO-NE Capacity, Energy, Loads, and Transmission (CELT) report noted thatNH is, due to failure to invest in energy efficiency and behind-the-meter solar PV,headed in a negative direction with respect to transmission costs. In the 2020 CELTreport, released April 2020, NH was projected to see its share of peak summer load(after accounting for energy efficiency and PV) grow from 9.7% to 10.8% of ISO-NE totalpeak load between 2021 and 2029. This represents an increase of 13.6% intransmission costs over that time.
14 Dixon Avenue, Suite 202 | Concord, NH 03301 | www.cleanenergynh.org | 603.226.4732

In the April 2021 CELT Report, those projections changed from 10% to 12.4% of ISO-NEtotal peak load between 2021 and 2029, an increase of 24% in transmission costs overthat time period. This increase will cost NH ratepayers millions more in transmissioncosts ($12.3 million for every 0.1% increase in load based on $12.3 billion in regionaltransmission investments).
Net metering behind-the-meter solar also saves ratepayers on future transmission costsbecause net metering mitigates the need for expensive new transmission projects thatsaddle ratepayers with an approximate 11.5% return earned by transmission companies.For reference, transmission is one of the fastest growing parts of electricity bills,increasing 555% since 2005. Furthermore, local renewables also hedge against the costof transmission line losses, estimated at 6-7%.
c. Offshore WindThe state energy strategy should recognize offshore wind as a major opportunity to builda new industry in NH, therefore providing an avenue for new jobs, new investments, andnew infrastructure. According to New England for Offshore Wind: “New Hampshire isestimated to have 3.4 gigawatts of potential offshore wind power off its coast. It also hasthe capacity to serve as an important part of the offshore wind supply chain, takingadvantage of the facilities at the Pease Tradeport in Portsmouth.” In addition, entitiesincluding the Port of New Hampshire, the Community College System of NewHampshire, UNH, private companies, and beyond all have a role to play and stand togain from the development of this industry, whether or not offshore wind farms are sitedoff the NH coast or not. The state has a huge opportunity to establish itself as anoffshore wind supply chain hub, serving the industry in Maine and Massachusetts,Connecticut, and Rhode Island, all of which have established robust offshore windtargets.
For reference, Massachusetts has established a procurement of 3.2GW of offshore windby 2035, Connecticut has a procurement goal of 2GW by 2030, and Rhode Island has aprocurement goal of 600MW. These procurements signal to developers that these statesare serious about offshore wind and therefore are optimal locations for investments.
The state should hold the Bureau of Ocean Energy Management (BOEM) accountablefor scheduling regular meetings with the Gulf of Maine Offshore Renewable Energy TaskForce. The first and only Task Force meeting was held in December of 2019 and as ofthe time of the submission of these comments, another meeting has yet to be scheduled.
The strategy should incorporate recommendations from the ongoing Senate Commissionto Study Offshore Wind and Port Development, chaired by State Senator David Watters,
14 Dixon Avenue, Suite 202 | Concord, NH 03301 | www.cleanenergynh.org | 603.226.4732

highlight the importance of state efforts to build an offshore wind supply chain in NH, andemphasize a scientific fact-based approach to offshore wind development that balancesthe use of multiple ocean resources.
d. Energy StorageThe energy strategy should highlight energy storage technologies as a vital opportunityto increase the efficiency of the electric grid and accelerate the transition to a cleanenergy future. Energy storage technologies are available in a variety of formats andhave been deployed successfully at various scales in neighboring states, such asVermont’s Green Mountain Power residential battery storage program and Sterling,Massachusetts’ commercial scale energy storage system paired with solar. NewHampshire should be seen as an attractive, open market for energy storage developersto encourage this grid resource.
Section 3: Energy Efficiency
As highlighted above, energy efficiency is the least-cost energy resource and should beprioritized by the state energy strategy. All residents and businesses benefit from energyefficiency efforts through the lowering of peak electricity demand, whether or not they participatedirectly in the state’s energy efficiency programs. According to the NHSaves ProgramAdministrators, as of 2018 data, the state’s energy efficiency programs produced “customerenergy cost savings of more than $373 million over the lifetime of the measures”, (NHSaves).The programs also support a robust industry; in 2018, the energy efficiency programssupport[ed] 914 full-time equivalents,” (NHSaves).
New Hampshire should utilize more funding from the Regional Greenhouse Gas Initiative(RGGI) auction proceeds for energy efficiency programs rather than rebates on electric bills.The savings that can be accrued for everyone from investments in energy efficiency are greaterthan the current rebate structure.
In addition, the state should not transfer any approval mechanism for the energy efficiency plansor programs to the legislature. This body is not equipped with the time, resources, or expertiseto evaluate the costs or benefits of energy efficiency and therefore the task should remain withthe subject-matter experts at the Public Utilities Commission. To our knowledge no other staterequires legislative approval of energy efficiency program funding.
The state should encourage the energy efficiency program administrators to adopt newprograms like active demand response programs to continually provide new options for thestate’s residents and businesses to save money, conserve energy, and better target peakdemand reduction.
14 Dixon Avenue, Suite 202 | Concord, NH 03301 | www.cleanenergynh.org | 603.226.4732

Finally, new buildings and significant renovations should be constructed to modern and energyefficient standards. NH should continue to work towards adopting and implementing up to datebuilding codes and ensure compliance with those building codes and standards withoutamendment that reduce the energy efficiency standards included in the codes.
Section 4: SitingThe state energy strategy should make it clear that the siting of offshore wind projects is underthe jurisdiction of the Bureau of Ocean Energy Management (BOEM) if projects are to belocated outside of state waters, of which it is likely all projects located along NH’s coast will be.
Siting of large renewable energy facilities that fall within the jurisdiction of the SEC should beevaluated in a fair manner with predictable and consistent review criteria. Siting of energyinfrastructure is very challenging and can greatly add to challenges and costs to add newresources.
Section 5: TransportationFirst, the state should establish a lead agency and mechanisms for efficiently receiving andexpending any federal dollars directed to NH electric vehicle-related transportation items fromany federal infrastructure or stimulus programs.
Second, the state energy strategy should clearly define goals for developing a robust electricvehicle (EV) charging station network. Evidence of an approaching inflection point in the EVmarket growth include the fact that automakers and suppliers have pledged $250 billion inelectrification investments by 2023 and IHS Markit projects there will be 130 EV modelsavailable in the U.S. by 2026. These models will be offered at a range of purchase prices andwill include popular vehicle types such as SUVs and crossovers that were not widely availableduring the early years of the market but are highly desirable to consumers, especially in NewEngland’s wintry climate. In addition, recent consumer surveys show that interest in consideringan EV purchase is also on the rise. There are a range of projections for how quickly the numberof EVs on the nation’s roads will increase over the next decade, but most industry expertsexpect a large jump. A recent analysis by Deloitte, for example, projects that EVs will make up27 percent of new vehicle sales in the United States by 2030. New Hampshire needs to beprepared to accommodate both residents and tourists with EVs and the current infrastructureavailable pales in comparison to neighboring states and Quebec.
The energy strategy should highlight the Volkswagen Settlement Beneficiary Mitigation Trust asa source of funding for level 2 and DC fast charging stations and encourage the timely use ofthese funds to assist communities and businesses with the installation of charging stations.Particular emphasis should be placed on ensuring rural and Northern communities are grantedequitable access to these funds for charging stations. In addition, the energy strategy should
14 Dixon Avenue, Suite 202 | Concord, NH 03301 | www.cleanenergynh.org | 603.226.4732

highlight the benefits of utility make-ready program investments, which can enable rapidexpansion of charging stations by ensuring infrastructure on the utility side of a charging stationcan be upgraded. The energy strategy should also highlight the importance of accessibletime-of-use rates that enable customers to modify their charging habits to utilize the electric gridmost efficiently, and discourage the use of demand charges as inappropriate for DC fastcharging station site hosts and drivers. According to industry experts, “...demand charges canadd up to 90 percent of total electricity costs, leaving many sites deeply in the red,” (St. John).
Furthermore the energy strategy should highlight electric transit and school buses as primeopportunities for state entities to consider for lower maintenance and operating costs. Stateentities should also be encouraged to purchase all-electric or hybrid electric vehicles from thestate bid list, which have the lowest total cost of ownership compared to gasoline poweredvehicles. This is in the best interest of NH taxpayers.
Section 6: Other Recommendations:
a. Community PowerThe energy strategy should emphasize the importance of flexibility when it comes tolocal control over energy infrastructure such as through the adoption and implementationof Community Power programs, otherwise known as municipal aggregation. Many citiesand towns across the state have expressed interest in adopting a community powermodel to choose where their electricity comes from on behalf of their residents andbusinesses, work with utilities on local energy infrastructure upgrades, and provideincreased access to new programs and services such as energy efficiency and localrenewables.
b. Statewide Energy Data PlatformThe state energy strategy should support the creation of a statewide energy dataplatform as described under the settlement agreement in PUC docket 19-197. Theenergy data platform provides Granite Staters with an opportunity to easily access theirenergy data. It also provides the potential to support innovative energy services andbusiness models that benefit New Hampshire homes and businesses.
Access to energy data can enable the adoption of distributed energy resources, adeeper understanding of energy efficiency and opportunities to apply efficiencymeasures, and efforts to modernize the grid. It is important to plan for and execute amore modern, resilient, and reliable electric grid. Access to readily available energy datais essential to that goal and will help transform New Hampshire’s clean energy economy.
14 Dixon Avenue, Suite 202 | Concord, NH 03301 | www.cleanenergynh.org | 603.226.4732

c. Heating SectorThe state energy strategy should emphasize the importance of accelerating the heatingsector’s transition to efficient electric heat pumps or locally produced, efficient,low-emission modern wood heating systems.
There are a number of electric heat pumps available on the market that are highlyeffective in colder climates like NH’s and provide a suite of benefits including loweremissions, higher efficiency, and improved comfort. The NHSaves programs arewell-suited to connect ratepayers with contractors and equipment to make the switch toelectric heat pumps.
In addition, “heating with wood has a 50% lower carbon impact than heating with oil orgas. While about 80% of the money spent on oil or gas leaves our region, nearly 100%of money spent on wood fuel remains in our region. Many of our communities have arich forest legacy, and residents feel proud to support heating with wood. Wood boilerscan be integrated into existing central heating systems without distribution systemupgrades, although sometimes distribution upgrades can dramatically improve energyefficiency,” (Feel Good Heat).
The energy strategy should also encourage the use of Combined Heat and Power(CHP), otherwise known as cogeneration systems, as “efficient and clean approach[es]to generating on-site electric power and useful thermal energy from a single fuel source,”(US DOE). The state currently has only about 47MW of CHP capacity but an estimatedtechnical capacity of significantly more: approximately 447MW. Utilizing cogeneration isan ideal way to maximize our energy resources.
d. Building CodesThe state energy strategy should highlight the importance of adopting modern buildingenergy codes. The state is currently far behind the most updated codes, having justadopted the 2015 codes from the previous 2009 version. Though the 2015 energy codesare in effect the Building Code Review Board adopted several amendments thatsignificantly reduced the energy savings benefits that would have been gained with theadoption of the 2015 energy code. Buildings are long-term assets, and each buildingconstructed today could affect energy consumption for the next 50 to 100 years. Energycodes that prioritize the efficient use of energy in building construction and usage arevery important and will reduce the need for more costly retrofits later on.
According to the state’s Energy Efficiency and Sustainable Energy (EESE) Board’s 2018statement of support for updated codes, updating from the 2009-2015 codes created:“an average annual avoided-energy cost of $542 across single and multi-family homes inthe southern tier of the state, and an average annual avoided-energy cost of $693 in thenorthern tier. Over the life of a 30-year mortgage, homeowners were projected to realize
14 Dixon Avenue, Suite 202 | Concord, NH 03301 | www.cleanenergynh.org | 603.226.4732

$8,575 in avoided-energy costs in southern New Hampshire and $10,258 in the North.Adoption of modern energy codes and standards will not only provide cost savings forheating, cooling, and lighting for homeowners, but it will help keep New Hampshireeconomically competitive.” If the state were to update the codes to the 2018 or newerversions, residents could see even more savings. Therefore, we encourage NH tocontinue moving forward with the adoption of updated building energy codes to ensurethat new buildings comply with the latest and most efficient standards which will reducethe cost of operating these buildings for decades to come.
References
Fowlie, Meredith. “Gearing Up for Grid Modernization” Energy Institute Blog, UC Berkeley, May 10, 2021,https://energyathaas.wordpress.com/2021/05/10/gearing-up-for-grid-modernization/
St John, 2021,https://www.greentechmedia.com/articles/read/getting-the-rates-right-for-a-public-electric-vehicle-charging-buildout
https://feelgoodheat.org/faqs
https://www.puc.nh.gov/EESE%20Board/Meetings/2019/20191018Mtg/20191018-EESE-Board-Presentation-2020-Statewide-EE-Plan-Update.pdf
https://www.energy.gov/sites/prod/files/2017/11/f39/StateOfCHP-NewHampshire.pdf
14 Dixon Avenue, Suite 202 | Concord, NH 03301 | www.cleanenergynh.org | 603.226.4732

1
CITY OF LEBANON 51 North Park Street
Lebanon, NH 03766
(603) 448-4220
June 25, 2021
Director Jared Chicoine Office of Strategic Initiatives 107 Pleasant Street Johnson Hall, 3rd Floor Concord, NH 03301
RE: Comments on update to NH Energy Strategy
Dear Director Chicoine,
On behalf of the City of Lebanon and its Energy Advisory Committee I offer the following comments on updating the New Hampshire 10-year state energy strategy. The particular focus of these comments is on how state policies can better enable consumer and community choice to harness the power of competitive markets to drive innovation and the most cost-effective energy and climate solutions.1 New Hampshire is somewhat uniquely situated to help drive the development of robust retail and wholesale energy markets that better enables the most cost-effective energy resources to serve our needs, including the full array of distributed energy resources (DERs), while simultaneously supporting accelerated decarbonization of our energy system to enable communities like Lebanon to best meet aggressive climate action goals.
While the City generally associates itself with the comments of the Town of Hanover (filed on 6/22) and those of the Clean Energy New Hampshire filed in May, we may deviate a bit in our focus on enabling a more robust in-state wholesale and retail market for distributed energy resources that reflects and works with the inter-state wholesale electricity market operated by ISO New England. New Hamphsire’s energy strategy might embrace the vision of Shared Integrated Grid, first articulated by the world’s leading electricity research body, the Electric Power Research Institute, supporting by most of the major electric utilities in North America. Prof. Amro Farid of the Thayer School of Engineering at Dartmouth, a volunteer consultant to the City of Lebanon, detailed the case for the shared integrated grid as “the leading industrial concept for New Hampshire to achieve its objectives” in his testimony in DE 19-197 concerning the development of a Statewide Multi-use Online Energy Platform.2
1 Please see the attached “Declaration on Energy Choice & Competition” that argues that “Open, competitive energy markets are an essential component of any policy seeking to mitigate climate change risk through reduced emissions of greenhouse gases. First, because energy innovations simply cannot spread if markets are closed. Second, because there could exist no better incentive for rapid acceleration of energy innovation than the enormous potential offered by vast, growing, open energy markets, ready to adopt and scale up the best innovations. Finally, any policy oriented towards reductions in GHG emissions can only work if markets are open to innovation and transformation, and not impeded by bureaucratic rules and monopoly privileges.” 2 See pages 6-13 in his 8/17/20 testimony found at: https://www.puc.nh.gov/Regulatory/Docketbk/2019/19-197/TESTIMONY/19-197_2020-08-18_LEBANON_LGC_REV_TESTIMONY_FARID.PDF.

2
Dr. Farid also summarized this concept and related it to existing NH constitutional and statutory policy in his testimony on HB 315 as introduced, which is attached to these comments. He summarized the Shared Integrated Grid at page 12 as consisting “of 1) network-enabled distributed energy resources and devices, 2) customer engagement in time-responsive retail electricity services (e.g. real-time pricing), and 3) community-level coordinated exchanges of electricity.” In reviewing this testimony, as it is quite relevant to NH’s energy strategy moving forward, please ignore the specific concerns about HB 315 as introduced on page 3-5, as all of those issues were satisfactorily resolved in the amended language as passed by the House and Senate.
A specific part of this vision that seems particularly consistent with NH’s policy and energy strategy as articulated to date is the further development of retail and intrastate wholesale electricity markets through the concept of Transactive Energy, which can be defined as:
“A system of economic and control mechanisms that allows the dynamic balance of supply and demand across the entire electrical infrastructure using value as a key operational parameter.”3
This is important because supply and demand must constantly be balanced in real time and our electric grid can be expected to become an increasingly important part of our energy system as transportation and space heating (through air and water source heat pumps) are expected to increasingly be provided by electric power in conjunction with shifting them off fossil fuels.
Appropriate price signals, visible to both suppliers and load, are essential to economically efficient price formation. There is a very strong temporal and dynamic aspect of electricity costs. Presently New England has a fairly robust bulk wholesale market administered by ISO-NE, but the 5-minute price signals that are seen by bulk generators and barely visible or translated to retail load. Economics 101 teaches that both supply and demand need to see relevant price signals to achieve optimal price formation and market efficiency.
For example, a very strong marginal price signal at the wholesale level, for transmission services in which embedded costs are recovered based on load’s shares of the single hour of highest demand each month (coincident peak), get turned into a flat per kWh rate the retail level. This is also true with the Forward Capacity Market, where future generation capacity costs are allocated based on load’s share of the single hour of highest demand, yet most load sees this cost as a flat per kWh charge, giving no signal to load (or retail storage), or net metered generation, that there is temporal value to capacity (and energy).
The current state energy strategy points out at page 10:
“The most effective near-term energy management strategy for New Hampshire is to efficiently and fully utilize existing infrastructure. Maximizing infrastructure utilization improves efficiency while helping reduce environmental impacts.”
While this statement is made with respect to transportation, that same can be said for the electricity system. The vast majority of electric costs relate to the capacity of the system to meet peak demand, across generation, transmission, and distribution. New increments of capacity tend to be much more expensive than existing capacity. Asset utilization rates, also known as load factors have tended be decline in New Hampshire and the rest of New England, as peak demand has grown faster than overall load. The result of this is that capacity costs are spread over fewer total kWh resulting in higher costs per
3 From: https://s3.amazonaws.com/2018-transactive-energy-conference/01+TESC+18+GWAC+Foundational.pdf.

3
kWh. Although somewhat dated the following graph (prepared by me) illustrates NH’s load duration curve:
Here is another illustration of the issue4:
If we can reverse this trend and grow price responsive flexible load such as vehicle charging and even cooling and heating loads (through thermal storage) during off-peak times, filling in the valleys such as is
4 From MA Energy Storage Initiative 9/27/16 presentation: https://www.mass.gov/files/documents/2016/09/xd/9-27-16-storage-presentation.pdf.
NH Capacity Factor or Asset Utilization
Rate has declined from 67% for decade
ending 2000 to 57% for decade ending 2015

4
illustrated below, that can significantly help lower the average cost per kWh and support increased cost-effective integration of distributed renewables.
The Rocky Mountain Institute, among others has, has tried to quantify the enormous opportunity and economic value of enabling demand flexibility (a.k.a. demand response)5 as have others. Interval metering, or Advanced Metering Infrastructure (AMI), including enabling near real time customer access to such meter data, is key to enabling these benefits as discussed in Grid Modernization, as are time varying rates that reflect the temporal value of capacity (for T, D & G) and energy.6
As an intervenor in Liberty’s battery storage and TOU rate pilot case, DE 17-189, the City worked closely with Liberty Utilities and the Consumer Advocate to design the 3-part TOU rate that the Commission approved in that case as well as in DE 19-064 for residential EV charging.7 This TOU rate design,
5 See “The Economics of Demand Flexibility: How ‘Flexiwatts’ Creates Quantifiable Value for Customers and the Grid” available at: https://rmi.org/insight/the-economics-of-demand-flexibility-how-flexiwatts-create-quantifiable-value-for-customers-and-the-grid/ 6 See also: “Expanding Customer Choices in a Renewable Energy Future,” Ahmad Faruqui, Principal, and Mariko Geronimo Aydin, Senior Associate, The Brattle Group, in Leadership in Rate Design, A Compendium of Rates Essays, Supplement to Public Power Magazine, May-June, 2019. Available here: https://www.publicpower.org/system/files/documents/Leadership-in-Rate-Design.pdf.
7 The Liberty TOU rate model is described here: Technical Statement Regarding Time-of-Use (TOU) Model, available at: https://www.puc.nh.gov/Regulatory/Docketbk/2017/17-189/LETTERS-MEMOS-TARIFFS/17-189_2018-11-19_GSEC_TECH_STATEMENT_TOU.PDF. The TOU rate model is an Excel spreadsheet with data for each hour of the year for T, G & D rate components. Cost causation is reflected in each of the components. The Regulatory Assistance Project characterized it this way in their recent publication “Rate Designs for Modern Grid, “[t]he Liberty storage pilot rate design accepted by the New Hampshire PUC is the most advanced

5
though not dynamic, is an important step forward in developing meaningful time varying rates that load can respond to.
Another key to delivering appropriate price signals to load and other DERs is for the State Energy Strategy to support retention of maximum state authority and jurisdiction over both retail and within-state wholesale sales of electricity and use that jurisdiction to better enable a shared integrated grid. Pursuant to the Federal Power Act, states have exclusive jurisdiction over retail sales, the electric distribution system serving retail customer and intrastate wholesale sales of electricity, meaning power generated within the state for consumption within the state. As a practical matter that means generation under 5 MW in output capacity, that is connected to the distribution grid, and not registered with ISO-NE as a generator asset. This means that such generation can function as a load reducer relative to ISO-NE energy markets and transmission allocation. This is discussed in more detail in my testimony on SB 91, Part IV, which as passed by the Senate would have accelerated a market based approach to enabling up to 5 MW distributed generation. This is attached to these comment. The final version of the bill instead creates a study commission to consider some the questions raised by that bill. Here are some additional comments I wrote in that regard:
The regulatory gap we are trying to fill with SB 91 Part IV is an important one that ISO New England’s Director of Advanced Technology Solutions, Tongxin Zheng, described in a presentation last summer in the Electric Power Research Institute (EPRI) – Stanford University’s Digital Grid Webinar series. Specifically he calls for development of “local energy markets” for distributed energy resources, regulated by the New England states, but in coordination with ISO-NE interstate wholesale markets for bulk power generation. The slide deck that went with that presentation can be found here: https://www.epri.com/research/sectors/technology/events/6182D0F6-9731-4819-83FD-3A126EEEF613 by clicking on “09-Digital Grid - The Value of Resilience for Customer DERs Panel (August 5, 2020)” Here are a few key quotes transcribed from it below.
• The recording is online here (click on attachments > media > play "Digital Grid - Customer DERs in Wholesale Markets panel").
• Transcribed parts of ISO-NE presentation and the Q&A follow below. • The Q&A mentions Federal / state jurisdiction— and alludes to how Europe is further along in
implementing Distribution System Operator (DSO) frameworks. In NH the electric distribution utilities are the DSOs.
• ISO-NE's presentation walks through the structural limitation of the current approach, reliant upon aggregators bidding DER assets into wholesale markets — which is that dispatch signals from ISO-NE could cause issues on the distribution grid and local congestion that requires "significant adjustment" deviating from the original dispatch instruction, all compounded by a lack of DER visibility and "mismatch between the market model and the physical".
• This leads to the conclusion that the scheme described above requires "proper ISO/DSO/[DER aggregator] coordination" and "can be efficient in the short run" — but to "fully resolve the TSO/DSO coordination issue, local energy markets could be established in the future when a large number of DERs participate in the wholesale markets."
modern rate design in New England, and closest to the Maryland 20 rate designs” that they characterize as one of the most well designed TOU ratesThe Regulatory Assistance Project’s 10/20/2020 policy brief “Time-Varying Rates in New England: Opportunities for Reform” presents a nice overview of the Liberty TOU rate at 7-8 and summary of IR 20-004 at 14. (https://www.raponline.org/knowledge-center/time-varying-rates-in-new-england-opportunities-for-reform/).

6
That suggestion is accompanied by the conceptual schema below:
The slide above begins at 1:11:45 — transcription below:
1:11:45 — Tongxin Jen (ISO-NE): We should have two levels of market structure... the existing wholesale market, and the DSO becomes either a market participant or a market operator for a local energy market. So the DSOs will monitor the distribution system and dispatch [DER aggregators] and also resources connected into their system, and try to resolve any issues in the distribution system — a D-LMP concept. However, the DSO will be coordinating with the ISO, or transacting at the T and D boundary at the LMP.
So in this type of coordination the ISO market will have very few responsibilities... so will not face the complexity created by the DER integration. This concept looks simple, but there are challenges especially from the state and policy perspectives, . . . to fully resolve the DSO / TSO coordination issue, the local energy market should be tackled in the future...
The Q&A that immediately follows is also interesting — excerpts from the first few minutes are transcribed below, where CAISO broadly agrees with ISO-NE and they discuss Federal / state jurisdiction:
• Q: A consistent theme is the need for market evolution and role of market operator as DSO, which we have in Europe but not really in the US. What kind of interventions are necessary in order to establish this role formally in each of these areas?
• 1:15:45 — Jill Powers (CAISO): "I think Tongxin really laid out what the challenge were and it's not just one agency that will be able to resolve this issue... [discusses the scope of coordination and metering necessary to implement DER aggregator model and practical challenges with participation]... absent having all of that in place there is real reluctance to even open up the ability for these types of resources to participate in the market. So it's going to be larger than just the ISO and working in partnership with utilities — it's going to take a lot of regulatory effort

7
at the state level to really put these frameworks into place. As John laid out, we really should be looking at long-term vision. We've tried to move forward incrementally into these participation models, but really we need to get to that long-term vision to really have the direction and roadmap as to what we're going to do to get there."
• 1:18:15 — Tongxin Jen (ISO-NE): "Jill pretty much covered it. For me, I think this is a regulatory issue especially though. If DERs participate in the wholesale market directly, that's FERC jurisdiction. But if you want to set up a local energy market, that actually falls in the hands of the state. . . .
• Q: paraphrased: what is the regulatory innovation you think should happen to achieve this vision?
• 1:21:20 — John Goodin (CAISO): I think the regulatory innovation has to be the ability to capture avoided cost value down at the lower tiers. . . . we need resources that can participate and provide both capacity and energy and capture those values and do that without having to present themselves and integrate with all the complexity in the wholesale markets. So the regulatory hurdle or mechanism is again, how can DR and DER capture avoided cost value, so while they don't have to explicitly earn a capacity payment out of a wholesale market but by their actions, and by reshaping load curve of that customer or in that distribution system under that DSO, that they are reducing the need for peak capacity. . . . So how do these DER entities capture value — for avoiding the need for RA, or avoiding the need for ancillary services by lowering requirements on the system through lower loads, less volatility, lower ramping requirements and ramping energy needs. And I think that's one of the biggest challenges: how to express that value for these providers by allowing them to participate in their tier, avoiding some of these costs, and getting them compensation for doing that — instead of squeezing every tiny little device into the wholesale market. And I think that's the challenge that we face: how to get that value as avoided cost value.
FERC Order 2222, directing wholesale markets like ISO New England’s to enable aggregated DERs to participate in FERC jurisdictional interstate wholesale energy markets, can be seen as a work-around for the fact that DERs and retail load are not enabled by state policy to see the appropriate temporal price signals from ISO-NE. Price-responsive demand (PRD)participating in ISO-NE markets is much the same issue. My comments to the ISO-NE on PRD in 2009 when I was a NH PUC Commissioner are still relevant in this respect.8
8 And can be found at: https://www.iso-ne.com/static-assets/documents/committees/comm_wkgrps/mrkts_comm/mrkts/mtrls/2009/jun9102009/a14b_nh_puc_presentation_06_10_09.ppt. Included with these slides are information about thermal energy storage for air conditioning loads, a commercially viable permanent load shifting technology of potentially enormous value and cost-effectiveness if given access to appropriate price signals. I note that the hottest and highest load days of the summer are also when thermal power plants (steam generators) operate at their lowest efficiency of the year because of the proportionally greater energy loads for air based cooling of condensate. It is also when the line and transformation (of voltage) losses are proportionately greatest due to peak loading of the equipment combined with high ambient temperatures, so least useable kWh per btu combusted. Just moving flexible load to off peak hours in the middle of the night results in significantly greater thermal efficiency of everything, including air conditioning equipment.
The more load that sees appropriate price signals on the cost of peak demand, the more that steep part of the curve get flattened and the pressure on adding capacity (and cost) to meet peak decreases. Roughly 40% of New England summer peak is air conditioning and cooling loads. As the slide deck illustrates there are cost effective commercial technologies available to shift AC loads off peak on a daily basis, but they only make

8
Community Power Aggregation, as enabled by RSA 53-E can play a key role in helping develop the Shared Integrated Grid and market based approaches to cost-effective integration of DERs.
New Hampshire does not appear to have benefitted as much from its electric utility restructuring as other states, as seen in this chart developed by the from the Retail Energy Supply Association:
The current state of the NH retail electricity market is evaluated in the testimony of Samuel Golding of Community Choice Partners in DE 17-179.9
A couple of recent studies find that DERs can be cybersecure, cost-effective and improve the reliability and reliance of our electric grid while helping accelerate decarbonization of the Grid.10
economic sense if the underlying cost causation can “seen” or the value recognized in retail rate. A prime example of this is the fact that larger C&I customers have demand charges that are the same whether the demand is in the middle of the night (such as to make ice for thermal storage for AC loads) vs. at coincident peak, so there is no financial reason to shift facility (of vehicle charging) peak demand off-peak, where it might be feasible if distribution demand charges and transmission charges where based on share of coincident peaks. The current rate regime is like saying all airline flights most be the same price regardless of whether on-peak or off-peak, resulting low load factors (asset utilization rates) and the need to build a bunch of extra capacity (# of airplanes and terminal size) just to meet high peak demand with no price differential. 9 See current state of retail market competition in New Hampshire starting at p. 11 of his testimony found here: https://www.puc.nh.gov/Regulatory/Docketbk/2019/19-197/TESTIMONY/19-197_2020-08-18_LEBANON_LGC_REV_TESTIMONY_GOLDING.PDF 10 See WHY LOCAL SOLAR FOR ALL COSTS LESS: A NEW ROADMAP FOR THE LOWEST COST GRID at https://www.vibrantcleanenergy.com/wp-content/uploads/2020/12/WhyDERs_ES_Final.pdf and
D. J. Thompson, W. C. H. Schoonenberg and A. M. Farid, "A Hetero-Functional Graph Resilience
Analysis of the Future American Electric Power System," in IEEE Access, vol. 9, pp. 68837-68848, 2021,
doi: 10.1109/ACCESS.2021.3077856. Available at https://ieeexplore.ieee.org/document/9423995.

9
Some additional suggestions follow for ways that NH could take State action to position NH ratepayers strategically for the coming transition to a more sustainable energy system:
1. Offshore Wind. The development and “capture” of offshore wind power should be prioritized. The coastal waters of NH and ME have some of the highest potential for offshore wind of any place on earth. The levelized cost of offshore wind is already the lowest of any energy source in your Figure 2.4, from Lazard, on page 25, and it is projected to lead the growth in renewables generation in the Northeast. https://www.eia.gov/outlooks/aeo/pdf/AEO2020 Full Report.pdf (page 79). Significant contributions of green offshore wind power could decrease the cost of electricity in NH. But without policy intervention it is likely that NH offshore wind power will be developed based on power purchase agreements from out-of-state businesses and other entities, even foreign, anxious to meet their renewable energy quotas, and much of the benefit may flow out-of- state. The Strategy should enable NH entities, including competitive electricity suppliers and community power aggregations, and retail customers, such as businesses with clean energy or sustainability goals, through their load serving entity, to contract for wind power generated off NH shores. A second issue is jobs. Offshore wind construction and operation could provide good paying jobs in NH over decades but may not do so unless NH mandates labor standards. These could be included in power purchase agreements from NH. This has been achieved in some offshore wind projects, such as Block Island Wind Farm, but Vineyard Wind is using the cheapest global labor.
2. Distributed Energy Resources. As the Strategy cites on page 36, distributed generation (DG) “brings opportunities and the possibility of designing an electric grid that meets New Hampshire’s needs moving deeper into the 21st century.” Large scale DG could contribute to both a more renewable and less expensive electricity generation fuel mix. Right now solar photovoltaic generation is competitive in price with natural gas combined-cycle. https://www.eia.gov/outlooks/aeo/pdf/AEO2020 Full Report.pdf (page 75). But the problems with DG are not limited to those mentioned in the Strategy of adequately valuing the power. The best valuation not with fixed forward price contracts, but by using block chain technology to attribute the market worth of the power at the time it is generated. Other important attributes of power that DG can deliver, such as frequency, voltage control and reactive power, can also be valued. “Time Of Use” valuation should be regulated by the PUC because it encourages DG to incorporate storage and deliver to the grid during evening peak use hours. A bigger difficulty is that DG is a new universe for utilities, and unless forced by the PUC, utilities will not develop their ability to incorporate DG effectively into their distribution networks. It is both a theoretical and practical problem that utilities don’t know what will happen when their distribution substations are back fed with significant and intermittent power. The markets cannot solve this public utilities problem, and the utilities will have to be forced to address it. An example is that the landfill gas to electricity program at the Lebanon landfill, which has the potential to supply all the electricity needs of the City from renewable sources, has been held up for a year in negotiation with the utility over what interconnection fee will cover substation modification..
3. Community Solar. Community Solar is a component of DG that could contribute modestly to NH load reduction but is made impossibly difficult because of the perception that reimbursement for the excess power generated is set too high and is subsidized by other ratepayers. This problem could be alleviated if the PUC required utilities to offer smart meters and Time Of Use rates and reimbursement. This would encourage storage and make these small producers function more effectively as load reducers. In addition, Time of Use rates can save all ratepayers small amounts. But protections would have to be in place against the huge overbilling that occurred in Texas. With equitable valuation of community solar, net metering caps should be raised. Even if the levelized cost of the power produced is high, the payback is adequate for people concerned about the environment who have the funds to invest.

10
4. Municipal Aggregation. Because of enlightened legislative action enabling municipal aggregation, NH is growing a market driven means of grid innovation which does not really need further State policy support, but should be mentioned in the Strategy because it can directly address some of the policy concerns of the Strategy. It is anticipated that through strategic procurement of power for multiple municipalities by the Community Power Coalition of NH, the base electricity rate can be (modestly but significantly) lowered for members, and rates can be stabilized over time. At the same time as saving customers money, they can be provided with greener electricity, for which there is a pent-up consumer demand. Both of these have elective ratepayer support. Typically, aggregations include a higher percentage of renewable power in their base, or default, rate than utilities are required to. And they offer options for customers to choose percentages of green power up to 100%. In Massachusetts, “Current municipal aggregation programs offering 1%, 5%, 20% and 25% additional Class I RECs above the Massachusetts RPS requirements were all providing rates below the Basic Service Rates. Of the programs which offered 50% or 100% Class I REC “green-up” options in May 2018, approximately half were offering a lower rate than Basic Service.” https://ag.umass.edu/sites/ag.umass.edu/files/pdf-doc-ppt/cca_survey_report_final.pdf
And in NH this will not be “green” power offset by purchased RECs, but through actual power purchase agreements for renewable generation.
In California, aggregated municipal agencies have the purchasing power to contract for the development of offshore wind. The Community Power Coalition of NH may have more aggregated load than some public utilities and may be able to enable offshore wind power through power purchase agreements. It certainly will be able to support smaller DG and Community Solar, by providing enhanced contracts for the power, thus alleviating concern about the broader ratepayer community supporting DG. Finally, municipal aggregation can develop programs leading to grid modernization, such as opt-in Time of Use rates (although customers need to be protected against the debacle that happened in Texas), smart metering, piloting of demand response equipment and incentives, moving toward the grid modernization goal of the Strategy.
5. Energy Efficiency. As the Strategy states on page 40, “Energy efficiency (EE) is the cheapest and cleanest energy resource.” The NHDES Climate Action Plan says that reduction in existing residential energy use gives both the biggest economic benefit and most reduction in emissions of any strategy. https://www.nh.gov/osi/energy/programs/documents/sb191-2013-12-17climate-action-plan.pdf (slide 13).
NHSaves funding should be increased, as was agreed upon between utilities and the PUC for the NH Energy Efficiency Resource Standard 2021-2023 Triennial Plan before opposition placed that decision on hold. Although it utilizes an imperfect funding mechanism, as the Strategy states, NHSaves expenditures are rigorously linked to energy reduction. In the Upper Valley area, Weatherization campaigns have shown that there are far more residential applicants for NHSaves funding than there are funds to disburse. Additionally, Liberty Utilities’ business electrical efficiency program in the Upper Valley has afforded significant savings to businesses, many municipalities, schools and nonprofits, such as low income housing providers and day care centers. Decreases in their energy use result in decreased operating budgets.
Opponents have argued that the Systems Benefit charge which supports NHSaves programs is a tax without respite imposed on all ratepayers for the few beneficiaries. In reply it can be argued that the inequity to residential and small business ratepayers is small, literally pennies, and there is some return to all ratepayers in the savings to municipal and school budgets, as well as in climate benefits. Furthermore, there is not a better program to support. Making the payments completely voluntary would not allow the multi-year planning that underpins NHSaves.

11
More of the RGGI proceeds should be committed to home energy efficiency, and this could alleviate the reliance on the systems benefit charge.
Additional Funding should be found for Community Action Weatherization of low income housing,a very effective but funding-limited program. Increasing NHSaves funding would accomplish this.
The most recent and energy stringent building codes should be adopted. Regulations are imposed for clear public good, such as fire safety. Increasing thermal efficiency and decreasing CO2 emissions counts as a public good. It makes no sense whatever to allow building stock to be added which will become a public liability throughout its full life span.
The State of New Hampshire should make energy efficiency a priority in its own buildings, leading by example and saving taxpayer money. Municipal governments throughout the state are doing this and the State should as well. The payback for many measures can be as little as a few years.
6. Natural Gas. Increased use of natural gas and new natural gas infrastructure should not be promoted as a State policy priority. Natural gas has been widely touted as “good for the environment”, and a bridge fuel in the transition to a primarily renewable future because it gives off less CO2 per unit of heat produced than other fossil fuels. But the environmental benefit of less CO2 emitted when burned is overwhelmed by the unacknowledged direct negative warming impact of the small percentage of methane gas which leaks unburned into the atmosphere during fracking, condensation, from pipelines and from distribution networks. Methane has up to 86 times the greenhouse warming effect as CO2 in the 20 year term. Because of this leakage, natural gas is may be worst possible fossil fuel to burn for heat, perhaps even than coal. Increasing realization that it will be impossible to limit global temperature rise without curtailing natural gas use is likely to lead to regulatory constraints, perhaps even factoring the cost of the “externality” of leaked gas into the price.
Utilities, in seeking to demonstrate the “need” for new natural gas infrastructure, have routinely vastly overstated future consumer demand for natural gas. The PUC found that the Granite Bridge application had inflated “need” in its attempt to claim that a new pipeline would be the most cost effective way of serving customers. In Lebanon, the PUC granted Liberty Utilities a license in 2018 to construct a storage depot and a stand alone distribution system, but with the stipulation that before commencing construction it must demonstrate enough customers. When it had been unable to secure the required customer support by 2020 the PUC withdrew the license. In both cases, the utility was saved from a bad business decision which would have saddled its ratepayers with a stranded asset.
Consumer demand for natural gas is likely to decrease for two reasons. Environmental concern is growing, as natural gas fracking poisons aquifers and releases a greenhouse gas many times more potent than CO2. And the price of natural gas, historically low, may increase as increasing portions of a limited domestic supply are used for manufacturing (primarily plastics) and are aggressively marketed to Europe and Asia. https://www.eia.gov/outlooks/aeo/pdf/03 AEO2021 Natural gas.pdf (pp. 3 and 8) https://primexbt.com/blog/natural-gas-price-prediction-forecast/ Consumers who invest in new natural gas furnaces will then be trapped, subjected to energy cost increases passed along by the supplier, and unable to shop around for alternative pricing because a public utility has a monopoly.
7. Include a Greenhouse Gas Reduction Goal. Because it fails to embrace the current New Hampshire adopted goal of 20% reduction in greenhouse gas emission below 1990 levels by 2025 and an 80% reduction by 2050, the Strategy appears to back away from making any commitment at all to carbon reduction, in favor of letting the market run its course. But this is equivalent to climate denial.

12
Since the adoption of this Strategy there has been widespread experience of the immediacy of climate change and its associated costs: Rampant wildfires, drought, floods, deaths from heat waves, hurricanes, crop failures, explosion of pests. Although New Hampshire is favorably positioned to avoid the worst climate change scourges, already prudent and expensive mitigation actions must be taken at the municipal level (placing further burden on local taxpayers), such as upgrading culverts on critical roads to protect against micro-bursts. Other political jurisdictions at every level are responding to the criticality of climate change by bringing forward their carbon reduction goals, as in aiming for net zero by 2050, or even 2030. House Bill 172 proposes such a goal change for New Hampshire. But valuing the interests of the fossil fuel industry over those of citizens still seems politically viable.
Meanwhile, the markets are beginning to signal that the risks of continued reliance on fossil fuel are too great to bear. Blackrock and other financial giants are counseling divestment from oil production and infrastructure. Oil companies have huge unfunded liabilities for capping spent wells. There are intimations that oil companies may begin to be held liable for the climate consequences of their product. The recent Dutch court decision against Shell was based on the concept of “duty of care”, the failure of the company directors to make prudent decisions in good faith. There are approximately 1400 such cases pending in the United States. http://climatecasechart.com/climate-change-litigation/about/?utm_source=newsletter&utm_medium=email&utm_campaign=greenbuzz&utm_content=2021-06-01&mkt_tok=MjExLU5KWS0xNjUAAAF9ZqTiZrG_6rSfXdynjVVEV8R4tpqt1mTN0z4bx_pM4S-WaynRg7WSuO-Vyz804JZpnf5PP5TKjLekRTBr1rYC0pCCZfCib6snyQl9Q_Xo0Ijb6VM It is possible that over the span of the next Strategy the fossil fuel industry will be held liable for, like the cigarette industry, knowingly purveying a toxic product. Carbon pricing seems politically controversal in the United States, but a cash-back approach has gained 59 co-sponsors in Congress ( http://energyinnovationact.org/). Even if carbon pricing is not instituted in this country, the EU has decided to impose Border Carbon Adjustments in 2023 on imports from the US, and Canada, another big trading partner, is considering the same. While some NH economic functions may not have an alternative to relying on fossil fuel in the near term, it is not prudent to fail to strategize an “escape” route” for most NH residents and businesses if and when the cost of fossil fuel spikes.
Businesses are setting their own sustainability goals. It may be that a disorganized state energy policy which fails to plan for the coming transition and creates uncertainty and risk, will be more of an impediment to a business locating in New Hampshire than high electricity costs, particularly in comparison to neighboring states. The developer of a large office and research park in Lebanon approached the City Municipal Aggregation Committee saying; “My tenants are going to expect the highest standard of environmental construction and will demand 100% renewable electricity.” Hopefully environmentally conscious businesses in NH will make their wishes weigh in on an upcoming new Strategic plan.
8. The Cost of Inaction. One of the costs of inaction is higher electric bills for NH residents. Neighboring states have reduced their electricity consumption at peak times while NH peak usage has continued to grow. The capacity charge portion of every NH rate payer for a year is calculated by the share of peak use on the one peak use day, which is increasing. The unnecessary increase in capacity charge because of this inaction will probably be greater than the contested systems benefit charge.
In considering the cost effectiveness of energy policies and the levelized cost of energy production, the Strategy ignores the “externalized” health and social costs of continued fossil fuel use. Similarly, by not joining the CAFE standard, NH dealerships to not receive the best high fuel-efficiency and electric cars to sell in NH, since manufacturers only sell in states where they will receive credit for the sale.

13
Some other “hidden” costs of inaction are health and social costs and projected decreases in NH important tourist economy:
• Air pollution. Air pollution is estimated to have cost NH residents and businesses over $3 billion per year in health care costs and lost productivity between 2013 and 2015, according to the State of New Hampshire Air Quality - 2017: Air Pollution Trends, Effects and Regulation, 2018. The same publication says: “When air is cleaner, fewer visits to doctors and hospitals lead to reduced health care costs and fewer employee sick days lead to increased productivity. Further, a cleaner and healthier environment can translate into an improved tourist experience, which can boost the local economy.”
• Heat Stress. Those with respiratory illness, seniors and children, low income or chronically ill people can expect more than 20 days of temperatures over 100 degrees, according to the NH Climate Action Plan 2009 ( https://www.des.nh.gov/sites/g/files/ehbemt341/files/documents/r-ard-09-1.pdf ).
• Increased tick and mosquito borne illnesses.
• ( https://www.des.nh.gov/sites/g/files/ehbemt341/files/documents/r-ard-09-1.pdf ).
• Increased foodborne illness In Climate Change and Human Health in New Hampshire: An Impact Assessment; Sustainability Institute, 2014 https://www.dhhs.nh.gov/dphs/climate/documents/climate-change-human-health.pdf.
• Rise in waterborne illnesses (ibid),
• More chronic disease from reduced outdoor activity (ibid), and
• Negative impacts on mental health (ibid)
A report for Massachusetts determined that the public health benefits gained would more than offset the cost of investing in initiatives to mitigate climate change. Investing in a Better Massachusetts: An Analysis of Job Creation and Community Benefits from Green Investments, 2021 (https://climate-xchange.org/wp-content/uploads/2018/08/Investing-in-a-Better-Massachusetts-An-Analysis-of-Job-Creation-and-Community-Benefits-from-Green-Investments_website.pdf).
The 2019-2023 NH Statewide Comprehensive Outdoor Recreation Plan from the NH Department of Natural & Cultural Resources lists the following Potential Climate Change Impacts on New Hampshire income from tourism and recreation, on pages 35-36:
• Foliage Dulling (a $292 million annual economy)
• Ecological collapse of beech, maple and hemlock trees
• 25% to75% decrease in forest vegetation due to wildfires and pests
• Sea level rise of from 10-20 inches and coastal storms affect coastal tourism (a $484 million economy)
• 50% to 100% eradication of trout affects freshwater fishing ($150 million)
• 10% to20% reduction in the ski season (a $42-$84 million annual loss)
• Extreme storm damage to recreational trails.

14
Thank you for your attention to this complex and challenging matter and I appreciate your volunteer service as a legislator, however you vote on this bill. Please do not hesitate to be touch if you have any questions or ideas to share.
Yours truly,
Clifton Below Assistant Mayor, Lebanon City Council [email protected]
ATTACHMENTS TO CITY OF LEBANON COMMENTS ON
NH STATE ENERGY STRATEGY
Attachment A – Civil Society Declaration on Energy Choice & Competition 1
Attachment B – Testimony of Amro Farid on HB 315 4
Attachment C – City of Lebanon testimony for SB 91

The Declaration on Energy Choice & Competition A Civil Society Call for all Leaders of Governments, States &
Nations to Remove Barriers to Affordable, Reliable & Clean Energy
We, members of civil society and representatives of civil society organizations from across the world, first gathering in New York City – the site of Thomas Edison’s first electrical lighting system and commercial-scale power plant – now join together with all present and future signatories, to call upon all leaders of governments, states and nations to undertake practical policy reforms that will improve the lives of billions of people by removing barriers to access to affordable, reliable, clean energy.† In support of this declaration, we offer these simple observations:
Clean Energy Saves Lives – Improving access to affordable, reliable, clean energy would save millions of lives every year. Over 2.5 billion people currently live in dwellings that use dirty fuels—such as wood, dung, coal and kerosene—for cooking, heat and light.[1] As a result, each year, around 2.7 million people, the majority of them women, die as a result of indoor air pollution caused by these dirty fuels. Another 4 million people die from outdoor air pollution caused in part by the use of dirty fuels in power generation and transportation.[2] In addition, energy is essential to the production and distribution of clean water, which is important not least because dirty water causes about 800,000 deaths each year.[3]
Reliable, Inexpensive Energy Promotes Economic Development – Access to increasingly reliable and efficient sources of energy has been a key driver of economic development.[4] Given its importance as a factor of production, expensive energy drives up costs, undermines competitiveness and reduces the amount of capital available for investment in innovation. Modern economies need affordable, reliable energy—especially electricity—for everything from basic industrial production to communications to air conditioning. Yet, over 800 million people currently have no access to electricity and many more lack access to reliable electricity.[5] This impedes, and may prevent, economic development.
Reliable, Inexpensive Energy Eases Adaptation to Climate-Related Problems – Most of the problems associated with climate change, such as access to adequate nutrition, clean water and sanitation, vector-borne diseases, natural disasters, and direct harms from heat, are problems today. Many can be reduced—and maybe even eliminated—through the use of technologies that rely on access to clean, reliable, affordable energy.[6].
Innovative, Reliable, Affordable, Low-Emission Energy and Affordable Energy-Efficient Products are Essential for Cost Effective Greenhouse Gas Emission Reductions – While GHG emissions have fallen in some nations, global emissions continue to rise. For GHG emission reductions to become politically and economically realistic for the world as a whole, barriers to the adoption of existing affordable, lower-carbon technologies and affordable energy efficient products

must be removed. Breakthrough energy innovation could also improve affordability, reliability, access, and safety, with economic, environmental and health benefits.
Access to Improved Clean, Reliable, Affordable Energy is Best Achieved by Maximizing Choice and Competition – Choice and competition drive innovation, as producers strive to deliver better quality goods and services to consumers at lower prices. In seeking to lower costs of production, to remain competitive and sell more goods, producers reduce the use of inputs. In the case of energy, this increase in productive efficiency leads to reduced use of fuel and lower emissions per unit of output. Over time, this dynamic has driven a trend towards lower carbon emissions per unit of output.[7] This trend is greater in competitive power markets, such as those in Chile, Texas, Sweden, Norway and Finland, which have more affordable energy than many monopoly markets.[8] They also generally have high market share for low- and zero-emission power.[9]
Open, competitive energy markets are an essential component of any policy seeking to mitigate climate change risk through reduced emissions of greenhouse gases. First, because energy innovations simply cannot spread if markets are closed. Second, because there could exist no better incentive for rapid acceleration of energy innovation than the enormous potential offered by vast, growing, open energy markets, ready to adopt and scale up the best innovations. Finally, any policy oriented towards reductions in GHG emissions can only work if markets are open to innovation and transformation, and not impeded by bureaucratic rules and monopoly privileges.
Barriers to Choice and Competition in Energy Generation and Distribution are Contrary to our Human Rights – Article 3 of the Universal Declaration of Human Rights states that “Everyone has the right to life, liberty and security of person.” While Article 7 states, inter alia, that “All are equal before the law and are entitled without any discrimination to equal protection of the law.” And Article 27 states that “Everyone has the right freely… to share in scientific advancement and its benefits.”
Taken together, these rights entail that each person has the right to protect their life from harms that might arise, such as those associated with pollution, contaminated water, disease and climate change – and to do so using whatever technologies they choose, so long as their action does not interfere with the like rights of others.
Therefore, we can conclude from the UN Universal Declaration of Human Rights, that everyone derives a right to produce, buy, trade or use the energy of their choice, and products using the energy technology of their choice, so long as doing so is reasonably clean and safe and does not infringe on the rights of others.
Yet today, billions of people are very much impeded in their ability to use and avail of modern energy technologies that would enable them better to protect their lives (to say nothing of improving those lives). Moreover, they are impeded through actions that are blatantly discriminatory, often through state preferences for energy technologies and companies and through various state-imposed restrictions on access to technologies and arrangements (such as micro-grids) that would better enable individuals to protect themselves.

Local Efforts to Advance Energy Choice and Competition will be Aided Greatly if Local, State & National Leaders Unite in Commitment to Such Energy Market Freedoms.
Thus, observing that:
1. Whereas access to clean, reliable, affordable energy is essential for human flourishing -- and to enable more effective mitigation of and adaptation to climate risks.
2. Whereas choice and competition empower and broaden access to clean, reliable, affordable energy.
3. Whereas choice and competition in energy generation, transmission and distribution are necessary for full protection of our human rights.
We hereby do DECLARE that:
In order to improve access to clean, reliable, affordable energy for all, and thereby reduce harmful air pollution, improve access to clean water and sanitation, reduce disease, improve productivity, and enable more rapid innovation and economic development, as well as more rapid and effective mitigation of and adaptation to diverse climate change risks, we now call upon leaders of all governments, states and nations to commit substantially to reduce, within and between nations, not only government-sanctioned barriers to choice and competition in energy markets, but also similar barriers to cleaner and more efficient products and energy innovations.
First Signed and So Declared, in Council on November 5, 2019, and Then Thereafter, by:
Footnotes:
† The signatories to this Declaration represent a diverse set of individuals and groups. In signing this Declaration, signatories imply neither assent nor dissent with respect to statements or actions of other signatories. Signatories may also submit separate and independent-minded commentary on the Declaration and issues discussed herein.
[1] https://www.iea.org/sdg/cooking/
[2] https://www.who.int/airpollution/en/
[3] https://www.who.int/news-room/fact-sheets/detail/drinking-water
[4] https://papers.ssrn.com/sol3/papers.cfm?abstract_id=1878863; http://vaclavsmil.com/wp-content/uploads/docs/smil-articles-science-energy-ethics-civilization.pdf
[5] https://www.iea.org/sdg/electricity/
[6] https://www.researchgate.net/publication/242088799_Which_Policy_to_Address_Climate_Change
[7] https://kk.org/extrapolations/energy-mix-overall-consumption-prices-emissions/
[8]http://regulationbodyofknowledge.org/wp-content/uploads/2013/03/OECDIEA_Competition_in_Electricity.pdf; https://www.researchgate.net/publication/222532951_Why_has_the_Nordic_electricity_market_worked_so_well; https://www.iea.org/publications/freepublications/publication/EnergyPoliciesBeyondIEACountriesChile2018Review.pdf [9] https://www.ei.se/PageFiles/310277/Ei_R2017_06.pdf; https://thehill.com/opinion/energy-environment/457353-deregulated-energy-markets-made-texas-a-clean-energy-giant; Studies comparing monopoly to competitive power markets also bear this out. Competitive US state markets have delivered faster decarbonization at a lower cost, compared to monopoly markets since 1997. See: https://www.resausa.org/phil-oconnor-thought-leadership

Prof . Amro M. Far id Test imony on HB315 2/19/2021
14 Engineer ing Drive Hanover , NH 03755 ht tp : / /engineer ing.dar tmouth.edu/ l i ines
LABORATORY FOR INTELLIGENTINTEGRATED NETWORKSOF ENGINEERING SYSTEMSEMPOWERING YOUR NETWORK
LABORATORY FOR INTELLIGENTINTEGRATED NETWORKSOF ENGINEERING SYSTEMSEMPOWERING YOUR NETWORK
LABORATORY FOR INTELLIGENTINTEGRATED NETWORKSOF ENGINEERING SYSTEMSEMPOWERING YOUR NETWORK
1
Prof. Amro M. Farid Associate Professor of Engineering Thayer School of Engineering at Dartmouth 14 Engineering Drive Hanover, NH 03755 February 19, 2021 Hon.Michael Vose Chair, Science, Technology & Energy Committee New Hampshire House RE: HB315, relative to the aggregation of electric customers Dear Rep. Vose & Members of the NH House Science, Technology & Energy Committee, I write to you to express and explain my strong opposition to HB 315 as introduced. By way of introduction, my name is Dr. Amro M. Farid.
• I’m a resident of Lyme, NH an an Eversource customer. • I’m an American citizen and vote regularly. • I am an Associate Professor of Engineering at the Thayer School of Engineering at
Dartmouth1 and an Adjunct Associate Professor of Computer Science at the Department of Computer Science at Dartmouth College. My office is located at 14 Engineering Drive, Hanover, NH. I have taught power systems engineering at the graduate level since 2010.
• I maintain a research expertise in intelligent multi-energy engineering systems which includes power systems engineering, economics, and policy. I have published over 140 peer-reviewed publications in these areas and have been externally funded by ISO New England, the Electric Power Research Institute, the Department of Energy, the Department of Defense, the National Science Founcation, and Mitsubishi Heavy Industries. I have been invited to speak on energy related issues by the International Energy Agency, Hydro-Quebec, the Australian Energy Market Operator, Great River Hydro, the Energy Systems Integration Group, several national laboratories, and a number of prominent universities including MIT, Harvard, Princeton, Stanford and UC Berkeley.
• I am also the Chief Executive Officer of Engineering Systems Analytics (ESA) LLC which is located in Lyme, NH. ESA produces the EPECS (Electric Power Enterprise Control System) Simulation Software that ISO New England uses to conduct its annual renewable energy, energy storage, and demand-side resource integration studies.
• I am the Chair of the IEEE Smart Cities Research & Technical Development Committee2, Chair of the IEEE Smart Buildings Load and Customers Architecture Subcommitte3 which
1 https://engineering.dartmouth.edu/people/faculty/amro-farid 2 https://smartcities.ieee.org/about/ieee-smart-cities-committees 3 https://site.ieee.org/pes-sblc/subcommittees/

Prof . Amro M. Far id Test imony on HB315 2/19/2021
14 Engineer ing Drive Hanover , NH 03755 ht tp : / /engineer ing.dar tmouth.edu/ l i ines
LABORATORY FOR INTELLIGENTINTEGRATED NETWORKSOF ENGINEERING SYSTEMSEMPOWERING YOUR NETWORK
LABORATORY FOR INTELLIGENTINTEGRATED NETWORKSOF ENGINEERING SYSTEMSEMPOWERING YOUR NETWORK
LABORATORY FOR INTELLIGENTINTEGRATED NETWORKSOF ENGINEERING SYSTEMSEMPOWERING YOUR NETWORK
2
oversees the IEEE’s standard for Blockchain in Energy4 and Co-Chair of the IEEE Systems, Man & Cybernetics Technical Committee on Intelligent Industrial Systems5.
• I am a senior member of the IEEE and a member of the ASME and INCOSE. • I received bachelors and masters degrees in mechanical engineering from MIT and a
doctoral degree in engineering from the University of Cambridge, UK. • I have won a Certificate of Merit for exceptional community service from the United States
Congress. In brief, RSA 53-E, as currently enacted, is a very good law that demonstrates effective bipartisan compromise.
1. It emphasizes economic benefits through market competition. 2. It emphasizes New Hampshire’s long-term prosperity through systemic innovation. 3. Its implementation is technically feasible using today’s technology. 4. It does not compromise reliable and secure grid operation. 5. It opens the door to a Shared Integrated Grid that can deliver quantifiable synergistic
benefits through real-time pricing transactive energy mechanisms. Like all good laws, it is not without points for improvement. However, we cannot make the perfect be the enemy of the very good; especially when the proposed HB315 is vastly inferior in all five respects outlined above. The remainder of my testimony elaborates on these five points. I. HB315 Inhibits Market Competition
My opposition to HB315 stems from the degree to which it appears entirely inconsistent with the spirit of market competition engrained in New Hampshire’s laws; including its constitution, RSA 374-F and RSA 53:E. The NH Constitution at Part II, Article 83 limits and regulates the power of monopolies:
“. . . all just power possessed by the state is hereby granted to the general court to
enact laws to prevent the operations within the state of all persons and associations, and all trusts and corporations, foreign or domestic, and the officers thereof, who
endeavor to raise the price of any article of commerce or to destroy free and fair competition in the trades and industries through combination, conspiracy,
monopoly, or any other unfair means; [and] to control and regulate the acts of all
such” entities.
As I elaborate later, the language of HB315 does not support the stated purpose of RSA:53:E and instead dilutes its legislative effect. The original purpose of RSA 53:E is stated below:
“The general court finds it to be in the public interest to allow municipalities to
aggregate retail electric customers, as necessary, to provide such customers access
to competitive markets for supplies of electricity and related energy services. The
general court finds that aggregation may provide small customers with similar
4 https://standards.ieee.org/project/2418_5.html 5 https://sites.google.com/view/ieee-smc-tc-iis/

Prof . Amro M. Far id Test imony on HB315 2/19/2021
14 Engineer ing Drive Hanover , NH 03755 ht tp : / /engineer ing.dar tmouth.edu/ l i ines
LABORATORY FOR INTELLIGENTINTEGRATED NETWORKSOF ENGINEERING SYSTEMSEMPOWERING YOUR NETWORK
LABORATORY FOR INTELLIGENTINTEGRATED NETWORKSOF ENGINEERING SYSTEMSEMPOWERING YOUR NETWORK
LABORATORY FOR INTELLIGENTINTEGRATED NETWORKSOF ENGINEERING SYSTEMSEMPOWERING YOUR NETWORK
3
opportunities to those available to larger customers in obtaining lower electric costs, reliable service, and secure energy supplies. The purpose of aggregation
shall be to encourage voluntary, cost effective and innovative solutions to local needs with careful consideration of local conditions and opportunities.”
Furthermore RSA 374-F states:
“ The most compelling reason to restructure the New Hampshire electric utility
industry is to reduce costs for all consumers of electricity by harnessing the power of competitive markets. The overall public policy goal of restructuring is to develop
a more efficient industry structure and regulatory framework that results in a more productive economy by reducing costs to consumers while maintaining safe and
reliable electric service with minimum adverse impacts on the environment. Increased customer choice and the development of competitive markets for
wholesale and retail electricity services are key elements in a restructured industry that will require unbundling of prices and services and at least functional
separation of centralized generation services from transmission and distribution services. …Competitive markets should provide electricity suppliers with incentives
to operate efficiently and cleanly, open markets for new and improved technologies, provide electricity buyers and sellers with appropriate price signals, and improve
public confidence in the electric utility industry.” These legal clauses provide motivation for supporting and developing competitive markets in New Hampshire. Therefore, my first and primary critique of HB315 is that it inhibits market competition. To elaborate, I refer to Attachment A in the testimony provided by Assistant City Mayor of Lebanon Clifton Below.
p.1, §1, lines 1-4; A1 (p.1, lines 14 & 31) strikes the words “provide” and “electric power supply” from the definition of aggregation. Community Power Aggregators (CPAs) are likely to have within their jurisdiction distributed generation assests that do not qualify for direct participation in the wholesale ISO New England market. These may be conventionally-fired municipal generation assets or solar photovoltaic generation assets. Similarly, as CPAs become more sophisticated in their provision of electricity supply, they may develop the capacity to use their municipal load-consuming assets as “virtual power plants” that provide kilo-watt-hour (kWh) equivalent electric power supply. Although these electricity supply options are likely to be very cost effective on a kWh basis, HB315 seeks to prohibit these scenarios rather than enhance market competition through an expanded supply portfolio.
p.1, §3, lines 9-20; A3 (p.1, lines 31-36) prohibits CPAs from providing any demand side management, conservation, or energy efficiency service that are not directly administered through a distribution utility or regional system operator. This statement should strike any neutral observer as 1.) limiting the services that a CPA can provide and 2.) making them perpertually subservient to distribution utilities; both to the detriment of electricity market competition and the stated purpose of RSA 53:E. From a common sense perspective, electricity customers do not need permission from grid operators to turn off their own lights when they leave a room, or turn down

Prof . Amro M. Far id Test imony on HB315 2/19/2021
14 Engineer ing Drive Hanover , NH 03755 ht tp : / /engineer ing.dar tmouth.edu/ l i ines
LABORATORY FOR INTELLIGENTINTEGRATED NETWORKSOF ENGINEERING SYSTEMSEMPOWERING YOUR NETWORK
LABORATORY FOR INTELLIGENTINTEGRATED NETWORKSOF ENGINEERING SYSTEMSEMPOWERING YOUR NETWORK
LABORATORY FOR INTELLIGENTINTEGRATED NETWORKSOF ENGINEERING SYSTEMSEMPOWERING YOUR NETWORK
4
their heat pumps before they go to sleep, so why do CPAs need permission to help customers make these decisions? Furthermore, none of these services are natural monopoly functions nor do they pose a plausible risk to grid operation and in my opinion are sufficient reason to oppose HB315. p.1, §3, lines 16-17; A4-A6 (p.1, lines 37-39), similarly, prohibits CPA from meter reading, customer service, and other energy related services. Again, it is difficult to understand how the authors of HB315 seek to achieve greater market competition with limited service offerings. It is well-established in energy economics that market competition grows with more service offerings rather than less. Again, an ordinary electricity customer can go on Amazon.com today and purchase a revenue-grade energy meter and hire a qualified electrician to install it in their electrical panel. So why is it that a CPA can not provide the same product? Or bundle data-centric services with the energy-meter product? It is no secret that many of New Hampshire’s investor owned utilities have not invested in “smart meters” (e.g. AMI) that provide a value of electric power consumed as a function of time. In my case, as an Eversource rate payer, I have had to invest several hundred dollars of my own money to buy such an energy meter. Had their been a CPA in Lyme, I would have entertained a meter-reading service from a CPA as a means of making informed real-time decisions about my energy consumption as I now do with my own off-the-shelf energy monitor. Such a meter-reading service would have been even more attractive if the CPA bundled it in with their electricity supply service and not forced to me to buy it out-of-pocket as I have had to do as an existing Eversource customer. This example is exactly the type of real-life market competition that our electric grid needs and that RSA 53:E purposefully intends. p.1, §3, lines 16-17; A4-A6 (p.1, lines 37-39), also prohibits “customer service” and “other related services”. Speaking as a small business owner, I’d like to kindly ask the authors of HB315 to go up to any small-business-owner in New Hampshire and tell them that there will be a new law that prohibits their business from providing customer service and instead it will be offered by a much larger competitor. I’m sure that we would hear a diversity of “colorful” responses for the simple reason that customer service is integral to the success of any delivered service; be it from a for-profit business, non-for-profit business, CPA or otherwise. Furthermore, the presence of the clause “other related services” in RSA 53-E is an open-ended invitation to spur market competition as is intended by the statute. The prohibition of “other related services” is just a blatant attempt to stifle the potential for any further developments of a competitive electricity market that were not prohibited earlier in the clause. §5, p.2, lines 4-8; A9-A10 (p.2, lines 29-33) prohibits the CPA from serving as a load serving entity (LSE). Again, the proposed language in HB315 is clearly against market competition. Retail customers, businesses, and municipalities can and do act as LSEs today in ISO New England’s wholesale electricity markets. I do not see how a law intended to expand market competition would specifically prohibit one type of entity from serving as a LSE, but allows others. If a municipality that has already registered as an LSE becomes a CPA would it need to withdraw its registration? I think it is plain to see that such an action reduces market competition. §5, p.2, lines 18; A11 (p.2, lines 43-44, p.3, lines 1-5) further blocks CPAs from negotiating with utilities to provide access to interval metering data. I have already spoken to my actions as an Eversource customer to install my own energy monitor in my home’s electrical panel. However,
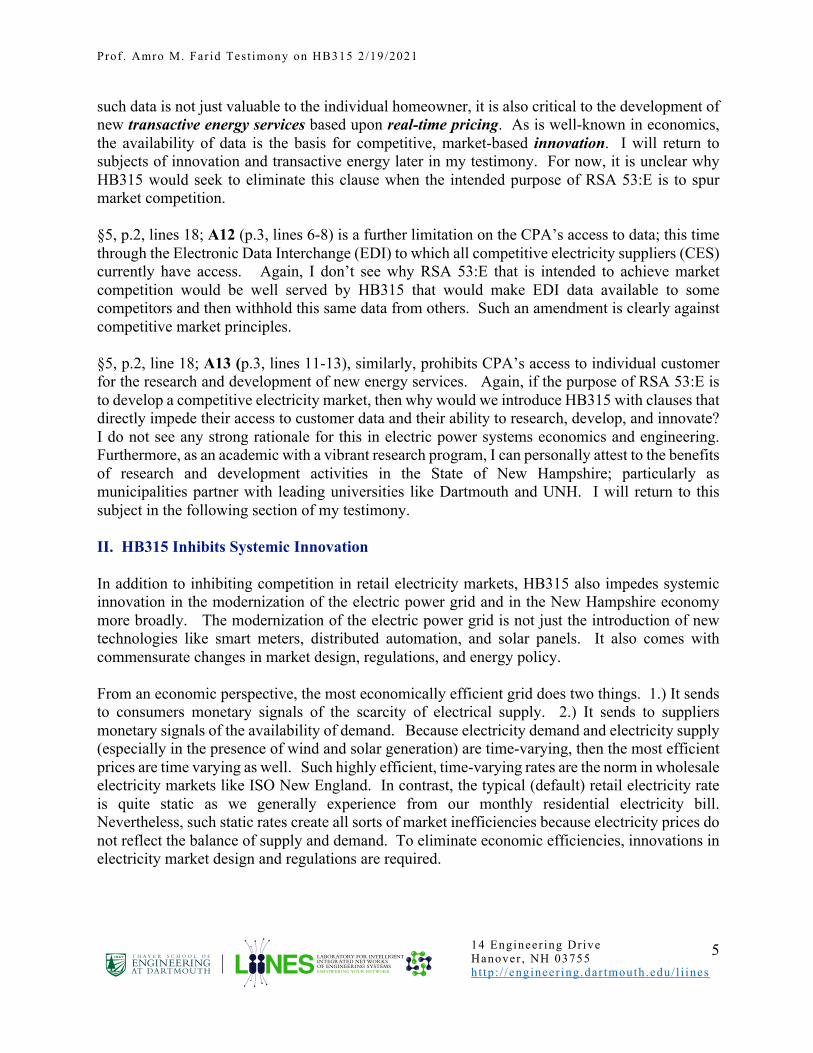
Prof . Amro M. Far id Test imony on HB315 2/19/2021
14 Engineer ing Drive Hanover , NH 03755 ht tp : / /engineer ing.dar tmouth.edu/ l i ines
LABORATORY FOR INTELLIGENTINTEGRATED NETWORKSOF ENGINEERING SYSTEMSEMPOWERING YOUR NETWORK
LABORATORY FOR INTELLIGENTINTEGRATED NETWORKSOF ENGINEERING SYSTEMSEMPOWERING YOUR NETWORK
LABORATORY FOR INTELLIGENTINTEGRATED NETWORKSOF ENGINEERING SYSTEMSEMPOWERING YOUR NETWORK
5
such data is not just valuable to the individual homeowner, it is also critical to the development of new transactive energy services based upon real-time pricing. As is well-known in economics, the availability of data is the basis for competitive, market-based innovation. I will return to subjects of innovation and transactive energy later in my testimony. For now, it is unclear why HB315 would seek to eliminate this clause when the intended purpose of RSA 53:E is to spur market competition. §5, p.2, lines 18; A12 (p.3, lines 6-8) is a further limitation on the CPA’s access to data; this time through the Electronic Data Interchange (EDI) to which all competitive electricity suppliers (CES) currently have access. Again, I don’t see why RSA 53:E that is intended to achieve market competition would be well served by HB315 that would make EDI data available to some competitors and then withhold this same data from others. Such an amendment is clearly against competitive market principles. §5, p.2, line 18; A13 (p.3, lines 11-13), similarly, prohibits CPA’s access to individual customer for the research and development of new energy services. Again, if the purpose of RSA 53:E is to develop a competitive electricity market, then why would we introduce HB315 with clauses that directly impede their access to customer data and their ability to research, develop, and innovate? I do not see any strong rationale for this in electric power systems economics and engineering. Furthermore, as an academic with a vibrant research program, I can personally attest to the benefits of research and development activities in the State of New Hampshire; particularly as municipalities partner with leading universities like Dartmouth and UNH. I will return to this subject in the following section of my testimony. II. HB315 Inhibits Systemic Innovation In addition to inhibiting competition in retail electricity markets, HB315 also impedes systemic innovation in the modernization of the electric power grid and in the New Hampshire economy more broadly. The modernization of the electric power grid is not just the introduction of new technologies like smart meters, distributed automation, and solar panels. It also comes with commensurate changes in market design, regulations, and energy policy. From an economic perspective, the most economically efficient grid does two things. 1.) It sends to consumers monetary signals of the scarcity of electrical supply. 2.) It sends to suppliers monetary signals of the availability of demand. Because electricity demand and electricity supply (especially in the presence of wind and solar generation) are time-varying, then the most efficient prices are time varying as well. Such highly efficient, time-varying rates are the norm in wholesale electricity markets like ISO New England. In contrast, the typical (default) retail electricity rate is quite static as we generally experience from our monthly residential electricity bill. Nevertheless, such static rates create all sorts of market inefficiencies because electricity prices do not reflect the balance of supply and demand. To eliminate economic efficiencies, innovations in electricity market design and regulations are required.
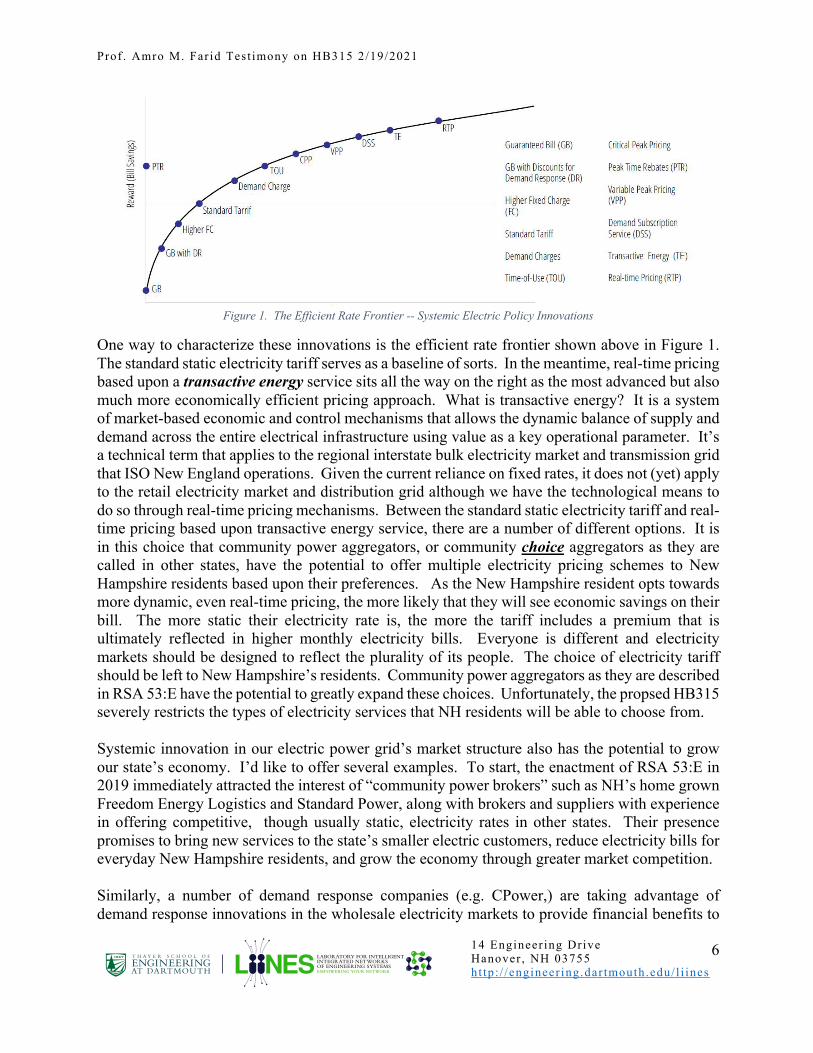
Prof . Amro M. Far id Test imony on HB315 2/19/2021
14 Engineer ing Drive Hanover , NH 03755 ht tp : / /engineer ing.dar tmouth.edu/ l i ines
LABORATORY FOR INTELLIGENTINTEGRATED NETWORKSOF ENGINEERING SYSTEMSEMPOWERING YOUR NETWORK
LABORATORY FOR INTELLIGENTINTEGRATED NETWORKSOF ENGINEERING SYSTEMSEMPOWERING YOUR NETWORK
LABORATORY FOR INTELLIGENTINTEGRATED NETWORKSOF ENGINEERING SYSTEMSEMPOWERING YOUR NETWORK
6
Figure 1. The Efficient Rate Frontier -- Systemic Electric Policy Innovations
One way to characterize these innovations is the efficient rate frontier shown above in Figure 1. The standard static electricity tariff serves as a baseline of sorts. In the meantime, real-time pricing based upon a transactive energy service sits all the way on the right as the most advanced but also much more economically efficient pricing approach. What is transactive energy? It is a system of market-based economic and control mechanisms that allows the dynamic balance of supply and demand across the entire electrical infrastructure using value as a key operational parameter. It’s a technical term that applies to the regional interstate bulk electricity market and transmission grid that ISO New England operations. Given the current reliance on fixed rates, it does not (yet) apply to the retail electricity market and distribution grid although we have the technological means to do so through real-time pricing mechanisms. Between the standard static electricity tariff and real-time pricing based upon transactive energy service, there are a number of different options. It is in this choice that community power aggregators, or community choice aggregators as they are called in other states, have the potential to offer multiple electricity pricing schemes to New Hampshire residents based upon their preferences. As the New Hampshire resident opts towards more dynamic, even real-time pricing, the more likely that they will see economic savings on their bill. The more static their electricity rate is, the more the tariff includes a premium that is ultimately reflected in higher monthly electricity bills. Everyone is different and electricity markets should be designed to reflect the plurality of its people. The choice of electricity tariff should be left to New Hampshire’s residents. Community power aggregators as they are described in RSA 53:E have the potential to greatly expand these choices. Unfortunately, the propsed HB315 severely restricts the types of electricity services that NH residents will be able to choose from. Systemic innovation in our electric power grid’s market structure also has the potential to grow our state’s economy. I’d like to offer several examples. To start, the enactment of RSA 53:E in 2019 immediately attracted the interest of “community power brokers” such as NH’s home grown Freedom Energy Logistics and Standard Power, along with brokers and suppliers with experience in offering competitive, though usually static, electricity rates in other states. Their presence promises to bring new services to the state’s smaller electric customers, reduce electricity bills for everyday New Hampshire residents, and grow the economy through greater market competition. Similarly, a number of demand response companies (e.g. CPower,) are taking advantage of demand response innovations in the wholesale electricity markets to provide financial benefits to

Prof . Amro M. Far id Test imony on HB315 2/19/2021
14 Engineer ing Drive Hanover , NH 03755 ht tp : / /engineer ing.dar tmouth.edu/ l i ines
LABORATORY FOR INTELLIGENTINTEGRATED NETWORKSOF ENGINEERING SYSTEMSEMPOWERING YOUR NETWORK
LABORATORY FOR INTELLIGENTINTEGRATED NETWORKSOF ENGINEERING SYSTEMSEMPOWERING YOUR NETWORK
LABORATORY FOR INTELLIGENTINTEGRATED NETWORKSOF ENGINEERING SYSTEMSEMPOWERING YOUR NETWORK
7
businesses and municipalities across the state. These cost savings translate to more vibrant businesses. They also translate to municipal budgets as savings to taxpayers and water & sewer utility ratepayers. Such competitive services in the electric power grid, however, are just the beginning in New Hampshire’s path along the efficient rate frontier. A new regulatory innovation like 53-E with robust and diverse provisions for CPAs to compete can further advance New Hampshire’s economy beyond the relatively modest services on the market today. Consider the very end of the efficient rate frontier in Figure 1. At this very moment, the United States Department of Energy Building Technologies Office, Solar Energy Technologies Office, Vehicle Technologies Office and the Office of Electricity have released a Funding Opportunity Announcement (FOA) for R&D proposals on “Connected Communities”6. Winning projects will be awarded between $3-7M. Upon reading the FOA, one finds that it specifically includes the development of transactive energy services based upon real-time pricing. It also emphasizes the effective collaboration of “connected communities” with local distribution utilities. RSA 53:E, through its existing provisions for CPA, only enhances the potential for such collaborations between CPA and distribution utilities. Innovations in policy and regulations make New Hampshire much more attractive for federally funded projects. The DOE Connected Communities FOA is not the only such opportunity. In 2019, the Thayer School of Engineering, partnered with the City of Lebanon and Liberty Utilities to study transactive energy services within the city. Liberty Utilities graciously shared load and system data. The City of Lebanon and the Thayer School of Engineering handled this data with the due care that it deserves. Most of all, the work fomented a healthy dialogue on community power aggregators, transactive energy services and real-time pricing. The work led to several peer-reviewed publications in leading conferences and journals which I attach at the end of my testimony as evidence of innovation in action [Attachment 1-3]. In his recent letter to you and this committee, Gov. Sununu wrote: “The key for the long-term success of community aggregation will be stakeholders engaging in constructive dialogue to reach achievable policy goals”. The evidence shows that the healthy dialogue exists and is already bearing fruit. Such collaborations between people and institutions, once initiated, often grow to bring long-term benefits. At this very moment, the Thayer School of Engineering at Dartmouth is collaborating with the Tuck School of Business at Dartmouth, MIT, UNH, the City of Lebanon and Liberty Utilities to propose a $2.5M CPA-based, real-time pricing, transactive energy service project to the National Science Foundation’s Smart and Connected Communities program7. When federal R&D funding come into the state, it has immediate economic benefits. It creates new R&D jobs, and it supports our public and private institutions for higher education. It also showcases New Hampshire as an “innovative state” that is driving exemplary technical and economic progress. Even if this project is not awarded – this time – the benefits are already realized. The multi-university collaborative links are already established and have value. The cooperation between academia and a local municipality is already established and has value. The cooperation between a municipality interested in community power aggregation and a distribution utility is already established and has value. And there will be other opportunities to seek out federal funding for
6 https://www.energy.gov/eere/solar/funding-opportunity-announcement-connected-communities 7 https://www.nsf.gov/pubs/2021/nsf21535/nsf21535.htm

Prof . Amro M. Far id Test imony on HB315 2/19/2021
14 Engineer ing Drive Hanover , NH 03755 ht tp : / /engineer ing.dar tmouth.edu/ l i ines
LABORATORY FOR INTELLIGENTINTEGRATED NETWORKSOF ENGINEERING SYSTEMSEMPOWERING YOUR NETWORK
LABORATORY FOR INTELLIGENTINTEGRATED NETWORKSOF ENGINEERING SYSTEMSEMPOWERING YOUR NETWORK
LABORATORY FOR INTELLIGENTINTEGRATED NETWORKSOF ENGINEERING SYSTEMSEMPOWERING YOUR NETWORK
8
this type of techno-economic multilateral cooperation. RSA 53:E in its current form, without dilution by the proposed HB315, supports market-based competition and innovation. III. The Enacted RSA 53-E is Technically Feasible Such “fancy” R&D initiatives should not in anyway lead us to believe that community power aggregators are unattainable “rocket-science”. Without qualification, we have the technical werewithall to setup effective Community Power Aggregators in the state today. In his recent letter, Gov. Sununu says: “Unfortunately, unanticipated complications and technical
uncertainties have kept this policy change from moving forward as quickly as it should.” In some cases, I have attended some of the discussions related to the implementation of RSA 53-E and in others I have been briefed by colleagues that have attended. In my opinion, the “unanticipated complicated and technical uncertainties” center around the question of what, how and when data is exchanged between a distribution utility and a CPA. These questions, in turn, strike me as business negotiations rather than any veritable frontier of technical feasibility. Let’s look at this simply. Community Power Aggregators have been around a long time. Nearly a dozen states have CPA laws, and many of those have been successfully implemented some form of CPA. In some states, the CPAs have been more successful than others. And some states have allowed CPAs to do more than others. But nevertheless, the data exchange and information technologies to stand them up has been verified and is available domestically. To argue that CPAs are technically infeasible in New Hampshire when there is overwhelming evidence that they are feasible in other states is equivalent to saying that the distribution utilities and CPAs in New Hampshire are somehow technically inferior. We all know such a presumption to be false. New Hampshire’s distribution utiltiies operate fine in other jurisdictions and the individuals involved in forming CPAs in New Hampshire are recognized energy experts outside the state. So let’s call the “unanticipated complications” for what they are: real-life business negotiations in an emerging competitive marketplace. The fact of the matter is that the what, how and when data gets exchanged has practical dollar-and-cents implications for both sides. Access to data is equivalent to market competitiveness. Furthermore, we have a retail electricity marketplace that is largely monopolistic transitioning to something that is much more multilateral. For both of these reasons, it shouldn’t surprise us that there will be wrangling. It also should not surprise us when each side presents their best arguments to support their side; even if it involves red-herrings like the technical infeasibility of data exchange. As I have found so many times in my career, it’s amazing how fast something can become technically infeasible when it doesn’t support management’s objectives. One particular red-herring that has surfaced as a part of the implementation of RSA 53-E has been the exchange of power system data. It’s a red-herring for the simple reason that there is no mention of system data in RSA 53-E. Furthermore, it is not a prerequisite to standing up a CPA because other CPAs have been implemented before without system data. So the exchange of system data should not be used as a reason to derail CPA implementation. Nor should it be a reason to support HB315 either.

Prof . Amro M. Far id Test imony on HB315 2/19/2021
14 Engineer ing Drive Hanover , NH 03755 ht tp : / /engineer ing.dar tmouth.edu/ l i ines
LABORATORY FOR INTELLIGENTINTEGRATED NETWORKSOF ENGINEERING SYSTEMSEMPOWERING YOUR NETWORK
LABORATORY FOR INTELLIGENTINTEGRATED NETWORKSOF ENGINEERING SYSTEMSEMPOWERING YOUR NETWORK
LABORATORY FOR INTELLIGENTINTEGRATED NETWORKSOF ENGINEERING SYSTEMSEMPOWERING YOUR NETWORK
9
So that my testimony is neither misunderstood nor misconstrued, I firmly believe that the judicious
exchange of system data with relevant grid stakeholders is beneficial for the power grid. Even though system data is potentially sensitive, there are many precedents where system data has been transferred beyond the transmission and distribution utility under well-defined rules, monitoring, and governance. Consequently, it is insufficient to use the fact that this data is sensitive as a single means of precluding it from being shared with other relevant grid stakeholders. Leading distribution utilities like National Grid (MA,NY) and Con Edison (NY) have created web portals with relevant system data that can be used to understand relevant questions like solar photovoltaic hosting capacity. National Grid’s Massachusetts portal is found at https://ngrid.apps.esri.com/NGSysDataPortal/MA/index.html. They have similar portals for Rhode Island and New York. Figure 2 shows GIS maps depicting National Grid’s feeders in Massachusetts. Con Edison’s portal is found at: https://www.coned.com/en/business-partners/hosting-capacity. Figure 3 shows GIS maps depicting Con Edison’s feeders in New York. We actively use this data in the Dartmouth-LIINES to research and develop innovative data-centric products. Even Eversource in Connecticut provides access to an ESRI GIS layer8, with an array of base map options and full zoom capability, for looking at hosting capacity as shown in Figure 4 below. Despite this fact, Eversource Lobbyist Donna Gamache has testified: “… [There are]
claims that communities who undertake community power plans should or must have a view of our distribution grid … into the distribution grid. Let me be clear, there is nothing on the shelf that
would enable this and therefore no idea on the overall cost and who would pay for this.”
Figure 2. A Screenshot from the National Grid Massachusetts Portal Depicting Distribution System Feeder Data
8 https://eversource.maps.arcgis.com/apps/webappviewer/index.html?id=4a8523bc4d454ddaa5c1e3f9428d8d8f

Prof . Amro M. Far id Test imony on HB315 2/19/2021
14 Engineer ing Drive Hanover , NH 03755 ht tp : / /engineer ing.dar tmouth.edu/ l i ines
LABORATORY FOR INTELLIGENTINTEGRATED NETWORKSOF ENGINEERING SYSTEMSEMPOWERING YOUR NETWORK
LABORATORY FOR INTELLIGENTINTEGRATED NETWORKSOF ENGINEERING SYSTEMSEMPOWERING YOUR NETWORK
LABORATORY FOR INTELLIGENTINTEGRATED NETWORKSOF ENGINEERING SYSTEMSEMPOWERING YOUR NETWORK
10
Figure 3. A Screenshot from the Con Edison New York Portal Depicting Distribution System Feeder Data
Figure 4. A Screenshot from the Eversource CT Hosting Capacity ArcGIS Map Viewer zoomed to Middletown CT
Furthermore, our research collaboration at the Thayer School of Engineering at Dartmouth involved the exchange of system data from Liberty Utilities. Beyond these immediate precedents, we need to understand that utilities exchange extensive amounts of system data in near real-time with wholesale market operators like ISO New England everyday. This exchange of system data

Prof . Amro M. Far id Test imony on HB315 2/19/2021
14 Engineer ing Drive Hanover , NH 03755 ht tp : / /engineer ing.dar tmouth.edu/ l i ines
LABORATORY FOR INTELLIGENTINTEGRATED NETWORKSOF ENGINEERING SYSTEMSEMPOWERING YOUR NETWORK
LABORATORY FOR INTELLIGENTINTEGRATED NETWORKSOF ENGINEERING SYSTEMSEMPOWERING YOUR NETWORK
LABORATORY FOR INTELLIGENTINTEGRATED NETWORKSOF ENGINEERING SYSTEMSEMPOWERING YOUR NETWORK
11
is used by both parties to collaboratively provide reliable, secure, and cost-effective service. Many of my ISO colleagues have relayed stories where a control room operator at an ISO calls a control room operator at a utility to ask “Are you seeing what I’m seeing?” And then they work it out. When it comes to reliable, secure, and cost-effective service, there is absolutely no reason to believe that such a collaborative environment between CPAs and utilities would not emerge. In my opinion, such a collaborative environment would emerge and it would be beneficial to all grid stakeholders and New Hampshire as a whole. IV. The Enacted RSA 53-E Does Not Compromise Reliable & Secure Grid Operation Unfortunately, the topic of exchanging system data with CPAs has not only been used to derail CPAs and support HB315, but it has also been used to insinuate that it would compromise the reliable and secure operation of the grid. For example, Eversource Lobbyist Donna Gamache in her testimony to this committee asked: “How would these communities ensure security of the
grid?” I feel obliged to reject the premise of the question because it contains a logical fallacy that the exchange of system data in terms of a “view into the distribution grid” is equivalent to “ensuring the security of the grid”. Utilities do need to see their own grid to secure it, but having “a view of the grid” does not mean that one must secure it! Gamache continued in the same testimony to say: “Every single week, we receive more than 1 million hits on our system, mainly by bad characters and other countries to shut down our system.” While I can not independently verify this number, there is a consensus in the electric power systems and cyber-security literature that protecting the grid from cyber-attacks from “bad characters and other countries” should neither be neglected nor underestimated. Nevertheless, and for many reasons, the statement is a remarkable red-herring that plays on the fears of NH residents.
• Utilities are responsible for securing their own grid assets, not CPAs. • Exchanging system data with CPAs does not somehow absolve the utility from securing
its own grid assets, nor does it imply that CPAs must now take on a new role of securing the grid.
• Securing the grid is entirely distinct from securing system data about the grid. • Receving system data is not required to implement a CPA. • RSA 53-E makes no mention of system data. • Therefore, arguments about the cyber-security of exchanging system data do not support
HB315 as a means of amending RSA 53-E. • Finally, system data is exchanged today securely by leading utilities including Eversource.
Ultimately, we have the technology today to support the wide range of innovation that RSA 53-E enables without compromising the reliable and secure operation of the grid. This includes real-time pricing and transactive energy services deployed in an opt-in pilot or made available to early adopter NH residents. V. The Enacted RSA 53-E Enables a Shared Integrated Grid Thus far, my testimony has argued against HB315 because it impedes market competition and systemic innovation. My testimony has also argued for RSA 53-E because it is technical feasible and does not compromise the reliable and secure operation of the grid. However, I must go further.

Prof . Amro M. Far id Test imony on HB315 2/19/2021
14 Engineer ing Drive Hanover , NH 03755 ht tp : / /engineer ing.dar tmouth.edu/ l i ines
LABORATORY FOR INTELLIGENTINTEGRATED NETWORKSOF ENGINEERING SYSTEMSEMPOWERING YOUR NETWORK
LABORATORY FOR INTELLIGENTINTEGRATED NETWORKSOF ENGINEERING SYSTEMSEMPOWERING YOUR NETWORK
LABORATORY FOR INTELLIGENTINTEGRATED NETWORKSOF ENGINEERING SYSTEMSEMPOWERING YOUR NETWORK
12
RSA 53-E enables a Shared Integrated Grid. The term Shared Integrated Grid has been developed by the Electric Power Research Institute (EPRI) as the leading institution of electric industry research & development in the United States. To be clear, this is a concept developed by leading electric utilities and has the support of leading electric power systems engineering academics now as well. Since 2017, the Thayer School of Engineering at Dartmouth has been working with EPRI to advance the Shared Integrated Grid through multiple collaborative projects. Concretely speaking, a shared integrated grid consists of 1) network-enabled distributed energy resources and devices, 2) customer engagement in time-responsive retail electricity services (e.g. real-time pricing), and 3) community-level coordinated exchanges of electricity. The first of these is equivalently called the “energy Internet of Things”. The second of these is often referred to as transactive energy services as previously defined. In the New Hampshire context, the third of these is most easily understood as community power aggregations (CPAs). Our recent open-access book, eIoT: The Development of the Energy Internet of Things in Energy Infrastructure, commissioned by EPRI (https://www.springer.com/gp/book/9783030104269) explains how these three elements combine to create a shared integrated grid. I have also presented on the topic of the Shared Integrated Grid, the energy Internet of Things, and eIoT information standards at a recent workshop hosted by EPRI and Stanford University. See attached slides [Attachment 4]. Mike Howard President and CEO of EPRI describes the shared integrated grid in his September 2018 article in the EPRI Journal (https://eprijournal.com/welcome-to-the-new-world-of-the-interactive-energy-customer/ ). On the same page, hyperlinked below is a video that explains the shared integrated grid (Shared Integrated Grid by EPRI: https://youtu.be/PknNL0TnCxQ). Though the video is worth watching for the graphics, for convenience, it is transcribed here: “Imagine an energy future when smart appliances, water heaters, thermostats energy, storage, electric vehicle chargers, and rooftop
solar are more than customers assets. They are energy solutions integrated with electric grid planning and operation that can enhance resiliency and provide value to customers at all levels of
the grid, creating a shared integrated grid. Much like the mobile apps that make subletting an apartment today easier than ever before, network operators can seamlessly enable a shared
integrated grid by introducing a platform to better utilize shared energy resources. By connecting to this platform through an app many different businesses can offer shared energy solutions for
customers enabling next-generation demand response, more efficient use of grid assets, more robust ancillary services, and improved hosting capacity to support more electric vehicles and
solar PV on the grid. Smart water heaters that work hardest when electricity demand or prices are low, thermostats that enable network operators to reduce peak demand and operate distribution
assets more efficiently, and customer-owned chargers that fuel electric vehicles with the capability to shift charging to times of excess generation capacity.” “In this future, grid investments can expand to include acquiring grid services from customers’
assets. Transmission and distribution companies can harness these emerging technologies which provide customer energy solutions and grid support. Participating customers can receive
incentives to share their resources for grid support, and society can benefit through a lower overall cost for all customers. Realizing this vision requires a platform that fully integrates grid planning
and operation with those distributed energy resources that customers have opted in to share with

Prof . Amro M. Far id Test imony on HB315 2/19/2021
14 Engineer ing Drive Hanover , NH 03755 ht tp : / /engineer ing.dar tmouth.edu/ l i ines
LABORATORY FOR INTELLIGENTINTEGRATED NETWORKSOF ENGINEERING SYSTEMSEMPOWERING YOUR NETWORK
LABORATORY FOR INTELLIGENTINTEGRATED NETWORKSOF ENGINEERING SYSTEMSEMPOWERING YOUR NETWORK
LABORATORY FOR INTELLIGENTINTEGRATED NETWORKSOF ENGINEERING SYSTEMSEMPOWERING YOUR NETWORK
13
the grid. In addition to buying a water heater from a store or website, a customer can purchase it from any qualifying solution provider through a shared integrated grid e-commerce platform, by
logging into an app that is integrated with the network operations and planning system, and with one simple click selecting a smart water heater to be installed by a trusted service provider, with
incentives based on the customers’ needs and the value to the grid. For customers, the app can provide customized alerts over the life of an appliance identifying service needs and offering
energy-saving tips. For network operators, the same platform serves as a standard interface connecting the asset to utility planning systems and distribution operation systems and linking to
aggregated services for the bulk power system, through secure interfaces enabling real-time operation and planning, with a customer-owned asset like a water heater treated as a wire's asset
for the purpose of grid investment planning. The result: a connected device such as a water heater can then optimize energy use based on grid needs shifting from heating water as needed over the
course of the day to working at times when energy demand is low and limiting use when demand is high, all without impacting the customer's comfort.”
“Through this approach, the definition of transmission and distribution investments expands to
include grid services delivering greater value to customers and all levels of the grid. Connected technologies can create a shared integrated grid, a new e-commerce reality, and a win-win
situation for network operators and every customer; a cost-effective approach that enables better-informed resource planning and strategic capital investments at the individual customer level;
unlocking better service quality, improving the customer experience, and providing greater value by integrating resources from the customer's home to the community and the grid as a whole. The
shared integrated grid, a key component of the integrated energy network can provide for clean cost-effective electricity with greater customer choice, comfort, convenience, and control The
Electric Power Research Institute is leading collaboration with industry and other stakeholders to enable this customer-focused energy future.”
Another video on the same page explains the role of the interactive energy customer in the shared integrated grid (The Interactive Energy Customer by EPRI: https://youtu.be/-hpxUymaR48. See also The Six Cs by EPRI: https://youtu.be/15A8WKFXt1k). For convenience, it is transcribed here: “The grid that has served electric utility customers well for more than a century is changing, adapting to new demands, and evolving to meet new expectations. Originally designed for one-
way service the grid has become an integrated energy network, an enabler of new technologies
that provide greater customer choice and enhanced service reliability and affordability. In an era
of e-commerce enabled by mobile apps increasingly connected customers expect streamlined access to products and services that align with their lifestyle. A convergence of new technologies
and rising customer expectations presents forward-thinking utilities greater opportunities to connect with customers, when and how they want to become more than an energy provider: an
energy partner, making a better quality of life possible for all. The interactive energy customer is central to a shared integrated grid, one that redefines utility capital investments by encouraging
customer-specific improvements that deliver value to all, empowering customers to make better
energy management decisions, enabling utilities to better draw from customer-owned resources,
to actively manage today's resources and better plan for the future, enhancing cybersecurity to securely manage the data, making this new utility reality possible and encouraging efficient
electrification to make the most of our natural resources while delivering reliable, safe, affordable,

Prof . Amro M. Far id Test imony on HB315 2/19/2021
14 Engineer ing Drive Hanover , NH 03755 ht tp : / /engineer ing.dar tmouth.edu/ l i ines
LABORATORY FOR INTELLIGENTINTEGRATED NETWORKSOF ENGINEERING SYSTEMSEMPOWERING YOUR NETWORK
LABORATORY FOR INTELLIGENTINTEGRATED NETWORKSOF ENGINEERING SYSTEMSEMPOWERING YOUR NETWORK
LABORATORY FOR INTELLIGENTINTEGRATED NETWORKSOF ENGINEERING SYSTEMSEMPOWERING YOUR NETWORK
14
and cleaner energy. The technology to enable this energy future already exists, customers are ready for the change, forward-thinking utilities can take a bold step forward by embracing new
and emerging technologies to expand their energy service capabilities, enhance service quality, drive greater value, and better engage with the interactive energy customer.” The shared integrated grid as it is described above is entirely consonant with the legislative objectives of RSA 53-E, RSA 374-F, and the emphasis on competitive markets in New Hampshire’s constitution. It specifically enables the state’s energy systems to become more distributed, responsive, dynamic, and consumer-focused. It promotes innovative business applications that will save customers money, allow them to make better and more creative use of the electricity grid, and facilitate municipal and county aggregation programs authorized by RSA 53-E. It will enable animated and competitive retail electricity markets and help customers to obtain lower electric costs, reliable service, and secure energy supplies. It also emphasizes the type of effective collaboration that Gov. Sununu has sought by writing: “The key for the long-
term success of community aggregation will be stakeholders engaging in constructive dialogue to reach achievable policy goals”. In short, the shared integrated grid is the leading industrial concept for New Hampshire to achieve its objectives. While a shared integrated grid can realize the legislative objectives of RSA 53-E, in many ways its implementation has been elusive for a variety of non-technical and often implicit barriers. The distinguished energy economist Dr. Ahmad Faruqui in his recent article in the journal Regulation entitled “Refocusing on the Consumer: Utilities’ regulation needs to prepare for the “prosumer” revolution” recounts the more than 50-year saga of trying to advance a basic building block of grid modernization: customer access to meaningful choices of time-varying rates. [Attachment 5] . He summarizes this saga and the current state grid of modernization in this way: “It’s obvious that both regulators and energy executives are frozen in time and they know it. They spend much of their time blaming each other for the delays. The blame game continues unabated
at many industry events. The pace, ambiguity, and inconclusiveness of this regulatory drama seem to be a reenactment of the play Waiting for Godot. . . . “
“While every state is in a big rush to move ahead with decarbonization and has specified some
very aggressive timelines for becoming 100% decarbonized, just about all the policy solutions are on the supply side. There is almost no inclusion of dynamic load flexibility, which could help deal
with the intermittent nature of renewable energy.”
“For those of us who work in the electric utility industry, the time has come to rethink regulation, reimagine the utility, and reconnect with the real customer. That journey can no longer be delayed.
…This journey will involve finding new ways to engage with customers and observing those
customers in real-time to understand their energy-buying decisions. Unless these steps are
undertaken, the customer is going to leave both the utility and the regulator in the dust.”
The enactment of RSA 53-E and RSA 374-F provide a legal pathway to overcome these implicit barriers and realize the Shared Integrated Grid and create quantifiable synergistic benefits in New Hampshire. My laboratory at the Thayer School of Engineering at Dartmouth recently conducted

Prof . Amro M. Far id Test imony on HB315 2/19/2021
14 Engineer ing Drive Hanover , NH 03755 ht tp : / /engineer ing.dar tmouth.edu/ l i ines
LABORATORY FOR INTELLIGENTINTEGRATED NETWORKSOF ENGINEERING SYSTEMSEMPOWERING YOUR NETWORK
LABORATORY FOR INTELLIGENTINTEGRATED NETWORKSOF ENGINEERING SYSTEMSEMPOWERING YOUR NETWORK
LABORATORY FOR INTELLIGENTINTEGRATED NETWORKSOF ENGINEERING SYSTEMSEMPOWERING YOUR NETWORK
15
the New England Energy Water Nexus Study as a collaborative project, funded by the United States Department of Energy, and now published in the prestigious peer-reviewed journal Renwable and Sustainable Energy Reviews [Attachment 6].
Figure 5. A Balanced Scorecard from the New England Energy-Water Nexus Study Showing the Quantifiable Cross-the-Board Synergistic Benefits of Flexible Energy-Water Resources.
The premise of the project was to quantify the benefits of using “energy-water resources” like water heaters, water utilities, and wastewater utilities as flexible resources in the ISO New England energy markets. The values shown in Fig. 5 assume a modest penetration of ~5% of peak electricity load of these resources. The wide ranges in values stem from six different future energy scenarios; ranging from “business-as-usual” to “high renewables”. Fig. 5 summarizes the final conclusion of the work: In ALL the future energy scenarios studied, enabling the flexible participation of energy-water resources improves the grid’s reliable balancing operation, improves the grid’s environmental performance in terms of water use and CO2 emissions, and saves tens of millions of dollars per year for New England’s residents WITHOUT trade-off. The primary impediment to realizing these benefits is that real-time prices that we see in the wholesale electricity markets must translate down to customers with energy-water resources in the distribution system. The Shared Integrated Grid is the techno-economic vehicle for real-time pricing transacive energy service in the distribution system. RSA 53-E, in turn, is the legislative vehicle for enabling the Shared Integrated Grid through CPAs. Therefore, I urge the New Hampshire legislature to “stay-the-course” and oppose HB315 for what it is: a regressive bill that hinders market competition, systemic innovation, and a whole host of quantifiable technical, economic, and environmental benefits.
Balanced Sustainability Scorecard
Table 15: The range of improvements caused by coordinated flexible operation of the
energy-water nexus.
Balancing Performance
Average Load Following Reserves 1.24–12.66%
Average Ramping Reserves 5.28–18.35%
Percent Time Curtailed 2.67–10.90%
Percent Time Exhausted Regulation Reserves 0%
Std. Dev. of Imbalances 3.874–6.484%
Environmental Performance
Total Water Withdrawals 0.65–25.58%
Total Water Consumption 1.03–5.30%
Total CO2 Emissions 2.10–3.46%
Economic Performance
Total Day-Ahead Energy Market Production Cost 29.30–68.09M$
Total Real-Time Energy Market Production Cost 19.58–70.83M$
LABORATORY FOR INTELLIGENTINTEGRATED NETWORKSOF ENGINEERING SYSTEMSEMPOWERING YOUR NETWORK
LABORATORY FOR INTELLIGENTINTEGRATED NETWORKSOF ENGINEERING SYSTEMSEMPOWERING YOUR NETWORK
LABORATORY FOR INTELLIGENTINTEGRATED NETWORKSOF ENGINEERING SYSTEMSEMPOWERING YOUR NETWORK
71/74

Prof . Amro M. Far id Test imony on HB315 2/19/2021
14 Engineer ing Drive Hanover , NH 03755 ht tp : / /engineer ing.dar tmouth.edu/ l i ines
LABORATORY FOR INTELLIGENTINTEGRATED NETWORKSOF ENGINEERING SYSTEMSEMPOWERING YOUR NETWORK
LABORATORY FOR INTELLIGENTINTEGRATED NETWORKSOF ENGINEERING SYSTEMSEMPOWERING YOUR NETWORK
LABORATORY FOR INTELLIGENTINTEGRATED NETWORKSOF ENGINEERING SYSTEMSEMPOWERING YOUR NETWORK
16
VI. Conclusion
This testimony that I have provided here is that of a volunteer and engaged citizen-scientist. It is my technical opinion based on a decade of well-developed academic credibility, and accumulated scientific expertise in power systems engineering and economics. I can attest that my testimony is free from any financial conflict of interest; including with any of the investor owned utilities and with any of the emerging community power aggregators. As a voting citizen and an Eversource rate payer, it is my preference to purchase electricity from another source; if given the choice. As a scientist and academic, my research publications demonstrate extensive evidence that such market competition and innovation would spur synergistic technical, economic and environmental benfits across the state; as RSA 53:E, RSA 374, and the state constitution intend.
Sincerely,
Dr. Amro M. Farid Associate Professor of Engineering Adjunct Associate Professor of Computer Science Laboratory for Intelligent Integrated Networks of Engineering Systems (LIINES) Thayer School of Engineering at Dartmouth CEO of Engineering Systems Analytics LLC

Towards a Shared Integrated Grid in New England’s Energy
Water Nexus
Steffi Muhanji1, Clifton Belows 2, Tad Montgomery 3 and Amro M. Farid4
Abstract— The electric power system is rapidly decar-bonizing with variable renewable energy resources (VREs)to mitigate rising climate change concerns. There are,however, fundamental VRE penetration limits that can onlybe lifted with the complementary integration of flexibledemand-side resources. A recent study has shown thatflexible energy-water resources can serve such a role, pro-vide much needed operating reserves and cost-effectivelyreduce power system imbalances. The implementation ofsuch demand-side resources necessitates a “shared inte-grated grid” that is characterized by: 1) integral socialengagement from individual electricity consumers 2.) thedigitization of energy resources through the energy internetof things (eIoT), and 3) community level coordination. Thispaper discusses the efforts of Dartmouth College and theCity of Lebanon, NH to develop such a shared integratedgrid. It leverages the newly passed New Hampshire mu-nicipal aggregation bill to develop a prototype transactiveenergy (TE) market that enables Lebanon residents totrade carbon-free electricity products and services amongstthemselves.
I. INTRODUCTION
The electric power system is rapidly decarbonizingto mitigate rising climate change concerns. This evo-lution to a carbon-free grid has been characterized bya widespread adoption of variable renewable energyresources (VREs) such as solar and wind throughout theelectricity supply chain. In the meantime, VRE adop-tion has been driven by a combination of technologyimprovements, favourable legislation and lower costs.While much VRE integration has been in the formof utility-scale developments, more recent integration,particularly roof-top solar has been at the consumerlevel, behind-the-meter, as distributed generation (DG).
VREs, however, pose fundamental challenges to thetechnical and economic control of the power grid. First,these resources are highly variable and erode the dis-patchable nature of the generation fleet [1]. Second,both solar and wind power profiles are influenced by
1Steffi Muhanji (corresponding author), is with the Thayer Schoolof Engineering, Dartmouth College, Hanover, NH 03755, [email protected]
2 Clifton Below is a City Councillor at the Lebanon City Coun-cil,NH. [email protected]
3 Tad Montgomery is a Chief Energy and Facilities Manager withthe City of Lebanon, [email protected]
4Amro M. Farid is with the Faculty of Thayer Schoolof Engineering, Dartmouth College, Hanover, NH 03755, [email protected]
external factors such as wind-speed and solar irradiancethat are challenging to predict and leverage in gridoperations. Grid operators must rely on forecasted VREpower profiles in order to dispatch generation so asto meet demand in real-time. Such forecasts are error-prone and, therefore, impede system operators’ abilityto exactly match generation and demand. Third, theeroded dispatchability of the generation fleet impedesits ability to track the net load. Whereby “net load” isdefined as the difference between the aggregated systemload and the total generation produced by VREs, tielineimports/exports, and any transmission and distributionlosses. Fig. 1 represents a phenomenon commonly re-ferred to as the “duck curve”. The black line representsthe net load. With each gigawatt (GW) of solar added,the “belly” of the net load curve grows. As the sunrises over the course of the day, an increasing numberof dispatchable generators are taken offline. As the sunsets, these same generators must start up and ramp upquickly to replace the waning solar generation [1], [2].Incidentally, this ramp also happens to coincide withthe evening electricity demand peak. These challengesgreatly limit the extent to which VREs can be adoptedwithin the current electricity grid set up.
Fig. 1: The duck curve. [2]
Indeed, dozens of renewable integration studies acrossvaried geographies have come to the following consen-sus conclusions [1]–[6]:
1) VREs require greater quantities of normal operatingreserves.
2) Both the variability and forecast errors of VREscontribute towards system imbalances.
3) VREs present dynamics that span multiple timescales and layers of power system control.

4) Operators are forced to take corrective manualactions to deal with real-time variability.
5) VRE forecast errors can impede real-time energymarkets from clearing. The associated optimizationmodels result in infeasible solutions.
6) Operating a system with high amounts of VREs re-quires even greater quantities of ancillary services.
These conclusions not only call for holistic and in-tegrated solutions but also the need to significantlyincrease available grid services [7].
Engaging the demand-side has been proposed as akey control lever towards effective VRE integration [1],[8]. Firstly, the grid periphery is increasingly activatedby “smart-home” distributed energy resources (DERs);be they in the form of rooftop solar, electric vehicles(EVs), or battery energy storage. Secondly, electricityconsumers are becoming more conscious of the costand sustainability of their consumption patterns [1],[8], [9]. Thirdly, the deregulation of electric powersystems has steadily disbanded traditional generationmonopolies and opened the way for increasing consumerchoice in electricity service. Finally, the rise of theenergy Internet of Things (eIoT) and its associated data-driven services have modernized the electricity demand-side, incentivized new types of grid actors (e.g demandaggregators), and inspired new retail services [1], [8],[9]. When these seemingly independent developmentsconverge to maturation, they form transactive energy(TE) market places that cost-effectively transact elec-tricity “products” amongst everyday grid “prosumers”,reliably secure the physical power grid, and seamlesslyinter-operate with wholesale (bulk) electricity markets.Coupled with favourable local legislation, Americancommunities are now able to take control over theirelectricity needs through various community energy ag-gregation schemes. These factors allow consumer choiceof energy provider, foster the development of localrenewable energy and facilitate the formation of marketstructures in which local consumers exchange energyproducts and services both with their local neighboursand with the grid as a whole [1], [9].
A. Contribution
This paper seeks to tie the “macro-picture” of griddecarbonization and VRE integration into the ”local-picture” of community efforts towards a shared inte-grated grid. First, it draws on the lessons learned fromthe ISO New England’s (ISO-NE) 2017 System Opera-tional Analysis and Renewable Energy Integration Study(SOARES) to illustrate the fundamental limits to VREintegration. Specifically, in the absence of complemen-tary demand-side initiatives, the electric power systemdevelops a notable dependence on VRE curtailment as akey control lever. Second, this paper demonstrates that
the needed control levers can come from the flexibleoperation of a modest percentage of New England’senergy-water resources. Doing so would enhance thegrid’s balancing performance, CO2 emissions, waterwithdrawals and consumption, and real-time/day-aheadmarket production costs. To achieve such a synergisticoutcome, the paper presents a concept of a sharedintegrated grid that is characterized by: 1) integral socialengagement from individual electricity consumers, 2)the digitization of energy resources with eIoT, and 3)community level coordination. The City of LebanonNH and Dartmouth College are currently collaboratingtowards its implementation in the form of a TransactiveEnergy (TE) Blockchain prototype.
B. Outline
The rest of the paper is structured as follows. Sec-tion II, discusses the key findings and lessons learnedin the SOARES. Section III presents the New Eng-land energy water nexus study results and conclusions.Section IV discusses ongoing efforts towards a sharedintegrated grid in NH. Finally, the paper concludes inSection V.
II. MOTIVATION — THE CURTAILMENT PROBLEM.
Fig. 2: SOARES Renewable Energy Study Scenarios as agreedby ISO-NE stakeholders [?].
A. Study Description
In 2017, ISO-NE commissioned the System Opera-tional Analysis and Renewable Energy Integration Study(SOARES) to investigate the impact of varying penetra-tions of VREs on the operations of the ISO-NE system.This study looked into 12 predefined (by the New Eng-land Power Pool (NEPOOL)) scenarios with 6 in 2025and 6 in 2030 [2]. These scenarios were distinguishedby the capacity and diversity of dispatchable generationresources, solar, wind, and energy efficiency. Fig. 2represents the installed capacity of and actual energydelivered by solar and wind for each of the 12 scenar-ios. The “2025/2030 Conventional” scenario reflects the

ISO-NE system if it were to evolve in a “business-as-usual” manner. Due to the high penetrations of solar andwind, most scenarios experienced a negative “net load”during low load periods in the Spring and Fall months.In addition, nuclear generation units were considered“must-run” resources and therefore, generated electricityat all times and at full capacity [2]..
B. Highlights of Key Results
The dispatched generation profile for the “2030 VREPlus” scenario in mid-April is shown in Fig. 3. Themajority of the generation is met by wind, solar, andnuclear power. At any one point in time, very few dis-patchable generators are committed. Note that with suchhigh amounts of VREs, the commitment of dispatchablegenerators is no longer a trivial issue but rather, onethat is difficult to predict as it is highly influenced byboth the non-linear dynamics of VREs and the statisticsof the net load profile [2]. Such high VRE penetrationlevels significantly impact the system’s ability to dealwith net load variability and hence mitigate imbalancesin real-time. For example, at midday, large amounts ofsolar result in low load conditions and test the system’sability to ramp downwards. The opposite is observed asthe sun begins to set whereby the system must rampupwards to compensate for the declining generation. AsFig. 3 shows, instead of the traditional “duck curve” (asin Fig. 1) an even more exaggerated profile ( called herethe “duck-dive curve”) is observed for the “2030 VREPlus” scenario. The sharper ramp in this Fig. 3 furtherillustrates the operational constraints presented by highpenetrations of VREs.
2030-3-0423a Week 16: Real Time Schedules
Apr 17 Apr 18 Apr 19 Apr 20 Apr 21 Apr 22 Apr 23Time (hours) 2030
0
2000
4000
6000
8000
10000
12000
14000
Pow
er (M
W)
NuclearNatural GasWoodHydroMunicipal Solid WasteLandfill GasKeroseneCoalDistillate Fuel OilJet FuelNo. 6 Fuel OilResidual Fuel OilSolarWind
Fig. 3: Dispatched generation profile by fuel type for the monthof April.
For the scenarios with a significant presence of VERs(“High VREs”, “High VRE Plus” and “High VREGEO”), the system is shown to entirely exhaust bothits upward and downward load-following as well asramping reserves [2]. Where load-following reservesrepresent the available capability by online generatorsto move up or down and ramping reserves is the ability
of online generators to move up or down per unit time.Figures 4 and 5 illustrate load-following and rampingreserves for the “High VREs Plus” scenario. Both theload-following and ramping reserves go to zero in theFall and Spring months. The minimum statistic of bothreserve quantities is particularly important as it indicatesthe “safety margin” that the system has to ensure itssecurity. As the third subplots of Figures 4 and 5respectively illustrate, both types of reserves have a zerominimum. Incidentally, the exhaustion of these reservequantities corresponds to even higher imbalances as thesystem is unable to respond to variability in the net-loadin real-time. These results challenge the assumptionsaround the acquisition of these reserve quantities andmotivate the need for better techniques to obtain them.
Jan Feb Mar Apr May Jun Jul Aug Sep Oct Nov Dec JanTime (months) 2030
-8000
-6000
-4000
-2000
0
2000
4000
Load
Fol
low
ing
Res
erve
s (M
W) 2030-3 Real Time Upward & Downward Load Following Reserves
Upward load-following reservesDownward load-following reserves
0 10 20 30 40 50 60 70 80 90 100
-8000
-6000
-4000
-2000
0
2000
4000Lo
ad F
ollo
win
g R
eser
ves
(MW
) 2030-3 Upward & Downward Load Following Reserves Duration Curve
Upward load-following reservesDownward load-following reserves
Histogram of 2030-3 Upward & Downward Load Following Reserves Distributions
-8000 -6000 -4000 -2000 0 2000 4000 6000Load Following Reserves (MW)
0
10
20
30
40
50
60
% T
ime
of Y
ear
Up LFR MEAN = 818 MWUp LFR STD = 683 MWUp LFR MAX = 4568 MWUp LFR MIN = 0 MWDown LFR MEAN = 1145 MWDown LFR STD = 1212 MWDown LFR MIN = 0 MWDown LFR MAX = 6765 MW
Fig. 4: Load-Following reserves profile for the “2030 VREPlus” scenario [2].
Jan Feb Mar Apr May Jun Jul Aug Sep Oct Nov Dec JanTime (months) 2030
-1000
-500
0
500
1000
1500
Ram
ping
Res
erve
s (M
W/m
in)
2030-3 Real Time Upward & Downward Ramping Reserves
Upward ramping reservesDownward ramping reserves
Jan Feb Mar Apr May Jun Jul Aug Sep Oct Nov Dec Jan2030
-1000
-500
0
500
1000
1500
Ram
ping
Res
erve
s (M
W/m
in) 2030-3 Upward & Downward Ramping Reserves Duration Curve
Upward ramping reservesDownward ramping reserves
Histogram of 2030-3 Upward & Downward Ramping Reserves Distributions
-1000 -500 0 500 1000 1500Ramping Reserves (MW/min)
0
10
20
30
40
% T
ime
of Y
ear
+RampR MEAN = 254 MW+RampR STD = 216 MW+RampR MAX = 1239 MW+RampR MIN = 0 MW-RampR MEAN = 134 MW-RampR STD = 105 MW-RampR MIN = 0 MW-RampR MAX = 771 MW
Fig. 5: Ramping reserves profile for the “2030 VRE Plus”scenario [2].
Perhaps the most insightful finding of this study isthe reliance on curtailment to maintain the system’snormal operating conditions. For all of the 12 scenarios,curtailment of VREs emerged as a key control lever inaddition to the load-following and ramping reserves pro-vided by dispatchable generators. Each scenario utilizedcurtailment as a balancing lever at least 98% of thetime [2]. More interestingly, the total energy curtailedranged from 2.72% of the total available VRE capacityfor the conventional scenarios to 41.19% for scenarioswith high penetrations of VREs [2]. While some of the

curtailment was due to excessive VRE generation in thesystem, a small portion of this curtailment was causedby topological limitations of the system. Curtailment isespecially vital when variable resources are situated inremote locations such as Northern Maine. In these cases,it can be the only available control lever [2].
Irrespective of the reason for curtailment, the extentto which curtailment was used in all these simulationscenarios is potentially concerning. Although increasingthe line-carrying capacity would alleviate the need forcurtailment in cases with topological constraints, build-ing more transmission is not always an option in mostregions. Furthermore, lower levels of curtailments arevital as they increase the overall amount of generationfrom renewable sources, and reduce the use of expensivedispatchable generation; which in turn cuts costs andCO2 emissions. This study illustrates the indispensablerole of curtailment in power system balancing perfor-mance.
Mathematically speaking, curtailment is not unlikeload-following and ramping reserves. The curtailmentsignal used in this study moved the power levels ofa given curtailable resource up or down within thereal-time resource scheduling market time step of 10minutes. This means that to curtail a VRE, this resourcemust ramp up/down from its current production levelto the curtailed level within 10 minutes. The rampingof a VRE as it reduces its generation level could counttowards the system ramping reserves and be compen-sated accordingly. Similarly, the total power availablefor curtailment from any given VRE could also counttowards the system load-following reserves. Reconcilingthe definitions of operating reserves and curtailment and,therefore, their treatment in electricity markets wouldgo a long way to provide the much needed flexibil-ity in systems with high penetrations of VREs. Semi-dispatchable resources (i.e. resources whose supply canbe curtailed) could provide load-following and rampingreserves. Similarly, a much faster curtailment signal canhelp develop regulation reserves.
III. RESULTS FROM THE NEW ENGLAND
ENERGY-WATER NEXUS STUDY
TABLE I: A summary of available flexible water resources inthe system as percentage of the peak load.
The findings of the SOARES are significant in twomain ways. First, they highlight the value of curtailment
in balancing performance, and second, they show theneed to engage more demand-side resources in marketoperations. With these conclusions in mind, the NewEngland Energy-Water-Nexus study was conducted toanalyze: 1) the value of curtailment in the provisionof load-following, and ramping reserves, 2) the valuedemand response by energy-water resources of varioustypes, 3) the fuel flows of thermal units and their as-sociated CO2 emissions, 4) water withdrawals and con-sumption by thermal units, and 5) the effect of flexibleoperation on the New England energy market productioncosts. This study combines the two main insights of theSOARES, by redefining the role of curtailment in powersystem operation and activating energy-water demand-side resources . The first goal is achieved by allowingcurtailment to count towards the provision of both load-following and ramping reserves. The second is achievedby allowing energy-water resources to provide demandresponse through their load-shedding capabilities.
The New England Energy Water Nexus study consid-ered 6 2040 scenarios for the ISO-NE system. The re-source mixes for the six 2030 scenarios of the SOARESwere evolved to 2040 scenarios using the RegionalEnergy Deployment System (ReEDS) optimization tooldeveloped by the National Renewable Energy Lab(NREL). Table I summarizes the capacity mixes ofall the energy-water resources used in this study. Twomodes of operation were considered: flexible operation(with flexible energy-water resources) and conventionaloperation (without them). In the flexible mode, run-of-river and pond-hydro were curtailable at a cost of$4.5/MWh while demand from water and wastewatertreatment facilities had a load-shedding capability. Theopposite was true for the conventional operation mode.Pumped storage was treated as a dispatchable resourceacross all six scenarios in both operating modes.
The “flexibility value” of coordinated flexible op-eration of the New England energy-water nexus wasassessed based on three main areas: 1) balancing per-formance (improvements in load-following, rampingand regulation reserves, curtailment, and system imbal-ances), 2) environmental impact (reductions in waterwithdrawals and consumption, and CO2 emissions) and3) overall production costs (day-ahead and real-time).Table II summarizes the range of improvements broughtabout by coordinated flexible operation of the NewEngland Energy water nexus.
A. Balancing Performance
Flexible operation enhanced the mean upward anddownward load-following reserves by 1.26%-12.66%across the six 2040 scenarios as illustrated in Table II.The study also showed that flexible operation signifi-cantly improves the minimum levels of load-following

TABLE II: Balanced Sustainability Scorecard: The range of improvements caused by coordinated flexible operation of theenergy-water nexus.
Balancing Performance % Improvement
Average Load Following Reserves 1.24–12.66%
Average Ramping Reserves 5.28–18.35%
Percent Time Curtailed 2.67–10.90%
Percent Time Exhausted Regulation Reserves 0%
Std. Dev. of Imbalances 3.874–6.484%
Environmental Performance % Improvement
Total Water Withdrawals 0.65–25.58%
Total Water Consumption 1.03–5.30%
Total CO2 Emissions 2.10–3.46%
Economic Performance % Improvement
Total Day-Ahead Energy Market Production Cost 29.30–68.09M$
Total Real-Time Energy Market Production Cost 19.58–70.83M$
reserves across all six scenarios and in some cases byup to 82.96%. The results indicate that by adding asmall amount of flexibility in the system (see Table I),the robustness of the system is improved in the worstcase points and the overall operation during challengingperiods.
Similarly, the mean downward and upward rampingreserves values were improved by 5.28%-18.25% withflexible operation as shown in Table II. The minimumstatistic of ramping reserves improved across all sixscenarios with up to 31.65% for downward rampingreserves and up to 47.32% for upward ramping reserves.These improvements were greater for systems with ahigh penetration of VREs. This result further illustratesthe role of curtailment in improving the flexibility ofthe system if applied towards the provision of load-following and ramping reserves.
Although, flexible operation increased the amount ofpower available for curtailment, the results of the studyshowed that flexible operation reduced the percent oftime VREs were curtailed by 2.67%–10.90%. Contrastedwith the SOARES where curtailments occurred up to98% of the time [2], flexible operation significantly im-proves the use of curtailment and, therefore, renewableenergy in power system operations. Also, due to flexibleoperation, regulation reserves were exhausted for 0%of the time unlike the SOARES where they exhausted0.14%–46.20% of the time. Finally, the standard devia-tions of imbalances decreased by 3.874%-6.484%. Theseresults illustrate that by revising the role of curtailmentin power system operation and engaging demand-sideresources, the overall security of the system is improvedthrough increased flexibility in balancing performance.
B. Environmental Impact
Flexible operation reduced the environment impactof the electric power grid by reducing the water with-drawals and consumption by thermal power plants by0.65%–25.58% and 1.03%–5.30% respectively. Simi-larly, the overall CO2 emissions were reduced by 2.10%–3.46%. These results indicate that an even bigger envi-ronment impact is likely with increased flexible opera-tion and demand-side participation.
C. Economic Impact
Finally, flexible operation reduced the overall electric-ity production cost by 29.30–68.09M$ for the day-aheadmarket and 19.58–70.83M$ as compared to the conven-tional mode of operation. These results indicate that theflexible mode of operation allows for less constrainedday-ahead and real-time optimization programs, that, inturn, result in reduced overall production costs.
IV. DISCUSSION
The New England energy-water-nexus study showedthat the introduction of small quantities of flexibleenergy-water demand-side resources could have far-reaching consequences on all aspects of power systemperformance. Nevertheless, there are many challengesto realizing the benefits of flexible energy-water de-mand side resources; be they water treatment plants,wastewater treatment plants, or even everyday householdelectric water heaters. First, they are owned and oper-ated by individual electricity consumers; with their ownobjectives for their use. Second, many such devices lackthe necessary instrumentation and control technologyto become active grid resources. Third, they are bothsmall and connected to the distribution system andconsequently lack the ability to have noticeable impact

on wholesale bulk power system operation. To overcomethese challenges and achieve the synergistic outcomes ofthe New England energy-water nexus study, this paperpresents the concept of a shared integrated grid thatis characterized by: 1) integral social engagement fromindividual electricity consumers, 2) the digitization ofenergy resources with eIoT, and 3) community levelcoordination.Fig. 6: Summary of available generation capacity as a per-centage of total available capacity by fuel type for all six 2040scenarios.
To that effect, and following on the recent enact-ment of NH Senate Bill 286, the City of LebanonNH has launched Lebanon Community Power (LCP)as a municipal load aggregation initiative. The mainobjective of the initiative is to enable consumer choice innewly animated retail electricity markets so that smallerelectricity consumers can benefit from the savings andrate alternatives that wholesale customers already enjoy.In so doing, the municipal aggregation gives access toreal-time electricity prices that are on-average lowercompared to the fixed retail rates. Furthermore, thelocal transactions of energy with Lebanon can serve tobolster renewable energy adoption, load reduction, anddecarbonization as a whole. Furthermore, at the citylevel, the presence of municipal load aggregation cancatalyze other initiatives like electric vehicle chargingstations, smart street-lighting, and the deployment ofother DERs like battery and thermal energy storage. Akey component of the LCP initiative is to obtain granularmeter data through collaborating with Liberty Utilityto support research efforts to guide the deployment ofDERs. This will involve meter upgrades to enable near-real time readings.
With these factors in mind, the Laboratory for In-telligent Integrated Networks of Engineering Systems(LIINES) at the Thayer School of Engineering at Dart-mouth has teamed-up with LCP to develop a TransactiveEnergy (TE) Blockchain prototype to support the LCP
initiative. The goal of the TE platform is to supportreal-time market transactions while ensuring that theLebanon electric power system continues to functionsecurely and reliably. Transactive energy (TE) is definedas “a system of economic and control mechanisms thatallow the dynamic balance of supply and demand acrossthe entire electrical infrastructure using value as a keyoperational parameter.” Central to the development aTE prototype as the economic backbone of the LCP isthe integration of power systems control engineering tosecure grid’s many operational and technical constraints.The technical development of the TE prototype draws onkey lessons from the technical literature distributed con-trol algorithms and multi-agent systems. Furthermore,the LIINES is collaborating with Liberty Utilities so theTE prototype addresses the specific complexities of theLebanon distribution system.
In a TE context, each physical DER participates asa market agent in a cyber (or market) layer. As adesign principle to minimize complexity and ensureprivacy, each agent in the cyber layer only holds andexchanges information that is relevant to their specificparticipation in the market. It then carries out local andcoordinated cost-minimization algorithm that simultane-ously respects operational and physical constraints of thesystem. Given the magnitude of information exchange,Blockchain serve as a secure and distributed ledgerto record and store transactions that each agent canultimately access and verify.
V. CONCLUSION
In conclusion, the technical development of the trans-active energy blockchain prototype coupled with thelegislative enactment of SB 286 serve to enable theLebanon Community Power initiative. While the LCPmay be classified as a type of Community Choice Ag-gregator, this particular conception demonstrates severaladvanced features including: 1.) working with innova-tive private-sector partners to expand market access,2.) working with utilities and technology developersto deploy the right IT infrastructure, and 3.) workingwith wide range of public and private stakeholders toensure that the market structure continues to evolve andembraces new technologies — under a nimble, flexiblemode of governance. These characteristics are integralto a truly “shared integrated grid” that through continuedinnovation in energy policy, markets, and technologyplatforms expands consumer choice, enables the flexibleoperation of demand-side resources, reduces electricitycosts, facilitates greater adoption of renewable energyand ultimately accelerates the decarbonization of theelectric power sector.

REFERENCES
[1] A. M. Farid, B. Jiang, A. Muzhikyan, and K. Youcef-Toumi,“The Need for Holistic Enterprise Control Assessment Methodsfor the Future Electricity Grid,” Renewable & Sustainable EnergyReviews, vol. 56, no. 1, pp. 669–685, 2015. [Online]. Available:http://dx.doi.org/10.1016/j.rser.2015.11.007
[2] A. Muzhikyan, S. Muhanji, G. Moynihan, D. Thompson,Z. Berzolla, and A. M. Farid, “The 2017 ISO New EnglandSystem Operational Analysis and Renewable Energy IntegrationStudy,” Energy Reports, vol. 5, pp. 747–792, July 2019.
[3] E. Ela, M. Milligan, B. Parsons, D. Lew, and D. Corbus, “Theevolution of wind power integration studies: past, present, andfuture,” in Power & Energy Society General Meeting, 2009.PES’09. IEEE. IEEE, 2009, pp. 1–8.
[4] A. S. Brouwer, M. van den Broek, A. Seebregts, and A. Faaij,“Impacts of large-scale Intermittent Renewable Energy Sources onelectricity systems , and how these can be modeled,” Renewableand Sustainable Energy Reviews, vol. 33, pp. 443–466, 2014.
[5] H. Holttinen, M. O. Malley, J. Dillon, and D. Flynn, “Recommen-dations for wind integration studies – IEA task 25,” InternationalEnergy Agency, Helsinki, Tech. Rep., 2012.
[6] H. Holttinen, A. Orths, H. Abilgaard, F. van Hulle, J. Kiviluoma,B. Lange, M. OMalley, D. Flynn, A. Keane, J. Dillon, E. M.Carlini, J. O. Tande, A. Estanquiro, E. G. Lazaro, L. Soder,M. Milligan, C. Smith, and C. Clark, “Iea wind export groupreport on recommended practices wind integration studies,” Inter-national Energy Agency, Paris, France, Tech. Rep., 2013.
[7] EPRI, “Electric power system flexibility: Challenges and opportu-nities,” Electric Power Research Institute, Tech. Rep. 3002007374,February 2016.
[8] S. O. Muhanji, A. E. Flint, and A. M. Farid, eIoT: The Develop-ment of the Energy Internet of Things in Energy Infrastructure.Berlin, Heidelberg: Springer, 2019.
[9] S. O. Muhanji, A. Muzhikyan, and A. M. Farid,“Distributed Control for Distributed Energy Resources: Long-Term Challenges & Lessons Learned,” IEEE Access, vol. 6,no. 1, pp. 32 737 – 32 753, 2018. [Online]. Available:http://dx.doi.org/10.1109/ACCESS.2018.2843720

Developing a Blockchain Transactive EnergyControl Platform in Lebanon to Transform the New
Hampshire Electricity Market.
1st Steffi Olesi MuhanjiThayer School of Engineering
Dartmouth College
Hanover, NH, [email protected]
2nd Samuel GoldingPresident & Founder
Community Choice Partners, Inc
Concord, NH [email protected]
3rd Tad MontgomeryCity of Lebanon
Energy and Facilities Manager
Lebanon NH, [email protected]
4th Clifton BelowCity of Lebanon
Assistant Mayor
Lebanon NH, [email protected]
5th Amro M. FaridThayer School of Engineering
Dartmouth College
Hanover NH, [email protected]
Abstract—The electricity distribution system is fundamentallychanging due to the widespread adoption of distributed gen-eration, network-enabled physical devices, and active consumerengagement. These changes necessitate new control structuresfor electric distribution systems that leverage the benefits ofintegral social and retail market engagement from individualelectricity consumers through active community-level coordina-tion to support the integration of distributed energy resources.This work discusses a collaboration between Dartmouth, theCity of Lebanon New Hampshire (NH) and Liberty Utilitiesto develop a transactive energy control platform for Lebanon.At its core, this work highlights the efforts of determinedcommunities within the state of New Hampshire seeking todemocratize energy and spearhead the sustainable energy tran-sition. The work implements a distributed economic model-predictive control (MPC) formulation of a dynamic alternatingcurrent (AC) optimal power flow to study the flows of powerwithin the Lebanon distribution grid. It employs the recentlyproposed augmented Lagrangian alternating direction inexactnewton (ALADIN) distributed control algorithm that has beenshown to guarantee convergence even for non-convex problems.The paper demonstrates the simulation methodology on a 13node Lebanon feeder with a peak load of 6000kW. Ultimately,this work seeks to highlight the added benefits of a distributedtransactive energy implementation namely: lowered emissions,cheaper cost of electricity, and improved reliability of theLebanon electric distribution system.
I. INTRODUCTION
In recent years, community choice aggregations (CCAs)have emerged as a means to democratize electricity supplyfor consumers [1]. CCAs are generally run by a public entitysuch as a municipality or a county government to procurewholesale electricity for its consumers while the utility con-tinues to offer transmission and distribution services [1]. CCAsdemocratize electricity procurement by offering consumersaccess to a broader portfolio of electric services, often at more
competitive prices, with renewable energy penetration thatcan exceed Renewable Portfolio Standards (RPS) requirements[1], [2]. CCAs first emerged in the state of Massachusettsin 1999 after the passage of the state’s Community ChoiceAggregation (CCA) law in 1997 [1]. Since then, CCAs havebeen implemented in 8 other states namely California, Illinois,New Jersey, New York, Ohio, Rhode Island, Virginia, andmost recently New Hampshire [1]. In New Hampshire, theauthorities of CCAs have been expanded to not just providedefault wholesale supply, but also retail customer services thatmonopoly distribution companies have heretofore provided tothe mass market, such as community-provided consolidatedbilling, meter reading and related functions critical to enablingTransactive Energy. This new model is referred to as ”Com-munity Power Aggregation” (CPA). This paper discusses theemergence of CPAs in the state of New Hampshire and morespecifically outlines the plan by the City of Lebanon NH todesign a cost effective and resilient electric distribution systembased on transactive energy market principles.
II. COMMUNITY POWER AGGREGATION IN NEW
HAMPSHIRE
Through a collaboration with Liberty Utility and the Lab-oratory for Intelligent Integrated Networks of EngineeringSystems (LIINES) at the Thayer School of Engineering atDartmouth, the City of Lebanon is developing Lebanon Com-munity Power (LCP) as a municipal load aggregation initiative.The primary goal of this initiative is to enable consumerchoice, reduce the overall costs of electricity by offeringreal-time prices and/or time-of-use rates among other pricingoptions, as a means to accelerate the development and adoptionof local renewable energy resources. What is most interestingand unique about the LCP initiative is their desire to develop

Fig. 1. The proposed organizational chart of the joint action agency (Com-munity Power New Hampshire) under formation.
a transactive energy market to foster an active retail marketwhere consumers can trade in a variety of electricity productsand services while also ensuring the overall resilience of theirelectricity grid. In addition, the city has undertaken severalsteps to improve its energy portfolio by investing in smartstreet-lighting, building energy conversion, small-scale hydro,landfill gas-to-electricity, and electric vehicle (EV) charginginfrastructure. It has also participated in a household batterypilot. These efforts benefit greatly from the enactment oftwo major bills: the statewide, multi-use online energy dataplatform bill (SB284) [3] and the NH municipal aggregationbill (SB286) [4].
SB284 establishes a state-wide multi-use online energy dataplatform to provide consumers and stakeholders access to safeand secure information about their energy usage [3]. Thisdata platform provides access to robust data that increasesawareness of energy use, and supports municipal/county aggre-gations through better planning and understanding of marketdynamics [3]. The development of this energy data platformis underway with the NH Public Utilities Commission (NHPUC) docket DE 19-1971. There, the authors have advocatedmodel-based system engineering (MBSE) principles to collect,aggregate, and anonymize consumer electricity use data in away that is easy to access and allows for a variety of researchapplications and business cases [3]. In addition, this dataplatform will likely consists of an application programminginterface (API) that various stakeholders can use to meet theirdata needs [3]. By allowing transparency and data access,this bill facilitates the establishment of municipal and countyaggregations that can draw from this data to make informeddecisions about the energy usage of their residents and col-laborate easily with utilities. In the meantime, the SB286allows for municipalities to form aggregations so as to procureelectricity and energy services on behalf of their consumers.Consumers that do not opt-out of the aggregation agree to havethe municipality or county government supply their electricityand provide other services such as demand side management,
1[fn] See tab 65 at: https://www.puc.nh.gov/Regulatory/Docketbk/2019/19-197.html
meter services, and energy efficiency and renewable energyacquisition. Together, these two bills promote not only theformation of CCAs but also allow for broader collaborationamong New Hampshire communities.
Since the enactment of the SB284 and SB286, collaborationamong New Hampshire community energy groups has in-creased significantly. To foster these collaborations and knowl-edge sharing, Lebanon and several other New HampshireCommunities have come together to collectively form a JointAction Agency called: “Community Power New Hampshire”.As Figures 1 and 2 depict, for every Community PowerAggregation that elects to join the governance board and sharein the cost of services, the agency will enroll default electricityservice customers on an opt-out basis and assume control ofwholesale and retail functions, irrespective of distribution util-ity territory, per the authorities granted under SB286. The JointAction Agency is designed to catalyze market transformationboth by implementing these systems on a statewide basisfor participating communities, and by coalescing communitiesto speak with one voice at the regulatory commission andlegislature to support necessary rule reforms and broaderinvestments in common infrastructure to enable TransactiveEnergy. Together, these communities establish the concept ofa shared integrated grid that is characterized by: 1) integralsocial and retail market engagement from electricity con-sumers, 2) the digitization of energy resources with the energyinternet of things (eIoT), and 3) widespread community-levelcoordination [5].
Fig. 2. Educational material explaining Community Power Aggregation (CPA)authorities.
A. Contribution
This paper seeks to tie the “macro-picture” of activating thedemand-side into the “social-picture” of integral communityengagement in the form of community power to establish ashared-integrated grid. First, it presents the efforts within NewHampshire to develop municipal/county-level aggregationsand a state-wide online data platform. These efforts indicate aclear determination towards the sustainable energy transitionas well as integral social engagement at the community andstate level. Second, this paper discusses the collaborationbetween the City of Lebanon, NH, Liberty Utilities andDartmouth College to develop a transactive energy prototypefor the city. It presents the overall structure of the transactive

energy platform, introduces key mathematical concepts em-ployed in the TE prototype and the data to be utilized in thestudy.
B. Outline
This paper is structured as follows. Section II, discusses thedevelopment of community power aggregations within NewHampshire. Section III presents the transactive energy im-plementation for the Lebanon Community Power. Section IVpresents simulation results on a simple 13 node feeder inLebanon. Finally, the paper concludes in Section V.
III. THE TRANSACTIVE ENERGY MODEL
The Lebanon-LIINES collaboration presents a realization ofthis shared-integrated grid concept. The LIINES is currentlytasked with developing a transactive energy control prototypeto support the LCP initiative. The goal of the TE platformis to support real-time market transactions of the aggregationwhile ensuring that the Lebanon electricity distribution systemcontinues to function securely and reliably. The prototypetransactive energy market is to be secured through blockchainfor Lebanon residents to trade carbon-free electricity productsand services with each other. It employs a distributed controlalgorithm that is better able to scale with the accelerating ex-plosion of actively-controlled eIoT devices than a comparablecentralized algorithm; thereby enabling a new generation ofenergy prosumers and entrepreneurs to engage in the grid’stransactive energy markets.
At its core, the TE model implements an economic modelpredictive control (E-MPC) formulation of the alternating cur-rent optimal power flow (ACOPF). The (ACOPF) is chosen asit offers the full implementation of the “power flow equations”which, in turn, are a pseudo-steady state model of Kirchkoff’scurrent law [6], [7]. This allows the model to fully capturethe dynamics of the electricity distribution system. Althoughmost implementations of the ACOPF are single time-stepoptimizations, an E-MPC formulation of the problem is usedhere to fully capture the multi-timescale dynamics introducedby variable renewable energy resources (VREs) such as solarand wind. MPC is an optimal feedback control technique thatuses the dynamic state of a system to predict over a finiteand receding time horizon how the state of the system evolvesand uses only the solution for the first time-step to update thesystem for the next optimization block [8].
This study focuses on distribution systems comprise of largenumbers of distributed energy resources and digital deviceshence a scalable distributed control algorithm is implemented.Several distributed control algorithms have been proposed inliterature to address the challenges of controlling the largenumber of active grid-edge devices. However, the majority ofthese algorithms don’t guarantee optimality for non-convex,non-linear problems such as the ACOPF and therefore, seekto linearize the ACOPF to either the DCOPF, or to convexvariants through the semi-definite and second-order cone pro-gramming (SOCP) relaxations [9], [10]. While linearizationoffers various convergence benefits, it generally fails to capture
the physical dynamics of the distribution systems. In additionmany of the proposed distributed control algorithms such asthe Alternating Direction Method of Multipliers (ADMM),Alternating Target Cascading (ATC), and Dual Ascent havepractical implementation weaknesses that make them unreli-able when applied to large-scale applications [11]. The mostcommon distributed control algorithm is the ADMM whichhas been widely studied in literature in its application to theelectric power grid [12], [13]. Unfortunately, recent studieshave shown that the convergence of the ADMM dependshighly on the choice of tuning parameters in convex spacesand is all-together not guaranteed in non-convex spaces suchas the ACOPF [11]. In recent years, the ALADIN algorithmhas been proposed in the literature as not just an alternativeto the ADMM but also as a solution with better convergenceguarantees even for non-convex applications [14], [15]. Forthese reasons, this work implements the ALADIN algorithm.
A. The AC Optimal Power Flow Problem
The ACOPF calculates the steady-state power flows withina given electricity grid. It is comprised of an objectivefunction in the form of a cost minimization, social welfaremaximization, or transmission loss minimization among oth-ers. It is usually constrained by generation capacity limits,voltage magnitude limits, and the power flow constraints butother constraints may be added depending on the need. Thetraditional ACOPF formulation is presented below:
min C(PG) = PTGC2PG +CT
1 PG +C01 (1)
s.t. AGPG!ADPD = Re{diag(V )Y "V "} (2)
AGQG!ADQD = Im{diag(V )Y "V "} (3)
PminG # PG # Pmax
G (4)
QminG # QG # Qmax
G (5)
V min # |V |#V max (6)
eTx !V = 0 (7)
where ex is an elementary basis vector that defines the xth
bus as the reference bus. Equation 1 represents the quadraticgeneration cost function where PG is the vector of powerinjections from power plants, C2, C1, and C0 are the quadratic,linear, and fixed cost coefficients of the generation fleet.Note that C2 is a diagonal matrix and so the generationcost objective function is separable by generator. It may beequivalently written as:
C(PG) = !g$G
c2gP2g + c1gPg + cog (8)
To continue, Equations 2 and 3 are the active and reactivepower flow constraints respectively where PD is the forecastedelectricity demand for electricity. AG and AD are the generator-to-bus and load-to-bus incidence matrices for generators andloads. Equations 4, 5, and 6 represent the capacity limitson active power injections, reactive power injections and busvoltage limits respectively. Finally, 7 sets the voltage angle ofthe chosen reference bus to 0.

Fig. 3. A simple 13 node feeder.
B. A Generic Non-linear Economic MPC Formulation
Model predictive control is an optimization-based controlalgorithm that solves a dynamic optimization problem over areceding time horizon of T discrete time steps. It solves theoptimization problem over k=[0,. . . , T-1] and then applies thecontrol input u[k=0]. The clock is then incremented and thesame process is repeated over k=[1,. . . , T] and so on. An MPCalgorithm is especially important as the electricity grid evolvesto include more variable renewable energy resources suchas solar and wind. A non-linear economic model predictivecontrol algorithm is presented below [8].Algorithm 1: Nonlinear Economic Model Predictive Con-trol Algorithm
argminuk=0
J =T!1
!k=0
xTk Qxk +uT
k WuTk +Axk +Buk (9)
s.t. xk+1 = f (xk,uk, dk) (10)
xmin # xk # xmax (11)
umin # uk # umax (12)
xk=0 = x0 (13)
whereby Equation 9 represents the economic objective func-tion, Equation 10 defines the non-linear dynamic systemstate equation and Equations 12, and 11 define the capacityconstraints for the system inputs and states respectively. Lastly,Equation 13 defines the initial conditions. Finally, xk, uk, anddk are the system state, input, and predicted disturbance atdiscrete time k.
C. An Economic MPC Formulation of a Multi-Period AC
Optimal Power Flow
This ACOPF formulation in Section III-A lacks severalfeatures: 1.) a multi-time period formulation, 2.) rampingconstraints on generation units, and 3.) an explicit descriptionof system state. The last of these requires the most significantattention. The power flow equations in Equations 15 and 16are derived assuming the absence of power grid imbalancesand energy storage [6]. In reality, however, all power systembuses are able to store energy; even if it be in relatively smallquantities. Consequently, relaxing the inherent assumptionsfound in the traditional power flow equations introduces astate variable xk associated with the energy stored at the powersystem buses during the kth time block. Naturally, limits areimposed on this state variable to reflect the physical realityand an initial state x0 is included in the EMPC ACOPFformulation.
argminPGk=0
J =T!1
!k=0
PTGkC2PGk +CT
1 PGk +C01 (14)
s.t. xk+1 = xk + . . . (15)
"T!
AGPGk!ADPDk!Re{diag(Vk)Y"V "k }
"
0 = AGQGk!ADQDk! Im{diag(V )Y "V "} (16)
PminG # PGk # Pmax
G (17)
QminG # QGk # Qmax
G (18)
"T RminG # PGk!PG,k!1 #!"T Rmax
G (19)
V min # |Vk|#V max (20)
xmin # xk # xmax (21)
eTx !Vk = 0 (22)
xk=0 = x0 (23)
Note that this EMPC ACOPF formulation is equivalent tothe traditional ACOPF when T = 0, xmin = xmax = 0 andRmin
G ,RmaxG % #.
D. The ALADIN (Augmented Lagrangian Alternating Direc-
tion Inexact Newton) Algorithm
The ALADIN algorithm admits an optimization problem ofthe form:
argminyi
J = !i
f (yi) (24)
s.t. hi(yik) = 0 (25)
Aiyik = 0 (26)
ymini # yi # ymax
i (27)
where the generic cost function J is separable with respect to Nsets of decision variables yi. Furthermore, there is a non-linear,not necessarily convex, function hi(yik) for each yi. Equation26 is a linear consensus constraint which serves as the onlycoupling between the subsets of decision variables. Finally,Equation 27 adds minimum and maximum capacity constraintson the decision variables. The distributed control algorithmfor solving the above optimization problem is discussed infull in [15] and proven to converge for non-linear non-convexfunctions hi.
The EMPC ACOPF problem is now solved using theALADIN algorithm as a distributed control approach. Inorder to do so, the decision variables [PGk;QGk; |Vk|;!Vk]&k =[0, . . . ,T ! 1] are partitioned into several sets of decisionvariables yi = [PGi;QGi; |Vi|;!Vi]&i = [1, . . . ,N]; each corre-sponding to a predefined control area. The objective functionin Equation 14 is then recast in separable form as in Equation8 with each generator assigned to a specific control area. Thestate equations in Equations 15 and 16 are further partitionedby control area and constitute the non-linear, non-convexfunctions hi(). At this point, the consensus constraints inEquation 26 serve to ensure that the flow of power goingfrom one control area i1 to another control area i2 is equaland opposite to the flow of power going from i2 to i1. Theremaining constraints of the EMPC ACOPF problem mapstraightforwardly to the capacity constraints of the ALADIN

optimization problem. [16] provide further background expla-nation of how the ALADIN optimization problem maps to atraditional ACOPF formulation.
Fig. 4. This figure illustrates the convergence of the distributed optimization tothe centralized objective cost value while ensuring consensus at the boundarybuses.
IV. SIMULATION RESULTS AND DISCUSSION
As a result of this collaboration, the team has acquiredand processed the necessary system data for the City ofLebanon. The system data includes 10 feeders with a totalof 5897 nodes as well as 1-minute power injection profilesfor each individual feeder. However, this paper demonstratessimulation on the smallest 13 node feeder with a peak load of6000kW. This feeder supplies electricity to the main hospitalin Lebanon and as a result its demand profile is fairly flatthroughout the day. Figure 3(a) depicts the 13 node feeder andFigure 3(b) represents the feeder split into two areas. Each areais comprised of several stochastic loads and a 300kW solarPV system. The substation serves as the reference bus andalso a controllable generator. An MPC simulation is run every5 minutes for a time horizon T = 5minutes with a 1-minutetime-step. The two areas must reach consensus as to the realand reactive power flows at the boundary between buses 4 and5 of Figure 3. Figure 4 illustrates that consensus is reachedfor the boundary buses within 10 iterations and the objectivecost of the ALADIN implementation also equals that of thecentralized solution.
Figure 5 illustrates that the ALADIN generation closelymatches the generation by the MPC implementation and thatdemand is met. These results not only indicate the convergenceof the formulation presented in this paper but they also producethe same results as the centralized solution.
V. CONCLUSION
This paper has presented a distributed economic modelpredictive control algorithm of the ACOPF using ALADIN. Itillustrates the importance of distributed algorithms for tacklingthe growing complexity of distribution grids. Specifically, ittests this algorithm on a 13-bus distribution grid feeder forthe City of Lebanon and shows that the algorithm convergeswithin 10 iterations and that consensus is reached with the
Generation Results: ALADIN vs. Centralized
0 20 40 60 80 100 120 140
Time (mins)
0
500
1000
1500
2000
2500
3000
Po
we
r G
en
en
era
tion
(K
W)
ALADIN GenerationALADIN SolarALADIN LossesCentralized: Total GenerationTotal Demand
Fig. 5. ALADIN vs. centralized ACOPF generation results.
generation for ALADIN exactly matching that of the central-ized formulation.
REFERENCES
[1] E. J. OShaughnessy, J. S. Heeter, J. Gattaciecca, J. Sauer, K. Trumbull,and E. I. Chen, “Community choice aggregation: Challenges, opportu-nities, and impacts on renewable energy markets,” National RenewableEnergy Lab.(NREL), Golden, CO (United States), Tech. Rep., 2019.
[2] P. Kuo, “Should uc berkeley use community choice aggregation (cca)to achieve zero-carbon electricity by 2025?” Class project for CE268,p. 5, 2014.
[3] SB284. (2019) SENATE BILL 284, Chapter316, NH Laws of 2019. [Online]. Available:http://gencourt.state.nh.us/bill Status/billText.aspx?sy=2019&id=1053&txtFormat=html
[4] SB286. (2019) SENATE BILL 286, Chapter286, NH Laws of 2019. [Online]. Available:http://gencourt.state.nh.us/bill Status/billText.aspx?sy=2019&id=1077&txtFormat=html
[5] S. O. Muhanji, C. Below, T. Montgomery, and A. M. Farid,“Towards a Shared Integrated Grid in New Englands Energy WaterNexus,” in IEEE International Symposium on Technology and Society,Boston, MA, United states, 2019, pp. 1–7. [Online]. Available:http://dx.doi.org/10.1109/ISTAS48451.2019.8938013
[6] A. G. Exposito, A. Gomez-Exposito, A. J. Conejo, and C. Canizares,Electric energy systems: analysis and operation. CRC Press, 2016.
[7] S. Frank, I. Steponavice, and S. Rebennack, “Optimal power flow: abibliographic survey i,” Energy Systems, vol. 3, no. 3, pp. 221–258,2012.
[8] M. Ellis, H. Durand, and P. D. Christofides, “A tutorial review of eco-nomic model predictive control methods,” Journal of Process Control,vol. 24, no. 8, pp. 1156–1178, 2014.
[9] D. K. Molzahn and I. A. Hiskens, “Convex relaxations of optimal powerflow problems: An illustrative example,” IEEE Transactions on Circuitsand Systems I: Regular Papers, vol. 63, no. 5, pp. 650–660, 2016.
[10] D. K. Molzahn, J. T. Holzer, B. C. Lesieutre, and C. L. DeMarco,“Implementation of a large-scale optimal power flow solver basedon semidefinite programming,” IEEE Transactions on Power Systems,vol. 28, no. 4, pp. 3987–3998, 2013.
[11] D. K. Molzahn, F. Dorfler, H. Sandberg, S. H. Low, S. Chakrabarti,R. Baldick, and J. Lavaei, “A survey of distributed optimization andcontrol algorithms for electric power systems,” IEEE Transactions onSmart Grid, vol. 8, no. 6, pp. 2941–2962, 2017.
[12] T. Erseghe, “Distributed optimal power flow using admm,” IEEE trans-actions on power systems, vol. 29, no. 5, pp. 2370–2380, 2014.
[13] J. Guo, G. Hug, and O. Tonguz, “Asynchronous admm for dis-tributed non-convex optimization in power systems,” arXiv preprintarXiv:1710.08938, 2017.
[14] B. Houska, J. Frasch, and M. Diehl, “An augmented lagrangian basedalgorithm for distributed nonconvex optimization,” SIAM Journal onOptimization, vol. 26, no. 2, pp. 1101–1127, 2016.
[15] B. Houska, D. Kouzoupis, Y. Jiang, and M. Diehl, “Convex optimizationwith aladin,” Optimization Online preprint, http://www. optimization-online. org/DBHTML/2017/01/5827. html, 2017.
[16] A. Engelmann, Y. Jiang, T. Muhlpfordt, B. Houska, and T. Faulwasser,“Toward distributed opf using aladin,” IEEE Transactions on PowerSystems, vol. 34, no. 1, pp. 584–594, 2018.

1
A Distributed Economic Model Predictive ControlDesign for a Transactive Energy Market Platform in
Lebanon, NHSteffi Olesi Muhanji, Student Member, IEEE, Samuel V. Golding, Tad Montgomery, Clifton Below,
and Amro M Farid, Senior Member, IEEE
Abstract—The electricity distribution system is fundamentallychanging due to the widespread adoption of variable renew-able energy resources (VREs), network-enabled digital physicaldevices, and active consumer engagement. VREs are uncertainand intermittent in nature and pose various technical challengesto power systems control and operations thus limiting theirpenetration. Engaging the demand-side with control structuresthat leverage the benefits of integral social and retail marketengagement from individual electricity consumers through activecommunity-level coordination serves as a control lever that couldsupport the greater adoption of VREs. This paper presents a Dis-tributed Economic Model Predictive control (DEMPC) algorithmfor the electric power distribution system using the augmentedlagrangian alternating direction inexact newton (ALADIN) algo-rithm. Specifically, this DEMPC solves the Alternating CurrentOptimal Power Flow (ACOPF) problem over a receding time-horizon. In addition, it employs a social welfare maximizationof the ACOPF to capture consumer preferences through explicituse of time-varying utility functions. The DEMPC formulationof the ACOPF applied in this work is novel as it addresses theinherent dynamic characteristics of the grid and scales with theexplosion of actively controlled devices on the demand-side. Thepaper demonstrates the simulation methodology on a 13-nodeLebanon NH distribution feeder.
I. INTRODUCTION
In recent years, significant attention has shifted towardsthe effective technical and economic control of the electricitydistribution system to address the complex challenge of oper-ating electricity grids with large amounts of variable renewableenergy resources (VREs) such as solar and wind. This shiftin focus has been driven primarily by the rapid evolutionof distribution grids to include: 1) a more active consumerbase, 2) numerous smart digital devices, and 3) large amountsof distributed energy resources (DERs) [1]. Unfortunately,the ambitious goal of decarbonizing the electric power gridwhile enhancing its sustainable and resilient operation presentstechnical, economic, and regulatory challenges.
S. O. Muhanji is with the Thayer School of Engineering at Dartmouth,Hanover, NH, 03755 USA email: [email protected].
S. Golding is President and Co-Founder of Community Choice PartnersInc., Concord, NH USA email: [email protected].
T. Montgomery is the Energy and Facilities Manager with the City ofLebanon, NH 03766, USA email: [email protected].
C. Below is the Assistant Mayor with the City of Lebanon, NH, 03755USA email: [email protected].
A. M. Farid an Associate Professor with the Thayer School of Engineeringat Dartmouth, Hanover, NH, 03755 USA email: [email protected].
Manuscript received October 31, 2020; revised ————.
The first of these technical challenges is that the uncer-tain and intermittent nature of VREs appears over multipletimescales and horizons [2]. This necessitates control tech-niques that capture the inter-timescale dynamics introduced tothe electricity net load by VREs [1]. In that regard, numerousmodel predictive control (MPC) algorithms – centralized aswell as distributed – have been proposed for power systemsapplications within the context of VRE integration. MPC isan optimal feedback control technique that uses the dynamicstate of a system to predict over a finite and receding timehorizon how the state of the system evolves and uses onlythe solution for the first time-step to update the system forthe next optimization block [3]. This feedback-based closed-loop control helps to compensate for the net-load variationsand stochasticity introduced by VREs in real-time operations[4]. A majority of the proposed centralized applications havefocused on the dynamic economic dispatch problem [4]–[6] for systems with a high penetration of VREs or onoptimal dispatch of DERs for distribution system microgrids[7], [8]. In the meantime, decentralized approaches exploresimilar themes as centralized ones with most focusing on theeconomic dispatch problem [9] or environmental dispatch withintermittent generation resources [4], [10]. However, a recentstudy has shown that the convergence to optimal values isnot always guaranteed for decentralized approaches and thata majority of these studies neither consider ramping rates northe impact of VREs on dispatch decisions [9].
The second of these technical challenges is that a highpenetration of VREs undermines the dispatchability of the gen-eration fleet and, therefore, requires the activation of demandside resources. Traditionally, the generation fleet comprisedof large controllable thermal power plants meant to servefairly passive loads. However, as more and more VREs areadded to the electricity grid, the variability of the systemnet load increases significantly introducing with it dynamicsthat span multiple timescales. The term “net load” here isdefined as the forecasted demand minus the forecasted variablegeneration from wind and solar. This means that in real-timeoperations, controllable generators must not only compensatefor net load forecast errors but also provide extensive rampingcapability to account for changes in variable generation due toexternal factors such as solar irradiance and wind speed. In themeantime, there are fewer dispatchable generators to serve thisbalancing role. This two-fold technical challenge greatly limitsthe penetration of VREs and, therefore, calls for more highly

2
responsive control levers. Activating the demand-side is seenas the remaining potential control lever given its evolutionto include: 1) an active consumer base, 2) numerous smartenergy internet of things (eIoT) devices, and 3) large amountsof distributed energy resources (DERs). These three factorsincrease the controllability of the demand-side paving the wayfor various demand-side management (DSM) solutions thatcan be used to shift, shed, and/or increase electricity demandin the real-time in order to balance variations in net load.
The dynamic nature of VREs also necessitates frequentdecision-making which requires automated (rather than man-ual) solutions on distributed edge devices called the energyInternet of Things (eIoT). This frequent decision-makingrequires robust information and communication technologies(ICTs) that enable intelligent coordination of these distributedeIoT devices [11]. eIoT solutions must scale with the numberof devices, deal with computational complexity and handlecommunication with other distributed devices in a timelyfashion [11], [12]. Multi-agent systems (MAS) have beenproposed in the literature to address the practical challengesof controlling a large number of active grid edge devicesin the short time span of power grid markets [11] . Smartdevices whether it is rooftop solar, electric vehicles (EVs),programmable thermostats, or battery energy storage, cancoordinate as agents within a MAS to reach a global consensusthat maintains power system balance or stability. In MASapproaches, agents can simplify decision making by commu-nicating with only their neighbours to make local decisionsthat inform higher-level decisions [13]–[15]. This significantlyreduces the amount of shared information among agents andalso allows for a more robust system by eliminating thesingle point of failure. At the core of MAS applications aredistributed control algorithms that are employed to solve localsub-problems so as to reach consensus on global objectives.
The integration of demand side resources at the gridperiphery begets a third challenge; the shear number. Thedemand-side is comprised of millions or even billions ofactively interacting cyber-physical devices that are distributedboth spatially as well as functionally [11], [16]. Controllingthese devices requires correspondingly distributed and scalablecontrol algorithms [12]. Distributed control algorithms havebeen proposed as solutions that can scale up to such a largenumber of devices and still be implemented in the minute-timescale of power system markets [1]. Through effectivecoordination, distributed control algorithms can be used tocoordinate local sub-problems to reach a global objectivesimilar to that achieved by centralized algorithms [1].
In addition, these algorithms must respect the physical con-straints of the grid which are both non-linear and non-convex.The optimal power flow (OPF) problem is among the mostcommon optimization problems used in the economic controlof the power system [17]. The OPF determines the optimalflows of power through a given electricity network to meetdemand and respect operational constraints. Several variantsof the OPF problem exist [18], [21], [21]; the alternatingcurrent (AC) OPF variant uses the full implementation of the“power flow equations” which, in turn, are a pseudo-steadystate model of Kirchkoff’s current law [17], [18], [22] and is
thus, non-linear and non-convex. As one would expect, variousdistributed control algorithms have also been proposed forthe OPF problem [23]. However, due to the non-linear, non-convex nature of the ACOPF, a majority of these algorithmsseek to either linearize the ACOPF or use other relaxationtechniques such as semi-definite programming (SDP) [24],[25] or second-order cone programming (SOCP). While suchmathematical simplifications have their algorithmic merits,they often fail to fully capture the complex and dynamicbehaviour of distribution systems [23]. Additionally, manyof the proposed algorithms such as the Alternating DirectionMethod of Multipliers (ADMM), Alternating Target Cascading(ATC), and Dual Ascent have practical implementation weak-nesses that make them unreliable when applied to large-scaleapplications [23]. The most common of these algorithms is theADMM which has been widely studied in the literature in itsapplication to the electric power grid [26], [27]. Unfortunately,recent studies have shown that the convergence of the ADMMdepends highly on the choice of tuning parameters in convexspaces and is all-together not guaranteed in non-convex spacessuch as the ACOPF [23]. In recent years, the AugmentedLagrangian Alternating Direction Inexact Newton (ALADIN)algorithm has been proposed in the literature as not just analternative to the ADMM but also as a solution with betterconvergence guarantees even for non-convex applications suchas the ACOPF [28], [29].
To be successful on a practical level, in addition to thetechnical challenges above, the distributed control algorithmmust be implemented within an appropriate commercial andregulatory framework. Community choice aggregation (CCA)represents one such framework, and is authorized in California,Massachusetts, New York, New Jersey, Illinois, Ohio, RhodeIsland and New Hampshire [30]. It is a policy that allowslocal governments (e.g. towns, cities and counties) to becomethe default electricity provider and enroll customers withintheir municipal boundaries that are currently on utility basicservice on an opt-out basis [30]. CCAs compete on the basis ofelectricity procurement and retail innovation by offering con-sumers access to a broader portfolio of electric products, oftenat more competitive prices than those traditionally offered byutilities [30], [31]. CCAs are thus naturally incentivized tofacilitate retail demand flexibility and the intelligent manage-ment of distributed energy to create revenue streams in newways, by integrating these assets into wholesale market oper-ations, the CCAs portfolio risk management, and distributioncompany network planning and operations. CCAs are, there-fore, also incentivized to advocate for the regulatory reformsnecessary to value and monetize Distributed Energy Resourcesin ways that account for their temporal and geographic at-tributes, and to expand data interchange and market accessfor innovative third-party companies. CCAs in certain states,most notably in California, have consequently focused onexpanding retail programs and third-party customer services,and engaged in multi-sectoral decarbonization planning andlocal infrastructure development (e.g. microgrids, non-wiresalternatives) [?]. However, CCAs may face operational barriersto retail innovation due to the statutory requirement that dis-tribution utilities continue to provide retail meter reading, data

3
management and consolidated billing functions [?]. The NewHampshire market is distinguished as the only state whereinthe statutory authorities of CCAs allow for the direct provisionof the aforementioned retail customer services, which arecritical to enabling Transactive Energy. Consequently, CCAsin New Hampshire represent a viable commercial pathwayto overcome legacy utility IT systems and implement theconcept of a shared integrated grid that is characterized by: 1)integral social and retail market engagement from electricityconsumers, 2) the digitization of energy resources with theeIoT, and 3) widespread community-level coordination [32].Towards this end, the City of Lebanon and other interested mu-nicipalities are drafting a Joint Power Agreement [?] to createan agency called “Community Power New Hampshire” [?] thatwill offer operational services to all CCAs on a statewide basis,and have already begun engaging in regulatory proceedings tocreate the market and control structures necessary to enablethe efcient and low-cost exchange of energy data, productsand services1.
To increase consumer participation, CCAs must provide gridservices that engage consumers and allow for the expressionof their preferences. Typically, the bulk of consumers at thedistribution system are residential homes. These consumersgenerally represent small loads and are driven by factors suchas comfort, ease of use, and cost. This naturally demandsmarket and control structures within CCAs that ultimatelyenable the efficient, and low-cost exchange of electricityproducts and services among consumers. These market andcontrol structures must recognize that the value of electricitydemand changes not just with quantity but also with the time ofday. For instance, a commercial supermarket may be unwillingto shed 1kw of consumption for refrigeration at 7am as theyare opening but could shed 1kw for laptop computers in themiddle of the day after their batteries have been charged.Similarly, someone with a set routine may be willing to paymore for a hot-water shower in the morning than for thesame shower in the afternoon. Given the time and usage valueof electricity, transactive energy market models implementedby CCAs must capture the social benefits to consumers byexplicitly implementing time-varying utility functions.
A. Contribution
Given these many technical, economic, and regulatory con-siderations, this paper develops a distributed transactive energycontrol system for the economic control of an electric powerdistribution system. It offers several key novel features relativeto the existing literature. (1) Unlike the traditional singletime step ACOPF problem based upon algebraic constraints,this work recasts the ACOPF formulation into an economicMPC with a finite look-ahead time horizon and explicit statevariables. Consequently, the system proactively responds to thevariability of the net load while controlling the energy storedwithin the distribution system. (2) The objective function inthis work minimizes social welfare and incentivizes demand-side participants to have elastic behavior. (3) Demand-side
1Refer to filings submitted by the City of Lebanon and the Lo-cal Government Coalition in NH PUC Docket 19-197. Available online:https://www.puc.nh.gov/Regulatory/Docketbk/2019/19-197.html
utility functions applied in this study are also explicitly time-varying to account for consumer’s preferences changing overthe course of the day. (4) To account for the potential explosionof active devices at the grid’s periphery, the EMPC problemis implemented as a multi-agent control system based on theALADIN algorithm which has been proven to converge toa local minimizer even for nonlinear, non-convex constraintssuch as those presented by the ACOPF equations. (6) Finally,the DEMPC is tested on a 13-bus feeder from the City ofLebanon, NH in which controllable demand, controllable gen-eration, stochastic generation and stochastic demand resourceshave been added.
B. Outline
The rest of this paper is organized as follows: In SectionII-A, the ACOPF problem, in its generic form, is presented.Section II-B introduces a generic formulation of economicMPC problem. Section III-A outlines the ACOPF problemreformulated as an economic MPC with a social welfareminimization to capture consumer preferences. Section III-Bthen introduces the ALADIN algorithm and discusses itsapplication to the previously mentioned EMPC ACOPF model.Section IV numerically demonstrates the convergence of AL-ADIN to the EMPC-ACOPF model for a 13-bus feeder for theCity of Lebanon, NH and provides a discussion of the results.Finally, the paper is concluded in Section V.
II. BACKGROUND
A. The AC Optimal Power Flow Problem
The ACOPF calculates the steady-state flows of powerwithin any given electrical network. It is comprised of anobjective function typically a generation cost minimization andis constrained by generation capacity limits, voltage magnitudelimits, and power flow constraints. The traditional ACOPFformulation is presented below:
min C(PGC) = PTGCC2PGC +CT
1 PGC +C01 (1)
s.t. AGCPGC!ADSPDS = Re{diag(V )Y "V "} (2)
AGCQGC!ADSQDS = Im{diag(V )Y "V "} (3)
PminGC # PGC # Pmax
GC (4)
QminGC # QGC # Qmax
GC (5)
V min # |V |#V max (6)
eTx !V = 0 (7)
The following notations are used in this formulation:GC index for controllable generators
DS index for traditional demand units
C2,C1,C0 quadratic, linear, and fixed cost terms
of the generation fleet
ex reference angle elementary basis vector
PGC,QGC active/reactive power generation
PDS, QDS total forecasted active/reactive demand
PminGC ,Pmax
GC min/max active generation limits
QminGC ,Q
maxGC min/max reactive generation limits
V min,V max min/max voltage limits at buses

4
Y bus admittance matrix
V bus voltages
NG number of generators
AGC generator-to-bus incidence matrix
ADS load-to-bus incidence matrix
Equation 1 represents the quadratic generation cost function.Note that C2 is a diagonal matrix and so the generation costobjective function is separable by generator. This cost functionmay be equivalently written as:
C(PG) = !g$G
c2gP2g + c1gPg + c0g (8)
Equations 2 and 3 define the active and reactive powerflow constraints at a bus respectively. While Equations 4, 5,and 6 represent the active power generation, reactive powergeneration and bus voltage limits. Finally, 7 sets the voltageangle of the chosen reference bus(es) to 0.
B. A Generic Non-linear Economic MPC Formulation
MPC is an optimization-based control algorithm that solvesa dynamic optimization problem over a receding time horizonof T discrete time steps. The solution to the optimizationproblem is computed over k=[0,. . . , T-1] and the solution fork = 0 is applied to the control input u[k=0]. The clock is thenincremented and the same process is repeated over k=[1,. . . ,T] and so on. A generic non-linear economic model predictivecontrol algorithm is presented below [3].
argminuk=0
J =T!1
!k=0
xTk Qxk +uT
k WuTk +Axk +Buk (9)
s.t. xk+1 = f (xk,uk, dk) (10)
umin # uk # umax (11)
xmin # xk # xmax (12)
xk=0 = x0 (13)
dk predicted disturbance at discrete time k
xk,uk system states and inputs at time k
xmin,xmax min/max system state limits
umin,umax min/max system input limits
whereby Equation 9 represents the economic objective func-tion, Equation 10 defines the non-linear dynamic system stateequation while Equations 11, and 12 define the capacityconstraints for the system inputs and states respectively. Lastly,Equation 13 defines the initial conditions.
III. METHODOLOGY AND SIMULATION SETUP
A. An Economic MPC Formulation of a Multi-Period AC
Optimal Power Flow
The ACOPF formulation in Section II-A lacks severalfeatures: 1.) a multi-time period formulation, 2.) rampingconstraints on generation units, 3.) controllable demand andstochastic generation units , 4) a time-varying demand-sideutility function, and 5) an explicit description of system state.The last of these requires the most significant attention. The
power flow equations in Equations 17 and 18 are derivedassuming the absence of power grid imbalances and energystorage [17]. In reality, however, all power system buses areable to store energy; even if it be in relatively small quantities.Consequently, relaxing the inherent assumptions found in thetraditional power flow equations introduces a state variable xk
associated with the energy stored at the power system busesduring the kth time block. Naturally, limits are imposed on thisstate variable to reflect the physical reality and an initial statex0 is included in the EMPC ACOPF formulation.
argminPGCk=0
J =T!1
!k=0
!
CGC(PGCk)+CDCk(PV Gk))"
(14)
PV Gk = PDCk!PDCk (15)
QV Gk = QDCk!QDCk (16)
s.t. xk+1 = xk +"T#
AGCPGCk+
. . .AGSPGSk +ADCPV Gk!ADSPDSk!
. . .Re{diag(Vk)Y"V "k }
$
(17)
0 = AGCQGCk +ADCQV Gk!
. . .ADSQDSk! Im{diag(V )Y "V "} (18)
PminGC # PGCk # Pmax
GC (19)
PminV Gk # PV Gk # Pmax
V G (20)
QminV Gk # QV Gk # Qmax
V G (21)
QminGC # QGCk # Qmax
GC (22)
"T RminGC # PGCk!PGC,k!1 # "T Rmax
GC (23)
V min # |Vk|#V max (24)
xmin # xk # xmax (25)
eTx !Vk = 0 (26)
xk=0 = x0 (27)
GS stochastic generators index
DC index for controllable demand units
ADCk,BDCk,CDCk quadratic, linear, fixed cost terms of
controllable demand at time k.
RminGC ,R
maxGC max/min generation ramp limits
PGCk,QGCk active/reactive controllable generation at k
PGSk active stochastic generation at time k
PDSk, QDSk active/reactive demand forecast at time k
PDCk, QDCk active/reactive forecasted controllable
demand at discrete time k
PDCk,QDCk active/reactive dispatched controllable
demand at discrete time k
xk+1 system state at time k+1
"T time step of the optimization
AGS,ADC stochastic generator-to-bus & controllable
load-to-bus incidence matrices
Note that this EMPC ACOPF formulation is equivalent tothe traditional ACOPF when T = 0, xmin = xmax = 0 andRmin
G ,RmaxG %#. The objective function has also been modified
to minimize the overall cost of controllable generation and the

5
cost of virtual generation for T discrete time-steps. Notice thatthe cost of controllable generation remains the same as beforeand is given by:
CGC = PTGCkC2PGCk +CT
1 PGCk +C01
Similarly, the cost of virtual generation follows a quadraticform as that of controllable generation and defined as follows:
CDC = (PDCk!PDCk)TADCk(PDCk!PDCk)+ . . .
BTDCk(PDCk!PDCk)+CDCk1
Whereby the coefficients ADCk, BDCk, and CDCk vary in timeto reflect consumer preferences at various points during theday. In addition to these changes, two new energy resourcesare introduced namely, controllable demand (PDCk!PDCk) andstochastic generation PGSk. The virtual generation (PDCk !PDCk) is also subject to capacity limits given by Equation 20.To eliminate baseline errors associated with virtual powerplants [33], the capacity limits of virtual generation are set as20% of forecasted stochastic demand for each demand node.
B. The ALADIN (Augmented Lagrangian Alternating Direc-
tion Inexact Newton) Algorithm
Fig. 1. Area agent architecture.
The ALADIN algorithm admits an optimization problem ofthe form:
argminyi
J = !i
f (yi) (28)
s.t. hi(yik) = 0 (29)
Aiyik = 0 (30)
ymini # yi # ymax
i (31)
where the generic objective function J is separable with respectto N sets of decision variables yi. Furthermore, there is anon-linear, not necessarily convex, function hi() for each yi.Equation 30 is a linear consensus constraint which serves asthe only coupling between the subsets of decision variables.Finally, Equation 31 adds minimum and maximum capacityconstraints on the decision variables. The distributed controlalgorithm for solving the above optimization problem is dis-cussed in full in [29] and proven to converge even for caseswhere the functions hi are non-linear and/or non-convex.
Fig. 2. ALADIN agent architecture.
The distributed ALADIN algorithm is best summarized byFigure 2. The algorithm is comprised of two steps, a fullydistributed step where area agents compute the solution toa non-linear optimization sub-problem for their respectivecontrol area. Each control area represents a power systemarea with a local agent architecture as the one depicted inFigure 1. The sub-problem in a given control area is obtainedby rearranging Equations 28, 29, 30, and 31 as shown inFigure 2.
The area agents then share their hessians, jacobians, gradi-ents, and local solutions with the consensus agent who thendetermines the updates ("yi and !QP) for the dual and primalvariables by solving the quadratically-constrained problem(QCP) shown in Figure 2. Notice that the role of the consensusagent may be carried out by a centralized facilitator or by anyof the local area agents. The dual and primal variables areupdated according to equations 32 and 33. In some cases,a line search is carried out to determine the update rate forcoefficients "1,"2,and "3 otherwise, "1 = "2 = "3 = 1.
zk+1& zk +"k1(y
k! zk)+"k2"yk (32)
! k+1& ! k +"k3(!
QP!! k) (33)
Two penalty parameters # and µ are employed in this al-gorithm for the local sub-problems and the consensus QCPrespectively. These parameters are updated according to Equa-tion 34. r# and rµ are constants that are chosen specifically toaid in updating the penalty parameters.
#k+1(µk+1) =
%
r# #k (rµ µk) if #k < p (µk < µ)
#k(µk) otherwise(34)
The EMPC ACOPF problem presented in Section III-A isnow solved using the ALADIN algorithm as a distributedcontrol approach. In order to do so, the decision variables y =[PGk;QGk; |Vk|;!Vk] 'k = [0, . . . ,T ! 1] are partitioned intoseveral sets of decision variables yi = [PGi;QGi; |Vi|;!Vi] 'i=[1, . . . ,N]; each corresponding to a predefined control areai. The objective function in Equation 14 is then recast in aseparable form as in Equation 8 with each generator assigned

6
Fig. 3. 13-bus distribution feeder for the City of Lebanon NH, with a peak demand of 6000kW, 2 300kW solar PV plants and 7 conventional loads.
to a specific control area. The state equations in Equations 17and 18 are further partitioned by control area and constitutethe non-linear, non-convex functions hi(). At this point, theconsensus constraints in Equation 30 serve to ensure that thepower flowing from one control area i1 to another controlarea i2 is equal and opposite to the power flowing fromi2 to i1. The remaining constraints of the EMPC ACOPFproblem map straightforwardly to the capacity constraints ofthe ALADIN optimization problem. [34]–[36] provide furtherbackground explanation of how the ALADIN optimizationproblem maps to a traditional ACOPF formulation and [28]discusses the general ALADIN algorithm including a linesearch implementation.
IV. NUMERICAL DEMONSTRATION OF CONVERGENCE
The goal of this section is to demonstrate the distributedeconomic model predictive control design as a potential trans-active energy market platform for the City of Lebanon, NH.More specifically, the DEMPC is numerically demonstratedon real-life data from a 13-bus feeder for the City of Lebanondistribution grid shown in Figure 3. (Given the sensitivity ofthe topology and load data from the local utility, it has notbeen shared in this publication.) Figure 3(a) represents theoriginal feeder with 7 conventional loads [LS1 % LS7] thataccount for an annual peak load of 6000kW. For the purposesof this study, two solar photo-voltaic (PV) plants each witha capacity of 300kW are placed on nodes 4 and 6. For adistributed simulation, the 13-bus feeder is broken down intotwo areas as shown in Figure 3(b). Area 1 is comprised ofNodes 0 to 4 while Area 2 is comprised of Nodes 5 through12. To incentivize demand-side participants, virtual powerplants [LC1 % LC7] whose maximum capacity is 20% of thetotal stochastic demand at the node are added. These plantsrepresents the amount of available controllable demand at eachconsumer node in time. Note that the maximum capacity limitof the virtual power plants [LC1 . . .LC7] changes with time andfollows the stochastic demand profile at the individual node.To reach a consensus, the boundary nodes between nodes 4and 5 must reach the same values for active and reactive powerflows as well as angles and voltages for all time steps of theMPC. Additionally, the value of the objective must converge
to that of the centralized solution within some error margin.Finally, to test the methodology, an MPC simulation is runevery 5-minutes with a 25-min horizon and 5-min time step.Results are presented for a single day. The parameter valuesused for this study are based on those presented in [34] andare tweaked as needed. In this study, the two ALADIN penaltyparameters # and µ are as follows: # = [1e2 % 1e5] andµ = [1e3% 1e5]. # is incremented by a factor of 1.5 aftereach iteration while µ is incremented by a factor of 2. A linesearch was not implemented for this demonstration, however,for more complex applications, a line search is recommendedto determine the dual and primal update steps [28]. The activeand reactive demand and net load profiles used in this studyare shown in Figure4(a). The time-varying locational marginalprices (LMPs) that are applied for the virtual power plants areshown in Figure4(c). Finally, Figure4(c) represents the totalcontrollable demand available in the system.
Figure 5(a) compares the active generation profile fromthe ALADIN EMPC implemention to that of the centralizedEMPC approach. As seen in Figure 5(a) the ALADIN solutionmeets demand and results in a final generation profile thatmatches that of the centralized solution. The active powerlosses account for approximately 4-6% of the total demandon the feeder. This result is typical for distribution systems.A comparison of the optimal cost for the centralized versusthe distributed approach (illustrated by Figure 5(b) )showssimilar values with a maximum deviation of 0.0212% from thecentralized solution. These results indicate that the solution ofthe distributed approach closely matches that of the centralizedapproach with small variations that can be resolved with betterparameter estimation and a line search. Finally, Figure 5(c)shows the reactive power generation profile. Similarly, thisfigure illustrates that the reactive power demand on the systemis met and that the centralized and distributed solutions closelymatch.
V. CONCLUSION
This paper has presented the mathematical formulationfor the ACOPF as an EMPC in the context of managingdistribution electricity grids with high penetrations of VREsas well as controllable demand. Inherent to the formulationis an introduction of a non-zero energy storage quantity at

7
0 500 1000 1500
Time (mins)
0
500
1000
1500
2000
2500
3000
3500
Pow
er
(KW
or
KV
AR
)
a) Total System Demand and Net-load
Active LoadReactive LoadNet-load = Active Load-Solar
0 500 1000 1500
Time (mins)
10
15
20
25
30
cents
/kW
b) LMPs for Controllable Demand
0 500 1000 1500
Time (mins)
550
600
650
700
Pow
er
(KW
or
KV
AR
)
c) Total Controllable Demand Available
Fig. 4. Demand and net load profiles, consensus at boundary buses and convergence of the objective cost value to that of the centralized solution.
0 200 400 600 800 1000 1200 1400
Time (mins)
0
1000
2000
3000
Po
we
r (k
W)
a) Generation Profile Centralized vs. Decentralized
Centralized SolutionNetloadSubstationControllable DemandSolarLosses
0 500 1000 1500
Time (mins)
-4
-2
0
2
% c
ost
ch
an
ge
10-2 b) % Optimal Cost
0 200 400 600 800 1000 1200 1400
Time (mins)
0
200
400
600
800
Po
we
r (k
Va
r)
c) Reactive Generation Profile
Centralized SolutionReactive DemandSubstationControllable DemandLosses
Fig. 5. Generation profile comparing the centralized vs. the distributed case and the overall change in optimal cost
each bus as a state variable with capacity constraints. ThisEMPC ACOPF formulation is then recast as a distributedcontrol problem for which the ALADIN algorithm is applied.The paper then demonstrates the methodology on a 13-busfeeder for the City of Lebanon, NH comprising of four typesof energy resources, controllable demand and generation, andstochastic demand and generation. The distributed solutionis shown to converge to a solution that meets demandsand matches the centralized solution. Finally, optimal costresults of the distributed approach closely match those of thecentralized solution within a small margin of error.
REFERENCES
[1] S. O. Muhanji, A. Muzhikyan, and A. M. Farid, “Distributed Controlfor Distributed Energy Resources: Long-Term Challenges & LessonsLearned,” IEEE Access, vol. 6, no. 1, pp. 32 737 – 32 753, 2018.[Online]. Available: http://dx.doi.org/10.1109/ACCESS.2018.2843720
[2] A. M. Farid, B. Jiang, A. Muzhikyan, and K. Youcef-Toumi,“The Need for Holistic Enterprise Control Assessment Methodsfor the Future Electricity Grid,” Renewable & Sustainable EnergyReviews, vol. 56, no. 1, pp. 669–685, 2015. [Online]. Available:http://dx.doi.org/10.1016/j.rser.2015.11.007
[3] M. Ellis, H. Durand, and P. D. Christofides, “A tutorial review of eco-nomic model predictive control methods,” Journal of Process Control,vol. 24, no. 8, pp. 1156–1178, 2014.
[4] L. Xie, M. D. Ilic, and M. D. Ili, “Model Predictive Economic /Environmental Dispatch of Power Systems with Intermittent Resources,”in 2009 Power & Energy Society General Meeting, 2009, pp. 1–6.
[5] X. Xia, J. Zhang, and A. Elaiw, “A Model Predictive Control approachto dynamic economic dispatch problem,” in 2009 IEEE BucharestPowerTech. Ieee, Jun. 2009, pp. 1–7. [Online]. Available: http://ieeexplore.ieee.org/lpdocs/epic03/wrapper.htm?arnumber=5282270
[6] ——, “An application of model predictive control to the dynamiceconomic dispatch of power generation,” Control Engineering Practice,vol. 19, no. 6, pp. 638–648, Jun 2011.
[7] B. Zhu, H. Tazvinga, and X. Xia, “Switched model predictive controlfor energy dispatching of a photovoltaic-diesel-battery hybrid powersystem,” IEEE Transactions on Control Systems Technology, vol. 23,no. 3, pp. 1229–1236, 2014.
[8] E. Mayhorn, K. Kalsi, M. Elizondo, W. Zhang, S. Lu, N. Samaan,and K. Butler-Purry, “Optimal control of distributed energy resourcesusing model predictive control,” in 2012 IEEE power and energy societygeneral meeting. IEEE, 2012, pp. 1–8.
[9] M. A. Velasquez, J. Barreiro-Gomez, N. Quijano, A. I. Cadena, andM. Shahidehpour, “Distributed model predictive control for economicdispatch of power systems with high penetration of renewable energy

8
resources,” International Journal of Electrical Power & Energy Systems,vol. 113, pp. 607–617, 2019.
[10] J. Alejandro, A. Arce, and C. Bordons, “Combined environmental andeconomic dispatch of smart grids using distributed model predictivecontrol,” International Journal of Electrical Power & Energy Systems,vol. 54, pp. 65–76, 2014.
[11] P. Vrba, V. Marik, P. Siano, P. Leitao, G. Zhabelova, V. Vyatkin, andT. Strasser, “A review of agent and service-oriented concepts applied tointelligent energy systems,” Industrial Informatics, IEEE Transactionson, vol. 10, no. 3, pp. 1890–1903, Aug 2014.
[12] A. M. Farid, “Multi-Agent System Design Principles for ResilientCoordination and Control of Future Power Systems,” IntelligentIndustrial Systems, vol. 1, no. 3, pp. 255–269, 2015. [Online].Available: http://dx.doi.org/10.1007/s40903-015-0013-x
[13] G. Santos, T. Pinto, H. Morais, T. M. Sousa, I. F. Pereira, R. Fernandes,I. Praca, and Z. Vale, “Multi-agent simulation of competitive electricitymarkets: Autonomous systems cooperation for european market model-ing,” Energy Conversion and Management, vol. 99, pp. 387–399, 2015.
[14] S. Rivera, A. M. Farid, and K. Youcef-Toumi, “Chapter 15 - a multi-agent system coordination approach for resilient self-healing operationsin multiple microgrids,” in Industrial Agents, P. L. Karnouskos, Ed.Boston: Morgan Kaufmann, 2015, pp. 269 – 285. [Online]. Available:http://amfarid.scripts.mit.edu/resources/Books/SPG-BC01.pdf
[15] V. Toro and E. Mojica-Nava, “Microgrids coordination based on het-erogeneous multi-agent systems,” in Automatic Control (CCAC), 2015IEEE 2nd Colombian Conference on. IEEE, 2015, pp. 1–5.
[16] P. Siano, D. Sarno, L. Straccia, and A. T. Marrazzo, “A novel methodfor evaluating the impact of residential demand response in a realtime distribution energy market,” Journal of Ambient Intelligence andHumanized Computing, vol. 7, no. 4, pp. 533–545, 2016.
[17] A. G. Exposito, A. Gomez-Exposito, A. J. Conejo, and C. Canizares,Electric energy systems: analysis and operation. CRC Press, 2016.
[18] Z. Qiu, G. Deconinck, and R. Belmans, “A literature survey of optimalpower flow problems in the electricity market context,” 2009 IEEE/PESPower Systems Conference and Exposition, pp. 1–6, Mar 2009.
[19] J. A. Momoh, M. El-Hawary, and R. Adapa, “A review of selectedoptimal power flow literature to 1993. part i: Nonlinear and quadraticprogramming approaches,” IEEE transactions on power systems, vol. 14,no. 1, pp. 96–104, 1999.
[20] ——, “A review of selected optimal power flow literature to 1993.part ii: Newton, linear programming and interior point methods,” IEEETransactions on Power Systems, vol. 14, no. 1, pp. 105–111, 1999.
[21] S. Frank, I. Steponavice, and S. Rebennack, “Optimal power flow: abibliographic survey ii,” Energy Systems, vol. 3, no. 3, pp. 259–289,2012.
[22] ——, “Optimal power flow: a bibliographic survey i,” Energy Systems,vol. 3, no. 3, pp. 221–258, 2012.
[23] D. K. Molzahn, F. Dorfler, H. Sandberg, S. H. Low, S. Chakrabarti,R. Baldick, and J. Lavaei, “A survey of distributed optimization andcontrol algorithms for electric power systems,” IEEE Transactions onSmart Grid, vol. 8, no. 6, pp. 2941–2962, 2017.
[24] D. K. Molzahn and I. A. Hiskens, “Convex relaxations of optimal powerflow problems: An illustrative example,” IEEE Transactions on Circuitsand Systems I: Regular Papers, vol. 63, no. 5, pp. 650–660, 2016.
[25] D. K. Molzahn, J. T. Holzer, B. C. Lesieutre, and C. L. DeMarco,“Implementation of a large-scale optimal power flow solver basedon semidefinite programming,” IEEE Transactions on Power Systems,vol. 28, no. 4, pp. 3987–3998, 2013.
[26] T. Erseghe, “Distributed optimal power flow using admm,” IEEE trans-actions on power systems, vol. 29, no. 5, pp. 2370–2380, 2014.
[27] J. Guo, G. Hug, and O. Tonguz, “Asynchronous admm for dis-tributed non-convex optimization in power systems,” arXiv preprintarXiv:1710.08938, 2017.
[28] B. Houska, J. Frasch, and M. Diehl, “An augmented lagrangian basedalgorithm for distributed nonconvex optimization,” SIAM Journal onOptimization, vol. 26, no. 2, pp. 1101–1127, 2016.
[29] B. Houska, D. Kouzoupis, Y. Jiang, and M. Diehl, “Convex optimizationwith aladin,” Optimization Online preprint, http://www. optimization-online. org/DBHTML/2017/01/5827. html, 2017.
[30] E. J. OShaughnessy, J. S. Heeter, J. Gattaciecca, J. Sauer, K. Trumbull,and E. I. Chen, “Community choice aggregation: Challenges, opportu-nities, and impacts on renewable energy markets,” National RenewableEnergy Lab.(NREL), Golden, CO (United States), Tech. Rep., 2019.
[31] P. Kuo, “Should uc berkeley use community choice aggregation (cca)to achieve zero-carbon electricity by 2025?” Class project for CE268,p. 5, 2014.
[32] S. O. Muhanji, C. Below, T. Montgomery, and A. M. Farid,“Towards a Shared Integrated Grid in New Englands Energy WaterNexus,” in IEEE International Symposium on Technology and Society,Boston, MA, United states, 2019, pp. 1–7. [Online]. Available:http://dx.doi.org/10.1109/ISTAS48451.2019.8938013
[33] B. Jiang, A. M. Farid, and K. Youcef-Toumi, “Demand side managementin a day-ahead wholesale market a comparison of industrial and socialwelfare approaches,” Applied Energy, vol. 156, no. 1, pp. 642–654, 2015.[Online]. Available: http://dx.doi.org/10.1016/j.apenergy.2015.07.014
[34] A. Engelmann, T. Muhlpfordt, Y. Jiang, B. Houska, and T. Faulwasser,“Distributed stochastic ac optimal power flow based on polynomialchaos expansion,” in 2018 Annual American Control Conference (ACC).IEEE, 2018, pp. 6188–6193.
[35] A. Engelmann, Y. Jiang, T. Muhlpfordt, B. Houska, and T. Faulwasser,“Toward distributed opf using aladin,” IEEE Transactions on PowerSystems, vol. 34, no. 1, pp. 584–594, 2018.
[36] A. Engelmann, T. Muhlpfordt, Y. Jiang, B. Houska, and T. Faulwasser,“Distributed ac optimal power flow using aladin,” IFAC-PapersOnLine,vol. 50, no. 1, pp. 5536–5541, 2017.
Steffi O. Muhanji Steffi is currently a 5th-year PhDCandidate at the Laboratory for Intelligent IntegratedNetworks of Engineering Systems (LIINES). Herresearch interests are in renewable energy integra-tion, transactive energy, the energy-water nexus anddistributed control. She has a B.A. in Physics witha Computer Science minor from Vassar College anda B.E. with a focus on energy systems from ThayerSchool of Engineering.
Samuel Golding Samuel V. Golding, President ofCommunity Choice Partners Inc., has been a techni-cal consultant and campaign strategist in the Com-munity Choice Aggregation (CCA) industry for overa decade. He is recognized as a pioneer of the jointaction governance structures and advanced operatingmodels that enable CCAs to animate retail marketsand develop regulatory frameworks conducive todemand flexibility, particularly in California andNew Hampshire. He received his B.A. in Interna-tional Political Economy in 2007 from The Colorado
College. Tad Montgomery Tad Montgomery is the Energyand Facilities Manager for the city of Lebanon,NH. His responsibilities include assisting the cityin meeting its greenhouse gas reduction goals inline with the Paris Climate Accord. Projects includeadoption of 800 kW of solar power, develop-ment of the Lebanon Community Power municipalaggregation program, thermal energy conservationthroughout city buildings, and demand reduction inthe big electric accounts at the water and wastewaterplants. He has an B.S. in Ceramic Engineering from
Alfred University and an M.S. in Environmental Systems Analysis (abd) fromHumboldt State University.
Clifton Below Clifton Below is the Assistant Mayorof the City of Lebanon and Chair of its EnergyAdvisory Committee. He formerly served 6 yearsas a Public Utilities Commissioner for NH and 12years in the NH House and Senate. He earned hisB.A. from Dartmouth College in 1980 and a Masterof Science in Community Economic Developmentfrom Southern NH University in 1985.
Amro M. Farid Prof. Amro M. Farid is currentlyan Associate Professor of Engineering at the ThayerSchool of Engineering at Dartmouth and AdjunctAssociate Professor of computer science at the De-partment of Computer Science. He leads the Lab-oratory for Intelligent Integrated Networks of Engi-neering Systems (LIINES). The laboratory maintainsan active research program in Smart Power Grids,Energy-Water Nexus, Energy-Transportation Nexus,Industrial Energy Management, and Integrated SmartCity Infrastructures. He received his Sc. B. in 2000
and his Sc. M. 2002 in mechanical engineering from MIT and his Ph.D.degree in Engineering from the U. of Cambridge (UK).

LABORATORY FOR INTELLIGENTINTEGRATED NETWORKSOF ENGINEERING SYSTEMSEMPOWERING YOUR NETWORK
Amro M. FaridAssociate Professor of Engineering
Adj. Assoc. Prof. of Computer Science
Thayer School of Engineering at Dartmouth
Accelerating the Shared Integrated Grid through an
eIoT eXtensible Information Model:
A Dartmouth-LIINES & EPRI Collaboration
Invited Presentation:Stanford University
Stanford, CAJuly 15th, 2020http://engineering.dartmouth.edu/liines
LABORATORY FOR INTELLIGENTINTEGRATED NETWORKSOF ENGINEERING SYSTEMSEMPOWERING YOUR NETWORK
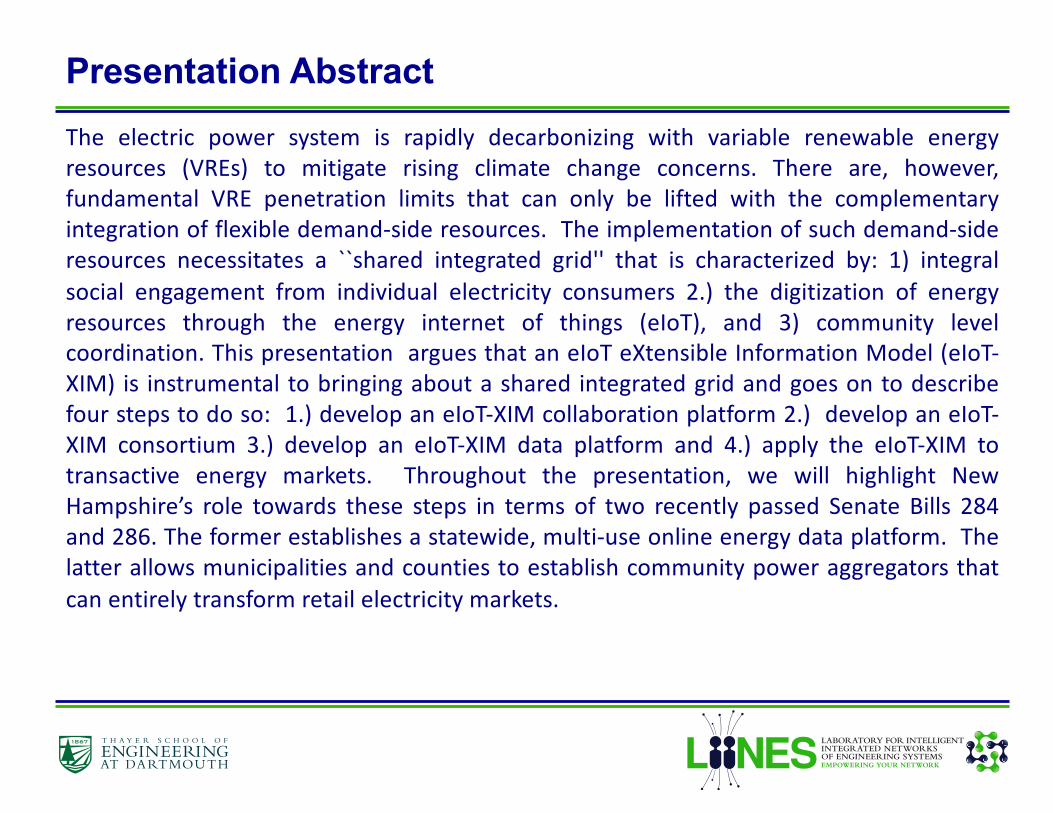
LABORATORY FOR INTELLIGENTINTEGRATED NETWORKSOF ENGINEERING SYSTEMSEMPOWERING YOUR NETWORK
The electric power system is rapidly decarbonizing with variable renewable energyresources (VREs) to mitigate rising climate change concerns. There are, however,fundamental VRE penetration limits that can only be lifted with the complementaryintegration of flexible demand-side resources. The implementation of such demand-sideresources necessitates a ``shared integrated grid'' that is characterized by: 1) integralsocial engagement from individual electricity consumers 2.) the digitization of energyresources through the energy internet of things (eIoT), and 3) community levelcoordination. This presentation argues that an eIoT eXtensible Information Model (eIoT-XIM) is instrumental to bringing about a shared integrated grid and goes on to describefour steps to do so: 1.) develop an eIoT-XIM collaboration platform 2.) develop an eIoT-XIM consortium 3.) develop an eIoT-XIM data platform and 4.) apply the eIoT-XIM totransactive energy markets. Throughout the presentation, we will highlight NewHampshire’s role towards these steps in terms of two recently passed Senate Bills 284and 286. The former establishes a statewide, multi-use online energy data platform. Thelatter allows municipalities and counties to establish community power aggregators thatcan entirely transform retail electricity markets.
Presentation Abstract

LABORATORY FOR INTELLIGENTINTEGRATED NETWORKSOF ENGINEERING SYSTEMSEMPOWERING YOUR NETWORK
Goal: To describe the Dartmouth-LIINES and EPRI effort to conceptualize the development of an energy Internet of Things eXtensible Information Model (eIoT-XIM)
§ Introduction:- What is an energy Internet of Things eXtensibile Information Model (eIoT-XIM) and why is it so
important? § Developing an eIoT-XIM Collaboration Platform
- Early on, there was a deep recognition that the development of an eIoT-XIM required a collaboration platform.
§ Developing an eIoT-XIM Consortium - Early on, there was a deep recognition that the development of an eIoT-XIM required a
consortium of diverse grid stakeholders.
§ Developing an eIoT-XIM Data Platform - An eIoT-XIM must serve a wide variety of complex use cases while remaining interoperable with
large body of CIM standards. § Applying an eIoT-XIM to a transactive energy blockchain simulation
- To demonstrate the potential for an eIoT-XIM, we highlight how it may be applied to a transactive energy blockchain application in the City of Lebanon, NH.
Presentation Outline
We will demonstrate the potential for collaborative IMPACT by highlighting relevant & ongoing activities in the LIINES & NH.
3

LABORATORY FOR INTELLIGENTINTEGRATED NETWORKSOF ENGINEERING SYSTEMSEMPOWERING YOUR NETWORK
What is the energy Internet of Things (eIoT)?
Customer Engagement Community Level CoordinationConnected Devices = Shared Economy
eIoT = network-enabled energy devices in a shared economy
4

LABORATORY FOR INTELLIGENTINTEGRATED NETWORKSOF ENGINEERING SYSTEMSEMPOWERING YOUR NETWORK
The Ubiquitous Energy Internet of Things
&RPPXQLFDWLRQ�1HWZRUNV�IRU�*ULG¬�2SHUDWRUV�DQG�8WLOLWLHV
:LGH�$UHD�1HWZRUN1HLJKERUKRRG��$UHD�1HWZRUN /RFDO�$UHD�1HWZRUN
%XON�*HQHUDWLRQ
*ULG�VFDOH�5HQHZDEOHV
6XEVWDWLRQV�DQG�WUDQVPLVVLRQ
'LVWULEXWHG�(QHUJ\�5HVRXUFHV&RPPHUFLDO�¬�,QGXVWULDO¬�FRQVXPHUV�
*ULG�6FDOH*HQHUDWLRQ 7UDQVPLVVLRQ 3RZHU�'LVWULEXWLRQ &RQVXPHUV
5HVLGHQWLDO�FRQVXPHUV
The energy Internet of Things (eIoT) appears in many forms throughout the entirety of the grid’s value chain.
5

LABORATORY FOR INTELLIGENTINTEGRATED NETWORKSOF ENGINEERING SYSTEMSEMPOWERING YOUR NETWORK
What is an eIoT eXtensible Information Model (XIM)?
XIM – An extensible collection of nouns and attributes that provide a common language for describing eIoT devices and how they communicate with each other on the internet
Customer Engagement Community Level CoordinationConnected Devices = Shared Economy
6

LABORATORY FOR INTELLIGENTINTEGRATED NETWORKSOF ENGINEERING SYSTEMSEMPOWERING YOUR NETWORK
eIoT’s Importance: The Sustainable Energy Transition
∴ The emergence of VRE necessitates eIoT-enabled demand side resources tomaintain grid reliability, promote decarbonization, reduce operating andinvestment costs.
Past:
Future: Generation/Supply Load/Demand
Well-Controlled &Dispatchable
Thermal Units: (Potential erosion of
capacity factor)
eIoT-enabled Demand Side Resources:
(Requires new control& market design)
Stochastic/Forecasted
Solar & Wind Generation:(Can cause unmanaged
grid imbalances)
Conventional Loads:(Growing &
Needs Curtailment)
Generation/Supply Load/Demand
Thermal Units: Few, Well-Controlled,
Dispatchable, In Steady-State
Conventional Loads:Slow Moving, Highly
Predictable, Always Served
7

LABORATORY FOR INTELLIGENTINTEGRATED NETWORKSOF ENGINEERING SYSTEMSEMPOWERING YOUR NETWORK
eIoT’s Importance: The Transition to an Active Grid Periphery
~
~
~
~Transmission
System
Distribution
System
Microgrids
Residences
~
~
~
~Transmission
System
Distribution
System
Consumers
The integration of distributed energy resources at the grid’s periphery implies the adoption of a plethora of network-enabled devices and appliances in an energy Internet of Things.
8

LABORATORY FOR INTELLIGENTINTEGRATED NETWORKSOF ENGINEERING SYSTEMSEMPOWERING YOUR NETWORK
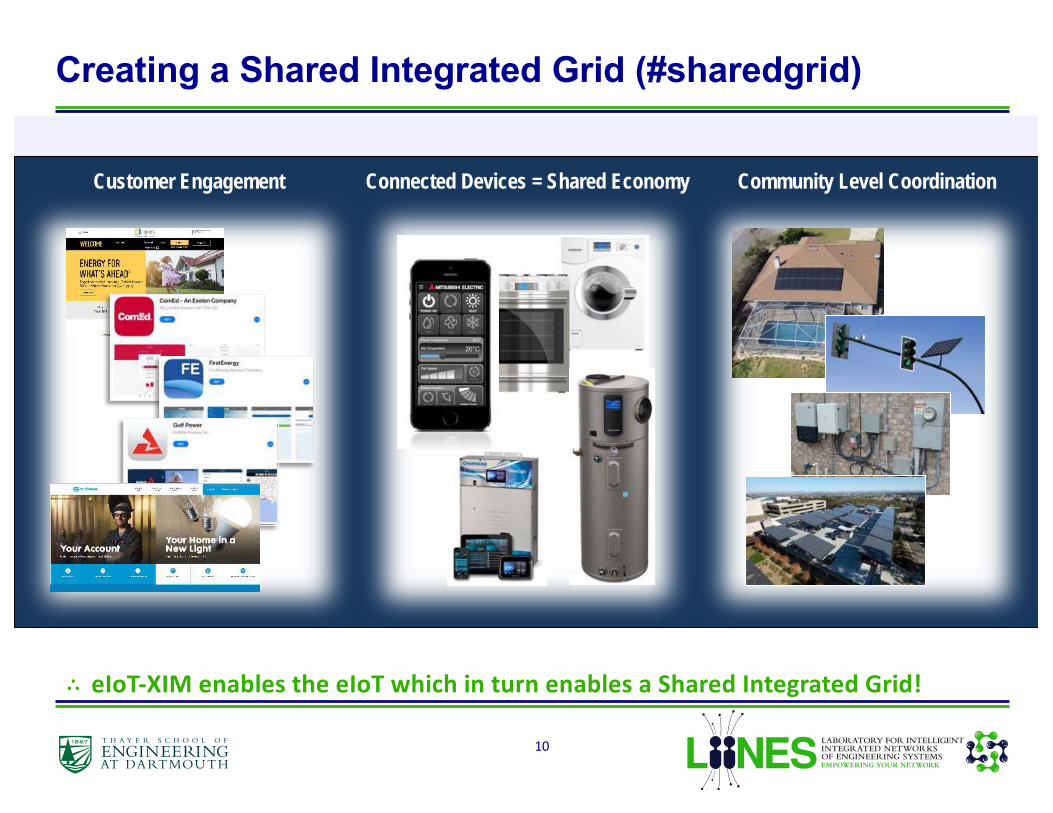
LABORATORY FOR INTELLIGENTINTEGRATED NETWORKSOF ENGINEERING SYSTEMSEMPOWERING YOUR NETWORK
Creating a Shared Integrated Grid (#sharedgrid)
Customer Engagement Community Level CoordinationConnected Devices = Shared Economy
∴ eIoT-XIM enables the eIoT which in turn enables a Shared Integrated Grid!
10

LABORATORY FOR INTELLIGENTINTEGRATED NETWORKSOF ENGINEERING SYSTEMSEMPOWERING YOUR NETWORK
Goal: To describe the Dartmouth-LIINES and EPRI effort to conceptualize the development of an energy Internet of Things eXtensible Information Model (eIoT-XIM)
§ Introduction:- What is an energy Internet of Things eXtensibile Information Model (eIoT-XIM) and why is it so
important? § Developing an eIoT-XIM Collaboration Platform
- Early on, there was a deep recognition that the development of an eIoT-XIM required a collaboration platform.
§ Developing an eIoT-XIM Consortium - Early on, there was a deep recognition that the development of an eIoT-XIM required a
consortium of diverse grid stakeholders.
§ Developing an eIoT-XIM (How?!)- An eIoT-XIM must serve a wide variety of complex use cases while remaining interoperable with
large body of CIM standards. § Applying an eIoT-XIM to a transactive energy blockchain simulation
- To demonstrate the potential for an eIoT-XIM, we highlight how it may be applied to a transactive energy blockchain application in the City of Lebanon, NH.
Presentation Outline
We will demonstrate the potential for collaborative IMPACT by highlighting relevant & ongoing activities in the LIINES & NH.
11

LABORATORY FOR INTELLIGENTINTEGRATED NETWORKSOF ENGINEERING SYSTEMSEMPOWERING YOUR NETWORK
As the eIoT-XIM project progressed, it became apparent that NH already possessed several emerging Shared Integrated Grid collaboration platforms.
§ City of Lebanon Energy Advisory Committee à City leader in Community Power Aggregation in NH
§ Sustainable Hanover Committee à Leading Municipal Implementation of Real-Time Pricing
§ NH Community Power Coalition à Bringing together NH Cities, Towns & Counties interested in Community Power Aggregation.
§ NH PUC Community Power Aggregation Rule Making à Serves to enable the implementation of community power aggregation
§ NH PUC Statewide Multi-Use Online Energy Data Platform Docket à Serves to enable the design & implementation of a data platform
Developing an eIoT-XIM Collaboration Platform
Local initiatives using existing local collaboration platformsMany Parallel Initiatives à Proves the Need for Collaborative Efforts
…but NH is not alone…
12

LABORATORY FOR INTELLIGENTINTEGRATED NETWORKSOF ENGINEERING SYSTEMSEMPOWERING YOUR NETWORK
Developing an eIoT-XIM Collaboration Platform
Local Initiatives are popping up all over the world
EPRI & the Dartmouth-LIINES recognize the need for an eIoT-enabled Shared Integrated Grid Collaboration Platform
13

LABORATORY FOR INTELLIGENTINTEGRATED NETWORKSOF ENGINEERING SYSTEMSEMPOWERING YOUR NETWORK
Goal: To describe the Dartmouth-LIINES and EPRI effort to conceptualize the development of an energy Internet of Things eXtensible Information Model (eIoT-XIM)
§ Introduction:- What is an energy Internet of Things eXtensibile Information Model (eIoT-XIM) and why is it so
important? § Developing an eIoT-XIM Collaboration Platform
- Early on, there was a deep recognition that the development of an eIoT-XIM required a collaboration platform.
§ Developing an eIoT-XIM Consortium - Early on, there was a deep recognition that the development of an eIoT-XIM required a
consortium of diverse grid stakeholders.
§ Developing an eIoT-XIM (How?!)- An eIoT-XIM must serve a wide variety of complex use cases while remaining interoperable with
large body of CIM standards. § Applying an eIoT-XIM to a transactive energy blockchain simulation
- To demonstrate the potential for an eIoT-XIM, we highlight how it may be applied to a transactive energy blockchain application in the City of Lebanon, NH.
Presentation Outline
We will demonstrate the potential for collaborative IMPACT by highlighting relevant & ongoing activities in the LIINES & NH.
14

LABORATORY FOR INTELLIGENTINTEGRATED NETWORKSOF ENGINEERING SYSTEMSEMPOWERING YOUR NETWORK
As the eIoT-XIM project progressed, it became apparent that many NH stakeholders already wished to participate in Shared Integrated Grid consortiums.
Developing an eIoT-XIM Consortium: Community Power NH
Community Power New Hampshire already draws from a broad spectrum of NH grid stakeholders.
Participating Municipal members:1. Bristol (Paul Bemis)2. Harrisville (Mary Day Mordecai & Ned Hulbert)3. Hanover (Julia Griffin & April Salas)
4. Lebanon (Clifton Below)5. Nashua (Doria Brown)
6. Cheshire County (Rod Bouchard)7. Monadnock Energy Hub (Dori Drachman)
8. Clean Energy New Hampshire (facilitator: Henry Herndon)9. Dartmouth College (ex officio: Dr. Amro Farid)10. Community Choice Partners (ex officio: Samuel Golding)
Community support members:
5 Municipalities~53,000 customers
(7% of market)~460,000 MWh / yr~$50 million (supply)
23 Municipalities~36,000 customers
(5% of market)~315,000 MWh / yr~$35 million (supply)
9 Municipalities~21,000 customers
(3% of market)~183,000 MWh / yr~$20 million (supply)
15

LABORATORY FOR INTELLIGENTINTEGRATED NETWORKSOF ENGINEERING SYSTEMSEMPOWERING YOUR NETWORK
As the eIoT-XIM project progressed, it became apparent that many NH stakeholders already wished to participate in Shared Integrated Grid consortiums.
Developing an eIoT-XIM Consortium: NH Energy Data Platform
Broad Spectrum of Engaged Grid Stakeholders: State & Local Government, Utilities, Academia, Industry Experts, Non-Profits, Vendors, Legal Counsel
1. NH Public Utilities Commission2. NH Office of the Consumer Advocate3. NH Representative Kat McGhee4. City of Lebanon5. Town of Hanover6. Unitil7. Eversource8. Liberty Utilities9. Dartmouth-LIINES-Thayer School of
Engineering10. Dartmouth Tuck School of Business
11. Community Choice Partners12. Clean Energy New Hampshire13. Greentel Group14. Mission Data15. Deloitte Consulting16. Utility API17. Packetized Energy18. Freedom Energy Logistics19. Orr & Reno P.A20. Mark Dean PLLC
16

LABORATORY FOR INTELLIGENTINTEGRATED NETWORKSOF ENGINEERING SYSTEMSEMPOWERING YOUR NETWORK
Goal: To describe the Dartmouth-LIINES and EPRI effort to conceptualize the development of an energy Internet of Things eXtensible Information Model (eIoT-XIM)
§ Introduction:- What is an energy Internet of Things eXtensibile Information Model (eIoT-XIM) and why is it so
important? § Developing an eIoT-XIM Collaboration Platform
- Early on, there was a deep recognition that the development of an eIoT-XIM required a collaboration platform.
§ Developing an eIoT-XIM Consortium - Early on, there was a deep recognition that the development of an eIoT-XIM required a
consortium of diverse grid stakeholders.
§ Developing an eIoT-XIM (How?!)- An eIoT-XIM must serve a wide variety of complex use cases while remaining interoperable with
large body of CIM standards. § Applying an eIoT-XIM to a transactive energy blockchain simulation
- To demonstrate the potential for an eIoT-XIM, we highlight how it may be applied to a transactive energy blockchain application in the City of Lebanon, NH.
Presentation Outline
We will demonstrate the potential for collaborative IMPACT by highlighting relevant & ongoing activities in the LIINES & NH.
17

LABORATORY FOR INTELLIGENTINTEGRATED NETWORKSOF ENGINEERING SYSTEMSEMPOWERING YOUR NETWORK
Envisioning a NH State-Wide Multi-Use Energy Data Platform
NH State-Wide Multi-Use Energy Data Platform
Independent System
Operators
Load Serving Entities
Community Power
Aggregators(CPA)
Distribution Utilities
Competitive Electricity Suppliers
Curtailment Service Providers
Community Power
Aggregators(CPA)
Competitive Electricity Suppliers
Consumers & Prosumers
Authorized Third Parties
Energy Service Companies
Other 3rd Parties
Governmental Agencies
Public Utilities Commission
(PUC)
Office of the Consumer Advocate
Municipalities Academia
Electric Distribution Companies
Transmission Owners
Distribution Owners
Q: How might we think about building such an energy data platform? Whatare we going to have to pay special attention to?One Answer: Just start coding!One Answer: Write a Request for Proposals. Outsource it to the lowest bidder!Your Answer: _______Write your answer in the chat box_________________

LABORATORY FOR INTELLIGENTINTEGRATED NETWORKSOF ENGINEERING SYSTEMSEMPOWERING YOUR NETWORK
The building of a NH energy data platform should be viewed as a Shared Integrated Grid systems engineering activity.
Building a Big Tent: NH Energy Data Platform Stakeholders
Broad Spectrum of Engaged Grid Stakeholders: State & Local Government, Utilities, Academia, Industry Experts, Non-Profits, Vendors, Legal Counsel
1. NH Public Utilities Commission2. NH Office of the Consumer Advocate3. NH Representative Kat McGhee4. City of Lebanon5. Town of Hanover6. Unitil7. Eversource8. Liberty Utilities9. Dartmouth-LIINES-Thayer School of
Engineering10. Dartmouth Tuck School of Business
11. Community Choice Partners12. Clean Energy New Hampshire13. Greentel Group14. Mission Data15. Deloitte Consulting16. Utility API17. Packetized Energy18. Freedom Energy Logistics19. Orr & Reno P.A20. Mark Dean PLLC
19

LABORATORY FOR INTELLIGENTINTEGRATED NETWORKSOF ENGINEERING SYSTEMSEMPOWERING YOUR NETWORK
A Big Tent Systems Approach: Architecting the NH Energy Data Platform
Developing a NH Energy Data Platform is a collaborative, context-aware socio-technical effort!
Steps: 1. Context Awareness: Understand the legal context of deregulation (i.e. SB 284 & SB 286)2. Requirements Gathering: Identify stakeholder requirements & use cases from existing
legislation, regulations, stakeholder needs. Collect from all stakeholders. 3. Requirements Engineering: Reconcile the stakeholder requirements & use cases into a
mutually exclusive & collective exhaustive set of technical requirements. All use cases & requirements are equally valid.
4. Quantify the Associated Benefits (in dollar terms): System Function à Benefits5. Determine the Relevant Data: For each technical requirement, assure interoperability &
extensibility with existing IEC Common Information Model standards6. Quantify the Associated Costs (in dollar terms): System Form à Costs7. Address Governance and Implementation Challenges:
20
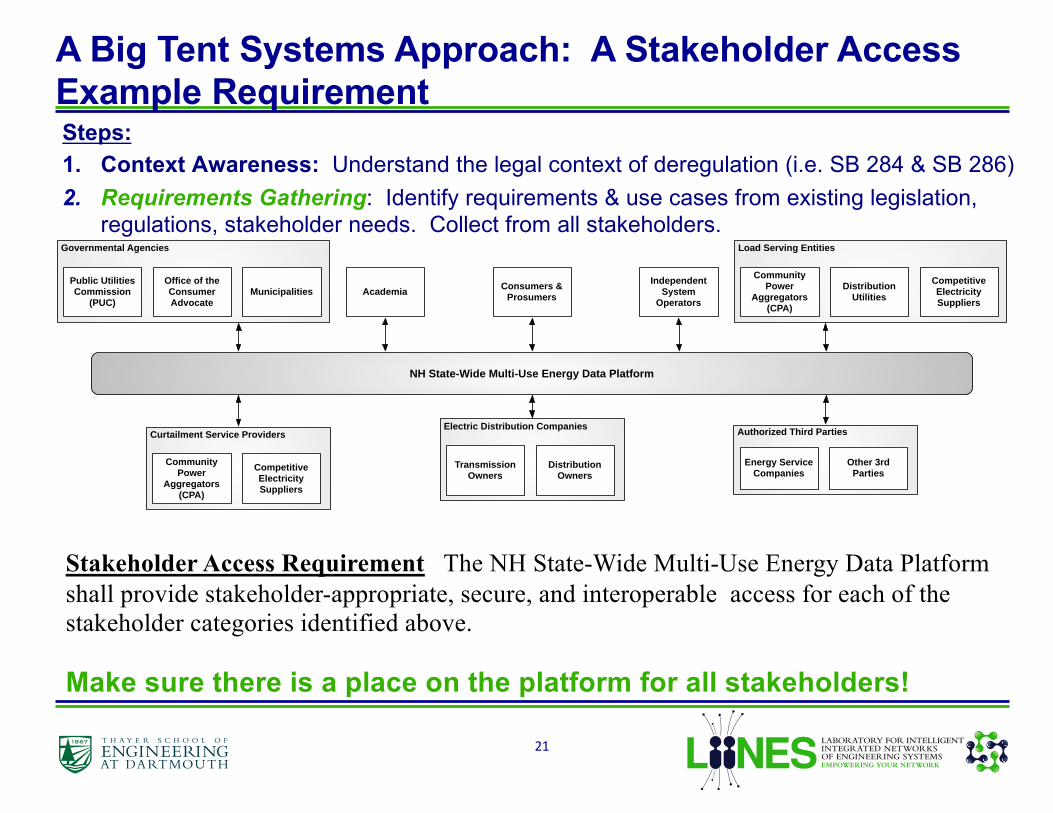
LABORATORY FOR INTELLIGENTINTEGRATED NETWORKSOF ENGINEERING SYSTEMSEMPOWERING YOUR NETWORK
A Big Tent Systems Approach: A Stakeholder Access Example Requirement
Make sure there is a place on the platform for all stakeholders!
Steps: 1. Context Awareness: Understand the legal context of deregulation (i.e. SB 284 & SB 286)2. Requirements Gathering: Identify requirements & use cases from existing legislation,
regulations, stakeholder needs. Collect from all stakeholders.
21
Stakeholder Access Requirement The NH State-Wide Multi-Use Energy Data Platform shall provide stakeholder-appropriate, secure, and interoperable access for each of the stakeholder categories identified above.
NH State-Wide Multi-Use Energy Data Platform
Independent System
Operators
Load Serving Entities
Community Power
Aggregators(CPA)
Distribution Utilities
Competitive Electricity Suppliers
Curtailment Service Providers
Community Power
Aggregators(CPA)
Competitive Electricity Suppliers
Consumers & Prosumers
Authorized Third Parties
Energy Service Companies
Other 3rd Parties
Governmental Agencies
Public Utilities Commission
(PUC)
Office of the Consumer Advocate
Municipalities Academia
Electric Distribution Companies
Transmission Owners
Distribution Owners

LABORATORY FOR INTELLIGENTINTEGRATED NETWORKSOF ENGINEERING SYSTEMSEMPOWERING YOUR NETWORK
A Big Tent Systems Approach: A Community Power Aggregator Example Requirement
Infuse the new legislation into the system requirements/use cases
Steps: 1. Context Awareness: Understand the legal context of deregulation (i.e. SB 284 & SB 286)2. Requirements Gathering: Identify requirements & use cases from existing legislation,
regulations, stakeholder needs. Collect from all stakeholders.
22
RSA 53-E:3/SB 286 “[CPAs have the authority to] provide for:
(1) The supply of electric power.
(2) Demand side management.
(3) Conservation.
(4) Meter reading.
(5) Customer service.
(6) Other related services.
(7) The operation of energy efficiency and clean energy districts
adopted by a municipality pursuant to RSA 53-F.”
4. OPERATION OF A COMMUNITY POWER AGGREGATION PROGRAM
4.1 The data platform shall provide CPAs and customers the read,
write, and append access to support the exchange of electric power
services.
4.2 The data platform shall provide CPAs and customers the read,
write, and append access to support the exchange of demand side
management services.
4.3 The data platform shall provide CPAs and customers the read,
write, and append access to support the exchange of conservation
services.
4.4 The data platform shall provide CPAs and customers the read,
write, and append access to support the exchange of energy efficiency
services.
4.5 The data platform shall provide CPAs and customers the read,
write, and append access to support customer service activities.
4.6 The data platform shall provide the CPAs, and electric utilities (as
owners/operators of metering systems) access to read, write and
update customers’ consumption and distribution generation meter
data.
4.7 The data platform shall provide customers access to read their
consumption and distributed generation meter data.

LABORATORY FOR INTELLIGENTINTEGRATED NETWORKSOF ENGINEERING SYSTEMSEMPOWERING YOUR NETWORK
A Big Tent Systems Approach: Architecting the NH Energy Data Platform
Developing a NH Energy Data Platform is a collaborative, context-aware socio-technical effort!
Steps: 1. Context Awareness: Understand the legal context of deregulation (i.e. SB 284 & SB 286)2. Requirements Gathering: Identify stakeholder requirements & use cases from existing
legislation, regulations, stakeholder needs. Collect from all stakeholders. 3. Requirements Engineering: Reconcile the stakeholder requirements & use cases into a
mutually exclusive & collective exhaustive set of technical requirements. All use cases & requirements are equally valid.
1. Equal Validity: A hypothetical road has pedestrian, cyclist, and motorist use cases2. Technical Requirements: Warm & Cozy vs. {72℉, 50% Humidity}
4. Quantify the Associated Benefits (in dollar terms): System Function à Benefits5. Determine the Relevant Data: For each technical requirement, assure interoperability &
extensibility with existing IEC Common Information Model standards6. Quantify the Associated Costs (in dollar terms): System Form à Costs7. Address Governance and Implementation Challenges:
23

LABORATORY FOR INTELLIGENTINTEGRATED NETWORKSOF ENGINEERING SYSTEMSEMPOWERING YOUR NETWORK
Managing the Complexity: Stakeholder Requirements by Life Cycle Stage
In a multi-stakeholder process, it is important to organize requirements & use cases in unifying frameworks.
Types of Use Cases
Operations Archetype Use Case
Transactive Energy Market: Dispatchable energy resources exchange via a distribution system operator a number of kilo-watt hours (active power integrated over time) in normal operating mode at a time-varying market-clearing rate with self-scheduled energy resources (be they generators, storage resources or consumers), for the duration of 5 minutes, on a given distribution system feeder.
The Operations Improvement Archetype Use Case
Improve Energy Efficiency (Sense Energy Monitor): Homeowner monitors home electricity consumption in kilo-watt hours in normal operating mode for the duration of one month with one minute granularity.
Maintenance
Scheduled Maintenance of a Motor: Track power quality of an operating motor and notify operator in the event of significant deviations.
The Regulatory Compliance Archetype Use Case
Determine Compliance with NH PUC’s 900 Net-Metering Rules

LABORATORY FOR INTELLIGENTINTEGRATED NETWORKSOF ENGINEERING SYSTEMSEMPOWERING YOUR NETWORK
Managing the Complexity: Types of Technical Requirements
In a multi-stakeholder process, it is important to organize technical requirements in unifying frameworks.
Taxonomy ofSystems
Requirements
Input/Output Technology &System-Wide Trade Off System
Qualification
Input
Output
Functional
ExternalInterfaces
Technology
Life Cycle Properties
"-ilities"
Cost
Schedule
CostTrade-offs
Data for allqualification
PerformanceTrade-offs
Cost-PerformanceTrade-off
VerificationPlan
ValidationPlan
AcceptancePlan

LABORATORY FOR INTELLIGENTINTEGRATED NETWORKSOF ENGINEERING SYSTEMSEMPOWERING YOUR NETWORK
A Big Tent Systems Approach: Architecting the NH Energy Data Platform
Developing a NH Energy Data Platform is a collaborative, context-aware socio-technical effort!
Steps: 1. Context Awareness: Understand the legal context of deregulation (i.e. SB 284 & SB 286)2. Requirements Gathering: Identify stakeholder requirements & use cases from existing
legislation, regulations, stakeholder needs. Collect from all stakeholders. 3. Requirements Engineering: Reconcile the stakeholder requirements & use cases into a
mutually exclusive & collective exhaustive set of technical requirements. All use cases & requirements are equally valid.
4. Quantify the Associated Benefits (in dollar terms): System Function à Benefits5. Determine the Relevant Data: For each technical requirement, assure interoperability &
extensibility with existing IEC Common Information Model standards6. Quantify the Associated Costs (in dollar terms): System Form à Costs7. Address Governance and Implementation Challenges:
26

LABORATORY FOR INTELLIGENTINTEGRATED NETWORKSOF ENGINEERING SYSTEMSEMPOWERING YOUR NETWORK
A Big Tent Systems Approach: Architecting the NH Energy Data Platform
Developing a NH Energy Data Platform is a collaborative, context-aware socio-technical effort!
Steps: 1. Context Awareness: Understand the legal context of deregulation (i.e. SB 284 & SB 286)2. Requirements Gathering: Identify stakeholder requirements & use cases from existing
legislation, regulations, stakeholder needs. Collect from all stakeholders. 3. Requirements Engineering: Reconcile the stakeholder requirements & use cases into a
mutually exclusive & collective exhaustive set of technical requirements. All use cases & requirements are equally valid.
4. Quantify the Associated Benefits (in dollar terms): System Function à Benefits5. Determine the Relevant Data: For each technical requirement, assure interoperability &
extensibility with existing IEC Common Information Model standards6. Quantify the Associated Costs (in dollar terms): System Form à Costs7. Address Governance and Implementation Challenges:
27

LABORATORY FOR INTELLIGENTINTEGRATED NETWORKSOF ENGINEERING SYSTEMSEMPOWERING YOUR NETWORK
IEC Smart Grid Standards Map

LABORATORY FOR INTELLIGENTINTEGRATED NETWORKSOF ENGINEERING SYSTEMSEMPOWERING YOUR NETWORK
A Big Tent Systems Approach: Architecting the NH Energy Data Platform
Developing a NH Energy Data Platform is a collaborative, context-aware socio-technical effort!
Steps: 1. Context Awareness: Understand the legal context of deregulation (i.e. SB 284 & SB 286)2. Requirements Gathering: Identify stakeholder requirements & use cases from existing
legislation, regulations, stakeholder needs. Collect from all stakeholders. 3. Requirements Engineering: Reconcile the stakeholder requirements & use cases into a
mutually exclusive & collective exhaustive set of technical requirements. All use cases & requirements are equally valid.
4. Quantify the Associated Benefits (in dollar terms): System Function à Benefits5. Determine the Relevant Data: For each technical requirement, assure interoperability &
extensibility with existing IEC Common Information Model standards6. Quantify the Associated Costs (in dollar terms): System Form à Costs7. Address Governance and Implementation Challenges:
29

LABORATORY FOR INTELLIGENTINTEGRATED NETWORKSOF ENGINEERING SYSTEMSEMPOWERING YOUR NETWORK
A Big Tent Systems Approach: Architecting the NH Energy Data PlatformSteps: 1. Context Awareness: Understand the legal context of deregulation (i.e. SB 284 & SB 286)2. Requirements Gathering: Identify stakeholder requirements & use cases from existing
legislation, regulations, stakeholder needs. Collect from all stakeholders. 3. Requirements Engineering: Reconcile the stakeholder requirements & use cases into a
mutually exclusive & collective exhaustive set of technical requirements. All use cases & requirements are equally valid.
4. Quantify the Associated Benefits (in dollar terms): System Function à Benefits5. Determine the Relevant Data: For each technical requirement, assure interoperability &
extensibility with existing IEC Common Information Model standards6. Quantify the Associated Costs (in dollar terms): System Form à Costs7. Address Governance and Implementation Challenges:
30
Q: What do you think might be some important governance andimplementation challenges?One Answer: We got this! What could possibly go wrong?!?!Your Answer: _______Write your answer in the chat box_________________

LABORATORY FOR INTELLIGENTINTEGRATED NETWORKSOF ENGINEERING SYSTEMSEMPOWERING YOUR NETWORK
Goal: To describe the Dartmouth-LIINES and EPRI effort to conceptualize the development of an energy Internet of Things eXtensible Information Model (eIoT-XIM)
§ Introduction:- What is an energy Internet of Things eXtensibile Information Model (eIoT-XIM) and why is it so
important? § Developing an eIoT-XIM Collaboration Platform
- Early on, there was a deep recognition that the development of an eIoT-XIM required a collaboration platform.
§ Developing an eIoT-XIM Consortium - Early on, there was a deep recognition that the development of an eIoT-XIM required a
consortium of diverse grid stakeholders.
§ Developing an eIoT-XIM (How?!) - An eIoT-XIM must serve a wide variety of complex use cases while remaining interoperable with
large body of CIM standards. § Applying an eIoT-XIM to a transactive energy blockchain simulation
- To demonstrate the potential for an eIoT-XIM, we highlight how it may be applied to a transactive energy blockchain application in the City of Lebanon, NH.
Presentation Outline
We will demonstrate the potential for collaborative IMPACT by highlighting relevant & ongoing activities in the LIINES & NH.
31

LABORATORY FOR INTELLIGENTINTEGRATED NETWORKSOF ENGINEERING SYSTEMSEMPOWERING YOUR NETWORK32
Conventional Model Transactive Energy Model
Conventional vs Transactive Energy Model

LABORATORY FOR INTELLIGENTINTEGRATED NETWORKSOF ENGINEERING SYSTEMSEMPOWERING YOUR NETWORK
๏ Customer choice
๏ Access to cleaner cheaper electricity
๏ Access to real-time wholesale prices
๏ Peer to peer electricity trading
33
Municipal aggregation enables:
How do we achieve this?๏ Collect relevant data๏ Develop software to simulate the market
How is the Transactive Energy Model Different?

LABORATORY FOR INTELLIGENTINTEGRATED NETWORKSOF ENGINEERING SYSTEMSEMPOWERING YOUR NETWORK34
Industrial State of the Art Solutions
Limitations: No guarantees of convergence
Academic State of the Art: ADMM Limitations: No guarantees of physical security
Our Solution:๏ Guarantees convergence๏ Physical security๏ Economic optimality
LEBTEC Software Development
Bringing a decade of renewable energyintegration experience to Lebanon!

LABORATORY FOR INTELLIGENTINTEGRATED NETWORKSOF ENGINEERING SYSTEMSEMPOWERING YOUR NETWORK35
Data:๏ GIS Layer ๏ Power injections
Worked with:๏ Liberty Utilities๏ LEAC
Next Steps:๏ Finalize data processing๏ Combine the software
model with data๏ Run simulations
Biggest Challenge:๏ Data collection and
processing
LEBTEC Data Processing

LABORATORY FOR INTELLIGENTINTEGRATED NETWORKSOF ENGINEERING SYSTEMSEMPOWERING YOUR NETWORK

LABORATORY FOR INTELLIGENTINTEGRATED NETWORKSOF ENGINEERING SYSTEMSEMPOWERING YOUR NETWORK
Creating a Shared Integrated Grid (#sharedgrid)
Customer Engagement Community Level CoordinationConnected Devices = Shared Economy
∴ eIoT-XIM enables the eIoT which in turn enables a Shared Integrated Grid!
37

LABORATORY FOR INTELLIGENTINTEGRATED NETWORKSOF ENGINEERING SYSTEMSEMPOWERING YOUR NETWORK
Amro M. FaridAssociate Professor of Engineering
Adj. Assoc. Prof. of Computer Science
Thayer School of Engineering at Dartmouth
Conceptualizing the Development of an energy Internet of Things eXtensible Information Model:
A Dartmouth-LIINES & EPRI Collaboration
Invited Presentation:Stanford University
Stanford, CAJuly 15th, 2020http://engineering.dartmouth.edu/liines
LABORATORY FOR INTELLIGENTINTEGRATED NETWORKSOF ENGINEERING SYSTEMSEMPOWERING YOUR NETWORK
Thank You

20 / Regulation / SPRING 2020
Refocusing on the Consumer
Utilities regulation needs to prepare for the “prosumer” revolution.� BY AHMAD FARUQUI
E N E R GY & N AT U R A L R E S O U R C E S
Back in 2017, a man attending a Florida work-
shop on utility rate design stumped me by
asking if I had traveled all the way from San
Francisco just to tell the audience how utili-
ties should modernize their rate designs. He
was obviously unimpressed with what I had
said. I asked him, “What were you expect-
ing?” He said he thought I would talk about rate design in
which electricity consumers were also producers—“prosum-
ers”—and there was no grid or utility. I was inclined to tell him
to go ask the bartender about that, but that would have been
impolite. So, I told him that I was not looking that far out in
the future, but focusing on market developments over the next
two decades
In the years since, I have seen more and more of my neighbors
turn into prosumers. I recently became one myself, with solar
panels and a battery storage system installed in my house. I also
drive an electric vehicle (EV). The distant future has arrived much
sooner than I expected, at least in my neighborhood. And, while
California continues to dominate the nation in the sheer number
of prosumers and EVs, it is not di!cult to imagine a not-so-dis-
tant future in which much of the nation will begin turning into
Prosumer Land.
THE CONSUMER REVOLUTION
A revolution is underway in the electric utility industry. The signs
of this were evident long before the Great Recession of 2008–
2009 slowed load growth. I spoke at Goldman Sachs’ Annual
Power Conference in New York City soon after the recession
ended and made that point. But the facial expressions of the
investment analysts in the room told me they were not buying
it. I was invited to speak at the same event two years later. I gave
AHMAD FARUQUI is principal of the Brattle Group.

SPRING 2020 / Regulation / 21
a similar message, saw a few people nodding their heads, but I’ve
yet to be invited back there to speak again.
In 2014, I spoke at a conference on the outlook for electricity
sales and peak demand. My message of flattening demand reso-
nated with the technical audience. Two of the three other panelists
agreed with me. (The fourth insisted an industrial renaissance was
underway that would propel growth.) The only issue among those
who agreed with me was which forces were driving this change.
Some said the primary force was utility demand-side management
programs. Some said it was governmental codes and standards.
Some said it was the arrival of distributed energy resources. And
some said that it was fuel switching away from electricity.
Today, as we stand at the cusp of the third decade of the
21st century, the trend is no longer being questioned, probably
not even at Goldman Sachs. Over the past decade, consumers
have decisively and irreversibly changed the way they think about
electricity, how they consume electricity, and when they consume
electricity. And some have turned into prosumers.
Of course, as we have discovered, no two customers are alike.
Even within the same household, husband and wife often di!er on
how they want to live their lives. Children introduce more uncer-
tainty into the energy decision-making. Of course, all customers
want choice, but they only want what they want. Yet, utilities often
o!er just one product to all customers in a “rate class”—delivered
electricity at a certain rate—thereby avoiding accusations of discrim-
ination. A few o!er some choices, but these are often marketed in a
jargon that would politely be called obscure and they use commu-
nication channels that sometimes don’t even reach the customer.
It’s safe to say that diversity is the hallmark of customer prefer-
ences for consuming electricity, just as it is for any other product
or service. Electricity is no exception. Utility consumers fall into
several categories. Some want bill stability and are willing to pay
more for it. Some want the lowest bill and are willing to shift
and reduce load. And some have gone organic in every aspect of
their lives and want to buy only green power to mitigate climate
change. Yet, most utilities simply o!er a single rate to all of
them. Imagine what would
happen to sales at retailers
like Nordstrom’s if they only
sized their merchandise as
“one size fits all.”
I recently called my local
utility’s customer service
number and asked which
rate I should pick given that
rooftop solar panels and bat-
tery storage were about to be
installed in my house. I was
told to pick such-and-such a
rate as a starting point. My
bill would now run 10 pages,
but I should ignore all the
pages except 1 and 3. I asked if
the recommended rate would
be the best rate for me since I
also have an EV. She said there
was no easy answer to that
question. It would be best if I
waited for another year to fig-
ure out my best rate, which of
course meant that I may end
up paying more in the next
12 months.
THE TECHNOLOGY
REVOLUTION
Concomitantly with the rev-
olution in consumer tastes,
an all-embracing technolog-
ical revolution is underway,
IST
OC
K /
GE
TT
Y I
MA
GE
S P
LU
S

E N E R G Y & N A T U R A L R E S O U R C E S
22 / Regulation / SPRING 2020
spurred by the advent of digital technologies. Just about all
customers have smart phones today. Currently, about half of all
customers have smart meters. But smart price signals are only
rarely being transmitted through those meters.
More and more customers have energy-e!cient appliances
with digital chips embedded in them. In fact, you can no longer
buy energy-hogging appliances even if you want to. Some cus-
tomers live in highly energy-e!cient dwellings, some with solar
panels on their roofs and even batteries for storage. In Hawaii,
which has very high electric rates, some 60% of new solar instal-
lations in Honolulu are being paired with batteries. In California,
where planned power shutdowns are being carried out to prevent
wildfires, the same can be expected. This has temporarily pushed
up storage battery prices, but they are on a long-term declining
trend. Finally, more and more customers are buying or leasing
EVs despite their high prices and short range, and despite their
especially high prices in California and Hawaii.
DISINTERMEDIATION OF UTILITIES
Disintermediation of utilities involves the entry of third parties
that sell products and services to utility customers that reduce util-
ity sales and revenues. This trend is well underway and appears to
be unstoppable. Utilities may think they are regulatorily protected
monopolies, but customers keep divining creative ways to manage
their energy use outside of utility (and commission) directives.
This should not surprise anyone, but it does seem to have eluded
more than one utility and one regulatory body.
Electricity consumers are going to act in their self-interest,
just as they do in every other market. Their eyes glaze over when
they are told they cannot do such-and-such because it would
be an uneconomic bypass of the grid and create cross subsidies
between customers.
Customers on the frontier of change want local control and
grid independence. Consumer choice aggregation is taking o"
like never before in California and is being considered in several
other states, such as Colorado and New Mexico. The drivers are
many, ranging from consumer desires to consume green energy,
have local control, and lower expenses. But the ultimate driver in
most cases, as mentioned by a utility executive to me, is a deep-
rooted anti-utility sentiment.
New entrants that are disintermediating utilities include global
tech giants, start-ups with unwieldy names, and even home secu-
rity firms and hardware stores. The electric customer is no longer
the exclusive preserve of the regulated monopoly.
While talking to a senior o!cer of a large utility the other
day, I mentioned the “prosumer” conversation I had in Florida
a few years ago. I thought he would dismiss the scenario that
the skeptic had laid out, much as I once did. Surprisingly, he
said that he was finding himself more and more in that camp.
He added that economic history tells us that no industry has
remained a natural monopoly forever. Utilities must change
their ways if they want to survive.
ARMAGEDDON?
At one time, the utilities conference circuit included talk of
“death spirals”—utilities slowly collapsing financially as a result
of market change. Today, the talk is of sudden “Armageddon.”
Whether the end is at hand or a chimera won’t be known for
another decade or two. Still, if utilities and regulators continue to
do business as they have for the past century, they will accelerate
the demise of the electric industry.
In a Harvard Business Review article entitled “Marketing Myo-
pia,” marketing professor Ted Levitt wrote ominously:
Every major industry was once a growth industry. But some
that are now riding a wave of growth enthusiasm are very
much in the shadow of decline. Others that are thought of as
seasoned growth industries have actually stopped growing. In
every case, whenever growth is threatened, slowed or stopped is
not because the market is saturated. It is because there has been
a failure of management.
He specifically cited the example of railroads forgetting they were
in the transportation business, not just the railroad business. He
cautioned oil companies about the advent of electric vehicles and
electric utilities about the advent of rooftop solar panels. What is
noteworthy is that the article was written in 1960. It is even more
relevant 60 years later.
WAITING FOR GODOT
In the meantime, utilities and regulators are moving slowly—one
might even say ponderously—through rate cases. Regulatory lag
is breaking records, often running into years. The slowest-mov-
ing drama in history is being played out in hearing rooms from
coast to coast, from ocean to ocean.
Consider these case studies from my career. I have observed
these instances of delays and back-tracking first-hand:
1976 The Electric Power Research Institute (EPRI) initi-
ated the Electric Utility Rate Design Study at the behest of the
National Association of Regulatory Utility Commissioners on
behalf of the industry. It was carried out over several years with
the close involvement of commissions, utilities, academics, and
consultants. Nearly a hundred reports were produced on various
aspects of time-of-use (TOU) rates. The study got a major boost
when Congress passed the Public Utility Regulatory Policies Act
(PURPA) in 1978. The study came to two primary conclusions:
First, it was cost-e"ective to deploy TOU rates—rates that fluctu-
ate to reflect marginal prices during the electricity demand cycle.
Second, TOU rates could be developed using either embedded
costs, which was the tradition in the industry and the favorite of
accounts, or marginal costs, which was the approach favored by
economists. Luminaires such as Alfred Kahn, chair of the New
York Public Service Commission, chaired the advisory committee
in its first phase. I joined EPRI in 1979 and worked on the study
for a year. The biggest barrier to the deployment of TOU rates

SPRING 2020 / Regulation / 23
back then was the lack of smart meters. Today 50% of homes
have smart meters, yet less than 5% of homes have TOU rates.
The biggest barrier has turned out to be political.
1980s This decade saw some limited deployment of TOU
rates in certain states, but those e!orts were soon eclipsed by the
emergence of demand-side management to enhance economic
e"ciency and lower customer bills. The main policy instrument
was financing and rebates. Pricing was judged to be the ideal policy
instrument, but such policies were deferred for later consideration,
once again because politics intervened. TOU rates were relegated
to the world of academe. A cottage industry arose comprised of
academics who designed and evaluated TOU pricing experiments.
1990s The industry began to move toward restructuring,
inspired by the liberalization of power markets in Great Britain
during the Margaret Thatcher era. Conferences were held on the
next generation of pricing designs, which would factor in retail
customer choice and market restructuring. Plenty of books,
papers, and articles were published. Once again, academics and
researchers thrived. Not customers.
2000s I was tasked with finding ways to enhance energy
e"ciency in the Kingdom of Saudi Arabia. I discovered that a
major barrier was that prices for electricity were heavily subsi-
dized. I started asking people if I could meet the person who
set prices, but no one could tell me who that was or where he
worked. The utility said it was probably the regulator. The reg-
ulator said it was probably the ministry. When I spoke to the
ministry, o"cials there were evasive. I persisted. Finally, someone
told me the King set the prices. I decided not to pursue the topic.
I figured out that His majesty did not want to trigger a revolt on
the Arab street by raising electric rates. He had raised the price
of petrol a few years earlier, but that had triggered an adverse
reaction, forcing him to roll back the prices.
2002 Around the time of California’s energy crisis, Puget
Sound Energy, which serves the suburbs around Seattle, deployed
very attenuated TOU rates (which it called “real-time pricing”). Cus-
tomers saved hardly anything, and a revolt ensued when shadow
bills were sent out showing that. The new CEO of the company, a
long-time advocate of TOU pricing when he was at Pacific Gas &
Electric, shut down the program. The utility could have improved
the savings opportunities for customers by increasing the o!-peak
discounts but chose not to do so. The national movement toward
TOU pricing was set back a decade. Regulators and utilities drew
the wrong conclusion, that TOU pricing was to blame for the revolt,
when the problem was with the specific design of the TOU rate and
not with TOU pricing in general.
2002–2004 Soon after the worst energy crisis in its
history roiled California’s power markets, several economists
(including me) signed a manifesto that concluded in part that
the best way to avoid another crisis was to reconnect the retail
and wholesale markets that had become disjointed when the
industry was restructured in 1998. In 2002, the California Public
Utilities Commission initiated a proceeding on advanced meter-
ing, demand response, and dynamic pricing. An experiment,
called the Statewide Pricing Pilot, was carried out jointly by the
three investor-owned utilities in California to test the merits of
dynamic pricing. It ran during 2003–2004 and was monitored
through regular meetings of a stakeholder group. It showed con-
clusively that customers responded to dynamic pricing signals by
reducing peak loads and shifting peak usage to o!-peak usage.
Within a few years, all three investor-owned utilities were given
approval to move ahead with advanced meters. Their business
cases included an ample dose of dynamic pricing. Two decades
have passed, millions of dollars have been spent on a new crop of
pilot programs to confirm (yet again) that Californians respond
to changes in the price of electricity. So, almost two decades after
the energy crisis, the state will witness the ultimate anti-climax:
Very mildly di!erentiated TOU rates will be rolled out to all cus-
tomers. No one will save much, even if they move all their load to
o!-peak hours. People will either ignore the rates or get annoyed.
I see Puget Sound Energy, Part II, in the making.
2006 I was invited to speak on smart meters and smart
rates by the National Association of Regulatory Utility Com-
missioners. In the years that followed, I was invited back nine
times to speak on the same topic. After one of those sessions, a
commissioner from New Jersey said she was impressed with the
benefits of smart meters and wanted to know if there was some
way to get those benefits without the meters. I wanted to tell her
I wish there was a way to get the benefits of sunlight without the
sun. But I bit my tongue and just smiled.
2007 The chair of the California Energy Commission
noticed that only half of the goals the state had laid out for
introducing price responsive demand in its Energy Action Plan
had been achieved. She hired me to work with stakeholders to
identify ways to enhance that percentage and reach the goal of
having 5% of California’s peak demand be price responsive. My
report recommended that the commission use its load man-
agement standards authority to require that all new homes be
equipped with smart, communicating thermostats. This would
allow critical peak pricing signals to be transmitted to central
air conditioners, a major driver of peak loads, thereby balancing
demand and supply in real time. Unfortunately, nothing came
of the proposal after a conservative talk show host stirred up an
Orwellian vision of the program for his radio audience.
2009 After speaking at a conference on demand response,
I talked on the sidelines with the CEO of PJM, the grid system
that serves much of the mid-Atlantic. I asked him if he liked
E N E R G Y & N A T U R A L R E S O U R C E S
24 / Regulation / SPRING 2020
the discussion of price responsive demand. He said he did not
trust price response because it wasn’t tangible; it was not steel
in the ground. His job depended on keeping the lights on. If the
lights went out because the price response did not materialize,
he would be out of a job. I responded that he couldn’t control
the weather or the economy; he should be used to planning
under uncertainty. Price response is not any more volatile than
the economy or the weather, I noted, and he should be able to
count on it. Besides, it would save consumers money. By the time
I finished my point, he had turned away and was speaking with
someone else.
2009 I carried out a study for the New York independent
system operator on the benefits of real-time pricing. The quan-
tified benefits were significant. But little subsequently happened
because the issue fell under the dominion of the state com-
mission, and it was reluctant to move on rate modernization
because the state lacked smart meters. Of course, that was just a
convenient excuse.
~ 2009 Inaction is not just a North American problem.
About 10 years ago, in Saudi Arabia, I was presenting the final
results of a project designed to promote energy e!ciency in
the country to the executive suite of the government-owned
electric utility. Halfway into my remarks, a vice president asked
me why I kept using the word “customer” over and over. His
tone was testy. I was not sure what to make of his question
because all the work I had done was designed to encourage
customers to invest in higher-e!ciency equipment. It could not
have been a language problem because he spoke fluent English.
I answered, “Because the customer is the king.” The audience’s
faces blanched and I realized the gravity of what I had said.
Mercifully, one audience member rescued me by saying that
customers were writing letters to the editor complaining about
the poor customer service of the utility.
2009 The Federal Energy Regulatory Commission con-
ducted a state-by-state assessment of demand response potential
and identified the best way to harness it was to deploy smart
meters and o"er smart rates to all customer classes. Several work-
shops were held with stakeholders and a national action plan
was launched. But the idea failed on the launch pad because the
implementation plan that followed was devoid of actionable pol-
icies, directives, and incentives. I wrote to the chair of FERC and
said the plan was a damp squib. He asked if I knew the meaning
of that British expression. What more was there to say?
2000–2010 Having observed the California energy
crisis from afar, Ontario, Canada decided to roll out smart meters
and deploy TOU rates as the default tari" in the mid-2000s.
However, the price di"erential between the peak and o"-peak
periods was highly attenuated. Also, the TOU di"erential only
applied to the generation portion of the tari". Nonetheless, a
three-year analysis carried out by a team of researchers (including
me) showed that customers were reducing peak load by a few
percentage points, but the savings were atrophying year after year.
A recommendation that we had made in 2010 to accentuate the
savings opportunities through dynamic pricing was ignored.
Late 2000s The Harvard Electricity Policy Group pro-
vides a good forum for discussing smart meters and smart rates.
During one of my presentations at the event, a commissioner
from Washington, DC asked me if customers would response
to price changes, since electricity was a necessity. She asked me
this question after I had shown an overwhelming amount of the
evidence that customers do respond to price.
2010 At a major law school conference on the future of
the utilities industry, I talked to the chair of the utilities commis-
sion about the delays in policymaking. He said that the utilities
were frozen in time. Later, I made the same comment to a senior
executive of the local utility. She said that the regulators were
frozen in time.
2010s I have spoken a few times in Hawaii on smart grid
and smart rates during the past decade. One of the state com-
missioners promised to write “a postcard to the future” to the
mainland on how the state was going to become 100% renew-
able before 2050. Yet, to this day, the state has no smart meters,
let alone smart rates. In the meantime, a third of single-family
homes in Oahu have installed solar panels on their roofs. Some
60% of new solar customers are also installing batteries. I have
seen several EVs on the road and Tesla has an incredible show-
room right in the heart of Waikiki. Consumer have once again
left the utility and the commission behind.
2011 After sharing the results of a dynamic pricing exper-
iment with a senior utility executive, I recommended what I
thought was the most forward-looking rate design from those
that had been tested in the experiment. He picked an anodyne
rate design. My face must have given away my inner thoughts
because he added quickly: “I am not stopping you from writing
your articles and giving your talks. But this is my company and
I will do what I think is in the best interest of the company.”
2012 A workshop sponsored by the California Foun-
dation on the Environment and the Economy reexamined the
tenets of California’s inclining block rates. Three speakers—two
professors from Berkeley and I—spoke at the event. This was fol-
lowed by comments from several stakeholders. Following up on
the workshop conclusions, the California Public Utilities Com-
mission initiated proceedings to redesign the inclining block
rates. Five steeply di"erentiated tiers had been created after the
energy crisis. All the inflation that came in the years that followed
SPRING 2020 / Regulation / 25
was lumped onto the upper three tiers. After deliberating on the
issue, the commission unanimously passed a rule to flatten the
tiers. The five tiers would be replaced with just two. But at the last
minute, to arrive at a unanimous decision, a super-user surcharge
was introduced for large users. Currently, it stands at 55¢ cents
per kilowatt hour for San Diego Gas & Electric and just under
50¢ for Pacific Gas & Electric. Simultaneously, the state wants
to decarbonize completely by 2045 and it views electrification of
buildings and transport as the best way to get there. But how do
you convince consumers to switch to heat pumps when electricity
is prohibitively expensive compared to natural gas? I have raised
this issue with some of the energy division sta! who are working
on decarbonization. They said it’s an issue for the rate design
group and they will get to it in the future. Once again, the can
has been kicked down the road.
2012 I was retained by the Australia Energy Market
Commission to examine the case for applying dynamic pricing
for distribution tari!s. In Australia (as in Texas), customers
have to choose a retail energy supplier. There is no default regu-
lated supply option; the regulator only sets distribution tari!s.
My final report recommended reforming this, but I was told
there were political challenges to be overcome. We discussed
a variety of di!erent deployment mechanisms and ultimately
devised a scheme that would make these rates mandatory for
the largest customers, optional for vulnerable customers, and
the default tari! for everyone else. I thought the recommenda-
tion was touched by Solomon’s wisdom. Alas, the government
did not agree. To this day the recommendation has not been
carried out.
2014 Minnesota initiated a process for creating the grid
of the future. Demand response is a major priority of the state
and studies indicate the best way to harness its potential is to
deploy dynamic pricing to all mass-market customers. The
state first began considering the deployment of smart meters
and smart pricing in 2001, following the example of Puget
Sound Energy. But the California electricity crisis prompted
Minnesota to pull back. A pilot with various time-varying rates
was scuttled. Finally, after years of deliberation, a simple TOU
regime will be launched.
2015 I was invited by the New York Law School to be a
keynote speaker at a conference on time-varying rates. The state
energy czar opened the event, followed by the chair of the utilities
commission. I gave my talk and hoped it would make a di!erence.
To this day, the state is still trying to make up its mind about
smart meters and doing pilots with innovative rate designs. New
York’s energy vision is taking shape very, very slowly.
2019 While discussing rate reform in Texas, a former
utility commissioner told me to wait another five years because
the legislature had recently had a lot of turnover and the new
lawmakers needed time to get up to speed. I said I have been
hearing that for the past four decades.
2019 In a northwestern state, after I had testified for five
hours spread over two days, a sta! member walked me to my car
and said, “Thanks for coming, but I think I the commission will
just kick the can down the road.”
2019 In a Canadian province, I shared several ideas for
moving customers to innovative rates to help utilities stay in step
with their customers. I noted that there were EVs on the road
there, just about everyone carried a smart phone, and consumers
there were buying energy-e"cient appliances. That’s why it was
time to modernize rates. I was told the status quo remained an
option for electric rates.
It’s obvious that both regulators and energy executives are frozen
in time and they know it. They spend much of their time blaming
each other for the delays. The blame game continues unabated at
many industry events. The pace, ambiguity, and inconclusiveness
of this regulatory drama seem to be a reenactment of the play
Waiting for Godot.
THE MISSING CUSTOMER
For all practical purposes, utilities think of the regulator as their
main customer. The end-use customer is almost an afterthought,
consigned to being a “ratepayer” or “meter.” Whatever innova-
tions take place on customers’ premises are referred to as “behind
the meter.” Imagine how Nordstrom’s would thrive if it refused
to consider what happens “behind the cash register.”
The regulators, in turn, often think of the legislature or the
governor as being their main customer. The elected o"cials have
their eyes on the next election. Their final customer, the American
voter, is actually the utility’s customer and that’s how the circle is
completed.
As we all know, emotion trumps logic when it comes to win-
ning votes and often leads to unsustainable energy policies and
unrealistic timetables. Elected o"cials change every few years
and regulators often change every few years. Depending on the
frequency of the crises that routinely a#ict utilities during these
tempestuous times, utility CEOs also often change every few years.
That’s chaos theory in action.
It used to be said that rate design is more art than science.
In fact, just last year, that notion was put to me in a regulatory
hearing where we were discussing the case for demand charges.
I said the notion was mostly rooted in politics. The whole room
broke out in laughter.
Earlier, I had been grilled for 90 minutes by one of the commis-
sioners. After the cross-examination ended, a person came up to
me and said that I should write a book about these encounters. I
said I have certainly had my share, trying to push regulators and

E N E R G Y & N A T U R A L R E S O U R C E S
26 / Regulation / SPRING 2020
utilities to listen to their customers.
A couple of years ago, I asked a newly appointed regulator in
a large western state how independent of state government the
commission’s policies would be. She said that she and her col-
leagues respected their chief executive very much. I said that was
not my question. She asked me to be more specifi c. Because that
state has more solar panels than any other state, I asked her when
we should expect to see a change in net energy metering policies.
Her answer left me stunned: “You know that the solar lobby in
the state is very powerful.”
TIME FOR CHANGE
As a freshman at the University of Karachi in 1969, I came across
Paul Samuelson’s Economics textbook. Every chapter began with a
quote. One that has stayed with me is from Lewis Carroll:
The time has come, the Walrus said
To talk of many things:
Of shoes—and ships—and sealing wax
Of cabbages—and kings;
And why the sea is boiling hot;
And whether pigs have wings.
While every state is in a big rush to move ahead with decar-
bonization and has specifi ed some very aggressive timelines for
becoming 100% decarbonized, just about all the policy solutions
are on the supply side. There is almost no inclusion of dynamic
load fl exibility, which could help deal with the intermittent nature
of renewable energy.
For those of us who work in the electric utility industry, the time
has come to rethink regulation, reimagine the utility, and reconnect
with the real customer. That journey can no longer be delayed.
The best way I can think of beginning this journey is to make
“customer-centricity” the guiding principle. This means leaving
the past behind and focusing on the future. It does not mean
simply creating a new website or sending frequent text messages
to customers. Nor does it mean just engaging in social norming
to shape customer behavior. It means changing the culture of the
industry, reimagining utilities as service providers, hiring sta!
with an open mindset and new skills, reaching out to customers
to understand their changing needs, and developing new products
and services to meet those needs.
This journey will involve fi nding new ways to engage with cus-
tomers and observing those customers in real time to understand
their energy-buying decisions. Unless these steps are undertaken,
the customer is going to leave both the utility and the regulator
in the dust.
JOIN TODAY IJ.ORG/ACTION
I N S T I T U T E F O R J U S T I C E
Real ActivismReal ActivismReal ActivismReal ActivismReal ActivismReal ActivismReal ActivismReal ActivismReal ActivismReal ActivismReal ActivismReal ActivismReal ActivismReal ActivismReal ActivismReal ActivismReal ActivismReal ActivismReal ActivismReal ActivismReal ActivismReal ActivismReal ActivismReal ActivismReal ActivismReal ActivismReal ActivismReal ActivismReal ActivismReal ActivismReal ActivismReal ActivismReal ResultsReal ResultsReal ResultsReal ResultsReal ResultsReal ResultsReal ResultsReal ResultsReal ResultsReal ResultsReal ResultsReal ResultsReal ResultsReal ResultsReal ResultsReal ResultsReal ResultsReal ResultsReal ResultsReal ResultsReal ResultsReal ResultsReal ResultsReal ResultsReal ResultsReal ResultsReal ResultsReal ResultsReal ResultsReal ResultsReal ResultsReal ResultsReal ResultsReal ResultsReal ResultsReal Results

5HQHZDEOH DQG 6XVWDLQDEOH (QHUJ\ 5HYLHZV ��� ������ ������
$YDLODEOH RQOLQH � )HEUXDU\ ��������������� ���� (OVHYLHU /WG� $OO ULJKWV UHVHUYHG�
Contents lists available at ScienceDirect
Renewable and Sustainable Energy Reviews
journal homepage: www.elsevier.com/locate/rser
An enterprise control assessment case study of the energy–water nexus for
the ISONew England system
Steffi Olesi Muhanjia,!, Clayton Barrows
b, Jordan Macknick
b, Amro M. Farid
a
aThayer School of Engineering, Dartmouth College, Hanover, NH 03755, United States
bNational Renewable Energy Lab (NREL), Golden, CO, United States
A R T I C L E I N F O
Keywords:
Renewable energy integration
Energy–water-nexus
ISO New England
Curtailment
Reserves
A B S T R A C T
The generation mix of Independent System Operator in New England (ISO-NE) is fundamentally changing.
Nuclear, coal, and oil generation facilities are retiring and are replaced with natural gas, solar, and wind
generation. Variable renewable energy resources (VREs) such as solar and wind present multiple operational
challenges that require new and innovative ways to manage and control the grid. This paper studies how
water supply systems (water and wastewater treatment), and water-dependent electricity generating resources
(hydro, and thermal power plants) can be operated flexibly to enhance the reliability of the grid. The study’s
methodology employs the novel Electric Power Enterprise Control System (EPECS) simulator to study power
systems operation, and the System-Level Generic Model (SGEM) to study water consumption and withdrawals.
This work considers six potential 2040 scenarios for the ISO-NE energy–water nexus (EWN). It presents a
holistic analysis that quantifies grid imbalances, normal operating reserves, energy market production costs,
and water withdrawals and consumption. For scenarios with high amounts of VREs, the study shows great
potential of water resources to enhance grid flexibility through improvements in load-following (up to 12.66%),
and ramping (up to 18.35%) reserves. Flexible operation also results in up to 10.90% reduction in the total
time VREs are curtailed. Additionally, flexible operation reduces water withdrawals by up to 25.58%, water
consumption by up to 5.30%, and carbon dioxide emissions by up to 3.46%. In general, this work provides
significant insights into how to jointly control the water and energy supply systems to aid in their synergistic
integration.
1. Introduction
The bulk electric power system of New England is fundamentally
changing to include more solar and wind generation resources. This
evolving resource mix has triggered changes to how the electricity
grid is managed and controlled. The bulk of these changes have been
in capacity and transmission expansion. However, with the growing
uncertainty and variability introduced by variable renewable energy,
there is an even greater need for increased amounts of operational
flexibility [1,2]. ISO-NE is the independent system operator for the
states of Connecticut, Maine, Massachusetts, New Hampshire, Rhode
Island and Vermont. It is tasked with performing three critical roles
namely; (1) coordinating and running the electricity grid for the re-
gion, (2) designing, managing and running the region’s deregulated
wholesale electricity market based on minimum generation costs, and
(3) planning the system such that it continues to meet the region’s
electricity needs over the next 10 years. Water plays a fundamental
!Corresponding author.
E-mail addresses: [email protected] (S.O. Muhanji), [email protected] (C. Barrows), [email protected] (J. Macknick),
[email protected] (A.M. Farid).
role in the ISO New England (ISO-NE) system. Conventional and run-
of-river hydro make up over 9% of the overall electricity generated
in the six New England states [3]. An additional 1% of electricity
generation comes from the two main pumped energy storage facilities,
Bearswamp and Northfield [3]. In the meantime, over 83% of the cur-
rent ISO-NE electricity generation fleet comes from thermal generation
facilities which withdraw and consume large quantities of water for
cooling purposes [3]. In spite of the changing resource mix, recent
studies predict that thermal generation facilities will still account for
a significant percentage of future generation facilities in 2040 [4,5].
Fig. 1 illustrates the extent of the coupling between the water and
electricity generation resources in New England. From Fig. 1, it is clear
that most generating facilities are located near a water source and rely
on adequate water supply to perform their function. These factors not
only indicate significant coupling between the water and electricity
supply systems but they also emphasize the need for more coordination
https://doi.org/10.1016/j.rser.2021.110766
Received 26 August 2019; Received in revised form 4 December 2020; Accepted 24 January 2021

5HQHZDEOH DQG 6XVWDLQDEOH (QHUJ\ 5HYLHZV ��� ������ ������
�
S.O. Muhanji et al.
Nomenclature
Acronyms
EIA Energy Information Agency
EPECS Electric Power Enterprise Control System
EWN Energy–water nexus
FCA Forward Capacity Auctions
ISO Independent System Operator
ISO-NE Independent System Operator New England
NGCC Natural gas combined-cycle
NICR net Installed Capacity Requirement
NREL National Renewable Energy Laboratory
PHEV plug-in hybrid electric vehicles
ReEDS Regional Energy Deployment System
RPS Renewable Portfolio Standards
RTUC Real-Time unit commitment
SCADA Supervisory control and data acquisition
SCED Security-constrained economic dispatch
SCUC Security-constrained unit commitment
SGEM System-Level Generic Model
SOARES System Operational Analysis and Renew-
able Energy Integration Study
UCED Unit-commitment-economic-dispatch
VREs Variable Renewable Energy Resources
CEII Critical Energy/Electric Infrastructure In-
formation
between the two systems. Specifically, the potential synergies between
the two systems cannot be ignored especially as the electricity grid
undergoes its sustainable energy transition.
Concern about water security is growing especially with climate
change affecting hydrology patterns and the decline of freshwater
resources [6–8]. At the same time, significant attention has gone into
the integration of variable renewable energy into the electricity grid as
a means of decarbonizing the electricity supply system. As discussed
in the prequel to this paper [9], the challenges of renewable energy
integration and energy–water-nexus are very much related. In addition
to presenting low CO2 emissions, VREs have very low life-cycle water
intensities [10] hence reducing the overall water intensity of electricity
generating systems. On the other hand, water is easily stored and
therefore, has the potential to serve as a flexible energy–water resource
on both the supply-side as well as the demand-side so as to support the
integration of VREs into electricity operations [11].
The growing penetration of solar and wind poses several challenges
to maintaining the reliability of the electricity grid. In addition to
being highly variable, these resources also lower the overall marginal
costs of electricity forcing thermal units into early retirement [2].
In the absence of established market rules for VREs participation,
curtailment is widely applied as a way to balance power systems with
high penetrations of VREs. While curtailment serves to balance the
grid, it raises the overall production costs as well as emissions. Given
these challenges, independent system operators and utilities are largely
constrained with respect to maintaining the reliable performance of
the grid [2]. Therefore, alternative techniques for managing VREs
such as allowing these resources to provide active power support and
operating reserves could greatly improve the operating flexibility of the
grid [2,12]. Furthermore, engaging active demand-side participation
in the provision of ancillary services such as reserves, and active
power support through load-shedding or load-shifting would go a long
way to improve the flexible performance of the electricity grid [12].
Water and wastewater treatment systems are already equipped with
the necessary monitoring technologies such as supervisory control and
data acquisition (SCADA) systems to provide ancillary services, and in
turn improve their profits and also achieve a more robust operation of
their systems. In order to better leverage the potential synergies in real-
time operation of water and power supply systems, the methodologies
of energy–water-nexus and renewable energy integration studies must
converge.
1.1. Literature review
Despite the benefits of joint operation, renewable energy integration
and EWN studies have not yet converged to realize benefits. While
some EWN studies have quantified the withdrawals by thermal power
plants, these studies have largely been conducted in isolation of actual
operation of the electricity generation industry [13–15]. Thus, the
full impact on either infrastructure is not assessed. For example, [16]
quantifies water withdrawal and consumption coefficients primarily
based on literature sources. Other EWN works have focused solely
on optimizing the operations of water systems such as in the optimal
operation and scheduling of water pumps to minimize electricity us-
age [17,18] and water pumping costs [19]. These include the optimal
scheduling of water systems [20,21] and flexible operation of water
systems for electricity demand response [22,23] and other ancillary
services so as to maximize returns for water systems [24]. Finally, a
small subset of EWN studies have presented mostly single-layer ap-
proaches that co-optimize the water and electricity networks. Examples
of such works include the optimal network flow in [25], the economic
dispatch in [26,27], and the unit commitment problem in [28] for
a combined water, power, and co-production facilities. A majority of
EWN studies however, still focus on specific case study geographies
such as the Middle East [29,30], California [31], or North Africa [32].
Despite the large body of work and research on the energy–water
nexus, there is still a lack of a generic, case and geography-independent
methodologies that encompass all flows within, and between the water
and energy systems [33,34]. In fact, a recent review [35] of EWN
studies shows that these studies require integral methodologies that
capture the overall complexity of the nexus.
In the meantime, renewable energy integration studies have of-
ten been case and geography specific and have mostly utilized unit-
commitment-economic-dispatch (UCED) models of power system con-
trol to study the operation of electricity markets with large penetra-
tions of VREs [36–38]. A significant percentage of these studies have
taken statistical approaches to determine the impact of wind and solar
forecast errors on dispatch decisions. A subset of renewable energy
integration studies have recognized the vital role of reserves in the
balancing performance of systems with high VRE penetration and have
thus, focused on the acquisition of normal operating reserves such as
load-following, regulation, and ramping reserves [39–42].
However, a recent review of renewable energy integration studies
shows major methodological limitations [43]. Firstly, while some stud-
ies focus on reserve acquisition, the required quantity of reserves is
usually based on the experiences of grid operators which no longer
applies to systems with high penetrations of VREs [44,45]. Secondly,
most studies only consider either the net load variability or the forecast
error in determining the amount of reserves despite evidence that
shows that both of these variables contribute towards normal operating
reserve requirements [44,46]. Lastly, although studies have shown
that VREs possess dynamics that span multiple timescales of power
system operation [47,48], most renewable energy integration studies
have largely neglected the effect of timescales on the various types of
operating reserve quantities [43]. Farid et al. [43] proposed a holistic
approach based on enterprise control to study the full impact of VREs
on power system balancing performance and reserve requirements
while considering the multi-timescale dynamics of VREs. Enterprise
control is an integrated and holistic approach that allows operators to
study and improve the technical performance of the grid while realizing

5HQHZDEOH DQG 6XVWDLQDEOH (QHUJ\ 5HYLHZV ��� ������ ������
�
S.O. Muhanji et al.
Fig. 1. A map of New England’s electric power generation units and rivers.
cost savings [43]. An application of enterprise control in the form of
the Electric Power Enterprise Control System (EPECS) simulator has
been proposed in literature [43,49–52] and tested on various case
studies including the ISO New England system [53]. In [53], the EPECS
simulator is used to study the performance of the ISO-NE system on 12
scenarios with varying penetrations of VREs. This study highlighted the
key role of curtailment and normal operating reserves on the balancing
performance of the ISO-NE system. This paper extends the work in [53]
and [9] to quantify the flexibility afforded the ISO-NE system through
flexible operation of energy–water resources. For the purposes of this
study, the term ‘‘energy–water resources’’ collectively refers to water
and wastewater treatment systems (which are assumed to only consume
electricity in this study), run-of-river and conventional hydro (which
generate electricity), thermal power plants (which consume water for
cooling and generate electricity), and finally, pumped energy storage
(which consumes and generates electricity).
1.2. Original contribution
The main contribution of this paper is a case study of the energy–
water nexus in the New England region. It utilizes the methodology
presented in the prequel [9] and extends the results of renewable
energy integration study found in [53] to specifically include several
environmental performance and economic performance measures. This
techno-economic study of the EWN in New England addresses twelve
predefined 2040 scenarios; 6 with a ‘‘flexible’’ operation of energy–
water resources and 6 ‘‘conventional’’ (i.e. inflexible) operation of
energy–water resources. This case study takes the yellow rectangle of
Fig. 2 as its system boundary and consequently is able to quantify
the mass and energy flows in and out of the defined yellow system
boundary regardless of the test case or geographical region. Addition-
ally, this paper provides insight into some of the operational challenges
presented by high penetrations of VREs and assesses the flexibility
value of flexible energy–water resources by quantifying the amounts
of normal operating reserves for the ISO-NE system for each scenario.
Given that the methodology presented in the prequel [9] is generic
and modular, the EPECS simulator is modified to reflect the ISO-NE
operations as fully outlined in [53]. Each simulation scenario runs for
a full year with one minute time step. In this study, the following
operational parameters are quantified: (1) load-following, ramping, and
regulation reserves, (2) the ability of water and wastewater treatment
facilities to shift their electricity demand in response to changes in
electricity supply, (3) the fuel flows of thermal units and their carbon
emissions, (4) water withdrawals and consumption by thermal power
plants, and (5) the overall effect of flexible operation of energy–water
resources on the production cost of operation for the New England
electricity grid.
1.3. Outline
The rest of the paper is structured as follows: Section 2 presents the
methodology for the ISO New England EWN study. Section 3 gives a
detailed description of the case study data. Section 4 presents the results
of the study within the context of the key performance characteristics
of the power grid. Finally, the paper is concluded in Section 5.
2. Methodology
As shown in Fig. 3, the methodology of the ISO New England EWN
study is best viewed in two parts: planning and operations. Section 2.1
describes how the National Renewable Energy Laboratory’s (NREL)
Regional Energy Deployment System (ReEDS) was used to evolve the
2030 ISO New England electric power generation capacity mixes to six
distinct 2040 capacity mix scenarios. From there, the remainder of the
section describes the Electric Power Enterprise Control System (EPECS)
simulator as customized for ISO New England’s operation [9,53]. Typi-
cally, it includes simulation functionality for two energy market layers:
the Security Constrained Unit Commitment (SCUC) and the Security

5HQHZDEOH DQG 6XVWDLQDEOH (QHUJ\ 5HYLHZV ��� ������ ������
�
S.O. Muhanji et al.
Fig. 2. A diagram of the physical flows between the physical infrastructures (water supply system, wastewater management system, and electricity supply system) and the natural
surface environment that were quantified in this study [54].
Fig. 3. Diagram of the Simulators Used for the ISO New England EWN Study.
Constrained Economic Dispatch (SCED), power system regulation and
a physical model of the power grid itself (i.e. power flow analysis). For
this study, the simulator has been customized for ISO-NE operations to
include the Real-Time Unit Commitment (RTUC) as shown in Fig. 4.
Furthermore, the SGEM model [9,55] is used to capture the essential
physics of cooling processes for thermal power plants and in turn
compute the water withdrawals and consumption for each power plant.
2.1. Regional energy deployment system (ReEDS) for capacity planning
ReEDS is a capacity planning tool that was developed by NREL
starting in 2003. ReEDS is a tool that identifies the long-term evolution
of the electric power grid for various regions in the United States [56–
58]. At its core ReEDS is an optimization tool that identifies the cost-
optimal mix of generation technologies subject to reliability, generation
resource, and regulatory constraints [56–58]. The optimization has a

5HQHZDEOH DQG 6XVWDLQDEOH (QHUJ\ 5HYLHZV ��� ������ ������
�
S.O. Muhanji et al.
Fig. 4. Architecture of the Electric Power Enterprise Control System (EPECS) simulator customized for ISO New England operations [53].
two-year time step for a total of 42 years ending in 2050[56–58].
The final output of the simulation is generation capacity by technol-
ogy, storage capacity, electricity costs among others [56–58]. This
optimization tool was used to determine the evolution of the ISO-NE
system from the 2030 scenarios to the 2040 scenarios. The model input
assumptions were selected from configurations defined by the 2018
Standard Scenarios [59] (see Table 1) to align with the 2030 capacity
mixes described in Section 3.1. Details on added capacities for each
scenario can be found in Section 3.
2.2. The physical power grid
The physical power grid layer of Fig. 4 is represented by the zonal
network shown in Fig. 5. The system data is in turn consolidated into
the zonal network model of Fig. 5. This zonal network captures the
power flows between pre-defined electricity load zones (i.e. ‘‘bubbles’’)
along abstracted ‘‘pipes’’; thus eliminating the need for Critical En-
ergy/Electric Infrastructure Information (CEII) clearance. The EPECS
simulator implements a lossless DC Power Flow Analysis to determine
these flows as described in [9,53]. The high-level interface flow limits
between the various bubbles are indicative of the line congestion often
experienced in the ISO New England territory.
2.3. The security constrained unit commitment (SCUC)
The power system balancing operation commences with the day-
ahead resource scheduling Fig. 4 in form of the SCUC. It is performed
the day before to determine the best set of generators that can meet
the hourly demand at a minimum cost. The time step for the SCUC
is 1-hour and it determines the optimal set of generators for the next
24-hours. A simplified version of this program is presented in [9]
and the full version customized for ISO-NE operations is presented
in [53]. Note that the SCUC formulation used for this study extends
the methodology in [53] to also include ramping constraints for wind,
solar, and hydro resources [9]. Ramping constraints define the limits
to how fast an energy resource can increase or decrease its output per
unit time. When variable resources such as solar and wind become
semi-dispatchable through curtailment, it means that these resources
must ramp between two consecutive curtailment values (in time). This
study assumes these variable energy resources can ramp between their
maximum and minimum capacities within a single SCED time step of
five minutes as defined in Ref. [9]. Conventional generation resources
have ramp rates as well.
2.4. Real-Time Unit Commitment (RTUC)
The same day resource scheduling of Fig. 4 is conducted every hour
through the RTUC. It uses an optimization program that is quite similar
to that of SCUC but only commits and de-commits fast-start units. Fast-
start units are defined by their ability to go online and produce at
full capacity within 15–30 min. The RTUC runs every hour with a 15-
minute time step and a 4-hour look-ahead. The complete mathematics
for the RTUC can be found in [53] with slight modifications to include
ramping constraints for wind, solar, and hydro resources as presented
in [9].
2.5. The Security Constrained Economic Dispatch (SCED)
The real-time balancing operation of Fig. 4 is implemented through
the SCED which is run every 10-minutes. The role of the SCED is to
move available generator outputs to new set points in a cost-effective
way. The SCED does not bring online any units but rather ramps up or
down the available online units. The SCED methodology is presented
in [9,53] and similar to SCUC and RTUC, it has been extended to
allow for the ramping of wind, solar, and hydro resources [9]. A more
comprehensive description of the EPECS methodology and mathemat-
ical formulations for each control layer can be found in [9,53]. This
methodology has been analyzed and validated by ISO-NE.
2.6. Regulation
A pseudo-steady-state approximation of the regulation service
model that ties directly to a power flow model of the physical power
grid is also used in this study. Normally, imbalances at the output of
the regulation service would be represented in the form of frequency
changes [60]. However, for steady-state simulations with 1-minute

5HQHZDEOH DQG 6XVWDLQDEOH (QHUJ\ 5HYLHZV ��� ������ ������
�
S.O. Muhanji et al.
Table 1
This table maps the SOARES 2030 scenarios to the ReEDS 2018 standard scenarios [59] that were used to evolve
the SOARES 2030 scenario data into the 2040 scenarios used for this study.
Scenario Name SOARES 2030 Scenarios ReEDS Scenarios
Scenario 2040-1 RPSs + Gas High RE Cost
Scenario 2040-2 ISO Queue Accelerated Nuclear Retirements
Scenario 2040-3 Renewables Plus Low RE Cost
Scenario 2040-4 No Retirements beyond
Forward Capacity Auctions (FCA) #10
Low Wind Cost
Scenario 2040-5 ACPs + Gas Extended Cost Recovery
Scenario 2040-6 Renewable Portfolio Standards (RPSs) +
Geodiverse Renewables
Low Natural Gas Prices
Fig. 5. The ISO-NE zonal network model represented as ‘‘pipes’’ and ‘‘bubbles’’[53].
time step, the concept of frequency is not applicable. Instead, a desig-
nated virtual swing bus consumes the mismatches between generation
and electricity load to make the steady state power flow equations
solvable [53].
2.7. Variable renewable energy
Variable renewable energy resources in the EPECS simulator are
studied as time-dependent, spatially distributed exogenous quantities
that contribute directly to the electricity net load. Where the term net
load here is defined as the difference between the aggregated electricity
system load and the total generation produced by VREs, tieline profiles
and any transmission losses [53].
As previously defined in [9], the EPECS simulator differentiates
energy resources into several classes:
Definition 2.7.1 (Variable Renewable Energy Resources (VREs)). Gener-
ation resources with a stochastic and intermittent power output. Wind,
solar, run-of-river hydro, and tie-lines are assumed to be VREs.
Definition 2.7.2 (Semi-Dispatchable Resources). Energy resources that
can be dispatched downwards (i.e curtailed) from their uncurtailed
power injection value. When curtailment is allowed for VREs, they
become semi-dispatchable. In this study, wind, solar and tie-lines are
treated as semi-dispatchable resources. Note that for the purposes of
this study, electricity generated by run-of-river and conventional hydro
resources can be curtailed and, therefore, these resources are treated
as semi-dispatchable in the ‘‘flexible case’’ mentioned in Section 3.1.
However, in the ‘‘conventional case’’, the electricity output of run-of-
river and conventional hydro resources is not semi-dispatchable but
rather variable. Similarly, water and wastewater treatment facilities
have the ability to shed their electricity consumption in the ‘‘flexible
case’’ and are inflexible or variable in the ‘‘conventional case’’.
Definition 2.7.3 (Must-Run Resources). Generation resources that must
run at their maximum output at all times. In this study, nuclear gener-
ation units are assumed to be must run resources.

5HQHZDEOH DQG 6XVWDLQDEOH (QHUJ\ 5HYLHZV ��� ������ ������
�
S.O. Muhanji et al.
Definition 2.7.4 (Dispatchable Resources). Energy resources that can be
dispatched up and down from their current value of power injection.
In this study, all other resources are assumed to be dispatchable.
The EPECS simulator employs the operating reserve concepts de-
scribed in [61,62] with only a few changes. This study focuses on the
normal operating reserves that are able to respond to real-time changes
in wind and solar generation. Specifically, how much of these reserve
quantities comes from electricity generated by water resources such
as conventional hydro and run-of-river hydro power plants, and the
electricity load-shedding potential of electricity consumed by water
and waste-water treatment facilities. Normal operating reserves are
classified as load following, ramping, and regulation reserves based on
the mechanisms upon which they are acquired and activated. For the
purposes of this study, the curtailment of VREs was assumed to provide
both load-following and ramping reserves in an upward direction to
their forecasted value and in a downward direction to their minimum
operating capacity limit.
These three types of operating reserves work together to respond
to real-time forecast errors and variability in the electricity net load
during normal system operation. Note that the actual quantities of
these reserves are physical properties of the power system and exist
regardless of whether they are monetized or not. The EPECS simulator
provides as output the following quantities: system imbalances, oper-
ating reserves (load-following, ramping and regulation), generator set
points, curtailed generation and line flows for every minute.
2.8. System-level Generic Model (SGEM)
The SGEM was developed to study the water use of fossil fuel,
nuclear, geothermal and solar thermal power plants using either steam
or combined cycle technologies [63]. This model is also geography
and case-independent; making it ideal for application to the ISO-NE
system. Three main cooling processes are applied in this paper: once-
through cooling, wet tower cooling and dry-air cooling. Majority of the
older generation power plants used once-through cooling technology
while the newer power plants were either recirculating or dry-cooling.
The formulae for computing water withdrawals and consumption are
presented in [9].
With this information, the energy–water flows through the yellow
system boundary of Fig. 2 can be easily quantified (as detailed in [9])
to determine, water withdrawals and consumption by thermal power
plants, as well as other aspects such as fuel consumption and CO2
emissions. As illustrated in Fig. 2, it is important to capture all the
physical flows between the three physical infrastructures(water supply
system, wastewater management system, and electricity supply system)
and the natural surface environment. In this study, however, each water
resource fits within an electric power system load area (or ‘‘bubble’’ as
they commonly called within the New England Power Pool). Therefore,
full hydraulic modeling does not provide additional insight in the
provision of flexibility services to the electric power grid. The approach
presented here is sufficient to capture all the interfaces between the
water supply system and the electricity supply system and impose
aggregate energy constraints as necessary.
2.9. Assessing the flexibility of the system
The term power system flexibility is quantified by assessing the
availability of several different types of normal operating reserves
namely; load-following, ramping, and regulation reserves. Together,
these reserves determine how well the system can respond to real-time
variability in the electricity system net load. The formulae for these
reserves are established in the following Refs. [61,62,64]. Therefore, a
system with abundant amounts of operating reserves is well-equipped
to respond to real-time variability in electricity net load and is thus,
considered to be more flexible.
3. Case study scenarios and data
3.1. Study scenarios
The case study scenarios presented in this work are best understood
in the context of the twelve scenarios that were studied in the 2017
System Operational Analysis and Renewable Energy Integration Study
(SOARES) that was commissioned by ISO-NE. These 12 scenarios distin-
guished between the amount and diversity of dispatchable generation
resources, electricity load profiles, and the penetration of VREs [53].
Of these scenarios, six were meant to describe the year 2025 while the
other six were meant to describe the year 2030. Both the 2025 and
2030 scenarios used in the SOARES were defined by ISO New England
and its respective stakeholders. The ReEDS capacity expansion model
was used to evolve the 2030 SOARES scenarios to the 2040 scenarios
used in this work. To achieve this, the ReEDS capacity planning tool
was first calibrated to reach the SOARES 2030 energy mixes from a
2015 base year. From there, the ReEDS model was extended along these
six distinct trends (as outlined in Table 1) another 10 years into the
future to 2040 to reach the energy mixes presented here. The final
capacity mixes of the six 2040 scenarios are summarized in Fig. 6 and
are described further below. Note that these scenarios are by no means
a prediction of ISO New England’s future energy mixes. They are simply
indicative of the trends demonstrated by the SOARES 2030 scenarios if
they were to continue another 10 years to 2040.
In order to assess the value of uncoordinated vs coordinated EWN
operation, each of these six scenarios were simulated twice; once
with energy–water resources as variable resources and another as
semi-dispatchable resources. These scenario variants are respectively
referred to as the ‘‘conventional’’ operating mode (as a control case)
and the ‘‘flexible’’ operating mode (as the experimental case).
3.1.1. Scenario 2040-1: RPSs + gas
In this scenario, the oldest oil and coal generation units are retired
by 2030 and the retired units are replaced by natural gas combined-
cycle (NGCC) units at the same locations. Furthermore, the ReEDS
model adds 50 MW of biomass, 233 MW of solar, 75MW of hydro and
6351 MW of natural gas (NG) to this scenario. It also retires 870 MW
of nuclear, 667 MW of NG and 1127 MW of oil generation.
3.1.2. Scenario 2040-2: ISO queue
In this scenario, the retired oil and coal units from Scenario 1 are
replaced by renewable energy resources instead of NGCC. The locations
of the renewable energy resources are determined according to the ISO-
NE Interconnection Queue. The ReEDS model resulted in the addition
of 2498 MW of solar, 9.77 MW of hydro, and 5831.75 MW of NG
(mostly in New Hampshire). In addition, 2471 MW of nuclear, 668 MW
of natural gas and 25 MW of coal generation units were retired.
3.1.3. Scenario 2040-3: Renewables plus
In this scenario, more renewable energy resources are used to
replace the retiring units. Additionally, battery energy systems, energy
efficiency and plug-in hybrid electric vehicles (PHEV) are added to the
system. Moreover, two new tie lines are added to increase the amounts
of hydroelectricity imports. The ReEDS model results in the following
modifications to this scenario: (1) addition of 2760 MW of solar, 9 MW
of hydro, 2765 MW of NG, and (2) the retirement of 378 MW of coal,
870 MW nuclear, 667 MW of NG and 1127 MW of oil.
3.1.4. Scenario 2040-4: No retirements beyond Forward Capacity Auctions
(FCA) #10
In contrast to other scenarios, no generation units are retired beyond
the known FCA resources. The FCA resources are replaced by NGCC
located at the Hub. This scenario is the business-as-usual scenario. The
ReEDS model results in the following modifications to this scenario: (1)
addition of 989 MW of solar, 4.2 MW of hydro, and 3987 MW of NG,
and (2) the retirement of 383 MW of coal, 870 MW nuclear, 667 MW
of NG and 1127 MW of oil.

5HQHZDEOH DQG 6XVWDLQDEOH (QHUJ\ 5HYLHZV ��� ������ ������
�
S.O. Muhanji et al.
Fig. 6. Summary of available generation capacity as a percentage of total available capacity by fuel type for all six 2040 scenarios.
3.1.5. Scenario 2040-5: ACPs + gas
In this scenario, the oldest oil and coal generation units are retired
by 2030 and these units are replaced by new NGCC units to meet the
net Installed Capacity Requirement (NICR). The ReEDS model results in
the following modifications to this scenario: (1) addition of 3089 MW
of solar, 11.1 MW of hydro, and 2496 MW of NG, and (2) the retirement
of 253 MW of coal, 870 MW nuclear, 667 MW of NG and 1127 MW of
oil.
3.1.6. Scenario 2040-6: Renewable Portfolio Standards (RPSs) + geodi-
verse renewables
This scenario is similar to Scenario 5 but instead of replacing the
retired units with NGCC units, additional renewable energy generation
is used to meet the RPSs and the NICR. However, the solar PV and
offshore wind units are located closer to the main electricity load
centers while the onshore wind is located in a remote area in Maine.
The ReEDS model results in the following modifications to this scenario:
(1) addition of 3011 MW of solar, 6.2 MW of hydro, and 2430 MW of
NG, and (2) the retirement of 870 MW nuclear, 667 MW of NG and
1127 MW of oil.
In addition to the changes in capacity mixes implemented in ReEDS,
interface limits shown in Fig. 5 were raised to reflect the likely situation
that New England would work to resolve line congestion found in the
2025 and 2030 scenarios in the SOARES scenarios [53]. Finally, in
addition to the electric data, data on power consumption by water
and waste-water treatment facilities as well as the cooling mechanisms
of thermal generators were used to determine their share of the peak
electricity load. The cooling data for thermal power plants was fur-
ther enhanced by data from the Energy Information Agency’s (EIA)
databases [65–67].
3.2. Electricity net load profiles
The electricity net load profile comprised of the system electricity
load profile minus the electricity generation from wind, solar, run-of-
river and pond-hydro power plants, as well as tie-line flows between
New England and other regions. Fig. 7 contrasts the electricity net
load profile of Scenario 2040-4 as a ‘‘business-as-usual’’ case to that of
Scenario 2040-3 as a high VRE case. The latter exhibits significant neg-
ative net load especially during low electricity load periods such as the
Spring and Fall seasons. Fig. 8 summarizes the statistics of the electric-
ity net load profiles for all six scenarios. The system electricity peak load
for Scenarios 2040-1/2/4/5/6 was 28594 MW while that of Scenario
2040-3 was 22103 MW due to a higher penetration of energy efficiency
measures. All scenarios had the same profile for electricity demand by
water and wastewater treatment facilities. Run-of-river and pond-hydro
generation profiles were curtailable at a price of $4.5"!"# similar
to the 2017 ISO-NE SOARES. In this study, electricity consumed by
water and wastewater treatment plants is treated as flexible in that it
has a load-shedding rather than load-shifting capability and is assumed
to contribute towards operating reserves. The 709 GWh of available
pumped energy storage capacity is treated as dispatchable for all six
scenarios throughout the study. Table 2 summarizes the capacity data
for these flexible energy–water resources. Again, in order to assess
the ‘‘flexibility value’’ of these energy–water resources, each of the six
scenarios is simulated in a ‘‘conventional or uncoordinated’’ mode of
operation and a ‘‘flexible or coordinated’’ mode of operation.
4. Results & discussion
Given the aforementioned scenarios, the value of flexible energy–
water resources is assessed from reliability, economic, and environ-
mental perspectives. From a reliability perspective, Section 4.1 presents
the relative improvements in the system’s balancing performance as
quantified by the available quantities of operating reserves (i.e. load-
following, ramping, and regulation reserves), curtailment, and the mag-
nitude of system imbalances. From an environmental perspective, Sec-
tion 4.2 quantifies the improvements in the quantities of water with-
drawn and consumed as well as CO2 emitted. Here, water withdrawn
refers to the volumetric flow rate of water withdrawn from the natural
surface environment and water consumption refers to the amount of wa-
ter not returned to its original point of withdrawal (due to evaporative
losses). Finally, Section 4.3 quantifies the associated production costs
in the day-ahead and real-time energy markets.
4.1. Balancing performance of coordinated energy–water operation
As mentioned above, this section presents the system balancing per-
formance improvements as result of coordinated energy–water opera-
tion in terms of: the available quantities of operating reserves (i.e. load-
following, ramping, and regulation reserves), curtailment, and the mag-
nitude of system imbalances.
4.1.1. Load-following reserves
In day-to-day operation, the upward and downward load-following
reserves are used in time to allow the system to respond to variability
and uncertainty in the electricity net load. In the traditional operation
of the electricity grid, having sufficient load-following reserves is a
primary concern especially in systems with high penetrations of renew-
ables. Both upward and downward load-following reserves are equally
important in ensuring system reliability. As upward load following

5HQHZDEOH DQG 6XVWDLQDEOH (QHUJ\ 5HYLHZV ��� ������ ������
�
S.O. Muhanji et al.
Fig. 7. The load and net load profiles from Scenario 2040-4 (top) and 2040-3 (bottom).
Fig. 8. A comparison of load and net load distributions for all six 2040 scenarios.
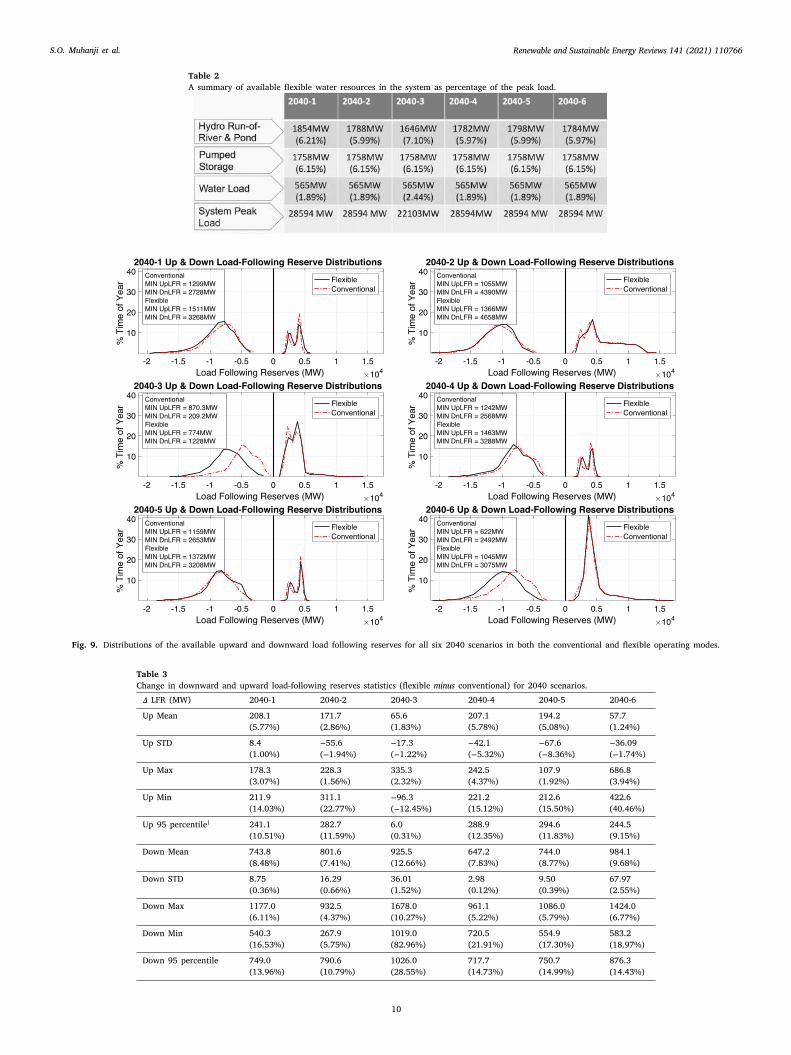
5HQHZDEOH DQG 6XVWDLQDEOH (QHUJ\ 5HYLHZV ��� ������ ������
��
S.O. Muhanji et al.
Table 2
A summary of available flexible water resources in the system as percentage of the peak load.
Fig. 9. Distributions of the available upward and downward load following reserves for all six 2040 scenarios in both the conventional and flexible operating modes.
Table 3
Change in downward and upward load-following reserves statistics (flexible minus conventional) for 2040 scenarios.
$ LFR (MW) 2040-1 2040-2 2040-3 2040-4 2040-5 2040-6
Up Mean 208.1
(5.77%)
171.7
(2.86%)
65.6
(1.83%)
207.1
(5.78%)
194.2
(5.08%)
57.7
(1.24%)
Up STD 8.4
(1.00%)
#55.6
(#1.94%)
#17.3
(#1.22%)
#42.1
(#5.32%)
#67.6
(#8.36%)
#36.09
(#1.74%)
Up Max 178.3
(3.07%)
228.3
(1.56%)
335.3
(2.32%)
242.5
(4.37%)
107.9
(1.92%)
686.8
(3.94%)
Up Min 211.9
(14.03%)
311.1
(22.77%)
#96.3
(#12.45%)
221.2
(15.12%)
212.6
(15.50%)
422.6
(40.46%)
Up 95 percentile1
241.1
(10.51%)
282.7
(11.59%)
6.0
(0.31%)
288.9
(12.35%)
294.6
(11.83%)
244.5
(9.15%)
Down Mean 743.8
(8.48%)
801.6
(7.41%)
925.5
(12.66%)
647.2
(7.83%)
744.0
(8.77%)
984.1
(9.68%)
Down STD 8.75
(0.36%)
16.29
(0.66%)
36.01
(1.52%)
2.98
(0.12%)
9.50
(0.39%)
67.97
(2.55%)
Down Max 1177.0
(6.11%)
932.5
(4.37%)
1678.0
(10.27%)
961.1
(5.22%)
1086.0
(5.79%)
1424.0
(6.77%)
Down Min 540.3
(16.53%)
267.9
(5.75%)
1019.0
(82.96%)
720.5
(21.91%)
554.9
(17.30%)
583.2
(18.97%)
Down 95 percentile 749.0
(13.96%)
790.6
(10.79%)
1026.0
(28.55%)
717.7
(14.73%)
750.7
(14.99%)
876.3
(14.43%)

5HQHZDEOH DQG 6XVWDLQDEOH (QHUJ\ 5HYLHZV ��� ������ ������
��
S.O. Muhanji et al.
Table 4
Change in downward and upward ramping reserves statistics (flexible minus conventional) for all six 2040 scenarios.
$ RampR Stats (MW/min) 2040-1 2040-2 2040-3 2040-4 2040-5 2040-6
Up Mean 334.9
(11.83%)
259.4
(5.28%)
291.3
(8.26%)
308.7
(13.78%)
325.3
(14.31%)
287.7
(6.16%)
Up STD 14.8
(2.86%)
27.9
(5.42%)
3.5
(0.31%)
16.3
(3.40%)
11.6
(2.55%)
15.8
(1.48%)
Up Max 430.7
(10.40%)
354.7
(5.65%)
271.0
(4.83%)
361.5
(10.43%)
372.9
(10.58%)
331.1
(4.79%)
Up Min #59.3
(#3.89%)
69.7
(3.07%)
410.6
(47.32%)
#4.4
(#0.40%)
#5.6
(#0.49%)
305.1
(15.21%)
Up 95 percentile 310.6
(14.77%)
195.5
(4.68%)
314.9
(14.11%)
300.0
(18.78%)
318.0
(19.19%)
42.5
(1.28%)
Down Mean 339.7
(14.81%)
261.8
(5.86%)
292.3
(8.70%)
317.3
(18.35%)
325.8
(17.88%)
288.9
(6.50%)
Down STD 16.4
(3.69%)
21.4
(4.81%)
1.5
(0.13%)
16.1
(3.67%)
12.7
(2.94%)
12.4
(1.20%)
Down Min 294.2
(22.51%)
22.1
(1.06%)
199.7
(31.65%)
#15.1
(#1.92%)
#6.7
(#0.76%)
293.9
(18.44%)
Down Max 417.3
(15.37%)
354.3
(7.06%)
275.9
(5.64%)
385.1
(17.38%)
345.1
(14.42%)
320.7
(5.40%)
Down 95 percentile 344.3
(19.12%)
208.5
(5.31%)
308.0
(13.94%)
328.3
(26.15%)
337.4
(24.92%)
42.1
(1.32%)
Table 5
Change in the curtailment statistics (flexible minus conventional) for all six 2040 scenarios.
2040-1 2040-2 2040-3 2040-4 2040-5 2040-6
Tot. Semi-Disp. Res. (GWh) 0.00 0.00 0.00 0.00 0.00 0.00
Tot. Curtailed Semi-Disp.
Energy (GWh)
17.71 #1.95 60.86 23.44 20.57 #6.18
% Semi-Disp. Energy Curtailed 0.03 #0.00 0.07 0.05 0.04 #0.01
% Time Curtailed #10.42 #2.67 #5.97 #10.90 #10.74 #3.08
Max Curtailment Level (MW) 1.82 2.68 330.16 #63.03 #1.81 397.67
reserves are exhausted (approach zero), the ability of the system to
respond to fluctuation in the electricity net load is constrained.
Therefore, an enhanced balancing performance with respect to load
following reserves would show a significant trough around the zero
LFR-axis in the distributions of load following reserves shown in Fig. 9.
The larger the trough is, the more the system is not using its load
following reserves to balance the system. Fig. 9 shows that the flex-
ible use of energy–water resources (in black) widens the trough of
load-following reserves around the zero line relative to conventional
operation (in red). These graphical results are confirmed numerically
in Table 3. Flexible operation enhances the mean values of the upward
and downward load following reserves (treated as separate distribu-
tions) by 1.24%–12.66% across all six scenarios. Furthermore, the
minimum upward and downward load following reserves are improved
by flexible operation by 5.75%–82.96% across all but one of the six
scenarios. The minimum statistic is particularly important because it
defines a type of worst case ‘‘safety margin’’ that the system will always
have available to ensure its security. Similarly the 95 percentile statistic
gives a measure of how much this minimum level increases when
5% of the distribution is treated as abnormal outlier behavior. The
simulations show improvements in the 95 percentile statistic of 0.13–
28.55% across all six scenarios; thus demonstrating its robustness to
not just the minimum worst-case point but also the distribution tail
that represents challenging periods of operation. The maximum and
standard deviation statistics are provided for completeness.
4.1.2. Ramping reserves
Ramping reserves describe the total amount of power that the
system can respond up or down within a minute. Traditionally, only
Table 6
Change in regulation reserves statistics (flexible minus conventional) for all six 2040
scenarios.
2040-1 2040-2 2040-3 2040-4 2040-5 2040-6
% Time Reg. Res
Exhausted
0.001 0.001 0.000 0.000 0.001 0.001
Reg. Res.
Mileage (GWh)
1.800 0.354 0.788 1.014 1.190 0.468
% Reg. Res.
Mileage
1.349 0.251 0.638 0.777 0.909 0.326
dispatchable resources are assumed to contribute towards ramping re-
serves. In this study, renewable energy resources are semi-dispatchable
by virtue of curtailment. Consequently, they are assumed to not just
be able to ramp down or up to their minimum or maximum values
but also do so within five minutes given their power-electronics based
control. Five minutes, in this case, coincide with the minimum time-
step used in the real-time market. Similar to load-following reserves,
ramping reserves are key to ensuring that the system can respond
in time to fluctuations in the electricity net load. Having sufficient
amounts of both upward and downward ramping reserves is equally
important to ensuring reliable performance. As the amount of ramping
reserves approaches zero, the ability of the system to respond to net
load variability is significantly diminished.
Similar to load-following reserves, both upward and downward
ramping reserves are enhanced through the flexible operation of
energy–water resources. Fig. 10 illustrates a widened trough in the

5HQHZDEOH DQG 6XVWDLQDEOH (QHUJ\ 5HYLHZV ��� ������ ������
��
S.O. Muhanji et al.
Fig. 10. Distributions of the available upward and downward ramping reserves for all six 2040 scenarios in both the flexible and conventional operating modes.
flexible operating mode relative to the conventional mode. This ob-
servation is supported by the statistics in Table 4. The mean value for
the upward ramping reserves is improved across all scenarios by up to
14.31%. Likewise, the mean downward ramping reserves are improved
by up to 18.35%. Another key measure of sufficient ramping reserves
is the minimum level. As illustrated in Table 4, flexible operation
enhances the minimum downward ramping reserves by 31.65% and
the minimum upward ramping reserves by a maximum of 47.32%.
However, in cases with a lower penetration of VREs such as scenarios
2040-1/4/5, the minimum levels are slightly worse in the flexible
case than in the conventional case. Despite these anomalies, flexible
operation improved 95% percentile levels of upward and downward
ramping reserves in all cases (by 1.28%–26.15%). These results show
that the curtailment of VREs increases the flexibility to the system if
they are used to provide ramping reserves. A complete summary of
ramping reserves statistics for all six scenarios is found in Table 4.
4.1.3. Curtailment
By definition, flexible energy–water resources increase the amount
of generation available for curtailment. Recall that by Definition 2.7.2,
run-of-river and conventional hydro-pond resources are semi-
dispatchable resources that can be curtailed in a flexible operating
mode. As illustrated in Fig. 11, scenarios with a lower penetration of
VREs such as scenario 2040-1/4/5 curtail infrequently and the amount
of megawatt curtailed is generally zero. For scenarios 2040-2/3/6,
curtailment is used at least 40% of the time. Although, the two cases
appear to have similar curtailment levels, a closer look at Table 5
shows that the flexible case curtails for a smaller percentage of the
year (2.67%–10.9%) less than the conventional case. Furthermore, the
two operating modes show nearly identical levels of total curtailed en-
ergy. In the absence of sufficient load-following and ramping reserves,
curtailment serves a key role in ensuring system balance. This role is
particularly crucial for VREs located in remote areas (e.g. Maine) where
it serves as the only control option given topological constraints and
distance from electricity load areas.
4.1.4. Regulation service
The regulation service is used to correct system imbalances in real-
time. This control lever is used to meet any left-over imbalances after
curtailment, load-following and ramping reserves have been used up
during market operation. In both cases, all scenarios appear to use
their regulation effectively as shown in Fig. 12. This is indicative of
a system that has sufficient regulation to mitigate real-time imbalances
and maintain balancing performance. A closer inspection of Table 6
illustrates that flexible operation marginally increases the reliance on
regulation (as shown by the excess mileage) and exhausts its regulation
(albeit for a small fraction of the year 0.001) for all but scenarios
2040-3 and 2040-4.
4.1.5. System imbalances
Balancing performance indicates the residual imbalances after the
regulation service has been deployed. Given that the regulation service
was barely saturated, the amount of imbalances are expected to be
minimal. As shown in Fig. 13, flexible energy–water resources had
a small impact on the range of final imbalances of the system. Both
systems appear to perform similarly with all cases maintaining a stan-
dard deviation of less than 16MW across all six scenarios. Table 7
illustrates that the flexible operating mode performs slightly better
than the conventional with up to a 6.48% improvement in standard
deviation. The minimum imbalances are lower in all cases except for
Scenarios 2040-1 and 2040-2. Similarly, the maximum imbalances are
lower for the flexible operating mode except for Scenarios 2040-2 and
2040-6 which represent scenarios with high VREs.
4.2. Environmental performance of coordinated energy–water operation
As mentioned before, the environmental performance of coordi-
nated energy–water operation is assessed through overall reductions in
water withdrawals, consumption and CO2 emissions.

5HQHZDEOH DQG 6XVWDLQDEOH (QHUJ\ 5HYLHZV ��� ������ ������
��
S.O. Muhanji et al.
Fig. 11. Curtailment duration curves for all six 2040 scenarios in both the flexible (above) and conventional (below) operating modes.
Fig. 12. Regulation duration curves for all six 2040 scenarios in both the flexible (above) and conventional (below) operating modes.

5HQHZDEOH DQG 6XVWDLQDEOH (QHUJ\ 5HYLHZV ��� ������ ������
��
S.O. Muhanji et al.
Fig. 13. Range (above) and standard deviation (below) statistics for all six 2050 scenarios in both the flexible (red) and conventional (blue) operation modes.
Fig. 14. Distributions of water withdrawals for all six 2040 scenarios in both the flexible and conventional operating modes.

5HQHZDEOH DQG 6XVWDLQDEOH (QHUJ\ 5HYLHZV ��� ������ ������
��
S.O. Muhanji et al.
Table 7
Change in range and standard deviations of imbalances (flexible minus conventional)
for all six 2040 scenarios.
Change in Imbalance 2040-1 2040-2 2040-3 2040-4 2040-5 2040-6
Max (MW) #0.384 0.597 #1.767 #0.682 #2.911 1.902
% Max #0.164 0.241 #0.998 #0.297 #1.269 0.779
Min (MW) 0.118 1.831 #0.598 #0.363 #4.405 #0.462
% Min #0.050 #0.733 0.335 0.156 1.887 0.189
Std. (MW) #0.552 #0.611 #0.684 #0.589 #0.584 #0.634
% Std. #3.874 #4.052 #6.484 #4.188 #4.147 #4.155
4.2.1. Water withdrawals
Fig. 14 shows the water withdrawal distributions for the flexible
and conventional operating modes. Flexible operation results in signif-
icantly lower withdrawals compared to conventional operation because
the flexible energy–water resources are able to offset the use of thermo-
electric power plants in favor of VREs. This phenomena is seen in
how the flexible withdrawal distributions are shifted left towards zero.
The associated water withdrawal statistics are summarized in Table 8
indicating improvements in mean withdrawals of up to 25.58%. These
improvements are most pronounced in Scenarios 2040-2/3/6 with
high penetrations of VREs. Indeed, the integration of several percent
(on a capacity basis) of flexible energy–water resources as shown in
Table 2, serves to reduce water withdrawals by many multiples of that
percentage. Such a phenomena can potentially appear in any scenario
where VRE curtailment serves as a major lever of balancing control.
Nevertheless, the flexible operation of energy–water resources reduces
water withdrawals across all six scenarios.
4.2.2. Water consumption
Electric power system water consumption occurs through the evap-
orative losses from cooling towers in recirculating cooling systems.
Fig. 15 shows the water consumption distribution for both the conven-
tional and flexible operating modes. While the effect is not large, the
flexible mode of operation shifts the distribution slightly towards the
zero mark. Specifically, flexible operation consumes 1.07–4.51% less
water than the conventional operation across all six scenarios, as shown
in Table 9. This relatively small percentage nevertheless accounts for
258 $ 103%3of water saved every year. Scenarios 2040-3 and 2040-
6 have the least savings. Due to high penetrations of VREs, these
scenarios require faster ramping generation which mostly comes from
fast-ramping natural gas units with recirculating cooling systems. In
short, the water saving effect of integrating VREs is a diminished to a
certain extent by the need for operating reserves from water-consuming
but flexible NGCC plants. If demand side resources (from electricity
consumed by water and wastewater treatment plants or otherwise)
played a large balancing role, then the water saving role of integrating
VREs would be more pronounced.
4.2.3. CO2 emissions
Finally, as shown in Fig. 16, the overall CO2 emissions are signif-
icantly reduced through flexible operation. It reduces the overall CO2
emissions by 2.10%–3.46%, as shown in Table 10. The mean, max, and
standard deviation of emissions are all improved. This CO2 emissions
reduction occurs because flexible energy–water resources 1.) eliminate
the need for some generation through reduced electricity consumption,
2.) enable greater VRE generation through a reduction in curtailment
and 3.) displace fossil-fueled conventional generation.
4.3. Economic performance of coordinated energy–water operation
The economic performance of coordinated energy–water operation
is assessed in terms of the day-ahead and real-time production costs.
4.3.1. Day-ahead energy market production costs
Fig. 17 shows flexible operation reduced the total production cost in
the day-ahead energy market for all 2040 scenarios. Table 11 summa-
rizes the associated statistics. Flexible operation reduced total produc-
tion costs by 29.3–68.09M$ or between 1.22–1.76%. As illustrated in
Fig. 17, Scenarios 2040-2/3/6 have much lower day-ahead production
costs due to a high penetration of VREs. In contrast, scenarios 2040-
1/4/5 have significantly higher costs as they are forced to commit
expensive thermal power plants. In short, the day-ahead energy market
production costs are lower because the flexible mode of operation
represents an optimization program that is less constrained than the
program associated with the conventional mode of operation.
4.3.2. Real-time energy market production costs
Fig. 18 illustrates the total real-time energy market production cost
for all six scenarios. Similar to the day-ahead energy market, Scenarios
2040-1/4/5 have significantly higher production costs as they are
forced to dispatch more expensive thermal power plants. Meanwhile,
Scenarios 2040-2/3/6 have lower real-time energy market production
costs due to a greater utilization of renewable energy. As detailed
in Table 12, flexible operation reduces the average real-time market
production costs by 2.46%–3.70% (or 19.58-70.83M$) across all six
scenarios.
4.4. Discussion
This study provides results for six 2040 scenarios for the New
England energy–water nexus. It illustrates significant improvements
in balancing performance of the electricity system that arise from
two key methodological differences from [53] namely; (1) treating
energy–water resources as flexible, and (2) allowing solar and wind to
provide load-following, and ramping reserves. These two changes in
how resources are treated within electricity markets amount to signif-
icant improvements in overall minimum load-following and ramping
reserves that ensure the system is able to better respond to variability
in the net load. Compared to the renewable energy integration study
in [53], the approach in this work results in overall lower curtailment
Table 8
Change in water withdrawals statistics (conventional minus flexible) for all six 2040 scenarios.
$H20 Withdrawals 2040-1 2040-2 2040-3 2040-4 2040-5 2040-6
Mean (m3"min) 905.0
(0.70%)
21370.0
(17.29%)
24050.0
(20.59%)
965.5
(0.74%)
837.6
(0.65%)
32460.0
(25.58%)
STD (m3"min) 106.7
(0.20%)
714.1
(1.35%)
#9537.0
(#19.92%)
161.8
(0.31%)
85.3
(0.16%)
#12790.0
(#24.40%)
Max (m3"min) 1251.0
(0.45%)
924.6
(0.34%)
976.6
(0.39%)
1290.0
(0.47%)
1534.0
(0.56%)
1289.0
(0.47%)
Min (m3"min) 40.1
(0.11%)
27260.0
(88.22%)
25630.0
(75.82%)
431.1
(1.17%)
575.7
(1.54%)
26830.0
(75.99%)
Total (m3"min $ 106) 475.7 11230.0 12640.0 507.5 440.2 18090.0
Percent change (%) 0.70 17.29 20.59 0.74 0.65 25.58

5HQHZDEOH DQG 6XVWDLQDEOH (QHUJ\ 5HYLHZV ��� ������ ������
��
S.O. Muhanji et al.
Fig. 15. Distributions of water consumption for all six 2040 scenarios in both the flexible and conventional operating modes.
Fig. 16. Distributions of CO2 emissions for all six 2040 scenarios in both the flexible and conventional operating modes.

5HQHZDEOH DQG 6XVWDLQDEOH (QHUJ\ 5HYLHZV ��� ������ ������
��
S.O. Muhanji et al.
Fig. 17. Total production cost in the day-ahead energy market for all 2040 scenarios in both the flexible and conventional operating modes.
Fig. 18. A comparison of the real-time production costs for flexible and conventional operation.

5HQHZDEOH DQG 6XVWDLQDEOH (QHUJ\ 5HYLHZV ��� ������ ������
��
S.O. Muhanji et al.
Table 9
Change in evaporative loss statistics (conventional minus flexible) for all six 2040 scenarios.
$ Evap Losses 2040-1 2040-2 2040-3 2040-4 2040-5 2040-6
Mean (m3"min) 2.67
(3.96%)
1.63
(3.11%)
0.30
(1.44%)
3.37
(5.03%)
1.51
(2.84%)
0.31
(1.03%)
STD (m3"min) 1.10
(2.77%)
1.05
(2.97%)
0.74
(5.58%)
1.23
(3.33%)
0.61
(2.61%)
0.68
(3.05%)
Max (m3"min) 5.71
(2.45%)
3.42
(1.44%)
6.40
(6.02%)
#0.00
(#0.00%)
1.80
(1.11%)
0.07
(0.04%)
Min (m3"min) #0.62
(#3.50%)
#0.00
(#0.00%)
#0.13
(#1.65%)
0.47
(2.56%)
#0.12
(#0.83%)
#0.06
(#0.52%)
Total (m3 $ 103) 1402 859 158 1769 794 165
Percent change (%) 4.12 3.21 1.46 5.30 2.92 1.03
Table 10
Change in CO2 emissions statistics (flexible minus conventional) for all six 2040 scenarios.
$CO2 Emissions 2040-1 2040-2 2040-3 2040-4 2040-5 2040-6
Mean (kg) 82 280
(3.46%)
60330
(3.28%)
21900
(3.17%)
82390
(3.11%)
71840
(2.90%)
23120
(2.10%)
STD (kg) 31460.0
(2.44%)
32230.0
(2.66%)
36350.0
(5.75%)
30660.0
(2.69%)
29540.0
(2.71%)
28830
(2.96%)
Max (kg) 51 500
(0.71%)
176000
(2.38%)
222500
(5.54%)
90040
(1.26%)
121800
(1.72%)
103100
(1.59%)
Min (kg) 8189.00
(2.07%)
#3313.00
(#1.08%)
#2383.00
(#1.35%)
#5755.00
(#1.14%)
1179.00
(0.31%)
92.23
(0.03%)
Total (kg $ 106) 43 240 31710 11510 43300 37760 12150
Percent change (%) 3.46 3.28 3.17 3.11 2.90 2.10
Table 11
Change in day-ahead energy market production cost statistics (flexible minus conventional) for all six 2040 scenarios.
$ Day-Ahead Costs 2040-1 2040-2 2040-3 2040-4 2040-5 2040-6
Mean ($/h) 6115.1
(1.22%)
5909.4
(1.49%)
3345.2
(1.76%)
7712.7
(1.41%)
7773.1
(1.49%)
4388.1
(1.64%)
STD ($/h) 4859.0
(2.09%)
4355.7
(1.89%)
5336.3
(3.89%)
5327.3
(2.62%)
6160.9
(3.05%)
6095.2
(3.02%)
Max ($/h) #16071.5
(#0.95%)
38820.1
(2.65%)
66093.4
(5.44%)
#76701.8
(#4.56%)
15683.0
(0.83%)
476535.0
(23.20%)
Min ($/h) 19290.1
(18.95%)
#2738.0
(#3.14%)
15922.7
(19.18%)
#706.4
(#0.45%)
#419.0
(#0.36%)
#10860.0
(#12.17%)
Total (million $) 53.57 51.77 29.30 67.56 68.09 38.44
% Reduction 1.22 1.49 1.76 1.41 1.49 1.64
Table 12
A summary of the real-time production cost statistics (flexible minus conventional).
$ Real-Time Cost 2040-1 2040-2 2040-3 2040-4 2040-5 2040-6
Mean ($/min) 1347.5
(3.70%)
1013.5
(3.65%)
372.5
(3.59%)
1304.9
(3.12%)
1173.1
(2.96%)
412.5
(2.46%)
STD ($/min) 493.5
(2.31%)
533.2
(2.62%)
553.8
(5.21%)
497.8
(2.58%)
545.8
(2.90%)
536.9
(3.30%)
Max ($/min) 895.8
(0.58%)
3976.9
(2.69%)
385.2
(0.36%)
3163.4
(2.02%)
#5845.8
(#3.41%)
40662.3
(23.52%)
Min ($/min) 88.4
(2.76%)
75.5
(3.45%)
#0.0
(#0.00%)
65.3
(0.98%)
#0.0
(#0.00%)
157.3
(3.78%)
Total (million $) 70.83 53.27 19.58 68.58 61.66 21.7
% Reduction 3.70 3.65 3.59 3.12 2.96 2.46
levels and therefore, greater utilization of VREs. While these two stud-
ies cannot be compared one-to-one given that they used different data
sets, the greater utilization of renewables in this work shows the signif-
icant value of flexible energy–water resources. The simulation results
also show that flexible operation improves environmental performance
of the electricity grid by reducing water withdrawals and consumption,
and total CO2 emissions of the system. Greater utilization of VREs in
turn decreases the day-ahead and real-time market production costs.
These results indicate that the study of renewable energy integration
must leverage the value of demand-side resources (such as demand-
side energy–water resources) in order to sustain higher penetrations
of VREs. Furthermore, it shows that there is significant economic,
environmental as well as reliability value in jointly studying/operating

5HQHZDEOH DQG 6XVWDLQDEOH (QHUJ\ 5HYLHZV ��� ������ ������
��
S.O. Muhanji et al.
Table 13
Balanced Sustainability Scorecard: The range of improvements caused by coordinated
flexible operation of the EWN.
Balancing Performance
Average Load Following Reserves 1.24–12.66%
Average Ramping Reserves 5.28–18.35%
Percent Time Curtailed 2.67–10.90%
Percent Time Exhausted Regulation Reserves 0%
Std. Dev. of Imbalances 3.874–6.484%
Environmental Performance
Total Water Withdrawals 0.65–25.58%
Total Water Consumption 1.03–5.30%
Total CO2 Emissions 2.10–3.46%
Economic Performance
Total Day-Ahead Energy Market Production Cost 29.30–68.09M$
Total Real-Time Energy Market Production Cost 19.58–70.83M$
interdependent infrastructures such as the energy and water supply
systems.
5. Conclusion
This work has used a novel enterprise control assessment method-
ology to study the EWN for the ISO New England System. Six scenarios
were studied representing plausible electric power capacity mixes in
2040. The study specifically sought to understand the impact of flexible
coordinated operation of energy–water resources on the holistic behav-
ior of these six scenarios. In short, the flexible operation energy–water
resources demonstrated truly ‘‘sustainable synergies’’ with respect to
balancing, environmental, and economic performance. Table 13 sum-
marizes the most important results of the study in a balanced sustain-
ability scorecard and highlights the synergistic improvements caused
by flexible coordinated operation of the EWN. Flexible operation of
energy–water resources results in up to 12.66% improvements in load-
following reserves, up to 18.35% increase in available ramping reserves
and up to 10.90% reduction in the total time that curtailment of VREs
occurs. Additionally, the environmental performance of the system is
significantly improved with flexible operation resulting in up to 25.58%
reductions in water withdrawals, 5.30% reductions in water consump-
tion and up to 3.46% reductions in carbon dioxide emissions. These
results show that as VRE resources become an ever-important part of
the electric power system landscape, so too must the electric power
system evolve to engage energy–water resources as control levers. In
some cases, such resources – like hydro-power plants – are mainstays of
traditional operation. In other cases, particularly water utility electric
loads, these resources will have to evolve their operation to become
true electric power grid participants.
CRediT authorship contribution statement
Steffi Olesi Muhanji: Data curation, Writing - original draft, Soft-
ware, Validation, Visualization, Investigation, Formal analysis. Clayton
Barrows: Funding acquisition, Data curation, Writing - review & edit-
ing. Jordan Macknick: Funding acquisition, Data curation, Writing -
review & editing. Amro M. Farid: Funding acquisition, Project adminis-
tration, Conceptualization, Methodology, Supervision, Writing - review
& editing.
Declaration of competing interest
The authors declare that they have no known competing finan-
cial interests or personal relationships that could have appeared to
influence the work reported in this paper.
Acknowledgments
The authors are grateful to the United States Department of En-
ergy (US-DOE) for their funding of this research work. We also ac-
knowledge the US-EU Integrated Power and Water Systems Modeling
Challenge Call which was devoted to answering the question of the
flexibility potential of energy–water resources in electric power systems
operations.
References
[1] Farid AM. The liines commitment to open-information, the labortory for
intelligent integrated networks of engineering systems. Tech. rep., 2016, [On-
line]. Available: http://engineering.dartmouth.edu/liines/wpblog/2016/02/07/
the-liines-commitment-to-open-information/.
[2] EPRI. Electric power system flexibility: challenges and opportunities. Tech. rep.,
Electric Power Research Institute; 2016, 3002007374.
[3] ISO-NE. Resource mix-ISO new England. 2019, [Online]. Available: https://www.
iso-ne.com/about/key-stats/resource-mix.
[4] Sanders KT, Blackhurst MF, King CW, Webber ME. The impact of water use fees
on dispatching and water requirements for water-cooled power plants in texas.
Environ Sci Technol 2014;48(12):140602120931006.
[5] Armstrong NR, Shallcross RC, Ogden K, Snyder S, Achilli A, Armstrong EL.
Challenges and opportunities at the nexus of energy, water, and food: A
perspective from the southwest united states. MRS Energy Sustain 2018;5.
[6] Rogers J, Averyt K, Clemmer S, Davis M, Flores-Lopez F, Kenney D, Macknick J,
Madden N, Meldrum J, Sattler S, Spanger-Siegfried E. Water-smart power:
strengthening the U.S. electricity system in a warming world. Tech. rep.,
Cambridge, MA: Union for Concerned Scientists; 2013.
[7] Kanyerere T, Tramberend S, Levine AD, Mokoena P, Mensah P, Chingombe W,
et al. Water futures and solutions: Options to enhance water security in Sub-
Saharan Africa. In: Systems analysis approach for complex global challenges.
Springer; 2018, p. 93–111.
[8] Averyt K, Macknick J, Rogers J, Madden N, Fisher J, Meldrum J, et al. Water
use for electricity in the united states: an analysis of reported and calculated
water use information for 2008. Environ Res Lett 2013;8(1):015001.
[9] Muhanji SO, Farid AM. An enterprise control methodology for the techno-
economic assessment of the energy water nexus. Appl Energy 2020;260:114274.
[10] Al-Nory M, El-Beltagy M. An energy management approach for renewable
energy integration with power generation and water desalination. Renew Energy
2014;72:377–85.
[11] Lubega WN, Farid AM. A reference system architecture for the energy–water
nexus. IEEE Syst J 2016;10(1):106–16.
[12] Muhanji SO, Flint AE, Farid AM. EIoT: the development of the energy internet
of things in energy infrastructure. Berlin, Heidelberg: Springer; 2019.
[13] Meldrum J, Nettles-Anderson S, Heath G, Macknick J. Life cycle water use
for electricity generation: a review and harmonization of literature estimates.
Environ Res Lett 2013;8(1):015031.
[14] Averyt K, Fisher J, Huber-Lee A, Lewis A, Macknick J, Madden N, et al.
Freshwater use by us power plants: electricity’s thirst for a precious resource.
Tech. rep., Cambridge, MA, USA: Union of Concerned Scientists; 2011.
[15] Macknick J, Sattler S, Averyt K, Clemmer S, Rogers J. The water implications
of generating electricity: water use across the united states based on different
electricity pathways through 2050. Environ Res Lett 2012;7(4):045803.
[16] Macknick J, Newmark R, Heath G, Hallett KC. Operational water consumption
and withdrawal factors for electricity generating technologies: a review of
existing literature. Environ Res Lett 2012;7(4):045802.
[17] Bagloee SA, Asadi M, Patriksson M. Minimization of water pumps’ electricity
usage: a hybrid approach of regression models with optimization. Expert Syst
Appl 2018.
[18] Menke R, Abraham E, Parpas P, Stoianov I. Demonstrating demand re-
sponse from water distribution system through pump scheduling. Appl Energy
2016;170:377–87.
[19] Bagirov AM, Barton A, Mala-Jetmarova H, Al Nuaimat A, Ahmed S, Sultanova N,
et al. An algorithm for minimization of pumping costs in water distribution
systems using a novel approach to pump scheduling. Math Comput Modelling
2013;57(3–4):873–86.
[20] Ulanicki B, Kahler J, See H. Dynamic optimization approach for solving an
optimal scheduling problem in water distribution systems. J Water Resour Plann
Manage 2007;133(1):23–32.
[21] Ghelichi Z, Tajik J, Pishvaee MS. A novel robust optimization approach for an
integrated municipal water distribution system design under uncertainty: A case
study of mashhad. Comput Chem Eng 2018;110:13–34.
[22] Diaz C, Ruiz F, Patino D. Modeling and control of water booster pressure systems
as flexible loads for demand response. Appl Energy 2017;204:106–16.
[23] Takahashi S, Koibuchi H, Adachi S. Water supply operation and schedul-
ing system with electric power demand response function. Procedia Eng
2017;186:327–32.

5HQHZDEOH DQG 6XVWDLQDEOH (QHUJ\ 5HYLHZV ��� ������ ������
��
S.O. Muhanji et al.
[24] Menke R, Abraham E, Parpas P, Stoianov I. Extending the envelope of demand
response provision though variable speed pumps. Procedia Eng 2017;186:584–91.
[25] Santhosh A, Farid AM, Youcef-Toumi K. Optimal network flow for the sup-
ply side of the energy-water nexus. In: 2013 IEEE International Workshop
on Intelligent Energy Systems (IWIES). 2013, p. 155–60, [Online]. Available:
10.1109/IWIES.2013.6698578.
[26] Santhosh A, Farid AM, Youcef-Toumi K. Real-time economic dispatch for the
supply side of the energy-water nexus. Appl Energy 2014;122(1):42–52. http:
//dx.doi.org/10.1016/j.apenergy.2014.01.062, [Online]. Available.
[27] Santhosh A, Farid AM, Youcef-Toumi K. The impact of storage facility ca-
pacity and ramping capabilities on the supply side of the energy-water
nexus. Energy 2014;66(1):1–10. http://dx.doi.org/10.1016/j.energy.2014.01.
031, [Online]. Available.
[28] Hickman W, Muzhikyan A, Farid AM. The synergistic role of renewable energy
integration into the unit commitment of the energy water nexus. Renew Energy
2017;108(1):220–9. http://dx.doi.org/10.1016/j.renene.2017.02.063, [Online].
Available.
[29] Crainz M, Curto D, Franzitta V, Longo S, Montana F, Musca R, et al. Flexibility
services to minimize the electricity production from fossil fuels. a case study in
a mediterranean small island. Energies 2019;12(18):3492.
[30] Hoffmann C. Beyond the resource curse and pipeline conspiracies: energy as a
social relation in the middle east. Energy Res Soc Sci 2018.
[31] Gurdak JJ. The water-energy-food nexus and California’s sustainable ground-
water management act. In: The water-energy-food nexus. Springer; 2018, p.
145–55.
[32] King C, Jaafar H. Rapid assessment of the water–energy–food–climate nexus in
six selected basins of North Africa and West Asia undergoing transitions and
scarcity threats. Int J Water Resour Dev 2015;1–17, no. ahead-of-print.
[33] Lubega WN, Farid AM. Quantitative engineering systems model and analysis of
the energy-water nexus. Appl Energy 2014;135(1):142–57. http://dx.doi.org/10.
1016/j.apenergy.2014.07.101, [Online]. Available.
[34] Lubega WN, Farid AM. A reference system architecture for the energy-water
nexus. IEEE Syst J 2014;PP(99):1–11. http://dx.doi.org/10.1109/JSYST.2014.
2302031, [Online]. Available.
[35] Hamiche AM, Stambouli AB, Flazi S. A review of the water-energy nexus. Renew
Sustain Energy Rev 2016;65:319–31.
[36] GE-Energy. New England wind integration study. Tech. rep., Schenectady, New
York: GE Energy and ISO New England; 2010.
[37] Shlatz E, Frantzis L, McClive T, Karlson G, Acharya D, Lu S, et al. Large-scale pv
integration study. Tech. rep., Las Vegas, NV, USA: Navigant Consulting; 2011.
[38] Piwko R, Bai X, Clark K, Jordan G, Miller N, Zimberlin J. The effects of inte-
grating wind power on transmission system planning, reliability and operations.
Tech. rep., Schnectady, New York: GE Energy; 2005.
[39] Ela E, Milligan M, Parsons B, Lew D, Corbus D. The evolution of wind power
integration studies: past, present, and future. In: Power & energy society general
meeting. IEEE; 2009, p. 1–8.
[40] Brouwer AS, van den Broek M, Seebregts A, Faaij A. Impacts of large-scale
Intermittent Renewable Energy Sources on electricity systems , and how these
can be modeled. Renew Sustain Energy Rev 2014;33:443–66.
[41] Holttinen H, Malley MO, Dillon J, Flynn D. Recommendations for wind integra-
tion studies – IEA task 25. Tech. rep., Helsinki: International Energy Agency;
2012.
[42] Holttinen H, Orths A, Abilgaard H, van Hulle F, Kiviluoma J, Lange B, et al. Iea
wind export group report on recommended practices wind integration studies.
Tech. rep., Paris, France: International Energy Agency; 2013.
[43] Farid AM, Jiang B, Muzhikyan A, Youcef-Toumi K. The need for holistic
enterprise control assessment methods for the future electricity grid. Renew
Sustain Energy Rev 2015;56(1):669–85. http://dx.doi.org/10.1016/j.rser.2015.
11.007, [Online]. Available.
[44] Holttinen H, Milligan M, Kirby B, Acker T, Neimane V, Molinski T. Using
standard deviation as a measure of increased operational reserve requirement
for wind power by wind engineering using standard deviation as a measure of
increased operational reserve requirement for wind power, 44. 2008.
[45] Robitaille A, Kamwa I, Oussedik AH, Montigny Md, Menemenlis N, Huneault M,
et al. Preliminary impacts of wind power integration in the hydro-quebec system.
Wind Eng 2012;36(1):35–52.
[46] Ummels BC, Gibescu M, Pelgrum E, Kling WL, Brand AJ. Impacts of wind
power on thermal generation unit commitment and dispatch. IIEEE Trans Energy
Convers 2007;22(1):44–51. http://dx.doi.org/10.1109/TEC.2006.889616.
[47] Curtright AE, Apt J. The character of power output from utility-scale photovoltaic
systems. Prog Photovolt, Res Appl 2008;16(3):241–7.
[48] Apt J, Curtright A. The spectrum of power from utility-scale wind farms and
solar photovoltaic arrays. In: Carnegie mellon electricity industry center working
paper, Pittsburgh, PA, United states, Tech. rep.; 2007.
[49] Muzhikyan A, Mezher T, Farid AM. Power system enterprise control with inertial
response procurement. IEEE Trans Power Syst 2018;33(4):3735–44. http://dx.
doi.org/10.1109/TPWRS.2017.2782085, [in press]. [Online]. Available.
[50] Muzhikyan A, Farid AM, Youcef-Toumi K. Relative merits of load following re-
serves and energy storage market integration towards power system imbalances.
Int J Electr Power Energy Syst 2016;74(1):222–9. http://dx.doi.org/10.1016/j.
ijepes.2015.07.013, [Online]. Available.
[51] Muzhikyan A, Farid AM, Youcef-Toumi K. An enterprise control assessment
method for variable energy resource induced power system imbalances part
2: Results. IEEE Trans Ind Electron 2015;62(4):2459–67. http://dx.doi.org/10.
1109/TIE.2015.2395380, [Online]. Available.
[52] Muzhikyan A, Farid AM, Youcef-Toumi K. An enterprise control assessment
method for variable energy resource induced power system imbalances part 1:
Methodology. IEEE Trans Ind Electron 2015;62(4):2448–58. http://dx.doi.org/
10.1109/TIE.2015.2395391, [Online]. Available.
[53] Muzhikyan A, Muhanji S, Moynihan G, Thompson D, Berzolla Z, Farid AM.
The 2017 ISO new England system operational analysis and renewable energy
integration study. Energy Rep 2019;5:747–92.
[54] Abdulla H, Farid AM. Extending the energy-water nexus reference architecture
to the sustainable development of agriculture, industry & commerce. In: First
IEEE international smart cities conference. 2015, p. 1–7. http://dx.doi.org/10.
1109/ISC2.2015.7366166, [Online]. Available.
[55] Rutberg MJ, Delgado A, Herzog HJ, Ghoniem AF. A system-level generic model of
water use at power plants and its application to regional water use estimation.
In: ASME 2011 international mechanical engineering congress and exposition.
American Society of Mechanical Engineers; 2011, p. 513–23.
[56] Cohen S, Becker J, Bielen D, Brown M, Cole W, Eurek K, et al. Regional energy
deployment system (ReEDS) model documentation: version 2018. Tech. Rep.
NREL/TP-6A20- 72023, Golden, CO (United States): National Renewable Energy
Lab. (NREL; 2019.
[57] Short W, Sullivan P, Mai T, Mowers M, Uriarte C, Blair N, et al. Regional
energy deployment system (ReEDS). Tech. Rep. NREL/TP-6A20-46534, Golden,
CO (United States: National Renewable Energy Lab.(NREL); 2011.
[58] Eurek K, Cole W, Bielen D, Blair N, Cohen S, Frew B, et al. Regional energy
deployment system (ReEDS) model documentation: version 2016. Tech. Rep.
NREL/TP-6A20-67067, Golden, CO (United States): National Renewable Energy
Lab.(NREL; 2016.
[59] Cole W, Frazier W, Donohoo-Vallett P, Mai T, Das P. 2018 standard scenarios
report: A U.S. electricity sector outlook. Tech. Rep. NREL/TP-6A20-71913,
National Renewable Energy Lab (NREL); 2018.
[60] Gómez-Expósito A, de la Vill Jaén A, Gómez-Quiles C, Rousseaux P, Van Cut-
sem T. A taxonomy of multi-area state estimation methods. Electr Power Syst
Res 2011;81(4):1060–9.
[61] Holttinen H, Milligan M, Ela E, Menemenlis N, Dobschinski J, Rawn B, et al.
Methodologies to determine operating reserves due to increased wind power.
IEEE Trans Sustain Energy 2012;3(4):713–23.
[62] Ela E, Kirby B, Lannoye E, Milligan M, Flynn D, Zavadil B, et al. Evolution of
operating reserve determination in wind power integration studies. In: Power
and energy society general meeting. IEEE; 2010, p. 1–8.
[63] Rutberg MJ. Modeling water use at thermoelectric power plants [Ph.D.
dissertation], Massachussets Institute of Technology; 2012.
[64] Muzhikyan A, Farid AM, Youcef-Toumi K. An a priori analytical method
for determination of operating reserves requirements. Int J Energy Power
Syst 2016;86(3):1–11. http://dx.doi.org/10.1016/j.ijepes.2016.09.005, [Online].
Available.
[65] EIA(EIA). Form eia-923 detailed data with previous form data (eia-906/920).
[Online]. Available: https://www.eia.gov/electricity/data/eia923/.
[66] Energy Information Agency (EIA). Form eia-860 detailed data with previous form
data (eia-860a/860b). [Online]. Available: https://www.eia.gov/electricity/data/
eia860/.
[67] Form eia-767 historical data files. 2019, [Online]. Available: https://www.eia.
gov/electricity/data/eia767/.

1
CITY OF LEBANON 51 North Park Street
Lebanon, NH 03766
(603) 448-4220
April 19, 2021
Hon. Michael Vose Chair, Science, Technology & Energy Committee New Hampshire House 107 North Main St. Concord, NH 03301 RE: SB 91, adopting omnibus legislation on renewable energy and utilities. Testimony on Part I, IV, and V.
Dear Rep. Vose & Members of the NH House Science, Technology & Energy Committee,
Good morning. I’m testifying in support of SB 91 on behalf of the City of Lebanon as its Assistant Mayor. This omnibus legislation enjoys broad bi-partisan in the Senate and I commend its passage to you.
Regarding Part V of the bill, it is nearly identical to the House passed HB 315, except it has the OLS drafting error striking “provide” on p. 8, line 16 that this Committee corrected. Either the bill should be amended to correct that or Part V removed all together and rely upon the Senate to pass HB 315.
I’m here in particular to make the case for keeping Part IV of the bill relative to the purchase of output of limited electrical producers in intrastate commerce and including qualifying storage systems. I realize this Committee has already voted two similar bills, HB 295, sponsored by Rep. Pearl, and HB 417, sponsored by Rep. McGhee, Inexpedient to Legislative. However, I urge you to take the time to take a closer look at this part and consider amending it to address any concerns that may persist after taking a closer look. Between now and May 27, when this bill must be reported, is the best and last opportunity to consider this matter in this biennium as House rule 36(e) prohibits the reintroduction of legislation voted ITL in first year of the session.
Part IV updates RSA 362-A: 2-a, that currently enables limited producers up to 5 MW to sell to up to 3 intrastate wholesale or retail customers, but includes archaic language dating back to 1979, regarding the PUC conducting an adjudicated proceeding for “wheeling” the power. That was a concept that existed before electric utility industry restructuring was enacted in 1996. It also limits the number of purchasers of such output to 3, without PUC authorization for more, and creates the possibly of such purchasers being relieved of transmission charges for such

2
purchases, even if such limited producer output does not actually decrease transmission charges to the distribution utility. I’ve attached a copy of the current statutes that Part IV would amend.
More importantly Part IV creates a market-based alternative, that should be free of any cross subsidy, to expanding net metering up to 5 MW. Absent such an alternative the political pressure to further expand net metering is likely to persist and grow.
Twenty-four years ago when I took on the prime sponsorship of HB 485, with then Rep. Bradley as my co-sponsor, that originally created net metering and RSA 362-A:9, we amended RSA 362-A:1, Declaration of Purpose, to read as follows (with emphasis added):
362-A:1 Declaration of Purpose. It is found to be in the public interest to provide for small scale and diversified sources of supplemental electrical power to lessen the state's dependence upon other sources which may, from time to time, be uncertain. It is also found to be in the public interest to encourage and support diversified electrical production that uses indigenous and renewable fuels and has beneficial impacts on the environment and public health. It is also found that these goals should be pursued in a competitive environment pursuant to the restructuring policy principles set forth in RSA 374-F:3. It is further found that net energy metering for eligible customer-generators may be one way to provide a reasonable opportunity for small customers to choose interconnected self generation, encourage private investment in renewable energy resources, stimulate in-state commercialization of innovative and beneficial new technology, enhance the future diversification of the state's energy resource mix, and reduce interconnection and administrative costs. However, due to uncertain cost and technical impacts to electric utilities and other ratepayers, the general court finds it appropriate to limit the availability of net energy metering to eligible customer-generators who are early adopters of small-scale renewable electric generating technologies.
While current law still recognizes that net metering is one way to enable such customer choice, the language on limiting net metering to early adopters is long since gone. But as the prime sponsor of the bill that first created net metering, I think we are overdue for a market-based alternative to net metering, especially for projects over 100 kW in size, up to 5 MW in size, and that intentionally avoids any significant cross-subsidy.
Part IV of this bill is an important complement to HB 315, allowing community power aggregations and competitive suppliers to offer local renewable generation to customers as part of their supply options, without gong through the contortions of group net metering, which is not available for generation and storage projects >1 MW up to 5 MW. Just in the past couple of weeks I’ve been approached by a major developer in West Lebanon, Chet Clem, with River Park, a 38 acre site with over 850,000 s.f. of approved mixed use space. He is very interested in the possibility of securing purchase power agreements for local renewable energy to help power his development, such as through Lebanon Community Power. I was also called last week by a Lebanon resident that owns a site that looks to be quite viable for more than 1 MW of solar (but

3
less than 5 MW) and would like to see that potential power, possibly with storage, sold through Lebanon Community. We are aware of other businesses and property owners with similar interests. Under current law such an arrangement may be possible, but is difficult. Part IV of this bill would make this a much more feasible possibility.
Before going into any more detail on Part IV of the bill, I’d also like to suggest an amendment to Part I of the bill (in red), which move NH forward in terms of enabling customer and utility owned electricity storage and all the benefits it might bring.
Amend RSA 374-H:1, XI as reenacted by Part I, Section 1 of SB 91 (p. 2, line 22) as follows:
XI. "Wholesale electricity markets" means any energy, capacity, or ancillary service market that ISO-New England operates or that may operate pursuant to RSA 362-A:2-a.
The reason for this is arises from how the definition is used to direct the PUC as follows: I. The commission shall investigate ways to enable energy storage projects to receive compensation for avoided transmission and distribution costs, including but not limited to avoided regional and local network service charges, while also participating in wholesale energy markets.
And to consider: “(b) How to compensate energy storage projects that participate in wholesale electricity markets for avoided transmission and distribution costs in a manner that provides net savings to consumers.”
There may be very limited or no way to compensate storage projects or realize net savings for avoided transmission costs for storage that participates in ISO-NE (FERC jurisdictional) wholesale markets because the load they serve, i.e. the electricity that they export to the grid is going to typically be counted toward the regional network load (RNL) that is used to determine allocation of transmission costs. HOWEVER, RSA 362-A:2-a as it exists today, and even more so as it would be improved by Part IV of SB 91, enables an intrastate wholesale market (within NH only for DG and storage < 5MW) in which generation or storage that does not participate in ISO-NE wholesale markets is treated as a load reducer and DOES reduce transmission costs and allocation to NH. So just let the PUC consider that as well as there may be greater value in having storage operate as a load reducer than full participant in ISO-NE markets. Storage that only participates with ISO-NE as a regulation resource, i.e. an ATRR or “Alternative Technology Regulation Resource” can still function as a load reducer for reducing allocation of transmission costs, but not if they are being paid for energy or capacity in that ISO-NE market.
Returning to Part IV, I’d also like to suggest a simple amendment (in red) to RSA 362-A:1-a, III as it would be amended (p. 6, lines 22-31) to read as follows:
III. "Limited producer" or "limited electrical energy producer" means a qualifying small power producer, a qualifying storage system, or a qualifying cogenerator, with a [total] maximum rated generating or discharge capacity of [not more] less than 5 megawatts, that does not participate in net energy metering, that is not registered as a
generator, asset, or network resource with ISO New England, and does not
otherwise participate in any FERC jurisdictional wholesale electricity markets,

4
except as a regulation resource. Such non-participation in FERC jurisdictional
intrastate wholesale markets may be achieved by retirement from such markets.
This would allow a limited producer not otherwise participating in ISO-NE markets to still be able to serve as a “regulation resource” (i.e. an ATRR) because that doesn’t change its function as load reducer for energy markets and relative to transmission costs.
Here are some key features of Part IV:
• It clarifies that a limited producer that participates in direct retail sales or within state wholesale sales cannot also be participating in net metering or the interstate wholesale markets administered by ISO New England. This is essential to avoid “double dipping” for compensation and to respect jurisdictional boundaries.
• It does clarify that for such limited producers, that are exclusively under state jurisdiction, can sell within the state at retail or at wholesale (intrastate wholesale sales) to electricity suppliers, which is the case today, but it is not explicitly addressed in terms of the regulatory structure.
• It gives credit, where credit is due, for actual avoided transmission costs, but only if they are actually realized.
• It allows storage under 5 MW that is not participating in net metering or ISO New England markets to engage in these bilateral within-state electricity supply transactions.
• It puts storage and distributed generation under 1 MW participating in transactions under this section of the law on an equal basis with such distributed resources that are participating in net metering.
• It gives the PUC appropriate authority to oversee this and puts the burden of accounting for this on the load serving entities that serve such limited producers and any retail customers.
There may be some confusion or concern about the jurisdictional issues. In response I highlight the following:
• The Federal Power Act, 16 U.S. Code § 824, (https://www.law.cornell.edu/uscode/text/16/824) has long been quite clear that while FERC has exclusive jurisdiction over wholesale sales of electricity in interstate commerce, the states have exclusive jurisdiction of wholesale sales in intrastate commerce.
• (b)(1) “The provisions of this subchapter shall apply to the transmission of electric energy in interstate commerce and to the sale of electric energy at wholesale in interstate commerce, but except as provided in paragraph (2) shall not apply to any other sale of electric energy . . . The Commission . . . shall not have jurisdiction, over facilities used in local distribution or only for the transmission of electric energy in intrastate commerce . . .”
• (d) Ae wholesale sale “means a sale of electric energy to any person for resale”
• (c) “electric energy shall be held to be transmitted in interstate commerce if transmitted from a State and consumed at any point outside thereof”
• The US Supreme Court has recently reiterated this jurisdictional boundary in FERC v. EPSA, 577 U. S. ____ (2016):

5
Under the statute [the FPA], the Commission has authority to regulate “the transmission of electric energy in interstate commerce” and “the sale of electric energy at wholesale in interstate commerce.” 16 U. S. C. §824(b)(1).
. . . the Act also limits FERC’s regulatory reach, and thereby maintains a zone of exclusive state jurisdiction. As pertinent here, §824(b)(1)—the same provision that gives FERC authority over wholesale sales—states that “this subchapter,” including its delegation to FERC, “shall not apply to any other sale of electric energy.” Accordingly, the Commission may not regulate either within-state wholesales sales or, more pertinent here, retail sales of electricity (i.e., sales directly to users). See New York, 535 U. S., at 17, 23. State utility commissions continue to oversee those transactions.
. . . as earlier described, [FPA] §824(b) limit[s] FERC’s sale jurisdiction to that at wholesale,” reserving regulatory authority over retail sales (as well as intrastate wholesale sales) to the States. New York, 535 U. S., at 17 (emphasis deleted); see 16 U. S. C. §824(b); supra, at 3. FERC cannot take an action transgressing that limit no matter its impact on wholesale rates. [p. 17] . . .
The Act makes federal and state powers “complementary” and “comprehensive,” [p.27]
• ISO New England through its FERC sanctioned tariffs, rules and operating procedures has drawn a bright line. Generation that is not less than 5 MW in size and connected to state jurisdictional distribution grid does not have to register with the ISO as a generator and instead operates as a “load reducer” for the purposes of the interstate wholesale electricity markets that it administers.
• While there has been some confusion as to how distributed generation (< 5MW and not registered with ISO New England is treated with regard to calculation of RNL (Regional Network Load) for purposes of transmission cost allocation, Eversource and other transmission owner in New England have proposed language to clarify the Open Access Transmission Tariff (OATT) to make clear that the output of (and the load served by) DG not registered as a “Generation Asset” with ISO New England onto a distribution grid would not contribute to RNL. That is to say, such DG output would reduce transmission costs allocated to the distribution utility from what they would otherwise be. Using the basic principle of cost causation, Part IV of SB 91 would simply give around 95% of the value of such savings to the DG or storage system creating such savings. The remaining value (~ 5%, the delta between the net retail load reduction and what would have been purchased from ISO-NE markets, i.e. transformation and line losses) would accrue to all ratepayers.
• Here is the tariff language addition that has been proposed and that all other members of the PTO-AC (Participating Transmission Owners Administrative Committee) unanimously voted on April 9th:
• “Network Customer’s Monthly Regional Network Load shall exclude (i) load offset by any resource that is not a Generator Asset, and (ii) load offset by the portion of the output of a Generator Asset that serves load located behind the same retail customer meter as the Generator Asset.”
• I’ve attached the slide deck that further explains this (quote above is from slide 5).

6
• Here is another slide from an earlier presentation to the Transmission Committee that further illustrates how this would apply:
Please do not hesitate to be touch if you have any questions. I do hope to work with the committee and interested stakeholders to further consider and refine Part IV of the bill. Thank you!
Yours truly,
Clifton Below Assistant Mayor, Lebanon City Council [email protected]
ExamplesExample ISO-NE Registra�on RNL Impact
Roo�op solar array (10 kW) Not registered Not included in RNL calcula�on
Stand-alone distribu�on-connected PV array (4 MW) SOG Included in RNL calcula�on
Stand-alone distribu�on-connected PV array (4 MW) Not registered Not included in RNL calcula�on
1 MW distributed generator co -located with 2 MW load Not registered Not included in RNL calcula�on
3 MW distributed generator co -located with 2 MW load Genera�on (1 MW) registered as SOG
Net genera�on included in RNL calcula�on
530 MW generator with 30 MW online sta�on service load Genera�on (500 MW) registered as Generator Asset
Net genera�on included in RNL calcula�on
2MW Stand-alone Ba�ery storage Not Registered Not Included in RNL
3MW Stand-alone Ba�ery storage Only Registered as ATRR Not Included in RNL
3MW Stand-alone Ba�ery storage Registered as a Generator Asset
Included in RNL calcula�on
SOG: Se�lement Only GeneratorATRR: Alterna�ve Technology Regula�on Resource
8

7
CHAPTER 362-A LIMITED ELECTRICAL ENERGY PRODUCERS ACT
362-A:1 Declaration of Purpose. – It is found to be in the public interest to provide for small scale and diversified sources of supplemental electrical power to lessen the state's dependence upon other sources which may, from time to time, be uncertain. It is also found to be in the public interest to encourage and support diversified electrical production that uses indigenous and renewable fuels and has beneficial impacts on the environment and public health. It is also found that these goals should be pursued in a competitive environment pursuant to the restructuring policy principles set forth in RSA 374-F:3. It is further found that net energy metering for eligible customer-generators may be one way to provide a reasonable opportunity for small customers to choose interconnected self generation, encourage private investment in renewable energy resources, stimulate in-state commercialization of innovative and beneficial new technology, enhance the future diversification of the state's energy resource mix, and reduce interconnection and administrative costs.
Source. 1978, 32:1. 1994, 362:2. 1998, 261:1, eff. Aug. 25, 1998. 2010, 143:1, eff. Aug. 13, 2010.
362-A:1-a Definitions. – In this chapter: III. "Limited producer" or "limited electrical energy producer" means a qualifying small power producer or a qualifying cogenerator, with a total capacity of not more than 5 megawatts.
362-A:2-a Purchase of Output by Private Sector. – I. A limited producer of electrical energy shall have the authority to sell its produced electrical energy to not more than 3 purchasers other than the franchise electric utility, unless additional authority to sell is otherwise allowed by statute or commission order. Such purchaser may be any individual, partnership, corporation, or association. The commission may authorize a limited producer, including eligible customer-generators, to sell electricity at retail, either directly or indirectly through an electricity supplier, within a limited geographic area where the purchasers of electricity from the limited producer shall not be charged a transmission tariff or rate for such sales if transmission facilities or capacity under federal jurisdiction are not used or needed for the transaction. The public utilities commission shall review and approve all contracts concerning a retail sale of electricity pursuant to this section. The public utilities commission shall not set the terms of such contracts but may disapprove any contract which in its judgment: (a) Fails to protect both parties against excessive liability or undue risk, or (b) Entails substantial cost or risk to the electric utility in whose franchise area the sale takes place, or (c) Is inconsistent with the public good. II. Upon request of a limited producer, any franchised electrical public utility in the transmission area shall transmit electrical energy from the producer's facility to the purchaser's facility in accordance with the provisions of this section. The producer shall compensate the transmitter for all costs incurred in wheeling and delivering the current to the purchaser. The public utilities commission must approve all such agreements for the wheeling of power and retains the right to order such wheeling and to set such terms for a wheeling agreement including price that it deems

8
necessary. The public utilities commission or any party involved in a wheeling transaction may demand a full hearing before the commission for the review of any and all of the terms of a wheeling agreement. III. Before ordering an electric utility to wheel power from a limited electric producer or before approving any agreement for the wheeling of power, the public utilities commission must find that such an order or agreement: (a) Is not likely to result in a reasonably ascertainable uncompensated loss for any party affected by the wheeling transaction. (b) Will not place an undue burden on any party affected by the wheeling transaction. (c) Will not unreasonably impair the reliability of the electric utility wheeling the power. (d) Will not impair the ability of the franchised electric utility wheeling the power to render adequate service to its customers.
Source. 1979, 411:1. 1998, 261:5, eff. Aug. 25, 1998.

Proposed changes to Monthly Regional Network Load calculation
Frank Ettori (on behalf of Avangrid, Eversource, National Grid, VELCO, and Versant)
4/6/2021
1
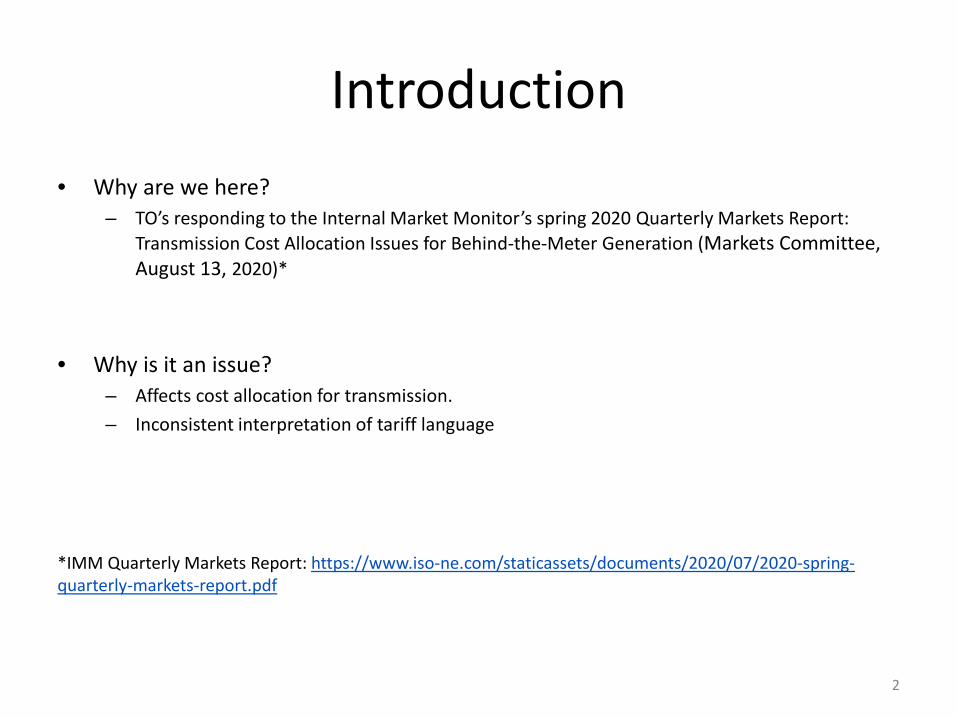
Introduction• Why are we here?
– TO’s responding to the Internal Market Monitor’s spring 2020 Quarterly Markets Report: Transmission Cost Allocation Issues for Behind-the-Meter Generation (Markets Committee, August 13, 2020)*
• Why is it an issue?– Affects cost allocation for transmission.– Inconsistent interpretation of tariff language
*IMM Quarterly Markets Report: https://www.iso-ne.com/staticassets/documents/2020/07/2020-spring-quarterly-markets-report.pdf
2
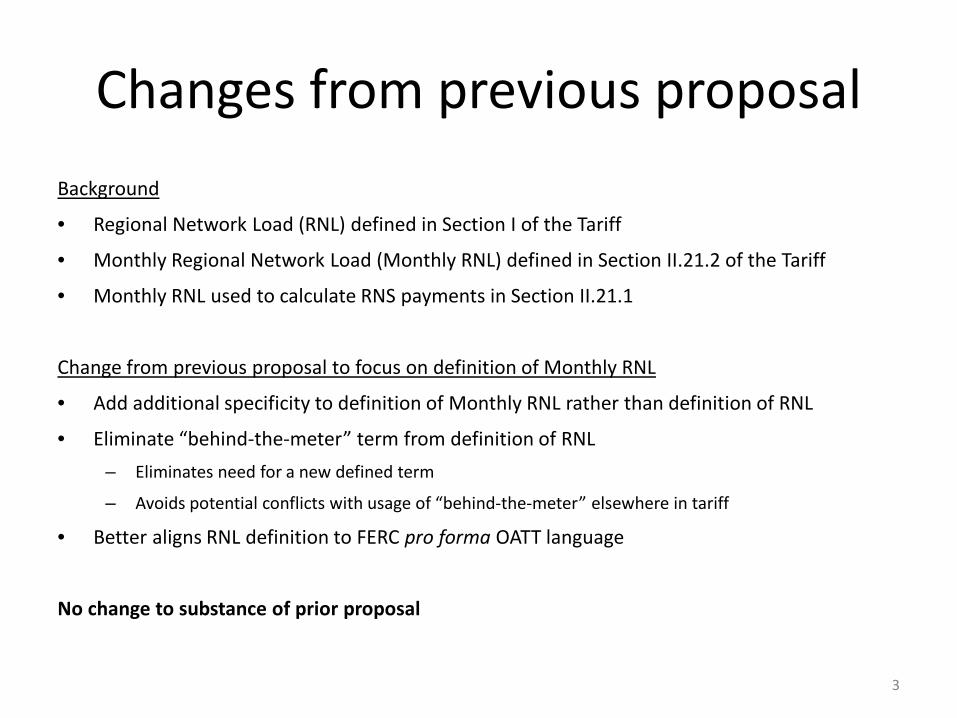
Changes from previous proposalBackground
• Regional Network Load (RNL) defined in Section I of the Tariff
• Monthly Regional Network Load (Monthly RNL) defined in Section II.21.2 of the Tariff
• Monthly RNL used to calculate RNS payments in Section II.21.1
Change from previous proposal to focus on definition of Monthly RNL
• Add additional specificity to definition of Monthly RNL rather than definition of RNL
• Eliminate “behind-the-meter” term from definition of RNL– Eliminates need for a new defined term
– Avoids potential conflicts with usage of “behind-the-meter” elsewhere in tariff
• Better aligns RNL definition to FERC pro forma OATT language
No change to substance of prior proposal
3

Proposed tariff changes to RNLSection I General Terms and Conditions
Regional Network Load is the load that a Network Customer designates for Regional Network Service under Part II.B of the OATT. The Network Customer’s Regional Network Load shall include all load designated by the Network Customer (including losses). and shall not be credited or reduced for any behind the meter generation. A Network Customer may elect to designate less than its total load as Regional Network Load but may not designate only part of the load at a discrete Point of Delivery. Where a Transmission Customer has elected not to designate a particular load at discrete Points of Delivery as Regional Network Load, the Transmission Customer is responsible for making separate arrangements under Part II.C of the OATT for any Point-To-Point Service that may be necessary for such non-designated load. A Network Customer’s Monthly Regional Network Load shall be calculated in accordance with Section II.21.2 of the OATT.
4

Tariff language to Monthly RNL• II.21.2 Determination of Network Customer’s Monthly Regional
Network Load: Network Customer’s “Monthly Regional Network Load” is its hourly load (including its designated Regional Network Load not physically interconnected with the PTF under Section II.18.3 of this OATT) coincident with the coincident aggregate load of all Network Customers served in each Local Network in the hour in which the coincident load is at its maximum for the month (“Monthly Peak”). Network Customer’s Monthly Regional Network Load shall exclude (i) load offset by any resource that is not a Generator Asset, and (ii) load offset by the portion of the output of a Generator Asset that serves load located behind the same retail customer meter as the Generator Asset. For Regional Network Load located within the New England Control Area, the Monthly Regional Network Load of all Network Customers within a Local Network shall be calculated by the associated PTO. For Regional Network Load located outside of the New England Control Area, the Monthly Regional Network Load of all Network Customers shall be calculated by the associated PTO (in consultation with the ISO and the associated Balancing Authority).
5
Generator Asset is a device (or a collection of devices) that is capable of injecting real power onto the grid that has been registered as a Generator Asset in accordance with the Asset Registration Process.

History
• When pro forma was written, resource mix was different
• We now have: – More customer-owned small-scale generation,
especially renewables– More focus on state energy policies
6

TO Proposal More Closely Aligns Monthly RNL with other load calculations
• Same loads will be used to calculate Monthly RNL and energy market settlement
• Monthly RNL will more closely align with load used for FCM cost allocation
• Monthly RNL will more closely align with transmission system planning models– Transmission system planning models currently include reductions for
energy efficiency and PV
7

TO Proposal Minimizes Impact to Existing and Future Resources
Existing resources• No additional metering required for existing resources• No impact to energy efficiency or demand response resources
Anticipated treatment of distributed energy resource aggregations (DERAs) under FERC Order No. 2222• Energy market load is calculated from positive net output from registered
generation and tie line flows• DERA with positive net output is akin to a registered generator with positive net
output, receives payment from energy market, and would contribute to load calculation
• DERA positive net output will be included in the Monthly RNL calculation• Load reductions included in a DERA load asset would continue to reduce Monthly
RNL, as they do today
8

Schedule• Nov 17: PTO-AC discussion• Dec 10:
– Introductory discussion at Transmission Committee• Jan:
– Introductory discussion at Markets Committee– 1/26: Follow-up discussion at TC
• Feb: – Feedback from TC– Revised proposal at MC
• Mar 23: Revised proposal at TC• April 6&27:
– 4/6 Discussion at MC– 4/9 Vote at PTO-AC– 4/27 Vote at TC
• May 11: Vote at MC • June:
– 6/3 Vote at NPC– File at FERC
• August: Effective date
9

Questions/Comments
10

1
June 25, 2021 Mr. Jared Chicoine Director Office of Strategic Initiatives 107 Pleasant Street Johnson Hall, Third Floor Concord, New Hampshire 03301 via e-mail to: [email protected] Dear Mr. Chicoine: As you know, the Office of Strategic Initiatives (OSI) is tasked pursuant to RSA 4-E:1 with reviewing our state’s Ten-Year Energy Strategy every three years to consider any changes that are necessary. OSI issued its most recent Ten-Year Energy Strategy in 2018 and, thus, in 2021 OSI is conducting its triennial review. In response to OSI’s request for public comments by June 25, 2021, the Office of the Consumer Advocate (OCA) is pleased to provide the following observations and suggestions.
The OCA is tasked pursuant to RSA 363:28 with representing the interests of New Hampshire’s residential utility customers before the Public Utilities Commission and any other decisionmaker when “the interests of residential utility customers are involved.” Our small agency operates “to assure that rates remain as low as possible without sacrificing safe and reliable service.”1 In the application of this duty, the OCA also advocates for “well-designed and prudently-administered ratepayer funded programs.”2 Therefore, on behalf of the state’s residential utility customers, we heartily endorse Goal 1 of the current State Energy Strategy, to “[p]rioritize cost effective energy policies.”
Because our writ is limited to ratepayer interests, we take no position on the pressing environmental issues of our time, including climate change, as reflected in the fifth of the Energy Policy Goals in the 2018 Ten-Year Plan. We leave to environmental advocates, elected officials, and relevant agency policymakers the question of how to assure that our state and our planet remain congenial to human life and thriving ecosystems. Our only “ask” in this realm is that everyone keep in mind that ultimately it is ratepayers, particularly captive residential utility
1 Biennial Report, OFFICE OF THE CONSUMER ADVOCATE, https://www.oca.nh.gov/biennial_report_OCA_2015-2017.pdf (last visited June 3, 2021). 2 About, THE OFFICE OF THE CONSUMER ADVOCATE, https://www.oca.nh.gov/ (last visited June 6, 2021).
CONSUMER ADVOCATE Donald M. Kreis ASSISTANT CONSUMER ADVOCATE Pradip K. Chattopadhyay
STATE OF NEW HAMPSHIRE
OFFICE OF THE CONSUMER ADVOCATE
21 S. Fruit St., Suite 18 Concord, N.H. 03301-2429
TDD Access: Relay NH 1-800-735-2964
Tel. (603) 271-1172
Website: www.oca.nh.gov

2
customers, who ultimately bear the costs of rising to environmental challenges.
Our comments focus on two elements of the 2018 Ten-Year Energy Strategy. Goal No. 4 calls on New Hampshire to “[m]aximize cost effective energy savings.” Perhaps just as notably, the phrase “cost-effective” in four of the eleven goals enumerated in the 2018 plan. For the reasons that follow, we suggest that the 2021 plan update place even greater emphasis on cost-effective energy efficiency, and bolster the overall objective of cost-effectiveness by reinvigorating New Hampshire’s commitment to the least-cost integrated resource planning process enshrined in RSA 378:37 to :40.
Robust policies supporting energy efficiency will further safe reliable service; while decreasing the cost burden on ratepayers and ensuring fairly administered programs. Further, the updated State Energy Strategy should strongly endorse providing the support necessary to develop new policies requiring utilities to better integrate energy efficiency into their least cost integrated resource planning (LCIRP). Also, more recently adopted policies like the Granite State Test for measuring the cost-effectiveness of ratepayer-funded energy efficiency initiatives should be integrated into the energy strategy to be considered in ultimate goals for New Hampshire.
Recommendations
LCIRP and Energy Efficiency
With respect to electricity, strong energy efficiency programs (1) offset supply resources at the generation level and (2) “reduc[e] demand at the transmission and/or distribution system level.”3 Reductions in demand lead to reductions in necessary supply; this directly impacts reliability because there is less stress on the system as a whole.4 If distribution utilities and other energy providers are adequately meeting demand, the regional electric grid does not need to add additional generation capacity. Because energy efficiency is significantly cheaper than building new infrastructure, “energy efficiency helps the electricity system achieve and maintain supply reliability at less cost.”5`
Precisely the same principles apply to natural gas and, indeed, to unregulated fuels. Implementation of robust energy efficiency measures causes residential customers of natural gas companies to save money because their utilities need to purchase less fuel at wholesale, acquire less pipeline capacity, build less infrastructure, and pursue fewer expansion projects.
Energy efficiency has known and measureable benefits, thanks to vigilant evaluation, monitoring, and verification (EM&V). The predictability allows for utilities to plan effectively and to integrate these benefits into their planning processes. However, this only occurs if
3 Grace Relf et. al., Keeping the Lights On: Energy Efficiency and Electric System Reliability, AMERICAN COUNCIL
FOR AN ENERGY-EFFICIENT ECONOMY (ACEE) 5 (2018) https://www.aceee.org/sites/default/files/publications/researchreports/u1809.pdf. 4 Id. at 5. 5 Id.

3
utilities are required by regulators to do what the LCIRP statute instructs them to do, which is to treat energy efficiency (and other demand-side initiatives, such as active demand response) as resources that compete on a level playing field with supply-side resources .
To date, in reviewing least-cost integrated resource plans, the Public Utilities Commission has allowed utilities simply to check the energy efficiency box by noting their participation in the utility-provided, 100 percent ratepayer-funded programs that operate under the “NHSaves” banner in furtherance of the PUC-adopted Energy Efficiency Resource Standard. This is insufficient to meet the requirements of the LCIRP statute, inasmuch as it leaves additional cost-effective energy efficiency and demand-side efforts (which could be funded via utility distribution rates) on the table. Given that New Hampshire is ranked seventh in the country for the average retail price of electricity to the residential sector, and given that the State Energy Strategy casts a suitably critical eye on high energy costs paid by Granite Staters, renewed efforts are necessary to make our electricity grid and our natural gas network truly least cost.6
The 2018 edition of the Ten-year Energy Strategy recognizes energy efficiency as the “cheapest and cleanest energy resource.” Further, the strategy declares that “New Hampshire should prioritize capturing cost-effective energy efficiency in all sectors.”10 The 2021 update should further these principles and should call for policies that encourage and require fair and equal treatment of energy efficiency and demand side resources in the LCIRP process.11 Without fair and equal treatment it is likely that utilities will favor only what will be profitable and what will increase their rate base.
Existing Energy Efficiency Policies
There are two significant energy efficiency policies that have been introduced in New Hampshire since the 2018 update. Both should be considered when developing a goals for the state because they will significantly impact those pathways.
First, the OCA has successfully championed revenue decoupling, first embraced by the Public Utilities Commission in 2017 and first rolled out by a utility in 2019. Revenue decoupling severs, in a fair and symmetrical manner, the link between sales and revenues. Thus, the integration of revenue decoupling has removed one disincentive to invest in energy efficiency. Sales of electricity can no longer be directly linked to profits. The State Energy Strategy should strongly endorse revenue decoupling and, in exchange, call for utilities to demonstrate the achievement or higher levels of energy efficiency.
Second, the 2018 update of the State Energy Strategy should explicitly endorse the Granite State Test for determining the cost-effectiveness of energy efficiency programs and any other initiatives that are included in non-bypassable rates. This test requires consideration of
6 New Hampshire State Overview, EIA, https://www.eia.gov/beta/states/states/nh/overview (last visited Jun. 15, 2021). 10 New Hampshire 10-Year State Energy Strategy, NEW HAMPSHIRE OFFICE OF STRATEGIC INITIATIVES 9 (Apr 2018), https://www.nh.gov/osi/energy/programs/documents/2018-10-year-state-energy-strategy.pdf. 11 Id. at 5.

4
energy efficiency measures to ensure they benefit all customers. Investments in programs to be implemented will pass through a process that considers “cost[s] and benefits that accrue to the utility system, but would not generally consider those impacts accruing to program participants.”12 In the order approving this test in late 2019, the Commission recognized the benefits of energy efficiency by noting that “certain energy optimization measure have the potential to put downward pressure on rates . . .. Increasing usage without increasing peak demand (improving the system load factor) has the potential to result in lower rates for both program participants and non-program participants.”13
Each of these established policies, however, fail to address the question of whether ratepayers should be the parties funding energy efficiency in the first place. Some recommendations of the Ten-year plan seek to create and maintain programs that attempt to get customers into a position where they have access to financing to integrate energy efficient measures into their day-to-day lives.14 Despite recognition of the need to “improve[e] consumer access to financing” and “better serve the low income population,” the current 10-year strategy does not fully address barriers to energy efficiency access.15
Where cost is a barrier to a large portion of the population, subsidies and access to financing still only allow a small portion of the state to accessing energy efficient improvements to their home. Programs pushing for small changes—the low hanging fruit—have been successfully implemented,16 however, there is now a need to develop and maintain substantial change that will contribute to reducing the state’s overall energy demand.
Lastly, the state of New Hampshire does not function in isolation; the Energy Strategy for the state must reflect that. New Hampshire’s energy demand in the region has increased and continues to increase, while other states are on the decline due to the integration of energy efficiency.17 Massachusetts, for example, is ranked second in the country for energy
12 Order Approving Benefit Cost Working Group Recommendations, Order No. 26,322 Docket No. 170136, at 9 (Dec. 30, 2019). 13 Id. at 12 (citing B/C Working Group Report at 11). 14 See 2014 New Hampshire State Energy Strategy, Office of Energy & Planning 34 (Sept. 2014), https://www.nh.gov/osi/energy/programs/documents/energy-strategy.pdf (explaining Recommendation 6: Improve Access to Financing). 15 Id. at 34-35. 16 Encouragement programs for Energy Start certified lightbulbs have been established at utilites across New Hampshire. See e.g., Energy Efficiency Programs, UNITIL, https://unitil.com/energy-efficiency/energy-efficiency-programs/electric-programs-rebates-assistance (last visited Jun. 14, 2021); Lighting for Homes, NH SAVES, https://nhsaves.com/programs/residential-lighting/ (last visited Jun. 14, 2021). 17 Compare New Hampshire: Total Energy Consumption by End-Use Sector, annual, EIA, https://www.eia.gov/beta/states/states/nh/data/dashboard/consumption (last visited Jun. 15, 2021) to Massachusetts: Total Energy Consumption by End-Use Sector, Annual, EIA, https://www.eia.gov/beta/states/states/ma/data/dashboard/consumption (last visited Jun. 15, 2021).
5
efficiency.18 Massachusetts has prioritized and developed energy efficient programs which include encouraging consumer investments, subsidizing investments in energy efficient/green buildings. New Hampshire does not need to mirror the programs of other states but should consider policies which have seen “regional and national successes.”19
As OSI is well aware, energy efficiency is at something of a crossroads in New Hampshire. Stakeholders, including the NHSaves utilities as well as OSA itself, participated in a successful effort over the course of pandemic-ridden 2020 to develop a triennial plan for implementation of the Energy Efficiency Resource Standard beginning on January 1, 2021. But the plan requires Commission approval and, to date, the Commission has yet to issue its order. This is a shocking and intolerable abdication of regulatory responsibility that has real economic consequences for customers seeking to save money via energy efficiency and local contractors that provide good blue-collar jobs to people who conduct energy audits install energy efficiency measures. In the meantime, skeptical legislators have noted that the Energy Efficiency Resource Standard is nowhere enshrined in statute and have asserted that non-bypassable energy efficiency charges are too much like a tax to be consigned to the discretion of unelected regulators.
The OCA does not agree that energy efficiency charges are a tax, inasmuch as these funds are neither collected by, held by, nor spent by government. Like any other Commission-approved rate, energy efficiency charges are prices paid by consumers for benefits received. However, in our view, the skeptics have a point: It is time for the General Court to deliberate the Energy Efficiency Resource Standard, to require that ratepayer-funded energy efficiency programs be cost-effective from the perspective of all utility customers, with due regard for the timing differences that have exaggerated the extent to which energy efficiency programs seem expensive,20 to set any other reasonable constraints and guidelines so as to bolster public confidence in these programs, and to assure that New Hampshire will compete successfully with its neighbors in our energy-intensive region.
Access to and Effective Use of Utility Customer Data
A significant development that has occurred since the adoption of the 2018 State Energy Platform is the advent of New Hampshire’s noteworthy commitment to providing utility customers with access to their usage data, both for their own edification and direct use plus, in particular, for the purpose of acquiring energy-related services from unregulated firms in the sectors of the economy that are innovation-driven. At the request of the OCA, in 2019 Senator Martha Fuller-Clark introduced, Representative Kat McGhee championed, and Governor Sununu wisely signed into law Chapter 286 of the 2019 New Hampshire Laws (Senate Bill 284), codified as RSA 378:50 to :54.
Thereafter, via the contested administrative proceeding that SB 284 requires the Commission to
18 Massachusetts State Scorecard, ACEE, https://database.aceee.org/state/massachusetts (last visited Jun. 15, 2021). 19 New Hampshire Energy Strategy, supra note 14, at 5. 20 We refer to the fact that when a utility makes a supply-side investment, such as building a new substation or gas main, the investment is placed into rate base and amortized so that ratepayers pay for these projects over the course of their useful lives, whereas energy efficiency measures provided by NHSaves (which also have extended useful lives) are paid for entirely on an immediate basis, thus front-loading costs and obscuring the beneficent effects of the Granite State Test.

6
open, utilities and other stakeholders, including unregulated energy services providers, municipalities, and the OCA, successfully negotiated a settlement agreement that provides a framework for building the statewide utility customer data platform endorsed by the 1999 legislation.21
The reasons for this initiative are well-stated in the findings made by the General Court via SB 284:
In order to accomplish the purposes of electric utility restructuring under RSA 374-F, to implement fully the state energy policy under RSA 378:37, and to make the state's energy systems more distributed, responsive, dynamic, and consumer-focused, it is necessary to provide consumers and stakeholders with safe, secure access to information about their energy usage. Access to granular energy data is a foundational element for moving New Hampshire's electric and natural gas systems to a more efficient paradigm in which empowering consumers is a critical element. By enabling the aggregation and anonymization of community-level energy data and requiring a consent-driven process for access to or sharing of customer-level energy usage data, the state can open the door to innovative business applications that will save customers money, allow them to make better and more creative use of the electricity grid as well as other utility services, and facilitate municipal and county aggregation programs authorized by RSA 53-E. Such a program of robust data is also likely to be useful in local planning, conducting market research, fostering increased awareness of energy consumption patterns, and the adoption of more efficient and sustainable energy use.22
It would be entirely appropriate for OSI to cut and paste the above findings into the 2021 update of the State Energy Strategy. Providing consumers with meaningful access to their usage data, which includes, critically, the ability to share that data quickly, efficiently, and in secure fashion (with due regard to privacy interests) with innovative service providers, is the biggest stroke of customer empowerment since electricity first came to New Hampshire more than a century ago. Our utilities, our market participants, and our municipalities recognize this important reality, so the State Energy Strategy should do likewise.
Conclusion
When utilities meet demand and save money by investing in energy efficiency over new supply-side resources, energy costs in New Hampshire will be positively impacted. The updated State Energy Strategy should therefore embrace and endorse policies that has been put in place since the 2018 plan was drafted, urge utilities and regulators to pursue additional cost-effective demand-side savings, and insist that the Granite State’s ever evolving energy system achieve its full potential to provide safe and reliable service to customers, especially residential customers,
21 See PUC Docket No. DE 19-197, available at https://www.puc.nh.gov/Regulatory/Docketbk/2019/19-197.html. As with the 2021-2023 Triennial Energy Efficiency Plan, the settlement agreement in Docket DE 19-197 is overdue for Commission approval. 22 2019 N.H. Laws, ch. 286:1, I.

7
at the lowest possible cost. Thank you for considering our views.
Sincerely,
Donald M. Kreis Consumer Advocate Kijana E. Plenderleith Legal/Energy Extern

June 25, 2021
VIA ELECTRONIC MAIL
Director Jared Chicoine
Office of Strategic Initiatives
107 Pleasant Street
Johnson Hall, 3rd Floor
Concord, NH 03301
Re: 10-Year State Energy Strategy Revision
Dear Director Chicoine,
Conservation Law Foundation (“CLF”) appreciates the opportunity to submit written comments
regarding the Office of Strategic Initiative’s (“OSI”) 10-Year State Energy Strategy update. In
the three years since the State Energy Strategy was last updated, the threat posed by climate
change to New Hampshire has become dire. While the prior update expressed a preference for a
laissez faire approach to energy markets, the urgency of the climate crisis necessitates a
reevaluation of this approach. Further, a number of energy resources, including energy
efficiency, offshore wind, and solar present significant economic and workforce opportunities; to
prevent New Hampshire from falling further behind its regional neighbors, and to seize the
important economic opportunities, the State Energy Strategy should prioritize these resources.
Founded in 1966, CLF is a nonprofit, member-supported environmental advocacy organization
working to create solutions that preserve our natural resources, protect public health, and
promote thriving communities for all in New Hampshire and New England. CLF has
approximately 5,000 members across the region, including over 700 in New Hampshire. CLF has
a long history of working to reduce air pollution, including greenhouse gases, to protect the
health of communities in New Hampshire and across the region.
Consistent with its mission to promote thriving, resilient communities, CLF is dedicated to
advancing solutions that strengthen New Hampshire’s environmental and economic vitality. To
this end, CLF has developed extensive expertise concerning energy projects, markets, and
regulatory policy. As a participant in the New England Power Pool (NEPOOL) stakeholder
process, CLF has participated in the formation and refinement of New England’s energy markets
and planning of the region’s electric transmission grid. CLF’s involvement in New Hampshire
energy markets, including but not limited to proceedings before the Public Utilities Commission
(Commission), has spanned two decades.1
1 CLF has intervened and participated in the following Commission Docket Nos.: DR 97-211, DE 01-057,
DE 07-064, DE 08-103, DE 08-145, DE 09-033, DE 10-160, DE 10-188, DE 11-215, DE 11-250, DE 13-108, DE

-2-
CLF previously submitted comments on the 2014 New Hampshire 10-Year State Energy
Strategy, as well as the 2018 update to the State Energy Strategy.
I. Clean Energy Means Local Jobs and Investments in New Hampshire’s Economy
The clean energy sector represents an immense opportunity for the creation of thousands of well-
paying jobs for New Hampshire and significant investment in New Hampshire’s economy.
Just prior to the start of the COVID-19 pandemic, in Q4 2019, 16,571 people were employed in
the clean energy sector in New Hampshire,2 of which 1,031 were employed in the solar energy
industry.3 By comparison, during the same timeframe, 122,477 people were employed in the
clean energy sector in Massachusetts, of which 10,400 were employed in the solar industry, and
42,455 people were employed in the clean energy sector in Connecticut, of which 2,234 were
employed in the solar industry.4 Although Massachusetts and Connecticut are larger states than
New Hampshire, in 2019, Vermont, which has half the population of New Hampshire, employed
nearly the same number of people in the clean energy sector and solar industry as New
Hampshire.5
Currently, New Hampshire has significantly less solar investments than its neighbors. In 2020,
New Hampshire had only 132.9 MW of installed solar capacity, ranked 42 out of 50 states for
solar installations, and obtained only 0.90% of its electricity from solar.6 To date, $337 million
has been invested in solar in New Hampshire.7 However, over the past five years, as investments
in solar have increased, solar prices in kWh have fallen by 45% in New Hampshire.8
13-275, DE 14-120, DE 14-238, DE 15-124, IR 15-072, IR 15-124, IR 15-137, IR 15-296, DE 16-241, DE 16-576,
DE 17-136, DG 17-152, DE 17-189, DG 17-198, DE 19-104, IR 20-004, DE 20-166, DE 20-170, DE 20-092, DG
21-008, and DE 21-030. 2 Clean Jobs America 2020, E2, at 7, April 2020, available at https://e2.org/wp-
content/uploads/2020/04/E2-Clean-Jobs-America-2020.pdf. This includes jobs in renewable energy, energy
efficiency, clean vehicles, battery storage, advanced biofuels, and low-impact hydro. 3 National Solar Jobs Census 2020, Solar Energy Industries Association & The Solar Foundation, May
2021, available at https://www.thesolarfoundation.org/wp-content/uploads/2021/05/National-Solar-Jobs-Census-
2020-FINAL.pdf. 4 Clean Jobs America 2020, E2, at 7, April 2020, available at https://e2.org/wp-
content/uploads/2020/04/E2-Clean-Jobs-America-2020.pdf.; National Solar Jobs Census 2020, Solar Energy
Industries Association & The Solar Foundation, May 2021, available at https://www.thesolarfoundation.org/wp-
content/uploads/2021/05/National-Solar-Jobs-Census-2020-FINAL.pdf. 5 Id. 6 New Hampshire Solar, Solar Energy Industries Association, last visited June 9, 2021, available at
https://www.seia.org/state-solar-policy/new-hampshire-solar. 7 Id. 8 Id.

-3-
Comparatively, Vermont, as of Q4 2020, had 379 MW of installed solar capacity, totaling $722
million in investments, ranked 30th in the nation in installed solar capacity, and obtained 14% of
its electricity from solar.9 Similarly, Rhode Island, as of Q4 2020, had 402.8 MW of installed
solar capacity, totaling $622 million in investments, ranked 28th in the nation in installed solar
capacity, and obtained 5.9% of its electricity from solar.10
Based on the preceding data from New Hampshire’s neighbors, which have witnessed
significantly more investment in solar than New Hampshire to date, there is significant potential
for increased growth in solar investments in New Hampshire. Therefore, to take advantage of the
considerable workforce and economic development benefits from solar, and to prevent New
Hampshire from falling further behind its neighbors, the revised State Energy Strategy should
support increased solar development.
Likewise, offshore wind development in the Gulf of Maine presents substantial opportunities for
investments in New Hampshire’s workforce and economy. As Governor Sununu recognized
when he requested that the Bureau of Offshore Energy Management (“BOEM”) establish a
renewable energy task force for New Hampshire and participated in the first meeting of the
BOEM Gulf of Maine Intergovernmental Renewable Task Force, offshore wind development
would provide numerous economic benefits for New Hampshire.
The American Wind Energy Association (“AWEA”) estimates that between 20,000 to 30,000
MW of offshore wind capacity will be operational on the east coast of the United States by 2030,
representing between $28 billion and $57 billion of investment in the U.S. economy.11
According to AWEA, under a high buildout and high domestic manufacturing scenario, offshore
wind could support up to 83,000 jobs annually in the United States by 2030.12 Thus, offshore
wind development in the Gulf of Maine would likely create thousands of good-paying
construction, maintenance, manufacturing, and port-related jobs in New Hampshire and result in
significant investment in the port of Portsmouth and other municipalities in the state.
To harness the considerable economic potential of solar and wind energy, New Hampshire
should require its electric distribution companies to procure at least 1,000 MW of solar and wind
energy by 2025. If New Hampshire does not take action to encourage investments in solar and
wind energy, the state risks losing out on the benefits of development of an in-state renewable
9 New Hampshire Solar, Solar Energy Industries Association, last visited June 9, 2021, available at
https://www.seia.org/state-solar-policy/vermont-solar. 10 Rhode Island Solar, Solar Energy Industries Association, last visited June 9, 2021, available at
https://www.seia.org/state-solar-policy/rhode-island-solar. 11 U.S. Offshore Wind Power Economic Impact Assessment, AWEA, at (March 2020) at 1, available at
https://supportoffshorewind.org/wp-content/uploads/sites/6/2020/03/AWEA_Offshore-Wind-Economic-
ImpactsV3.pdf. 12 Id.

-4-
energy industry, while its neighbors, which do more to encourage investments in renewable
energy, reap them. Further, although the prior State Energy Strategy expressed concerns
regarding the costs of renewables, onshore wind and utility scale solar currently have similar or
lower levelized costs of energy than natural gas combined cycle power production, and offshore
wind has a lower levelized cost of energy than coal and is becoming increasingly cost
competitive with natural gas.13 Accordingly, New Hampshire’s 10-Year State Energy Strategy
should promote the use of renewable energy procurements to jumpstart the solar and offshore
wind industries in the state. Additionally, New Hampshire should call on BOEM to revive the
Gulf of Maine Intergovernmental Renewable Task Force process, which has been dormant since
late 2019, to lay the ground for possible commercial offshore wind development in the Gulf of
Maine.
II. Energy Efficiency Saves New Hampshire Money and is Economically Efficient
As the current 10-Year State Energy Strategy correctly notes, “Energy efficiency (EE) is the
cheapest and cleanest energy resource. Investing in efficiency boosts the state’s economy by
creating jobs and reduces energy costs for consumers and businesses.”14 The State Energy
Strategy then states that “New Hampshire should prioritize capturing cost-effective energy
efficiency in all sectors, including buildings, manufacturing, and transportation.” Further, the
State Energy Strategy astutely observes that:
New Hampshire’s utility efficiency programs must be “cost
effective” as determined by the [Commission], meaning that each
dollar spent on the programs yields at least one dollar in savings.
Efficiency benefits more than just those customers who participate
in energy efficiency programs. Reducing energy use, especially
during expensive peak times such as the hottest and coldest days of
the year, saves money for everyone on our energy systems. For
reliability purposes, we build our energy infrastructure to meet our
needs during peak demand. Reducing that peak means spending
less on expensive transmission, distribution, and generation
infrastructure.15
13 Lazard’s Levelized Cost of Energy Analysis-Version 14.0, Lazard, at 3 (October 2020), available at
https://www.lazard.com/media/451419/lazards-levelized-cost-of-energy-version-140.pdf; Projected Costs of
Generating Electricity, International Energy Agency, at 15, 47 (December 2020), available at
https://iea.blob.core.windows.net/assets/ae17da3d-e8a5-4163-a3ec-2e6fb0b5677d/Projected-Costs-of-Generating-
Electricity-2020.pdf. 14 New Hampshire 10-Year State Energy Strategy, at 39 (April 2018). 15 Id.

-5-
Since 2002, energy efficiency measures in New Hampshire have resulted in cumulative customer
savings in excess of $3.4 billion.16 In fact, as DES recently announced, the New Hampshire state
government alone has saved $45 million from energy efficiency over the past 11 years.17
Moreover, the NH Utilities’ proposed 2021-2023 energy efficiency plan, as modified by the joint
settlement agreement entered into by the New Hampshire Utilities, CLF, Office of Consumer
Advocate, Clean Energy New Hampshire, and others and filed on December 3, 2020, would
result in extra customer energy cost savings of more than $1.1 billion over the lifetime of the
measures.18 Spending on the energy efficiency services involved with the 2021-2023 plan would
also support over 4,503 full-time jobs.19
The energy efficiency measures proposed under the modified 2021-2023 plan are all cost
effective, meaning they are the lowest cost energy resource. In other words, a unit of energy
saved through efficiency is less expensive than the total lifetime cost of a unit of energy from
other resources. While a few groups have criticized the 2021-2023 plan for being too expensive
for ratepayers, they have ignored the fact that the energy efficiency resources proposed under the
plan will cost consumers less than they would otherwise spend on energy without the energy
efficiency gains of the plan.
The revised 10-year plan should reaffirm New Hampshire’s currently lagging commitment to
maximizing cost-effective energy efficiency. Rather than stand in the way of the substantial
energy efficiency benefits that would be enjoyed under the modified 2021-2023 plan, OSI should
recognize that energy efficiency saves all families and businesses money, even those who do not
participate in energy efficiency programs. When families and business save money through
energy efficiency, it means they can use those savings for other necessities and economy-
stimulating investments.
Further, energy efficiency reduces loads on the New England grid, saving money region-wide.
For example, ISO-NE’s 2021 Capacity, Energy, Loads, and Transmission (“CELT”) report
projects that energy efficiency will decrease ISO-NE’s peak load by 2,677 MW in 2021 and
4,294 MW in 2030.20 As the cheapest among all energy resources, energy efficiency is a key tool
to constrain prices in regional energy markets and enables New Hampshire to reduce its share of
regional electricity markets.
16 2021-2023 New Hampshire Statewide Energy Efficiency Plan, at 18, filed September 1, 2020, available
at https://www.puc.nh.gov/regulatory/Docketbk/2020/20-092/INITIAL%20FILING%20-%20PETITION/20-
092_2020-09-01_NHUTILITIES_EE_PLAN.PDF. 17 DES Press Release, February 11, 2021, available at https://www.des.nh.gov/news-and-media/nh-state-
government-energy-management-efforts-avoid-over-45-million-energy-costs. 18 Revised 2021-2023 New Hampshire Statewide Energy Efficiency Plan, at 19. 19 Id. at 20. 20 2021 CELT Report, ISO-NE (May 1, 2021), available at https://www.iso-ne.com/system-
planning/system-plans-studies/celt/.

-6-
However, if New Hampshire does not invest in energy efficiency, its portion of the region’s grid
costs will rise. ISO-NE allocates grid costs to states on a load-ratio basis; i.e., according to a
state’s percentage of overall regional demand for electricity. As other states in the region
continue to ramp up policies that reduce their share of regional load, including through energy
efficiency, distributed energy generation, and energy storage, New Hampshire’s share of the
region’s load will increase. If New Hampshire does not keep pace by supporting load-reducing
measures including energy efficiency, it will be left bearing a disproportionate burden for
regional grid costs. As grid costs are high in New England and can represent a significant
portion of the monthly bill, this would place an unnecessary burden on New Hampshire’s
families and businesses. With investments in energy efficiency comparable to its neighbors, New
Hampshire would lower its costs and keep them from rising.
Accordingly, New Hampshire should substantially increase its investments in energy efficiency.
Contrary to several misconceptions regarding the costs to ratepayers from energy efficiency
measures, energy efficiency benefits the local economy; does not result in significant bill
impacts, and in many instances even results in lower electric bills over the lifetime of energy
efficiency measures;21 and costs less than the energy that would otherwise be needed in the
absence of energy efficiency. New Hampshire currently lags behind other states in the region on
energy efficiency and cannot afford to neglect this area of energy investment. Without increased
investments in energy efficiency, New Hampshire’s families and businesses will spend more on
energy than necessary and its economy will lose out on significant economic opportunities; thus,
the revised State Energy Strategy should reprioritize investments in and the importance of energy
efficiency to New Hampshire’s economy.
III. New Hampshire Should Support Efforts to Encourage Increased Use of Electric
Vehicles and Deployment of Electric Vehicle Charging Stations
The current 10-Year State Energy Strategy notes that, given the low usage rate of electric
vehicles (EVs) in New Hampshire, consumers are “likely to benefit without government
subsidization to encourage adoption of a particular technology” and “[g]overnment should avoid
speculative investments with taxpayer dollars focused on a fraction of the consumer base, but
may be able to leverage non-taxpayer funding sources to spur private investment.”22 The current
strategy, however, recognizes some of the difficulties associated with increased adoption of EVs,
observing that there is a “challenge of the feedback loop of adoption and infrastructure –
consumers don’t want to buy cars if there isn’t sufficient charging availability, and investors
won’t build charging stations unless there is a large enough market to serve.”23
21 See, e.g., 2021-2023 New Hampshire Statewide Energy Efficiency Plan, at Attachments E3, M. 22 New Hampshire 10-Year State Energy Strategy, at 49-50 (April 2018). 23 Id. at 49.

-7-
At present, the Commission is considering EV-related electric rates, including time-of-use rates
and demand charge alternatives, and EV charging station “make ready” proposals in three
separate dockets: Docket Nos. DE 20-170, DE 21-030, and DE 21-078. The adoption of time-of-
use rates, avoidance of demand charges, and proposals for developing charging stations all have
the potential to incentivize the increased adoption of EVs and deployment of charging stations in
the state. A revised State Energy Strategy should encourage these efforts currently underway at
the Commission and support further efforts to encourage adoption of EVs in the state.
While the current State Energy Strategy prefers that the government not encourage certain forms
of transportation, given the feedback loop of adoption and infrastructure, consumers who prefer
to adopt EVs are severely hindered in their ability to do so because of the lack of EV charging
infrastructure in the state. Moreover, EV-driving tourists from neighboring states and provinces
with higher EV-usage rates than New Hampshire, such as Massachusetts and Quebec, may
decide not to visit and spend money in New Hampshire due to the lack of EV charging
infrastructure here. Therefore, to enable residents to adopt EVs and to avoid discouraging EV-
driving tourists from visiting the state, the revised State Energy Strategy should promote efforts
to encourage the increased deployment of charging infrastructure, including the use of taxpayer
funds to subsidize charging stations.
IV. New Hampshire Should Encourage Increased Deployment of Energy Storage
In many instances, energy storage alternatives are less expensive than and can replace traditional
wires solutions.24 Energy storage can delay or defer the need for costly upgrades to transmission
and distribution systems, by reducing peak load and providing congestion relief; provide grid
reliability benefits, including improved frequency and voltage regulation; and increase resiliency,
by helping to reduce distribution outages during severe weather events.25 The Commission is
currently considering the ability of energy storage to avoid costly transmission and distribution
projects and ways to encourage investments in energy storage in Docket No. DE 20-166. Given
the benefits of energy storage, the revised State Energy Strategy should seek ways to promote
24 Sashwat Roy, Battery Energy Storage Systems for Transmission & Distribution Upgrade Deferral,
UNIVERSITY OF DELAWARE, BIDEN SCHOOL JOURNAL OF PUBLIC POLICY, supra note 4, at 6; Garrett Fitzgerald, James
Mandel, Jesse Morris, and Hervé Touatl, The Economics of Battery Energy Storage, ROCKY MOUNTAIN INSTITUTE,
at 10 , October 2015, available at https://rmi.org/wp-content/uploads/2017/03/RMI-
TheEconomicsOfBatteryEnergyStorage-FullReport- FINAL.pdf. 25 Final Report of the Commission to Study the Economic, Environmental and Energy Benefits of Energy
Storage to the Maine Electrical Industry, ME. LEG. OFFICE OF POLICY & LEGAL ANALYSIS, December 2019, at 5-6,
available at https://legislature.maine.gov/doc/3710; Madison Condon, Richard L. Revesz and Burcin Unel, Ph.D.,
Managing the Future of Energy Storage, INSTITUTE FOR POLICY INTEGRITY: N.Y. UNIV. SCHOOL OF LAW, at 6, April
2018, available at https://policyintegrity.org/files/publications/Managing_the_Future_of_Energy_Storage.pdf.

-8-
energy storage in New Hampshire, such as through establishing energy storage procurements
and/or installed storage targets.
V. New Hampshire Must Avoid Increasing its Reliance on Natural Gas for Heating and
Electricity
In order to address climate change and its significant costs, New Hampshire must avoid major
investments in new and expanded natural gas pipelines. Any significant investment in natural gas
infrastructure puts ratepayers at risk for stranded costs and higher bills and undermines the
state’s future ability to reduce greenhouse gas emissions.
In 2019, New Hampshire consumed 53,624 million cubic feet of natural gas, of which
approximately 15 percent was used for residential use, 19 percent was used for commercial use,
18 percent was used for industrial use, and 47 percent was used for electric power generation.26
The amount of natural gas consumed by New Hampshire has increased over the past several
years as New Hampshire’s natural gas utilities have expanded their customer bases and
distribution networks into new territories.
Increased use of natural gas in New Hampshire carries huge financial risks. With respect to gas
used for heating, when gas utilities invest in their distribution systems, they pass the costs of the
investments on to their customers through utility bill charges and can recover those costs for as
many as 50 or 60 years. However, once New Hampshire begins accelerating its transition away
from fossil fuels, more customers will switch to electric-powered heating systems and an ever-
declining customer base will be burdened with paying for utilities’ investments in pipelines, as
well as their maintenance and repair. Many of the remaining customers who are stuck paying
for natural gas infrastructure investments will be low-income homeowners, who cannot afford to
switch to electric heating systems, or renters, who are unable to switch because of landlords’
unwilling to pay to convert heating systems. Further, as New Hampshire transitions away from
using fossil fuels, natural gas utilities will not be able to recover the costs of their investments
before they become obsolete and need to be taken out of service. Moreover, as the region reduces
its reliance on natural gas pursuant to mandatory greenhouse gas emissions reduction legislation
enacted in the five other New England states, New Hampshire will be left with increased costs
for maintaining the regional gas transmission network.
Accordingly, to avoid impairing the state’s future reduction in greenhouse gas emissions and a
situation where natural gas utilities’ investments become stranded and/or natural gas utilities are
forced to recover costs from a decreasing customer base, the State Energy Strategy revision
should establish a policy of seeking to reduce New Hampshire’s reliance on natural gas.
26 New Hampshire Natural Gas Consumption by End Use, U.S. Energy Information Administration, May
28, 2021, available at https://www.eia.gov/dnav/ng/ng_cons_sum_dcu_SNH_a.htm.
-9-
VI. New Hampshire Must Establish Firm Greenhouse Gas Emissions Reduction Targets
To protect the health of its residents, communities, and the environment, and to maintain a
vibrant economy, New Hampshire must address the climate crisis through legislation containing
firm greenhouse gas emissions reduction mandates.
One of New Hampshire’s greatest assets is its outdoor resources, which attract out-of-state
tourists to ski, snowmobile, and ice fish in the winter, and to hike and enjoy its lakes and beaches
in the summer. However, the climate crisis poses an existential threat to the continued enjoyment
of New Hampshire’s outdoor resources. The climate crisis could also have major implications for
New Hampshire’s maple syrup industry, with increasing temperatures resulting in a shorter
season for maple syrup production.27 Further, climate change has already had and will continue
to have major negative impacts on New Hampshire’s Seacoast.
Due to climate change, the lengths of U.S. winters are shortening, with winters lasting a month
shorter on average than a hundred years ago.28 In New Hampshire, average winter temperatures
have warmed more than 4 degrees Fahrenheit since 1895 and, since the 1970’s, nearly 80 percent
of winters have been above the long-term average, with the top-five warmest winters all
occurring since 1998.29 Further, since 1970, the number of days with snow cover has decreased
by about one week in Pinkham Notch and by over two weeks in Durham, and ice-out on Lake
Sunapee occurs several weeks earlier than occurred in the past.30 New Hampshire is hotter year-
round as well, with average annual temperature increasing by 3 degrees Fahrenheit since the late
19th century and New Hampshire experiencing more days above 90 degrees Fahrenheit each
summer.31 As average temperatures continue to rise and the length of winters continue to
decrease due to climate change, there will be major negative consequences for New Hampshire’s
winter tourism and recreation industries and its most popular ski resorts, such as Cannon
Mountain, Loon, and Waterville Valley.
The climate crisis also makes New Hampshire more vulnerable to extreme weather. The state’s
coastline is especially vulnerable to nor’easters, hurricanes, and tropical storms, which result in
27 Brady Carlson, How Could Climate Change Affect New Hampshire’s Maple Syrup Industry, New
Hampshire Public Radio (March 7, 2016), available at https://www.nhpr.org/post/how-could-climate-change-affect-
new-hampshires-maple-syrup-industry#stream/0. 28 US Winter has shrunk by more than one month in 100 years, The Guardian (October 27, 2017), available
at https://www.theguardian.com/us-news/2017/oct/28/us-winter-has-shrunk-by-more-than-one-month-in-100-years. 29 Elizabeth Burakowski & Lawrence Hamilton, Are New Hampshire’s Winters Warming?, UNH Carsey
School of Public Policy (February 17, 2020), available at https://carsey.unh.edu/publication/nh-winters-warming. 30 Id. 31 State Climate Summaries: New Hampshire, National Oceanic and Atmospheric Administration National
centers for Environmental Information, last visited June 16, 2021, available at
https://statesummaries.ncics.org/chapter/nh/.

-10-
wide-scale coastal flooding, erosion, and property damage.32 Superstorm Sandy in 2012 was one
of the most destructive storms to affect the Northeastern United States over the past 40 years. In
New Hampshire, Sandy resulted in storm surge heights reaching 3.2 feet above normal tide
levels and caused an estimated $80 million in property losses.33
New Hampshire’s coastal communities are also susceptible to rising sea levels caused by climate
change. Sea levels in coastal New Hampshire rose approximately 7.5 to 8.0 inches from 1912 to
2018.34 Sea levels are projected to rise between 0.5 and 1.3 feet from 2000 to 2050 and between
1.0 to 2.9 feet by 2100 if global greenhouse gas concentrations stabilize, and even further if
greenhouse gas levels do not stabilize.35 Sea level rise also increases the frequency of coastal
flooding, which causes infrastructure and property damage, road closures, and overwhelms storm
drains.36 Sea level rise is estimated to have already cost New Hampshire more than $15 million
in coastal property valuation since 2005 and approximately 26,200 coastal properties in New
Hampshire are currently at risk from frequent tidal flooding.37 The amount of property damage
and number of properties at risk will keep increasing as sea levels continue to rise in the coming
decades.
Additionally, climate change threatens public health in numerous ways. Increased high daily
temperatures and heat waves are associated with increased mortality. Warming temperature and
longer growing seasons also lead to the exacerbation and development of allergies due to
changes in pollen seasons, and increases in temperature and precipitation may increase vector-
borne diseases, such as West Nile Virus and Lyme disease.38 Low income and marginalized
communities are especially vulnerable to and are likely to bear a disproportionate burden of the
public health impacts from climate change.39
32 State Climate Summaries: New Hampshire, National Oceanic and Atmospheric Administration National
centers for Environmental Information, last visited June 16, 2021, available at
https://statesummaries.ncics.org/chapter/nh/. 33 Id. 34 Cameron P. Wake, et al., New Hampshire Coastal Flood Risk Summary Part 1: Science, University of
New Hampshire Scholar’s Repository, at 4 (August 2019), available at
https://scholars.unh.edu/cgi/viewcontent.cgi?article=1209&context=ersc. 35 Id. at 5; see also Rising Sea Levels and Climate Change, New Hampshire Fish and Game, last visited
June 16, 2021, available at https://www.wildlife.state.nh.us/climate/sea-levels.html. 36 State Climate Summaries: New Hampshire, National Oceanic and Atmospheric Administration National
centers for Environmental Information, last visited June 16, 2021, available at
https://statesummaries.ncics.org/chapter/nh/. 37 Flood iQ Adds New England States, First Street Foundation (January 22, 2019), available at
https://medium.com/firststreet/fiq-new-england-states-629e5311911a. 38 Cameron P. Wake, John Bucci, and Semra Aytur, An Assessment of the Impact of Climate Change on
Human Health in New Hampshire, University of New Hampshire Sustainability Institute, at 15, 28, 30 (2014),
available at https://scholars.unh.edu/cgi/viewcontent.cgi?article=1007&context=sustainability, 39 Id. at ES x.
-11-
To address the substantial threats presented by the climate crisis and avoid and/or minimize its
worst effects, New Hampshire should establish firm and mandatory greenhouse gas emissions
reduction targets. Without mandatory reduction targets, the significant costs to the state resulting
from a changing climate, which are highlighted above, will continue to accelerate. Under
mandatory greenhouse gas emissions reduction targets, New Hampshire could develop policies
to transition to clean energy resources and reduce climate-warming emissions in a rapid and cost-
effective manner, while at the same time strengthening the state’s economy. Therefore, the
revision to the 10-Year State Energy Strategy should signal support for establishing a mandatory
2050 net-zero greenhouse gas emissions target, with interim targets before that date. Further, the
revised State Energy Strategy should signal support for investments in climate change resiliency,
especially on the Seacoast, in order to prepare for, address, and respond to the risks from climate
change.
VII. Conclusion
CLF appreciates the opportunity to submit these comments. Because of the urgent climate crisis
and the need for New Hampshire to seize the economic and workforce opportunities presented
by renewable energy and energy efficiency, CLF urges OSI to commit to revising the 10-Year
State Energy Strategy consistent with the above recommendations. As part of OSI’s revision of
the State Energy Strategy, OSI should hold multiple public hearings around the state and provide
opportunities for additional public comment periods to increase public involvement in the
process. CLF looks forward to continuing to participate in the revision of the 10-Year State
Energy Strategy going forward.
/s/ Nick Krakoff
Nick Krakoff
Staff Attorney
Conservation Law Foundation
27 North Main Street
Concord, NH 03301

1
ENERGY EFFICIENCY AND SUSTAINABLE ENERGY BOARD
RSA 125-O:5-a 21 South Fruit Street, Suite 10
Concord, N.H. 03301-2429
FINAL Comments on 2021 State Energy Strategy
June 18, 2021
Members Voting “Yes”: Rebecca Ohler (NH DES); Pradip Chattopadhyay (NH OCA); Tonia Chase (Business and Industry Association); Raymond Burke (NH Legal Assistance); Rep. Kat McGhee (NH House of Representatives); Ryan Clouthier (Southern NH Services); Bruce Clendenning (The Nature Conservancy); Philip Biron (NH State Fire Marshal) Members Abstaining: Karen Cramton (NH PUC) Members Voting “No”: N/A Members Not Present To Vote: Rep. Michael Vose (NH House of Representatives); Mark Sanborn (NH OSI); Taylor Caswell (NH BEA); Theresa Swanick (NH Municipal Association); Scott Emond (Home Builders Association); Donald Perrin (NH DAS); Jack Ruderman (NH Housing Finance Authority)
Introduction
The Energy Efficiency and Sustainable Energy (EESE) Board was established in 2008 to “promote and coordinate energy efficiency, demand response, and sustainable energy programs in the state”1 and has a diverse membership including representatives of state agencies, business and industry, municipalities, community action agencies, entities supporting low-income community interests, electric and gas utilities, and the legislature. Throughout its existence the EESE Board has kept abreast of market and policy developments relative to energy efficiency, and sustainable and renewable-energy resources. The EESE Board has historically weighed in on state policy where consensus can be reached among its members. The EESE Board is pleased to submit these comments regarding the 2021 update to the State Energy Strategy.
The EESE Board notes that reducing overall energy use and diversifying New Hampshire’s energy portfolio can help to remove price uncertainty caused by over-dependence on any single energy resource. New Hampshire has experienced a net economic, public health, and environmental benefit as greenhouse gas (GHG) emissions have fallen. The State Energy Strategy should include benchmarks and tangible goals to enable the General Court to better develop and define policies to meet those goals.
Background/Context
1 NH RSA 125-O:5-a Energy Efficiency and Sustainable Energy Board, http://www.gencourt.state.nh.us/rsa/html/x/125-o/125-o-5-a.htm.

2
In addressing energy policy for the State of New Hampshire, it is important to recognize the critical role energy plays in the state’s economy. In 2018, New Hampshire citizens, businesses, and industries spent over $5.8 billion on energy,2 two-thirds of which left the state entirely to pay for imported fuels.3
New Hampshire Energy Status
NH has experienced a net economic, public health, and environmental benefit as energy-use and GHG emissions have fallen. Between 1997 and 2018, the longest period that consistent data is readily available, New Hampshire has seen its Gross Domestic Product (GDP) steadily rise, pausing only briefly during the 2008 Recession, and ultimately growing by almost 60 percent in two decades (Figure 14). Across that same time period, the state’s population grew by just over ten percent. Meanwhile, New Hampshire’s total primary-energy consumption5 and GHG emissions underwent much more extreme changes, rising quite rapidly to peak in 2004-2005 before falling through 2018.6
While NH’s total primary-energy use fell between 2005 and 2018, the total end-use energy consumption across all sectors,7 inclusive of retail-electricity consumption, was similar to the total increase in population compared to 1997. Despite that, the
state’s GHG emissions ended more than 10 percent BELOW 1997 levels by the end of 2018, primarily due to increasing use of natural gas to replace coal and oil for electric generation.
2 Based on NHDES analysis of US DOE Energy Information Administration, State Energy Data System, Table ET2 Total End‐Use Energy Price and Expenditure Estimates, 1970-2018 New Hampshire, https://www.eia.gov/state/seds/data.php?incfile=/state/seds/sep_prices/tx/pr_tx_NH.html&sid=NH.
3 Based on portion of spending that leaves the state, drawing upon information from the 2011 VEIC Study NH Independent Study of Energy Policy Issues, https://www.puc.nh.gov/sustainable%20energy/Reports/New%20Hampshire%20Independent%20Study%20of%20Energy%20Policy%20Issues%20Final%20Report_9-30-2011.pdf.
4 Federal Reserve Economic Data, https://fred.stlouisfed.org/series/NHRGSP; US DOE EIA State Energy Data System (SEDS): NH 1960-2018, https://www.eia.gov/state/seds/seds-data-complete.php?sid=NH; and US Census Bureau; NHDES Analysis. Subject to revision. August 2020.
5 Primary energy consumption refers to the fuels consumed at their first point of use rather than final point of use (i.e., accounts for nuclear and natural gas fuels consumed to generate electricity but not the electricity used by homes and businesses).
6 The low is primary energy consumption did occur in 2012, however, this was primarily driven by very warm temperatures in March of 2012 which reduced and even eliminated heating load for a significant portion of the end of winter and beginning of spring.
7 In contrast to primary energy, as defined above, total end-use energy does not include the energy consumed by the electric sector in New Hampshire, but instead factors in the retail electricity consumption in residential, commercial, industrial, and transportation sectors.
Figure 1 – NH GDP, Energy and Emissions 1997 - 2018
Figure 2 – NH Energy Use by Sector 1990 - 2018
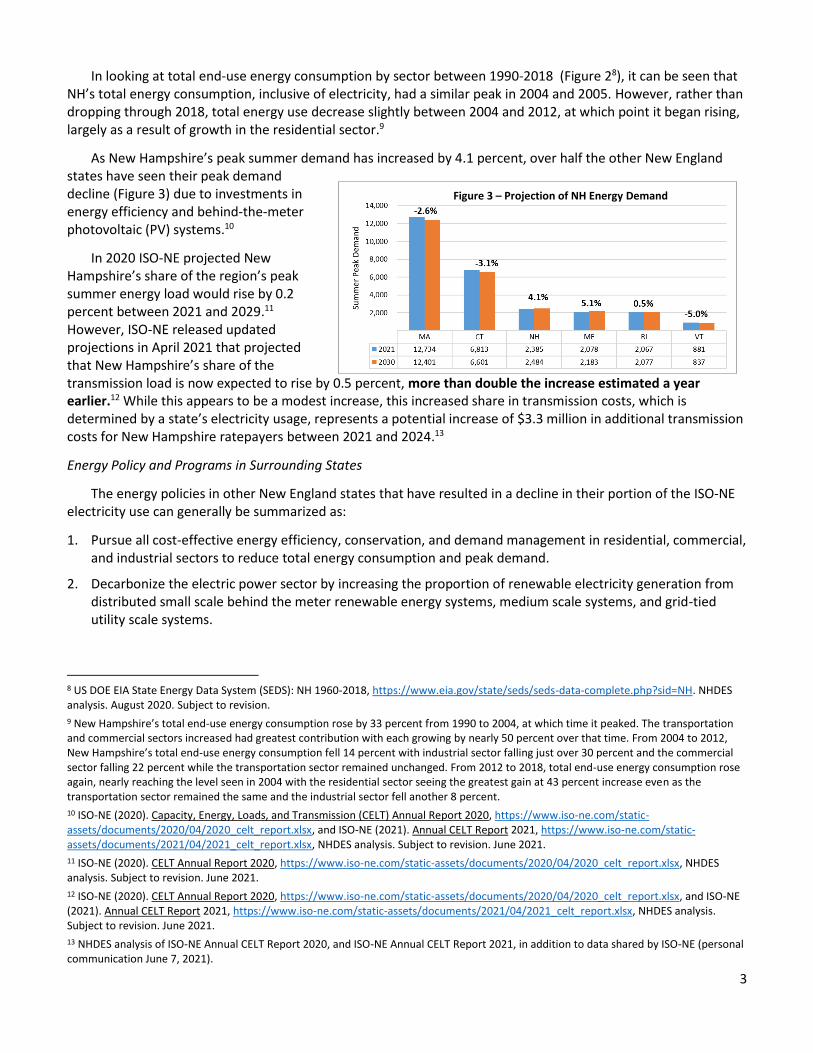
3
In looking at total end-use energy consumption by sector between 1990-2018 (Figure 28), it can be seen that NH’s total energy consumption, inclusive of electricity, had a similar peak in 2004 and 2005. However, rather than dropping through 2018, total energy use decrease slightly between 2004 and 2012, at which point it began rising, largely as a result of growth in the residential sector.9
As New Hampshire’s peak summer demand has increased by 4.1 percent, over half the other New England states have seen their peak demand decline (Figure 3) due to investments in energy efficiency and behind-the-meter photovoltaic (PV) systems.10
In 2020 ISO-NE projected New Hampshire’s share of the region’s peak summer energy load would rise by 0.2 percent between 2021 and 2029.11 However, ISO-NE released updated projections in April 2021 that projected that New Hampshire’s share of the transmission load is now expected to rise by 0.5 percent, more than double the increase estimated a year earlier.12 While this appears to be a modest increase, this increased share in transmission costs, which is determined by a state’s electricity usage, represents a potential increase of $3.3 million in additional transmission costs for New Hampshire ratepayers between 2021 and 2024.13
Energy Policy and Programs in Surrounding States
The energy policies in other New England states that have resulted in a decline in their portion of the ISO-NE electricity use can generally be summarized as:
1. Pursue all cost-effective energy efficiency, conservation, and demand management in residential, commercial, and industrial sectors to reduce total energy consumption and peak demand.
2. Decarbonize the electric power sector by increasing the proportion of renewable electricity generation from distributed small scale behind the meter renewable energy systems, medium scale systems, and grid-tied utility scale systems.
8 US DOE EIA State Energy Data System (SEDS): NH 1960-2018, https://www.eia.gov/state/seds/seds-data-complete.php?sid=NH. NHDES analysis. August 2020. Subject to revision.
9 New Hampshire’s total end-use energy consumption rose by 33 percent from 1990 to 2004, at which time it peaked. The transportation and commercial sectors increased had greatest contribution with each growing by nearly 50 percent over that time. From 2004 to 2012, New Hampshire’s total end-use energy consumption fell 14 percent with industrial sector falling just over 30 percent and the commercial sector falling 22 percent while the transportation sector remained unchanged. From 2012 to 2018, total end-use energy consumption rose again, nearly reaching the level seen in 2004 with the residential sector seeing the greatest gain at 43 percent increase even as the transportation sector remained the same and the industrial sector fell another 8 percent.
10 ISO-NE (2020). Capacity, Energy, Loads, and Transmission (CELT) Annual Report 2020, https://www.iso-ne.com/static-assets/documents/2020/04/2020_celt_report.xlsx, and ISO-NE (2021). Annual CELT Report 2021, https://www.iso-ne.com/static-assets/documents/2021/04/2021_celt_report.xlsx, NHDES analysis. Subject to revision. June 2021.
11 ISO-NE (2020). CELT Annual Report 2020, https://www.iso-ne.com/static-assets/documents/2020/04/2020_celt_report.xlsx, NHDES analysis. Subject to revision. June 2021.
12 ISO-NE (2020). CELT Annual Report 2020, https://www.iso-ne.com/static-assets/documents/2020/04/2020_celt_report.xlsx, and ISO-NE (2021). Annual CELT Report 2021, https://www.iso-ne.com/static-assets/documents/2021/04/2021_celt_report.xlsx, NHDES analysis. Subject to revision. June 2021.
13 NHDES analysis of ISO-NE Annual CELT Report 2020, and ISO-NE Annual CELT Report 2021, in addition to data shared by ISO-NE (personal communication June 7, 2021).
Figure 3 – Projection of NH Energy Demand

4
3. Strategically electrify homes, government facilities, businesses, and industrial applications as well as the transportation sector to take advantage of efficiencies associated with modern heat pump and motor technologies.
Each of the above approaches will continue to result in significant changes to energy use in terms of timing, total consumption and demand across the entire region and at different times of the year. This will have a cascade of impacts across the ISO-NE grid, including downward pressure on energy supply costs and potentially a reduced need for additional transmission and distribution investments. Reduced demand may not only result in less need for transmission and distribution upgrades, but may also reduce peak energy events, which is when the costliest sources of energy supply are dispatched. However, as these policies reduce electric use in other ISO-NE states, New Hampshire’s relative share of total energy use, and, therefore, New Hampshire’s relative share of the cost of the transmission system, will continue to increase absent implementation of similar demand reduction strategies.
EESE Board Recommended Outcomes
In light of the above considerations the EESE Board proposes that the State Energy Strategy include a set of desired outcomes that can be applied across multiple sectors and/or policies.
A. Minimize NH’s regional cost share through NH investments.
New Hampshire’s share of regional obligations for transmission costs is forecasted to increase absent investments in in-state behind the meter resources.14 Lowering demand through energy efficiency, coupled with increased local, sustainable energy supply will help many NH ratepayers manage costs by addressing both supply and demand, as energy efficiency investments compound over time
B. Strive to achieve all cost-effective energy efficiency.
There is a great deal of cost-effective energy efficiency still available. Investing in efficiency reduces the state’s reliance on imported fuels, provides a boost to the state’s economy by creating in‐state jobs, and reduces energy costs for consumers and businesses. This can be inclusive of not only the traditional electric and gas utility sector, but also new more highly efficient end-uses in the building and transportation sector such as heat pumps and electric vehicles, and building energy codes.
C. Expand fuel diversity and energy reliability.
New Hampshire imports all of the fossil fuels used in the state and has experienced considerable volatility in both price and supply. Diversifying the state’s energy portfolio and end-use technologies15 and increasing the use of in‐state resources may help to reduce New Hampshire’s vulnerability to price volatility and supply disruptions, leading to increased energy independence, and local economic development.
D. Support economic development by building local energy resources, businesses, and workforce.
New Hampshire’s aging workforce, distance from fossil-fuel energy sources, and older building stock are often identified as liabilities for the state’s economy, but properly planned for they can serve to grow the economy. Deep investments in cost-effective energy efficiency, workforce development, and support for in-state energy sources reduce the energy dollars exported from the state economy and provide local jobs. Transforming homes, businesses, local government buildings, and industrial facilities to be energy efficient will foster development of highly skilled tradespeople.
E. Incorporate resilience across all aspects of energy planning and policy.
14 Based on NHDES analysis of the most recent ISO-NE CELT report, April 2021. It is noted that the Federal Energy Regulatory Commission’s (FERC) Minimum Offer Price Rule (MOPR), and other policy changes at federal, regional, and state, may have additional impacts.
15 These technologies are inclusive of electric vehicles, heat pumps, storage, and others.

5
In the last two decades, NH has experienced more presidentially-declared weather-related disasters than in the 50 years prior16 and the most significant power outages have all occurred since 2008.17 The severity and frequency of storms is projected to rise going forward. While NH utilities have modified their vegetative management programs, significantly reducing and shortening the power outages in the state, modernizing the grid to integrate storage and improve distribution intelligence,18 and weatherizing homes to reduce the impact of extreme heat and cold during outages are critical to support public health and safety, as well as economic vitality.
EESE Board Recommendations
In addition to incorporating the set of overarching, interconnected outcomes listed above, the EESE Board recommends that the 2021 State Energy Strategy include tangible implementation measures that the legislature can use to define policies to meet those outcomes.
A. Invest in Grid Modernization
While interrelated with each of the following topics, the EESE Board singles out the topic of grid modernization as it ultimately enables all other aspects of these comments to be enacted. Grid modernization refers to changes needed in the power grid to accommodate all the rapid technological changes happening in the generation, transmission and distribution of electric power, and is an essential foundation to being able to accommodate and incorporate many other objectives within New Hampshire’s energy policy. NH’s 10-year strategy should also encourage and enable investments in resiliency that account for the increase in extreme weather events experienced and predicted to occur in the coming decades.
Investments in grid modernization will serve to enable more distributed generation and other strategies to reduce overall demand, including shifting demand to non-peak periods. Grid modernization will also enable use of new energy sources such as offshore wind, innovative energy management efforts such as Community Power Aggregation, and other emerging technologies. Grid Modernization may also increase availability of real-time energy use data which is necessary for time-of-use (TOU) electricity pricing.
A modern, resilient and well-maintained distribution grid can readily enable the addition and interconnection of additional distributed generation and renewable energy, including solar and battery storage, the addition of ever increasing numbers of electric vehicles, and, when coupled with cost-effective energy efficiency, could reduce the need for additional generation, transmission and distribution investments.
B. Support Vehicle Electrification Across the State
New Hampshire should encourage and enable electrification of the transportation sector to reduce harmful emissions and, as the technology continues to grow, lower transportation costs.
Most vehicle manufacturers have committed to significant increases in availability of EV models within the current decade, with some manufacturers, including General Motors, already committing to solely selling zero-emission vehicles in the near future.19 Within three years, electric vehicles (EV) purchase prices are projected to be at or below conventional vehicle price.20 That, combined with the lower operating and maintenance costs of
16 FEMA (2021). Federal Emergency Management Agency (FEMA): Declared Disasters. https://www.fema.gov/disaster/declarations, NHDES analysis. Subject to revision. June 2021.
17 PUC (2019). New Hampshire Historical Outages All Utilities For Wide Scale Storms, https://www.puc.nh.gov/Safety/Electrical%20Safety/Safety-Chart-Of-Historical-Storms.pdf.
18 US DOE (2021). A Key Component Of Distribution Intelligence Is Outage Detection And Response, https://www.smartgrid.gov/the_smart_grid/distribution_intelligence.html.
19 NY Times (2021). G.M. Will Sell Only Zero-Emission Vehicles by 2035, https://www.nytimes.com/2021/01/28/business/gm-zero-emission-vehicles.html; and CNN (2019). Mercedes-Benz’s Aggressive Climate Pledge: All Cars Will Be Carbon-Neutral By 2039, https://www.cnn.com/2019/05/13/business/mercedes-benz-carbon-neutral-electric-vehicles/index.html.
20 Bloomberg NEF (2021). Electric Vehicle Outlook Report 2021, https://about.bnef.com/electric-vehicle-outlook/.

6
EVs, will result in a significant increase in use of electricity for transportation. It is necessary to invest in appropriate infrastructure now to ensure the buildout of charging networks is enabled, but also to ensure it occurs in a manner that does not result in increased emissions. Additionally, policies should be in place to encouraged non-essential charging to occur during non-peak hours to help minimize any impact on electric rates.
As the transition to EVs is its infancy, New Hampshire’s energy policy should be focused on spurring market adoption and the buildout of associated infrastructure to support and ease this transition and enable the increasing number of electric vehicles to be readily accommodated. This can occur by supporting utility “make-ready” investments where appropriate as well as by developing and offering EV charging rates that are appropriate for the level of market penetration that EVs have achieved. As these investments and rates are being made, costs should be appropriately distributed across the systems users.
C. Maximize Cost-Effective Energy Efficiency
Recognizing that energy efficiency is an effective tool to reduce energy costs, the state should continue to proactively pursue all cost-effective energy efficiency, and emphasize investments that benefit low- and moderate-income residents. The EESE Board continues to stand behind the long-term Energy Efficiency Resource Standard (EERS) policy objective of achieving all cost-effective energy efficiency inclusive of combined heat and power. These programs represent a true investment and because they are the lowest-cost method of satisfying incremental energy needs, are a crucial component in managing energy costs in New Hampshire.
The NH Utilities, PUC staff, OCA and other stakeholders should continue to work in close coordination to identify the best opportunities to achieve cost-effective energy efficiency and demand response in order to mitigate any upward pressure on electric rates.
D. Procure Additional Renewable Energy
The EESE Board acknowledges that sustainable renewable energy21, including renewable thermal, has the ability to provide clean and reliable energy for residents and businesses. The continued advancements and development of technology has lowered the cost of many sources of renewable energy, making them competitive with fossil fuel sources. Further development of renewable energy in New Hampshire is not only possible, but warranted to continue to reduce GHG emissions and retain our energy dollars in the state.
Encouraging energy portfolio diversity, while being cognizant of existing energy sources, removes price uncertainty from over-dependence on any single energy resource.
E. Reduce Upfront Expense
Develop programing, policies, and approaches that will support the reduction of upfront costs for residents, business, local governments, and manufacturers to adopt energy efficiency and clean energy technologies.
F. Prepare for Changes to Grid Mix
The EESE Board recognizes that the state’s electric power sector is at a turning point that requires careful consideration to ensure reliability, diversity, and economic development. The state has a diverse array of power generation facilities, which include hydro, nuclear, coal, oil, gas, solar, biomass, and wind. In the past 20 years, the mix of the fuels has changed dramatically as coal and oil use has declined and natural gas and nuclear have become the dominant energy sources. In the next two decades it is projected that large amounts of new renewable sources of generation will be added to the regional mix.22 Questions remain about the long-term operation of other non-fossil baseload facilities such as nuclear and biomass. No energy source generates power
21 Sustainable is inclusive of economic, social, environmental considerations, providing not only an economic benefit but is also appropriately sited in order to benefit the local community, while mitigating environmental impacts.
22 ISO-NE (2020). A Queue And A Curve: Signs In New England Of A Greener Grid This Earth Day, ISO-NEWSWIRE, April 22, 2021, https://isonewswire.com/2021/04/22/a-queue-and-a-curve-signs-in-new-england-of-a-greener-grid-this-earth-day/.

7
without some environmental, social, or economic impact. As the state and region transition from one mix to another, policymakers should consider the implications for the various scenarios that may occur and plan accordingly to secure our economic, social, and environmental sustainability.
G. State Government Leadership by Example
The State of NH should continue to pursue cost-effective energy management strategies to reduce its overall energy consumption and costs, maximizing energy efficiency and utilizing in-state sources of energy. The State has already avoided more than $45 million in energy costs in state-owned buildings since 2009 through energy efficiency and switching to locally sourced renewable energy. Significant opportunities remain for further energy cost savings. The State should utilize recently passed legislation to invest in cost-effective energy projects and utilize a portion of the savings to pursue further reductions.
The State should also provide support to local governments, including municipalities, school systems, and regional planning commissions to assist in collecting and analyzing baseline data, developing energy plans, and setting energy targets, in order to achieve energy reductions and cost savings.23
23 In 2020, the Governor signed Omnibus Bill House Bill (HB 1245) 1245, which included the language originally proposed in Senate Bill (SB) 462 (2020). The language in HB 1245 and SB 462 updated multiple RSAs related to the State of New Hampshire’s management of energy within state-owned buildings and within the State’s vehicle fleet. The language created a new source of funding for building energy projects, and enabled the State to utilize a broader range of financing mechanisms, as well as energy technologies. In addition, it also required the State to consider life-cycle costs across all building and fleet capital investments and leasing decisions. See HB 1245 (2020) Sections 37:53 through 37:60: http://www.gencourt.state.nh.us/bill_status/billText.aspx?sy=2020&id=1652&txtFormat=pdf&v=current.

PRODUCING ELECTRICITY FROM A RENEWABLE RESOURCE
GRANITE STATE HYDROPOWER ASSOCIATION, INC. TWO COMMERCIAL STREET TELEPHONE: 603-753-4577 BOSCAWEN, NEW HAMPSHIRE 03303 EMAIL: [email protected]
June 25, 2021 Office of Strategic Initiatives Re: State Energy strategy update 107 pleasant Street Johnson hall, 3rd Floor Concord, NH 03301 Dear Director Chicoine, Granite State Hydropower Association, Inc. (“GSHA”) is pleased to submit the following comments and recommendations regarding the 2021 update to the State of New Hampshire 10 Year State Energy Strategy. Our comments primarily focus on sections of the plan that we think will affect the New Hampshire small hydroelectric industry. Thank you for the opportunity to submit these comments and recommendations. Please feel free to contact me with any questions or further discuss any of the content of our comments. Sincerely,
Robert King President Granite State Hydropower Association

Granite State Hydropower Association comments on NH State Energy Strategy
By way of brief background, GSHA is a voluntary, non-profit trade association for the small-
scale hydropower industry in New Hampshire. Members of GSHA own and operate nearly 50
hydroelectric facilities located in 35 towns and cities throughout the state, totaling nearly 55
megawatts (MWs) of distributed generation. GSHA members produce an emissions-free,
renewable, reliable and locally distributed source of electricity that provides important economic,
recreational, and environmental benefits to New Hampshire. GSHA hydro facilities pay local and
state property and business taxes, employ New Hampshire residents, and purchase local goods
and services needed for operation and maintenance.
As we advance on a transition towards cleaner electric generating resources, it will be critically
important to ensure our grid is supplied by a diverse mix of generation technologies that can
complement each other to ensure reliability, resilience, and protect against risks and potential
costs of over-reliance on a single generation type. Unlike some other renewable resources,
hydropower typically generates 24/7 for long stretches of the year and provides predictable day
ahead generation. Most small hydropower projects in NH operate as run-of-river, where power
production is dependent upon seasonal variations and influenced by climatic variation such as
droughts. Nonetheless, our hydropower resources typically have a capacity factor of 40-45%
offering significant power generation in a relatively small footprint. Compared to dams without
hydropower generation, hydropower dams are safe and well maintained, and project owners
bear the cost of recreational opportunities, and removal of trash and debris from our rivers.
Small hydropower electric generating resources represent an important industry for our state
that provide in state value despite facing many challenges not borne by other renewable energy
sources. Virtually all GSHA facilities are regulated by the Federal Energy Regulatory
Commission (FERC), and all work closely with state agencies and local officials on public safety
matters. Several small hydropower projects are undergoing FERC re-licensing which is a multi-
year undertaking that requires both tremendous time and financial investments to complete
successfully. It is also typical that new regulatory requirements are imposed during re-licensing
such as new fish passage infrastructure, by-pass flow requirements, and modifications in
operations requirements which reduce power generation. Though FERC licensing and re-
licensing is a federal process, state agencies such as NH DES and NH Fish and Game also
play an important role in the process. Like all other electric generating resources, we encourage
NH to carefully strike the balance between ensuring the protection of our natural resources and
being realistic, practical, efficient, and not overly burdensome with re-licensing requirements.
The current state energy strategy encourages a technology-neutral approach to the Renewable
Portfolio Standard (RPS) which would consolidate all existing classes and create a single
overall goal for eligible resources. Though this may result in a potential reduction in the overall
cost of compliance with the RPS, such an approach would fail to recognize the positive benefits

provided by GSHA projects and fail to achieve the goals of the RPS. The RPS was established
in 2007 and, as stated in RSA 362 F:1, the purpose of this policy is first to provide fuel diversity
to protect against overreliance on fossil fuels and protect against fuel price volatility and price
spikes. Additionally, investment in renewable energy technologies keeps energy investment in-
state to benefit our own economy. A third goal is to achieve environmental benefits, improve air
quality, and protect public health. The 4 classes of the NH RPS program were the result of
extensive multiparty negotiations involving environmental, regulatory, utility, and industry
representatives. The final regulations recognized specific differences confronting different
renewable energy technologies and were adopted to achieve fuel diversity and economic
benefits for NH rate payers. The program has operated successfully since its adoption and also
has provided funds for renewable energy grant and rebate programs. Therefore, we strongly
urge you to reconsider the energy strategy’s position on the RPS which seeks to eliminate the
class structure of the NH RPS program. We respectfully urge you to continue to support
existing classes and goals of the NH RPS while beginning to plan, with meaningful stakeholder
input, the future of the NH RPS beyond 2025.
Several GSHA member projects of 1MW or less are group net metering hosts which allows
them to supply power and savings to local NH customers. Typically, group net metering
customers are able to purchase energy at a discount from the default service energy rates from
franchise utilities. Group net metering enables electric and financial transactions that benefit
both the host generator and the group members who would otherwise export their energy to the
ISO-grid. State and local municipalities also benefit from increased property and business
profits taxes. The potential passage of “municipal host” legislation this year (HB 315) would
allow hydropower projects over 1MW and up to 5MW to also serve as group net metering hosts
serving exclusively members who are political subdivisions. This would create new opportunities
for more of NH’s hydropower projects to serve local customers which will benefit both the
municipal customers and their taxpayers with cost savings, provide additional value to the host
hydropower projects and increased taxes to municipalities and the State. Net metering is
therefore a very important policy that helps support our small hydropower projects.
We look forward to the findings of distributed energy resources study now being conducted by
the NH PUC which will consider hydropower in addition to solar and the results will inform the
development of any future net metering tariffs. We recommend the energy plan address one
current problem with the current group net meter regulations. The net metering credit (rate) is
based upon default energy service rates which change every 6 months. The lack of future rate
certainty makes it difficult, if not impossible, for new renewable projects to obtain financing. As
we’ve seen significant rate decreases in recent years the value of net metering is decreasing
and uncertain. Setting a more stable and predictable net metering credit would be preferable for
future iterations of net metering tariffs.

Although NH is playing host to new large solar developments that have won bids in neighboring
states’ procurements, unlike other New England states, NH has thus far not issued or seriously
considered renewable or clean energy procurements. NH’s load is relatively small in
comparison to the size of the ISO grid and is unlikely to be the prime sponsor of economically
sized offshore wind projects. We encourage the state to continue to support existing local
resources including small hydropower that provide substantial in state benefits. To the extent
the NH renewable base is to be expanded we suggest joining with other New England states
that are considering development of economically sized new renewable projects like offshore
wind.
The current NH energy strategy is almost exclusively focused on immediate costs to ratepayers.
Though we recognize this is an important priority, it fails to consider the tangible economic
benefits of in state renewable generation and potential longer term savings of policies that may
have a short term cost. Additionally, the strategy does not consider recent and ongoing trends in
cost drivers for ratepayers. Specifically, the cost of energy including wholesale electricity prices
and default energy service have declined significantly in recent years while transmission and
distribution charges and their relative share of the overall bill are increasing significantly. We
encourage a more holistic consideration of ratepayer costs and benefits which considers the
value of investments that will benefit our state and our economy now and in the long term.


1
Comments and Recommendations for the
2021 Update to New Hampshsire’s 10-Year State Energy Strategy
The state’s 2018 10-year Energy Strategy is out of touch with today’s energy
markets. It fails to recognize the cost-effectiveness of renewable energy,
understates the subsidization of fossil fuels, needs to provide stronger support for
energy efficiency, and ignores the need to strategize a path to an energy future that
will mitigate the problems of climate change. This myopic approach will retard the
state’s future economic viability and resiliency.
We will discuss these Energy Strategy topics with recommendations in the sections
to follow.
1. Climate Change Mitigation
This should be one of the top goals of any state energy strategy; it was
ignored in the 2018 strategy.
2. Cost-effectiveness
A worthy goal; but should not be considered too narrowly.
3. Energy Markets
These are evolving. Renewable energy is often the cheapest electricity
available, even compared to heavily subsidized fossil fuels.
Temporary subsidies and preferences for renewables may prove useful
to accelerate the transition to an affordable, low-carbon-emission
future.
4. Energy Efficiency
New Hampshire should promptly pursue cost-effective paths to raise
energy efficiency in buildings, which has been neglected.
5. Transportation
The automotive fleet is shifting from internal combustion engines to
electric-powered vehicles. New Hampshire should assure availability
of charging stations. Transportation efficiency also calls for more
public transit, park-and-rides and bike lanes.
6. Growing the New Economy
To stay appealing to companies, skilled workers, residents and
tourists, New Hampshire should join neighboring states in setting
targets for renewable energy.

2
1. MITIGATING GLOBAL CLIMATE CHANGE
Mitigating climate change must be one of the top goals of any state energy
strategy. For the US1, as for the entire world2, fossil fueled energy use is the major
cause of the climate disruptions which are coming with disastrous effects at
increasing frequency and intensity. The 2018 Strategy Plan theorized that pursuing
lowest costs without government mandates and subsidies would protect us from
disruption and climate change3, but that is not the reality, as most recently
demonstrated by the devastating Texas freeze-up in early 2021.
Hanover and five other NH cities and towns have already committed to making the
transition to 100 percent clean energy for electricity by 2030 and
heating/transportation by 2050. Our New England neighbors – Maine, Vermont,
Massachusetts, Rhode Island, Connecticut - have established carbon reduction
goals of 80 to 100% for target dates between 2030 and 2050. As the only New
England state without such a mandate, NH risks being left behind with the
outdated, climate-harmful, costly energy systems of yesteryear, to the detriment of
our businesses and residents.
WE RECOMMEND that New Hampshire adopt the following energy strategies
which can be achieved in ways that are cost effective and promote growth:
● Make mitigation of climate change a top priority of state energy goals.
● Establish greenhouse gas emission targets consistent with those of other
New England states.
● Increase renewable energy goals to transition to 100% clean energy by 2030
for electricity and 2050 for heating and transportation.
2. COST EFFECTIVENESS
Cost effectiveness is important, but it makes poor policy if considered too narrowly
and without foresight. In crafting energy goals, New Hampshire should also
consider dependability, self-reliance, resilience, public health and welfare, and
1 “In the United States, most of the emissions of human-caused (anthropogenic) greenhouse gases (GHG) come
primarily from burning fossil fuels—coal, natural gas, and petroleum—for energy use.”
https://www.eia.gov/energyexplained/energy-and-the-environment/where-greenhouse-gases-come-from.php 2 Energy accounts for over two-thirds of global greenhouse gas emissions. This means energy must be at the
heart of any solution.” https://www.ipcc.ch/2020/07/31/energy-climatechallenge/ 3 https://www.nh.gov/osi/energy/programs/documents/2018-10-year-state-energy-strategy.pdf, p 16.

3
environmental protection. In evaluating costs, we must acknowledge those
associated with the increasing climate disruption to our towns, businesses and
residents. These include the costs caused by droughts, flooding, rising sea level on
the coastline, shortened ski seasons and health care. The NH Medical Society has
warned of substantial increases in illness and health care costs which include heat
stress, water contamination, respiratory issues, worsening air quality, etc. The Oil
Discharge and Disposal Cleanup Fund costs $12 million each year to address spills
and other damage from fossil fuels. To our knowledge, there is no equivalent fund
for renewables.
New Hampshire has little or no production of fossil fuels. They need to be shipped
here from outside the state and may be curtailed by forces beyond our control, as
natural gas has been at times. Wind and solar energy, in contrast, are produced in-
state. They provide New Hampshire jobs and cannot be curtailed to meet other
states’ needs. Unlike fossil fuel plants, they emit none of the air pollution that
causes health and environmental hazards and climate-changing greenhouse gases.
They support small distributed systems that increase local energy independence
and choice. They enhance the power grid’s resilience, as determined by a recent
Dartmouth Engineering study4.
Renewable energy technologies are increasingly the most cost-effective form of
electricity generation. According to a 2020 study by the International Energy
Agency, “the levelized cost of electricity generation of low-carbon generation
technologies are falling and increasingly below the costs of conventional fossil
fuels. …onshore wind is expected to have, on average, the lowest levelized cost of
electricity generation in 2025”5. According to a May 2019 report by the
International Renewable Energy Agency (IRENA), “Onshore wind and solar PV
power are now, frequently, less expensive than any fossil-fuel option, without
financial assistance.”6
An update of the 2018 Energy Strategy should correct that document’s
exaggeration of subsidies for renewables relative to those for fossil fuels. The
document cites Energy Information Administration (EIA) statistics for 2013,
finding renewables harvested almost $11.67 billion in “direct federal financial
interventions and subsidies”, compared to just $3.25 billion for “conventional”
4 https://engineering.dartmouth.edu/news/dartmouth-engineering-study-shows-renewable-energy-will-enhance-power-grids-resilience
5 https://www.iea.org/reports/projected-costs-of-generating-electricity-2020 6 https://www.irena.org/publications/2019/May/Renewable-power-generation-costs-in-2018

4
energy from oil, gas, coal and nuclear fuels. And it notes that this financial benefit
was far out of proportion to the small contribution of renewables to electric
generation. But the same study shows those renewable subsidies had been cut in
half by 2016, and that much of those went to biofuels; wind and solar got less than
$3.5 billion.
Most estimates of federal studies peg aid to fossil fuels far higher than suggested in
the 2018 OSI report. The EIA authors acknowledge that their study omits indirect
subsidies. The International Monetary Fund calculates this nation’s annual
subsidies to the oil, gas and coal industries in 2017 at an astounding $677.65
billion.7 Advocacy groups Oil Change International and the Overseas Development
Institute estimated more than $24 billion.8 Some of these huge totals include
“externalities”, the uncompensated costs of fossil fuels’ pollution, which should be
considered in New Hampshire’s assessment of cost.
WE RECOMMEND the following energy strategies to promote energy options
that are truly the most cost-effective sources for our state:
● Cost-effectiveness should consider direct and indirect costs and benefits,
including environmental and health costs.
● Investment in temporary subsidies may be provided to resources that meet a
full consideration of cost effectiveness and contribute to achieving the
State’s low emission goal.
● Increase investment in distributed grid resources by lifting the net metering
cap from the current 1 MW limit. Net metered renewables are cheaper and
reduce the need for costly high-voltage transmission lines.
3. ENERGY MARKETS
Energy markets are changing. The 2018 10-year strategy says that New Hampshire
will need natural gas “into the foreseeable future”. That runs counter to the
International Energy Agency’s finding that to minimize climate disasters,
advanced nations need to begin shutting down their coal, oil and natural gas
development by 2035.9 And it ignores market trends.
7 https://www.imf.org/en/Publications/WP/Issues/2019/05/02/Global-Fossil-Fuel-Subsidies-Remain-Large-An-
Update-Based-on-Country-Level-Estimates-46509 8 https://insideclimatenews.org/news/12112015/fossil-fuel-subsidies-top-450-billion-annually-study-
says/?gclid=CjwKCAjwtpGGBhBJEiwAyRZX2l1OBMoAcrr1XlUw7jL5cwkkfyAFWBag7C6TF58luN_F7opMW
XJZVBoCwGkQAvD_BwE 9 https://www.iea.org/reports/net-zero-by-2050
5
Regional, national and global markets are moving rapidly toward a renewable
energy future, as is ISO-New England. According to their 2021 Regional
Electricity Outlook, “The changeover is happening—and is most evident in the
ISO’s interconnection queue, which tracks proposals for new energy resources. In
the past few years, proposals to build clean energy resources such as wind, solar,
and battery storage, have eclipsed proposals to build natural gas generation”10.
Major electric power companies are already shifting from building more gas plants
toward a combination of wind and solar farms and batteries. Duke Power, long
powered by fossil fuels, is considering writing off new gas plants in 25 years,
rather than 40, because it fears they will become obsolete due to renewable and
battery competition. 11 It will not serve the people of New Hampshire to be left on
the sidelines as the energy market moves on.
Our state needs to encourage innovation and economic development such as the
2.45MW battery storage facility installed by NHEC in Moultonborough. The
batteries will be charged by an adjacent solar farm during low demand hours and
discharge during peak demand12. The New Hampshire Electric Cooperative
predicts the batteries will save members $2.3 million over the next 12 years. This
demonstrates the ability of renewables to attract new, high level investment into
the state while furthering our progress to our clean energy goals.
Markets are responding to organizations and businesses worldwide that are
transitioning to clean energy through their businesses and supply chains. The
Climate Group (www.theclimategroup.org), an international non-profit, has
brought together hundreds of businesses both large (Fortune 500) and small, who
have committed to sourcing all their electricity renewably for their headquarters,
stores, branches, supply chains, etc. If New Hampshire does not have the
renewable energy infrastructure and resources necessary to meet the demands of
companies such as these, the state will lose business and jobs to neighboring states
that can provide the necessary resources.
In our community, the largest electricity users – Dartmouth College, Hypertherm,
Dartmouth-Hitchcock Medical Center, Kendal, and the Town of Hanover - have
10 https://www.iso-ne.com/static-assets/documents/2021/03/2021_reo.pdf 11 https://www.wsj.com/articles/batteries-challenge-natural-gas-elecric-power-generation-
11620236583?page=1
12 https://www.concordmonitor.com/battery-storage-solar-electricity-NHEC-40504020

6
set sustainability goals. Impressively, the Town of Hanover is more than 90%
transitioned to locally generated solar electricity, and more than 200 homes in
Hanover are powered by solar.
While it is ideal for a free market to solve energy issues, there are obstacles that
may require government intervention for savings and emission reductions to occur
in a timely manner. Cost-effective new technologies have not always replaced old
systems even when they have lived beyond their “useful competitive lifespan”13.
An example is the delay of many years (and the unnecessary expenditure of many
thousands of taxpayer dollars annually) before Investor Owned Utilities agreed to a
reasonable transition to LED street lighting.
WE RECOMMEND that NH should reframe its energy strategies to recognize the
new energy market:
● Promote innovation and smart technologies that increase energy reliability
and access to clean energy,
● Support community power programs based on RSA 53-E to enhance
consumer access to affordable renewable energy and innovative cost saving
measures to reduce demand, and
● Adopt goals and a strong Renewable Portfolio Standard mandate, to send a
clear signal to the market about the State’s commitment to a clean energy
future.
4. ENERGY EFFICIENCY
The 2018 10-year strategy correctly notes that energy efficiency is the state’s
“cheapest, cleanest energy resource.” But it fails to point out cost-effective ways of
optimizing it: new construction codes and rebates for weatherization and efficient
appliances.
New Building Codes. New Hampshire has failed to take advantage of money-
saving improvements in energy-efficient building codes that have been widely
adopted elsewhere. These have prescribed better air-sealing, thermal wrapping,
windows, HVAC systems, lighting, and more.
The state last upgraded residential energy efficiency building codes in 2019 to
standards set in the 2015 International Energy Conservation Code (IECC). But to
13 https://www.nh.gov/osi/energy/programs/documents/2018-10-year-state-energy-strategy.pdf, Page 20
7
reduce construction costs it carved out four exceptions that cost homeowners a
significant part of the estimated 30-year net savings which that code produced
(total savings exceeded $10,000 for a 2,400 sq. ft. home).14 Moreover, the state
has failed to make other residential energy code improvements adopted by IECC in
2018 and 2021 that would yield an additional 12 percent energy savings. It also
failed to adopt international code improvements proposed since 2013 for
commercial construction.15
Added construction costs from tighter codes should be recouped from lower fuel
costs within one-to-four years, according to the studies cited above. This is a win-
win opportunity. Building owners will enjoy fuel savings for the life of the
structures, and the climate will benefit from reduced emissions of greenhouse
gases.
The codes apply to new construction and additions. To achieve cost-effective
energy savings in older structures, New Hampshire should ensure that
weatherization rebates and energy-efficient appliance rebates are fully funded each
year and that their availability is continuous, guaranteed and sufficient to meet the
demand.
According to the US Department of Energy, 40% of the energy used in the US is
for home and commercial buildings.16 “By combining proper equipment
maintenance and upgrades with appropriate insulation, air sealing, and thermostat
settings, homeowners can cut their energy use for heating and cooling from 20% to
50%”.17 That is cost effective; one study found that energy savings pay off the cost
of home weatherization improvements in northern U.S. climates within two to
three years. 18 According to the NHSaves Program administrators, since 2002 the
state’s energy efficiency rebate programs had begun producing customer energy
cost savings that would total more than $3.4 billion over the lifetime of the
measures. In addition to saving energy, carbon emissions and money,
weatherization provides comfort and health benefits for building owners and
14 Cost-Effectiveness Analysis of the Residential Provisions of the 2015 IECC for New Hampshire. Pacific
Northwest National Laboratory, February 2016:
https://www.energycodes.gov/sites/default/files/documents/NewHampshireResidentialCostEffectiveness_2015.pdf
2021 IECC Standards analyzed
Finalizing the 2021 IECC Takes the Next Step Forward, June 29, 2020
https://newbuildings.org/finalizing-the-2021-iecc-takes-the-next-step-forward/
15 Cost Effectiveness of ASHRAE Standard 90.1-2016 for the State of New Hampshire, August 2020:
https://www.energycodes.gov/sites/default/files/documents/90.1-2016_State_Cost-Effectiveness_NH.pdf 16 Why Energy Efficiency Upgrades, https://www.energy.gov/eere/why-energy-efficiency-upgrades 17 https://www.energy.gov/eere/why-energy-efficiency-upgrades 18 http://efm.princeton.edu/pubs/Bradshaw_Thesis%20FINAL.pdf

8
renters. Despite these advantages, New Hampshire’s energy efficiency programs
have been confusing and often underfunded. NH lags behind the other New
England states in energy efficiency investment, which has resulted in higher ISO-
NE transmission costs. Implementation of the 2021-2023 Statewide Energy
Efficiency Plan,19 which was widely anticipated to improve efforts, has been
delayed causing uncertainty for service providers and consumers.
Appliances matter, too. The state should ensure that money for cost effective
rebates for the most energy-efficient appliances are consistently available. In our
community, heating companies are seeing significant movement from oil and gas
to electric heat pumps, which provide more efficient heating and can be powered
by clean energy. To avert climate disasters, the IEA recommends a ban on new
fossil fuel boilers by 2025.20
WE RECOMMEND that New Hampshire accelerate energy efficiency
programming to surpass the “modest” effort described in the 2018 strategy:
● Promptly upgrade the State’s energy efficiency standards for new
construction to meet the IECC 2021 standards.
● Strengthen the Energy Efficiency Resource Standard and ensure that energy
efficiency plans are implemented in timely and predictable planning cycles.
● Encourage utilities and energy suppliers to provide NH energy users with
access to new energy-saving and demand-reducing technologies
● Ensure that incentive programs are offered and funded consistently and
reliably at levels sufficient to accomplish cost and demand reduction goals.
5. TRANSPORTATION
The transportation sector accounts for nearly 30% of greenhouse gas emissions and
is the largest source of greenhouse gases in New England. Emissions can be
dramatically decreased by promoting electric vehicles and alternative forms of
19 https://www.puc.nh.gov/Regulatory/Docketbk/2020/20-092/LETTERS-MEMOS-TARIFFS/20-092_2021-01-
19_EVERSOURCE_REV_PLAN_NARRATIVE_INCORPORATE_SETTLEMENT_TERMS.PDF 20 https://www.iea.org/reports/net-zero-by-2050

9
transportation. These alternatives also save money for New Hampshire businesses
and residents.
The landscape for transportation has changed dramatically since 2018. Electric
vehicle sales are accelerating, expecting to grow by 70% in 2021 over 2020.21 It is
no longer true that “ those vehicle types will remain a minority of vehicles on the
road for decades, even under optimistic projections.” (NH 10 Year Energy Strategy
2018. P. 49). Volkswagen, GM, Volvo, and Honda have committed to producing
only electric cars by 2030-2040. Ford, maker of the most popular motor vehicle of
all time, the F150 pick-up,has just introduced an all-electric version. An Oct. 2020
article by Barron’s quotes Morgan Stanley analysts as saying that, “Battery-
powered electric vehicle (BEV) sales will make up more than 30% of the global
market by 2030”.
Those vehicles will need electric chargers. Tourism, the biggest industry in New
Hampshire, will demand charging facilities at hotels, restaurants, and tourist
attractions. Travelers need to have DC fast chargers scattered throughout the state.
Neighboring states are developing such networks and will draw away our tourists
if New Hampshire does not compete. Therefore, the state should promote the
development of a network of DC fast chargers along all main roads. The state
should also encourage installation of level-2 chargers at other locations by offering
incentives. And the state-operated ski area, Cannon Mt., should have chargers to
attract skiers from other states.
Funds for installing chargers are available. The State of NH received $30.9 million
dollars from the VW settlement and allocated $4.6 million to expanding the EV
charging network, but it remains unspent. The Biden administration’s
infrastructure plan calls for adding 500,000 DC fast charging stations by 2030. The
State needs to facilitate installation of electric vehicle chargers through its funding,
policies and regulation in a timely manner.
Many commercial and public service fleets are converting to electric vehicles. For
example, FedEx will convert to electric delivery vehicles by 2040. The US Postal
Service is starting to buy electric trucks. The state can contribute to this conversion
by facilitating conversion of school buses. Electric school buses are a clean,
healthy alternative to the diesel buses which release pollutants linked to serious
health problems such as asthma, bronchitis and cancer. The latest generation of
these e-buses is a viable solution even in northern climates such as ours. And
21 https://ihsmarkit.com/research-analysis/ihs-markit-forecasts-global-ev-sales-to-rise-by-70-percent.html

10
they’re cost-effective. “Over the lifespan of an electric school bus battery, schools
can save nearly $130,000 per bus”22.
For personal transportation, bicycling and walking saves both energy and money.
A 2018 Energy Department report found that nearly 60 percent of all vehicle trips
involved a distance of under 6 miles23. In our community, as elsewhere, commuters
and errand runners are discovering an electric bicycle can be used for many of
these trips at a substantial fraction of a car’s fuel and maintenance cost. Better
infrastructure is needed to support e-biking and other forms of active mobility. The
State should build bike paths, bike lanes, and sidewalks on more of its roads. This
not only saves money for the consumer, but for the State, too. The book
“Drawdown” quotes a savings of $2.1 trillion in lifetime savings for investment in
bike infrastructure over roads24.
Fewer cars on the road reduces energy use and greenhouse gas emissions. To
reduce vehicle trips, the State should promote public transportation where it is
efficient, such as near large employment centers. Building more Park-and-Rides
would promote more car-pooling and further reduce vehicle miles.
WE RECOMMEND the following strategies for the transportation sector:
■ Develop a comprehensive network of fast EV chargers and level 2 chargers
along major roads for use by citizens and travelers from other areas.
■ Support development of EV charging stations by utilities, employers, local
governments and businesses, including stations in the most rural parts of the
state.
■ Create financing options to assist school districts with the upfront cost of
electric buses to achieve long-term savings.
■ Design and implement a statewide network of multi-use paths to connect
towns and improve the safety of low-carbon travel.
22 https://uspirg.org/news/usp/new-report-outlines-how-utility-companies-can-help-pay-electric-school-buses
23 https://www.energy.gov/eere/vehicles/articles/fotw-1042-august-13-2018-2017-nearly-60-all-vehicle-trips-
were-less-six-miles 24 Drawdown: the most comprehensive plan ever proposed to reverse global warming, edited by Paul Hawken, p.
89.

11
6. GROWING THE NEW ECONOMY
If NH fails to join with the rest of New England and, indeed, the rest of the world,
in a transition to a clean energy economy, the State risks losses in jobs, young
people, economic investment, and tourism. Clean, renewable energy development
brings jobs. According to the Environmental Defense Fund, “The most rapid
renewable energy job growth has come from the solar and wind sectors, which rose
by 24.5 percent and 16 percent, respectively, from 2016 to 2017. Solar and wind
energy jobs outnumber coal and gas jobs in 30 states, including the District of
Columbia. The coal industry, which has been declining, now employs 160,000
workers, less than a quarter as many Americans as the renewable energy
industry”.25
Signs that the energy economy is moving away from fossil fuels--including natural
gas--are everywhere. ISO New England reports that, five years ago, 63% of the
ISO New England interconnection queue was comprised of proposals for natural
gas generation. Today, however, wind power makes up the majority of new
proposals, and the interconnection queue is now 90% carbon-free. What’s more,
five years ago, it would have been extremely unlikely to see even one day where
the demand on the grid was lower in the afternoon than overnight. Now, however,
New England has seen 27 days of grid demand being lower in the afternoon than
overnight. The reason for this is energy efficiency and distributed energy resources
like behind-the-meter solar, which are shifting daily demand curves and reducing
demand on the grid.26 When NH pursues a course that is contrary to other ISO-NE
states, as advocated by the 2018 Strategy Goal #10, our weak renewable mandates
and subsidy programs fail to reduce peak demand at rates achieved by others27. The
result is higher transmission costs for NH electricity consumers. This is not a cost
effective strategy.
The graphic below from ISO New England illustrates where electricity generation
is moving in New England.
25 https://www.edf.org/energy/clean-energy-jobs
26 https://isonewswire.com/2021/04/22/a-queue-and-a-curve-signs-in-new-england-of-a-greener-grid-this-earth-day/
27

12
ISO New England says it “will continue to support [reducing carbon emissions
while meeting energy demands] by taking steps to plan and operate a reliable,
greener grid, including working with NESCOE (New England State Committee on
Electricity) and NEPOOL (New England Power Pool) on the Future Grid
Initiative.28
Along with this investment in green energy comes an investment in jobs.
According to a 2019 research article in nature.com , “Through the LCEGSS (Low
Carbon and Environmental Goods and Services Sector) data, the US green economy is
estimated to represent $1.3 trillion in annual sales revenue and to employ nearly 9.5
million Full-Time Equivalent jobs (FTE); both of which have grown by over 20% in
the last three years.29 Comparison with China, OECD members and the G20 countries
shows the US has a greater proportion of the working age population employed (4%)
and higher sales revenue per capita in the green economy. It also demonstrates that
other countries have huge potential to develop their green economy and the US needs
to develop energy, environmental and educational policies to remain competitive.”
Offshore wind in the Gulf of Maine will bring direct and indirect jobs in both the
construction or the assembly out at sea followed by the operations and maintenance
that will occur over the next 25 to 30 years.30It is expected to create more than $1.5
28
https://isonewswire.com/2021/04/22/a-queue-and-a-curve-signs-in-new-england-of-a-greener-grid-this-earth-day/
29 https://www.nature.com/articles/s41599-019-0329-3#Sec12
30 https://www.fosters.com/story/news/local/2021/02/23/new-hampshire-offshore-wind-turbines-renewable-energy-
maine-massachusetts/4553958001/

13
billion in wages and state tax benefits for NH31. State Sen. David Waters, chairman of
the state Offshore Wind Commission, estimates it will yield 20,000 jobs for the
region, but says New Hampshire needs to develop policies and infrastructure to get its
share. NH has taken the first steps to participate in the economic growth that will
come from the offshore wind industry but is behind Massachusetts and Maine in
readiness.
New Hampshire should support changes in federal law and regulation that may be
needed to allow our harbor at Portsmouth to service foreign flag vessels that are
currently the only ones sufficiently large to assemble the most efficient, giant
offshore wind turbines. 32
Organized labor is also embracing the green economy by teaming with renewable
energy developer, Orsted: “Orsted, the Danish renewable energy group, and the
North America’s Building Trade Unions (NABTU) have entered into a pact to
train an offshore wind construction workforce as the firm eyes construction of a
series of wind farm projects up and down the East Coast”. Orsted has been
awarded 2.9 GW of offshore wind power contracts all along the Eastern seaboard,
making it the largest offshore wind developer operating in US waters.
The following graphic from ISO New England shows that New Hampshire, the
only New England state without a mandate to reduce greenhouse gas emissions,
risks becoming obsolete as the infrastructure and electricity grid evolves to
accommodate the clean energy transition.
31 https://www.unionleader.com/opinion/op-eds/david-watters-and-michael-behrmann-launching-the-offshore-wind-
industry-in-nh/article_5ce3cd8f-7d9d-52ab-8007-55a361d76b55.html 32 https://www.shiplawlog.com/2021/02/25/u-s-congress-applies-jones-act-to-offshore-wind/

14
WE RECOMMEND that New Hampshire embrace the growth of a new,
sustainable economy.
● Support innovative, clean-energy businesses.
● Forge commitments to reduce greenhouse gas emissions by specific dates.
● Support development of infrastructure and workforce skills needed for New
Hampshire to help build and maintain offshore wind farms in the Gulf of
Maine.
● Engineer changes in law, regulation and financial incentives to meet those
goals.

NH State Energy Strategy | Public Comment of Henry Herndon | June 7, 2021
1
June 7, 2021
To:
Office of Strategic Initiatives Re: State Energy Strategy 107 Pleasant Street Johnson Hall, 3rd Floor Concord, NH 03301
From:
Henry Herndon, Citizen 14 Dixon Ave, Suite 201 Concord, NH 03301
To Whom It May Concern:
I respectfully submit the following comments to the New Hampshire Office of Strategic Initiatives as public comment regarding the 2021 revision to the New Hampshire 10-Year State Energy Strategy. My comments are organized in accordance with the Table of Contents presented in the 2018 Strategy.
Summary of Comments:
• Continue to support market-based policies
• Increase “Retail Market Competition” by access to price-signals
• Increase market opportunities for “Distributed Energy Resources”
• Remove policy barriers to development of mid-size projects (1 – 5 megawatts) for New Hampshire energy users, for example, by supporting amendment of RSA 362:A, Limited Electrical Energy Producers Act
• Continue to lead by supporting Statewide Energy Data Platform and Community Power market development
• Implement strategies to better manage Transmission and Capacity costs (e.g., market-based load-shifting, load management, load reduction at peak times)
Goal 1: Prioritize Cost Effective Energy Policies.
Comment: Support.
Goal 2: Ensure Secure, Reliable and Resilient Energy System (Cybersecurity & Grid Modernization)
Comment: Support.
The state could do more to remove regulatory barriers to “Distributed Energy Resources” including battery storage, vehicle-to-grid battery discharge, distributed

NH State Energy Strategy | Public Comment of Henry Herndon | June 7, 2021
2
generation, and microgrids. These “DERs” increase grid resiliency by providing distributed/back-up power in the event of grid failures. The state should prioritize removing utility regulations that stifle markets for distributed energy resources. The state should seek to increase market competition by introduction of price signals to retail market participants.
One strategy would be to require utilities offer time-based rate options and pricing for grid-connected energy storage systems providing power at small (1 – 1,000 kilowatt) and medium (1,000 - 5,000 kilowatt) scales.
Another option would be to support development of Community Power Aggregations seeking to innovate by offering smart rate options for energy supply produced at small scale within their municipality or within the state.
Goal 3: Adopt All Resource Energy Strategies and Minimize Government Barriers to Innovation
Comment: Partially Oppose, Partially Support.
I do not support adopting an “all resource” energy strategy. I prefer a “market-based” energy strategy.
I support minimizing government barriers to innovation. This is an enormously challenging task, and perhaps the defining characteristic of the energy sector historically. Government regulation of investor-owned monopolies (and the inevitable regulatory capture that comes with that century-long relationship) is the biggest obstacle to modernizing the electric power sector. I am hopeful that market-based (Community Power Legislation) and grid modernization (Statewide Energy Data Platform) initiatives that have been taking shape under this administration’s leadership are good steps towards minimizing government/monopoly barriers to innovation.
Goal 4: Maximize Cost Effective Energy Savings (Energy Efficiency Resource Standard)
Comment: Neutral.
Goal 5: Achieve Environmental Protection that is Cost Effective and Enables Economic Growth.
Comment: Support.
Goal 6: Government Intervention in Energy Markets Should be Limited, Justifiable, and Technology Neutral.
Comment: Support.
I agree. When government intervenes, it should be to remove regulatory barriers to market competition.

NH State Energy Strategy | Public Comment of Henry Herndon | June 7, 2021
3
Senate Bill 91 Part IV from this past legislative session (which I believe is has not survived to make it to the Governor’s desk) is a good example of government action that is limited, justifiable and technology neutral. SB91 Part IV (as introduced, not as amended), would have created an in-state competitive marketplace for energy generation projects of between 1 and 5 megawatts in capacity.
The bill would have amended RSA 362:A, the “Limited Electrical Energy Producers Act,” and in doing so, create a marketplace where buyers and sellers could come together to negotiate an agreed-upon price and contract term for the purchase of electricity from in-state generators of 1-5 Megawatts. This is an alternative to the Net Metering debate at the 1-5 MW scale. Under net metering, the regulators set the price. By amending RSA 362:A, we could create an alternative where the market, not the regulators, sets the price. This precludes any possibility of cost-shifting. It would enable large energy users, municipalities, Community Power programs, and other large buyers of energy to negotiate directly to develop projects here in New Hampshire for the benefit of New Hampshire ratepayers. Such policy action is also technology neutral.
Suggestion: support amending RSA 362:A, Limited Electrical Energy Producers Act, to remove regulatory barriers and create a marketplace for in-state generators and buyers.
Goal 7: Encourage Market Selection of Cost-Effective Energy Resources.
Comment: Support.
The “retail market” remains flawed and corrupted by legacy monopoly utility infrastructure and business practices. Specifically: Metering & Billing.
Utility businesses systems including metering and customer bill processing are woefully outdated. A more paranoid man might even suggest utility meters and billing systems are deliberately moronic. Meters collect information once monthly via car-drive-by-radio-receiver. Together, obsolete metering and billing practices prevent any innovative pricing that might account for time-of-day, real-time demand and price on the system, and other common sense price signals that could be used to offer customers better retail product options.
By retail product options, I refer to things like “Critical Peak Pricing” (e.g., rates increase to discourage usage on hot summer afternoons when power is expensive for customers who want to make use of such incentives); time-of-use rates; electric vehicle charging rates to encourage off-peak charging; aggregated battery storage, demand response or other load-shifting programs (which could be facilitated through Community Power Programs at the local level); time-based net metering tariffs (for generators and for energy storage); or any other number of energy products a business might customize for an energy user to better manage cost/load.
Retail products are by nature, market-based. But markets require competitive access to information and data. This is why the Statewide Energy State Platform shows such promise: it would use modern technology to grant market actors greater access to useful data about energy consumption, so that markets can work their magic and find efficiencies to be gained and sold to customers. We get market selection of more cost-effective energy resources when the market place has useful

NH State Energy Strategy | Public Comment of Henry Herndon | June 7, 2021
4
information (e.g., smart-meters collecting real-time-data and billing systems that can bill customers based on time-of-usage, time-of-battery-discharge, etc.).
So what’s the solution? Mandate utilities invest in smart meters? No, probably not. The serious market fundamentalist would recommend “quarantining the monopoly” by stripping it of its metering and billing functions, which are not “natural monopolies,” and giving those functions to the marketplace .1 Similar to how we forced the monopoly to sell its generation assets to the market, the state could require that customers have the option of choosing market options for metering and billing. This could be done through competitive energy suppliers, community power aggregators, or individual customers and would encourage market selection of cost-effective energy resources.
Goal 8: Generate In-State Economic Activity Without Reliance on Permanent Subsidization of Energy
Comment: Support.
This is a good goal. We should pursue options to remove regulatory barriers to in-state economic activity, including power generation, that does not rely on any kind of subsidy, let alone permanent.
I will refer again to the ideas of Senate Bill 91, Part IV to amend the “Limited Electrical Energy Producers Act,” RSA 362:A. This change in policy creates opportunities for in-state development of energy generators, to sell to in-state energy buyers, at a negotiated/market-based price. Such projects would develop without any subsidy. Quite the contrary, such projects have great potential to reduce transmission costs for all New Hampshire ratepayers.
Unlike much of energy policy/regulation, this concept is intuitive.
For example. If a large New Hampshire municipality were able to develop a 3 megawatt energy project locally, and then contract directly for that power output, that power offsets the need to buy power from the wholesale market, which flows across the transmission lines. By enabling customers to build projects locally, the state can reduce load coming over the inter-state transmission grid. Transmission costs are the fastest growing bucket of costs. If buyers and sellers can develop local generation beneath the transmission grid, it lowers monthly transmission peaks, and lowers monthly transmission costs.
Amending of RSA 362:A is a strategy to support in-state economic activity and generation in a non-subsidized fashion.
Goal 9: Maximize the Economic Lifespan of Existing Resources While Integrating New Entrants on a Levelized Basis.
1 Giberson, M; Kiesling, L. 2017. “The Need for Electricity Retail Market Reforms.” Energy & Environment. Retrieved from: https://assets.realclear.com/files/2017/10/701_regulation-v40n3-4.pdf

NH State Energy Strategy | Public Comment of Henry Herndon | June 7, 2021
5
Comment: Neutral.
Goal 10: Protect Against Neighboring States’ Policies that Socialize Costs.
Comment: Support.
The best way to achieve this goal is to build up a New Hampshire energy marketplace. Several of the administration’s policies are geared towards this goal, including the development of a Community Power market and the Statewide Energy Data Platform. Additional policies that stimulate both “Retail Market Competition” (fancy new rates and distributed energy products for customers) and market-based project development at the 1 – 5 Megawatt scale. There needs to be a way to meet the enormous demand for in-state energy projects at 1-5 MW in scale. Many cities, towns and large energy users have clear demand for these projects, but policy barriers stand in the way. Net metering is one option. Amending “Limited Electrical Energy Producers Act” RSA 362:A is another option.
If New Hampshire can build up its retail market and its market for mid-level projects (1-5 MW), it will have more energy independence and be less prone to policies from Massachusetts and elsewhere.
If one were to levy criticism on New Hampshire’s energy policy, it is that the state has done very little to encourage market-based “peak-shaving,” “load-shifting,” and “load reduction.” Massachusetts and others have programs that are trying to shift load off peak, which can shift costs to other states like NH. If NH can improve markets to discourage peak-time-usage, or, encourage peak-time-generation locally, it can better protect itself from neighboring states policies.
Goal 11: Ensure that Appropriate Energy Infrastructure is Able to be Sited While Incorporating Input and Guidance from Stakeholders.
Comment: Neutral.
Conclusion: I support an energy policy that is market-based and seeks to remove regulatory barriers that are associated with monopoly regulation.
Thank you for your attention.
Sincerely,
Henry Herndon

10-Year State Energy Strategy Comments From The House Majority Office June 21, 2021 ● Prioritize policies that keep energy prices as low as possible for all Granite Staters.
● Focus energy assistance on lower income residents who spend a higher proportion of their
income on energy.
● Avoid energy subsidies whenever possible, particularly for high-income residents
● Pursue policies that keep the power on and protect it from attack by bad actors.
● Make sure government does not get in the way of energy innovation.
● Allow all forms of energy to compete for a customer’s dollars.
● Encourage energy efficiency by reminding citizens of their personal responsibility to minimize their energy footprint.
● Pursue energy efficiency in the state’s rental housing stock.
● Use energy policy, whenever possible, to grow New Hampshire businesses.
● Pursue government energy procurements that reduce taxes rather than increase them.
● Reduce existing energy subsidies.
● Work to protect New Hampshire ratepayers from attempts by other states to pass along their energy costs to the regional grid.
● Focus on reducing traffic related energy consumption and related pollution by minimizing traffic congestion.
● Improve the siting of energy infrastructure in the state. ● Promote the use and innovation of nuclear energy as a means of providing a zero-emission clean
energy source.
-- Rep. Jason Osborne House Majority Leader

June 22, 2021
Jared Chicoine
Director, New Hampshire Office of Strategic Initiatives
Governor Hugh J. Gallen State Office Park
Johnson Hall, 3rd Floor
107 Pleasant Street
Concord, NH 03301
Dear Mr. Chicoine,
Thank you for the opportunity to provide comments regarding the development of New Hampshire’s 10-Year
Energy Strategy.
Liberty is New Hampshire’s largest natural gas distribution utility, serving more than 98,000 customers in 31
communities, primarily within New Hampshire’s busiest economic corridor along I-93. Liberty also provides
electric service to 44,000 customers in 21 communities, primarily in the Salem area and the Upper Valley.
We recognize the challenges and opportunities presented by the rapid transformation already underway in the
global, national, and regional energy marketplace, and we believe New Hampshire’s 10 Year Energy Strategy
must be forward-thinking and innovative to ensure all Granite Staters have access to affordable, safe, reliable,
and sustainable energy services into the future. The technological advancements happening today in the energy
sector will be no less transformational than the tech revolution that created smartphones and high-speed
internet. Over the next decade every aspect of our energy economy -- from the fuels we need to stay warm in
the winter and support critical industries like manufacturing, to the electricity we need to keep the lights on and,
increasingly, power our transportation fleet and buildings -- will be touched by this market transformation,
whether New Hampshire takes action or not. We therefore urge you to adopt policies and strategies that will
position New Hampshire to capitalize on new technologies in order to lower energy costs and create good local
jobs, while ensuring policy and market forces outside of New Hampshire don’t force families and businesses to
pay even more for their energy.
We are pleased to provide several recommendations for your consideration below, which speak to what New
Hampshire can do in this 10 Year Energy Strategy to balance transformational technologies while working to
bring about lower energy costs, enhanced resiliency and reliability, and better pathways to meet Granite Staters’
energy needs today and into the future.

Plan for the Future of Building Heat and Thermal Energy
Keeping New Hampshire homes and businesses warm in the winter must be a central focus of the 10 Year
Energy Strategy. Thermal energy – that is, the primary energy used to generate heat for homes, commercial
buildings, and industrial processes – is the largest component of New Hampshire’s annual energy consumption.
According to data from the EIA1, thermal energy represents 43% of New Hampshire’s end-use energy
consumption, followed by transportation fuel consumption at 41%, and electric power consumption at just 15%.
In New Hampshire, natural gas is the lowest-cost, cleanest, safest, and most reliable way for customers who can
access it to heat their homes and businesses, adding significant value to the state’s economy. Gas distribution
infrastructure is reliable -- the average gas customer experiences a gas outage once every 112 years. 2 The gas
system also adds resiliency to our overall energy system, providing needed fuel diversity and helping balance
intermittent renewable power production. And gas distribution infrastructure is flexible, able to deliver the fuels
of the future like hydrogen and renewable natural gas (RNG) as well as conventional natural gas. Utility-provided
gas will be an important fuel for New Hampshire’s building heat, industrial, power generation, and
transportation sectors even beyond 2050. Therefore, ensuring Granite Staters who want gas can get it should be
an important policy priority for the state.
Over the next decade, thermal energy technologies with the potential to complement natural gas are likely to
scale up, putting new opportunities in play that create additional value for New Hampshire utility customers. We
urge you to consider policy and regulatory frameworks that enable utility investment in emerging thermal
energy technologies as well as necessary conventional infrastructure in order to capitalize on these emerging
technologies, create local jobs producing local energy, and ensure customers pay the least over the long term to
safely and reliably heat their homes and businesses.
Hydrogen
Hydrogen is a flexible energy carrier which can be delivered by existing gas networks to provide building and
process heat, fuel for power generation and transportation, and flexible, long-term energy storage. President
Donald Trump’s Department of Energy developed and implemented a Hydrogen Program Plan, calling hydrogen
“a versatile fuel that offers a path to sustainable long-term economic growth,” which can “add value to multiple
sectors in the economy and support America’s ongoing manufacturing renaissance.” The Trump plan aims to
“develop the technology that can enable a hydrogen transition in the United States.”3 President Biden’s
Department of Energy is continuing the federal commitment to hydrogen, targeting federal research and
development to make hydrogen economically viable in the near term.4 The bipartisan consensus on hydrogen is
an important signal that this technology will play a major role in the future of energy. We urge you to consider
the role of hydrogen in New Hampshire’s energy future, and to develop policy and regulatory frameworks that
enable New Hampshire’s utilities to incorporate hydrogen into their long-term plans.
1 https://www.eia.gov/state/seds/seds-data-complete.php?sid=NH#Consumption 2 https://www.gti.energy/wp-content/uploads/2018/11/Assessment-of-Natural-Gas-Electric-Distribution-Service-Reliability-TopicalReport-Jul2018.pdf 3 https://www.hydrogen.energy.gov/pdfs/hydrogen-program-plan-2020.pdf 4 https://www.energy.gov/articles/secretary-granholm-launches-energy-earthshots-initiative-accelerate-breakthroughs-toward

Renewable Natural Gas
RNG from landfills and a variety of local feedstocks like agriculture and forestry waste offers meaningful
opportunities for New Hampshire to generate local clean energy, meet customer demand for renewable fuels,
and mitigate cost and resiliency risk from exposure to pipeline capacity constraints and volatile peak natural gas
prices. Governor Sununu’s leadership and support for RNG by signing bipartisan legislation (SB577) in 2018 was
an important step forward, helping enable New Hampshire’s first utility RNG project in Bethlehem. Liberty is
partnering with Casella and RUDARPA to develop the Bethlehem project, which broke ground in May 2021. This
project alone will produce enough fuel to meet six percent of Liberty’s New Hampshire customers’ demand for
natural gas. Demand for RNG from Liberty customers in New Hampshire, including businesses of all sizes,
institutions, and residential customers, is significant and growing. Liberty encourages the inclusion of policies in
the 10 Year Energy Strategy to enable RNG development, such as authorizing utilities to sign long-term contracts
for RNG supply, in order to realize the full potential of RNG in New Hampshire.
Heat Pumps
Electric, gas-fired, and geothermal heat pumps have the potential to lower costs, increase efficiency, and
improve the sustainability profile of New Hampshire’s thermal energy system. Liberty agrees with New
Hampshire Consumer Advocate D. Maurice Kreis that electric heat pump deployment ought to be targeted in
the first instance at customers who are not able to access natural gas, 5 but Liberty also recognizes the potential
for New Hampshire’s gas utilities to help deploy heat pumps to customers who want them. Liberty encourages
the inclusion of policies in the 10 Year Energy Strategy to authorize gas utility programs for deploying heat
pumps and district geothermal heating loops, which will expand customer choice for building heat systems.
Reaffirm New Hampshire’s Commitment to Energy Efficiency
The lowest-cost energy is the energy you don’t use, making energy efficiency the most valuable energy resource
available to utilities, customers, and the state. For more than two decades, New Hampshire’s utilities have
offered energy efficiency and demand response programs to utility customers, providing energy savings,
promoting economic development, reducing the need for costlier investments, and protecting the natural
environment.
New Hampshire’s energy efficiency programs are highly effective and incredibly valuable. Since 2002, New
Hampshire’s utility-administered energy efficiency programs have generated cumulative customer savings of
more than $3.4 billion6. According to the rigorous “Granite State Test” methodology approved by the New
Hampshire Public Utilities Commission in 2019, every $1 spent on energy efficiency programs under the
proposed 2021-2023 Triennial Energy Efficiency Resource Standard (EERS) Plan will save New Hampshire utility
customers $2.55.
Energy efficiency lowers the cost of doing business in New Hampshire, creates good jobs with local companies
who provide energy efficiency services, and puts more money in all Granite Staters’ pockets. Liberty is proud to
do our part to administer New Hampshire’s enormously successful energy efficiency programs, and we urge you
5 http://indepthnh.org/2020/07/31/granite-bridge-2-0-progress-at-last-on-natural-gas/ 6 https://www.puc.nh.gov/Regulatory/Docketbk/2020/20-092/INITIAL%20FILING%20-%20PETITION/20-092_2020-09-01_NHUTILITIES_EE_PLAN.PDF

to include a commitment to the long-term viability and efficacy of utility-administered energy efficiency
programs in the 10 Year Energy Strategy.
Support Utility Investment in Energy Storage and Distributed Energy Resources
Distribution utilities can play a vital role in deploying a wide range of innovative technologies which can
contribute to reductions in peak demand and regional transmission costs. Liberty’s first-of-its-kind behind-the-
meter battery storage pilot program in New Hampshire, developed in partnership with Tesla, is one example.
Utility investment in other energy storage technologies, including utility-scale battery storage and natural gas
storage, as well as other distributed energy resources, also has the potential to lower costs and enhance
reliability and resiliency for customers. We urge you to consider policies to encourage more utility investment in
these technologies to create greater long-term value for customers.
Optimize Gas and Electric System Planning Processes
New Hampshire’s existing Integrated Resource Plan (IRP) framework is a remnant from the time when vertically
integrated utilities were responsible for planning and operation of generation, transmission, and distribution of
electricity. Updating this process to recognize the fully restructured electricity market and the unique system
planning needs of the gas system would result in better outcomes and new choices for customers. Liberty
believes that enhanced stakeholder input during the system planning process may improve outcomes as well.
Support the Expansion of Electric Vehicle Infrastructure
As more Granite Staters choose electric vehicles, New Hampshire’s infrastructure, policies, and regulations must
keep pace. Electric utilities are well-positioned to help the state meet consumer demand for electric vehicle
infrastructure through new rate offerings and partnerships with private entities to increase investment in
needed infrastructure. Liberty currently offers a time-of-use rate plan7 for electric vehicle charging, and is
partnering with businesses in our electric service territory to deploy charging stations. New policies such as
allowing utility investment in certain “make ready” infrastructure would further enhance electric vehicle
infrastructure deployment in New Hampshire.
Integrate Hydrogen into Offshore Wind Strategies
Liberty applauds Governor Sununu’s creation of an offshore wind commission and offshore wind industry
development office. The massive potential for wind power generation in the Gulf of Maine is a once-in-a-lifetime
opportunity for economic development for New Hampshire. Recognizing that hydrogen is expected to become a
vital part of the energy system in coming years, we urge you to consider initiatives to build partnerships with
offshore wind developers to produce hydrogen from off-peak power generation right here in New Hampshire.
Hydrogen can serve as a highly flexible storage medium for offshore wind power, with seasonal storage
7 https://new-hampshire.libertyutilities.com/uploads/Rates%20and%20Tariffs/Electric%202020/2020-08-01%20GSE%20Tariff%20No.%2021.pdf

capabilities that dwarf the intra-day storage capacity of batteries. If combined with policies and regulations to
enable integration of hydrogen into the gas distribution system, encouraging local production of hydrogen from
offshore wind has the potential to jumpstart an entirely new industry in New Hampshire while reducing reliance
on out-of-state energy sources.
Thank you again for the opportunity to provide these comments. Liberty stands ready to work with OSI,
Governor Sununu, the legislature, and any other interested stakeholders to support the development of a 10
Year Energy Strategy to meet New Hampshire’s energy needs into the future.
Sincerely,
Neil Proudman
President, Liberty-NH

1
New Hampshire Office of Strategic Initiatives
NEPGA Written Comments
10-Year State Energy Strategy Update
June 4, 2021
The New England Power Generators Association (NEPGA)1 appreciates the opportunity to provide written comments to the Office of Strategic Initiatives (OSI) regarding its update of the 10-Year State Energy Plan (SES). As the OSI reviews the 2018 SES in preparation for the 2021 SES, NEPGA urges it to consider the contributions of the region’s competitive wholesale markets to support New Hampshire’s energy policy.
NEPGA is the trade association that represents competitive electric generating companies in New England. NEPGA’s member companies account for over 90% of all generating capacity throughout New England – and over 4,000 MW in New Hampshire. NEPGA’s member companies invest in a broad array of generation technologies in New Hampshire and New England, including nuclear, natural gas, coal, oil, hydro, wind, solar, and energy storage. NEPGA companies provide thousands of well-paying, highly skilled jobs to the state’s workforce, pay millions of dollars in state and local taxes, and contribute millions of dollars in income taxes paid by employees. The 2018 SES The 2018 SES outlined a number of goals to improve New Hampshire’s energy policy and meet the needs of its consumers. Those goals include: prioritize cost-effective energy policies; ensure a secure, reliable, and resilient energy system; adopt all-resource energy strategies and minimize government barriers to innovation; maximize cost-effective energy savings; achieve environmental protection that is cost-effective and enables economic growth; government intervention in energy markets should be limited, justifiable, and technology neutral; encourage market-selection of cost-effective energy resources; and generate in-state economic activity without reliance on permanent subsidization of energy. New England’s wholesale electricity markets have helped New Hampshire achieve those goals through a system designed to procure a reliable supply of electricity at the lowest possible cost. Through the wholesale markets, private investors, guided by transparent price signals, seek the most innovative and efficient means to produce electricity in order to seek a competitive advantage. The result is lower wholesale electricity prices for New Hampshire consumers, continued system reliability, innovations and efficiencies that have contributed to lower carbon dioxide (CO2)
1 The comments expressed herein represent those of NEPGA as an organization, but not necessarily those of any particular member.

2
emissions, and critical support for New Hampshire’s and the broader region’s economies – all without reliance on ratepayer-backed subsidies. However, changes are already underway that leave uncertain the prospects for the continuation of these benefits. As federal policies evolve toward greater state deference and state policies focus on supporting individual resources, the regional electricity market must make concurrent changes to preserve market-based reliability. Failure to do so will lead down the path toward cost-of-service contracts that put consumers on the hook for a less efficient and higher cost electric grid.
Restructuring and the Benefits of Competition In 1996, New Hampshire enacted legislation to restructure its electricity industry for the benefit of its consumers. Other New England states, except Vermont, passed their own restructuring acts, setting the foundation for a regional competitive wholesale electricity marketplace. Prior to restructuring, the monopoly electric utilities that owned and operated power plants were largely insulated from competition and could rely on ratepayers to finance generation facilities through utility rates, effectively guaranteeing cost recovery and a rate of return. Utilities had little or no incentive to build and maintain efficient and cost-effective generation resources to reliably supply the region’s electricity needs. New Hampshire knows well the downside of rate base investment in utility-owned generation assets. In fact, ratepayers continue to pay for those costly decisions. In 2006, Public Service of New Hampshire (now known as Eversource Energy), then the owner of the Merrimack Station coal-fired power plant in Bow, sought and received legislative approval for what Eversource estimated would be $250 million for a scrubber to reduce sulfur dioxide emissions from the plant. Instead, the costs for the environmental controls ballooned to $420 million – a 70% cost overrun. Eversource was not only entitled to recover the $420 million in cost overruns from its New Hampshire ratepayers, but it also earned a 9.81% rate of return. Following full implementation of restructuring, utilities in New Hampshire and across most of the region divested themselves of their generation assets to focus on transmission and distribution services. Merchant generators now compete on a level playing field to produce the most cost-effective and efficient outcomes. Importantly, utility ratepayers no longer assume the risk that investments in generation assets could prove more costly than anticipated or altogether uneconomic.2
2 In 2015, a report prepared for the New England States Committee on Electricity (NESCOE) reviewed the objectives of restructuring in New England. That report highlighted the transfer of risk from ratepayers to private investors as a primary rationale for the states’ support for restructuring and a move to market competition. See Reishus Consulting, LLC (prepared for NESCOE), Electric Restructuring in New England – A Look Back, December 2015, p. 21.

3
New Hampshire’s electricity consumers have since reaped the economic benefits of a competitive market. Since 2004, wholesale energy prices in New England have declined by 51%. That means that a dollar spent on electricity supply in 2004 costs only 49 cents today. In fact, the average annual wholesale electricity price in 2020 was $23.37/MWh, the lowest price since full implementation of the region’s competitive markets in 2003 (when calculated in 2020 dollars).3 While other portions of a typical New Hampshire electric customer’s utility bill have increased over the years, wholesale energy price reductions have translated to real savings for the state’s consumers.4
The competitive markets have also ensured reliability at least cost through the addition of 9,627 MW of new generation capacity at historically low prices.5 The most recent Forward Capacity Auction (FCA) yielded 950 MW of increased generation investments and nearly 600 MW of new energy storage resources cleared the auction. These investments are the result of market price signals that incentivize investment in resources – both new and existing – where and when they are needed, providing the region with resource adequacy and other critical reliability services.
3 https://www.iso-ne.com/static-assets/documents/2021/03/new_england_power_grid_regional_profile.pdf; Adjusted to 2020 dollars 4 By comparison, New England transmission rates have increased by over 650% since 2004. https://www.iso-ne.com/markets-operations/settlements/tariff-rates 5 https://www.iso-ne.com/about/key-stats/markets#fcaresults
0
0
20
30
0
0
0
0
0
0
00
0

4
In addition, competitive market forces, coupled with low-cost fuel and certain public
policies, have also resulted in a cleaner, more efficient fleet of power plants in the
region. Since 1990, power plants in New England have cut CO2 emissions by 50% – the
most of any sector of the economy over the same period – according to recent data
released by the U.S. Energy Information Agency.6 Much of these reductions can be
attributed to the innovations and efficiencies driven by private investment in the region’s
power plants following the restructuring of the region’s electricity industry. Since ,
the efficiency for power plants in New England improved by 22% - the equivalent of
closing one of every five plants while providing the same amount of electricity output. In
2000, 40% of the electricity produced in New England was generated from coal and oil
resources. Today, coal and oil plants together account for less than % of the region’s
resource mix.7
St t P t R ’ C m t t k t In recent years, several New England states have enacted legislation directing the procurement of renewable and zero-carbon resources, largely through long-term contracting, to help achieve their respective greenhouse gas reduction mandates.
6 https://www.eia.gov/environment/emissions/state/ 7 https://www.iso-ne.com/about/key-stats/resource-mix

5
Analysis conducted in 2018 found that state-supported resources are on track to comprise over 0% of the region’s generation mix by 20278 – an amount that is clearly understated given recent legislation requiring more out-of-market procurements. The effect of these state-supported resources on the region’s competitive wholesale electricity markets is two-fold. First, the introduction of state policy resources will displace existing competitive resources, including those that will be needed for their unique reliability aspects and their ability to meet state environmental needs in a cost-effective manner. Second, state-supported resources will likely bid into the Energy Market as price takers (i.e., at $0/MWh), putting downward pressure on the Energy Market prices that merchant generators rely upon to continue operations and make capital investments in existing facilities. These resources operate in the market without revenue or cost guarantees, and without consumer-backed long-term contracts, leaving them reliant on a fair and competitive market. Price suppression in the market has very real consequences for the viability of these facilities to continue to reliably supply New Hampshire and the region with electricity and to enable a decarbonized future. State procurements of renewable and zero-carbon resources have also created tensions in the Forward Capacity Market (FCM). Some New England states have questioned the ability of the FCM to facilitate the entry of new state-supported clean energy resources, leading those states to turn to long-term contracting to meet their policy mandates. In particular, these states have called for a re-examination of the Minimum Offer Price Rule (MOPR), a market mechanism that sets a floor price for offers in the FCA based on a calculated competitive offer benchmark for a given resource’s technology type. The MOPR is designed to prevent the artificial suppression of FCM clearing prices by accounting for resources that receive a revenue stream or other subsidy outside the competitive markets. The MOPR ensures that only the lowest-priced resources will be selected on a transparent and competitive basis to meet the region’s reliability needs three years in the future. As a consequence, state policy resources that receive revenues through ratepayer-funded long-term contracts are mitigated in the FCA and may not be selected in the auction to receive a Capacity Supply Obligation. Nonetheless, states continue to procure clean energy resources outside the wholesale electricity markets. Without market-based changes, the impact of price-taker resources in the energy and capacity markets could lead to what ISO-NE has termed as a “disorderly” retirement of plants that will be needed for resource adequacy and reliability for years to come. The result is lower revenues for existing generators – particularly newer, more efficient, and flexible units – that run less, as well as price-taking baseload units. A plant that is displaced by a state-supported resource will run less often, which makes it more reliant on the FCM and the Ancillary Services Market to recoup lost Energy Market revenue. Even when those units do run, they can be expected to earn fewer revenues from lower Energy Market prices or potentially no revenues at all in the case of marginal units. That could then drive another round of reliability cost-of-service contracts. Additionally, there is the risk of a “Green Gap,” as existing low- and zero-carbon resources experience the same price suppression faced by traditional generation, yet are excluded from revenue
8 https://nepga.org/2018/11/report-on-new-england-electricity-market-out-to-2027/

6
streams favoring new generation, are forced to retire. That outcome raises the very situation that gave rise to the development of the FCM in the first place and is a costly and inefficient outcome that NEPGA believes both generators and New Hampshire would prefer to avoid. In February 2019, ISO-NE implemented Competitive Auctions with Sponsored Policy Resources (CASPR), a mechanism in the FCA that balances state policies and the competitive markets by coordinating the entry of state policy resources and the retirement of existing capacity resources. However, CASPR only addresses a transitional phase of meeting state laws. It does not provide a long-term solution that deals with the central issue: how to value state policies in the market to facilitate entry of resources to help the states meet their respective mandates. Currently, NEPGA and other stakeholders in the New England Power Pool (NEPOOL) are participating in the Future Grid Initiative, an examination of pathways to better align the competitive markets with state policy mandates and goals.9 The effort reflects stakeholders’ acknowledgement that the region’s electric grid is fundamentally changing with increasing amounts of distributed generation, intermittent renewables, and load reduction and shifting, all of which challenge current market design. Stakeholders will conduct analysis to predict the kinds and quantities of resources that will be necessary to meet the New England states’ decarbonization targets, most of which must be met by 2050. Based on that predicted future resource mix, stakeholders will identify any gaps to reliably operate the region’s bulk power system, along with changes in market design that are needed to procure those missing reliability needs. NEPGA has also joined New Hampshire and other New England states in the New England Energy Vision process in stakeholder discussions on a future wholesale market design to help states accomplish their respective requirements but ensure that the integrity and benefits of the region’s wholesale electricity markets are preserved for the long-term. The alternative is continued reliance on costly out-of-market constructs, like long-term contracting for handpicked resources. That trend is now finding its way into New Hampshire with the introduction this session of SB151, a bill that would mandate the procurement of up to 800 MW of primarily offshore wind resources under contracts as long as 30 years.10 SB 151 would upend the principles of restructuring by committing New Hampshire’s utility ratepayers to finance the costs of new generation facilities, including the risk that investments that appear attractive today could prove costly, inefficient, or obsolete in future years. As noted above, New Hampshire has already experienced the pitfalls of rate base financing of generation. SB 151 would reverse a central objective of restructuring and once again require New Hampshire’s consumers to bear the risk for investments, this time in support of public policy goals. In addition, selected resources receiving long-term contracts under SB 151 would undermine the commercial viability of more cost-effective generation that provides system reliability as well as low- and zero-carbon resources – including some located in
9 https://nepool.com/future-grid-initiative/ 10 SB 151, An Act Relative to Renewable Energy Procurement (introduced February 4, 2021).

7
New Hampshire. For generators that depend on the competitive markets to earn sufficient revenues to maintain operations, that means the lost market opportunities will have to be made up somewhere else, potentially through other consumer-guaranteed contracts. Over time, the situation only becomes more challenging as additional state-supported resources enter the region’s power system, further distorting market pricing and the cost benefits for New Hampshire’s and other New England states’ consumers. A Path Forward To meet the current challenge, tomorrow’s electricity system must be able to both better internalize state policy requirements for clean energy, while evolving to deliver the products and investible framework to preserve reliability.
NEPGA has focused over the last several years on carbon pricing to better integrate state policies into the market. That is the most efficient way to meet the decarbonization mandates in other New England states. NEPGA, however, recognizes that New Hampshire does not have such a legal requirement, and other market-based mechanisms may be more appropriate to best meet state needs while leveraging the wholesale electricity market. A future wholesale market design must also ensure continued reliability as the system evolves to include increasing amounts of variable, weather-dependent renewable resources. A report from Energy + Environmental Economics (E3) and Energy Futures Initiative (EFI), led by former U.S. Secretary of Energy Ernest Moniz, finds that current New England states’ laws to decarbonize across the economy will require “the addition of large amounts of wind, solar, and battery storage resources, complemented by firm capacity to provide generation during extended periods of low wind and solar availability. Firm capacity includes natural gas power plants, nuclear, hydrogen generation, or other yet-to-be commercialized options such as long-duration storage.”11
NEPGA has long called for a review of the wholesale market to ensure that the products are best aligned with the needs of the system based on changing consumer usage and a new resource mix. That review is ongoing.12 Nevertheless, NEPGA is supportive of the focus on effective load carrying capability (ELCC) and to best recognizing the reliability benefit of resource types – both new renewables, as well as other existing resources. This work becomes even more critical as electricity is increasingly used to power our lives and support our economy. With increased electrification of transportation, and growing reliance on electricity for home heating, reliability takes on even greater
11https://static1.squarespace.com/static/58ec123cb3db2bd94e057628/t/5fd2997d26324029a116f9b4/1607637387632/E3+EFI_Report+New+England+Reliability+Under+Deep+Decarbonization_Full+Report_November_2020.pdf 12 https://www.iso-ne.com/static-assets/documents/2021/02/npc-20210218-chadalavada-presentation-r.pdf

8
importance. As the experiences in California and Texas over the last year have shown us, reliability must always remain job one. Conclusion NEPGA strongly believes in the benefits of a regional marketplace with economies of scale, efficiency of cross-border trade, and an independently-administered market. As OSI charts a course for the SES, the wholesale electricity markets can and should remain the foundation for achieving New Hampshire’s energy goals for the next ten years and beyond.
NEPGA appreciates New Hampshire’s leadership and continued engagement in supporting a strong economic foundation to provide competitive pricing for consumers, reliability, a cleaner environment, and market-based investments.

June 25, 2021 NH Office of Strategic Initiatives Re: State Energy Strategy 107 Pleasant Street Johnson Hall, 3rd floor Concord, New Hampshire 03301 Dear Office of Strategic Initiatives: Eversource Energy is pleased to submit these comments in response to the Office of Strategic Initiatives’ (OSI) request, per RSA 4-E:1, to develop an updated energy strategy for the State of New Hampshire. Eversource believes that an effective long-term energy strategy should be balanced to respond to the expressed desires and the energy needs of all our customers with the goal of rebuilding from hardships encountered in 2020 and supporting robust economic growth in New Hampshire and statewide prosperity over the next ten years. We take our responsibility to provide safe, reliable service to our customers while being responsible environmental stewards very seriously, and we’re focused every day on innovative solutions to reduce costs, enhance reliability and advance clean energy for our customers. From our nationally recognized energy efficiency programs and our own industry-leading goal to achieve carbon neutrality in our operations by 2030, to electric vehicle infrastructure, energy storage and offshore wind, we are committed to serving as a catalyst for clean energy and a leader in helping the region meet its energy goals in a cost-effective manner. We cannot achieve our shared energy goals with a narrow focus on any one issue, and it is with great honor that I submit these comments on a wide range of key energy policy objectives to help meet the needs of our people and businesses and spur economic development. At its foundation, an effective long-term energy strategy will strive toward energy equity for all customers, avoiding unnecessary cost-shifting and ensuring that all customers – not just certain groups of customers – can share in the benefits of our clean energy future. As such, these comments were developed with thoughtful consideration to balance the imperative that all customers have the opportunity to access a clean energy future with the reality that cost remains a barrier for many. Continued input from our customers is a critical part of those efforts, and these comments are aimed at representing the needs and concerns of those customers – residential and commercial, low-income to the most affluent, from all corners of the state – to ensure that an updated energy strategy is ambitious, attainable, and cost-effective. We believe that Eversource is uniquely positioned to help New Hampshire move toward a smarter grid that advances clean energy while
780 N. Commercial Street P.O. Box 330 Manchester, NH 03105-0330 Joseph A. Purington President, Eversource New Hampshire Operations 603-634-2259 [email protected]

2
keeping customers’ costs as low as possible, and these comments reflect our commitment to a clean energy future that best serves all of our customers. Baseload Fuel Diversity Ensuring that the region has enough cost-effective baseload generation to meet the energy demands of customers across the region is the foundation of safe, reliable service. It’s no secret that much of the region’s traditional baseload generation has gone offline in recent years or is scheduled to be taken out of service soon, including the vast majority of dirtier fossil fuels like coal. While this is an important objective for the region that clearly has numerous environmental and other benefits, there is still a significant gap that needs to be filled to ensure that the grid is protected and has the capacity to always meet the energy needs of our people and businesses in a cost-effective manner so that they continue to have the opportunity to grow and thrive. Many of our high-tech manufacturers in New Hampshire and countless other innovative companies across the state depend on absolute reliability, or “perfect power,” to maximize their success. This constant reliability is also critical to those who work or learn from home, as the pandemic made clearer than ever. We cannot sacrifice reliability, nor can we pursue solutions without regard to cost – and a balanced and efficient regulatory structure is necessary to developing the diversified fuel mix and the adequate supply of baseload generation that will ensure all customers have the safe, reliable service they need. New Hampshire has a long history of learning from the mistakes of other states when it comes to energy policy. One does not have to look far to see the consequences of ignoring the need for a secure and sustainable baseload energy supply. Rolling blackouts in California and the failure of the Texas power grid this past winter, as well as its continuing struggles into this summer, highlight the necessity of focusing on clean energy options that look like baseload power plants. We are very pleased to see the movement toward the potential for offshore wind in the Gulf of Maine, and we urge the administration to seek other opportunities for clean, affordable baseload generation. Much of the focus up to this point has largely been on small-scale renewable generation, which must be balanced with more clean baseload sources if we are to truly achieve a clean energy future.
Renewable Energy Eversource continues to support New Hampshire’s ongoing efforts to advance the diversification of its energy resources, including the development of renewable energy resources like solar and wind. With significant advances in technology continually coming to the forefront, New Hampshire has the opportunity to benefit from the lessons learned in clean energy development in other states and to make well-informed decisions on the adoption of cost-effective clean energy resources to reduce carbon emissions from the state’s baseline and peak demand. Eversource is eager to share its experience pursuing cost-effective clean energy strategies and to leverage our expertise and insight from our electric vehicle, solar, offshore wind, and battery storage initiatives in other states. In Massachusetts, we’re constructing a state-of-the-art, utility-scale battery storage project in Provincetown that will soon be put into service. In particular,

3
battery storage can be a critical catalyst for more resilient clean energy, helping to ensure that we can maximize the benefits of intermittent renewable resources when the sun isn’t shining or the wind isn’t blowing while enhancing system resiliency as an important source of back-up power. Learning from, and building upon, these kinds of utility-scale and utility-directed investments will likely bring similar benefits to New Hampshire customers. Additionally, Eversource is proud to be a national leader in offshore wind development through our partnership with Ørsted. Offshore wind is more than a clean energy alternative; it is also a reliable energy source, particularly in winter when New England infrastructure is most challenged. Due to advances in offshore wind turbine technology combined with an increase in the scale of offshore wind projects and federal tax incentives, the price of offshore wind has fallen significantly. Over the next few years, Massachusetts, Rhode Island, and Connecticut plan to further procure renewable energy from offshore wind adding more clean energy to the New England grid. These large-scale procurements of offshore wind have the potential to lower costs, which will benefit all New England states including New Hampshire. Adding to these efforts, the federal government has indicated its broad support for the development of new clean energy resources like offshore wind. Focus of the federal government to incentivize offshore wind combined with procurements by New England states will offer opportunities to New Hampshire as it pursues a deliberative and affordable approach to this clean energy adoption. Eversource also has experience developing new low-income community solar models that ensure our most vulnerable customers see the benefits of clean energy development, and we can use lessons learned to help New Hampshire grow its solar market while also reducing energy cost burdens for customers who struggle to pay their energy bills. While there is still much to be learned from renewable energy development and efforts to find efficiencies and to lower costs, New Hampshire should employ existing and emerging lessons to develop tailored clean energy solutions for the people and businesses of the state. Ideally, such solutions will provide substantial renewable baseload and cost-effective, grid-reliable sources to New Hampshire’s energy mix. Eversource supports the furtherance of New Hampshire’s endeavor for a cleaner energy future and hopes the State can generate a plan for cost-effective large- and small-scale renewable energy projects that will redound numerous benefits to its residents. Transmission Grid Investment Eversource’s high-voltage electric transmission system plays an essential role in connecting customers across New England with reliable and affordable power, while also helping facilitate a clean energy future. The investments we are making in transmission ensure the reliable delivery of power from a diverse mix of cost-effective generation sources and make our infrastructure more resilient to extreme weather. For decades, Eversource has been working to improve the reliability of the regional electric system so that power can flow efficiently from the source of generation to end-use customer locations. We have preserved reliability while allowing over 6,000 MW of baseload generation to retire since 2000. Recent improvements include the Seacoast and Merrimack Valley

4
Reliability Projects, which answered the urgent need to strengthen the electric system and ensure the continued reliable delivery of energy to major population centers in New Hampshire. Our current project work in the state is focused on making an aging grid infrastructure more reliable, flexible, and resilient to New England’s wide range of weather conditions. We are also ensuring that the grid is evolving to meet the needs of the future, including the growth of both large- and small-scale clean energy and the electrification of the transportation and building sectors. With these considerations in mind, and with proper support, we can plan forward-looking transmission solutions that ensure reliability, achieve future cost savings, and reduce the impact to the surrounding environment. Underlying all our transmission project work is a commitment to working openly and maintaining two-way communication with all of our stakeholders from the early stages of a project through its completion. Distribution System Reliability and Resiliency A reliable and resilient electric distribution system is vital to all aspects of the energy future for the residents and businesses in the State of New Hampshire, and we continue to pursue investments to replace antiquated infrastructure with stronger poles, covered wire, distribution automation like smart switches, and other newer materials and technology to reduce the number and duration of power outages experienced by our customers. These upgrades also aid in the integration of Distributed Energy Resources into the electric distribution system. Electric Vehicle Infrastructure Adequate electric vehicle supply equipment (EVSE) in New Hampshire, especially direct current fast chargers (DCFC) along major travel corridors in the state, is necessary to enable electric vehicle (EV) travel to, within and through New Hampshire. Furthermore, availability of adequately spaced EVSE along the state’s major travel corridors is essential to overcome EV battery “range anxiety” to enable broader adoption of EVs by New Hampshire residents. As manufacturers continue to introduce a wider variety of EV models that will be available to consumers in the coming years, drivers will be best served if New Hampshire’s EV charging market supports multiple business models, generates new jobs, encourages innovation and competition in equipment and networks services, and supports travel and tourism. Utilities are uniquely positioned to enable strategic electrification as part of larger investments in grid modernization capabilities, specifically investments in EV charging infrastructure. Utility investments in EV charging infrastructure can address the limited availability of public charging stations, the upfront cost of charging infrastructure, and a lack of consumer awareness about EVs. Through such investments, utilities can accelerate charging infrastructure deployment, enabling greater EV adoption and easing or removing range anxiety for travelers to and through New Hampshire.

5
Through one of the nation’s leading and most rapidly executed large-scale EV charging programs, Eversource has demonstrated its proficiency in charging infrastructure deployment in neighboring states. Our “Make Ready” model has enabled 2,700 EV ports since 2018 and we expect to reach our goal of 3,500 this summer – a year ahead of schedule. As proposed to the NH PUC in its Docket No. DE 21-078, Eversource is prepared to support efficient and effective expansion of EVSE along travel corridors with another “Make Ready” model, by assisting with site selection and installing infrastructure to support the deployment of DCFCs, particularly where it is needed to fill gaps in those corridors, and helping to effectuate and augment the Beneficiary Mitigation Plan. Additionally, Eversource is actively pursuing solutions to ensure that EV load is managed in a way that is beneficial to the electric distribution system and all electric customers. As more and more drivers adopt EVs, which could increase load and demand, such increased adoption will only accentuate the importance of cost-effective solutions for baseload generation and renewable energy. Energy Efficiency Eversource is proud of its role as a national leader in administering and delivering robust, cost-effective energy efficiency programs to its customers. As part of the NHSaves energy efficiency programs, Eversource and its utility partners have been recognized time and time again for delivering award-winning programs and energy savings.
Energy efficiency programs are the lowest-cost solution for meeting the next unit of energy consumption. It has been and continues to be less expensive to invest in energy efficiency and reduce consumption than it is to add incremental generation onto the electric system to meet evolving energy needs. Offerings and measures are available to municipalities, businesses and residences of all sizes and demographics across the state. To name a few, measures are available to aid customers with heating and cooling, weatherization, appliances, other equipment, and lighting. Additionally, there is a dedicated subset of funding that is strictly used for aiding low-income customers throughout the state so that all residents have access to and benefit from these programs. Funding collected from each sector contributes to the low-income program and remaining funding is directed at projects within their respective sectors; residential budgets are enabling residential projects and C&I budgets are enabling C&I projects to be completed. Due in part to the continued success of the NHSaves programs, the residential lighting market has substantially transformed. Many customers now own efficient lighting and have access to a plethora of efficient bulbs at affordable prices.
Since the EERS framework was adopted by the NHPUC and the first triennial plan began in 2018, the NHSaves programs have provided services to over 1.4 million participants, saved over 4 billion lifetime kWh, saved over 14 million lifetime MMBTUs and created a lifetime benefit valuation of over $570 million for the measures installed between 2018 and 2020. In their roles as administrators of the NHSaves programs, Eversource and the state’s other utilities will continue to pursue energy efficiency opportunities with the same rigor that enabled us to have

6
such a meaningful impact on the lighting market; will continue to evolve program offerings to meet market demand and spur customer adoption in new efficient technologies; and will continue to accrue these benefits for our customers and for our state.
We continue to believe that any energy strategy is incomplete without the inclusion of cost-effective energy efficiency and that such programs should be available and accessible to all customers.
Conclusion In closing, Eversource thanks OSI for the opportunity to provide input on the development of the next phase of the State’s energy strategy. We have a strong commitment to safely and reliably serving all our customers while providing affordable clean energy options and maintaining responsible environmental stewardship. As the largest electric utility in the State of New Hampshire, we care deeply about the future of our customers and are dedicated to meeting their energy needs in an equitable manner. We look forward to the opportunity to partner with OSI as the strategy is being considered and implemented. Sincerely,
Joseph A. Purington

BBP Comments to NH State Energy Plan June 25, 2021 1
New Hampshire Office of Strategic Initiatives
Burgess BioPower Written Comments 10-Year State Energy Strategy Update
June 25, 2021
I. Introduction
Burgess BioPower (“Burgess”) is a state-of-the-art biomass power plant which annually provides over 500,000 MW-hours of in-state, reliable baseload power to New Hampshire. Among the largest and most technologically advanced plants of its kind in the country, Burgess represents a $300 million investment in New Hampshire’s North Country. Burgess is located in the heart of the City of Berlin, on the site of the former Fraser Paper Pulp Mill and uses the most advanced combustion and emissions control technology to meet stringent emissions standards. Burgess operates as a baseload dispatchable generator and achieves availability and capacity percentages of over 90%, among the highest solid-fueled facilities in the country. Unlike other renewable resources like solar and wind, Burgess’ power is not intermittent, but more closely comparable to baseload natural gas or nuclear resources. Thus, it provides the environmental benefits of renewable power along with the dependability of gas or nuclear. The annual statewide energy and economic benefits Burgess provides are significant:
• 240 jobs
• $14.6 million in labor income
• $69.1 million in output of goods and services o Burgess spends roughly $50 million within 50 miles of Berlin each year
• Annual net economic benefit to New Hampshire of more than $43 million
• 65% more jobs than an equivalent natural gas-fired plant
• $500,000+ in Renewable Energy Credit revenue sharing with the City of Berlin Supporting the long-term economic health of the North Country is a key priority for Burgess. Accordingly, Burgess has partnered with the City of Berlin to develop an economic development project to significantly improve downtown street infrastructure. Burgess will deliver waste heat in the form of hot water from the plant’s cooling system to a piping system to be installed under the downtown streets and sidewalks to keep them snow- and ice-free. In addition to attracting business and economic activity to the City, the project will reduce sand and salt use and the attendant dust and runoff, improve safety for people walking and driving in the downtown area, and reduce the City’s costs and motor vehicle emissions from snow removal activities. It also provides an excellent and replicable example of an independent power producer truly partnering with its host community to bring value and improve its performance. II. The State Should Focus on Competitive Transmission as a Main Driver in Energy Costs The update to the State Energy Strategy should focus its attention on competitive transmission. In late 2017, and as authorized by SB 125, Chapter 83:1, Laws of 2017, a committee of the New Hampshire

BBP Comments to NH State Energy Plan June 25, 2021 2
legislature prepared a comprehensive report studying “transmission, distribution, generation, and other costs in the state's electricity system.” Recommendations from the committee included: 1. advocating for competition in the development and construction of transmission projects to meet reliability needs; and 2. reducing transmission costs and other costs allocated to NH by increasing spending on rigorously validated, cost effective distributed generation, distributed resources, and energy efficiency programs that lower coincident peak demands. These recommendations remain as relevant and important today as they did when made by the legislative subcommittee in late 2017. Between 2005 and 2017, the wholesale price of power had dropped 46%, while transmission costs increased 555%, and distribution costs had increased 67%,1 according to testimony heard at the legislative study committee. While competition in the wholesale electricity markets continues to drive the cost of power to historical lows, transmission and distribution costs continue to rise at unprecedented levels. Comments submitted by the New England Power Generators Association support that this alarming trend continues. While transmission rates are largely within the purview of the Federal Energy Regulatory Commission, the New Hampshire Public Utilities Commission does have control over utility distribution rates. Not only should the PUC consider taking an active role in FERC proceedings addressing transmission within the region, it should also examine closely the return on equity approved in utility rate cases. While other, i.e., riskier, industries may warrant higher percentage returns, utility investments are low risk and simply do not merit the returns the PUC has awarded. III. The State’s Plan Should Balance Cost, Reliability and Renewable Resources
Burgess fully supports the State’s objectives of promoting fuel diversity. The State’s focus must include promoting cleaner, cost-effective resources that enhance grid reliability. As additional renewable resources connect to the grid, baseload resources, or their equivalent, will become increasingly more important to balance out the intermittent and non-dispatchable characteristics of these resources. As a renewable resource, Burgess has an average capacity factor of 95%. In addition to operating at an efficiency level comparable to baseload resources, it offers the environmental benefits captured as a Class I renewable resource under the State’s Renewable Portfolio Standards. Moreover, as a homegrown source of power, it promotes the State’s energy independence whose power can effectively be used to backstop more intermittent, less reliable renewable resources. The retirement of Burgess would further increase NH’s dependence on gas, increase price volatility in the winter, and decrease system reliability due to gas supply constraints during periods of extreme cold. Biomass also contributes to the management of the State’s forestry industry and serves as a valuable tool for forest management. Burgess purchases approximately 800,000 tons of biomass fuel each year, spread among as many suppliers as possible. Since 2014, roughly 6.5 million tons of market for low-grade wood has been lost annually though plant closures in New Hampshire and Maine; over 2 million tons of this loss has occurred since 2019. Burgess’ continued operation is essential to New Hampshire’s forest products industry. The State’s plan should promote and protect local resources that provide so many benefits to the State’s energy policy, as well as contributes to the State’s environmental goals.
1 See Legislative Study Committee Report at p. 21.

June 25, 2021 Submitted electronically via: [email protected]
Office of Strategic Initiatives 107 Pleasant Street Johnson Hall, 3rd Floor Concord, NH 03301 Re: New Hampshire 10 Year State Energy Strategy Dear Officers of Strategic Initiatives & Energy Strategy, On behalf of Opower, I am pleased to submit comments relative to the 2018 Energy Strategy Revision of the New Hampshire 10-Year State Energy Strategy. Opower is a part of the Utilities Global Business Unit within Oracle, the largest software company with a dedicated focus of building leading edges software for the utility industry. Opower’s mission is to support utilities in getting the most out of demand-side decarbonization efforts by influencing customer action on an incredible scale. We thank the Office of Strategic Initiatives (OSI) for the opportunity to provide input on the update to the State Energy Strategy. We commend OSI for the work done thus far to develop the State Energy Strategy to inform decisions about New Hampshire’s clean energy future. The purpose of the State Energy Strategy is to inform decisions about the state’s energy future. New Hampshire has a greenhouse gas (GHG) emission reduction target of 80 percent by 2050. The state’s energy strategy should be geared towards achieving this goal with decarbonization resources. In addition to clean energy, resources such as energy efficiency, demand flexibility, and electrification are fast, affordable decarbonization pathways that will help a clean energy future. New Hampshire should pursue all available strategies with equity & affordability as a priority. Energy efficiency Energy efficiency is the least cost clean energy and GHG reduction resource that can help customers save energy and reduce costs. Various neighboring states pursue all cost-effective energy efficiency, including Connecticut, Maine, Massachusetts, Rhode Island, and Vermont.1 All cost-effective efficiency mandates in energy efficiency resource standard (EERS) targets aim to achieve the maximum levels of cost-effective efficiency available within a state.
1 A. Gilleo, Picking All the Fruit: All Cost-Effective Energy Efficiency Mandates, August 2014, American Council for an Energy-Efficient Economy, Available at: https://www.aceee.org/files/proceedings/2014/data/papers/8-377.pdf

Energy efficiency programs include structural programs, such as weatherization and retrofits, as well as behavioral energy efficiency (BEE). According to recent research completed by the Analysis Group, behavioral programs have significant climate change mitigation value due to the scale at which they operate and ability to deliver significant greenhouse gas reductions today, limiting future climate damages. When compared to other energy efficiency programs, behavioral energy efficiency can deliver upwards of five times the greenhouse gas reductions in a shorter timeframe and at a quarter of the cost.2 New Hampshire should leverage behavior-based strategies to drive weatherization and deep energy retrofits. The two programs should be viewed as complementary. Designing innovative behavior-based strategies and weatherization programs that intentionally reinforce one another will lead to retrofitting the residential built environment at a faster pace than if the programs are largely uncoordinated. Behavioral programs generate savings and reduce emissions at scale today, when emissions reductions are most valuable,3 and accelerate participation in weatherization programs. Demand Response Demand response (DR) is increasingly important as states see diversification of energy resources with consumers adopting clean energy resources, energy storage, and electric vehicles. Demand response can help utilities manage demand during high usage, or peak periods, when energy is most expensive. This is a critical resource in helping reduce energy costs for customers and reducing the need for capital investments in new gas and electric infrastructure. The residential sector is rife with opportunity for demand response for both gas and electric systems. With behavioral demand response, every household has the potential to be a demand response resource and at a fraction of the cost of traditional direct load control. Opower is proud to operate behavioral demand response programs across the country in some of the geographies with the most critical grid needs including Texas, California, Illinois, and Maryland. The DR portfolio should prioritize DR solutions that reach as many households as possible. Residential DR will be increasingly important as the net system peak shifts toward late afternoon and evening hours with renewable energy resources on the rise, specifically residential renewable sources. Transportation Transportation is a major source of energy consumption and GHG emissions in New Hampshire. Electrification of transportation should be considered in the State Energy Strategy. Utility programs and market drivers will encourage the adoption of electric vehicles
2 Id. 3 P. Hibbard, The Role of Behavioral Energy Efficiency in Decarbonization, Analysis Group, August 2020, Available at: https://go.oracle.com/LP=97548?elqCampaignID=262134

(EVs). The benefits of transportation electrification heavily depend on customer behavior. EV purchases and charging can be complex consumer decisions. To ensure that NH residents and businesses benefit from utilities’ investment in EV infrastructure and EV ownership incentives, customer education and engagement plans should be included along with any plan to develop an EV charging network or promote EV adoption. Utilities are in a great position to deliver this education and outreach. Behavior-based strategies can be used to encourage consumers to optimize EV charging, engage in time of use pricing, and maximize the benefits of transportation electrification. Conclusion New Hampshire is on the path towards a clean energy future and should consider the state’s 80 percent GHG emissions reduction goal in pursuing that future. Focusing on decarbonization strategies like the ones mentioned in this letter will enable consumers to reduce costs and create a reliable and resilient energy system. These comments are intended to support the work of the Office of Strategic Initiatives in updating the State Energy Strategy and we appreciate the opportunity to provide input. Please reach out with any questions or comments as we are happy to provide further assistance as needed. Sincerely, Samantha Caputo Samantha Caputo Manager, Regulatory Affairs and Market Development Opower/Oracle [email protected]

June 24, 2020 Office of Strategic Initiatives Re: State Energy Strategy 107 Pleasant Street Johnson Hall, 3rd Floor Concord, NH 03301
Dear Director Chicoine,
ReVision Energy, New Hampshire’s largest clean energy company with locations in Brentwood and Enfield, is pleased to submit the following comments and recommendations concerning solar electricity for the 2021 update to the State of New Hampshire’s 10-Year State Energy Strategy. We also wish to convey our full support for the recommendations submitted by Clean Energy New Hampshire.
As an employee-owned B Corporation, ReVision works to reduce carbon pollution and lower energy costs for everyone while adding local jobs and investing in New Hampshire’s economy. Since 2003, we have installed over 10,000 clean energy systems in New Hampshire, Maine, and Massachusetts, including solar arrays, battery systems, electric vehicle chargers, and air-source heat pumps for families, business, nonprofits, and local governments.
We believe that developing a forward-looking energy strategy for New Hampshire is critical for the long-term health of our people, our environment, and our economy. Unfortunately, New Hampshire is lagging far behind other states in harnessing the full potential of homegrown renewable energy as a result of state policies and utility practices that generally discourage the energy transition. State leadership is urgently needed to reduce carbon pollution and enable the rapid expansion of low-cost, low-carbon alternatives for energy generation and electrification, thereby averting the worst effects of climate change on human health, the environment, and the economy. According to the latest NHDES Air Quality report, over 1,300 Granite Staters die each year from carbon pollution at a public health cost of $3.83 billion, with negative health effects falling disproportionately on low-income people and communities of color.
We believe it is possible to counteract these and other worrying trends through concerted action that begins with a robust and empirically grounded State Energy Strategy. Thank you for your work on behalf of our state.
Dan Clapp Dan Weeks Co-Founder VP, Business Development
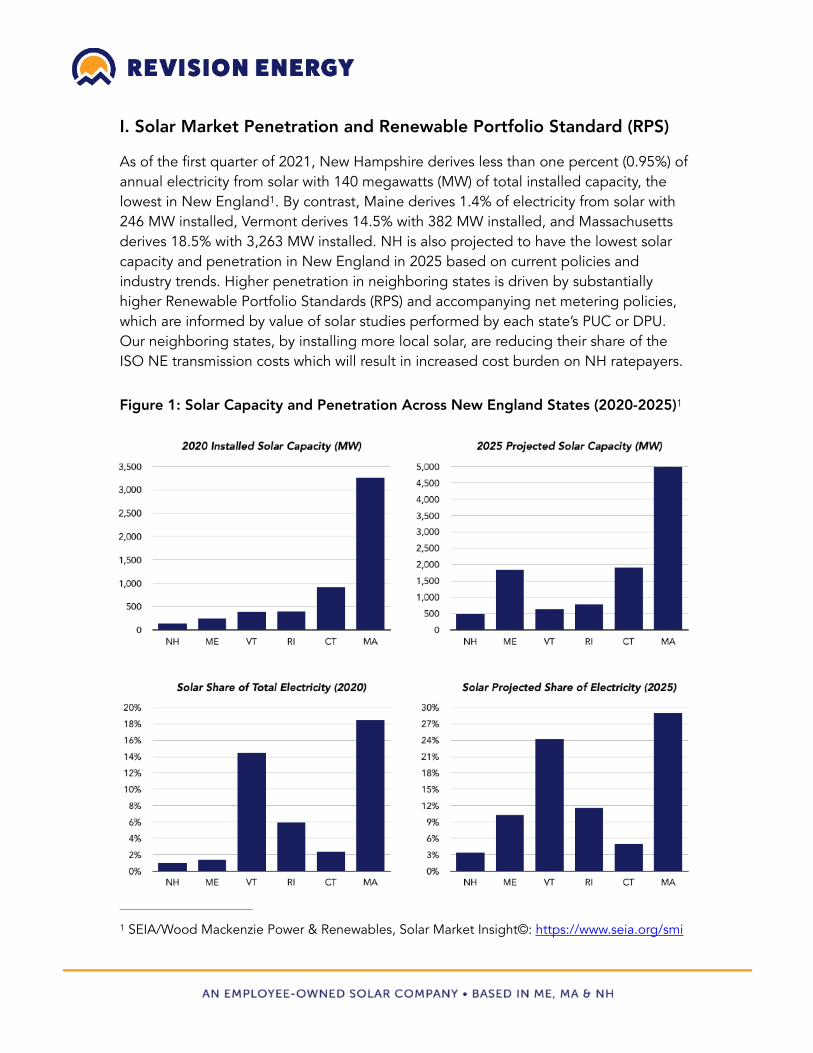
I. Solar Market Penetration and Renewable Portfolio Standard (RPS)
As of the first quarter of 2021, New Hampshire derives less than one percent (0.95%) of annual electricity from solar with 140 megawatts (MW) of total installed capacity, the lowest in New England . By contrast, Maine derives 1.4% of electricity from solar with 1
246 MW installed, Vermont derives 14.5% with 382 MW installed, and Massachusetts derives 18.5% with 3,263 MW installed. NH is also projected to have the lowest solar capacity and penetration in New England in 2025 based on current policies and industry trends. Higher penetration in neighboring states is driven by substantially higher Renewable Portfolio Standards (RPS) and accompanying net metering policies, which are informed by value of solar studies performed by each state’s PUC or DPU. Our neighboring states, by installing more local solar, are reducing their share of the ISO NE transmission costs which will result in increased cost burden on NH ratepayers.
Figure 1: Solar Capacity and Penetration Across New England States (2020-2025)1
SEIA/Wood Mackenzie Power & Renewables, Solar Market Insight©: https://www.seia.org/smi 1

RECOMMENDATION: RPS is a proven tool for promoting private-sector investment in clean energy. Although NH’s 2007 RPS has already resulted in substantial reductions in carbon pollution, the solar goal of 0.7% RPS through 2029 is extremely low and out of step with climate science. Setting RPS goals of 50% clean energy by 2035, 75% by 2040, and 90% by 2050 to avert the worst effects of climate change would result in tens of thousands of additional jobs across solar, wind, storage, and other zero-carbon technologies while reducing energy costs and driving billions of dollars in local economic investment.
Figure 2: New England States Renewable Portfolio Standards (2018-2040) 2
II. Net Metering and Value of Solar
In New Hampshire, the value of solar net metering is pegged to utility default supply rates for any customer generator over 100 kW (AC) and up to a maximum allowable size of 1 MW (AC). This net metering formula was proposed by the utilities and established by the NH Public Utilities Commission (PUC) in 2017 without the benefit of an empirical analysis of the actual costs and benefits of solar to the grid and to ratepayers at large. For small customer generators up to 100 kW, the net metering value was established in 2017 at default supply plus the transmission charge and one-quarter of the distribution charge. The PUC is still years away from completing its value of distributed energy resources (DERs) study required by the 2017 net metering settlement; the locational value of distributed generation (DG) portion was expected by summer 2020. In the absence of PUC data, independent analyst Synapse Energy Economics conducted a comprehensive review of the value of distributed solar to the New England grid based on five years’ worth of system load and production data released by ISO-NE. The
Independent System Operator of New England (ISO-NE), 20192

report, published in December 2020, found that solar reduced system demand substantially, particularly in the summer months and shoulder seasons, delivering energy and transmission capacity savings as well as varying levels of environmental benefits depending on the cost of CO2 pollution, as summarized in Figure 3.
Figure 3: Value of Solar Study Highlights (Synapse Energy Economics, 2020)

On average for small solar customer-generators (<100kw AC), New Hampshire’s value per kilowatt-hour (kWh) from solar generation is at least 32% lower than Vermont’s, 43% lower than Massachusetts’, and 15% lower than Maine’s. For large customer-generators in NH, the value per kWh from solar generation is at least 45% lower than VT, 56% lower than MA, 35% lower than ME. It is approximately 50% to 85% lower than the effective value of solar based on the Synapse Energy Economics report. All New England states are managed by the same integrated transmission grid under ISO-NE.
• New Hampshire – Net metering pays 9-12 cents per kWh under 100 kW AC (depending on percent solar consumed onsite) and 6-8 cents for 100 kW to 1 MW (Eversource default energy rate currently under 7 cents per kWh)
• Maine – Net metering pays 12.7 cents per kW hour plus 1-2 cents for RECs totaling 13-14.7 cents for systems larger then 20kW.
• Massachusetts - Feed-in tariff under the SMART program pays 25 cents per kWh for 25-250kW AC rooftop installations, 21.5 cents for 250-500kW rooftop installations, and 19.5 cents for ground-mounted installations
• Vermont – Net metering pays 15.4 cents per kWh under 500 kW AC plus 1 cent for rooftop (preferred site), plus 1 cent for RECs over 10 years totaling ~17.4 cents (GMP service territory)
RECOMMENDATIONS: Net metering is critical to the growth of small-scale renewables in New Hampshire by allowing families, businesses, nonprofits, and municipalities to offset their energy needs with solar, wind, and hydro at a fraction the retail cost. Raising the net metering cap from 1MW to 5MW for all customers, not only governmental entities, and raising the small-large customer generator threshold from 100kW to 500kW with empirically-determined net metering values established by the PUC would enable the growth of onsite and offsite clean energy generation to in accordance with an expanded Renewable Portfolio Standard.
III. NH Renewable Energy Fund (REF)
Since the REF-funded Solar Rebate Program was introduced by the PUC in 2011 as New Hampshire’s only state solar incentive, 548 C&I solar projects have been supported by state rebates, according to PUC data. The benefiting projects are primarily small in scale, broadly distributed across the state, and disproportionately benefit community organizations, schools, low- and moderate-income institutions, and small businesses that would find it difficult, if not impossible, to afford a solar installation without the REF rebate. Although the cost of solar technology has fallen since 2011, REF funding has fallen more rapidly in recent years.

• 2018 C&I Rebate levels: 50 cents per watt up to $150,000 for projects up to 500 kW AC (typical rebates $50,000-$100,000, 90 projects funded)
• 2019 C&I Rebate levels: 40 cents per watt up to $50,000 for projects up to 500 kW AC (typical rebates $30,000-$50,000, 81 projects funded)
• 2020 C&I Rebate levels: 20 cents per watt up to $10,000 for projects up to 500 kW AC with more stringent requirements (typical rebates $5,000-$10,000)
Over the same time period, standard residential solar rebates from the REF were cut from $2,500 to $1,000.
Figure 4: C&I Rebate Applications Received and Awarded, 2011-19 (NH PUC)
Figure 5: C&I Rebate Funding Levels, 2011-2020 (NH PUC)
RECOMMENDATION: In the absence of longer-term RPS and net metering reforms, restoring state rebates to their 2019 value of $50,000 (40 cents per watt), if not their 2018 value of $150,000, would enable significantly more small-scale clean energy projects, especially during the present economic recession. A simple transfer of some or all of the $5 million Clean Energy Fund committed by Eversource as part of its divestment settlement with the state would provide ample resources for the REF. The fund has gone unspent since 2017.
IV. Renewable Energy Certificates (RECs) New Hampshire’s extremely low RPS requirement for solar, which is fixed at 0.7% of total electricity generation through 2029, has resulted in a depressed market for Class II (solar) RECs. RECs have declined from $50-$60 per 1,000 kWh of solar electricity generation before 2017 to a fraction that amount TODAY, further harming solar project economics in NH and effectively requiring solar hosts to sell their RECs into the comparatively healthy Massachusetts REC market. REC values are further undermined by the utility practice of “sweeping” unclaimed RECs at no cost and by the inaccurate capacity factor assumptions automatically ascribed to solar generators.
RECOMMENDATIONS: Ending the utility practice of “sweeping” unclaimed RECs produced by clean energy generators to meet RPS and correcting the capacity factor assumption would support a rebound in REC prices and enable more NH families, businesses, municipalities, and nonprofits to install solar projects.
V. Solar Industry Jobs and Investment
According to U.S. Solar Market Insight report from Wood MacKenzie and the Solar Energy Industries Association (2019), New Hampshire has seen $351 million in direct solar investment since 2010 with a peak of more than 1,200 jobs across 85 solar companies in 2017. Solar jobs dipped to a low of approximately 800 in early 2019 but saw a partial rebound to 985 by 2020 before the Covid-19 recession. By comparison, the latest solar investment jobs figures for neighboring states show:
• Vermont: $729 million direct investment with 1,046 jobs across 59 solar companies
• Maine: $349 million direct investment with 595+ jobs across 47+ solar companies (rapid growth starting after 2019 state policy changes to be reflected in ’21 reports)
• Massachusetts: $9.132 billion direct investment with 9,475 jobs across 421 solar companies

Figure 6: Direct Solar Investment To Date in New England States, 2020 3
RECOMMENDATIONS: In addition to the options outlined above, NH policymakers can enable clean energy job growth and private investment by establishing robust virtual net metering for community solar farms; ensuring third-party energy suppliers permit net metering instead of requiring customer-generators to take default supply; extending the voluntary property tax exemption for solar and storage statewide and including third-party financing partners; removing administrative red tape to enable more efficient and streamlined permitting and interconnection of distributed renewables; removing blanket barriers to solar adoption in certain communities such as homeowner associations and historic districts; requiring Non-Wires Alternatives (e.g. demand-response and distributed solar+storage) be considered in place of traditional utility capital investments; promoting policies that designate small-scale renewables as load reducers to lower ISO Transmission charges and benefit all ratepayers; modernizing our outdated electric distribution and transmission systems through deployment of a clean-energy “smart grid” with time-of-use rates for effective integration of distributed renewables, battery storage, electric vehicles, and smart-home appliances; preventing cost-shifting of planned and costly utility upgrades, such as multiple reclosers costing six-figures each, to solar customers as a condition for grid interconnection; requiring transparency and accountability in the utility interconnection process, including providing hosting capacity information to renewable energy developers; and mandating Integrated Resource Plans from utilities every three years that track grid modernization, climate resiliency, distributed generation, beneficial electrification and efficiency against state goals, among others.
The Solar Foundation, State Solar Jobs Census: http://www.thesolarfoundation.org/solar-jobs-census 3


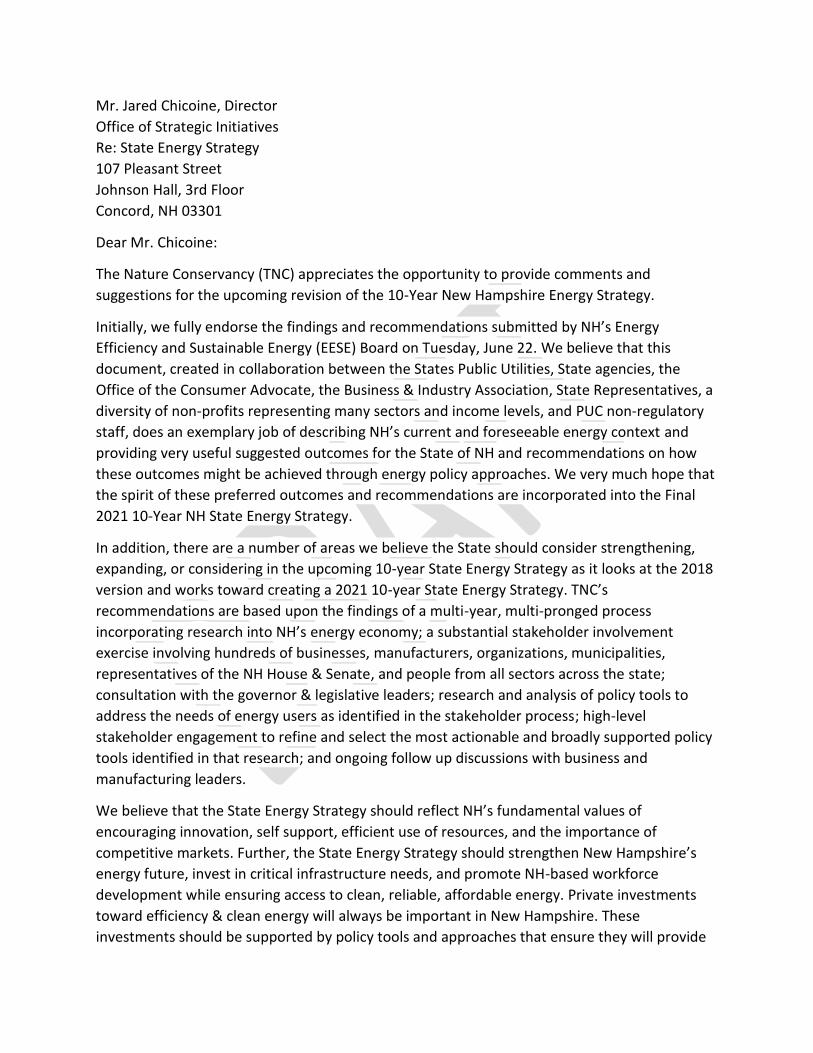
Mr. Jared Chicoine, Director
Office of Strategic Initiatives
Re: State Energy Strategy
107 Pleasant Street
Johnson Hall, 3rd Floor
Concord, NH 03301
Dear Mr. Chicoine:
The Nature Conservancy (TNC) appreciates the opportunity to provide comments and
suggestions for the upcoming revision of the 10-Year New Hampshire Energy Strategy.
Initially, we fully endorse the findings and recommendations submitted by NH’s Energy
Efficiency and Sustainable Energy (EESE) Board on Tuesday, June 22. We believe that this
document, created in collaboration between the States Public Utilities, State agencies, the
Office of the Consumer Advocate, the Business & Industry Association, State Representatives, a
diversity of non-profits representing many sectors and income levels, and PUC non-regulatory
staff, does an exemplary job of describing NH’s current and foreseeable energy context and
providing very useful suggested outcomes for the State of NH and recommendations on how
these outcomes might be achieved through energy policy approaches. We very much hope that
the spirit of these preferred outcomes and recommendations are incorporated into the Final
2021 10-Year NH State Energy Strategy.
In addition, there are a number of areas we believe the State should consider strengthening,
expanding, or considering in the upcoming 10-year State Energy Strategy as it looks at the 2018
version and works toward creating a 2021 10-year State Energy Strategy. TNC’s
recommendations are based upon the findings of a multi-year, multi-pronged process
incorporating research into NH’s energy economy; a substantial stakeholder involvement
exercise involving hundreds of businesses, manufacturers, organizations, municipalities,
representatives of the NH House & Senate, and people from all sectors across the state;
consultation with the governor & legislative leaders; research and analysis of policy tools to
address the needs of energy users as identified in the stakeholder process; high-level
stakeholder engagement to refine and select the most actionable and broadly supported policy
tools identified in that research; and ongoing follow up discussions with business and
manufacturing leaders.
We believe that the State Energy Strategy should reflect NH’s fundamental values of
encouraging innovation, self support, efficient use of resources, and the importance of
competitive markets. Further, the State Energy Strategy should strengthen New Hampshire’s
energy future, invest in critical infrastructure needs, and promote NH-based workforce
development while ensuring access to clean, reliable, affordable energy. Private investments
toward efficiency & clean energy will always be important in New Hampshire. These
investments should be supported by policy tools and approaches that ensure they will provide
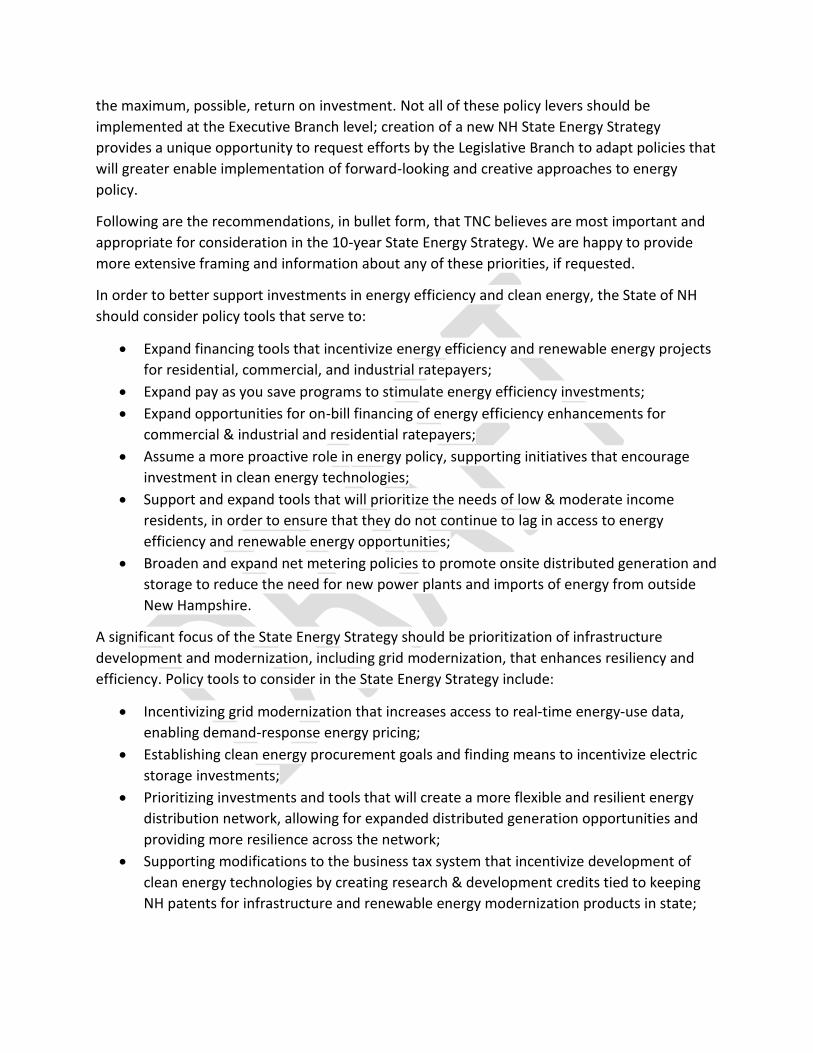
the maximum, possible, return on investment. Not all of these policy levers should be
implemented at the Executive Branch level; creation of a new NH State Energy Strategy
provides a unique opportunity to request efforts by the Legislative Branch to adapt policies that
will greater enable implementation of forward-looking and creative approaches to energy
policy.
Following are the recommendations, in bullet form, that TNC believes are most important and
appropriate for consideration in the 10-year State Energy Strategy. We are happy to provide
more extensive framing and information about any of these priorities, if requested.
In order to better support investments in energy efficiency and clean energy, the State of NH
should consider policy tools that serve to:
• Expand financing tools that incentivize energy efficiency and renewable energy projects
for residential, commercial, and industrial ratepayers;
• Expand pay as you save programs to stimulate energy efficiency investments;
• Expand opportunities for on-bill financing of energy efficiency enhancements for
commercial & industrial and residential ratepayers;
• Assume a more proactive role in energy policy, supporting initiatives that encourage
investment in clean energy technologies;
• Support and expand tools that will prioritize the needs of low & moderate income
residents, in order to ensure that they do not continue to lag in access to energy
efficiency and renewable energy opportunities;
• Broaden and expand net metering policies to promote onsite distributed generation and
storage to reduce the need for new power plants and imports of energy from outside
New Hampshire.
A significant focus of the State Energy Strategy should be prioritization of infrastructure
development and modernization, including grid modernization, that enhances resiliency and
efficiency. Policy tools to consider in the State Energy Strategy include:
• Incentivizing grid modernization that increases access to real-time energy-use data,
enabling demand-response energy pricing;
• Establishing clean energy procurement goals and finding means to incentivize electric
storage investments;
• Prioritizing investments and tools that will create a more flexible and resilient energy
distribution network, allowing for expanded distributed generation opportunities and
providing more resilience across the network;
• Supporting modifications to the business tax system that incentivize development of
clean energy technologies by creating research & development credits tied to keeping
NH patents for infrastructure and renewable energy modernization products in state;

• Expanding efforts that support the creation of an EV-charging network throughout the
State, beyond the forward-looking commitment to utilizing the maximum allowable
amounts of the VW settlement funds for this purpose.
New Hampshire is in the center of a region with a growing clean tech sector and has a unique
opportunity to attract a younger demographic to fill industry needs, if the State is proactive in
focusing on workforce development opportunities such as:
• Establishing a debt forgiveness for skilled technology workers recruiting fund to match
existing or developing employer incentive programs;
• Creating a registered apprentice program for the clean tech sector that links schools,
colleges, and employers in the areas these schools are situated to help ensure pathways
to the trades and skilled jobs that we must fill to keep New Hampshire’s economy
growing;
• Incentivizing academic loan repayment programs for NH graduates that remain
employed in-state for at least two years;
• Work with the Governor’s Millennial Council to develop workforce training
opportunities that feed into the rapidly growing clean tech and energy sectors.
The 10-year State Energy Strategy provides an important platform whereby policy makers
establish the direction New Hampshire will take in coming years as it addresses our shared
energy needs. TNC believes that updating and revising the 2018 State Energy Strategy is an
appropriate priority, as that document did not effectively serve to point the State in a direction
that was forward-looking and competitive, when compared to our neighboring states. New
Hampshire is not located in a vacuum, it is surrounded by States that have made ambitious
proposals to reduce their greenhouse gas emissions, maximizing investments in energy
efficiency and utilizing renewable energy resources. In doing so, these other States have
effectively reduced their energy use and demand for energy during peak periods, while New
Hampshire’s energy use has gone up. The result of this is that ISO-NE’s most recent forecasts
predict that our state’s share of distribution costs will increase in coming years with a cost to
NH ratepayers of millions of dollars that other states’ ratepayers will not face. It’s not too late
for New Hampshire to take a more forward-looking approach to energy policy, ensuring that we
will remain competitive over the coming decades. TNC appreciates the opportunity to provide
these recommendations to the new 10-year Energy Strategy and will remain an engaged and
active partner wherever and however possible.


NH 10 Year Energy Strategy Comments and recommendation from the Warner Energy Committee
The Warner Energy Committee believes that NH’s energy strategy should be based on the urgent need to address climate change. The goals of this strategy should be to significantly reduce our reliance on fossil fuels, increase our reliance on renewable energy sources and minimize our energy consumption though conservation measures. It is critical that these goals be incorporated into NH’s K-12 curriculum.
We believe that the costs resulting from climate change must be a factor in determining the most cost effective energy policies for the state. Doing so will result in long term benefit to all NH residents and the NH environment. We also believe that this approach will be an economic driver for NH businesses and directly contribute to increased job opportunities for NH workers.
10 Year Energy Strategy recommendations:
Measures to reduce our reliance on fossil fuels
• Put a plan in place to convert state buildings from reliance on fossil fuels. • Convert the fleet of state vehicles to electric vehicles, wherever possible. • Expand EV charging stations around the state, including state offices and state parks. • Support mass transit options that include a commuter rail system that connects to
transportation hubs in Concord, Manchester and Nashua.
Measures to increase reliance of renewable energy sources
• Eliminate the cap on net metering for businesses, municipalities, and school districts. • Continue support for community power projects. • Adopt policies to encourage electric storage systems both in front of and behind the
meter. • Remove barriers to biomass and small-scale hydropower and include them as part of an
in state distributed power grid. • Support NH as terminal location for collecting and transmission of offshore wind
production.
Minimize energy consumption through conservation
• Increase the funding for the NH Saves program to encourage energy conservation. • Adopt policies that remove barriers to community composting.