Embed Size (px)
Citation preview
A PROCESS VIEW OF ALLIANCE CAPABILITY:
GENERATING VALUE IN ALLIANCE PORTFOLIOS
MB Sarkar
Assistant Professor Department of Management
College of Business Administration University of Central Florida
Orlando, FL 32816-1400 Phone: (407) 823 5699
email: [email protected]
Preet S. Aulakh
Pierre Lassonde Chair in International Business Schulich School of Business
York University Toronto, ON M3J 1P3, Canada
email: [email protected]
Anoop Madhok
David Eccles Fellow and Associate Professor Department of Management
1645 E Campus Center Dr Rm 104 University of Utah
Salt Lake City, UT 84112 email: [email protected]
ACKNOWLEDGEMENTS
We are indebted to the Queen’s Center for Knowledge-based Enterprises and the Alliance-Edge program (http://business.queensu.ca/kbe) for generous support of this project. The first author would also like to acknowledge support of this project from the Center for International Business Education Research at Michigan State University, and the Institute for the Study of Business Markets at Pennsylvania State University.
A PROCESS VIEW OF ALLIANCE CAPABILITY:
GENERATING VALUE IN ALLIANCE PORTFOLIOS
ABSTRACT
This paper investigates the source of heterogeneity in the distribution of alliance capabilitiesamong firms, and relates it to business processes that enable firms to generate collaborative value. Complementing the existing view of dyadic value creation, and the emerging experience and structural perspectives of alliance capabilities, we argue the importance of examining such a capability through the lens of organizational processes. Based on a theoretical framework of collaborative rents, we identify three processes – namely alliance proactiveness, relationalorientation and portfolio coordination as constituting such a capability. Using data from 235 firms, and controlling for alliance experience and the presence of a dedicated alliance function, we show that the three processes play an important role in enhancing a firm’s alliance portfoliocapital. Further, we find that the alliance portfolio capital has a positive impact on firm performance. Thus we find evidence of heterogeneity in deriving value from alliance portfoliosthrough an alliance capability emanating from organizational processes.
1
While the benefits of inter-organizational alliances have long been recognized, recent
evidence suggests that some firms are better able to create and capture value through their
alliances than other (Harbison and Pekar, 1998; Anand and Khanna, 2000; Kale, Dyer, and
Singh, 2002). From a resource-based perspective, such performance differentials reflect firm
heterogeneity in alliance capability, or the set of organizational and strategic routines used by
firms to develop and implement alliance strategies. In other words, the fountainhead of superior
collaboration-based outcome and resultant competitive advantage is arguably the set of high-
performance alliance routines operating inside the firm (Teece, Pisano, and Schuen, 1997).
However, in spite of growing interest on an alliance capability-based framework, we lack a
systematic understanding of this capability, and its underlying processes (Simonin, 1997;
Madhok and Tallman, 1998; Gulati, 1998). Aiming to address this gap, our study addresses three
questions: What are the organizational processes that constitute alliance capability? How does
formal institutionalization of an alliance function impact the outcome of these processes? What
is the relationship between the outcome of alliance capability and firm performance?
Within the rich traditions of voluntary inter-firm cooperation, two streams of research
have focused specifically on collaborative wealth generation and capture by firms. The first
stream of research focuses on dyadic ties between alliance partners in an effort to examine the
relational and governance aspects of collaborations, and their impact on value creation in
interdependent situations (Madhok and Tallman, 1998; Dyer and Singh, 1998). As a result, such
studies have provided useful insights into the life cycles of individual alliances in terms of partner
selection, relationship structure and governance modes, and performance implications of bilateral
collaborative relationships. The second more recent stream of research focuses on the firm as a unit
of analysis. Here the effort is to scientifically examine the intriguing possibility of differences in
2
firms’ ability to create and capture value at an organizational level, or heterogeneity in alliance
capabilities among firms. In particular, two recent studies identify alliance experience (Anand and
Khanna, 2000) and a dedicated alliance function (Kale, Dyer, and Singh, 2002) as demographic and
structural proxies of alliance capability.
We identify two areas that remain underdeveloped in the literature. First, an endemic
problem with the former stream of research which focuses on individual alliances is the fallacious
assumption that a firm’s set of alliances is independent (Koka and Prescott, 2002; Gulati 1998).
To the contrary, it has been noted that alliance success is not only a function of a firm’s
individual alliances, but also related to the design and management of alliance strategies across
the entire portfolio of partners (Parise and Casher, 2003). Coordinating knowledge and resource
flows across the different constituent elements of a firm’s alliance portfolio may be a value
creating mechanism in itself, since the possibility of synergy is likely to increase the portfolio
potential beyond the mere sum total of the individual alliances. In other words, the traditional
dyadic approach misses the possibility that the portfolio as a whole may become more imbued
with value as a result of holistic and inclusive management mechanisms and processes across
alliance (Dyer and Nobeoka, 2000).
Second, the emerging literature on alliance capabilities seems to be characterized by an
over-emphasis on structure, and a relative disregard of organizational processes. For example,
recent studies have considered alliance experience (Anand and Khanna, 2000) and a dedicated
alliance function (Kale, et al. 2002) as surrogates of alliance capability. However, given that
learning curves tend to vary significantly across firms (Argote, 1999), differences in alliance
outcomes could be explained by variance in organizational routines and processes that reflect
superior capability to design and manage alliance networks. Accordingly, experience, or internal
3
legitimization, may not be enough to guarantee future collaborative performance without the
explicit consideration of organizational routines and processes (Simonin, 1997). The need to
adopt a process mode of competitive advantage is further reinforced by the literature on dynamic
capabilities (Eisenhardt and Martin, 2000), and the associated idea that the competitive potential
of a firm’s resources and capabilities can only be realized through business processes (Ray,
Barney, and Muhanna, 2004).
In other words, the existing structural view of alliance capabilities do not explain the
underlying processes through which firms create and capture value from multiple alliances. This
under-emphasis is surprising given anecdotal evidence that some firms have developed and
refined their alliance routines so much so that it is now a part of their core competency (Harbison
and Pekar, 1998). In fact, both Anand and Khanna (2000) and Kale et al. (2002) point to the need
for further research to unpack the processes underlying alliance capabilities that do not get
captured either through accumulated experience, or institutionalization of the alliance function.
Finding that unobservables impact a firm’s alliance success rate, Kale et al. (2002) suggest that
“such unobservable characteristics relate to some firms being more learning and coordination
oriented than other firms, which in turn influences their alliance success rates” (p. 762).
Similarly, Anand and Khanna (2002) point out that although their study establishes the
“existence of differences in ‘alliance capabilities’ across firms” (p. 313-314), future work needs
to “explore the organizational determinants of this capability” (p. 314).
Our paper addresses these gaps by identifying organizational processes that create value
in the context of a firm’s portfolio of alliances. We first discuss “alliance portfolio capital” as the
value that resides in a firm’s set of alliances. Next, we identify organizational processes that
enhance the focal firm’s portfolio capital, as well as examine the contingent role of an
4
institutionalized alliance function on the link between organizational processes and alliance
portfolio capital. Finally, we link the alliance portfolio capital to firm performance.
ALLIANCE PORTFOLIO CAPITAL AND ORGANIZATIONAL PROCESSES
Alliance Portfolio Capital
Measuring the performance of dyadic alliances and the collaborative value that they
generate is an issue that has perplexed both academic researchers and practitioners for years
(Alliance Analyst, 1998; Geringer and Hebert, 1991). This problem is exacerbated while
assessing the performance of a firm’s alliance portfolio, where firms may have multiple alliances
at different phase of the life-cycle and operating at various stages of the value-chain. Evaluating
the performance of the portfolio through simple aggregation of the performance of individual
alliances may be erroneous because the portfolio members may contribute tangible and
intangible flows that spill-over beyond the dyadic relationship and create synergy. In other
words, since a “portfolio can be more than the sum of its parts” (Bamford and Ernst, 2002: 38), it
is important to consider an outcome that relates to the portfolio as a whole rather than its
constituent parts.
Accordingly, we consider the value created and captured by a firm through its alliances in
terms of its “alliance portfolio capital.” In conceptualizing this variable, we consider three
aspects that have been highlighted in the inter-firm collaboration literature (Parise and Casher,
2003). First, we consider the compositional element, and thereby the competitive strength of the
of portfolio members. This is important since “a firm’s portfolio of collaborations is both a
resource and a signal to markets, as well as to other potential partners, of the quality of the firm’s
activities and products” (Powell, 1998: 229). Therefore, a high-quality portfolio will not only
offer access to better resources, but is also likely to result in future accrual of better resources by
5
attracting stronger prospective partners. Second, in keeping with the rich tradition of relational
rents (Dyer and Singh, 1998) we consider the strength of the firm’s relationship with individual
partners within the portfolio. Third, we consider the strength of the firm’s affiliation of
partnerships as a whole. In sum, we consider the equity of the focal firm as a potential partner,
the competitiveness of the affiliation group, and the resilience of a focal firm’s ties with each
member as a firm’s alliance portfolio capital. In a sense, alliance portfolio capital captures the
“health/vigor” of a firm’s alliances, and thereby would reflect the degree to which it has been
able to create and capture value from its alliances.
Conceptualizing Alliance Capability
Extant literature suggests that collaborations present a firm with two potential routes to
value, namely common and private benefits (Khanna, Gulati, and Nohria, 1994; Khanna, 1998).
First, common benefits are those that accrue collectively to alliance partners. These composite
quasi-rents, or value generated by a firm’s resources in continued association with that of another
(Hill, 1990), enable firms to create value that individually, they would be unable to accomplish.
Private benefits refer to value generated for the firm through its alliance outside the focal
collaboration, for instance when knowledge-based spillovers from an alliance enriches a firm’s
stock of know-how in adjacent areas.
Importantly though, these benefits have been addressed mainly within the domain of
activities of a specific alliance. Yet, the argument also applies at the alliance portfolio level,
where a central firm forms multiple alliances that complement one another, and can benefit both
jointly and privately from each of these. The two levels are not disassociated from one another.
At the dyadic level, knowledge flows from individual collaborations can collectively and
dynamically coalesce with the focal firm’s own knowledge base in a synergistic way that is
6
singularly distinctive and not available to any other partner. Moreover, as Dyer and Nobeoka
(2000) found, common benefits also become available at the portfolio level when a focal firm
runs its alliances in an inclusive and participative way, and actively leverages relevant
knowledge generated from any one alliance across the portfolio. Logically then, if portfolio
members were to benefit more from their participation with a particular nodal firm relative to its
competitors, because of the focal firm’s particular competence at managing collaborations, this
would attract stronger partners.
However, in spite of the potential for both private and common benefits at both dyadic
and portfolio levels, firms often fail to translate such potential into realized benefits (Madhok
and Tallman, 1998). This can occur for various reasons: First, the choice of partners may be sub-
optimal. Second, systemic relationship imperfections, such as lack of trust and commitment and
inadequate coordination routines for sharing knowledge, can prevent partners from combining
their resources and capabilities optimally. Third, firms may fail to fully leverage knowledge from
their individual alliances across the portfolio. Given this distinction between the potential of a
firm’s alliance portfolio and its ability to translate this potential into realized collaborative
benefits, firms need to operate on multiple fronts and engage in a coherent set of inter-related
activities in order to maximize the value derived from its alliance portfolio. In this light, effective
collaboration routines become critical not only to maximize the potential value of the alliance
portfolio, but also to narrow the gap between the potential and realized value.
Put differently, the variance in how firms manage their resource re-configuration through
linking to bilateral and portfolio-level strategic assets in their search for new value-creating
strategies provides a basis for understanding why firms derive different levels of value through
their alliances. In other words, performance differentials across firms with respect to their
7
alliance portfolios may occur due to differences in the embedded potential of a firm’s alliances,
as well as varying degrees of success in translating this potential into realized collaborative
benefits.
The implications from the above discussion are as follows: One, collaborative rents are
created by processes that enable a firm to identify and form relationships with partners with
whom alliances would have high value-creating potential. Second, firms can develop process
skills in managing cooperative relationships that facilitate the intermingling of joint and often
interdependent resources and capabilities, thus enabling them to exploit the underlying potential
(Dyer and Singh, 1998). Third, above and beyond this, firms need to engage in cross-alliance
knowledge transferring mechanisms and thus create synergy across its portfolio of alliances
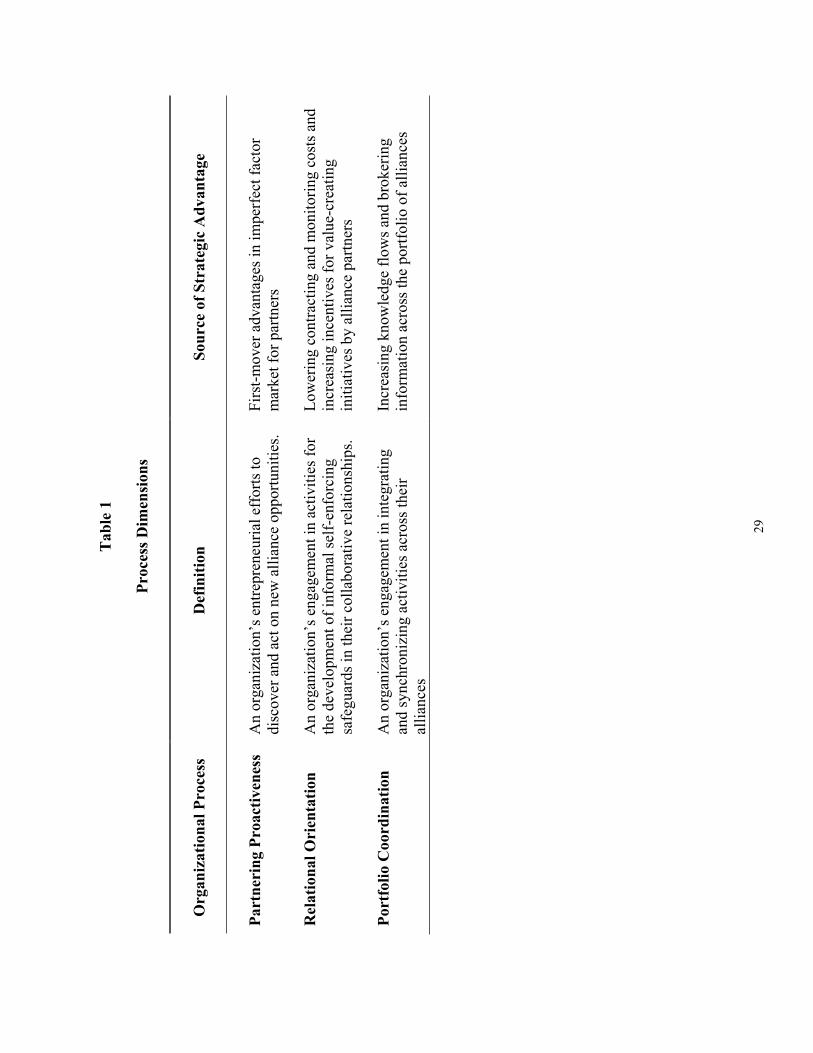
(Gulati, 1998). These three processes and their underlying properties are summarized in Table 1.
In the following section, we elaborate on each and develop the hypotheses.
-------------------------------------Insert Table 1 Here
--------------------------------------
HYPOTHESES
Alliance Capability and Portfolio Capital
Alliance Proactiveness: We conceptualize alliance proactiveness as a firm’s efforts to
discover and act on new alliance opportunities. Encompassing opportunity sensing and response
capabilities, this dimension of includes organizational processes to identify new and potentially
valuable partnering opportunities, and preemptive actions to respond to such opportunities. Firms
that are proactive in identifying and acting on partnering opportunities are likely to enjoy pre-
emptive first-mover advantages in the ‘market for partners’. This in turn is likely to increase the
value creating potential of their alliances.
8
The relevant strategic factor market for a firm wishing to augment its internally owned
and controlled resources and capabilities through alliances is the market for partners. The
strategic factor market for partners, defined as the set of potential collaborator firms that are
compatible and possess required strategic resources, is likely to be imperfect for several reasons.
First, there is likely to be asymmetric information and differing expectations among competitor
firms about the future value of a specific alliance. Better-informed firms may be able to exploit
imperfections in their favor. Second, a potential ‘small numbers’ problem may lead to a scarcity
of potential alliance partners, and leave late movers with sub-optimal options (Sarkar,
Echambadi and Harrison, 2001).
Therefore, alliance proactiveness is likely to result in preemptive benefits, enabling such
firms to capture advantageous positions in partner space, which consists of the set of suitable
firms that possess the required set of complementary strategic assets. Gomes-Casseres (1996)
calls this “strategic gridlock,” referring to a situation of supply-side scarcity in which partnership
options are used up as alliances proliferate in an industry, and where resulting preemption of
valuable and scarce resources in partner space becomes a source of strategic advantage. As a
result, a stronger and more competitive portfolio is likely to possess greater underlying potential
to create value through the alliances. The unique resource configurations or “constellations” that
result from proactive alliance activity may be difficult to imitate, leading to sustainable
differences in the value of the alliance portfolio in which firms are embedded (Gomes-Casseres,
1996). Therefore, we hypothesize:
H1: Alliance proactiveness will be positively associated with alliance portfolio capital.
Relational Orientation: An organization’s willingness to make relational investments reflects
its level of commitment to the relationships, and the extent to which individual partners are
9
valued. Accordingly, the relational dimension refers to the extent to which partners are mutually
oriented towards one another. A relational orientation tends to be characterized by greater trust,
flexibility and resilience (Dyer and Singh, 1998) and is manifested through the extent to which
an organization engages in informal interactions and normative mechanisms that are cooperative
in nature and serve to bind partners together through shared understandings and norms. In such
cases, any contracts between the partners are supported and supplemented through normative
mechanisms, whereby the partners concerned are willing to initiate unilateral commitments in
the interests of the relationships. A relational orientation enables partners to engage in a more
dynamic process of interaction and value creation than would be the case in situations where
there are significant imperfections in the relationship. One critical systemic relational
imperfection is the fear of opportunism, which creates a fundamental safeguarding problem in
relationships where partners have to make exchange-specific investments (Williamson, 1985).
Both formal and informal safeguards are appropriate mechanisms to minimize the threat
of opportunistic behavior in interorganizational relationships, and may even complement one
another (Poppo and Zenger, 2002). However, besides cost and efficiency implications as a result
of lower contracting and monitoring costs, informal normative safe-guards characterized by trust
relations provide superior incentives for value-creating initiatives by alliance partners, such as
sharing fine-grained tacit knowledge, exchanging resources that are difficult to price, or offering
innovations or responsiveness beyond the contract (Dyer and Singh, 1998). In other words, given
that “the production of a collective good is inextricably intertwined with the underlying
dynamics of exchange” (Madhok and Tallman, 1998: 327), the value of a partnership is likely to
depend on the relational investments and patterns of interaction among the partners.
10
The main difference between these approaches is that the former is purely self-interested
point of view of a focal firm whereas the latter is much more dyadic in its orientation (Zajac and
Olsen, 1993). To the extent that a firm’s partners can also benefit in their alliances with the firm
as a result of its relational orientation, the firm becomes an attractive partner. Other things being
equal, potential partners would be drawn to enter into partnerships with a focal firm over its
competitors if there is a greater probability in benefiting from it, as evidenced by its prior track
record, and would also be more willing to act relationally from the outset. Skills at managing
partnerships, as well as availability and willingness of partners of choice, should result in joint
value creation to the benefit of all partners (Madhok, 2002). Thus,
H2: Relational orientation will be positively associated with alliance portfolio capital.
Alliance Portfolio Coordination: Portfolio coordination comprises the processes by
which the focal firm engages in integrating and synchronizing activities, strategies, and
knowledge flows across their alliance networks. In place of a discrete, atomistic view of
alliances, or what Granovetter (1992) has termed ‘dyadic atomization,’ this perspective eschews
the reductionism that occurs when an analyzed pair of firms is abstracted out of their embedded
context. Instead, it emphasizes a holistic view of an organization’s network. Due to the
possibility of knowledge spillovers, the value potential of the alliance portfolio is greater than the
sum of individual alliances (Anderson, Hakansson, and Johanson, 1994; Koka and Prescott,
2002).
As “interstices between firms, universities, research laboratories, suppliers and
customers" become sources of innovation (Powell, Koput, and Smith-Doerr, 1996: 118), any
single breakthrough involves a wide range of organizations (Hargadorn and Sutton, 1997).
Accordingly, the locus of value creation becomes the collective entity, rather than an individual
11
firm. In response to such complex task requirements, firms need to integrate many different
specialist organizations into a large, modular system of grouped value-adding activities.
Managing such complex interdependencies across multiple external partners necessitates
extensive coordination among constituent firms. Coordinating and aligning strategies with the set
of partners becomes key to a firm’s response capability to leverage the entire alliance portfolio
(Lei, Hitt, and Goldhar, 1996; Gomes-Casseres, 1996). Further, increasing diversity in source of
innovations implies opportunities to create value by brokering information and coordinating
knowledge flows across structural holes, or disconnects in knowledge structures through
information access, timing, referrals, and control (Burt, 1992; Achrol and Kotler, 1999).
In essence, multiple interdependencies and associated knowledge flows across the
portfolio of alliances potentially generates collaborative synergies. In order to realize this
synergy, however, firms need to systematically manage the interdependencies and flow of
resources between their inter-organizational resource clusters. They need to coordinate, integrate,
and transform resources housed in different 'partner silos' in their internal networks the portfolio.
That is, through inter-alliance coordination, a firm can adapt and recombine know-how of
partners into unique market opportunities, and thus create synergistic value for the whole
portfolio (Parise and Casher, 2003).
In fact, managing the portfolio as a collective and generating synergy across the entire
network should benefit the participants more than if each were managed separately. In the case
of Toyota’s network, for example, Dyer and Nobeoka (2000) found that knowledge sharing
mechanisms at the portfolio level, together with a strong network identity, such as a partners’
association, benefited both Toyota and its partners. This further increased their willingness to
share knowledge with one another. Through such processes, the portfolio evolved from a
12
collection of dyadic ties with the nodal firm to also include multilateral ties among portfolio
members. Moreover, reputational mechanisms work more readily in such interdependent
alliance portfolios, which also prevents free-riding and opportunism. The authors demonstrated
how this ultimately led to productivity benefits and made the portfolio as a whole more
competitive.
H3: Alliance portfolio coordination will be positively related to alliance portfolio capital.
The Contingent Role of Alliance Function
Our arguments till now have centered on the premise that firm heterogeneity in acquiring
and deploying collaborative processes accounts for the generation of alliance portfolio capital.
The three processes clearly reinforce one another. The combination – discovery of partnering
opportunities and partners, managing each partnership in a way that both partners enjoys robust
benefits from partnership, and managing them collectively so that benefits within partnerships
are also shared for network synergies where available - contribute to the value of a firm’s
alliance portfolio capital, i.e. enhance alliance portfolio capital.
Recent research has proposed that a centralized point of coordination, expressed through
a separate and dedicated alliance function, may enhance a firm’s alliance capabilities by
facilitating the transformation of experience into know-how, ensuring resource flows, and
improving coordination processes. In support, Kale, Dyer, and Singh (2002) found that a formal,
dedicated alliance function is associated with superior alliance performance. However, reflecting
their interest in the performance aspects, these authors just asserted that an alliance function
would facilitate alliance coordination. Rather than make such an assumption, we test this
argument and examine whether and how a dedicated alliance program interacts with the
collaborative routines underlying the above three dimensions in the creation of value.
13
We adopt the viewpoint that a formal alliance program has a synergistic effect with
collaborative routines, and accordingly propose that the effect of the alliance management
processes strengthens in the presence of structural support as manifested through an
institutionalized alliance program. This is so since, besides a legitimizing role that signals the
importance of alliances and also has resource implications, an alliance function also has a
learning role (Kale, Dyer, and Singh, 2002). A centralized center of competency development is
likely to enable a firm to convert its alliance experiences into an organization-wide know-how.
An organization with a dedicated alliance program is more likely to engage in systematic efforts
to capture, interpret, and codify alliance experiences into a shared organizational repository of
alliance management knowledge. As a result, the effectiveness of organizational routines that
underlie the three aspects of portfolio management above would be further enhanced where there
is a formalized alliance program. In other words, collaborative routines and organizational
structure share a complementary, or co-specialized relationship in that the value of one increases
in the presence of the other. Accordingly, we hypothesize that:
H4a-4c: The relationship between alliance proactiveness, relational orientation, and
portfolio coordination and the alliance portfolio capital will be moderated by alliance
function, such that these relationships will be stronger as the level of institutionalization
of the alliance function increases.
Alliance Portfolio Capital and Firm Performance
While the previous hypotheses related three process dimensions to alliance portfolio
capital from the perspective of a focal firm, a critical issue that demands further investigation is
whether the value created through strengthening the portfolio impacts firm performance. We
suggest that a firm’s alliance portfolio capital represents a valuable, rare and non-imitable
resource and thus will positively impact performance. First, the value of extra-firm resources
accessed through alliances and other affiliations has been well documented (Kale et al., 2002;
14
Anand and Khanna, 2000; Tsai and Ghoshal, 1998), with respect to both private as well as
common benefits (Dyer and Nobeoka, 2000). In the context of our study, a strong alliance
portfolio would enable the focal firm to gain access and deploy economic and knowledge
resources through its partners that help it maintain and enhance competitive advantage. Second,
such portfolio capital has rareness property because of the small numbers problem of quality
partnering opportunities. Therefore, a firm that becomes a partner of choice in imperfect partner
markets is able to build strong individual relations, as well as synergistically combine resources
from different parts of the portfolio and create a rare, firm specific advantage. Finally, alliance
portfolio capital is simultaneously located in discrete, identifiable dyads, and as a generalized
resource gained through membership in portfolio that actors may draw on. The co-production
and consumption of this alliance capital makes it not only time-dependent but also sticky, due to
which it is difficult to transfer and imitate. Accordingly, we hypothesize that:
H5: Alliance portfolio capital will be positively related to firm performance.
METHOD
Questionnaire Development
The study was conducted in two stages using a discovery-oriented approach. In stage one,
after a review of the literature, measures were developed through an iterative modification
process and in-depth interviews with 25 senior managers with alliance responsibilities from 21
firms across diverse industries1. Our respondents were identified through three sources: corporate
1 We approached executives/companies through three sources: Corporate members of a research institute of a largemid-western University, searches on electronic databases such as Lexis/Nexis and Proquest with keywords such as ‘alliance managers’ and ‘director alliances’ and contacts of some practitioners who presented and conductedsessions at the strategic alliances seminars for the Conference Board. Firms from various industries wereinterviewed: advisory and consultation, computer software, pharmaceutical, chemicals, mining and manufacturing,building-materials and glass for telecommunication, scientific/ photo/ control/equipment, motor vehicles and parts,collectible motorsports and consumer products, computers/office equipment, and network communication. Fifteen
15
members of a research institute of a large mid-western university, searches on Lexis/Nexis and
Proquest with keywords such as ‘alliance managers’ and ‘director alliances,’ and through
contacts of practitioners who had participated at strategic alliances seminars for The Conference
Board. Scales were borrowed and adapted from existing literature. In those instances where no
previous scales existed, measures were developed using a framework proposed by DeVellis
(1991). For new scales, we drew on the expertise of our interview informants to develop a pool
of items. The instrument incorporated their language to reflect the exact nuances of the variable
in question. This initial item pool was reviewed by academic experts, and returned to the
industry informants who were now asked to evaluate and modify the items where they felt it was
necessary. The scale length was optimized, subsequent to which the draft questionnaire was
administered to a second panel of executives, and their concerns noted through follow-up
discussions. The discussions focused on ambiguous items, instrument length, and format. Once
again, items were either modified or deleted based on this feedback, and the questionnaire
finalized.
Sampling Frame and Data Collection
Data for testing the hypotheses were collected through a mail survey. First, 1800 firms
with annual sales over $25 million were drawn randomly from the CorpTech Directory of
Technology Companies.2 We sent a letter and return envelope to CEOs requesting participation
and asking for the contact details of senior-level executives knowledgeable about the company's
strategic alliance-related processes and activities (the CEO could also identify himself/herself).
Thirty seven surveys were undelivered and 110 companies responded that for various reasons
of them had substantial global networks, of which seven were large Fortune 500 companies, and six were ranked inGlobal 500.2 The firms were from the following primary SIC codes: SIC 28-Chemicals and allied products; SIC 35 - Industrialand machinery equipment; SIC 36-Electronic and other electric equipment; SIC 38-Instruments and relatedproducts; SIC 73-Computer and data processing; SIC 87-Engineering and management services.
16
they were unable to participate. From the effective sampling frame of 1653, 293 firms agreed to
participate in the survey.
In the second stage, we mailed the survey, along with a cover letter and a business reply
envelope, to the 293 executives. This was followed by a telephone/e-mail reminder two weeks
after the first mailing, and then a second mailing was done about three weeks later. In both the
cover letter and the instructions on the questionnaire, respondents were reminded that the survey
deals with their respective firms’ alliance related activities. Accordingly, they were told to focus
on their firms’ alliances along the different value-chain activities (i.e., new product development,
marketing, distribution, manufacturing, R&D, suppliers, customers). Further, the respondents
were provided with a working definition of alliances in the above mentioned domains as
“relatively enduring cooperative arrangements, equity-based or otherwise, involving
interdependence and resource-linkages, having the express purpose of joint accomplishment of
goals linked to the corporation mission of each firm.” After the two mailings, a total of 184
companies responded. Subsequently, we electronically mailed the surveys to the non-responding
informants and through this process received additional responses from 53 firms. Thus, we
received responses from 237 firms for an effective response rate of 14.34%. Two of these
returned surveys were discarded due to excess amount of missing data. From 28 firms, we
received two responses. In subsequent analysis we used the response from the more senior
manager. In effect, the final sample size is 235 different firms.
Validity of Responses
While survey research has been useful in understanding organizational behavior, and in
certain contexts, may be the only feasible way to get the desired information (Huber and Power,
1985; Dess and Robinson, 1984), there are several concerns related to the validity of this data
collection methodology. In particular, three issues have been raised: (i) selection of key
17
informants and informant bias in responding to the survey; (ii) non-response bias which leads to
a systematic exclusion of firms from the population; and (iii) problems related to common
method variance (Huber and Power, 1985; Podsakoff and Organ, 1986).
Survey methodology was used in this study because our focus on organizational
processes which are difficult to ascertain from archival sources. However, we were cognizant of
the above mentioned problems related to perceptual measures and took careful steps both prior to
collecting the data and questionnaire design, and through post hoc procedures, First, in designing
the survey, as suggested by Parkhe (1993), the measures for dependent variables related to
performance preceded the independent variables. Second, in order to further minimize effects of
consistency artifacts, open-ended questions were interspersed throughout the instrument and the
anchors for scales varied for certain constructs (i.e., use of both Likert scales and indices).
Regarding issues related to key informants, we targeted managers who were explicitly
responsible for the respective firm’s alliance operations.
Respondents were mostly senior level executives, with the following breakdown:
CEO/President – 17.6%; Vice-President - 54.5%; Director – 23.2%; Manager – 4.7%. The
respondents on average had 10.3 years of experience with their current firms. To assess non-
response bias, early and late responders were compared on sales volume, number of employees,
and the items used to measure market performance (Armstrong and Overton, 1977). The results
indicate no statistically significant difference between these groups.
Finally, we examined the common method variance issue through three post hoc
statistical tests. First, we used Harman’s one-factor test. The logic behind this test is that if
common method variance is a serious issue in the data, a single factor will emerge or one general
factor will account for most of the covariance in the independent and dependent variables
(Aulakh and Kotabe, 1997; Podsakoff and Organ, 1986). We performed a factor analysis on
items related to the partnering proactiveness, relational orientation, portfolio coordination and
alliance portfolio capital, extracting four factors with eigen values greater than one.
Furthermore, no general factor was apparent in the unrotated factor structure, with Factor 1
18
accounting for only 17% of the variance. Second, we conducted Wilcoxon Signed-Ranks Test for
paired sample data that came from multiple respondents on matched firms. In all, we identified
28 companies that had two respondents. We did the Wilcoxon signed-ranks tests in two steps. In
the first step, tests were conducted at the item-level on the various independent and dependent
variables. The null hypotheses, that there is no difference in response between the respondents,
could not be rejected for any of the items. In the second stage, we summated the individual
items to create the constructs used in our study and conducted the Wilcoxon signed-ranks tests
on these constructs. All the null hypotheses were not rejected.
Finally, our sample contained inputs from 94 public firms, of which 12 reported that they
were responding at the business-unit level. For the remaining 82 firms, we collected
performance data from the COMPUSTAT database. We collected data on commonly used
measures of performance – Return on Assets (ROA), Return on Equity (ROE), Return on
Investment (ROI) and Sales Growth (SG) for 1996, 1997 and 1998. We subtracted the industry
average from each firm’s ROA, ROE, ROI and SG to control for industry effects (Agle, Mitchell
and Sonnenfield 1999). We then averaged three years of performance data and correlated the
four with perceptual measure of market performance. The correlations between market
performance and averaged ROA, ROE, ROI and SG are 0.45, 0.41, 0.44, 0.31, respectively, all
significant at p < .05. The above-described tests indicate satisfactory validation of our survey
measures.
--------------------------------Insert Table 2 Here
-------------------------------------
Measures
Table 2 reports individual items and their loadings on relevant constructs. The 5-item likert scale
for alliance proactiveness ( = .83) tapped a firm’s efforts to collect information from diverse
channels about alliance opportunities, and its general state of alertness in sensing and responding
to partnering opportunities. The 5-item relational orientation likert scale ( = .79) was adapted
19
from Heide and John (1992), and measured the cooperative, long-term approach of relationship
building with alliance partners. The 5-item likert scale for portfolio coordination ( = .82)
measured the extent to which a firm integrated its activities, strategies, and knowledge flows
across its alliance portfolio. Alliance portfolio capital ( = .78) was measured as a firm’s
partnering reputation as a reliable network member (Benjamin and Podolny, 1999), the
relationships the firm has accumulated over time (Granovetter, 1985), and the competitiveness of
the firm’s alliance network. The dichotomous alliance function scale is similar to Kale, Dyer,
and Singh (2002). Respondents were asked whether their organization had a formal, dedicated
program that was responsible for overseeing the firm’s alliances. For firm market performance,
we adapted Venkatraman and Ramanujam's (1986) formative scale and measured four aspects,
namely market share, sales growth, market development and product development. Respondents
rated their performance, relative to competitors to control for industry effects (Judge and
Douglas, 1998) on a 5-point scale with the anchors being 'Much Worse' and 'Much Better'.
Controls: Firm size is operationalized as the natural logarithm of total sales. Industry effect is
controlled through the inclusion of a variable, resource munificence, operationalized from a four-
item scale which measures the extent to which resources for growth are available in the firm’s
industry. Alliance experience was measured as the natural logarithm of the total number of a
firm’s alliances. Alliance diversity was operationalized as a variation of Blau’s index.
Respondents were asked to note their number of alliances in each of the following areas: New
Product Development, R&D/Technology, Marketing/Distribution, Supplier, Manufacturing, and
Customer. We then computed alliance portfolio diversity for each firm by adapting Powell et
al’s. (1996) network portfolio diversity measure, as follows: D is the diversity measure and p the
proportion of the firm’s alliances in each of the 6 alliance categories.
6
D = 1- pi2
j=1
20
Measurement Model
We use confirmatory factor analysis techniques using the maximum likelihood estimation
in EQS v 5.7b to check for convergent and discriminant validity as well as factor structure of our
four critical self-reported scales, namely the three process variables and alliance portfolio capital.
Through a series of iterations, some items that were either cross-loading or not loading on to the
intended construct adequately were eliminated. The refined measurement model indicates
acceptable fit ( = 108.76, d.f. = 1.14, GFI = 0.95, CFI = 0.99, RMSEA = 0.024). Convergent
validity was indicated by the fact that all standardized loadings were above .58 and significant (p
< .01), and lack of cross-loadings. Composite reliabilities ranged from .78 to .83, well above the
recommended .6 cut-off. Inter-factor correlations were significant and positive, ranging from .37
to .54, indicating nomological validity. Discriminant validity was assessed in two ways. Chi-
square difference tests, in which correlation between pairs of constructs were freely estimated
and then constrained to 1 (Joreskog, 1971), were conducted. In each instance, the difference in
chi-square from the baseline four-factor model was significant, thus indicating both discriminant
validity as well as support for a four-factor structure modeli. Further, average variance extracted
(AVE), which measures the amount of variance captured by a construct’s measures relative to
measurement error, all achieved recommended levels of .5, with the exception of relational
orientation which was marginally lower at .47 (Fornell and Larcker, 1981). The squared
correlation between pairs of constructs, which ranged between .14 and .25, was compared with
AVE. The AVE of each construct turned out to be greater than its squared correlation with any
other factor, thus further indicating discriminant validity. Therefore, it appears that the scale
measures are internally consistent, able to discriminate, and provide a good fit of the model to
the data.
21
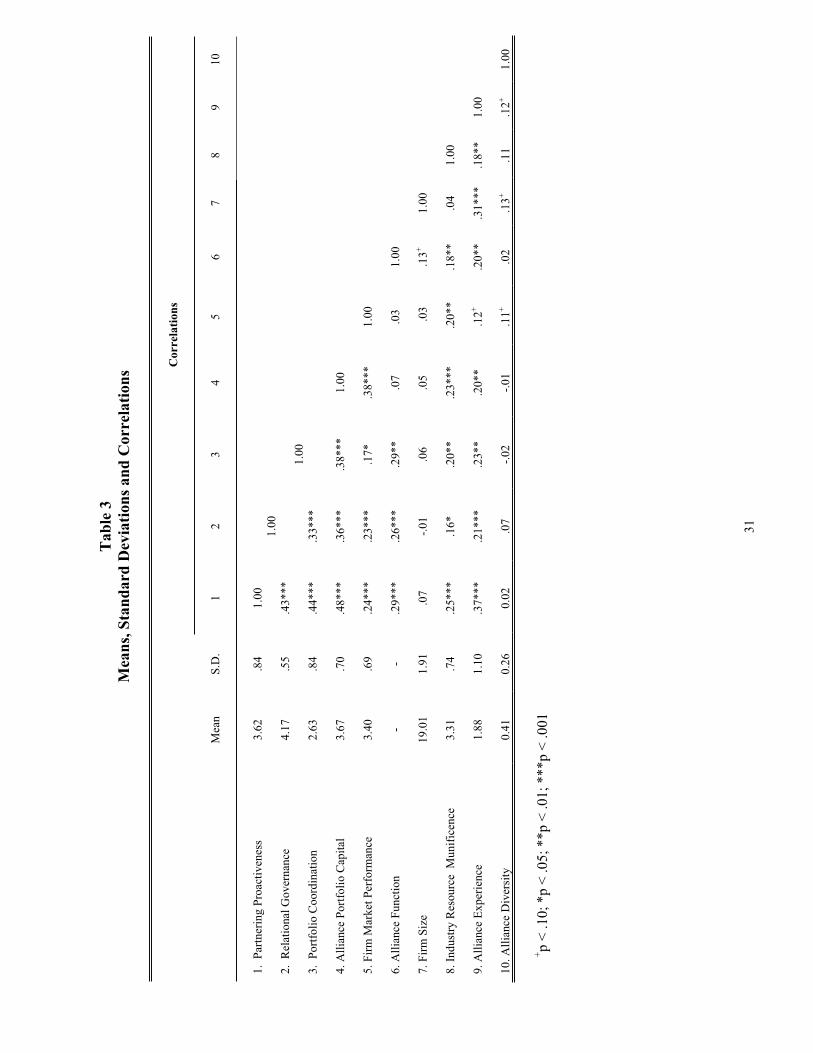
--------------------------------Insert Table 3 Here
--------------------------------------
RESULTS
The hypotheses were tested through ordinary least squares regression. The descriptive
statistics and correlations of the summated scores are provided in Table 3. We performed
collinearity diagnostics by examining the bivariate correlations and variance inflation factors
(VIFs). None of VIFs in all the regression equations was more than 2.0, well below the accepted
cut-of 10. Furthermore, assumptions of equality of variance, independence of error, and
normality of the distribution of errors were met for all regression equations. The hypotheses
were tested in two stages: first, the antecedents of alliance portfolio capital, and second, the
relationship between alliance portfolio capital and the firm’s market performance.
--------------------------------Insert Table 4 Here
--------------------------------------
In the first stage, the hypotheses related to the direct impact of the three process aspects
(partnering proactiveness, relational orientation and portfolio coordination) (H1 to H3) as well as
the moderating role of alliance function (H4a-H4c) were tested through OLS hierarchical
regression. Accordingly, a two step model was run with alliance portfolio capital as the
dependent variable and the three process aspects, moderator, three interactions, and three
controls as the independent variables. Results are provided in Table 4
--------------------------------Insert Table 4 Here
--------------------------------
As shown in the table, the Model 1 is significant (F(7, 202) = 10.72, p < .001) and the set of
independent variables explain 24% variance in alliance portfolio capital. In terms of individual
22
hypotheses, the beta coefficient for partnering proactiveness is positive and significant ( = .29,
p < .001), thus supporting H1. We also find support for the positive relationship ( = .15, p <
.05) between relational orientation and alliance portfolio capital thus supporting H2. H3 is also
supported as the beta coefficient for portfolio coordination is positive and significant ( = .18, p
< .01). Thus, we find strong support for the direct impact of the three process aspects identified
in this study in enhancing the firm’s alliance portfolio capital.
In model 2, we added the moderator variable (alliance function) and the three interactions
to examine the incremental impact on model fit and test. As shown in the table, this significantly
improves the model fit. The overall model is significant (F(11, 198) = 8.35, p < .001), the change in
F-value is significant ( F=3.34, p < .05) and there is a significant increased in explained
variance (adjusted r-square = .28). In terms of the individual interactions, as expected, the beta
coefficient for the interaction between partnering proactiveness and alliance function is positive
and significant ( = .23, p < .05), thus supporting H4a. Similarly the interaction term for
relational orientation and alliance function is positive and significant ( = .16, p < .10)
supporting H4b. Contrary to our hypothesized relationship, we find that alliance function
negatively moderates the relationship between portfolio coordination and alliance portfolio
capital ( = -.19, p < .10) thus contradicting H4c.
To evaluate the moderating effect of alliance function further, we performed sub-group
analyses, the results of which are provided in Table 5. We divided the sample into two groups
(Group 1 being firms without a dedicated alliance function and Group 2 consisting of firms with
a dedicated alliance function). Subsequently, we ran two regression models for the two groups
whereby alliance portfolio capital is regressed on the three process variables and the four
controls. While both models are significant, we find that the explained variance is higher for the
23
group with the alliance function (Adjusted R2Group2 = 0.34) than for the group without an alliance
function (Adjusted R2Group1 = 0.27) and the overall Chow test shows significant differences
(F(7,214) = 3.12, p < .05). We also find that proactiveness has a consistent positive effect on
alliance portfolio capital although the effect is stronger for Group 2 ( = .40, p < .001) than for
Group 1 ( = .23, p < .05). Similarly, for relational orientation, the effect is stronger for Group 2
( = 0.26, p < .01) than for Group 1 ( = .09, p > .10). Thus, as expected in H4a and H4b, we
find a positive moderating effect of alliance function. For portfolio coordination, we find that
the effects for Group 1 with no alliance function ( = 0.36, p < .001) is stronger than for Group 2
with an alliance function ( = 0.12, p > .10) which suggests a negative moderation. These
findings are discussed in the next section.
--------------------------------Insert Table 5 Here
--------------------------------
To test H5, which relates to the impact of a firm’s portfolio capital on its market
performance, we ran a hierarchical regression model. In Model 1, we regressed market
performance on the four control variables, the three process aspects, alliance function, and the
three interactions. In Model 2, alliance portfolio capital was added to the equation. This
approach allowed us to assess whether there were any direct effects of partnering proactiveness,
relational orientation, portfolio coordination as well as alliance function on market performance
or if these effects were mediated by alliance portfolio capital. Results are provided in Table 6.
The overall models are significant at p < .001 level, the explained variance is 6% and
13%, respectively for the two models and the change in r-square (7%) is significant at p < .001.
In terms of H5, we find a positive and significant relationship ( = .32, p < .001) between firm’s
alliance portfolio capital and market performance. Furthermore, the results also show that the
24
alliance portfolio capital mediates the relationship between the three alliance process aspects
identified in this paper and market performance (there is no significant coefficient in Model 2).
--------------------------------Insert Table 6 Here
--------------------------------
DISCUSSION
As firms transform from atomistic units into ones with flexible boundaries, their ability to
design, manage, and leverage their portfolio of strategic partnerships assumes increasing
relevance in explaining heterogeneous outcomes from their alliance networks. This is so since
managing a particular alliance relationship as part of an interconnected portfolio of relationships
could yield performance advantages over firms that manage them atomistically. However, while
the strategic importance of being able to access and leverage partner resources and capabilities
has never been higher, it is intriguing that most of the literature on alliances that examines
processes does so at the dyadic level (i.e., within a particular partnership). In contrast, the
alliance capability literature has tended to implicitly assume, or at least downplay, the role of
process. This is all the more significant since processes form the bedrock of competitive
advantage (Ray, Barney and Muhanna, 2004).
One reason for this lacuna may be that the alliance portfolio literature is as yet incipient.
Our research was motivated by the need to complement existing studies on the topic. Although
the literature rooted in firm capabilities does point to the importance of focusing on firms’
alliancing routines and processes, our understanding however of what exactly underlies such
capabilities is limited. This paper makes a contribution by more carefully and systematically
investigating underlying processes which contribute to the strengthening of alliance portfolio
capital, which in turn has implications for competitive advantage and ultimately performance. In
25
this regard, we link alliance portfolio capital to its processes encompassing proactive portfolio
formation, relationship management, and network coordination.
In essence, the positive relationship between a firm’s alliance portfolio capital and its
market performance supports some recent theoretical linkages in the network literature between
social capital and rent generation and appropriation (Blyler and Coff, 2003). As we move
towards a greater understanding of portfolios and networks as resource and knowledge
repositories, Pettigrew, Thomas and Whittington’s (2001: 18) contention that participation in
networks and skills in operating within them “are now seen to be key additional factors in
explaining the old strategy questions of ‘why do firms differ in their conduct and profitability’”
acquires even greater import. Overall, to derive sustainable competitive advantage, a firm needs
to not only develop a network of alliances but also to develop processes needed to build and
strengthen their alliance portfolio capital. The link between such processes and firm performance
is an important area for future research. Recent empirical findings of fixed-firm effects in
individual firms’ alliance performance seems to indicate heterogeneity in firms’ alliance
capabilities, since such effects existed even after controlling for alliance experience (Anand and
Khanna, 2000).
While we find no direct relationship between an alliance function and alliance portfolio
capital, our findings regarding the contingency impact of a dedicated alliance function on the
relationship of these three processes on alliance portfolio capital are mixed. The lack of a direct
relationship of an alliance function on alliance portfolio capital is intriguing. It appears that
creating an alliance function is unlikely to have much impact on desired organizational outcomes
since it is by itself not a driver of alliance portfolio capital, and again focuses us back on
processes. However, we find that the relationships between proactiveness and alliance portfolio
26
capital and between relational orientation and alliance portfolio capital strengthen in the presence
of an alliance program. Therefore, there appears to be a synergistic relationship where proactive
alliance opportunity and relational oriented processes share a co-specialized relationship with an
institutionalized formalization of the function, where one builds on the other. On the other hand,
its negative moderating effect on the relationship between coordination process and alliance
portfolio capital is intriguing in that it suggests the following: although portfolio coordinating
activities serve to enhance alliance portfolio capital, the incremental value of investing in such
processes diminishes in the presence of a dedicated alliance function. One possible interpretation
of this finding is that coordination processes and formalization of the alliance function are
substitutable, with the former being the organizational routine equivalent of a structural
mechanism.
Our findings need to be interpreted in the context of the potential limitations inherent in
this research. Since our research is survey-based, the data is perceptual in nature. Yet this
perhaps is not so significant an issue, especially in the light of findings of a high correlation
between subjective and objective measures of performance in research on joint ventures and
alliances (Geringer and Hebert, 1991; Kale et al., 2002). Besides, since our data is cross-
sectional in nature and was collected at one point in time, no inferences of causality can be
conclusively established, nor can we discount the possibility of reverse causality. Also,
formation and management processes typically occur at different stages of the life-cycle of an
alliance network, thus raising the question whether there is a multi-stage sequence wherein
process leads to structure, which in turn triggers off processes, and so on. For both these
concerns, a longitudinal design, cross-validation of findings, and additional sources of data
would enable us to further assess the causality of the hypothesized relationships. A related issue
27

is that of common method variance. While we have taken ample steps to reduce the concern that
this may be a problem, more elaborate research designs could have assuaged such concerns.
In summary, we note that there is little formalization of a framework that links
organizational processes to alliance portfolio capital derived from a firm’s network of alliance
relationships. Our research is a step forward in this direction.
28
Ta
ble
1
Pro
cess
Dim
ensi
on
s
Org
an
iza
tio
na
l P
roce
ssD
efin
itio
nS
ou
rce
of
Str
ate
gic
Ad
va
nta
ge
Pa
rtn
erin
g P
roa
ctiv
enes
s A
n o
rgan
izat
ion
’s e
ntr
epre
neu
rial
eff
ort
s to
d
isco
ver
an
d a
ct o
n n
ew a
llia
nce
op
po
rtu
nit
ies.
Fir
st-m
ov
er a
dv
anta
ges
in
im
per
fect
fac
tor
mar
ket
fo
r p
artn
ers
Rel
ati
on
al
Ori
enta
tio
nA
n o
rgan
izat
ion
’s e
ng
agem
ent
in a
ctiv
itie
s fo
r th
e d
evel
op
men
t o
f in
form
al s
elf-
enfo
rcin
g
safe
gu
ard
s in
th
eir
coll
abo
rati
ve
rela
tio
nsh
ips.
Lo
wer
ing
co
ntr
acti
ng
an
d m
on
ito
rin
g c
ost
s an
d
incr
easi
ng
in
cen
tiv
es f
or
val
ue-
crea
tin
g
init
iati
ves
by
all
ian
ce p
artn
ers
Po
rtfo
lio
Co
ord
ina
tio
nA
n o
rgan
izat
ion
’s e
ng
agem
ent
in i
nte
gra
tin
g
and
sy
nch
ron
izin
g a
ctiv
itie
s ac
ross
th
eir
alli
ance
s
Incr
easi
ng
kn
ow
led
ge
flo
ws
and
bro
ker
ing
in
form
atio
n a
cro
ss t
he
port
foli
o o
f al
lian
ces
29
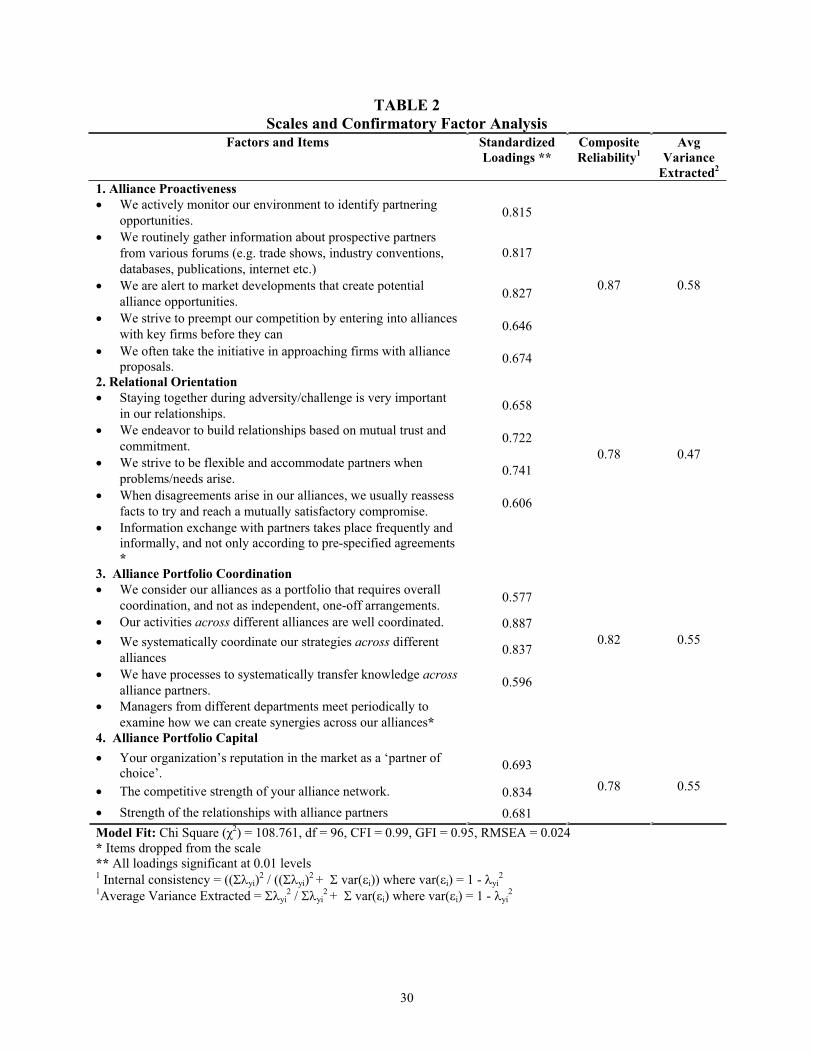
TABLE 2
Scales and Confirmatory Factor Analysis
Factors and Items Standardized
Loadings **
Composite
Reliability1
Avg
Variance
Extracted2
1. Alliance Proactiveness
We actively monitor our environment to identify partnering
opportunities.0.815
We routinely gather information about prospective partners
from various forums (e.g. trade shows, industry conventions,
databases, publications, internet etc.)
0.817
We are alert to market developments that create potential
alliance opportunities.0.827
We strive to preempt our competition by entering into alliances
with key firms before they can0.646
We often take the initiative in approaching firms with allianceproposals.
0.674
0.87 0.58
2. Relational Orientation
Staying together during adversity/challenge is very important
in our relationships.0.658
We endeavor to build relationships based on mutual trust and
commitment.0.722
We strive to be flexible and accommodate partners when
problems/needs arise. 0.741
When disagreements arise in our alliances, we usually reassess
facts to try and reach a mutually satisfactory compromise.0.606
0.78 0.47
Information exchange with partners takes place frequently andinformally, and not only according to pre-specified agreements*
3. Alliance Portfolio Coordination
We consider our alliances as a portfolio that requires overall
coordination, and not as independent, one-off arrangements.0.577
Our activities across different alliances are well coordinated. 0.887
We systematically coordinate our strategies across different
alliances0.837
We have processes to systematically transfer knowledge across
alliance partners.0.596
0.82 0.55
Managers from different departments meet periodically to
examine how we can create synergies across our alliances*
4. Alliance Portfolio Capital
Your organization’s reputation in the market as a ‘partner ofchoice’.
0.693
The competitive strength of your alliance network. 0.834
Strength of the relationships with alliance partners 0.681
0.78 0.55
Model Fit: Chi Square ( 2) = 108.761, df = 96, CFI = 0.99, GFI = 0.95, RMSEA = 0.024* Items dropped from the scale** All loadings significant at 0.01 levels1 Internal consistency = (( yi)
2 / (( yi)2 + var( i)) where var( i) = 1 - yi
2
1Average Variance Extracted = yi2 / yi
2 + var( i) where var( i) = 1 - yi2
30
Ta
ble
3
Mea
ns,
Sta
nd
ard
Dev
iati
on
s an
d C
orr
elati
on
s
Co
rrel
ati
on
s
Mea
nS
.D.
12
34
56
78
910
1. P
artn
erin
g P
roac
tiv
enes
s3
.62
.84
1.0
0
2. R
elat
ional
Go
ver
nan
ce
4.1
7.5
5.4
3*
**
1.0
0
3. P
ort
foli
o C
oord
inat
ion
2.6
3.8
4.4
4*
**
.33
**
*1
.00
4.
All
iance
Po
rtfo
lio
Cap
ital
3.6
7.7
0.4
8*
**
.36
**
*.3
8*
**
1.0
0
5.
Fir
m M
ark
et P
erfo
rman
ce3
.40
.69
.24
**
*.2
3*
**
.17
*.3
8*
**
1.0
0
6.
All
iance
Fu
nct
ion
-
-.2
9*
**
.26
**
*.2
9*
*.0
7.0
31
.00
7.
Fir
m S
ize
19
.01
1.9
1.0
7-.
01
.06
.05
.03
.13
+1
.00
8.
Ind
ust
ry R
esou
rce
Mu
nif
icen
ce3
.31
.74
.25
**
*.1
6*
.20
**
.23
**
* .
20
**
.1
8*
*.0
41
.00
9.
All
iance
Ex
per
ien
ce1
.88
1.1
0.3
7*
**
.21
**
*.2
3*
*.2
0*
*.1
2+
.20
**
.31
**
*.1
8*
*1
.00
10
. A
llia
nce
Div
ersi
ty0
.41
0.2
60
.02
.07
-.0
2-.
01
.11
+.0
2.1
3+
.11
.12
+1
.00
+p
< .
10
; *
p <
.0
5;
**
p <
.01
; *
**
p <
.0
01
31
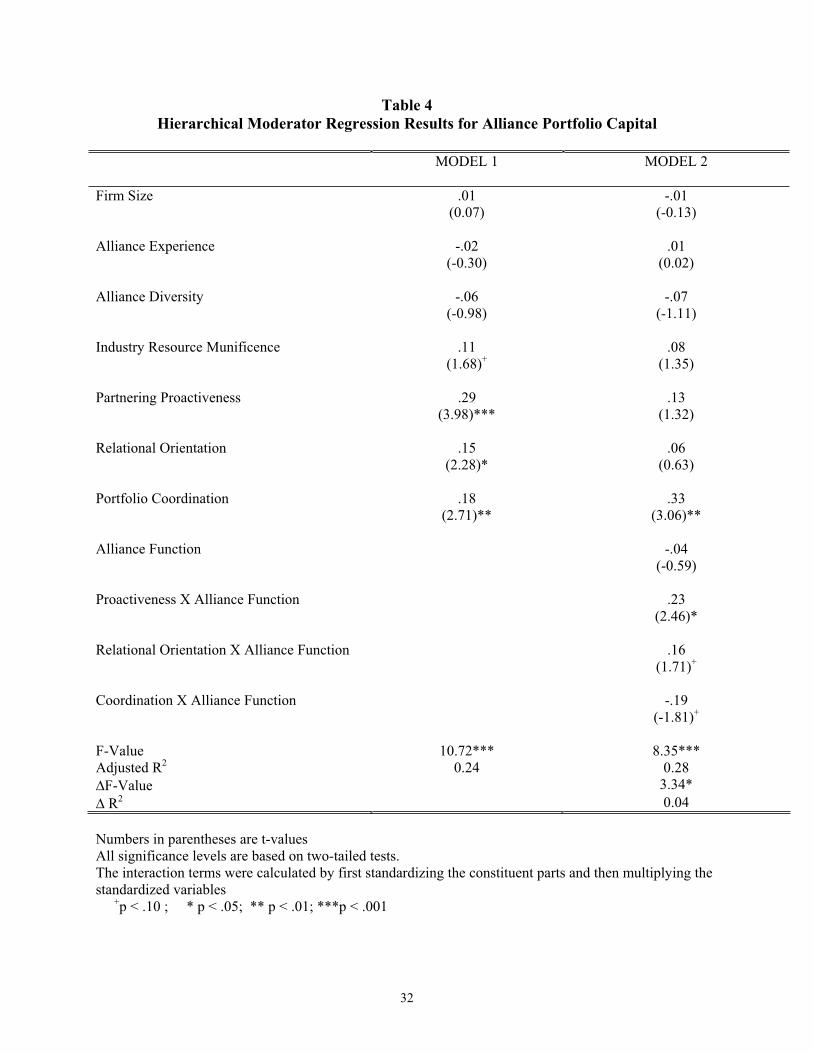
Table 4
Hierarchical Moderator Regression Results for Alliance Portfolio Capital
MODEL 1 MODEL 2
Firm Size .01(0.07)
-.01(-0.13)
Alliance Experience -.02(-0.30)
.01(0.02)
Alliance Diversity -.06(-0.98)
-.07(-1.11)
Industry Resource Munificence .11(1.68)+
.08(1.35)
Partnering Proactiveness .29(3.98)***
.13(1.32)
Relational Orientation .15(2.28)*
.06(0.63)
Portfolio Coordination .18(2.71)**
.33(3.06)**
Alliance Function -.04(-0.59)
Proactiveness X Alliance Function .23(2.46)*
Relational Orientation X Alliance Function .16(1.71)+
Coordination X Alliance Function -.19(-1.81)+
F-Value 10.72*** 8.35***Adjusted R2 0.24 0.28
F-Value 3.34*
R2 0.04
Numbers in parentheses are t-values All significance levels are based on two-tailed tests.The interaction terms were calculated by first standardizing the constituent parts and then multiplying the standardized variables
+p < .10 ; * p < .05; ** p < .01; ***p < .001
32
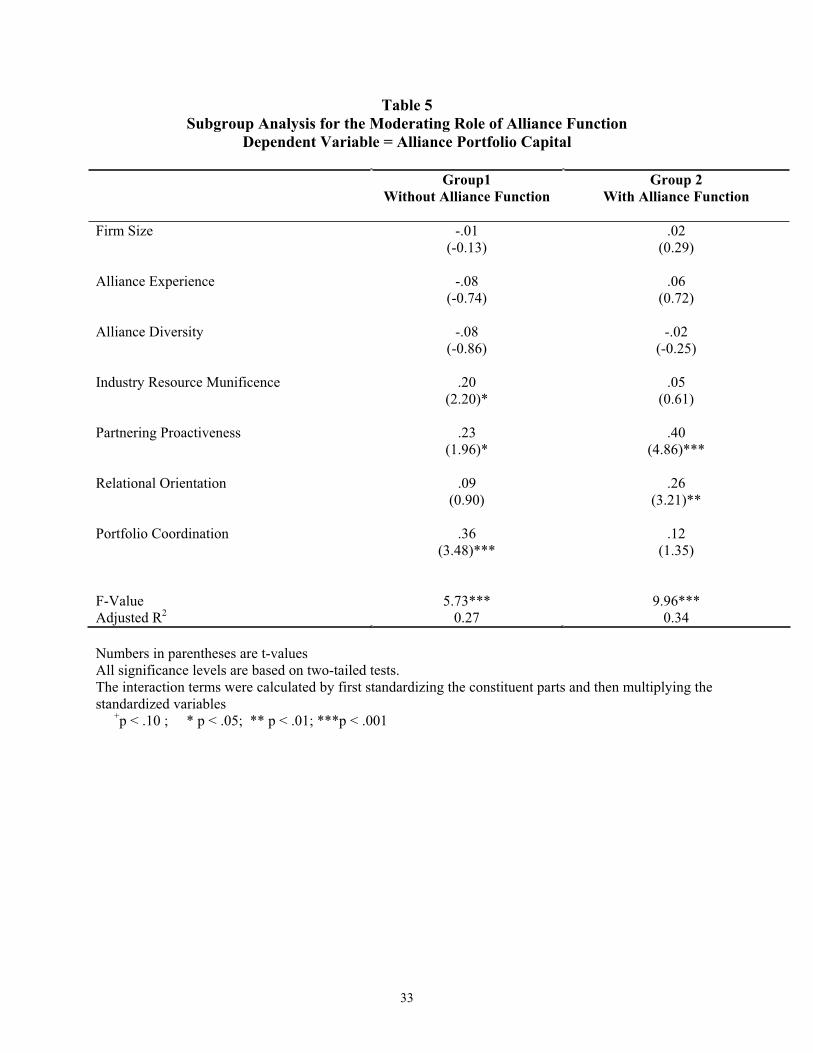
Table 5
Subgroup Analysis for the Moderating Role of Alliance Function
Dependent Variable = Alliance Portfolio Capital
Group1
Without Alliance Function
Group 2
With Alliance Function
Firm Size -.01(-0.13)
.02(0.29)
Alliance Experience -.08(-0.74)
.06(0.72)
Alliance Diversity -.08(-0.86)
-.02(-0.25)
Industry Resource Munificence .20(2.20)*
.05(0.61)
Partnering Proactiveness .23(1.96)*
.40(4.86)***
Relational Orientation .09(0.90)
.26(3.21)**
Portfolio Coordination .36(3.48)***
.12(1.35)
F-Value 5.73*** 9.96***Adjusted R2 0.27 0.34
Numbers in parentheses are t-values All significance levels are based on two-tailed tests.The interaction terms were calculated by first standardizing the constituent parts and then multiplying the standardized variables
+p < .10 ; * p < .05; ** p < .01; ***p < .001
33
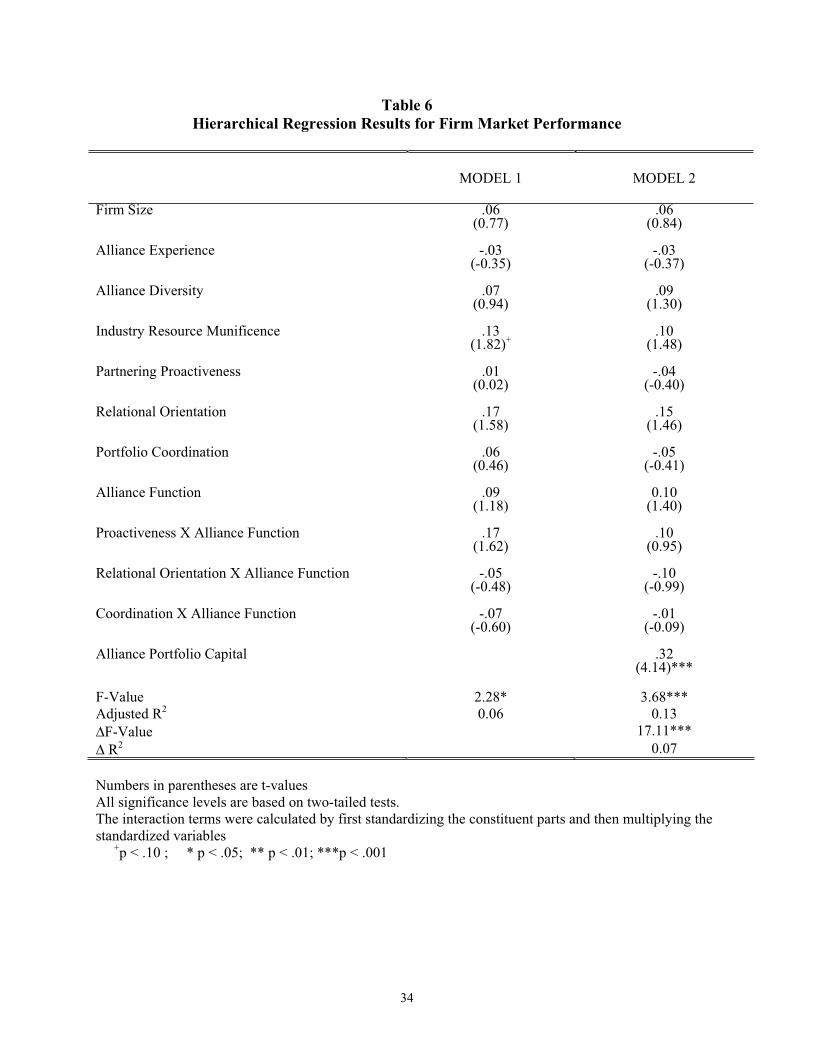
Table 6
Hierarchical Regression Results for Firm Market Performance
MODEL 1 MODEL 2
Firm Size .06(0.77)
.06(0.84)
Alliance Experience -.03(-0.35)
-.03(-0.37)
Alliance Diversity .07(0.94)
.09(1.30)
Industry Resource Munificence .13(1.82)+
.10(1.48)
Partnering Proactiveness .01(0.02)
-.04(-0.40)
Relational Orientation .17(1.58)
.15(1.46)
Portfolio Coordination .06(0.46)
-.05(-0.41)
Alliance Function .09(1.18)
0.10(1.40)
Proactiveness X Alliance Function .17(1.62)
.10(0.95)
Relational Orientation X Alliance Function -.05(-0.48)
-.10(-0.99)
Coordination X Alliance Function -.07(-0.60)
-.01(-0.09)
Alliance Portfolio Capital .32(4.14)***
F-Value 2.28* 3.68***Adjusted R2 0.06 0.13
F-Value 17.11***
R2 0.07
Numbers in parentheses are t-values All significance levels are based on two-tailed tests.The interaction terms were calculated by first standardizing the constituent parts and then multiplying the standardized variables
+p < .10 ; * p < .05; ** p < .01; ***p < .001
34
References
Achrol RS, Kotler P. 1999. Marketing in the network economy. Journal of Marketing 63(SpecialIssue): 146-63.
Alliance Analyst. 1998. Measuring alliance performance. August 1998. NewCap Communications: Philadelphia, PA.
Anand BN, Khanna T. 2000. Do firms learn to create value? The case of alliances. Strategic
Management Journal 21(Special Issue): 295-315.
Anderson JC, Hakansson H, Johanson J. 1994. Dyadic business relationships within a business network context. Journal of Marketing 58(4): 1-16.
Argote L. 1999. Organizational Learning: Creating, Retaining and Transferring Knowledge.Kluwer Academic Publishers: Boston, MA.
Armstrong JS, Overton TS. 1977. Estimating nonresponse bias in mail surveys. Journal of
Marketing Research 14(3): 396-402.
Aulakh PS, Kotabe M. 1997. Antecedents and performance implications of channel integration in foreign markets. Journal of International Business Studies 28(1): 145-175.
Bamford J, Ernst D. 2002. Managing an alliance portfolio. The McKinsey Quarterly 3: 29-39.
Benjamin BA, Podolny JM. 1999. Status, quality, and social order in the California wineindustry. Administrative Science Quarterly 44(3): 563-89.
Blyler M, Coff RW. 2003. Dynamic capabilities, social capital, and rent appropriation: Ties thatsplit pies. Strategic Management Journal 24: 677-686.
Burt RS. 1992. Structural holes: The social structure of competition. Harvard University Press: Boston, MA
Dess G, Robinson RB Jr. 1984. Measuring organizational performance in the absence of objective measures: The Case of the privately-held firm and conglomerate business unit. Strategic Management Journal 5(3): 265-273.
DeVellis RF. 1991. Scale development: Theory and applications. Sage: Newbury Park, CA.
Dyer JH, Singh H. 1998. The Relational view: Cooperative strategy and sources of interorganizational competitive advantage. Academy of Management Review 23(4): 660-79.
Dyer JH, Nobeoka K. 2000. Creating and managing a high-performance knowledge-sharing network: The Toyota case. Strategic Management Journal 21(3): 345-367.
35
Eisenhardt KM, Martin JA. 2000. Dynamic capabilities: what are they? Strategic Management
Journal 21(10-11): 1105-1121.
Fornell C, Larcker DF. 1981. Evaluating Structural Equation Models with Unobservable Variables and Measurement Error. Journal of Marketing Research 18(February): 39-50.
Geringer JM. 1988. Selection of partners for international joint ventures. Business Quarterly
53(2): 31-37.
Geringer JM, Hebert L. 1991. Measuring Performance of International Joint Ventures. Journal of
International Business Studies 2: 249-263.
Gomes-Casseres B. 1996. The Alliance revolution: The new shape of business rivalry. Harvard University Press: Cambridge, MA
Granovetter M. 1985. Economic action and social structure: The problem of embeddedness.American Journal of Sociology 91(3): 481-510.
Granovetter M. 1992. Networks and organizations: structure, form, and action. Harvard Business School Press: Boston, MA
Gulati R. 1998. Alliances and networks. Strategic Management Journal 19: 293-317.
Harbison JR, Pekar P Jr. 1998. Smart alliances: A practical guide to repeatable success. Josey-Bass: San Francisco, CA
Hargadon A, Sutton RI. 1997. Technology brokering and innovation in a product developmentfirm. Administrative Science Quarterly 42: 716-749.
Heide JB, John G. 1992. Do norms matter in marketing relationships? Journal of Marketing
56(2): 32-45.
Hill CWL. 1990. Cooperation, opportunities, and the invisible hand: Implication for transactioncost theory. Academy of Management Review 15(3): 500-13.
Huber GP, Power DJ. 1985. Retrospective reports of strategic-level managers: Guidelines for increasing their accuracy. Strategic Management Journal 6(2): 171-181.
Joreskog KG. 1971. Simultaneous factor analysis in several populations. Psychometrika 36: 409-426.
Judge WQ Jr, Douglas TJ. 1998. Performance implications of incorporating natural environmental issues into the strategic planning process: An empirical assessment. The
Journal of Management Studies 35(2): 241-262.
36
Kale P, Dyer JH, Singh H. 2002. Alliance capability, stock market response, and long-termalliance success: The role of the alliance function. Strategic Management Journal 23(8): 747-67.
Khanna T, Gulati R, Nohria N. 1994. Unilateral commitments and the importance of process inalliances. Sloan Management Review 35: 61-69.
Khanna T. 1998. The scope of alliances. Organization Science 9(3): 340-55.
Koka BR, Prescott JE. 2002. Strategic alliances as social capital: A multidimensional view.Strategic Management Journal 29(9): 795-816.
Madhok A. 2002. Reassessing the fundamentals and beyond: Ronald Coase, the transaction cost and resource-based theories of the firm and the institutional structure of production. Strategic
Management Journal 23(6): 535-550.
Madhok A, Tallman SB. 1998. Resources, transactions, and rents: Managing value throughinterfirm collaborative relationships. Organization Science 9(3): 326-339.
Parise S, Casher A. 2003. Alliance portfolios: Designing and managing your network of business-partner relationships. Academy of Management Executive 17(4): 25-39.
Parkhe A. 1993. Strategic alliance structuring: A game theory and transaction cost examinationof interfirm cooperation. Academy of Management Journal 36: 794-829.
Pettigrew AM, Thomas H, Whittington R. 2001. Strategic Management: The Strengths and Limitations of a field. In Handbook of strategy and management, Pettigrew AM, Thomas H, Whittington R. (Eds.). Sage: London; 3-30.
Podsakoff P, Organ D. 1986. Reports in organizational research: Problems and prospects. Journal of Management Studies 27: 305-327.
Poppo L, Zenger TR. 2002. Do Formal Contracts and Relational Governance Function as Substitutes or Complements? Strategic Management Journal 23(8).
Powell W. 1998. Learning from Collaboration: Knowledge and Networks in the Biotechnology and Pharmaceutical Industries. California Management Review 40(3): 228-240.
Powell W, Koput KW, Smith-Doerr L. 1996. Interorganizational collaboration and the locus of innovation: Networks of learning in biotechnology. Administrative Science Quarterly 41(1):116-45.
Ray G, Barney JB, Muhanna WA. 2004. Capabilities, business processes, and competitiveadvantage: Choosing the dependent variable in empirical tests of the resource-based view. Strategic Management Journal 25: 23-37.
37
Sarkar MB, Echambadi R, Harrison J. 2001. Alliance Entrepreneurship and Firm Market Performance. Strategic Management Journal 22(6/7): 701-711.
Simonin BL. 1997. The importance of collaborative know-how: An Empirical test of the learning organization. Academy of Management Journal 40(5): 1150-74.
Teece DJ, Pisano G, Shuen A. 1997. Dynamic capabilities and strategic management. Strategic
Management Journal 18: 509-33.
Tsai W, Ghoshal S. 1998. Social capital and value creation: The Role of interfirm networks. Academy of Management Journal 41(4): 359-374.
Williamson OE. 1985. The Economic Institutions of Capitalism. The Free Press: New York
Venkatraman N, Ramanujam V. 1986. Measurement of business performance in strategy research: A Comparison of approaches. The Academy Of Management
Review 11(4): 801-15.
Zajac EJ, Olsen CP. 1993. From transaction cost to transactional value analysis: Implications for the study of interorganizational strategies. The Journal of
Management Studies 30(1): 131-146.
38