Embed Size (px)
Citation preview

Introduction
The majority of the vertebrate appendicular and axial skeleton isformed by endochondral ossification, a developmental processthat requires the formation of a cartilage template intermediate.Longitudinal growth of long bones is achieved through the activityof the growth plate, the cartilaginous structure that remains ateither end of the bone [1]. The growth plate is a highly sophisti-
cated tissue that is organized into three distinctive zones; resting,proliferative and hypertrophic. Each portion exhibits distinct cellmorphology, organization and specific gene expression patterns[2]. Chondrocytes of the resting zone are small and surrounded byvast quantities of matrix [3]. The rate of proliferation of restingchondrocytes is slow in comparison to the proliferative zone [4].Chondrocytes within the proliferative zone are distinguished bytheir columnar organization and discoidal shape [5]. The rate ofproliferation is highest in this portion of the growth plate andchondrocytes expresses high levels of proliferative markers suchas cyclin D1 [6]. Hypertrophic chondrocytes are cuboidal andmuch larger in volume, and this increase in size contributesgreatly to longitudinal bone growth [7]. Hypertrophic chondro-cytes also express a different subset of genes, such as type X
Control of chondrocyte gene expression by actin dynamics:
a novel role of cholesterol/Ror-� signalling in
endochondral bone growth
Anita Woods, Claudine G. James, Guoyan Wang, Holly Dupuis, Frank Beier *
CIHR Group in Skeletal Development and Remodeling, Department of Physiology and Pharmacology, Schulich School of Medicineand Dentistry, The University of Western Ontario, London, Ontario, Canada
Received: September 14, 2008; Accepted: January 14, 2009
Abstract
Elucidating the signalling pathways that regulate chondrocyte differentiation, such as the actin cytoskeleton and Rho GTPases, dur-ing development is essential for understanding of pathological conditions of cartilage, such as chondrodysplasias and osteoarthri-tis. Manipulation of actin dynamics in tibia organ cultures isolated from E15.5 mice results in pronounced enhancement of endo-chondral bone growth and specific changes in growth plate architecture. Global changes in gene expression were examined of primary chondrocytes isolated from embryonic tibia, treated with the compounds cytochalasin D, jasplakinolide (actin modifiers) andthe ROCK inhibitor Y27632. Cytochalasin D elicited the most pronounced response and induced many features of hypertrophic chon-drocyte differentiation. Bioinformatics analyses of microarray data and expression validation by real-time PCR and immunohisto-chemistry resulted in the identification of the nuclear receptor retinoid related orphan receptor-� (Ror-�) as a novel putative regula-tor of chondrocyte hypertrophy. Expression of Ror-� target genes, (Lpl, fatty acid binding protein 4 [Fabp4], Cd36 and kruppel-likefactor 5 [Klf15]) were induced during chondrocyte hypertrophy and by cytochalasin D and are cholesterol dependent. Stimulation ofRor-� by cholesterol results in increased bone growth and enlarged, rounded cells, a phenotype similar to chondrocyte hypertrophyand to the changes induced by cytochalasin D, while inhibition of cholesterol synthesis by lovastatin inhibits cytochalasin D inducedbone growth. Additionally, we show that in a mouse model of cartilage specific (Col2-Cre) Rac1, inactivation results in increased Hif-1� (a regulator of Rora gene expression) and Ror-�� cells within hypertrophic growth plates. We provide evidence that choles-terol signalling through increased Ror-� expression stimulates chondrocyte hypertrophy and partially mediates responses of cartilageto actin dynamics.
Keywords: chondrocytes • rho GTPases • actin cytoskeleton • microarray • cholesterol • nuclear receptors • Ror-� • hypertrophy
J. Cell. Mol. Med. Vol 13, No 9B, 2009 pp. 3497-3516
*Correspondence to: Frank BEIER, Department of Physiology and Pharmacology, University of Western Ontario, London, Ontario N6A 5C1, Canada.Tel.: (519) 661–2111-85344Fax: (519) 661–3827E-mail: [email protected]
© 2009 The AuthorsJournal compilation © 2009 Foundation for Cellular and Molecular Medicine/Blackwell Publishing Ltd
doi:10.1111/j.1582-4934.2009.00684.x
Tissue remodelling/regeneration

3498
collagen, matrix metalloproteases (MMPs) and vascular endothe-lial growth factor-� (Vegf-�) [8]. Although many markers of chon-drocyte differentiation are known, the signalling pathways regulat-ing their expression remain incompletely understood.
Chondrodysplasias are a large family of diseases that are char-acterized by disordered cartilage development and bone formation resulting in dwarfism and poor bone quality [9, 10]. Thepathways regulating chondrocyte hypertrophy are also implicatedin osteoarthritis (OA). Ectopic chondrocyte hypertrophy has beendemonstrated in OA, suggesting that the pathogenetical processinvolves a recapitulation of endochondral ossification [11–13].Therefore, analyses of the molecular pathways regulating hypertro-phy in development are of particular interest for understanding OA.
We recently identified a role of the actin cytoskeleton and theRho family of small GTPases as major regulators of chondrocytedifferentiation. Our data demonstrated that RhoA/ROCK signallinginhibits both early and late chondrocyte differentiation in vitro[14–16]. It has been previously shown that inhibiting actin poly-merization re-establishes chondrocyte gene expression in de-differ entiated chondrocytes in vitro [17–21]. We have also shownthat manipulation of the actin cytoskeleton promotes the differen-tiation of mesenchymal cells to the chondrocyte lineage in vitro[14]. However, the effects of manipulating the actin cytoskeletonon later stages of chondrocyte differentiation are still unknown, asare most of the target genes mediating the chondrocyte responseto changes in actin dynamics.
In this study, we have employed microarray analysis in orderto understand global changes in chondrocyte gene expression in response to modifiers of the actin cytoskeleton. Additionally,we compare the current data set with previous gene expressiondata during chondrocyte differentiation in vitro and in vivo. Ourdata suggest that inhibition of actin polymerization promoteschondrocyte hypertrophy. We functionally analysed the retinoidrelated orphan receptor-� (Ror-�), a gene that was up-regulatedin all three analysed models of chondrocyte maturation.Interestingly, several genes up-regulated by cytochalasin D treat-ment were also identified as known targets of Ror-� signalling.This suggests a novel pathway downstream of actin dynamicsthat controls chondrocyte hypertrophy through cholesterol/Ror-� signalling.
Materials and methods
Materials
CD1 mice (timed pregnant at embryonic day (E) 15.5) were purchasedfrom Charles River Laboratories (St. Constant, Quebec, Canada). All cellculture reagents were from Invitrogen (Burlington, Ontario, Canada) unlessstated otherwise. Y27632 (cat. #688000) and jasplakinolide (cat. #420107)were purchased from Calbiochem (Darmstadt, Germany), and cytochalasinD from Sigma Aldrich (St. Louis, MO, USA), cat. #C8273. General chemi-cals were from Sigma Aldrich or Calbiochem unless otherwise stated. TheRor-� antibody was purchased from Santa Cruz (Santa Cruz, CA, USA),
cat. #sc-28612, the hypoxic inducible factor 1, subunit � (Hif-1�) antibodywas purchased from Cell Signaling (Danvers, MA, USA), cat. #3716, andthe �-actin antibody was from Sigma Aldrich (cat. #A3853).
Methods
Organ culture
Tibiae were isolated from E15.5 mice, measured and incubated in mediacontaining �-MEM, 5% bovine serum albumin, 1% L-glutamine, and 1%penicillin/streptomycin [22, 23]. The following day, media were changedand inhibitors were added to the culture (DMSO or ethanol vehicle, 10 �MY27632, 1 �M cytochalasin D, 50 nM jasplakinolide, 10 �M cholesterol,10 mM (2-hydroxypropyl)-�-cyclodextrin [HPCD; Sigma] and/or 5 �Mlovastatin [Sigma]). A subset of organ cultures were pre-treated with 10 mMHPCD and after 4 hrs and then washed in phosphate buffered saline (PBS).The remaining treatments were added every other day to cultures, and after6 days tibiae were measured and fixed in 4% paraformaldehyde (PFA)overnight at 4�C. Subsets of bones were labelled with BrdU for a period of4 hrs before being fixed in 4% PFA. Another subset of bones was stainedin Alcian Blue/Alizarin Red solution, and the rest were sent for embeddingin paraffin and sectioning (Robarts Research Institute, MolecularPathology, London, Ontario, Canada).
Col2-Cre Rac1fl/fl mice were maintained and genotyped and tibiae wereisolated on P0 and sent for sectioning as described [24].
Primary cultures
Long bones (humerus, radius, ulna, tibia, fibula and femur) were isolatedfrom E 15.5 mice and digested in 1 mg/ml of Collagenase P in DMEM con-taining 10% FBS for 1 hr at 37�C with gentle agitation [15]. Chondrocyteswere centrifuged for 5 min. at 1000 rpm and resuspended in media con-taining 60% F12, 40% DMEM, 10% FBS, 1% L-glutamine and 1% penicillin/streptomycin. Chondrocytes were plated at a density of 500,000 cells/wellin a six-well dish (Nunc-Thermo Fisher Scientific; Rochester, NY, USA).After 24 hrs, cultures were treated with 10 �M Y27632, 1 �M cytochalasinD or 50 nM jasplakinolide. After another 24 hrs of incubation with inhibitors,cells were harvested for RNA. Specific chondrogenic gene expression hasbeen previously
For cholesterol studies, primary cultures were isolated as describedabove, but after an 8-hr culture period, cells were serum-starved. After 24 hrsin serum-free medium, subsets of cells were pre-treated with 10 mMHPCD (Sigma) for a period of 4 hrs. After a wash-out, cells were thentreated with either DMSO (vehicle), ethanol (vehicle), 1 �M cytochalasin D,5 �M lovastatin, or 10 �M cholesterol in serum free medium. After another24-hr period, cells were harvested for RNA isolation.
Microarray analysis
Chondrocytes were isolated as above, plated in high-density monolayerand treated for a period of 24 hrs with DMSO for control, 10 �M Y27632,1 �M cytochalasin D or 50 nM jasplakinolide. RNA was isolated using theRNeasy kit (QIAGEN, Mississauga, Ontario, Canada) and then sent forassessment of quality with Agilent 2100 BioAnalyzer Data Review Software
© 2009 The AuthorsJournal compilation © 2009 Foundation for Cellular and Molecular Medicine/Blackwell Publishing Ltd

J. Cell. Mol. Med. Vol 13, No 9B, 2009
3499
(Wilmington, DE, USA) at the London Regional Genomics Center beforehybridization to Affymetrix430A (Santa Clara, CA, USA) chips (RobartsResearch Institute, London, Ontario, Canada). Raw data were analysed byGeneSpring 7.3.1, and gene lists were compiled from probe sets demon-strating a reliable signal as determined by M.A.S. 5.0 derived algorithmsfollowed by a one-way Welch ANOVA (P-value cut-off of 0.05). Probe setlists were filtered using the ‘Filter on Fold Change’ option in GeneSpring. Aminimum 1.5-fold change in gene expression was implemented, in com-parison of DMSO control treated RNA samples to samples treated withinhibitors, as described [13, 25].
Potential Ror-� targets were determined with the mousegenome9999 application from GeneSpring. The list of probe sets up-reg-ulated by cytochalasin D were translated into the genome9999 applica-tion, and 506 probe sets of the 777 originally identified gene list werescanned over the 5000 base pairs upstream for the transcriptional startsites for the RORE consensus sequence ANNTAGGTCA [26], asdescribed [25]. A total of 103 probe sets contained the consensussequence, only exact matches are listed.
RT real-time PCR
RNA was isolated from primary cultures using the RNeasy kit (QIAGEN) asper manufacturers’ protocol. Twenty-five nanograms of RNA were platedper well in quadruplicate. Relative gene expression was determined meas-uring Rora, lymphocyte cystolic factor 1 (Lcp1), Osteoadherin, frizzledrelated protein (Frzb), Gdf10, aldehyde dehydrogenase family 1, subfamilyA3 (Aldh1a3), fatty acid binding protein 4 (Fabp4), kruppel-like factor 5(Klf15) (Assays on demand, Applied Biosystems; Forest City, CA, USA) rel-ative to glyceraldehyde-3-phosphate dehydrogenase (Gapdh) using onestep RT qPCR Master Mix (Applied Biosystems) and 40 cycles on the ABIprism 7900 HT sequence detector (PerkinElmer Life Sciences; Waltham,MA, USA) as described [27, 28].
Immunohistochemistry
Sections were dewaxed in xylene and rehydrated in serial ethanol washes.Endogenous peroxidases were blocked by incubating tissues in 3% hydrogenperoxide in methanol for 30 min. Antigen retrieval was performed by boilingsamples in 0.1 M sodium citrate/PBS solution, pH 6, for 20 min. followed byrinsing in double distilled water. After blocking sections for 30 min. at roomtemperature in appropriate animal serum:PBS (1:20), primary antibodieswere diluted 1:200 in the blocking solution and incubated overnight at 4�C.The following day, tissue sections were rinsed in PBS and incubated withappropriate HRP-conjugated secondary antibodies, 1:200 diluted in PBS for1 hr. Sections were washed in PBS and then incubated with Diaminobenzidine(Dako, Mississauga, ON, Canada) for colorimetric detection.
Statistical analysis
Longitudinal growth of long bones are the average of five independentexperiments, with six tibia per trial, the mean longitudinal growth � S.E.M.Data were analysed by one-way ANOVA followed by a post Bonferroni test.
RNA used for real-time PCR analyses were collected from three inde-pendent trials (long bones collected from the embryos of one or two litters)and run in quadruplicate. The data shown are the average mean geneexpression of three independent trials, normalized to the vehicle control
cultures � S.E.M. Data were analysed by one-way ANOVA followed by a post hoc Bonferroni test.
Results
Disruption of actin organization increases longitudinal growth of organ cultures and altersgrowth plate organization
We wanted to determine the effects of modifying the actincytoskeleton on chondrocytes in the three dimensional environ-ment of the growth plate. Tibiae isolated from E15.5 mice wereincubated with DMSO vehicle, 10 �M Y27632 (which inhibitsRho/ROCK signalling), 1 �M cytochalasin D (an inhibitor of actinpolymerization) or 50 nM jasplakinolide (stabilizes and promotesactin polymerization). After 6 days in culture, bones were stainedwith alcian blue/alizarin red to assess glycosaminoglycan produc-tion and mineralization, respectively. Bones treated with Y27632grew slightly longer and appeared to have less alizarin red stain,indicating less mineralization (Fig. 1A). Bones treated with eithercytochalasin D or jasplakinolide were markedly larger than con-trols (Fig. 1A). Quantitative measurements of treated bonesdemonstrate significant increases in longitudinal growth com-pared to control cultures (Fig. 1B).
We next asked how growth plate architecture was affected bythese treatments by staining paraffin sections with haematoxylin.The resting (green arrow), proliferative (blue arrow) and hyper-trophic (black arrow) zones of control growth plates were clearlydistinguished in control bones (Fig. 1C). Growth plate zone meas-urements revealed that inhibition of ROCK signalling by Y27632results in an expanded resting zone, whereas the proliferative andhypertrophic zones sizes remain unchanged (Fig. 1D).Interestingly, the proliferative zone is hypocellular in Y27632treated bones, suggesting an effect on chondrocyte proliferation.Tibiae treated with jasplakinolide showed significantly expandedresting, proliferative and hypertrophic zones (Fig. 1D). Inhibitionof actin polymerization by cytochalasin D resulted in a growthplate that was too unorganized to distinguish and measure anyzones (Fig. 1D). Instead, the cellular morphology of cytochalasinD treated tibiae showed features of hypertrophic and resting chon-drocytes; cells were larger but were also surrounded by an abun-dant matrix.
Because all treatments resulted in increased longitudinalgrowth as compared to the control, we examined the effect ofthese treatments on cell proliferation using BrdU labelling.Control growth plates label with BrdU mostly in the proliferativeregion of the growth plate, with some positive cells in the restingzone (Fig. 1E). Bones treated with Y27632 or jasplakinolide dis-played a slight increase in BrdU labelling; however, the pattern oflabelling extended into the upper portion of the hypertrophic zone and more cells were labelled in the resting zone (Fig. 1E),
© 2009 The AuthorsJournal compilation © 2009 Foundation for Cellular and Molecular Medicine/Blackwell Publishing Ltd

3500 © 2009 The AuthorsJournal compilation © 2009 Foundation for Cellular and Molecular Medicine/Blackwell Publishing Ltd
Fig. 1 Disruption of actin organization increases bone growth in organ culture and alters growth plate organization. Tibiae were isolated from E15.5mice and incubated for a period of 6 days with DMSO vehicle, 1 �M cytochalasin D, 10 �M Y27632 or 50 nM jasplakinolide. (A) Tibiae were fixed andthen stained with Alcian Blue for the detection of sulphated glycosaminoglycans and with Alizarin Red for mineral content. Data shown are representa-tive of four independent trials, scale bar � 1 mm. (B) Lengths of tibiae were measured at the beginning and end of the 6-day culture period to determine the average longitudinal growth. All treatments result in a significant increase in longitudinal growth, but both cytochalasin D and jasplaki-nolide resulted in a dramatic increase in both longitudinal and appositional growth. Data shown are the average of five independent experiments, withsix tibia per trial, the mean longitudinal growth � S.E.M., *P 0.05. (C) A subset of tibia were fixed, dehydrated, embedded in paraffin and sectionedfor histological analysis of growth plate organization. Sections were stained with haematoxylin and eosin for visualization of basic histology. Data shownare representative of four independent trials, scale bar � 0.1 mm. (D) Growth plate zones were measured on the basis of cellular morphology and organ-ization of histological sections by a blind observer. Data shown are the average of four independent experiments, four bones per trial, the length � S.E.M., *P 0.05. (E) Tibiae were grown in culture for a period of 6 days in the presence of vehicle, 10 �M Y27632, 1 �M cytochalasin D or 50 nM jasplakinolide. At the end of the culture period, tibiae were incubated in media containing BrdU for 4 hrs and then washed in PBS. Boneswere fixed, dehydrated and embedded in paraffin, followed by sectioning and then immunohistochemistry for BrdU. Data shown are representative, scale bar � 0.1 mm.

J. Cell. Mol. Med. Vol 13, No 9B, 2009
3501
suggesting deregulation of cell cycle progression under theseconditions. Cytochalasin D-treated bones did not have an organ-ized growth plate, but the area in which the proliferative zoneshould reside had no cells positively labelled with BrdU. Instead,a few cells on either side of the upper condyle were labelled by BrdU(Fig. 1E). These data suggest that bones treated with cytochalasinD do demonstrate enhanced proliferation but in the restinggrowth plate zone which is uncharacteristic of normal growthplates, possibly contributing to the enhanced growth observed.
Microarray analysis of primary embryonic growthplate chondrocytes treated with actin inhibitors
We wanted to assess global changes of gene expression in chon-drocytes in response to actin modulators to gain insights into themolecular pathways mediating the observed responses. RNA from
a mixed population of primary mouse chondrocytes were isolatedfrom embryonic long bones (as described by [22]) treated withthe various compounds was hybridized to Affymetrix microarraysrepresenting the entire mouse genome. Inhibition of ROCK signalling by Y27632 treatment resulted in significant up-regula-tion of 176 probe sets, and down-regulation of 139 probe sets (Fig. 2A, Table S1). Cytochalasin D treatment induced up-regula-tion of 777 probe sets and down-regulation of 1209 probe sets(Fig. 2A, Table S2). Stimulation of actin polymerization by jasplaki-nolide treatment resulted in 120 probe sets being up-regulatedand 107 down-regulated (Fig. 2A, Table S3).
We wanted to determine whether the different treatmentsregulated a common set of genes. We compared gene lists anddetermined that 14 probe sets were regulated in all three (Fig. 2B);12 probe sets corresponded to genes listed in Table 1. Y27632and cytochalasin D treatment were the most similar with 99common probe sets while jasplakinolide regulated 61 common genes
© 2009 The AuthorsJournal compilation © 2009 Foundation for Cellular and Molecular Medicine/Blackwell Publishing Ltd
Fig. 2 Microarray analysis of primary chon-drocytes treated with actin inhibitors. Anenriched population of primary mouse chon-drocytes were treated with DMSO vehicle, 1 �Mcytochalasin D, 10 �M Y27632 or 50 nM jas-plakinolide for 24 hrs. RNA was isolated andhybridized to Affymetrix MOE 4.0 chips. Genelists were compiled from genes that demon-strated a reliable signal (as determined by theMAS5.0 algorithm) and changed signifi-cantly; a 1.5-fold cut-off was assigned. (A)Inhibition of Rho/ROCK signalling by Y27632resulted in 176 probe sets being up-regulatedand 139 probe sets being down-regulated.Cytochalasin D treatment resulted in 777 up-regulated and 1209 down-regulated probesets in comparison to control cultures whilejasplakinolide treatment resulted in 120probe sets being up-regulated and 107 probesets being down-regulated. (B) Comparisonsof all probe sets regulated by the three differ-ent pharmacological actin modifiers demon-strate that 14 probe sets are commonly reg-ulated by all treatments. A total of 85 probesets are commonly regulated by both Y27632and cytochalasin D, 24 probe sets are com-monly regulated by cytochalasin D and jasplakinolide and 47 probe sets are com-monly regulated by Y27632 and jasplakino-lide. (C) Commonly regulated probe setswere assessed for positive or negative corre-lation between treatments. Probe sets thatwere up-regulated or down-regulated by bothtreatments were assigned a positive correla-tion, while probe sets that were up-regulatedin one treatment and down-regulated in theother were assigned a negative correlation.The majority of probe sets were positivelycorrelated in all treatments.

3502
with Y27632 and 38 with cytochalasin D. The majority of probesets common to two of the inhibitors tested were positively cor-related; for example, if up-regulated by one inhibitor, it was alsoup-regulated by the other compound (Fig. 2C). Cytochalasin Dand jasplakinolide are often regarded as having opposingeffects because one inhibits whereas the other promotes actinpolymerization [29, 30]. However, many genes commonly regu-lated by both compounds were positively correlated (Fig. 2C).This is not without precedent as the regulation of transcriptionor the activity of some genes/proteins appear to be responsiveto changes in actin dynamics and not specifically to either inhibition or polymerization of actin, such as Sox9 and theserum response factor (SRF) [14, 31].
Pathways and processes regulated by cytochalasin D treatment
We analysed the data set of cytochalasin D treatment in moredetail because this compound elicited the most dramatic changesboth in gene expression and growth of tibia organ cultures. Thegene list generated from cytochalasin D treatment compared toDMSO treated chondrocytes was analysed for molecular functionby Fatigo+ software (Babelomics http://babelomics2.bioinfo.cipf.es/index.html) [32]. We show that a large proportion of regulatedgenes are involved in nucleic acid metabolism, including 215probe sets in the category of nucleic acid binding, 62 transcriptionfactors and 15 in chromatin binding. Other interesting categoriesincluded lipid binding and lipid transport with 34 and 5 probe sets,respectively (Fig. 3A).
Next we identified common signalling pathways between genesthat changed in response to cytochalasin D treatment using Keggpathway analyses (Babelomics). We found that cell cycle regula-tion was the category most responsive to cytochalasin D, with 32down-regulated and only 2 up-regulated probe sets, in agreementwith the decrease in BrdU labelling observed earlier (Fig. 3B). Fourspecific signalling pathways were identified; transforming growthfactor-� signalling, Wnt signalling, mTOR signalling and PPARsignalling, all of which have been previously implicated in the reg-ulation of endochondral bone growth [33–36].
Gene ontology and KEGG analyses were also performed for theother two treatments (Figs. S1 and S2). Of note, Y27632 treatmentstrongly down-regulated several genes involved in cytokine sig-nalling, whereas the most pronounced effect of jasplakinolide wasup-regulation of genes involved in actin regulation, focal adhe-sions, ECM receptor interactions and cell communication.
Comparison of cytochalasin D effects to gene expression patterns during chondrocyte differentiation in vitro and in vivo
We had shown that organ cultures treated with cytochalasin Ddisplayed a completely disorganized growth plate consisting oflarge cells, similar in morphology to hypertrophic chondrocytes.Due to this observation, we compared genes up-regulated incytochalasin D treatment to genes up-regulated in the hyper-trophic growth plate of microdissected bones and genes up-regulated during hypertrophic differentiation of micromass cultures[13] (Fig. 4). Of the 777 probe sets up-regulated in cytochalasinD treatment, almost 50% are up-regulated during hypertrophy inone or both of these models, suggesting that cytochalasin Dinduces selective features of hypertrophy, in agreement with thecellular appearance. A total of 56 probe sets are common to allthree models and are listed (Table 2). These genes included Roraand Lcp1. Other genes of interest include Frzb and Gdf10 whichwere commonly up-regulated by cytochalasin D treatment and inhypertrophic microdissected bones, but not in the micromassculture system.
© 2009 The AuthorsJournal compilation © 2009 Foundation for Cellular and Molecular Medicine/Blackwell Publishing Ltd
Fold change
CytD Y27632 Jasp
Acaa1b3-ketoacyl-CoA thiolase B
7.6 2.0 1.9
Actg2Actin, �2, smooth muscle, enteric
6.4 1.9 5.3
AspmCalmodulin binding protein 1
2.0 2.0 2.4
Cnn1 Calponin 1 3.6 2.8 3.3
Ereg Epiregulin 1.9 2.3 1.9
Gjb2Gap junction membranechannel protein �2
6.1 3.1 1.6
Lcp1Lymphocyte cytosolic protein 1
4.7 1.5 1.7
MylkMyosin, light polypeptide kinase
4.1 2.6 2.3
Osr1Odd-skipped related 1 (Drosophila)
5.3 1.7 1.9
Wdr33 WD repeat domain 33 1.8 2.1 2.6
Depdc6DEP domain containing 6
2.3 2.0 1.7
Rtel1Regulator of telomereelongation helicase 1
1.9 1.6 1.7
Table 1 Probe sets commonly regulated by all compounds tested genename gene description

J. Cell. Mol. Med. Vol 13, No 9B, 2009
3503
Real-time validations of selected genes changingin response to actin inhibitors
We next confirmed regulation of selected genes from our microar-ray data by real-time PCR. The gene encoding the nuclear recep-tor Rora was increased by cytochalasin D treatment in themicroarray. Here we confirmed that mRNA levels of Rora are sig-nificantly increased in response to cytochalasin D treatment butalso in response to jasplakinolide, whereas Y27632 reduced Roratranscript levels (Fig. 5A). Lcp1 was up-regulated by all threeinhibitors in the microarray. Real-time PCR validated that cytocha-lasin D, Y27632 and jasplakinolide treatment result in significantincreases of Lcp1 mRNA levels (Fig. 5B). The Wnt antagonist Frzbhas been previously identified as a promoter of endochondral
ossification and was up-regulated in response to cytochalasin Dtreatment in the microarray [37]. Frzb mRNA levels were signifi-cantly increased in response to cytochalasin D treatment as com-pared to controls in real-time PCR (Fig. 5C). Gdf10 is part of thetransforming growth factor-� family and is closely related to Gdf5,a gene known to be important in cartilage differentiation [38].Furthermore, another study has shown that Gdf10 may be impor-tant for regulation of cell differentiation in skeletogenesis due to itsexpression pattern in calvaria and long bones [39]. Gdf10 wasshown to be up-regulated by both cytochalasin D and Y27632treatment in the microarray. Real-time PCR analyses confirmedthese data and showed that both treatments result in significantlyincreased mRNA levels of Gdf10 (Fig. 5D). Ror-� was selected forfollow up studies due to it’s response to various actin modifications,
© 2009 The AuthorsJournal compilation © 2009 Foundation for Cellular and Molecular Medicine/Blackwell Publishing Ltd
Fig. 3 Gene ontology and Keggpathways in response to cytocha-lasin D treatment. (A) Microarraygene sets from primary chondro-cytes treated with 1 �M cytocha-lasin D for a period of 24 hrs wereassessed according to GO annota-tions categorized by Fatigo�. (B)Kegg annotations were used todetermine changes within differentsignalling pathways.

3504
as well for its known role in lipid metabolism, an important func-tional category identified in our micorarray analyses in responseto actin dynamics.
Expression of Ror-� in the growth plate
We analysed the expression pattern of Ror-� protein (the productof the Rora gene) within the growth plate of tibia organ cultures.Ror-� is most highly expressed within the pre-hypertrophic/hypertrophic region of the growth plate of control cultures, con-sistent with the pattern of expression determined in our microarrays(Fig. 6A). When organ cultures were grown in the presence of
cytochalasin D, Ror-� expression was found throughout thegrowth plate (Fig. 6A). These data further suggest that cytocha-lasin D treatment results in a pre-hypertrophic/hypertrophic-likephenotype in growth plates.
Hif-1� plays an important role in cartilage development [40]and is a direct regulator of Ror-� gene expression in other celltypes [41]. Hif-1� gene expression was found to be up-regulatedin response to cytochalasin D treatment of primary monolayerchondrocytes in our microarray data set in comparison to con-trols. We therefore wanted to examine the pattern of expression ofHif-1� in the growth plate to compare its expression to that ofRor-�. In control organ cultures, Hif-1� expression is highest inthe pre-hypertrophic and hypertrophic region of the growth plate,consistent with the literature [40] (Fig. 6B). Hif-1� expression isalso highly expressed in the periphery of the growth plate withstrong expression in the upper portion of the resting zone (Fig.6B). Cytochalasin D treated organ cultures exhibited Hif-1�
expression throughout the growth plate, similar to Ror-� (Fig. 6B).These data suggest that the increase in Ror-� gene and proteinexpression observed might be due to the effect of cytochalasin Dstimulating increased expression of Hif-1� in both the growthplate and primary monolayer culture.
We next complemented our pharmacological approaches usinggenetic inactivation of a physiological regulator of actin dynamics.Control mice displayed Ror-� and Hif-1� protein expression inpre-hypertrophic and hypertrophic chondrocytes, consistent withthe expression pattern observed in tibia organ cultures (Fig. 6C).Mice with cartilage-specific inactivation of the Rac1 gene, a keyregulator of actin organization, display numerous skeletal defects,including disrupted growth plate organization, dwarfism andskeletal deformities [24]. Rac1 deficiency resulted in increasedlevels of Hif-1� in the hypertrophic region of the growth plate incomparison to control bones (Fig. 6C) and a similar increased areaof Ror-� expression (Fig. 6C), suggesting that genetic disruptionof actin organization in vivo also results in increased expression ofHif-1� and Ror-�.
Functional validations of genes up-regulated by cytochalasin D
There is evidence from the literature that Ror-� is no longer anorphan receptor as two potential ligands have been discovered,melatonin and cholesterol (as well as cholesterol sulphate) [42,43]. Bioinformatics analyses suggested that cytochalasin D treat-ment of chondrocytes affected a large number of known or puta-tive target genes of Ror-� (Table 3). We therefore wanted toassess if these genes are regulated by cholesterol in primarymonolayer chondrocytes. Chondrocytes were treated with eithercytochalasin D or vehicle control. To inhibit endogenous Ror-�activity in either of these treatments, we pre-treated a subset ofthese cells with HPCD (to block intracellular transport of choles-terol) and lovastatin (to inhibit cholesterol synthesis through themevalonate pathway) [44]. Additional subsets of these cells were
© 2009 The AuthorsJournal compilation © 2009 Foundation for Cellular and Molecular Medicine/Blackwell Publishing Ltd
Fig. 4 Comparison of cytochalasin D treatment to hypertrophic geneexpression in vivo and in vitro. Microarray data sets from three differentexperiments were compared: (1) RNA was isolated from an enriched pop-ulation of primary chondrocytes plated in high-density monolayer culturesand treated for a period of 24 hrs with DMSO vehicle or 1 �M cytocha-lasin D. (2) RNA was isolated from micromass cultures of differentiatingchondrocytes on day 3 and day 15 of culture. (3) RNA was isolated fromE15.5 tibiae that were microdissected into different growth plate zones. Allexperiments were run in triplicate for each treatment or time-point. RNAswere hybridized to Affymetrix chips for the micromass arrays we used dif-ferent chips, raw data were imported into Genespring7.3.1 and gene listswere generated from those probe sets that demonstrate a reliable signalas determined by M.A.S. 5.0 and that changed significantly as determinedby a one-way ANOVA. A cut-off of 1.5-fold change was implemented andthose probe sets that were significantly up-regulated by 1.5-fold incytochalasin D treatment versus DMSO control, 1.5-fold up-regulated inthe hypertrophic region of the growth plate versus the resting zone and1.5-fold up-regulated on day 15 of micromass culture versus day 3 of cul-ture were compared. A total of 56 probe sets were commonly regulated inall three models. A total of 426 probe sets were commonly regulated inthe microdissected hypertrophic growth plate versus the differentiatedmicromass culture. A total of 203 probe sets were commonly regulated indifferentiated micromass culture and cytochalasin D treatment and 128probe sets were commonly regulated in the cytochalasin D treatment ver-sus the hypertrophic growth plate.

J. Cell. Mol. Med. Vol 13, No 9B, 2009
3505© 2009 The AuthorsJournal compilation © 2009 Foundation for Cellular and Molecular Medicine/Blackwell Publishing Ltd
Gene name Gene description Fold change
CytD GP MM
1110018J18Rik RIKEN cDNA 1110018J18 gene 2.0 1.9 1.9
1810054D07Rik RIKEN cDNA 9130422G05 gene 2.5 20.5 3.0
2.1 4.3 2.4
3110005G23Rik RIKEN cDNA 3110005G23 gene 1.6 3.0 1.7
4930471M23Rik RIKEN cDNA 4930471M23 gene 1.8 1.9 2.0
Agt Angiotensinogen 10.9 2.5 2.1
Ak3l1 Adenylate kinase 4 3.4 3.4 1.8
3.2 3.3 1.5
Anxa11 Annexin A11 2.2 3.7 1.6
Anxa4 Annexin A4 1.7 3.2 4.3
Atf3 Activating transcription factor 3 9.6 2.3 2.7
Bnip3BCL2/adenovirus E1B 19kDa-interacting protein 1, NIP3
3.5 1.6 2.7
Camk1 Calcium/calmodulin-dependent protein kinase I 1.9 1.8 1.8
1.9 1.7 1.7
Chac1 Cation transport regulator-like 1 (E. coli) 2.5 2.4 1.7
Cth Cystathionase (cystathionine �-lyase) 4.3 1.7 2.9
Eps8l2 EPS8-like 2 2.1 2.1 1.5
F13a1 Coagulation factor XIII, alpha subunit 3.2 3.4 6.2
Fuca2 RIKEN cDNA 0610025O11 gene 1.7 1.6 2.3
Gba Glucosidase, �; acid 2.0 1.9 1.6
Hist2h2aa1 Histone 2, H2aa1 2.5 1.6 1.6
Htatip2HIV-1 tat interactive protein 2, homolog (human)
2.2 4.6 6.6
Il16 Interleukin 16 4.5 2.1 2.7
Jam2 Junction adhesion molecule 2 3.4 1.7 1.6
Lcp1 Lymphocyte cytosolic protein 1 8.9 4.4 20.2
4.6 2.6 8.7
Leprotl1 Leptin receptor overlapping transcript-like 1 2.0 1.6 2.5
Lpl Lipoprotein lipase 2.2 1.9 23.0
Mid2 Midline 2 6.9 2.5 2.4
Mras Muscle and microspikes RAS 2.6 4.3 1.6
Myo6 Myosin VI 2.3 5.7 1.8
Ndg2 Nur77 downstream gene 2 5.0 2.1 2.2
Ndrg1 N-myc downstream regulated 1 2.9 1.5 15.0
Table 2 Probe sets commonly regulated by cytochalasin D and models of hypertrophy. (1) Genes (probe sets) up-regulated by cytochalasin D incomparison to DMSO vehicle (CytD), (2) Genes (probe sets) up-regulated in the hypertrophic zone in comparison to the resting/proliferative zone(GP) and (3) Genes (probe sets) up-regulated in the micromass culture system, day 15 in comparison to day 3 of culture (MM).
Continued

3506
then given exogenous cholesterol to see if the effects of choles-terol inhibitors could be rescued. We first examined the effects ofthese treatments on baseline Rora gene expression. Rora geneexpression was not affected by either; decreased or increased lev-els of cholesterol (Fig. 7A). Cytochalasin D treatment resulted inan increase of Rora mRNA levels (white bars), as shown previ-ously (Fig. 3A), but this increase in response to cytochalasin D(white bars) was not altered when cholesterol synthesis wasinhibited (column set 3) or exogenous cholesterol was added (col-umn set 4) (Fig. 7A).
Lipoprotein lipase (Lpl) is a known target of Ror-� signallingand is involved in lipid homeostasis [45]. We show that cytocha-
lasin D treatment increases Lpl mRNA levels (white bar, column 1)but the inhibition of cholesterol synthesis (black bar, column 3)resulted in a significant decrease of basal Lpl mRNA levels and acomplete block of cytochalasin D induction (white bar, column 3)(Fig. 7B). Addition of exogenous cholesterol (black bar, column4) was able to overcome this deficiency and markedly increasedbasal Lpl mRNA levels, without further induction by cytochalasinD (white bar, column 4) (Fig. 7B). Fabp4 is a confirmed targetgene of Ror-� in other cell types and a known regulator of lipidhomeostasis [45]. Additionally, Fabp4 gene expression wasincreased in response to cytochalasin D treatment in the microar-ray and confirmed by real-time PCR (white bar, column 1) (Fig. 7C).
© 2009 The AuthorsJournal compilation © 2009 Foundation for Cellular and Molecular Medicine/Blackwell Publishing Ltd
Gene name Gene description Fold change
CytD GP MM
Neu1 Neuraminidase 1 2.5 1.6 2.3
Nupr1 Nuclear protein 1 3.4 4.8 7.5
3.1 4.3 5.9
Pde8a Phosphodiesterase 8A 2.6 4.2 1.6
Pfkp Phosphofructokinase, platelet 2.9 1.5 2.6
Pim3 Proviral integration site 3 2.3 2.6 1.6
Plxnd1 Plexin D1 2.7 1.9 2.1
Ppp1r1bProtein phosphatase 1, regulatory (inhibitor) subunit 1B
5.6 4.9 2.0
Psph Phosphoserine phosphatase 2.2 2.4 1.8
Rgs3 Regulator of G-protein signalling 3 1.8 3.1 3.3
Rora RAR-related orphan receptor-� 4.0 1.6 3.6
3.3 1.6 2.4
Scarb2 Scavenger receptor class B, member 2 2.3 2.8 2.1
Serinc3 Tumour differentially expressed 1 2.1 2.5 2.0
Slc1a3 Solute carrier family 1, member 3 1.8 2.3 1.9
Slc35a3Solute carrier family 35 (UDP-N-acetylglucosamine (UDP-GlcNAc) trans-porter), member 3
2.7 2.0 1.6
Slc7a2Solute carrier family 7 (cationic amino acid transporter, y � system),member 2
2.6 1.9 1.8
Stc2 Stanniocalcin 2 21.6 1.7 4.2
Steap1Six transmembrane epithelial antigen of the prostate
2.8 5.7 3.5
Steap3 Steap family member 3 2.5 1.7 8.9
Tgfb1 Transforming growth factor, �1 2.3 2.0 2.6
Tgoln1 Trans-golgi network protein 1.9 2.2 1.6
Trpv4Transient receptor potential cation channel, subfamily V, member 4
2.0 1.6 1.6
Table 2 Continued

J. Cell. Mol. Med. Vol 13, No 9B, 2009
3507
We demonstrate that inhibition of cholesterol synthesis and shut-tling does not affect basal Fabp4 mRNA levels (black bar, column 3)(Fig. 7C). However, blockade of endogenous cholesterol synthe-sis and shuttling inhibited the stimulation of Fabp4 expression by cytochalasin D (white bar, column 3) (Fig. 7C), demonstratinga requirement for cholesterol in the Fabp4 response to cytocha-lasin D. Addition of exogenous cholesterol to cultures in whichcholesterol synthesis was inhibited resulted in a large increase of basal Fabp4 mRNA levels (black bar, column 4), with only aminor further increase in response to cytochalasin D (white bar,column 4) (Fig. 7C). These data suggest that cholesterol – andthus Ror-� signalling – is required for the chondrocyte responseto cytochalasin D.
Cd36 is a cell surface receptor which binds both collagen I andthrombospondin, is involved in fatty acid translocation and hasbeen shown to be up-regulated in osteoarthritic cartilage [46].Cd36 is also a known target of Ror-� in other cell types [26]. Herewe demonstrate that Cd36 is up-regulated in response to cytocha-lasin D treatment (white bar, column 1) (Fig. 7D), but inhibition ofcholesterol synthesis blocks the response of cytochalasin D (whitebar, column 3) similar to Fabp4. Exogenous addition of cholesterol
to blocked cultures results in a 3.5-fold increase of Cd36 mRNAlevels (black bar, column 4), with no additional effect of cytocha-lasin D (white bar, column 4) (Fig. 7D).
The product of the Aldh1a3 gene metabolizes vitamin A inorder to produce retinoic acid [47], and Aldh1a3 expression isalso up-regulated in all three array studies, but the Aldh1a3 geneis not a known target of Ror-�. We confirmed that inhibition ofactin polymerization by cytochalasin D results in increased mRNAlevels of Aldh1a3 (white bar, column 1) (Fig. 7E). However, inhibi-tion of cholesterol synthesis did not block the response ofAldh1a3 transcript levels to cytochalasin D (white bar, column 3)(Fig. 7E). Additionally, exogenous addition of cholesterol did notaffect mRNA levels of Aldh1a3 (black bar, column 4) (Fig. 7E).These data suggest that regulation of Aldh1a3 is independent ofRor-� signalling and confirms that the observed effects of choles-terol manipulations are specific to Ror-� target genes.
Klf15 encodes a transcription factor involved in adipogenesisand gluconeogensis [48] and was up-regulated in response tocytochalasin D treatment. We confirm increased mRNA levels ofKlf15 in cultures treated with cytochalasin D (white bar, column 1)(Fig. 7F). The cytochalasin D-induced increase in Klf15 expression
© 2009 The AuthorsJournal compilation © 2009 Foundation for Cellular and Molecular Medicine/Blackwell Publishing Ltd
Fig. 5 Real-time validations of selected genes changing in response to actin inhibitors RNA isolated from an enriched population primary chondrocytesplated in high-density monolayer for a period of 24 hrs with vehicle control, 1 �M cytochalasin D, 10 �M Y27632 or 50 nM jasplakinolide were assessedby real-time PCR. (A) Rora mRNA levels are significantly increased by both cytochalasin D and jasplakinolide treatment in comparison to the vehicle con-trol. Y27632 treatment results in a significant decrease in Rora mRNA levels. (B) Lcp1 mRNA levels are significantly increased in response to all treat-ments in comparison to control cultures. (C) Relative gene expression of Frzb is significantly increased with cytochalasin D treatment but is unaffectedwith either jasplakinolide or Y27632 treatment. (D) Gdf10 mRNA levels are significantly increased with both cytochalasin D and Y27632 treatment. Datashown are the average of three independent trials run in quadruplicated, the relative gene expression � S.E., *P 0.05.

3508 © 2009 The AuthorsJournal compilation © 2009 Foundation for Cellular and Molecular Medicine/Blackwell Publishing Ltd
Fig. 6 Ror-� and Hif-1� expression pattern in the growth plate. (A) Paraffin-embedded sections from tibia organ cultures were analysed for Ror-� pro-tein expression by immunohistochemistry. Ror-� protein levels are highest in the pre-hypertrophic and hypertrophic regions of control sections, buthigh throughout the growth plate of cytochalasin D treated bones. Data shown are representative of 3 independent trials, scale bar � 0.1 mm. (B)Paraffin embedded sections were analysed for Hif-1� protein expression. Hif-1� protein levels are highest in the pre-hypertrophic and hypertrophicregion of control sections. In sections from tibia treated with 1 �M cytochalasin D, Hif-1� expression was found throughout the growth plate. Datashown are representative of 3 independent trials, scale bar � 0.1 mm. (C) Tibiae were isolated from newborn control (wild-type) and cartilage-specificRac1 deficient (knockdown [KD]) animals, Col2-Cre Rac1fl/fl mice. Paraffin embedded sections were analysed for Hif-1� and Ror-� protein expression.Hif-1� protein levels are highest in the lower portion of the proliferative zone and upper portion of the hypertrophic zone. In Rac1 knockdown tibiae,the zone of Hif-1� expression was expanded. Similarly, expression of Ror-� is highest in the pre-hypertrophic region of the growth in control tibiae.The number of cells expressing Ror-� in Rac1 knockdown animals is increased, scale bar � 0.1 mm.

J. Cell. Mol. Med. Vol 13, No 9B, 2009
3509© 2009 The AuthorsJournal compilation © 2009 Foundation for Cellular and Molecular Medicine/Blackwell Publishing Ltd
Fabp7 Fatty acid binding protein 7, brain
Fapb4 Fatty acid binding protein 4, adipocyte
Fgfr1 Fibroblast growth factor receptor-like 1
Gadd45a Growth arrest and DNA-damage-inducible 45 �
Gch1 GTP cyclohydrolase 1
Gdf15 Growth differentiation factor 15
Glt25d2 Glycosyltransferase 25 domain containing 2
Gmppa GDP-mannose pyrophosphorylase A
Gna13 Guanine nucleotide binding protein, �13
Got1 Glutamate oxaloacetate transaminase 1, soluble
Gpr56 G protein-coupled receptor 56
Gramd1b GRAM domain containing 1B
Gtl2GTL2, imprinted maternally expressed untranslated mRNA
Hif1a Hypoxia inducible factor 1, � subunit
Hist3h2a Histone 3, H2a
Hr Hairless
Il11 Interleukin 11
Il16 Interleukin 16
Itga9 Integrin �9
Jam2 Junction adhesion molecule 2
Lef1 Lymphoid enhancer binding factor 1
Litaf LPS-induced TN factor
Lrp1 Low-density lipoprotein receptor-related protein 1
Ltbp4Latent transforming growth factor � binding protein 4
Mbnl2 Muscleblind-like 2
Myd116 Myeloid differentiation primary response gene 116
Myl9 Myosin, light polypeptide 9, regulatory
Nfil3 Nuclear factor, interleukin 3, regulated
Niban Niban protein
Nog Noggin
Olfm1 Olfactomedin 1
Olfm1 Phosphoserine phosphatase
P2rx4Purinergic receptor P2X, ligand-gated ion channel 4
Pdgfrl Platelet-derived growth factor receptor like
PigsPhosphatidylinositol glycan anchor biosynthesis,class S
RIKEN cDNA 1110007C09 gene
RIKEN cDNA 1700025G04 gene
RIKEN cDNA 1810031K17 gene
RIKEN cDNA 2310031A18 gene
RIKEN cDNA 3110005G23 gene
RIKEN cDNA 4933417E01 gene
RIKEN cDNA 4933426M11 gene
RIKEN cDNA 9130213B05 gene
RIKEN cDNA C130038G02 gene
RNA binding protein gene with multiple splicing
Ank2 Ankyrin 2, brain
Arhgef2 Rho/rac guanine nucleotide exchange factor (GEF) 2
Arl10a ADP-ribosylation factor-like 10
Armc8 Armadillo repeat containing 8
Aytl2 Acyltransferase like 2
BambiBMP and activin membrane-bound inhibitor,homolog (Xenopus laevis)
Bdh 3-hydroxybutyrate dehydrogenase, type 1
Bhlhb2 Basic helix-loop-helix domain containing, class B2
Cd14 CD14 antigen
Col14a1 Procollagen, type XIV, �1
Col6a3 Procollagen, type VI, �3
Cpm Carboxypeptidase M
Cth Cystathionase (cystathionine �-lyase)
Ctsb Cathepsin B
Ddit3 DNA-damage inducible transcript 3
Dirc2 Disrupted in renal carcinoma 2 (human)
Eaf1 ELL associated factor 1
EdnrA Endothelin receptor type A
Efcab1 EF hand calcium binding domain 1
Efhd1 EF hand domain containing 1
Eif4ebp1Eukaryotic translation initiation factor 4E bindingprotein 1
Emp2 Epithelial membrane protein 2
Erf Ets2 repressor factor
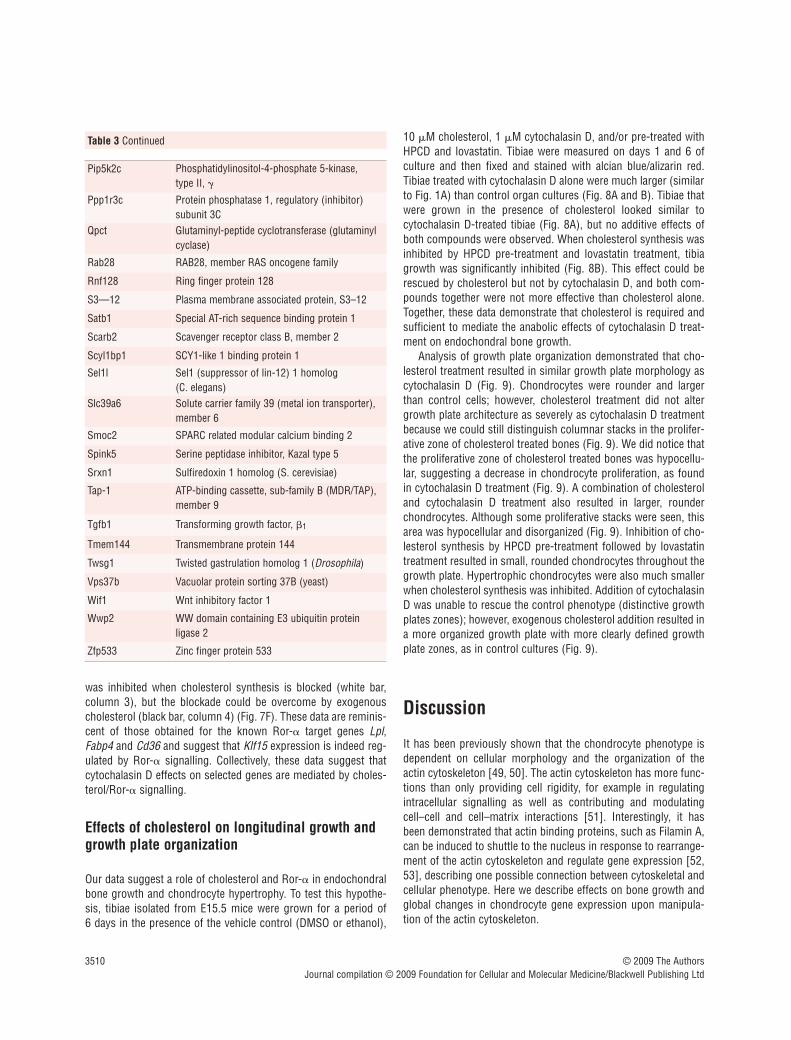
Table 3 Genes up-regulated in response to cytochalasin D containingthe Ror-� consensus binding sequence (ANNTAGGTCA)
Table 3 Continued
Continued
3510
was inhibited when cholesterol synthesis is blocked (white bar,column 3), but the blockade could be overcome by exogenouscholesterol (black bar, column 4) (Fig. 7F). These data are reminis-cent of those obtained for the known Ror-� target genes Lpl,Fabp4 and Cd36 and suggest that Klf15 expression is indeed reg-ulated by Ror-� signalling. Collectively, these data suggest thatcytochalasin D effects on selected genes are mediated by choles-terol/Ror-� signalling.
Effects of cholesterol on longitudinal growth andgrowth plate organization
Our data suggest a role of cholesterol and Ror-� in endochondralbone growth and chondrocyte hypertrophy. To test this hypothe-sis, tibiae isolated from E15.5 mice were grown for a period of 6 days in the presence of the vehicle control (DMSO or ethanol),
10 �M cholesterol, 1 �M cytochalasin D, and/or pre-treated withHPCD and lovastatin. Tibiae were measured on days 1 and 6 ofculture and then fixed and stained with alcian blue/alizarin red.Tibiae treated with cytochalasin D alone were much larger (similarto Fig. 1A) than control organ cultures (Fig. 8A and B). Tibiae thatwere grown in the presence of cholesterol looked similar tocytochalasin D-treated tibiae (Fig. 8A), but no additive effects ofboth compounds were observed. When cholesterol synthesis wasinhibited by HPCD pre-treatment and lovastatin treatment, tibiagrowth was significantly inhibited (Fig. 8B). This effect could berescued by cholesterol but not by cytochalasin D, and both com-pounds together were not more effective than cholesterol alone.Together, these data demonstrate that cholesterol is required andsufficient to mediate the anabolic effects of cytochalasin D treat-ment on endochondral bone growth.
Analysis of growth plate organization demonstrated that cho-lesterol treatment resulted in similar growth plate morphology ascytochalasin D (Fig. 9). Chondrocytes were rounder and largerthan control cells; however, cholesterol treatment did not altergrowth plate architecture as severely as cytochalasin D treatmentbecause we could still distinguish columnar stacks in the prolifer-ative zone of cholesterol treated bones (Fig. 9). We did notice thatthe proliferative zone of cholesterol treated bones was hypocellu-lar, suggesting a decrease in chondrocyte proliferation, as foundin cytochalasin D treatment (Fig. 9). A combination of cholesteroland cytochalasin D treatment also resulted in larger, rounderchondrocytes. Although some proliferative stacks were seen, thisarea was hypocellular and disorganized (Fig. 9). Inhibition of cho-lesterol synthesis by HPCD pre-treatment followed by lovastatintreatment resulted in small, rounded chondrocytes throughout thegrowth plate. Hypertrophic chondrocytes were also much smallerwhen cholesterol synthesis was inhibited. Addition of cytochalasinD was unable to rescue the control phenotype (distinctive growthplates zones); however, exogenous cholesterol addition resulted ina more organized growth plate with more clearly defined growthplate zones, as in control cultures (Fig. 9).
Discussion
It has been previously shown that the chondrocyte phenotype isdependent on cellular morphology and the organization of theactin cytoskeleton [49, 50]. The actin cytoskeleton has more func-tions than only providing cell rigidity, for example in regulatingintracellular signalling as well as contributing and modulatingcell–cell and cell–matrix interactions [51]. Interestingly, it hasbeen demonstrated that actin binding proteins, such as Filamin A,can be induced to shuttle to the nucleus in response to rearrange-ment of the actin cytoskeleton and regulate gene expression [52,53], describing one possible connection between cytoskeletal andcellular phenotype. Here we describe effects on bone growth andglobal changes in chondrocyte gene expression upon manipula-tion of the actin cytoskeleton.
© 2009 The AuthorsJournal compilation © 2009 Foundation for Cellular and Molecular Medicine/Blackwell Publishing Ltd
Pip5k2c Phosphatidylinositol-4-phosphate 5-kinase, type II, �
Ppp1r3c Protein phosphatase 1, regulatory (inhibitor)subunit 3C
Qpct Glutaminyl-peptide cyclotransferase (glutaminylcyclase)
Rab28 RAB28, member RAS oncogene family
Rnf128 Ring finger protein 128
S3—12 Plasma membrane associated protein, S3–12
Satb1 Special AT-rich sequence binding protein 1
Scarb2 Scavenger receptor class B, member 2
Scyl1bp1 SCY1-like 1 binding protein 1
Sel1l Sel1 (suppressor of lin-12) 1 homolog (C. elegans)
Slc39a6 Solute carrier family 39 (metal ion transporter),member 6
Smoc2 SPARC related modular calcium binding 2
Spink5 Serine peptidase inhibitor, Kazal type 5
Srxn1 Sulfiredoxin 1 homolog (S. cerevisiae)
Tap-1 ATP-binding cassette, sub-family B (MDR/TAP),member 9
Tgfb1 Transforming growth factor, �1
Tmem144 Transmembrane protein 144
Twsg1 Twisted gastrulation homolog 1 (Drosophila)
Vps37b Vacuolar protein sorting 37B (yeast)
Wif1 Wnt inhibitory factor 1
Wwp2 WW domain containing E3 ubiquitin protein ligase 2
Zfp533 Zinc finger protein 533
Table 3 Continued

J. Cell. Mol. Med. Vol 13, No 9B, 2009
3511© 2009 The AuthorsJournal compilation © 2009 Foundation for Cellular and Molecular Medicine/Blackwell Publishing Ltd
Fig. 7 Functional validations of genes up-regulated by cytochalasin D treatment and some known targets of Ror-� signalling. RNA was isolated froman enriched population of primary chondrocytes plated in high-density monolayer culture that were pre-treated for 4 hrs with 10 mM HPCD or ethanol.After media were changed, cells were treated with vehicle control, 10 �M cholesterol, 5 �M lovastatin and/or 1 �M cytochalasin D. (A) Rora geneexpression was determined by real-time PCR. Cytochalasin D treatment increased mRNA levels of Rora independent of increased or decreased levelsof cholesterol. (B) Lpl mRNA levels were significantly increased by cytochalasin D treatment which was inhibited by the addition of HPCD and lovas-tatin. Lpl gene expression was rescued by the addition of cholesterol to HPCD and lovastatin treatment. (C) Fabp4 gene expression is increased withcytochalasin D treatment and this increase was inhibited by HPCD and lovastatin treatment. Fabp4 gene expression was rescued by the addition of cho-lesterol. (D) Cd36 gene expression was increased by cytochalasin D treatment and this increase was inhibited by HPCD and lovastatin treatment. Theaddition of cholesterol in the presence of HPCD and lovastatin resulted in an increase of Cd36 gene expression. (E) Aldh1a3 is not a known target ofRor-� signalling. Aldh1a3 gene expression was increased by cytochalasin D treatment but not affected by the inhibition or addition of cholesterol. (F)Klf15 gene expression was significantly increased by cytochalasin D treatment; this increase was inhibited by the treatment of HPCD and lovastatin andthen rescued by the addition of cholesterol. Relative gene expression was determined by comparing gene expression to Gapdh. Data shown are an average of three independent experiments run in quadruplicate, the mean relative gene expression � S.E.M., *P 0.05 between the vehicle andcytochalasin D treatment, and #P 0.05 within the vehicle treatment and the addition or removal of cholesterol.

3512
Inhibition of actin polymerization by cytochalasin D resulted indrastic changes in organ culture growth. Bones treated withcytochalasin D for 6 days were much longer and wider than con-trols. Upon further examination of growth plate histology, we wereunable to distinguish any structure resembling a growth plate, butall cells exhibited enlarged morphology, similar to that of hyper-trophic cells. Inhibition of Rho/ROCK signalling and stimulation ofactin polymerization by jasplakinolide also resulted in increasedlongitudinal growth, although analysis of growth plate histologyrevealed less dramatic changes in structural organization (Fig. 1).Parallel microarray analyses allowed for detailed analysis of theaffects of cytochalasin D, Y27632 and jasplakinolide on chon-droycte gene expression. In comparison to jasplakinolide treat-ment, cytochalasin D and Y27632 treatment of primary monolayerchondrocytes resulted in the most similar changes in probe sets;with 99 common genes (Fig. 2B). However, the phenotypic dis-similarity of growth plate organization that was observed is notunexpected because cytochalasin D and Y27632 treatment alsoregulate 2185 dissimilar probe sets, likely contributing to the dis-parity in phenotype.
Microarray analysis of chondrocytes treated with actin modify-ing compounds demonstrated that many genes stimulated bycytochalasin D are known markers of chondrocyte hypertrophy,including Vegf-�, Chondroadherin, Mmp3, Mmp9 and Atf3 [27,54–57]. However, it needs to be noted that other markers ofhypertrophy such as type X collagen were not induced signifi-cantly by cytochalasin D. Although collagen X is often describedas one of the genes expressed during chondrocyte hypertrophy,
this does not mean that hypertrophy is not induced in our system.Multiple markers of chondrocyte hypertrophy have been identifiedand are likely regulated independently of each other and theabsence of collagen X is not without precedence [36].
We therefore systematically compared our cytochalasin D datasets to our other microarray studies that examined chondrocytedifferentiation in vitro [13] or in vivo (James et al., in prep.). Wefound 64 genes that were commonly up-regulated during hyper-trophy in these studies and in response to cytochalasin D in thecurrent study, further validating our model that cytochalasin Dpromotes aspects of chondrocyte hypertrophy. We selected thegene encoding the nuclear receptor Ror-� for follow up studies.Ror-� has been implicated in regulating development of the cere-bellum as well as lipid homeostasis, inflammation, and bonemaintenance [45, 58–61], but its function in endochondral ossifi-cation has not been addressed. We show that Ror-� proteinexpression is highest in the pre-hypertrophic/hypertrophic regionof the growth plate. Furthermore, in cytochalasin D treated bones,Rora gene expression is found throughout the entire growth plate.These data suggest that Rora gene expression corresponds tohypertrophy and may be a regulator of the terminal stage in chon-drocyte differentiation.
Many of the other genes up-regulated in our array in responseto cytochalasin D treatment were shown to be involved in lipid sig nalling and shuttling as well as being known targets of Ror-�signalling. Therefore, we wanted to assess if Ror-� activity wasresponsible for the increase expression of this subset of genes inour system, by manipulating levels of the Ror-� ligand cholesterol.
© 2009 The AuthorsJournal compilation © 2009 Foundation for Cellular and Molecular Medicine/Blackwell Publishing Ltd
Fig. 8 Longitudinal growth of organ culturestreated with cholesterol and/or inhibition ofcholesterol synthesis. (A) E15.5 tibiae weregrown for a period of 6 days in culture andtreated every other day. Subsets of tibiaewere pre-treated for a period of 4 hrs with 10mM HPCD. Remaining tibiae were thentreated with vehicle, 1 �M cytochalasin D, 10�M cholesterol and/or 5 �M lovastatin(HPCD pre-treated tibiae). Bones were fixedand then stained with Alcian Blue/AlizarinRed. Data shown are representative of 3independent trials, scale bar � 1 mm. (B)Tibiae were measured on day 1 of culture andthen at the end of 6 days for assessment oflongitudinal growth. Tibiae treated withcytochalasin D, cholesterol or a combinationof both grew significantly longer than thecontrol. Inhibition of cholesterol signallingby HPCD pre-treatment followed by lovas-tatin treatment resulted in significantlyshorter bones, which could be rescued byexogenous cholesterol but not by cytocha-lasin D. Data shown are an average of 3 inde-pendent trials run in triplicate, �S.E.M., *P 0.05.

J. Cell. Mol. Med. Vol 13, No 9B, 2009
3513
We confirmed that Rora mRNA expression was up-regulated inresponse to cytochalasin D treatment but not affected by the lev-els of cholesterol. We show here that Fabp4, Cd36, Lpl and Klf15mRNA levels are all responsive to cholesterol signalling and theirup-regulation in the microarray are likely due to the increase inRor-� expression and activity (Fig. 10). The regulation of genesimplicated in lipid metabolism in chondrocytes is not withoutprecedence, as previous work done by our lab has shown thatchondrocytes are capable of lipid metabolism [36].
We also show that treatment of tibiae with cholesterol resultedin similar effects on bone growth as cytochalasin D, while inhibi-tion of cholesterol synthesis resulted in much shorter bones andblocked the anabolic effects of cytochalasin D. Interestingly,
because cytochalasin D cannot rescue the effects ofHPCD/lovastatin treatment (in contrast to cholesterol), cytocha-lasin D appears to act upstream of and to require cholesterol sig-nalling for its anabolic function. It is important to note that someof the effects of inhibiting cholesterol synthesis may be due to theinhibition of production of other mevalonate pathway members,such as farnesyl and geranylgeranyl side chains. Data from our labhas shown that members of the Rho family of proteins are impor-tant for chondrocyte maturation [24, 62]. Prenylation (farnesyla-tion and/or geranylgeranylation) of this family of proteins isrequired for function and therefore cannot be ruled out as a con-tributing factor to the phenotypes observed [63]. However,because exogenous cholesterol can overcome the effects of these
© 2009 The AuthorsJournal compilation © 2009 Foundation for Cellular and Molecular Medicine/Blackwell Publishing Ltd
Fig. 9 Growth plate morphology of choles-terol treated tibia. After 6 days in culture,treated tibiae were embedded in paraffinand sectioned. Growth plates were stainedwith haematoxylin for visualization ofgrowth plate organization. Growth plateswere treated with cholesterol and in combi-nation with cytochalasin D or cholesterolsynthesis was inhibited by HPCD pre-treat-ment followed by lovastatin and in combi-nation with cholesterol and cytochalasin D.Growth plates treated with cholesterolshowed larger, more rounded cellsthroughout the growth plate; however, theystill exhibited organized growth platezones. Inhibition of cholesterol synthesisalso resulted in rounded cellular morphol-ogy, except the chondrocytes looked muchsmaller and no hypertrophic zone wasobserved. Cytochalasin D treatment wasunable to rescue the effects of lovastatinand HPCD treatment. However, addition ofcholesterol was able to rescue the pheno-type, and growth plate zones were clearlydistinguishable. Data shown are represen-tative, scale bar � 0.1 mm.

3514
inhibitors, it appears likely that altered cholesterol levels areresponsible for the majority of the observed effects.
It is interesting to note that the well-characterized staggerermouse which carries a loss-of-function mutation in the Roragene displays dwarfism [64], but to our knowledge growth platefunction has not been studied in these mice. Previous work hasshown that inhibiting cholesterol synthesis decreases longitudinalgrowth and chondrocyte hypertrophy in vivo [65]. However, these findings were contributed to the decrease in necessary post-translational modification of sonic hedgehog and Indianhedgehog for activity. From our studies, we show that cholesterolitself may also be regulating chondrocyte hypertrophy directly,through activation of Ror-� and downstream target genes (e.g.genes involved in lipid metabolism).
Importantly, we show that Ror-� is not only induced by therelatively unphysiological compound cytochalasin D, but alsoup-regulated during physiological chondrocyte maturation in vitro and in vivo. Furthermore, we show that cartilage-specificinactivation of the Rac1 gene, a prominent regulator of actindynamics, also results in increased expression of Ror-� and itsupstream regulator Hif-1�. These data suggest novel linksbetween regulators of cytoskeletal dynamics (e.g. Rac1 andpossibly other Rho GTPases), oxidative signalling (e.g. Hif1a)and lipid metabolism (e.g. Rora) in the control of endochondralbone growth.
In summary, our data suggest that changes in actin dynamicsin chondrocytes result in up-regulation of Ror-� expression,potentially through increased Hif-1� expression. Elevated levels ofRor-� mediate the anabolic response of endochondral bones to
cholesterol. These data identify Ror-� as a novel regulator ofendochondral bone growth at the intersection of actin dynamics,oxidative signalling and lipid metabolism.
Acknowledgements
A.W. and C.G.J. were supported by Doctoral Awards from the CanadianInstitutes of Health Research (CIHR). F.B. is the recipient of a CanadaResearch Chair. This work was supported by operating grants from theCIHR and the Canadian Arthritis Network to F.B.
Supporting Information
Additional Supporting Information may be found in the online ver-sion of this article.
Table S1 Probe sets regulated by Y27632
Table S2 Probe sets regulated by cytochalasin D
Table S3 Probe sets regulated by jasplakinolide
Fig. S1 Gene ontology and Kegg pathways in response to Y27632treatment(A) Microarray gene sets from primary chondrocytes treated with10 �M Y27632 for a period of 24 hrs were assessed according toGO annotations categorized by Fatigo�.(B) Kegg annotations were used to determine common genechanges within different signalling pathways.
Fig. S2 Gene ontology and Kegg pathways in response to jas-plakinolide treatment. (A) Microarray gene sets from primarychondrocytes treated with 50 nM jasplakinolide for a period of 24hrs were assessed according to GO annotations categorized byFatigo�.(B) Kegg annotations were used to determine common genechanges within different signalling pathways.
This material is available as part of the online article from:http://www.blackwell-synergy.com/doi/abs/10.1111/j.1582-4934.2009.00684.x(This link will take you to the article abstract).
Please note: Wiley-Blackwell are not responsible for the content or functionality of any supporting materials supplied by the authors. Any queries (other than missing material) shouldbe directed to the corresponding author for the article.
© 2009 The AuthorsJournal compilation © 2009 Foundation for Cellular and Molecular Medicine/Blackwell Publishing Ltd
Fig. 10 Summary. Our studies suggest that a gene expressed during chon-drocyte differentiation to hypertrophy, Ror-�, regulates the expression ofFabp4, Klf15, Cd36 and Lpl in a cholesterol dependent manner. Inhibitionof actin polymerization by cytochalasin D or inhibition of Rac1 signallingpromotes Ror-� expression levels. The regulation of Ror-� expression lev-els is likely mediated via Hif-1�, a known regulator of Ror-�.

J. Cell. Mol. Med. Vol 13, No 9B, 2009
3515
References
1. Hunziker EB. Mechanism of longitudinalbone growth and its regulation by growthplate chondrocytes. Microsc Res Tech.1994; 28: 505–19.
2. Noonan KJ, Hunziker EB, Nessler J, et al.Changes in cell, matrix compartment, andfibrillar collagen volumes between growth-plate zones. J Orthop Res. 1998; 16: 500–8.
3. Abad V, Meyers JL, Weise M, et al. Therole of the resting zone in growth platechondrogenesis. Endocrinology. 2002;143: 1851–7.
4. Hunziker EB, Schenk RK, Cruz-Orive LM.Quantitation of chondrocyte performancein growth-plate cartilage during longitudi-nal bone growth. J Bone Joint Surg Am.1987; 69: 162–73.
5. Wilsman NJ, Farnum CE, LeifermanEM, et al. Differential growth by growthplates as a function of multiple parame-ters of chondrocytic kinetics. J OrthopRes. 1996; 14: 927–36.
6. Beier F. Cell-cycle control and the cartilagegrowth plate. J Cell Physiol. 2005; 202:1–8.
7. Breur GJ, VanEnkevort BA, Farnum CE, et al. Linear relationship between the vol-ume of hypertrophic chondrocytes andthe rate of longitudinal bone growth ingrowth plates. J Orthop Res. 1991; 9:348–59.
8. Karsenty G, Wagner EF. Reaching agenetic and molecular understanding ofskeletal development. Dev Cell. 2002; 2:389–406.
9. Schwartz NB, Domowicz M.Chondrodysplasias due to proteoglycandefects. Glycobiology. 2002; 12: 57–68.
10. Spranger J, Winterpacht A, Zabel B. Thetype II collagenopathies: a spectrum ofchondrodysplasias. Eur J Pediatr. 1994;153: 56–65.
11. Drissi H, Zuscik M, Rosier R, et al.Transcriptional regulation of chondro-cyte maturation: potential involvementof transcription factors in OA pathogen-esis. Mol Aspects Med. 2005; 26:169–79.
12. Aigner T, Gerwin N. Growth plate cartilageas developmental model in osteoarthritisreserach–potentials and limitations. CurrDrug Targets. 2007; 8: 377–85.
13. James CG, Appleton CT, Ulici V, et al.Microarray analyses of gene expressionduring chondrocyte differentiation identi-fies novel regulators of hypertrophy. MolBiol Cell. 2005; 16: 5316–33.
14. Woods A, Wang G, Beier F. RhoA/ROCKsignaling regulates Sox9 expression andactin organization during chondrogenesis.J Biol Chem. 2005; 280: 11626–34.
15. Woods A, Beier F. RhoA/ROCK signalingregulates chondrogenesis in a context-dependent manner. J Biol Chem. 2006;281: 13134–40.
16. Wang G, Woods A, Sabari S, et al.RhoA/ROCK signaling suppresses hyper-trophic chondrocyte differentiation. J BiolChem. 2004; 279: 13205–14.
17. Benya PD, Brown PD, Padilla SR.Microfilament modification by dihydrocy-tochalasin B causes retinoid acid-modu-lated chondrocytes to re-express the dif-ferentiated collagen phenotype without achange in shape. J Cell Biol. 1988; 106:161–70.
18. Brown PD, Benya PD. Alterations inchondrocyte cytoskeletal architectureduring phenotypic modulation by retinoicacid and dihydrocytochalasin B-inducedreexpression. J Cell Biol. 1988; 106:171–9.
19. Benya PD. Modulation and re-expressionof the chondrocyte phenotype; mediationby cell shape and microfilament modifica-tion. Pathol Immunopathol Res. 1988; 7:51–4.
20. Newman SA, Watt FM. Influence ofcytochalasin D induced changes in cellshape on proteoglycan sythesis by cul-tured articular chondrocytes. Exp Cell Res.1988; 178: 199–210.
21. Loty S, Forest N, Boulekbache H, et al.Cytochalasin D induces changes in cellshape and promotes in vitro chondrogene-sis: a morphological study. Biol Cell. 1995;83: 149–61.
22. Agoston H, Khan S, James CG, et al.C-type natriuretic peptide regulates endo-chondral bone growth through p38 MAPkinase-dependent and independent path-ways. BMC Devl Biol. 2007; 7: 18.
23. Ulici V, Hoenselaar KD, Gillespie JR, et al. The PI3K pathway regulates endo-chondral bone growth through control ofhypertrophic chondrocyte differentiation.BMC Dev Biol. 2008; 11: 40.
24. Wang G, Woods A, Agoston H, et al.Genetic ablation of Rac1 in cartilageresults in chondrodysplasia. Dev Biol.2007; 306: 612–23.
25. James CG, Ulici V, Tuckermann J, et al.Expression profiling of dexamethasonetreated primary chondrocyte identifies tar-
gets of glucocorticoid signaling in endo-chondral ossification development. BMCGenomics. 2007; 8: 205.
26. Kang HS, Angers M, Beak JY, et al. Geneexpression profiling reveals a regulatoryrole for ROR alpha and ROR gamma inphase I and phase II metabolism. PhysiolGenomics. 2007; 31: 281–94.
27. James CG, Woods A, Underhill TM, et al.The transcription factor ATF3 is upregu-lated during chondrocyte differentiationand represses cyclin D1 and A gene tran-scription. BMC Mol Biol. 2006; 7: 30.
28. Bursell L, Woods A, James CG, et al. Srckinase inhibition promotes the chondro-cyte phenotype. Arthritis Res Ther. 2007;9: R105.
29. Bubb M, Senderowicz A, Sausville E, et al. Jasplakinolide, a cytotoxic naturalproduct, induces actin polyerization andcompetitively inhibits the binding of phal-loidin to F-actin. J Biol Chem. 1994; 269:14869–71.
30. Goddette DW, Frieden C. The kinetics ofcytochalasin D binding to monomericactin. J Biol Chem. 1986; 261: 15970–3.
31. Miralles F, Posern G, Zaromytidou A-I, et al. Actin dynamics control SRF activityby regulation of its coactivator MAL. Cell.2003; 113: 329–42.
32. Al-Shahrour F, Carbonell J, Minquez P, et al. Babelomics: advanced functionalprofiling of transcriptomics, proteomicsand genomics experiments. Nucleic AcidsRes. 2008; 36: W341–6.
33. Shao YY, Wang L, Hicks DG, et al.Expression and activation of peroxisomeproliferator-activated receptors in growthplate chondrocytes. J Orthop Res. 2005;23: 1139–45.
34. Hill TP, Spater D, Taketo MM, et al.Canonical Wnt/beta-catenin signaling pre-vents osteoblasts from differentiating intochondrocytes. Dev Cell. 2005; 8: 727–38.
35. Li TF, O’Keefe RJ, Chen D. TGF-beta sig-naling in chondrocytes. Front Biosci. 2005;1: 681–8.
36. Stanton LA, Beier F. PPARgamma2expression in growth plate chondrocytes is regulated by p38 and GSK-3. J Cell Mol Med. DOI: 10.1111/j.1582-4934.2008.00396.x
37. Enomoto-Iwamoto M, Kitagawa J,Koyama E, et al. The Wnt antagonist Frzb-1 regulates chondrocyte maturation andlong bone development during limb skele-togenesis. Dev Biol. 2002; 251: 142–56.
© 2009 The AuthorsJournal compilation © 2009 Foundation for Cellular and Molecular Medicine/Blackwell Publishing Ltd

3516
38. Coleman CM, Tuan RS. Functional role ofgrowth/differentiation factor 5 in chondro-genesis of limb mesenchymal cells. MechDev. 2003; 120: 823–36.
39. Cunningham NS, Jenkins NA, Gilbert DJ,et al. Growth/differentiation factor-10: anew member of the transforming growthfactor-beta superfamily related to bonemorphogenetic protein-3. Growth Factors.1995; 12: 99–109.
40. Schipani E, Ryan HE, Didrickson S, et al. Hypoxia in cartilage: HIF-1alpha isessential for chondrocyte growth arrestand survival. Genes Dev. 2001; 15:2865–76.
41. Chauvet C, Bois-Joyeux B, Berra E, et al.The gene encoding human retinoic acid-receptor-related orphan receptor alpha is atarget for hypoxia-inducible factor 1.Biochem J. 2004; 384: 79–85.
42. Kallen JA, Schlaeppi JM, Bitsch F, et al.X-ray structure of the hRORalpha LBD at1.63 A: structural and functional data thatcholesterol or a cholesterol derivative isthe natural ligand of RORalpha. Structure.2002; 10: 1697–707.
43. Wiesenberg I, Missbach M, Kahlen JP, et al. Transcriptional activation of thenuclear receptor RZR alpha by the pinealgland hormone melatonin and identifica-tion of CGP 52608 as a synthetic ligand.Nucleic Acids Res. 1995; 23: 327–33.
44. Alberts AW, Chen J, Kuron G, et al.Mevinolin: A highly potent competitveinhibitor of hydroxymethylglutaryl coen-zyme A reductase and a cholesterol-lower-ing agent. Proc Natl Acad Sci USA. 1980;77: 3957–61.
45. Lau P, Nixon SJ, Parton RG, et al.RORalpha regulates the expression ofgenes involved in lipid homeostasis inskeletal muscle cells: caveolin-3 and CPT-1 are direct targets of ROR. J Biol Chem.2004; 279: 36828–40.
46. Pfander D, Cramer T, Deuerling D, et al.Expression of thrombospondin-1 and itsreceptor CD36 in human osteoarthritic car-tilage. Ann Rheum Dis. 2000; 59: 448–54.
47. Mic FA, Molotkiv A, Fan X, et al.RALDH3, a retinaldehyde dehydrogenasethat generates retinoic acid, is expressedin the ventral retina, otic vesical and olfac-tory pit during mouse development. MechDev. 2000; 97: 227–30.
48. Gray S, Wang B, Orihuela Y, et al.Regulation of gluconeogenesis byKruppel-like factor 15. Cell Metab. 2007; 5:305–12.
49. Schnabel M, Marlovits S, Eckhoff G, et al. Dedifferentiation-associated changesin morphology and gene expression in pri-mary human articular chondrocytes in cellculture. Osteoarthritis Cartilage. 2002; 10:62–70.
50. Mallein-Gerin F, Garrone R, van der RestM. Proteoglycan and collagen synthesisare correlated with actin organization indedifferentiating chondrocytes. Eur J CellBiol. 1991; 56: 364–73.
51. Woods A, Wang G, Beier F. Regulation ofchondrocyte differentiation by the actincytoskeleton and adhesive interactions. J Cell Physiol. 2007; 213: 1–8.
52. Uribe R, Jay D. A review of actin bindingproteins: new perspectives. Mol Biol Rep.2009; 36: 121–5.
53. Loy CJ, Sim KS, Yong EL. Filamin-A frag-ment localizes to the nucleus to regulateandrogen receptor and coactivator func-tions. Proc Natl Acad Sci USA. 2003; 100:4562–7.
54. Gerber HP, Vu TH, Ryan AM, et al. VEGFcouples hypertrophic cartilage remodeling,ossification and angiogenesis duringendochondral bone formation. Nat Med.1999; 5: 623–8.
55. Shen Z, Gantcheva S, Mansson B, et al.Chondradherin expression changes in
skeletal development. Biochem J. 1998;330: 549–57.
56. Dreier R, Opolka A, Grifka J, et al.Collagen IX-deficiency seriously compro-mises growth cartilage development inmice. Matrix Biol. 2008; 27: 319–29.
57. Hasky-Negev M, Simsa S, Tong A, et al.Expression of matrix metalloproteinasesduring vascularization and ossification ofnormal and impaired avian growth plate. JAnim Sci. 2008; 86: 1306–15.
58. Steinmayr M, Andre E, Conquet F, et al.Staggerer phenotype in retinoid-relatedorphan receptor alpha-deficient mice. ProcNatl Acad Sci USA. 1998; 95: 3960–5.
59. Raspe E, Duez H, Gervois P, et al.Transcriptional regulation of apolipoproteinC-III gene expression by the orphannuclear receptor RORalpha. J Biol Chem.2001; 276: 2865–71.
60. Meyer T, Kneissel M, Mariani J, et al. Invitro and in vivo evidence for orphannuclear receptor RORalpha function inbone metabolism. Proc Natl Acad Sci USA.2000; 97: 9197–202.
61. Kopmels B, Mariani J, Delhaye-BouchaudN, et al. Evidence for a hyperexcitability stateof staggerer mutant mice macrophages. J Neurochem. 1992; 58: 192–9.
62. Wang G, Beier F. Rac1/Cdc42 and RhoAGTPases antagonistically regulate chondro-cyte proliferation, hypertrophy, and apopto-sis. J Bone Miner Res. 2005; 20: 1022–31.
63. Seabra MC. Membrane association andtargeting of prenylated Ras-like GTPases.Cell Signal. 1998; 10: 167–72.
64. Sidman RL, Lane PW, Dickie MM.Staggerer, a new mutation in the mouseaffecting the cerebellum. Science. 1962;137: 610–2.
65. Wu S, De Luca F. Role of cholesterol in theregulation of growth plate chondrogenesisand longitudinal bone growth. J BiolChem. 2004; 279: 4642–7.
© 2009 The AuthorsJournal compilation © 2009 Foundation for Cellular and Molecular Medicine/Blackwell Publishing Ltd


