Embed Size (px)
Citation preview

Controlling the Cohesion of Cement PasteBo Jonsson,*,† A. Nonat,‡ C. Labbez,‡ B. Cabane,§ and H. Wennerstrom|
Theoretical Chemistry, Chemical Center, POB 124, S-221 00 Lund, Sweden, LRRS,UMR CNRS 5313, Universite de Bourgogne, F-21078 Dijon Cedex, France, PMMH, ESPCI,
10 rue Vauquelin, F-75231 Paris Cedex 05, France, and Physical Chemistry 1,Chemical Center, POB 124, S-221 00 Lund, Sweden
Received April 19, 2005. In Final Form: July 8, 2005
The main source of cohesion in cement paste is the nanoparticles of calcium silicate hydrate (C-S-H),which are formed upon the dissolution of the original tricalcium silicate (C3S). The interaction betweenhighly charged C-S-H particles in the presence of divalent calcium counterions is strongly attractivebecause of ion-ion correlations and a negligible entropic repulsion. Traditional double-layer theory basedon the Poisson-Boltzmann equation becomes qualitatively incorrect in these systems. Monte Carlo (MC)simulations in the framework of the primitive model of electrolyte solution is then an alternative, whereion-ion correlations are properly included. In addition to divalent calcium counterions, commercial Portlandcement contains a variety of other ions (sodium, potassium, sulfate, etc.). The influence of high concentrationsof these ionic additives as well as pH on the stability of the final concrete construction is investigatedthrough MC simulations in a grand canonical ensemble. The results show that calcium ions have a strongphysical affinity (in opposition to specific chemical adsorption) to the negatively charged silicate particlesof interest (C-S-H, C3S). This gives concrete surprisingly robust properties, and the cement cohesion isunaffected by the addition of a large variety of additives provided that the calcium concentration and theC-S-H surface charge are high enough. This general phenomenon is also semiquantitatively reproducedfrom a simple analytical model. The simulations also predict that the affinity of divalent counterions fora highly and oppositely charged surface sometimes is high enough to cause a “charge reversal” of theapparent surface charge in agreement with electrophoretic measurements on both C3S and C-S-H particles.
Introduction
Cement is one of the most widely used building materialsin theworld,and it is amazinglyvariable in its composition.The earliest known cements were made in Roman timesfrom lime, volcanic ash, and clay, so-called Pozzolaniccements.1,2 Modern Portland cement is made from lime-stone and clay, which are heated to a high temperature,1500 °C, producing a cement clinker. The clinker productis a polyphasic material including calcium silicates (Ca3-SiO5dC3S, 50-70 wt % and Ca2SiO4, 10-30%), calciumaluminate, and aluminoferrite (5-20%). Because of thenatural origin of the raw materials including possiblepollutants and the different fuels used to burn the clinker,it may also contain a few percent of alkali oxides or sulfates.Finally, a variety of waste materials, including urbansludge3-5 and industrial waste,6-8 are often burnt togetherwith the minerals as a convenient way to dispose of them.The volumes of waste that are incorporated in this waycan be substantial, amounting to about 5% secondarymaterial and 80% alternative fuel. The final cementproduct is obtained by grinding the clinkers with about5% gypsum (CaSO4).
At an early stage, after mixing cement with water andsand, concrete is a fluid cement paste with embedded
gravels. The paste is a concentrated suspension of 10-100 µm grains immersed in an aqueous solution; thevolume fraction is typically around 40%. As soon as thecement constituents are in contact with water, they beginto dissolve, and the surface of the grains, mainly C3S,becomes negatively charged. The solution contains fromthe very beginning calcium, potassium, and/or sodium,sulfate, hydroxide, silicate, and aluminate ions. The C3Sparticles form a network in the first minutes after mixingbecause of attractive forces between them;9,10 see Figure1a. The solution is quickly supersaturated with respectto calcium silicate hydrate (CaO-SiO2-H2O ) C-S-H)and calcium sulfoaluminate hydrate (ettringite), whichprecipitate. The dissolution-precipitation continues, whilemaintaining lowconcentrationsof silicatesandaluminatesin the solution. Initially, pH is increasing until theprecipitation of calcium hydroxide (portlandite) occurs.
Among the precipitated hydrates, the main componentis C-S-H, which constitutes at least 60% of the fullyhydrated cement paste. It is generally recognized asresponsible for the setting and hardening of cementbecause it precipitates at the surface of the anhydrouscalcium silicate grains, preferentially first at the contactbetween them. AFM experiments11 reveal that C-S-Hparticles, immersed in a Ca(OH)2 solution, attract eachother at short range (2 nm) provided that pH exceeds 12.The strength of the paste increases during the hydrationprocess because of the augmentation of the number ofcontact points between the cement grains created byC-S-H particles; see Figure 1b. Mechanical experi-ments10 show that the intrinsic properties of the networkremain the same throughout the hydration process. A fully
† Theoretical Chemistry, Chemical Center.‡ Universite de Bourgogne.§ PMMH.| Physical Chemistry 1, Chemical Center.(1) Vitruvius: Ten Books on Architecture; Cambridge University
Press: Cambridge, U.K., 1999.(2) MacLaren, D. C.; White, M. A. J. Chem. Educ. 2003, 80, 623.(3) Romeu, J. M. Cemento-Hormigon 1994, 65, 756.(4) Ochsenreiter, C.; Kuyumcu, H. Cem. Int. 2004, 2, 58.(5) Klaska, R.; Baetzner, S.; Moeller, H.; Paul, M.; Roppelt, T. Cem.
Int. 2003, 1, 88.(6) Scheur, A. Cem. Int. 2003, 1, 48.(7) Trezza, M. A.; Scian, A. N. Cem. Concr. Res. 2000, 30, 137.(8) Wanzura, F.; Wendt, B. ZKG Int. 2003, 56, 53.
(9) Jiang, S. P.; Mutin, J.-C.; Nonat, A. Cem. Concr. Res. 1996, 26,491.
(10) Nachbaur, L.; Mutin, J.-C.; Nonat, A.; Choplin, L. Cem. Concr.Res. 2001, 31, 183.
(11) Lesko, S.; Lesniewska, E.; Nonat, A.; Mutin, J.-C.; Goudonnet,J.-P. Ultramicroscopy 2001, 86, 11.
10.1021/la051048z CCC: $30.25 © xxxx American Chemical SocietyPAGE EST: 10.4Published on Web 00/00/0000

hydrated cement paste can exhibit a high compressivestrength, >100 MPa, whereas its tensile strength is low(∼2 MPa).12 This is probably due to the fact that the elasticlimit of the material is small: the critical strain that cementpaste can support is <10-4.10 It was suggested that thisis because the cohesion of the network is due to short-range surface forces between C-S-H particles and cementgrains and C-S-H particles themselves.
The molecular mechanisms of the cohesion in cementpaste are not well understood despite a tremendous effortdevoted to both structural and thermodynamic studies.One reason is the lack of accurate structural data for theC-S-H particles. It is, however, generally agreed that itis a nanocrystalline material with a lamellar structuresimilar to that of a rare mineral, tobermorite.13 The silanolgroups on the surface of C-S-H can titrate and will giverise toahighsurface chargedensityunder basic conditions.A second reason is that the cement composition can varyquite a lot, hence we lack a unique target for ourinvestigation. This second factor is actually a clue to thecohesion process because it indicates that the mechanismmust be of rather general character. Both van der Waalsforces and electrostatic ionic forces are of general characterand do not vary much from one material to another orfrom one type of ion to another.14 Still, the so-called DLVOtheory15,16 seems not to be applicable to the cohesion ofcement because under these conditions it predicts only arepulsive pressure. That is, the attractive van der Waalsforce alone cannot explain the cohesion in cement pastebecause the attraction between cement particles changeswith the composition of the solution.
Some years ago,17 we demonstrated that the Poisson-Boltzmann (PB) equation, an essential part of the DLVOtheory, becomes inadequate in strongly coupled systemshaving high surface charge densities and/or multivalentcounterions. The PB approximation is a mean fieldapproximation and neglects the correlation between theco- and counterions in the solution. These ion-ion
correlations become important in strongly coupled sys-tems. Under such conditions, the PB equation fails in twoways. First, it lacks the attractive pressure that describesthe effect of ion-ion correlations. Second, it overstimatesthe repulsive pressure that results from the entropy ofthe counterions. As a result, the PB equation may predicta “double-layer repulsion” in systems where the totalosmotic pressure is in fact attractive. These results havealso been reproduced in a variety of simulations18,19 andadvanced liquid-state theories.20-22
Kjellander et al. have suggested that the ion-ioncorrelations are important for the stability of clays,23 andprevious studies by Delville and co-workers24-27 haveshown that the correlations can give rise to attractiveforces that explain the cohesion of cement paste. The latterstudies have, however, been limited in treating the cementpaste in a simplified fashion, assuming that the concen-tration of additional salt is zero.28 In fact, the system thatproduces the mechanical properties of the paste is madeof fourcomponents: cementgrains,C-S-Hnanoparticles,the confined solution separating the nanoparticles, andthe aqueous solution filling the pores between grains,which we will refer to as the bulk solution; see Figure 1.The composition of the bulk solution is determined by thedissolution processes, which bring in a collection of cations(mainly Ca2 +, K+, Na+, etc.) and anions (OH-, sulfate,silicates, aluminates, etc.), according to the compositionof the dry cement mix. This solution acts as a reservoirdetermining the chemical potentials of all ions throughoutthe paste including the confined solution. Thus, changesin the mix of the raw materials will produce modificationsin the composition of the bulk solution as well as in theconfined solution and in the C-S-H surface chargedensity, which in turn will affect the cohesion of the cementpaste. Another aspect is that the composition of thesolution changes during the hydration process and mayeven show local variations due to the composite characterof concrete. Hence, it is important to be able to accountfor these effects in a theoretical treatment.
In the following text, we will focus on the interactionbetween the C-S-H particles and how the interactionbecomes attractive at high surface charge density and inthe presence of divalent calcium ions. However, the sametype of interaction exists between two C3S particles orbetween one C3S and one C-S-H particle. Indeed,electrophoretic measurements indicate that the surfacecharge density of C3S is only marginally lower than thatof C-S-H.29 The attraction between the C3S particles isthen responsible for the initial cohesion in cement paste,and it is due to the same type of ion-ion correlations as
(12) Maso, J. C. L’etude Experimentale du Comportement du BeetonDurci sous Sollicitations Monoaxiales et Pluriaxiales. Le Beton Hy-draulique; Presses de l’Ecole Nationale des Ponts et Chaussees: Paris,1982.
(13) Nonat, A. Cem. Concr. Res. 2004, 34, 1521.(14) Israelachvili, J. Intermolecular and Surface Forces, 2nd ed.;
Academic Press: London, 1991.(15) Derjaguin, B. V.; Landau, L. Acta Phys. Chim. URSS 1941, 14,
633.(16) Verwey, E. J. W.; Overbeek, J. Th. G. Theory of the Stability of
Lyophobic Colloids; Elsevier: Amsterdam, 1948.(17) Guldbrand, L.; Jonsson, B.; Wennerstrom, H.; Linse, P. J. Chem.
Phys. 1984, 80, 2221.
(18) Valleau, J. P.; Ivkov, R.; Torrie, G. M. J. Chem. Phys. 1991, 95,520.
(19) Guldbrand, L.; Nilsson, L.; Nordenskiold, L. J. Chem. Phys. 1986,85, 6686.
(20) Kjellander, R.; Marcelja, S. Chem. Phys. Lett. 1984, 112, 49.(21) Kjellander, R.; Marcelja, S. J. Chem. Phys. 1985, 82, 2122.(22) Tang, Z.; Scriven, L. E.; Davis, H. T. J. Chem. Phys. 1992, 97,
9258.(23) Kjellander, R.; Marcelja, S.; Pashley, R. M.; Quirk, J. P. J. Chem.
Phys. 1990, 92, 4399.(24) Pellenq, R.; Caillot, J.; Delville, A. J. Phys. Chem. B 1997, 101,
8584.(25) Pellenq, J.-M.; Delville, A.; van Damme, H. In Characterisation
of Porous Solids IV; B. McEnaney et al., Eds.; Cambridge, U.K., 1997;p 596.
(26) Delville, A.; Pellenq, R.; Caillot, J. J. Chem. Phys. 1997, 106,7275.
(27) van Damme, H. In Encyclopedia of Surface and Colloid Science;Marcel Dekker: New York, 2002; p 1087.
(28) Jonsson, B.; Wennerstrom, H.; Nonat, A.; Cabane, B. Langmuir2004, 20, 6702.
(29) Nachbaur, L.; Nkinamubanzi, P.-C.; Nonat, A.; Mutin, J.-C. J.Colloid Interface Sci. 1998, 202, 261.
Figure 1. Schematic drawing of early cement paste with sand,C3Sparticlesdrawnashatched,approximatelyspherical objects,and C-S-H platelets drawn as black bars. (Left) At an earlystage, water has been added, and the C3S particles have formeda weak network. C3S has also started to go into solution, andthe precipitation threshold of C-S-H has been reached. TheC-S-H particles form preferentially close to the contact pointsof the C3S particles. (Right) At a later stage, a significant portionof C3S has dissolved, and a corresponding amount of C-S-Hhas been created. The contact points between the C3S grainsmediated by the C-S-H particles has increased in number,and so has the cohesion of the paste.
B Langmuir Jonsson et al.

the attraction between the C-S-H particles taking placeat later stages.
The aim of the present work is to analyze the equilibriabetween the bulk and the confined solution, calculate theforces between particles that are immersed in the solution,and predict the composition boundaries beyond which thecement paste may lose its cohesive properties. In this way,we may possibly understand how cement users are ableto tolerate such surprisingly large variations in composi-tion. The article is organized as follows: the next sectiondescribes the physical chemistry of cement and is followedby a section with model and technical details of thesimulation. Before the results of the numerical simulationscomes a section where we try to explain the correlationattraction in the simplest possible model system and witha minimum of mathematics. The Results and Discussionsection starts with a description of ion distributions inthe confined solution and its relation to the bulk conditions.Here we also demonstrate how ion-ion correlations undercertain conditions can lead to an apparent charge reversalof the C-S-H particle. Finally, we describe the cohesion(negative osmotic pressure) under a variety of realisticconditions occurring during the evolution of cement paste.
Physical Chemistry of Cement Hydration
The main component of cement is calcium oxide, ∼70%.The calcium concentration is limited in the bulk solutionby the solubility of different salts. During the first hoursof hydration, the bulk solution is saturated with respectto Ca(OH)2 (portlandite) and CaSO4 or a double salt,calcium potassium sulfate (syngenite), if the K+ concen-tration is higher than 0.4 M. The Ca2+ concentrationstrongly depends on the Na+ and K+ concentrations, whichcan vary from 0 to 1 M depending on the cement. The Ca2+
concentration then varies from 35 to 5 mM, and the sulfateconcentration varies from 10 to 400 mM; see Table 1. Inthis concentration interval, pH increases from 12.5 to 13.After about 10 h, there are no more sulfate ions in solution.They have precipitated in the form of calcium sulfoalu-minate, which has a very low solubility (the SO4
2-
concentration is less than 1 µM). The bulk solution is thena sodium or potassium hydroxide solution saturated withrespect to calcium hydroxide. Depending once again onthe sodium and potassium concentrations, the calciumconcentration varies from 20 mM in absence of alkali ionsto less than 1 mM in a 1 M alkali hydroxide solution. ThepH varies then from 12.5 to 14.30 The important point isthe decrease in calcium concentration and the increase inhydroxide concentration with the alkali content of cement.The extreme case relates to the alkali-silica reaction
occurring in very basic pore solution, when aggregatesinclude a reactive silica part that is known to lead to severecracks in concrete. In that case, the calcium concentrationcould be locally zero in the vicinity of reactive silica grains.Hydroxide and polysilicate anions are then charge bal-anced by alkali ions (monovalent).
We will see below that two factors are of paramountimportance for the cohesion, the pH of the solution, andthe presence of di- or multivalent cations (the anions playa much smaller role). The alkalinity of the solutiondetermines the surface charge density of the C-S-Hparticles. Unfortunately, the titration properties of thesilicate moieties in C-S-H are not well characterized;consequently, we do not know exactly how the surfacecharge density varies with pH. Anyway, pH will undermost circumstances be high in the cement paste, and thesilanol groups of the surface will titrate according to
From geometric/stoichiometric considerations, one canconclude that an upper value for the surface charge densityof C-S-H is approximately 0.8 C/m2 (1 C/m2 ) 6.24 e/nm2),corresponding to a pH value close to 14. At pH 12, the truevalue is probably closer to 0.2-0.4 C/m2. Lacking the exactnumber for the charge of C-S-H, we have chosen to spana range of reasonable surface charge density in oursimulations. This means that the hydroxide ions havebeen considered to be on equal footing with chloride andnitrate ions. All of these monovalent anions are collectivelydenoted X. The titration properties of C-S-H are animportant problem, and we will come back to them in afuture study.
The other factor that controls the cohesion is the relativeconcentration of mono- (Na+) and divalent cations (Ca2+),which will be investigated in a realistic range of concen-tration in the simulations. Trivalent cations are notencountered in significant concentration in the bulksolution of a cement paste because of its high pH. Trivalentmetal ions are either amphoteric (i.e., Al(III)) and formanions under this condition or precipitate as insolublehydroxides. Relatively high concentrations of divalentanions may be transitorily present in bulk solution (Table1) associated with alkali ions and also in special cases oftrivalent anions (i.e., phosphates). The effect of theseanions on the ionic distribution and the cohesion will bedescribed below.
Model and Simulations
Model. We do not attempt to model the cement systemin atomic detail, but instead we aim at a mesoscopic modelthat contains the basic physical ingredients. The primitivemodel of electrolyte solution is such an alternative, whereall ions are considered explicitly and water is treated asa dielectric continuum characterized only by its relativedielectric permittivity, εr ) 78.5 (at room temperature).Furthermore, lacking detailed information on the geom-etry of the C-S-H nanoparticles, it is assumed that theinteraction between them can be modeled as an interactionbetween two parallel planar walls, with a smeared outsurface charge density (see Figure 2; the surface chargeof C-S-H is of course negative, and in the rest of thearticle we will refer to its absolute value). The C-S-Hplatelets have limited dimensions, but the ratio betweenthe extension of the platelets (300-600 Å) and the relevantseparation between them, 10-20 Å, is such that theinfinite system is a very good model for the interactionbetween C-S-H particles. The confined solution will(30) Longuet, P.; Burglen, L.; Zelwer, A. CERILH N 1972, 219, 219.
Table 1. Variation of Main Ionic Concentrations (mM) inthe Pore (Bulk) Solution of a Cement Paste According to
the Alkali Content (wt % M2O)a
different stages M2O% K+ or Na+ SO42- OH- Ca2+
early paste - 1 0.0 0 10 50 35early paste - 2 0.3 200 70 94 17early paste - 3 1.4 1000 400 210 5
late paste - 1 0.0 0 0 40 20late paste - 2 0.3 200 0 206 3late paste - 3 1.4 1000 0 1000 1
extreme case 1.4 1000 0 600 0a Early stage relates to the first 10-20 h after mixing, when
sulfate is being consumed to form ettringite. Late stage relates tomature pastes (more than 1 month old). In the extreme case,polysilicate chargebalances thealkali ions,andtheCaconcentrationbecomes vanishingly small.
-SiOH + OH- f -SiO- + H2O
Controlling the Cohesion of Cement Paste Langmuir C

contain an electrolyte solution with both counter- and co-ions whose average concentration will vary with theseparation h. The assumption is that this solution is inequilibrium with an infinite bulk solution of knownstoichiometric composition. That is, the concentration ofthe ionic species in the confined solution is not knownbeforehand but has to be determined from the chemicalpotentials imposed by the bulk solution in a grandcanonical Monte Carlo simulation. This is done under thecondition of electroneutrality.
An interesting and conceptually useful property of themodel system in Figure 2 is that it is, in the absence ofadditional salt, completely determined by two dimension-less parameters.17 These can be seen as a rescaled wall-wall separation,
and a rescaled surface charge density,
where lB ) e2/(4πε0εrkT) is the Bjerrum length. We willuse these rescaled quantities for a qualitative discussionin a following section.
As previously mentioned, the variation of the composi-tion of cement can affect the cohesion between the C-S-Hparticles. This variation is induced either by the variabilityof row materialssfuels and wastessor by additives inorder to improve certain properties of the cement pasteor both. The additives can be various salts containing ionssuch as Na+, SO4
2-, PO43-, and silicates as well as more
complex ions. Some of these ions are added to improvecertain properties of the cement paste, and others appearas unwanted pollutants. In either case, it is important toknow how they affect the cohesion. As an example, considera cement paste containing 20 mM Ca(OH)2 and 100 mMNa2SO4. This means that there will be four different ionicspecies that can enter the slit. Hence, we have to prescribethe chemical potential for three salts, for example, Ca-
(OH)2, NaOH, and Na2SO4. An equally valid combinationis Ca(OH)2, CaSO4, and Na2SO4. The fourth degree offreedom will be taken care of by the requirement that thesystem must be electroneutral.
Cement paste can, as in the above example, contain avariety of mono- and divalent cations as well as anions.In an attempt to minimize the number of parameters andmaintain a simple model, we have set all ionic radii equalto 2 Å, that is, dhc ) 4 Å. Previous analyses of seawateralso indicate that the appropriate variation of ionic radiiis rather limited.31
Ionic Interactions. The interaction energy betweenany two ions of diameter dhc can be formally described by
where e and ε0 are the elementary charge and dielectricpermittivity of vacuum, respectively. These interactionsare applied to all ions in a “box” defined by the chargedwalls separated a distance of h. The size of the simulationbox is LLh, where the lateral dimensions (L) are deter-mined by the net ionic charge of ions in the Monte Carlo(MC) box. Besides their mutual interactions, the ions alsointeract with the charged surfaces in the simulation box.The potential generated by the two squared surfaces ofdimension L2 is
where Φ(z) is the electrostatic potential in position z andthe two charged surfaces are placed at (h/2. Electrostaticinteractions are long-ranged, and a correction termapproximating interactions outside the MC box has alsobeen added.18,32 Thus, the total energy is a sum of ion-ion, ion-wall, and wall-wall interactions plus a long-range correction term
The numerical procedure we follow here has been testedin a number of previous double-layer simulations, and wefeel confident about its stability17,18
Osmotic Pressure. The osmotic pressure of theconfined solution, posm
conf, may be calculated according toeither of the following expressions17,33
where mp stands for midplane. These relations are exact
(31) Lund, M.; Jonsson, B.; Pedersen, T. Mar. Chem. 2003, 80, 95.(32) Jonsson, B.; Wennerstrom, H.; Halle, B. J. Phys. Chem. 1980,
84, 2179.
Figure 2. Planar model system of two C-S-H particles withneutralizing mono- and divalent counterions as well as co-ions.The system is thought to be infinite in two dimensions, and thesurface charge density, σ, is assumed to be uniformly smearedout on the two confining surfaces. The confined solution containsboth co- and counterions, whose concentrations are determinedby the equilibrium with an infinite bulk solution. The dielectricpermittivity, εr, is assumed to be uniform throughout space,and the whole system is electroneutral.
S1 )4πε0εrkTh
Z2e2) h
Z2lB
(1)
S2 ) Z3e3σ(4πε0εrkT)2
)Z3lB
2σe
(2)
u(ri, rj) )ZiZje
2
4πε0εr|ri - rj|r > dhc (3)
u(ri, rj) ) ∞ r < dhc (4)
Φ(z) )σ
4πε0εr∑
s)1,-1
4L lnxL2/2 + (z + (sh/2))2 + L/2
x(L/2)2 + (z + (sh/2))2
(5)
-2|z + (sh/2)| ×
[arcsin(L/2)4 - (z + (sh/2))4 - (L2/2)(z + (sh/2))2
{(L/2)2 + (z + (sh/2))2}2+ π
2]
Utot ) Uii + Uiw + Uww + Ulr (6)
posmconf ) kBT∑
i
ci(wall) -σ2
2εrε0
posmconf ) kBT∑
i
ci(mp) + pcorr + phc (7)
D Langmuir Jonsson et al.

within the primitive model. The term pcorr comes from thefact that ions on either side of the midplane correlate andgive an attractive contribution to the pressure. In the meanfield description, this term disappears because of elec-troneutrality (i.e., there are no correlations across themidplane). Here we have used the second relation for theevaluation of the pressure because it tends to give thebest accuracy. If the ions have a finite size dhc, then onealso gets a hard core term,phc, that describes the additionalpressure due to the finite volume of the ions. In somefortuitous cases, ion-ion correlation and ionic size effectscompensate, and the net pressure is surprisingly welldescribed by a mean field approximation.34
The hard core radius has a clear physical origin, thatis, ions cannot overlap because of the quantum mechanicalexchange repulsion. In simulations or other theories ofelectrolyte solutions, however, it tends to achieve thecharacter of a fitting parameter. There is not a clear-cutchoice of dhc. Should it be the bare ion diameter or thatof a hydrated ion? Fortunately, for the present study ofcement paste there is a relatively broad range for dhc whereit has only a weak effect on the interparticle forces. Aninteresting discussion of the importance of the ionic sizecan be found in a combined experimental and theoreticalstudy by Kekicheff et al.35
Equation 7 gives the osmotic pressure in the confinedregion, but the experimentally interesting quantity is thenet osmotic pressure,
where the bulk pressure is calculated for a bulk with thesame chemical potential(s) as the double layer. The osmoticpressure in the bulk was calculated as36
where φ is the volume fraction of ions, xi is the fractionof ions of type i in the bulk, and gij(dhc) is the contact valueof the ion-ion correlation function.
Monte Carlo Simulations. The electrostatic interac-tion described above defines the Hamiltonian (i.e., formsthe basis for a MC simulation of the solution phase ofcement paste). We use the standard Metropolis algorithm37
extended to a grand canonical ensemble.38 That is, inaddition to the random movements of ions, there will alsobe the creation and anhilation of salt pairs. A randomdisplacement of an already existing ion will be acceptedif the new energy fulfills
where ê is a random number between zero and 1 and ∆U) Utot
new - Utotold. A similar criterion applies for the creation
of a salt pair at random positions in the box. For example,the creation of a sodium sulfate triplet is accepted if
where µtot is the total chemical potential for the sodiumsulfate salt and ∆U is the change in electrostatic energyupon the insertions. A similar relation holds for theanhilation of a sodium sulfate triplet,
The numbers of co- and counterions vary, but the totalnumber of ions was always larger than approximately200, and in some high-salt cases, it increased to morethan 1000 ions. Size convergence was ensured by per-forming simulations with double the number of ions. Eachparticle was subject to 105 attempted moves. Simulationswith 106 moves/ion confirmed that convergence wasachieved with respect to number of configuration. In thesimulations of the confined solution, we apply periodicboundary conditions in two dimensions, that is, thedirections parallel to the charged surfaces. In the thirddimension, the system is limited by the charged walls,which are impenetrable to the ions. The results areequilibrium distributions of all ions in the confinedsolution, their average concentration, and the direct forceacting between the two halves of the system shown inFigure 2. From this knowledge, we can calculate theosmotic pressure, and we can also analyze the differentcomponents of the pressure as defined in eq 7.
Because these simulations are performed in the grandcanonical ensemble, a necessary input is the total chemicalpotentials of the salt, µtot/kBT, in the corresponding bulksolution. Thus, initially we have to perform a set ofsimulations for the relevant bulk conditions. Here we usedthe ordinary canonical ensemble with the interactionsfollowing eq 3. Periodic boundary conditions were appliedin three dimensions, and the number of configurationsgenerated in the simulations was approximately an orderof magnitude smaller than in the simulations of theconfined solution. The chemical potential was calculatedwith the Widom insertion technique,39 where an ion isinserted at a random position, r, in the simulation boxand the excess chemical potential is obtained from
where ∆U(r) is the interaction energy between the insertedion and all other ions in the box. ⟨...⟩ 0 symbolizes an averageover the unperturbed system, that is, the inserted ion isremoved after calculating ∆U(r). The Coulomb interactionis long-ranged, and we have added a correction term tohandle correlations between the inserted ion and ionsoutside the MC box.40 This modified insertion techniqueallows us to obtain single-ion activities. The salt chemicalpotential is then simply a sum of the relevant single-ionactivities. An alternative route to avoid the complicationsof the long-ranged Coulomb interaction is to insert aneutral salt into the Widom procedure. This is, however,numerically inferior to the insertion of single ions, inparticular, for asymmetric salts such as Na3PO4 consistingof several ions. The accuracy in µex/kBT is better than
(33) Wennerstrom, H.; Jonsson, B.; Linse, P. J. Chem. Phys. 1982,76, 4665.
(34) Kjellander, R.; Marcelja, S. J. Phys. (France) 1988, 49, 1009.(35) Kekiche, P.; Marcelja, S.; Senden, T. J.; Shubin, V. E. J. Chem.
Phys. 1993, 99, 6098.(36) McQuarrie, D. A. Statistical Mechanics; Harper Collins: New
York, 1976.(37) Metropolis, N. A.; Rosenbluth, A. W.; Rosenbluth, M. N.; Teller,
A.; Teller, E. J. Chem. Phys. 1953, 21, 1087.(38) Frenkel, D.; Smit, B. Understanding Molecular Simulation;
Academic Press: San Diego, CA, 1996.(39) Widom, B. J. Chem. Phys. 1963, 39, 2808.(40) Svensson, B. R.; Woodward, C. E. Mol. Phys. 1988, 64, 247.
posm ) posmconf - posm
bulk (8)
posmbulk )
kBT∑i
cibulk[1 +
⟨Utot⟩
3kBT+ 4φ∑
i∑
j
gij(dhc)xibulkxj
bulk] (9)
exp(-∆U/kBT) > ê (10)
V3
(NNa + 1)(NNa + 2)(NSO4+ 1)
×
exp(µtot/kBT - ∆U/kBT) > ê (11)
NNa(NNa - 1)NSO4
V3exp(-µtot/kBT - ∆U/kBT) > ê (12)
µex ) -kBT ln⟨exp[-∆U(r)/kBT]⟩0 (13)
Controlling the Cohesion of Cement Paste Langmuir E

(0.005, and the accuracy in osmotic pressure is betterthan (2 mM. The latter is needed to calculate the netosmotic pressure; see eq 9. It is also a check of theconsistency of the simulations because we know that theosmotic pressure in the confined solution should approachthe bulk value when h f ∞.
Simple Model. As a complement to the Monte Carlosimulations of the model in Figure 2, we first introducea simple free-energy function for an even simpler modelsystem. We argue that this system captures the essentialphysics of the cohesion in cement paste. It has the properresponse to changes in counterion valency, added salt,solvent quality, and surface charge density. As a startingpoint, consider the model system in Figure 2. If theinteraction between the counterions is strong, then theywill become strongly correlated, and we can imagine asituation where each counterion is confined to its ownlittle cylinder with the ends of the cylinder being thecharged surfaces. That is, each cylinder contains only onecounterion, and we assume that there is no interactionbetween two cylinders. The extreme of this is of course ifthe counterion, of charge Ze, moves only along the cylinderaxis. To simplify the system further, we also replace thecharged circular surfaces with a point charge equal to -Ze/2, and finally we obtain the model system depicted inFigure 3. The distance δ is chosen such that the potentialat the end points from the nearest surface is the samewith a point charge as with a smeared out surface chargedensity on a circular area with radius R. That is, we havethe condition
Noting that σ ) Ze/2πR2, we get
Thus, for a given counterion valency, we can use thedistance δ as a measure of the surface charge density. Letus now estimate the energy by placing the counterion inthe middle between the “surfaces”. The energy for thatparticular configuration is not as low as the average energyof the system. Likewise, we can overestimate the entropyby assuming that the distribution is uniform. Using sucha heuristic approach, we can write the free energy of thesystem in Figure 3 as
where we have used the dimensionless parametersintroduced in eqs 1 and 2. A constant, kT ln Z2lB, has alsobeen added to make the entropic term dimensionallyconsistent. A more extensive discussion of the model inFigure 3 can be found in refs 41 and 42. Here we merelynote that eq 16 contains terms that depends in a quali-tatively correctwayon thesamedimensionless parametersas those of the more elaborate model, Figure 2. There is
a competition between an entropic term that dominatesfor large S1 (i.e. large separations) and also for very smallS1, whereas the interaction term can dominate at inter-mediate separations provided that S2 is sufficiently large.
The force, F, acting on the fixed charges is determinedby the derivative
By solving for the condition of F ) 0 at a finite value ofS1, we obtain the requirement that S2 g 128/49π for anonmonotonic variation of the force. One advantage ofexpressing the free energy in terms of dimensionlessquantities is that it clearly shows that there is nofundamental relation between the counterion valency andthe nature of the force. Rather it is one of the oddities ofnature that for monovalent counterions in an aqueoussystem it is essentially impossible to reach such a highsurface charge density that S2 exceeds the critical value128/49π ≈ 0.83, whereas this is readily achieved forcounterions of higher valency.
As an explicit example, choose σ ) 0.07 C/m2 (∼1e/200Å2) in an aqueous system at room temperature (lB ) 7.1Å). For monovalent ions S2 ) 0.22, which is well below thecritical value, whereas for divalent counterions we haveS2 ) 1.76, which yields a force curve with a primaryminimum. For Z ) 3, S2 ≈ 12, and as shown in Figure 4,this results in a strongly attractive force curve.
For room-temperature and aqueous conditions, thelimiting charge density for a nonmonotonic force curvecorresponds to
σ ) 0.26 C/m2, h ) 6.2 Å, Z ) 1;σ ) 0.033 C/m2, h ) 25 Å, Z ) 2; andσ ) 0.010 C/m2, h ) 55 Å, Z ) 3.These values are for the simplified model system, but
for an exact MC simulation of the model system in Figure2, approximately the same numbers will result. When σincreases beyond these values, then the minimum in theinteraction moves to shorter separations according to
The plus sign gives the position of the maximum of theforce curve. At high surface charge densities, S2 . 1, and
(41) Jonsson, B.; Wennerstrom, H. When Ion-Ion Corelations AreImportant in Charged Colloidal Systems. In Electrostatic Effects in SoftMatter and Biophysics; Holm, C., Kekiche, P., Podgornik, R., Eds.;Kluwer Academic Publishers: Norwell, MA, 2001.
(42) Jonsson, B.; Wennerstrom, H. J. Adhes. 2004, 80, 339.
(Ze/2)Ze4πε0εrδ
) ∫0
R Zeσ2πr dr4πε0εrr
(14)
δ ) R2
and σ ) Ze8πδ2
(15)
A(h)kBT
) -7Z2lB
4(h + 2δ)- ln h
Z2lB
)
- 74(S1 + 1/x2πS2)
- ln S1 (16)
Figure 3. Simplified model with two fixed “surface” chargesand one mobile counterion of valency Z confined to a line oflength h. The displacement of the surface charges, δ, is supposedto mimic the surface charge density.
Figure 4. Force between the two fixed charges in the simplified“double layer”. The counterion valency has been varied, whereasσ ) 0.07 C/m2.
F ) -∂(A(h)/kBT)
∂S1) - 7
4(S1 + (1/x2πS2))2
+ 1S1
(17)
S1 ) 78
- 1
x2πS2
( x(78)2- 7
4x2πS2
(18)
F Langmuir Jonsson et al.

then eq 18 predicts that the minimum occurs for S1 ≈(4/7)/(2πS2). For comparison with simulation results, it isinstructive to analyze how the depth of the minimumvaries with counterion valency at high charge density.Using eq 16 and neglecting logarithmic terms, we findthat in the minimum
The minimum in free energy corresponds to the adhesionenergy per counterion. The adhesion energy is typicallymeasured per unit wall charge, which we obtain dividingby Z/2,
Thus, in the regime of strong electrostatic coupling, theadhesion energy is relatively weakly dependent on thecounterion valency as well as on the surface charge density.
This simple model system captures the main physicalfeatures of a planar double layer and the cohesion in acement paste. The addition of a second salt can also beinterpreted in this simple fashion. For example, addinga monovalent counterion to a system already containinga divalentonemeans that the “average” counterionvalencyis reduced and that the attraction is weakened. We canuse the simple model to estimate the effect of the additionof a Na+ salt to the bulk that already contains a Ca2+ salt(the concentration of anions in the confined region is lowand will be neglected). Let us by cCa and cNa denote thecalcium and sodium concentrations in the bulk solution,respectively, which for simplicity we will treat as beingideal. This means that the free-energy difference betweena calcium and a sodium ion in the bulk is given by
The corresponding difference in the confined solution isgiven by eq 22,
With these free-energy differences, we can calculate theprobability for di- and monovalent counterions, respec-tively, in the confined solution as a function of the relativesalt concentrations in the bulk. The probability, QCa, isgiven by
and similarly for QNa ) 1 - QCa. We can now calculate anapproximate net osmotic pressure for a given bulk saltratio from
where posmCa and posm
Na are calculated from eq 17. Figure 5shows that the cohesion is very robust and that therobustness increases with increasing surface charge
density. For a range of physically reasonable surfacecharge densities, the cohesion survives in the presence oflarge numbers of monovalent counterions in the bulk. Wewill return to this issue later on using more accurate datafrom the MC simulations. The qualitative picture of Figure5 will, however, remain the same. Thus, we can, on thebasis of the results from this simple model, conclude thattwo properties are important for the cohesion of cement:(i) the presence of divalent calcium counterions and (ii)a high surface charge density (i.e., a high pH).
Simulation ResultsIon Distributions. The general behavior of co- and
counterions found already with the PB equation survivesto a large extent even in highly coupled systems such ascement. A few exceptions appear, and it is our intentionto start by describing these before discussing the resultingpressures. Figure 6a shows concentration profiles whenthe bulk contains 20 mM CaX2 and 100 mM NaX. Initially,at short a distance, there will hardly be any co-ions in theconfined solution, but at distances larger than 10-20 Å,the concentration will be essentially the same as in thebulk. The calcium and sodium ions will compete for thecharged surfaces, and at short separations, calcium willbe the dominating counterion. Again, we can see that thebulk values are reached at a separation of a few nanom-eters.
The competition between counterions of different va-lency is an important property, which has a profound
A(hmin)kBT
≈ - 74x2πS2 (19)
Aadh
kBT≈ -7lBxπZσ
2e(20)
∆Abulk
kBT) -ln
cCa
cNa(21)
∆Aconf
kBT) - 7
4(S1Ca + (1/x2πS2
Ca))+
7
4(S1Na + (1/x2πS2
Na))(22)
QCa )exp[-(∆Aconf - ∆Abulk)/kBT]
exp[-(∆Aconf - ∆Abulk)/kBT] + 1(23)
posm ) QCaposmCa + QNaposm
Na (24)
Figure 5. Competition between calcium and sodium ions asapproximately described by the simple model. The curves showhow the attractive minimum is reduced for different surfacecharge densities (0.15-0.5 C/m2) upon increasing the sodiumconcentration in the bulk. cNa and cCa are the bulk concentrationsof sodium and calcium, respectively. The pressure is calculatedfrom eq 25.
Figure 6. (Left) Co- and counterion profiles for a confinedsolution in equilibrium with a bulk solution containing 20 mMCaX2 and 100 mM NaX. The surface charge density is 0.32C/m2. The bold solid line shows the calcium concentration, andthe thin solid line shows the sodium concentration. The anionconcentration is represented by the dashed line. (Right) Thefraction sodium charge (see text) in the confined solution as afunction of surface separation. The bulk contains 20 mM CaX2+ 200 mM Na2SO4 and σ ) 0.32 C/m2 (lower solid curve), 20mM CaX2 + 200 mM Na2SO4 and σ ) 0.16 C/m2 (upper solidcurve), 20 mM CaX2 + 1000 mM NaX and σ ) 0.32 C/m2 (lowerdashed curve), and 1 mM CaX2 + 1000 mM NaX and σ ) 0.32C/m2 (upper dashed curve).
Controlling the Cohesion of Cement Paste Langmuir G

influence on the cohesion of cement. Figure 6b demon-strates how the surface charge distribution and the bulkconcentration ratio affect the competition between sodiumand calcium. The fraction sodium charge in the confinedsolution,
is low at short separations and then gradually approachesthe bulk ratio (⟨...⟩ denotes an average over the slit). Atlow surface charge density and with 20 mM CaX2 and 200mM Na2SO4 in the bulk, the limiting value is 10/11,whereas the value at h ) 60 Å is slightly less; see theupper solid curve in Figure 6b. By doubling the surfacecharge density, we favor the calcium ions, giving the lowersolid curve in Figure 6b. The two dashed lines in Figure6b correspond to the same charge density but a differentbulk ratio of calcium and sodium ions. Thus, we canconclude that a high surface charge density favors calciumions as counterions and that with the surface chargedensities studied here, >0.1 C/m2, we need a high bulksodium concentration in order to exchange the calciumions in the confined solution. These are two importantfactors for the cohesion of cement.
Charge Reversal. We can also allow the confinedsolution to be in equilibrium with a bulk solution, whichcontains only divalent counterions. Without monovalentcounterions, we find that the addition of CaX2 to the bulkleads to a gradual build up of a second layer outside thecharged surface. That is, the surface is “more thanneutralized” by counterions ,and as a consequence, a layerof co-ions is formed about 5-10 Å from the surface.
The accumulation of co-ions is limited to very shortseparations, z < 10 Å, and it increases with salt concen-tration; see Figure 7. It is not possible to go to very largeseparations in the simulations, but it is our belief that thetwo maxima shown for h ) 20 and 40 Å in Figure 7a willsurvive even at infinite separation. The co-ion layer ispromoted by a high surface charge density; see Figure 8a.It also increases with increasing bulk salt concentrationas can be seen from the ionic profiles in Figure 7b. Thislayered structure appears in double-layer systems whenthe energetic term dominates over the entropy.
The accumulation of counterions may lead to a chargereversal near the surface. Let us formally define anapparent charge density seen at a position z as
where F(z′) is the charge density of the mobile ions and-σ0 is the surface charge density of a wall placed at -h/2.
With only monovalent counterions or low surface chargedensity, σapp(z) is usually a monotonic function going from-σ0 to zero when z varies from -h/2 to 0. A nonmonotonicbehavior (i.e., a charge reversal) is seen at high surfacecharge density and in the presence of divalent counterions,and it increases with increasing salt concentration in thebulk. Figure 8b shows the charge reversal for a system inequilibrium with the bulk, which has a varying calciumconcentration. The charge reversal has been seen in avariety of electrophoretic experiments and is often in-terpreted as a consequence of specific ion binding.29,43 Whatwe see here is that electrostatic interactions alone areenough to create an apparently changed surface charge.The charge reversal is another manifestation of ion-ioncorrelations and is sometimes seen under the sameconditions at which the attractive double-layer forcesappear. The two phenomena should not be confused. Forexample, the attraction exists over a much wider param-eter space than the charge reversal. The fact that thedielectric continuum model predicts a charge reversal inexcellent agreement with experiment is of course ad-ditional evidence that the model catches important andcomplex physical mechanisms in a highly charged sus-pension.
In an aqueous solution with monovalent counterions,we do not see any charge reversal, and it is only withmultivalent counterionsorpolyelectrolyte counterions thatit is found.35,44 Thus, a consequence of the successiveaddition of NaX is that the layering of co-ions starts todisappear, but more important is the fact that theconcentration decreases as shown in Figure 9. This is inline with the discussion above, where we stressed thatthe increase in the number of monovalent cations in thebulk leads to an “effective counterion” with a valency ofless than 2. Under these circumstances, the systembecomes dominated by the entropy, and canonical behaviorboth with respect to ion distribution and forces can beexpected.
We note that the “layering” of co-ions is also promotedby the co-ion valency. That is, divalent or trivalent co-ions more easily lead to a nonmonotonic profile in the slit.Figure 9b shows the total co-ion profiles for four differentbulk conditions. Without any monovalent counterions,there is a strong buildup of a co-ion layer, and the co-ionconcentration also readily exceeds the bulk value. Withthe addition of NaX, this pattern disappears, whereas itpersists in the presence of multivalent co-ions (i.e., SO4
2-
and PO43-), although it does not lead to a charge reversal;
(43) Viallis-Terrisse, H.; Nonat, A.; Petit, J.-C. J. Colloid InterfaceSci. 2001, 244, 58.
(44) Sjostrom, L.; A° kesson, T.; Jonsson, B. Ber. Bunsen-Ges. Phys.Chem. 1996, 100, 889.
Figure 7. (Left) Normalized co-ion distribution for fourdifferent surface separations: h ) 5, 10, 20, and 40 Å. The bulksolution contains 80 mM CaX2. (Right) Co-ion concentration asa function of surface separation. Solid lines are the average slitconcentration, and dashed lines show the mid-plane concentra-tion. The corresponding bulk concentrations are indicated witharrows to the right. The surface charge density is 0.32 C/m2.
ηNa )⟨cNa⟩
2⟨cCa⟩ + ⟨cNa⟩(25)
σapp(z) ) -σ0 + ∫-h/2
zdz′ F(z′) (26)
Figure8. (Left) Co-ion (X-) distribution fora surface separationof 40 Å. The surface charge density is varied, whereas the bulkconcentration is kept fixed at 80 mM CaX2. (Right) Apparentsurface charge density, σapp(z), in arbitrary units. The surfacecharge density is 0.32 C/m2, h ) 40 Å, and the bulk containsCaX2 solution of varying concentration as indicated in the graph.
H Langmuir Jonsson et al.

see Figure 10. Layering is not directly related to chargereversal. As a matter of fact, multivalent co-ions areexpelled from the confined solution as compared tomonovalent ones. Still, they display a more nonuniformionic profile in the slit.
The charge reversal is found in systems with divalentcounterions. The addition of a salt with a monovalentcounterion such as Na+ reduces the charge reversal, andeventually it will disappear. Sodium salts with multivalentanions are in this respect more effective, and even smallamounts of Na3PO4 lead to the disappearance of chargereversal (Figure 10). However, charge reversal is alsodependent on the surface charge density, and it canreappear upon increasing the surface charge density.
Cohesion. Below we discuss for a number of technicallyimportant cases how the osmotic pressure and the cohesionvary with bulk conditions. The latter include pH and addedsalt of different valencies. The pH determines the surfacecharge density of the C-S-H nanoparticles and affectsthe balance between attractive and repulsive forces. Ithas previously been shown for the counterion-onlycase24,26,28 and it is also apparent from the simple modelabove that it is only at high surface charge density andin the presence of divalent or multivalent counterions thatcohesion sets in. The general feature of adding salt is thatnothing happens except under rather extreme conditions.That is, large amounts of a sodium salt are required toextinguish the cohesion, and at high pH, it is essentiallyimpossible to “salt out” the attractive force. Note that thepressure is reported in concentration units (posm/RT ) 1M corresponds to posm ) 2.5 MPa).
Addition of CaX2. Figure 11a shows how the attractiveminimum is reduced when pH and the surface chargedensity is reduced. The position of the minimum is alsodisplaced to larger separation, which is in agreement with
the predictions of the simple model. Note that the graphactually contains 12 curves grouped 4 and 4. That is, thevariation of the concentration of a 2:1 salt (e.g. calciumchloride) has essentially no effect on the force curves upto a concentration of 80 mM. The highest surface chargedensity used, 0.57 C/m2, corresponds to a very high pH(>13) and gives a very short ranged, strong attraction. Bychanging the surface charge density approximately anorder of magnitude, 0.08 C/m2, we still obtain an attractiveforce, but it is now reduced by 2 to 3 orders of magnitude.We can also note from Figure 11b that there seems to bea weak salt dependence in this case and that the additionof a calcium salt actually increases the attraction at allseparations.
These results are in excellent agreement with experi-ment, where it is found that the addition of a calcium saltdoes not lead to improved cohesion if the surface chargedensity is high. At low surface charge density, however,the cohesion is seen to increase up to about 20 mM calciumions in the bulk.45
Competition between CaX2 and NaX. One set ofexperiment of interest is when calcium ions are graduallyreplaced by sodium ions, keeping the hydroxide concen-tration constant. This means that pH and consequentlythe surface charge density are kept constant, whereasthe original divalent calcium counterion is replaced bythe monovalent sodium ion. In general, it is not possibleto go much below ∼1 mM Ca2+ in a cement paste becauseof the solubility of C-S-H. (This is not strictly correctbecause at very high pH the calcium concentration maybe well below 1 mM; however, the surface charge densitywill then be very high, and cohesion is still maintained.)However, concrete may contain “reactive” silica ag-gregates, which under basic conditions form polysilicateions in the solution and trap the calcium ions.46,47 In thisextreme case, only monovalent counterions remain, andthe interaction turns repulsive, promoting cracks in thestructure. Figure 12 shows that replacing calcium hy-droxide with sodium hydroxide does not alter the cohesionunless the calcium concentration drops to submillimolarconcentrations. Note that the fraction of monovalentcounterions is small at separations below 10-15 Å; seeFigure 6b.
One can also imagine a situation where the calciumconcentration is kept constant and an increasing amountof NaX is added to the bulk solution. With the additionof small amounts of NaX and highly charged C-S-Hparticles, we should not expect any major changes in the
(45) Plassard, C.; Lesniewska, E.; Pochard, I.; Nonat, A. Langmuir2005, 21, 7263.
(46) Gaboraud, F.; Nonat, A.; Chaumont, D.; Craievich, A.; Hanquet,B. J. Phys. Chem. B 1999, 103, 2091.
(47) Gaboraud, F.; Nonat, A.; Chaumont, D.; Craievich, A. J. Phys.Chem. B 1999, 103, 5775.
Figure 9. Distribution of co-ions in the confined solution forvarying bulk conditions. The concentration curves have beennormalized with the corresponding bulk concentration. Thesurface charge density is 0.32 C/m2, and the bulk alwayscontains 20 mM CaX2 in addition to the sodium salts. (Left)Addition of NaX. (Right) Addition of sodium salts with differentco-ions. The sodium concentration is always 200 mM.
Figure 10. Apparent surface charge density, σapp(z), inarbitrary units. The surface charge density is 0.32 C/m2, h )40 Å, and the bulk contains 20 mM CaX2 and added sodiumsalts with different co-ions. The sodium concentration is always200 mM.
Figure 11. Net osmotic pressure as a function of surfaceseparation. (Left) Varying salt and surface charge density. Thebulk CaX2 concentrations used are 1, 20, 40, and 80 mM, andthey give rise to four overlapping curves for each surface chargedensity. (Right) The same as in the left-hand plot but with aneven lower surface charge density of 0.08 C/m2.
Controlling the Cohesion of Cement Paste Langmuir I

surface forces. With large amounts, however, there oughtto be a competition between calcium and sodium coun-terions for the surface, leading to a weakening of thecohesion. The interesting question is at which NaXconcentration this becomes an important effect.
In the first set of simulations, we used a calciumconcentration of 20 mM, and the resulting pressure curvescan be seen in Figure 13a. With the addition of 1000 mMNaX, there is a clear reduction of the attractive pressureand an even more pronounced effect on the cohesiveenergy.
If the concentration of divalent counterions in the bulkis reduced but the high surface charge density is main-tained, then we see a weakened cohesion and a primarymaximum appearing; see Figure 13b. (We can imaginethat the charge density is maintained by the addition ofNaOH.) This reduction of the cohesion is a consequenceof ion competition. That is, with increased bulk NaXconcentration more monovalent counterions will enter theconfined solution, and the repulsive entropic term willincrease.
Addition of Na2SO4 and Na3PO4. So far, we havestudied only the effect of adding monovalent co-ions tothe bulk solution. From a technical point of view, calciumsulfate is always added to the cement clinker. It is usedto regulate the setting of cement and avoid a flash set dueto the precipitation of calcium aluminates. On the basisof experience, we should expect that the addition of a 2:2salt to the bulk would maintain the cohesion while causinga more pronounced build up of the co-ion layer (cf. Figure7). In real life, 2:2 salts are scarce, but we see from Figure14 that the addition of 10 mM CaSO4, which correspondsto the solubility of gypsum, has virtually no effect on thecohesion. However, increasing the sulfate concentrationby adding sodium sulfate means that the original divalentcalcium counterions are replaced and the cohesion willeventually be lost. With a low surface charge density, 0.16C/m2, it is enough with 200 mM Na2SO4 to eradicate theattraction; see Figure 14b. This is in qualitative agreement
with rheological experiments by Garrault et al.,48 whofound that the addition of K2SO4 decreased the viscosityin commercial cement paste as well as in pure calciumsilicate paste. Thus, it cannot be attributed to the reactionof sulfate with aluminate phases.
The addition of phosphate has the same effect as addingsulfate both in the simulations and on the rheologicalproperties.49 The viscosity at short time is also reducedbecause the cohesion is gradually reduced by competitionbetween the original divalent counterion and monovalentsodium from the phosphate salt. With 100 mM Na3PO4and a high surface charge density, there is still a strongcohesion as is evident from Figure 15a. There does notseem to be any strong dependence on the valency of theco-ion, and equivalent concentrations of NaX, Na2SO4,and Na3PO4 have the same weak effect on the cohesion.Figure 15b give quantitative support to this conclusion.
ConclusionsThe present simulations based on a dielectric continuum
model describe the essential interactions in cement paste.They provide an understanding of many phenomena thathave been observed but remained unexplained withrespect to the behavior of cement pastes at both short andlong times. Despite large variations in composition andenvironmental conditions, the cement cohesion is pre-served, except under rare extreme conditions. The ro-bustness is explained by the Coulomb interactions betweenthe charged surfaces of the C-S-H particles and the ionsconfined between these surfaces. The two main factorscontrolling the cohesion are the surface charge densityand the valency of the counterions. Figure 16 summarizes
(48) Garrault, S.; Nachbaur, L.; Sauvaget, C. Ann. Chim. 2003, 28,S43.
(49) Benard, P.; Garrault, S.; Nonat, A.; Cau-Dit-Coumes, C. J. Eur.Ceram. Soc., in press, 2004.
Figure 12. Pressure as a function of surface separation withconstant hydroxide concentration equal to 40 mM but a varyingCa/Na ratio in the bulk solution. Note that the 20, 1, and 0.2mM curves coincide. The surface charge density is 0.57 C/m2.
Figure 13. Pressure as a function of surface separation forvaryingNaXconcentrations in theaddition toaconstant amountof CaX2. The surface charge density is 0.32 C/m2. (Left) 20 mMCaX2 and (Right) 1 mM CaX2.
Figure 14. Osmotic pressure as a function of separation forvarying bulk conditions. The bulk always contains 20 mM CaX2.The addition of 10 mM CaSO4 to the bulk has no effect on thepressure, and the curve coincides with the results with onlyCaX2 in the bulk (“no add”). The surface charge density is (left)0.32 C/m2 and (right) 0.16 C/m2.
Figure 15. (Left) Osmotic pressure as a function of separationupon addition of Na3PO4 to the bulk solution. The bulk alwayscontains 20 mM CaX2, and the surface charge density is 0.32C/m2. (Right) Reduction of the cohesion obtained with sodiumsalts with varying valency of the anion. The sodium concentra-tion is in all cases 200 mM, 20 mM CaX2 has been used as thereference, and the surface charge density is 0.32 C/m2.
J Langmuir Jonsson et al.
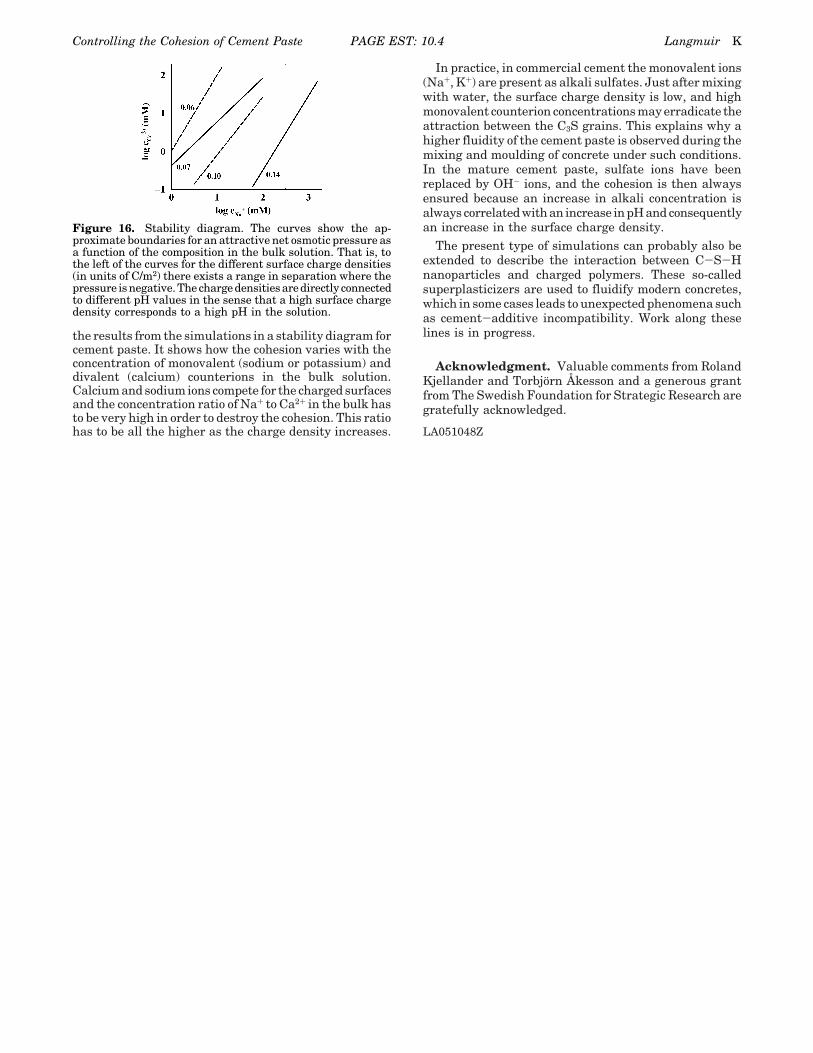
the results from the simulations in a stability diagram forcement paste. It shows how the cohesion varies with theconcentration of monovalent (sodium or potassium) anddivalent (calcium) counterions in the bulk solution.Calcium and sodium ions compete for the charged surfacesand the concentration ratio of Na+ to Ca2+ in the bulk hasto be very high in order to destroy the cohesion. This ratiohas to be all the higher as the charge density increases.
In practice, in commercial cement the monovalent ions(Na+, K+) are present as alkali sulfates. Just after mixingwith water, the surface charge density is low, and highmonovalent counterion concentrations may erradicate theattraction between the C3S grains. This explains why ahigher fluidity of the cement paste is observed during themixing and moulding of concrete under such conditions.In the mature cement paste, sulfate ions have beenreplaced by OH- ions, and the cohesion is then alwaysensured because an increase in alkali concentration isalways correlated with an increase in pH and consequentlyan increase in the surface charge density.
The present type of simulations can probably also beextended to describe the interaction between C-S-Hnanoparticles and charged polymers. These so-calledsuperplasticizers are used to fluidify modern concretes,which in some cases leads to unexpected phenomena suchas cement-additive incompatibility. Work along theselines is in progress.
Acknowledgment. Valuable comments from RolandKjellander and Torbjorn Åkesson and a generous grantfrom The Swedish Foundation for Strategic Research aregratefully acknowledged.
LA051048Z
Figure 16. Stability diagram. The curves show the ap-proximate boundaries for an attractive net osmotic pressure asa function of the composition in the bulk solution. That is, tothe left of the curves for the different surface charge densities(in units of C/m2) there exists a range in separation where thepressure is negative. The charge densities are directly connectedto different pH values in the sense that a high surface chargedensity corresponds to a high pH in the solution.
Controlling the Cohesion of Cement Paste PAGE EST: 10.4 Langmuir K