Embed Size (px)
Citation preview
Cost-Volume Profit Analysis (CVP)
USQ UNIVERSITY OF SOUTHERN QUEENSLAND
MBA - ACC5502
Accounting & Financial Management / S1 / 2014
M B G Wimalarathna
(FCA, FCMA, MCIM, FMAAT, ACPM)(MBA–PIM/USJ)
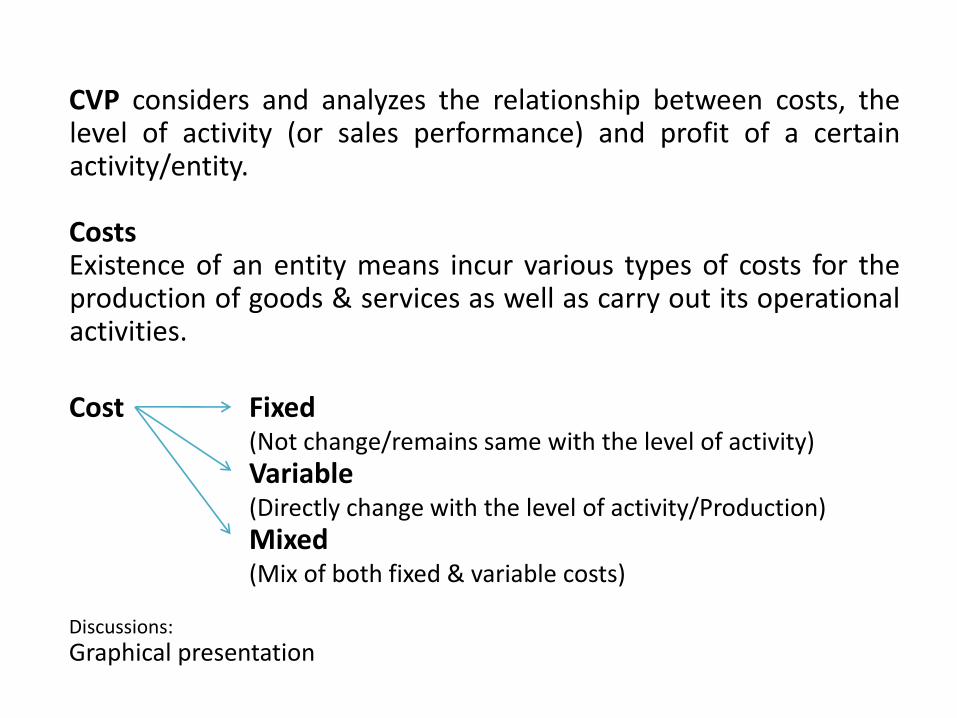
CVP considers and analyzes the relationship between costs, the level of activity (or sales performance) and profit of a certain activity/entity. Costs Existence of an entity means incur various types of costs for the production of goods & services as well as carry out its operational activities.
Cost Fixed (Not change/remains same with the level of activity) Variable (Directly change with the level of activity/Production) Mixed (Mix of both fixed & variable costs) Discussions:
Graphical presentation
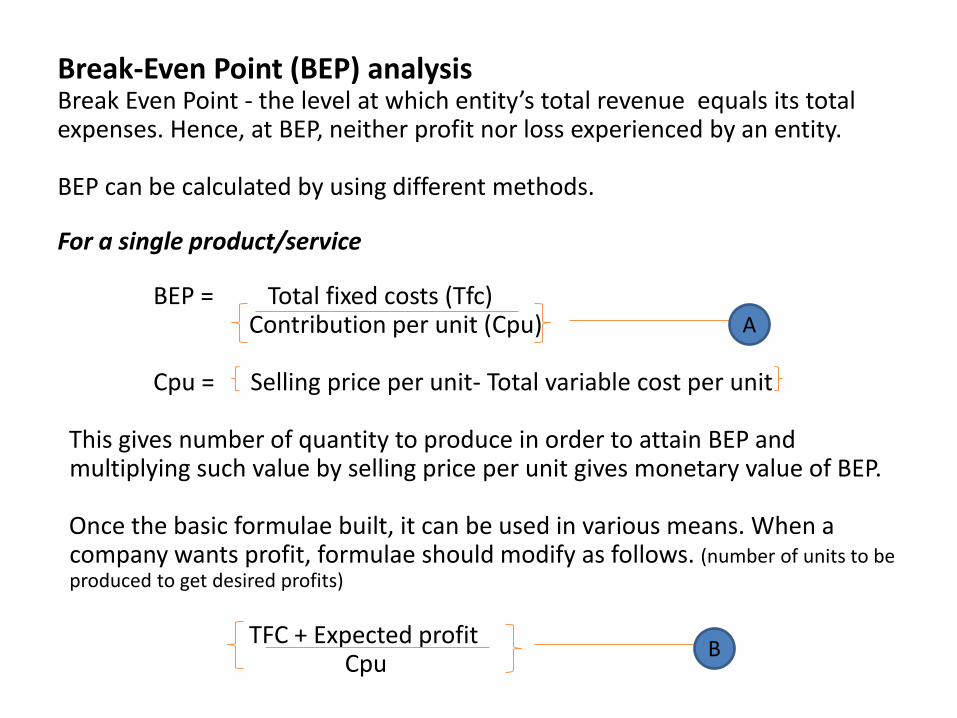
Break-Even Point (BEP) analysis Break Even Point - the level at which entity’s total revenue equals its total expenses. Hence, at BEP, neither profit nor loss experienced by an entity. BEP can be calculated by using different methods. For a single product/service BEP = Total fixed costs (Tfc) Contribution per unit (Cpu) Cpu = Selling price per unit- Total variable cost per unit
This gives number of quantity to produce in order to attain BEP and multiplying such value by selling price per unit gives monetary value of BEP. Once the basic formulae built, it can be used in various means. When a company wants profit, formulae should modify as follows. (number of units to be produced to get desired profits)
TFC + Expected profit Cpu
A
B
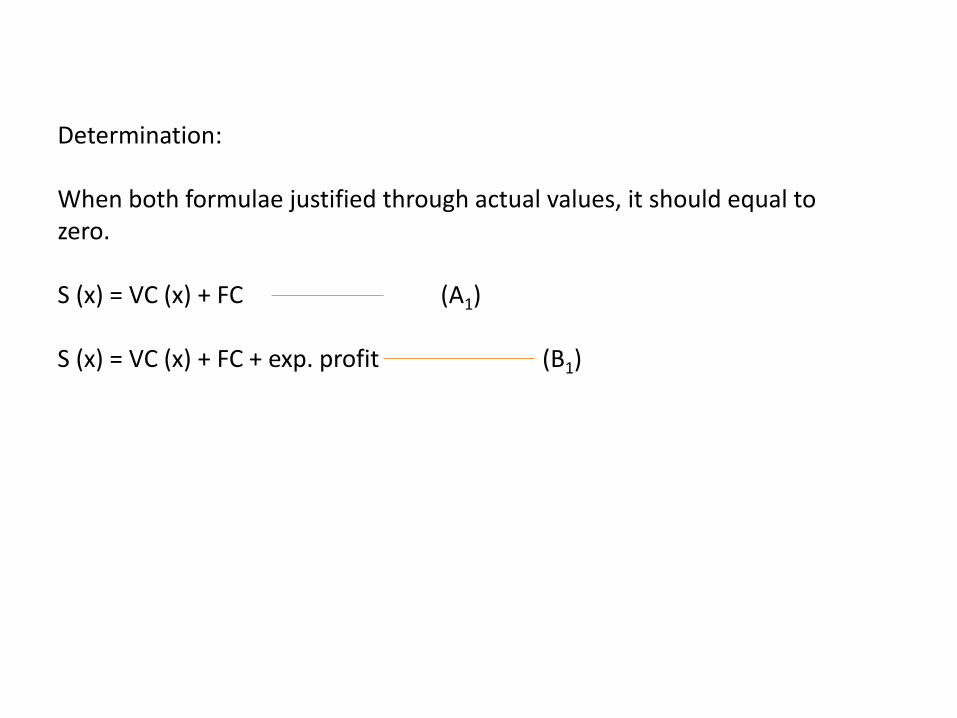
Determination: When both formulae justified through actual values, it should equal to zero. S (x) = VC (x) + FC (A1) S (x) = VC (x) + FC + exp. profit (B1)
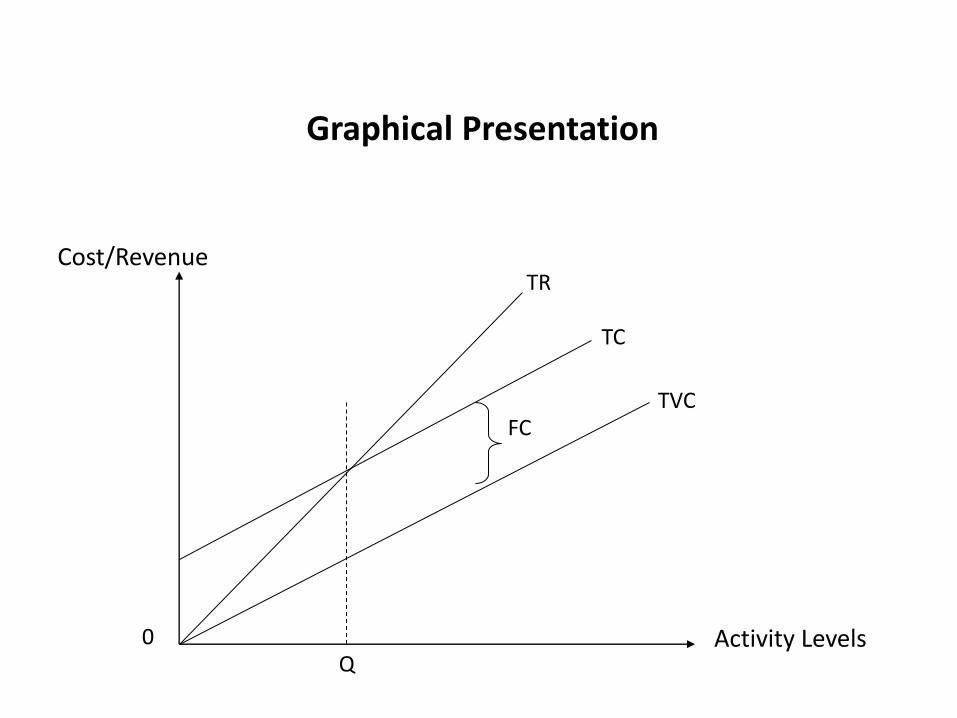
Graphical Presentation
Activity Levels
Cost/Revenue
0 Q
TC
TVC FC
TR
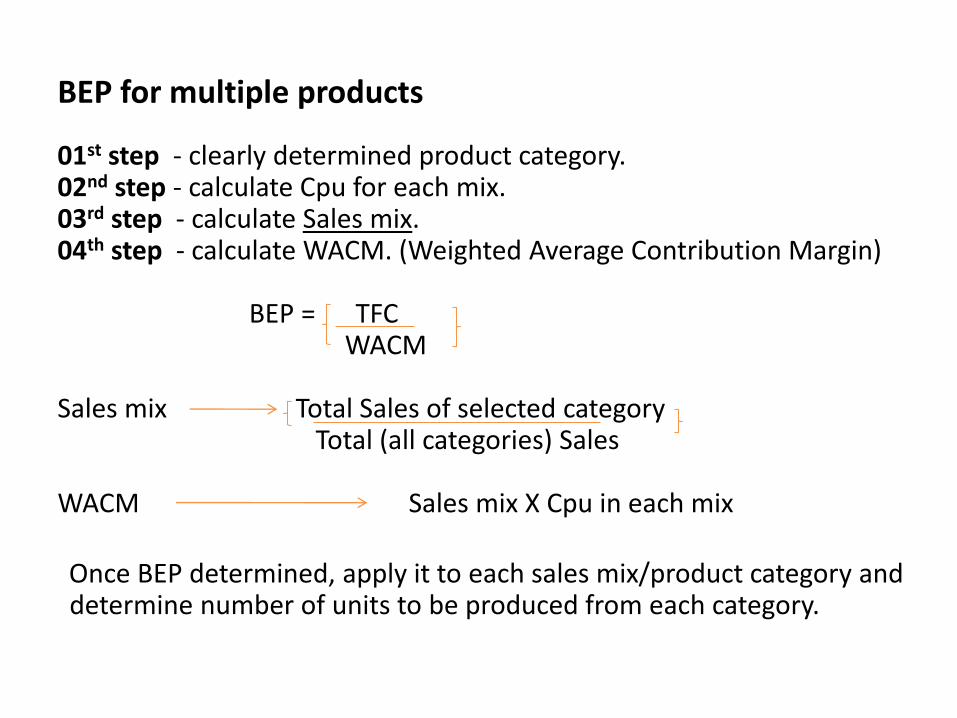
BEP for multiple products 01st step - clearly determined product category. 02nd step - calculate Cpu for each mix. 03rd step - calculate Sales mix. 04th step - calculate WACM. (Weighted Average Contribution Margin) BEP = TFC WACM Sales mix Total Sales of selected category Total (all categories) Sales WACM Sales mix X Cpu in each mix
Once BEP determined, apply it to each sales mix/product category and determine number of units to be produced from each category.
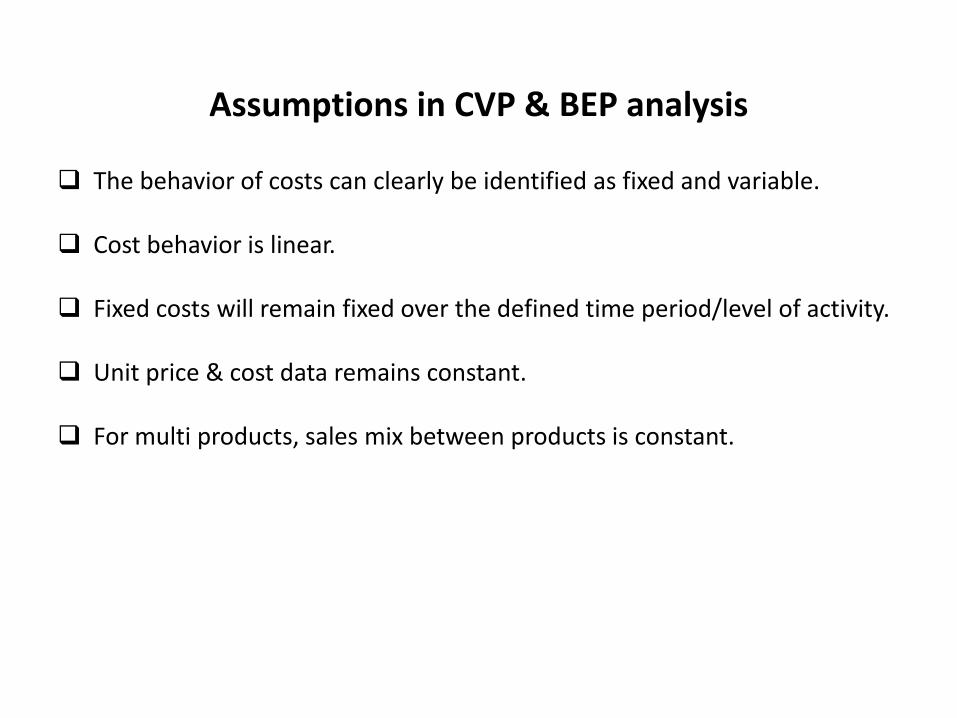
Assumptions in CVP & BEP analysis
The behavior of costs can clearly be identified as fixed and variable.
Cost behavior is linear.
Fixed costs will remain fixed over the defined time period/level of activity.
Unit price & cost data remains constant.
For multi products, sales mix between products is constant.
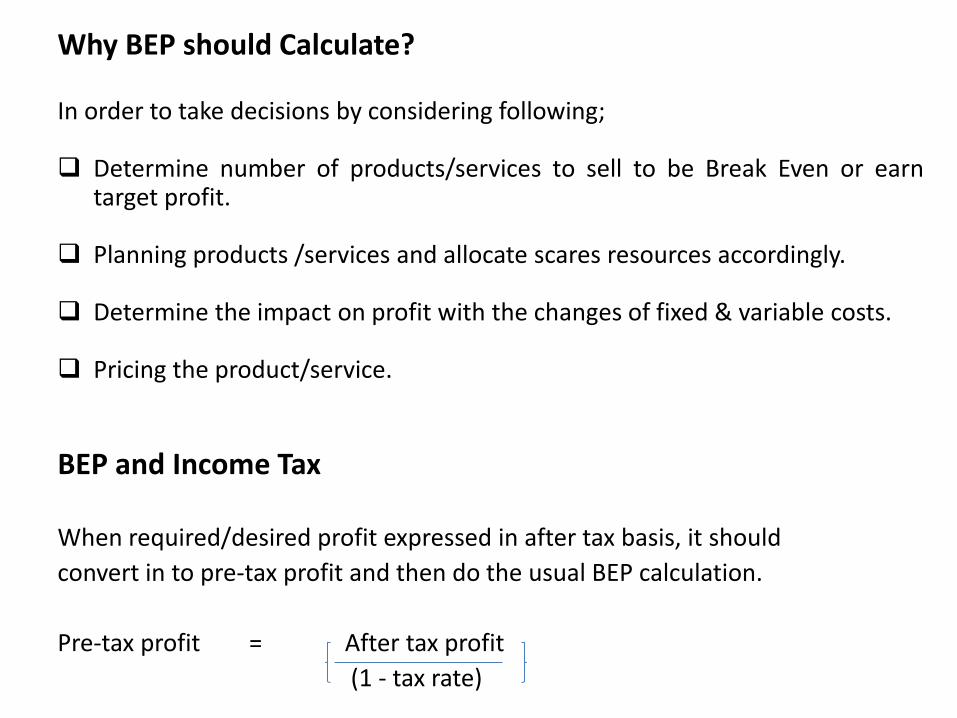
Why BEP should Calculate? In order to take decisions by considering following; Determine number of products/services to sell to be Break Even or earn
target profit. Planning products /services and allocate scares resources accordingly. Determine the impact on profit with the changes of fixed & variable costs. Pricing the product/service. BEP and Income Tax
When required/desired profit expressed in after tax basis, it should
convert in to pre-tax profit and then do the usual BEP calculation.
Pre-tax profit = After tax profit
(1 - tax rate)
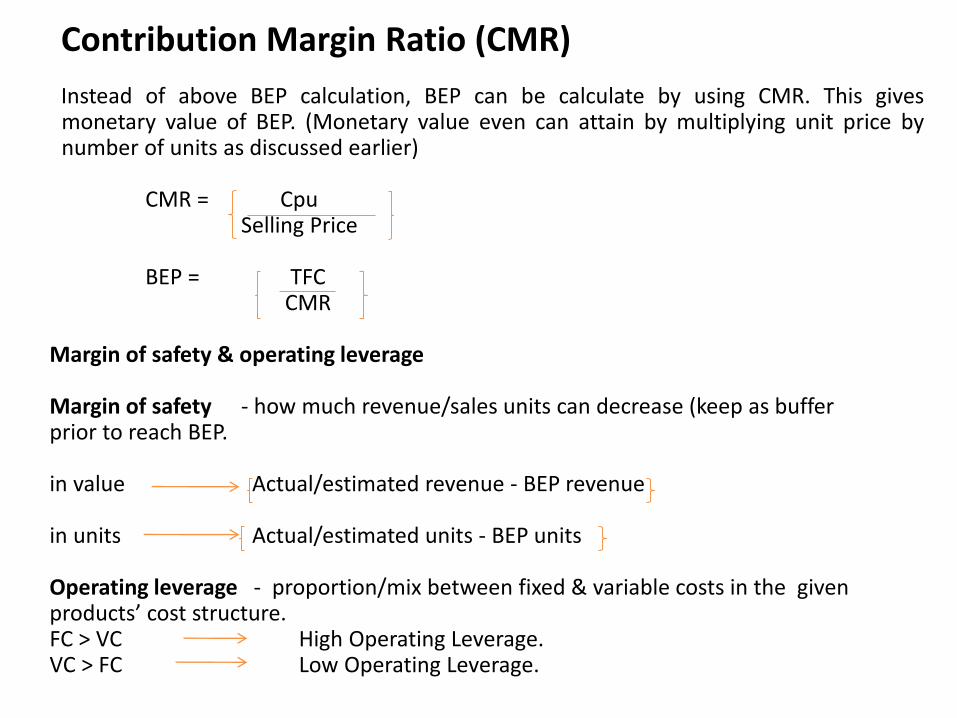
Contribution Margin Ratio (CMR) Instead of above BEP calculation, BEP can be calculate by using CMR. This gives monetary value of BEP. (Monetary value even can attain by multiplying unit price by number of units as discussed earlier)
CMR = Cpu Selling Price BEP = TFC CMR Margin of safety & operating leverage Margin of safety - how much revenue/sales units can decrease (keep as buffer prior to reach BEP. in value Actual/estimated revenue - BEP revenue in units Actual/estimated units - BEP units Operating leverage - proportion/mix between fixed & variable costs in the given products’ cost structure. FC > VC High Operating Leverage. VC > FC Low Operating Leverage.
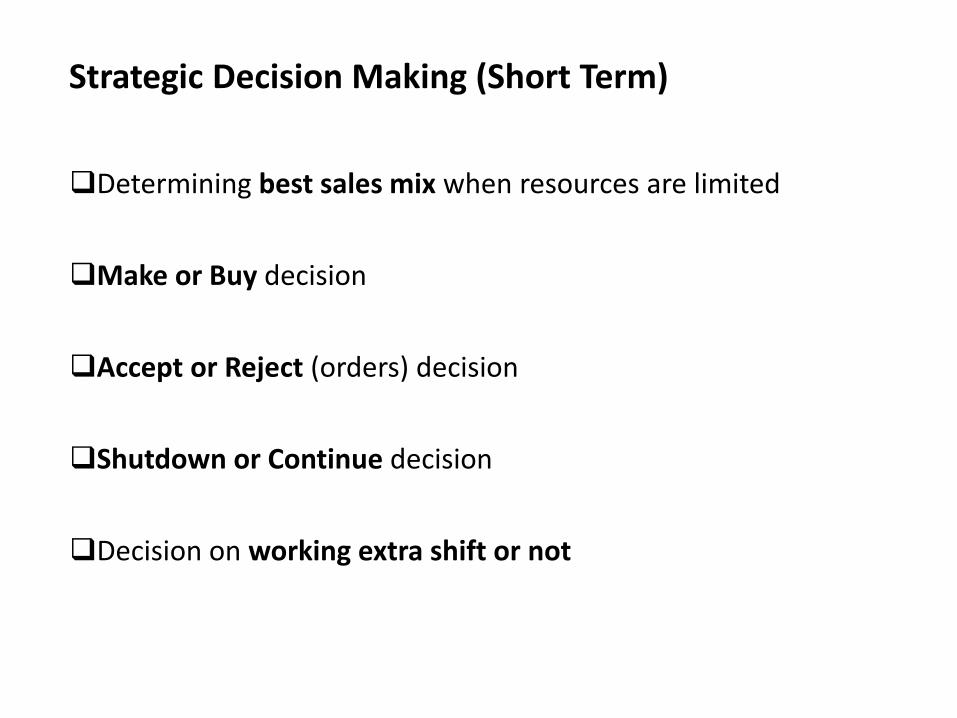
Strategic Decision Making (Short Term)
Determining best sales mix when resources are limited
Make or Buy decision
Accept or Reject (orders) decision
Shutdown or Continue decision
Decision on working extra shift or not


