Embed Size (px)
Citation preview
CCrriimmee iinn MMoonnttaannaa
22000088--22000099 RREEPPOORRTT

2
This page intentionally left blank
3
Crime in Montana
2008-2009 Report
Published by the Montana Board of Crime Control
Statistical Analysis Center
Mike Anderson, Chair (2006-2009) Roland M. Mena, Executive Director
This report was compiled by the Montana Board of Crime Control statistical analysis center:
Jimmy Steyee, SAC Director/statistician
Kathy Ruppert, Data Manager
Published: July 2010
Montana Board of Crime Control 3075 N. Montana Ave. Helena, MT 59620-1408
(406) 444-3604 Fax: (406) 444-4722 TTY: (406) 444-7099
Alternative formats of this document will be provided upon request. Persons with disabilities
who require this material in another format should contact the Montana Board of Crime
Control at 3075 N. Montana Ave., Helena, MT 59620-1408.
Phone: (406) 444-3604, Fax: (406) 444-4722, TTY: (406) 444-7099
4
TABLE OF CONTENTS Page #
National Incident‐Based Reporting System and the Montana Incident‐Based Reporting System 5
Considerations and Limitations of the Data 15
Glossary of Terms 18
Population 20
Montana Crime Clock 22
Trends and Comparisons 23
Violent Crime Trends 24
Property Crime Trends 26
Ten Year Trend Analysis 28
Part I Violent Crimes 38
Part I Property Crimes 63
Selected Non-Index Offenses 72
Group B Offenses 86
Juvenile Arrestees 90
Appendices: Appendix A: Reporting Agencies 100 Appendix B: 2009 Index Crimes by Agency 101 Appendix C: 2009 Index Crimes by County 103
5
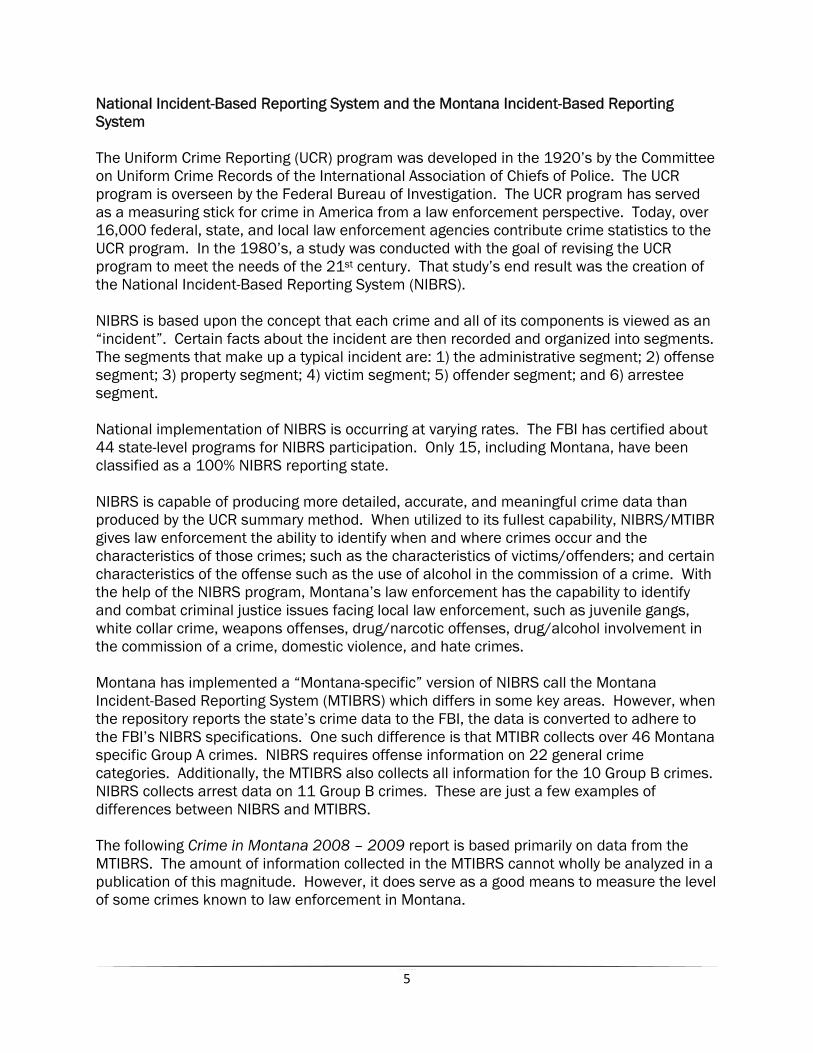
National Incident-Based Reporting System and the Montana Incident-Based Reporting System The Uniform Crime Reporting (UCR) program was developed in the 1920’s by the Committee on Uniform Crime Records of the International Association of Chiefs of Police. The UCR program is overseen by the Federal Bureau of Investigation. The UCR program has served as a measuring stick for crime in America from a law enforcement perspective. Today, over 16,000 federal, state, and local law enforcement agencies contribute crime statistics to the UCR program. In the 1980’s, a study was conducted with the goal of revising the UCR program to meet the needs of the 21st century. That study’s end result was the creation of the National Incident-Based Reporting System (NIBRS). NIBRS is based upon the concept that each crime and all of its components is viewed as an “incident”. Certain facts about the incident are then recorded and organized into segments. The segments that make up a typical incident are: 1) the administrative segment; 2) offense segment; 3) property segment; 4) victim segment; 5) offender segment; and 6) arrestee segment. National implementation of NIBRS is occurring at varying rates. The FBI has certified about 44 state-level programs for NIBRS participation. Only 15, including Montana, have been classified as a 100% NIBRS reporting state. NIBRS is capable of producing more detailed, accurate, and meaningful crime data than produced by the UCR summary method. When utilized to its fullest capability, NIBRS/MTIBR gives law enforcement the ability to identify when and where crimes occur and the characteristics of those crimes; such as the characteristics of victims/offenders; and certain characteristics of the offense such as the use of alcohol in the commission of a crime. With the help of the NIBRS program, Montana’s law enforcement has the capability to identify and combat criminal justice issues facing local law enforcement, such as juvenile gangs, white collar crime, weapons offenses, drug/narcotic offenses, drug/alcohol involvement in the commission of a crime, domestic violence, and hate crimes. Montana has implemented a “Montana-specific” version of NIBRS call the Montana Incident-Based Reporting System (MTIBRS) which differs in some key areas. However, when the repository reports the state’s crime data to the FBI, the data is converted to adhere to the FBI’s NIBRS specifications. One such difference is that MTIBR collects over 46 Montana specific Group A crimes. NIBRS requires offense information on 22 general crime categories. Additionally, the MTIBRS also collects all information for the 10 Group B crimes. NIBRS collects arrest data on 11 Group B crimes. These are just a few examples of differences between NIBRS and MTIBRS. The following Crime in Montana 2008 – 2009 report is based primarily on data from the MTIBRS. The amount of information collected in the MTIBRS cannot wholly be analyzed in a publication of this magnitude. However, it does serve as a good means to measure the level of some crimes known to law enforcement in Montana.
6
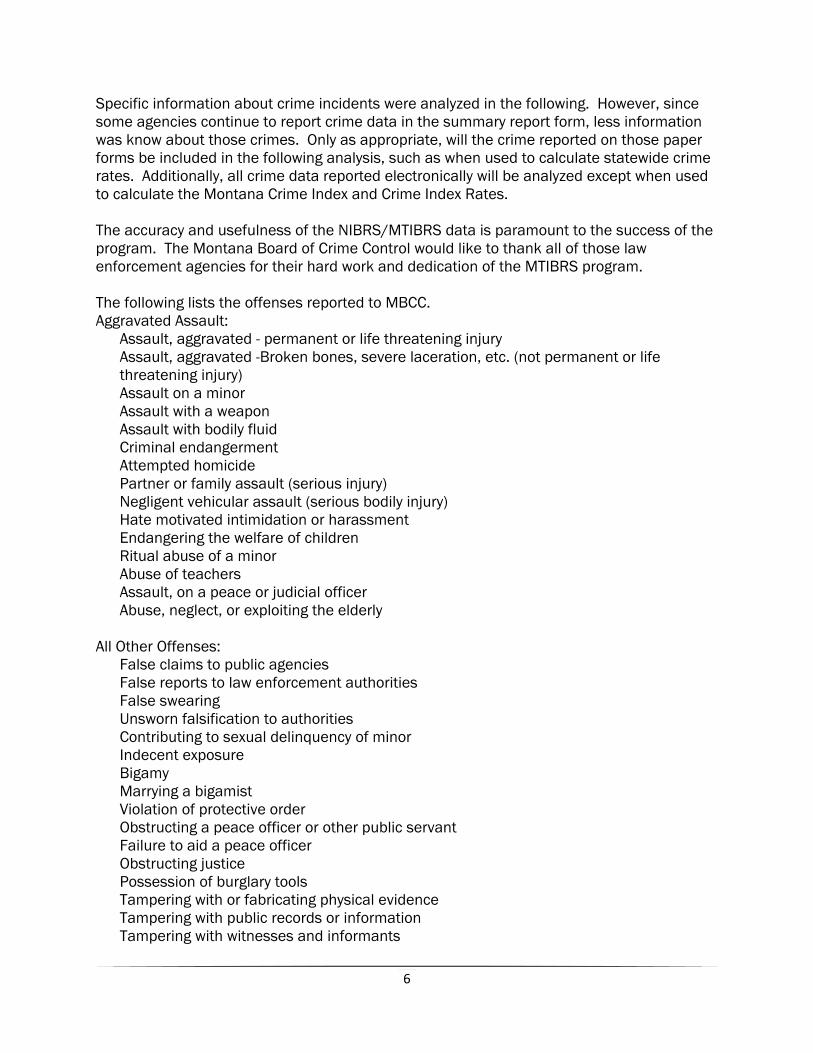
Specific information about crime incidents were analyzed in the following. However, since some agencies continue to report crime data in the summary report form, less information was know about those crimes. Only as appropriate, will the crime reported on those paper forms be included in the following analysis, such as when used to calculate statewide crime rates. Additionally, all crime data reported electronically will be analyzed except when used to calculate the Montana Crime Index and Crime Index Rates. The accuracy and usefulness of the NIBRS/MTIBRS data is paramount to the success of the program. The Montana Board of Crime Control would like to thank all of those law enforcement agencies for their hard work and dedication of the MTIBRS program. The following lists the offenses reported to MBCC. Aggravated Assault:
Assault, aggravated - permanent or life threatening injury Assault, aggravated -Broken bones, severe laceration, etc. (not permanent or life threatening injury) Assault on a minor Assault with a weapon Assault with bodily fluid Criminal endangerment Attempted homicide Partner or family assault (serious injury) Negligent vehicular assault (serious bodily injury) Hate motivated intimidation or harassment Endangering the welfare of children Ritual abuse of a minor Abuse of teachers Assault, on a peace or judicial officer Abuse, neglect, or exploiting the elderly
All Other Offenses:
False claims to public agencies False reports to law enforcement authorities False swearing Unsworn falsification to authorities Contributing to sexual delinquency of minor Indecent exposure Bigamy Marrying a bigamist Violation of protective order Obstructing a peace officer or other public servant Failure to aid a peace officer Obstructing justice Possession of burglary tools Tampering with or fabricating physical evidence Tampering with public records or information Tampering with witnesses and informants
7
Transfer illegal articles or communications False alarm to agencies of public safety False reporting of an impending explosion False reporting of a fire or other catastrophe Escape Criminal defamation Cruelty to animals Employer misconduct Failure to yield party line Harming a police dog Official misconduct Perjury Garbage/Littering Bail jumping Bringing armed men into state Aiding or soliciting suicide Causing animals to fight Creating a hazard Criminal contempt Interfere with court order for minor Use of property subject to criminal forfeiture Failing to register as a sex or violent offender Illegal posting of public land Obscene/harassing phone call - privacy in communication Home arrest violation Abuse of teachers Revocation of suspended/deferred sentence Solicitation Conspiracy Attempt Accountability for Conduct of Another Violation of no-contact order Violation of conditions of release Probation violation Parole violation Underage tobacco possession or consumption Negligent vehicular assault (serious bodily injury) Negligent vehicular assault (non-serious injury)
Arson:
Arson Arson, negligent Arson, throwing lighted materials
Bad Check Offense:
Issuing a bad check
8
Bribery Offense: Illegal gifts to public servants Compensation for past official behavior Bribery in official and political matters Bribery, compounding a felony
Burglary:
Burglary, residence Burglary, non-residence Burglary, aggravated
Curfew/Loitering/Vagrancy Offenses:
Incitement to riot Riot Juvenile curfew violations Loitering juvenile Ungovernable juvenile
Disorderly Conduct:
Disorderly conduct Obstructing access to health care facility Criminal incitement Failure of disorderly person to disperse Public nuisance Civil disorder
Drug/Narcotic Offenses:
Sale of dangerous drugs Possession of dangerous drugs Production or manufacture of dangerous drugs Fraudulently obtaining dangerous drugs Altering labels on dangerous drugs Operation of clandestine lab Possession of drug paraphernalia Advertisement of drug paraphernalia Sale of imitation dangerous drug Possession with intent to sell Manufacture imitation dangerous drug Manufacture or delivery of drug paraphernalia Advertisement of imitation dangerous drug Sale of dangerous drugs on/near school property Possession of toxic substances Delivery of drug paraphernalia to a minor Sells or gives intoxicating substances to minors Possession of imitation drugs with purpose to sell Possession of precursors to dangerous drugs
9
DUI Offenses:
DUI, undetermined level - refused to test DUI, determined level of intoxication, liquor 0.08 or greater DUI, under 21 with BAC of 0.02 - liquor DUI, intoxication by drugs or alcohol
Embezzlement:
Embezzlement Extortion/Blackmail:
Extortion / blackmail Family Offenses, Nonviolent:
Endangering the welfare of children Ritual abuse of a minor Unlawful transactions with children Truancy Nonsupport Visitation interference Aggravated visitation interference Parenting interference Abuse, neglect, or exploiting elderly
Forgery/Counterfeiting:
Forgery Counterfeit Counterfeiting or defacing gambling documents
Fraud Offenses:
Credit cards Deceptive business practices Deceptive practices for financial gain Defrauding creditors Theft of labor or services or use of property Avoidance of telecommunication charges Theft of identity, fraud Welfare fraud Unauthorized acquisition/transfer of food stamps Medicaid fraud Workers comp fraud Obtaining communication services to defraud Unlawful use of a computer Money laundering Failure to return rented or leased property Impersonating a public servant Obscuring the identity of a machine
10
Securities regulations Securities selling Security fraud Security liability Unlawful automated telephone solicitation Chain distributor scheme Pyramid scheme
Gambling Offenses:
Betting, wagering Possess illegal gambling device or enterprise Gambling on a cash basis Possession and sale of antique slot machines Minors not to participate in gambling Illegal sale, lease or transfer of gambling license Obtain item of value by fraud or illegal gambling Soliciting participation in illegal gambling activity Bribery in contests/sports tampering
Homicide:
Homicide, deliberate Homicide, mitigated deliberate Homicide, negligent Vehicular homicide Homicide, justifiable
Intimidation:
Stalking Assault - threat to coerce gang membership Threats in official and political matters Assault, by coercion, intimidation, or threat
Kidnapping:
Kidnapping, aggravated Kidnapping Custodial interference Unlawful restraint
Larceny/Theft Offenses:
Pickpocket Purse snatch Shoplift Theft of belongings from motor vehicles Theft of motor vehicles parts and accessories Theft from buildings Theft from coin-op machines Illegal branding or altering or obscuring a brand
11
Theft of lost or mislaid property Theft, all others
Liquor Law Violations:
Purchase or possess intoxicant by a minor False identification by a minor to get alcohol Sale of alcohol not purchased from state agency Unlawful transfer, or possession of alcohol Sale of alcohol without license Drinking in public Sell or provide alcohol to person under age 21 Providing alcohol to an intoxicated person Sells or gives an alcoholic beverage to minors Closing hours for licensed retail establishments Selling alcohol after hours Liquor licensee/employee sells or provides alcohol to person under age 21 Open container in motor vehicle on highway Failure to attach keg tag Remove or deface keg tab
Motor Vehicle Theft:
Motor vehicle theft Unauthorized use of motor vehicle
Obscenity/Pornography:
Obscenity Display or provide obscene material to minors
Peeping Tom:
Peeping tom Prostitution Offenses:
Prostitution Prostitution promotion Prostitution, aggravated promotion of
Robbery:
Robbery Runaway:
Runaway, juvenile Sex Offenses, Forcible:
Sexual assault Sexual abuse of children Sodomy, deviate sexual conduct Sexual intercourse without consent
12
Sexual intercourse (with object) w/o consent Sexual intercourse (forcible sodomy) w/o consent Same-sex forcible rape
Sex Offenses, Nonforcible:
Statutory rape - sexual intercourse w/o consent Incest
Simple Assault:
Resisting arrest Assault, simple - with minor injuries (no broken bones or severe lacerations, etc.) Negligent endangerment Partner or family assault (non-aggravated) Mistreating prisoners Assault upon sports official Endangering the welfare of children Ritual abuse of a minor Abuse of teachers Abuse, neglect, or exploiting the elderly Assault with bodily fluid
Stolen Property Offenses:
Receiving stolen property from minor Illegal handling of stolen property Theft by disposal of stolen property
Trespass:
Stowing away on railroad property Trespass, criminal, to vehicles Trespass, criminal, to property
Vandalism/Criminal Mischief:
Criminal mischief/vandalism Desecration of Capitol Desecration of flags Intentional vandalism to railroad property
Weapons Law Violations:
Possess illegally, sawed-off firearm Possess illegally, switchblade knife Possession of explosives Possession of a destructive device Possession of a silencer Possession of deadly weapon by a prisoner Use of machine gun for offensive purpose Use of machine gun in connection with a crime Possession of firearm by convicted person
13
Carrying concealed weapon Carrying a concealed weapon while intoxicated Carrying a concealed weapon when prohibited Discharge within city limits - firing firearms Reckless or malicious use of explosives Manufacturer’s failure to register machine gun Owner’s failure to register machine gun Selling or giving explosives to minors Providing firearms to criminal street gangs Guns in schools Use of firearms by children under fourteen
Categorizing Crime Incidents Categories are often used to group crimes together in a meaningful way. Traditionally, offenses were grouped into Index Crimes and Non-Index Crimes. Index crimes include homicide; rape; robbery; aggravated assault; burglary; larceny/theft; and motor vehicle theft. Arson was also later added as an index crime, but is not counted as an index crime in Montana. Index crimes were chosen because traditionally they are the offenses that are the highest in severity and would be most commonly reported to law enforcement. The seven index crimes can be further subcategorized into violent crimes and property crimes. The sum of the seven index crimes is the crime index. The crime index is used as a measure to gauge the level of crime in a particular geographic region. In NIBRS, the list of reportable offenses was greatly expanded beyond the seven index crimes. This expanded list can be grouped into two different categories: Group A offenses and Group B offenses. Group A offenses include the following: arson; assault; bribery; burglary; counterfeiting/forgery; criminal mischief/vandalism; drug offenses; embezzlement; extortion/blackmail; fraud; gambling; homicide; kidnapping; larceny/theft; motor vehicle theft; obscenity/pornography; robbery; forcible sex offense; non-forcible sex offenses; stolen property offenses; and weapon law violations. Group B offenses include the following: bad checks; curfew/loitering/vagrancy; disorderly conduct; driving under the influence; non-violent family offenses; liquor law violations; drunkenness1; peeping tom; runaway; trespassing; and all other offenses. Both Group A and Group B offenses can be further subcategorized according to Montana Code Annotated law codes. NIBRS/MTIBR Data Elements The field labels used in the NIBRS/MTIBRS are called data elements. The MTIBRS collects data on 58 different data elements. Data values describe the characteristics of an incident.
1 Montana does not collect offense information on “drunkenness”.
14
Some data values are mandatory and others are mandatory/conditional, meaning they are collected only when certain conditions within an incident are met. The following is a list of the data fields in the MTIBR system:
1. ORI number 2. Incident number 3. Incident date/hour 4. Exceptional clearance 5. Exceptional clearance date 6. Offense code(s) 7. Offense attempted/completed 8. Offender(s) suspected of using 9. Bias motivation 10. Domestic Abuse Related 11. Gang Related 12. Gambling Related 13. Location type 14. Number of premises entered 15. Method of entry 16. Type of criminal activity 17. Type of weapon/force involved 18. Type of property loss/etc. 19. Property description 20. Value of property 21. Date recovered 22. Number of stolen motor vehicles 23. Number of recovered motor vehicles 24. Suspected drug type 25. Estimated drug quantity 26. Type of drug measure 27. Victim sequence number 28. Victim connected to offense code(s) 29. Type of Victim 30. LEOKA type of assignment 31. LEOKA type of activity 32. Victim age 33. Victim sex 34. Victim race 35. Victim ethnicity 36. Victim residency 37. Aggravated assault/homicide circumstances 38. Additional justifiable homicide circumstances 39. Type of injury 40. Offender sequence number 41. Offender number(s) to be related 42. Relationship of victim to offender(s) 43. Offender sex
15
44. Offender age 45. Offender race 46. Arrestee sequence number 47. Arrest transaction number 48. Arrest date 49. Type of arrest 50. Multi-arrest segments indicator 51. Arrest offense code(s) 52. Arrestee was armed with 53. Arrestee age 54. Arrestee sex 55. Arrestee race 56. Arrestee ethnicity 57. Arrestee resident status 58. Disposition of arrestee when arrestee is less than 18
More information about the MTIBR system can be found online at http://mbcc.mt.gov. Also more information about the FBI’s UCR and NIBRS programs can be found online at http://www.fbi.gov/ucr/ucr.htm. Considerations and Limitations of the Data It is important to note that UCR and NIBRS data provide only estimates of the “true” crime rate-- it cannot be measured directly. That is why it is important to obtain accurate, reliable crime data from law enforcement and the public; the more accurate the data that we have, the lower the error in the estimate of the “actual” volume and rates of criminal activity. The crime index data used by the UCR does have limitations, but the UCR has been the most widely used measure of crime for more than 70 years. The most important limitation is that the UCR is a measure of reported crime and, as many crimes go unreported to the police, it is not a measure of all crime. An annual survey conducted by the U.S. Bureau of Statistics indicated that as little as 49% of violent crime and 40% of property crime is reported to a law enforcement agent2. Some crimes are reported more regularly than others; some jurisdictions experience higher reporting rates; and the degree to which citizens report criminal activity or victimization may change from year to year–all of which can give the appearance that the crime rate is changing, when it is actually the rate people report crime that is changing. The rate of reporting crimes to law enforcement can be affected by the following: perception of crime incident as a public or private matter by the citizen or the police; perception of legal seriousness of a crime incident by the citizen or the police; victim-offender relationships; desires of the complainant, citizen confidence in the police and/or criminal justice system; changes in police policy; and media coverage. A number of factors can influence counts in particular jurisdictions. The following factors should be carefully considered when viewing crime statistics:
• Local law enforcement resources and policies;
2 . United States Department of Justice, Office of Justice Programs, Bureau of Justice Statistics (2003). Criminal Victimization 2002: Changes 1998-1999 with trends 1993-1999.
16
• Variations in the demographics of the population, particularly age structure; • Population density and size of locality and its surrounding area; • Stability of population with respect to residents' mobility, commuting patterns, and
transient factors; • The presence or absence of interstate highways, major state highways, or ports of
entry; • Economic conditions, such as median income and job availability; • Cultural conditions such as education, recreation, and religious characteristics; • Family conditions with respect to divorce and family cohesiveness; • Effective strength and size of law enforcement agencies; • Administrative and investigative emphasis of law enforcement; • Policies of other components of the criminal justice system (i.e., prosecutorial,
judicial, correctional, and probation/parole systems); • Attitudes of citizenry toward crime; • Crime reporting practices of citizenry; and • Illegal drug supply, cost, and demand.
For example, the reporting practices of law enforcement can create the illusion of an increase or decrease in the crime rate when in reality the landscape of crime activity is unchanged. In addition, since 1978 there have been many changes in laws and data collection procedures. For example, in 1990, Montana began the conversion from the summary UCR format to the NIBRS format. The increased specificity in reporting changed the way crimes were classified and counted. In 1978, data was submitted on paper forms; but in 2009, 91% of the reporting law enforcement agencies submitted data electronically. In 1987, legislation was enacted which required reporting domestic violence as partner and family member assault and defining it as criminal conduct. Partner and family member assault began to be reported in the 1989 Crime in Montana as a subset of “Other/Simple Assaults”. In the 2001 Crime in Montana, partner and family member assault was grouped as a separate category that includes simple assaults, aggravated assaults, and homicides that are a result of partner and family member assault. The result is the appearance of an increase in the partner and family member assault (domestic violence) rate because the aggravated partner and family member assaults were included with the simple partner and family member assaults to construct a separate accounting of the problem.3 This added a number of “extra” offenses that may not have been included in the past, and may be a contributing factor to “higher” rates. In a similar alteration, the defining characteristics for reporting aggravated assault changed to include more incidents in late 1998; the rate was 191.3 in 1999 and 293.3 in 2003–an apparent increase of over 50 percent in three years. The reporting procedure has changed, which may have affected the rate that Crime in Montana reports. All these types of changes should be considered when comparing data.
3 The Aggravated Assault numbers and rates, as well as the Other Assault (simple) numbers and rates include the partner and family member assaults. The partner and family member assault numbers and rates must be considered separately from the rest of the crime index.
17
Data Gaps The MBCC’s Statistical Analysis Center (SAC) strives to validate the accuracy and the validity of the data it receives from law enforcement agencies. In order for Montana to keep its crime reporting certification, the FBI maintains that reporting law enforcement agencies must maintain an error rate of 4% or less. In 2009, Montana was successful in doing so. Additionally, in 2008 the SAC integrated a number of data integrity reports that will further enhance the accuracy of the data. The SAC is also conducting crime reporting audits to enhance the quality of the data that was reported to the MTIBRS. However, Crime in Montana is not a complete count of all crime in Montana. Many crimes go unreported to law enforcement and are never “officially” recorded and counted. In addition, despite MBCC’s best efforts not all law enforcement agencies report their crime data. As a result, those agencies are not represented in this analysis. Additionally, this analysis did not include data from state and federal law enforcement agencies such as the Montana Highway Patrol, U.S. Marshall’s Office, or Fish, Wildlife, and Parks. Consequently, certain offenses such as poaching are not represented in this publication. Finally, this analysis did not include crime reported to tribal law enforcement agencies. Tribal nations make up a large land mass in Montana; as a result, a portion of Montana’s population was also not covered in this analysis. Statement on Data for Crime in Montana The data contained in Crime in Montana 2008-2009 is as complete and accurate as possible. Changes in rates of offense or types of offense can be compared, with appropriate attention to detail. Care must be taken when comparing Crime in Montana 2008-2009 data with other state’s data because of differences in reporting standards and procedures. For example, it may not be a fair comparison to compare Montana crime data with a state that gathers crime data in UCR format. This data may be used to compare counties, while being critical of the various differences between counties. This data is also effective in comparing trend data at the county and state level. As noted above, there are inherent limitations in the reporting procedure that makes it impossible to capture one hundred per cent of all criminal activity and offenses. Differences in reporting standards and procedures, by both law enforcement and the public, must be taken into account. However, with appropriate care and consideration, this data can be particularly useful for research or analysis. If you need a publication or assistance in obtaining statistical information or a customized statistical report, please contact MBBC’s Statistical Analysis Center at: Montana Board of Crime Control c/o Jimmy Steyee SAC Director/Statistician P.O. Box 201408 Helena, MT 59620 Phone: (406) 444-3604 TTY: (406) 444-7099 E-mail: [email protected] Web Page: http://mbcc.mt.gov
18
Glossary of Terms Cleared by Arrest – A offense that is cleared when at least one person is (1) arrested, (2) charged with the commission of the offense, and (3) turned over to the court for prosecution. If more than one crime is committed during an incident, one arrest will clear all of the crimes. Exceptional Clearance – For UCR purposes, an offense is considered exceptionally cleared when law enforcement has: (1) definitely established the identity of the offender, (2) there is enough information to support an arrest, charge, and turning over to the court for prosecution, (3) the exact location of the offender is known so the subject could be taken into custody, and (4) some reason outside law enforcement control prevents bringing the offender to court. Crimes Against Persons – Includes the following index crimes: homicide, rape, robbery, and aggravated assault. Crimes Against Property – Includes the following index crimes: burglary, larceny/theft, motor vehicle theft. Crime Index – The total of the seven index crimes used to measure the extent, fluctuation, and distribution of crime. Group A Offenses – For NIBRS purposes, Group A offenses include 22 crime categories for which extensive crime data should be collected. A complete list of the Group A offenses is available at: http://www.mbcc.mt.gov/Data/CrimeDataSubmissions/UCRConversionSheet.pdf Group B Offenses – For NIBRS purposes, Group B offenses include 11 crime categories for which only arrest data should be collected. However, Montana treats Group B offenses the same as Group A offenses and collects all information for Group B crimes. A complete list of Group B offenses is available at: http://www.mbcc.mt.gov/Data/CrimeDataSubmissions/UCRConversionSheet.pdf Hotel Rule – A UCR scoring practice which limits to one the number of burglaries which can be counted when more than one room is entered for the purpose of committing a felony theft within a structure. Index Crimes – Includes the following crimes: homicide, rape, robbery, aggravated assault, burglary, larceny/theft, and motor vehicle theft. Index Crime Rate – The number of Index Crimes per a standard population, typically 100,000 people. Juvenile – Youth between the ages of 10 to 17.
19
Part I Offenses – Also called “major offenses”; consists of the seven index crimes and arson. Part II Offenses – Consists of all other crime categories not already designated at Part I, excluding traffic violations. Summary Reporting – A method of collecting crime data adopted for national reporting purposes in which a limited amount of data associated with an offense or arrest is compiled by each contributing agency.
20
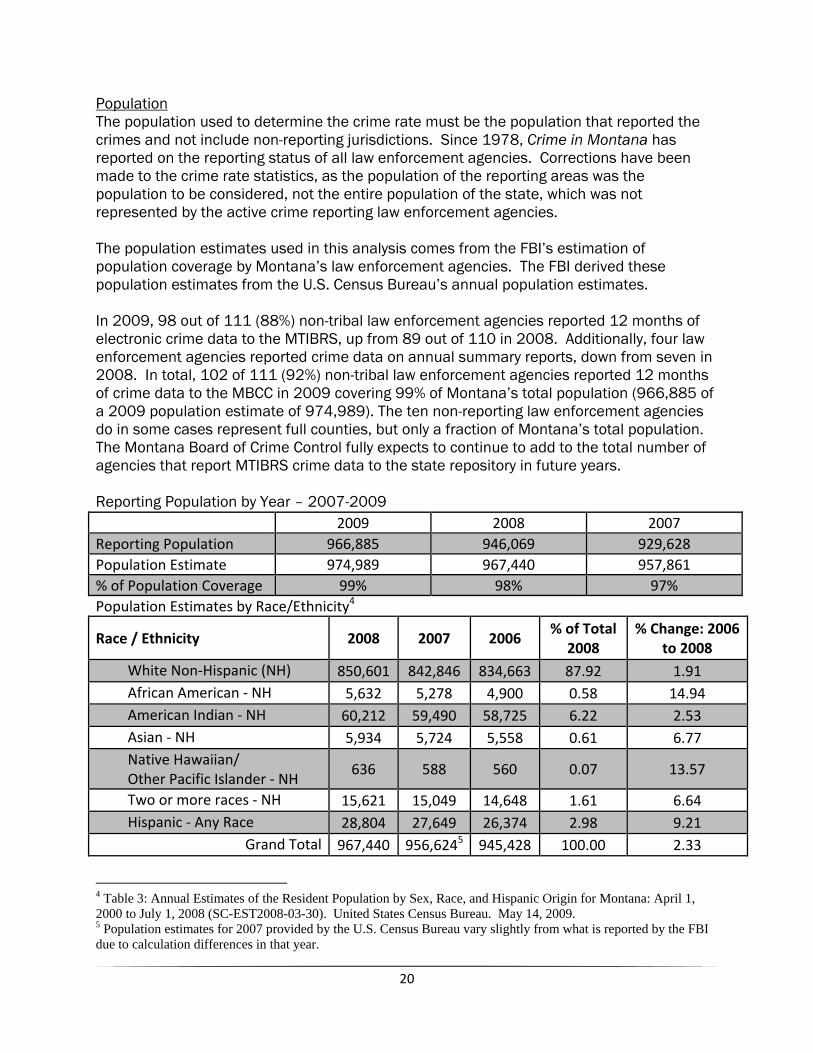
Population The population used to determine the crime rate must be the population that reported the crimes and not include non-reporting jurisdictions. Since 1978, Crime in Montana has reported on the reporting status of all law enforcement agencies. Corrections have been made to the crime rate statistics, as the population of the reporting areas was the population to be considered, not the entire population of the state, which was not represented by the active crime reporting law enforcement agencies. The population estimates used in this analysis comes from the FBI’s estimation of population coverage by Montana’s law enforcement agencies. The FBI derived these population estimates from the U.S. Census Bureau’s annual population estimates. In 2009, 98 out of 111 (88%) non-tribal law enforcement agencies reported 12 months of electronic crime data to the MTIBRS, up from 89 out of 110 in 2008. Additionally, four law enforcement agencies reported crime data on annual summary reports, down from seven in 2008. In total, 102 of 111 (92%) non-tribal law enforcement agencies reported 12 months of crime data to the MBCC in 2009 covering 99% of Montana’s total population (966,885 of a 2009 population estimate of 974,989). The ten non-reporting law enforcement agencies do in some cases represent full counties, but only a fraction of Montana’s total population. The Montana Board of Crime Control fully expects to continue to add to the total number of agencies that report MTIBRS crime data to the state repository in future years. Reporting Population by Year – 2007-2009 2009 2008 2007 Reporting Population 966,885 946,069 929,628 Population Estimate 974,989 967,440 957,861 % of Population Coverage 99% 98% 97% Population Estimates by Race/Ethnicity4
Race / Ethnicity 2008 2007 2006 % of Total
2008 % Change: 2006
to 2008 White Non‐Hispanic (NH) 850,601 842,846 834,663 87.92 1.91 African American ‐ NH 5,632 5,278 4,900 0.58 14.94 American Indian ‐ NH 60,212 59,490 58,725 6.22 2.53 Asian ‐ NH 5,934 5,724 5,558 0.61 6.77 Native Hawaiian/ Other Pacific Islander ‐ NH
636 588 560 0.07 13.57
Two or more races ‐ NH 15,621 15,049 14,648 1.61 6.64 Hispanic ‐ Any Race 28,804 27,649 26,374 2.98 9.21
Grand Total 967,440 956,6245 945,428 100.00 2.33
4 Table 3: Annual Estimates of the Resident Population by Sex, Race, and Hispanic Origin for Montana: April 1, 2000 to July 1, 2008 (SC-EST2008-03-30). United States Census Bureau. May 14, 2009. 5 Population estimates for 2007 provided by the U.S. Census Bureau vary slightly from what is reported by the FBI due to calculation differences in that year.
21
0%1%2%3%4%5%6%7%8%9%
Und
er 5
yea
rs5
to 9
yea
rs1
0 to
14
yea
rs1
5 to
19
yea
rs2
0 to
24
yea
rs2
5 to
29
yea
rs3
0 to
34
yea
rs3
5 to
39
yea
rs4
0 to
44
yea
rs4
5 to
49
yea
rs5
0 to
54
yea
rs5
5 to
59
yea
rs6
0 to
64
yea
rs6
5 to
69
yea
rs7
0 to
74
yea
rs7
5 to
79
yea
rs8
0 to
84
yea
rs8
5+
yea
rs
Age Distribution - 2008
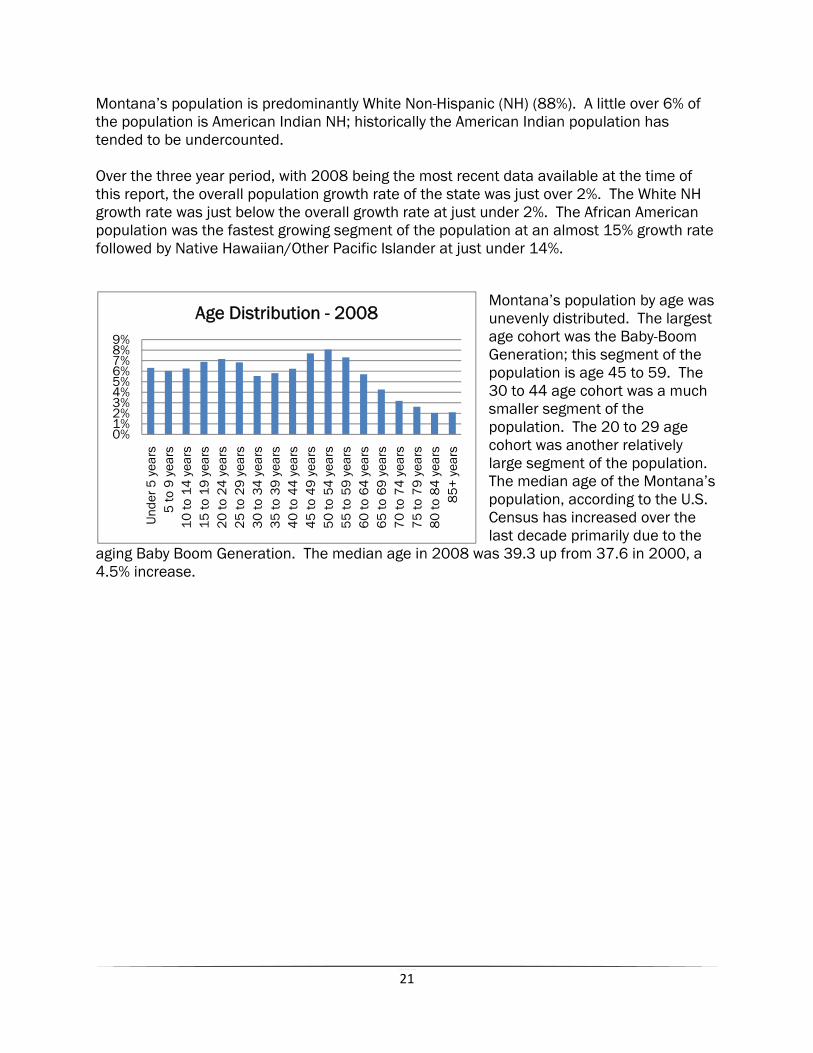
Montana’s population is predominantly White Non-Hispanic (NH) (88%). A little over 6% of the population is American Indian NH; historically the American Indian population has tended to be undercounted. Over the three year period, with 2008 being the most recent data available at the time of this report, the overall population growth rate of the state was just over 2%. The White NH growth rate was just below the overall growth rate at just under 2%. The African American population was the fastest growing segment of the population at an almost 15% growth rate followed by Native Hawaiian/Other Pacific Islander at just under 14%.
Montana’s population by age was unevenly distributed. The largest age cohort was the Baby-Boom Generation; this segment of the population is age 45 to 59. The 30 to 44 age cohort was a much smaller segment of the population. The 20 to 29 age cohort was another relatively large segment of the population. The median age of the Montana’s population, according to the U.S. Census has increased over the last decade primarily due to the
aging Baby Boom Generation. The median age in 2008 was 39.3 up from 37.6 in 2000, a 4.5% increase.
22
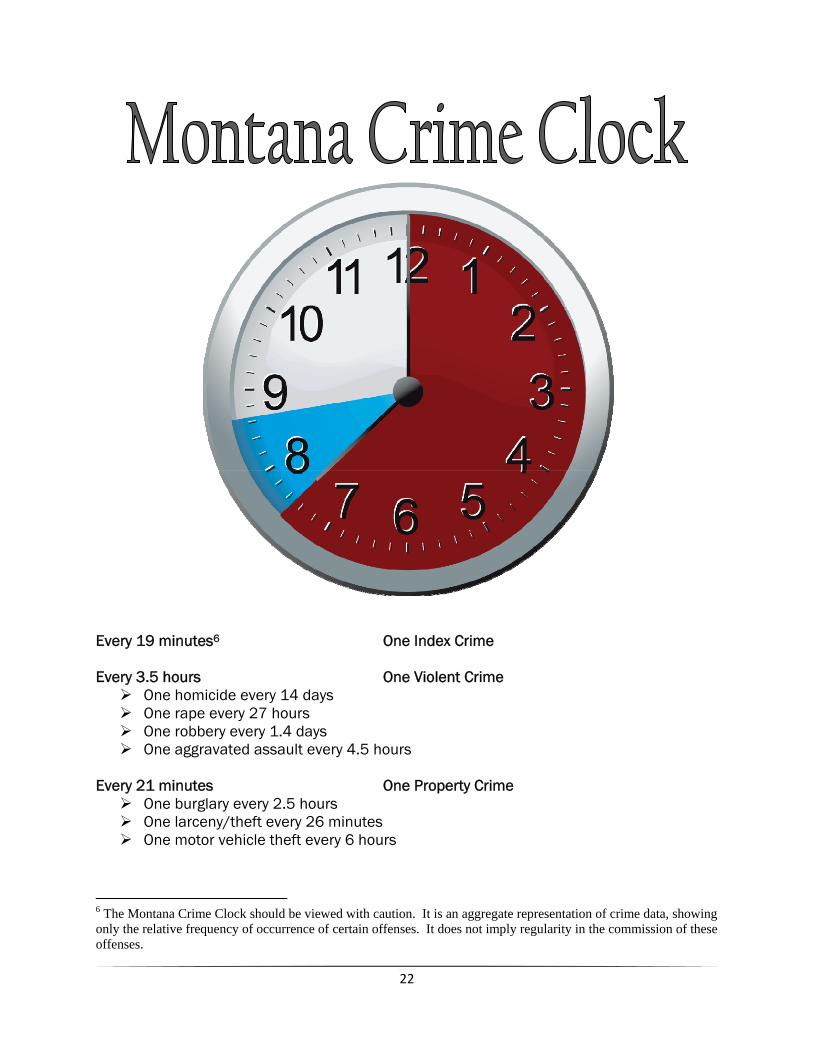
Every 19 minutes6 One Index Crime Every 3.5 hours One Violent Crime
One homicide every 14 days One rape every 27 hours One robbery every 1.4 days One aggravated assault every 4.5 hours
Every 21 minutes One Property Crime
One burglary every 2.5 hours One larceny/theft every 26 minutes One motor vehicle theft every 6 hours
6 The Montana Crime Clock should be viewed with caution. It is an aggregate representation of crime data, showing only the relative frequency of occurrence of certain offenses. It does not imply regularity in the commission of these offenses.
23
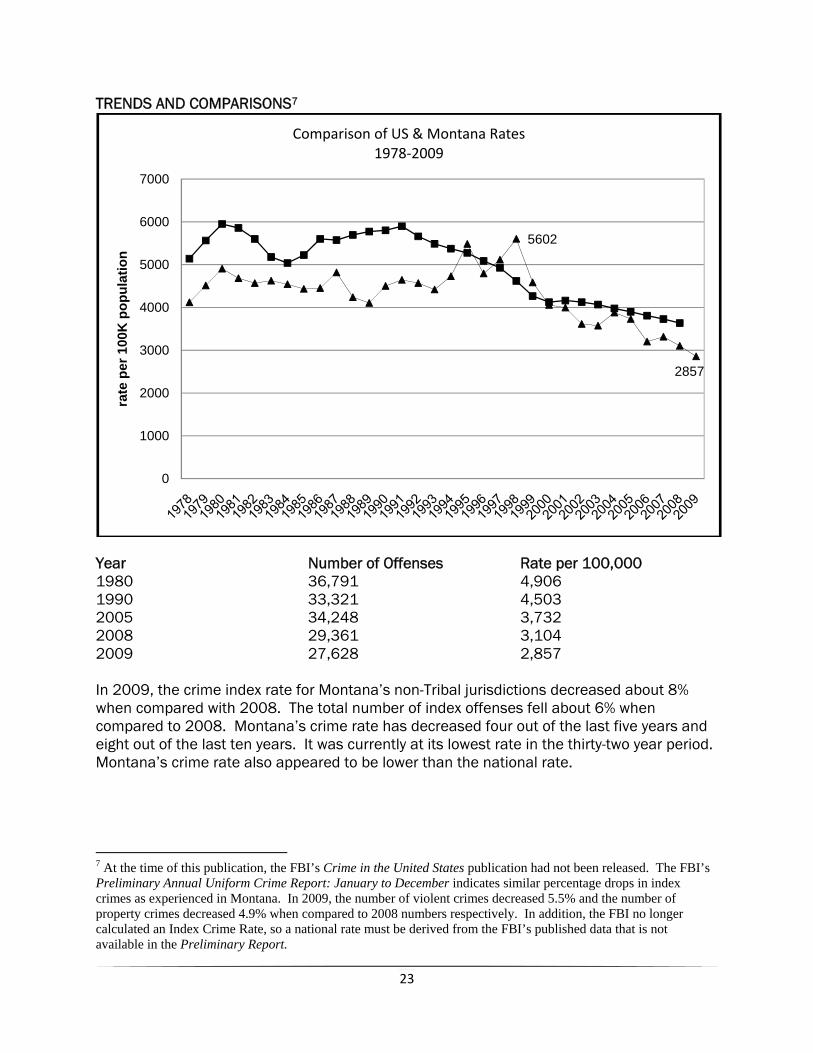
TRENDS AND COMPARISONS7
Year Number of Offenses Rate per 100,000 1980 36,791 4,906 1990 33,321 4,503 2005 34,248 3,732 2008 29,361 3,104 2009 27,628 2,857 In 2009, the crime index rate for Montana’s non-Tribal jurisdictions decreased about 8% when compared with 2008. The total number of index offenses fell about 6% when compared to 2008. Montana’s crime rate has decreased four out of the last five years and eight out of the last ten years. It was currently at its lowest rate in the thirty-two year period. Montana’s crime rate also appeared to be lower than the national rate.
7 At the time of this publication, the FBI’s Crime in the United States publication had not been released. The FBI’s Preliminary Annual Uniform Crime Report: January to December indicates similar percentage drops in index crimes as experienced in Montana. In 2009, the number of violent crimes decreased 5.5% and the number of property crimes decreased 4.9% when compared to 2008 numbers respectively. In addition, the FBI no longer calculated an Index Crime Rate, so a national rate must be derived from the FBI’s published data that is not available in the Preliminary Report.
5602
2857
0
1000
2000
3000
4000
5000
6000
7000
rate
per
100
K p
opul
atio
nComparison of US & Montana Rates
1978‐2009
24
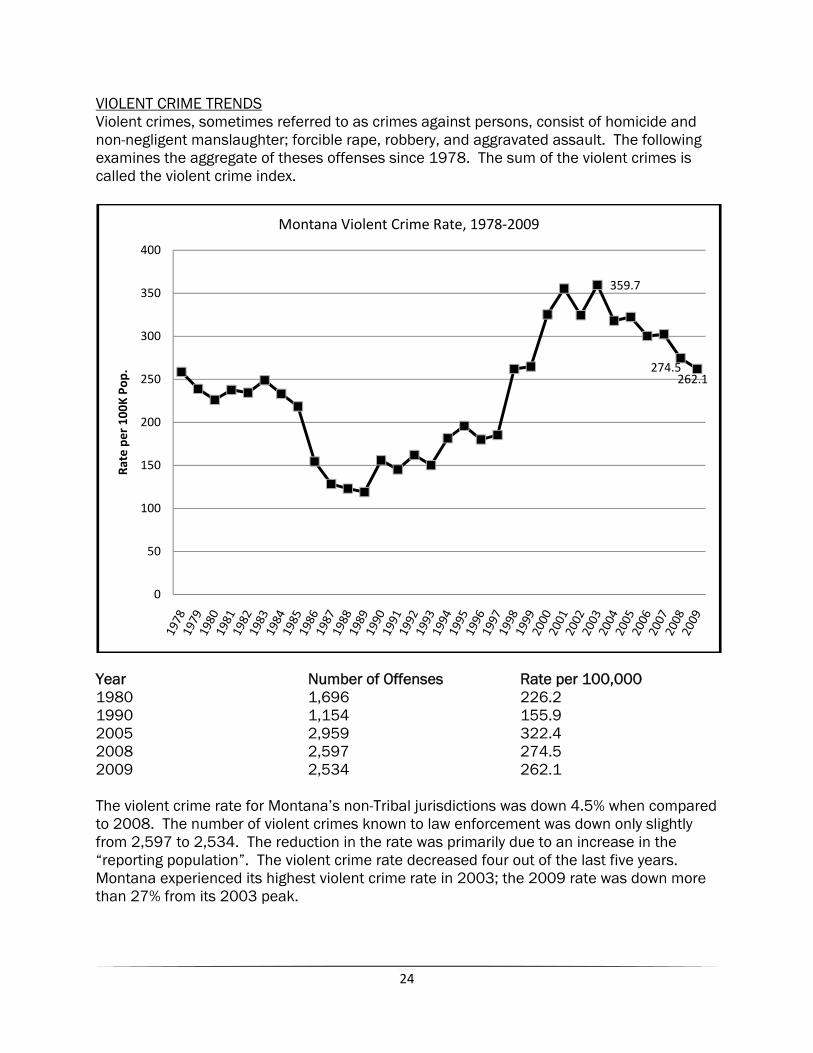
VIOLENT CRIME TRENDS Violent crimes, sometimes referred to as crimes against persons, consist of homicide and non-negligent manslaughter; forcible rape, robbery, and aggravated assault. The following examines the aggregate of theses offenses since 1978. The sum of the violent crimes is called the violent crime index.
Year Number of Offenses Rate per 100,000 1980 1,696 226.2 1990 1,154 155.9 2005 2,959 322.4 2008 2,597 274.5 2009 2,534 262.1 The violent crime rate for Montana’s non-Tribal jurisdictions was down 4.5% when compared to 2008. The number of violent crimes known to law enforcement was down only slightly from 2,597 to 2,534. The reduction in the rate was primarily due to an increase in the “reporting population”. The violent crime rate decreased four out of the last five years. Montana experienced its highest violent crime rate in 2003; the 2009 rate was down more than 27% from its 2003 peak.
359.7
274.5262.1
0
50
100
150
200
250
300
350
400
Rate per 100
K Po
p.
Montana Violent Crime Rate, 1978‐2009
25
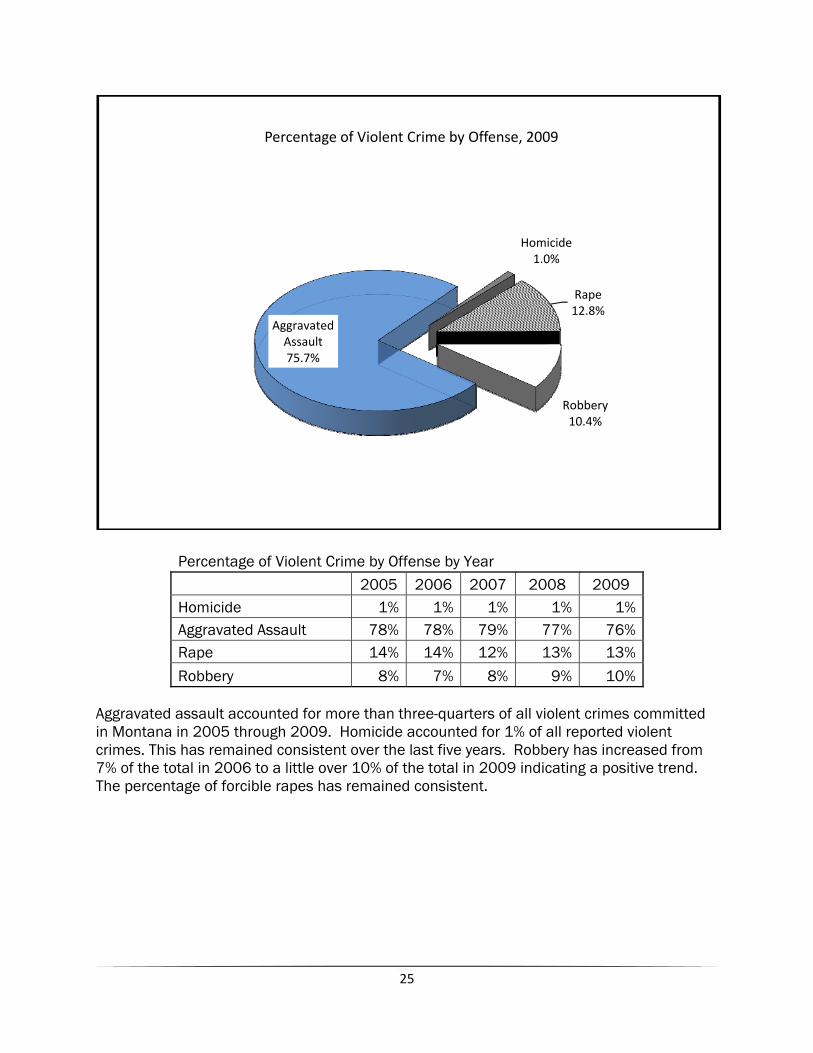
Percentage of Violent Crime by Offense by Year 2005 2006 2007 2008 2009 Homicide 1% 1% 1% 1% 1% Aggravated Assault 78% 78% 79% 77% 76% Rape 14% 14% 12% 13% 13%
Robbery 8% 7% 8% 9% 10% Aggravated assault accounted for more than three-quarters of all violent crimes committed in Montana in 2005 through 2009. Homicide accounted for 1% of all reported violent crimes. This has remained consistent over the last five years. Robbery has increased from 7% of the total in 2006 to a little over 10% of the total in 2009 indicating a positive trend. The percentage of forcible rapes has remained consistent.
Homicide1.0%
Rape12.8%
Robbery10.4%
Aggravated Assault75.7%
Percentage of Violent Crime by Offense, 2009
26
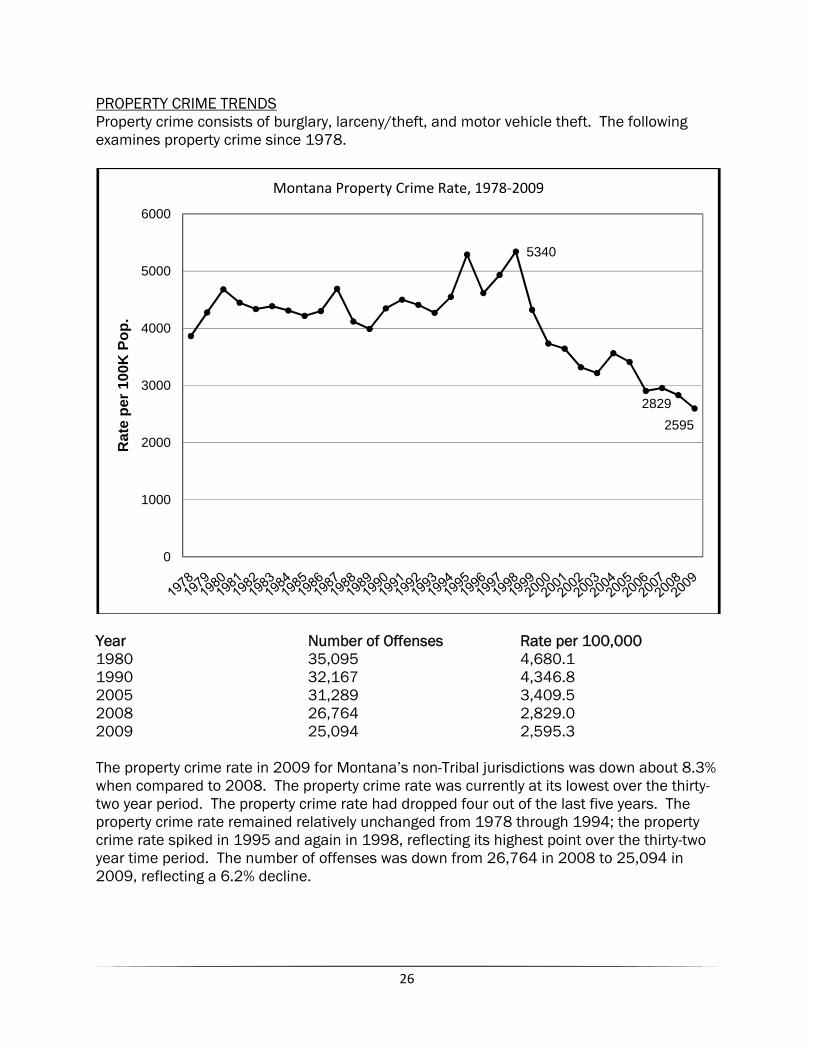
PROPERTY CRIME TRENDS Property crime consists of burglary, larceny/theft, and motor vehicle theft. The following examines property crime since 1978.
Year Number of Offenses Rate per 100,000 1980 35,095 4,680.1 1990 32,167 4,346.8 2005 31,289 3,409.5 2008 26,764 2,829.0 2009 25,094 2,595.3 The property crime rate in 2009 for Montana’s non-Tribal jurisdictions was down about 8.3% when compared to 2008. The property crime rate was currently at its lowest over the thirty-two year period. The property crime rate had dropped four out of the last five years. The property crime rate remained relatively unchanged from 1978 through 1994; the property crime rate spiked in 1995 and again in 1998, reflecting its highest point over the thirty-two year time period. The number of offenses was down from 26,764 in 2008 to 25,094 in 2009, reflecting a 6.2% decline.
5340
28292595
0
1000
2000
3000
4000
5000
6000
Rat
e pe
r 100
K P
op.
Montana Property Crime Rate, 1978‐2009
27
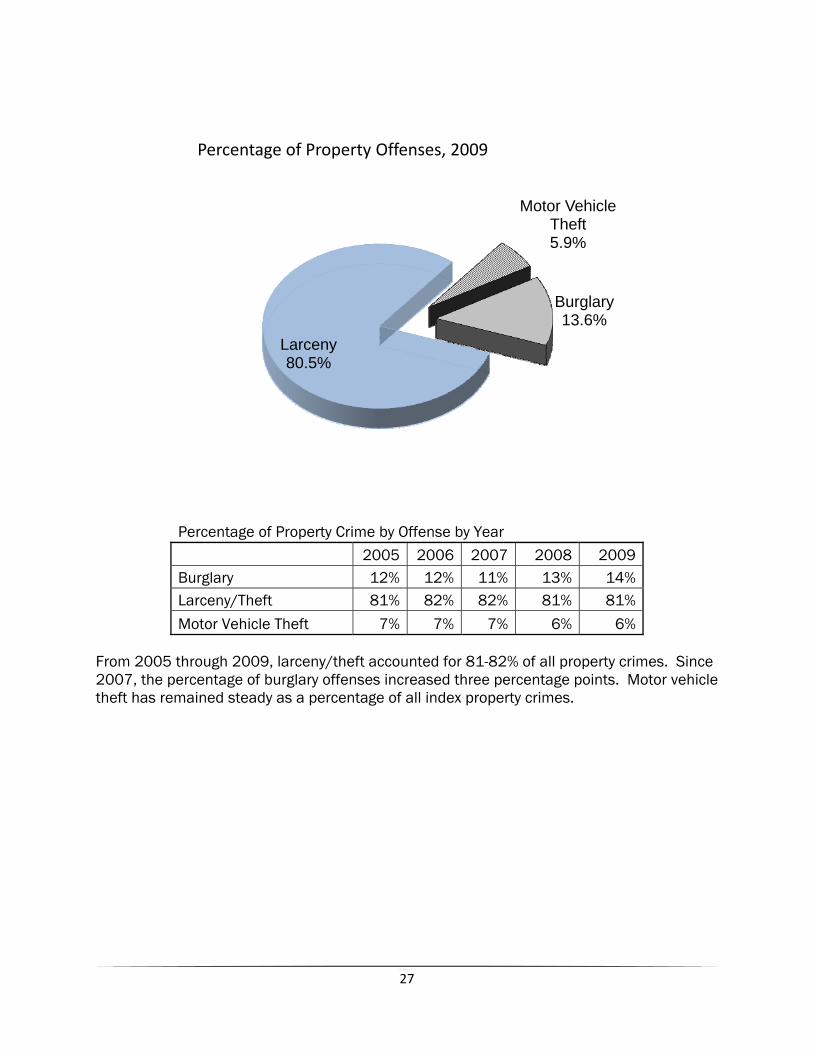
Percentage of Property Crime by Offense by Year
2005 2006 2007 2008 2009 Burglary 12% 12% 11% 13% 14% Larceny/Theft 81% 82% 82% 81% 81%
Motor Vehicle Theft 7% 7% 7% 6% 6%
From 2005 through 2009, larceny/theft accounted for 81-82% of all property crimes. Since 2007, the percentage of burglary offenses increased three percentage points. Motor vehicle theft has remained steady as a percentage of all index property crimes.
Burglary13.6%
Larceny80.5%
Motor Vehicle Theft5.9%
Percentage of Property Offenses, 2009
28
TEN YEAR TREND ANALYSIS
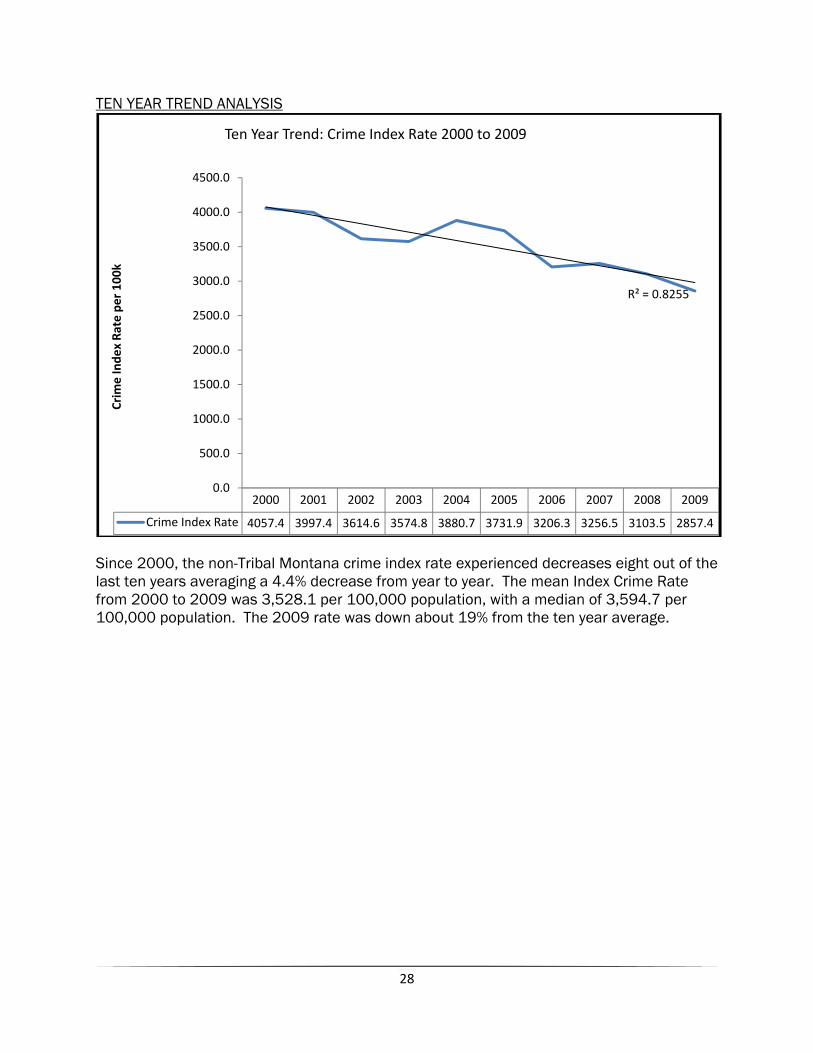
Since 2000, the non-Tribal Montana crime index rate experienced decreases eight out of the last ten years averaging a 4.4% decrease from year to year. The mean Index Crime Rate from 2000 to 2009 was 3,528.1 per 100,000 population, with a median of 3,594.7 per 100,000 population. The 2009 rate was down about 19% from the ten year average.
2000 2001 2002 2003 2004 2005 2006 2007 2008 2009
Crime Index Rate 4057.4 3997.4 3614.6 3574.8 3880.7 3731.9 3206.3 3256.5 3103.5 2857.4
R² = 0.8255
0.0
500.0
1000.0
1500.0
2000.0
2500.0
3000.0
3500.0
4000.0
4500.0
Crim
e Inde
x Ra
te per 100
kTen Year Trend: Crime Index Rate 2000 to 2009
29
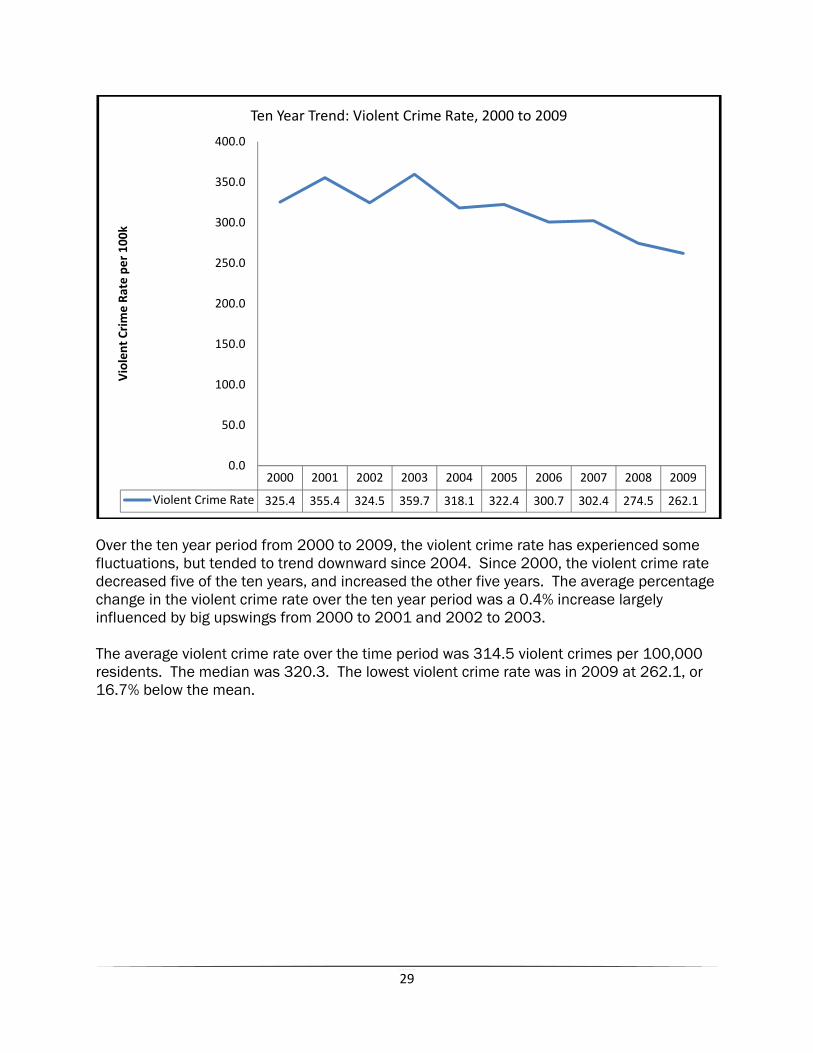
Over the ten year period from 2000 to 2009, the violent crime rate has experienced some fluctuations, but tended to trend downward since 2004. Since 2000, the violent crime rate decreased five of the ten years, and increased the other five years. The average percentage change in the violent crime rate over the ten year period was a 0.4% increase largely influenced by big upswings from 2000 to 2001 and 2002 to 2003. The average violent crime rate over the time period was 314.5 violent crimes per 100,000 residents. The median was 320.3. The lowest violent crime rate was in 2009 at 262.1, or 16.7% below the mean.
2000 2001 2002 2003 2004 2005 2006 2007 2008 2009
Violent Crime Rate 325.4 355.4 324.5 359.7 318.1 322.4 300.7 302.4 274.5 262.1
0.0
50.0
100.0
150.0
200.0
250.0
300.0
350.0
400.0Violent Crime Ra
te per 100
kTen Year Trend: Violent Crime Rate, 2000 to 2009

30
The non-Tribal property crime rate over the ten year period steadily decreased over the ten year period, reaching its lowest point in 2009. The rate increased two out of ten years, with the largest increase (10.8%) occurring in 2004. On average, the property crime rate decreased almost 5% per year. The mean property crime rate over the ten year period was 3,216.2 per 100,000 residents, the 2009 rate was significantly lower (19.3%) than the ten year average. The median property crime rate was 3,266.2. The maximum occurred in 2000 at 3,732.1 per 100,000 residents8.
8 Montana’s non-Tribal property crime rate actually peaked in 1995 and again in 1998, outside of the ten year time frame of this analysis.
2000 2001 2002 2003 2004 2005 2006 2007 2008 2009
Prop. Crime Rate 3732.1 3641.9 3317.2 3215.1 3562.6 3409.5 2905.6 2954.1 2829.0 2595.3
0.0
500.0
1000.0
1500.0
2000.0
2500.0
3000.0
3500.0
4000.0
Prop
erty
Crim
e R
ate
per 1
00
kTen Year Trend: Property Crime, 2000 to 2009
31
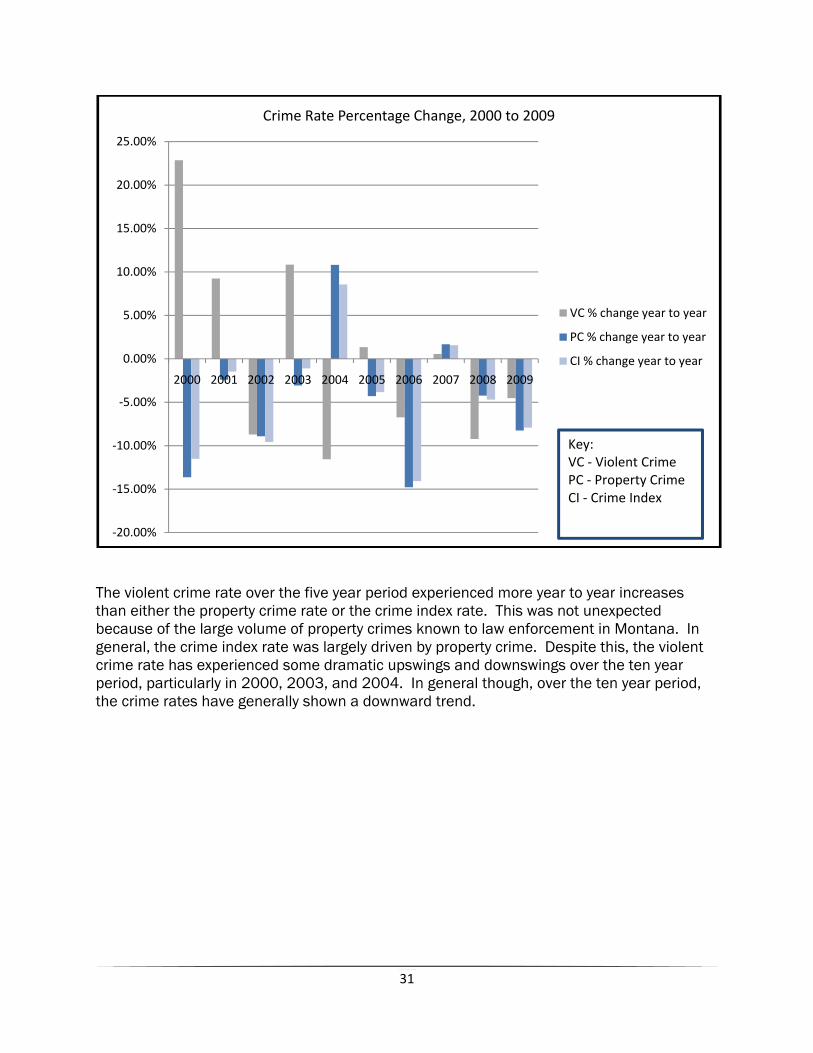
The violent crime rate over the five year period experienced more year to year increases than either the property crime rate or the crime index rate. This was not unexpected because of the large volume of property crimes known to law enforcement in Montana. In general, the crime index rate was largely driven by property crime. Despite this, the violent crime rate has experienced some dramatic upswings and downswings over the ten year period, particularly in 2000, 2003, and 2004. In general though, over the ten year period, the crime rates have generally shown a downward trend.
‐20.00%
‐15.00%
‐10.00%
‐5.00%
0.00%
5.00%
10.00%
15.00%
20.00%
25.00%
2000 2001 2002 2003 2004 2005 2006 2007 2008 2009
Crime Rate Percentage Change, 2000 to 2009
VC % change year to year
PC % change year to year
CI % change year to year
Key:VC ‐ Violent CrimePC ‐ Property CrimeCI ‐ Crime Index
32
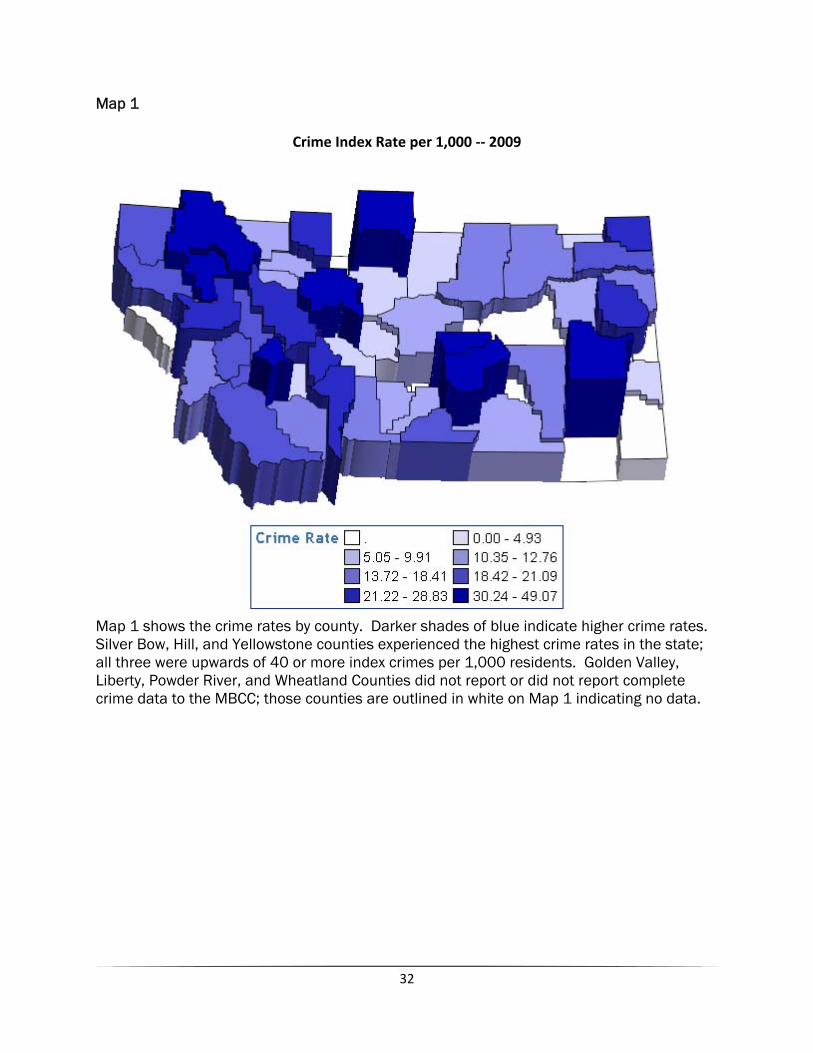
Map 1
Crime Index Rate per 1,000 ‐‐ 2009
Map 1 shows the crime rates by county. Darker shades of blue indicate higher crime rates. Silver Bow, Hill, and Yellowstone counties experienced the highest crime rates in the state; all three were upwards of 40 or more index crimes per 1,000 residents. Golden Valley, Liberty, Powder River, and Wheatland Counties did not report or did not report complete crime data to the MBCC; those counties are outlined in white on Map 1 indicating no data.
33
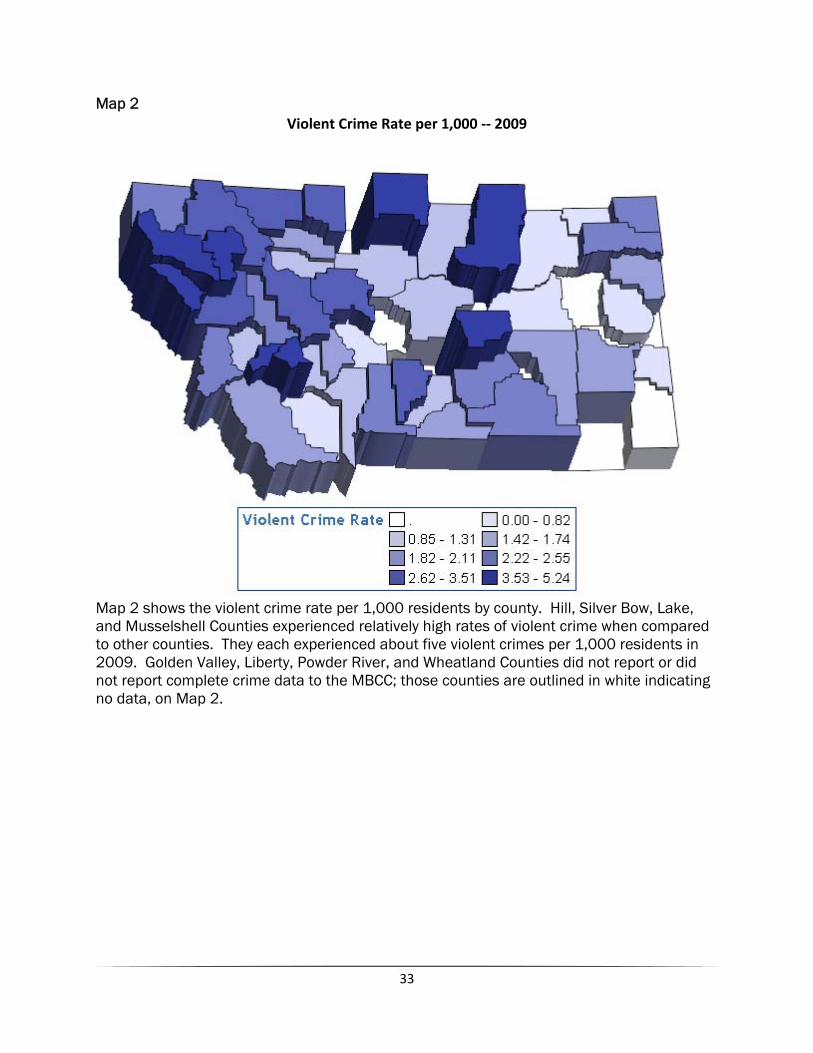
Map 2 Violent Crime Rate per 1,000 ‐‐ 2009
Map 2 shows the violent crime rate per 1,000 residents by county. Hill, Silver Bow, Lake, and Musselshell Counties experienced relatively high rates of violent crime when compared to other counties. They each experienced about five violent crimes per 1,000 residents in 2009. Golden Valley, Liberty, Powder River, and Wheatland Counties did not report or did not report complete crime data to the MBCC; those counties are outlined in white indicating no data, on Map 2.
34
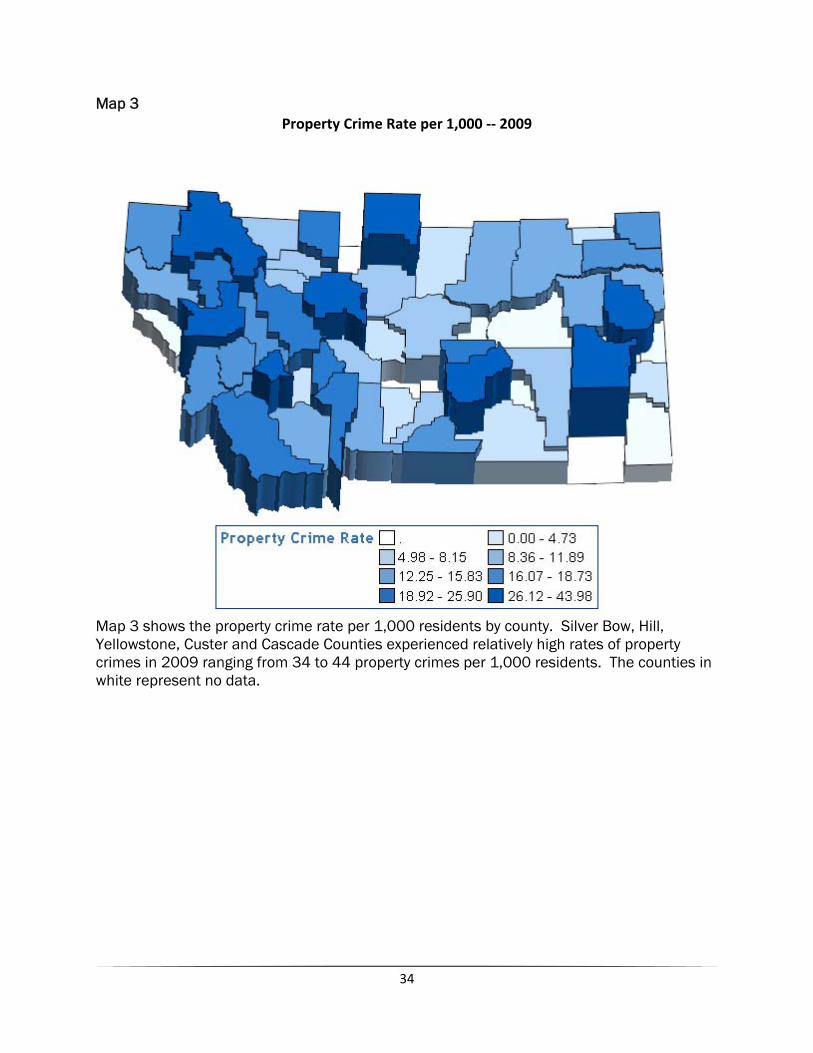
Map 3 Property Crime Rate per 1,000 ‐‐ 2009
Map 3 shows the property crime rate per 1,000 residents by county. Silver Bow, Hill, Yellowstone, Custer and Cascade Counties experienced relatively high rates of property crimes in 2009 ranging from 34 to 44 property crimes per 1,000 residents. The counties in white represent no data.
35
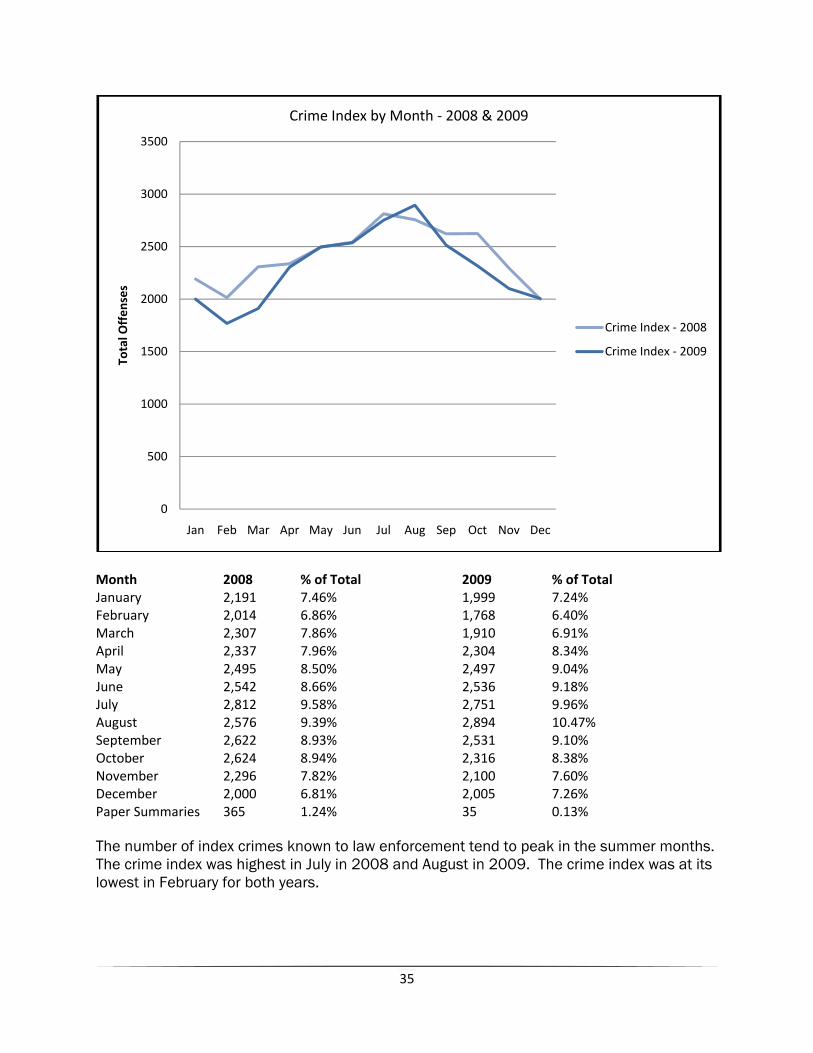
Month 2008 % of Total 2009 % of Total January 2,191 7.46% 1,999 7.24% February 2,014 6.86% 1,768 6.40% March 2,307 7.86% 1,910 6.91% April 2,337 7.96% 2,304 8.34% May 2,495 8.50% 2,497 9.04% June 2,542 8.66% 2,536 9.18% July 2,812 9.58% 2,751 9.96% August 2,576 9.39% 2,894 10.47% September 2,622 8.93% 2,531 9.10% October 2,624 8.94% 2,316 8.38% November 2,296 7.82% 2,100 7.60% December 2,000 6.81% 2,005 7.26% Paper Summaries 365 1.24% 35 0.13% The number of index crimes known to law enforcement tend to peak in the summer months. The crime index was highest in July in 2008 and August in 2009. The crime index was at its lowest in February for both years.
0
500
1000
1500
2000
2500
3000
3500
Jan Feb Mar Apr May Jun Jul Aug Sep Oct Nov Dec
Total O
ffen
ses
Crime Index by Month ‐ 2008 & 2009
Crime Index ‐ 2008
Crime Index ‐ 2009
36
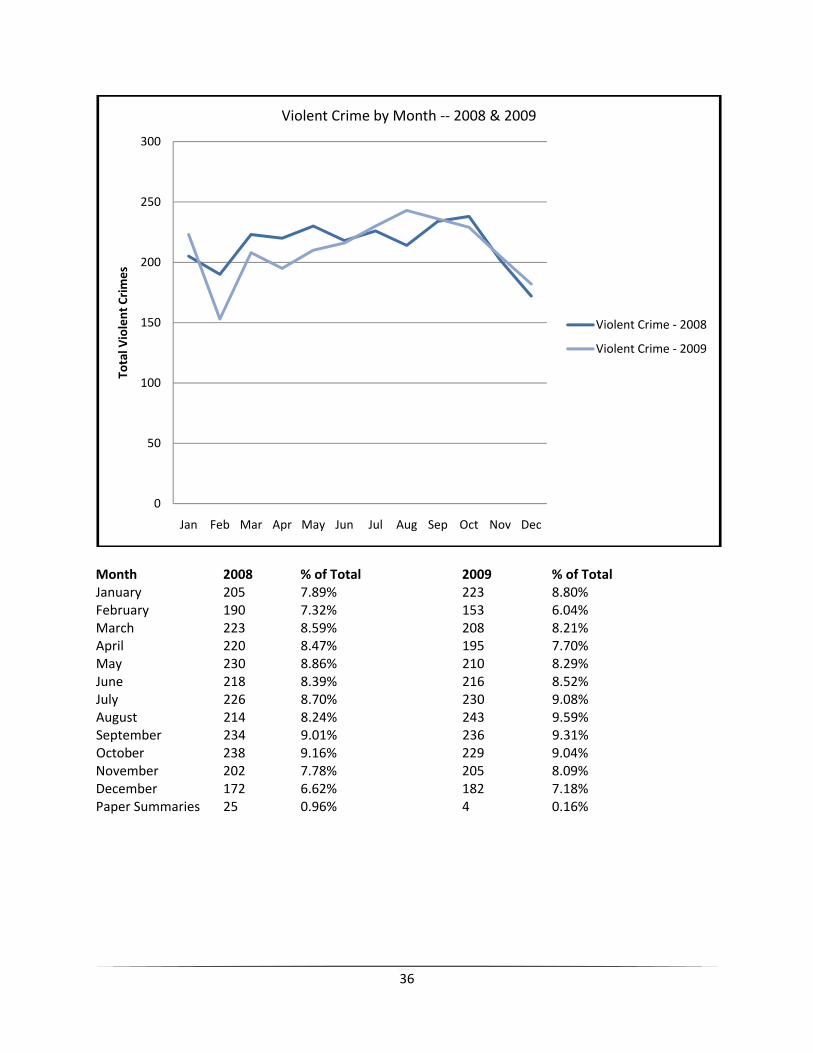
Month 2008 % of Total 2009 % of Total January 205 7.89% 223 8.80% February 190 7.32% 153 6.04% March 223 8.59% 208 8.21% April 220 8.47% 195 7.70% May 230 8.86% 210 8.29% June 218 8.39% 216 8.52% July 226 8.70% 230 9.08% August 214 8.24% 243 9.59% September 234 9.01% 236 9.31% October 238 9.16% 229 9.04% November 202 7.78% 205 8.09% December 172 6.62% 182 7.18% Paper Summaries 25 0.96% 4 0.16%
0
50
100
150
200
250
300
Jan Feb Mar Apr May Jun Jul Aug Sep Oct Nov Dec
Total V
iolent Crimes
Violent Crime by Month ‐‐ 2008 & 2009
Violent Crime ‐ 2008
Violent Crime ‐ 2009
37
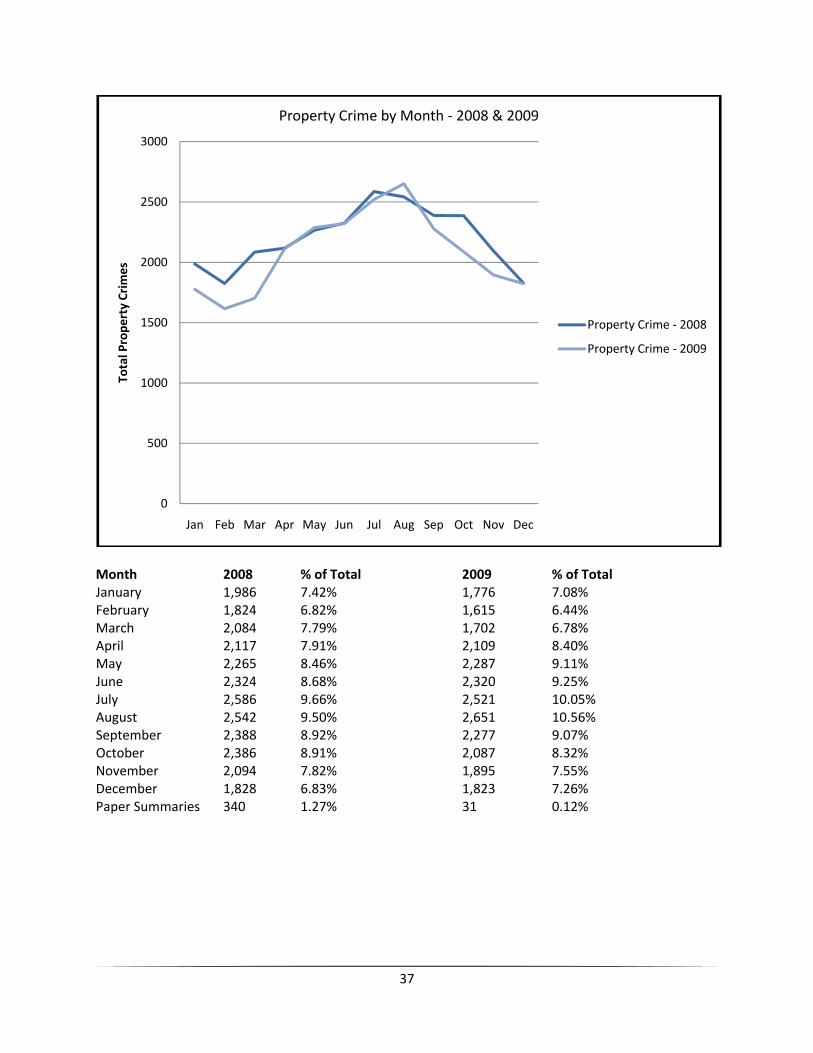
Month 2008 % of Total 2009 % of Total January 1,986 7.42% 1,776 7.08% February 1,824 6.82% 1,615 6.44% March 2,084 7.79% 1,702 6.78% April 2,117 7.91% 2,109 8.40% May 2,265 8.46% 2,287 9.11% June 2,324 8.68% 2,320 9.25% July 2,586 9.66% 2,521 10.05% August 2,542 9.50% 2,651 10.56% September 2,388 8.92% 2,277 9.07% October 2,386 8.91% 2,087 8.32% November 2,094 7.82% 1,895 7.55% December 1,828 6.83% 1,823 7.26% Paper Summaries 340 1.27% 31 0.12%
0
500
1000
1500
2000
2500
3000
Jan Feb Mar Apr May Jun Jul Aug Sep Oct Nov Dec
Total Prope
rty Crim
esProperty Crime by Month ‐ 2008 & 2009
Property Crime ‐ 2008
Property Crime ‐ 2009
38
Part I Violent Crimes HOMICIDE9
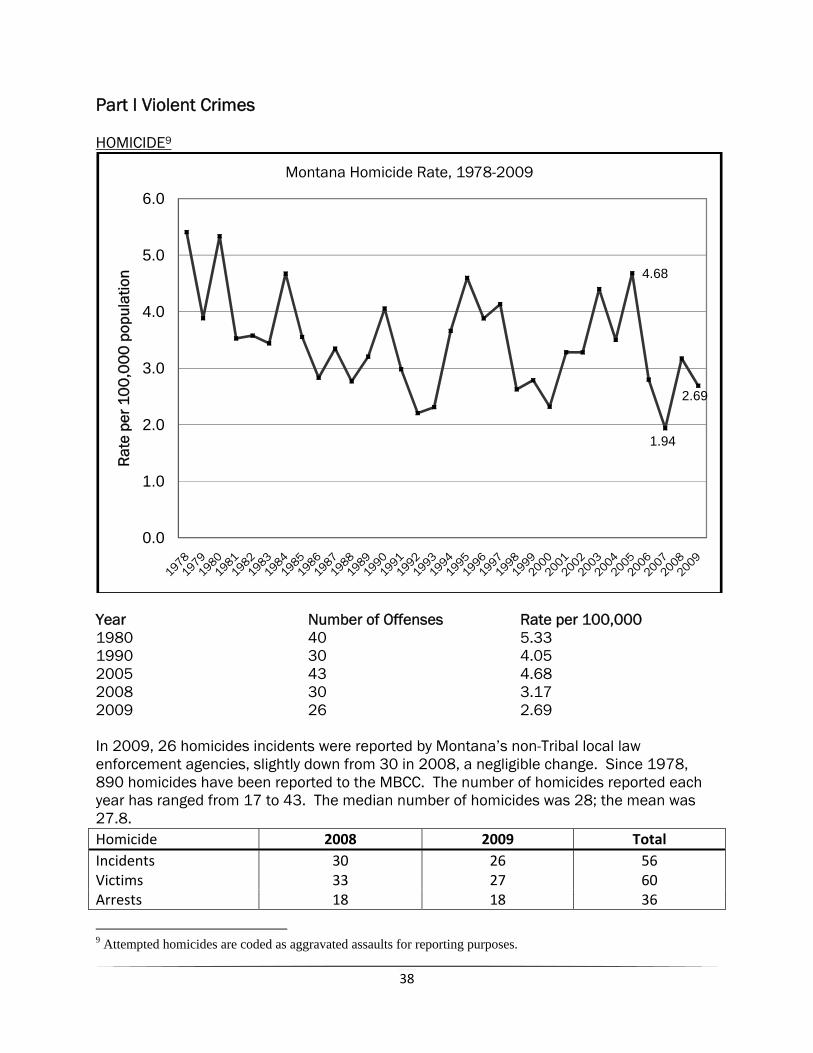
Year Number of Offenses Rate per 100,000 1980 40 5.33 1990 30 4.05 2005 43 4.68 2008 30 3.17 2009 26 2.69 In 2009, 26 homicides incidents were reported by Montana’s non-Tribal local law enforcement agencies, slightly down from 30 in 2008, a negligible change. Since 1978, 890 homicides have been reported to the MBCC. The number of homicides reported each year has ranged from 17 to 43. The median number of homicides was 28; the mean was 27.8. Homicide 2008 2009 Total Incidents 30 26 56 Victims 33 27 60 Arrests 18 18 36
9 Attempted homicides are coded as aggravated assaults for reporting purposes.
4.68
1.94
2.69
0.0
1.0
2.0
3.0
4.0
5.0
6.0
Rat
e pe
r 10
0,0
00
pop
ulat
ion
Montana Homicide Rate, 1978-2009
39
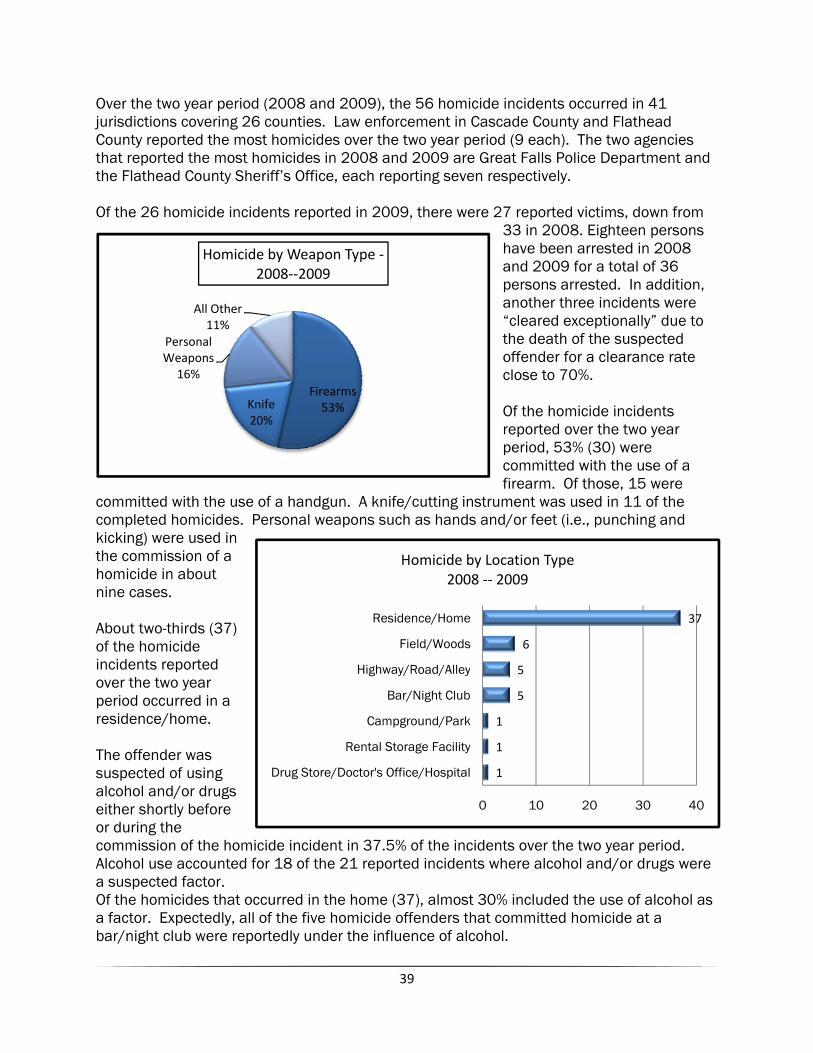
Over the two year period (2008 and 2009), the 56 homicide incidents occurred in 41 jurisdictions covering 26 counties. Law enforcement in Cascade County and Flathead County reported the most homicides over the two year period (9 each). The two agencies that reported the most homicides in 2008 and 2009 are Great Falls Police Department and the Flathead County Sheriff’s Office, each reporting seven respectively. Of the 26 homicide incidents reported in 2009, there were 27 reported victims, down from
33 in 2008. Eighteen persons have been arrested in 2008 and 2009 for a total of 36 persons arrested. In addition, another three incidents were “cleared exceptionally” due to the death of the suspected offender for a clearance rate close to 70%. Of the homicide incidents reported over the two year period, 53% (30) were committed with the use of a firearm. Of those, 15 were
committed with the use of a handgun. A knife/cutting instrument was used in 11 of the completed homicides. Personal weapons such as hands and/or feet (i.e., punching and kicking) were used in the commission of a homicide in about nine cases. About two-thirds (37) of the homicide incidents reported over the two year period occurred in a residence/home. The offender was suspected of using alcohol and/or drugs either shortly before or during the commission of the homicide incident in 37.5% of the incidents over the two year period. Alcohol use accounted for 18 of the 21 reported incidents where alcohol and/or drugs were a suspected factor. Of the homicides that occurred in the home (37), almost 30% included the use of alcohol as a factor. Expectedly, all of the five homicide offenders that committed homicide at a bar/night club were reportedly under the influence of alcohol.
Firearms53%Knife
20%
Personal Weapons
16%
All Other11%
Homicide by Weapon Type ‐2008‐‐2009
1
1
1
5
5
6
37
0 10 20 30 40
Drug Store/Doctor's Office/Hospital
Rental Storage Facility
Campground/Park
Bar/Night Club
Highway/Road/Alley
Field/Woods
Residence/Home
Homicide by Location Type 2008 ‐‐ 2009
40
0
5
10
15
20
Age
Homicide Victims by Age: 2008 & 2009
Not Reported
3%Multiple Victims/
Offenders10%
Not Know by Victim
20%
Within Family27%
Outside Family but Known to
Victim40%
Homicide - Victim to Offender Relationship: 2008 & 2009
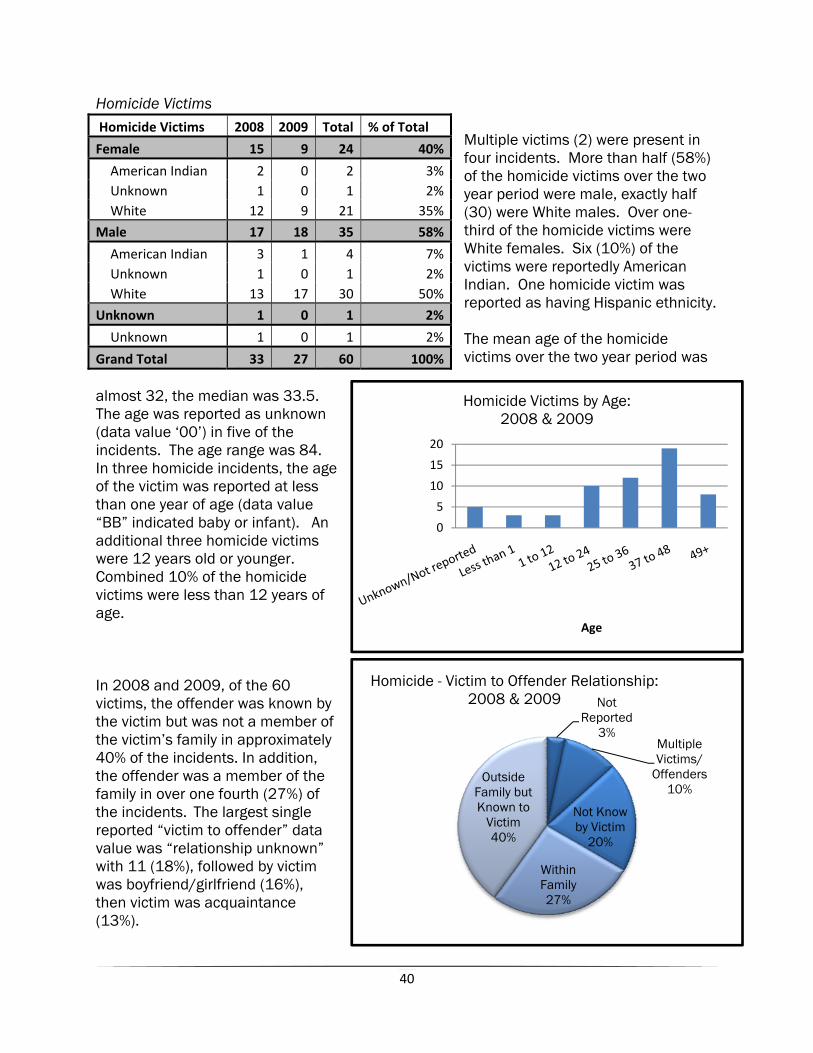
Homicide Victims Multiple victims (2) were present in four incidents. More than half (58%) of the homicide victims over the two year period were male, exactly half (30) were White males. Over one-third of the homicide victims were White females. Six (10%) of the victims were reportedly American Indian. One homicide victim was reported as having Hispanic ethnicity. The mean age of the homicide victims over the two year period was
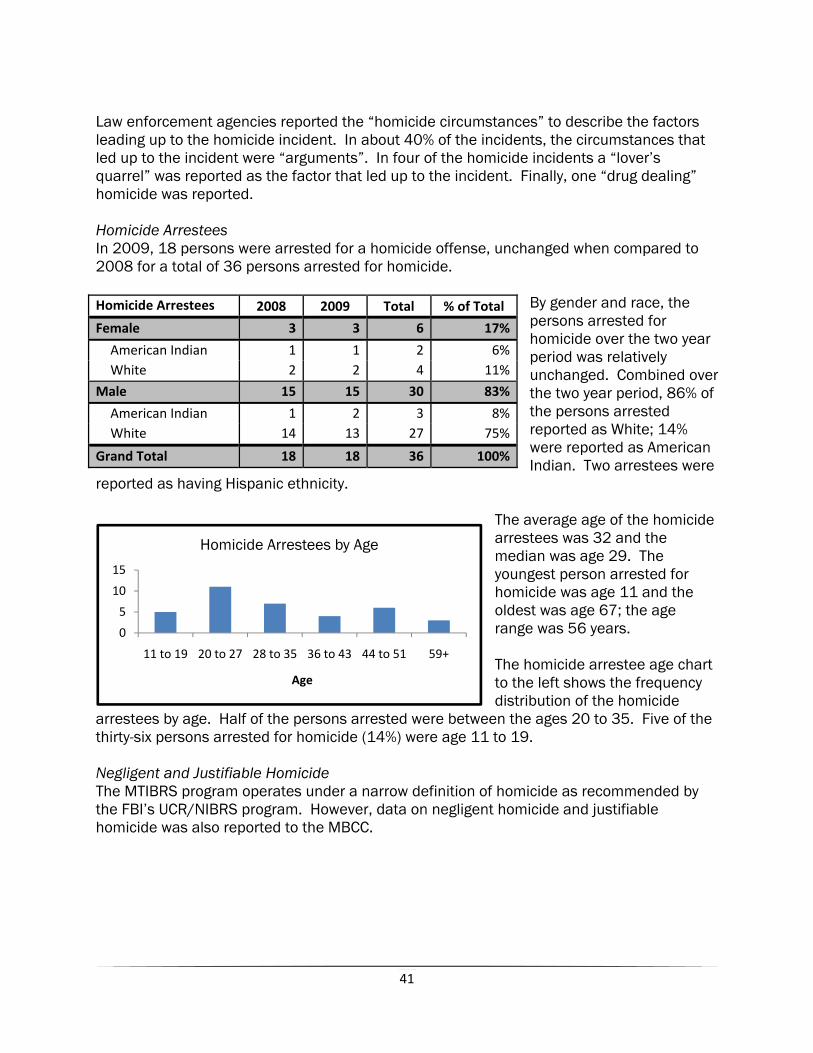
almost 32, the median was 33.5. The age was reported as unknown (data value ‘00’) in five of the incidents. The age range was 84. In three homicide incidents, the age of the victim was reported at less than one year of age (data value “BB” indicated baby or infant). An additional three homicide victims were 12 years old or younger. Combined 10% of the homicide victims were less than 12 years of age. In 2008 and 2009, of the 60 victims, the offender was known by the victim but was not a member of the victim’s family in approximately 40% of the incidents. In addition, the offender was a member of the family in over one fourth (27%) of the incidents. The largest single reported “victim to offender” data value was “relationship unknown” with 11 (18%), followed by victim was boyfriend/girlfriend (16%), then victim was acquaintance (13%).
Homicide Victims 2008 2009 Total % of Total
Female 15 9 24 40%
American Indian 2 0 2 3%Unknown 1 0 1 2%White 12 9 21 35%
Male 17 18 35 58%
American Indian 3 1 4 7%Unknown 1 0 1 2%White 13 17 30 50%
Unknown 1 0 1 2%
Unknown 1 0 1 2%
Grand Total 33 27 60 100%
41
0
5
10
15
11 to 19 20 to 27 28 to 35 36 to 43 44 to 51 59+
Age
Homicide Arrestees by Age
Law enforcement agencies reported the “homicide circumstances” to describe the factors leading up to the homicide incident. In about 40% of the incidents, the circumstances that led up to the incident were “arguments”. In four of the homicide incidents a “lover’s quarrel” was reported as the factor that led up to the incident. Finally, one “drug dealing” homicide was reported. Homicide Arrestees In 2009, 18 persons were arrested for a homicide offense, unchanged when compared to 2008 for a total of 36 persons arrested for homicide.
By gender and race, the persons arrested for homicide over the two year period was relatively unchanged. Combined over the two year period, 86% of the persons arrested reported as White; 14% were reported as American Indian. Two arrestees were
reported as having Hispanic ethnicity.
The average age of the homicide arrestees was 32 and the median was age 29. The youngest person arrested for homicide was age 11 and the oldest was age 67; the age range was 56 years. The homicide arrestee age chart to the left shows the frequency distribution of the homicide
arrestees by age. Half of the persons arrested were between the ages 20 to 35. Five of the thirty-six persons arrested for homicide (14%) were age 11 to 19. Negligent and Justifiable Homicide The MTIBRS program operates under a narrow definition of homicide as recommended by the FBI’s UCR/NIBRS program. However, data on negligent homicide and justifiable homicide was also reported to the MBCC.
Homicide Arrestees 2008 2009 Total % of Total
Female 3 3 6 17%
American Indian 1 1 2 6%White 2 2 4 11%
Male 15 15 30 83%
American Indian 1 2 3 8%White 14 13 27 75%
Grand Total 18 18 36 100%
42
In 2009, seven persons were the victims of negligent homicide, down from 12 in 2008. Additionally, five persons were the victims of vehicular homicide as reported by Montana’s non-Tribal local law enforcement agencies. This may be an undercount because the Montana
Highway Patrol does not report traffic accidents to the MBCC. Finally, one justifiable homicide was reported by Glasgow Police Department during the course of a “sniper-like” homicide incident. RAPE
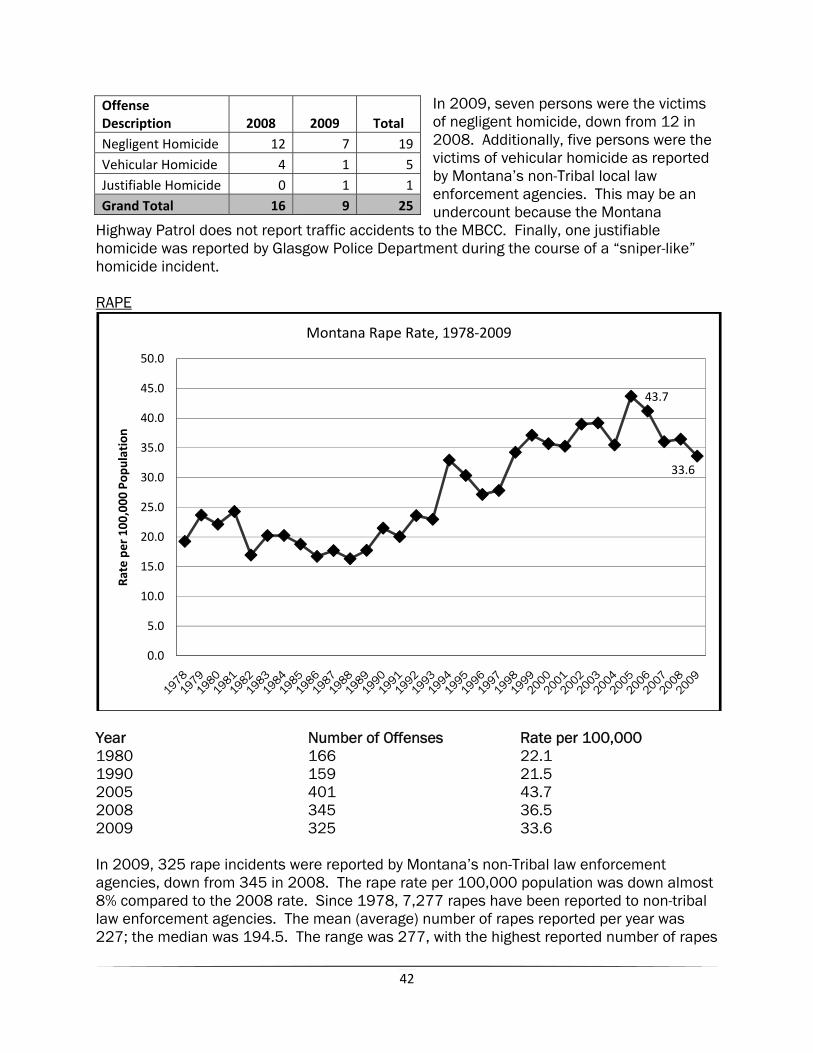
Year Number of Offenses Rate per 100,000 1980 166 22.1 1990 159 21.5 2005 401 43.7 2008 345 36.5 2009 325 33.6 In 2009, 325 rape incidents were reported by Montana’s non-Tribal law enforcement agencies, down from 345 in 2008. The rape rate per 100,000 population was down almost 8% compared to the 2008 rate. Since 1978, 7,277 rapes have been reported to non-tribal law enforcement agencies. The mean (average) number of rapes reported per year was 227; the median was 194.5. The range was 277, with the highest reported number of rapes
43.7
33.6
0.0
5.0
10.0
15.0
20.0
25.0
30.0
35.0
40.0
45.0
50.0
Rate per 100
,000
Pop
ulation
Montana Rape Rate, 1978‐2009
Offense Description 2008 2009 Total Negligent Homicide 12 7 19Vehicular Homicide 4 1 5Justifiable Homicide 0 1 1Grand Total 16 9 25
43
at 401 and the minimum was 124. Since 1978, the rape rate tended to trend upward, reaching its peak in 2005, at about 43.7 rapes per 100,000 population. However, since 2005, the rape rate has trended downward to its current level. Since 2005, the rape rate was down about 23%. Rape 2008 2009 Total Incidents 345 325 670 Victims 359 347 706 Arrests 47 46 93 Multiple victims may be victimized during one rape incident. In 2009, 347 persons were reported as victims of rape, slightly down from 359 in 2008. Over the two year period, law enforcement reported 706 victims of rape over 661 incidents. Of those incidents, 93 persons were arrested for rape, 47 in 2008 and 46 in 2009. In addition, in 2008 and 2009, 30 rape incidents were “cleared exceptionally” because the prosecution was declined (10) or the victims refused to cooperate (20). The total clearance rate for rape incidents, including arrests and exceptional clearance for 2008 and 2009 was about 18%.
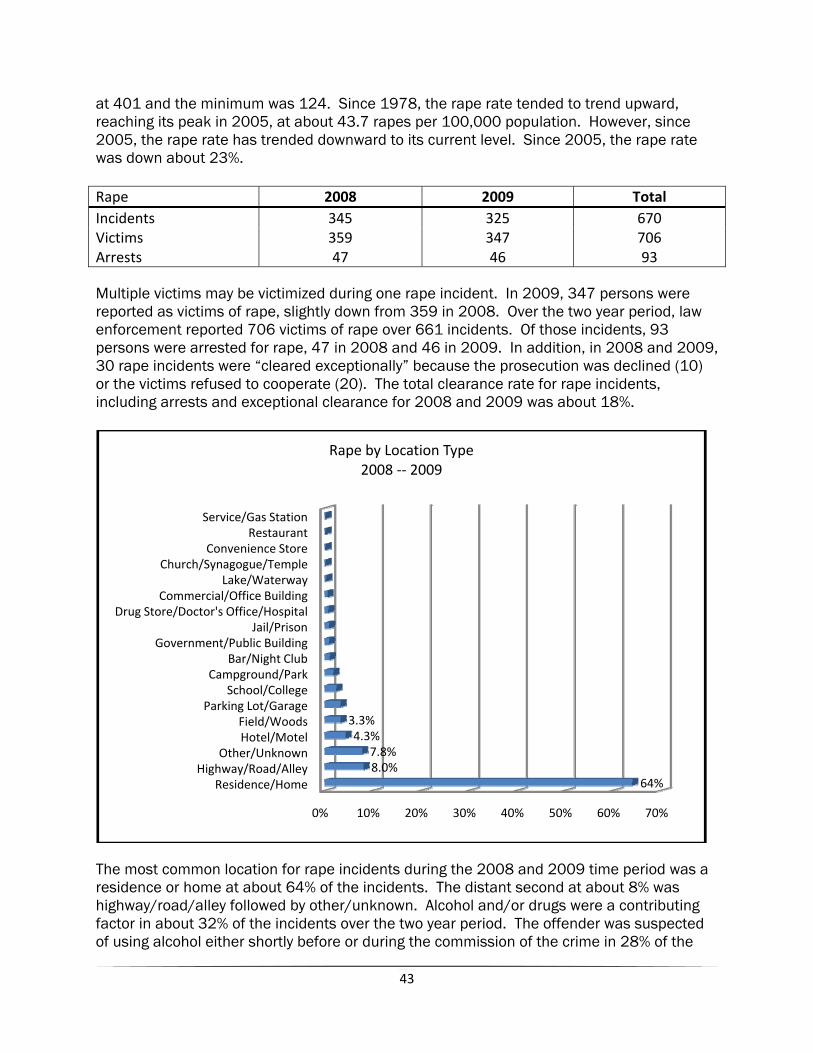
The most common location for rape incidents during the 2008 and 2009 time period was a residence or home at about 64% of the incidents. The distant second at about 8% was highway/road/alley followed by other/unknown. Alcohol and/or drugs were a contributing factor in about 32% of the incidents over the two year period. The offender was suspected of using alcohol either shortly before or during the commission of the crime in 28% of the
0% 10% 20% 30% 40% 50% 60% 70%
Residence/HomeHighway/Road/Alley
Other/UnknownHotel/MotelField/Woods
Parking Lot/GarageSchool/College
Campground/ParkBar/Night Club
Government/Public BuildingJail/Prison
Drug Store/Doctor's Office/HospitalCommercial/Office Building
Lake/WaterwayChurch/Synagogue/Temple
Convenience StoreRestaurant
Service/Gas Station
64%8.0%7.8%
4.3%3.3%
Rape by Location Type2008 ‐‐ 2009
44
incidents; the offender was suspected of using drugs in 3% of the reported incidents; and the offender was suspected of using both drugs and alcohol in 1% of the incidents.
Over the two year period, personal weapons (i.e., hands and feet) were reported as the type of force/weapon type most commonly reported during the commission of rape incidents. A firearm was used in less than 1% of the rape incidents.
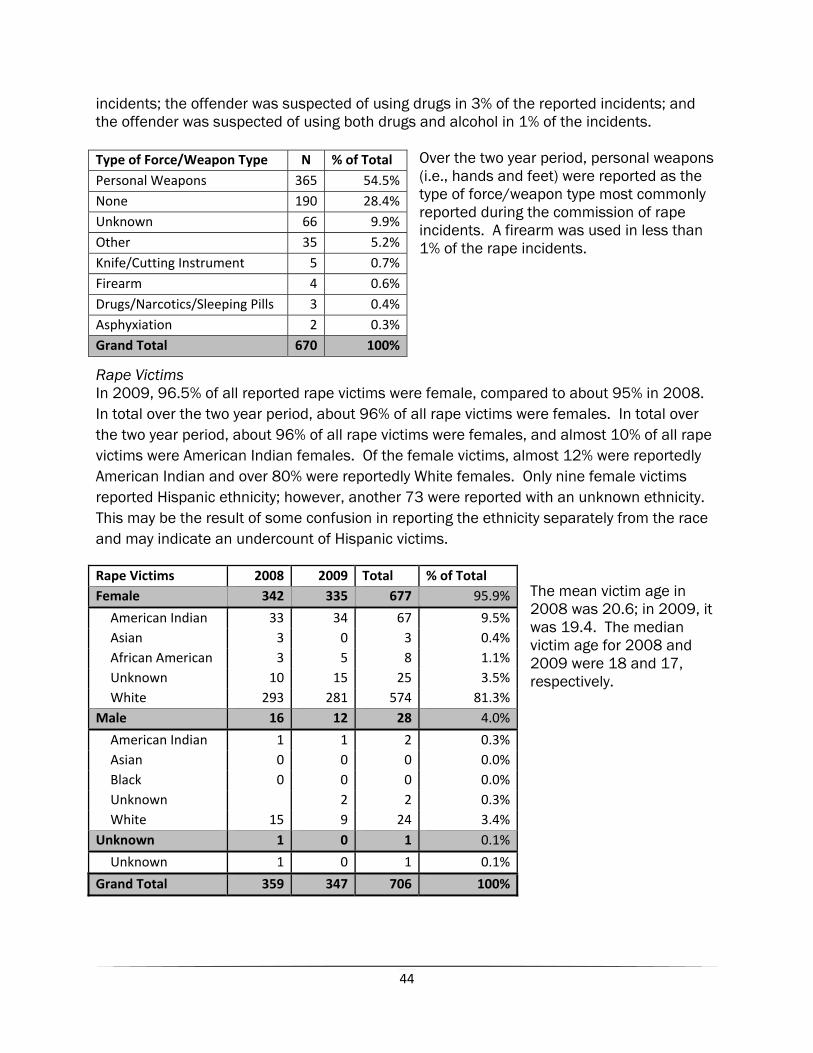
Rape Victims In 2009, 96.5% of all reported rape victims were female, compared to about 95% in 2008. In total over the two year period, about 96% of all rape victims were females. In total over the two year period, about 96% of all rape victims were females, and almost 10% of all rape victims were American Indian females. Of the female victims, almost 12% were reportedly American Indian and over 80% were reportedly White females. Only nine female victims reported Hispanic ethnicity; however, another 73 were reported with an unknown ethnicity. This may be the result of some confusion in reporting the ethnicity separately from the race and may indicate an undercount of Hispanic victims.
The mean victim age in 2008 was 20.6; in 2009, it was 19.4. The median victim age for 2008 and 2009 were 18 and 17, respectively.
Type of Force/Weapon Type N % of Total Personal Weapons 365 54.5%None 190 28.4%Unknown 66 9.9%Other 35 5.2%Knife/Cutting Instrument 5 0.7%Firearm 4 0.6%Drugs/Narcotics/Sleeping Pills 3 0.4%Asphyxiation 2 0.3%Grand Total 670 100%
Rape Victims 2008 2009 Total % of Total Female 342 335 677 95.9%
American Indian 33 34 67 9.5%Asian 3 0 3 0.4%African American 3 5 8 1.1%Unknown 10 15 25 3.5%White 293 281 574 81.3%
Male 16 12 28 4.0%
American Indian 1 1 2 0.3%Asian 0 0 0 0.0%Black 0 0 0 0.0%Unknown 2 2 0.3%White 15 9 24 3.4%
Unknown 1 0 1 0.1%
Unknown 1 0 1 0.1%
Grand Total 359 347 706 100%
45
0 50 100 150 200
Unknown
10 or less
11 to 17
18 to 25
26 to 35
36 to 45
46+
Rape Victims by Age: 2008 ‐‐ 2009
2008
2009
Known Outside Family52%
Multiple Offenders
12%
Not Reported
4%
Relationship Unknown
12%
Stanger5%
Within Family15%
Relationship Victim to Offender: 2009 Rape Victims
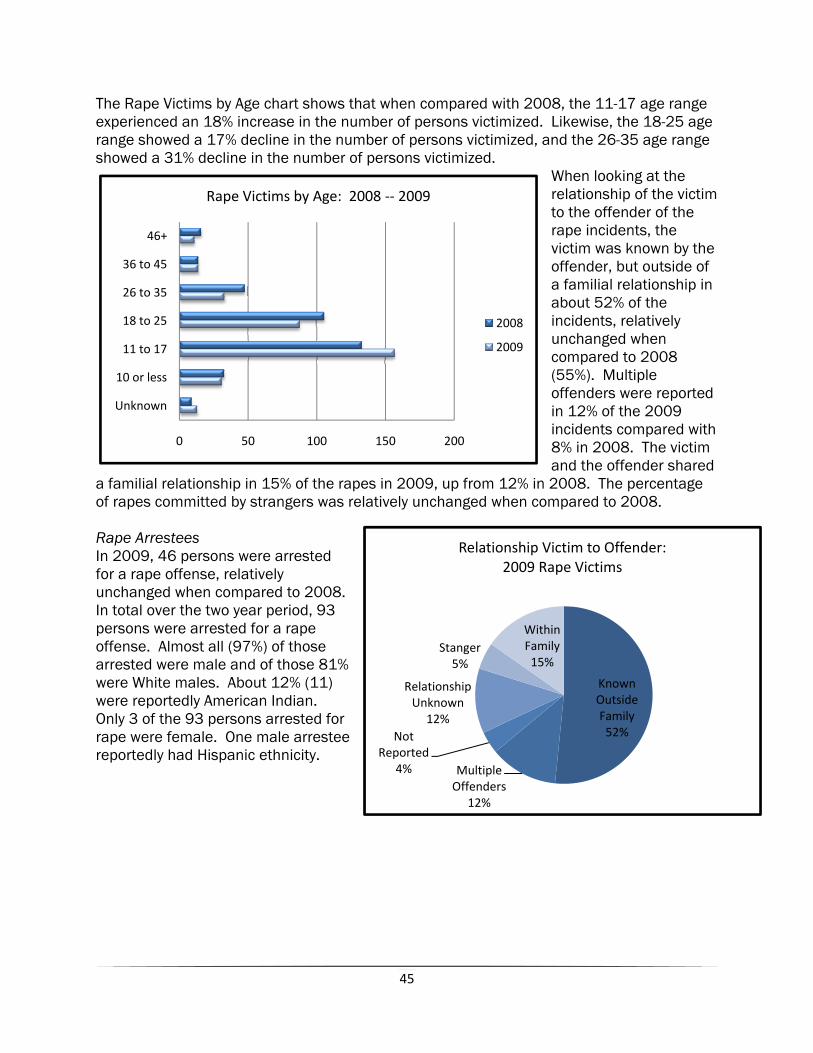
The Rape Victims by Age chart shows that when compared with 2008, the 11-17 age range experienced an 18% increase in the number of persons victimized. Likewise, the 18-25 age range showed a 17% decline in the number of persons victimized, and the 26-35 age range showed a 31% decline in the number of persons victimized.
When looking at the relationship of the victim to the offender of the rape incidents, the victim was known by the offender, but outside of a familial relationship in about 52% of the incidents, relatively unchanged when compared to 2008 (55%). Multiple offenders were reported in 12% of the 2009 incidents compared with 8% in 2008. The victim and the offender shared
a familial relationship in 15% of the rapes in 2009, up from 12% in 2008. The percentage of rapes committed by strangers was relatively unchanged when compared to 2008. Rape Arrestees In 2009, 46 persons were arrested for a rape offense, relatively unchanged when compared to 2008. In total over the two year period, 93 persons were arrested for a rape offense. Almost all (97%) of those arrested were male and of those 81% were White males. About 12% (11) were reportedly American Indian. Only 3 of the 93 persons arrested for rape were female. One male arrestee reportedly had Hispanic ethnicity.
46
5
12
18
4
8
6
14
12
3
11
0
2
4
6
8
10
12
14
16
18
20
10 to 17 18 to 25 26 to 35 36 to 45 46+
Age
Persons Arrested for Rape by Age2008 ‐‐ 2009
2008
2009
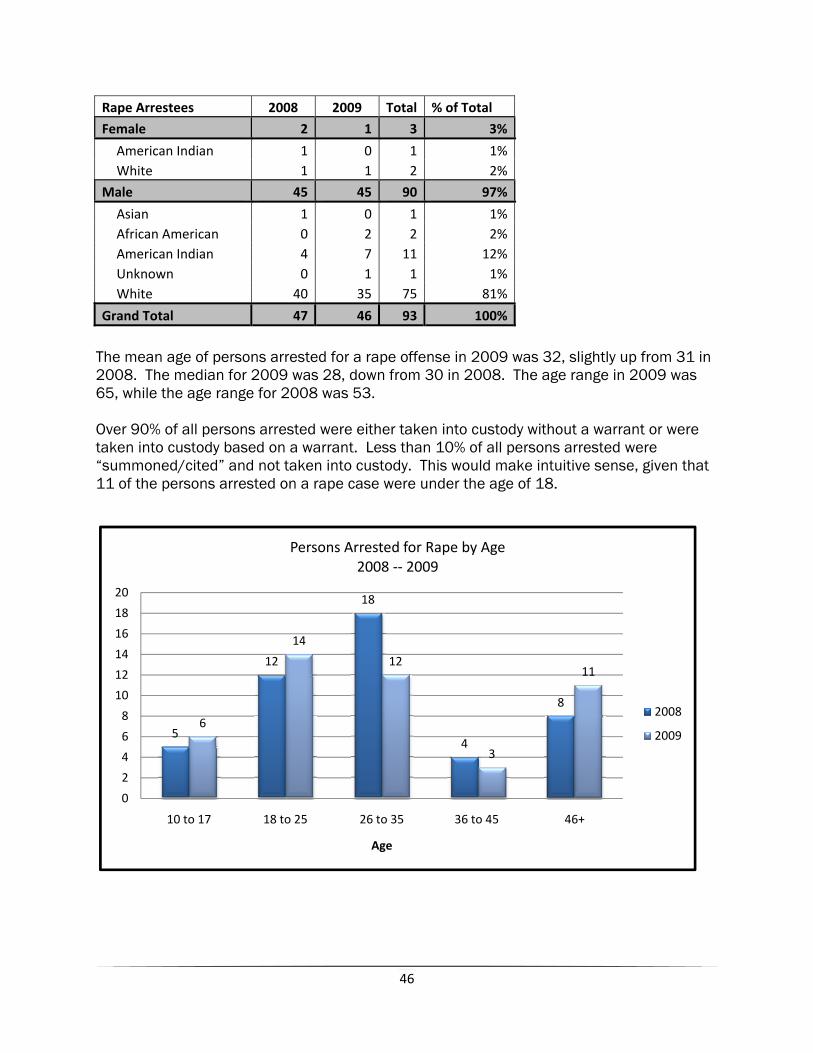
The mean age of persons arrested for a rape offense in 2009 was 32, slightly up from 31 in 2008. The median for 2009 was 28, down from 30 in 2008. The age range in 2009 was 65, while the age range for 2008 was 53. Over 90% of all persons arrested were either taken into custody without a warrant or were taken into custody based on a warrant. Less than 10% of all persons arrested were “summoned/cited” and not taken into custody. This would make intuitive sense, given that 11 of the persons arrested on a rape case were under the age of 18.
Rape Arrestees 2008 2009 Total % of Total
Female 2 1 3 3%
American Indian 1 0 1 1%White 1 1 2 2%
Male 45 45 90 97%
Asian 1 0 1 1%African American 0 2 2 2%American Indian 4 7 11 12%Unknown 0 1 1 1%White 40 35 75 81%
Grand Total 47 46 93 100%
47
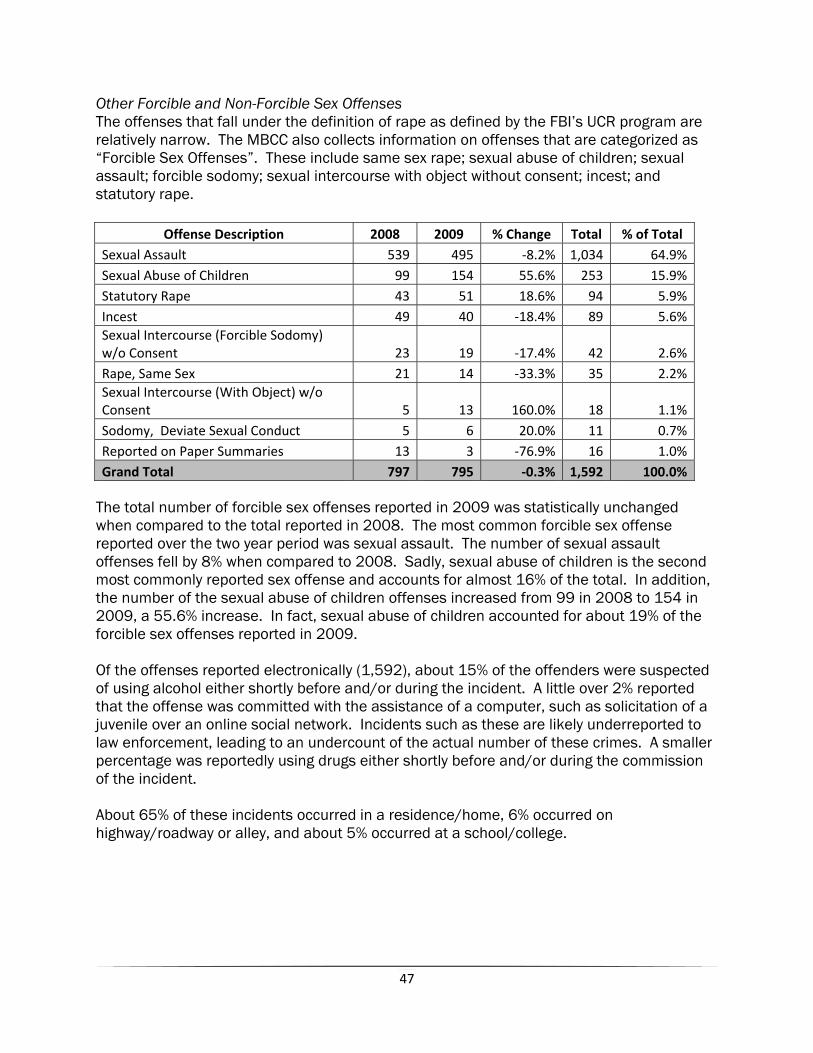
Other Forcible and Non-Forcible Sex Offenses The offenses that fall under the definition of rape as defined by the FBI’s UCR program are relatively narrow. The MBCC also collects information on offenses that are categorized as “Forcible Sex Offenses”. These include same sex rape; sexual abuse of children; sexual assault; forcible sodomy; sexual intercourse with object without consent; incest; and statutory rape.
Offense Description 2008 2009 % Change Total % of Total Sexual Assault 539 495 ‐8.2% 1,034 64.9%Sexual Abuse of Children 99 154 55.6% 253 15.9%Statutory Rape 43 51 18.6% 94 5.9%Incest 49 40 ‐18.4% 89 5.6%Sexual Intercourse (Forcible Sodomy) w/o Consent 23 19 ‐17.4% 42 2.6%Rape, Same Sex 21 14 ‐33.3% 35 2.2%Sexual Intercourse (With Object) w/o Consent 5 13 160.0% 18 1.1%Sodomy, Deviate Sexual Conduct 5 6 20.0% 11 0.7%Reported on Paper Summaries 13 3 ‐76.9% 16 1.0%Grand Total 797 795 ‐0.3% 1,592 100.0%
The total number of forcible sex offenses reported in 2009 was statistically unchanged when compared to the total reported in 2008. The most common forcible sex offense reported over the two year period was sexual assault. The number of sexual assault offenses fell by 8% when compared to 2008. Sadly, sexual abuse of children is the second most commonly reported sex offense and accounts for almost 16% of the total. In addition, the number of the sexual abuse of children offenses increased from 99 in 2008 to 154 in 2009, a 55.6% increase. In fact, sexual abuse of children accounted for about 19% of the forcible sex offenses reported in 2009. Of the offenses reported electronically (1,592), about 15% of the offenders were suspected of using alcohol either shortly before and/or during the incident. A little over 2% reported that the offense was committed with the assistance of a computer, such as solicitation of a juvenile over an online social network. Incidents such as these are likely underreported to law enforcement, leading to an undercount of the actual number of these crimes. A smaller percentage was reportedly using drugs either shortly before and/or during the commission of the incident. About 65% of these incidents occurred in a residence/home, 6% occurred on highway/roadway or alley, and about 5% occurred at a school/college.
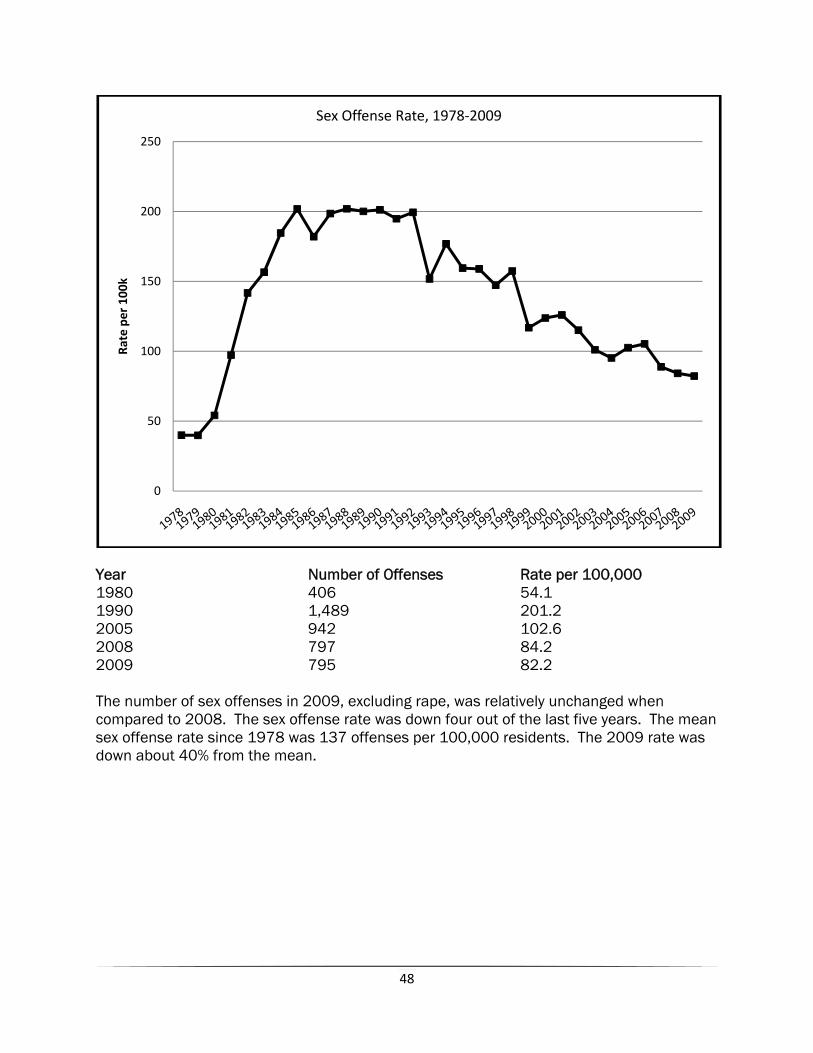
48
Year Number of Offenses Rate per 100,000 1980 406 54.1 1990 1,489 201.2 2005 942 102.6 2008 797 84.2 2009 795 82.2 The number of sex offenses in 2009, excluding rape, was relatively unchanged when compared to 2008. The sex offense rate was down four out of the last five years. The mean sex offense rate since 1978 was 137 offenses per 100,000 residents. The 2009 rate was down about 40% from the mean.
0
50
100
150
200
250Ra
te per 100
kSex Offense Rate, 1978‐2009
49
ROBBERY
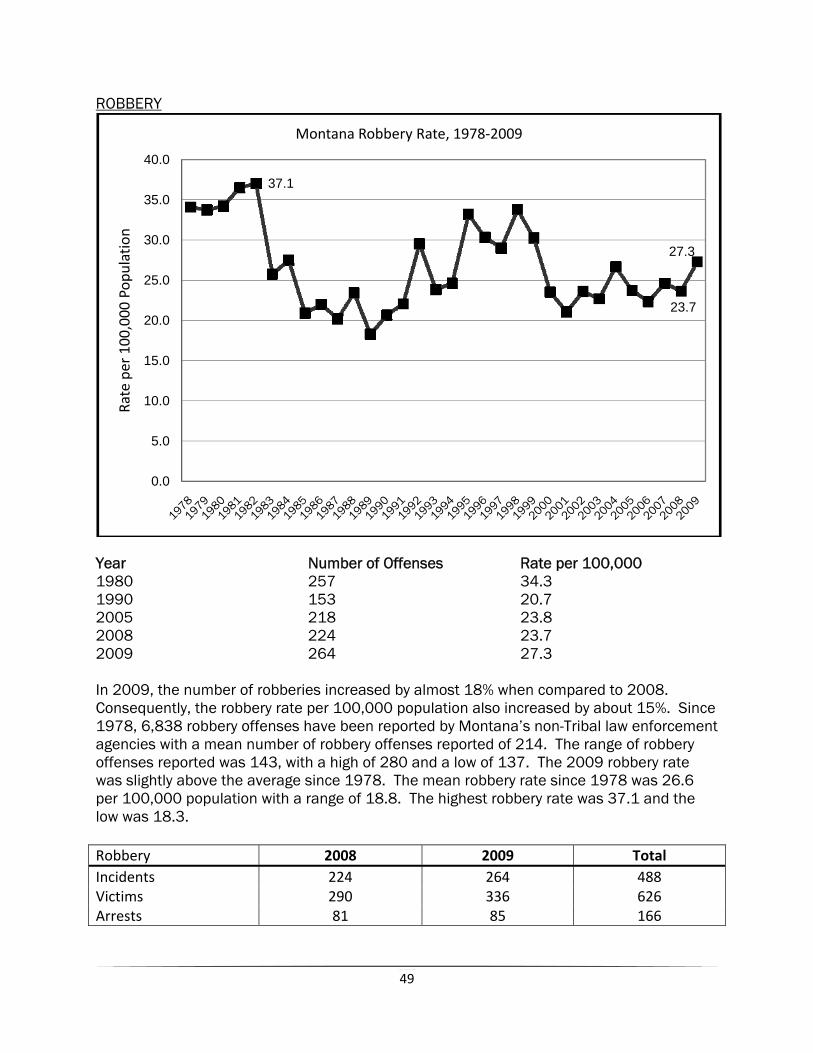
Year Number of Offenses Rate per 100,000 1980 257 34.3 1990 153 20.7 2005 218 23.8 2008 224 23.7 2009 264 27.3 In 2009, the number of robberies increased by almost 18% when compared to 2008. Consequently, the robbery rate per 100,000 population also increased by about 15%. Since 1978, 6,838 robbery offenses have been reported by Montana’s non-Tribal law enforcement agencies with a mean number of robbery offenses reported of 214. The range of robbery offenses reported was 143, with a high of 280 and a low of 137. The 2009 robbery rate was slightly above the average since 1978. The mean robbery rate since 1978 was 26.6 per 100,000 population with a range of 18.8. The highest robbery rate was 37.1 and the low was 18.3. Robbery 2008 2009 Total Incidents 224 264 488 Victims 290 336 626 Arrests 81 85 166
37.1
23.7
27.3
0.0
5.0
10.0
15.0
20.0
25.0
30.0
35.0
40.0
Rate per 100,000
Pop
ulation
Montana Robbery Rate, 1978‐2009
50
Firearm21%
Knife10%
Personal Weapons
40%
All Other25%
None Reported
4%
Robbery by Weapon Type2008‐‐2009
01020304050607080
Robbery by Location Type2008‐‐2009
2008
2009
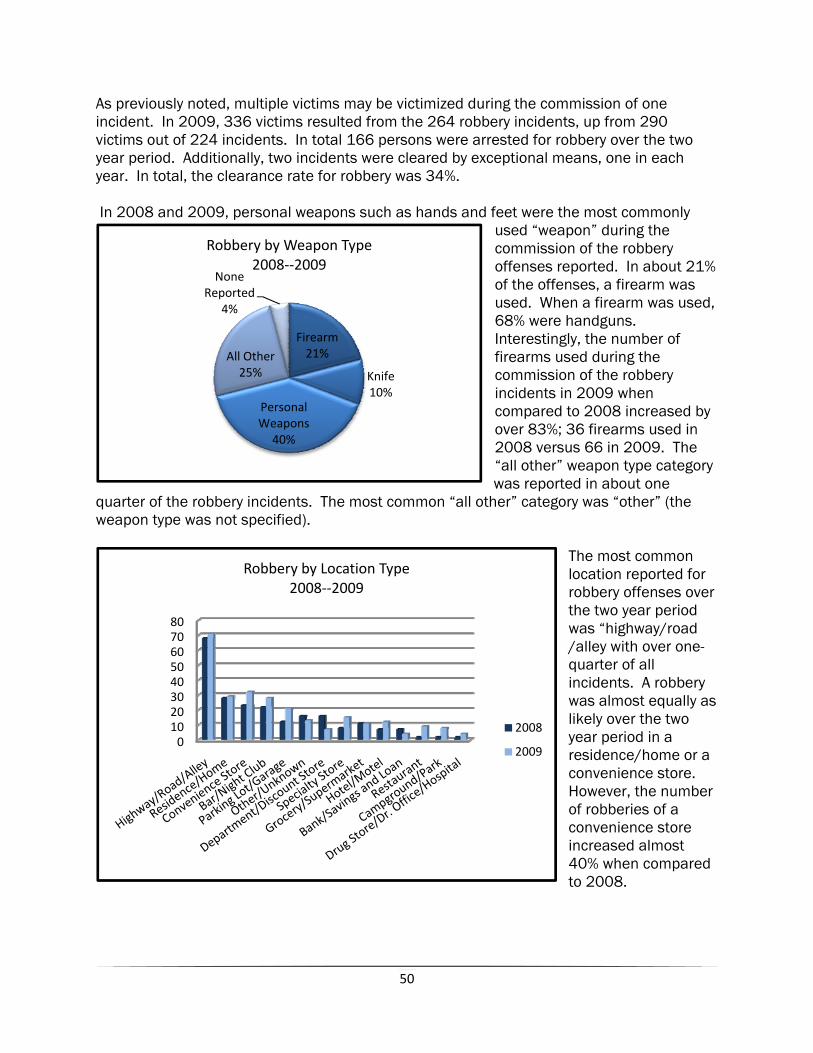
As previously noted, multiple victims may be victimized during the commission of one incident. In 2009, 336 victims resulted from the 264 robbery incidents, up from 290 victims out of 224 incidents. In total 166 persons were arrested for robbery over the two year period. Additionally, two incidents were cleared by exceptional means, one in each year. In total, the clearance rate for robbery was 34%. In 2008 and 2009, personal weapons such as hands and feet were the most commonly
used “weapon” during the commission of the robbery offenses reported. In about 21% of the offenses, a firearm was used. When a firearm was used, 68% were handguns. Interestingly, the number of firearms used during the commission of the robbery incidents in 2009 when compared to 2008 increased by over 83%; 36 firearms used in 2008 versus 66 in 2009. The “all other” weapon type category was reported in about one
quarter of the robbery incidents. The most common “all other” category was “other” (the weapon type was not specified).
The most common location reported for robbery offenses over the two year period was “highway/road /alley with over one-quarter of all incidents. A robbery was almost equally as likely over the two year period in a residence/home or a convenience store. However, the number of robberies of a convenience store increased almost 40% when compared to 2008.
51
0 10 20 30 40 50 60 70
Unknown
10 to 17
18 to 25
26 to 35
36 to 45
46+
Robbery Victim by Age2008‐‐2009
2009
2008
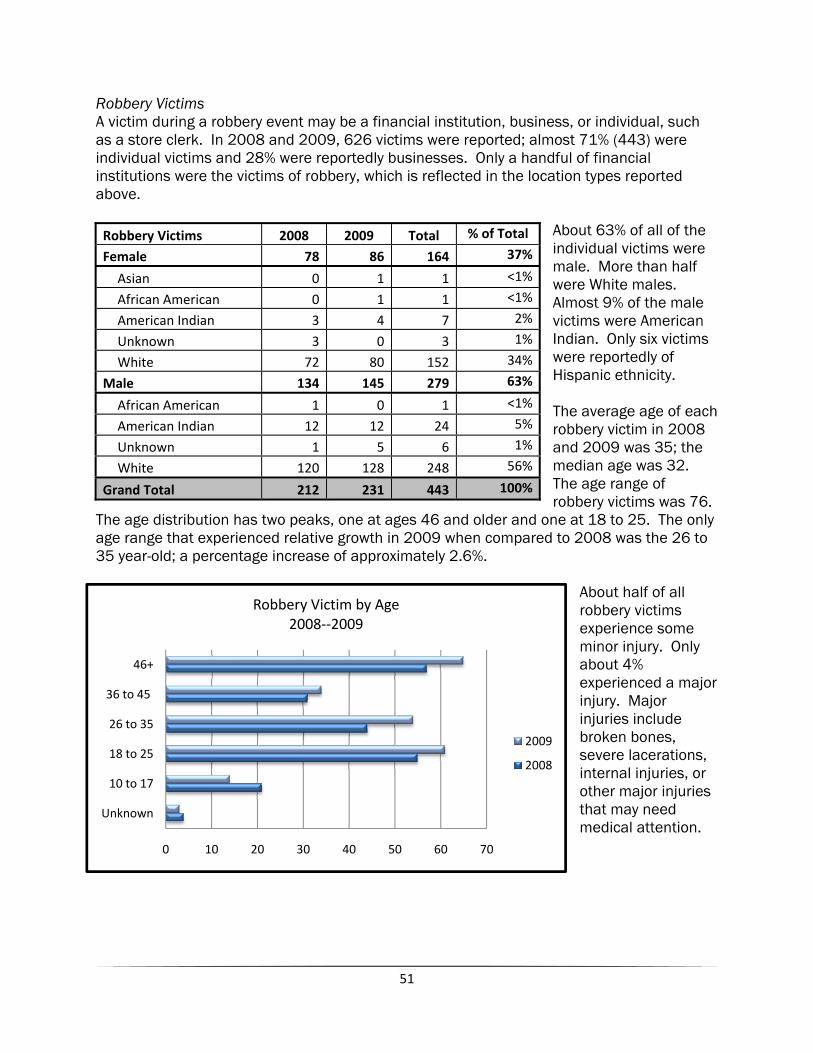
Robbery Victims A victim during a robbery event may be a financial institution, business, or individual, such as a store clerk. In 2008 and 2009, 626 victims were reported; almost 71% (443) were individual victims and 28% were reportedly businesses. Only a handful of financial institutions were the victims of robbery, which is reflected in the location types reported above.
About 63% of all of the individual victims were male. More than half were White males. Almost 9% of the male victims were American Indian. Only six victims were reportedly of Hispanic ethnicity. The average age of each robbery victim in 2008 and 2009 was 35; the median age was 32. The age range of robbery victims was 76.
The age distribution has two peaks, one at ages 46 and older and one at 18 to 25. The only age range that experienced relative growth in 2009 when compared to 2008 was the 26 to 35 year-old; a percentage increase of approximately 2.6%.
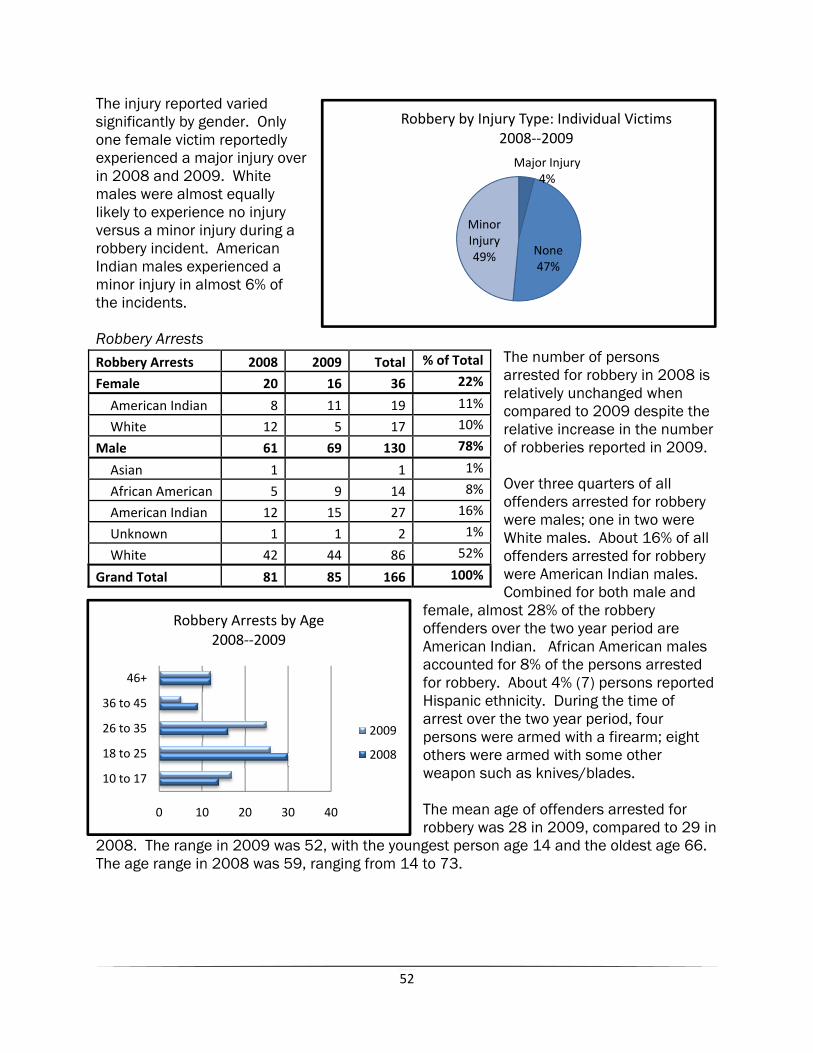
About half of all robbery victims experience some minor injury. Only about 4% experienced a major injury. Major injuries include broken bones, severe lacerations, internal injuries, or other major injuries that may need medical attention.
Robbery Victims 2008 2009 Total % of Total
Female 78 86 164 37%
Asian 0 1 1 <1%
African American 0 1 1 <1%
American Indian 3 4 7 2%
Unknown 3 0 3 1%
White 72 80 152 34%
Male 134 145 279 63%
African American 1 0 1 <1%
American Indian 12 12 24 5%
Unknown 1 5 6 1%
White 120 128 248 56%
Grand Total 212 231 443 100%
52
Major Injury4%
None47%
Minor Injury49%
Robbery by Injury Type: Individual Victims2008‐‐2009
0 10 20 30 40
10 to 17
18 to 25
26 to 35
36 to 45
46+
Robbery Arrests by Age2008‐‐2009
2009
2008
The injury reported varied significantly by gender. Only one female victim reportedly experienced a major injury over in 2008 and 2009. White males were almost equally likely to experience no injury versus a minor injury during a robbery incident. American Indian males experienced a minor injury in almost 6% of the incidents. Robbery Arrests
The number of persons arrested for robbery in 2008 is relatively unchanged when compared to 2009 despite the relative increase in the number of robberies reported in 2009. Over three quarters of all offenders arrested for robbery were males; one in two were White males. About 16% of all offenders arrested for robbery were American Indian males. Combined for both male and
female, almost 28% of the robbery offenders over the two year period are American Indian. African American males accounted for 8% of the persons arrested for robbery. About 4% (7) persons reported Hispanic ethnicity. During the time of arrest over the two year period, four persons were armed with a firearm; eight others were armed with some other weapon such as knives/blades. The mean age of offenders arrested for robbery was 28 in 2009, compared to 29 in
2008. The range in 2009 was 52, with the youngest person age 14 and the oldest age 66. The age range in 2008 was 59, ranging from 14 to 73.
Robbery Arrests 2008 2009 Total % of Total
Female 20 16 36 22%
American Indian 8 11 19 11%
White 12 5 17 10%
Male 61 69 130 78%
Asian 1 1 1%
African American 5 9 14 8%
American Indian 12 15 27 16%
Unknown 1 1 2 1%
White 42 44 86 52%
Grand Total 81 85 166 100%
53
AGGRAVATED ASSAULT
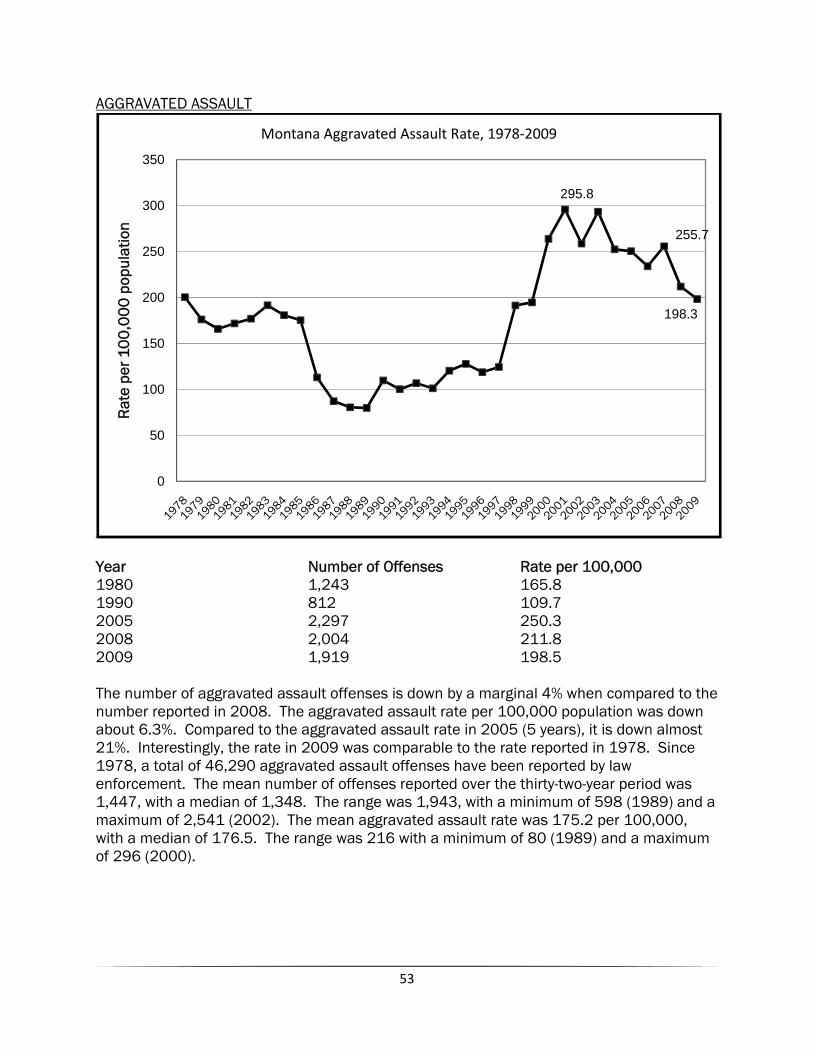
Year Number of Offenses Rate per 100,000 1980 1,243 165.8 1990 812 109.7 2005 2,297 250.3 2008 2,004 211.8 2009 1,919 198.5 The number of aggravated assault offenses is down by a marginal 4% when compared to the number reported in 2008. The aggravated assault rate per 100,000 population was down about 6.3%. Compared to the aggravated assault rate in 2005 (5 years), it is down almost 21%. Interestingly, the rate in 2009 was comparable to the rate reported in 1978. Since 1978, a total of 46,290 aggravated assault offenses have been reported by law enforcement. The mean number of offenses reported over the thirty-two-year period was 1,447, with a median of 1,348. The range was 1,943, with a minimum of 598 (1989) and a maximum of 2,541 (2002). The mean aggravated assault rate was 175.2 per 100,000, with a median of 176.5. The range was 216 with a minimum of 80 (1989) and a maximum of 296 (2000).
295.8
255.7
198.3
0
50
100
150
200
250
300
350
Rat
e pe
r 10
0,0
00
pop
ulat
ion
Montana Aggravated Assault Rate, 1978‐2009
54
37%
13%13%
9%
9%
8%
6%
3%
1%1%
Aggravated Assault by Weapon Type2008‐‐2009 Title
Personal Weapons
Knife/Cutting Instrument
Firearms
Other Weapon
Blunt Object
Motor Vehicle
None
Unknown
All Other
Reported on paper summaries
Aggravated Assault 2008 2009 Total Offenses 2,004 1,919 3,923 Victims 2,131 2,062 4,193 Arrests 982 981 1,963 In 2009, 1,919 offenses resulted in 2,062 victims of aggravated assault, compared with 2,004 offenses and 2,131 victims in 2008. The number of arrests year-to-year was relatively unchanged; this was true for homicide, rape, robbery, and aggravated assault. Additionally, another 43 offenses were cleared by exceptional means, 16 in 2008 and 27 in 2009. The prosecution was declined and the victim refused to cooperate were the most common exceptional clearances reported with 43% of the total each. Death of the offender and juvenile/no custody were also exceptional clearance reported. Combining the arrests with the exceptional clearances, the clearance rate for aggravated assault over the two-year period was 51%. The clearance rate in 2009 was 52.5%, while 2008’s clearance rate was 50%.
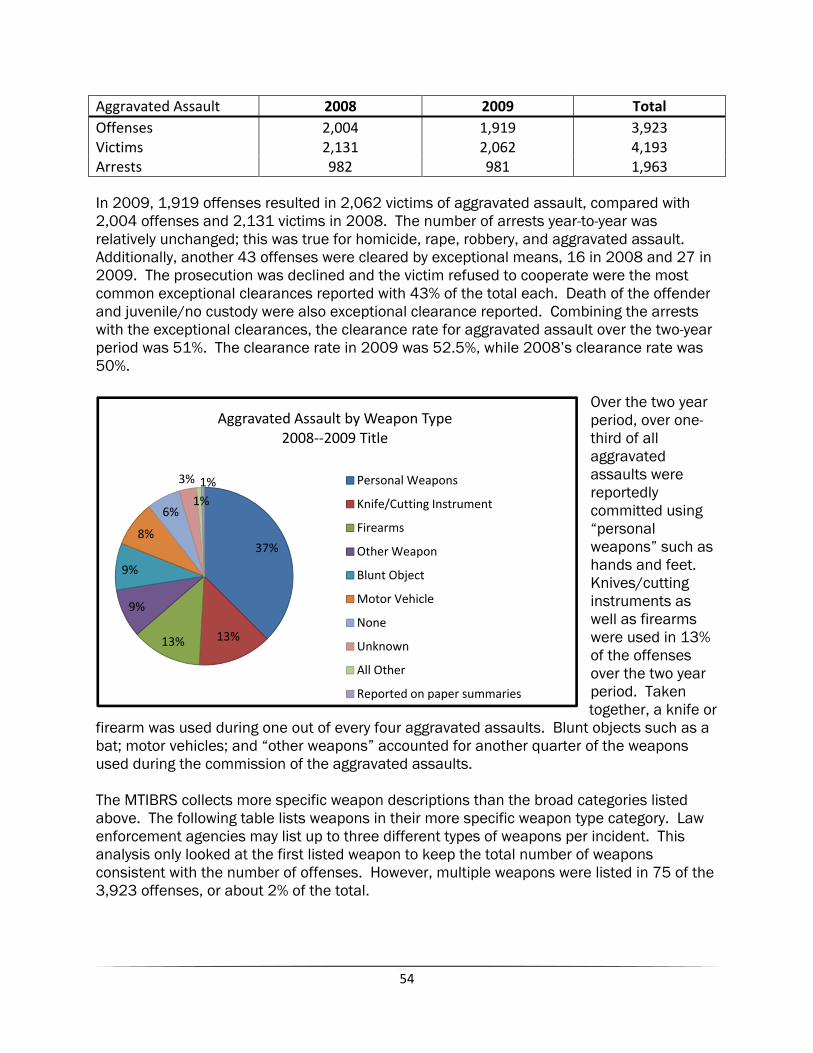
Over the two year period, over one-third of all aggravated assaults were reportedly committed using “personal weapons” such as hands and feet. Knives/cutting instruments as well as firearms were used in 13% of the offenses over the two year period. Taken together, a knife or
firearm was used during one out of every four aggravated assaults. Blunt objects such as a bat; motor vehicles; and “other weapons” accounted for another quarter of the weapons used during the commission of the aggravated assaults. The MTIBRS collects more specific weapon descriptions than the broad categories listed above. The following table lists weapons in their more specific weapon type category. Law enforcement agencies may list up to three different types of weapons per incident. This analysis only looked at the first listed weapon to keep the total number of weapons consistent with the number of offenses. However, multiple weapons were listed in 75 of the 3,923 offenses, or about 2% of the total.
55
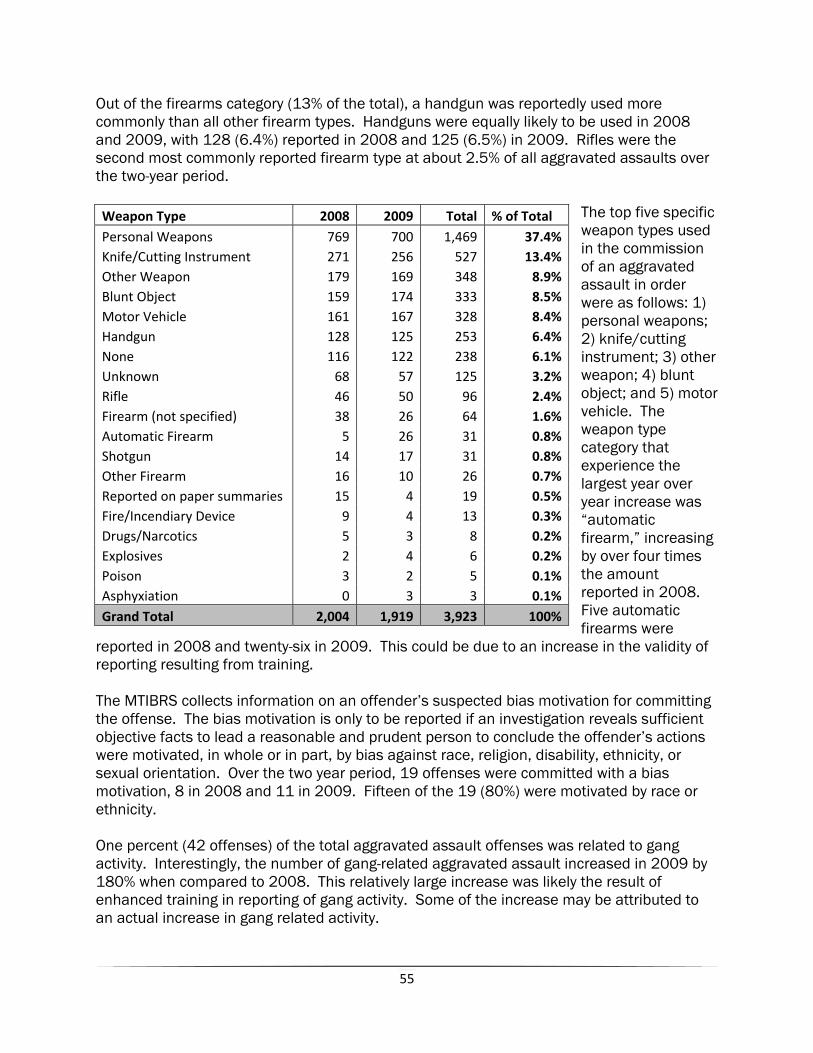
Out of the firearms category (13% of the total), a handgun was reportedly used more commonly than all other firearm types. Handguns were equally likely to be used in 2008 and 2009, with 128 (6.4%) reported in 2008 and 125 (6.5%) in 2009. Rifles were the second most commonly reported firearm type at about 2.5% of all aggravated assaults over the two-year period.
The top five specific weapon types used in the commission of an aggravated assault in order were as follows: 1) personal weapons; 2) knife/cutting instrument; 3) other weapon; 4) blunt object; and 5) motor vehicle. The weapon type category that experience the largest year over year increase was “automatic firearm,” increasing by over four times the amount reported in 2008. Five automatic firearms were
reported in 2008 and twenty-six in 2009. This could be due to an increase in the validity of reporting resulting from training. The MTIBRS collects information on an offender’s suspected bias motivation for committing the offense. The bias motivation is only to be reported if an investigation reveals sufficient objective facts to lead a reasonable and prudent person to conclude the offender’s actions were motivated, in whole or in part, by bias against race, religion, disability, ethnicity, or sexual orientation. Over the two year period, 19 offenses were committed with a bias motivation, 8 in 2008 and 11 in 2009. Fifteen of the 19 (80%) were motivated by race or ethnicity. One percent (42 offenses) of the total aggravated assault offenses was related to gang activity. Interestingly, the number of gang-related aggravated assault increased in 2009 by 180% when compared to 2008. This relatively large increase was likely the result of enhanced training in reporting of gang activity. Some of the increase may be attributed to an actual increase in gang related activity.
Weapon Type 2008 2009 Total % of Total Personal Weapons 769 700 1,469 37.4%Knife/Cutting Instrument 271 256 527 13.4%Other Weapon 179 169 348 8.9%Blunt Object 159 174 333 8.5%Motor Vehicle 161 167 328 8.4%Handgun 128 125 253 6.4%None 116 122 238 6.1%Unknown 68 57 125 3.2%Rifle 46 50 96 2.4%Firearm (not specified) 38 26 64 1.6%Automatic Firearm 5 26 31 0.8%Shotgun 14 17 31 0.8%Other Firearm 16 10 26 0.7%Reported on paper summaries 15 4 19 0.5%Fire/Incendiary Device 9 4 13 0.3%Drugs/Narcotics 5 3 8 0.2%Explosives 2 4 6 0.2%Poison 3 2 5 0.1%Asphyxiation 0 3 3 0.1%Grand Total 2,004 1,919 3,923 100%
56
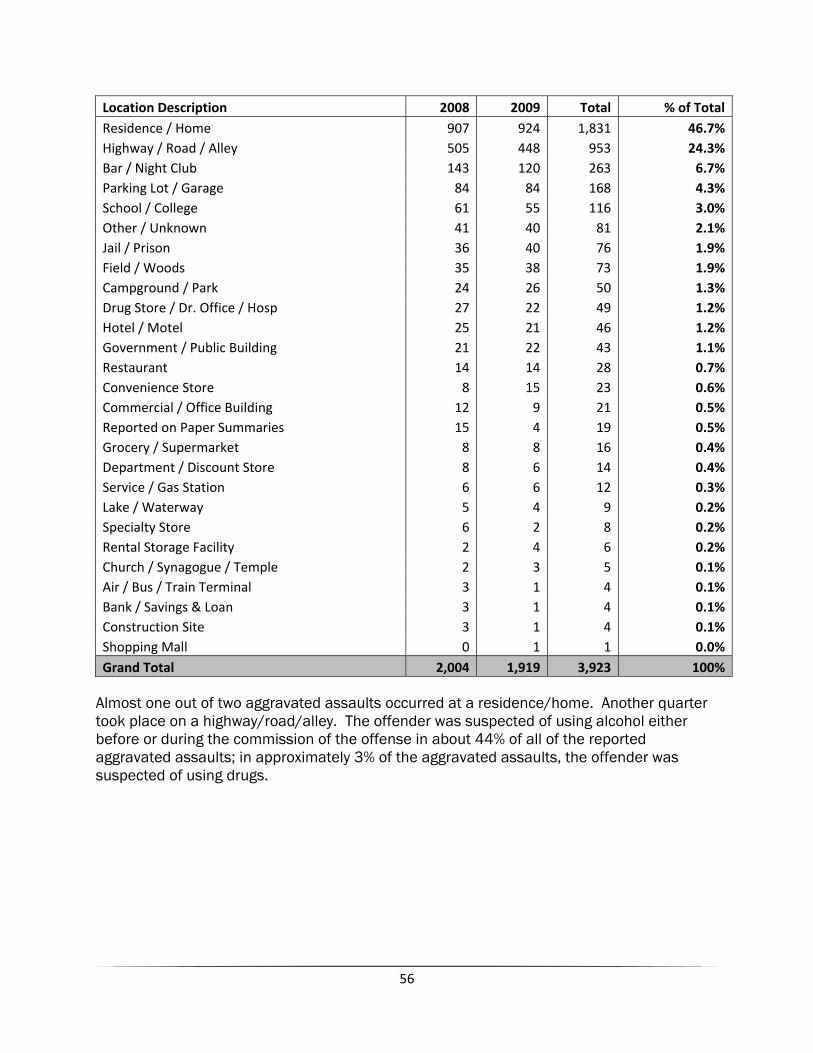
Almost one out of two aggravated assaults occurred at a residence/home. Another quarter took place on a highway/road/alley. The offender was suspected of using alcohol either before or during the commission of the offense in about 44% of all of the reported aggravated assaults; in approximately 3% of the aggravated assaults, the offender was suspected of using drugs.
Location Description 2008 2009 Total % of TotalResidence / Home 907 924 1,831 46.7%Highway / Road / Alley 505 448 953 24.3%Bar / Night Club 143 120 263 6.7%Parking Lot / Garage 84 84 168 4.3%School / College 61 55 116 3.0%Other / Unknown 41 40 81 2.1%Jail / Prison 36 40 76 1.9%Field / Woods 35 38 73 1.9%Campground / Park 24 26 50 1.3%Drug Store / Dr. Office / Hosp 27 22 49 1.2%Hotel / Motel 25 21 46 1.2%Government / Public Building 21 22 43 1.1%Restaurant 14 14 28 0.7%Convenience Store 8 15 23 0.6%Commercial / Office Building 12 9 21 0.5%Reported on Paper Summaries 15 4 19 0.5%Grocery / Supermarket 8 8 16 0.4%Department / Discount Store 8 6 14 0.4%Service / Gas Station 6 6 12 0.3%Lake / Waterway 5 4 9 0.2%Specialty Store 6 2 8 0.2%Rental Storage Facility 2 4 6 0.2%Church / Synagogue / Temple 2 3 5 0.1%Air / Bus / Train Terminal 3 1 4 0.1%Bank / Savings & Loan 3 1 4 0.1%Construction Site 3 1 4 0.1%Shopping Mall 0 1 1 0.0%Grand Total 2,004 1,919 3,923 100%
57
0 100 200 300 400 500
Unknown
Less than 10
10 to 17
18 to 25
26 to 35
36 to 45
46+
Aggravated Assault Victims by Age2008‐‐2009
2009
2008
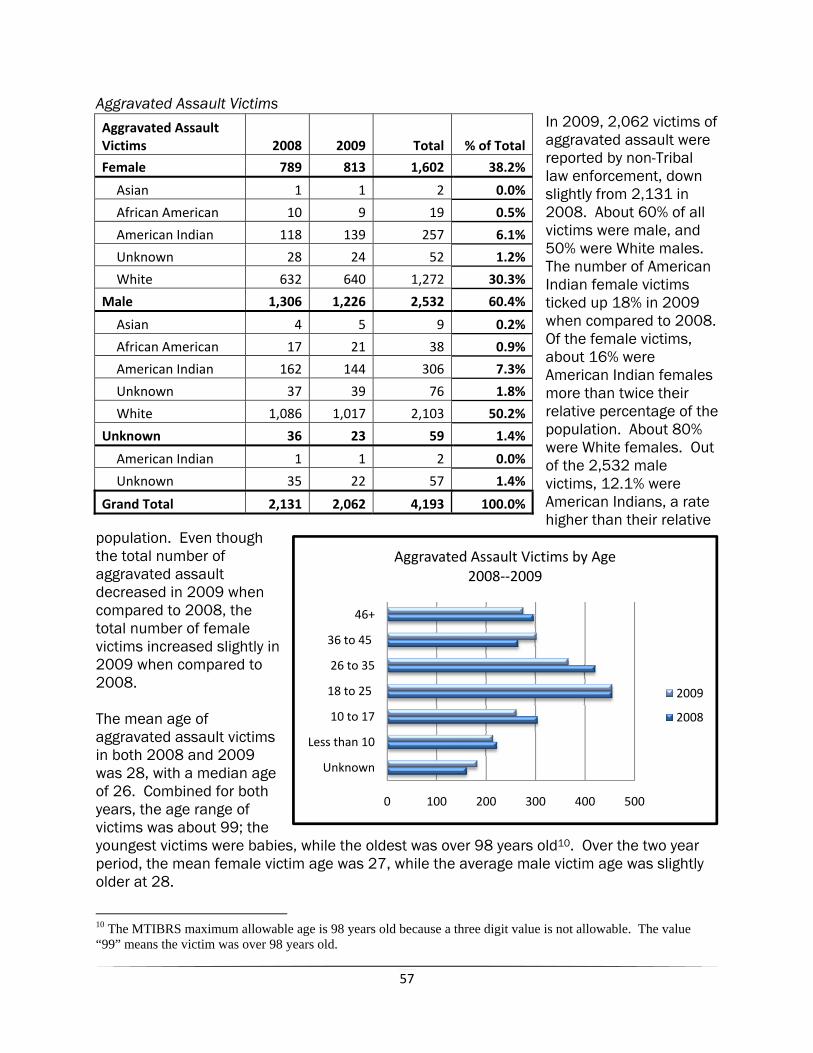
Aggravated Assault Victims In 2009, 2,062 victims of aggravated assault were reported by non-Tribal law enforcement, down slightly from 2,131 in 2008. About 60% of all victims were male, and 50% were White males. The number of American Indian female victims ticked up 18% in 2009 when compared to 2008. Of the female victims, about 16% were American Indian females more than twice their relative percentage of the population. About 80% were White females. Out of the 2,532 male victims, 12.1% were American Indians, a rate higher than their relative
population. Even though the total number of aggravated assault decreased in 2009 when compared to 2008, the total number of female victims increased slightly in 2009 when compared to 2008. The mean age of aggravated assault victims in both 2008 and 2009 was 28, with a median age of 26. Combined for both years, the age range of victims was about 99; the youngest victims were babies, while the oldest was over 98 years old10. Over the two year period, the mean female victim age was 27, while the average male victim age was slightly older at 28.
10 The MTIBRS maximum allowable age is 98 years old because a three digit value is not allowable. The value “99” means the victim was over 98 years old.
Aggravated Assault Victims 2008 2009 Total % of Total
Female 789 813 1,602 38.2%
Asian 1 1 2 0.0%
African American 10 9 19 0.5%
American Indian 118 139 257 6.1%
Unknown 28 24 52 1.2%
White 632 640 1,272 30.3%
Male 1,306 1,226 2,532 60.4%
Asian 4 5 9 0.2%
African American 17 21 38 0.9%
American Indian 162 144 306 7.3%
Unknown 37 39 76 1.8%
White 1,086 1,017 2,103 50.2%
Unknown 36 23 59 1.4%
American Indian 1 1 2 0.0%
Unknown 35 22 57 1.4%
Grand Total 2,131 2,062 4,193 100.0%
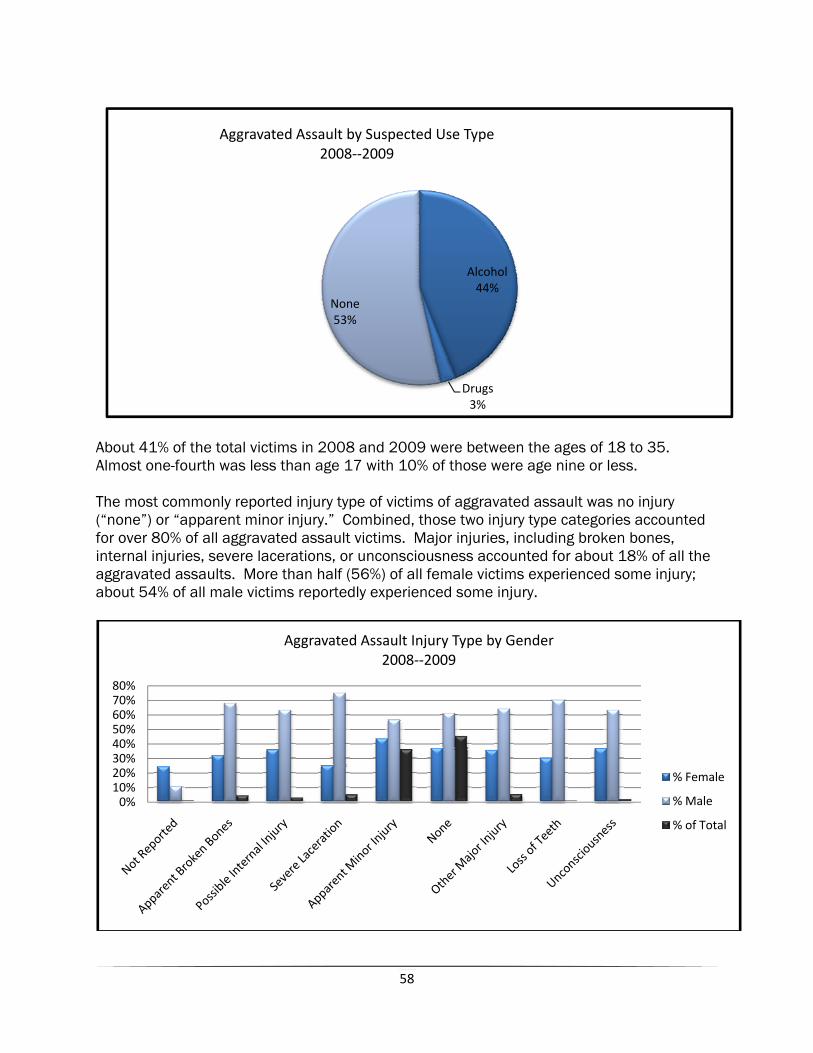
58
Alcohol44%
Drugs3%
None53%
Aggravated Assault by Suspected Use Type2008‐‐2009
About 41% of the total victims in 2008 and 2009 were between the ages of 18 to 35. Almost one-fourth was less than age 17 with 10% of those were age nine or less. The most commonly reported injury type of victims of aggravated assault was no injury (“none”) or “apparent minor injury.” Combined, those two injury type categories accounted for over 80% of all aggravated assault victims. Major injuries, including broken bones, internal injuries, severe lacerations, or unconsciousness accounted for about 18% of all the aggravated assaults. More than half (56%) of all female victims experienced some injury; about 54% of all male victims reportedly experienced some injury.
0%10%20%30%40%50%60%70%80%
Aggravated Assault Injury Type by Gender2008‐‐2009
% Female
% Male
% of Total
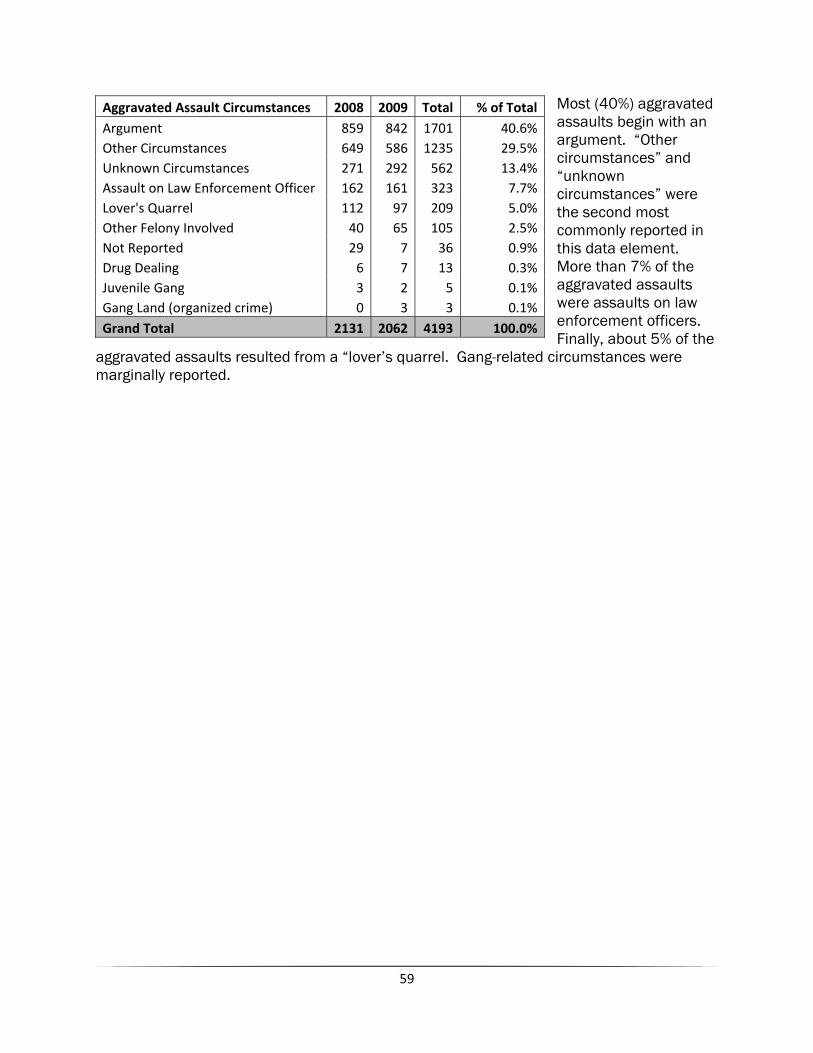
59
Most (40%) aggravated assaults begin with an argument. “Other circumstances” and “unknown circumstances” were the second most commonly reported in this data element. More than 7% of the aggravated assaults were assaults on law enforcement officers. Finally, about 5% of the
aggravated assaults resulted from a “lover’s quarrel. Gang-related circumstances were marginally reported.
Aggravated Assault Circumstances 2008 2009 Total % of TotalArgument 859 842 1701 40.6%Other Circumstances 649 586 1235 29.5%Unknown Circumstances 271 292 562 13.4%Assault on Law Enforcement Officer 162 161 323 7.7%Lover's Quarrel 112 97 209 5.0%Other Felony Involved 40 65 105 2.5%Not Reported 29 7 36 0.9%Drug Dealing 6 7 13 0.3%Juvenile Gang 3 2 5 0.1%Gang Land (organized crime) 0 3 3 0.1%Grand Total 2131 2062 4193 100.0%
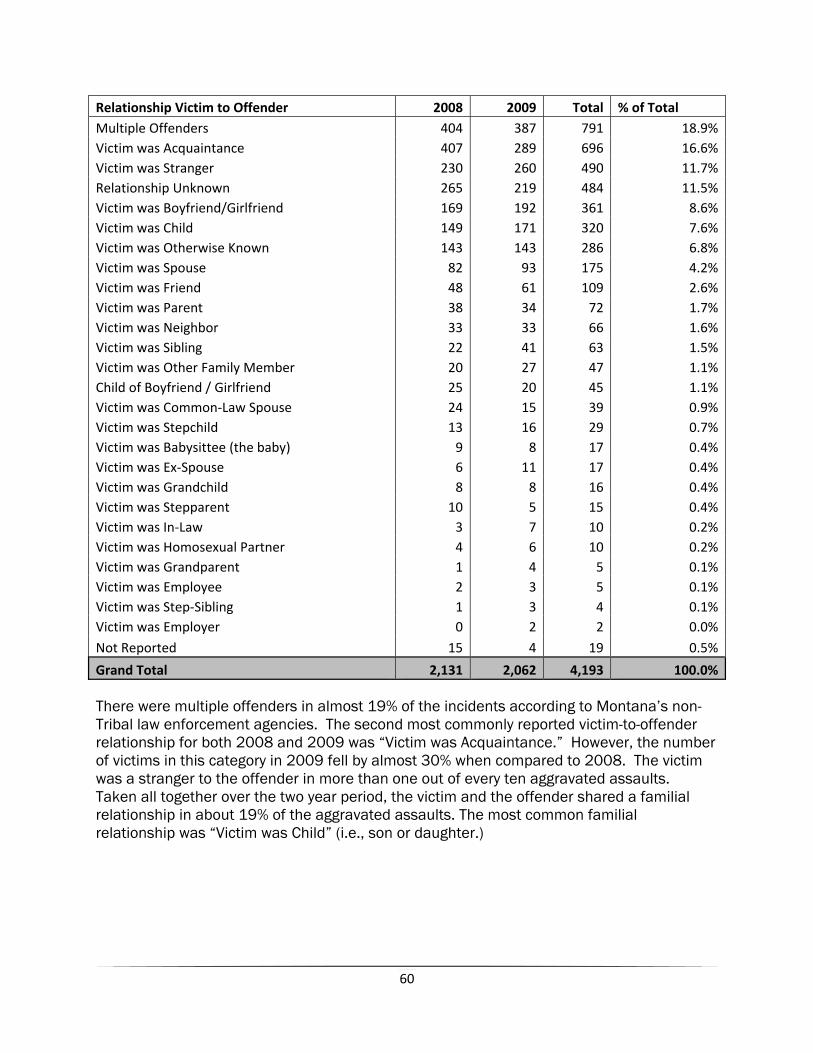
60
Relationship Victim to Offender 2008 2009 Total % of Total Multiple Offenders 404 387 791 18.9%Victim was Acquaintance 407 289 696 16.6%Victim was Stranger 230 260 490 11.7%Relationship Unknown 265 219 484 11.5%Victim was Boyfriend/Girlfriend 169 192 361 8.6%Victim was Child 149 171 320 7.6%Victim was Otherwise Known 143 143 286 6.8%Victim was Spouse 82 93 175 4.2%Victim was Friend 48 61 109 2.6%Victim was Parent 38 34 72 1.7%Victim was Neighbor 33 33 66 1.6%Victim was Sibling 22 41 63 1.5%Victim was Other Family Member 20 27 47 1.1%Child of Boyfriend / Girlfriend 25 20 45 1.1%Victim was Common‐Law Spouse 24 15 39 0.9%Victim was Stepchild 13 16 29 0.7%Victim was Babysittee (the baby) 9 8 17 0.4%Victim was Ex‐Spouse 6 11 17 0.4%Victim was Grandchild 8 8 16 0.4%Victim was Stepparent 10 5 15 0.4%Victim was In‐Law 3 7 10 0.2%Victim was Homosexual Partner 4 6 10 0.2%Victim was Grandparent 1 4 5 0.1%Victim was Employee 2 3 5 0.1%Victim was Step‐Sibling 1 3 4 0.1%Victim was Employer 0 2 2 0.0%Not Reported 15 4 19 0.5%
Grand Total 2,131 2,062 4,193 100.0% There were multiple offenders in almost 19% of the incidents according to Montana’s non-Tribal law enforcement agencies. The second most commonly reported victim-to-offender relationship for both 2008 and 2009 was “Victim was Acquaintance.” However, the number of victims in this category in 2009 fell by almost 30% when compared to 2008. The victim was a stranger to the offender in more than one out of every ten aggravated assaults. Taken all together over the two year period, the victim and the offender shared a familial relationship in about 19% of the aggravated assaults. The most common familial relationship was “Victim was Child” (i.e., son or daughter.)
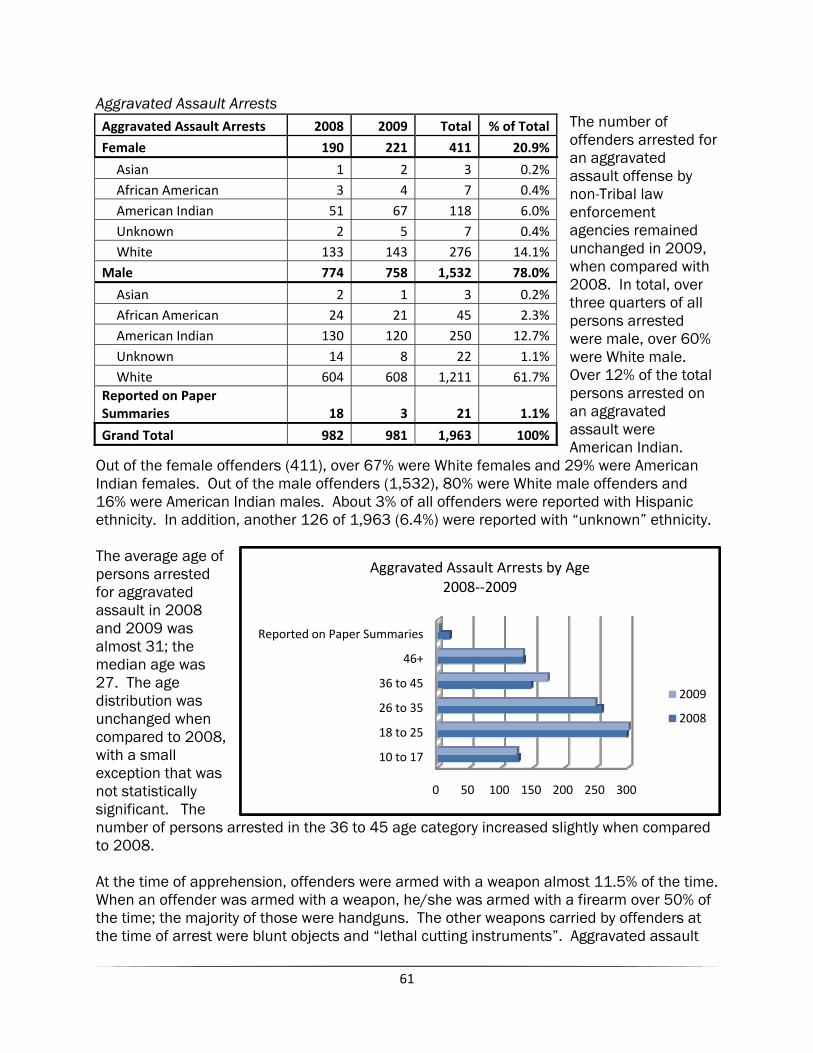
61
0 50 100 150 200 250 300
10 to 17
18 to 25
26 to 35
36 to 45
46+
Reported on Paper Summaries
Aggravated Assault Arrests by Age2008‐‐2009
2009
2008
Aggravated Assault Arrests The number of offenders arrested for an aggravated assault offense by non-Tribal law enforcement agencies remained unchanged in 2009, when compared with 2008. In total, over three quarters of all persons arrested were male, over 60% were White male. Over 12% of the total persons arrested on an aggravated assault were American Indian.
Out of the female offenders (411), over 67% were White females and 29% were American Indian females. Out of the male offenders (1,532), 80% were White male offenders and 16% were American Indian males. About 3% of all offenders were reported with Hispanic ethnicity. In addition, another 126 of 1,963 (6.4%) were reported with “unknown” ethnicity. The average age of persons arrested for aggravated assault in 2008 and 2009 was almost 31; the median age was 27. The age distribution was unchanged when compared to 2008, with a small exception that was not statistically significant. The number of persons arrested in the 36 to 45 age category increased slightly when compared to 2008. At the time of apprehension, offenders were armed with a weapon almost 11.5% of the time. When an offender was armed with a weapon, he/she was armed with a firearm over 50% of the time; the majority of those were handguns. The other weapons carried by offenders at the time of arrest were blunt objects and “lethal cutting instruments”. Aggravated assault
Aggravated Assault Arrests 2008 2009 Total % of Total
Female 190 221 411 20.9%
Asian 1 2 3 0.2%African American 3 4 7 0.4%American Indian 51 67 118 6.0%Unknown 2 5 7 0.4%White 133 143 276 14.1%
Male 774 758 1,532 78.0%
Asian 2 1 3 0.2%African American 24 21 45 2.3%American Indian 130 120 250 12.7%Unknown 14 8 22 1.1%White 604 608 1,211 61.7%
Reported on Paper Summaries 18 3 21 1.1%
Grand Total 982 981 1,963 100%
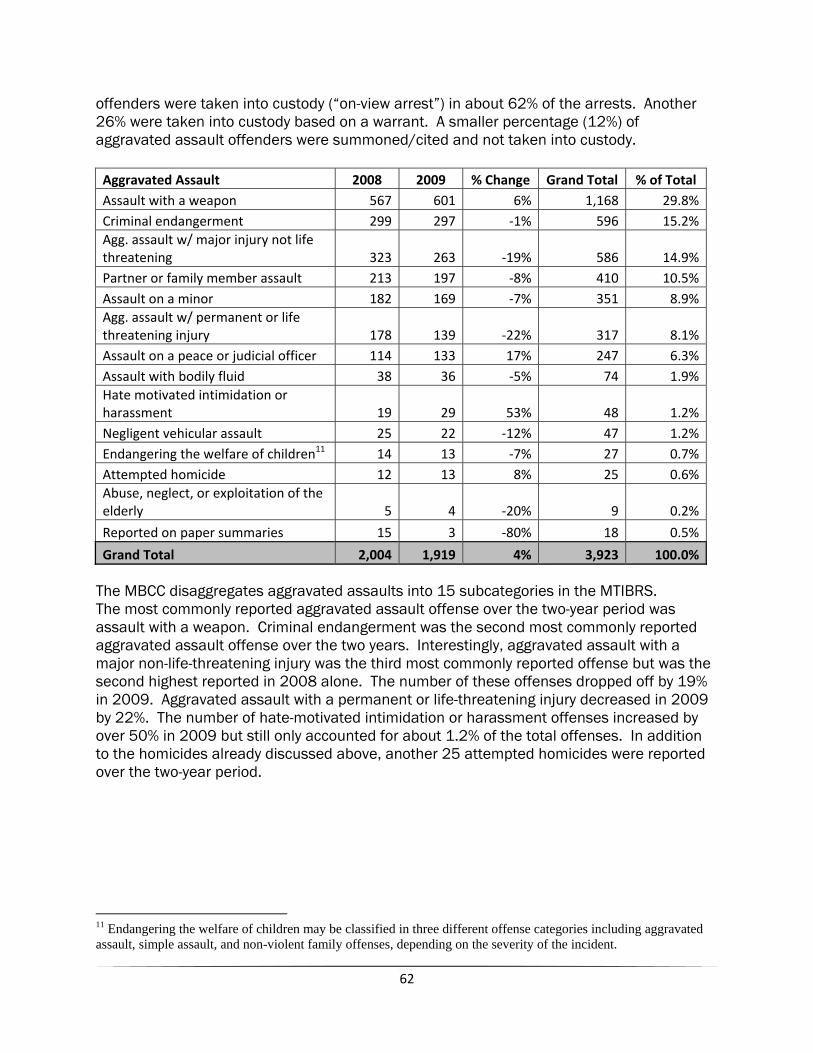
62
offenders were taken into custody (“on-view arrest”) in about 62% of the arrests. Another 26% were taken into custody based on a warrant. A smaller percentage (12%) of aggravated assault offenders were summoned/cited and not taken into custody. Aggravated Assault 2008 2009 % Change Grand Total % of Total Assault with a weapon 567 601 6% 1,168 29.8%Criminal endangerment 299 297 ‐1% 596 15.2%Agg. assault w/ major injury not life threatening 323 263 ‐19% 586 14.9%Partner or family member assault 213 197 ‐8% 410 10.5%Assault on a minor 182 169 ‐7% 351 8.9%Agg. assault w/ permanent or life threatening injury 178 139 ‐22% 317 8.1%Assault on a peace or judicial officer 114 133 17% 247 6.3%Assault with bodily fluid 38 36 ‐5% 74 1.9%Hate motivated intimidation or harassment 19 29 53% 48 1.2%Negligent vehicular assault 25 22 ‐12% 47 1.2%Endangering the welfare of children11 14 13 ‐7% 27 0.7%Attempted homicide 12 13 8% 25 0.6%Abuse, neglect, or exploitation of the elderly 5 4 ‐20% 9 0.2%
Reported on paper summaries 15 3 ‐80% 18 0.5%
Grand Total 2,004 1,919 4% 3,923 100.0% The MBCC disaggregates aggravated assaults into 15 subcategories in the MTIBRS. The most commonly reported aggravated assault offense over the two-year period was assault with a weapon. Criminal endangerment was the second most commonly reported aggravated assault offense over the two years. Interestingly, aggravated assault with a major non-life-threatening injury was the third most commonly reported offense but was the second highest reported in 2008 alone. The number of these offenses dropped off by 19% in 2009. Aggravated assault with a permanent or life-threatening injury decreased in 2009 by 22%. The number of hate-motivated intimidation or harassment offenses increased by over 50% in 2009 but still only accounted for about 1.2% of the total offenses. In addition to the homicides already discussed above, another 25 attempted homicides were reported over the two-year period.
11 Endangering the welfare of children may be classified in three different offense categories including aggravated assault, simple assault, and non-violent family offenses, depending on the severity of the incident.
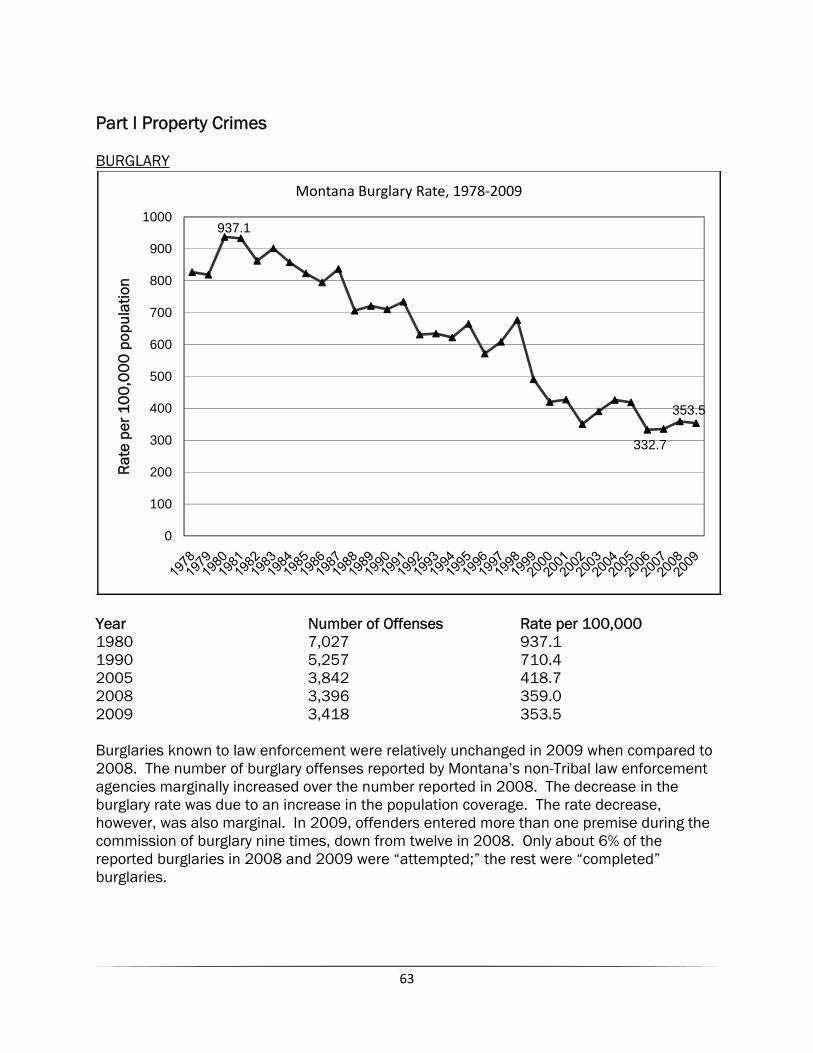
63
Part I Property Crimes BURGLARY
Year Number of Offenses Rate per 100,000 1980 7,027 937.1 1990 5,257 710.4 2005 3,842 418.7 2008 3,396 359.0 2009 3,418 353.5 Burglaries known to law enforcement were relatively unchanged in 2009 when compared to 2008. The number of burglary offenses reported by Montana’s non-Tribal law enforcement agencies marginally increased over the number reported in 2008. The decrease in the burglary rate was due to an increase in the population coverage. The rate decrease, however, was also marginal. In 2009, offenders entered more than one premise during the commission of burglary nine times, down from twelve in 2008. Only about 6% of the reported burglaries in 2008 and 2009 were “attempted;” the rest were “completed” burglaries.
937.1
332.7
353.5
0
100
200
300
400
500
600
700
800
900
1000
Rat
e pe
r 10
0,0
00
pop
ulat
ion
Montana Burglary Rate, 1978‐2009
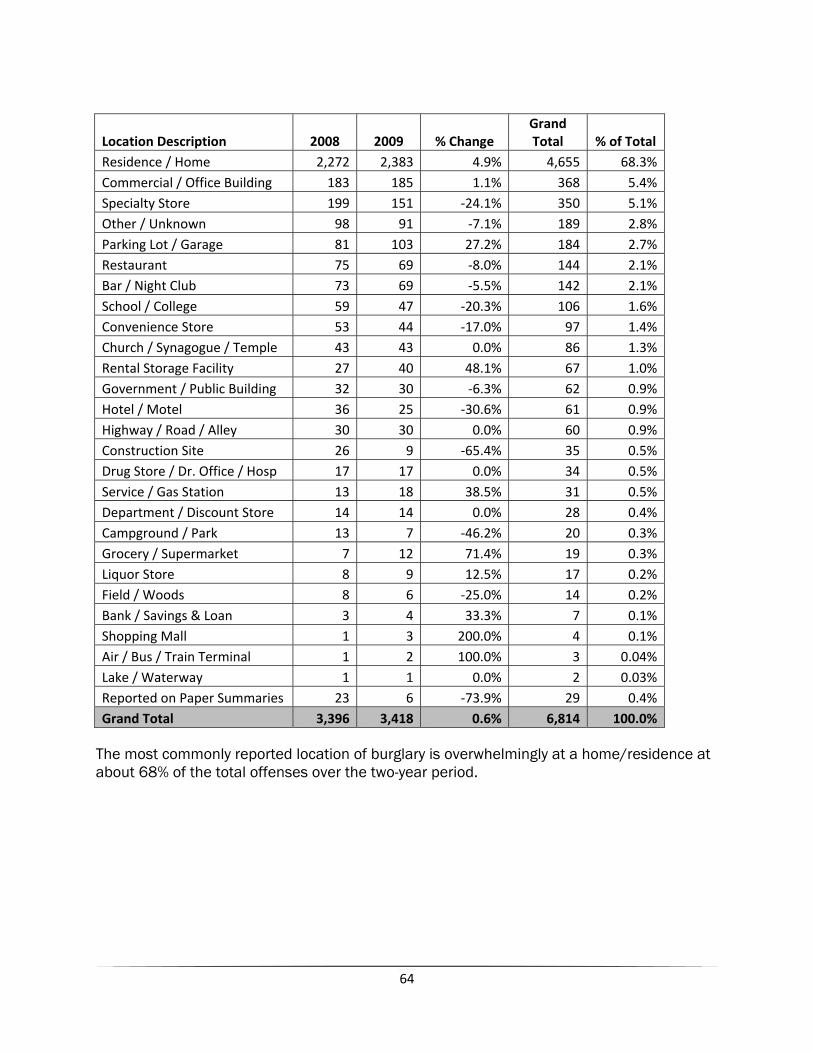
64
Location Description 2008 2009 % Change Grand Total % of Total
Residence / Home 2,272 2,383 4.9% 4,655 68.3%Commercial / Office Building 183 185 1.1% 368 5.4%Specialty Store 199 151 ‐24.1% 350 5.1%Other / Unknown 98 91 ‐7.1% 189 2.8%Parking Lot / Garage 81 103 27.2% 184 2.7%Restaurant 75 69 ‐8.0% 144 2.1%Bar / Night Club 73 69 ‐5.5% 142 2.1%School / College 59 47 ‐20.3% 106 1.6%Convenience Store 53 44 ‐17.0% 97 1.4%Church / Synagogue / Temple 43 43 0.0% 86 1.3%Rental Storage Facility 27 40 48.1% 67 1.0%Government / Public Building 32 30 ‐6.3% 62 0.9%Hotel / Motel 36 25 ‐30.6% 61 0.9%Highway / Road / Alley 30 30 0.0% 60 0.9%Construction Site 26 9 ‐65.4% 35 0.5%Drug Store / Dr. Office / Hosp 17 17 0.0% 34 0.5%Service / Gas Station 13 18 38.5% 31 0.5%Department / Discount Store 14 14 0.0% 28 0.4%Campground / Park 13 7 ‐46.2% 20 0.3%Grocery / Supermarket 7 12 71.4% 19 0.3%Liquor Store 8 9 12.5% 17 0.2%Field / Woods 8 6 ‐25.0% 14 0.2%Bank / Savings & Loan 3 4 33.3% 7 0.1%Shopping Mall 1 3 200.0% 4 0.1%Air / Bus / Train Terminal 1 2 100.0% 3 0.04%Lake / Waterway 1 1 0.0% 2 0.03%Reported on Paper Summaries 23 6 ‐73.9% 29 0.4%Grand Total 3,396 3,418 0.6% 6,814 100.0%
The most commonly reported location of burglary is overwhelmingly at a home/residence at about 68% of the total offenses over the two-year period.
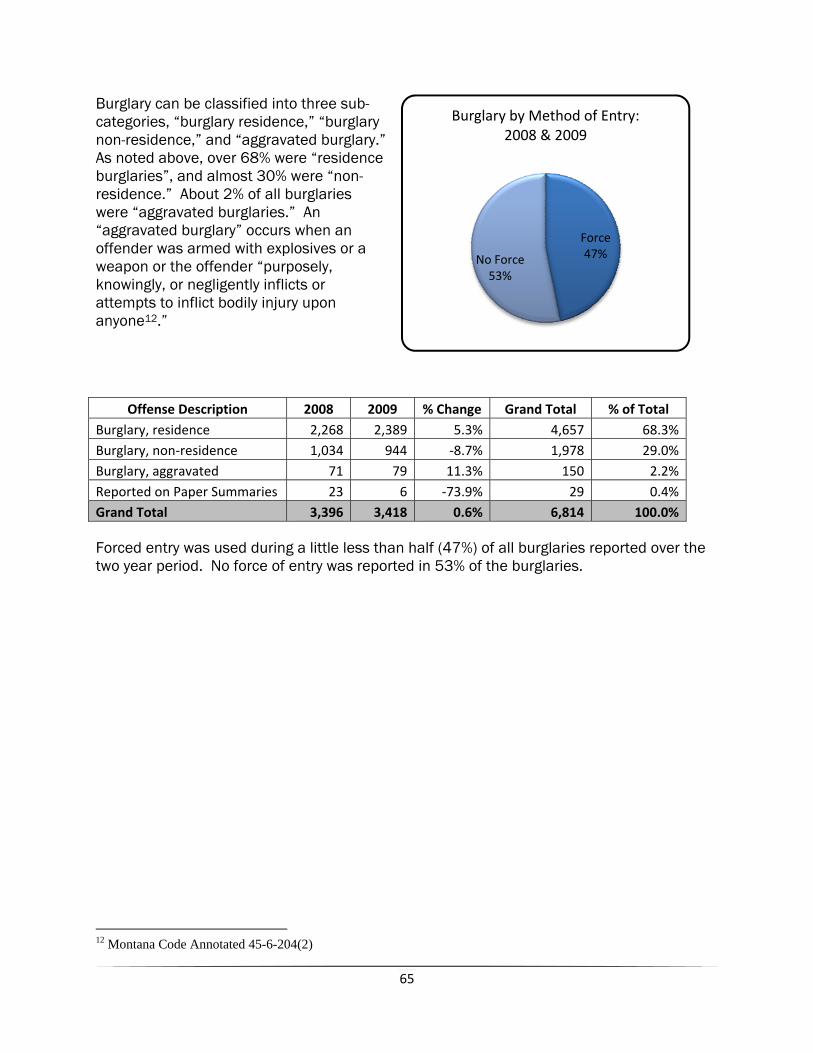
65
Force47%No Force
53%
Burglary by Method of Entry: 2008 & 2009
Burglary can be classified into three sub-categories, “burglary residence,” “burglary non-residence,” and “aggravated burglary.” As noted above, over 68% were “residence burglaries”, and almost 30% were “non-residence.” About 2% of all burglaries were “aggravated burglaries.” An “aggravated burglary” occurs when an offender was armed with explosives or a weapon or the offender “purposely, knowingly, or negligently inflicts or attempts to inflict bodily injury upon anyone12.”
Forced entry was used during a little less than half (47%) of all burglaries reported over the two year period. No force of entry was reported in 53% of the burglaries.
12 Montana Code Annotated 45-6-204(2)
Offense Description 2008 2009 % Change Grand Total % of Total Burglary, residence 2,268 2,389 5.3% 4,657 68.3%Burglary, non‐residence 1,034 944 ‐8.7% 1,978 29.0%Burglary, aggravated 71 79 11.3% 150 2.2%Reported on Paper Summaries 23 6 ‐73.9% 29 0.4%Grand Total 3,396 3,418 0.6% 6,814 100.0%
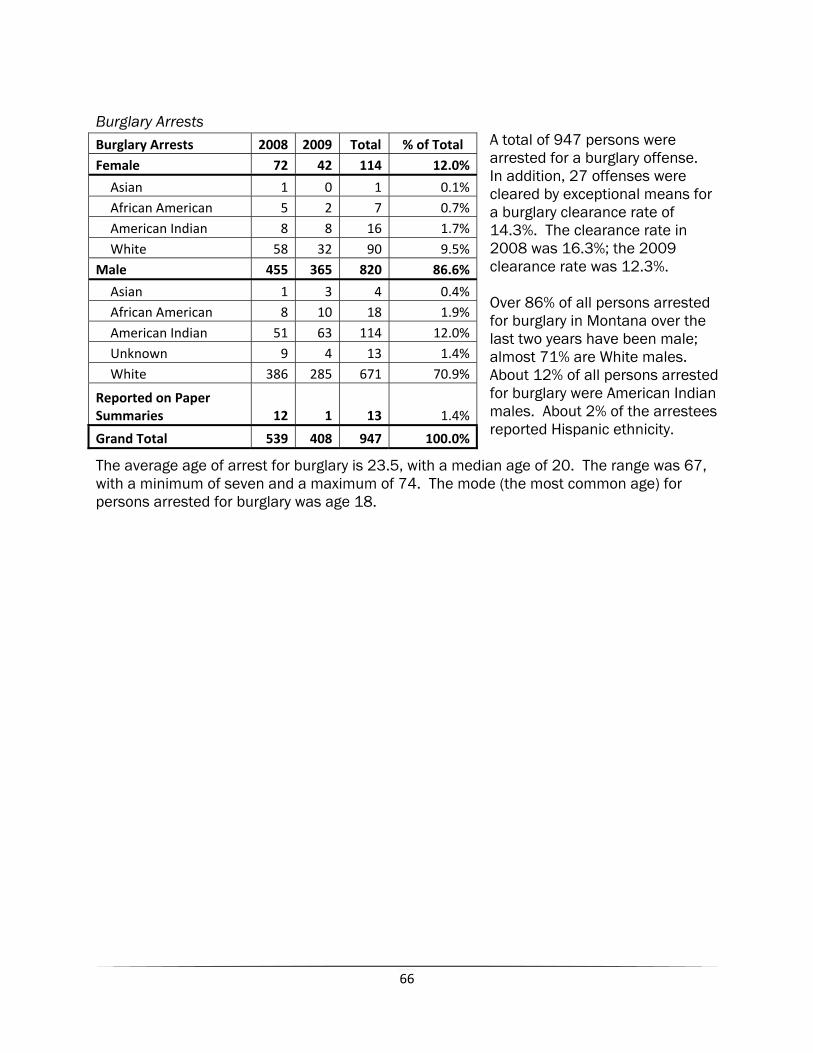
66
Burglary Arrests
A total of 947 persons were arrested for a burglary offense. In addition, 27 offenses were cleared by exceptional means for a burglary clearance rate of 14.3%. The clearance rate in 2008 was 16.3%; the 2009 clearance rate was 12.3%. Over 86% of all persons arrested for burglary in Montana over the last two years have been male; almost 71% are White males. About 12% of all persons arrested for burglary were American Indian males. About 2% of the arrestees reported Hispanic ethnicity.
The average age of arrest for burglary is 23.5, with a median age of 20. The range was 67, with a minimum of seven and a maximum of 74. The mode (the most common age) for persons arrested for burglary was age 18.
Burglary Arrests 2008 2009 Total % of Total Female 72 42 114 12.0%
Asian 1 0 1 0.1%African American 5 2 7 0.7%American Indian 8 8 16 1.7%White 58 32 90 9.5%
Male 455 365 820 86.6%
Asian 1 3 4 0.4%African American 8 10 18 1.9%American Indian 51 63 114 12.0%Unknown 9 4 13 1.4%White 386 285 671 70.9%
Reported on Paper Summaries 12 1 13 1.4%
Grand Total 539 408 947 100.0%
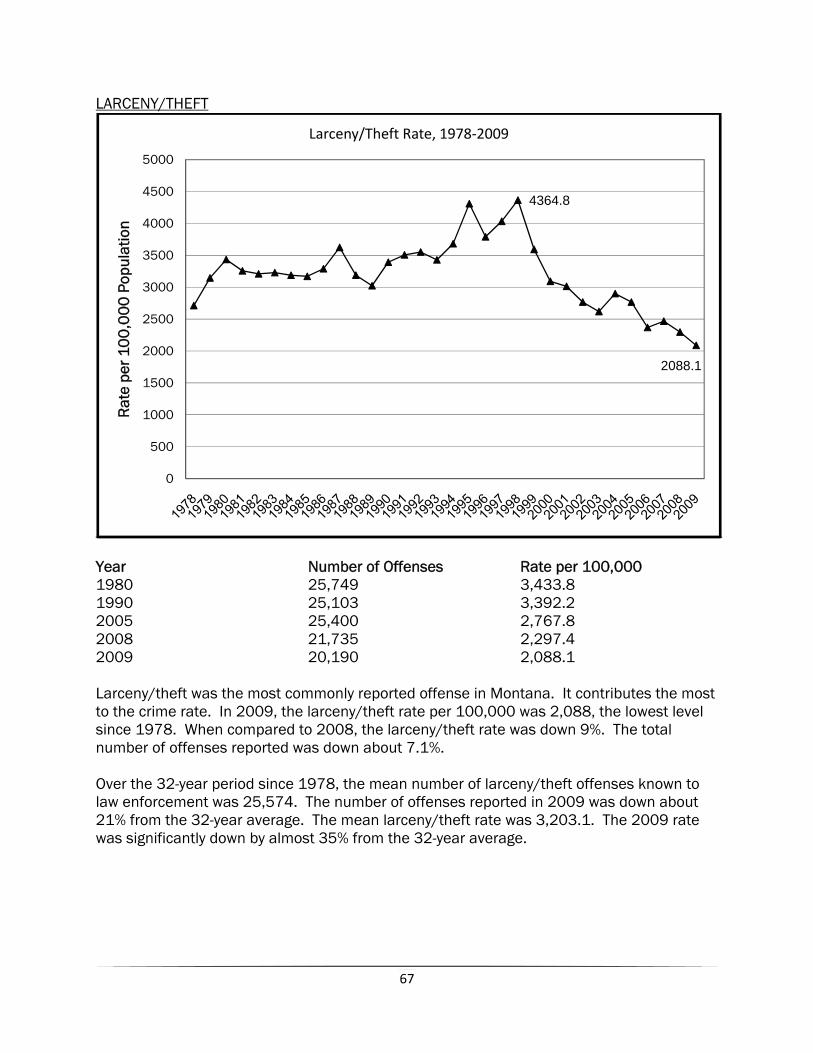
67
LARCENY/THEFT
Year Number of Offenses Rate per 100,000 1980 25,749 3,433.8 1990 25,103 3,392.2 2005 25,400 2,767.8 2008 21,735 2,297.4 2009 20,190 2,088.1 Larceny/theft was the most commonly reported offense in Montana. It contributes the most to the crime rate. In 2009, the larceny/theft rate per 100,000 was 2,088, the lowest level since 1978. When compared to 2008, the larceny/theft rate was down 9%. The total number of offenses reported was down about 7.1%. Over the 32-year period since 1978, the mean number of larceny/theft offenses known to law enforcement was 25,574. The number of offenses reported in 2009 was down about 21% from the 32-year average. The mean larceny/theft rate was 3,203.1. The 2009 rate was significantly down by almost 35% from the 32-year average.
4364.8
2088.1
0
500
1000
1500
2000
2500
3000
3500
4000
4500
5000
Rat
e pe
r 10
0,0
00
Pop
ulat
ion
Larceny/Theft Rate, 1978‐2009
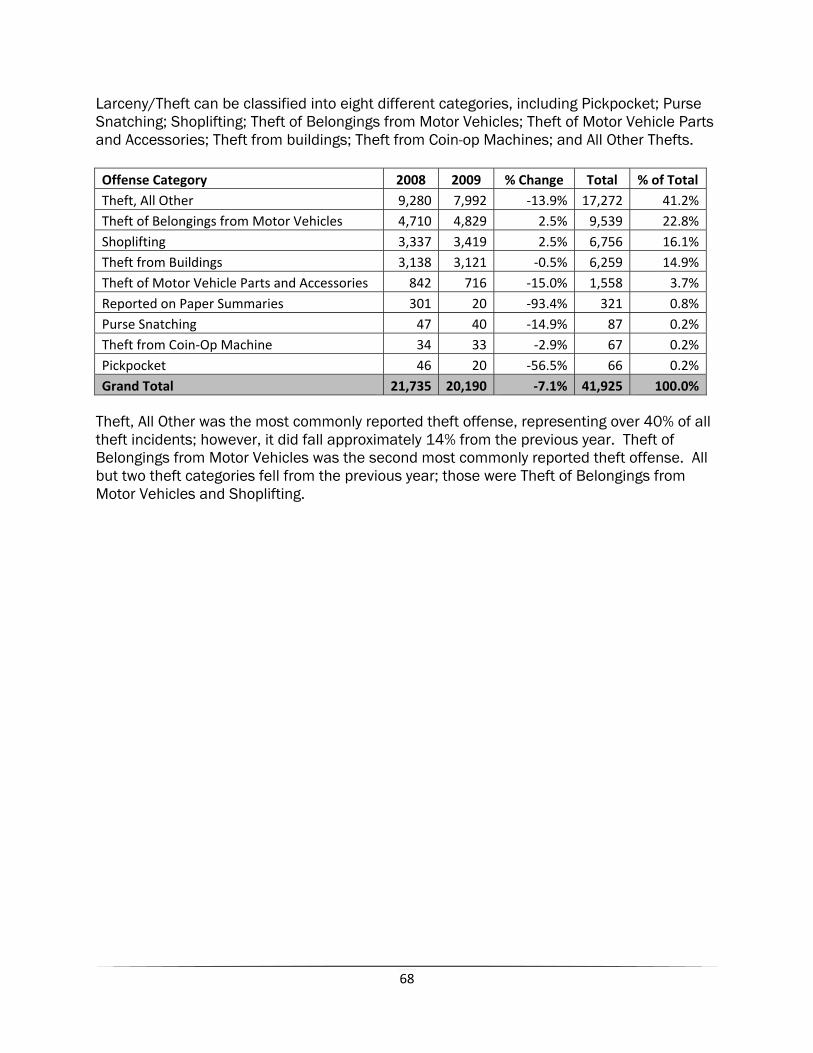
68
Larceny/Theft can be classified into eight different categories, including Pickpocket; Purse Snatching; Shoplifting; Theft of Belongings from Motor Vehicles; Theft of Motor Vehicle Parts and Accessories; Theft from buildings; Theft from Coin-op Machines; and All Other Thefts. Offense Category 2008 2009 % Change Total % of Total Theft, All Other 9,280 7,992 ‐13.9% 17,272 41.2%Theft of Belongings from Motor Vehicles 4,710 4,829 2.5% 9,539 22.8%Shoplifting 3,337 3,419 2.5% 6,756 16.1%Theft from Buildings 3,138 3,121 ‐0.5% 6,259 14.9%Theft of Motor Vehicle Parts and Accessories 842 716 ‐15.0% 1,558 3.7%Reported on Paper Summaries 301 20 ‐93.4% 321 0.8%Purse Snatching 47 40 ‐14.9% 87 0.2%Theft from Coin‐Op Machine 34 33 ‐2.9% 67 0.2%Pickpocket 46 20 ‐56.5% 66 0.2%Grand Total 21,735 20,190 ‐7.1% 41,925 100.0%
Theft, All Other was the most commonly reported theft offense, representing over 40% of all theft incidents; however, it did fall approximately 14% from the previous year. Theft of Belongings from Motor Vehicles was the second most commonly reported theft offense. All but two theft categories fell from the previous year; those were Theft of Belongings from Motor Vehicles and Shoplifting.
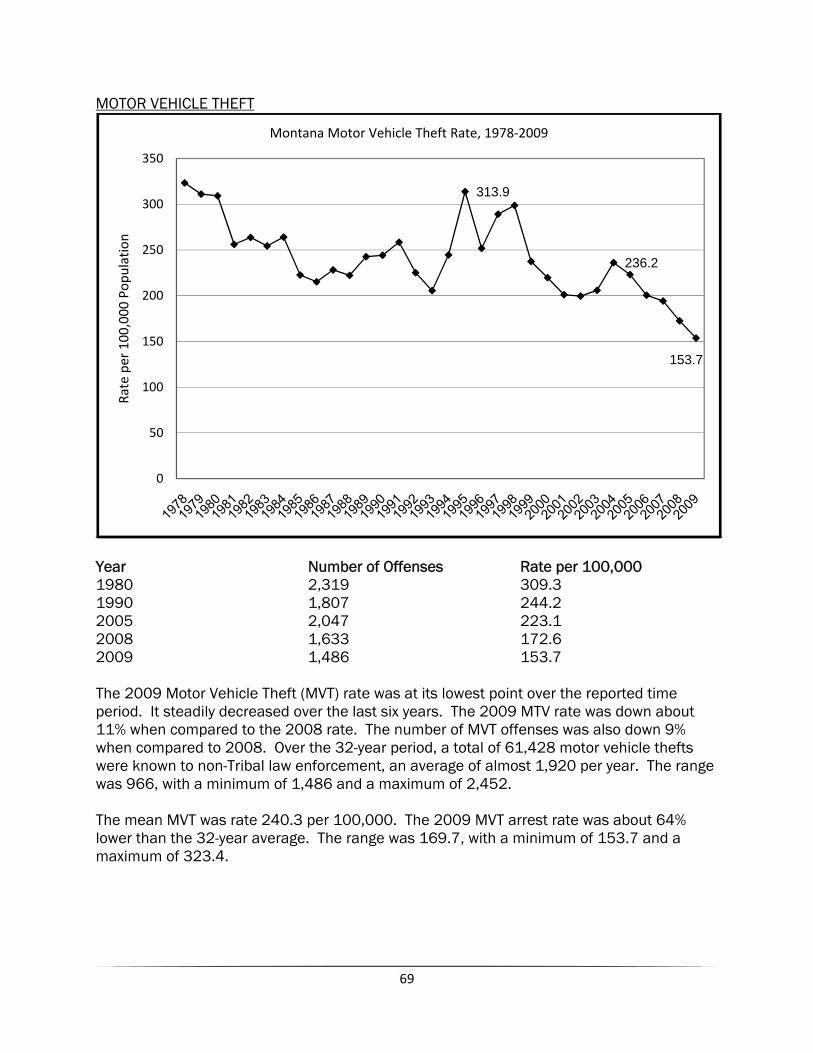
69
MOTOR VEHICLE THEFT
Year Number of Offenses Rate per 100,000 1980 2,319 309.3 1990 1,807 244.2 2005 2,047 223.1 2008 1,633 172.6 2009 1,486 153.7 The 2009 Motor Vehicle Theft (MVT) rate was at its lowest point over the reported time period. It steadily decreased over the last six years. The 2009 MTV rate was down about 11% when compared to the 2008 rate. The number of MVT offenses was also down 9% when compared to 2008. Over the 32-year period, a total of 61,428 motor vehicle thefts were known to non-Tribal law enforcement, an average of almost 1,920 per year. The range was 966, with a minimum of 1,486 and a maximum of 2,452. The mean MVT was rate 240.3 per 100,000. The 2009 MVT arrest rate was about 64% lower than the 32-year average. The range was 169.7, with a minimum of 153.7 and a maximum of 323.4.
313.9
236.2
153.7
0
50
100
150
200
250
300
350
Rate per 100
,000
Pop
ulation
Montana Motor Vehicle Theft Rate, 1978‐2009
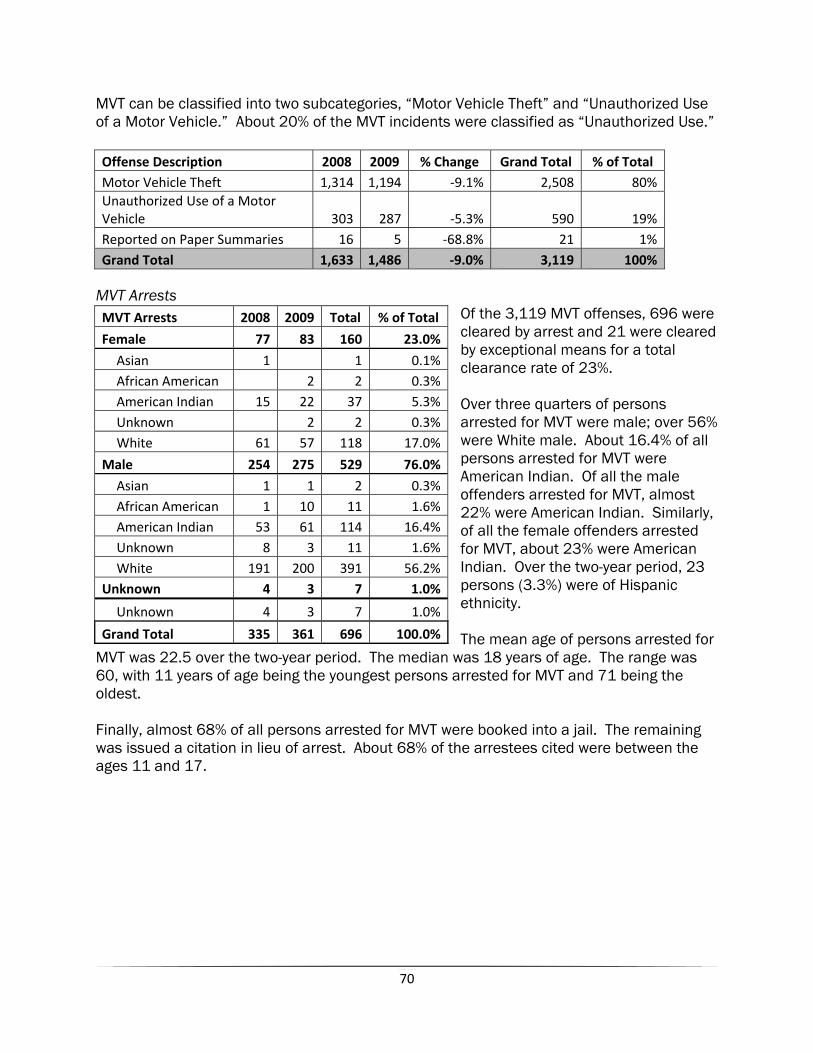
70
MVT can be classified into two subcategories, “Motor Vehicle Theft” and “Unauthorized Use of a Motor Vehicle.” About 20% of the MVT incidents were classified as “Unauthorized Use.” Offense Description 2008 2009 % Change Grand Total % of Total Motor Vehicle Theft 1,314 1,194 ‐9.1% 2,508 80%Unauthorized Use of a Motor Vehicle 303 287 ‐5.3% 590 19%Reported on Paper Summaries 16 5 ‐68.8% 21 1%Grand Total 1,633 1,486 ‐9.0% 3,119 100%
MVT Arrests
Of the 3,119 MVT offenses, 696 were cleared by arrest and 21 were cleared by exceptional means for a total clearance rate of 23%. Over three quarters of persons arrested for MVT were male; over 56% were White male. About 16.4% of all persons arrested for MVT were American Indian. Of all the male offenders arrested for MVT, almost 22% were American Indian. Similarly, of all the female offenders arrested for MVT, about 23% were American Indian. Over the two-year period, 23 persons (3.3%) were of Hispanic ethnicity. The mean age of persons arrested for
MVT was 22.5 over the two-year period. The median was 18 years of age. The range was 60, with 11 years of age being the youngest persons arrested for MVT and 71 being the oldest. Finally, almost 68% of all persons arrested for MVT were booked into a jail. The remaining was issued a citation in lieu of arrest. About 68% of the arrestees cited were between the ages 11 and 17.
MVT Arrests 2008 2009 Total % of Total
Female 77 83 160 23.0%
Asian 1 1 0.1%African American 2 2 0.3%American Indian 15 22 37 5.3%Unknown 2 2 0.3%White 61 57 118 17.0%
Male 254 275 529 76.0%
Asian 1 1 2 0.3%African American 1 10 11 1.6%American Indian 53 61 114 16.4%Unknown 8 3 11 1.6%White 191 200 391 56.2%
Unknown 4 3 7 1.0%
Unknown 4 3 7 1.0%
Grand Total 335 361 696 100.0%
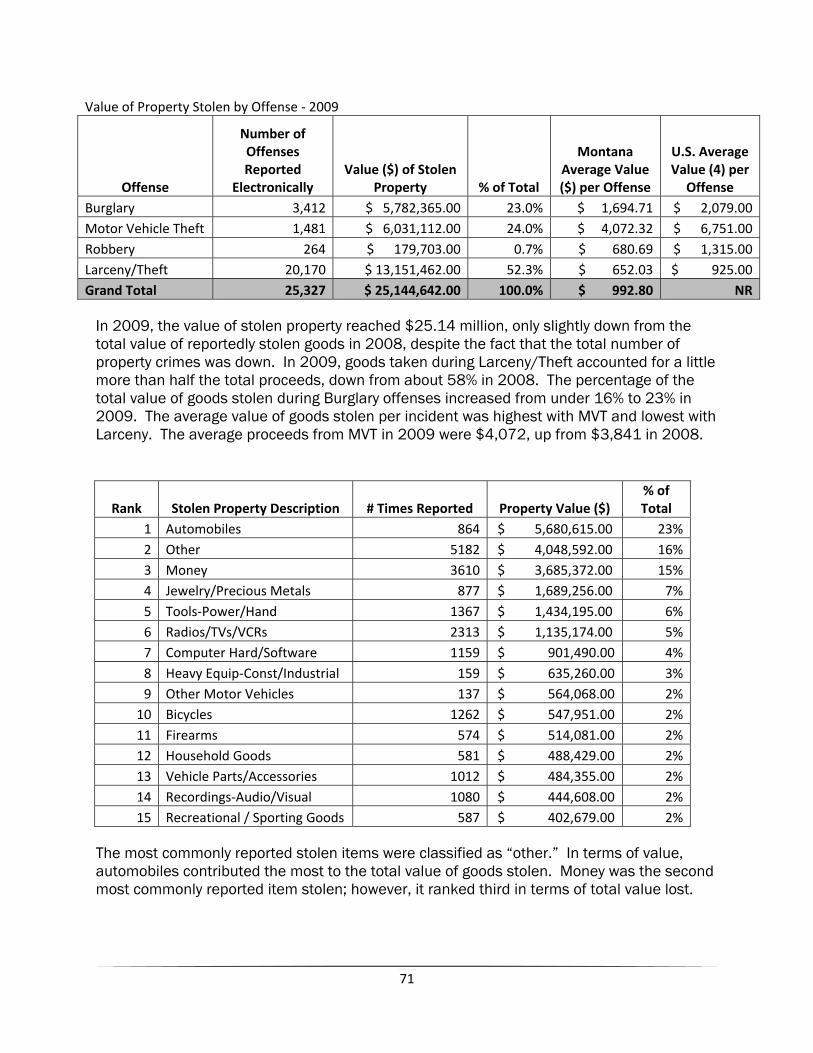
71
Value of Property Stolen by Offense ‐ 2009
Offense
Number of Offenses Reported
Electronically Value ($) of Stolen
Property % of Total
Montana Average Value ($) per Offense
U.S. Average Value (4) per
Offense Burglary 3,412 $ 5,782,365.00 23.0% $ 1,694.71 $ 2,079.00 Motor Vehicle Theft 1,481 $ 6,031,112.00 24.0% $ 4,072.32 $ 6,751.00 Robbery 264 $ 179,703.00 0.7% $ 680.69 $ 1,315.00 Larceny/Theft 20,170 $ 13,151,462.00 52.3% $ 652.03 $ 925.00 Grand Total 25,327 $ 25,144,642.00 100.0% $ 992.80 NR
In 2009, the value of stolen property reached $25.14 million, only slightly down from the total value of reportedly stolen goods in 2008, despite the fact that the total number of property crimes was down. In 2009, goods taken during Larceny/Theft accounted for a little more than half the total proceeds, down from about 58% in 2008. The percentage of the total value of goods stolen during Burglary offenses increased from under 16% to 23% in 2009. The average value of goods stolen per incident was highest with MVT and lowest with Larceny. The average proceeds from MVT in 2009 were $4,072, up from $3,841 in 2008.
Rank Stolen Property Description # Times Reported Property Value ($) % of Total
1 Automobiles 864 $ 5,680,615.00 23%2 Other 5182 $ 4,048,592.00 16%3 Money 3610 $ 3,685,372.00 15%4 Jewelry/Precious Metals 877 $ 1,689,256.00 7%5 Tools‐Power/Hand 1367 $ 1,434,195.00 6%6 Radios/TVs/VCRs 2313 $ 1,135,174.00 5%7 Computer Hard/Software 1159 $ 901,490.00 4%8 Heavy Equip‐Const/Industrial 159 $ 635,260.00 3%9 Other Motor Vehicles 137 $ 564,068.00 2%
10 Bicycles 1262 $ 547,951.00 2%11 Firearms 574 $ 514,081.00 2%12 Household Goods 581 $ 488,429.00 2%13 Vehicle Parts/Accessories 1012 $ 484,355.00 2%14 Recordings‐Audio/Visual 1080 $ 444,608.00 2%15 Recreational / Sporting Goods 587 $ 402,679.00 2%
The most commonly reported stolen items were classified as “other.” In terms of value, automobiles contributed the most to the total value of goods stolen. Money was the second most commonly reported item stolen; however, it ranked third in terms of total value lost.
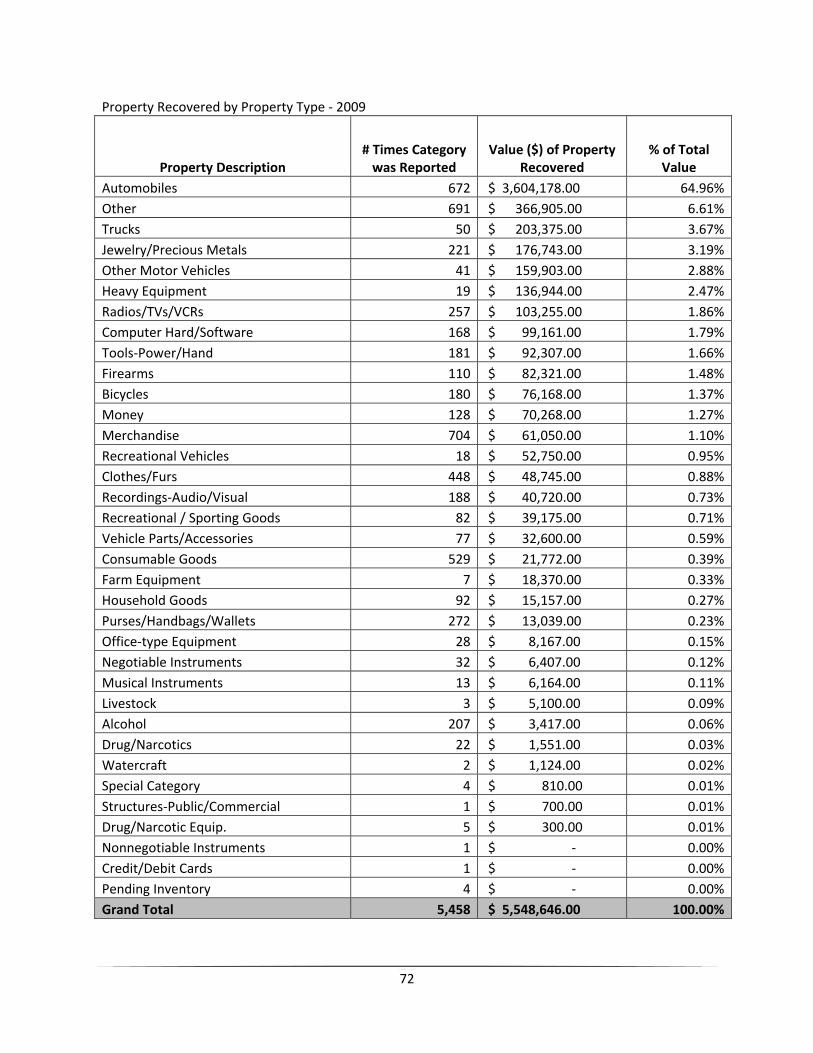
72
Property Recovered by Property Type ‐ 2009
Property Description # Times Category was Reported
Value ($) of Property Recovered
% of Total Value
Automobiles 672 $ 3,604,178.00 64.96%Other 691 $ 366,905.00 6.61%Trucks 50 $ 203,375.00 3.67%Jewelry/Precious Metals 221 $ 176,743.00 3.19%Other Motor Vehicles 41 $ 159,903.00 2.88%Heavy Equipment 19 $ 136,944.00 2.47%Radios/TVs/VCRs 257 $ 103,255.00 1.86%Computer Hard/Software 168 $ 99,161.00 1.79%Tools‐Power/Hand 181 $ 92,307.00 1.66%Firearms 110 $ 82,321.00 1.48%Bicycles 180 $ 76,168.00 1.37%Money 128 $ 70,268.00 1.27%Merchandise 704 $ 61,050.00 1.10%Recreational Vehicles 18 $ 52,750.00 0.95%Clothes/Furs 448 $ 48,745.00 0.88%Recordings‐Audio/Visual 188 $ 40,720.00 0.73%Recreational / Sporting Goods 82 $ 39,175.00 0.71%Vehicle Parts/Accessories 77 $ 32,600.00 0.59%Consumable Goods 529 $ 21,772.00 0.39%Farm Equipment 7 $ 18,370.00 0.33%Household Goods 92 $ 15,157.00 0.27%Purses/Handbags/Wallets 272 $ 13,039.00 0.23%Office‐type Equipment 28 $ 8,167.00 0.15%Negotiable Instruments 32 $ 6,407.00 0.12%Musical Instruments 13 $ 6,164.00 0.11%Livestock 3 $ 5,100.00 0.09%Alcohol 207 $ 3,417.00 0.06%Drug/Narcotics 22 $ 1,551.00 0.03%Watercraft 2 $ 1,124.00 0.02%Special Category 4 $ 810.00 0.01%Structures‐Public/Commercial 1 $ 700.00 0.01%Drug/Narcotic Equip. 5 $ 300.00 0.01%Nonnegotiable Instruments 1 $ ‐ 0.00%Credit/Debit Cards 1 $ ‐ 0.00%Pending Inventory 4 $ ‐ 0.00%Grand Total 5,458 $ 5,548,646.00 100.00%
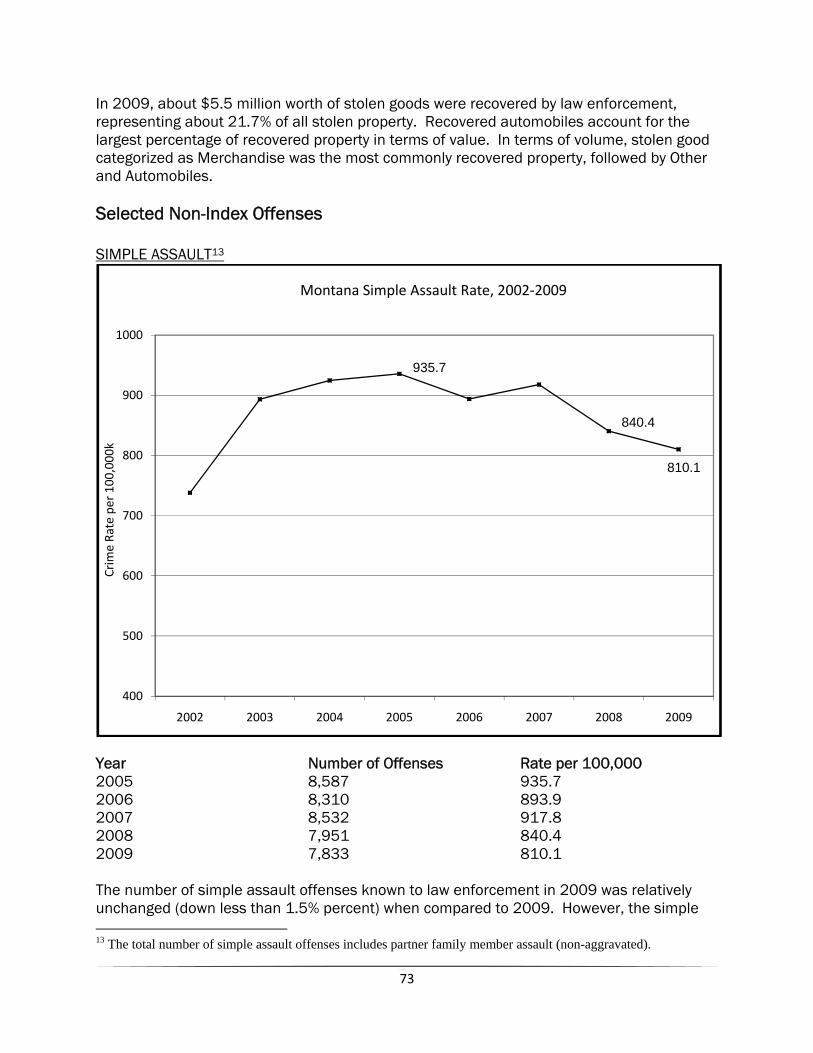
73
In 2009, about $5.5 million worth of stolen goods were recovered by law enforcement, representing about 21.7% of all stolen property. Recovered automobiles account for the largest percentage of recovered property in terms of value. In terms of volume, stolen good categorized as Merchandise was the most commonly recovered property, followed by Other and Automobiles. Selected Non-Index Offenses SIMPLE ASSAULT13
Year Number of Offenses Rate per 100,000 2005 8,587 935.7 2006 8,310 893.9 2007 8,532 917.8 2008 7,951 840.4 2009 7,833 810.1 The number of simple assault offenses known to law enforcement in 2009 was relatively unchanged (down less than 1.5% percent) when compared to 2009. However, the simple 13 The total number of simple assault offenses includes partner family member assault (non-aggravated).
935.7
840.4
810.1
400
500
600
700
800
900
1000
2002 2003 2004 2005 2006 2007 2008 2009
Crim
e Ra
te per 100
,000
k
Montana Simple Assault Rate, 2002‐2009
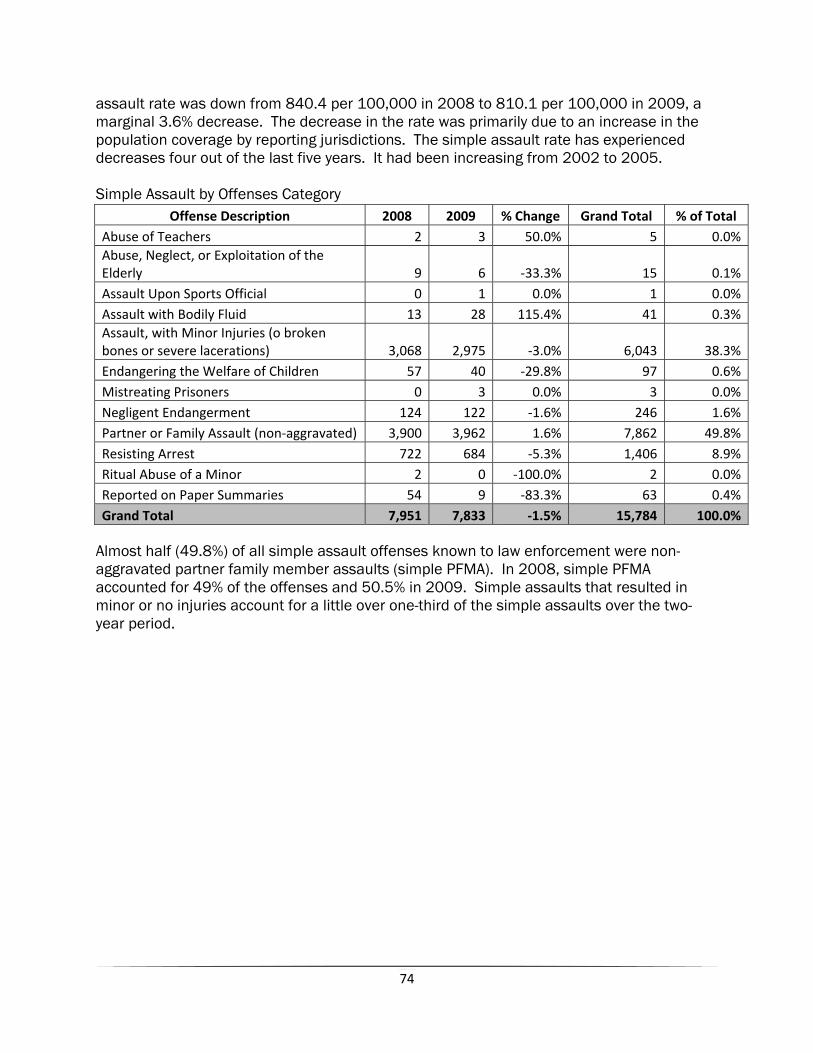
74
assault rate was down from 840.4 per 100,000 in 2008 to 810.1 per 100,000 in 2009, a marginal 3.6% decrease. The decrease in the rate was primarily due to an increase in the population coverage by reporting jurisdictions. The simple assault rate has experienced decreases four out of the last five years. It had been increasing from 2002 to 2005. Simple Assault by Offenses Category
Offense Description 2008 2009 % Change Grand Total % of Total Abuse of Teachers 2 3 50.0% 5 0.0%Abuse, Neglect, or Exploitation of the Elderly 9 6 ‐33.3% 15 0.1%Assault Upon Sports Official 0 1 0.0% 1 0.0%Assault with Bodily Fluid 13 28 115.4% 41 0.3%Assault, with Minor Injuries (o broken bones or severe lacerations) 3,068 2,975 ‐3.0% 6,043 38.3%Endangering the Welfare of Children 57 40 ‐29.8% 97 0.6%Mistreating Prisoners 0 3 0.0% 3 0.0%Negligent Endangerment 124 122 ‐1.6% 246 1.6%Partner or Family Assault (non‐aggravated) 3,900 3,962 1.6% 7,862 49.8%Resisting Arrest 722 684 ‐5.3% 1,406 8.9%Ritual Abuse of a Minor 2 0 ‐100.0% 2 0.0%Reported on Paper Summaries 54 9 ‐83.3% 63 0.4%Grand Total 7,951 7,833 ‐1.5% 15,784 100.0%
Almost half (49.8%) of all simple assault offenses known to law enforcement were non-aggravated partner family member assaults (simple PFMA). In 2008, simple PFMA accounted for 49% of the offenses and 50.5% in 2009. Simple assaults that resulted in minor or no injuries account for a little over one-third of the simple assaults over the two-year period.
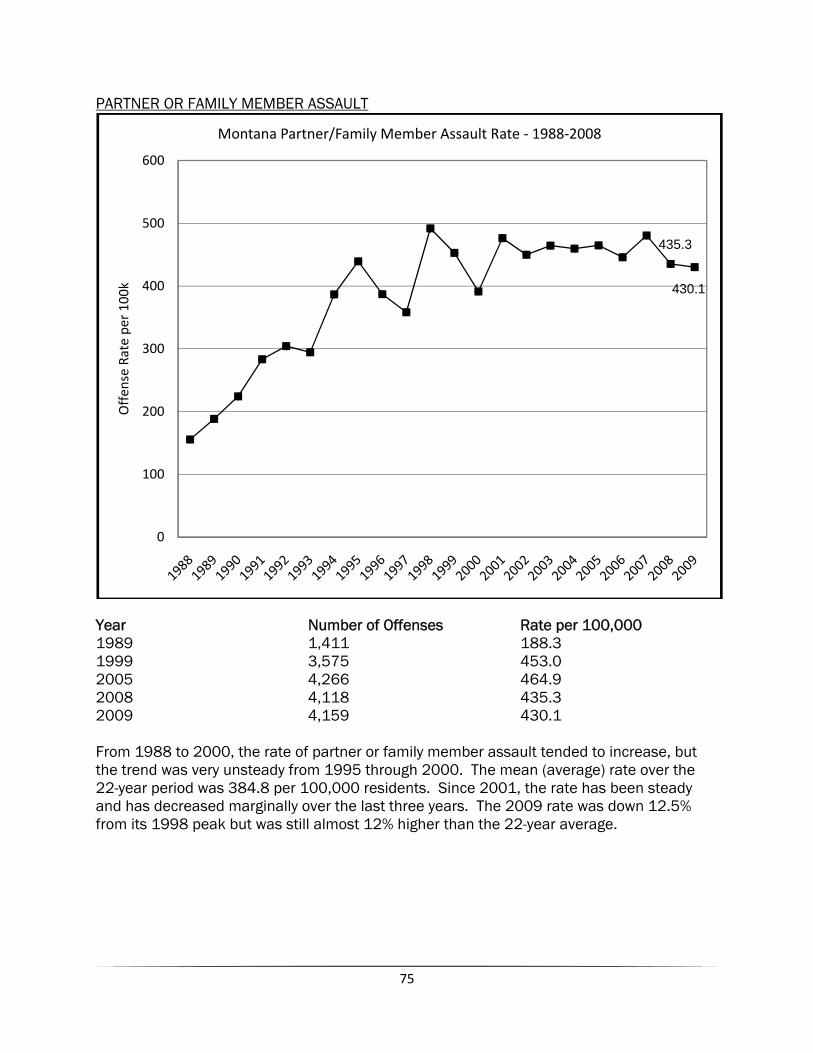
75
PARTNER OR FAMILY MEMBER ASSAULT
Year Number of Offenses Rate per 100,000 1989 1,411 188.3 1999 3,575 453.0 2005 4,266 464.9 2008 4,118 435.3 2009 4,159 430.1 From 1988 to 2000, the rate of partner or family member assault tended to increase, but the trend was very unsteady from 1995 through 2000. The mean (average) rate over the 22-year period was 384.8 per 100,000 residents. Since 2001, the rate has been steady and has decreased marginally over the last three years. The 2009 rate was down 12.5% from its 1998 peak but was still almost 12% higher than the 22-year average.
435.3
430.1
0
100
200
300
400
500
600
Offen
se Rate pe
r 10
0kMontana Partner/Family Member Assault Rate ‐ 1988‐2008
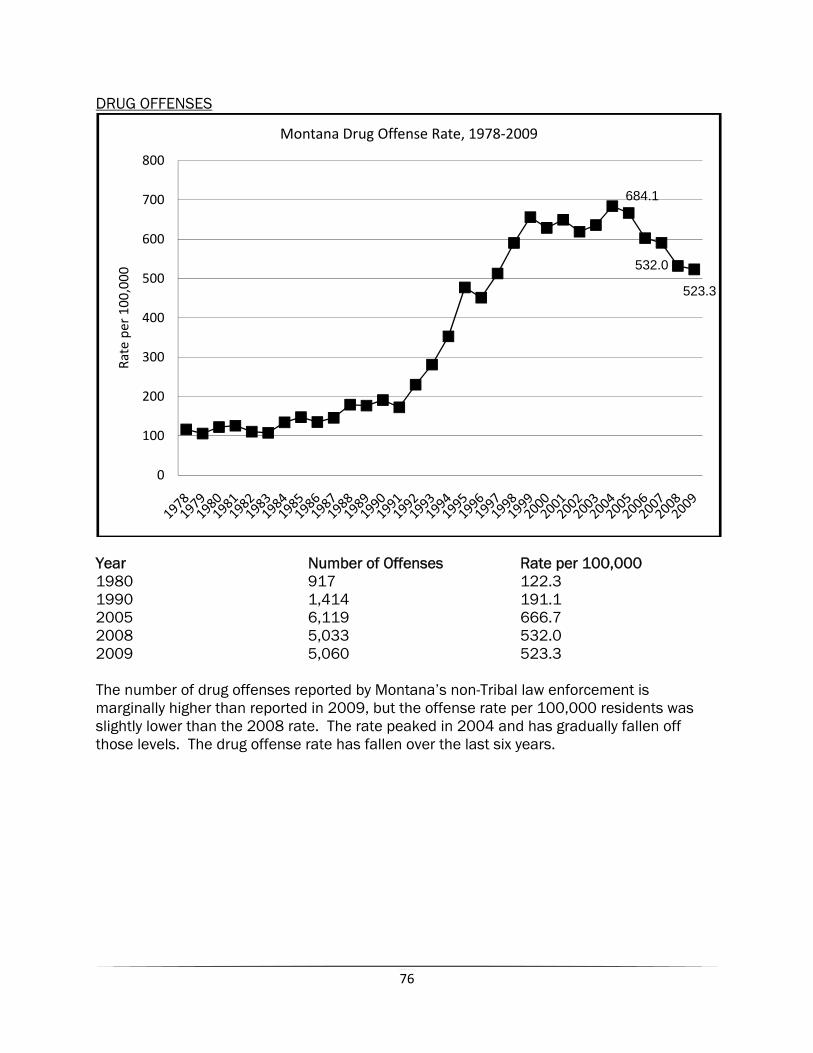
76
DRUG OFFENSES
Year Number of Offenses Rate per 100,000 1980 917 122.3 1990 1,414 191.1 2005 6,119 666.7 2008 5,033 532.0 2009 5,060 523.3 The number of drug offenses reported by Montana’s non-Tribal law enforcement is marginally higher than reported in 2009, but the offense rate per 100,000 residents was slightly lower than the 2008 rate. The rate peaked in 2004 and has gradually fallen off those levels. The drug offense rate has fallen over the last six years.
684.1
532.0
523.3
0
100
200
300
400
500
600
700
800
Rate per 100
,000
Montana Drug Offense Rate, 1978‐2009
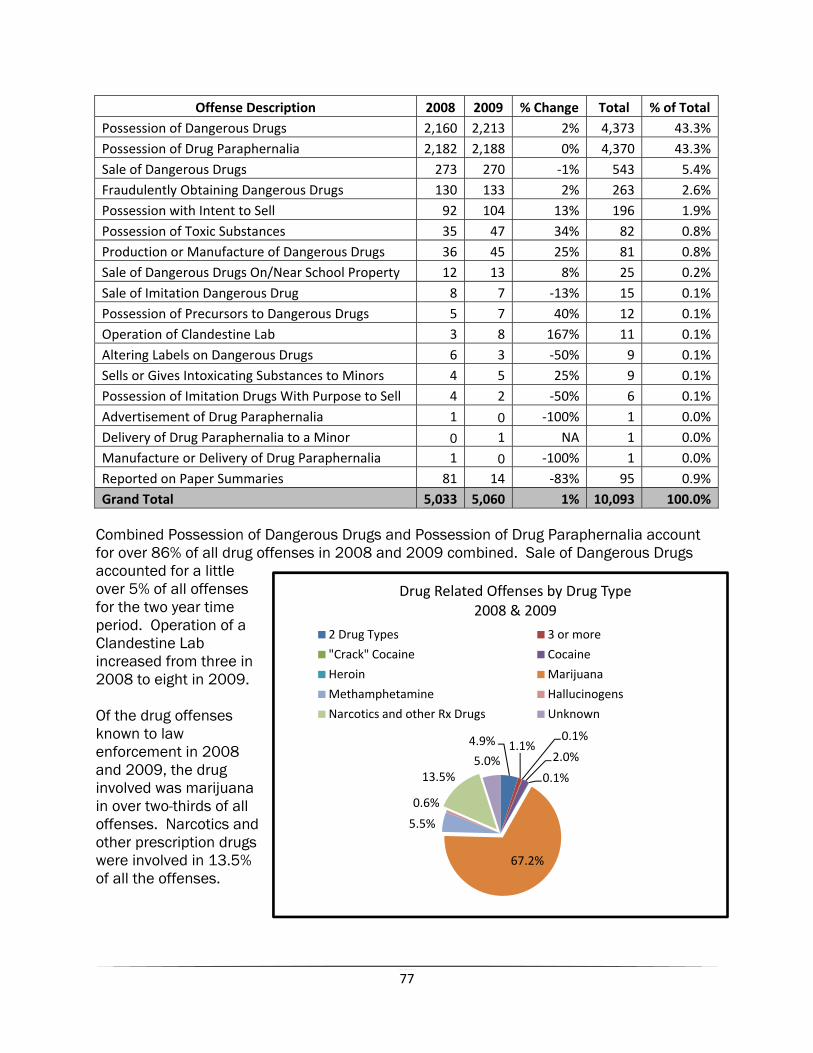
77
4.9% 1.1%0.1%
2.0%
0.1%
67.2%
5.5%
0.6%
13.5%5.0%
Drug Related Offenses by Drug Type2008 & 2009
2 Drug Types 3 or more
"Crack" Cocaine Cocaine
Heroin Marijuana
Methamphetamine Hallucinogens
Narcotics and other Rx Drugs Unknown
Offense Description 2008 2009 % Change Total % of Total Possession of Dangerous Drugs 2,160 2,213 2% 4,373 43.3%Possession of Drug Paraphernalia 2,182 2,188 0% 4,370 43.3%Sale of Dangerous Drugs 273 270 ‐1% 543 5.4%Fraudulently Obtaining Dangerous Drugs 130 133 2% 263 2.6%Possession with Intent to Sell 92 104 13% 196 1.9%Possession of Toxic Substances 35 47 34% 82 0.8%Production or Manufacture of Dangerous Drugs 36 45 25% 81 0.8%Sale of Dangerous Drugs On/Near School Property 12 13 8% 25 0.2%Sale of Imitation Dangerous Drug 8 7 ‐13% 15 0.1%Possession of Precursors to Dangerous Drugs 5 7 40% 12 0.1%Operation of Clandestine Lab 3 8 167% 11 0.1%Altering Labels on Dangerous Drugs 6 3 ‐50% 9 0.1%Sells or Gives Intoxicating Substances to Minors 4 5 25% 9 0.1%Possession of Imitation Drugs With Purpose to Sell 4 2 ‐50% 6 0.1%Advertisement of Drug Paraphernalia 1 0 ‐100% 1 0.0%Delivery of Drug Paraphernalia to a Minor 0 1 NA 1 0.0%Manufacture or Delivery of Drug Paraphernalia 1 0 ‐100% 1 0.0%Reported on Paper Summaries 81 14 ‐83% 95 0.9%Grand Total 5,033 5,060 1% 10,093 100.0%
Combined Possession of Dangerous Drugs and Possession of Drug Paraphernalia account for over 86% of all drug offenses in 2008 and 2009 combined. Sale of Dangerous Drugs accounted for a little over 5% of all offenses for the two year time period. Operation of a Clandestine Lab increased from three in 2008 to eight in 2009. Of the drug offenses known to law enforcement in 2008 and 2009, the drug involved was marijuana in over two-thirds of all offenses. Narcotics and other prescription drugs were involved in 13.5% of all the offenses.
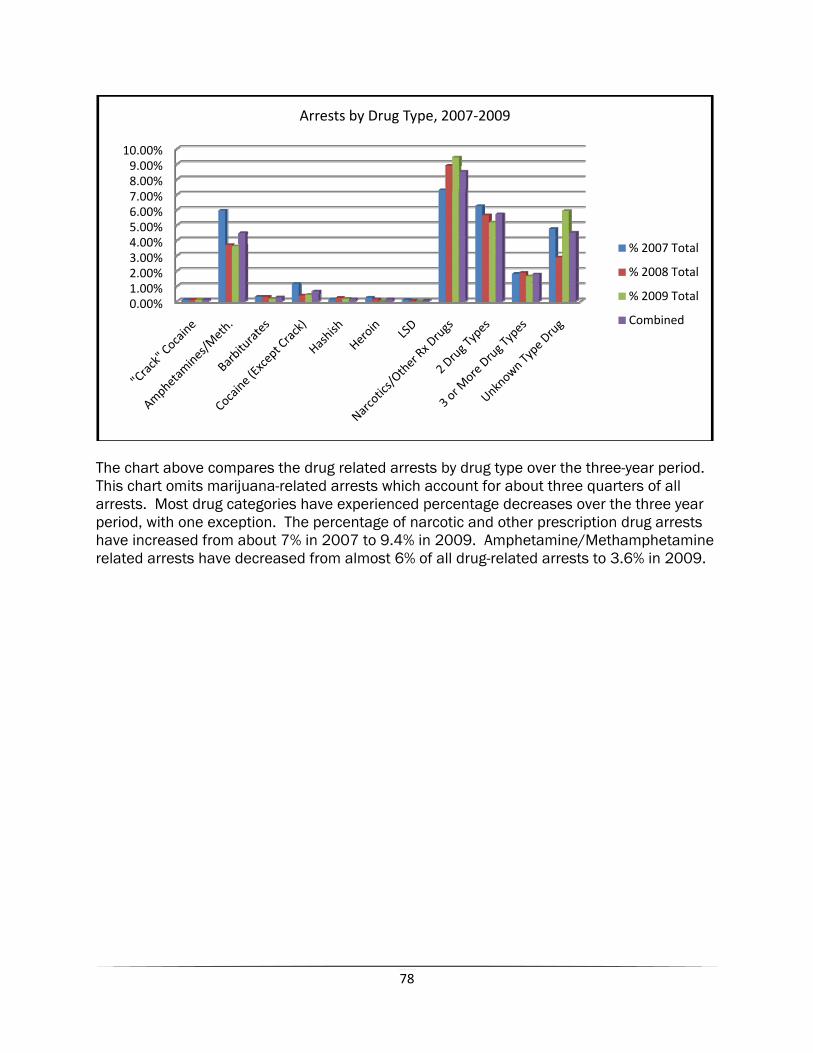
78
The chart above compares the drug related arrests by drug type over the three-year period. This chart omits marijuana-related arrests which account for about three quarters of all arrests. Most drug categories have experienced percentage decreases over the three year period, with one exception. The percentage of narcotic and other prescription drug arrests have increased from about 7% in 2007 to 9.4% in 2009. Amphetamine/Methamphetamine related arrests have decreased from almost 6% of all drug-related arrests to 3.6% in 2009.
0.00%1.00%2.00%3.00%4.00%5.00%6.00%7.00%8.00%9.00%
10.00%
Arrests by Drug Type, 2007‐2009
% 2007 Total
% 2008 Total
% 2009 Total
Combined
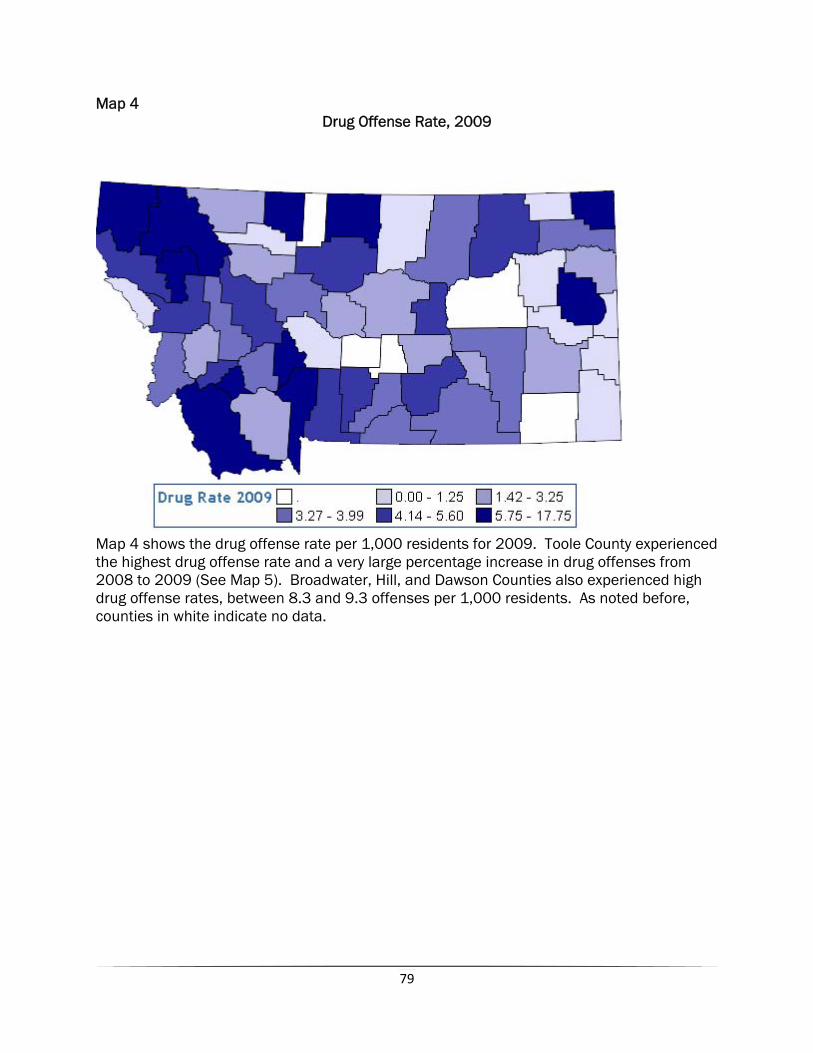
79
Map 4 Drug Offense Rate, 2009
Map 4 shows the drug offense rate per 1,000 residents for 2009. Toole County experienced the highest drug offense rate and a very large percentage increase in drug offenses from 2008 to 2009 (See Map 5). Broadwater, Hill, and Dawson Counties also experienced high drug offense rates, between 8.3 and 9.3 offenses per 1,000 residents. As noted before, counties in white indicate no data.
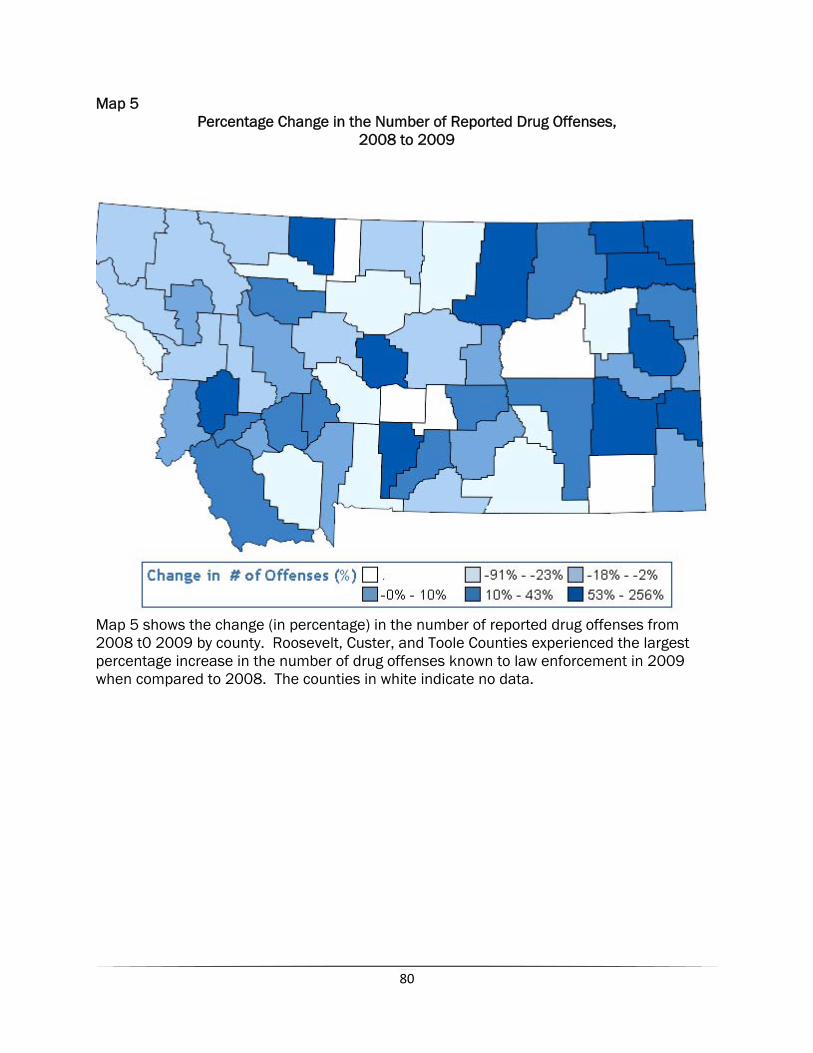
80
Map 5 Percentage Change in the Number of Reported Drug Offenses,
2008 to 2009
Map 5 shows the change (in percentage) in the number of reported drug offenses from 2008 t0 2009 by county. Roosevelt, Custer, and Toole Counties experienced the largest percentage increase in the number of drug offenses known to law enforcement in 2009 when compared to 2008. The counties in white indicate no data.
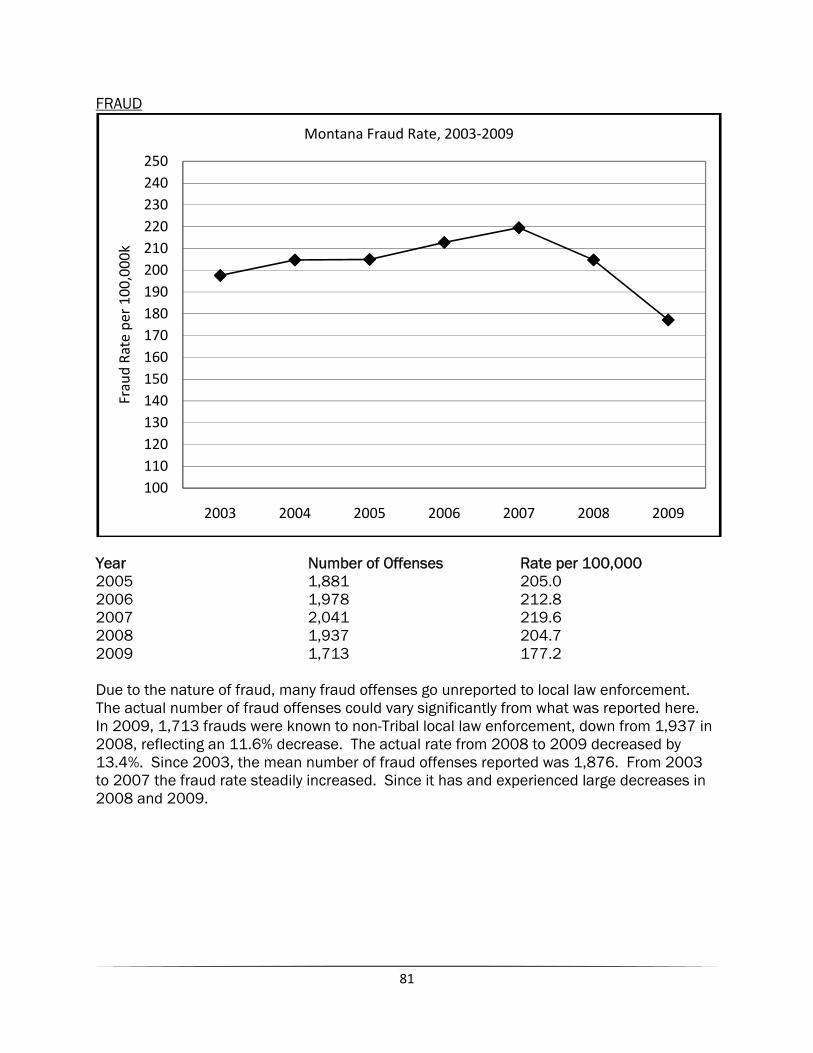
81
FRAUD
Year Number of Offenses Rate per 100,000 2005 1,881 205.0 2006 1,978 212.8 2007 2,041 219.6 2008 1,937 204.7 2009 1,713 177.2 Due to the nature of fraud, many fraud offenses go unreported to local law enforcement. The actual number of fraud offenses could vary significantly from what was reported here. In 2009, 1,713 frauds were known to non-Tribal local law enforcement, down from 1,937 in 2008, reflecting an 11.6% decrease. The actual rate from 2008 to 2009 decreased by 13.4%. Since 2003, the mean number of fraud offenses reported was 1,876. From 2003 to 2007 the fraud rate steadily increased. Since it has and experienced large decreases in 2008 and 2009.
100110120130140150160170180190200210220230240250
2003 2004 2005 2006 2007 2008 2009
Fraud Ra
te per 100,000k
Montana Fraud Rate, 2003‐2009
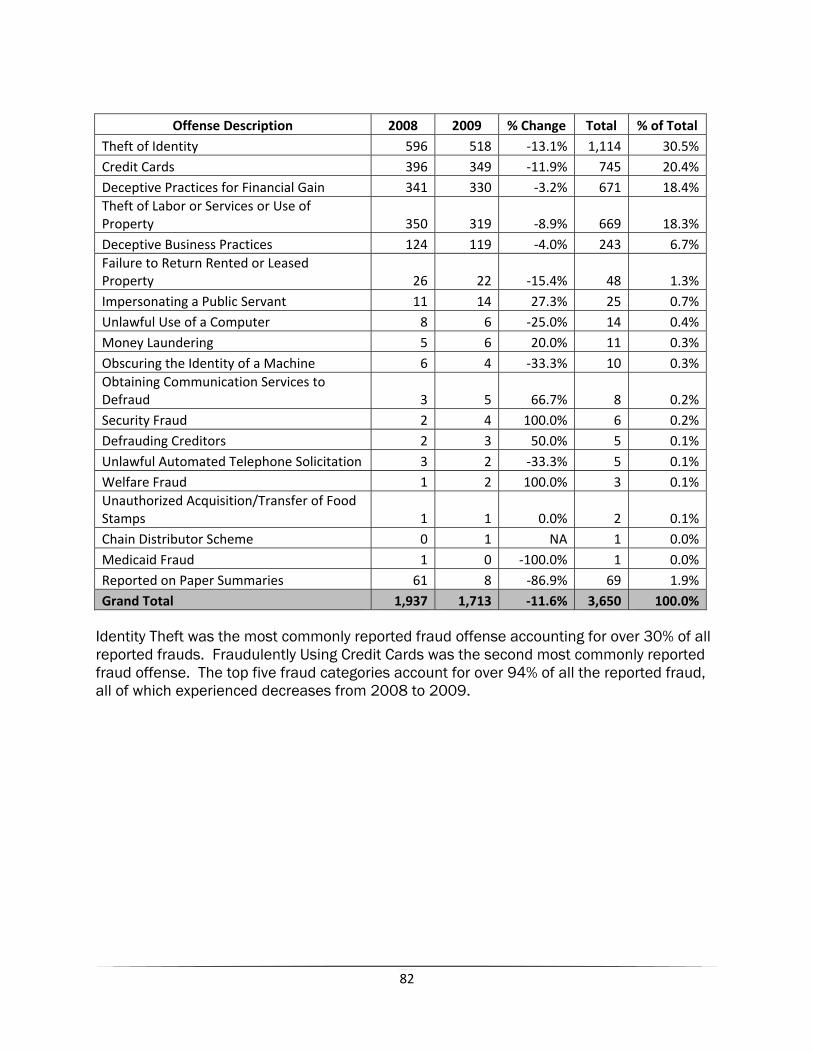
82
Offense Description 2008 2009 % Change Total % of Total
Theft of Identity 596 518 ‐13.1% 1,114 30.5%Credit Cards 396 349 ‐11.9% 745 20.4%Deceptive Practices for Financial Gain 341 330 ‐3.2% 671 18.4%Theft of Labor or Services or Use of Property 350 319 ‐8.9% 669 18.3%Deceptive Business Practices 124 119 ‐4.0% 243 6.7%Failure to Return Rented or Leased Property 26 22 ‐15.4% 48 1.3%Impersonating a Public Servant 11 14 27.3% 25 0.7%Unlawful Use of a Computer 8 6 ‐25.0% 14 0.4%Money Laundering 5 6 20.0% 11 0.3%Obscuring the Identity of a Machine 6 4 ‐33.3% 10 0.3%Obtaining Communication Services to Defraud 3 5 66.7% 8 0.2%Security Fraud 2 4 100.0% 6 0.2%Defrauding Creditors 2 3 50.0% 5 0.1%Unlawful Automated Telephone Solicitation 3 2 ‐33.3% 5 0.1%Welfare Fraud 1 2 100.0% 3 0.1%Unauthorized Acquisition/Transfer of Food Stamps 1 1 0.0% 2 0.1%Chain Distributor Scheme 0 1 NA 1 0.0%Medicaid Fraud 1 0 ‐100.0% 1 0.0%Reported on Paper Summaries 61 8 ‐86.9% 69 1.9%Grand Total 1,937 1,713 ‐11.6% 3,650 100.0%
Identity Theft was the most commonly reported fraud offense accounting for over 30% of all reported frauds. Fraudulently Using Credit Cards was the second most commonly reported fraud offense. The top five fraud categories account for over 94% of all the reported fraud, all of which experienced decreases from 2008 to 2009.
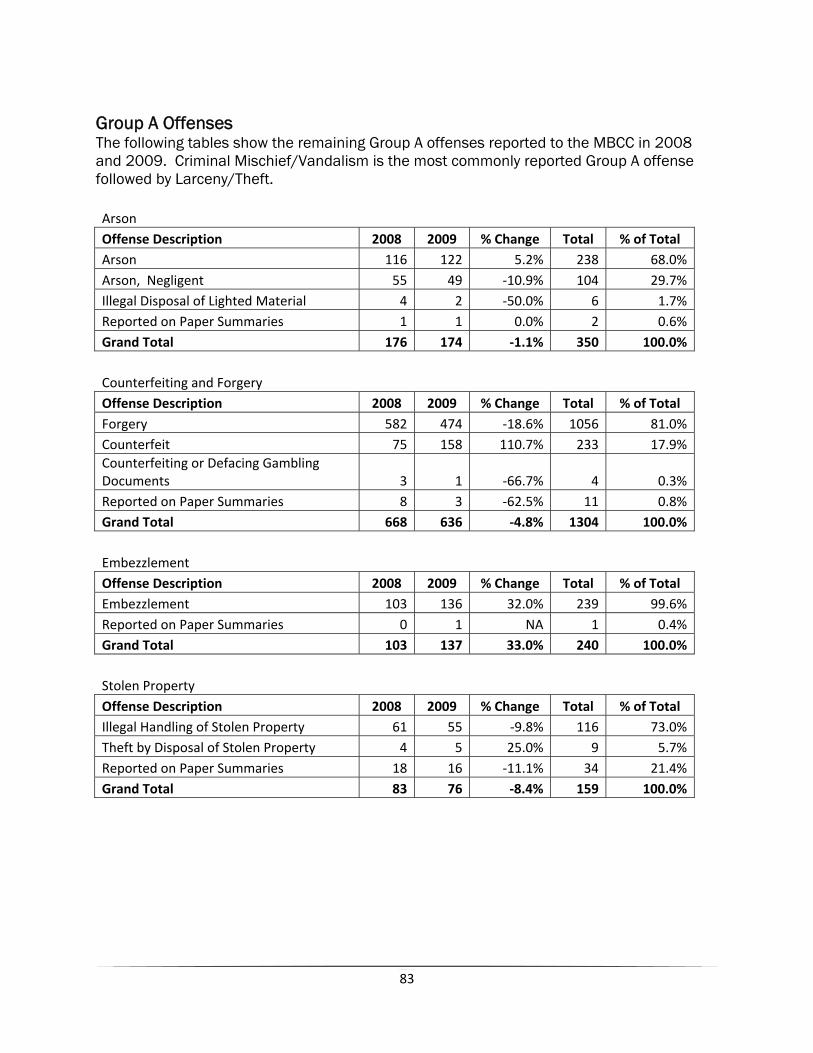
83
Group A Offenses The following tables show the remaining Group A offenses reported to the MBCC in 2008 and 2009. Criminal Mischief/Vandalism is the most commonly reported Group A offense followed by Larceny/Theft. Arson Offense Description 2008 2009 % Change Total % of Total Arson 116 122 5.2% 238 68.0%Arson, Negligent 55 49 ‐10.9% 104 29.7%Illegal Disposal of Lighted Material 4 2 ‐50.0% 6 1.7%Reported on Paper Summaries 1 1 0.0% 2 0.6%Grand Total 176 174 ‐1.1% 350 100.0%
Counterfeiting and Forgery Offense Description 2008 2009 % Change Total % of Total Forgery 582 474 ‐18.6% 1056 81.0%Counterfeit 75 158 110.7% 233 17.9%Counterfeiting or Defacing Gambling Documents 3 1 ‐66.7% 4 0.3%Reported on Paper Summaries 8 3 ‐62.5% 11 0.8%Grand Total 668 636 ‐4.8% 1304 100.0%
Embezzlement Offense Description 2008 2009 % Change Total % of Total Embezzlement 103 136 32.0% 239 99.6%Reported on Paper Summaries 0 1 NA 1 0.4%Grand Total 103 137 33.0% 240 100.0%
Stolen Property Offense Description 2008 2009 % Change Total % of Total Illegal Handling of Stolen Property 61 55 ‐9.8% 116 73.0%Theft by Disposal of Stolen Property 4 5 25.0% 9 5.7%Reported on Paper Summaries 18 16 ‐11.1% 34 21.4%Grand Total 83 76 ‐8.4% 159 100.0%
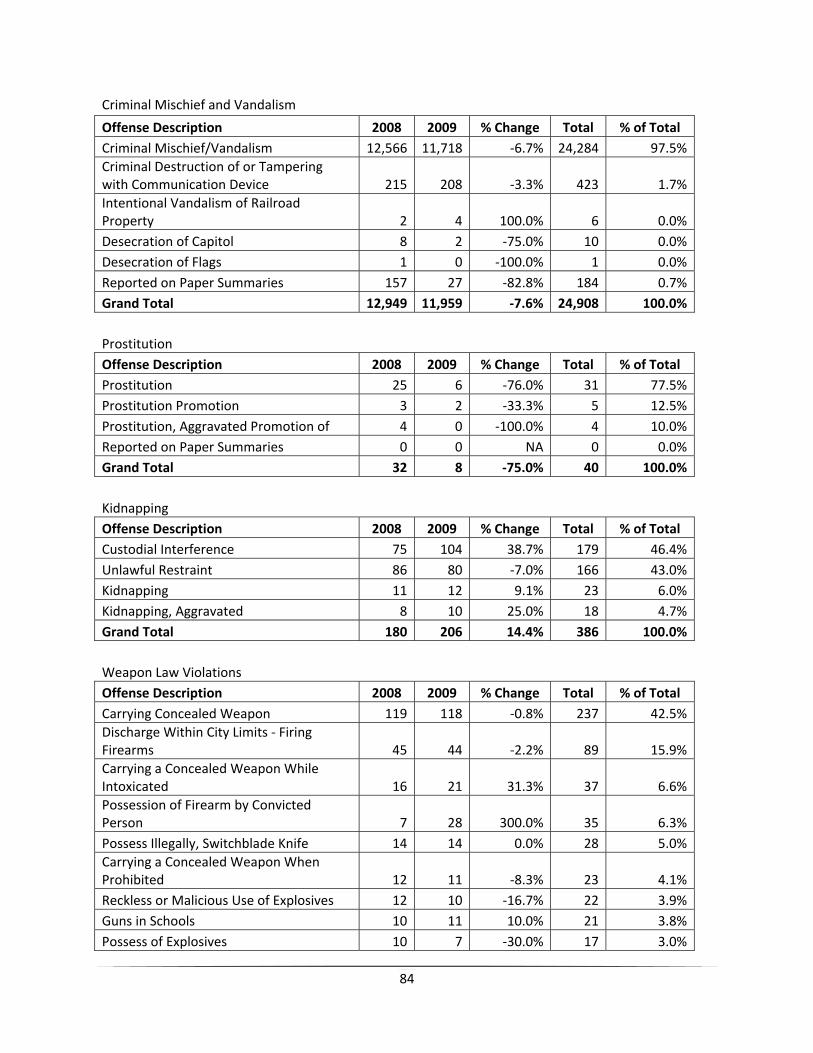
84
Criminal Mischief and Vandalism
Offense Description 2008 2009 % Change Total % of Total Criminal Mischief/Vandalism 12,566 11,718 ‐6.7% 24,284 97.5%Criminal Destruction of or Tampering with Communication Device 215 208 ‐3.3% 423 1.7%Intentional Vandalism of Railroad Property 2 4 100.0% 6 0.0%Desecration of Capitol 8 2 ‐75.0% 10 0.0%Desecration of Flags 1 0 ‐100.0% 1 0.0%Reported on Paper Summaries 157 27 ‐82.8% 184 0.7%Grand Total 12,949 11,959 ‐7.6% 24,908 100.0%
Prostitution Offense Description 2008 2009 % Change Total % of Total Prostitution 25 6 ‐76.0% 31 77.5%Prostitution Promotion 3 2 ‐33.3% 5 12.5%Prostitution, Aggravated Promotion of 4 0 ‐100.0% 4 10.0%Reported on Paper Summaries 0 0 NA 0 0.0%Grand Total 32 8 ‐75.0% 40 100.0%
Kidnapping Offense Description 2008 2009 % Change Total % of Total Custodial Interference 75 104 38.7% 179 46.4%Unlawful Restraint 86 80 ‐7.0% 166 43.0%Kidnapping 11 12 9.1% 23 6.0%Kidnapping, Aggravated 8 10 25.0% 18 4.7%Grand Total 180 206 14.4% 386 100.0%
Weapon Law Violations Offense Description 2008 2009 % Change Total % of Total Carrying Concealed Weapon 119 118 ‐0.8% 237 42.5%Discharge Within City Limits ‐ Firing Firearms 45 44 ‐2.2% 89 15.9%Carrying a Concealed Weapon While Intoxicated 16 21 31.3% 37 6.6%Possession of Firearm by Convicted Person 7 28 300.0% 35 6.3%Possess Illegally, Switchblade Knife 14 14 0.0% 28 5.0%Carrying a Concealed Weapon When Prohibited 12 11 ‐8.3% 23 4.1%Reckless or Malicious Use of Explosives 12 10 ‐16.7% 22 3.9%Guns in Schools 10 11 10.0% 21 3.8%Possess of Explosives 10 7 ‐30.0% 17 3.0%
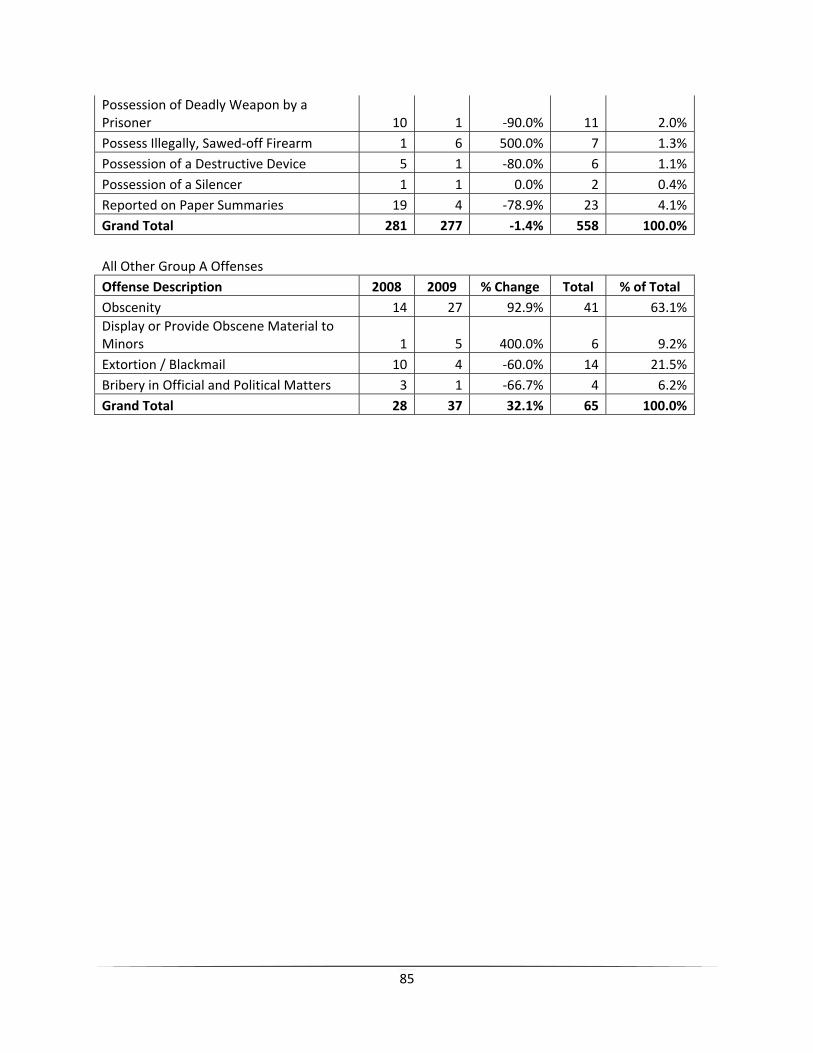
85
Possession of Deadly Weapon by a Prisoner 10 1 ‐90.0% 11 2.0%Possess Illegally, Sawed‐off Firearm 1 6 500.0% 7 1.3%Possession of a Destructive Device 5 1 ‐80.0% 6 1.1%Possession of a Silencer 1 1 0.0% 2 0.4%Reported on Paper Summaries 19 4 ‐78.9% 23 4.1%Grand Total 281 277 ‐1.4% 558 100.0%
All Other Group A Offenses Offense Description 2008 2009 % Change Total % of Total Obscenity 14 27 92.9% 41 63.1%Display or Provide Obscene Material to Minors 1 5 400.0% 6 9.2%Extortion / Blackmail 10 4 ‐60.0% 14 21.5%Bribery in Official and Political Matters 3 1 ‐66.7% 4 6.2%Grand Total 28 37 32.1% 65 100.0%
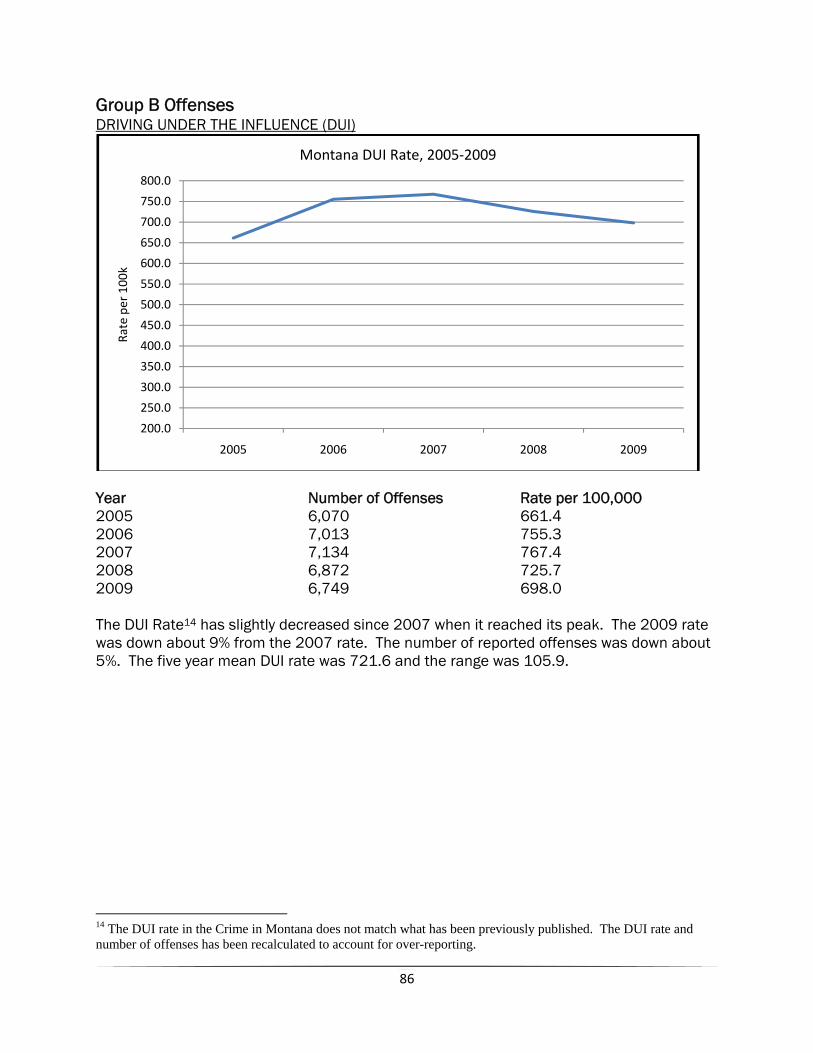
86
Group B Offenses DRIVING UNDER THE INFLUENCE (DUI)
Year Number of Offenses Rate per 100,000 2005 6,070 661.4 2006 7,013 755.3 2007 7,134 767.4 2008 6,872 725.7 2009 6,749 698.0 The DUI Rate14 has slightly decreased since 2007 when it reached its peak. The 2009 rate was down about 9% from the 2007 rate. The number of reported offenses was down about 5%. The five year mean DUI rate was 721.6 and the range was 105.9.
14 The DUI rate in the Crime in Montana does not match what has been previously published. The DUI rate and number of offenses has been recalculated to account for over-reporting.
200.0
250.0
300.0
350.0
400.0
450.0
500.0
550.0
600.0
650.0
700.0
750.0
800.0
2005 2006 2007 2008 2009
Rate per 100
k
Montana DUI Rate, 2005‐2009
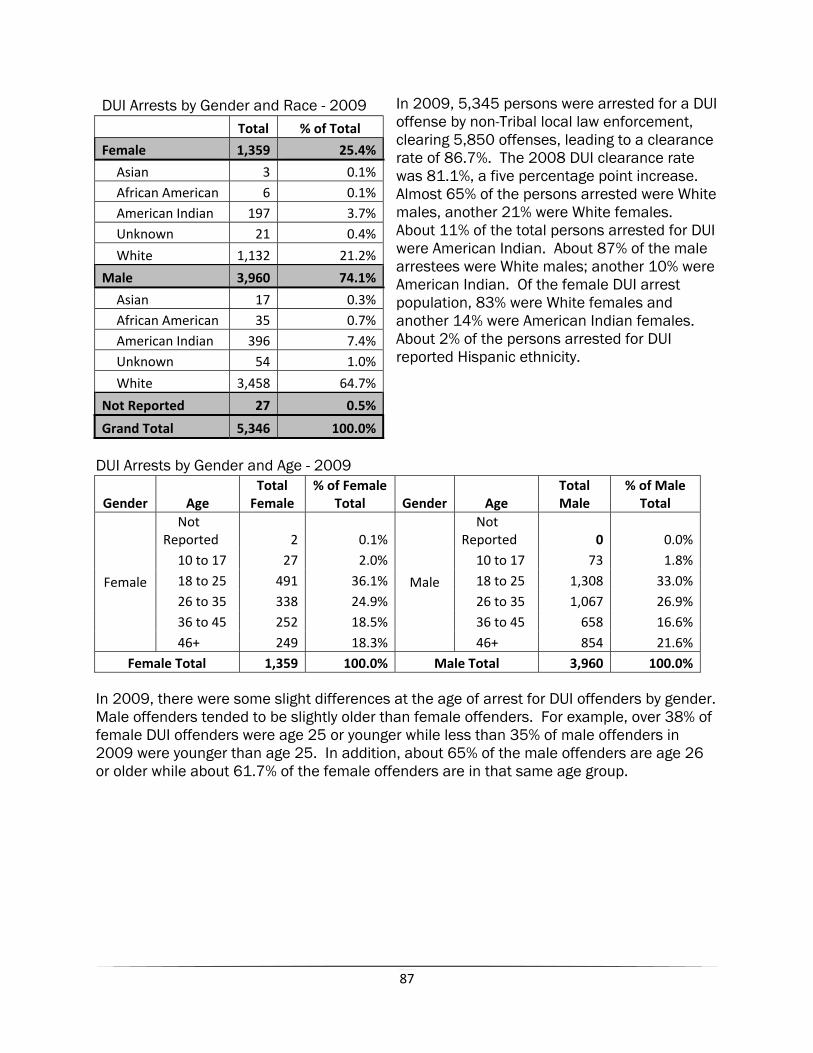
87
In 2009, 5,345 persons were arrested for a DUI offense by non-Tribal local law enforcement, clearing 5,850 offenses, leading to a clearance rate of 86.7%. The 2008 DUI clearance rate was 81.1%, a five percentage point increase. Almost 65% of the persons arrested were White males, another 21% were White females. About 11% of the total persons arrested for DUI were American Indian. About 87% of the male arrestees were White males; another 10% were American Indian. Of the female DUI arrest population, 83% were White females and another 14% were American Indian females. About 2% of the persons arrested for DUI reported Hispanic ethnicity.
DUI Arrests by Gender and Age - 2009
Gender Age Total Female
% of Female Total Gender Age
Total Male
% of Male Total
Female
Not Reported 2 0.1%
Male
Not Reported 0 0.0%
10 to 17 27 2.0% 10 to 17 73 1.8%18 to 25 491 36.1% 18 to 25 1,308 33.0%26 to 35 338 24.9% 26 to 35 1,067 26.9%36 to 45 252 18.5% 36 to 45 658 16.6%46+ 249 18.3% 46+ 854 21.6%
Female Total 1,359 100.0% Male Total 3,960 100.0% In 2009, there were some slight differences at the age of arrest for DUI offenders by gender. Male offenders tended to be slightly older than female offenders. For example, over 38% of female DUI offenders were age 25 or younger while less than 35% of male offenders in 2009 were younger than age 25. In addition, about 65% of the male offenders are age 26 or older while about 61.7% of the female offenders are in that same age group.
DUI Arrests by Gender and Race - 2009 Total % of Total
Female 1,359 25.4%
Asian 3 0.1%African American 6 0.1%American Indian 197 3.7%Unknown 21 0.4%
White 1,132 21.2%
Male 3,960 74.1%
Asian 17 0.3%African American 35 0.7%American Indian 396 7.4%Unknown 54 1.0%
White 3,458 64.7%
Not Reported 27 0.5%
Grand Total 5,346 100.0%
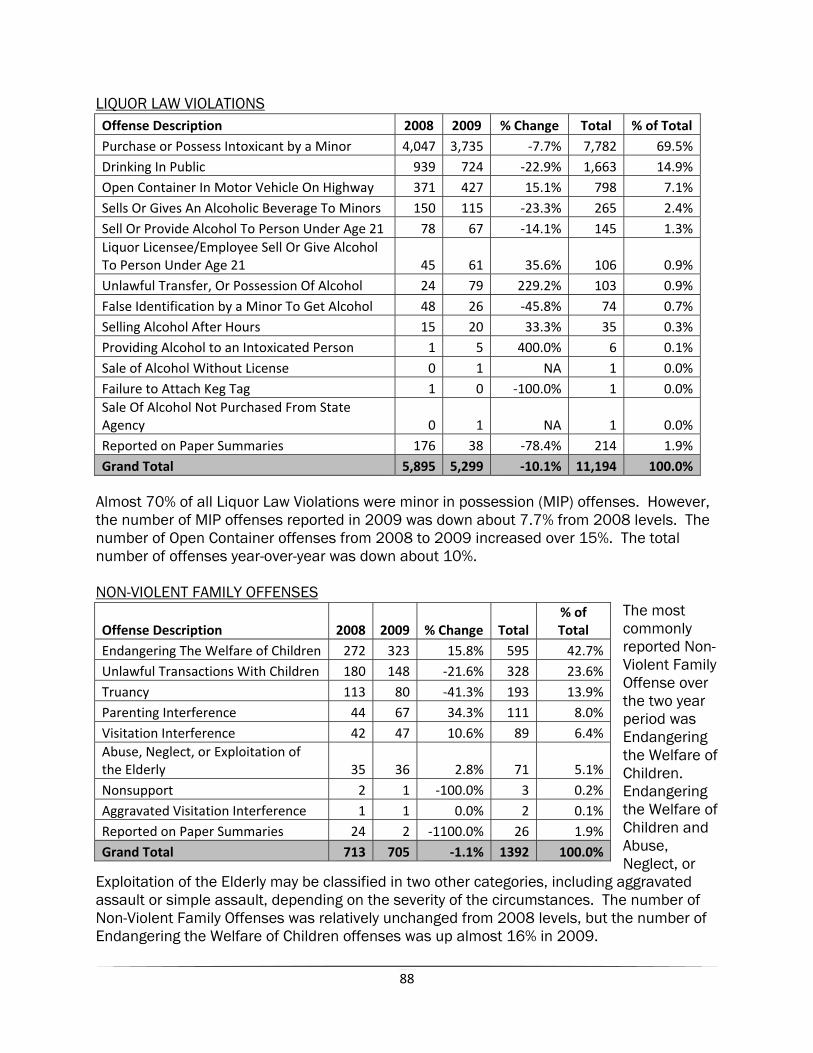
88
LIQUOR LAW VIOLATIONS Offense Description 2008 2009 % Change Total % of Total Purchase or Possess Intoxicant by a Minor 4,047 3,735 ‐7.7% 7,782 69.5%Drinking In Public 939 724 ‐22.9% 1,663 14.9%Open Container In Motor Vehicle On Highway 371 427 15.1% 798 7.1%Sells Or Gives An Alcoholic Beverage To Minors 150 115 ‐23.3% 265 2.4%Sell Or Provide Alcohol To Person Under Age 21 78 67 ‐14.1% 145 1.3%Liquor Licensee/Employee Sell Or Give Alcohol To Person Under Age 21 45 61 35.6% 106 0.9%Unlawful Transfer, Or Possession Of Alcohol 24 79 229.2% 103 0.9%False Identification by a Minor To Get Alcohol 48 26 ‐45.8% 74 0.7%Selling Alcohol After Hours 15 20 33.3% 35 0.3%Providing Alcohol to an Intoxicated Person 1 5 400.0% 6 0.1%Sale of Alcohol Without License 0 1 NA 1 0.0%Failure to Attach Keg Tag 1 0 ‐100.0% 1 0.0%Sale Of Alcohol Not Purchased From State Agency 0 1 NA 1 0.0%Reported on Paper Summaries 176 38 ‐78.4% 214 1.9%Grand Total 5,895 5,299 ‐10.1% 11,194 100.0%
Almost 70% of all Liquor Law Violations were minor in possession (MIP) offenses. However, the number of MIP offenses reported in 2009 was down about 7.7% from 2008 levels. The number of Open Container offenses from 2008 to 2009 increased over 15%. The total number of offenses year-over-year was down about 10%. NON-VIOLENT FAMILY OFFENSES
The most commonly reported Non-Violent Family Offense over the two year period was Endangering the Welfare of Children. Endangering the Welfare of Children and Abuse, Neglect, or
Exploitation of the Elderly may be classified in two other categories, including aggravated assault or simple assault, depending on the severity of the circumstances. The number of Non-Violent Family Offenses was relatively unchanged from 2008 levels, but the number of Endangering the Welfare of Children offenses was up almost 16% in 2009.
Offense Description 2008 2009 % Change Total% of Total
Endangering The Welfare of Children 272 323 15.8% 595 42.7% Unlawful Transactions With Children 180 148 ‐21.6% 328 23.6% Truancy 113 80 ‐41.3% 193 13.9% Parenting Interference 44 67 34.3% 111 8.0% Visitation Interference 42 47 10.6% 89 6.4% Abuse, Neglect, or Exploitation of the Elderly 35 36 2.8% 71 5.1% Nonsupport 2 1 ‐100.0% 3 0.2% Aggravated Visitation Interference 1 1 0.0% 2 0.1% Reported on Paper Summaries 24 2 ‐1100.0% 26 1.9% Grand Total 713 705 ‐1.1% 1392 100.0%
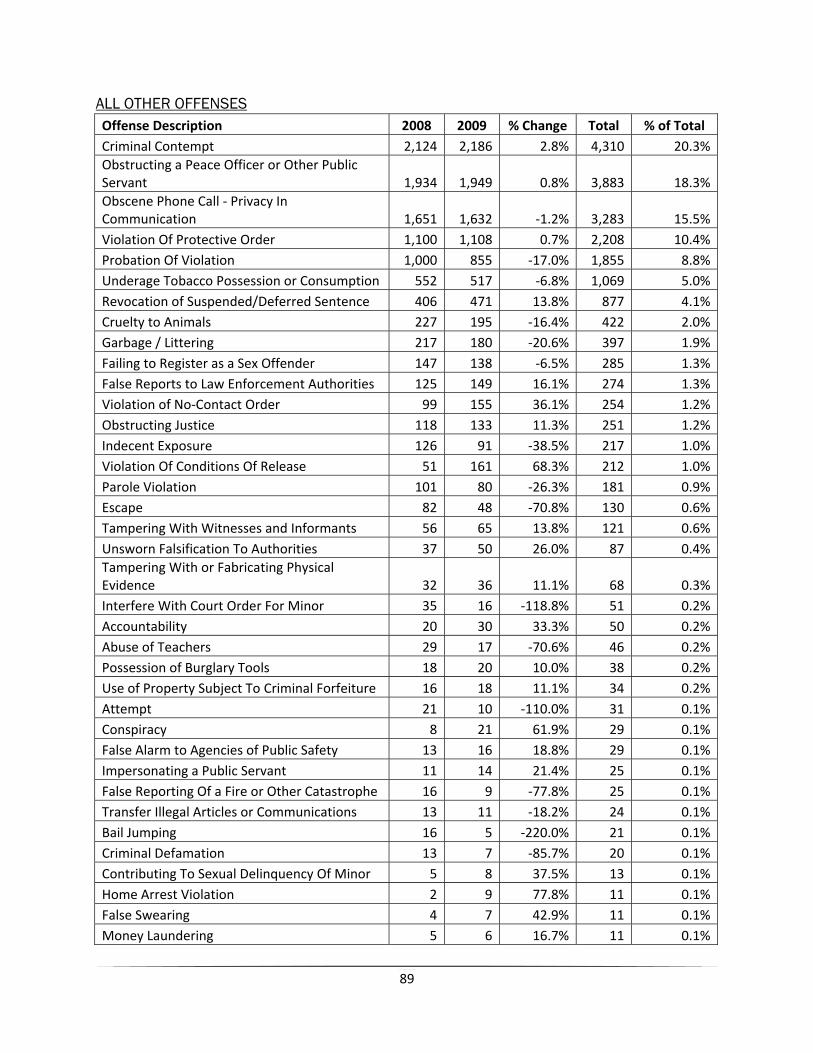
89
ALL OTHER OFFENSES Offense Description 2008 2009 % Change Total % of Total Criminal Contempt 2,124 2,186 2.8% 4,310 20.3%Obstructing a Peace Officer or Other Public Servant 1,934 1,949 0.8% 3,883 18.3%Obscene Phone Call ‐ Privacy In Communication 1,651 1,632 ‐1.2% 3,283 15.5%Violation Of Protective Order 1,100 1,108 0.7% 2,208 10.4%Probation Of Violation 1,000 855 ‐17.0% 1,855 8.8%Underage Tobacco Possession or Consumption 552 517 ‐6.8% 1,069 5.0%Revocation of Suspended/Deferred Sentence 406 471 13.8% 877 4.1%Cruelty to Animals 227 195 ‐16.4% 422 2.0%Garbage / Littering 217 180 ‐20.6% 397 1.9%Failing to Register as a Sex Offender 147 138 ‐6.5% 285 1.3%False Reports to Law Enforcement Authorities 125 149 16.1% 274 1.3%Violation of No‐Contact Order 99 155 36.1% 254 1.2%Obstructing Justice 118 133 11.3% 251 1.2%Indecent Exposure 126 91 ‐38.5% 217 1.0%Violation Of Conditions Of Release 51 161 68.3% 212 1.0%Parole Violation 101 80 ‐26.3% 181 0.9%Escape 82 48 ‐70.8% 130 0.6%Tampering With Witnesses and Informants 56 65 13.8% 121 0.6%Unsworn Falsification To Authorities 37 50 26.0% 87 0.4%Tampering With or Fabricating Physical Evidence 32 36 11.1% 68 0.3%Interfere With Court Order For Minor 35 16 ‐118.8% 51 0.2%Accountability 20 30 33.3% 50 0.2%Abuse of Teachers 29 17 ‐70.6% 46 0.2%Possession of Burglary Tools 18 20 10.0% 38 0.2%Use of Property Subject To Criminal Forfeiture 16 18 11.1% 34 0.2%Attempt 21 10 ‐110.0% 31 0.1%Conspiracy 8 21 61.9% 29 0.1%False Alarm to Agencies of Public Safety 13 16 18.8% 29 0.1%Impersonating a Public Servant 11 14 21.4% 25 0.1%False Reporting Of a Fire or Other Catastrophe 16 9 ‐77.8% 25 0.1%Transfer Illegal Articles or Communications 13 11 ‐18.2% 24 0.1%Bail Jumping 16 5 ‐220.0% 21 0.1%Criminal Defamation 13 7 ‐85.7% 20 0.1%Contributing To Sexual Delinquency Of Minor 5 8 37.5% 13 0.1%Home Arrest Violation 2 9 77.8% 11 0.1%False Swearing 4 7 42.9% 11 0.1%Money Laundering 5 6 16.7% 11 0.1%
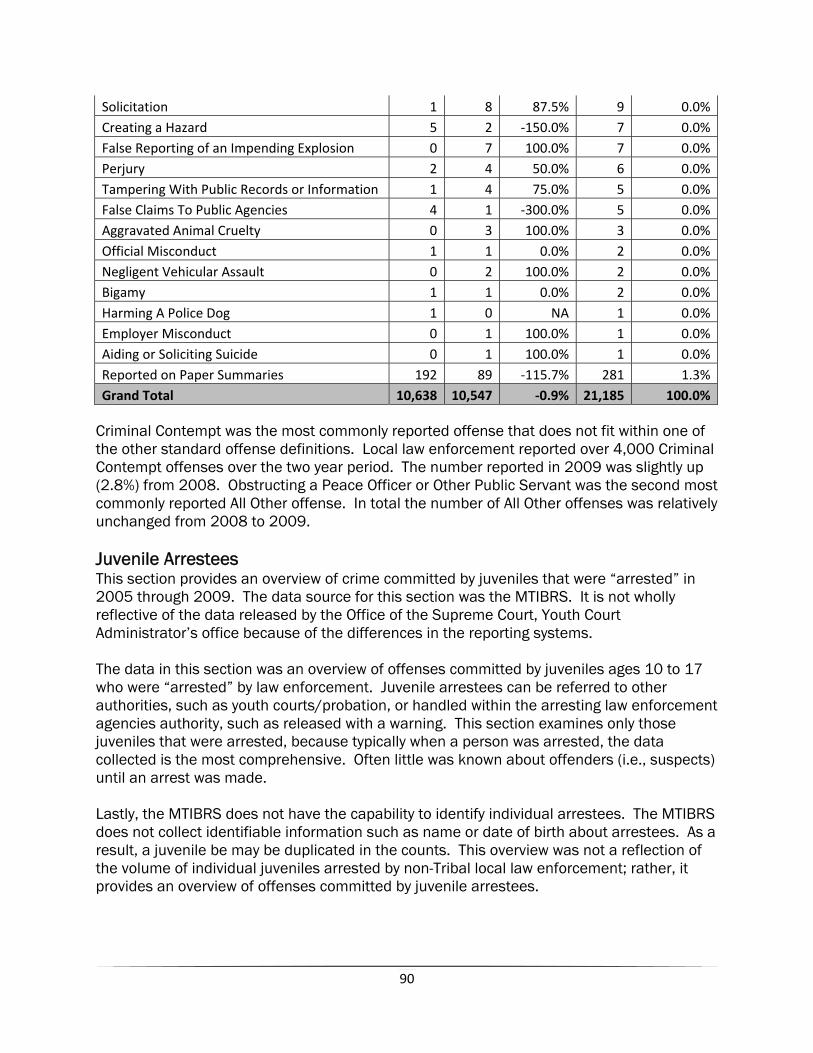
90
Solicitation 1 8 87.5% 9 0.0%Creating a Hazard 5 2 ‐150.0% 7 0.0%False Reporting of an Impending Explosion 0 7 100.0% 7 0.0%Perjury 2 4 50.0% 6 0.0%Tampering With Public Records or Information 1 4 75.0% 5 0.0%False Claims To Public Agencies 4 1 ‐300.0% 5 0.0%Aggravated Animal Cruelty 0 3 100.0% 3 0.0%Official Misconduct 1 1 0.0% 2 0.0%Negligent Vehicular Assault 0 2 100.0% 2 0.0%Bigamy 1 1 0.0% 2 0.0%Harming A Police Dog 1 0 NA 1 0.0%Employer Misconduct 0 1 100.0% 1 0.0%Aiding or Soliciting Suicide 0 1 100.0% 1 0.0%Reported on Paper Summaries 192 89 ‐115.7% 281 1.3%Grand Total 10,638 10,547 ‐0.9% 21,185 100.0%
Criminal Contempt was the most commonly reported offense that does not fit within one of the other standard offense definitions. Local law enforcement reported over 4,000 Criminal Contempt offenses over the two year period. The number reported in 2009 was slightly up (2.8%) from 2008. Obstructing a Peace Officer or Other Public Servant was the second most commonly reported All Other offense. In total the number of All Other offenses was relatively unchanged from 2008 to 2009. Juvenile Arrestees This section provides an overview of crime committed by juveniles that were “arrested” in 2005 through 2009. The data source for this section was the MTIBRS. It is not wholly reflective of the data released by the Office of the Supreme Court, Youth Court Administrator’s office because of the differences in the reporting systems. The data in this section was an overview of offenses committed by juveniles ages 10 to 17 who were “arrested” by law enforcement. Juvenile arrestees can be referred to other authorities, such as youth courts/probation, or handled within the arresting law enforcement agencies authority, such as released with a warning. This section examines only those juveniles that were arrested, because typically when a person was arrested, the data collected is the most comprehensive. Often little was known about offenders (i.e., suspects) until an arrest was made. Lastly, the MTIBRS does not have the capability to identify individual arrestees. The MTIBRS does not collect identifiable information such as name or date of birth about arrestees. As a result, a juvenile be may be duplicated in the counts. This overview was not a reflection of the volume of individual juveniles arrested by non-Tribal local law enforcement; rather, it provides an overview of offenses committed by juvenile arrestees.
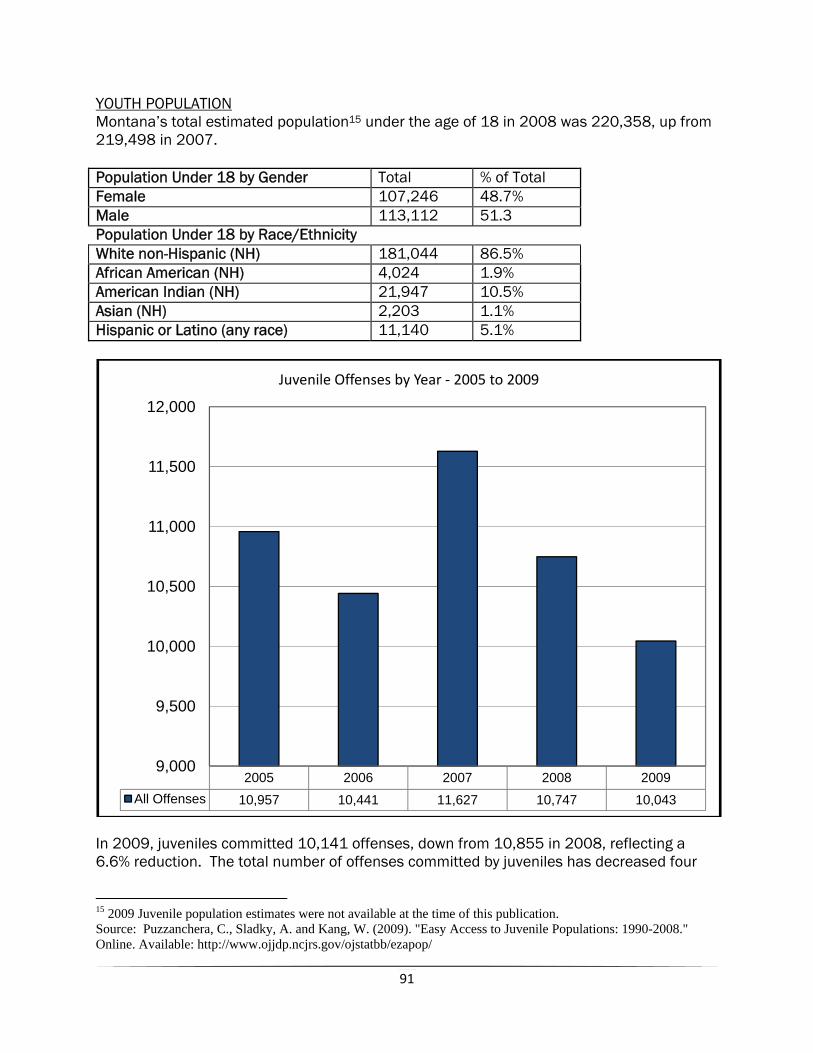
91
YOUTH POPULATION Montana’s total estimated population15 under the age of 18 in 2008 was 220,358, up from 219,498 in 2007. Population Under 18 by Gender Total % of Total Female 107,246 48.7% Male 113,112 51.3 Population Under 18 by Race/Ethnicity White non-Hispanic (NH) 181,044 86.5% African American (NH) 4,024 1.9% American Indian (NH) 21,947 10.5% Asian (NH) 2,203 1.1% Hispanic or Latino (any race) 11,140 5.1%
In 2009, juveniles committed 10,141 offenses, down from 10,855 in 2008, reflecting a 6.6% reduction. The total number of offenses committed by juveniles has decreased four
15 2009 Juvenile population estimates were not available at the time of this publication. Source: Puzzanchera, C., Sladky, A. and Kang, W. (2009). "Easy Access to Juvenile Populations: 1990-2008." Online. Available: http://www.ojjdp.ncjrs.gov/ojstatbb/ezapop/
2005 2006 2007 2008 2009All Offenses 10,957 10,441 11,627 10,747 10,043
9,000
9,500
10,000
10,500
11,000
11,500
12,000
Juvenile Offenses by Year ‐ 2005 to 2009
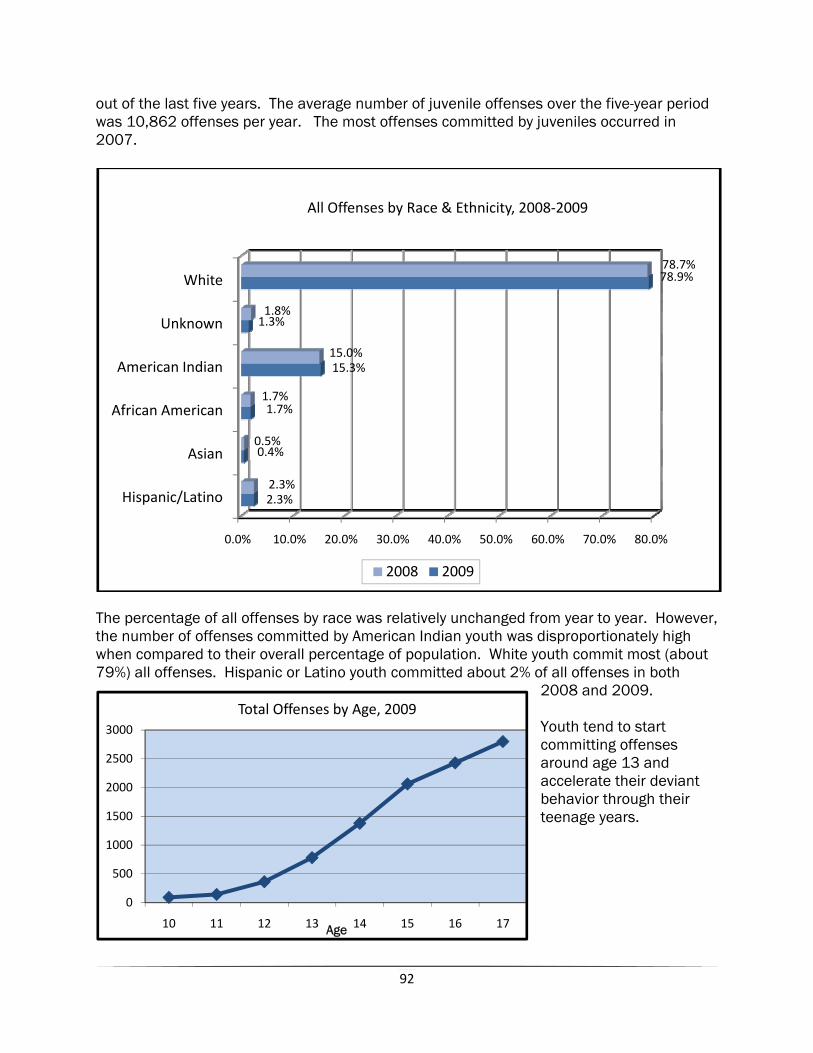
92
0
500
1000
1500
2000
2500
3000
10 11 12 13 14 15 16 17Age
Total Offenses by Age, 2009
out of the last five years. The average number of juvenile offenses over the five-year period was 10,862 offenses per year. The most offenses committed by juveniles occurred in 2007.
The percentage of all offenses by race was relatively unchanged from year to year. However, the number of offenses committed by American Indian youth was disproportionately high when compared to their overall percentage of population. White youth commit most (about 79%) all offenses. Hispanic or Latino youth committed about 2% of all offenses in both
2008 and 2009. Youth tend to start committing offenses around age 13 and accelerate their deviant behavior through their teenage years.
0.0% 10.0% 20.0% 30.0% 40.0% 50.0% 60.0% 70.0% 80.0%
Hispanic/Latino
Asian
African American
American Indian
Unknown
White
2.3%
0.4%
1.7%
15.3%
1.3%
78.9%
2.3%
0.5%
1.7%
15.0%
1.8%
78.7%
All Offenses by Race & Ethnicity, 2008‐2009
2008 2009
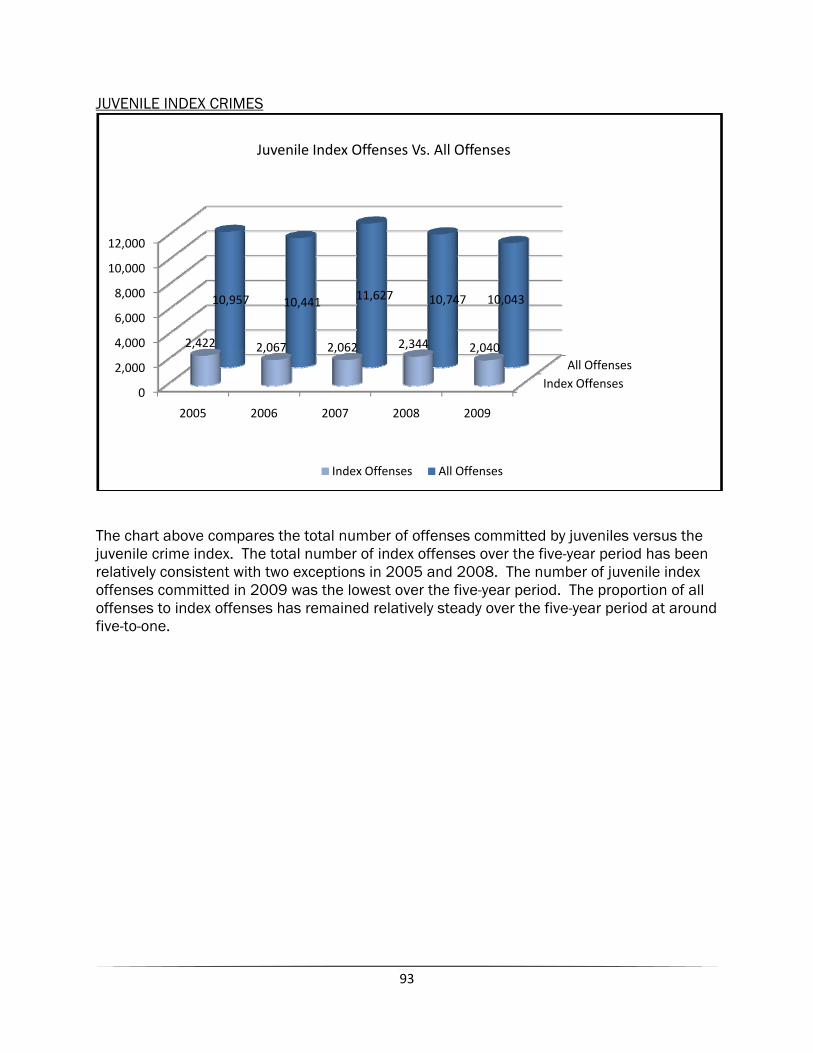
93
JUVENILE INDEX CRIMES
The chart above compares the total number of offenses committed by juveniles versus the juvenile crime index. The total number of index offenses over the five-year period has been relatively consistent with two exceptions in 2005 and 2008. The number of juvenile index offenses committed in 2009 was the lowest over the five-year period. The proportion of all offenses to index offenses has remained relatively steady over the five-year period at around five-to-one.
Index OffensesAll Offenses
0
2,000
4,000
6,000
8,000
10,000
12,000
2005 2006 2007 2008 2009
2,422 2,067 2,062 2,344 2,040
10,957 10,441 11,627 10,747 10,043
Juvenile Index Offenses Vs. All Offenses
Index Offenses All Offenses
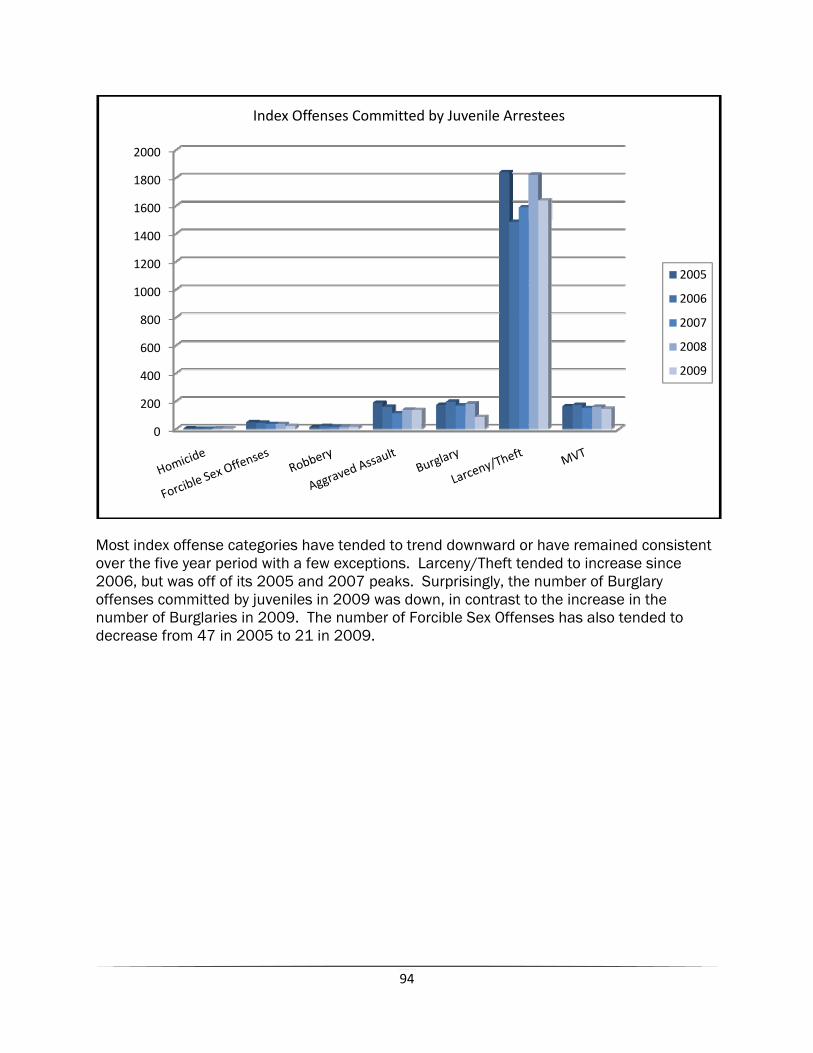
94
Most index offense categories have tended to trend downward or have remained consistent over the five year period with a few exceptions. Larceny/Theft tended to increase since 2006, but was off of its 2005 and 2007 peaks. Surprisingly, the number of Burglary offenses committed by juveniles in 2009 was down, in contrast to the increase in the number of Burglaries in 2009. The number of Forcible Sex Offenses has also tended to decrease from 47 in 2005 to 21 in 2009.
0
200
400
600
800
1000
1200
1400
1600
1800
2000
Index Offenses Committed by Juvenile Arrestees
2005
2006
2007
2008
2009
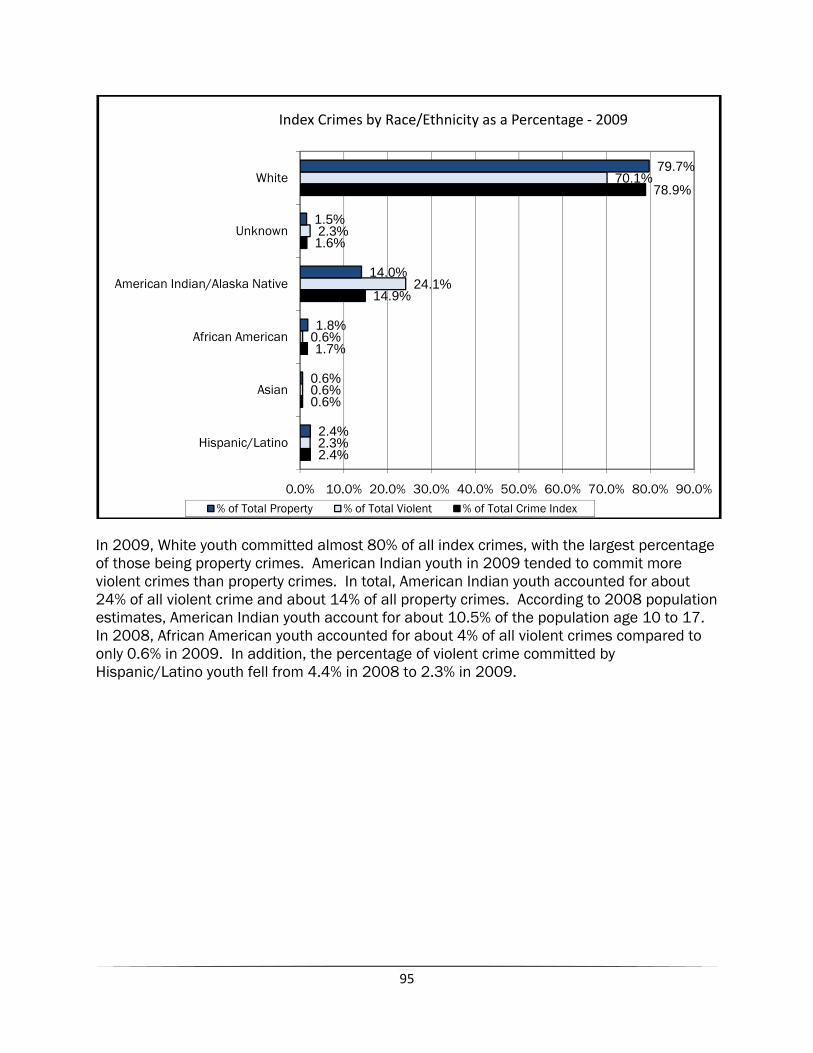
95
In 2009, White youth committed almost 80% of all index crimes, with the largest percentage of those being property crimes. American Indian youth in 2009 tended to commit more violent crimes than property crimes. In total, American Indian youth accounted for about 24% of all violent crime and about 14% of all property crimes. According to 2008 population estimates, American Indian youth account for about 10.5% of the population age 10 to 17. In 2008, African American youth accounted for about 4% of all violent crimes compared to only 0.6% in 2009. In addition, the percentage of violent crime committed by Hispanic/Latino youth fell from 4.4% in 2008 to 2.3% in 2009.
2.4%
0.6%
1.7%
14.9%
1.6%
78.9%
2.3%
0.6%
0.6%
24.1%
2.3%
70.1%
2.4%
0.6%
1.8%
14.0%
1.5%
79.7%
0.0% 10.0% 20.0% 30.0% 40.0% 50.0% 60.0% 70.0% 80.0% 90.0%
Hispanic/Latino
Asian
African American
American Indian/Alaska Native
Unknown
White
Index Crimes by Race/Ethnicity as a Percentage ‐ 2009
% of Total Property % of Total Violent % of Total Crime Index
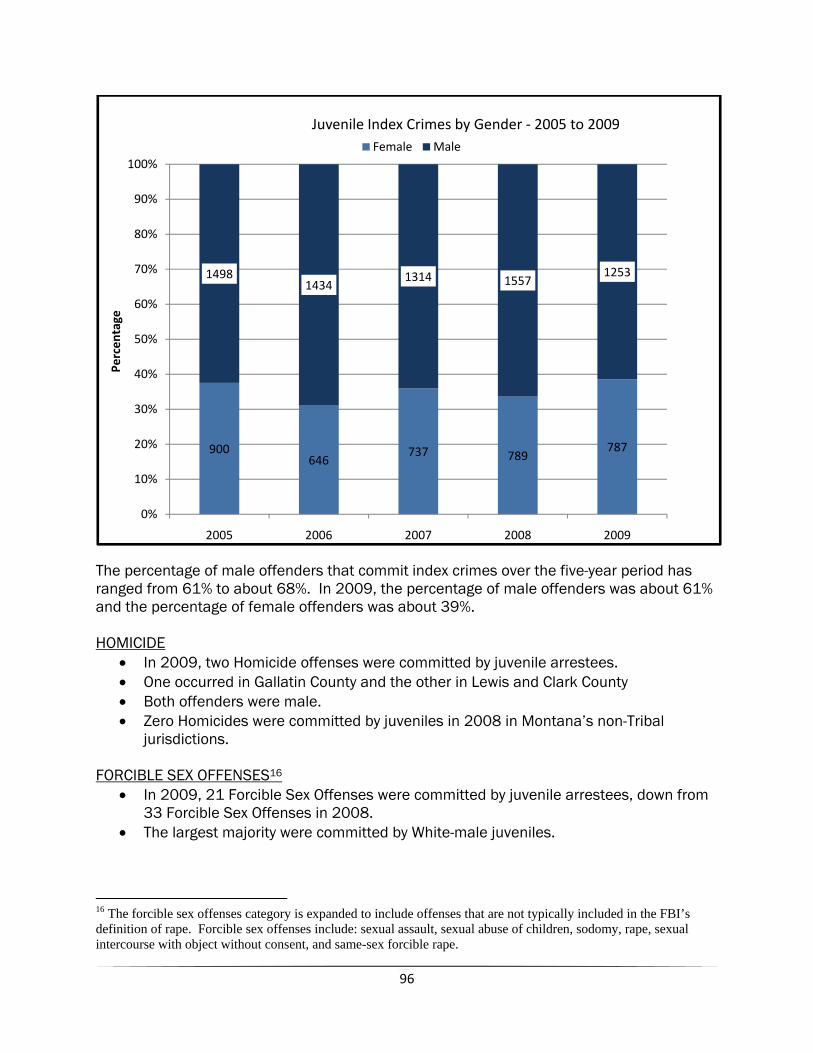
96
The percentage of male offenders that commit index crimes over the five-year period has ranged from 61% to about 68%. In 2009, the percentage of male offenders was about 61% and the percentage of female offenders was about 39%. HOMICIDE
• In 2009, two Homicide offenses were committed by juvenile arrestees. • One occurred in Gallatin County and the other in Lewis and Clark County • Both offenders were male. • Zero Homicides were committed by juveniles in 2008 in Montana’s non-Tribal
jurisdictions. FORCIBLE SEX OFFENSES16
• In 2009, 21 Forcible Sex Offenses were committed by juvenile arrestees, down from 33 Forcible Sex Offenses in 2008.
• The largest majority were committed by White-male juveniles.
16 The forcible sex offenses category is expanded to include offenses that are not typically included in the FBI’s definition of rape. Forcible sex offenses include: sexual assault, sexual abuse of children, sodomy, rape, sexual intercourse with object without consent, and same-sex forcible rape.
900646
737 789787
14981434
1314 15571253
0%
10%
20%
30%
40%
50%
60%
70%
80%
90%
100%
2005 2006 2007 2008 2009
Percen
tage
Juvenile Index Crimes by Gender ‐ 2005 to 2009Female Male
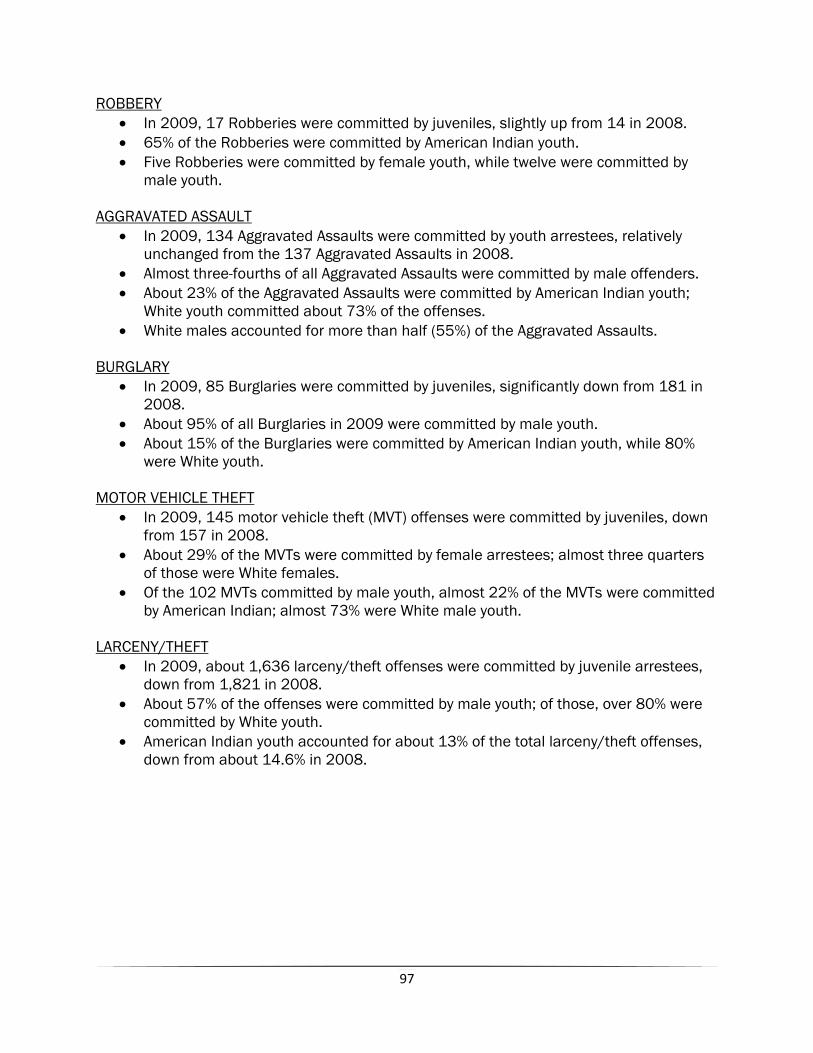
97
ROBBERY • In 2009, 17 Robberies were committed by juveniles, slightly up from 14 in 2008. • 65% of the Robberies were committed by American Indian youth. • Five Robberies were committed by female youth, while twelve were committed by
male youth. AGGRAVATED ASSAULT
• In 2009, 134 Aggravated Assaults were committed by youth arrestees, relatively unchanged from the 137 Aggravated Assaults in 2008.
• Almost three-fourths of all Aggravated Assaults were committed by male offenders. • About 23% of the Aggravated Assaults were committed by American Indian youth;
White youth committed about 73% of the offenses. • White males accounted for more than half (55%) of the Aggravated Assaults.
BURGLARY
• In 2009, 85 Burglaries were committed by juveniles, significantly down from 181 in 2008.
• About 95% of all Burglaries in 2009 were committed by male youth. • About 15% of the Burglaries were committed by American Indian youth, while 80%
were White youth. MOTOR VEHICLE THEFT
• In 2009, 145 motor vehicle theft (MVT) offenses were committed by juveniles, down from 157 in 2008.
• About 29% of the MVTs were committed by female arrestees; almost three quarters of those were White females.
• Of the 102 MVTs committed by male youth, almost 22% of the MVTs were committed by American Indian; almost 73% were White male youth.
LARCENY/THEFT
• In 2009, about 1,636 larceny/theft offenses were committed by juvenile arrestees, down from 1,821 in 2008.
• About 57% of the offenses were committed by male youth; of those, over 80% were committed by White youth.
• American Indian youth accounted for about 13% of the total larceny/theft offenses, down from about 14.6% in 2008.
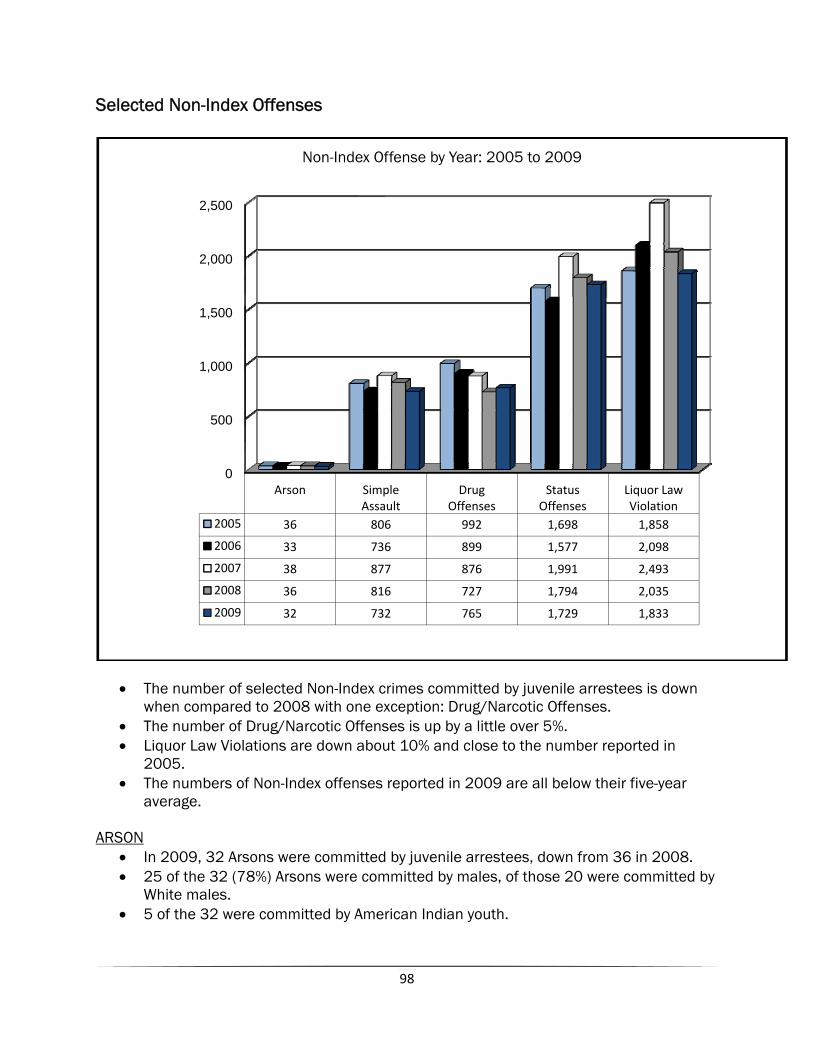
98
Selected Non-Index Offenses
• The number of selected Non-Index crimes committed by juvenile arrestees is down when compared to 2008 with one exception: Drug/Narcotic Offenses.
• The number of Drug/Narcotic Offenses is up by a little over 5%. • Liquor Law Violations are down about 10% and close to the number reported in
2005. • The numbers of Non-Index offenses reported in 2009 are all below their five-year
average. ARSON
• In 2009, 32 Arsons were committed by juvenile arrestees, down from 36 in 2008. • 25 of the 32 (78%) Arsons were committed by males, of those 20 were committed by
White males. • 5 of the 32 were committed by American Indian youth.
0
500
1,000
1,500
2,000
2,500
Arson Simple Assault
Drug Offenses
Status Offenses
Liquor Law Violation
2005 36 806 992 1,698 1,858
2006 33 736 899 1,577 2,098
2007 38 877 876 1,991 2,493
2008 36 816 727 1,794 2,035
2009 32 732 765 1,729 1,833
Non-Index Offense by Year: 2005 to 2009
99
SIMPLE ASSAULT • Almost two out of three Simple Assaults are committed by male youth; a little over
half were White male youth. • American Indian youth accounted for about 19% of all Simple Assaults. • African American youth accounted for almost 4% of the Simple Assaults. • In 2008, about 25% of all Simple Assaults were committed by females, compared to
35% in 2009.
DRUG/NARCOTIC OFFENSES • In 2009, 765 Drug/Narcotic Offenses were committed by arrested juveniles, up from
727 in 2008 but down significantly from 992 in 2005. • Male youth accounted for about 76% of all Drug/Narcotic Offenses committed by
juveniles. • Of the 585 offenses committed by male youth in 2009, White males committed 523
drug/narcotic offenses. • Of the 180 offense committed by female youth in 2009, White females account for
142 (79%) and American Indian females account for 33 (18.3%). • Of the youth arrested with drug property seized, most youth (87.2%) had marijuana
on their person. • 328 (42.8%) Drug/Narcotic Offenses were classified as Possession of Dangerous
Drugs. • 360 (47%) Drug/Narcotic Offenses were classified as Possession of Drug
Paraphernalia. STATUS OFFENSES
• In 2009, 1,729 Status Offenses were committed by youth, down from 1,794 in 2008. • More than half 57% of the Status Offenses were committed by male youth. • The most commonly reported status offense was Runaway, accounting for about 33%
of the 1,729 reported offenses. • Underage Tobacco Consumption was the second most commonly reported Status
Offense, accounting for about 29% of the total. LIQUOR LAW VIOLATIONS
• 1,833 Liquor Law Violations were committed by youth arrestees in 2009 down from 2,035 in 2008.
• In 2009, 1,077 (58.7%) Liquor Law Violations were committed by male youth of those, 77% were White males and 19% were American Indian.
• 756 (41.2%) were committed by female youth of those, almost 80% were White and 17% were American Indian.
• Almost all Liquor Law Violations committed by youth were classified as Purchase or Possess Intoxicant by a Minor (MIP).
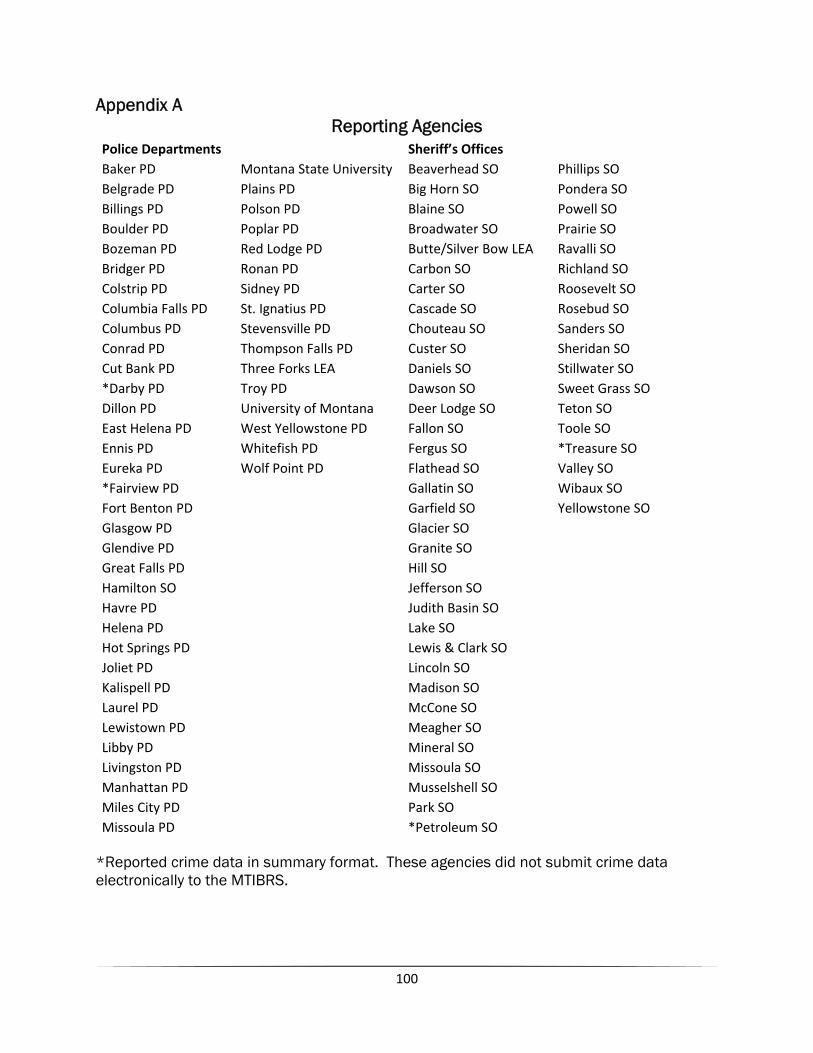
100
Appendix A Reporting Agencies
Police Departments Sheriff’s Offices Baker PD Montana State University Beaverhead SO Phillips SO Belgrade PD Plains PD Big Horn SO Pondera SO Billings PD Polson PD Blaine SO Powell SO Boulder PD Poplar PD Broadwater SO Prairie SO Bozeman PD Red Lodge PD Butte/Silver Bow LEA Ravalli SO Bridger PD Ronan PD Carbon SO Richland SO Colstrip PD Sidney PD Carter SO Roosevelt SO Columbia Falls PD St. Ignatius PD Cascade SO Rosebud SO Columbus PD Stevensville PD Chouteau SO Sanders SO Conrad PD Thompson Falls PD Custer SO Sheridan SO Cut Bank PD Three Forks LEA Daniels SO Stillwater SO *Darby PD Troy PD Dawson SO Sweet Grass SO Dillon PD University of Montana Deer Lodge SO Teton SO East Helena PD West Yellowstone PD Fallon SO Toole SO Ennis PD Whitefish PD Fergus SO *Treasure SO Eureka PD Wolf Point PD Flathead SO Valley SO *Fairview PD Gallatin SO Wibaux SO Fort Benton PD Garfield SO Yellowstone SO Glasgow PD Glacier SO Glendive PD Granite SO Great Falls PD Hill SO Hamilton SO Jefferson SO Havre PD Judith Basin SO Helena PD Lake SO Hot Springs PD Lewis & Clark SO Joliet PD Lincoln SO Kalispell PD Madison SO Laurel PD McCone SO Lewistown PD Meagher SO Libby PD Mineral SO Livingston PD Missoula SO Manhattan PD Musselshell SO Miles City PD Park SO Missoula PD *Petroleum SO
*Reported crime data in summary format. These agencies did not submit crime data electronically to the MTIBRS.
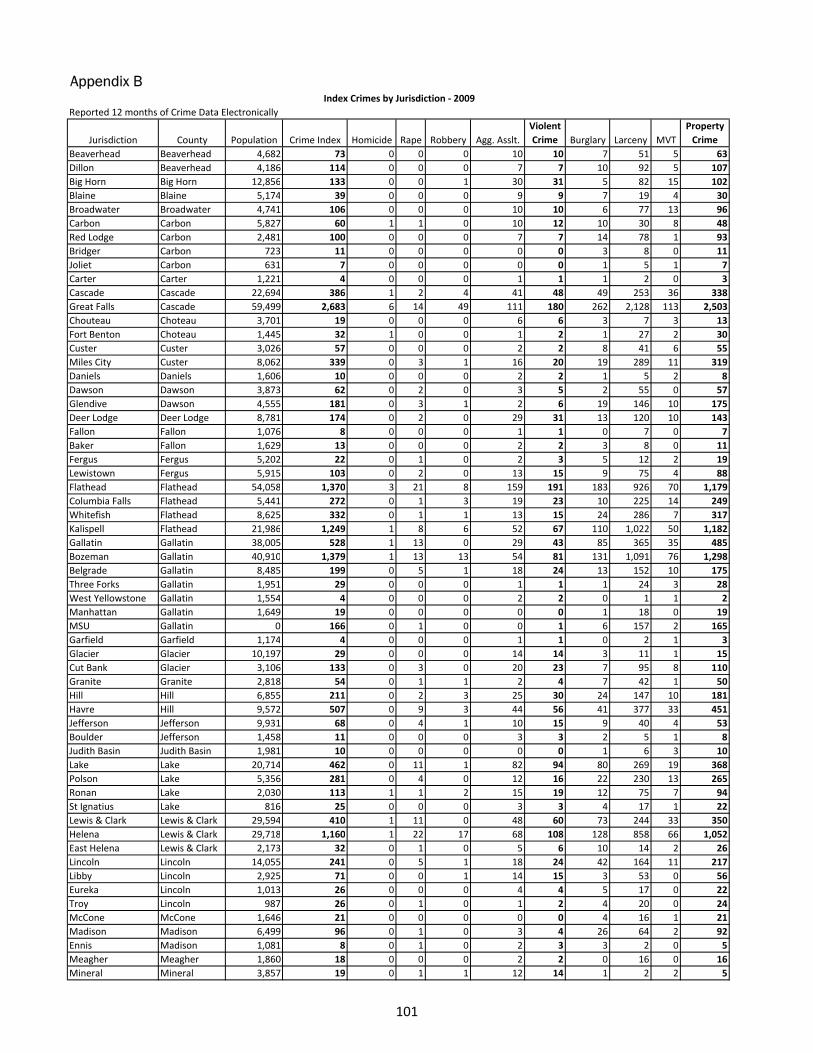
Appendix B
Reported 12 months of Crime Data Electronically
Jurisdiction County Population Crime Index Homicide Rape Robbery Agg. Asslt.Violent Crime Burglary Larceny MVT
Property Crime
Beaverhead Beaverhead 4,682 73 0 0 0 10 10 7 51 5 63Dillon Beaverhead 4,186 114 0 0 0 7 7 10 92 5 107Big Horn Big Horn 12,856 133 0 0 1 30 31 5 82 15 102Blaine Blaine 5,174 39 0 0 0 9 9 7 19 4 30Broadwater Broadwater 4,741 106 0 0 0 10 10 6 77 13 96Carbon Carbon 5,827 60 1 1 0 10 12 10 30 8 48Red Lodge Carbon 2,481 100 0 0 0 7 7 14 78 1 93Bridger Carbon 723 11 0 0 0 0 0 3 8 0 11Joliet Carbon 631 7 0 0 0 0 0 1 5 1 7Carter Carter 1,221 4 0 0 0 1 1 1 2 0 3Cascade Cascade 22,694 386 1 2 4 41 48 49 253 36 338Great Falls Cascade 59,499 2,683 6 14 49 111 180 262 2,128 113 2,503Chouteau Choteau 3,701 19 0 0 0 6 6 3 7 3 13Fort Benton Choteau 1,445 32 1 0 0 1 2 1 27 2 30Custer Custer 3,026 57 0 0 0 2 2 8 41 6 55Miles City Custer 8,062 339 0 3 1 16 20 19 289 11 319Daniels Daniels 1,606 10 0 0 0 2 2 1 5 2 8Dawson Dawson 3,873 62 0 2 0 3 5 2 55 0 57Glendive Dawson 4,555 181 0 3 1 2 6 19 146 10 175Deer Lodge Deer Lodge 8,781 174 0 2 0 29 31 13 120 10 143Fallon Fallon 1,076 8 0 0 0 1 1 0 7 0 7Baker Fallon 1,629 13 0 0 0 2 2 3 8 0 11Fergus Fergus 5,202 22 0 1 0 2 3 5 12 2 19Lewistown Fergus 5,915 103 0 2 0 13 15 9 75 4 88Flathead Flathead 54,058 1,370 3 21 8 159 191 183 926 70 1,179Columbia Falls Flathead 5,441 272 0 1 3 19 23 10 225 14 249Whitefish Flathead 8,625 332 0 1 1 13 15 24 286 7 317Kalispell Flathead 21,986 1,249 1 8 6 52 67 110 1,022 50 1,182Gallatin Gallatin 38,005 528 1 13 0 29 43 85 365 35 485Bozeman Gallatin 40,910 1,379 1 13 13 54 81 131 1,091 76 1,298Belgrade Gallatin 8,485 199 0 5 1 18 24 13 152 10 175Three Forks Gallatin 1,951 29 0 0 0 1 1 1 24 3 28West Yellowstone Gallatin 1,554 4 0 0 0 2 2 0 1 1 2Manhattan Gallatin 1,649 19 0 0 0 0 0 1 18 0 19MSU Gallatin 0 166 0 1 0 0 1 6 157 2 165Garfield Garfield 1,174 4 0 0 0 1 1 0 2 1 3Glacier Glacier 10,197 29 0 0 0 14 14 3 11 1 15Cut Bank Glacier 3,106 133 0 3 0 20 23 7 95 8 110Granite Granite 2,818 54 0 1 1 2 4 7 42 1 50Hill Hill 6,855 211 0 2 3 25 30 24 147 10 181Havre Hill 9,572 507 0 9 3 44 56 41 377 33 451Jefferson Jefferson 9,931 68 0 4 1 10 15 9 40 4 53Boulder Jefferson 1,458 11 0 0 0 3 3 2 5 1 8Judith Basin Judith Basin 1,981 10 0 0 0 0 0 1 6 3 10Lake Lake 20,714 462 0 11 1 82 94 80 269 19 368Polson Lake 5,356 281 0 4 0 12 16 22 230 13 265Ronan Lake 2,030 113 1 1 2 15 19 12 75 7 94St Ignatius Lake 816 25 0 0 0 3 3 4 17 1 22Lewis & Clark Lewis & Clark 29,594 410 1 11 0 48 60 73 244 33 350Helena Lewis & Clark 29,718 1,160 1 22 17 68 108 128 858 66 1,052East Helena Lewis & Clark 2,173 32 0 1 0 5 6 10 14 2 26Lincoln Lincoln 14,055 241 0 5 1 18 24 42 164 11 217Libby Lincoln 2,925 71 0 0 1 14 15 3 53 0 56Eureka Lincoln 1,013 26 0 0 0 4 4 5 17 0 22Troy Lincoln 987 26 0 1 0 1 2 4 20 0 24McCone McCone 1,646 21 0 0 0 0 0 4 16 1 21Madison Madison 6,499 96 0 1 0 3 4 26 64 2 92Ennis Madison 1,081 8 0 1 0 2 3 3 2 0 5Meagher Meagher 1,860 18 0 0 0 2 2 0 16 0 16Mineral Mineral 3,857 19 0 1 1 12 14 1 2 2 5
Index Crimes by Jurisdiction ‐ 2009
101
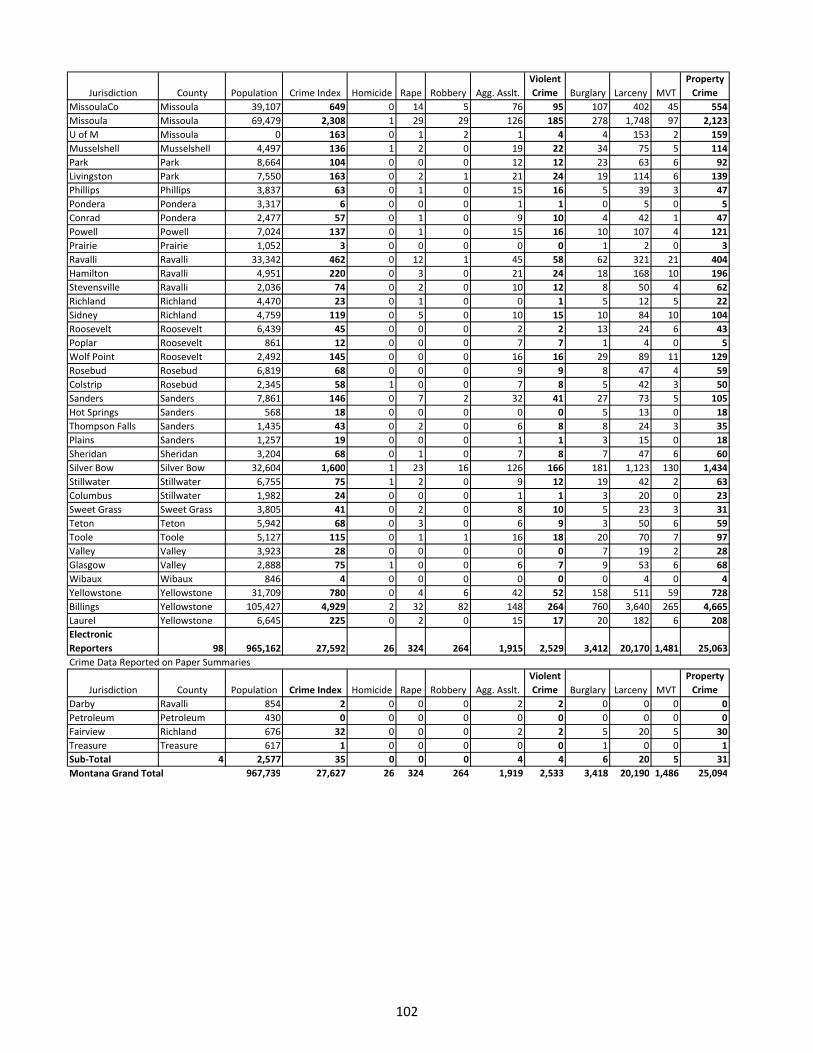
Jurisdiction County Population Crime Index Homicide Rape Robbery Agg. Asslt.Violent Crime Burglary Larceny MVT
Property Crime
MissoulaCo Missoula 39,107 649 0 14 5 76 95 107 402 45 554Missoula Missoula 69,479 2,308 1 29 29 126 185 278 1,748 97 2,123U of M Missoula 0 163 0 1 2 1 4 4 153 2 159Musselshell Musselshell 4,497 136 1 2 0 19 22 34 75 5 114Park Park 8,664 104 0 0 0 12 12 23 63 6 92Livingston Park 7,550 163 0 2 1 21 24 19 114 6 139Phillips Phillips 3,837 63 0 1 0 15 16 5 39 3 47Pondera Pondera 3,317 6 0 0 0 1 1 0 5 0 5Conrad Pondera 2,477 57 0 1 0 9 10 4 42 1 47Powell Powell 7,024 137 0 1 0 15 16 10 107 4 121Prairie Prairie 1,052 3 0 0 0 0 0 1 2 0 3Ravalli Ravalli 33,342 462 0 12 1 45 58 62 321 21 404Hamilton Ravalli 4,951 220 0 3 0 21 24 18 168 10 196Stevensville Ravalli 2,036 74 0 2 0 10 12 8 50 4 62Richland Richland 4,470 23 0 1 0 0 1 5 12 5 22Sidney Richland 4,759 119 0 5 0 10 15 10 84 10 104Roosevelt Roosevelt 6,439 45 0 0 0 2 2 13 24 6 43Poplar Roosevelt 861 12 0 0 0 7 7 1 4 0 5Wolf Point Roosevelt 2,492 145 0 0 0 16 16 29 89 11 129Rosebud Rosebud 6,819 68 0 0 0 9 9 8 47 4 59Colstrip Rosebud 2,345 58 1 0 0 7 8 5 42 3 50Sanders Sanders 7,861 146 0 7 2 32 41 27 73 5 105Hot Springs Sanders 568 18 0 0 0 0 0 5 13 0 18Thompson Falls Sanders 1,435 43 0 2 0 6 8 8 24 3 35Plains Sanders 1,257 19 0 0 0 1 1 3 15 0 18Sheridan Sheridan 3,204 68 0 1 0 7 8 7 47 6 60Silver Bow Silver Bow 32,604 1,600 1 23 16 126 166 181 1,123 130 1,434Stillwater Stillwater 6,755 75 1 2 0 9 12 19 42 2 63Columbus Stillwater 1,982 24 0 0 0 1 1 3 20 0 23Sweet Grass Sweet Grass 3,805 41 0 2 0 8 10 5 23 3 31Teton Teton 5,942 68 0 3 0 6 9 3 50 6 59Toole Toole 5,127 115 0 1 1 16 18 20 70 7 97Valley Valley 3,923 28 0 0 0 0 0 7 19 2 28Glasgow Valley 2,888 75 1 0 0 6 7 9 53 6 68Wibaux Wibaux 846 4 0 0 0 0 0 0 4 0 4Yellowstone Yellowstone 31,709 780 0 4 6 42 52 158 511 59 728Billings Yellowstone 105,427 4,929 2 32 82 148 264 760 3,640 265 4,665Laurel Yellowstone 6,645 225 0 2 0 15 17 20 182 6 208Electronic Reporters 98 965,162 27,592 26 324 264 1,915 2,529 3,412 20,170 1,481 25,063Crime Data Reported on Paper Summaries
Jurisdiction County Population Crime Index Homicide Rape Robbery Agg. Asslt.Violent Crime Burglary Larceny MVT
Property Crime
Darby Ravalli 854 2 0 0 0 2 2 0 0 0 0Petroleum Petroleum 430 0 0 0 0 0 0 0 0 0 0Fairview Richland 676 32 0 0 0 2 2 5 20 5 30Treasure Treasure 617 1 0 0 0 0 0 1 0 0 1Sub‐Total 4 2,577 35 0 0 0 4 4 6 20 5 31Montana Grand Total 967,739 27,627 26 324 264 1,919 2,533 3,418 20,190 1,486 25,094
102
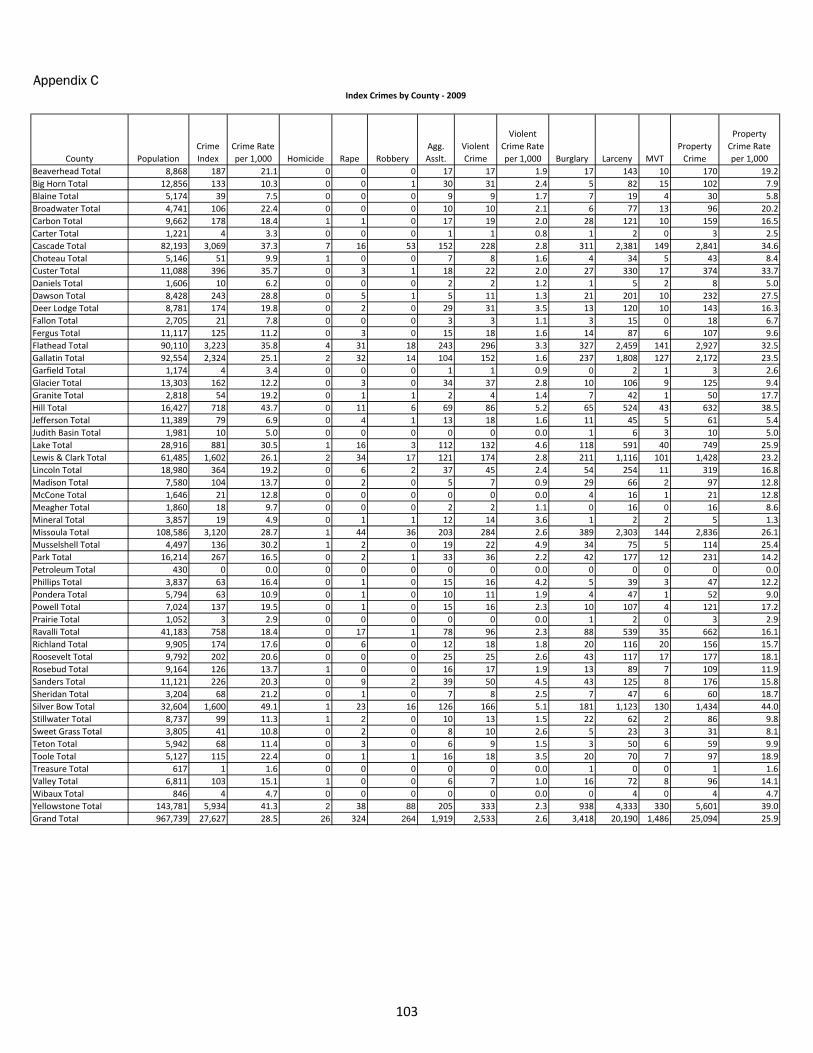
Appendix C
County PopulationCrime Index
Crime Rate per 1,000 Homicide Rape Robbery
Agg. Asslt.
Violent Crime
Violent Crime Rate per 1,000 Burglary Larceny MVT
Property Crime
Property Crime Rate per 1,000
Beaverhead Total 8,868 187 21.1 0 0 0 17 17 1.9 17 143 10 170 19.2Big Horn Total 12,856 133 10.3 0 0 1 30 31 2.4 5 82 15 102 7.9Blaine Total 5,174 39 7.5 0 0 0 9 9 1.7 7 19 4 30 5.8Broadwater Total 4,741 106 22.4 0 0 0 10 10 2.1 6 77 13 96 20.2Carbon Total 9,662 178 18.4 1 1 0 17 19 2.0 28 121 10 159 16.5Carter Total 1,221 4 3.3 0 0 0 1 1 0.8 1 2 0 3 2.5Cascade Total 82,193 3,069 37.3 7 16 53 152 228 2.8 311 2,381 149 2,841 34.6Choteau Total 5,146 51 9.9 1 0 0 7 8 1.6 4 34 5 43 8.4Custer Total 11,088 396 35.7 0 3 1 18 22 2.0 27 330 17 374 33.7Daniels Total 1,606 10 6.2 0 0 0 2 2 1.2 1 5 2 8 5.0Dawson Total 8,428 243 28.8 0 5 1 5 11 1.3 21 201 10 232 27.5Deer Lodge Total 8,781 174 19.8 0 2 0 29 31 3.5 13 120 10 143 16.3Fallon Total 2,705 21 7.8 0 0 0 3 3 1.1 3 15 0 18 6.7Fergus Total 11,117 125 11.2 0 3 0 15 18 1.6 14 87 6 107 9.6Flathead Total 90,110 3,223 35.8 4 31 18 243 296 3.3 327 2,459 141 2,927 32.5Gallatin Total 92,554 2,324 25.1 2 32 14 104 152 1.6 237 1,808 127 2,172 23.5Garfield Total 1,174 4 3.4 0 0 0 1 1 0.9 0 2 1 3 2.6Glacier Total 13,303 162 12.2 0 3 0 34 37 2.8 10 106 9 125 9.4Granite Total 2,818 54 19.2 0 1 1 2 4 1.4 7 42 1 50 17.7Hill Total 16,427 718 43.7 0 11 6 69 86 5.2 65 524 43 632 38.5Jefferson Total 11,389 79 6.9 0 4 1 13 18 1.6 11 45 5 61 5.4Judith Basin Total 1,981 10 5.0 0 0 0 0 0 0.0 1 6 3 10 5.0Lake Total 28,916 881 30.5 1 16 3 112 132 4.6 118 591 40 749 25.9Lewis & Clark Total 61,485 1,602 26.1 2 34 17 121 174 2.8 211 1,116 101 1,428 23.2Lincoln Total 18,980 364 19.2 0 6 2 37 45 2.4 54 254 11 319 16.8Madison Total 7,580 104 13.7 0 2 0 5 7 0.9 29 66 2 97 12.8McCone Total 1,646 21 12.8 0 0 0 0 0 0.0 4 16 1 21 12.8Meagher Total 1,860 18 9.7 0 0 0 2 2 1.1 0 16 0 16 8.6Mineral Total 3,857 19 4.9 0 1 1 12 14 3.6 1 2 2 5 1.3Missoula Total 108,586 3,120 28.7 1 44 36 203 284 2.6 389 2,303 144 2,836 26.1Musselshell Total 4,497 136 30.2 1 2 0 19 22 4.9 34 75 5 114 25.4Park Total 16,214 267 16.5 0 2 1 33 36 2.2 42 177 12 231 14.2Petroleum Total 430 0 0.0 0 0 0 0 0 0.0 0 0 0 0 0.0Phillips Total 3,837 63 16.4 0 1 0 15 16 4.2 5 39 3 47 12.2Pondera Total 5,794 63 10.9 0 1 0 10 11 1.9 4 47 1 52 9.0Powell Total 7,024 137 19.5 0 1 0 15 16 2.3 10 107 4 121 17.2Prairie Total 1,052 3 2.9 0 0 0 0 0 0.0 1 2 0 3 2.9Ravalli Total 41,183 758 18.4 0 17 1 78 96 2.3 88 539 35 662 16.1Richland Total 9,905 174 17.6 0 6 0 12 18 1.8 20 116 20 156 15.7Roosevelt Total 9,792 202 20.6 0 0 0 25 25 2.6 43 117 17 177 18.1Rosebud Total 9,164 126 13.7 1 0 0 16 17 1.9 13 89 7 109 11.9Sanders Total 11,121 226 20.3 0 9 2 39 50 4.5 43 125 8 176 15.8Sheridan Total 3,204 68 21.2 0 1 0 7 8 2.5 7 47 6 60 18.7Silver Bow Total 32,604 1,600 49.1 1 23 16 126 166 5.1 181 1,123 130 1,434 44.0Stillwater Total 8,737 99 11.3 1 2 0 10 13 1.5 22 62 2 86 9.8Sweet Grass Total 3,805 41 10.8 0 2 0 8 10 2.6 5 23 3 31 8.1Teton Total 5,942 68 11.4 0 3 0 6 9 1.5 3 50 6 59 9.9Toole Total 5,127 115 22.4 0 1 1 16 18 3.5 20 70 7 97 18.9Treasure Total 617 1 1.6 0 0 0 0 0 0.0 1 0 0 1 1.6Valley Total 6,811 103 15.1 1 0 0 6 7 1.0 16 72 8 96 14.1Wibaux Total 846 4 4.7 0 0 0 0 0 0.0 0 4 0 4 4.7Yellowstone Total 143,781 5,934 41.3 2 38 88 205 333 2.3 938 4,333 330 5,601 39.0Grand Total 967,739 27,627 28.5 26 324 264 1,919 2,533 2.6 3,418 20,190 1,486 25,094 25.9
Index Crimes by County ‐ 2009
103
This publication is supported by Grant No. 2007-BJ-CX-K020 awarded by the Bureau of Justice Statistics, Office of Justice Programs U.S. Department of Justice. Points of view in this document are those of the author and do not necessarily represent the official position of policies of the U.S. Department of Justice.
200 copies of this public document were published at an estimated cost of $13.00 per copy, for a total cost of $2,619.00, which includes $2,619.00 for printing and $0.00 for distribution.