Embed Size (px)
Citation preview
SIMMS Integrated Mathematics: A Modeling Approach Using
Technology
Level 3 Volumes 1-3
L E V E L 3 V O L U M E S 1 - 3
Teacher Guide Table of Contents
About Integrated Mathematics:A Modeling Approach Using Technology i 1 From Here to There 1 2 What Are You Eating? 25 3 What’s Your Bearing? 69 4 Taste Test 107 5 Classical Crystals 137 6 Strive for Quality 171 7 Graphing the Distance 205 8 Fair Is Fair 247 9 Let the Games Begin 273 10 What’s Your Orbit? 305 11 Our Town 341 12 One Dish and Two Cones 377 13 Finding Gold 413 14 Banking on Life 447
i
About Integrated Mathematics: A Modeling Approach Using Technology
The Need for Change In recent years, many voices have called for the reform of mathematics education in the United States. Teachers, scholars, and administrators alike have pointed out the symptoms of a flawed system. From the ninth grade onwards, for example, about half of the students in this country’s mathematical pipeline are lost each year (National Research Council, 1990, p. 36). Attempts to identify the root causes of this decline have targeted not only the methods used to instruct and assess our students, but the nature of the mathematics they learn and the manner in which they are expected to learn. In its Principles and Standards for School Mathematics, the National Council of Teachers of Mathematics addressed the problem in these terms:
When students can connect mathematical ideas, their understanding is deeper and more lasting. They can see mathematical connections in the rich interplay among mathematical topics, in contexts that relate mathematics to other subjects, and in their own interests and experience. Through instruction that emphasizes the interrelatedness of mathematical ideas, students not only learn mathematics, they also learn about the utility of mathematics. (p. 64)
Some Methods for Change Among the major objectives of the Integrated Mathematics curriculum are:
• offering a 9–12 mathematics curriculum using an integrated inter-disciplinary approach for all students.
• incorporating the use of technology as a learning tool in all facets and at all levels of mathematics.
• offering a Standards-based curriculum for teaching, learning, and assessing mathematics.
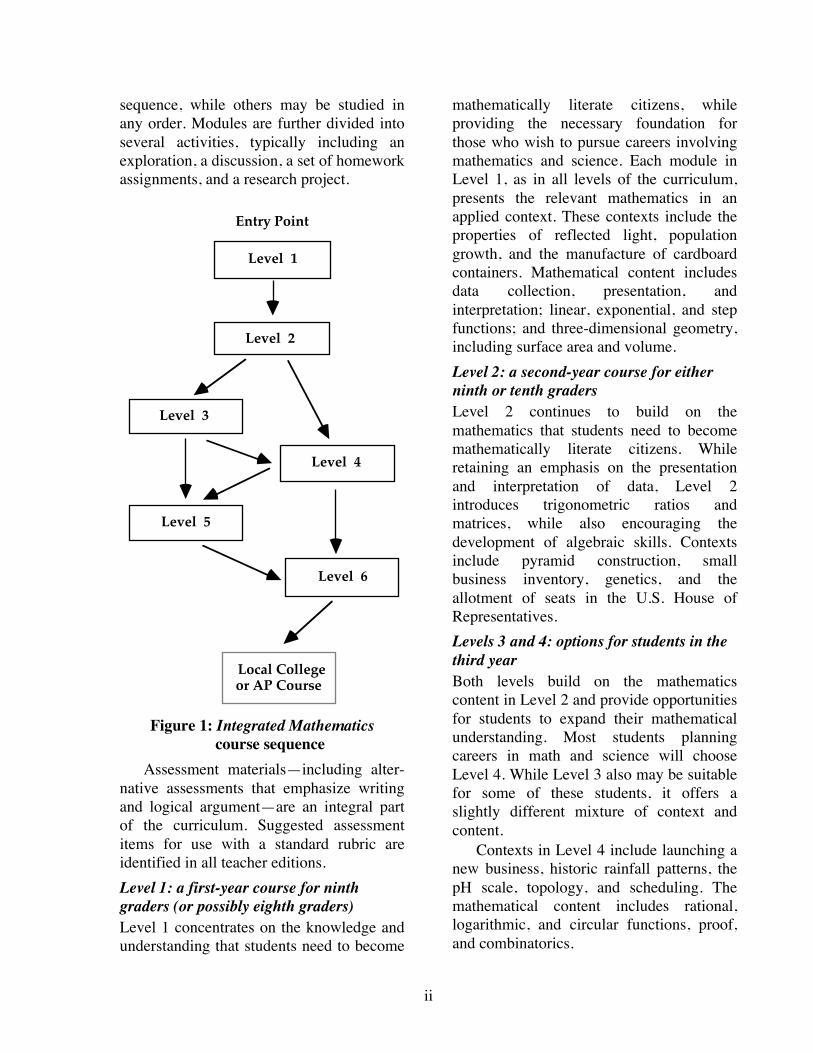
The Integrated Mathematics Curriculum An integrated mathematics program “consists of topics chosen from a wide variety of mathematical fields. . . [It] emphasizes the relationships among topics within mathematics as well as between mathematics and other disciplines” (Beal, et al., 1992; Lott, 1991). In order to create innovative, integrated, and accessible materials, Integrated Mathematics: A Modeling Approach Using Technology was written, revised, and reviewed by secondary teachers of mathematics and science. It is a complete, Standards-based mathematics program designed to replace all currently offered secondary mathematics courses, with the possible exception of advanced placement classes, and builds on middle-school reform curricula. The Integrated Mathematics curriculum is grouped into six levels. All students should take at least the first two levels. In the third and fourth years, Integrated Mathematics offers a choice of courses to students and their parents, depending on interests and goals. A flow chart of the curriculum appears in Figure 1. Each year-long level contains 14–16 modules. Some must be presented in
ii
sequence, while others may be studied in any order. Modules are further divided into several activities, typically including an exploration, a discussion, a set of homework assignments, and a research project.
Figure 1: Integrated Mathematics course sequence
Assessment materials—including alter-native assessments that emphasize writing and logical argument—are an integral part of the curriculum. Suggested assessment items for use with a standard rubric are identified in all teacher editions. Level 1: a first-year course for ninth graders (or possibly eighth graders) Level 1 concentrates on the knowledge and understanding that students need to become
mathematically literate citizens, while providing the necessary foundation for those who wish to pursue careers involving mathematics and science. Each module in Level 1, as in all levels of the curriculum, presents the relevant mathematics in an applied context. These contexts include the properties of reflected light, population growth, and the manufacture of cardboard containers. Mathematical content includes data collection, presentation, and interpretation; linear, exponential, and step functions; and three-dimensional geometry, including surface area and volume. Level 2: a second-year course for either ninth or tenth graders Level 2 continues to build on the mathematics that students need to become mathematically literate citizens. While retaining an emphasis on the presentation and interpretation of data, Level 2 introduces trigonometric ratios and matrices, while also encouraging the development of algebraic skills. Contexts include pyramid construction, small business inventory, genetics, and the allotment of seats in the U.S. House of Representatives. Levels 3 and 4: options for students in the third year Both levels build on the mathematics content in Level 2 and provide opportunities for students to expand their mathematical understanding. Most students planning careers in math and science will choose Level 4. While Level 3 also may be suitable for some of these students, it offers a slightly different mixture of context and content. Contexts in Level 4 include launching a new business, historic rainfall patterns, the pH scale, topology, and scheduling. The mathematical content includes rational, logarithmic, and circular functions, proof, and combinatorics.
Level 1
Level 2
Level 3
Level 4
Level 5
Level 6
Local Collegeor AP Course
Entry Point
iii
In Level 3, contexts include nutrition, surveying, and quality control. Mathematical topics include linear programming, curve-fitting, polynomial functions, and sampling. Levels 5 and 6: options for students in the fourth year Level 6 materials continue the presentation of mathematics through applied contexts while embracing a broader mathematical perspective. For example, Level 6 modules explore operations on functions, instantaneous rates of change, complex numbers, and parametric equations. Level 5 focuses more specifically on applications from business and the social sciences, including hypothesis testing, Markov chains, and game theory.
More About Level 3 “From Here to There” revisits three-dimensional coordinate systems using topographical maps. “Taste Test” and “Strive for Quality” continue to explore probability and statistics. “What’s Your Bearing” stresses trigonometric concepts via orienteering and surveying. Other modules with a geometric theme include “Classical Crystals,” “One Dish and Two Cones,” and “Finding Gold.” “What Are You Eating,” “Graphing the Distance,” and “What’s Your Orbit” focus on functions and equations. “Let the Games Begin” examines logical connectives in a game-playing context. Students also investigate graph theory, fair division, and other mathematical topics in this level.
The Teacher Edition To facilitate use of the curriculum, the teacher edition contains these features: Overview /Objectives/Prerequisites Each module begins with a brief overview of its contents. This overview is followed by
a list of teaching objectives and a list of prerequisite skills and knowledge. Time Line/Materials & Technology Required A time line provides a rough estimate of the classroom periods required to complete each module. The materials required for the entire module are listed by activity. The technology required to complete the module appears in a similar list. Assignments/Assessment Items/Flashbacks Assignment problems appear at the end of each activity. These problems are separated into two sections by a series of asterisks. The problems in the first section cover all the essential elements in the activity. The second section provides optional problems for extra practice or additional homework. Specific assignment problems recon-mended for assessment are preceded by a single asterisk in the teacher edition. Each module also contains a Summary Assess-ment in the student edition and a Module Assessment in the teacher edition, for use at the teacher’s discretion. In general, Summary Assessments offer more open-ended questions, while Module Assessments take a more traditional approach. To review prerequisite skills, each module includes brief problem sets called “Flashbacks.” Like the Module Assessment, they are designed for use at the teacher’s discretion.
Technology in the Classroom The Integrated Mathematics curriculum takes full advantage of the appropriate use of technology. In fact, the goals of the curriculum are impossible to achieve without it. Students must have ready access to the functionality of a graphing utility, a spreadsheet, a geometry utility, a statistics program, a symbolic manipulator, and a word processor. In addition, students should have access to a science interface device
iv
that allows for electronic data collection from classroom experiments, as well as a telephone modem. In the student edition, references to technology provide as much flexibility as possible to the teacher. In the teacher edition, sample responses refer to specific pieces of technology, where applicable.
Professional Development A program of professional development is recommended for all teachers planning to use the curriculum. The Integrated Mathematics curriculum encourages the use of cooperative learning, considers mathematical topics in a different order than in a traditional curriculum, and teaches some mathematical topics not previously encountered at the high-school level. In addition to incorporating a wide range of context areas, Integrated Mathematics invites the use of a variety of instructional formats involving heterogeneous classes. Teachers should learn to use alternative assessments, to integrate writing and communication into the mathematics curriculum, and to help students incorporate technology in their own investigations of mathematical ideas. Approximately 30 classroom teachers and 5 university professors are available to present inservice workshops for interested school districts. Please contact Kendall Hunt Publishing Company for more information.
Student Performance During the development of Integrated Mathematics, researchers conducted an annual assessment of student performances in pilot schools. Each year, two basic measures—the PSAT and a selection of open-ended tasks—were administered to two groups: students in classes using Integrated Mathematics and students in classes using other materials. Students using
Integrated Mathematics materials typically had access to technology for all class work. During administration of the PSAT, however, no technology was made available to either group. Student scores on the mathematics portion of this test indicated no significant difference in performance. During the open-ended, end-of-year test, technology was made available to both groups. Analysis of student solutions to these tasks showed that students using Integrated Mathematics were more likely to provide justification for their solutions and made more and better use of graphs, charts, and diagrams. They also demonstrated a greater variety of problem-solving strategies and were more willing to attempt difficult problems.
References Beal, J., D. Dolan, J. Lott, and J. Smith.
Integrated Mathematics: Definitions, Issues, and Implications; Report and Executive Summary. ERIC Clearing-house for Science, Mathematics, and Environmental Education. The Ohio State University, Columbus, OH: ED 347071, January 1990, 115 pp.
Lott, J., and A. Reeves. “The Integrated Mathematics Project,” Mathematics Teacher 84 (April 1991): 334–35.
National Council of Teachers of Mathematics (NCTM). Principles and Standards for School Mathematics. Reston, VA: NCTM, 2000.
National Research Council. A Challenge of Numbers: People in the Mathematical Sciences. Washington, DC: National Academy Press, 1990.
The SIMMS Project. Monograph 1: Philosophies. Missoula, MT: The Montana Council of Teachers of Mathematics, 1993.

From Here to There
If you’ve ever hiked over unfamiliar terrain, chances are you consulted a topographic map to help find your way. (If you didn’t, you may have wished that you had.) In this module, you use topography to investigate three-dimensional coordinate systems and the distances between points.
Pete Stabio • Randy Carspecken
3
Teacher Edition From Here to There
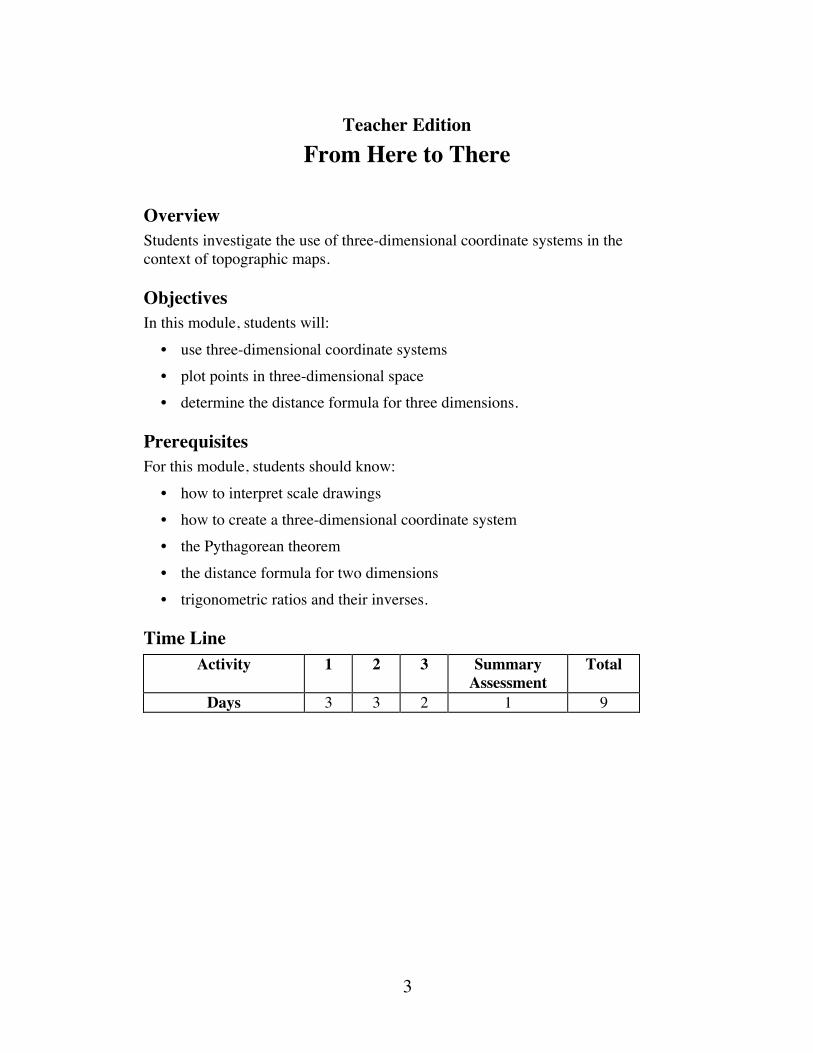
Overview Students investigate the use of three-dimensional coordinate systems in the context of topographic maps.
Objectives In this module, students will: • use three-dimensional coordinate systems • plot points in three-dimensional space • determine the distance formula for three dimensions.
Prerequisites For this module, students should know: • how to interpret scale drawings • how to create a three-dimensional coordinate system • the Pythagorean theorem • the distance formula for two dimensions • trigonometric ratios and their inverses.
Time Line Activity 1 2 3 Summary
Assessment Total
Days 3 3 2 1 9
4
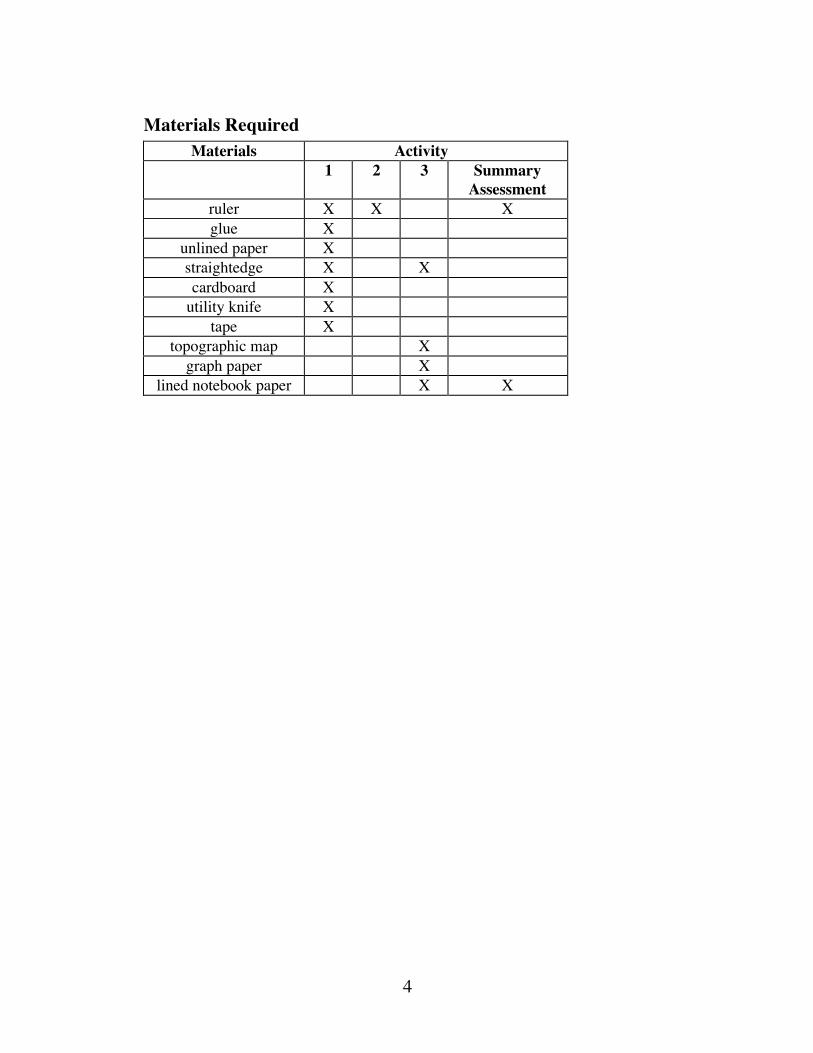
Materials Required Materials Activity
1 2 3 Summary Assessment
ruler X X X glue X
unlined paper X straightedge X X cardboard X
utility knife X tape X
topographic map X graph paper X
lined notebook paper X X
5
From Here to There
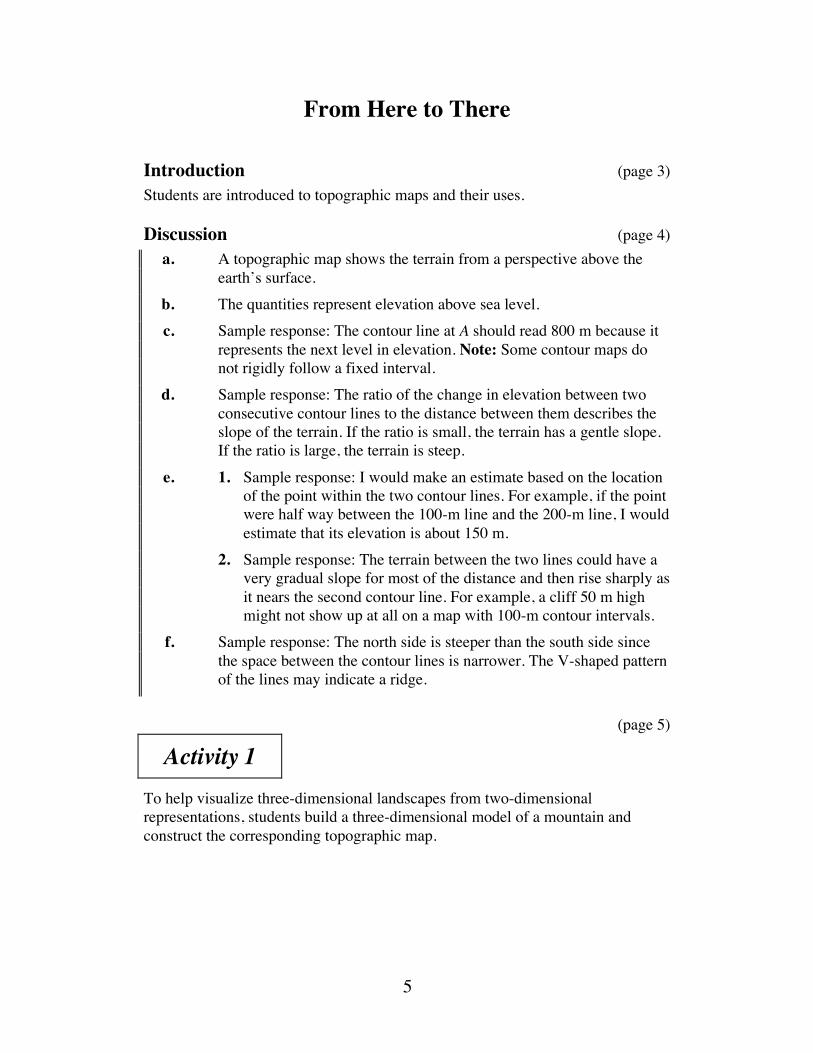
Introduction (page 3) Students are introduced to topographic maps and their uses.
Discussion (page 4) a. A topographic map shows the terrain from a perspective above the
earth’s surface. b. The quantities represent elevation above sea level. c. Sample response: The contour line at A should read 800 m because it
represents the next level in elevation. Note: Some contour maps do not rigidly follow a fixed interval.
d. Sample response: The ratio of the change in elevation between two consecutive contour lines to the distance between them describes the slope of the terrain. If the ratio is small, the terrain has a gentle slope. If the ratio is large, the terrain is steep.
e. 1. Sample response: I would make an estimate based on the location of the point within the two contour lines. For example, if the point were half way between the 100-m line and the 200-m line, I would estimate that its elevation is about 150 m.
2. Sample response: The terrain between the two lines could have a very gradual slope for most of the distance and then rise sharply as it nears the second contour line. For example, a cliff 50 m high might not show up at all on a map with 100-m contour intervals.
f. Sample response: The north side is steeper than the south side since the space between the contour lines is narrower. The V-shaped pattern of the lines may indicate a ridge.
(page 5)
Activity 1 To help visualize three-dimensional landscapes from two-dimensional representations, students build a three-dimensional model of a mountain and construct the corresponding topographic map.
6
Materials List • large sheets of paper, at least 60 cm by 28 cm (one per group) • clear adhesive tape or quick-drying glue • ruler or straightedge (one per group) • thick cardboard (several sheets per group; cardboard boxes are a good
source) • utility knife (one per group)
Exploration (page 5) a–f. Students create a three-dimensional cardboard model of a mountain
that includes a cliff, a summit, a lake, and a saddle. The model consists of 10 layers of cardboard shapes, each representing the terrain at a given elevation. While building the cardboard model, students also create the corresponding topographic map.
Note: You may wish to remind students to read the instructions for the entire exploration before beginning their models.
g. Students create a scale for their model and topographic map using the thickness of the cardboard to represent 100 m.
h–i. Students use ordered pairs and ordered triples to describe the summits of their mountains.
Discussion (page 7) a. Sample response: Our cliff is represented by a number of contour lines
that converge to form one line. Our lake is represented by a shaded region. Our saddle is represented as the lowest elevation between two summits. Our summit is located inside the region defined by the highest contour line.
b. Sample response: An ordered triple not only indicates where the summit is located, but also its height.
c. Differences in methods may produce a variety of measurements for similar sheets of cardboard. For example, students who directly measure one layer may get significantly different results from students who measure five layers and divide by 5.
7
d. Students should recognize that the z-coordinate for all points on the surface of the lake is 300.
e. Students should suggest drawing a path that contains relatively long segments from one elevation to the next.
Assignment (page 7) 1.1 a. Answers will vary. The ordered triples should have the same x-
and y-coordinates. b. Sample response: The x- and y-coordinates are the same while the
z-coordinates differ. c. The figure is a vertical line. d. Sample response: These points are represented by the same point
on the topographic map. 1.2 a. Answers will vary. The ordered triples should have the same
z-coordinates. b. Sample response: The x- and y-coordinates are different while the
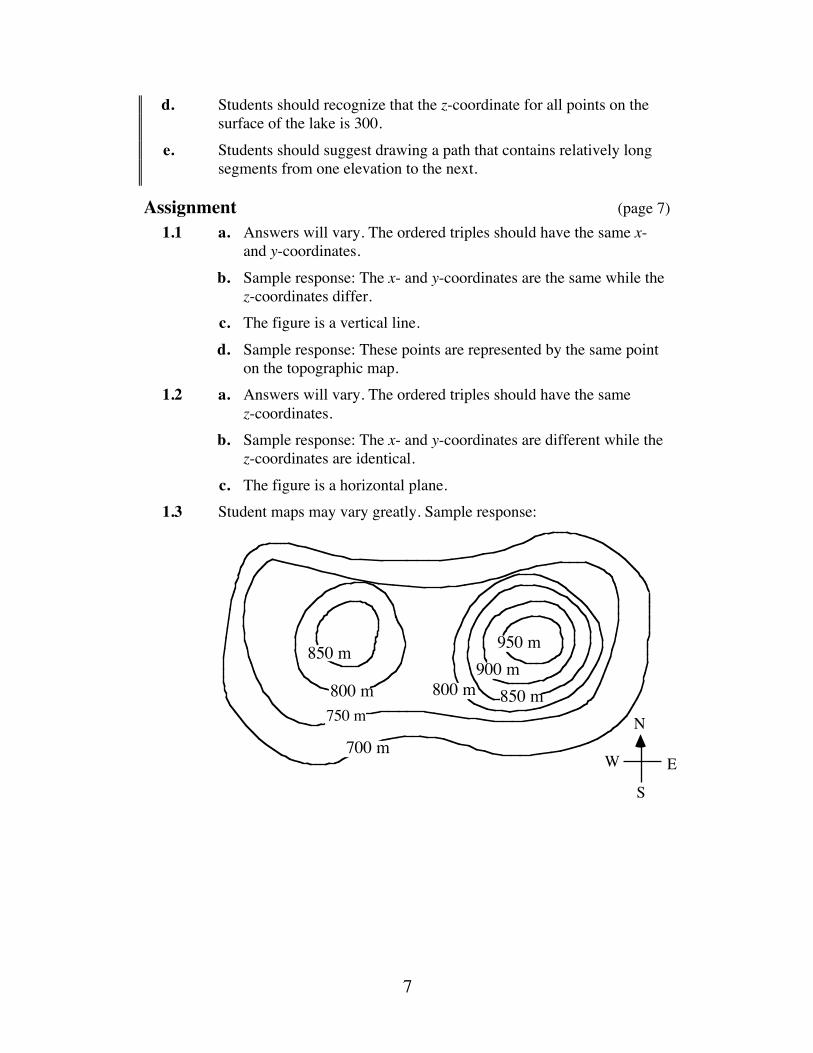
z-coordinates are identical. c. The figure is a horizontal plane. 1.3 Student maps may vary greatly. Sample response:
N
S
W E
750 m
850 m
800 m 850 m900 m
950 m
700 m
800 m
850 m
8
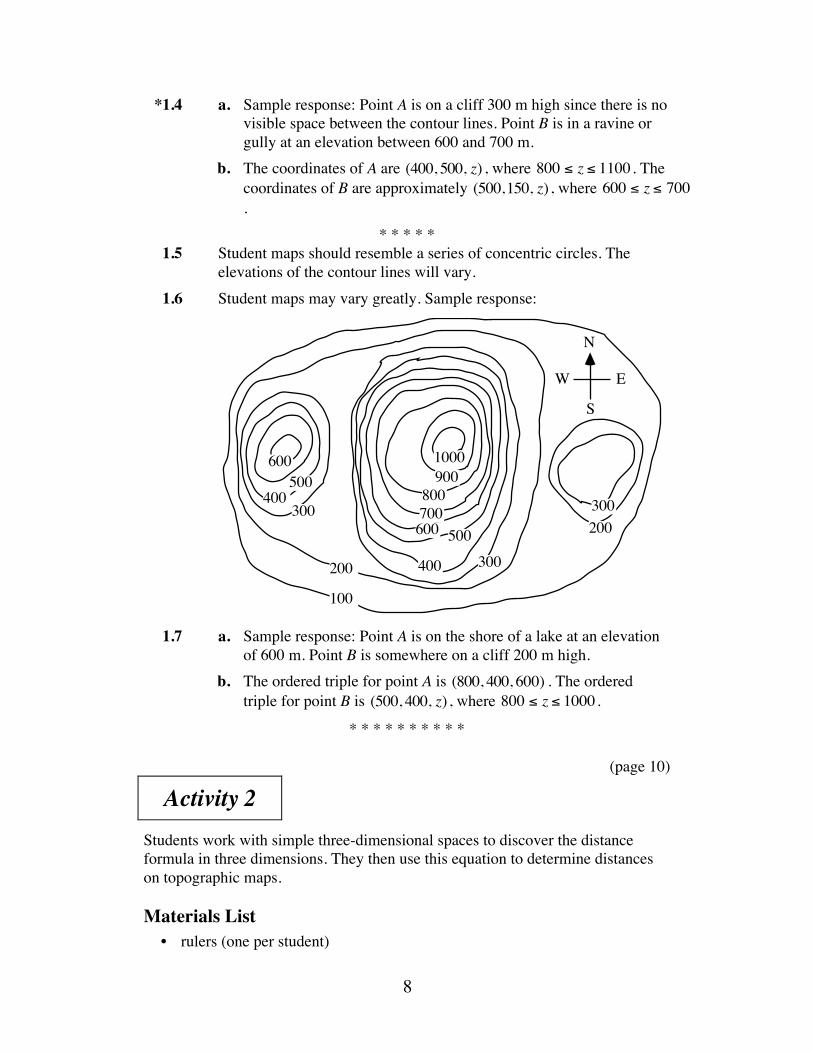
*1.4 a. Sample response: Point A is on a cliff 300 m high since there is no visible space between the contour lines. Point B is in a ravine or gully at an elevation between 600 and 700 m.
b. The coordinates of A are (400, 500, z) , where 800 ≤ z ≤ 1100 . The coordinates of B are approximately (500,150, z) , where 600 ≤ z ≤ 700.
* * * * * 1.5 Student maps should resemble a series of concentric circles. The
elevations of the contour lines will vary. 1.6 Student maps may vary greatly. Sample response:
1.7 a. Sample response: Point A is on the shore of a lake at an elevation
of 600 m. Point B is somewhere on a cliff 200 m high. b. The ordered triple for point A is (800, 400, 600) . The ordered
triple for point B is (500, 400, z) , where 800 ≤ z ≤ 1000 .
* * * * * * * * * * (page 10)
Activity 2 Students work with simple three-dimensional spaces to discover the distance formula in three dimensions. They then use this equation to determine distances on topographic maps.
Materials List • rulers (one per student)
100
200 300400
5006007008009001000
200300300
400500
600
N
S
W E
9
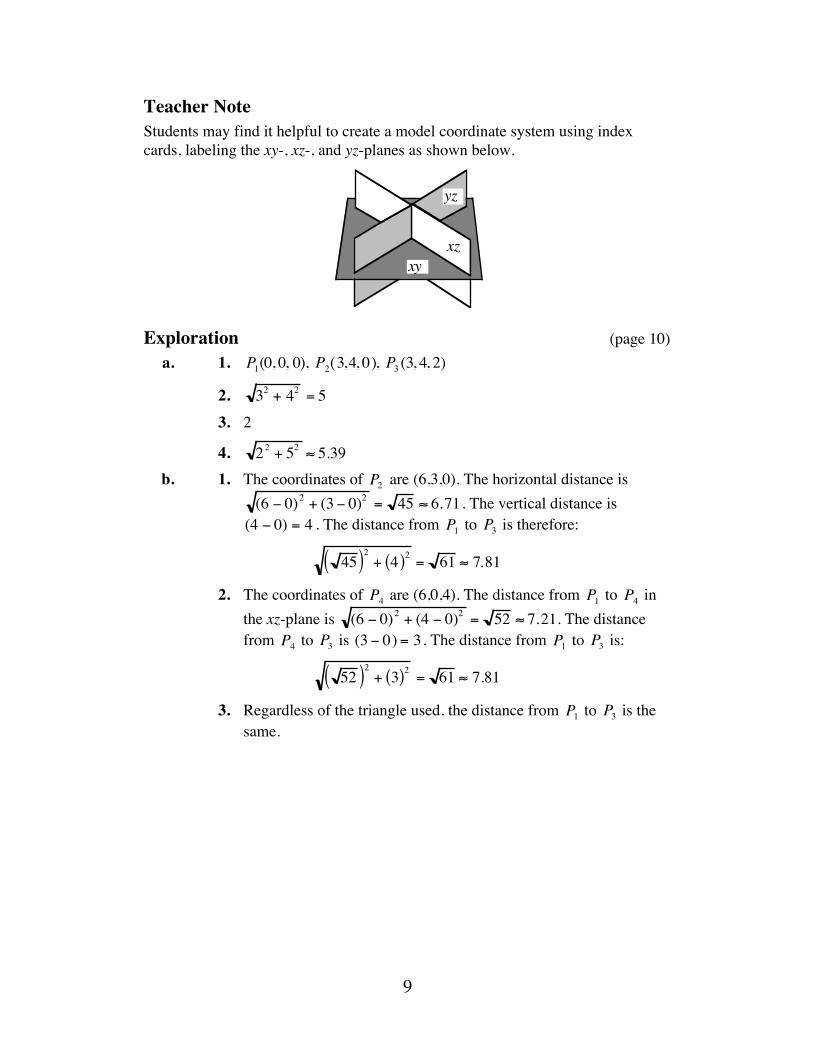
Teacher Note Students may find it helpful to create a model coordinate system using index cards, labeling the xy-, xz-, and yz-planes as shown below.
Exploration (page 10) a. 1. P1(0, 0, 0), P2(3,4, 0), P3 (3, 4, 2)
2. 32 + 42 = 5 3. 2
4. 22 + 52 ≈ 5.39 b. 1. The coordinates of P2 are (6,3,0). The horizontal distance is
(6 − 0)2 + (3 − 0)2 = 45 ≈ 6.71 . The vertical distance is (4 − 0) = 4 . The distance from P1 to P3 is therefore:
45( )2 + 4( )2 = 61 ≈ 7.81
2. The coordinates of P4 are (6,0,4). The distance from P1 to P4 in the xz-plane is (6 − 0)2 + (4 − 0)2 = 52 ≈ 7.21. The distance from P4 to P3 is (3 − 0) = 3 . The distance from P1 to P3 is:
52( )2 + 3( )2 = 61 ≈ 7.81
3. Regardless of the triangle used, the distance from P1 to P3 is the same.
xzxy
yz
10
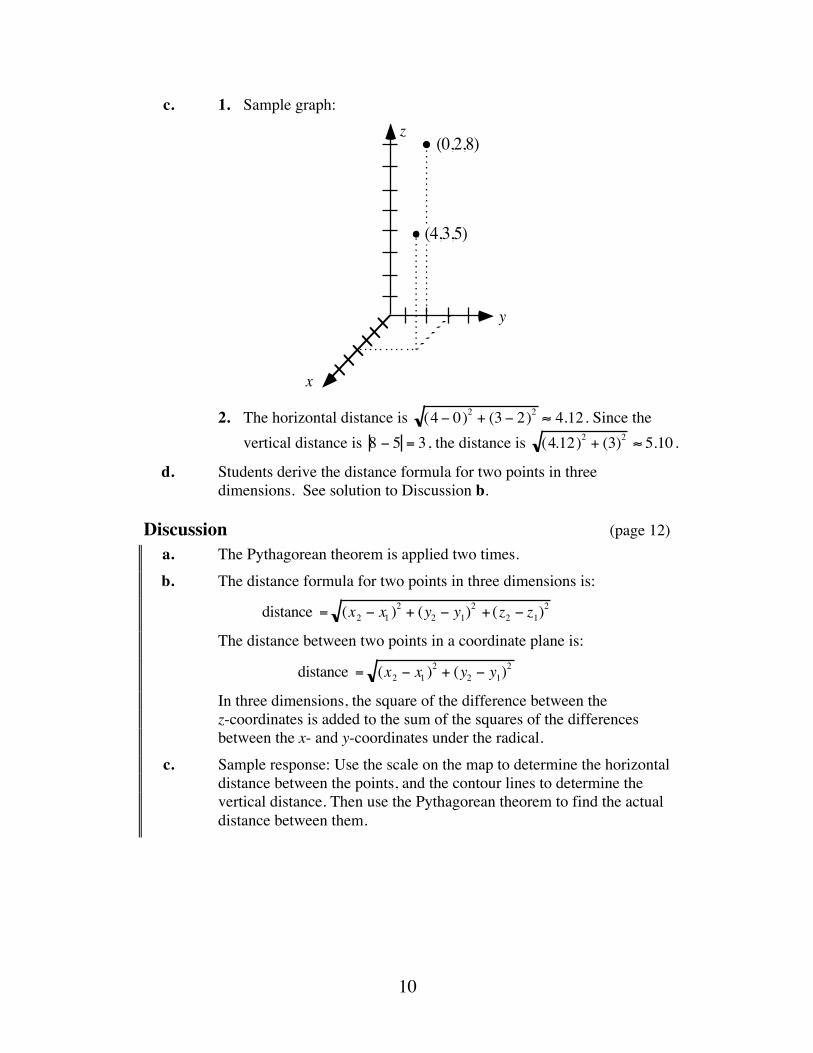
c. 1. Sample graph:
2. The horizontal distance is (4 − 0)2 + (3 − 2)2 ≈ 4.12 . Since the
vertical distance is 8 − 5 = 3 , the distance is (4.12)2 + (3)2 ≈ 5.10 .
d. Students derive the distance formula for two points in three dimensions. See solution to Discussion b.
Discussion (page 12) a. The Pythagorean theorem is applied two times. b. The distance formula for two points in three dimensions is:
distance = (x2 − x1 )2 + (y2 − y1)
2 + (z2 − z1)2
The distance between two points in a coordinate plane is:
distance = (x2 − x1 )2 + (y2 − y1)
2
In three dimensions, the square of the difference between the z-coordinates is added to the sum of the squares of the differences between the x- and y-coordinates under the radical.
c. Sample response: Use the scale on the map to determine the horizontal distance between the points, and the contour lines to determine the vertical distance. Then use the Pythagorean theorem to find the actual distance between them.
x
(0,2,8)z
y
(4,3,5)
11
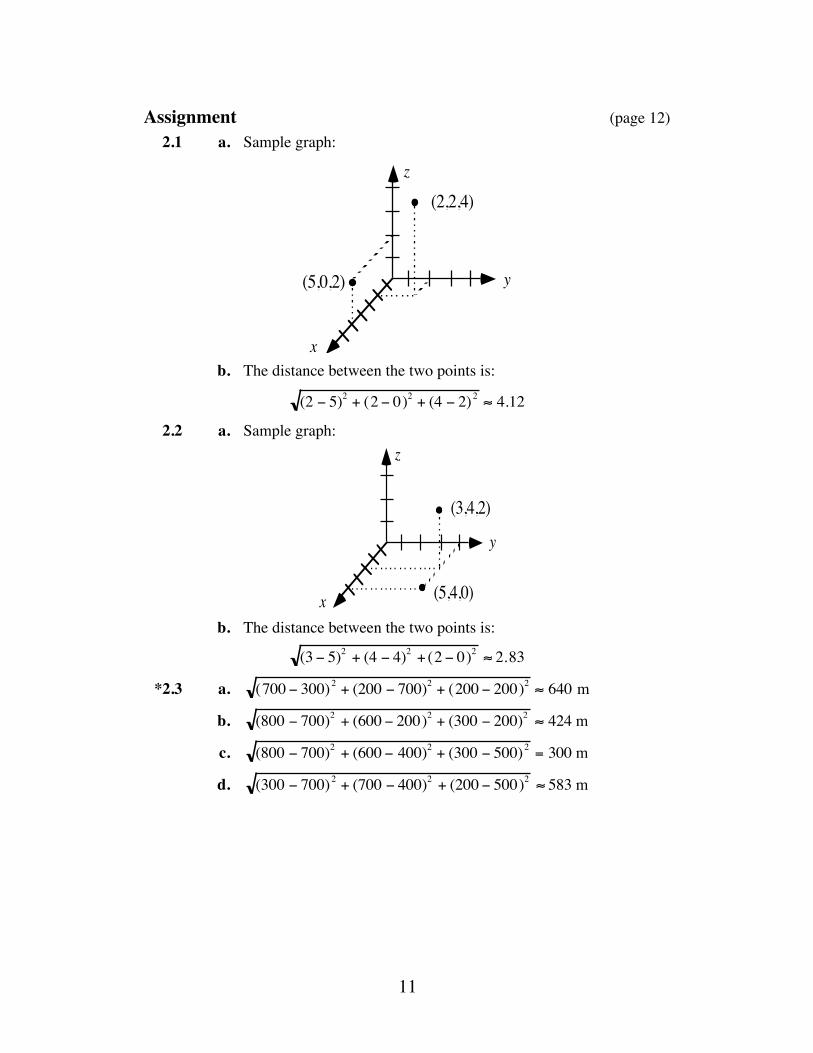
Assignment (page 12) 2.1 a. Sample graph:
b. The distance between the two points is:
(2 − 5)2 + (2 − 0)2 + (4 − 2)2 ≈ 4.12
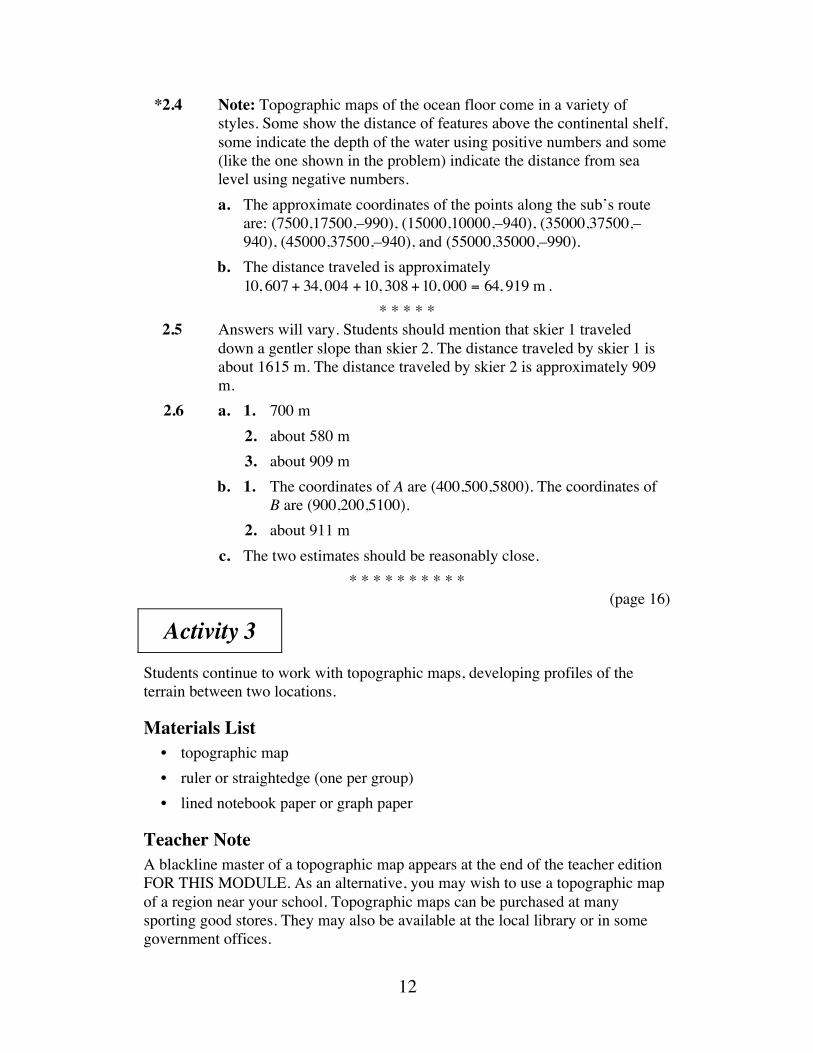
2.2 a. Sample graph:
b. The distance between the two points is:
(3 − 5)2 + (4 − 4)2 + (2 − 0)2 ≈ 2.83
*2.3 a. (700 − 300)2 + (200 − 700)2 + (200 − 200)2 ≈ 640 m
b. (800 − 700)2 + (600 − 200)2 + (300 − 200)2 ≈ 424 m
c. (800 − 700)2 + (600 − 400)2 + (300 − 500)2 = 300 m
d. (300 − 700)2 + (700 − 400)2 + (200 − 500)2 ≈ 583 m
x
(5,0,2)
(2,2,4)z
y
x
(3,4,2)
(5,4,0)
z
y
12
*2.4 Note: Topographic maps of the ocean floor come in a variety of styles. Some show the distance of features above the continental shelf, some indicate the depth of the water using positive numbers and some (like the one shown in the problem) indicate the distance from sea level using negative numbers.
a. The approximate coordinates of the points along the sub’s route are: (7500,17500,–990), (15000,10000,–940), (35000,37500,–940), (45000,37500,–940), and (55000,35000,–990).
b. The distance traveled is approximately 10, 607 + 34, 004 +10, 308 +10, 000 = 64, 919 m .
* * * * * 2.5 Answers will vary. Students should mention that skier 1 traveled
down a gentler slope than skier 2. The distance traveled by skier 1 is about 1615 m. The distance traveled by skier 2 is approximately 909 m.
2.6 a. 1. 700 m 2. about 580 m 3. about 909 m b. 1. The coordinates of A are (400,500,5800). The coordinates of
B are (900,200,5100). 2. about 911 m c. The two estimates should be reasonably close.
* * * * * * * * * * (page 16)
Activity 3 Students continue to work with topographic maps, developing profiles of the terrain between two locations.
Materials List • topographic map • ruler or straightedge (one per group) • lined notebook paper or graph paper
Teacher Note A blackline master of a topographic map appears at the end of the teacher edition FOR THIS MODULE. As an alternative, you may wish to use a topographic map of a region near your school. Topographic maps can be purchased at many sporting good stores. They may also be available at the local library or in some government offices.
13
Exploration (page 16) Students obtain an image of the landscape between two locations by developing a profile of the terrain. Note: The profile may not be to scale, since the lines on the notebook paper may give a different scale than the one on the map. a. Profile segments should begin and end on contour lines with different
elevations. A more interesting profile will be developed if there are several changes in elevation between endpoints.
b–d. Refer to Figure 14 in the student edition. e. Students should realize that a difference in horizontal and vertical
scales will affect the appearance of the profile. f. Students may notice that terrain which appeared to have a steep slope
in their first profiles actually has a more gradual incline. Note: By using the same scale, students can determine the distance
between two points simply by measuring with a ruler. If the scales are not the same, the Pythagorean theorem must be used to calculate the distance.
Discussion (page 18) a. Sample response: A profile allows you to see elevation changes and to
compare the steepness of the inclines. b. Sample response: No. You would only be able to draw a series of
isolated dots representing points on a profile segment. c. Answers will vary. Students should consider both the distance
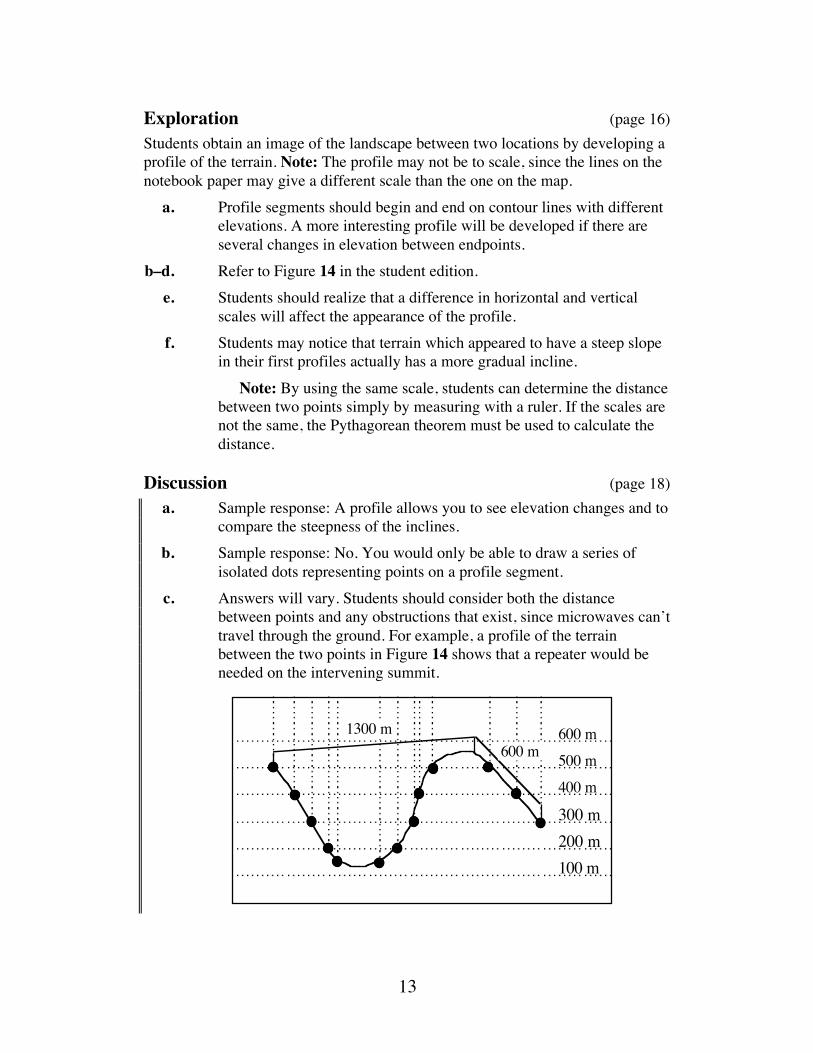
between points and any obstructions that exist, since microwaves can’t travel through the ground. For example, a profile of the terrain between the two points in Figure 14 shows that a repeater would be needed on the intervening summit.
600 m
300 m200 m100 m
400 m500 m
1300 m600 m
14
d. Sample response: Measure the distance between the points on the profile and use the horizontal scale to convert the measured distance to approximate the actual distance. (This ignores the vertical distance.)
e. Sample response: Yes, if the vertical scale and horizontal scale of the profile are the same. If this is true, right-triangle trigonometry can be used to determine the angle of elevation. If the scales are not the same, the right triangle formed will not be similar to the actual triangle. Since they are not similar, the corresponding angles may not be congruent.
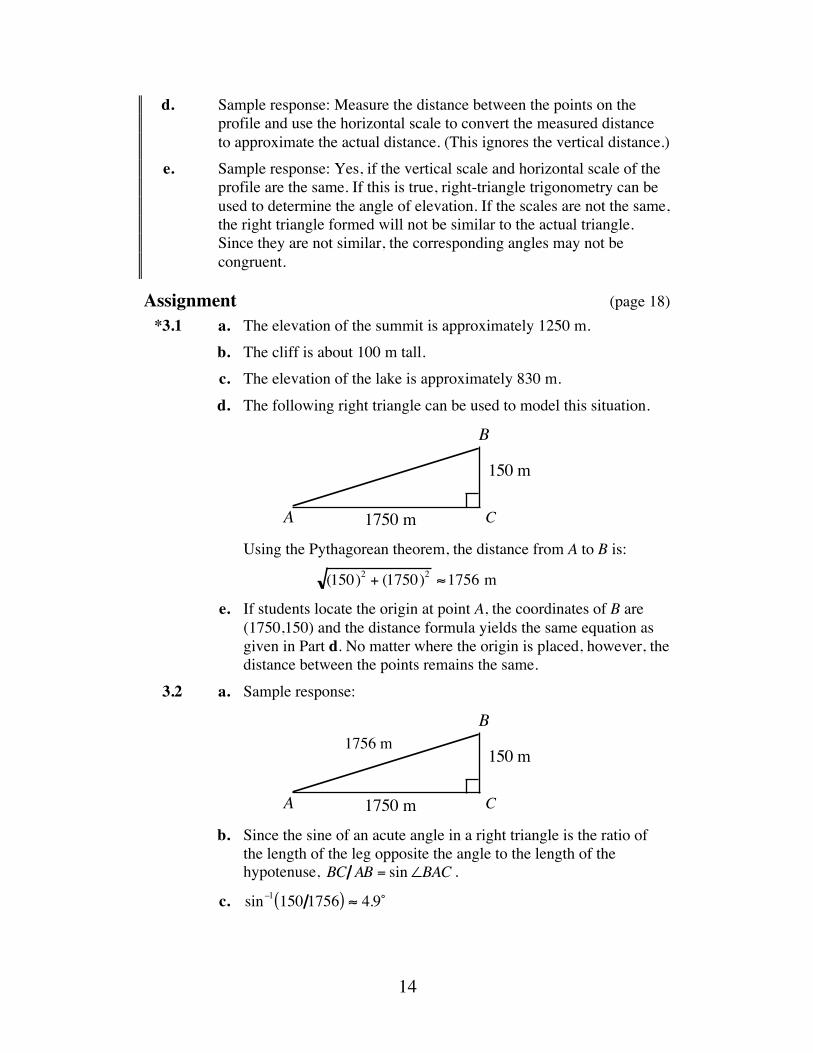
Assignment (page 18) *3.1 a. The elevation of the summit is approximately 1250 m. b. The cliff is about 100 m tall. c. The elevation of the lake is approximately 830 m. d. The following right triangle can be used to model this situation.
Using the Pythagorean theorem, the distance from A to B is:
(150)2 + (1750)2 ≈1756 m
e. If students locate the origin at point A, the coordinates of B are (1750,150) and the distance formula yields the same equation as given in Part d. No matter where the origin is placed, however, the distance between the points remains the same.
3.2 a. Sample response:
b. Since the sine of an acute angle in a right triangle is the ratio of
the length of the leg opposite the angle to the length of the hypotenuse, BC AB = sin∠BAC .
c. sin–1 150 1756( ) ≈ 4.9˚
1750 mA
B
150 m
C
1750 mA
B
150 m
C
1756 m
15
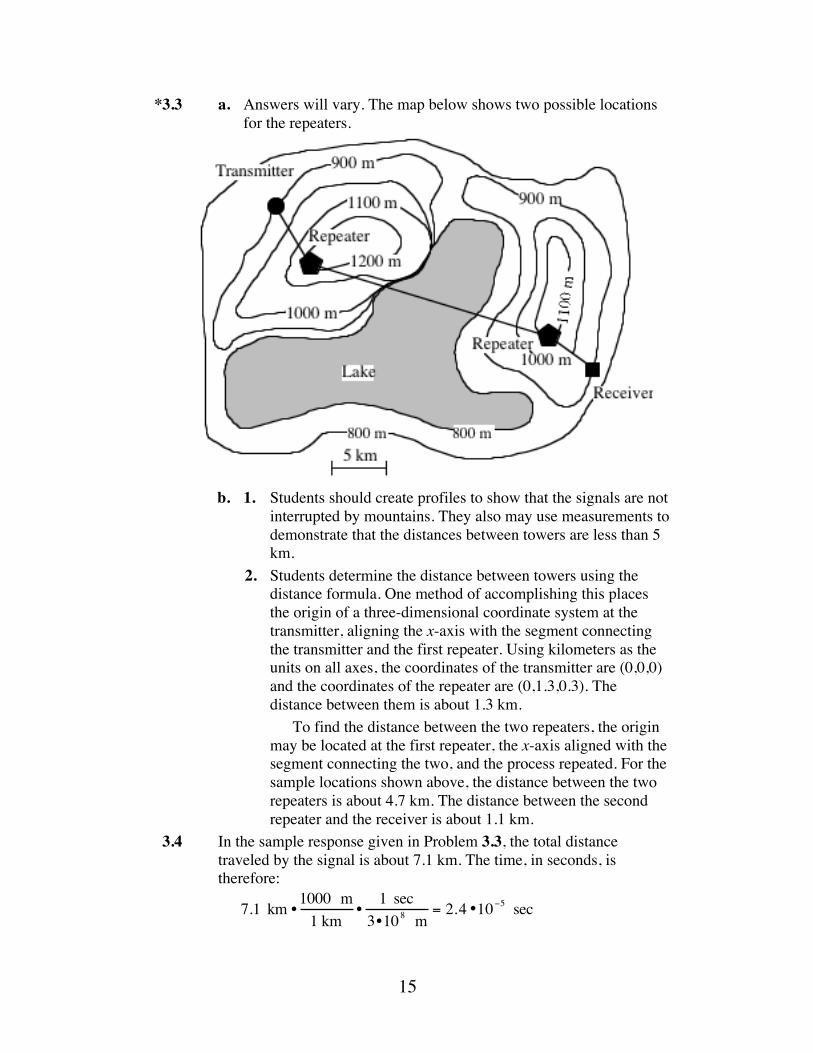
*3.3 a. Answers will vary. The map below shows two possible locations for the repeaters.
b. 1. Students should create profiles to show that the signals are not
interrupted by mountains. They also may use measurements to demonstrate that the distances between towers are less than 5 km.
2. Students determine the distance between towers using the distance formula. One method of accomplishing this places the origin of a three-dimensional coordinate system at the transmitter, aligning the x-axis with the segment connecting the transmitter and the first repeater. Using kilometers as the units on all axes, the coordinates of the transmitter are (0,0,0) and the coordinates of the repeater are (0,1.3,0.3). The distance between them is about 1.3 km.
To find the distance between the two repeaters, the origin may be located at the first repeater, the x-axis aligned with the segment connecting the two, and the process repeated. For the sample locations shown above, the distance between the two repeaters is about 4.7 km. The distance between the second repeater and the receiver is about 1.1 km.
3.4 In the sample response given in Problem 3.3, the total distance traveled by the signal is about 7.1 km. The time, in seconds, is therefore:
7.1 km • 1000 m1 km
• 1 sec3•108 m
= 2.4 •10−5 sec
16
3.5 Estimated distances will vary, depending on the route chosen and where students locate the peaks. For example, some routes may cross the lake, while others go around it. Some students may create profiles of the terrain along their paths.
* * * * * 3.6 Answers will vary. Students should show that the profile segment
intersects the topographic map at the appropriate locations. 3.7 a. The elevation at the lowest part of the valley is about 70 m. b. The distance between points A and B is:
90( )2+ 1500( )2
≈ 1503 m
* * * * * * * * * *
Research Project (page 21) Student responses should demonstrate their understanding of contour maps and describe the methods used to find the distance and angle of elevation between the two highest points. Note: As an alternative to the tasks described in the student edition, you may wish to ask students to create a topographic map of a portion of the classroom.
17
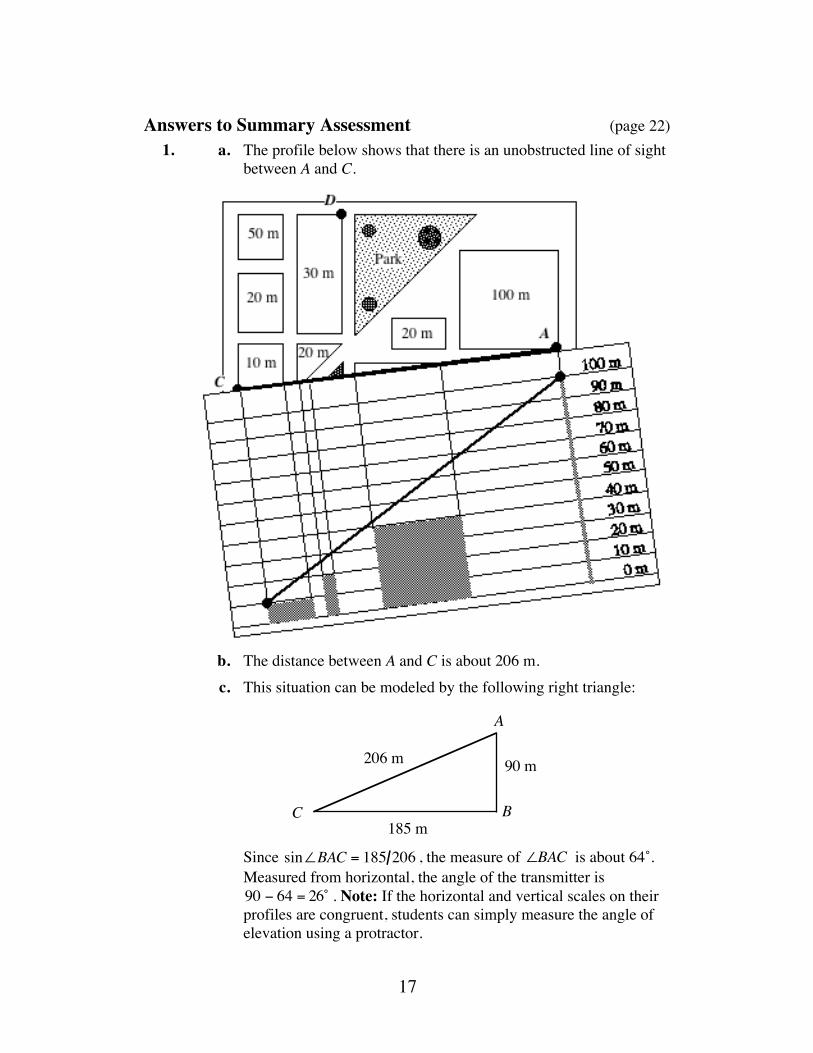
Answers to Summary Assessment (page 22) 1. a. The profile below shows that there is an unobstructed line of sight
between A and C.
b. The distance between A and C is about 206 m. c. This situation can be modeled by the following right triangle:
Since sin∠BAC = 185 206 , the measure of ∠BAC is about 64˚.
Measured from horizontal, the angle of the transmitter is 90 − 64 = 26˚ . Note: If the horizontal and vertical scales on their profiles are congruent, students can simply measure the angle of elevation using a protractor.
A
C B
206 m
185 m
90 m
18
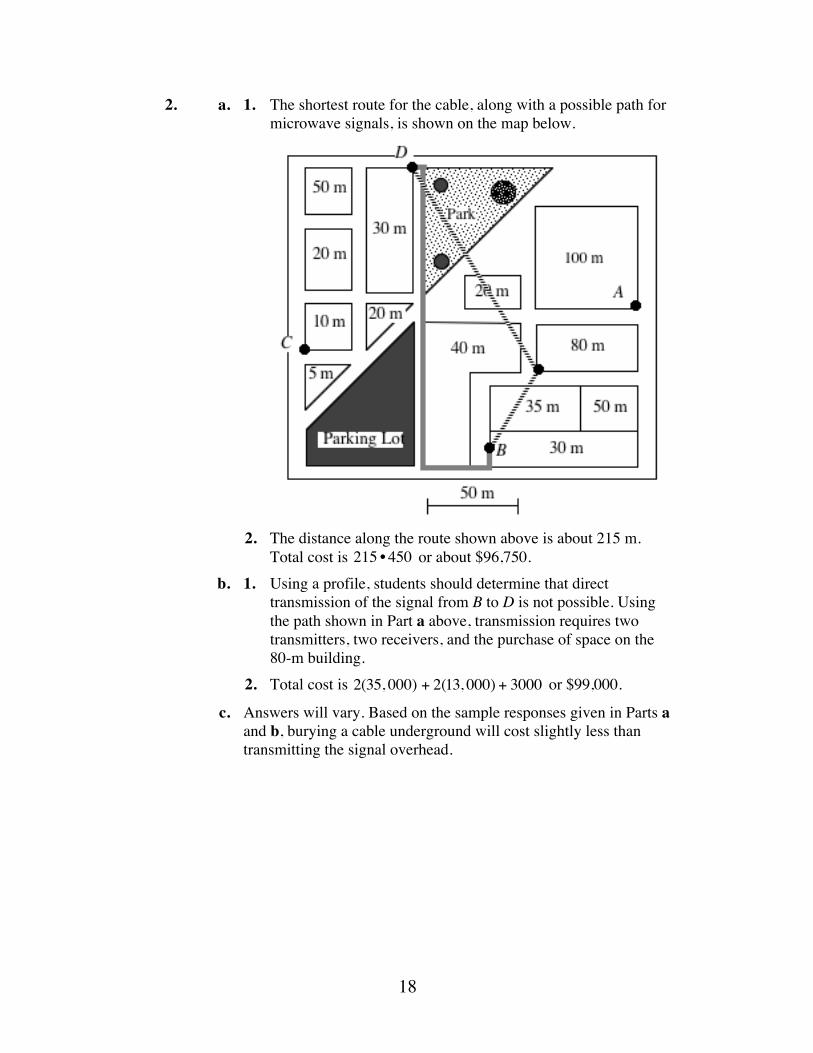
2. a. 1. The shortest route for the cable, along with a possible path for microwave signals, is shown on the map below.
2. The distance along the route shown above is about 215 m.
Total cost is 215 • 450 or about $96,750. b. 1. Using a profile, students should determine that direct
transmission of the signal from B to D is not possible. Using the path shown in Part a above, transmission requires two transmitters, two receivers, and the purchase of space on the 80-m building.
2. Total cost is 2(35, 000) + 2(13, 000) + 3000 or $99,000.
c. Answers will vary. Based on the sample responses given in Parts a and b, burying a cable underground will cost slightly less than transmitting the signal overhead.
19
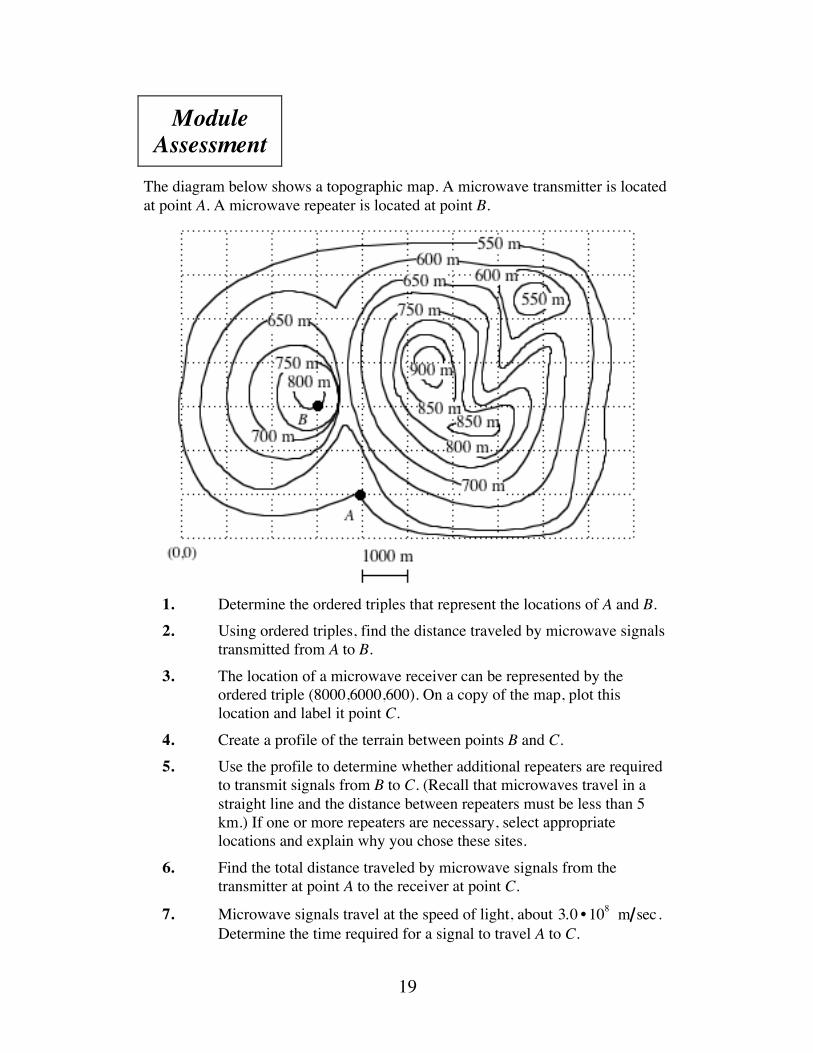
Module Assessment
The diagram below shows a topographic map. A microwave transmitter is located at point A. A microwave repeater is located at point B.
1. Determine the ordered triples that represent the locations of A and B. 2. Using ordered triples, find the distance traveled by microwave signals
transmitted from A to B. 3. The location of a microwave receiver can be represented by the
ordered triple (8000,6000,600). On a copy of the map, plot this location and label it point C.
4. Create a profile of the terrain between points B and C. 5. Use the profile to determine whether additional repeaters are required
to transmit signals from B to C. (Recall that microwaves travel in a straight line and the distance between repeaters must be less than 5 km.) If one or more repeaters are necessary, select appropriate locations and explain why you chose these sites.
6. Find the total distance traveled by microwave signals from the transmitter at point A to the receiver at point C.
7. Microwave signals travel at the speed of light, about 3.0 • 108 m sec . Determine the time required for a signal to travel A to C.
20
Answers To Module Assessment 1. The ordered triple that represents the location of A is (4000,1000, 550)
. The ordered triple that represents the location of B is (3000, 3000, 800) .
2. The distance between A and B is:
(4000 − 3000)2 + (1000 − 3000)2 + (550 − 800)2 = 2250 m
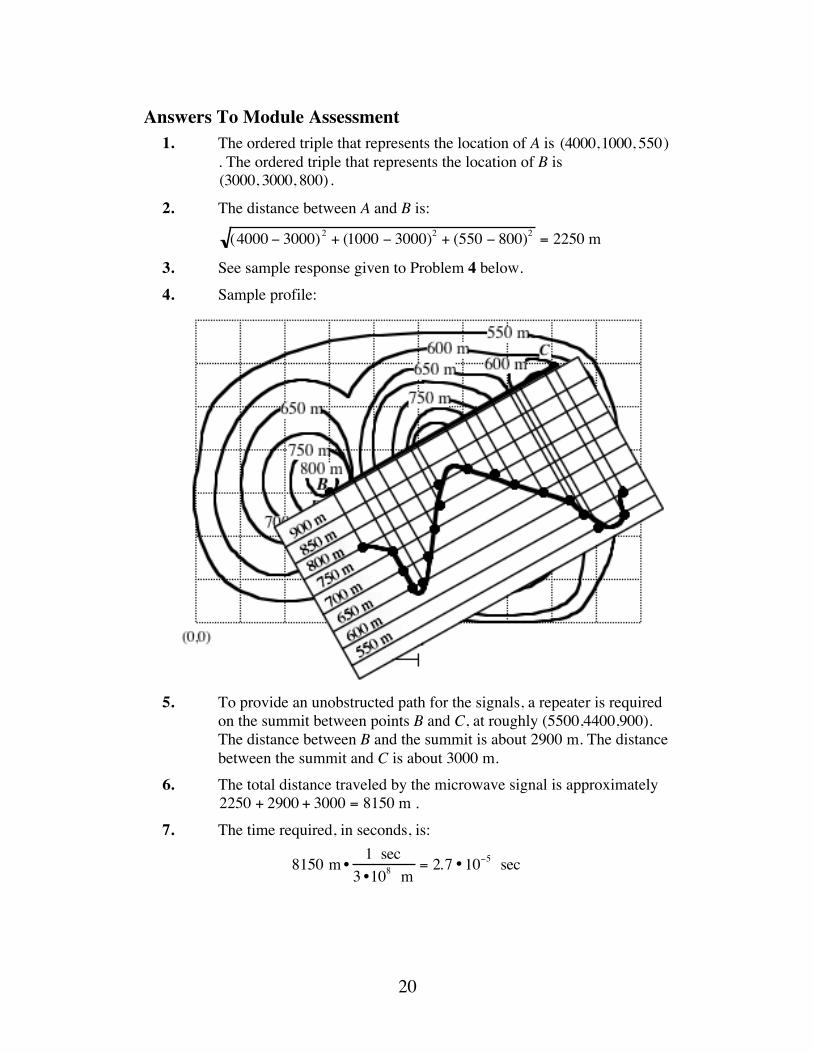
3. See sample response given to Problem 4 below. 4. Sample profile:
5. To provide an unobstructed path for the signals, a repeater is required
on the summit between points B and C, at roughly (5500,4400,900). The distance between B and the summit is about 2900 m. The distance between the summit and C is about 3000 m.
6. The total distance traveled by the microwave signal is approximately 2250 + 2900 + 3000 = 8150 m .
7. The time required, in seconds, is:
8150 m •1 sec
3 •108 m= 2.7 •10−5 sec

21
Selected References Microflect Company. Passive Repeater Engineering. Salem, OR: Microflect,
1984. U.S. Department of the Army. Map Reading and Land Navigation. Washington,
DC: U.S. Government Printing Office, 1987. Van Heuvelen, A. Physics. Boston: Little Brown, 1982.
22
Flashbacks
Activity 1 1.1 Describe how locations on a three-dimensional coordinate system can
be indicated with ordered triples. Use your classroom as an example. 1.2 Consider a cube with one vertex located at the origin of a three-
dimensional coordinate system. The length of each edge of the cube is 5 units. List the coordinates of the cube’s vertices.
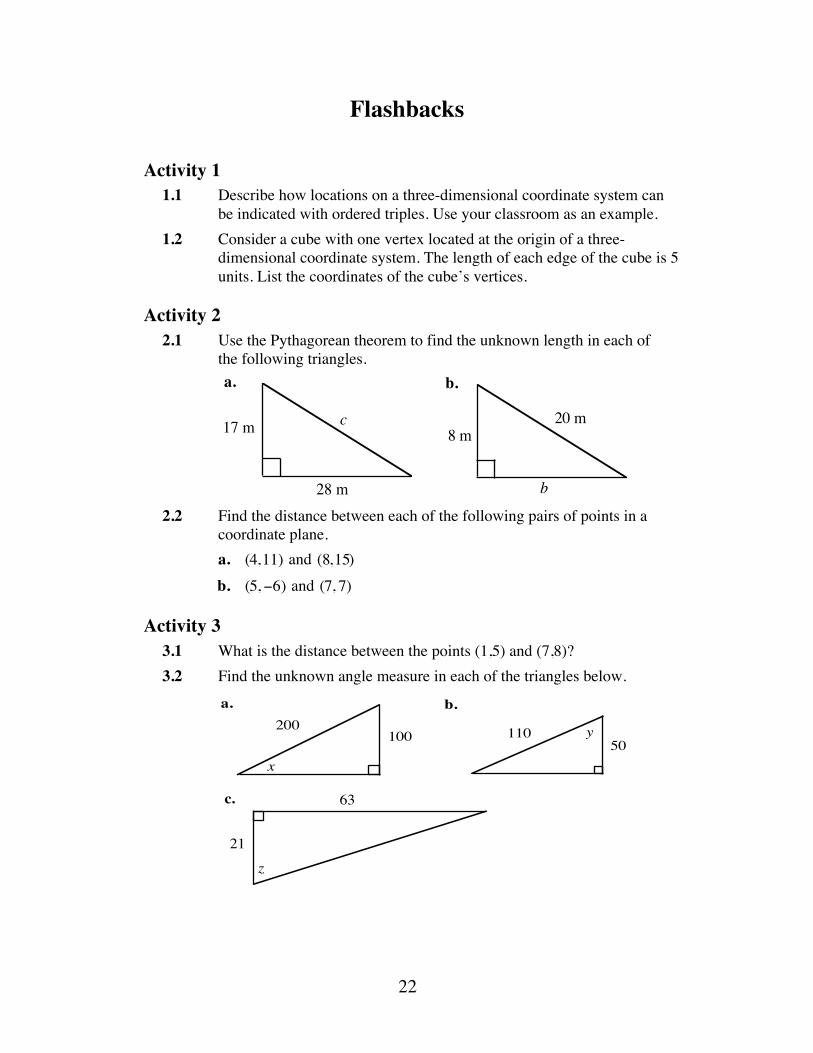
Activity 2 2.1 Use the Pythagorean theorem to find the unknown length in each of
the following triangles.
2.2 Find the distance between each of the following pairs of points in a
coordinate plane. a. (4,11) and (8,15) b. (5, −6) and (7, 7)
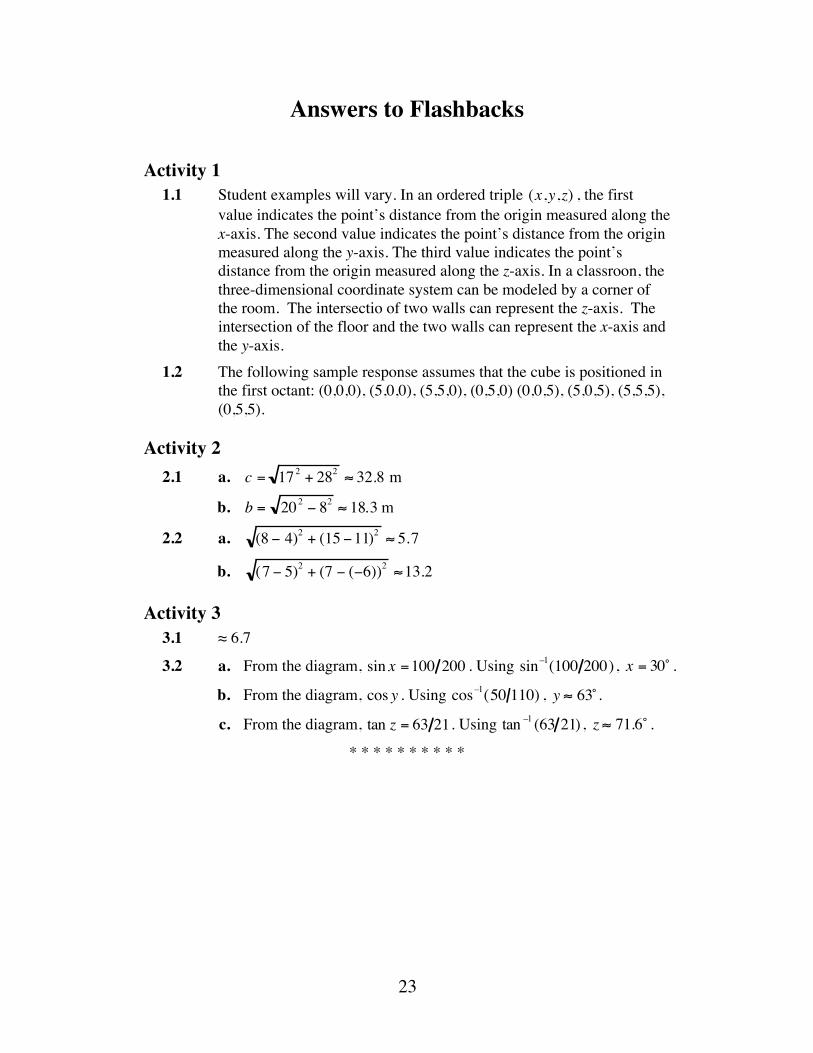
Activity 3 3.1 What is the distance between the points (1,5) and (7,8)? 3.2 Find the unknown angle measure in each of the triangles below.
17 m
28 m
c
a.
8 m
b.
b
20 m
a. b.
50110100
200
x
y
21
63c.
z
23
Answers to Flashbacks
Activity 1 1.1 Student examples will vary. In an ordered triple (x,y,z) , the first
value indicates the point’s distance from the origin measured along the x-axis. The second value indicates the point’s distance from the origin measured along the y-axis. The third value indicates the point’s distance from the origin measured along the z-axis. In a classroon, the three-dimensional coordinate system can be modeled by a corner of the room. The intersectio of two walls can represent the z-axis. The intersection of the floor and the two walls can represent the x-axis and the y-axis.
1.2 The following sample response assumes that the cube is positioned in the first octant: (0,0,0), (5,0,0), (5,5,0), (0,5,0) (0,0,5), (5,0,5), (5,5,5), (0,5,5).
Activity 2 2.1 a. c = 172 + 282 ≈ 32.8 m
b. b = 202 − 82 ≈ 18.3 m
2.2 a. (8 − 4)2 + (15 −11)2 ≈ 5.7
b. (7 − 5)2 + (7 − (−6))2 ≈13.2
Activity 3 3.1 ≈ 6.7
3.2 a. From the diagram, sin x =100 200 . Using sin–1(100 200) , x = 30˚ .
b. From the diagram, cos y . Using cos–1(50 110) , y ≈ 63̊ .
c. From the diagram, tan z = 63 21. Using tan –1 (63 21) , z ≈ 71.6˚ .
* * * * * * * * * *

24
Topographic Map

What Are You Eating?
The labels on packaged food contain a wealth of nutritional information. In this module, you use these labels and linear programming to help select foods that satisfy nutritional requirements.
Masha Albrecht • Darlene Pugh
27
Teacher Edition What Are You Eating?
Overview In this module, students use linear programming techniques to analyze nutrition. They also examine the use of matrix operations to solve systems of equations.
Objectives In this module, students will: • express constraints as a system of inequalities • graph feasible regions and find corner points • minimize or maximize objective functions using the corner principle • solve systems of linear equations graphically and algebraically • represent systems of linear equations as matrix equations • solve matrix equations • use matrices to solve systems of equations • identify consistent and inconsistent systems of equations.
Prerequisites For this module, students should know how to: • calculate proportions and percentages • solve linear equations • use the distributive property • solve systems of linear equations by substitution and graphing • solve systems of inequalities by graphing • perform matrix multiplication • determine multiplicative identities for matrices • determine multiplicative inverses of square matrices.
28
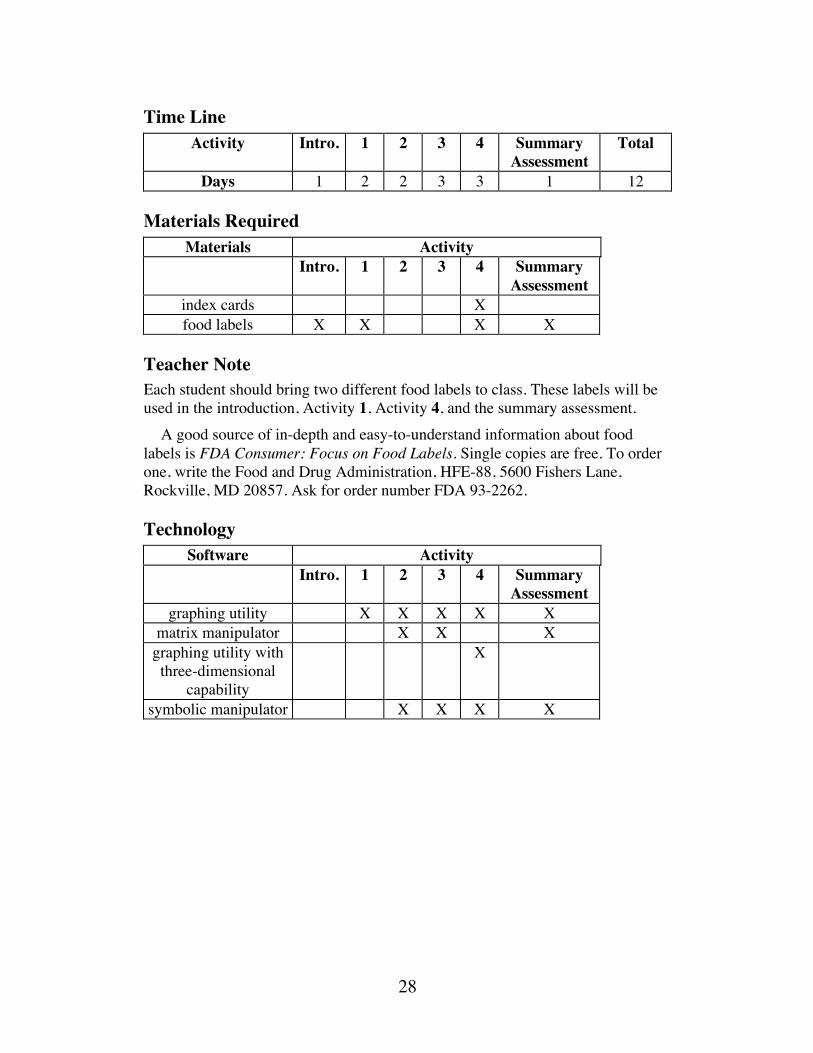
Time Line Activity Intro. 1 2 3 4 Summary
Assessment Total
Days 1 2 2 3 3 1 12
Materials Required Materials Activity
Intro. 1 2 3 4 Summary Assessment
index cards X food labels X X X X
Teacher Note Each student should bring two different food labels to class. These labels will be used in the introduction, Activity 1, Activity 4, and the summary assessment. A good source of in-depth and easy-to-understand information about food labels is FDA Consumer: Focus on Food Labels. Single copies are free. To order one, write the Food and Drug Administration, HFE-88, 5600 Fishers Lane, Rockville, MD 20857. Ask for order number FDA 93-2262.
Technology Software Activity
Intro. 1 2 3 4 Summary Assessment
graphing utility X X X X X matrix manipulator X X X
graphing utility with three-dimensional
capability
X
symbolic manipulator X X X X
29
What Are You Eating?
Introduction (page 29) Students discuss the information on food labels. For a summary of the information which must be listed on a food label and how it must be presented, refer to the FDA publication Food Labeling: Questions and Answers.
Discussion (page 31) a. Answers will vary. Sample response: A healthy meal may include
lowfat milk, fruits, vegetables, and whole-grain breads or cereals. An unhealthy meal may consist of foods that are high in saturated fats, cholesterol, and sodium, and low in calcium and fiber.
b. 1. Answers may vary. Some students may suggest that the FDA multiplied the grams of total fat by the number of calories per gram of fat, then rounded to two significant digits. Since each gram of fat contains 9 calories, the equation 13 •9 = 117 gives the total number of calories. This figure was then rounded to 120 calories.
2. Since one serving of 260 calories contains 120 calories from fat, the percentage is approximately 46%.
3. The total fat for one serving (13 g) is divided by the total fat for a 2000-calorie reference diet (65 g).
c. Answers may vary. Sample response: Each label reports the Percent Daily Values in one serving of 5 different nutrients and 4 vitamins and minerals. Since all Daily Values are based on a 2000-calorie diet, different foods are easy to compare. Labels also show the total number of grams recommended per day for each of six nutrients and the calories per gram for fat, carbohydrates, and protein.
Note: Labels do not show Percent Daily Values for sugars or protein because health authorities have not set limits for these two nutrients.
d. 1. One serving of this food contains 13 g of fat, 31 g of carbohydrate, and 0 g of fiber. Since the recommended 2500-calorie diet includes 80 g of total fat, 375 g of total carbohydrate, and 30 g of fiber, the corresponding Percent Daily Values are 13 80 ≈16% , 31 375 ≈ 8%, and 0 30 = 0%, respectively.
2. Sample response: The Percent Daily Values received from 1 serving are lower for a person on a 2500-calorie diet. This is because a person who requires 2500 calories per day needs more fat, carbohydrates, and fiber than a person who requires 2000 calories per day.
30
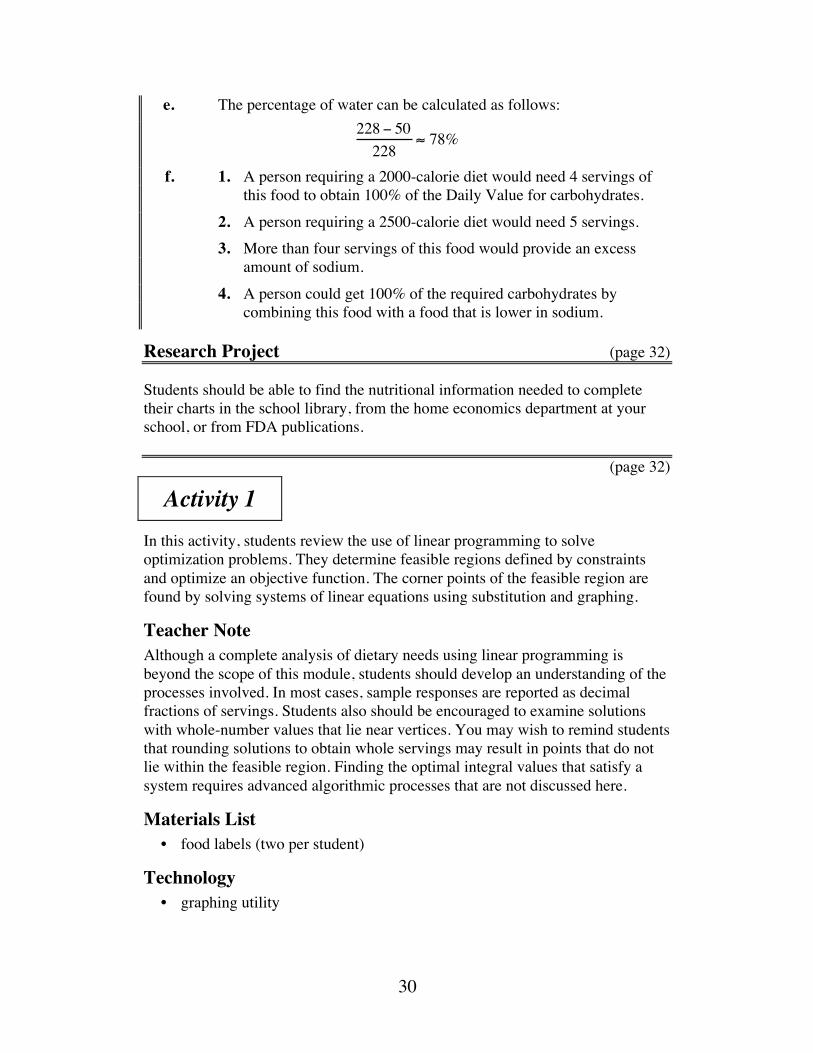
e. The percentage of water can be calculated as follows: 228 − 50228
≈ 78%
f. 1. A person requiring a 2000-calorie diet would need 4 servings of this food to obtain 100% of the Daily Value for carbohydrates.
2. A person requiring a 2500-calorie diet would need 5 servings. 3. More than four servings of this food would provide an excess
amount of sodium. 4. A person could get 100% of the required carbohydrates by
combining this food with a food that is lower in sodium.
Research Project (page 32) Students should be able to find the nutritional information needed to complete their charts in the school library, from the home economics department at your school, or from FDA publications. (page 32)
Activity 1 In this activity, students review the use of linear programming to solve optimization problems. They determine feasible regions defined by constraints and optimize an objective function. The corner points of the feasible region are found by solving systems of linear equations using substitution and graphing.
Teacher Note Although a complete analysis of dietary needs using linear programming is beyond the scope of this module, students should develop an understanding of the processes involved. In most cases, sample responses are reported as decimal fractions of servings. Students also should be encouraged to examine solutions with whole-number values that lie near vertices. You may wish to remind students that rounding solutions to obtain whole servings may result in points that do not lie within the feasible region. Finding the optimal integral values that satisfy a system requires advanced algorithmic processes that are not discussed here.
Materials List • food labels (two per student)
Technology • graphing utility
31
Discussion 1 (page 33) a. Since there are five equations, no two are parallel, and no more than two
intersect at any one point, the number of intersections is 10. Students may count these by examining the graph in Figure 2.
b. Although this point satisfies four constraints, it is not included in the feasible region because it does not satisfy the constraint 4x + 2y ≥16 .
c. Since each of the following five intersections is not contained in the feasible region, it is not a corner point:
• the intersection of x = 0 and y = 0 ; 0, 0( )
• the intersection of 4x + 2y = 16 and y = 0 ; 4, 0( )
• the intersection of 2x + 3y = 12 and x + y = 9 ; 15, −6( )
• the intersection of 4x + 2y = 16 and x + y = 9 ; −1,10( )
• the intersection of 2x + 3y = 12 and x = 0 ; 0, 4( )
d. 1. Sample response: The value of a y-intercept can be found by substituting 0 for x in the equation of the line and solving for y.
4(0) + 2y = 162y = 16y = 8
2. Sample response: The value of an x-intercept can be found by substituting 0 for y in the equation of the line and solving for x.
4x + 2(0) = 164x = 16x = 4
e. 1. The corner points (0,8) and (0,9) are located on the y-axis. The corner points (6,0) and (9,0) are located on the x-axis.
2. Sample response: Each of these points represents an x- or y-intercept for one of the lines. The value of an x-intercept can be found by substituting 0 for y in the equation of the line and solving for x. The value of a y-intercept can be found by substituting 0 for x in the equation of the line and solving for y.
3. Sample response: There is one corner point remaining—the intersection of 4x + 2y = 16 and 2x + 3y = 12 . Its coordinates can be found by solving the following system of equations:
4x + 2y = 162x + 3y = 12⎧ ⎨ ⎩
32
Teacher Note You may wish to review several ways of solving systems of equations. Students already may be familiar with one or more of the following methods. • Solve both equations for x and set them equal to each other. • Solve both equations for y and set them equal to each other. • Use the substitution method for solving simultaneous equations. • Use a graphing utility to graph the system, then trace to find the coordinates
of the point of intersection. • Add the equations together to eliminate a variable, then solve for the
remaining variable.
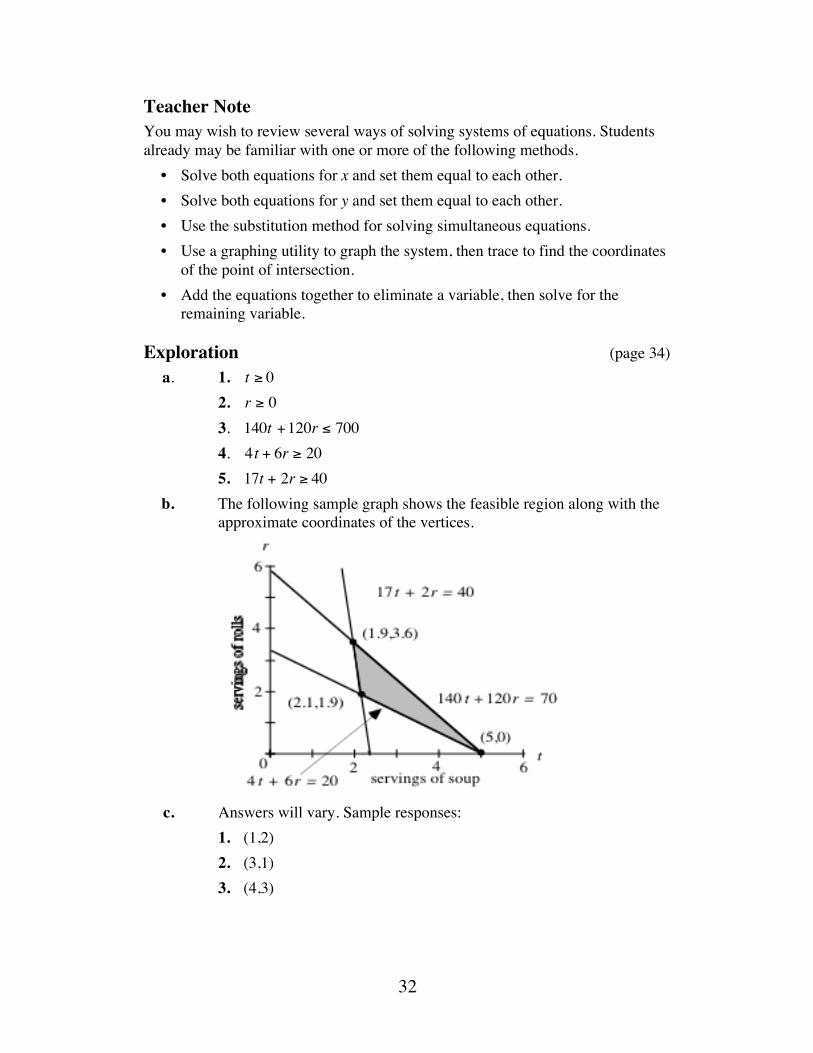
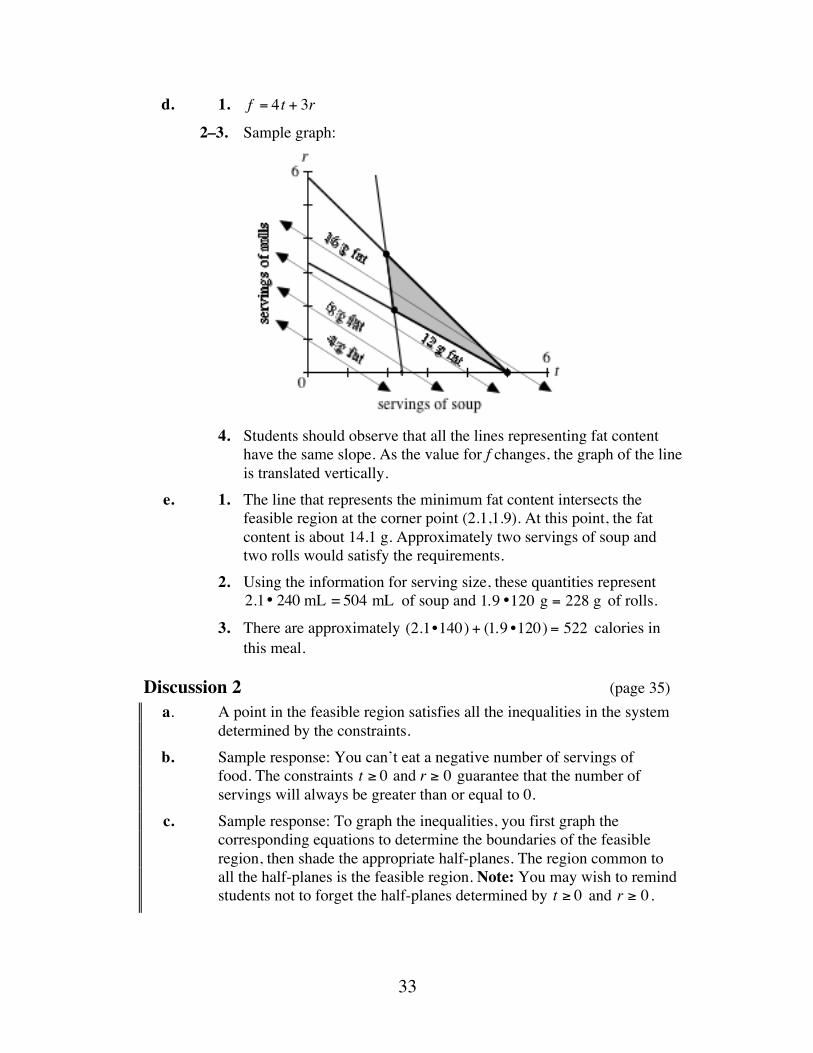
Exploration (page 34) a. 1. t ≥ 0 2. r ≥ 0 3. 140t +120r ≤ 700 4. 4t + 6r ≥ 20 5. 17t + 2r ≥ 40 b. The following sample graph shows the feasible region along with the
approximate coordinates of the vertices.
c. Answers will vary. Sample responses: 1. (1,2) 2. (3,1) 3. (4,3)
33
d. 1. f = 4t + 3r
2–3. Sample graph:
4. Students should observe that all the lines representing fat content
have the same slope. As the value for f changes, the graph of the line is translated vertically.
e. 1. The line that represents the minimum fat content intersects the feasible region at the corner point (2.1,1.9). At this point, the fat content is about 14.1 g. Approximately two servings of soup and two rolls would satisfy the requirements.
2. Using the information for serving size, these quantities represent 2.1• 240 mL = 504 mL of soup and 1.9 •120 g = 228 g of rolls.
3. There are approximately (2.1•140) + (1.9 •120) = 522 calories in this meal.
Discussion 2 (page 35) a. A point in the feasible region satisfies all the inequalities in the system
determined by the constraints. b. Sample response: You can’t eat a negative number of servings of
food. The constraints t ≥ 0 and r ≥ 0 guarantee that the number of servings will always be greater than or equal to 0.
c. Sample response: To graph the inequalities, you first graph the corresponding equations to determine the boundaries of the feasible region, then shade the appropriate half-planes. The region common to all the half-planes is the feasible region. Note: You may wish to remind students not to forget the half-planes determined by t ≥ 0 and r ≥ 0 .
34
d. The following constraints bound the feasible region: 4t + 6r = 20 (20% DV of iron)17t + 2r = 40 (40% DV of calcium)140t +120r = 700 (calories)
⎧
⎨ ⎪
⎩ ⎪
e. 1. The coordinates of each point on the line describe a combination of rolls and soup that corresponds to 8 g of fat.
2. Each combination that corresponds to 8 g of fat determines a meal that does not satisfy the constraints of the problem.
f. 1. The minimum occurs at the point with approximate coordinates (2.1,1.9), a corner point of the polygon that defines the feasible region.
2. According to the corner principle, the minimum and maximum values of an objective function, if they exist, will always occur at a corner point of the feasible region.
g. The minimum amount of fat occurs when t = 2 and r = 3 , as indicated in the table below. Simply through rounding, students may expect the point (2,2) to provide the minimum fat content. However, this point fails to meet the constraint for calcium, 17t + 2r ≥ 40 .
Assignment (page 36) 1.1 a. In the following system, c represents acres of corn and w
represents acres of wheat: c ≥ 0w ≥ 0w + c ≤ 100300c + 250w ≤ 26500
⎧
⎨
⎪ ⎪
⎩
⎪ ⎪
Servings of Soup Servings of Rolls Fat Content (g)
3 2 182 3 175 0 20
4 1 19
2 2 14
35
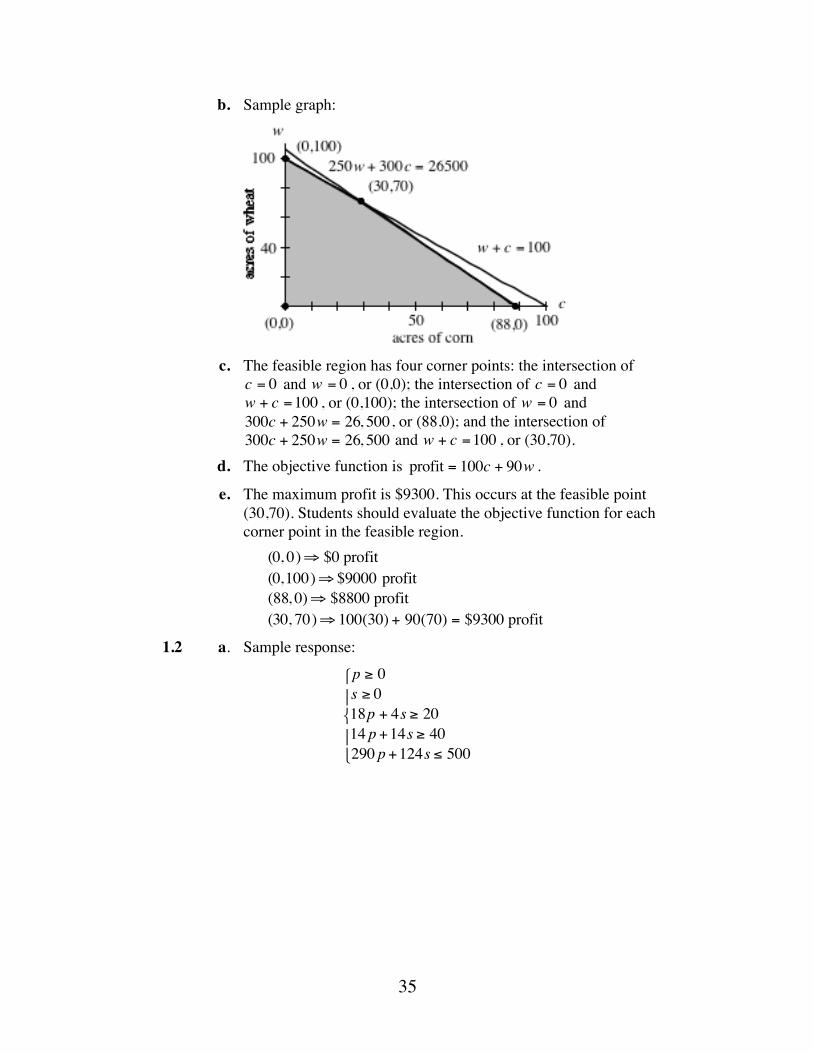
b. Sample graph:
c. The feasible region has four corner points: the intersection of
c = 0 and w = 0 , or (0,0); the intersection of c = 0 and w + c =100 , or (0,100); the intersection of w = 0 and 300c + 250w = 26, 500, or (88,0); and the intersection of 300c + 250w = 26, 500 and w + c =100 , or (30,70).
d. The objective function is profit = 100c + 90w .
e. The maximum profit is $9300. This occurs at the feasible point (30,70). Students should evaluate the objective function for each corner point in the feasible region.
(0, 0)⇒ $0 profit(0,100)⇒ $9000 profit(88, 0)⇒ $8800 profit(30, 70)⇒ 100(30) + 90(70) = $9300 profit
1.2 a. Sample response: p ≥ 0s ≥ 018p + 4s ≥ 2014 p +14s ≥ 40290 p +124s ≤ 500
⎧
⎨ ⎪
⎩ ⎪
36
b. The following sample graph shows the feasible region along with the approximate coordinates of the vertices.
c. Sample response: The region defined by these constraints is the
first quadrant of the coordinate plane. The points in the feasible region represent a subset of the points in the first quadrant.
d. The objective function is C = 124s + 290p . e. The minimum value of the objective function occurs at the corner
point with approximate coordinates (0.6,2.2). This represents 0.6 •210 ≈ 130 g of pizza and 2.2 • 248 ≈ 550 g of salad.
f. For 130 g of pizza and 550 g of salad, the number of calories is 0.6 • 290 + 2.2 •124 = 450 calories and the number of grams of fat is 0.6 • 8 = 4.8 g .
*1.3 a. Answers will vary. Students should minimize the amount of sodium consumed. Some students may obtain a system that cannot be solved.
b. Students should verify their responses to Part a both graphically and algebraically.
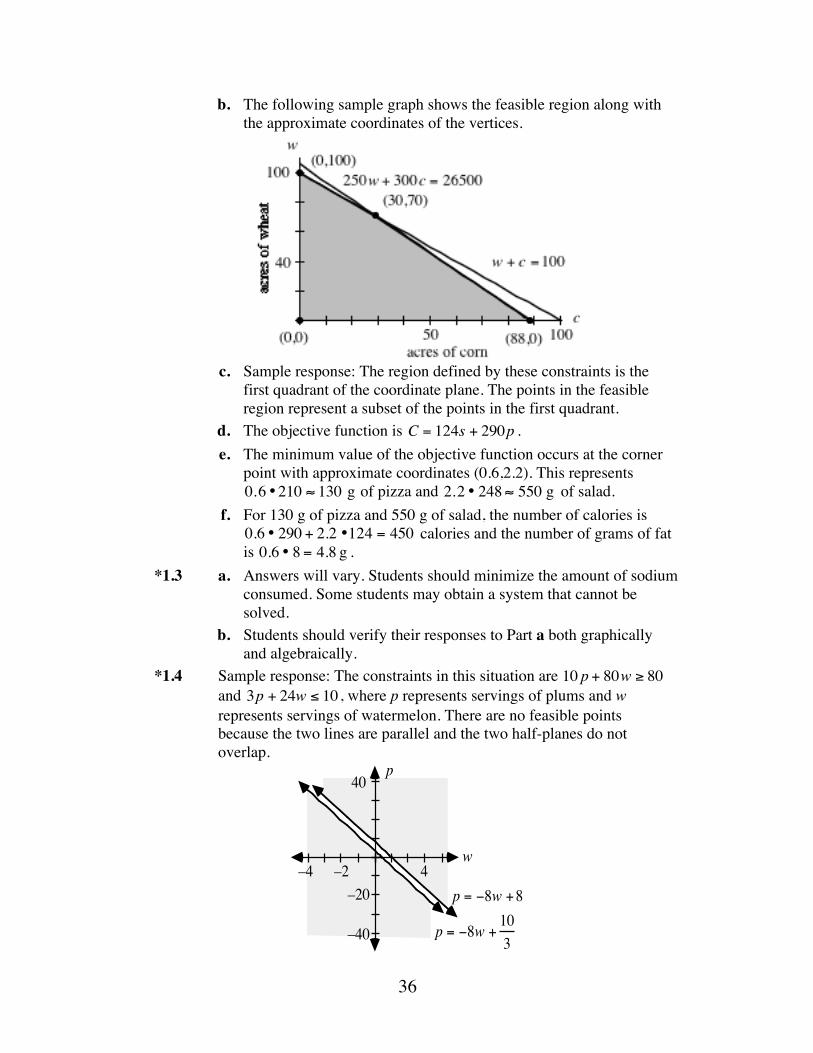
*1.4 Sample response: The constraints in this situation are 10 p + 80w ≥ 80 and 3p + 24w ≤ 10 , where p represents servings of plums and w represents servings of watermelon. There are no feasible points because the two lines are parallel and the two half-planes do not overlap.
40
–40
–4 w
p
–2 4–20 p = −8w +8
p = −8w +103
37
* * * * *
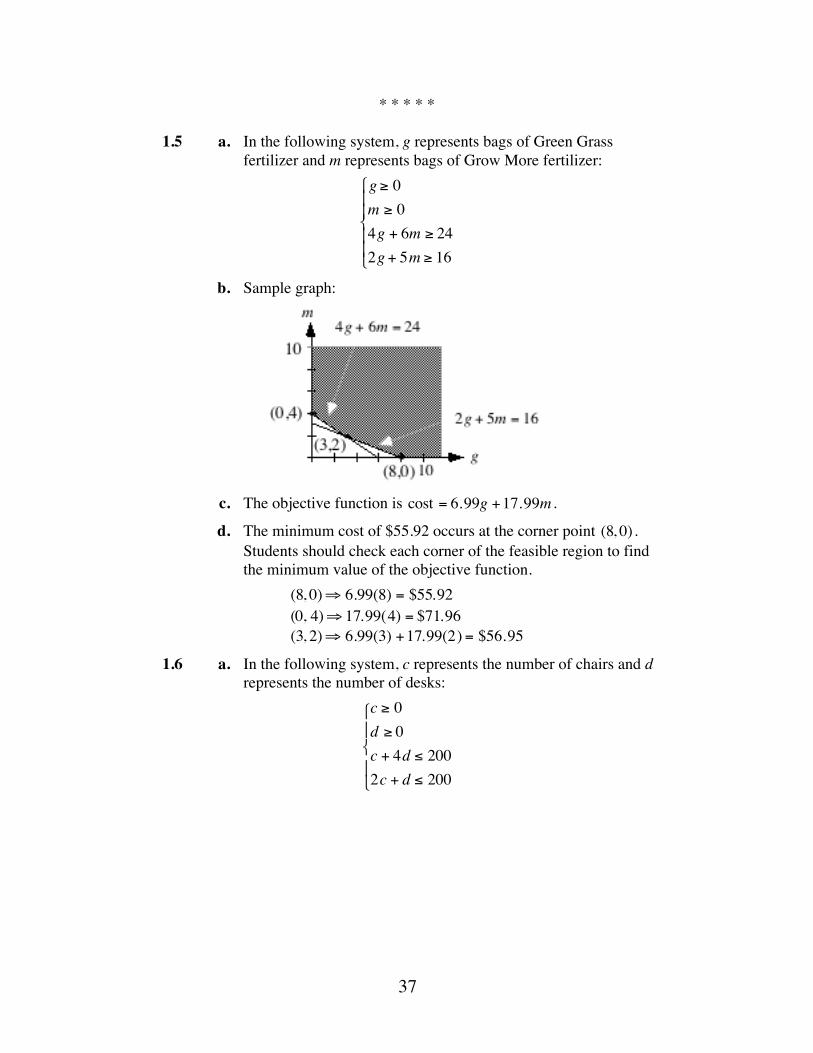
1.5 a. In the following system, g represents bags of Green Grass fertilizer and m represents bags of Grow More fertilizer:
g ≥ 0m ≥ 04g + 6m ≥ 242g + 5m ≥ 16
⎧
⎨
⎪ ⎪
⎩
⎪ ⎪
b. Sample graph:
c. The objective function is cost = 6.99g +17.99m .
d. The minimum cost of $55.92 occurs at the corner point (8, 0) . Students should check each corner of the feasible region to find the minimum value of the objective function.
(8, 0)⇒ 6.99(8) = $55.92(0, 4)⇒ 17.99(4) = $71.96(3, 2)⇒ 6.99(3) +17.99(2) = $56.95
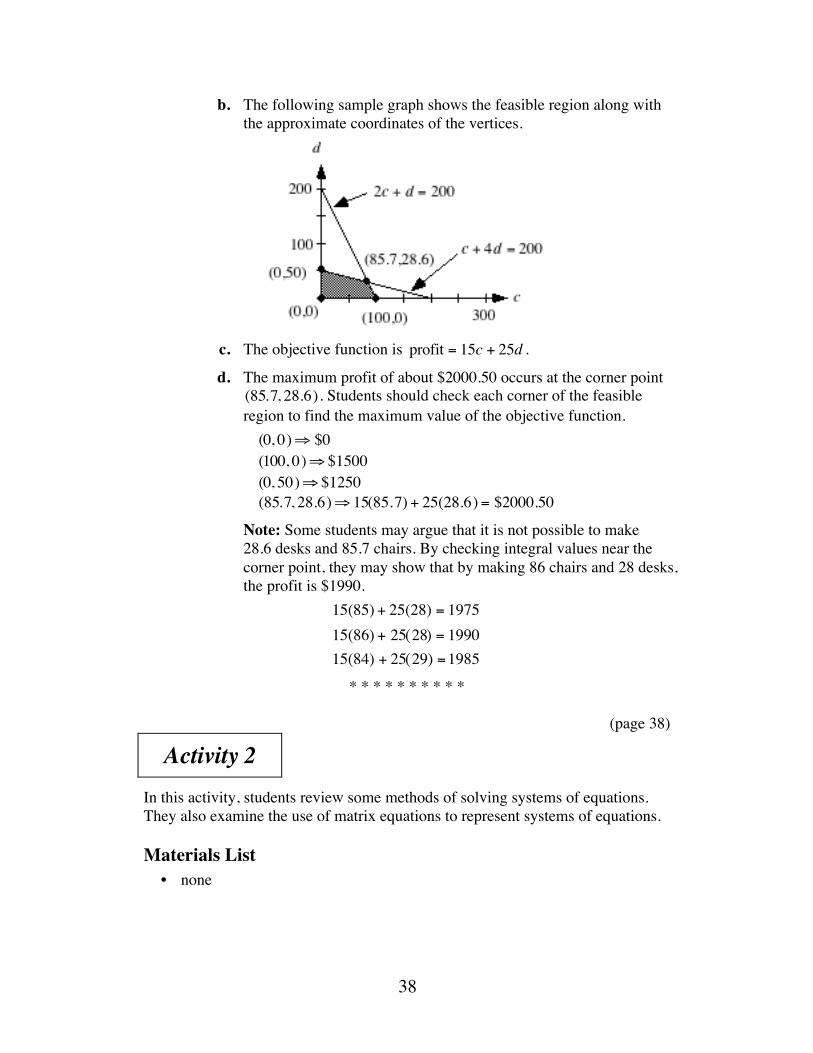
1.6 a. In the following system, c represents the number of chairs and d represents the number of desks:
c ≥ 0d ≥ 0c + 4d ≤ 2002c + d ≤ 200
⎧
⎨ ⎪
⎩ ⎪
38
b. The following sample graph shows the feasible region along with the approximate coordinates of the vertices.
c. The objective function is profit = 15c + 25d .
d. The maximum profit of about $2000.50 occurs at the corner point (85.7, 28.6). Students should check each corner of the feasible region to find the maximum value of the objective function. (0, 0)⇒ $0(100, 0)⇒ $1500(0, 50)⇒ $1250(85.7, 28.6)⇒ 15(85.7) + 25(28.6) = $2000.50
Note: Some students may argue that it is not possible to make 28.6 desks and 85.7 chairs. By checking integral values near the corner point, they may show that by making 86 chairs and 28 desks, the profit is $1990.
15(85) + 25(28) = 197515(86) + 25(28) = 199015(84) + 25(29) =1985
* * * * * * * * * * (page 38)
Activity 2 In this activity, students review some methods of solving systems of equations. They also examine the use of matrix equations to represent systems of equations.
Materials List • none
39
Technology • graphing utility • matrix manipulator • symbolic manipulator (optional)
Exploration (page 38) a. Students may solve by graphing or by substitution. 1. (4, −2)
2. (0.75, −1)
b. Students should substitute as shown below. 1.
2s + 3t = 22(4) + 3(−2) = 2
8 − 6 = 22 = 2
−5s + 0.5t = −21−5(4) + 0.5(−2) = −21
−20 −1 = −21−21 = −21
2.
12x − y =1012(0.75) − (−1) =10
9 +1 =1010 =10
4x + 2y = 13 − 2 = 1
4(0.75) + 2(−1) = 11 = 1
c–d. These matrix equations simplify to the same systems of equations given in Part a. Therefore, the solutions are the same as in Part a.
e. 1.
5 72 8⎡
⎣ ⎢ ⎤
⎦ ⎥ •tr⎡
⎣ ⎢ ⎤
⎦ ⎥ =3025⎡
⎣ ⎢ ⎤
⎦ ⎥
2.
1 −34 2⎡
⎣ ⎢
⎤
⎦ ⎥ •
xy⎡
⎣ ⎢ ⎤
⎦ ⎥ =
−27
⎡
⎣ ⎢
⎤
⎦ ⎥
3.
2 13 1⎡
⎣ ⎢ ⎤
⎦ ⎥ •xy⎡
⎣ ⎢ ⎤
⎦ ⎥ =34⎡
⎣ ⎢ ⎤
⎦ ⎥
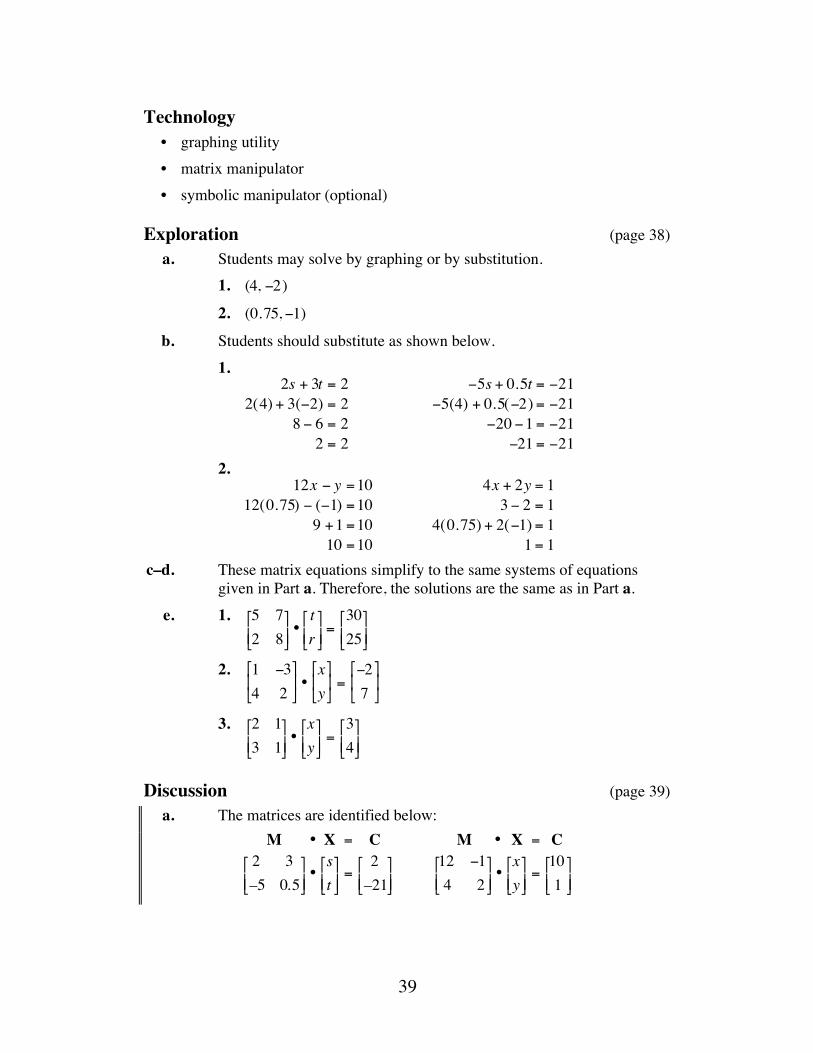
Discussion (page 39) a. The matrices are identified below:
M • X = C2 3–5 0.5⎡
⎣ ⎢ ⎤
⎦ ⎥ •st⎡
⎣ ⎢ ⎤
⎦ ⎥ =
2–21⎡
⎣ ⎢ ⎤
⎦ ⎥
M • X = C12 −14 2⎡
⎣ ⎢ ⎤
⎦ ⎥ •xy⎡
⎣ ⎢ ⎤
⎦ ⎥ =
101⎡
⎣ ⎢ ⎤
⎦ ⎥
40
b. A system of two equations with two variables can have one solution (when the graphs of the equations intersect), no solutions (when the graphs of the equations are parallel), or infinite solutions (when the graphs of the equations coincide).
c. According to the corner principle, the minimum or maximum values of a linear objective function, if they exist, always occurs at a vertex of the feasible region. A vertex occurs at the intersection of two or more lines. Solving the system of equations that represents those lines determines the coordinates of the point of intersection (corner points).
Note: You may wish to remind students that there may be more efficient methods for identifying the coordinates of some corner points. For example, intercepts may be found by substituting 0 for the appropriate variables.
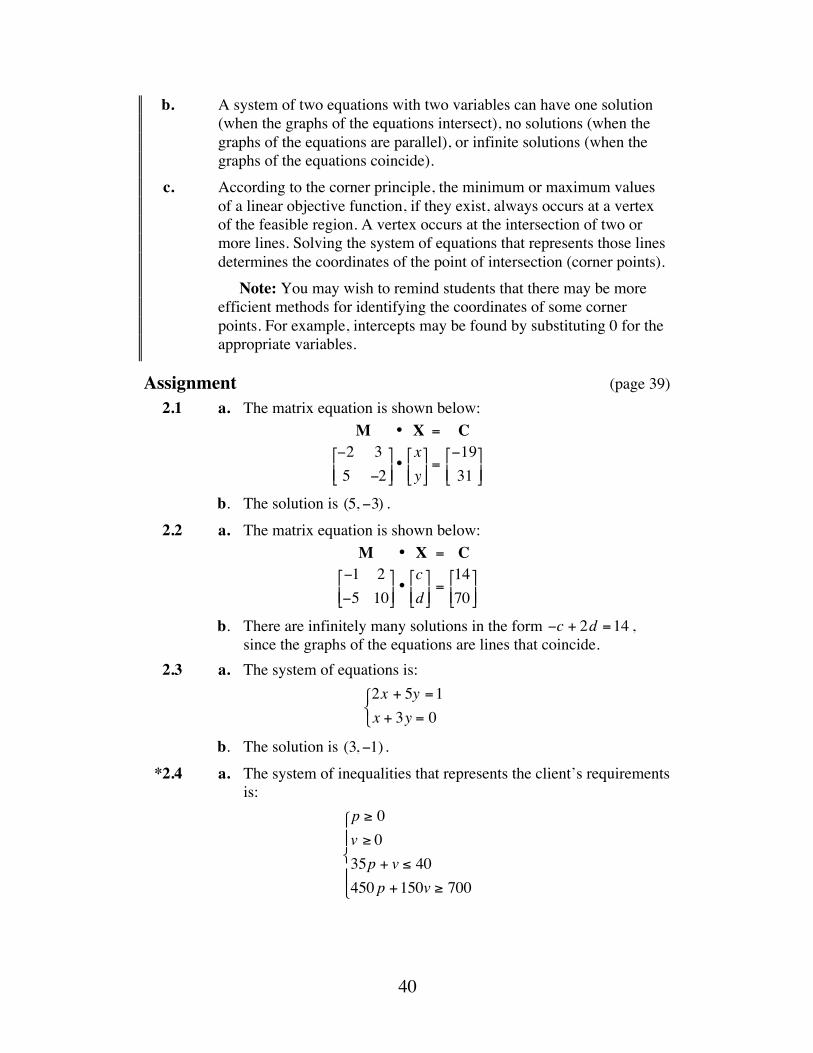
Assignment (page 39) 2.1 a. The matrix equation is shown below:
M • X = C−2 35 −2
⎡
⎣ ⎢ ⎤
⎦ ⎥ •xy⎡
⎣ ⎢ ⎤
⎦ ⎥ =
−1931
⎡
⎣ ⎢ ⎤
⎦ ⎥
b. The solution is (5, −3) . 2.2 a. The matrix equation is shown below:
M • X = C−1 2−5 10⎡
⎣ ⎢ ⎤
⎦ ⎥ •cd⎡
⎣ ⎢ ⎤
⎦ ⎥ =1470⎡
⎣ ⎢ ⎤
⎦ ⎥
b. There are infinitely many solutions in the form −c + 2d =14 , since the graphs of the equations are lines that coincide.
2.3 a. The system of equations is: 2x + 5y =1x + 3y = 0⎧ ⎨ ⎩
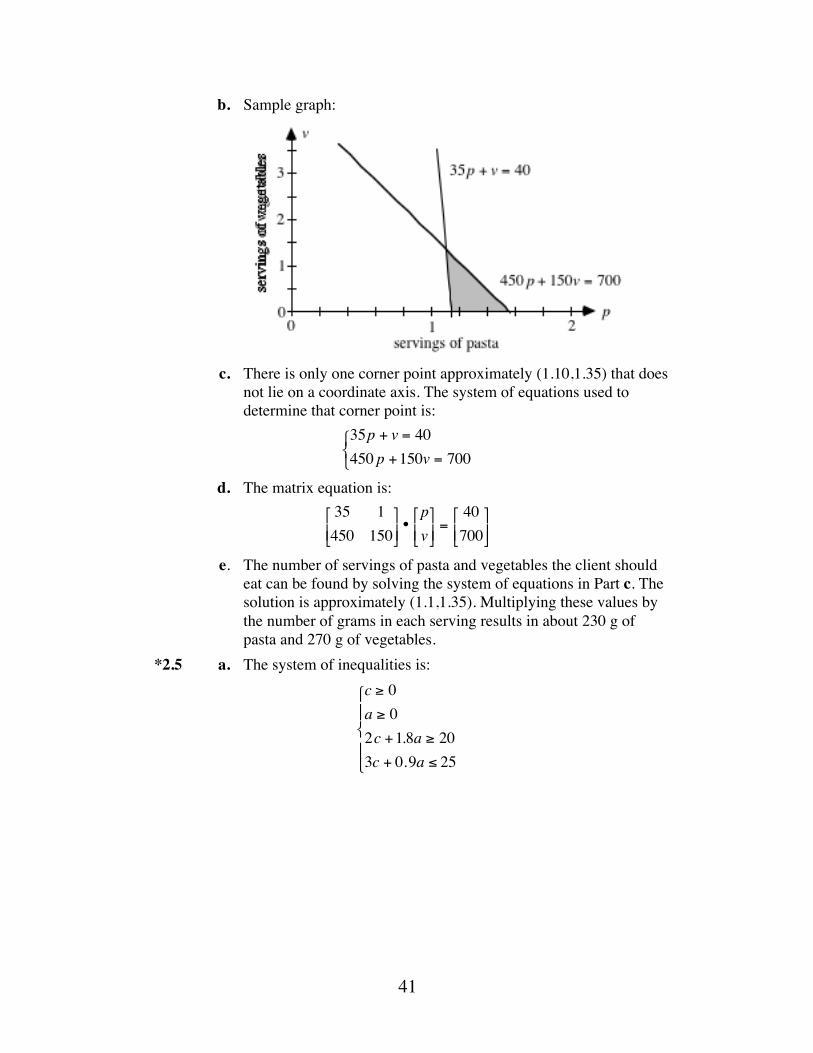
b. The solution is (3, −1) . *2.4 a. The system of inequalities that represents the client’s requirements
is: p ≥ 0v ≥ 035p + v ≤ 40450 p +150v ≥ 700
⎧
⎨ ⎪
⎩ ⎪
41
b. Sample graph:
c. There is only one corner point approximately (1.10,1.35) that does
not lie on a coordinate axis. The system of equations used to determine that corner point is:
35p + v = 40450 p +150v = 700⎧ ⎨ ⎩
d. The matrix equation is: 35 1450 150⎡
⎣ ⎢ ⎤
⎦ ⎥ •pv⎡
⎣ ⎢ ⎤
⎦ ⎥ =
40700⎡
⎣ ⎢ ⎤
⎦ ⎥
e. The number of servings of pasta and vegetables the client should eat can be found by solving the system of equations in Part c. The solution is approximately (1.1,1.35). Multiplying these values by the number of grams in each serving results in about 230 g of pasta and 270 g of vegetables.
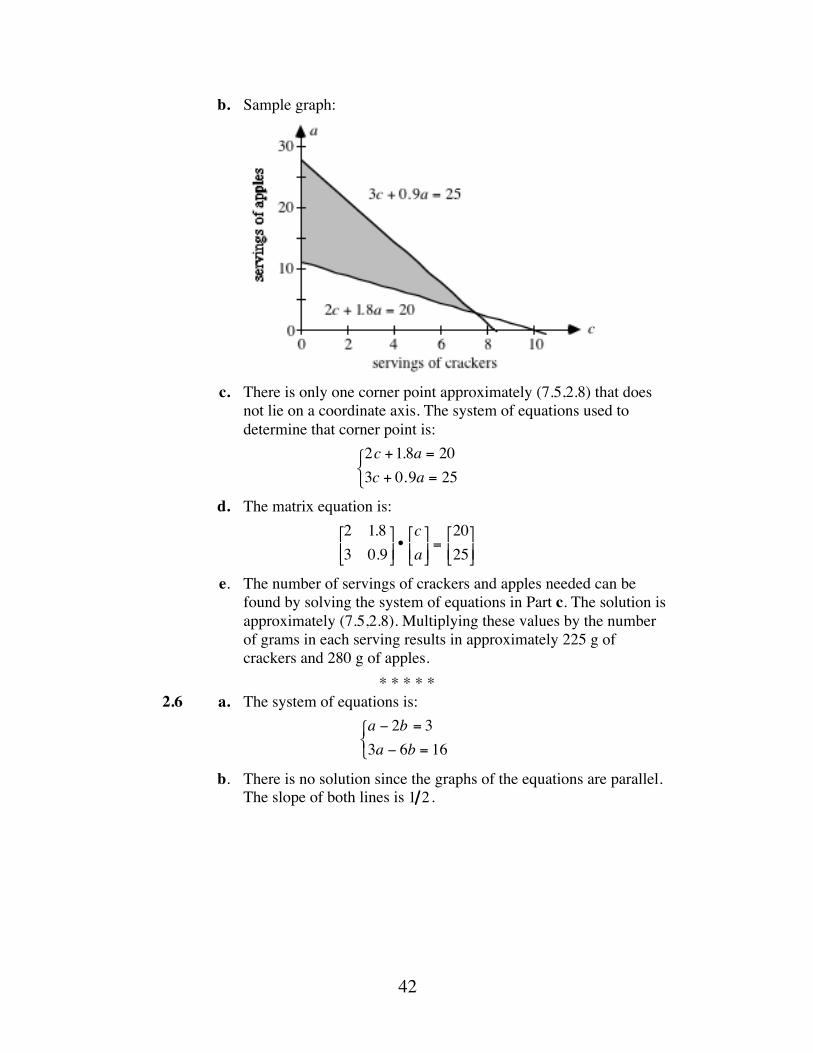
*2.5 a. The system of inequalities is: c ≥ 0a ≥ 02c +1.8a ≥ 203c + 0.9a ≤ 25
⎧
⎨ ⎪
⎩ ⎪
42
b. Sample graph:
c. There is only one corner point approximately (7.5,2.8) that does
not lie on a coordinate axis. The system of equations used to determine that corner point is:
2c +1.8a = 203c + 0.9a = 25⎧ ⎨ ⎩
d. The matrix equation is: 2 1.83 0.9⎡
⎣ ⎢ ⎤
⎦ ⎥ •ca⎡
⎣ ⎢ ⎤
⎦ ⎥ =2025⎡
⎣ ⎢ ⎤
⎦ ⎥
e. The number of servings of crackers and apples needed can be found by solving the system of equations in Part c. The solution is approximately (7.5,2.8). Multiplying these values by the number of grams in each serving results in approximately 225 g of crackers and 280 g of apples.
* * * * * 2.6 a. The system of equations is:
a − 2b = 33a − 6b = 16⎧ ⎨ ⎩
b. There is no solution since the graphs of the equations are parallel. The slope of both lines is 1 2 .

43
2.7 a. The system of equations that describes this situation is shown below:
5r + 20n = 5001.5r + n = 80⎧ ⎨ ⎩
The corresponding matrix equation is: 5 201.5 1⎡
⎣ ⎢ ⎤
⎦ ⎥ •rn⎡
⎣ ⎢ ⎤
⎦ ⎥ =50080⎡
⎣ ⎢ ⎤
⎦ ⎥
b. The solution is (44,14) , so the Jewelry Emporium can make 44 rings and 14 necklaces.
* * * * * * * * * * (page 41)
Activity 3 In this activity, students review the multiplicative inverse and multiplicative identity for real numbers. They discover the multiplicative inverse and multiplicative identity for matrices, then use them to solve matrix equations.
Materials List • none
Technology • graphing utility • symbolic manipulator
Exploration (page 41) a. The matrix equation is:
M • X = C−8 −34 6
⎡
⎣ ⎢ ⎤
⎦ ⎥ •st⎡
⎣ ⎢ ⎤
⎦ ⎥ =
10 5⎡
⎣ ⎢ ⎤
⎦ ⎥
b. The inverse of the coefficient matrix is:
−8 −3 4 6⎡
⎣ ⎢ ⎤
⎦ ⎥
−1
=−1 6 −1 12 1 9 2 9⎡
⎣ ⎢ ⎤
⎦ ⎥ ≈
−0.167 −0.083 0.111 0.222⎡
⎣ ⎢ ⎤
⎦ ⎥
Note: When using technology to compute the inverse of a matrix A, the symbol A–1 should not be confused with 1 A . In most cases, they do not yield the same results. Using a TI-92 calculator, for example, requires entering the matrix, then using the x−1 key to calculate the inverse.
44
Algebraically, the inverse of the matrix a bc d⎡
⎣ ⎢ ⎢
⎤
⎦ ⎥ ⎥
is the matrix below, where ad − bc is the determinant: d
ad − bc−b
ad − bc−c
ad − bca
ad − bc
⎡
⎣
⎢ ⎢ ⎢ ⎢
⎤
⎦
⎥ ⎥ ⎥ ⎥
The inverse exists if and only if the determinant is not 0. c. 1. The identity I for 2 × 2 matrix multiplication is:
I =1 00 1⎡
⎣ ⎢ ⎤
⎦ ⎥
2. Students should observe that A • I = A , or: a bc d⎡
⎣ ⎢ ⎤
⎦ ⎥ •1 00 1⎡
⎣ ⎢ ⎤
⎦ ⎥ =a bc d⎡
⎣ ⎢ ⎤
⎦ ⎥
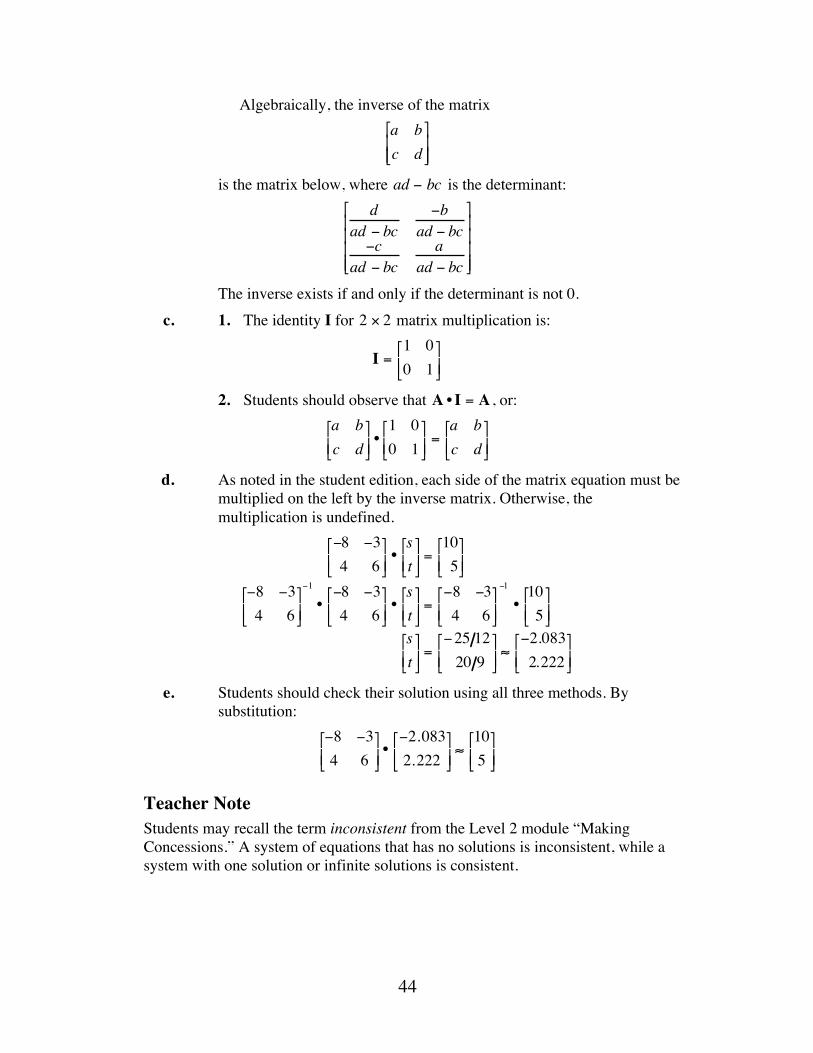
d. As noted in the student edition, each side of the matrix equation must be multiplied on the left by the inverse matrix. Otherwise, the multiplication is undefined.
−8 −3 4 6⎡
⎣ ⎢ ⎤
⎦ ⎥ •st⎡
⎣ ⎢ ⎤
⎦ ⎥ =
10 5⎡
⎣ ⎢ ⎤
⎦ ⎥
−8 −3 4 6⎡
⎣ ⎢ ⎤
⎦ ⎥
−1
•−8 −3 4 6⎡
⎣ ⎢ ⎤
⎦ ⎥ •st⎡
⎣ ⎢ ⎤
⎦ ⎥ =
−8 −3 4 6⎡
⎣ ⎢ ⎤
⎦ ⎥
−1
•10 5⎡
⎣ ⎢ ⎤
⎦ ⎥
st⎡
⎣ ⎢ ⎤
⎦ ⎥ =
−25 12 20 9
⎡
⎣ ⎢ ⎤
⎦ ⎥ ≈
−2.083 2.222⎡
⎣ ⎢ ⎤
⎦ ⎥
e. Students should check their solution using all three methods. By substitution:
−8 −34 6
⎡
⎣ ⎢ ⎤
⎦ ⎥ •−2.0832.222
⎡
⎣ ⎢ ⎤
⎦ ⎥ ≈105⎡
⎣ ⎢ ⎤
⎦ ⎥
Teacher Note Students may recall the term inconsistent from the Level 2 module “Making Concessions.” A system of equations that has no solutions is inconsistent, while a system with one solution or infinite solutions is consistent.
45
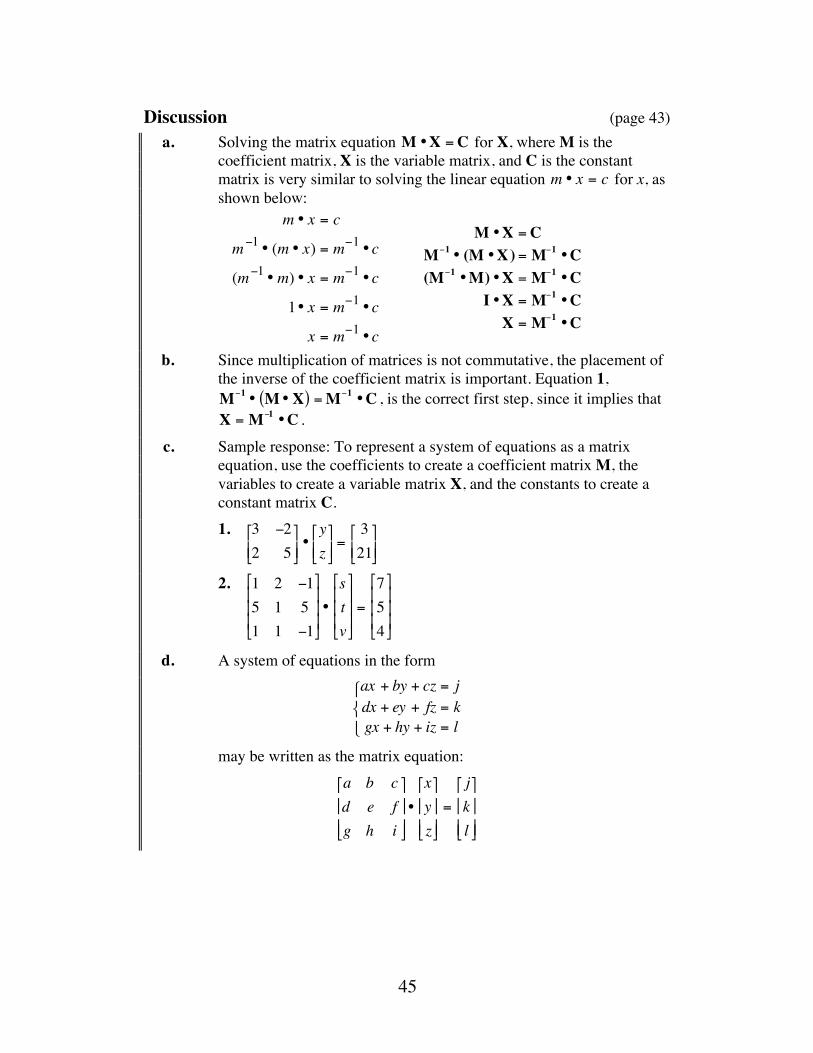
Discussion (page 43) a. Solving the matrix equation M •X =C for X, where M is the
coefficient matrix, X is the variable matrix, and C is the constant matrix is very similar to solving the linear equation m • x = c for x, as shown below:
m • x = c
m−1 • (m • x) = m−1 •c
(m−1 •m) • x = m−1 •c
1• x = m−1 •c
x = m−1 •c
M •X =CM−1 • (M •X) = M−1 •C(M−1 •M) •X = M−1 •C
I •X = M−1 •CX = M−1 •C
b. Since multiplication of matrices is not commutative, the placement of the inverse of the coefficient matrix is important. Equation 1, M−1 • M •X( ) =M−1 •C , is the correct first step, since it implies that X = M−1 •C .
c. Sample response: To represent a system of equations as a matrix equation, use the coefficients to create a coefficient matrix M, the variables to create a variable matrix X, and the constants to create a constant matrix C.
1. 3 −2
2 5⎡
⎣ ⎢ ⎤
⎦ ⎥ •yz⎡
⎣ ⎢ ⎤
⎦ ⎥ =
321⎡
⎣ ⎢ ⎤
⎦ ⎥
2.
1 2 −15 1 51 1 −1
⎡
⎣
⎢ ⎢ ⎢
⎤
⎦
⎥ ⎥ ⎥
•
stv
⎡
⎣
⎢ ⎢ ⎢
⎤
⎦
⎥ ⎥ ⎥
=
754
⎡
⎣
⎢ ⎢ ⎢
⎤
⎦
⎥ ⎥ ⎥
d. A system of equations in the form ax + by + cz = jdx + ey + fz = kgx + hy + iz = l
⎧ ⎨ ⎩
may be written as the matrix equation: a b cd e fg h i
⎡
⎣
⎢ ⎢
⎤
⎦
⎥ ⎥ •xyz
⎡
⎣
⎢ ⎢
⎤
⎦
⎥ ⎥
=
jkl
⎡
⎣
⎢ ⎢
⎤
⎦
⎥ ⎥
46
e. 1. Each system may be solved by multiplying each side of the matrix equation by the inverse of the coefficient matrix. The solutions for these systems are shown below:
yz⎡
⎣ ⎢ ⎤
⎦ ⎥ =33⎡
⎣ ⎢ ⎤
⎦ ⎥ stv
⎡
⎣
⎢ ⎢
⎤
⎦
⎥ ⎥
=
0.73.0−0.3
⎡
⎣
⎢ ⎢
⎤
⎦
⎥ ⎥
Note: You may wish to demonstrate how to solve a system of three equations in three unknowns by substitution. Students will encounter such systems in Activity 4.
2. The solutions may be checked either by substitution or by graphing. Checking the solution to the system of three equations requires three-dimensional graphing. Verification of solutions by graphing is limited to problems with three or fewer variables.
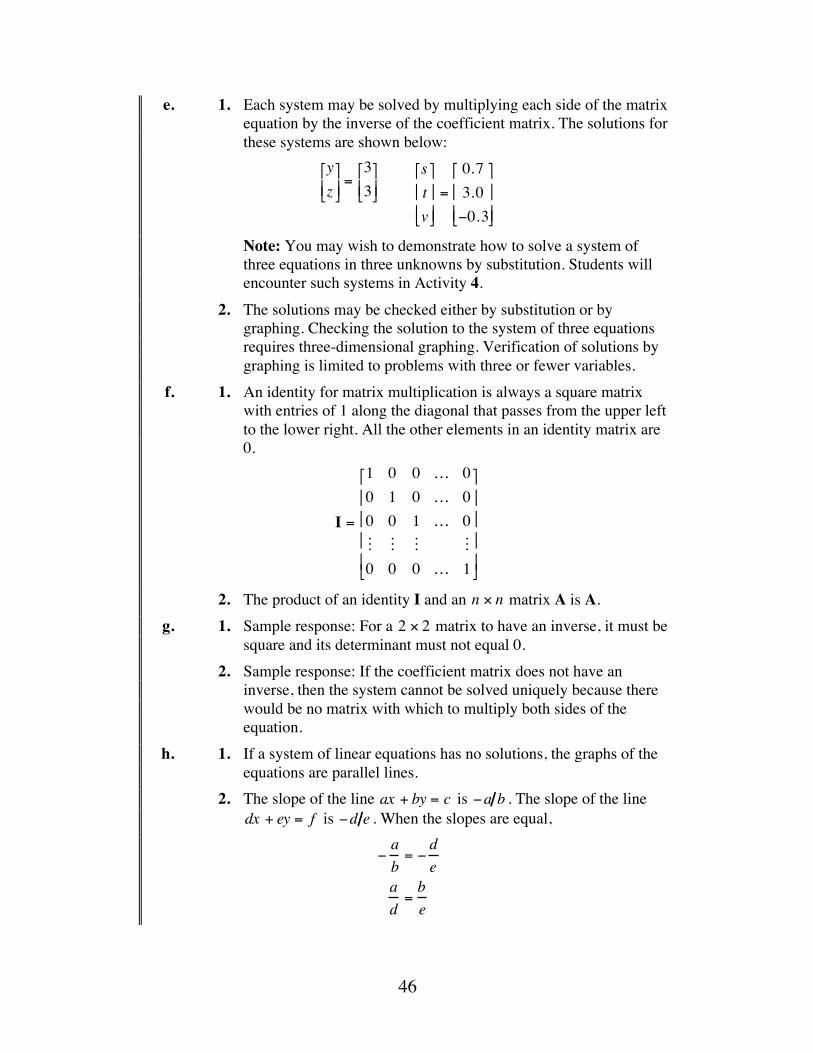
f. 1. An identity for matrix multiplication is always a square matrix with entries of 1 along the diagonal that passes from the upper left to the lower right. All the other elements in an identity matrix are 0.
I =
1 0 0 … 00 1 0 … 00 0 1 … 0! ! ! !0 0 0 … 1
⎡
⎣
⎢ ⎢ ⎢ ⎢
⎤
⎦
⎥ ⎥ ⎥ ⎥
2. The product of an identity I and an n × n matrix A is A. g. 1. Sample response: For a 2 × 2 matrix to have an inverse, it must be
square and its determinant must not equal 0. 2. Sample response: If the coefficient matrix does not have an
inverse, then the system cannot be solved uniquely because there would be no matrix with which to multiply both sides of the equation.
h. 1. If a system of linear equations has no solutions, the graphs of the equations are parallel lines.
2. The slope of the line ax + by = c is −a b . The slope of the line dx + ey = f is −d e . When the slopes are equal,
−ab= −
de
ad=be
47
In this case, the lines are parallel and the system has no solutions or they are different representations of the same line and the system has infinitely many solutions. If the slopes are not equal,
−ab≠ −
de
ad≠be
then, the lines intersect and there is exactly one solution. 3. Sample response: If the coefficient matrix has no inverse, then the
system has no solutions. Therefore, the two lines are parallel and the following equations are true:
−ba= −
ed
ad=be
Students also may reason that if the coefficient matrix shown in Step 2 has no inverse, then the determinant is 0 and the following equations are true ae − bd = 0 and ae = bd . All of these equations are equivalent.
i. According to the corner principle, the minimum or maximum value of an objective function, if it exists, always occurs at a vertex of the feasible region. In situations involving two variables, a vertex occurs at the intersection of two lines. Solving the matrix equation that represents the two lines determines the coordinates of their point of intersection.
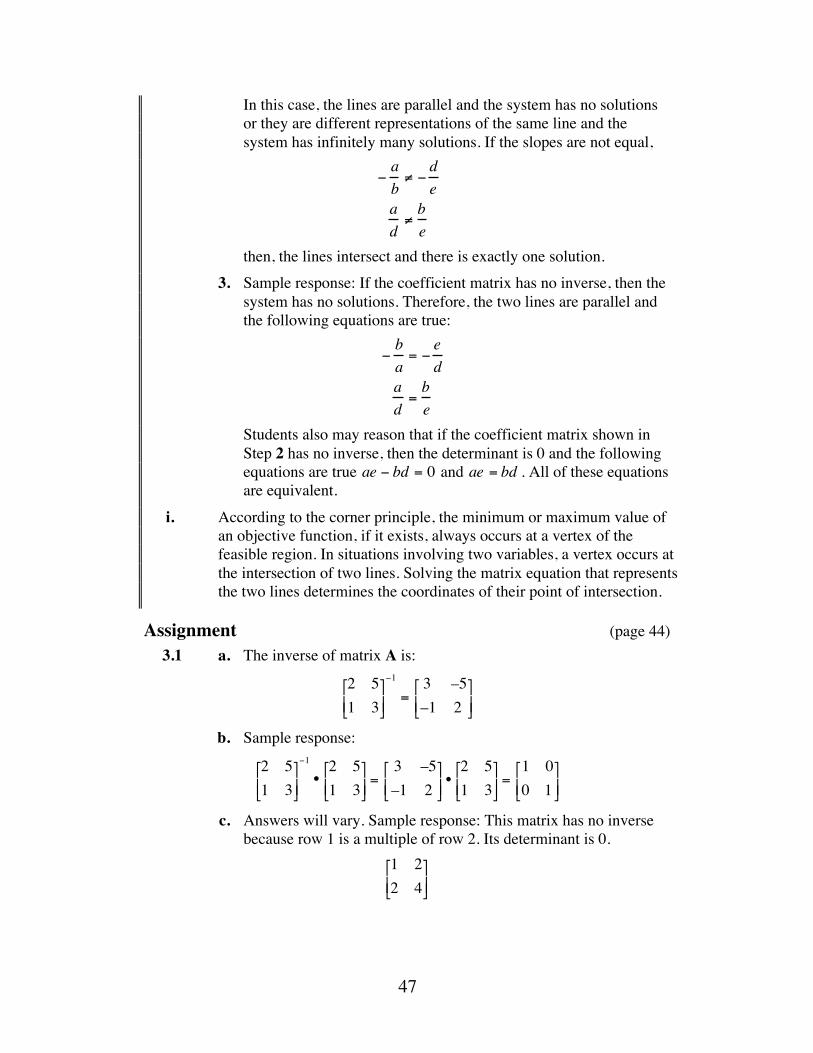
Assignment (page 44) 3.1 a. The inverse of matrix A is:
2 51 3⎡
⎣ ⎢ ⎤
⎦ ⎥
−1
=3 –5–1 2⎡
⎣ ⎢ ⎤
⎦ ⎥
b. Sample response:
2 51 3⎡
⎣ ⎢ ⎤
⎦ ⎥
−1
•2 51 3⎡
⎣ ⎢ ⎤
⎦ ⎥ =
3 –5–1 2⎡
⎣ ⎢ ⎤
⎦ ⎥ •2 51 3⎡
⎣ ⎢ ⎤
⎦ ⎥ =1 00 1⎡
⎣ ⎢ ⎤
⎦ ⎥
c. Answers will vary. Sample response: This matrix has no inverse because row 1 is a multiple of row 2. Its determinant is 0.
1 22 4⎡
⎣ ⎢ ⎤
⎦ ⎥

48
3.2 a. ps⎡
⎣ ⎢ ⎤
⎦ ⎥ =2.50.5⎡
⎣ ⎢ ⎤
⎦ ⎥
b. There is no solution since the graphs of the equations represented by the matrix equation are parallel lines.
c. There are infinite solutions of the form f + 2r = 5 since the graphs of the lines represented by the matrix equation coincide.
*3.3 a. In the following system, p represents the number of servings of pasta and v represents the number of servings of vegetables:
p ≥ 0v ≥ 025p + 6v ≤ 15450 p +150v ≥ 300
⎧
⎨ ⎪
⎩ ⎪
b. See graph in Part f. c. The equations are 450 p + 150v = 300 and 25p + 6v =15 . d. The matrix equation is:
450 15025 6
⎡
⎣ ⎢ ⎤
⎦ ⎥ •pv⎡
⎣ ⎢ ⎤
⎦ ⎥ =30015⎡
⎣ ⎢ ⎤
⎦ ⎥
e. The solution is: pv⎡
⎣ ⎢ ⎤
⎦ ⎥ ≈0.40.7⎡
⎣ ⎢ ⎤
⎦ ⎥
This point lies in the feasible region since the coordinates satisfy all the inequalities (constraints) from Part a.
f. The corner point that minimizes cholesterol can be found using the objective function cholesterol = 35p + v . The minimum occurs at (0.4,0.7), resulting in 14.7% of the Daily Value. A graph of the feasible region, including the approximate coordinates of the vertices, is shown below:
49
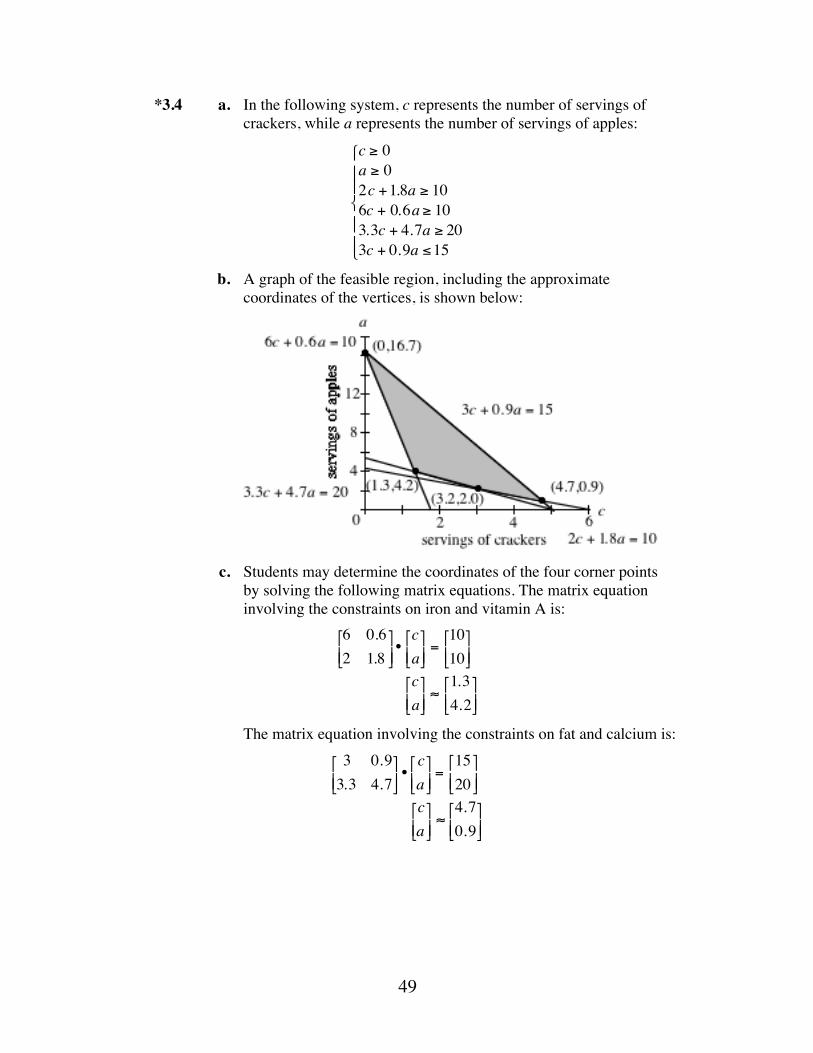
*3.4 a. In the following system, c represents the number of servings of crackers, while a represents the number of servings of apples:
c ≥ 0a ≥ 02c +1.8a ≥ 106c + 0.6a ≥ 103.3c + 4.7a ≥ 203c + 0.9a ≤15
⎧
⎨
⎪ ⎪
⎩
⎪ ⎪
b. A graph of the feasible region, including the approximate coordinates of the vertices, is shown below:
c. Students may determine the coordinates of the four corner points
by solving the following matrix equations. The matrix equation involving the constraints on iron and vitamin A is:
6 0.62 1.8⎡
⎣ ⎢ ⎤
⎦ ⎥ •ca⎡
⎣ ⎢ ⎤
⎦ ⎥ =1010⎡
⎣ ⎢ ⎤
⎦ ⎥
ca⎡
⎣ ⎢ ⎤
⎦ ⎥ ≈1.34.2⎡
⎣ ⎢ ⎤
⎦ ⎥
The matrix equation involving the constraints on fat and calcium is: 3 0.93.3 4.7⎡
⎣ ⎢ ⎤
⎦ ⎥ •ca⎡
⎣ ⎢ ⎤
⎦ ⎥ =1520⎡
⎣ ⎢ ⎤
⎦ ⎥
ca⎡
⎣ ⎢ ⎤
⎦ ⎥ ≈4.70.9⎡
⎣ ⎢ ⎤
⎦ ⎥
50
The matrix equation involving the constraints on calcium and vitamin A is:
3.3 4.72 1.8
⎡
⎣ ⎢ ⎤
⎦ ⎥ •ca⎡
⎣ ⎢ ⎤
⎦ ⎥ =2010⎡
⎣ ⎢ ⎤
⎦ ⎥
ca⎡
⎣ ⎢ ⎤
⎦ ⎥ ≈3.22.0⎡
⎣ ⎢ ⎤
⎦ ⎥
The matrix equation involving the constraints on iron and fat is: 6 0.63 0.9⎡
⎣ ⎢ ⎤
⎦ ⎥ •ca⎡
⎣ ⎢ ⎤
⎦ ⎥ =1015⎡
⎣ ⎢ ⎤
⎦ ⎥
ca⎡
⎣ ⎢ ⎤
⎦ ⎥ ≈
016.7⎡
⎣ ⎢ ⎤
⎦ ⎥
Since this point lies on the a-axis, students also may determine its coordinates by substitution.
d. The objective function is calories = 120c + 56a. The minimum number of calories (about 390) occurs when eating about 1.3 servings of crackers and 4.2 servings of apples. This is about 40 g of crackers and 420 g of apples.
e. Some students will observe that 4 apples seems an unreasonable amount for a snack. They may suggest choosing a point in the feasible region which does not minimize calories or combining other foods with apples and crackers to meet the desired constraints.
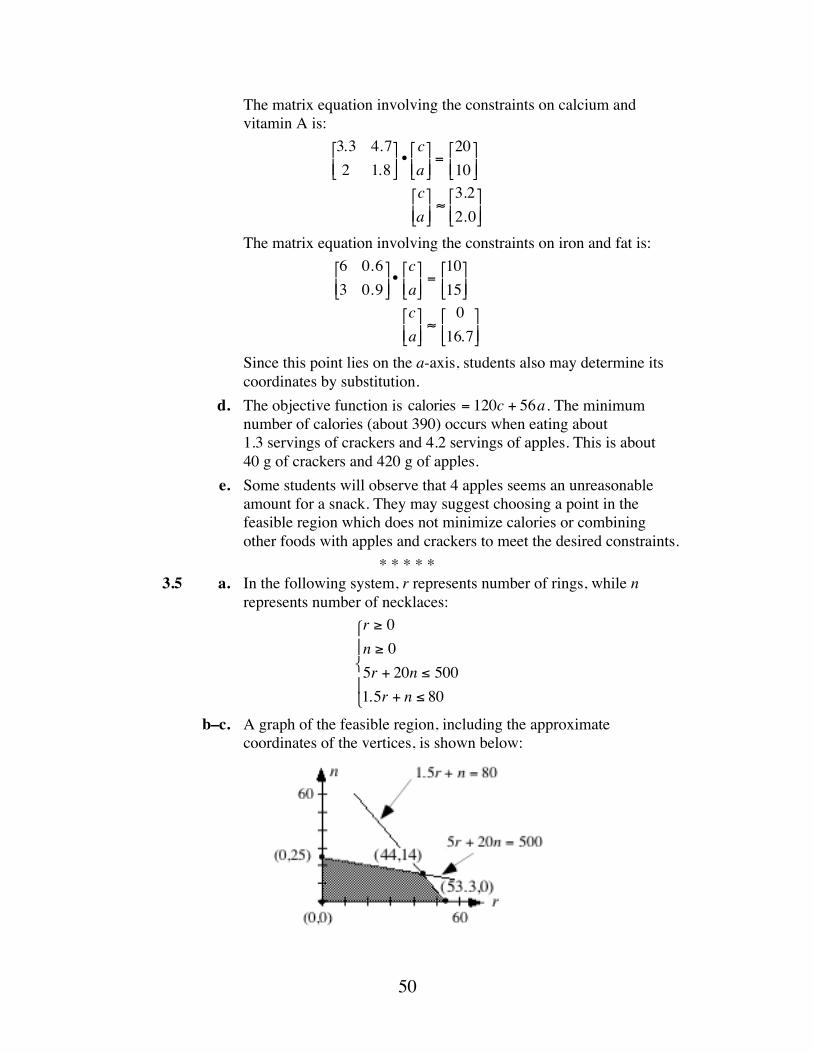
* * * * * 3.5 a. In the following system, r represents number of rings, while n
represents number of necklaces: r ≥ 0n ≥ 05r + 20n ≤ 5001.5r + n ≤ 80
⎧
⎨ ⎪
⎩ ⎪
b–c. A graph of the feasible region, including the approximate coordinates of the vertices, is shown below:
51
d. The objective function is profit = 90r + 40n. The maximum profit of about $4797 occurs at the corner point (53.3, 0) .
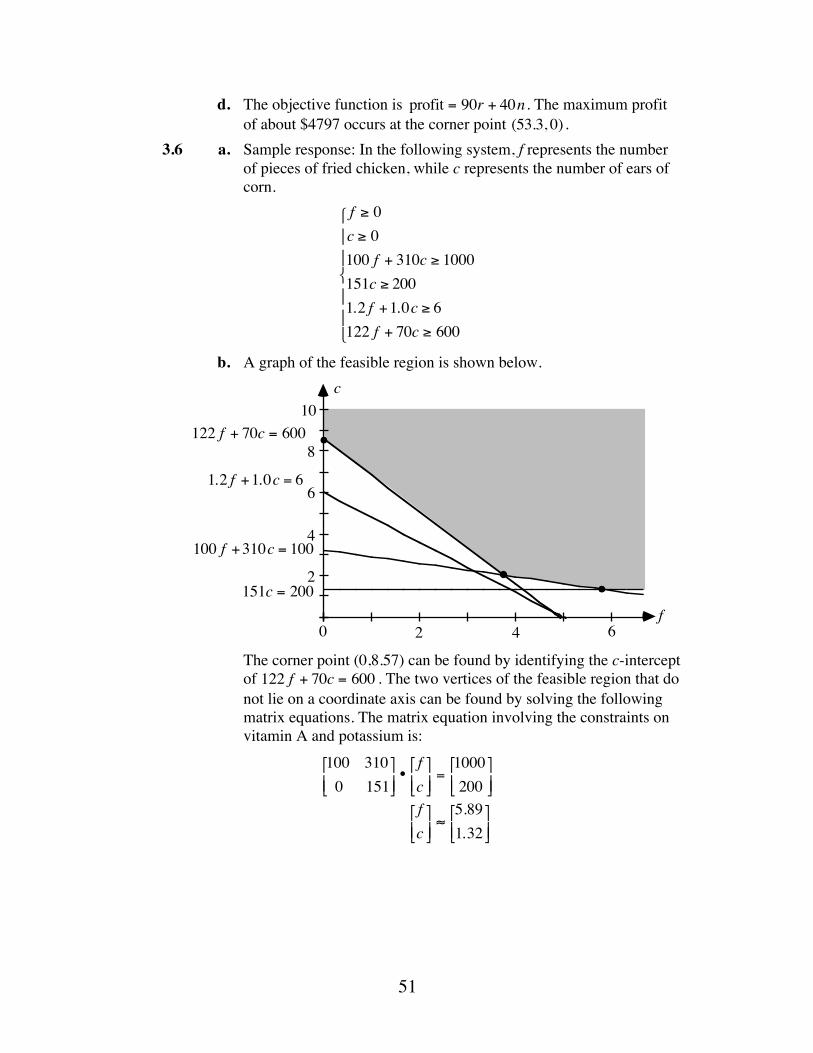
3.6 a. Sample response: In the following system, f represents the number of pieces of fried chicken, while c represents the number of ears of corn.
f ≥ 0c ≥ 0100 f + 310c ≥ 1000151c ≥ 2001.2 f +1.0c ≥ 6122 f + 70c ≥ 600
⎧
⎨
⎪ ⎪
⎩
⎪ ⎪
b. A graph of the feasible region is shown below.
The corner point (0,8.57) can be found by identifying the c-intercept of 122 f + 70c = 600 . The two vertices of the feasible region that do not lie on a coordinate axis can be found by solving the following matrix equations. The matrix equation involving the constraints on vitamin A and potassium is:
100 3100 151
⎡
⎣ ⎢ ⎤
⎦ ⎥ •fc⎡
⎣ ⎢ ⎤
⎦ ⎥ =1000200⎡
⎣ ⎢ ⎤
⎦ ⎥
fc⎡
⎣ ⎢ ⎤
⎦ ⎥ ≈5.891.32⎡
⎣ ⎢ ⎤
⎦ ⎥
c
f20 4 6
2
4
6
8
10
100 f +310c = 100
151c = 200
1.2 f +1.0c = 6
122 f + 70c = 600
52
The matrix equation involving the constraints on vitamin A and calories is:
100 310122 70⎡
⎣ ⎢ ⎤
⎦ ⎥ •fc⎡
⎣ ⎢ ⎤
⎦ ⎥ =1000600⎡
⎣ ⎢ ⎤
⎦ ⎥
fc⎡
⎣ ⎢ ⎤
⎦ ⎥ ≈3.762.01⎡
⎣ ⎢ ⎤
⎦ ⎥
c. The objective function is cost = 0.90 f + 0.75c . The minimum cost of about $4.89 occurs at the corner point (3.76,2.01). Since it is not possible to buy these quantities of chicken and corn, students may round to (4,2), which results in a total cost of $5.10.
* * * * * * * * * * (page 46)
Activity 4 In this activity, linear programming problems are extended to three variables. Students investigate the use of both substitution and matrices in solving systems of three-variable equations.
Teacher Note Because of the difficulties involved in identifying the corner points of a three-dimensional feasible region, students are given the intersecting planes in Exploration 2. You may wish to use this as an optional activity.
Materials List • index cards (15 per group)
Technology • matrix manipulator • graphing utility with three-dimensional capability • symbolic manipulator
Exploration 1 (page 47) a. Answers will vary. Sample responses:
0, 0, 5( ), 1,1,4.55( ), 1009,5,0
⎛ ⎝ ⎜
⎞ ⎠ ⎟ ≈ 11.1,5, 0( ) .
b. Students may or may not realize that the graph of all the solutions is a plane.
53
c. Answers will vary. Sample responses: (0,0,9.09), (1,2,6.82), (10,5,1.36).
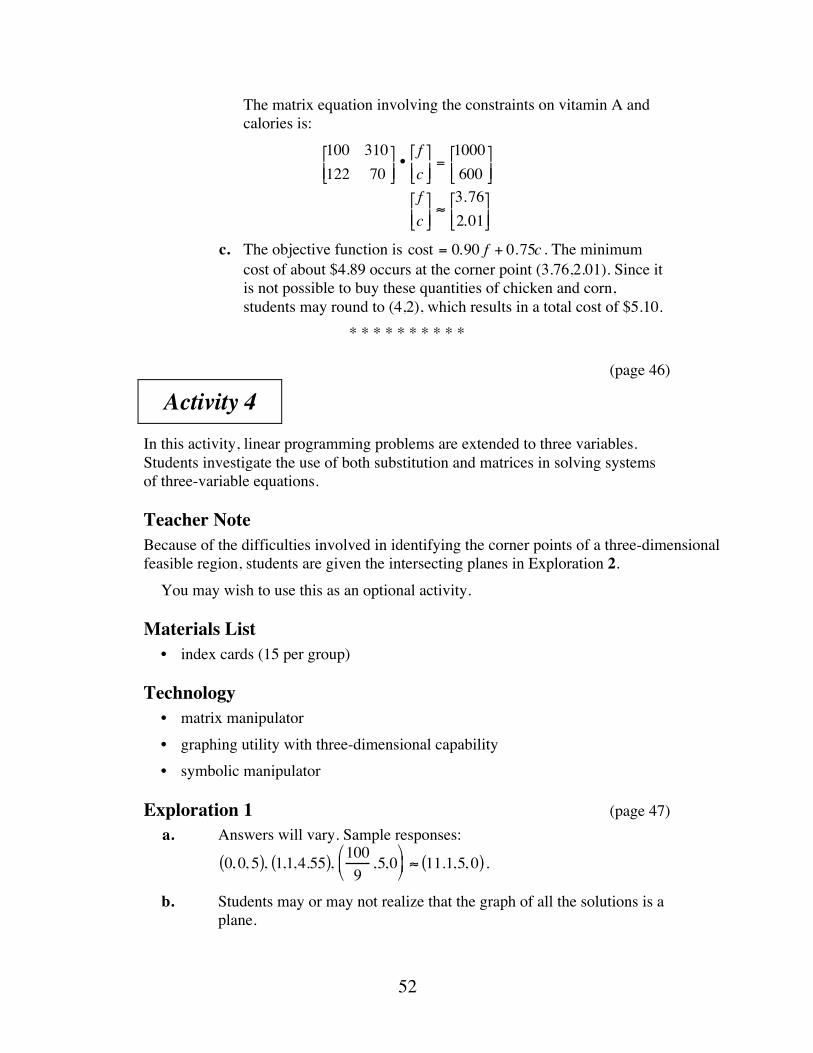
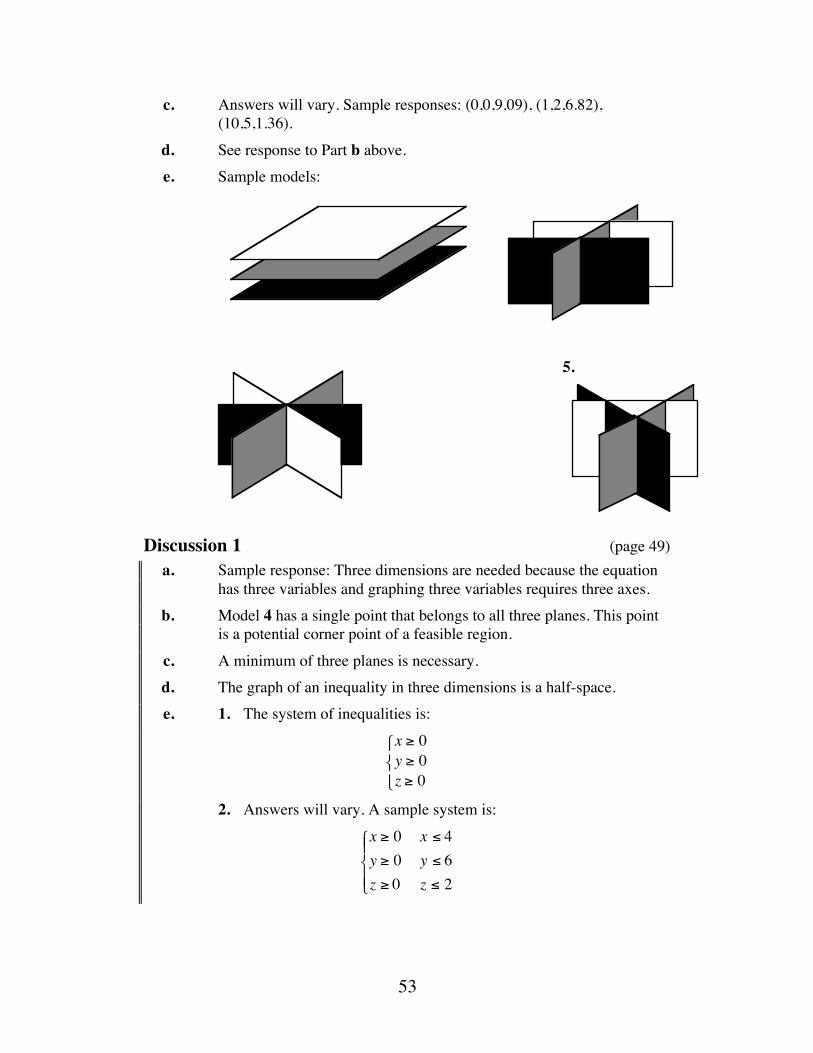
d. See response to Part b above. e. Sample models:
Discussion 1 (page 49) a. Sample response: Three dimensions are needed because the equation
has three variables and graphing three variables requires three axes. b. Model 4 has a single point that belongs to all three planes. This point
is a potential corner point of a feasible region. c. A minimum of three planes is necessary. d. The graph of an inequality in three dimensions is a half-space. e. 1. The system of inequalities is:
x ≥ 0y ≥ 0z ≥ 0
⎧ ⎨ ⎩
2. Answers will vary. A sample system is: x ≥ 0y ≥ 0z ≥ 0
⎧
⎨ ⎪
⎩ ⎪
x ≤ 4y ≤ 6z ≤ 2
5.
54
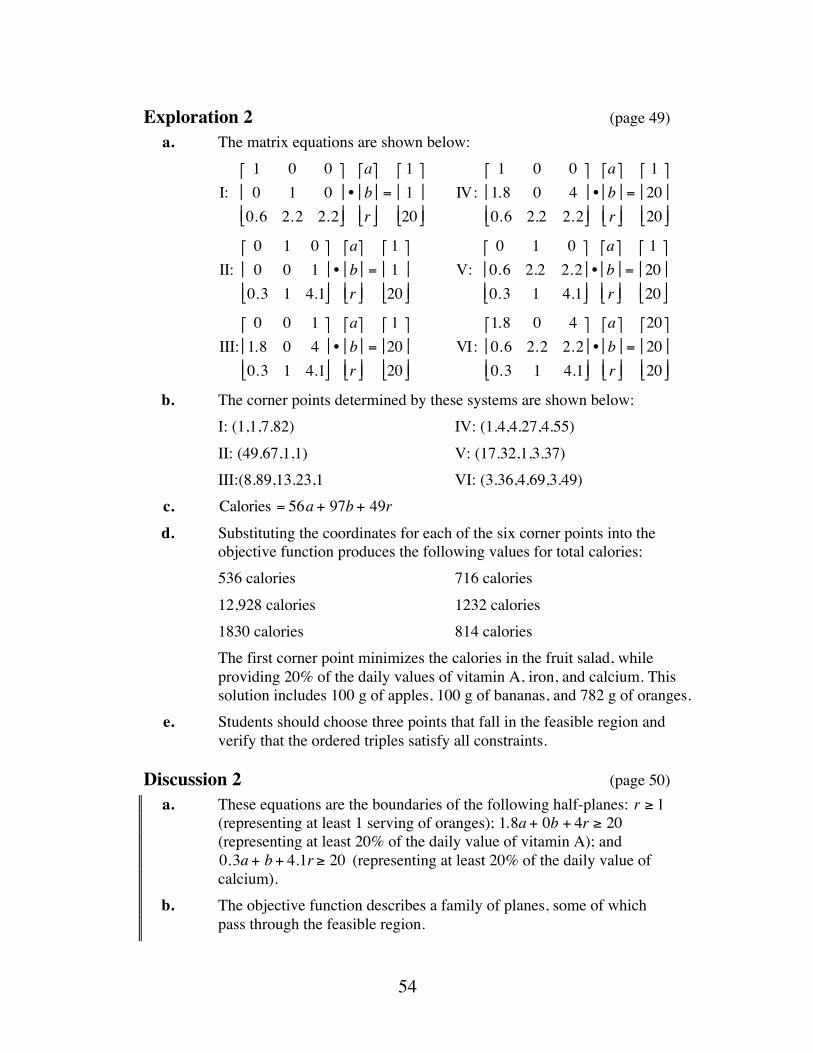
Exploration 2 (page 49) a. The matrix equations are shown below:
I: 1 0 00 1 0
0.6 2.2 2.2
⎡
⎣
⎢ ⎢
⎤
⎦
⎥ ⎥
•abr
⎡
⎣
⎢ ⎢
⎤
⎦
⎥ ⎥
=
11
20
⎡
⎣
⎢ ⎢
⎤
⎦
⎥ ⎥
IV: 1 0 0
1.8 0 40.6 2.2 2.2
⎡
⎣
⎢ ⎢
⎤
⎦
⎥ ⎥
•abr
⎡
⎣
⎢ ⎢
⎤
⎦
⎥ ⎥
=
12020
⎡
⎣
⎢ ⎢
⎤
⎦
⎥ ⎥
II: 0 1 00 0 1
0.3 1 4.1
⎡
⎣
⎢ ⎢
⎤
⎦
⎥ ⎥
•abr
⎡
⎣
⎢ ⎢
⎤
⎦
⎥ ⎥
=
11
20
⎡
⎣
⎢ ⎢
⎤
⎦
⎥ ⎥
V: 0 1 0
0.6 2.2 2.20.3 1 4.1
⎡
⎣
⎢ ⎢
⎤
⎦
⎥ ⎥
•abr
⎡
⎣
⎢ ⎢
⎤
⎦
⎥ ⎥
=
12020
⎡
⎣
⎢ ⎢
⎤
⎦
⎥ ⎥
III:0 0 11.8 0 40.3 1 4.1
⎡
⎣
⎢ ⎢
⎤
⎦
⎥ ⎥ •abr
⎡
⎣
⎢ ⎢
⎤
⎦
⎥ ⎥
=
12020
⎡
⎣
⎢ ⎢
⎤
⎦
⎥ ⎥
VI: 1.8 0 40.6 2.2 2.20.3 1 4.1
⎡
⎣
⎢ ⎢
⎤
⎦
⎥ ⎥
•abr
⎡
⎣
⎢ ⎢
⎤
⎦
⎥ ⎥
=
202020
⎡
⎣
⎢ ⎢
⎤
⎦
⎥ ⎥
b. The corner points determined by these systems are shown below: I: (1,1,7.82) IV: (1.4,4.27,4.55) II: (49.67,1,1) V: (17.32,1,3.37) III:(8.89,13.23,1 VI: (3.36,4.69,3.49) c. Calories = 56a + 97b + 49r d. Substituting the coordinates for each of the six corner points into the
objective function produces the following values for total calories: 536 calories 716 calories 12,928 calories 1232 calories 1830 calories 814 calories The first corner point minimizes the calories in the fruit salad, while
providing 20% of the daily values of vitamin A, iron, and calcium. This solution includes 100 g of apples, 100 g of bananas, and 782 g of oranges.
e. Students should choose three points that fall in the feasible region and verify that the ordered triples satisfy all constraints.
Discussion 2 (page 50) a. These equations are the boundaries of the following half-planes: r ≥ 1
(representing at least 1 serving of oranges); 1.8a + 0b + 4r ≥ 20 (representing at least 20% of the daily value of vitamin A); and 0.3a + b + 4.1r ≥ 20 (representing at least 20% of the daily value of calcium).
b. The objective function describes a family of planes, some of which pass through the feasible region.
55
c. Sample response: As the plane is translated through the feasible region the last point(s) that it touches is either a vertex, an edge, or an entire face of the feasible region.
Assignment (page 50) *4.1 a. This statement is true. If the system contains two equations
representing nonparallel lines, the lines intersect in a single point. b. This statement is true. If the system contains three equations and the
planes representing them intersect in a single point, then the solution is an ordered triple.
c. This statement is false. The lines that represent such a system have no points in common.
d. This statement is true. The planes that represent such a system have no points in common.
e. This statement is true. To be consistent, the system must have values in common to all three equations or planes. A point in common to only two of the planes is not a solution to the system.
f. This statement is false. The three planes will intersect each other, but all might not intersect in the same place. (See model 5 in Part e of Exploration 1)
4.2 a. The graph of the system consists of three planes parallel to the xy-plane.
b. The matrix equation is: 0 0 10 0 10 0 1
⎡
⎣
⎢ ⎢
⎤
⎦
⎥ ⎥
•
xyz
⎡
⎣
⎢ ⎢
⎤
⎦
⎥ ⎥
=
123
⎡
⎣
⎢ ⎢
⎤
⎦
⎥ ⎥
c. Sample response: This system can’t be solved because there is no inverse for the coefficient matrix. Note: When using technology, students may receive an error message indicating that this is a “singular matrix.”
4.3 a. The three planes intersect in the line with equation y + 2z = 3 . Note: This equation can found by choosing any two equations and eliminating x.
b. There are no solutions. Two of the planes are parallel and each intersects the third.
c. There are no solutions. All three planes are parallel. d. The planes intersect at the point with coordinates (1,2, −3).
56
*4.4 a. Sample response: 0b + 26.6p + 0.4r ≥ 10 (vitamin A )2.2b + 2.8p + 8.6r ≥ 10 (iron)1b + 0.9 p + 8.6r ≥ 10 (calcium )1.6b + 2.4p + 3.2r ≥10 (fiber)
⎧
⎨ ⎪
⎩ ⎪
b. There are four possible combinations of three inequalities:
1) vitamin A, iron, calcium; 2) vitamin A, iron, fiber; 3) vitamin A, calcium, fiber; and 4) iron, calcium, fiber.
By solving the corresponding systems of equations, students should find the following four corner points: (–4.95,0.35,1.70), (6.65,0.38,–0.49), (4.45,0.37,0.60), and (86.3,–48.3,–3.82).
c. Sample response: All but one of these corners has a negative value for one of the snacks. It is impossible to eat a negative amount of fruit.
* * * * * 4.5 The six corner points determined in the exploration are: (1,1,7.82),
(1.4,4.27,4.55), (49.67,1,1), (17.32,1,3.37), (8.89,13.23,1), and (3.36,4.69,3.49). Using the information in Table 2, the objective function is fiber = 1.6b + 2. 4p +3.2r .
By substituting the coordinates of each corner point in the objective function, students should determine that the point (8.89,13.23,1) maximizes the amount of fiber in the fruit salad. This solution corresponds to 889 g of apples, 1323 g of bananas, and 100 g of oranges.
* * * * * * * * * *
57
Answers to Summary Assessment (page 52) Responses will vary. Students should use nutrient information from two food labels to write at least six inequalities representing the nutrient and calorie constraints given in the problem. They should graph the inequalities to find the feasible region, determine the corner points, and write an objective function for fat contained in the two foods. Using the corner principle, they should then determine the point that minimizes fat. When the resulting solution involves unusual quantities of food or a meal consisting of only one food, students should discuss the practicality of their responses.
58
Module Assessment
1. Audley likes to mix two different cereals for breakfast. His favorite
cereal is High Sugar, which contains 20% sugar. The other cereal, Bowl of Health, contains only 5% sugar. Audley wants to reduce his sugar intake, but refuses to give up his favorite cereal. He would like to eat 25 g of a cereal mixture that contains 10% sugar.
a. Write a system of equations that describes this situation. b. Solve this system to determine the amount of each type of cereal
Audley must mix to obtain 25 g of cereal that contains 10% sugar. c. Show a verification of your solution. 2. An electronics firm makes two kinds of computers—laptops and
desktops. The firm has enough parts to make as many as 1000 laptops and 600 desktops per week. It takes 20 hr to build a laptop computer and 30 hr to build a desktop computer. The firm has a maximum of 24,000 hours of labor available each week. A profit of $2000 is made on each laptop and $2500 on each desktop.
a. Write a system of inequalities that describes all the constraints in this situation.
b. Graph the system and label the coordinates of the vertices of the feasible region.
c. Determine the maximum amount of profit that may be earned by this electronics firm. Justify your response.
3. One peach provides 28% of the Daily Value of vitamin A and 48% of the Daily Value of vitamin C for a 2000-calorie reference diet. For the same diet, one avocado provides 16% of the vitamin A and 27% of the vitamin C recommended.
Ignoring the 2000-calorie limit, is it possible to obtain no more than 20% of the Daily Value of vitamin A but at least 80% of the Daily Value of vitamin C by eating only peaches and avocados? Use a graph to justify your response.
59
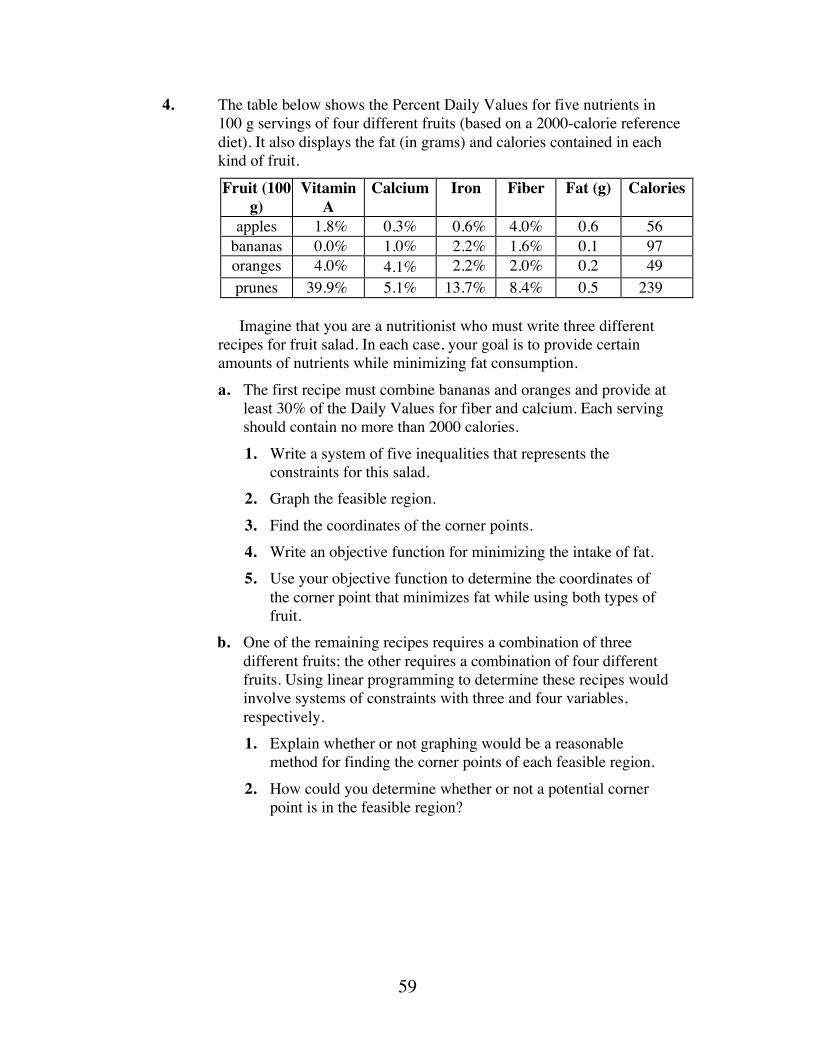
4. The table below shows the Percent Daily Values for five nutrients in 100 g servings of four different fruits (based on a 2000-calorie reference diet). It also displays the fat (in grams) and calories contained in each kind of fruit.
Fruit (100 g)
Vitamin A
Calcium Iron Fiber Fat (g) Calories
apples 1.8% 0.3% 0.6% 4.0% 0.6 56 bananas 0.0% 1.0% 2.2% 1.6% 0.1 97 oranges 4.0% 4.1% 2.2% 2.0% 0.2 49 prunes 39.9% 5.1% 13.7% 8.4% 0.5 239
Imagine that you are a nutritionist who must write three different
recipes for fruit salad. In each case, your goal is to provide certain amounts of nutrients while minimizing fat consumption.
a. The first recipe must combine bananas and oranges and provide at least 30% of the Daily Values for fiber and calcium. Each serving should contain no more than 2000 calories.
1. Write a system of five inequalities that represents the constraints for this salad.
2. Graph the feasible region. 3. Find the coordinates of the corner points. 4. Write an objective function for minimizing the intake of fat. 5. Use your objective function to determine the coordinates of
the corner point that minimizes fat while using both types of fruit.
b. One of the remaining recipes requires a combination of three different fruits; the other requires a combination of four different fruits. Using linear programming to determine these recipes would involve systems of constraints with three and four variables, respectively.
1. Explain whether or not graphing would be a reasonable method for finding the corner points of each feasible region.
2. How could you determine whether or not a potential corner point is in the feasible region?
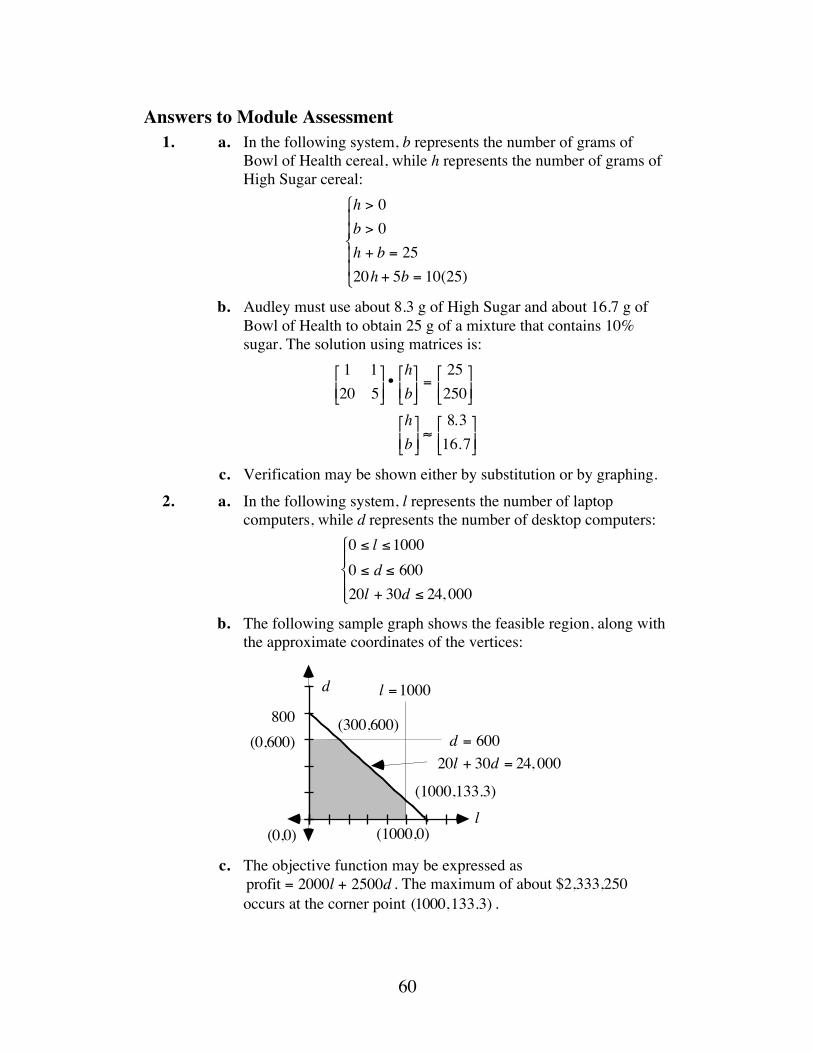
60
Answers to Module Assessment 1. a. In the following system, b represents the number of grams of
Bowl of Health cereal, while h represents the number of grams of High Sugar cereal:
h > 0b > 0h + b = 2520h + 5b = 10(25)
⎧
⎨
⎪ ⎪
⎩
⎪ ⎪
b. Audley must use about 8.3 g of High Sugar and about 16.7 g of Bowl of Health to obtain 25 g of a mixture that contains 10% sugar. The solution using matrices is:
1 120 5⎡
⎣ ⎢ ⎤
⎦ ⎥ •hb⎡
⎣ ⎢ ⎤
⎦ ⎥ =
25250⎡
⎣ ⎢ ⎤
⎦ ⎥
hb⎡
⎣ ⎢ ⎤
⎦ ⎥ ≈
8.316.7⎡
⎣ ⎢ ⎤
⎦ ⎥
c. Verification may be shown either by substitution or by graphing. 2. a. In the following system, l represents the number of laptop
computers, while d represents the number of desktop computers: 0 ≤ l ≤10000 ≤ d ≤ 60020l + 30d ≤ 24, 000
⎧
⎨ ⎪
⎩ ⎪ ⎪
b. The following sample graph shows the feasible region, along with the approximate coordinates of the vertices:
c. The objective function may be expressed as
profit = 2000l + 2500d . The maximum of about $2,333,250 occurs at the corner point (1000,133.3) .
d
l
800 (300,600)
(0,0) (1000,0)
(1000,133.3)
(0,600)
l =1000
d = 60020l + 30d = 24, 000
61
3. Using p for the number of peaches and a for the number of avocados, the system of inequalities for this problem is:
p ≥ 0a ≥ 028p +16a ≤ 2048 p + 27a ≥ 80
⎧
⎨
⎪ ⎪
⎩
⎪ ⎪
The graphs of the two lines intersect at approximately (61.7, –106.7) . Since the half-planes defined by the inequalities do not intersect in the first quadrant, it is not possible to satisfy the constraints by eating peaches and avocados.
4. a. 1. Sample response: Using b for servings of bananas and r for servings of oranges, the system of inequalities is:
b ≥ 0p ≥ 01.6b + 2r ≥ 301b + 4.1r ≥ 3097b + 49r ≤ 2000
⎧
⎨ ⎪
⎩ ⎪
2–3. Student graphs should show that the corners of the feasible region are (0,40.8), (0,15), (13.8,3.9), and (19.3,2.6). They may use both substitution and matrices to find these coordinates. For example, some students may use substitution to find corner points (0,15) and (0,40.8) and matrices to find (19.3,2.6).
4. f = 0.1b + 0.2r
5. The corner point at (13.8,3.9) minimizes the intake of fat (2.16 g). b. 1. Sample response: A three-dimensional graph of the feasible
region might be possible for the three-fruit recipe, but a graph is not possible for the four-fruit recipe because there are four variables and that would require four dimensions.
2. Sample response: A corner point would have to satisfy all of the constraints in order to be included in the feasible region.
62
Selected References Browne, M. B. Label Facts for Healthful Eating. Dayton, OH: Mazor Corp.,
1993. Ensminger, A. H., M. E. Ensminger, J. E. Konlande, and J. R. K. Robson. Foods
and Nutrition Encyclopedia. Clovis, CA: Pegus Press, 1983. Liebman, B. “What’s in a Label?” Nutrition Action 3 (April 1994): 5. Merill, A., and B. K. Watt. Energy Values of Foods—Basis and Derivation.
Human Nutrition Research Branch, Agricultural Research Service, Department of Agriculture. Agriculture Handbook No. 74. Washington, DC: U.S. Department of Agriculture, 1973.
Remer, R. J. “Enterprise Cost for Irrigated Crops Including Corn.” Lake County, MT: Moise Irrigation Unit, Flathead Irrigation Project, January 1993.
U. S. Center for Food Safety and Applied Nutrition, Office of Food Labeling. Food Labeling Questions and Answers. Washington, DC: U.S. Government Printing Office, 1993.
U.S. Department of Agriculture, Human Nutrition Information Service. The Food Guide Pyramid. Washington, DC: U.S. Department of Agriculture, 1992.
U.S. Food and Drug Administration. FDA Consumer: Focus on Food Labeling. Rockville, MD: Public Health Service, Department of Health and Human Services, 1993.
Wilson, E. D., K. H. Fisher, and P. A. Garcia. Principles of Nutrition. New York: John Wiley and Sons, 1979.
63
Flashbacks
Activity 1 1.1 If a class of 24 students contains 18 females, what percentage of the
class is male? 1.2 Recall that the solution set to a system of equations is the set of values
that satisfies every equation in the system. Write and graph a system of equations that has:
a. exactly one solution b. no solutions c. an infinite number of solutions. 1.3 Solve each of the following systems of inequalities by graphing and
identifying the feasible region.
a.
x ≥ 0y ≥ 0y ≤ −x + 3y ≤ −3x + 4
⎧
⎨ ⎪
⎩ ⎪
b.
x ≥ 0y ≥ 0y ≤ −(5 4)x + 5y ≤ −(3 4)x + 3
⎧
⎨ ⎪
⎩ ⎪
c.
x ≥ 0y ≥ 0y ≤ −(3 5)x + 3x ≤ 2
⎧
⎨
⎪ ⎪
⎩
⎪ ⎪
Activity 2 2.1 Solve each of the following equations for x: a. 3 + 4x = 7 b. 7 − 5(2x +1) + 5x = 6.5
c. 3(x − 3y) =12
d. −5(x + y) + 7y = 6.5
2.2 Simplify each of the following matrix expressions:
a.
1 23 4⎡
⎣ ⎢ ⎤
⎦ ⎥ •ab⎡
⎣ ⎢ ⎤
⎦ ⎥
b.
−2 1−4 2⎡
⎣ ⎢ ⎤
⎦ ⎥ •st⎡
⎣ ⎢ ⎤
⎦ ⎥
2.3 Solve the system of equations below by graphing. Verify your solution by solving using substitution.
x + 2y = 83x + 4y =18⎧ ⎨ ⎩
64
Activity 3 3.1 What is the multiplicative identity for the set of 3 × 3 matrices? 3.2 Find the multiplicative inverse for each of the following. Justify your
responses. a. –5 b. 4 3
5
c. 0 3.3 a. If A and B are 2 × 2 matrices, does A • B = B •A ? In other
words, is matrix multiplication commutative? b. If A, B, and C are 2 × 2 matrices, does (A • B)•C = A • (B •C)?
In other words, is matrix multiplication associative?
Activity 4 4.1 By graphing, estimate the coordinates of the corner points of each
region described below. Then use matrices to determine the coordinates of the corner points.
a.
x ≥ 0y ≥ 03x + y ≤ 222x + 3y ≤ 32
⎧
⎨ ⎪
⎩ ⎪
b.
x + 3y ≥162x + y ≥ 8−x + y ≤ 53x + y ≤ 32
⎧
⎨ ⎪
⎩ ⎪
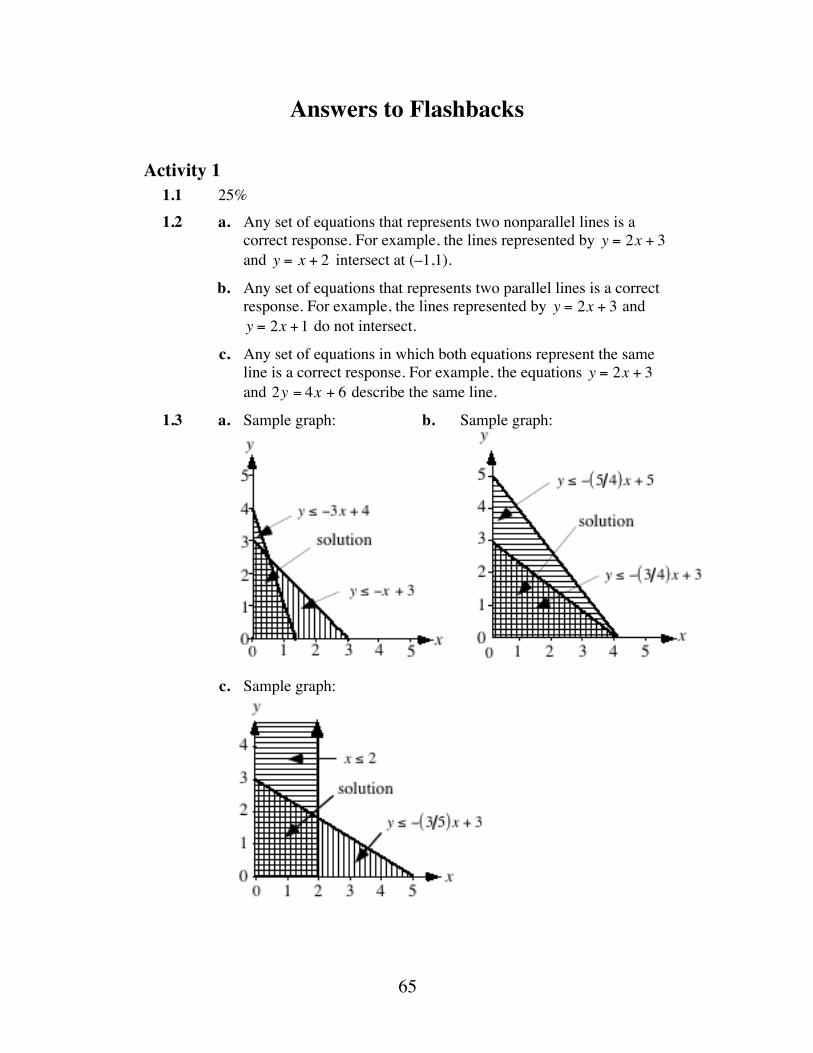
65
Answers to Flashbacks
Activity 1 1.1 25% 1.2 a. Any set of equations that represents two nonparallel lines is a
correct response. For example, the lines represented by y = 2x + 3 and y = x + 2 intersect at (–1,1).
b. Any set of equations that represents two parallel lines is a correct response. For example, the lines represented by y = 2x + 3 and y = 2x +1 do not intersect.
c. Any set of equations in which both equations represent the same line is a correct response. For example, the equations y = 2x + 3 and 2y = 4x + 6 describe the same line.
1.3 a. Sample graph: b. Sample graph: c. Sample graph:
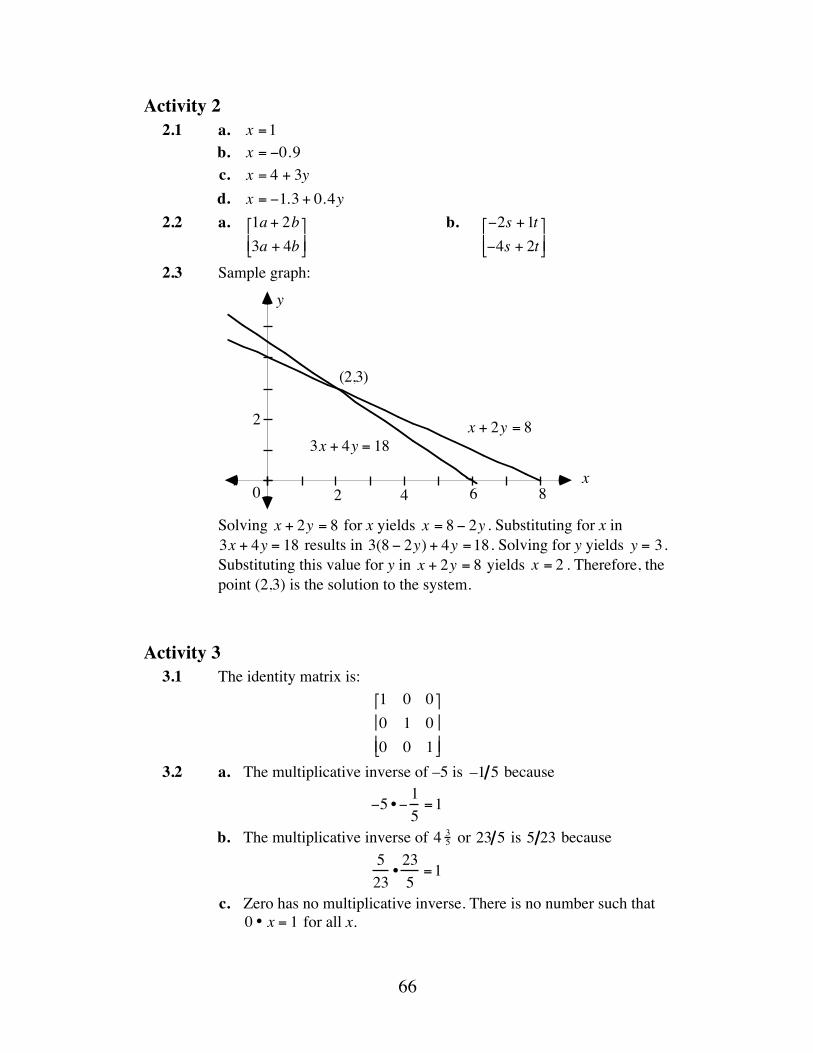
66
Activity 2 2.1 a. x =1 b. x = −0.9 c. x = 4 + 3y d. x = −1.3 + 0.4y 2.2 a. 1a + 2b
3a + 4b⎡
⎣ ⎢ ⎤
⎦ ⎥
b. −2s +1t−4s + 2t⎡
⎣ ⎢ ⎤
⎦ ⎥
2.3 Sample graph:
Solving x + 2y = 8 for x yields x = 8 − 2y . Substituting for x in
3x + 4y = 18 results in 3(8 − 2y) + 4y =18. Solving for y yields y = 3. Substituting this value for y in x + 2y = 8 yields x = 2 . Therefore, the point (2,3) is the solution to the system.
Activity 3 3.1 The identity matrix is:
1 0 00 1 00 0 1
⎡
⎣
⎢ ⎢
⎤
⎦
⎥ ⎥
3.2 a. The multiplicative inverse of –5 is –1 5 because
−5 •−15=1
b. The multiplicative inverse of 4 35 or 23 5 is 5 23 because
523• 235=1
c. Zero has no multiplicative inverse. There is no number such that 0 • x = 1 for all x.
8 x
y
2 4 60
2 x + 2y = 83x + 4y = 18
(2,3)
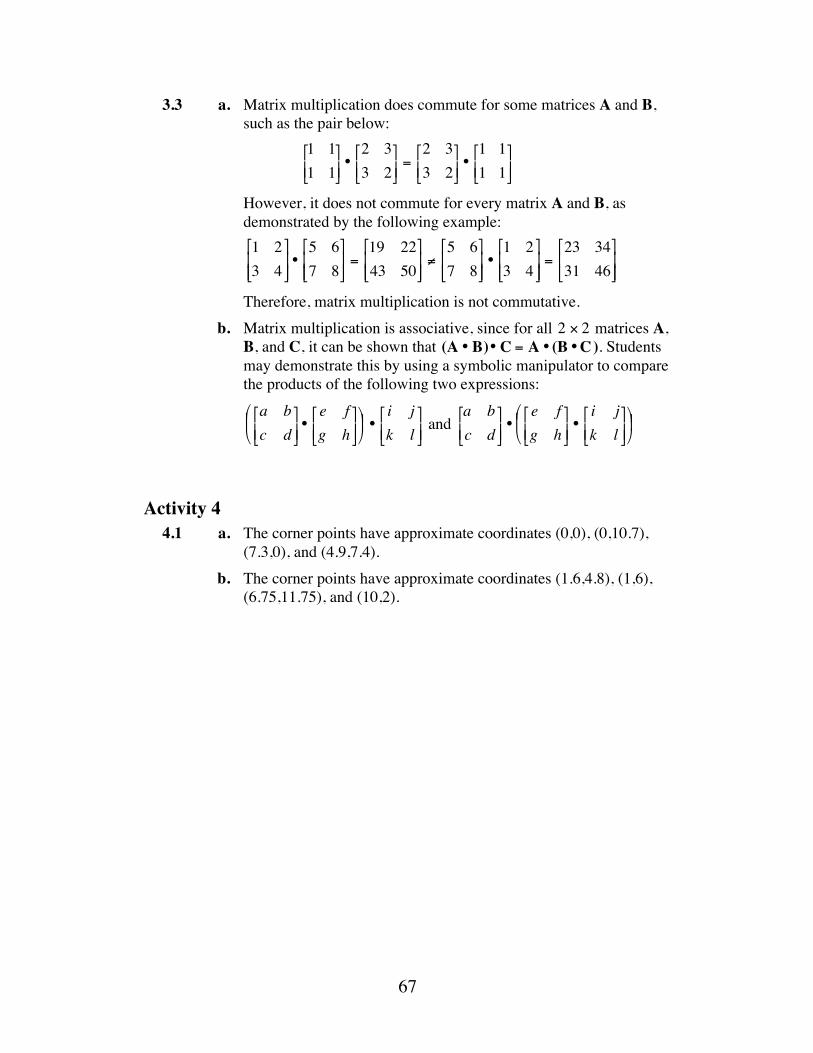
67
3.3 a. Matrix multiplication does commute for some matrices A and B, such as the pair below:
1 11 1⎡
⎣ ⎢ ⎤
⎦ ⎥ •2 33 2⎡
⎣ ⎢ ⎤
⎦ ⎥ =2 33 2⎡
⎣ ⎢ ⎤
⎦ ⎥ •1 11 1⎡
⎣ ⎢ ⎤
⎦ ⎥
However, it does not commute for every matrix A and B, as demonstrated by the following example:
1 23 4⎡
⎣ ⎢ ⎢
⎤
⎦ ⎥ ⎥
•5 67 8⎡
⎣ ⎢ ⎢
⎤
⎦ ⎥ ⎥
=19 2243 50⎡
⎣ ⎢ ⎢
⎤
⎦ ⎥ ⎥ ≠5 67 8⎡
⎣ ⎢ ⎢
⎤
⎦ ⎥ ⎥
•1 23 4⎡
⎣ ⎢ ⎢
⎤
⎦ ⎥ ⎥
=23 3431 46⎡
⎣ ⎢ ⎢
⎤
⎦ ⎥ ⎥
Therefore, matrix multiplication is not commutative. b. Matrix multiplication is associative, since for all 2 × 2 matrices A,
B, and C, it can be shown that (A • B)•C = A • (B •C). Students may demonstrate this by using a symbolic manipulator to compare the products of the following two expressions:
a bc d⎡
⎣ ⎢ ⎤
⎦ ⎥ •e fg h⎡
⎣ ⎢ ⎤
⎦ ⎥ ⎛
⎝ ⎜ ⎞
⎠ ⎟ •
i jk l⎡
⎣ ⎢ ⎤
⎦ ⎥ and
a bc d⎡
⎣ ⎢ ⎤
⎦ ⎥ •
e fg h⎡
⎣ ⎢ ⎤
⎦ ⎥ •i jk l⎡
⎣ ⎢ ⎤
⎦ ⎥ ⎛
⎝ ⎜ ⎞
⎠ ⎟
Activity 4 4.1 a. The corner points have approximate coordinates (0,0), (0,10.7),
(7.3,0), and (4.9,7.4). b. The corner points have approximate coordinates (1.6,4.8), (1,6),
(6.75,11.75), and (10,2).

What’s Your Bearing?
In this module, you’ll explore how surveyors locate property lines, find the lengths of boundaries, and calculate the area of land parcels.
Todd Fife • Anne Merrifield
71
Teacher Edition What’s Your Bearing?
Overview Students extend the trigonometric concepts developed in Level 2 by investigating their applications in orienteering and surveying. Students use bearings, the law of sines, and the law of cosines to complete land surveys.
Objectives In this module, students will: • apply the right-triangle trigonometric ratios: sine, cosine, and tangent • use bearings to complete survey maps • use triangulation to determine the lengths of sides and the areas of polygons • develop and use the law of sines • develop and use the law of cosines.
Prerequisites For this module, students should know: • how to identify obtuse, right, and acute angles • the sum of the measures of the interior angles of a triangle • how to find the area of a triangle • right-triangle trigonometric ratios and their inverses • the properties of supplementary angles • how to manipulate and solve proportions algebraically.
Time Line Activity Intro. 1 2 3 Summary
Assessment Total
Days 1 3 3 3 1 11
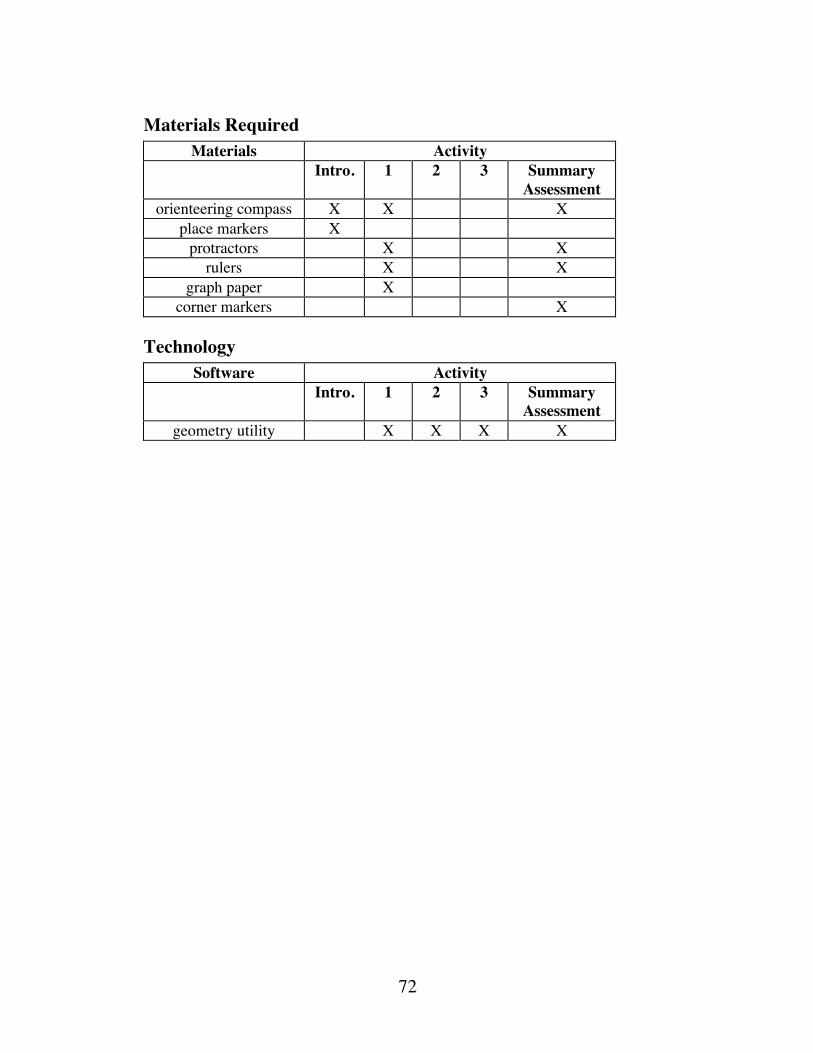
72
Materials Required Materials Activity
Intro. 1 2 3 Summary Assessment
orienteering compass X X X place markers X
protractors X X rulers X X
graph paper X corner markers X
Technology Software Activity
Intro. 1 2 3 Summary Assessment
geometry utility X X X X
73
What’s Your Bearing?
Introduction (page 59) In the introductory exploration, students familiarize themselves with the basics of an orienteering compass and with angle measures greater than 90˚.
Materials List • orienteering compass (one per pair of students) • place marker (one per pair of students)
Teacher Note The physical education or earth science teacher at your school may have a set of orienteering compasses. If you must purchase them, relatively inexpensive models can be found at most camping or sporting goods stores. The local Boy Scouts of America or the National Guard also may have sets of compasses to loan. Place markers should be at least as large as a quarter, but small enough so that they cannot be seen from a great distance away. This encourages students to rely on the compass for returning to the marker.
Exploration (page 59) The exploration works best outside. In case of inclement weather, you may wish to make plans to use the school’s gym or cafeteria. a. Each student should practice the instructions outlined in Part a before
proceeding to Part b. Note: If you are unable to obtain orienteering compasses, use the
following set of modified instructions: 1. Hold the compass so that the selected azimuth faces directly away
from you. 2. Holding the compass level and steady, turn yourself until the north
end of the magnetic needle points to the letter N on the compass. You are now facing your azimuth.
3. Lift the compass close to eye level. Sight over the compass and choose a distinct landmark in the direction of your azimuth. Lower the compass and walk the number of steps specified by your teacher toward the landmark.
b. The path describes an equilateral triangle whose sides are 30 steps long.
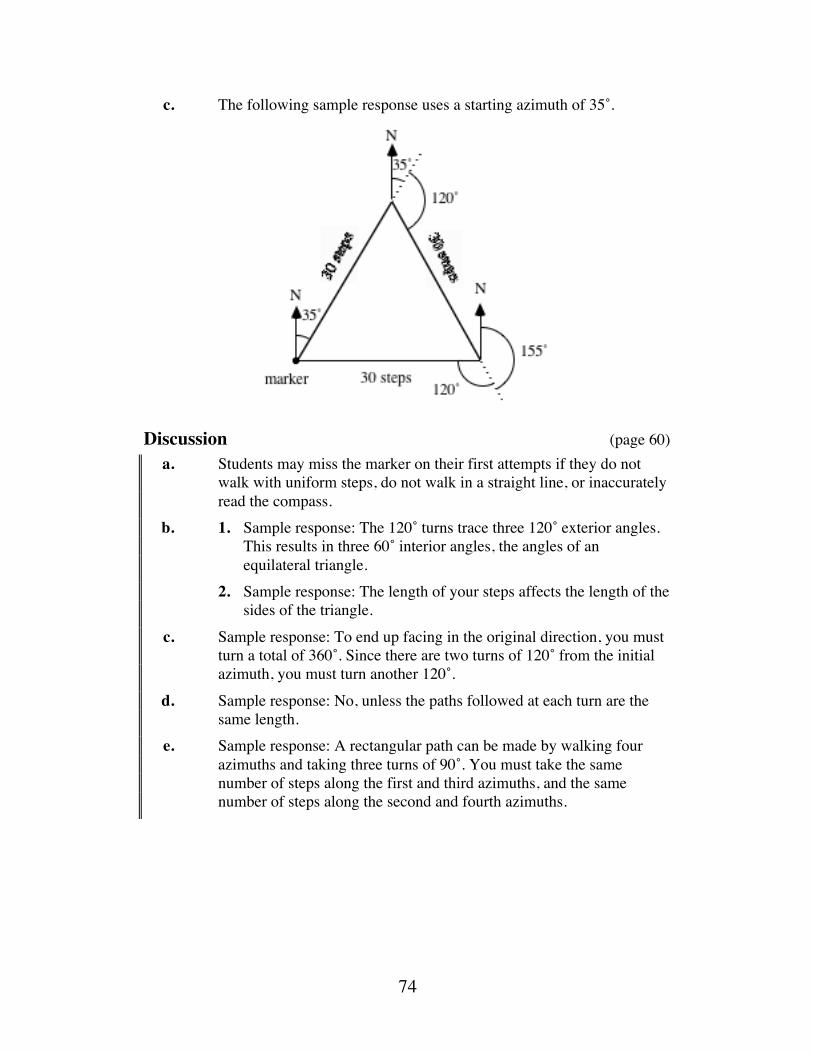
74
c. The following sample response uses a starting azimuth of 35˚.
Discussion (page 60) a. Students may miss the marker on their first attempts if they do not
walk with uniform steps, do not walk in a straight line, or inaccurately read the compass.
b. 1. Sample response: The 120˚ turns trace three 120˚ exterior angles. This results in three 60˚ interior angles, the angles of an equilateral triangle.
2. Sample response: The length of your steps affects the length of the sides of the triangle.
c. Sample response: To end up facing in the original direction, you must turn a total of 360˚. Since there are two turns of 120˚ from the initial azimuth, you must turn another 120˚.
d. Sample response: No, unless the paths followed at each turn are the same length.
e. Sample response: A rectangular path can be made by walking four azimuths and taking three turns of 90˚. You must take the same number of steps along the first and third azimuths, and the same number of steps along the second and fourth azimuths.
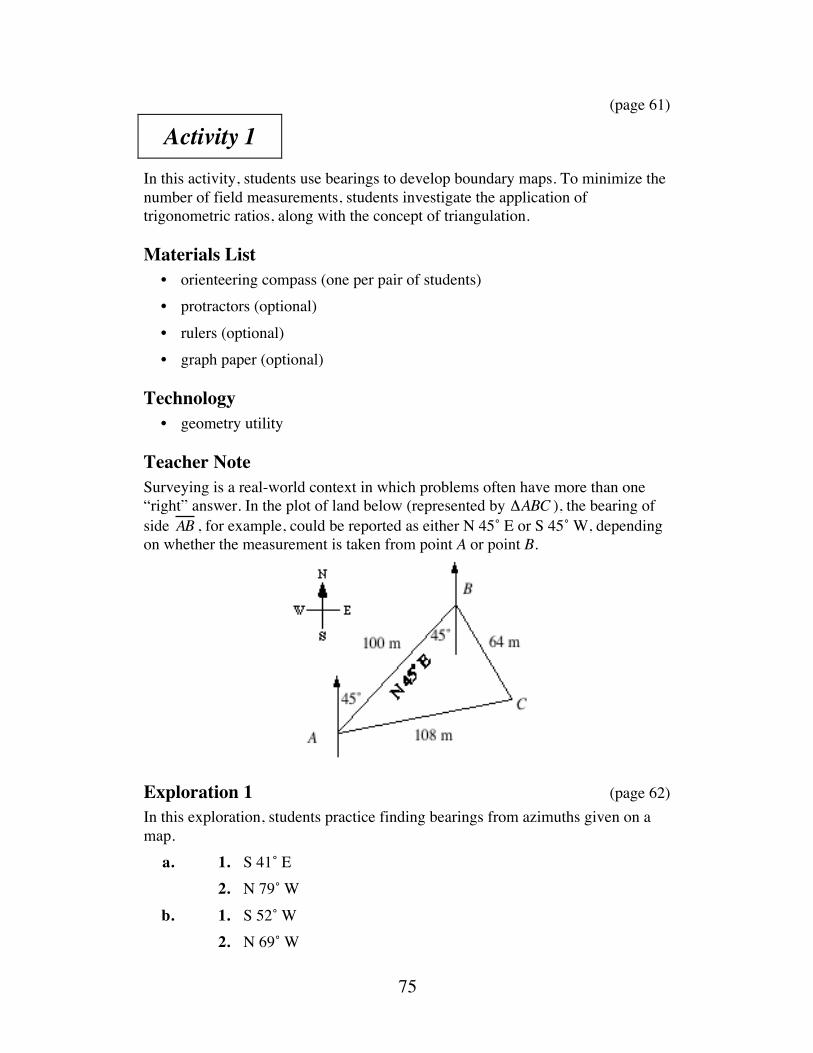
75
(page 61)
Activity 1 In this activity, students use bearings to develop boundary maps. To minimize the number of field measurements, students investigate the application of trigonometric ratios, along with the concept of triangulation.
Materials List • orienteering compass (one per pair of students) • protractors (optional) • rulers (optional) • graph paper (optional)
Technology • geometry utility
Teacher Note Surveying is a real-world context in which problems often have more than one “right” answer. In the plot of land below (represented by ΔABC ), the bearing of side AB , for example, could be reported as either N 45˚ E or S 45˚ W, depending on whether the measurement is taken from point A or point B.
Exploration 1 (page 62) In this exploration, students practice finding bearings from azimuths given on a map. a. 1. S 41˚ E 2. N 79˚ W b. 1. S 52˚ W 2. N 69˚ W
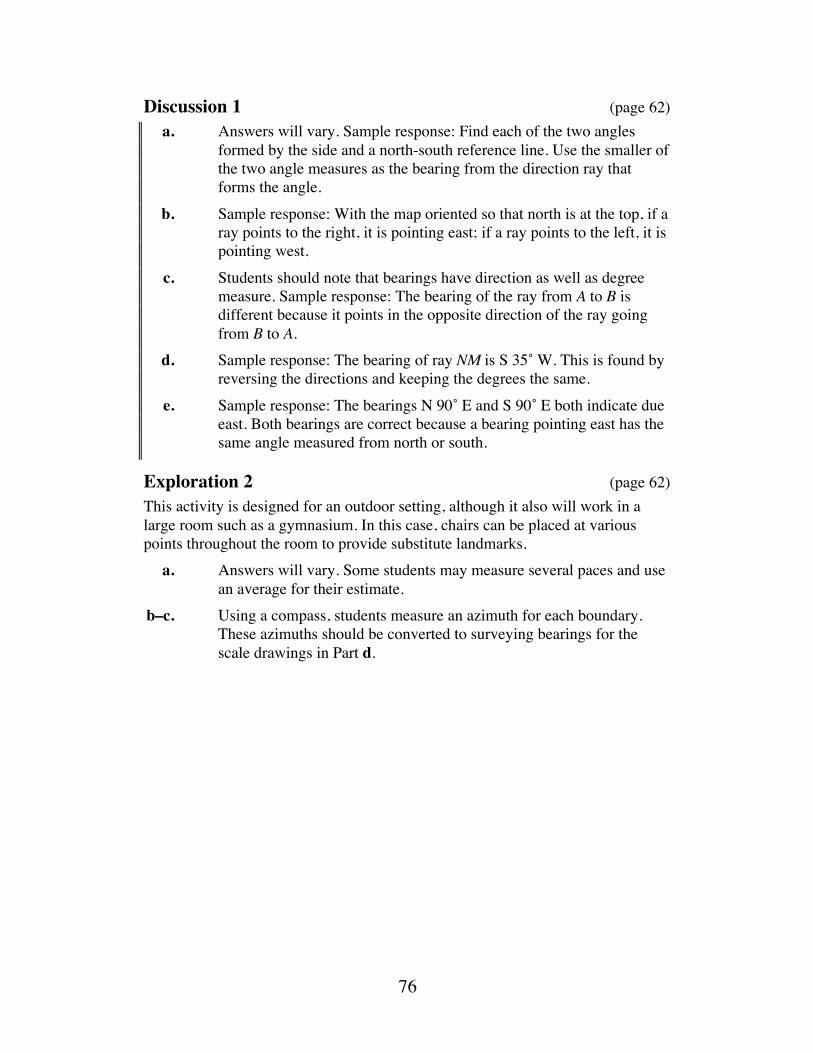
76
Discussion 1 (page 62) a. Answers will vary. Sample response: Find each of the two angles
formed by the side and a north-south reference line. Use the smaller of the two angle measures as the bearing from the direction ray that forms the angle.
b. Sample response: With the map oriented so that north is at the top, if a ray points to the right, it is pointing east; if a ray points to the left, it is pointing west.
c. Students should note that bearings have direction as well as degree measure. Sample response: The bearing of the ray from A to B is different because it points in the opposite direction of the ray going from B to A.
d. Sample response: The bearing of ray NM is S 35˚ W. This is found by reversing the directions and keeping the degrees the same.
e. Sample response: The bearings N 90˚ E and S 90˚ E both indicate due east. Both bearings are correct because a bearing pointing east has the same angle measured from north or south.
Exploration 2 (page 62) This activity is designed for an outdoor setting, although it also will work in a large room such as a gymnasium. In this case, chairs can be placed at various points throughout the room to provide substitute landmarks. a. Answers will vary. Some students may measure several paces and use
an average for their estimate. b–c. Using a compass, students measure an azimuth for each boundary.
These azimuths should be converted to surveying bearings for the scale drawings in Part d.
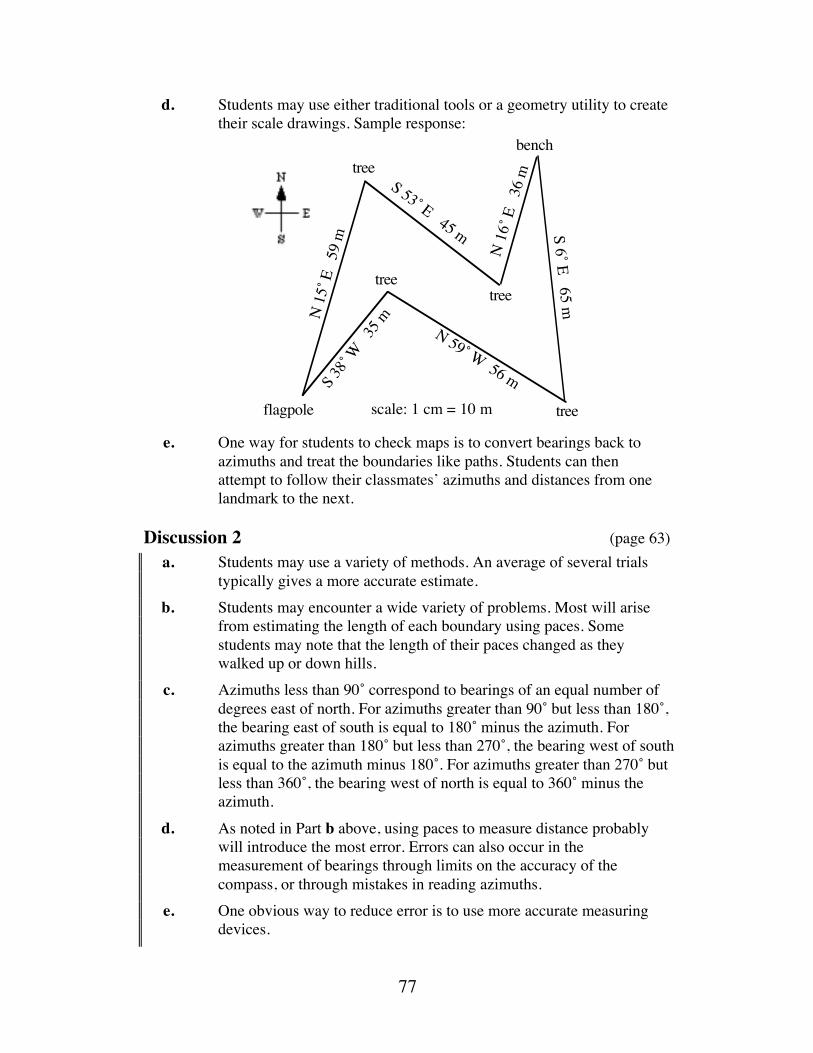
77
d. Students may use either traditional tools or a geometry utility to create their scale drawings. Sample response:
e. One way for students to check maps is to convert bearings back to
azimuths and treat the boundaries like paths. Students can then attempt to follow their classmates’ azimuths and distances from one landmark to the next.
Discussion 2 (page 63) a. Students may use a variety of methods. An average of several trials
typically gives a more accurate estimate. b. Students may encounter a wide variety of problems. Most will arise
from estimating the length of each boundary using paces. Some students may note that the length of their paces changed as they walked up or down hills.
c. Azimuths less than 90˚ correspond to bearings of an equal number of degrees east of north. For azimuths greater than 90˚ but less than 180˚, the bearing east of south is equal to 180˚ minus the azimuth. For azimuths greater than 180˚ but less than 270˚, the bearing west of south is equal to the azimuth minus 180˚. For azimuths greater than 270˚ but less than 360˚, the bearing west of north is equal to 360˚ minus the azimuth.
d. As noted in Part b above, using paces to measure distance probably will introduce the most error. Errors can also occur in the measurement of bearings through limits on the accuracy of the compass, or through mistakes in reading azimuths.
e. One obvious way to reduce error is to use more accurate measuring devices.
flagpole
tree
tree
tree
bench
tree
N 1
5˚ E
59
m
S 53˚ E 45 m
N 1
6˚ E
36
m
S 6˚ E 65 m
N 59˚ W 56 m S 38˚
W 3
5 m
scale: 1 cm = 10 m
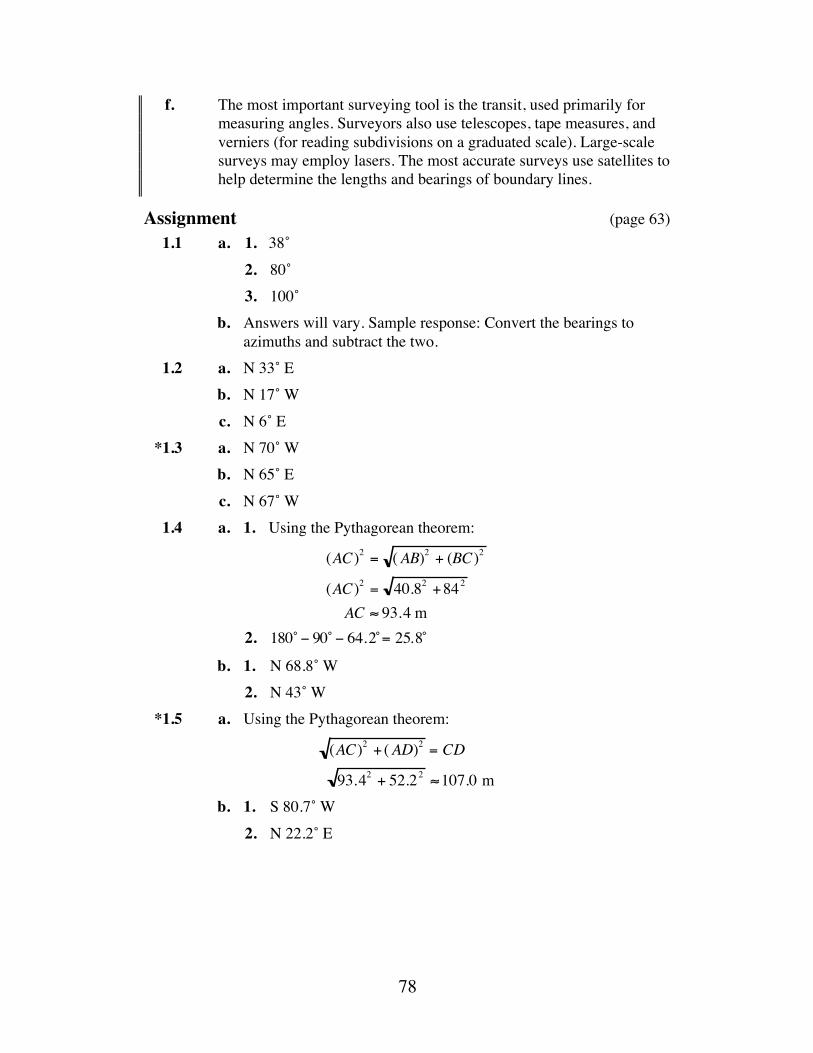
78
f. The most important surveying tool is the transit, used primarily for measuring angles. Surveyors also use telescopes, tape measures, and verniers (for reading subdivisions on a graduated scale). Large-scale surveys may employ lasers. The most accurate surveys use satellites to help determine the lengths and bearings of boundary lines.
Assignment (page 63) 1.1 a. 1. 38˚ 2. 80˚ 3. 100˚ b. Answers will vary. Sample response: Convert the bearings to
azimuths and subtract the two. 1.2 a. N 33˚ E b. N 17˚ W c. N 6˚ E *1.3 a. N 70˚ W b. N 65˚ E c. N 67˚ W 1.4 a. 1. Using the Pythagorean theorem:
(AC)2 = (AB)2 + (BC)2
(AC)2 = 40.82 +842
AC ≈ 93.4 m
2. 180˚ − 90˚ − 64.2̊ = 25.8̊
b. 1. N 68.8˚ W 2. N 43˚ W *1.5 a. Using the Pythagorean theorem:
(AC)2 + (AD)2 = CD
93.42 + 52.22 ≈107.0 m
b. 1. S 80.7˚ W 2. N 22.2˚ E
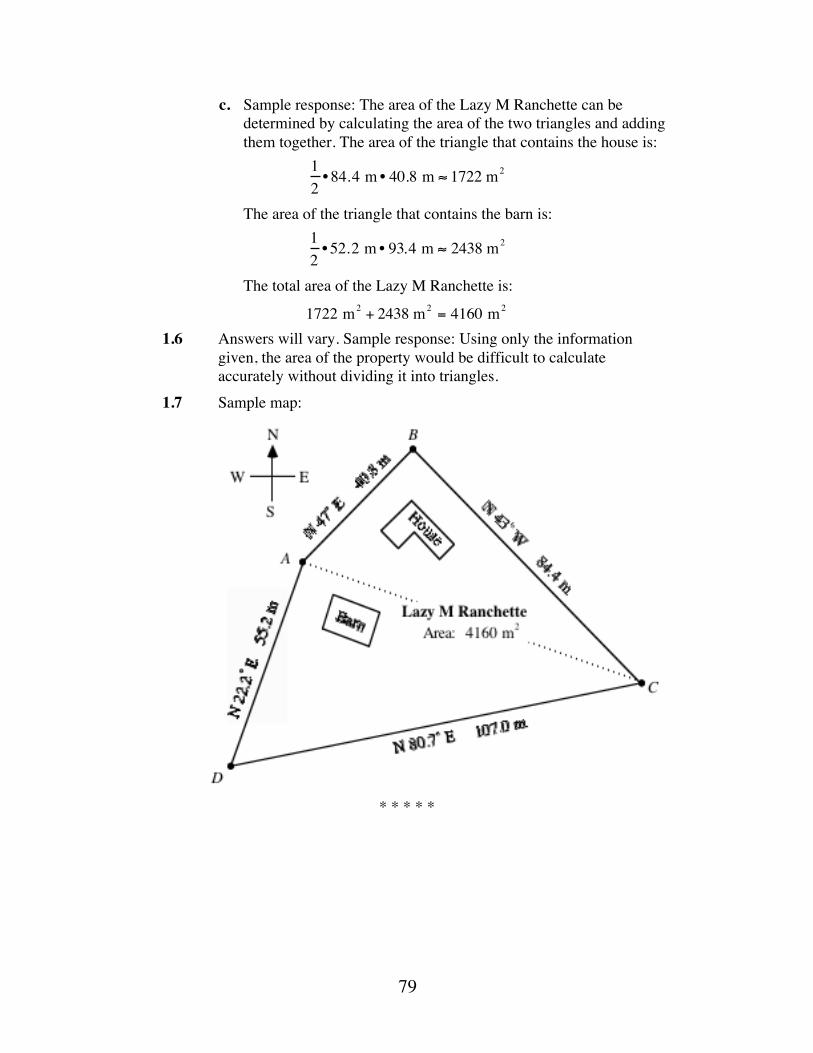
79
c. Sample response: The area of the Lazy M Ranchette can be determined by calculating the area of the two triangles and adding them together. The area of the triangle that contains the house is:
12
• 84.4 m • 40.8 m ≈ 1722 m2
The area of the triangle that contains the barn is: 12
• 52.2 m • 93.4 m ≈ 2438 m2
The total area of the Lazy M Ranchette is:
1722 m2 + 2438 m2 = 4160 m2 1.6 Answers will vary. Sample response: Using only the information
given, the area of the property would be difficult to calculate accurately without dividing it into triangles.
1.7 Sample map:
* * * * *
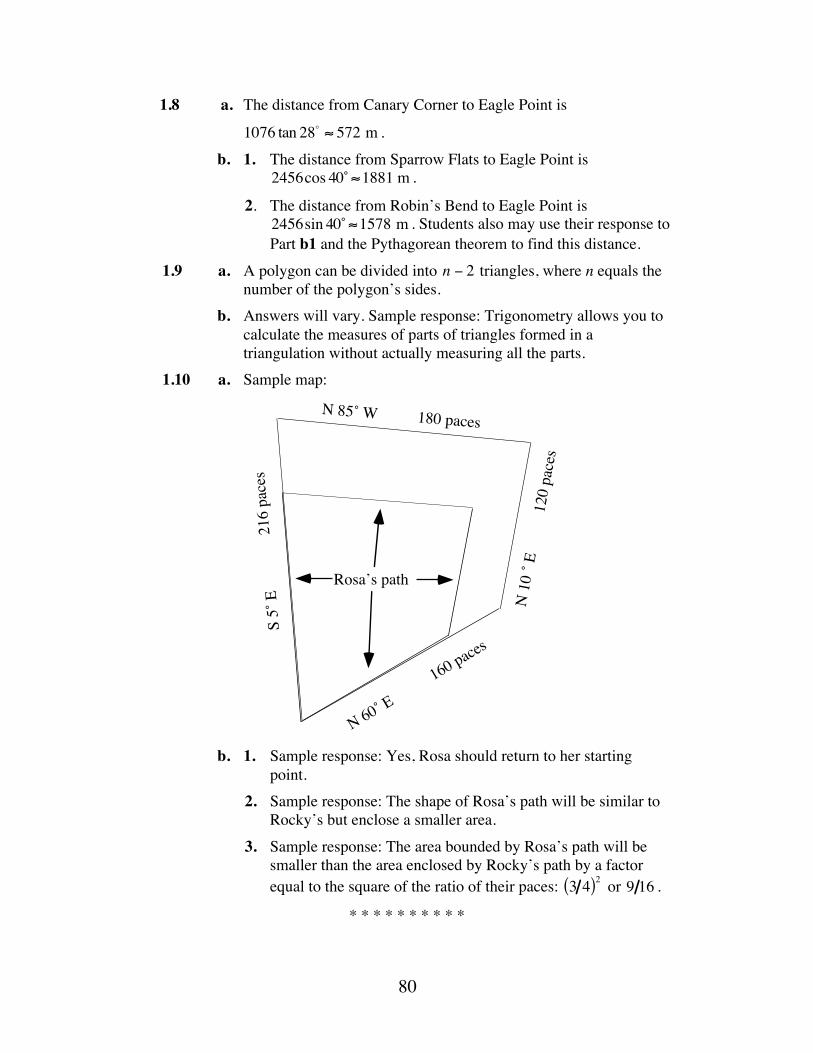
80
1.8 a. The distance from Canary Corner to Eagle Point is
1076 tan 28! ≈ 572 m . b. 1. The distance from Sparrow Flats to Eagle Point is
2456cos 40˚ ≈1881 m .
2. The distance from Robin’s Bend to Eagle Point is 2456sin 40˚ ≈1578 m . Students also may use their response to Part b1 and the Pythagorean theorem to find this distance.
1.9 a. A polygon can be divided into n − 2 triangles, where n equals the number of the polygon’s sides.
b. Answers will vary. Sample response: Trigonometry allows you to calculate the measures of parts of triangles formed in a triangulation without actually measuring all the parts.
1.10 a. Sample map:
b. 1. Sample response: Yes, Rosa should return to her starting
point. 2. Sample response: The shape of Rosa’s path will be similar to
Rocky’s but enclose a smaller area. 3. Sample response: The area bounded by Rosa’s path will be
smaller than the area enclosed by Rocky’s path by a factor equal to the square of the ratio of their paces: 3 4( )2 or 9 16 .
* * * * * * * * * *
.
Rosa’s path
N 85˚ W 180 paces
N 1
0 ˚ E
12
0 pa
ces
N 60˚ E 160 paces
S 5˚
E
216
pace
s
81
(page 68)
Activity 2 This activity focuses on the development of the law of sines. Students use a geometry utility to explore relationships between the coordinates of a point on a circle centered at the origin and the sine and cosine. They then develop and apply the law of sines.
Materials List • protractors (optional) • rulers (optional)
Technology • geometry utility
Teacher Note In the following two explorations and discussions, students discover the relationship between the values of the trigonometric ratios for obtuse angles and acute angles, derive the basis for the law of sines, and discover how to calculate the altitude of a triangle. You may wish to use Exploration 2 as a demonstration.
Exploration 1 (page 68) a. Note: Students should save their constructions for use in Activity 3. b. Students should use the geometry utility to determine sine and cosine.
Sample table:
m∠ACB r cos∠ACB sin∠ACB Coordinates of A 0.00 3.02 1.00 0.00 (3.02,0) 6.70˚ 3.02 0.99 0.12 (3,0.35)
44.12˚ 3.02 0.72 0.70 (2.17,2.1) 61.86˚ 3.02 0.47 0.88 (1.42,2.66) 80.34˚ 3.02 0.17 0.99 (0.51,2.98) 90.00˚ 3.02 0.01 1.00 (0,3.02)
c. Students should observe that the coordinates of point A are (r cosθ,rsinθ )
.
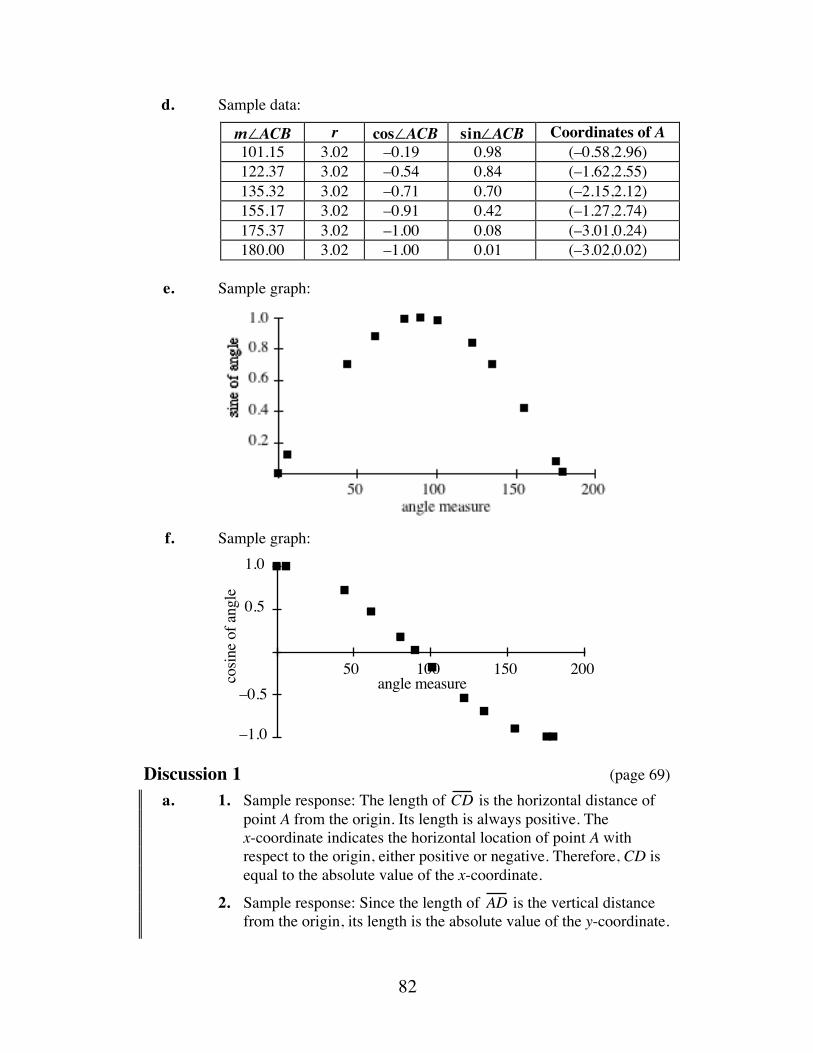
82
d. Sample data:
m∠ACB r cos∠ACB sin∠ACB Coordinates of A 101.15 3.02 –0.19 0.98 (–0.58,2.96) 122.37 3.02 –0.54 0.84 (–1.62,2.55) 135.32 3.02 –0.71 0.70 (–2.15,2.12) 155.17 3.02 –0.91 0.42 (–1.27,2.74) 175.37 3.02 –1.00 0.08 (–3.01,0.24) 180.00 3.02 –1.00 0.01 (–3.02,0.02)
e. Sample graph:
f. Sample graph:
Discussion 1 (page 69) a. 1. Sample response: The length of CD is the horizontal distance of
point A from the origin. Its length is always positive. The x-coordinate indicates the horizontal location of point A with respect to the origin, either positive or negative. Therefore, CD is equal to the absolute value of the x-coordinate.
2. Sample response: Since the length of AD is the vertical distance from the origin, its length is the absolute value of the y-coordinate.
–1.0
–0.5
0.5
1.0
50 100 150 200angle measurecosin
e of
ang
le
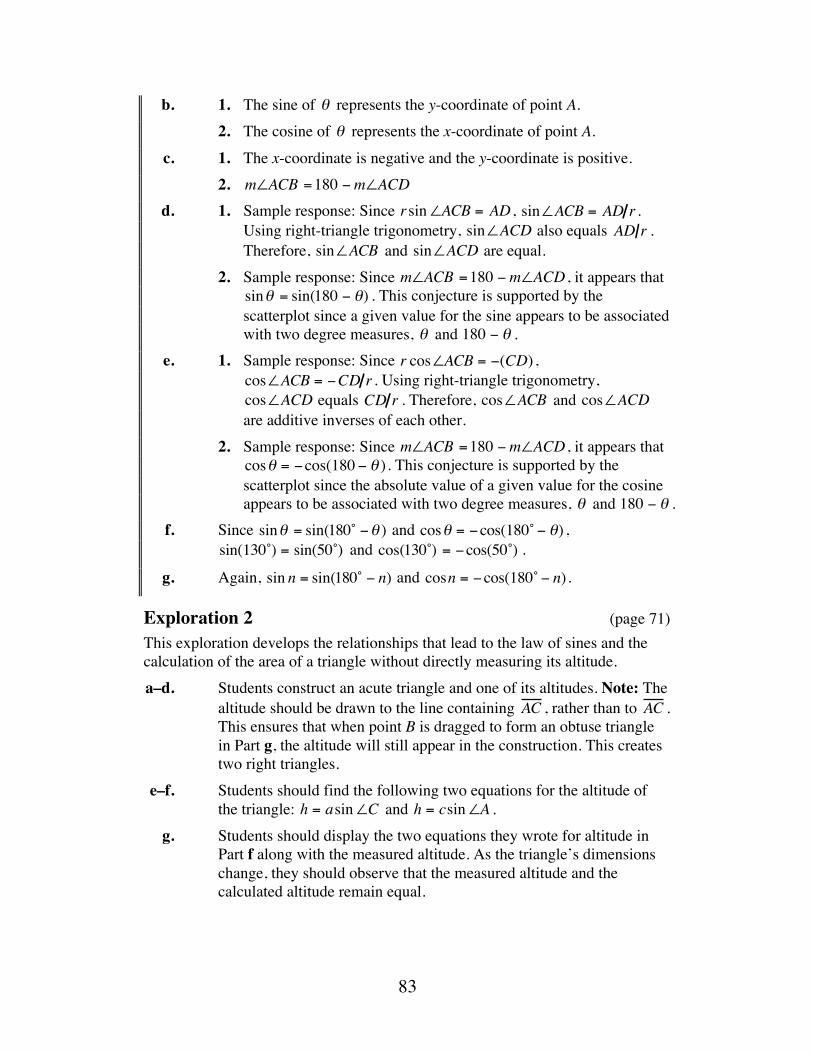
83
b. 1. The sine of θ represents the y-coordinate of point A. 2. The cosine of θ represents the x-coordinate of point A. c. 1. The x-coordinate is negative and the y-coordinate is positive. 2. m∠ACB =180 −m∠ACD d. 1. Sample response: Since rsin∠ACB = AD , sin∠ACB = AD r .
Using right-triangle trigonometry, sin∠ACD also equals AD r . Therefore, sin∠ACB and sin∠ACD are equal.
2. Sample response: Since m∠ACB =180 −m∠ACD , it appears that sinθ = sin(180 − θ) . This conjecture is supported by the scatterplot since a given value for the sine appears to be associated with two degree measures, θ and 180 − θ .
e. 1. Sample response: Since r cos∠ACB = −(CD) , cos∠ACB = −CD r . Using right-triangle trigonometry, cos∠ACD equals CD r . Therefore, cos∠ACB and cos∠ACD are additive inverses of each other.
2. Sample response: Since m∠ACB =180 −m∠ACD , it appears that cosθ = −cos(180 − θ ). This conjecture is supported by the scatterplot since the absolute value of a given value for the cosine appears to be associated with two degree measures, θ and 180 − θ .
f. Since sinθ = sin(180˚ −θ ) and cosθ = −cos(180˚ − θ) , sin(130˚) = sin(50˚) and cos(130˚) = −cos(50˚) .
g. Again, sin n = sin(180˚ − n) and cosn = −cos(180˚ − n) .
Exploration 2 (page 71) This exploration develops the relationships that lead to the law of sines and the calculation of the area of a triangle without directly measuring its altitude. a–d. Students construct an acute triangle and one of its altitudes. Note: The
altitude should be drawn to the line containing AC , rather than to AC . This ensures that when point B is dragged to form an obtuse triangle in Part g, the altitude will still appear in the construction. This creates two right triangles.
e–f. Students should find the following two equations for the altitude of the triangle: h = asin∠C and h = csin∠A .
g. Students should display the two equations they wrote for altitude in Part f along with the measured altitude. As the triangle’s dimensions change, they should observe that the measured altitude and the calculated altitude remain equal.
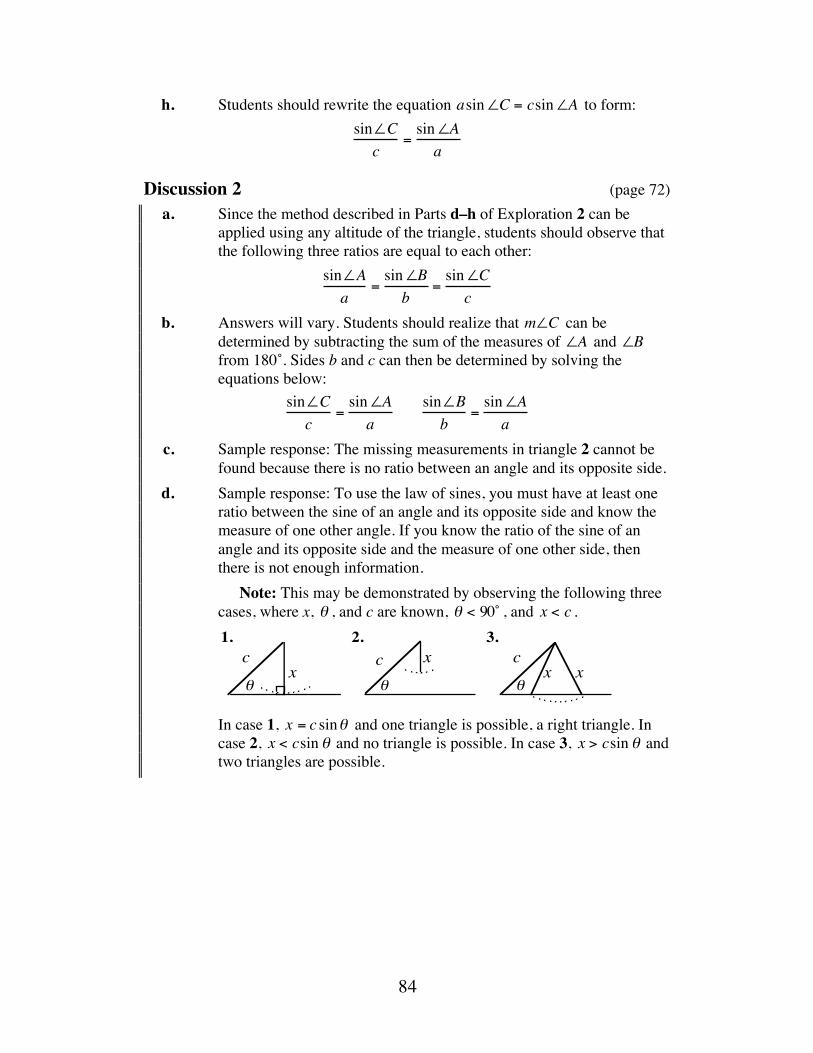
84
h. Students should rewrite the equation asin∠C = csin∠A to form: sin∠Cc
=sin∠Aa
Discussion 2 (page 72) a. Since the method described in Parts d–h of Exploration 2 can be
applied using any altitude of the triangle, students should observe that the following three ratios are equal to each other:
sin∠Aa
=sin∠Bb
=sin∠Cc
b. Answers will vary. Students should realize that m∠C can be determined by subtracting the sum of the measures of ∠A and ∠B from 180˚. Sides b and c can then be determined by solving the equations below:
sin∠Cc
=sin∠Aa
sin∠Bb
=sin∠Aa
c. Sample response: The missing measurements in triangle 2 cannot be found because there is no ratio between an angle and its opposite side.
d. Sample response: To use the law of sines, you must have at least one ratio between the sine of an angle and its opposite side and know the measure of one other angle. If you know the ratio of the sine of an angle and its opposite side and the measure of one other side, then there is not enough information.
Note: This may be demonstrated by observing the following three cases, where x, θ , and c are known, θ < 90˚ , and x < c .
In case 1, x = c sinθ and one triangle is possible, a right triangle. In
case 2, x < csin θ and no triangle is possible. In case 3, x > csin θ and two triangles are possible.
1. 2.c x
θθ
cx
3.
xc
xθ
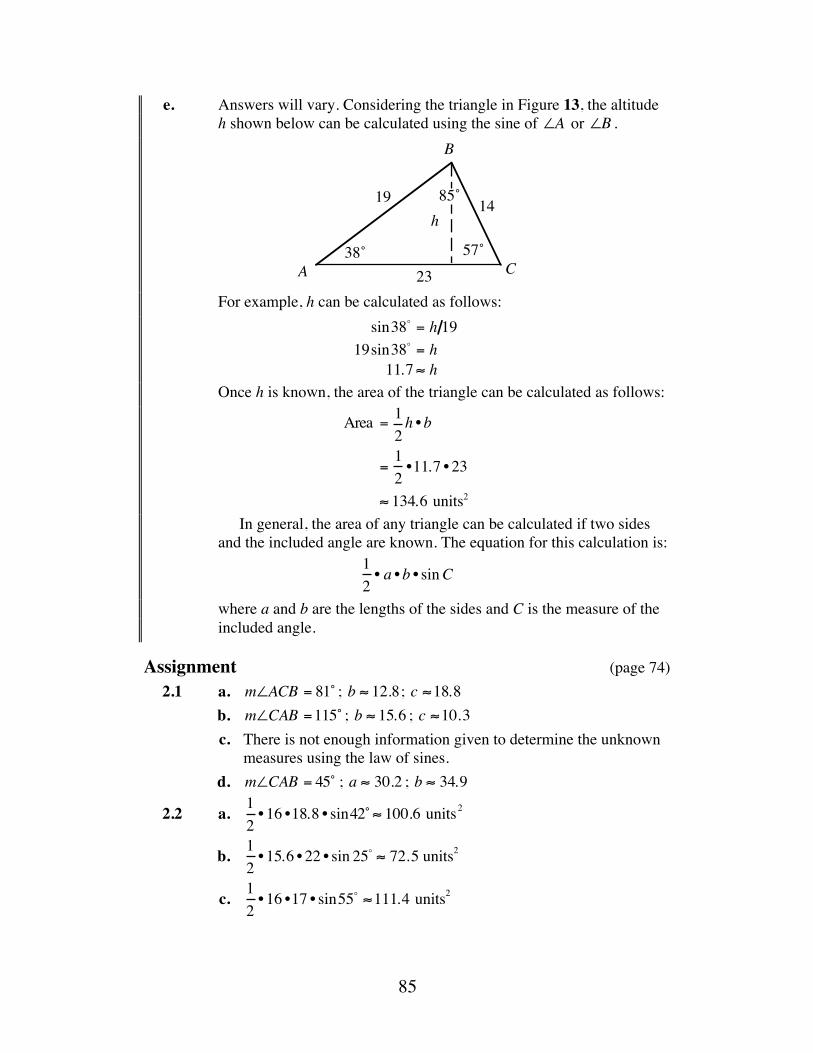
85
e. Answers will vary. Considering the triangle in Figure 13, the altitude h shown below can be calculated using the sine of ∠A or ∠B .
For example, h can be calculated as follows:
sin38! = h 1919sin38! = h
11.7 ≈ h
Once h is known, the area of the triangle can be calculated as follows:
Area =12h • b
=12
•11.7 • 23
≈ 134.6 units2
In general, the area of any triangle can be calculated if two sides and the included angle are known. The equation for this calculation is:
12• a •b • sinC
where a and b are the lengths of the sides and C is the measure of the included angle.
Assignment (page 74) 2.1 a. m∠ACB = 81˚ ; b ≈ 12.8; c ≈18.8 b. m∠CAB =115˚ ; b ≈ 15.6 ; c ≈10.3 c. There is not enough information given to determine the unknown
measures using the law of sines. d. m∠CAB = 45˚ ; a ≈ 30.2 ; b ≈ 34.9
2.2 a. 12
• 16 •18.8 • sin42˚ ≈ 100.6 units2
b.
12
• 15.6 • 22 • sin 25! ≈ 72.5 units2
c.
12
• 16 •17 • sin55! ≈111.4 units2
A
B
C
1419
23
h85˚
38˚ 57˚
86
d.
12
• 42 • 30.2 • sin55! ≈ 519.5 units2
2.3. a. The measures of the three angles are m∠A = 55̊, m∠B = 25̊, m∠C =105˚; AB ≈107.2 m; AC ≈ 71.8 m ;
b. The measures of the three angles are m∠D = 83̊, m∠E = 47 ,̊ m∠F = 50˚; DF ≈ 68.5 m; DE ≈ 71.8m
c. The area of Parcel 1 is:
Area =12
• AC • CB • sin105˚
=12
• 46.9 • 85 • sin105o ≈1925 m2
The area of Parcel 2 is:
Area =12
• DF • FE • sin50˚
=12
• 68.5• 93• sin 50˚ ≈ 2440 m2
d. Parcel 2 is a better buy since it costs approximately $10.66 m2 while Parcel 1 costs approximately $10.91 m2 .
2.4 a. 1. To calculate AD, students must first calculate m∠ABD as follows: m∠ABD = 180! − 45! − 97! = 38! . Using the law of sines:
sin38!
AD=sin 45!
32AD ≈ 27.9
2. Using the law of sines:
sin97!
BD=sin45!
32BD ≈ 44.9
3. Using the law of sines:
sin 45o
BC=sin80o
44.9BC ≈ 32.2
4. To calculate DC, students must first find m∠CBD as follows: m∠CBD = 180! − 45! − 80! = 55! . Using the law of sines:
sin55o
DC=sin 80o
44.9DC ≈ 37.3
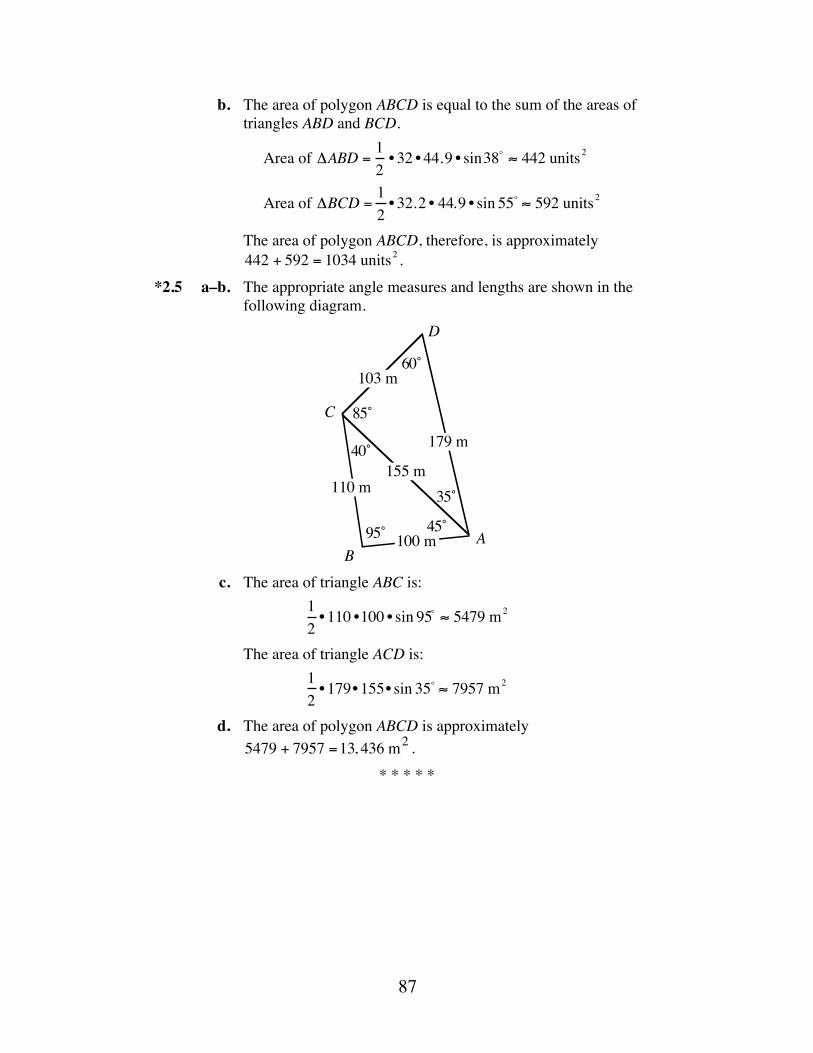
87
b. The area of polygon ABCD is equal to the sum of the areas of triangles ABD and BCD.
Area of ΔABD =
12
• 32 • 44.9 • sin38! ≈ 442 units2
Area of ΔBCD =
12
• 32.2 • 44.9 • sin 55! ≈ 592 units2
The area of polygon ABCD, therefore, is approximately 442 + 592 = 1034 units2 .
*2.5 a–b. The appropriate angle measures and lengths are shown in the following diagram.
c. The area of triangle ABC is:
12
• 110 •100 • sin 95! ≈ 5479 m2
The area of triangle ACD is:
12
• 179• 155• sin 35! ≈ 7957 m2
d. The area of polygon ABCD is approximately 5479 + 7957 =13, 436 m2 .
* * * * *
100 m AB
C
D
85˚
40˚
35˚
45˚95˚
60˚103 m
179 m
155 m110 m
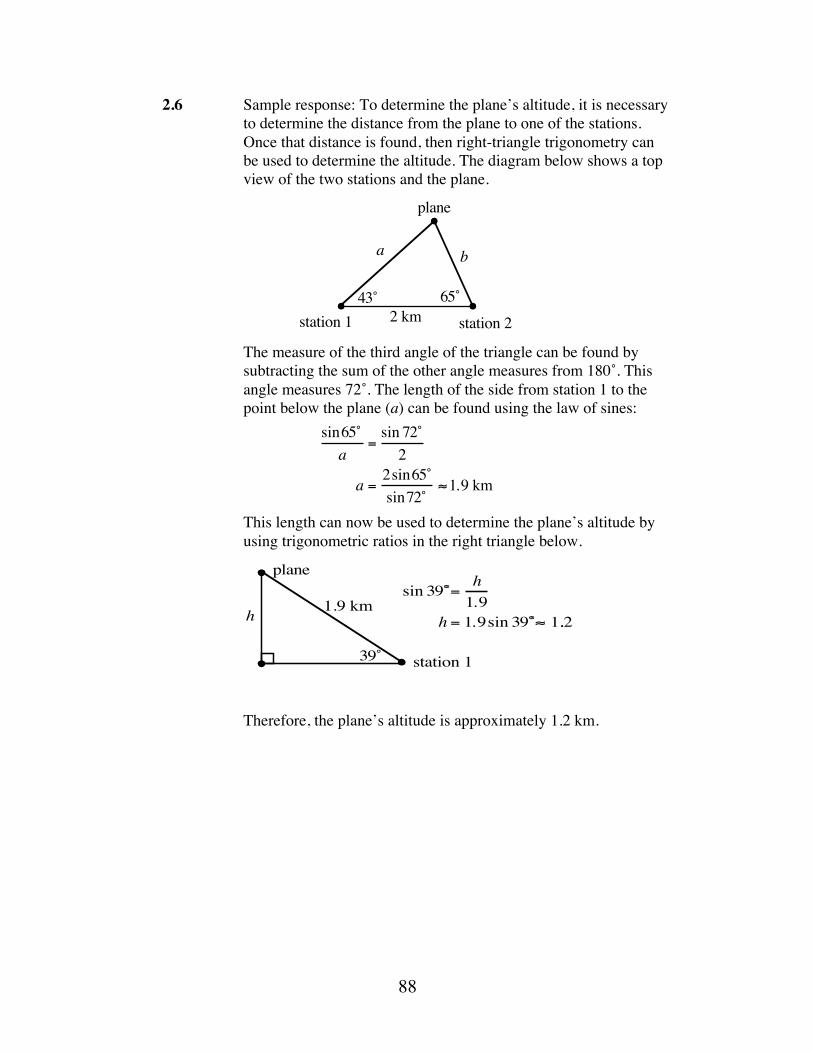
88
2.6 Sample response: To determine the plane’s altitude, it is necessary to determine the distance from the plane to one of the stations. Once that distance is found, then right-triangle trigonometry can be used to determine the altitude. The diagram below shows a top view of the two stations and the plane.
The measure of the third angle of the triangle can be found by
subtracting the sum of the other angle measures from 180˚. This angle measures 72˚. The length of the side from station 1 to the point below the plane (a) can be found using the law of sines:
sin65˚a
=sin 72˚
2
a = 2sin65˚sin72˚
≈1.9 km
This length can now be used to determine the plane’s altitude by using trigonometric ratios in the right triangle below.
Therefore, the plane’s altitude is approximately 1.2 km.
2 km
a b
station 1 station 2
plane
43˚ 65˚
station 1
plane
h
39˚
1.9 kmsin 39˚̊=
h1.9
h = 1.9sin 39˚̊≈ 1.2 km.
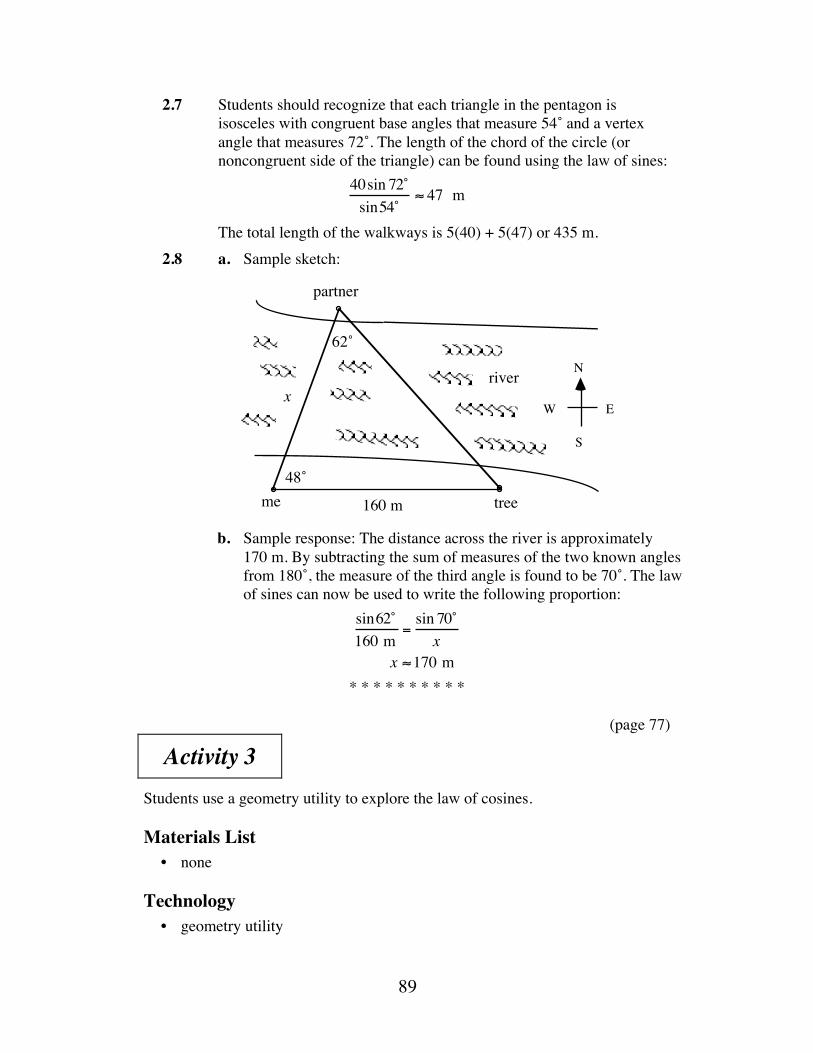
89
2.7 Students should recognize that each triangle in the pentagon is isosceles with congruent base angles that measure 54˚ and a vertex angle that measures 72˚. The length of the chord of the circle (or noncongruent side of the triangle) can be found using the law of sines:
40sin 72˚sin54˚
≈ 47 m
The total length of the walkways is 5(40) + 5(47) or 435 m. 2.8 a. Sample sketch:
b. Sample response: The distance across the river is approximately
170 m. By subtracting the sum of measures of the two known angles from 180˚, the measure of the third angle is found to be 70˚. The law of sines can now be used to write the following proportion:
sin62˚160 m
=sin 70˚x
x ≈170 m
* * * * * * * * * * (page 77)
Activity 3 Students use a geometry utility to explore the law of cosines.
Materials List • none
Technology • geometry utility
48˚
62˚
160 mme
partner
tree
xriver N
W
S
E
90
Teacher Note Many geometry utilities offer a “programming” feature that can simplify the creation of repetitive constructions. You may wish to instruct your students in the use of this feature when creating the squares on the sides of the triangles in Exploration 1. As an alternative, you may wish to create the construction before class and allow students to download it.
Exploration 1 (page 77) In this exploration, students investigate the relationships among the squares of the lengths of a triangle’s sides. a. Using their construction from Activity 2, students create a square on
each side of the triangle. b–c. Students record the area of each square and compare the sum of the
areas of the squares on the two legs of the right triangle to the area of the square on the hypotenuse. They should observe that c2 = b2 + a2 .
d. By moving vertex A, students create obtuse and acute triangles. They should observe that, when m∠ACB > 90˚ , c2 > b2 + a2 . When m∠ACB < 90˚ , c2 < b2 + a2 .
Discussion 1 (page 78) a. 1. Sample response: When the measure of ∠ACB is greater than 90˚,
the area of the square on the longest side is greater than the sum of the areas of the squares on the two shorter sides of the triangle.
2. Sample response: When the measure of ∠ACB is less than 90˚, the areas of the square on the longest side is less than the sum of the areas of the squares on the two shorter sides of the triangle.
b. In an obtuse triangle, the sum of the length of the longest side is greater than the sum of the squares of the lengths of the two shorter sides.
In an acute triangle, the sum of the length of the side opposite a given angle is less than the sum of the squares of the lengths of the other two sides of the triangle.
c. Sample response: If the area of the square on the longest side of the triangle equals the sum of the areas of the squares on the two shorter sides, then the angle is a right angle (and hence the triangle is a right triangle.
If the are of the square on the side opposite an angle is less than the sum of the areas of the squares on the other two sides, then the angle is acute . Note: To insure the triangle is an acute triangle, one would need to insure all three angles are acute.
91
If the area of the square on the longest side of a triangle is greater than the sum of the areas of the squares on the two shorter sides, then the angle is obtuse (and hence the triangle is an obtuse triangle).
Exploration 2 (page 79) a. Students remove the squares from the sides of the triangle in
Exploration 1 and move point A so that ∠A is obtuse. b. Students construct the altitude from point A to create two right
triangles. c. x = b cos∠ACB
d. h2 = b2 − (bcos∠ACB)2
e. h2 = c2 − y2
f. y = a − x
g. h2 = c2 − (a − bcos∠ACB)2
h. 1. Students use the two expressions for h2 to find the law of cosines: c2 − (a − b cos∠ACB)2 = b2 − (bcos∠ACB)2
c2 = b2 − (bcos∠ACB)2 + (a − bcos∠ACB)2
c2 = b2 − (bcos∠ACB)2 + a2 − 2abcos∠ACB + (b cos∠ACB)2
c2 = b2 + a2 − 2ab cos∠ACB
2. Students should identify − 2abcos∠C as the quantity that is required to adjust the Pythagorean theorem when a triangle is not a right triangle.
Discussion 2 (page 80) a. The equations are equivalent. b. 1. The sign of the quantity cos∠ACB is positive. 2. The sign of the quantity cos∠ACB is negative. c. Sample response:
a2 = 8.82 + 23.12 − 2(8.8)(23.1)cos 44˚≈ 77.44 + 533.61− 292.45≈ 318.6
a = 318.6≈17.85 cm
d. 1. Sample response: Substitute the value of a and the lengths of the other two sides of the triangle into the law of cosines. Solve the resulting equation for cos∠C , where ∠C is the measure of the angle to be found. Once the value of cos∠C is found, the inverse cosine function can be used to determine the measure of ∠C .
92
2. Sample response: Substitute the value of a , 44˚, and the length of one of other two sides into ratios that define the law of sines. The resulting proportion can then be solved for the angle opposite the second side.
e. Sample response: Yes. Since the cos90˚ is equal to 0, then c2 = a2 + b2 − 2ab(0) = a2 + b2 , which is the Pythagorean relationship.
Assignment (page 81) 3.1 a. Using the law of cosines, CE ≈13.7 m. b. Sample response: Once CE is known, either the law of sines or the
law of cosines can be used to find the measure of a second angle. The measure of the third angle can be found by subtracting the sum of the measures of the first two from 180˚.
*3.2 a. YZ ≈19.0 m
b. m∠XZY ≈ 38!
c. m∠XYZ ≈ 69o
d. approximately 107.9 m2
3.3 a. Using 1.92 = 2.852 + 2.52 + 2.52 − 2 2.85( ) 2.5( )cos∠A gives m∠BAC ≈ 40.95̊
b. Sample response: Once m∠BAC is known, the law of cosines can be used to find m∠ABC as follows:
2.852 = 2.52 +1.92 − 2(2.5)(1.9)cos∠B gives m∠ABC ≈ 79.46̊
Subtracting the sum of 40.95˚ and 79.46˚ from 180˚ yields m∠ACB ≈m∠59.59˚ . An alternative method is to use the law of sines to find both m∠ABC and m∠ACB .
*3.4 Answers may vary, depending on rounding and the processes used. Sample responses are given below.
a. Using the law of cosines: 162 = 182 +172 − 2(18)(17) cos∠NMO
0.583 ≈ cos∠NMO54.3˚ ≈ m∠NMO
b. Using the law of sines: 17
sin∠MNO=
16sin 54.3˚
sin∠MNO = 17 • sin54.3̊16
m∠MNO ≈ 59.6̊
93
c. Subtracting the sum of the two known measures from 180˚, m∠MON = 66.1˚ .
d. The altitude of the triangle drawn from O is equal to 16 • sin59.6˚. The area of the triangle is 0.5 •18 • (16 • sin59.6˚) , or approximately 124.2 km2 .
*3.5 a. The diagram below shows the length of each segment and the area of each triangle.
b. The total area of the property is 101,038 m2 .
* * * * * 3.6 Sample response: The sketch below shows the location of the ships 3 hr
after leaving the harbor. To simplify, the diagram below ignores the 0.5 km that separated the ships at the beginning of the journey. The distances are given in kilometers. They were found by multiplying the ships’ speeds in kilometers per hour by 3.
Using the law of cosines, the distance between the two ships in the
triangle is approximately 143.3 km. Since the ships started approximately 0.5 km apart, the actual distance is approximately 143.8 km.
175 m
220 m258 m
146 m
207 m269 m
23,200 m2
29,391 m2
21,103 m2
27,344 m2
ship A
ship B
70˚117 km
132 km
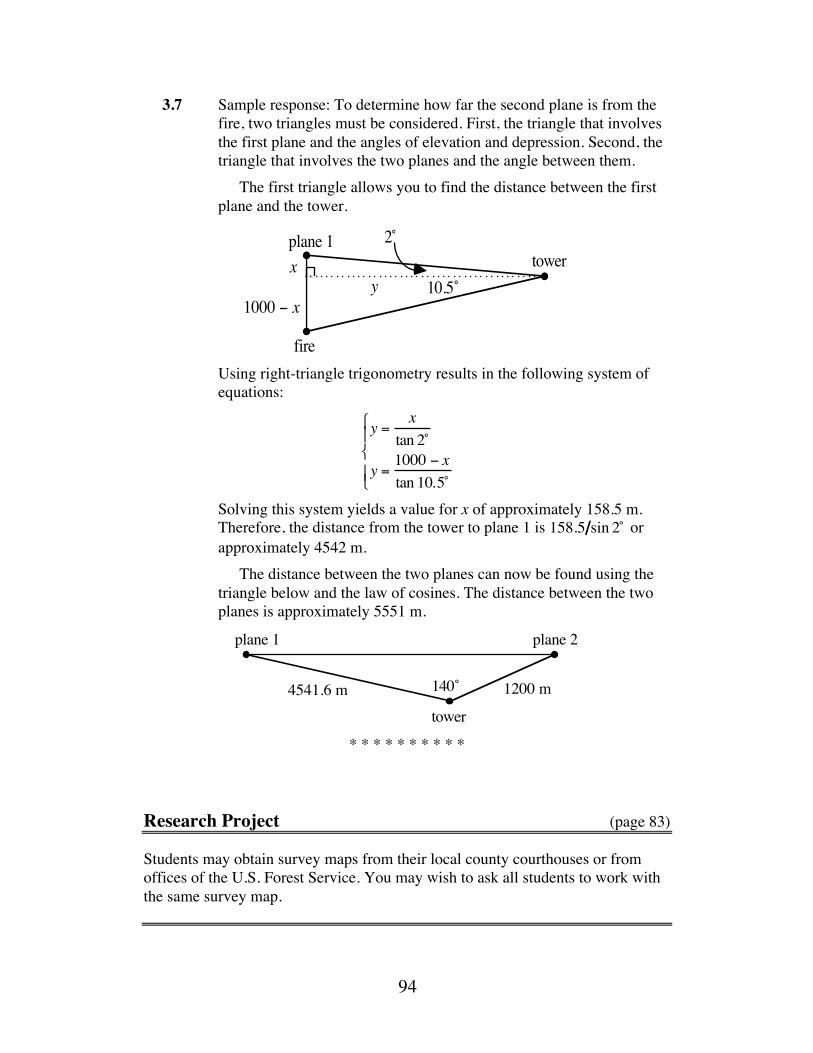
94
3.7 Sample response: To determine how far the second plane is from the fire, two triangles must be considered. First, the triangle that involves the first plane and the angles of elevation and depression. Second, the triangle that involves the two planes and the angle between them.
The first triangle allows you to find the distance between the first plane and the tower.
Using right-triangle trigonometry results in the following system of
equations:
y =x
tan 2̊
y =1000 − xtan 10.5̊
⎧
⎨ ⎪
⎩ ⎪
Solving this system yields a value for x of approximately 158.5 m. Therefore, the distance from the tower to plane 1 is 158.5 sin 2̊ or approximately 4542 m.
The distance between the two planes can now be found using the triangle below and the law of cosines. The distance between the two planes is approximately 5551 m.
* * * * * * * * * *
Research Project (page 83) Students may obtain survey maps from their local county courthouses or from offices of the U.S. Forest Service. You may wish to ask all students to work with the same survey map.
2̊
10.5˚yx
1000 − x
towerplane 1
fire
tower
plane 1 plane 2
140˚ 1200 m4541.6 m
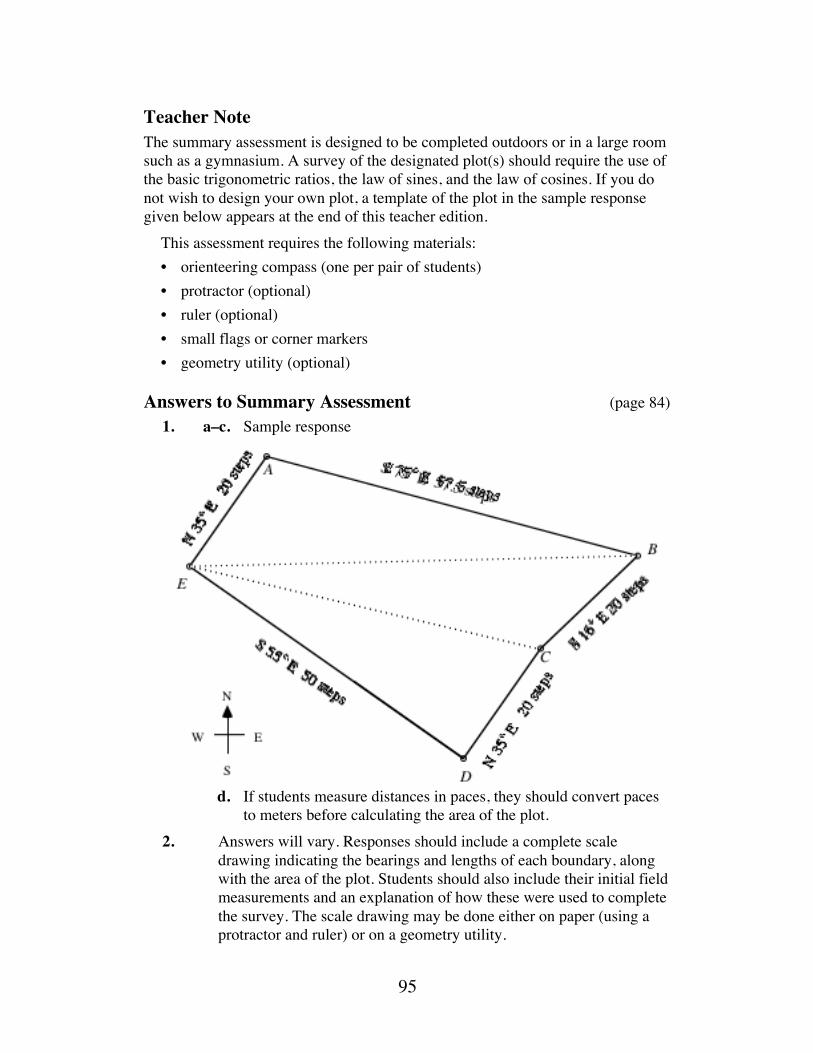
95
Teacher Note The summary assessment is designed to be completed outdoors or in a large room such as a gymnasium. A survey of the designated plot(s) should require the use of the basic trigonometric ratios, the law of sines, and the law of cosines. If you do not wish to design your own plot, a template of the plot in the sample response given below appears at the end of this teacher edition. This assessment requires the following materials: • orienteering compass (one per pair of students) • protractor (optional) • ruler (optional) • small flags or corner markers • geometry utility (optional)
Answers to Summary Assessment (page 84) 1. a–c. Sample response
d. If students measure distances in paces, they should convert paces
to meters before calculating the area of the plot. 2. Answers will vary. Responses should include a complete scale
drawing indicating the bearings and lengths of each boundary, along with the area of the plot. Students should also include their initial field measurements and an explanation of how these were used to complete the survey. The scale drawing may be done either on paper (using a protractor and ruler) or on a geometry utility.
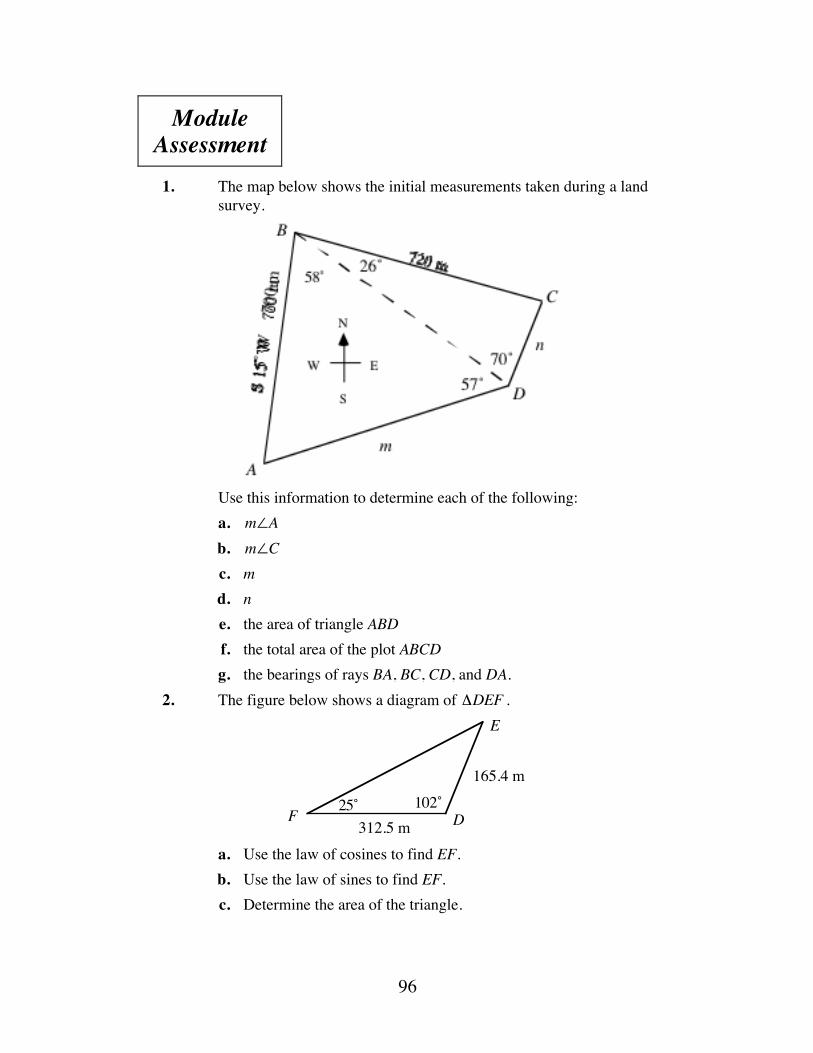
96
Module Assessment
1. The map below shows the initial measurements taken during a land
survey.
Use this information to determine each of the following: a. m∠A b. m∠C c. m d. n e. the area of triangle ABD f. the total area of the plot ABCD g. the bearings of rays BA, BC, CD, and DA. 2. The figure below shows a diagram of ΔDEF .
a. Use the law of cosines to find EF. b. Use the law of sines to find EF. c. Determine the area of the triangle.
D25˚
E
102˚312.5 m
165.4 m
F
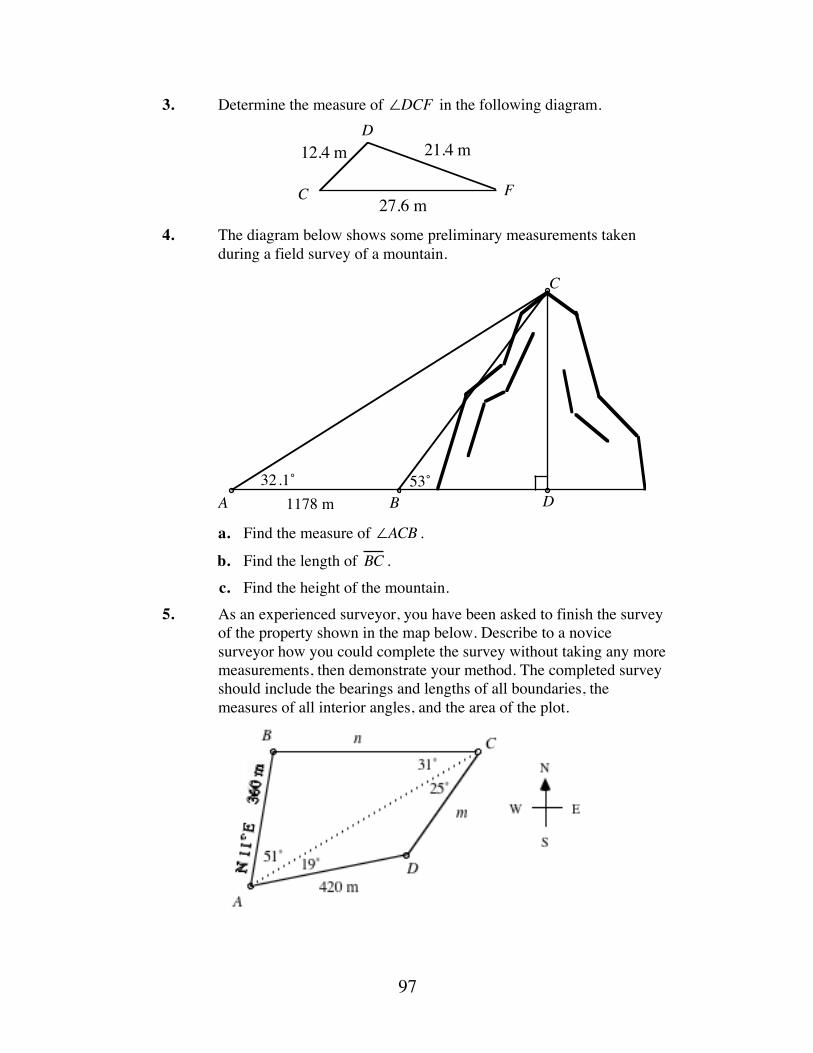
97
3. Determine the measure of ∠DCF in the following diagram.
4. The diagram below shows some preliminary measurements taken
during a field survey of a mountain.
a. Find the measure of ∠ACB .
b. Find the length of BC . c. Find the height of the mountain. 5. As an experienced surveyor, you have been asked to finish the survey
of the property shown in the map below. Describe to a novice surveyor how you could complete the survey without taking any more measurements, then demonstrate your method. The completed survey should include the bearings and lengths of all boundaries, the measures of all interior angles, and the area of the plot.
12.4 m 21.4 m
27.6 mC
D
F
A D
C
B32.1˚ 53˚
1178 m
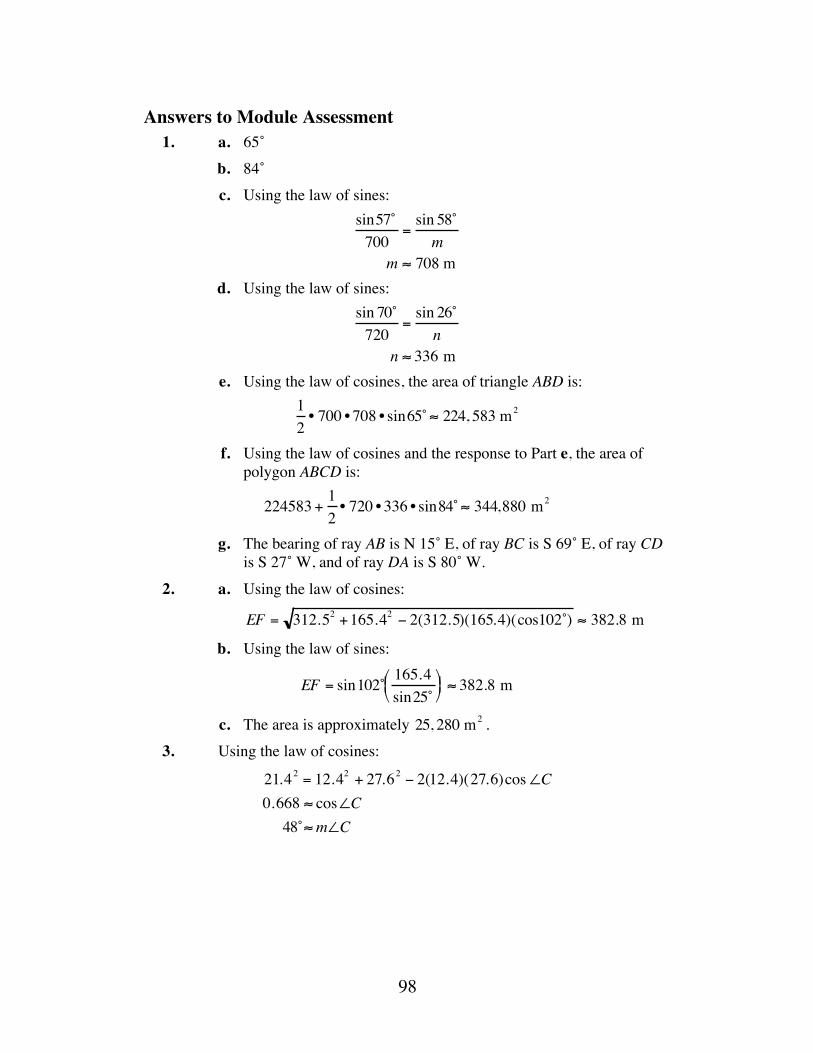
98
Answers to Module Assessment 1. a. 65˚ b. 84˚ c. Using the law of sines:
sin57˚700
=sin 58˚m
m ≈ 708 m
d. Using the law of sines: sin 70˚
720=
sin 26˚n
n ≈ 336 m
e. Using the law of cosines, the area of triangle ABD is: 12
• 700 • 708 • sin65˚ ≈ 224, 583 m2
f. Using the law of cosines and the response to Part e, the area of polygon ABCD is:
224583 + 12
• 720 • 336 • sin84˚ ≈ 344,880 m2
g. The bearing of ray AB is N 15˚ E, of ray BC is S 69˚ E, of ray CD is S 27˚ W, and of ray DA is S 80˚ W.
2. a. Using the law of cosines:
EF = 312.52 +165.42 − 2(312.5)(165.4)(cos102˚) ≈ 382.8 m b. Using the law of sines:
EF = sin102˚ 165.4sin25˚⎛ ⎝ ⎜ ⎞
⎠ ⎟ ≈ 382.8 m
c. The area is approximately 25, 280 m2 . 3. Using the law of cosines:
21.42 = 12.42 + 27.62 − 2(12.4)(27.6)cos∠C0.668 ≈ cos∠C48˚≈m∠C
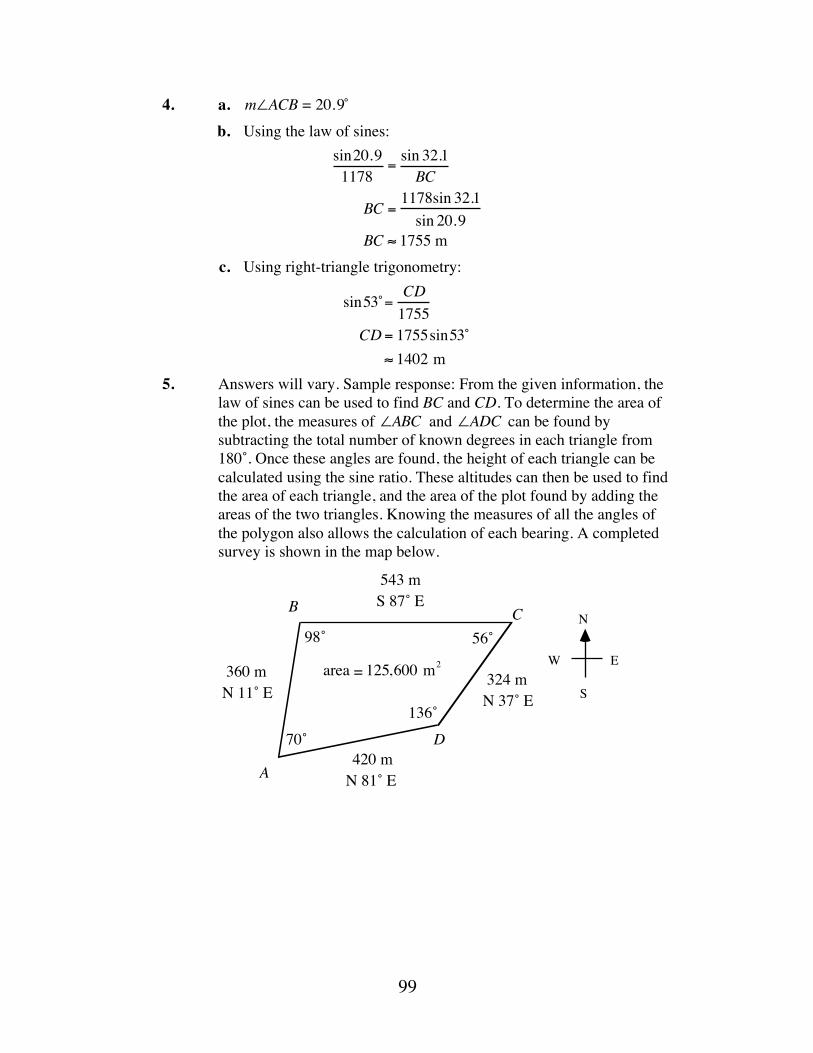
99
4. a. m∠ACB = 20.9̊ b. Using the law of sines:
sin20.91178
=sin 32.1BC
BC =1178sin 32.1
sin 20.9BC ≈ 1755 m
c. Using right-triangle trigonometry:
sin53˚= CD1755
CD = 1755sin53˚≈ 1402 m
5. Answers will vary. Sample response: From the given information, the law of sines can be used to find BC and CD. To determine the area of the plot, the measures of ∠ABC and ∠ADC can be found by subtracting the total number of known degrees in each triangle from 180˚. Once these angles are found, the height of each triangle can be calculated using the sine ratio. These altitudes can then be used to find the area of each triangle, and the area of the plot found by adding the areas of the two triangles. Knowing the measures of all the angles of the polygon also allows the calculation of each bearing. A completed survey is shown in the map below.
S 87˚ E543 m
N 37˚ E324 m
N 81˚ E420 m
N 11˚ E360 m area = 125,600 m2
N
W
S
E
A
B C
D
98˚
136˚
56˚
70˚
100
Selected References Hudson, D. A., and J. G. Miller. The Challenge of the Unknown: Teaching Guide.
New York: W. W. Norton and Co., 1986. Davis, R. Elementary Plane Surveying. New York: McGraw-Hill, 1969. Kissam, P. Surveying Practice. New York: McGraw-Hill, 1971. Rayner, W. H., and M. O. Smith. Fundamentals of Surveying, New York: D. Van
Nostrand, 1969. Silva Company. “How to Find Your Way With the Silva Compass.” Binghamton,
NY: Silva Co., n.d. Trussell, M. “Teaching Basic Geographical Skills: Map and Compass Activities.”
Journal of Geography, 85 (July–August 1886): 169–173.
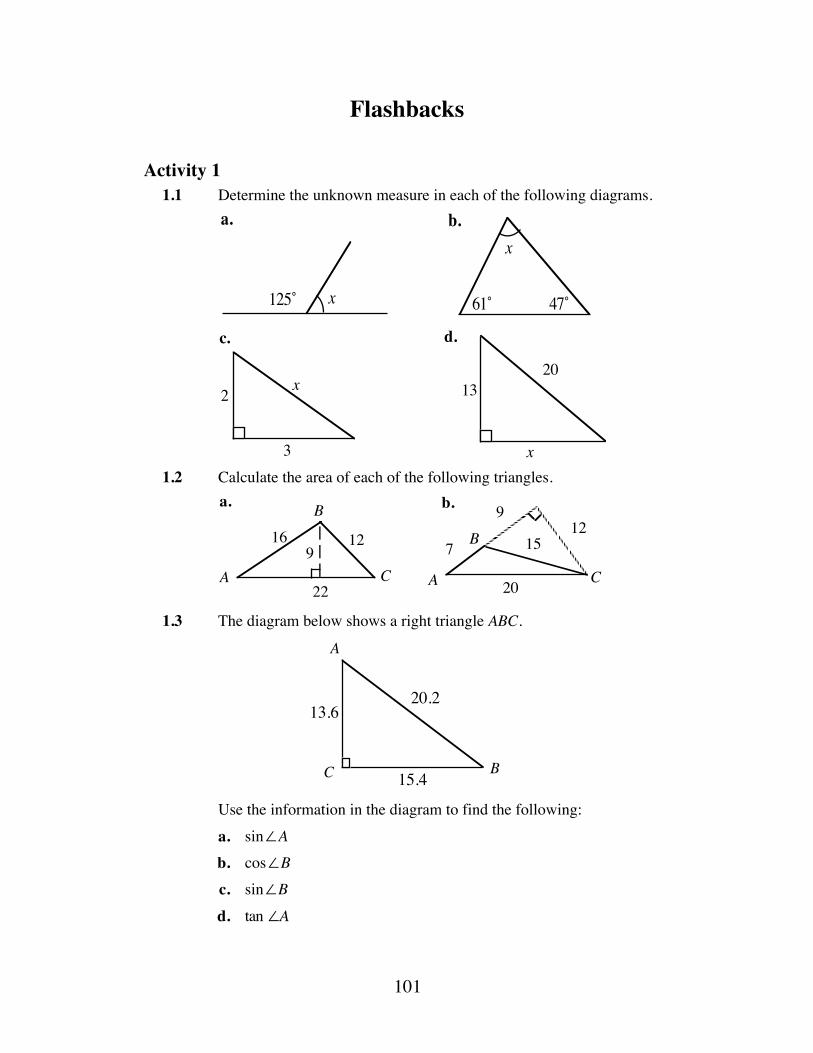
101
Flashbacks
Activity 1 1.1 Determine the unknown measure in each of the following diagrams.
1.2 Calculate the area of each of the following triangles.
1.3 The diagram below shows a right triangle ABC.
Use the information in the diagram to find the following: a. sin∠A b. cos∠B c. sin∠B d. tan ∠A
125˚ x
a.
61˚ 47˚
xb.
2
3
x
c.
13
x
20
d.
16 12
22
9A
B
C
a.
A
B
C
1215
9
7
20
b.
A
13.6
15.4
20.2
BC
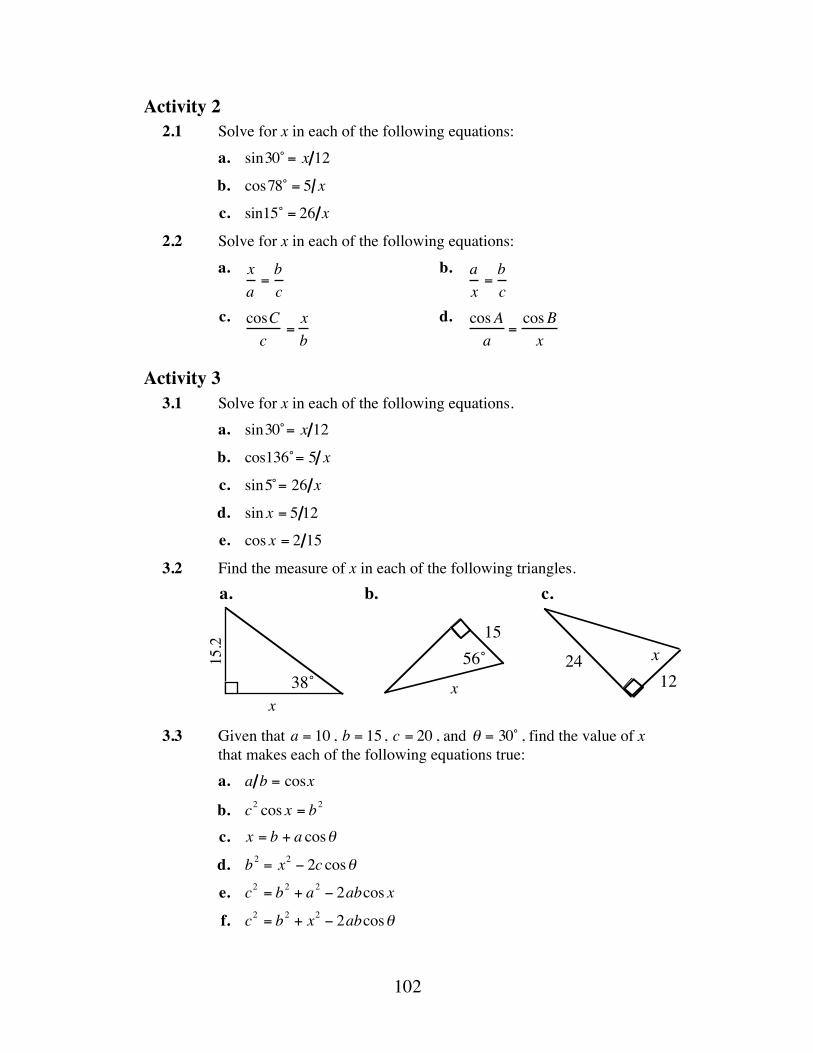
102
Activity 2 2.1 Solve for x in each of the following equations: a. sin30˚ = x 12
b. cos78˚ = 5 x
c. sin15˚ = 26 x
2.2 Solve for x in each of the following equations:
a.
xa=bc
b.
ax=bc
c.
cosCc
=xb
d.
cosAa
=cosBx
Activity 3 3.1 Solve for x in each of the following equations. a. sin30˚= x 12
b. cos136˚= 5 x
c. sin5̊ = 26 x
d. sin x = 5 12
e. cos x = 2 15
3.2 Find the measure of x in each of the following triangles.
3.3 Given that a = 10 , b = 15 , c = 20 , and θ = 30˚ , find the value of x
that makes each of the following equations true: a. a b = cosx
b. c2 cos x = b2 c. x = b + a cosθ
d. b2 = x2 − 2c cosθ
e. c2 = b2 + a2 − 2abcos x
f. c2 = b2 + x2 − 2abcosθ
x
15x2412
a. b. c.
38˚56˚
x
15.2
103
Answers to Flashbacks
Activity 1 1.1 a. 55˚ b. 72˚
c. 13 ≈ 3.61
d. 231 ≈ 15.2
1.2 a. 12• 9 • 22 = 99 units2
b. 12•16 •12 = 96 units2
1.3 a. sin∠A =15.4 20.2 ≈ 0.76
b. cos∠B =15.4 20.2 ≈ 0.76
c. sin∠B =13.6 20.2 ≈ 0.67
d. tan ∠A = 15.4 13.6 ≈ 1.13
Activity 2 2.1 a. x = 6 b. x ≈ 24.0 c. x ≈100.5
2.2 a. x =bac
b. x =acb
c. x =b • cosC
c
d. x =a • cosBcosA
104
Activity 3 3.1 a. x = 6 b. x ≈ −6.95 c. x ≈ 298.3 d. x ≈ 24.6̊ or x ≈155.4̊ e. x ≈ 82.3˚ 3.2 a. x ≈19.5 b. x ≈ 26.8 c. x ≈ 63.4̊ 3.3 a. x ≈ 48.2̊ b. x ≈ 55.8̊ c. x ≈ 23.7 d. x ≈16.1 e. x ≈104.5̊ (Some calculators may give 75.5˚. A sketch of the
triangle will help show the solution.) f. x ≈ 20.9̊
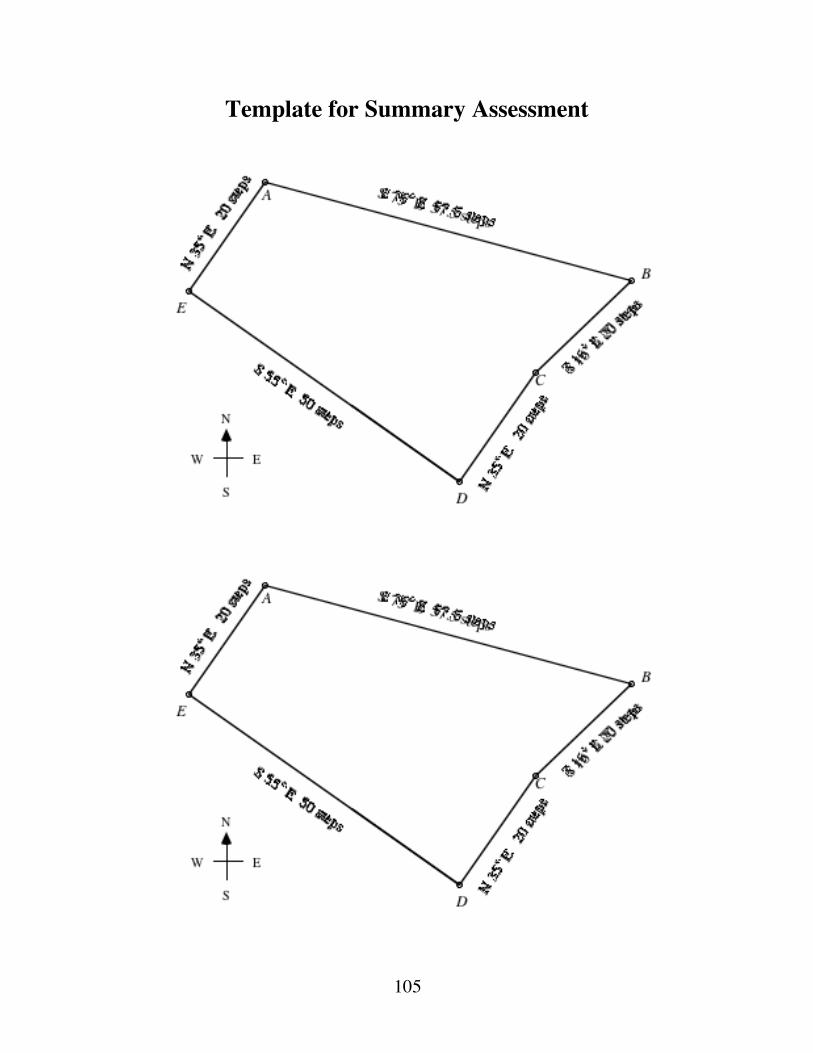
105
Template for Summary Assessment
Taste Test
What’s your favorite soft drink? Do you drink it because of its taste, or for some other reasons? In this module, you explore the bewildering number of choices involved in marketing a new soft drink.
Tom Teegarden • Deanna Turley
Danny Jones • Laurie Paladichuk
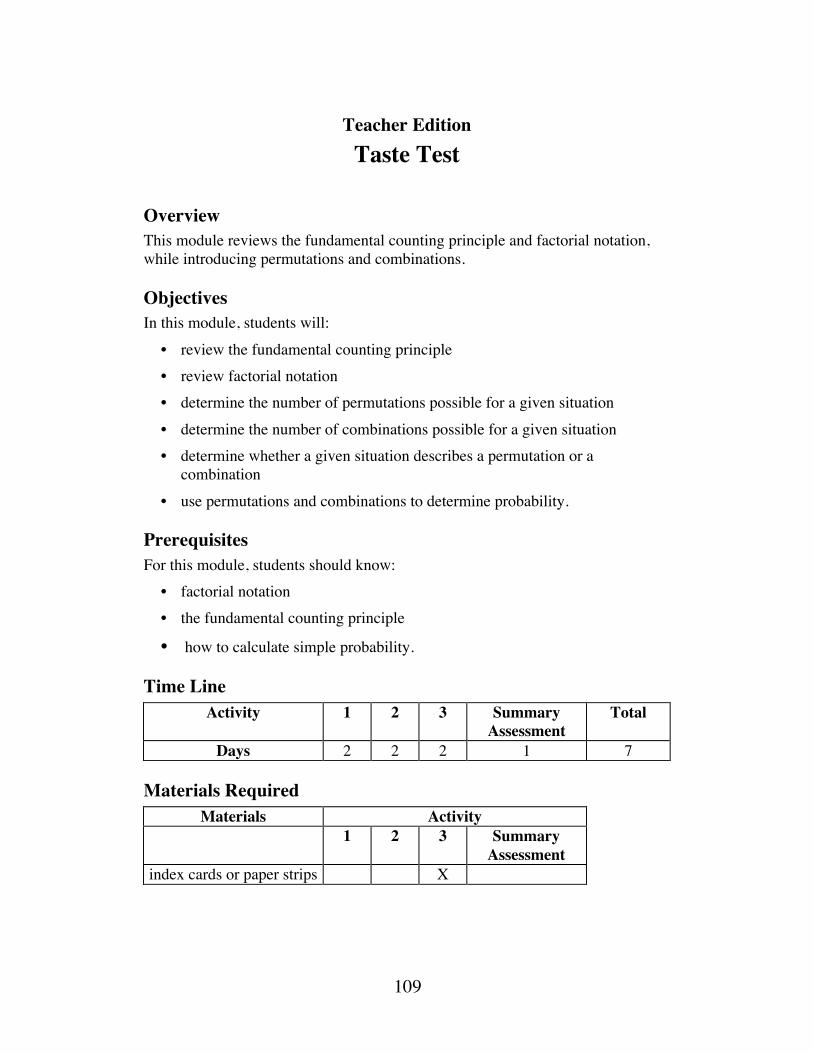
109
Teacher Edition Taste Test
Overview This module reviews the fundamental counting principle and factorial notation, while introducing permutations and combinations.
Objectives In this module, students will: • review the fundamental counting principle • review factorial notation • determine the number of permutations possible for a given situation • determine the number of combinations possible for a given situation • determine whether a given situation describes a permutation or a
combination • use permutations and combinations to determine probability.
Prerequisites For this module, students should know: • factorial notation • the fundamental counting principle
• how to calculate simple probability.
Time Line Activity 1 2 3 Summary
Assessment Total
Days 2 2 2 1 7
Materials Required Materials Activity
1 2 3 Summary Assessment
index cards or paper strips X
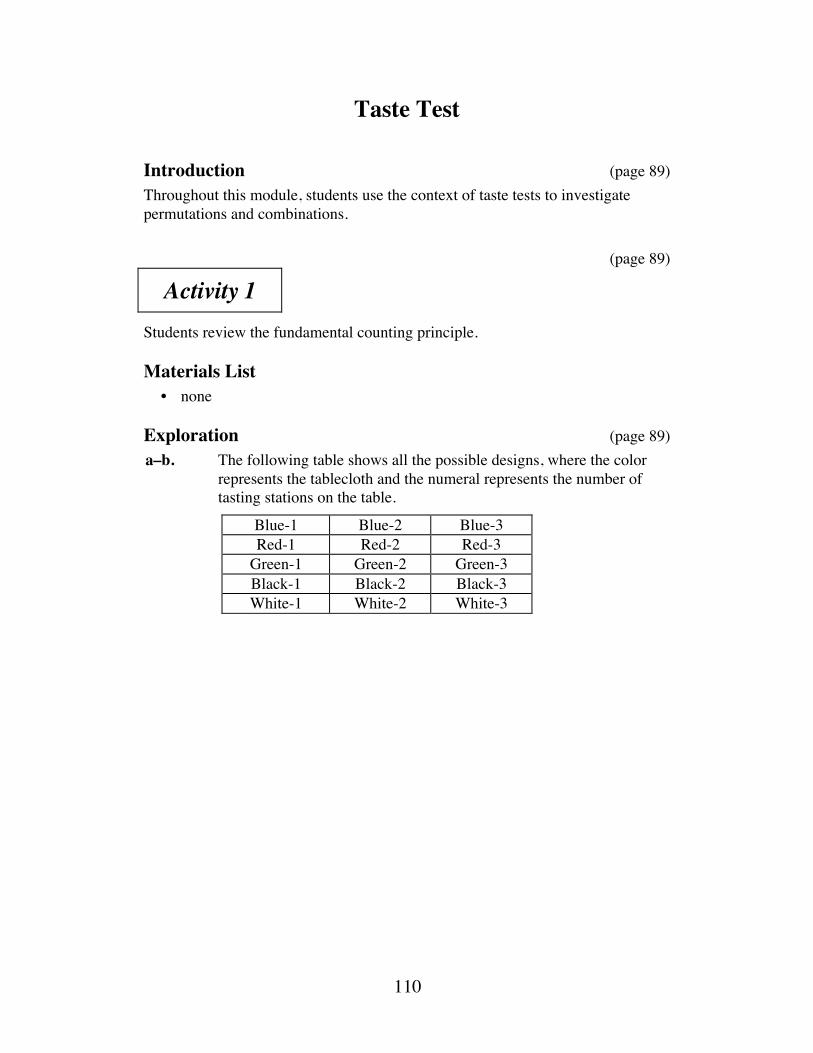
110
Taste Test
Introduction (page 89) Throughout this module, students use the context of taste tests to investigate permutations and combinations. (page 89)
Activity 1 Students review the fundamental counting principle.
Materials List • none
Exploration (page 89) a–b. The following table shows all the possible designs, where the color
represents the tablecloth and the numeral represents the number of tasting stations on the table.
Blue-1 Blue-2 Blue-3 Red-1 Red-2 Red-3
Green-1 Green-2 Green-3 Black-1 Black-2 Black-3 White-1 White-2 White-3
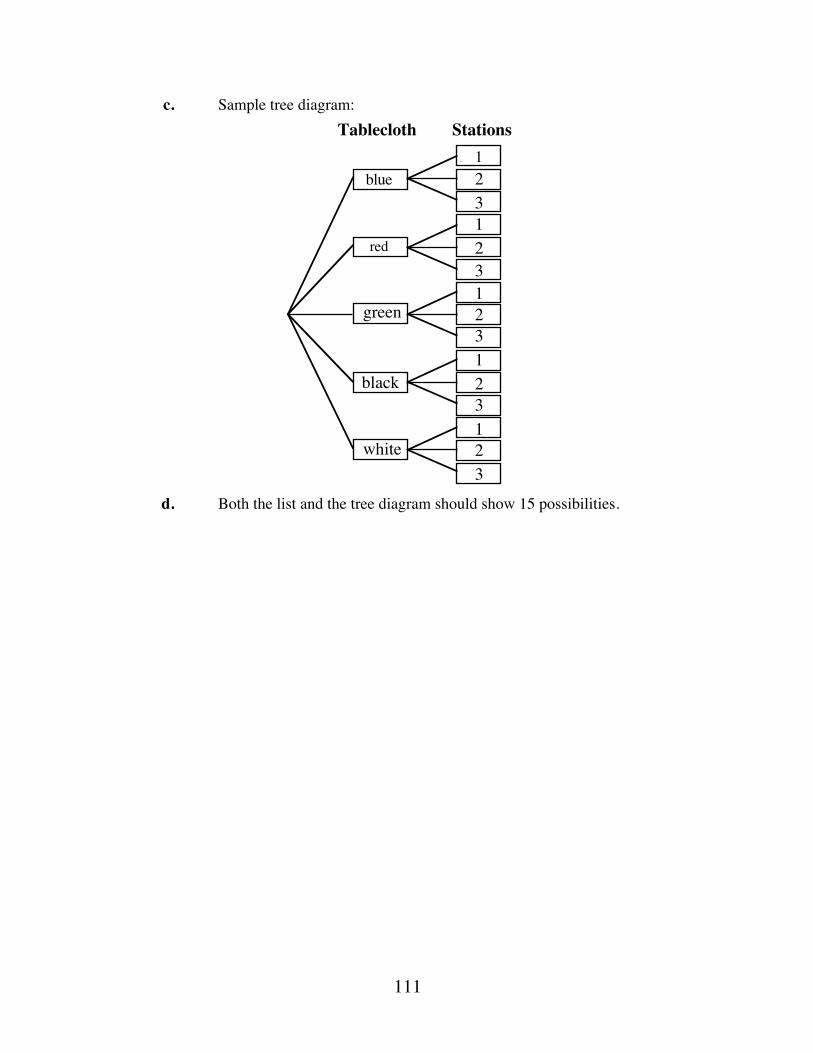
111
c. Sample tree diagram:
d. Both the list and the tree diagram should show 15 possibilities.
blue
red
One
black
green
white
Tablecloth Stations123123123123123
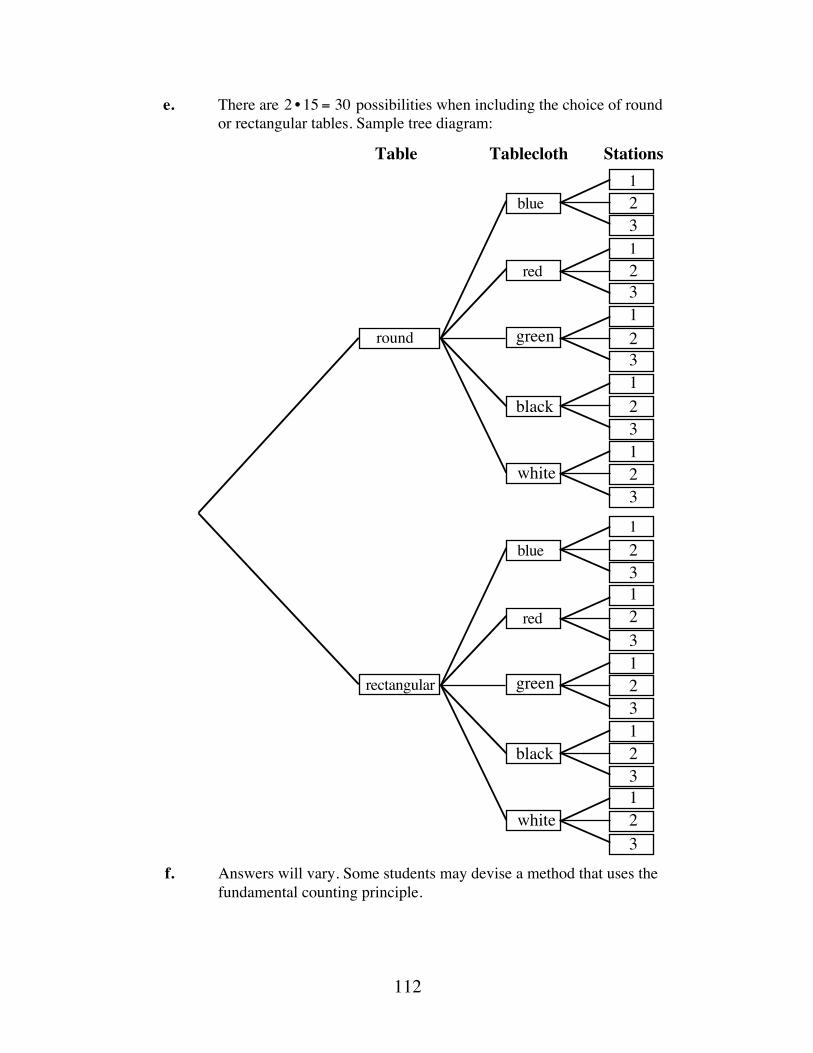
112
e. There are 2 • 15 = 30 possibilities when including the choice of round or rectangular tables. Sample tree diagram:
f. Answers will vary. Some students may devise a method that uses the
fundamental counting principle.
blueO
23
black
green 2
white
Tablecloth Stations
231
3123123
e
rectangular
23
2
1231
3123123
1
red
round
1
1
Table
blue
black
green
white
red
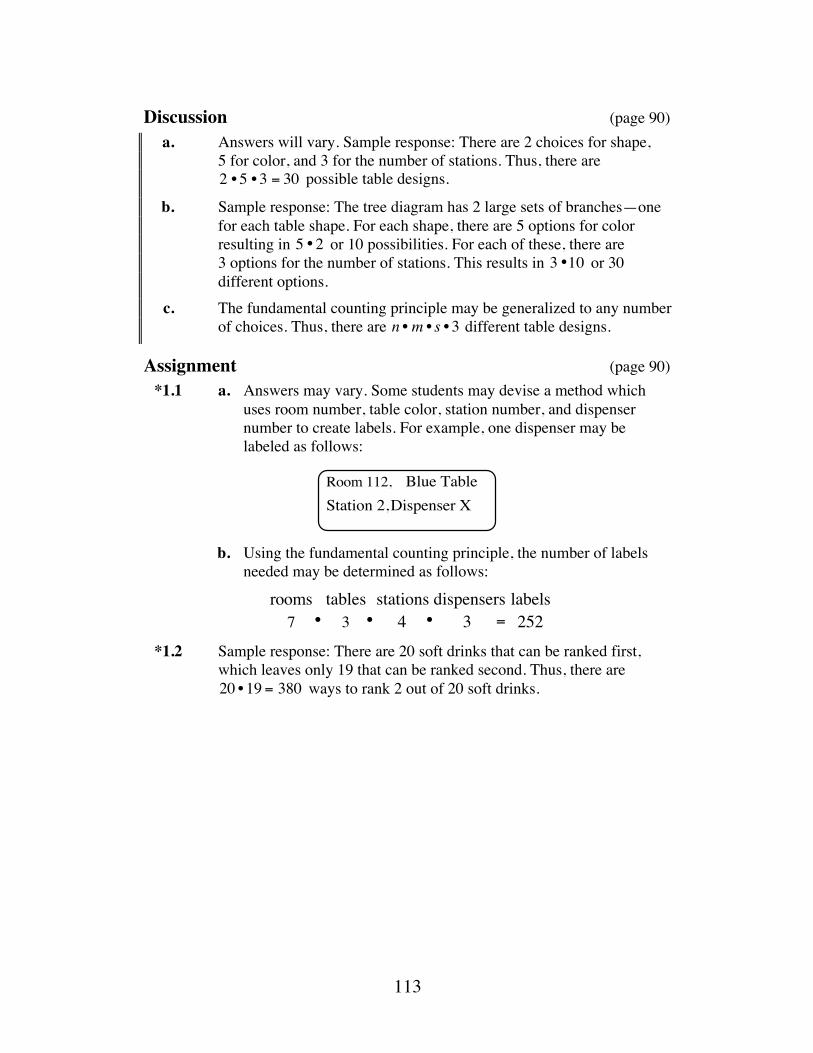
113
Discussion (page 90) a. Answers will vary. Sample response: There are 2 choices for shape,
5 for color, and 3 for the number of stations. Thus, there are 2 • 5 • 3 = 30 possible table designs.
b. Sample response: The tree diagram has 2 large sets of branches—one for each table shape. For each shape, there are 5 options for color resulting in 5 •2 or 10 possibilities. For each of these, there are 3 options for the number of stations. This results in 3 •10 or 30 different options.
c. The fundamental counting principle may be generalized to any number of choices. Thus, there are n • m • s • 3 different table designs.
Assignment (page 90) *1.1 a. Answers may vary. Some students may devise a method which
uses room number, table color, station number, and dispenser number to create labels. For example, one dispenser may be labeled as follows:
b. Using the fundamental counting principle, the number of labels
needed may be determined as follows:
*1.2 Sample response: There are 20 soft drinks that can be ranked first,
which leaves only 19 that can be ranked second. Thus, there are 20 • 19 = 380 ways to rank 2 out of 20 soft drinks.
Room 112,
Dispenser XBlue Table
Station 2,
7 • 4 • 3 = 252rooms tables stations dispensers labels
3•
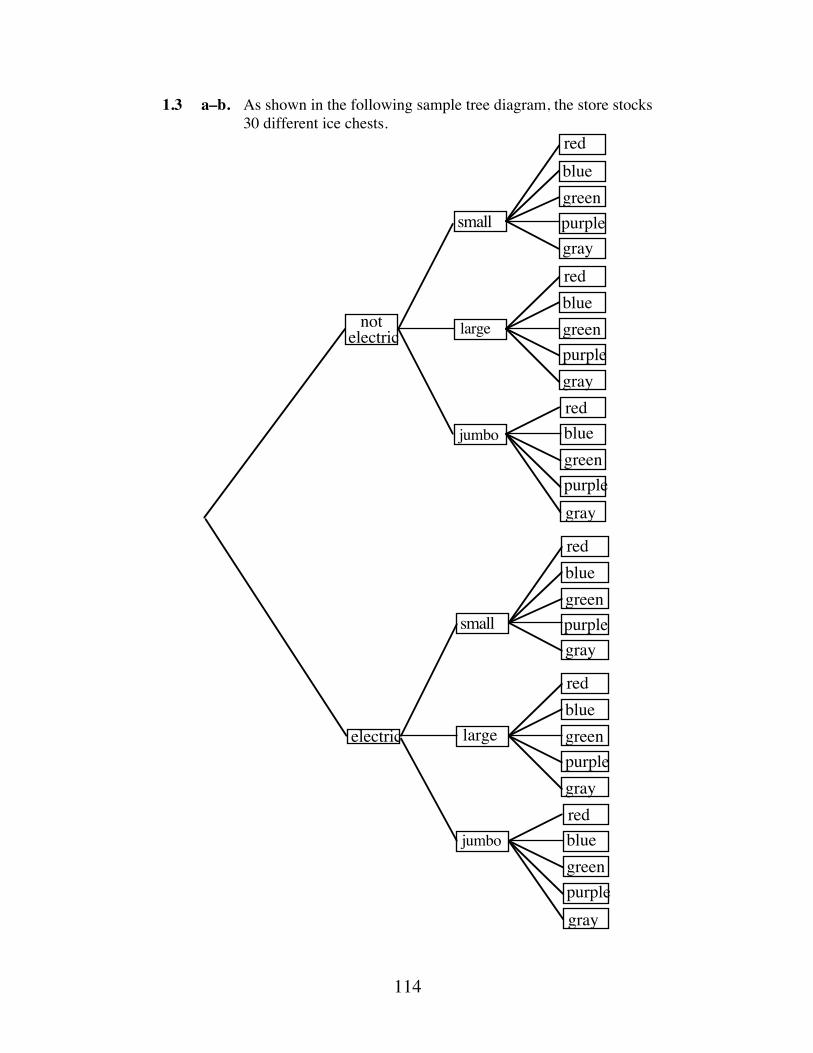
114
1.3 a–b. As shown in the following sample tree diagram, the store stocks 30 different ice chests.
large
red
green
green
purple
purple
small
red
blue
blue
blue
greenpurple
gray
gray
gray
notelectric
large
red
red
green
green
purple
purple
small
red
blue
blue
blue
greenpurple
gray
gray
gray
electric
red
jumbo
jumbo
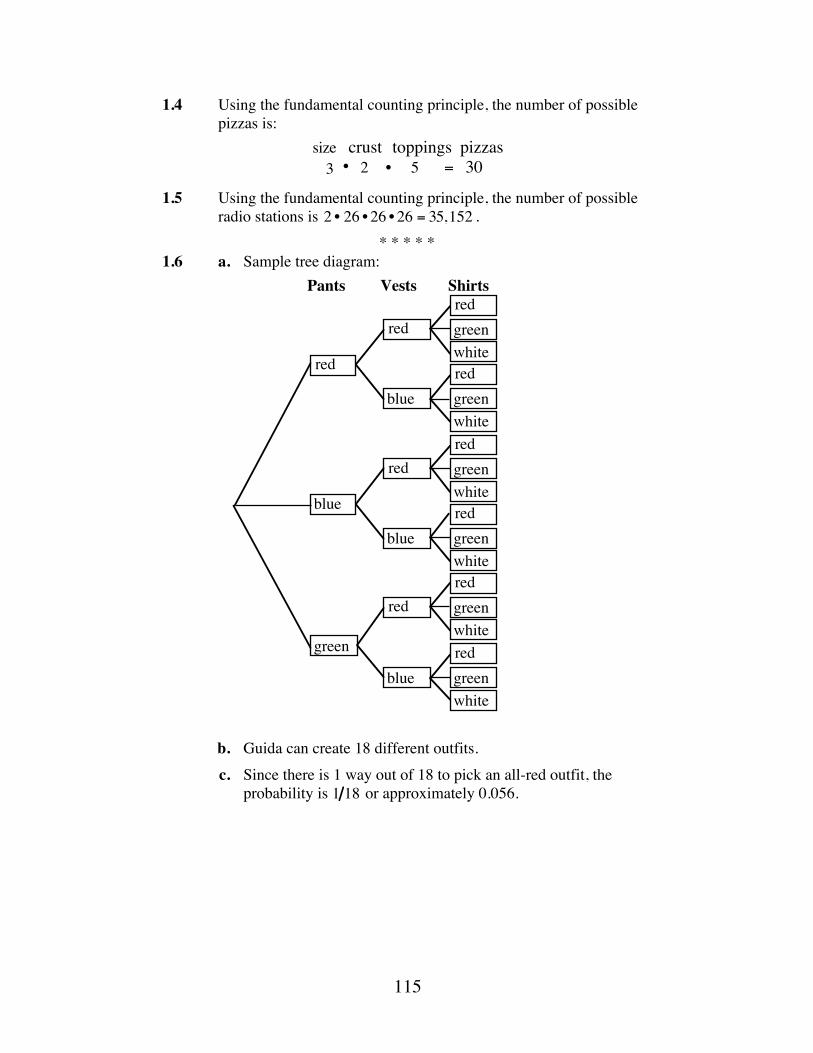
115
1.4 Using the fundamental counting principle, the number of possible pizzas is:
1.5 Using the fundamental counting principle, the number of possible
radio stations is 2 • 26 • 26 • 26 = 35,152 . * * * * *
1.6 a. Sample tree diagram:
b. Guida can create 18 different outfits. c. Since there is 1 way out of 18 to pick an all-red outfit, the
probability is 1 18 or approximately 0.056.
2 = 30pizzastoppingscrust
5•size3 •
greenred
whitered
blue
green
blue
red
greenred
white
greenred
white
greenred
white
greenred
white
greenred
white
red
blue
red
blue
Pants Vests Shirts
116
1.7 a. Using the fundamental counting principle, the number of possible single-flavor cones is:
b. If a customer can choose a dish instead of a cone and choose not
to have a topping, then the number of desserts is:
1.8 Answers will vary. Sample response: Divide the stadium into
26 sections, each with no more than 26 rows. Label each section and each row with a letter. Then use a two-digit number to designate each seat in the row. As long as there are less than 99 seats in each row, this labeling scheme could work for up to 26 • 26 • 99 = 66, 924 seats.
1.9 a. Sample response: Using the fundamental counting principle, the number of possible codes is: 9 • 9 • 9 • 9 = 6561 . Since you can’t select the current code, you have 6560 codes from which to choose.
b. The probability is 10 6561 or approximately 0.0015. This represents less than a 0.2% chance of finding the correct combination.
* * * * * * * * * * (page 92)
Activity 2 Students explore permutations and number of permutations in the context of designing a four-color beverage can.
Materials List • none
Exploration (page 92) a. 1. Each of the 4 colors could be the background color. Once a color
has been chosen for the background, only 3 choices remain for the logo. There are 4 • 3 = 12 possible arrangements of first and second colors.
2. Once colors have been chosen for the background and logo, only 2 choices remain for the name of the drink. There are 4 • 3• 2 = 24 possible arrangements of first, second, and third colors.
3. Once colors have been chosen for the background, logo, and name, only 1 color remains for highlighting. There are 4 • 3• 2 •1 = 24 possible designs.
ice cream toppings cones7 • 5 • 3 = 105
toppings6 • 5 = 168
desserts7 •
ice cream containers4
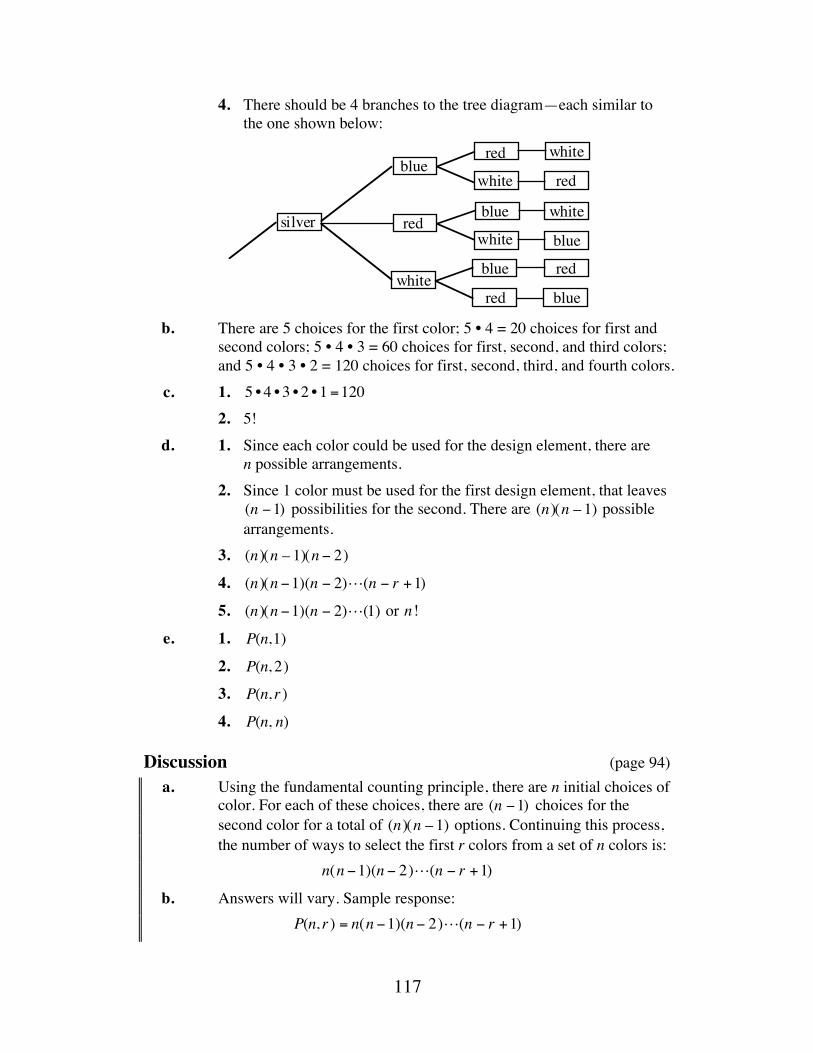
117
4. There should be 4 branches to the tree diagram—each similar to the one shown below:
b. There are 5 choices for the first color; 5 • 4 = 20 choices for first and
second colors; 5 • 4 • 3 = 60 choices for first, second, and third colors; and 5 • 4 • 3 • 2 = 120 choices for first, second, third, and fourth colors.
c. 1. 5 • 4 • 3 • 2 • 1 =120 2. 5! d. 1. Since each color could be used for the design element, there are
n possible arrangements. 2. Since 1 color must be used for the first design element, that leaves
(n −1) possibilities for the second. There are (n)(n – 1) possible arrangements.
3. (n)(n – 1)(n − 2)
4. (n)(n −1)(n − 2)!(n − r +1)
5. (n)(n −1)(n − 2)!(1) or n!
e. 1. P(n,1)
2. P(n, 2)
3. P(n, r )
4. P(n, n)
Discussion (page 94) a. Using the fundamental counting principle, there are n initial choices of
color. For each of these choices, there are (n −1) choices for the second color for a total of (n)(n – 1) options. Continuing this process, the number of ways to select the first r colors from a set of n colors is:
n(n −1)(n − 2)!(n − r +1)
b. Answers will vary. Sample response:
P(n, r ) = n(n −1)(n − 2)!(n − r +1)
silver
blue
red
white
red
white
white
blue
blue
red
red
red
white
white
blue
blue
118
c. n! d. (n − r)!
e. P(n, r ) gives the number of designs possible for r colors chosen. n − r( )! gives the number of designs possible for the colors not
chosen. Therefore P n1r( ) • n − r( )! represents the number of designs possible if all n colors are chosen or P n, r( )
f. Since P(n, n) = n!, P(n, r ) • (n − r)! = P(n,n)
P(n, r) =P(n,n)(n − r)!
=n!
(n − r )!
g. The first formula given in the mathematics note matches the formula described in Part b of the discussion. The second formula matches the one described in Part f of the discussion. The two are equivalent, as shown below:
n!(n − r)!
=n(n −1)(n − 2)! (n − r + 1)(n − r)(n − r −1)!(3)(2)(1)
(n − r )(n − r −1)!(3)(2)(1)= n(n −1)(n − 2)!(n − r + 1)
h. Sample response: P(10, 3) =10 • 9 • 8
P(10, 3) = 10!(10 − 3)!
=10 • 9 • 8 • 7 • 6 • 5 • 4 • 3 • 2 • 1
7 • 6 • 5• 4 • 3• 2 •1
i. Sample response: Using one of the formulas in the mathematics note:
P(n, n) = n!(n − n)!
=n!0!
Given that nPn = n!, 0! must be defined as 1 if the formula is to hold true when r = n .
Assignment (page 95) 2.1 a. P(8, 3) = 336
b. P(8, 4) = 1680
c. P(8, 7) = 40, 320
d. P(8,8) = 40, 320
119
2.2 a. 12!8!
or 12!(12 − 4)!
b. 8!5!
or 8!(8 − 3)!
c. 8!1!
or 8!
*2.3 a. P(5, 5) = 5! = 120
b. P(8, 5)= 6720
2.4 P(8,8) = 40, 320
* * * * * 2.5 a. There are P(12, 9) = 79, 833,600 possible lineups.
b. The first 8 positions in the lineups must be filled using 11 possible candidates. Thus, there are P(11,8) = 6, 652, 800 different lineups with the child in question batting ninth.
c. The probability is: 6, 652,80079, 833,600
≈ 0.0833
2.6 a. There are P(10, 2) or 90 possible rankings.
b. P(10, r )
c. The number of possible responses if a person visits exactly 1 location is P(10,1) . If a person visits exactly 2 locations, the number of possible responses is P(10, 2) . In general, there are P(10, r ) possible responses if a person visits exactly r locations. Thus, the total number of possible responses for the survey is P(10,1) + P(10, 2) +!+ P(10, 9) + P(10,10) or 9,864,100.
2.7 a. P(550, 3) = 550 • 549 • 548 = 165, 468,600
b. 1. The probability is 1 550 , or approximately 0.0018.
2. The probability is: 1550
+1549
+1548
=452,101
82, 734, 300≈ 0.0546
* * * * * * * * * *
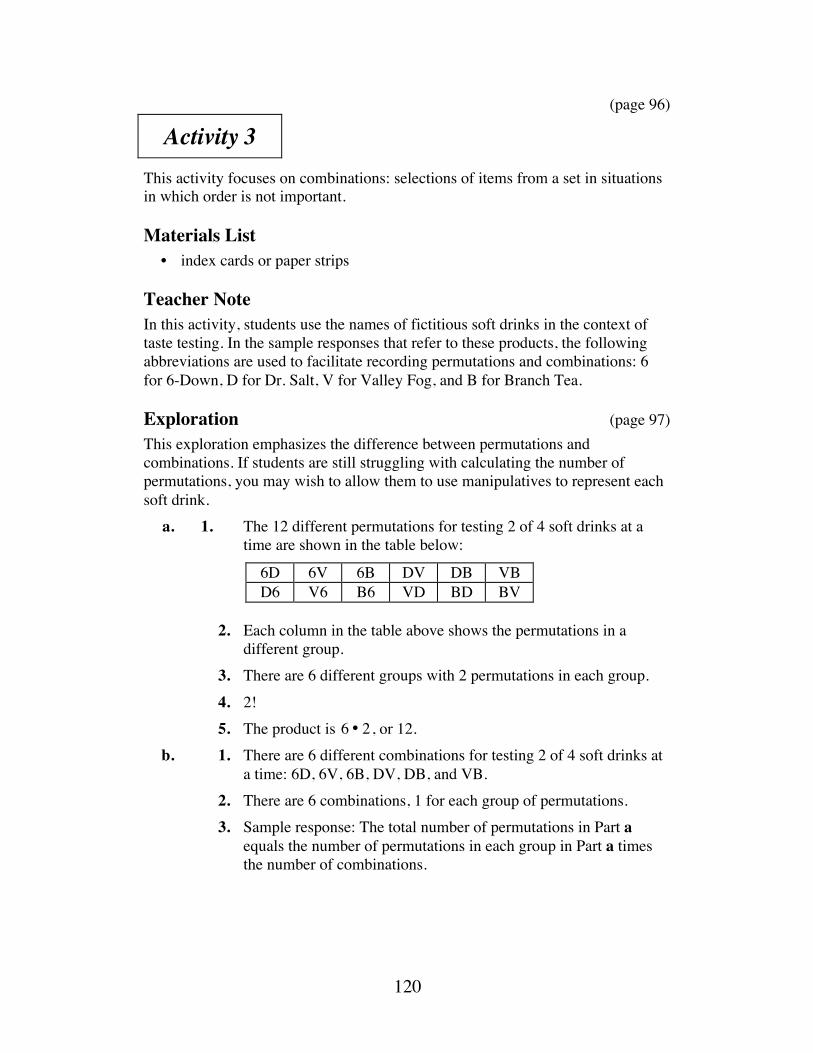
120
(page 96)
Activity 3 This activity focuses on combinations: selections of items from a set in situations in which order is not important.
Materials List • index cards or paper strips
Teacher Note In this activity, students use the names of fictitious soft drinks in the context of taste testing. In the sample responses that refer to these products, the following abbreviations are used to facilitate recording permutations and combinations: 6 for 6-Down, D for Dr. Salt, V for Valley Fog, and B for Branch Tea.
Exploration (page 97) This exploration emphasizes the difference between permutations and combinations. If students are still struggling with calculating the number of permutations, you may wish to allow them to use manipulatives to represent each soft drink. a. 1. The 12 different permutations for testing 2 of 4 soft drinks at a
time are shown in the table below:
6D 6V 6B DV DB VB D6 V6 B6 VD BD BV
2. Each column in the table above shows the permutations in a
different group. 3. There are 6 different groups with 2 permutations in each group. 4. 2! 5. The product is 6 • 2 , or 12. b. 1. There are 6 different combinations for testing 2 of 4 soft drinks at
a time: 6D, 6V, 6B, DV, DB, and VB. 2. There are 6 combinations, 1 for each group of permutations. 3. Sample response: The total number of permutations in Part a
equals the number of permutations in each group in Part a times the number of combinations.
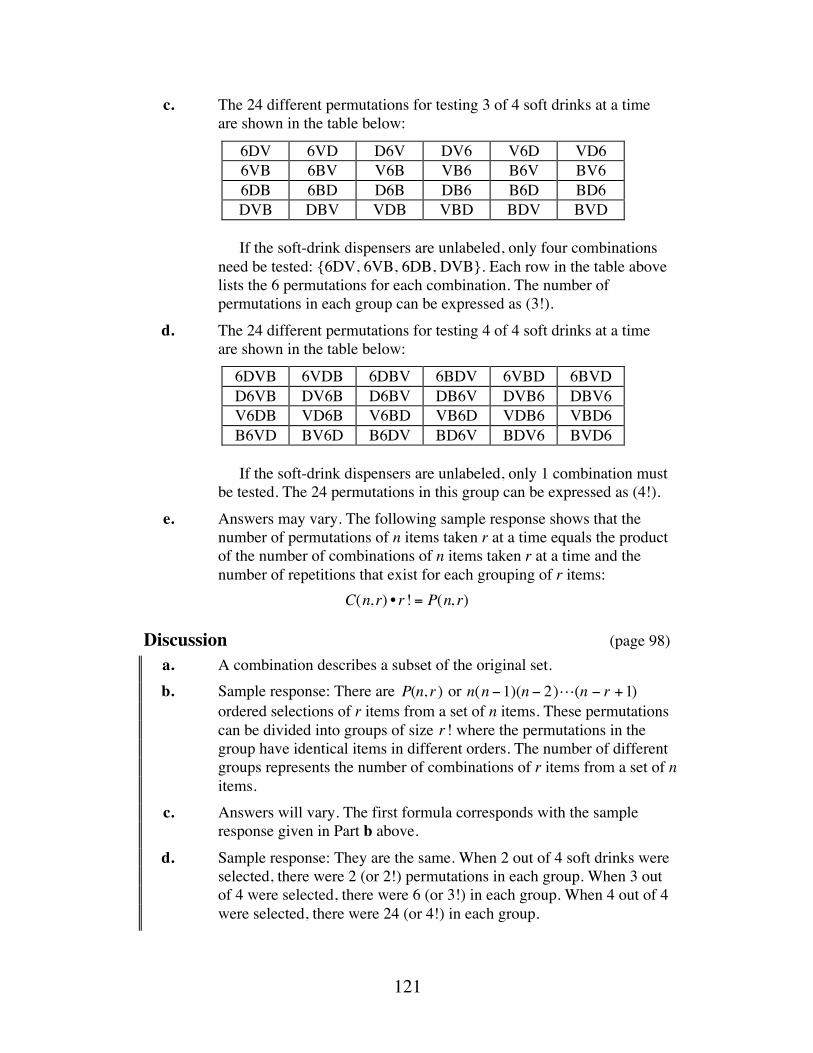
121
c. The 24 different permutations for testing 3 of 4 soft drinks at a time are shown in the table below:
6DV 6VD D6V DV6 V6D VD6 6VB 6BV V6B VB6 B6V BV6 6DB 6BD D6B DB6 B6D BD6 DVB DBV VDB VBD BDV BVD
If the soft-drink dispensers are unlabeled, only four combinations
need be tested: {6DV, 6VB, 6DB, DVB}. Each row in the table above lists the 6 permutations for each combination. The number of permutations in each group can be expressed as (3!).
d. The 24 different permutations for testing 4 of 4 soft drinks at a time are shown in the table below:
6DVB 6VDB 6DBV 6BDV 6VBD 6BVD D6VB DV6B D6BV DB6V DVB6 DBV6 V6DB VD6B V6BD VB6D VDB6 VBD6 B6VD BV6D B6DV BD6V BDV6 BVD6
If the soft-drink dispensers are unlabeled, only 1 combination must
be tested. The 24 permutations in this group can be expressed as (4!). e. Answers may vary. The following sample response shows that the
number of permutations of n items taken r at a time equals the product of the number of combinations of n items taken r at a time and the number of repetitions that exist for each grouping of r items:
C(n, r) • r ! = P(n, r)
Discussion (page 98) a. A combination describes a subset of the original set. b. Sample response: There are P(n, r ) or n(n −1)(n − 2)!(n − r +1)
ordered selections of r items from a set of n items. These permutations can be divided into groups of size r ! where the permutations in the group have identical items in different orders. The number of different groups represents the number of combinations of r items from a set of n items.
c. Answers will vary. The first formula corresponds with the sample response given in Part b above.
d. Sample response: They are the same. When 2 out of 4 soft drinks were selected, there were 2 (or 2!) permutations in each group. When 3 out of 4 were selected, there were 6 (or 3!) in each group. When 4 out of 4 were selected, there were 24 (or 4!) in each group.
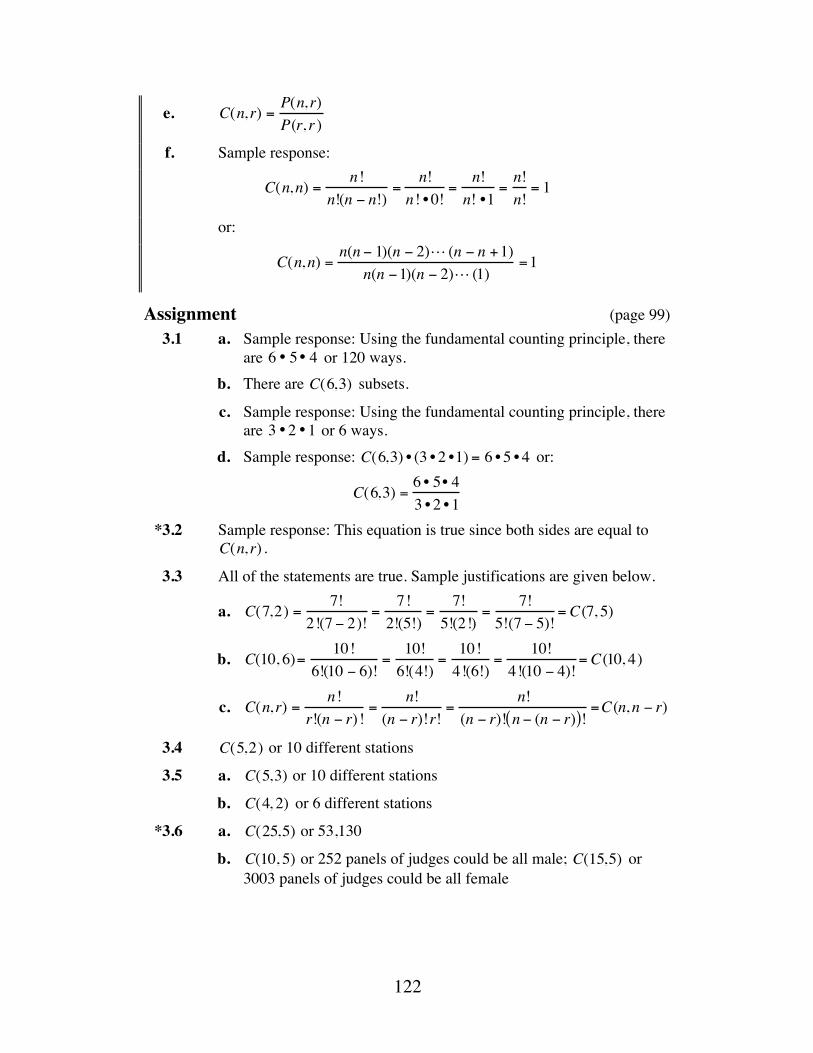
122
e. C(n, r) =P(n, r)P(r, r )
f. Sample response:
C(n,n) =n!
n!(n − n!)=
n!n! • 0!
=n!n! •1
=n!n!= 1
or:
C(n,n) =
n(n − 1)(n − 2)! (n − n +1)n(n −1)(n − 2)! (1)
=1
Assignment (page 99) 3.1 a. Sample response: Using the fundamental counting principle, there
are 6 • 5• 4 or 120 ways. b. There are C(6,3) subsets.
c. Sample response: Using the fundamental counting principle, there are 3 •2 •1 or 6 ways.
d. Sample response: C(6,3) • (3 • 2 •1) = 6 • 5 • 4 or:
C(6,3) = 6 • 5• 43 • 2 • 1
*3.2 Sample response: This equation is true since both sides are equal to C(n, r) .
3.3 All of the statements are true. Sample justifications are given below.
a. C(7,2) = 7!2!(7 − 2)!
=7!2!(5!)
=7!
5!(2!)=
7!5!(7 − 5)!
= C(7, 5)
b. C(10, 6)= 10!6!(10 − 6)!
=10!6!(4!)
=10!4!(6!)
=10!
4!(10 − 4)!= C(10, 4)
c. C(n, r) = n!r!(n − r)!
=n!
(n − r)!r!=
n!(n − r)! n − (n − r)( )!
=C(n,n − r)
3.4 C(5,2) or 10 different stations
3.5 a. C(5,3) or 10 different stations
b. C(4, 2) or 6 different stations
*3.6 a. C(25,5) or 53,130
b. C(10, 5) or 252 panels of judges could be all male; C(15,5) or 3003 panels of judges could be all female
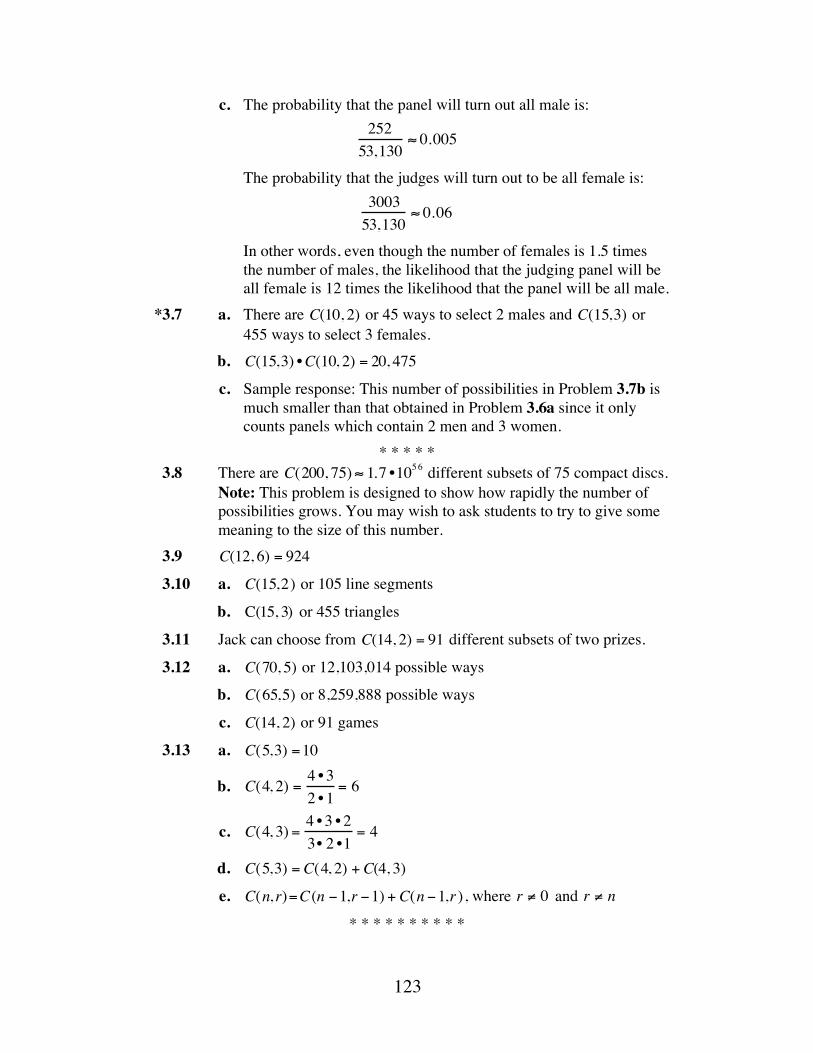
123
c. The probability that the panel will turn out all male is: 25253,130
≈ 0.005
The probability that the judges will turn out to be all female is: 300353,130
≈ 0.06
In other words, even though the number of females is 1.5 times the number of males, the likelihood that the judging panel will be all female is 12 times the likelihood that the panel will be all male.
*3.7 a. There are C(10, 2) or 45 ways to select 2 males and C(15,3) or 455 ways to select 3 females.
b. C(15,3) •C(10, 2) = 20, 475
c. Sample response: This number of possibilities in Problem 3.7b is much smaller than that obtained in Problem 3.6a since it only counts panels which contain 2 men and 3 women.
* * * * * 3.8 There are C(200, 75) ≈ 1.7 •1056 different subsets of 75 compact discs.
Note: This problem is designed to show how rapidly the number of possibilities grows. You may wish to ask students to try to give some meaning to the size of this number.
3.9 C(12, 6) = 924
3.10 a. C(15,2) or 105 line segments
b. C(15, 3) or 455 triangles
3.11 Jack can choose from C(14, 2) = 91 different subsets of two prizes.
3.12 a. C(70, 5) or 12,103,014 possible ways
b. C(65,5) or 8,259,888 possible ways
c. C(14, 2) or 91 games
3.13 a. C(5,3) =10
b. C(4, 2) = 4 • 32 • 1
= 6
c. C(4, 3) = 4 • 3 • 23• 2 •1
= 4
d. C(5,3) = C(4, 2) + C(4, 3)
e. C(n, r)=C(n −1,r −1) + C(n −1,r ), where r ≠ 0 and r ≠ n
* * * * * * * * * *
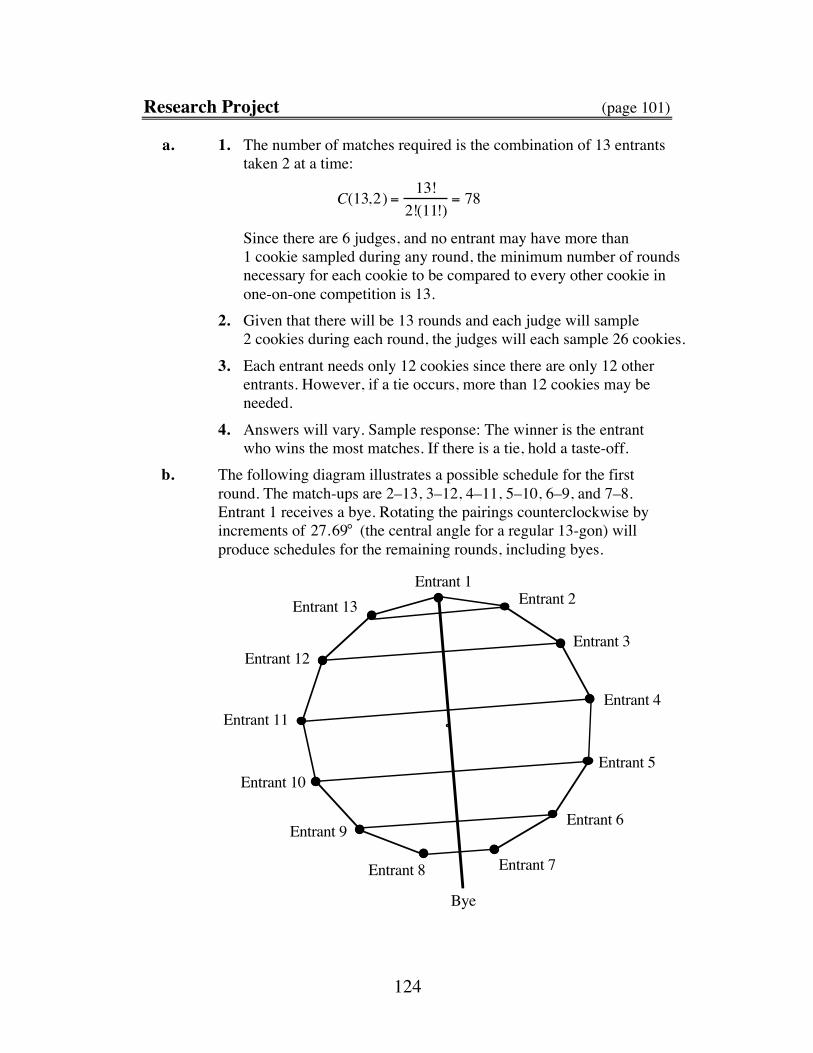
124
Research Project (page 101) a. 1. The number of matches required is the combination of 13 entrants
taken 2 at a time:
C(13,2) = 13!2!(11!)
= 78
Since there are 6 judges, and no entrant may have more than 1 cookie sampled during any round, the minimum number of rounds necessary for each cookie to be compared to every other cookie in one-on-one competition is 13.
2. Given that there will be 13 rounds and each judge will sample 2 cookies during each round, the judges will each sample 26 cookies.
3. Each entrant needs only 12 cookies since there are only 12 other entrants. However, if a tie occurs, more than 12 cookies may be needed.
4. Answers will vary. Sample response: The winner is the entrant who wins the most matches. If there is a tie, hold a taste-off.
b. The following diagram illustrates a possible schedule for the first round. The match-ups are 2–13, 3–12, 4–11, 5–10, 6–9, and 7–8. Entrant 1 receives a bye. Rotating the pairings counterclockwise by increments of 27.69° (the central angle for a regular 13-gon) will produce schedules for the remaining rounds, including byes.
Entrant 1Entrant 2
Entrant 3
Entrant 4
Entrant 5
Entrant 6
Entrant 7Entrant 8
Entrant 9
Entrant 10
Entrant 11
Entrant 12
Entrant 13
Bye
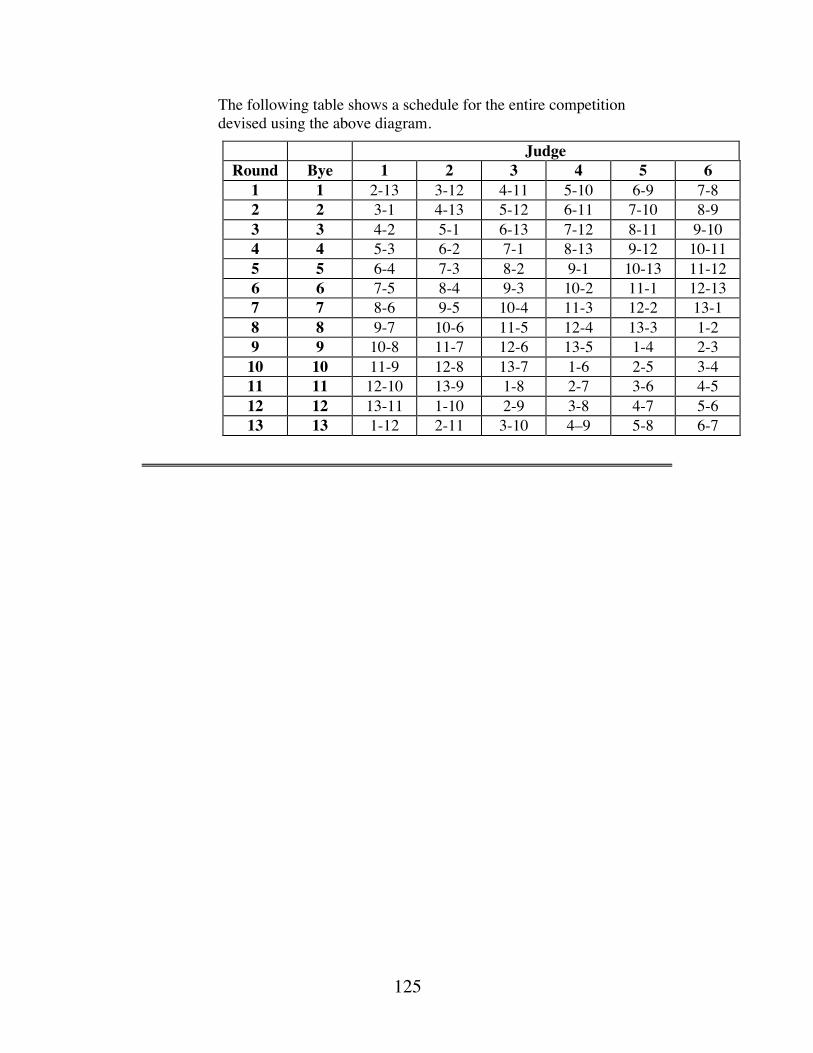
125
The following table shows a schedule for the entire competition devised using the above diagram.
Judge Round Bye 1 2 3 4 5 6
1 1 2-13 3-12 4-11 5-10 6-9 7-8 2 2 3-1 4-13 5-12 6-11 7-10 8-9 3 3 4-2 5-1 6-13 7-12 8-11 9-10 4 4 5-3 6-2 7-1 8-13 9-12 10-11 5 5 6-4 7-3 8-2 9-1 10-13 11-12 6 6 7-5 8-4 9-3 10-2 11-1 12-13 7 7 8-6 9-5 10-4 11-3 12-2 13-1 8 8 9-7 10-6 11-5 12-4 13-3 1-2 9 9 10-8 11-7 12-6 13-5 1-4 2-3 10 10 11-9 12-8 13-7 1-6 2-5 3-4 11 11 12-10 13-9 1-8 2-7 3-6 4-5 12 12 13-11 1-10 2-9 3-8 4-7 5-6 13 13 1-12 2-11 3-10 4–9 5-8 6-7
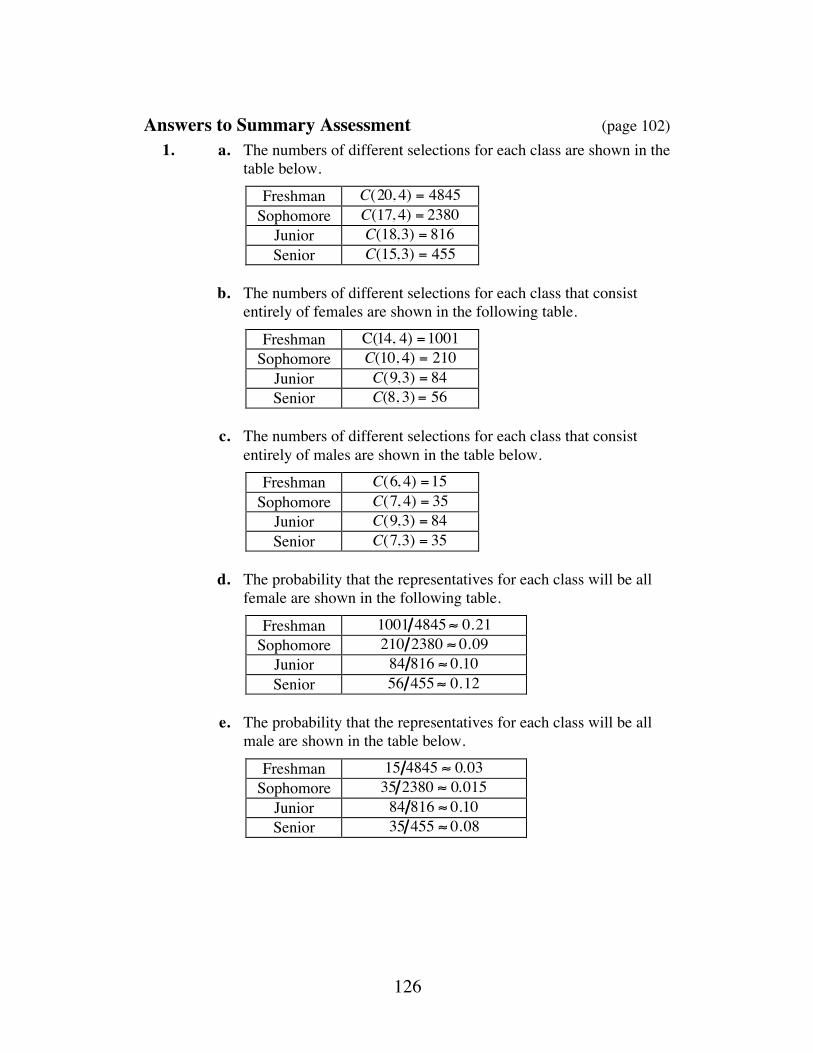
126
Answers to Summary Assessment (page 102) 1. a. The numbers of different selections for each class are shown in the
table below.
Freshman C(20, 4) = 4845 Sophomore C(17, 4) = 2380
Junior C(18,3) = 816 Senior C(15,3) = 455
b. The numbers of different selections for each class that consist
entirely of females are shown in the following table.
Freshman C(14, 4) =1001 Sophomore C(10, 4) = 210
Junior C(9,3) = 84 Senior C(8, 3) = 56
c. The numbers of different selections for each class that consist
entirely of males are shown in the table below.
Freshman C(6, 4) =15 Sophomore C(7, 4) = 35
Junior C(9,3) = 84 Senior C(7,3) = 35
d. The probability that the representatives for each class will be all
female are shown in the following table.
Freshman 1001 4845 ≈ 0.21 Sophomore 210 2380 ≈ 0.09
Junior 84 816 ≈ 0.10 Senior 56 455 ≈ 0.12
e. The probability that the representatives for each class will be all
male are shown in the table below.
Freshman 15 4845 ≈ 0.03 Sophomore 35 2380 ≈ 0.015
Junior 84 816 ≈ 0.10 Senior 35 455 ≈ 0.08
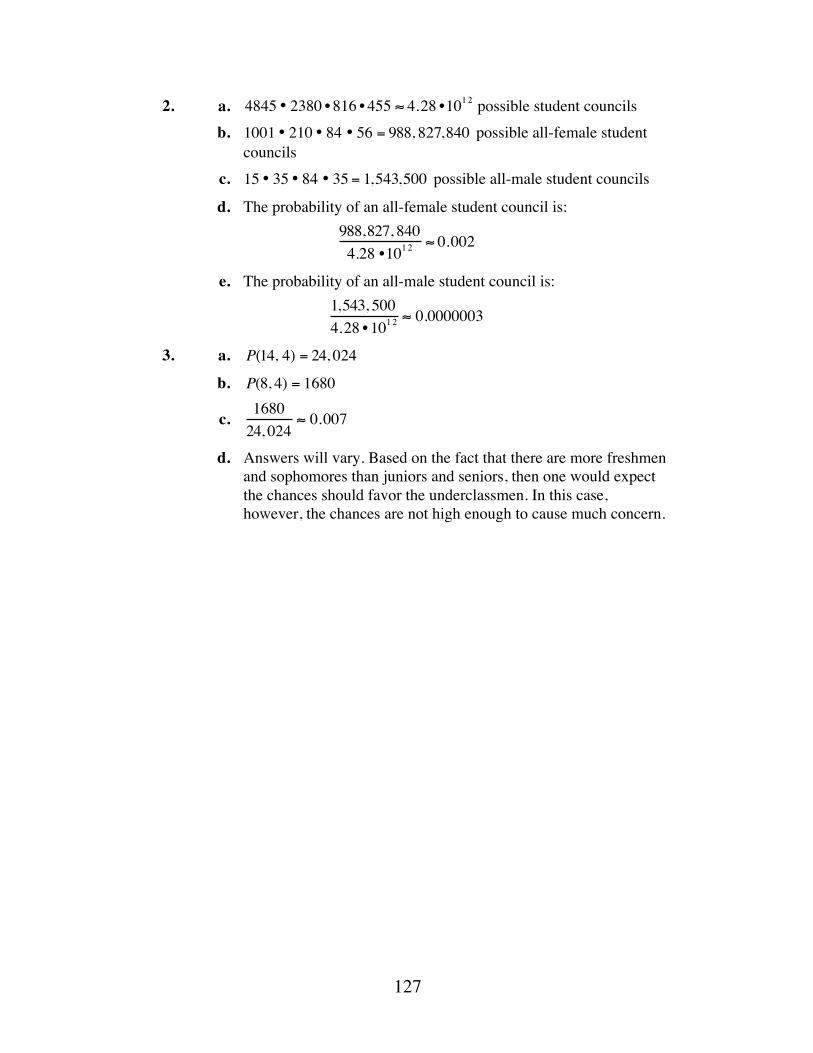
127
2. a. 4845 • 2380 • 816 • 455 ≈ 4.28 •1012 possible student councils b. 1001 • 210 • 84 • 56 = 988, 827,840 possible all-female student
councils c. 15 • 35 • 84 • 35 = 1,543,500 possible all-male student councils
d. The probability of an all-female student council is: 988,827, 8404.28 •1012
≈ 0.002
e. The probability of an all-male student council is: 1,543, 5004.28 • 1012
≈ 0.0000003
3. a. P(14, 4) = 24, 024
b. P(8, 4) = 1680
c. 168024, 024
≈ 0.007
d. Answers will vary. Based on the fact that there are more freshmen and sophomores than juniors and seniors, then one would expect the chances should favor the underclassmen. In this case, however, the chances are not high enough to cause much concern.
128
Module Assessment
1. Ms. Paladin gave her math class a quiz that contained 5 true/false
problems. One student who answered all the questions correctly claimed she had guessed the answers without reading the problems.
a. In how many different ways could the student have answered the 5 problems?
b. What is the probability of guessing the correct answers to all of the problems?
2. The local student council consists of 6 seniors, 6 juniors, 5 sophomores, and 4 freshmen.
a. The council plans to form a committee of 4 students to study school dress codes. In how many ways can a group of 4 students from the council be selected for the committee?
b. In how many ways can the committee be chosen so that 1 member is selected from each class?
c. What is the probability that a randomly chosen group of 4 students will contain 1 member from each class?
3. In five-card poker, a hand that contains the 10, jack, queen, king, and ace of the same suit is called a royal flush. Since there are four suits in an ordinary deck of 52 playing cards, there are four possible royal flushes.
a. If 5 cards are dealt from an ordinary deck of 52, how many different hands can occur?
b. If 5 cards are dealt from the deck, what is the probability of getting a royal flush?
c. If a joker is added to the deck, how many different five-card hands can occur?
d. In some card games, a joker represents a wild card. In other words, it can represent any other card in the deck. How many different royal flushes are possible in a deck with one joker?
e. What is the probability of getting a royal flush if 5 cards are dealt from the deck with one joker?
129
4. The four members of a relay team agree to run in the order that their names are drawn from a hat.
a. How many different orders are possible for the relay? b. If the coach insists that the fastest member of the team run first,
then how many different orders are possible? 5. A total of 75 tickets have been sold for the school raffle. Imagine that
you hold 5 of those tickets. a. What is the probability that you will win first prize? b. What is the probability that you will win the first and second prizes?
Hint: Calculate how many ways you could fill the first and second positions from the set of 75 tickets. Then calculate how many ways you could fill the first and second positions from the 5 tickets you hold.
c. What is the probability that you will win the first, second, and third prizes?
d. What is the probability that you will not win any of the first three prizes?
130
Answers to Module Assessment 1. a. Since there are 2 ways to answer each of the 5 questions, then
there are 2 • 2 • 2 • 2 • 2, or 32, possible outcomes. b. 1 32 ≈ 0.031
2. a. There are C(21,4) = 5985 ways to choose the committee.
b. By the fundamental counting principle, there are 6 • 6 • 5 • 4, or 720, different ways of choosing 1 member from each class.
c. 720 5985 ≈ 0.12
3. a. C(52, 5) = 2, 598,960
b. 4 2, 598,960 = 0.0000015
c. C(53,5) = 2, 869, 685
d. Sample response: Since you would need 4 of the cards from the royal flush to go with the joker, there are C(5,4) or 5 possible royal flushes for each suit. Since there are 4 suits, there are 20 possible royal flushes.
e. 20 2,869, 685 ≈ 0.000007
4. a. P(4, 4) or 4! or 24
b. P(3, 3) or 3! or 6
5. a. P(5,1)P(75,1)
=575
≈ 0.067
b. P(5, 2)P(75,2)
=205550
≈ 0.0036
c. P(5, 3)P(75,3)
=60
405,150≈ 0.00015
d. 1 − P(5, 3)P(75, 3)
≈ 1− 0.00015 = 0.99985

131
Selected References Johnson, J. “Using Dominoes to Introduce Combinatorial Reasoning.” In Discrete
Mathematics across the Curriculum: K–12. Ed. by M. J. Kenney. Reston, VA: National Council of Teachers of Mathematics, 1991.
Evered, L., and B. Schroeder. “Counting with Generating Functions.” In Discrete Mathematics across the Curriculum: K–12. Ed. by M. J. Kenney. Reston, VA: National Council of Teachers of Mathematics, 1991.
132
Flashbacks
Activity 1 1.1 a. How many different outfits can be formed from 2 pairs of shorts
and 3 shirts? b. Draw a tree diagram to illustrate your response to Part a. 1.2 How many different 3-character terms can be formed if the first and
third characters are numerals from 0 through 9 and the second character is a letter from the English alphabet?
1.3 Expand and evaluate (7!). 1.4 Evaluate each of the following: a. 7! b. 10! 1.5 Determine the probability of selecting each of the following from an
ordinary deck of 52 playing cards: a. the king of hearts b. a queen c. a club
Activity 2 2.1 Substitute each of the values in Parts a–c for n in the following
expression, then simplify. n(n − 4)n −1
a. 10 b. 3 c. –5 2.2 Evaluate each of the following expressions: a. 5! 0! b. 14! 13! c. 15! (15 − 6)! d. 8! (8 − 8)! 2.3 Simplify the expression n! (n −1)! by first expanding the numerator
and the denominator.
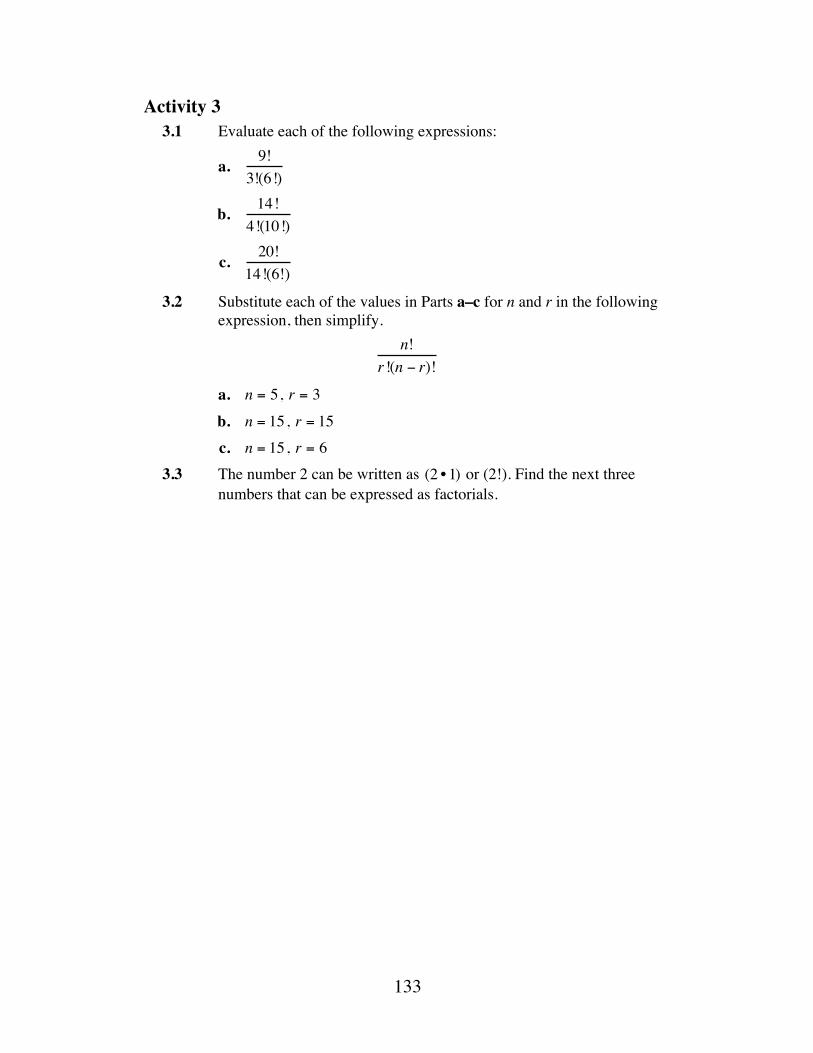
133
Activity 3 3.1 Evaluate each of the following expressions:
a. 9!3!(6!)
b. 14!4!(10!)
c. 20!14!(6!)
3.2 Substitute each of the values in Parts a–c for n and r in the following expression, then simplify.
n!r !(n − r)!
a. n = 5, r = 3 b. n = 15 , r = 15 c. n = 15 , r = 6 3.3 The number 2 can be written as (2 • 1) or (2!). Find the next three
numbers that can be expressed as factorials.
134
Answers to Flashbacks
Activity 1 1.1 a. There are 2 • 3 or 6 different outfits. b. Sample diagram
1.2 There are 10 • 26 •10 or 2600 different terms. 1.3 7! = 7 • 6 • 5 • 4 • 3• 2 •1 = 5040 1.4 a. 5040 b. 3,628,800 1.5 a. 1 52 or approximately 0.019
b. 4 52 or approximately 0.077
c. 13 52 or 0.25
Activity 2
2.1 a. 10(10 − 4)10 −1
=203
b. 3(3 − 4)3 −1
= −32
c. −5(−5 − 4)−5 −1
= −152
shorts 1
shorts 2
shirt 1
shirt 2
shirt 3
shirt 1
shirt 2
shirt 3
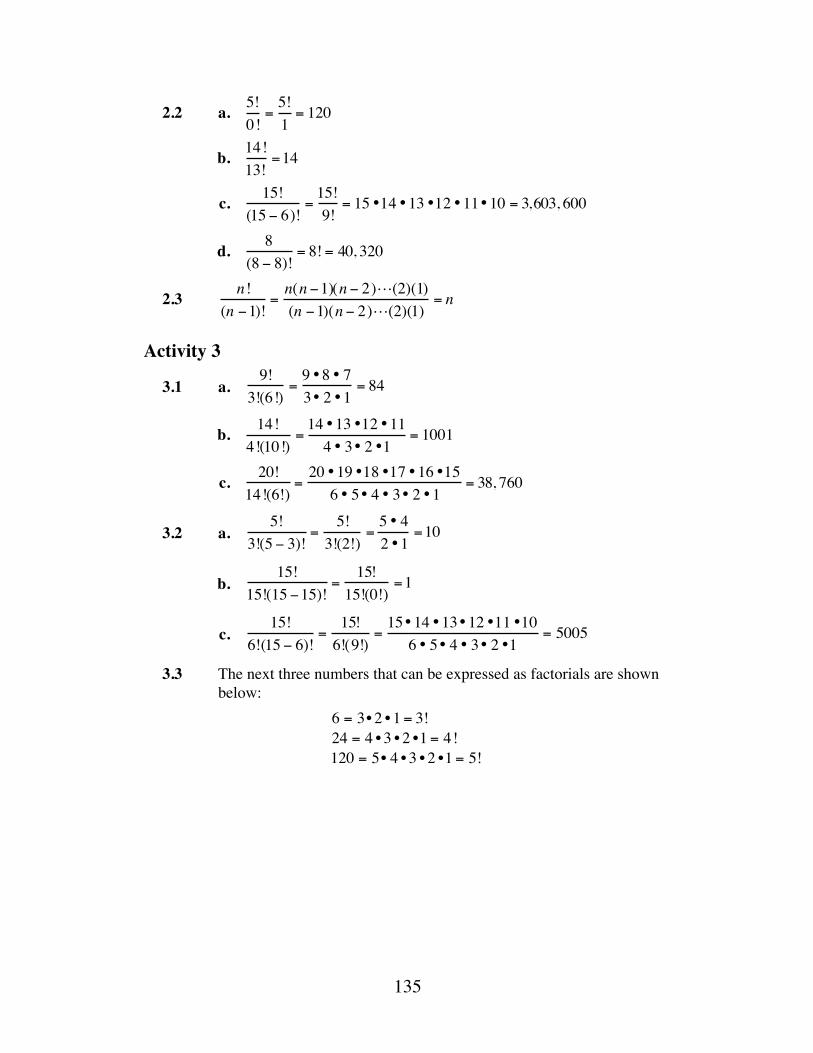
135
2.2 a. 5!0!=5!1= 120
b. 14!13!
=14
c. 15!(15 − 6)!
=15!9!
= 15 •14 •13 •12 •11•10 = 3,603, 600
d. 8(8 − 8)!
= 8! = 40, 320
2.3
n!(n −1)!
=n(n −1)(n − 2)!(2)(1)(n −1)(n − 2)!(2)(1)
= n
Activity 3
3.1 a. 9!
3!(6!)=9 •8 • 73• 2 •1
= 84
b. 14!4!(10!)
=14 •13 •12 •114 • 3• 2 •1
= 1001
c. 20!14!(6!)
=20 •19 •18 •17 •16 •156 • 5• 4 • 3• 2 •1
= 38, 760
3.2 a. 5!
3!(5 − 3)!=
5!3!(2!)
=5 • 42 •1
=10
b. 15!
15!(15 −15)!=
15!15!(0!)
=1
c. 15!
6!(15 − 6)!=15!6!(9!)
=15•14 •13•12 •11 •106 • 5• 4 • 3• 2 •1
= 5005
3.3 The next three numbers that can be expressed as factorials are shown below:
6 = 3• 2 • 1 = 3!24 = 4 • 3 • 2 •1 = 4!120 = 5• 4 • 3 • 2 •1 = 5!


Classical Crystals
What do diamonds, quartz, and salt all have in common? In this module, you’ll explore the properties of some familiar crystals.
Paul Swenson • Teri Willard
139
Teacher Edition Classical Crystals
Overview This module introduces students to the classical solids. As some of these shapes occur in nature as crystals, students use crystals to explore three-dimensional symmetry and other characteristics of the classical solids.
Objectives In this module, students will: • develop spatial visualization skills • discover the symmetrical properties of regular polygons • design nets for and build models of some Platonic solids • examine a relationship among the edges, faces, and vertices of polyhedra.
Prerequisites For this module, students should know: • how to measure angles with a protractor and a geometry utility • the law of sines • how to determine the area of regular polygons • how to construct polygons using a geometry utility.
Time Line Activity 1 2 3 4 Summary
Assessment Total
Days 2 2 3 2 2 11

140
Materials Required Materials Activity
1 2 3 4 Summary Assessment
ruler X X X X X protractor X X X X X scissors X X X X
tape X X X X mirrors X X
toothpicks X miniature marshmallows X
stiff paper X X X X template A X X template B X template C
Teacher Note In Activity 1, students use toothpicks and miniature marshmallows to build model polyhedra. Modeling clay, gum drops, or raisins also will work. Blackline masters of the templates appear at the end of the teacher edition for this module.
Technology Software Activity
1 2 3 4 Summary Assessment
geometry utility X X X X X
141
Teacher Edition Classical Crystals
Introduction (page 109) You may wish to borrow books on minerals or gemstones from your school library for use as classroom resources. An earth science teacher may be able to provide actual samples of crystals for display. (page 110)
Activity 1 This activity introduces polyhedra as three-dimensional solids and explores the special cases of polyhedra known as the Platonic solids. Students build models of a regular tetrahedron, a regular hexahedron (cube), and a regular octahedron. Note: Students should save all models they build for use later in the module.
Materials • toothpicks (about 40 per student) • miniature marshmallows, gum drops, raisins, or modeling clay (about
25 pieces per student) • stiff paper (two sheets per student) • tape • scissors (one pair per group) • rulers (one per group) • protractors (one per group) • mirrors (for use in Problem 1.5; one per group)
Technology • geometry utility (optional)
Exploration Students build three Platonic solids and explore their characteristics. a. Students build three Platonic solids. b. Explore their characteristics.
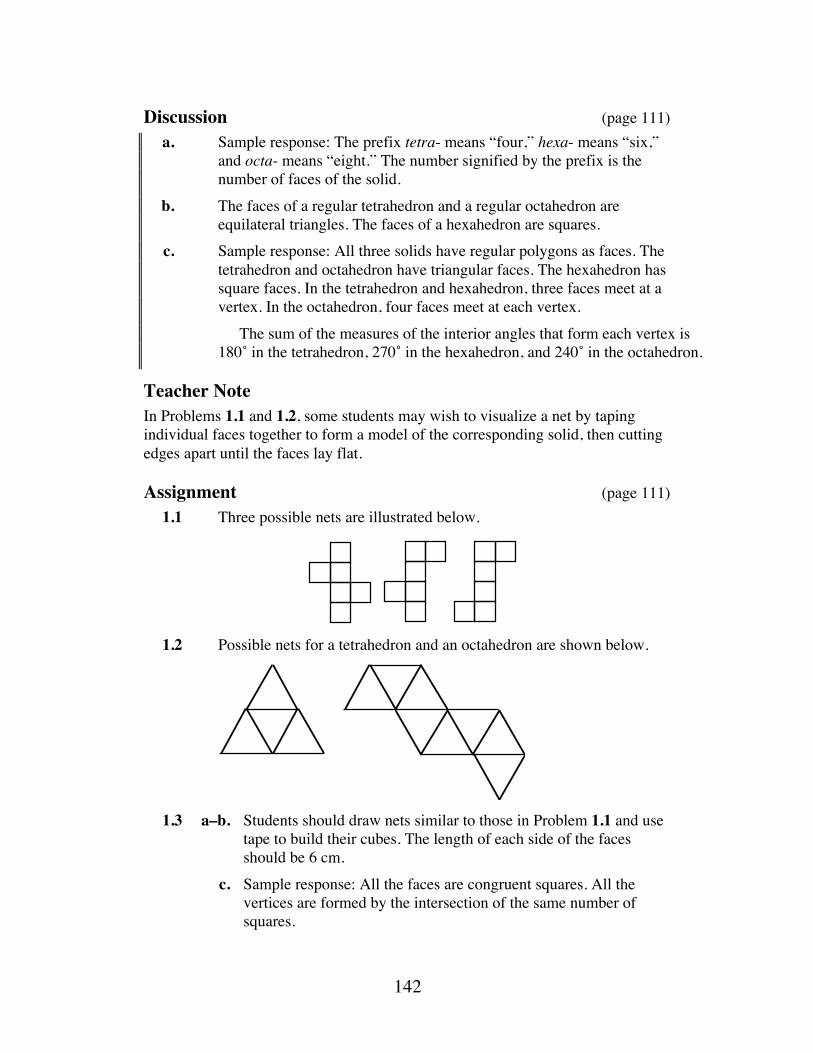
142
Discussion (page 111) a. Sample response: The prefix tetra- means “four,” hexa- means “six,”
and octa- means “eight.” The number signified by the prefix is the number of faces of the solid.
b. The faces of a regular tetrahedron and a regular octahedron are equilateral triangles. The faces of a hexahedron are squares.
c. Sample response: All three solids have regular polygons as faces. The tetrahedron and octahedron have triangular faces. The hexahedron has square faces. In the tetrahedron and hexahedron, three faces meet at a vertex. In the octahedron, four faces meet at each vertex.
The sum of the measures of the interior angles that form each vertex is 180˚ in the tetrahedron, 270˚ in the hexahedron, and 240˚ in the octahedron.
Teacher Note In Problems 1.1 and 1.2, some students may wish to visualize a net by taping individual faces together to form a model of the corresponding solid, then cutting edges apart until the faces lay flat.
Assignment (page 111) 1.1 Three possible nets are illustrated below.
1.2 Possible nets for a tetrahedron and an octahedron are shown below.
1.3 a–b. Students should draw nets similar to those in Problem 1.1 and use
tape to build their cubes. The length of each side of the faces should be 6 cm.
c. Sample response: All the faces are congruent squares. All the vertices are formed by the intersection of the same number of squares.
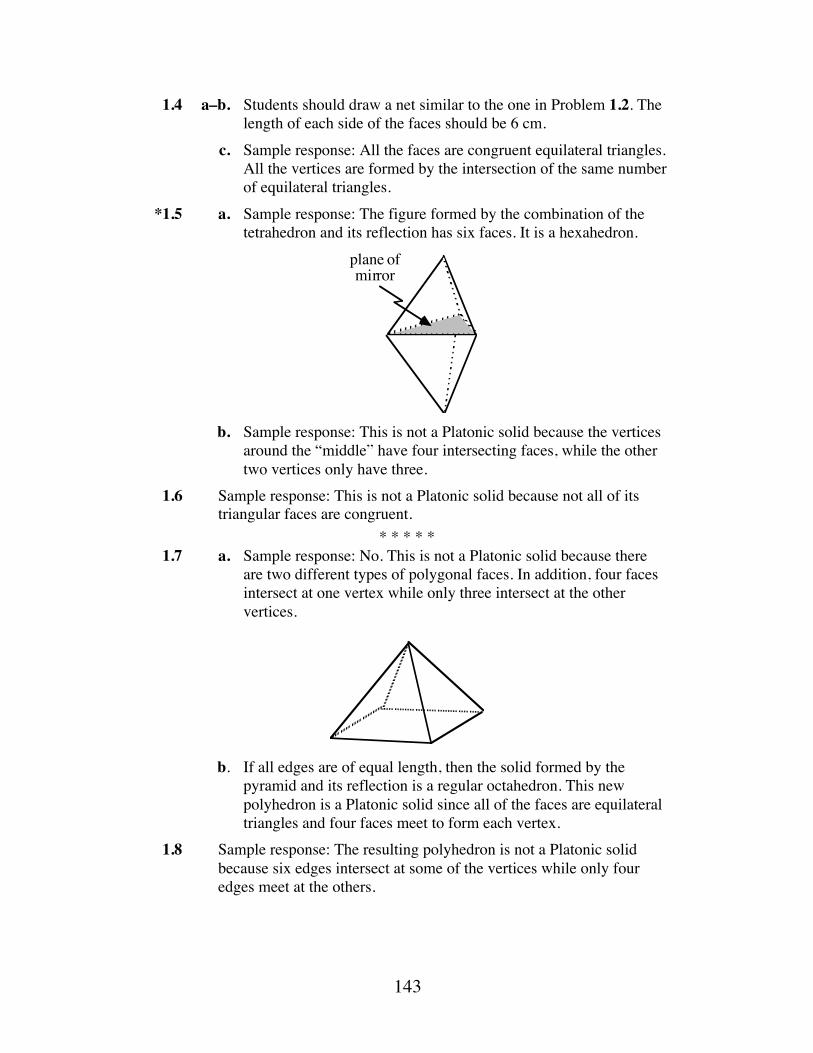
143
1.4 a–b. Students should draw a net similar to the one in Problem 1.2. The length of each side of the faces should be 6 cm.
c. Sample response: All the faces are congruent equilateral triangles. All the vertices are formed by the intersection of the same number of equilateral triangles.
*1.5 a. Sample response: The figure formed by the combination of the tetrahedron and its reflection has six faces. It is a hexahedron.
b. Sample response: This is not a Platonic solid because the vertices
around the “middle” have four intersecting faces, while the other two vertices only have three.
1.6 Sample response: This is not a Platonic solid because not all of its triangular faces are congruent.
* * * * * 1.7 a. Sample response: No. This is not a Platonic solid because there
are two different types of polygonal faces. In addition, four faces intersect at one vertex while only three intersect at the other vertices.
b. If all edges are of equal length, then the solid formed by the
pyramid and its reflection is a regular octahedron. This new polyhedron is a Platonic solid since all of the faces are equilateral triangles and four faces meet to form each vertex.
1.8 Sample response: The resulting polyhedron is not a Platonic solid because six edges intersect at some of the vertices while only four edges meet at the others.
plane ofmirror
144
1.9 a. The area of each face is 10 •10 or 100 cm2 . Since there are 6 congruent faces, the surface area of a cube with edge length 10 cm is 6 •100 = 600 cm2 .
b. Sample response: Since all of the faces of a Platonic solid are congruent, its surface area can be determined by finding the area of one face, then multiplying by the number of faces.
* * * * * * * * * * (page 113)
Activity 2 In this activity, students discover why there are only five Platonic solids.
Materials List • stiff paper (several sheets per student) • tape • scissors (one pair per group) • protractors (one per group) • template A (optional) • template B (for Problem 2.3; one per student) • template C (optional)
Technology • geometry utility (optional)
Teacher Note Both the exploration and the assignment work well in groups. Blackline masters of the templates appear at the end of the teacher edition for this module.
Exploration (page 113) Students use regular polygons to attempt to form vertices of polyhedrons. Note: Template A provides samples of the four regular polygons used in the exploration. a–b. Students cut out six equilateral triangles. The measure of each interior
angle is 60˚. c. The sum of the measures of the two angles is 120˚.
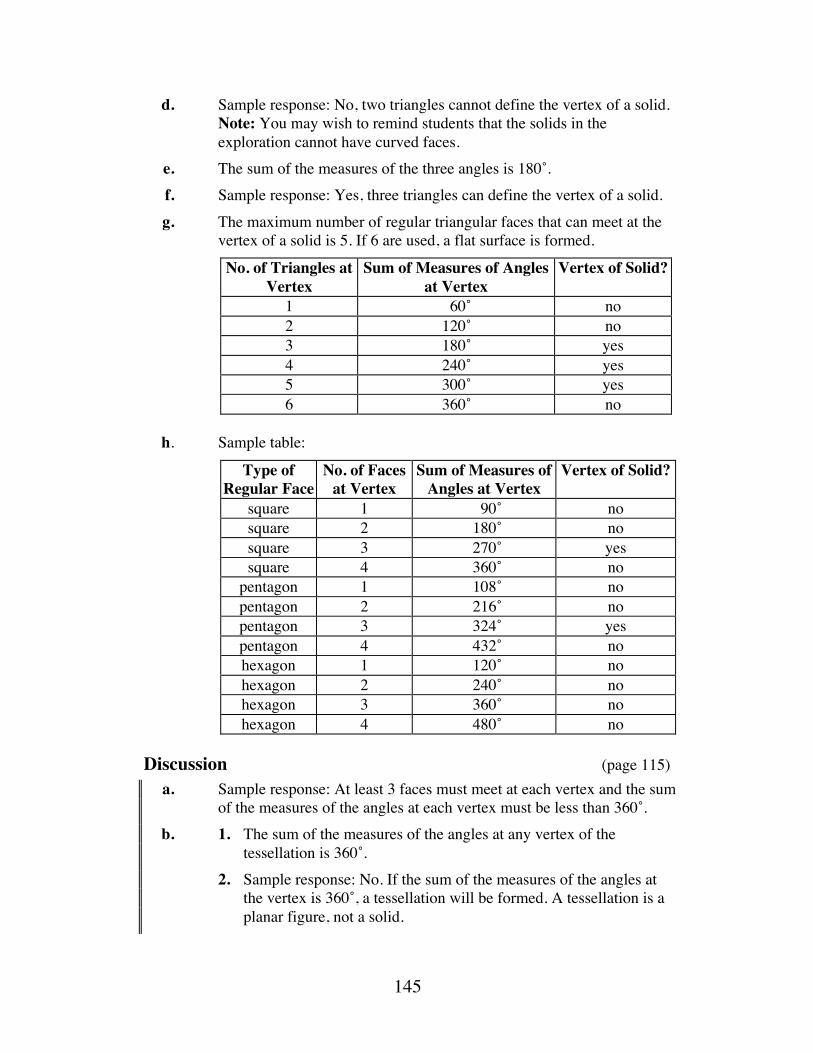
145
d. Sample response: No, two triangles cannot define the vertex of a solid. Note: You may wish to remind students that the solids in the exploration cannot have curved faces.
e. The sum of the measures of the three angles is 180˚. f. Sample response: Yes, three triangles can define the vertex of a solid. g. The maximum number of regular triangular faces that can meet at the
vertex of a solid is 5. If 6 are used, a flat surface is formed.
No. of Triangles at Vertex
Sum of Measures of Angles at Vertex
Vertex of Solid?
1 60˚ no 2 120˚ no 3 180˚ yes 4 240˚ yes 5 300˚ yes 6 360˚ no
h. Sample table:
Type of Regular Face
No. of Faces at Vertex
Sum of Measures of Angles at Vertex
Vertex of Solid?
square 1 90˚ no square 2 180˚ no square 3 270˚ yes square 4 360˚ no
pentagon 1 108˚ no pentagon 2 216˚ no pentagon 3 324˚ yes pentagon 4 432˚ no hexagon 1 120˚ no hexagon 2 240˚ no hexagon 3 360˚ no hexagon 4 480˚ no
Discussion (page 115) a. Sample response: At least 3 faces must meet at each vertex and the sum
of the measures of the angles at each vertex must be less than 360˚. b. 1. The sum of the measures of the angles at any vertex of the
tessellation is 360˚. 2. Sample response: No. If the sum of the measures of the angles at
the vertex is 360˚, a tessellation will be formed. A tessellation is a planar figure, not a solid.
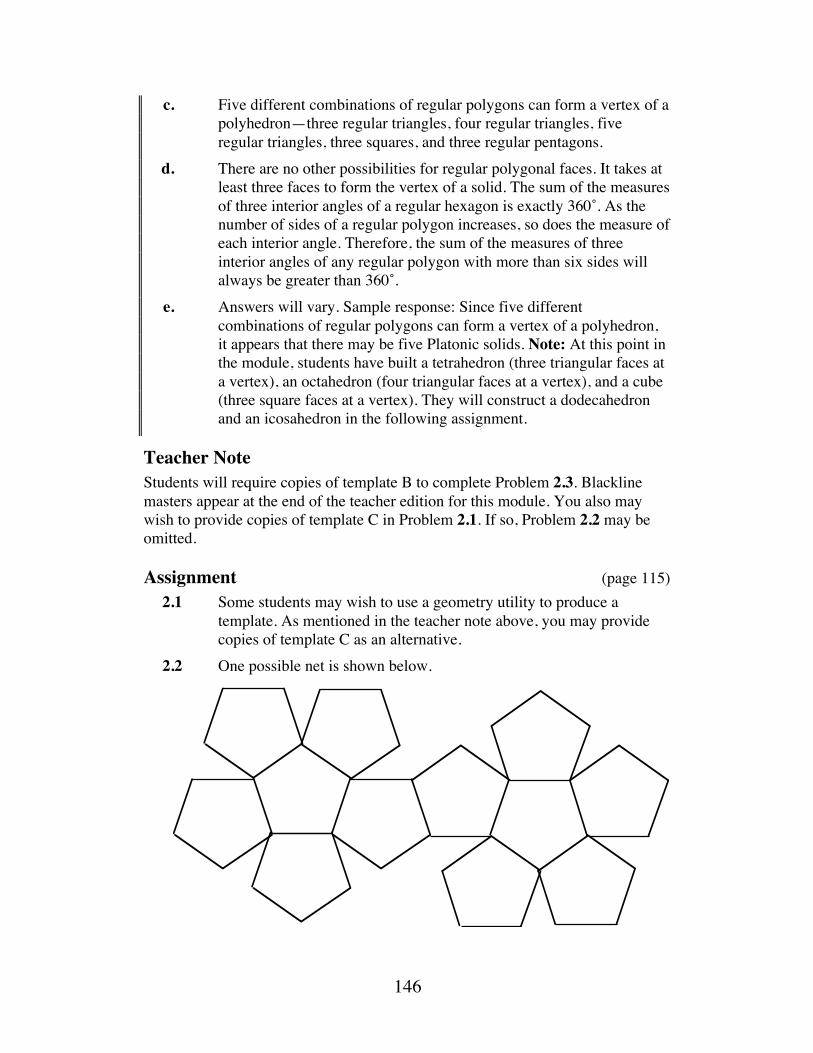
146
c. Five different combinations of regular polygons can form a vertex of a polyhedron—three regular triangles, four regular triangles, five regular triangles, three squares, and three regular pentagons.
d. There are no other possibilities for regular polygonal faces. It takes at least three faces to form the vertex of a solid. The sum of the measures of three interior angles of a regular hexagon is exactly 360˚. As the number of sides of a regular polygon increases, so does the measure of each interior angle. Therefore, the sum of the measures of three interior angles of any regular polygon with more than six sides will always be greater than 360˚.
e. Answers will vary. Sample response: Since five different combinations of regular polygons can form a vertex of a polyhedron, it appears that there may be five Platonic solids. Note: At this point in the module, students have built a tetrahedron (three triangular faces at a vertex), an octahedron (four triangular faces at a vertex), and a cube (three square faces at a vertex). They will construct a dodecahedron and an icosahedron in the following assignment.
Teacher Note Students will require copies of template B to complete Problem 2.3. Blackline masters appear at the end of the teacher edition for this module. You also may wish to provide copies of template C in Problem 2.1. If so, Problem 2.2 may be omitted.
Assignment (page 115) 2.1 Some students may wish to use a geometry utility to produce a
template. As mentioned in the teacher note above, you may provide copies of template C as an alternative.
2.2 One possible net is shown below.
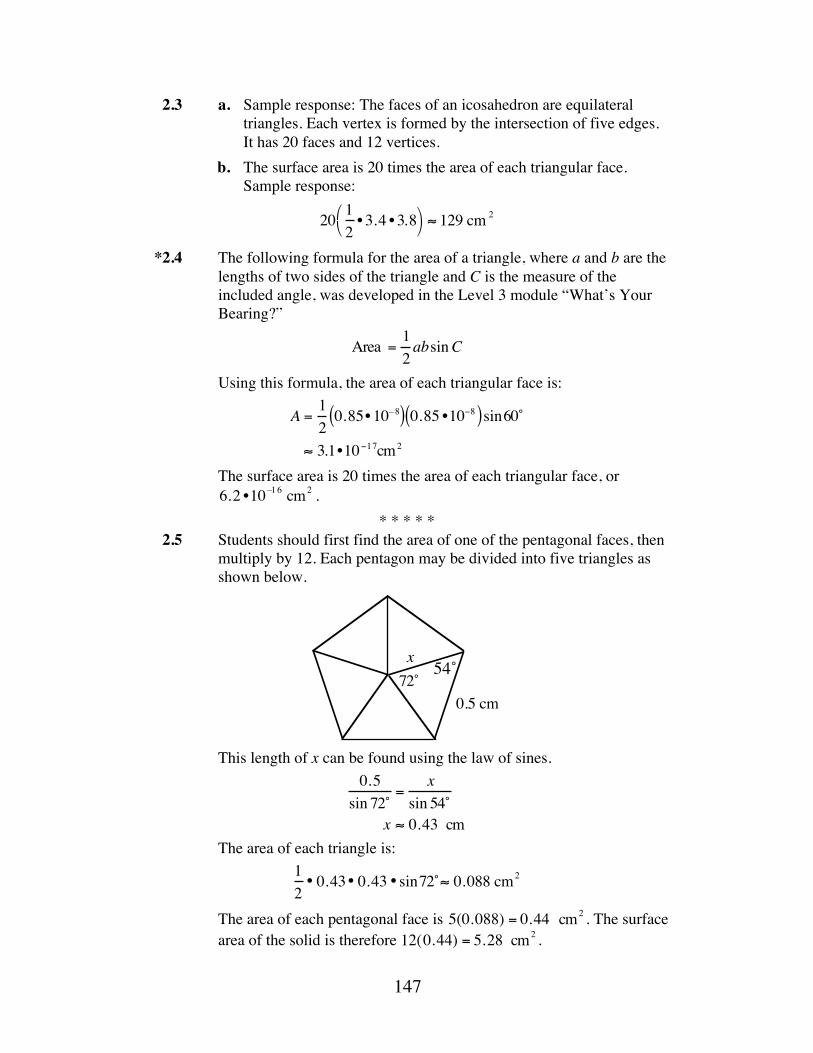
147
2.3 a. Sample response: The faces of an icosahedron are equilateral triangles. Each vertex is formed by the intersection of five edges. It has 20 faces and 12 vertices.
b. The surface area is 20 times the area of each triangular face. Sample response:
2012
• 3.4 • 3.8⎛ ⎝
⎞ ⎠ ≈ 129 cm 2
*2.4 The following formula for the area of a triangle, where a and b are the lengths of two sides of the triangle and C is the measure of the included angle, was developed in the Level 3 module “What’s Your Bearing?”
Area = 12absinC
Using this formula, the area of each triangular face is:
A =120.85• 10–8( ) 0.85 •10−8( )sin60˚
≈ 3.1•10−17cm2
The surface area is 20 times the area of each triangular face, or 6.2 •10–1 6 cm2 .
* * * * * 2.5 Students should first find the area of one of the pentagonal faces, then
multiply by 12. Each pentagon may be divided into five triangles as shown below.
This length of x can be found using the law of sines.
0.5sin 72˚
=x
sin 54˚x ≈ 0.43 cm
The area of each triangle is: 12• 0.43• 0.43 • sin72˚≈ 0.088 cm2
The area of each pentagonal face is 5(0.088) = 0.44 cm2 . The surface area of the solid is therefore 12(0.44) = 5.28 cm2 .
0.5 cm
54˚72˚x
148
2.6 Sample response: Use an icosahedron and put each integer on two faces that are on opposite sides.
2.7 Students should discover that the sum of the measures of the angles at a vertex of any convex solid is less than 360˚.
* * * * * * * * * * (page 116)
Activity 3
In this activity, students draw regular polygons and investigate lines of symmetry. They also locate the planes of symmetry of Platonic solids with the help of mirrors.
Materials List • mirrors (two per group) • rulers (one per student) • protractors (one per group) • template A (one per group)
Technology • geometry utility (optional)
Teacher Note The use of a geometry utility to create the regular polygons in Exploration 1 allows students to investigate reflecting polygons without the use of mirrors. If students do not use a geometry utility, you may wish to conduct this exploration in pairs. A blackline master for template A appears at the end of the teacher edition for this module. In Exploration 2 and in the assignment, students will need their models of the Platonic solids constructed in previous activities.
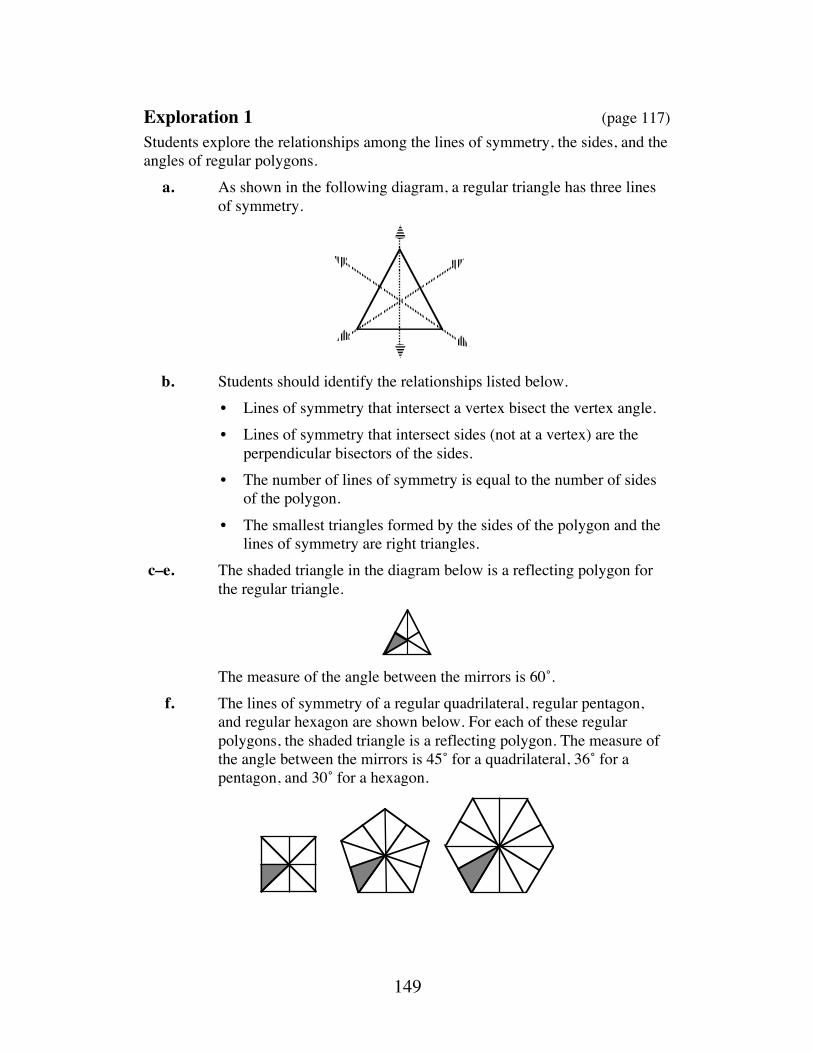
149
Exploration 1 (page 117) Students explore the relationships among the lines of symmetry, the sides, and the angles of regular polygons. a. As shown in the following diagram, a regular triangle has three lines
of symmetry.
b. Students should identify the relationships listed below. • Lines of symmetry that intersect a vertex bisect the vertex angle. • Lines of symmetry that intersect sides (not at a vertex) are the
perpendicular bisectors of the sides. • The number of lines of symmetry is equal to the number of sides
of the polygon. • The smallest triangles formed by the sides of the polygon and the
lines of symmetry are right triangles. c–e. The shaded triangle in the diagram below is a reflecting polygon for
the regular triangle.
The measure of the angle between the mirrors is 60˚. f. The lines of symmetry of a regular quadrilateral, regular pentagon,
and regular hexagon are shown below. For each of these regular polygons, the shaded triangle is a reflecting polygon. The measure of the angle between the mirrors is 45˚ for a quadrilateral, 36˚ for a pentagon, and 30˚ for a hexagon.
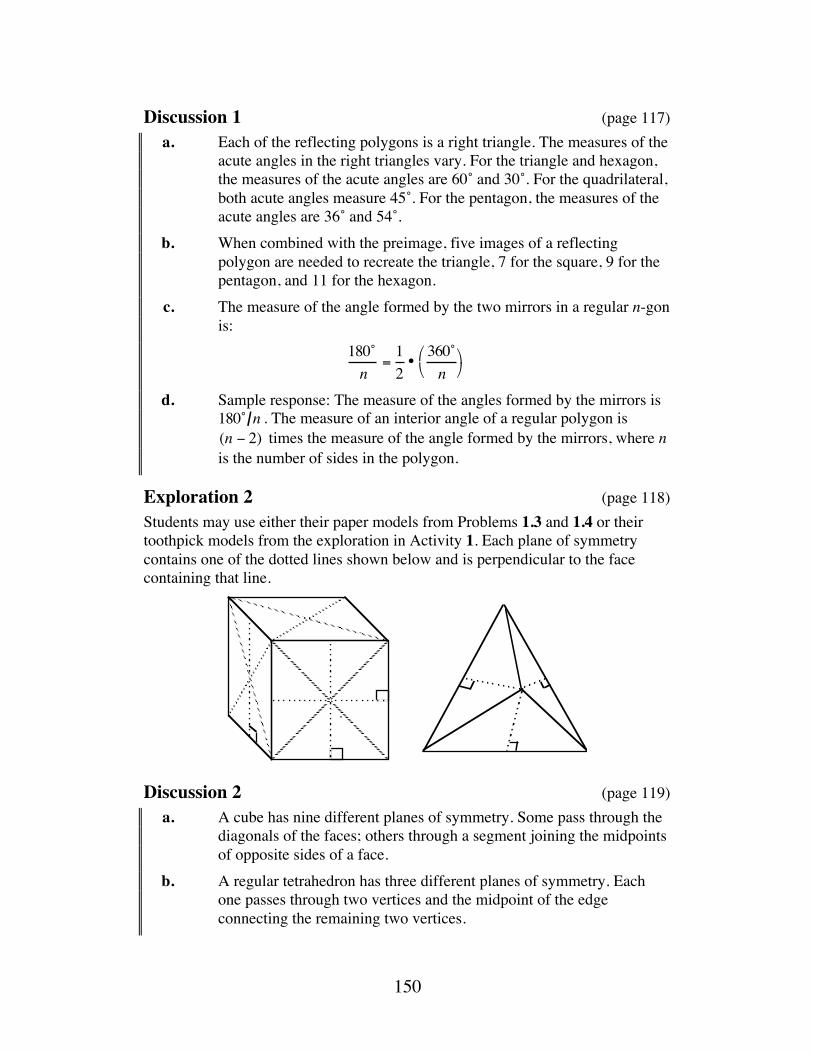
150
Discussion 1 (page 117) a. Each of the reflecting polygons is a right triangle. The measures of the
acute angles in the right triangles vary. For the triangle and hexagon, the measures of the acute angles are 60˚ and 30˚. For the quadrilateral, both acute angles measure 45˚. For the pentagon, the measures of the acute angles are 36˚ and 54˚.
b. When combined with the preimage, five images of a reflecting polygon are needed to recreate the triangle, 7 for the square, 9 for the pentagon, and 11 for the hexagon.
c. The measure of the angle formed by the two mirrors in a regular n-gon is:
180˚n
=12
•360˚n
⎛ ⎝
⎞ ⎠
d. Sample response: The measure of the angles formed by the mirrors is 180˚ n . The measure of an interior angle of a regular polygon is (n − 2) times the measure of the angle formed by the mirrors, where n is the number of sides in the polygon.
Exploration 2 (page 118) Students may use either their paper models from Problems 1.3 and 1.4 or their toothpick models from the exploration in Activity 1. Each plane of symmetry contains one of the dotted lines shown below and is perpendicular to the face containing that line.
Discussion 2 (page 119) a. A cube has nine different planes of symmetry. Some pass through the
diagonals of the faces; others through a segment joining the midpoints of opposite sides of a face.
b. A regular tetrahedron has three different planes of symmetry. Each one passes through two vertices and the midpoint of the edge connecting the remaining two vertices.
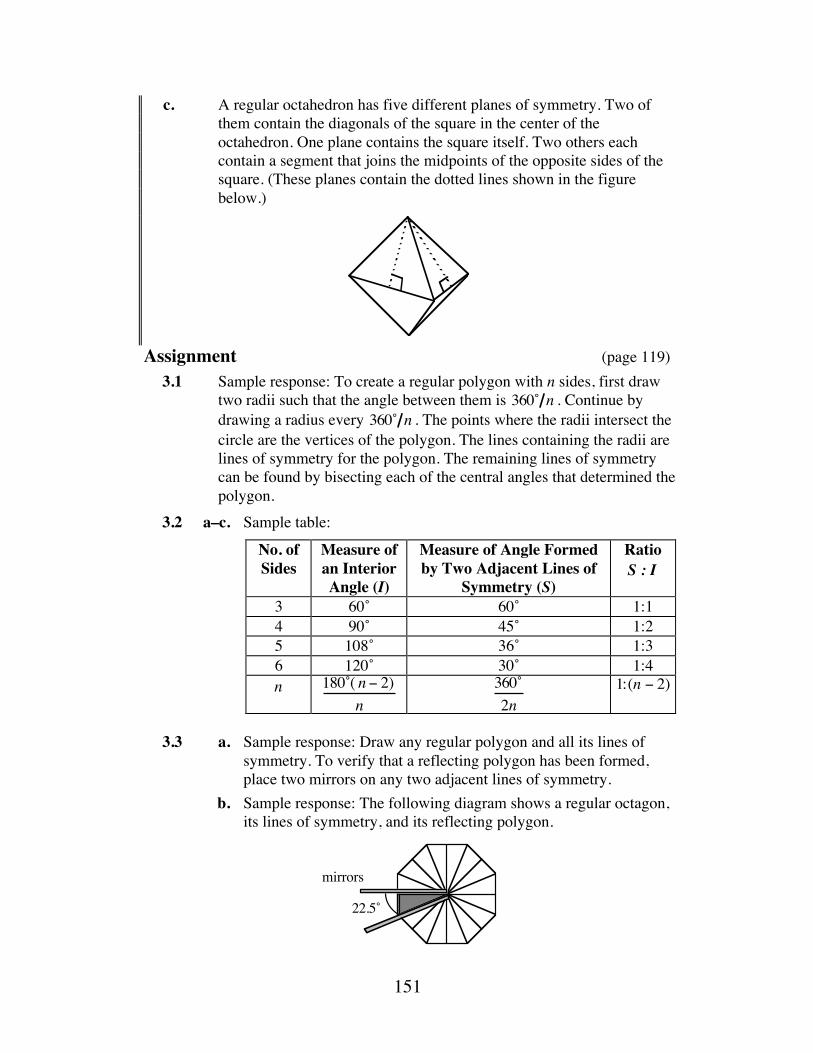
151
c. A regular octahedron has five different planes of symmetry. Two of them contain the diagonals of the square in the center of the octahedron. One plane contains the square itself. Two others each contain a segment that joins the midpoints of the opposite sides of the square. (These planes contain the dotted lines shown in the figure below.)
Assignment (page 119) 3.1 Sample response: To create a regular polygon with n sides, first draw
two radii such that the angle between them is 360˚ n . Continue by drawing a radius every 360˚ n . The points where the radii intersect the circle are the vertices of the polygon. The lines containing the radii are lines of symmetry for the polygon. The remaining lines of symmetry can be found by bisecting each of the central angles that determined the polygon.
3.2 a–c. Sample table: No. of Sides
Measure of an Interior Angle (I)
Measure of Angle Formed by Two Adjacent Lines of
Symmetry (S)
Ratio S : I
3 60˚ 60˚ 1:1 4 90˚ 45˚ 1:2 5 108˚ 36˚ 1:3 6 120˚ 30˚ 1:4 n 180˚( n − 2)
n 360˚
2n 1:(n − 2)
3.3 a. Sample response: Draw any regular polygon and all its lines of
symmetry. To verify that a reflecting polygon has been formed, place two mirrors on any two adjacent lines of symmetry.
b. Sample response: The following diagram shows a regular octagon, its lines of symmetry, and its reflecting polygon.
mirrors
22.5˚
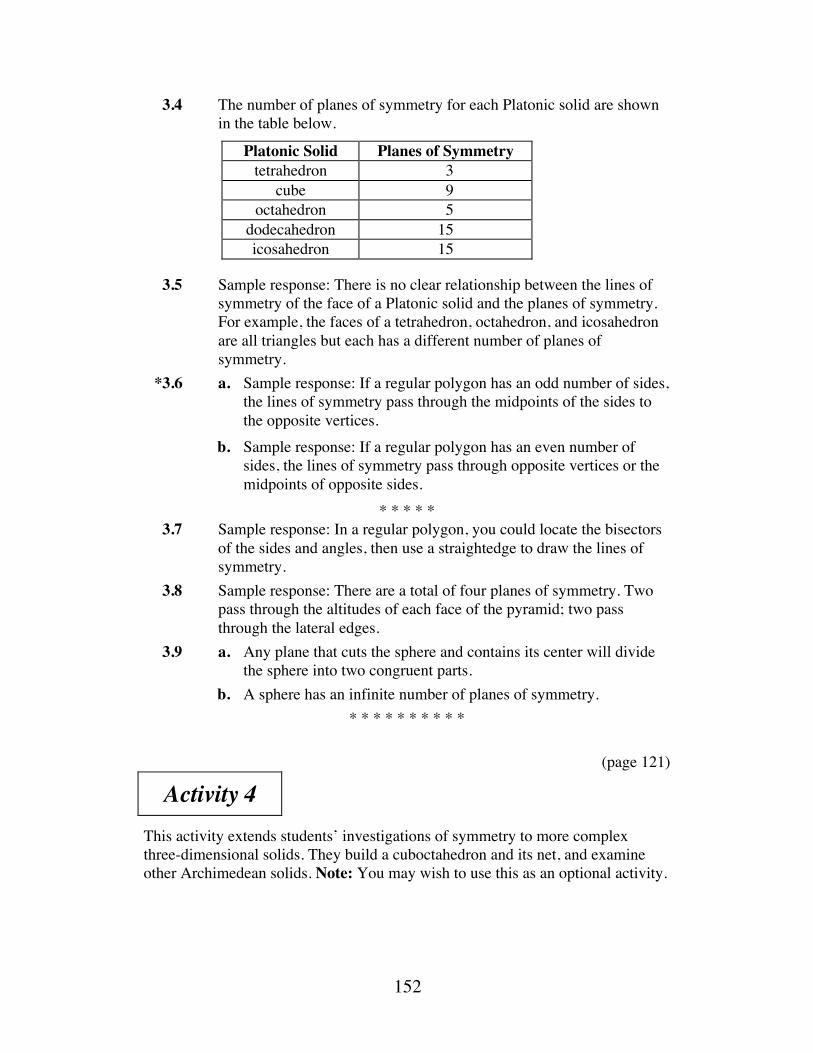
152
3.4 The number of planes of symmetry for each Platonic solid are shown in the table below.
Platonic Solid Planes of Symmetry tetrahedron 3
cube 9 octahedron 5
dodecahedron 15 icosahedron 15
3.5 Sample response: There is no clear relationship between the lines of
symmetry of the face of a Platonic solid and the planes of symmetry. For example, the faces of a tetrahedron, octahedron, and icosahedron are all triangles but each has a different number of planes of symmetry.
*3.6 a. Sample response: If a regular polygon has an odd number of sides, the lines of symmetry pass through the midpoints of the sides to the opposite vertices.
b. Sample response: If a regular polygon has an even number of sides, the lines of symmetry pass through opposite vertices or the midpoints of opposite sides.
* * * * * 3.7 Sample response: In a regular polygon, you could locate the bisectors
of the sides and angles, then use a straightedge to draw the lines of symmetry.
3.8 Sample response: There are a total of four planes of symmetry. Two pass through the altitudes of each face of the pyramid; two pass through the lateral edges.
3.9 a. Any plane that cuts the sphere and contains its center will divide the sphere into two congruent parts.
b. A sphere has an infinite number of planes of symmetry. * * * * * * * * * *
(page 121)
Activity 4 This activity extends students’ investigations of symmetry to more complex three-dimensional solids. They build a cuboctahedron and its net, and examine other Archimedean solids. Note: You may wish to use this as an optional activity.
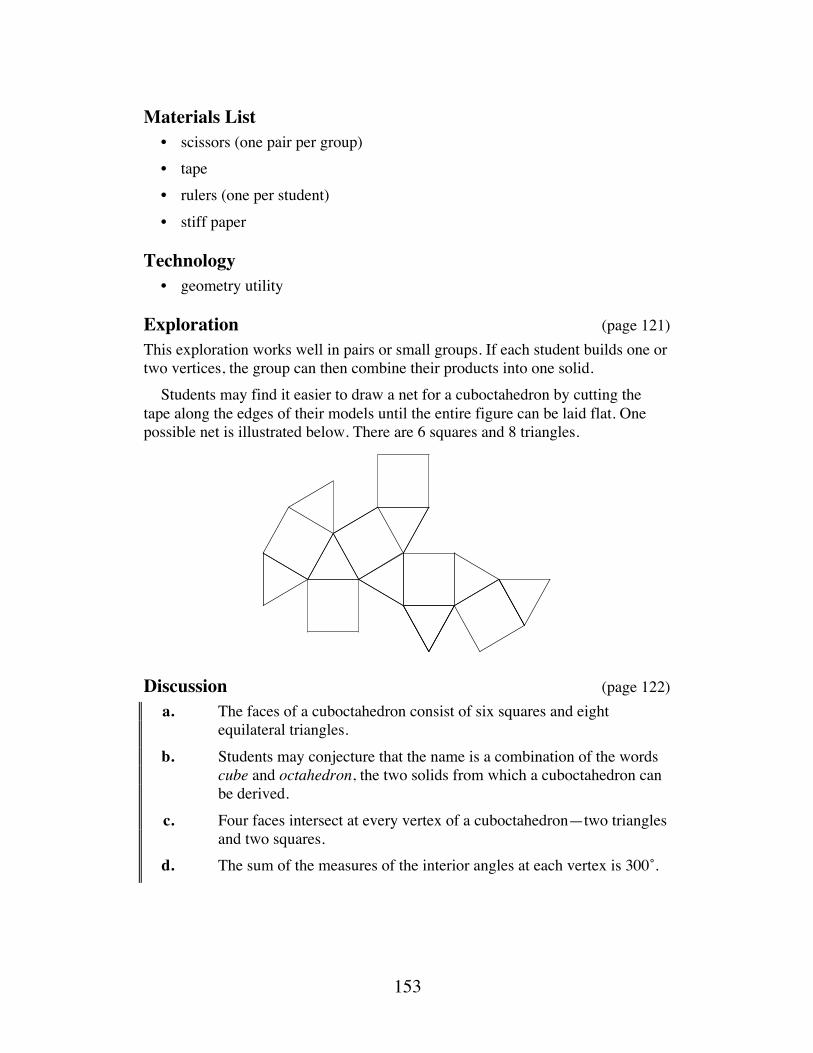
153
Materials List • scissors (one pair per group) • tape • rulers (one per student) • stiff paper
Technology • geometry utility
Exploration (page 121) This exploration works well in pairs or small groups. If each student builds one or two vertices, the group can then combine their products into one solid. Students may find it easier to draw a net for a cuboctahedron by cutting the tape along the edges of their models until the entire figure can be laid flat. One possible net is illustrated below. There are 6 squares and 8 triangles.
Discussion (page 122) a. The faces of a cuboctahedron consist of six squares and eight
equilateral triangles. b. Students may conjecture that the name is a combination of the words
cube and octahedron, the two solids from which a cuboctahedron can be derived.
c. Four faces intersect at every vertex of a cuboctahedron—two triangles and two squares.
d. The sum of the measures of the interior angles at each vertex is 300˚.
154
Assignment (page 122) 4.1 A cuboctahedron has nine planes of symmetry—the same number as a
cube. An octahedron has only five planes of symmetry. The planes of symmetry for an cuboctahedron are the same as the planes for the cube from which it could be derived.
4.2 a. Sample table: Platonic Solid Faces Vertices Edges
tetrahedron 4 4 6 cube 6 8 12
octahedron 8 6 12 icosahedron 20 12 30
dodecahedron 12 20 30
b–c. The sum of the numbers of vertices and faces is 2 more than the number of edges. Sample table:
Solid Faces (F) Vertices (V) F + V Edges (E) tetrahedron 4 4 8 6
cube 6 8 14 12 octahedron 8 6 14 12 icosahedron 20 12 32 30
dodecahedron 12 20 32 30 cuboctahedron 14 12 26 24
d. Sample response: V + F = E + 2 or (V + F) − 2 = E , where V represents the number of vertices, F represents the number of faces, and E represents the number of edges in a polyhedron.
4.3 a. 1. Sample response: Yes. There are 16 vertices, 10 faces, and 24 edges. The sum of the vertices and the faces is equal to the number of faces plus 2. Thus, 16 +10 − 2 = 24 .
2. Sample response: No. It is not a polyhedron because it has a hole.
b. 1. Sample response: This solid has 32 edges, 16 faces, and 16 vertices. Therefore, Euler’s formula does not hold true since 16 +16 ≠ 32 + 2 .
2. Sample response: Yes. Since it is not true for this case, it cannot be true for all solids with holes. Note: You may wish to introduce students to the phrase “proof by counterexample.”
4.4 a. Sample response: Yes. The regions of the planar map represent the faces of the tetrahedron, the vertices represent the vertices, and the segments represent the edges. Since all the parts of the tetrahedron are represented and Euler’s formula can be applied to the tetrahedron, it can also be applied to the planar map.
155
b. Sample cube and corresponding planar map:
c. Sample response: Yes. The regions of the planar map represent the
faces of the cube, the vertices represent the vertices, and the segments represent the edges. Since all the parts of the cube are represented and Euler’s formula can be applied to the cube, it can also be applied to the planar map.
4.5 Sample planar graph:
4.6 a. The dual of a regular octahedron is a cube. A cube has six faces
and eight vertices. b. The dual of a cuboctahedron has the same number of edges as
regular octahedron (12), 14 vertices, and 12 faces. *4.7 A cuboctahedron could be formed by cutting a square-based pyramid
from each vertex of an octahedron. The length of the base of this pyramid would be equal to half the length of an edge of the octahedron. The height of the pyramid, where s represents the length of the edge of the original octahedron, would be s 2 4 .
The figure in the diagram below represents half the octahedron. The small square pyramid at the top is the portion removed from each vertex of the octahedron to create the cuboctahedron.
CB
A
D
E
Fface A
face B face C
face E
face F
face D
A
B
C
D
E
F
s s 2
s 4
s 4
s 24
s 34
156
Using the Pythagorean theorem, the slant height of half an octahedron is s 3 2. Since the lengths of the edges of the square faces and the triangular faces must be equal to form a cuboctahedron, the plane that cuts off each vertex must pass through the midpoints of adjacent edges. Therefore the slant height of the pyramid removed is half the slant height of half the octahedron or s 3 4 . The base of the pyramid has a length equal to half the length of an edge of the octahedron or s 2 . Using the Pythagorean theorem again, the height of the portion to be removed is s 2 4 .
* * * * * 4.8 If each face were a regular polygon, the pattern on a soccer ball would
result in an Archimedean solid known as the truncated icosahedron. Students may observe that because the pattern on the ball consists of regular polygons, it meets the criteria for an Archimedean solid.
4.9 Sample response: Since a cuboctahedron has 14 faces, it could be used to make a die with each face representing one of the integers from 1 to 14. However, it is doubtful that the die would be fair since the square faces have a larger surface area than the triangular faces.
* * * * * * * * * *
Research Project (page 124) There are 14 semiregular polyhedra, 13 of which were known in Archimedes’ time. Students should be encouraged to make sketches, build models, or draw nets of the solids.
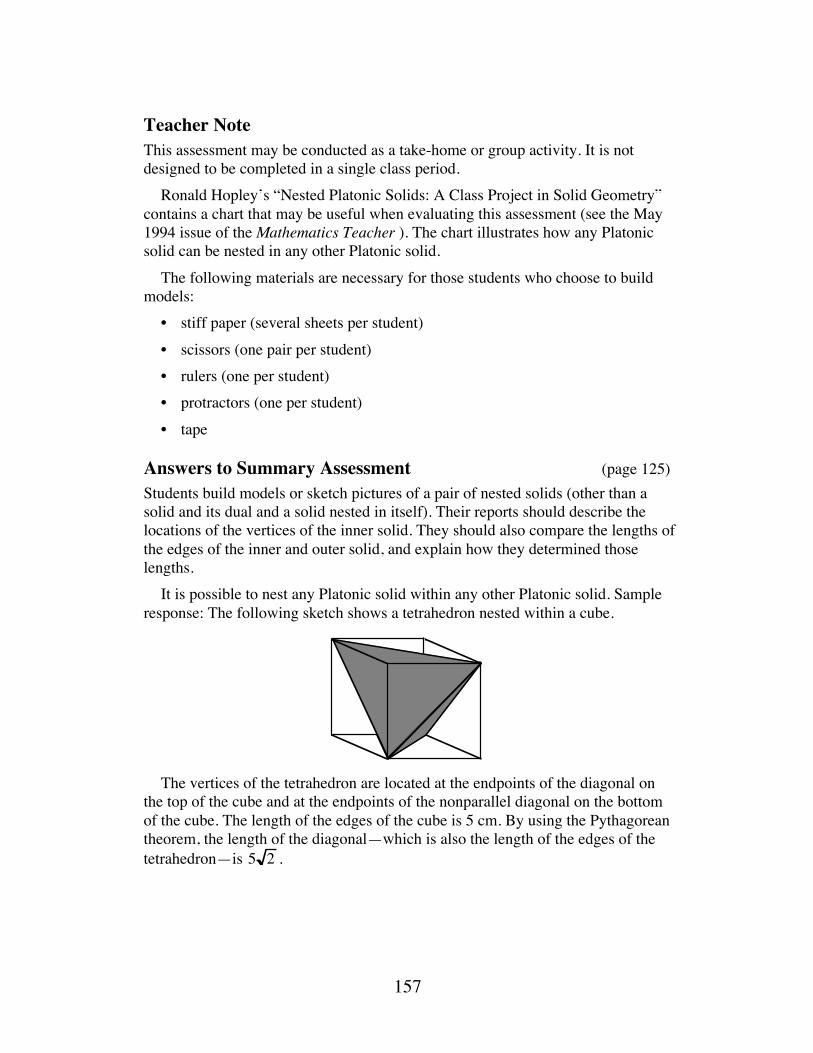
157
Teacher Note This assessment may be conducted as a take-home or group activity. It is not designed to be completed in a single class period. Ronald Hopley’s “Nested Platonic Solids: A Class Project in Solid Geometry” contains a chart that may be useful when evaluating this assessment (see the May 1994 issue of the Mathematics Teacher ). The chart illustrates how any Platonic solid can be nested in any other Platonic solid. The following materials are necessary for those students who choose to build models: • stiff paper (several sheets per student) • scissors (one pair per student) • rulers (one per student) • protractors (one per student) • tape
Answers to Summary Assessment (page 125) Students build models or sketch pictures of a pair of nested solids (other than a solid and its dual and a solid nested in itself). Their reports should describe the locations of the vertices of the inner solid. They should also compare the lengths of the edges of the inner and outer solid, and explain how they determined those lengths. It is possible to nest any Platonic solid within any other Platonic solid. Sample response: The following sketch shows a tetrahedron nested within a cube.
The vertices of the tetrahedron are located at the endpoints of the diagonal on the top of the cube and at the endpoints of the nonparallel diagonal on the bottom of the cube. The length of the edges of the cube is 5 cm. By using the Pythagorean theorem, the length of the diagonal—which is also the length of the edges of the tetrahedron—is 5 2 .
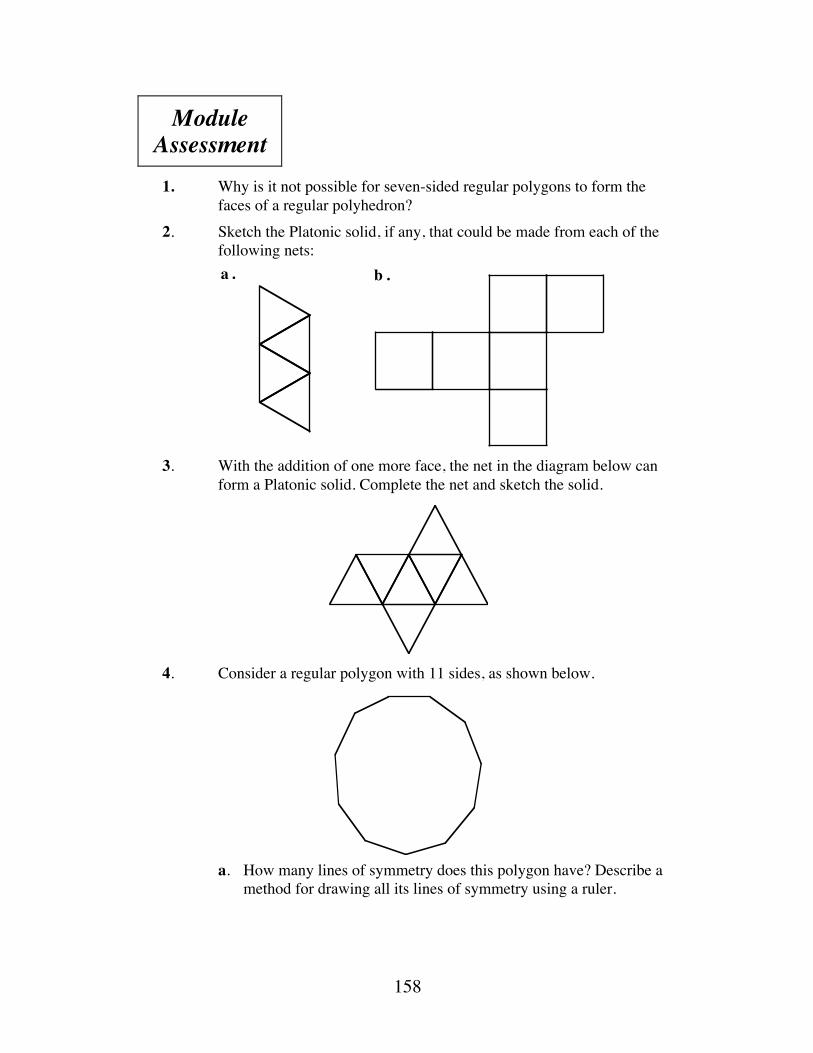
158
Module Assessment
1. Why is it not possible for seven-sided regular polygons to form the
faces of a regular polyhedron? 2. Sketch the Platonic solid, if any, that could be made from each of the
following nets:
3. With the addition of one more face, the net in the diagram below can
form a Platonic solid. Complete the net and sketch the solid.
4. Consider a regular polygon with 11 sides, as shown below.
a. How many lines of symmetry does this polygon have? Describe a
method for drawing all its lines of symmetry using a ruler.
a . b .

159
b. Describe how you would place two mirrors to locate a reflecting polygon for the 11-gon. Determine the measure of the angle between the mirrors.
c. How many images of a reflecting polygon are required to recreate the original polygon?
5. Describe how to locate a plane of symmetry in any Platonic or Archimedean solid.
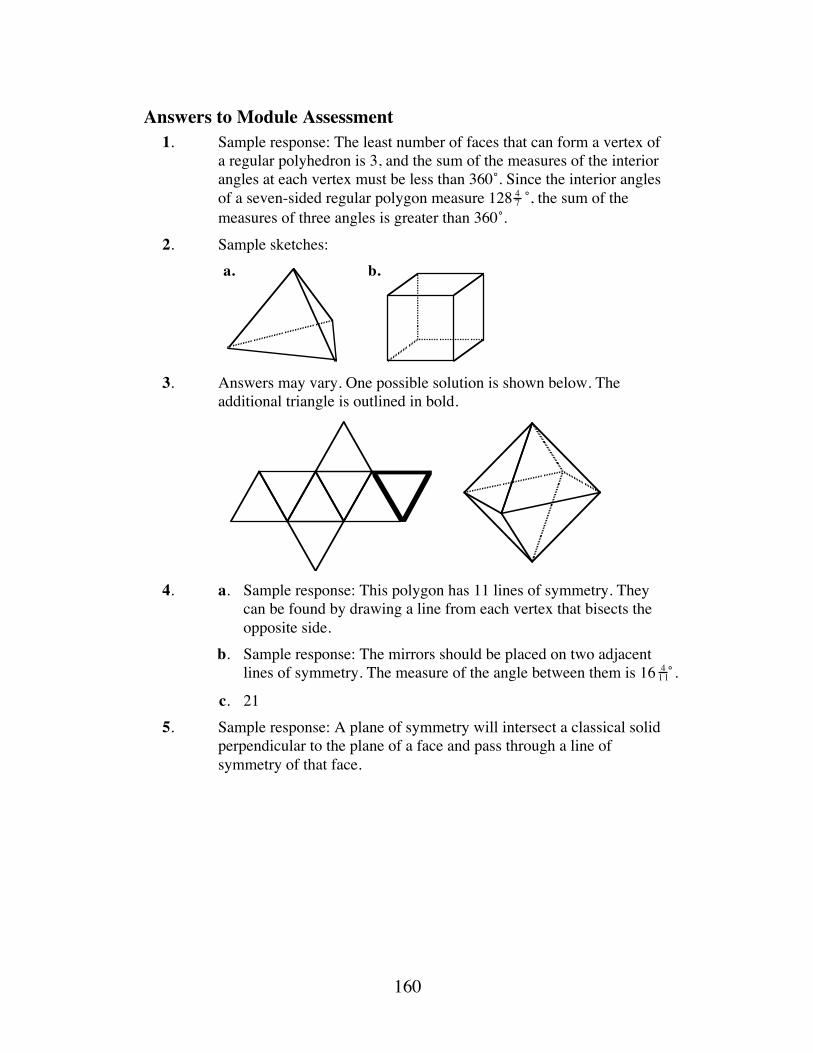
160
Answers to Module Assessment 1. Sample response: The least number of faces that can form a vertex of
a regular polyhedron is 3, and the sum of the measures of the interior angles at each vertex must be less than 360˚. Since the interior angles of a seven-sided regular polygon measure 128 47 ˚, the sum of the measures of three angles is greater than 360˚.
2. Sample sketches:
3. Answers may vary. One possible solution is shown below. The
additional triangle is outlined in bold.
4. a. Sample response: This polygon has 11 lines of symmetry. They
can be found by drawing a line from each vertex that bisects the opposite side.
b. Sample response: The mirrors should be placed on two adjacent lines of symmetry. The measure of the angle between them is 16 4
1 1̊ .
c. 21 5. Sample response: A plane of symmetry will intersect a classical solid
perpendicular to the plane of a face and pass through a line of symmetry of that face.
a. b.
161
Selected References Battey, M. H. Mineralogy for Students. New York: Hafner Press, 1972. Blackwell, W. Geometry in Architecture. Berkeley, CA: Key Curriculum Press,
1984. Cundy, H. M., and A. P. Rollett. Mathematical Models. London, England: Oxford
University Press, 1961. Eves, H. An Introduction to the History of Mathematics. 6th ed. New York: Holt,
Rinehart and Winston, 1990. Fetter, A., C. Schmalzried, N. Eckert, D. Schattschneider, and E. Klotz. The
Platonic Solids. Berkeley, CA: Key Curriculum Press, 1991. Hopley, R. B. “Nested Platonic Solids: A Class Project in Solid Geometry.”
Mathematics Teacher 87 (May 1994): 312–318. Hurlbut, C. S., Jr. Dana’s Manual of Mineralogy. New York: John Wiley and
Sons, 1971. Jacobs, H. R. Mathematics: A Human Endeavor. New York: W. H. Freeman and
Co., 1982. Kastner, B. Applications of Secondary School Mathematics. Reston, VA: National
Council of Teachers of Mathematics, 1978. O’Neil, P. Planet Earth: Gemstones. Alexandria, VA: Time-Life Books, 1984. Smith, J. V. Geometrical and Structural Crystallography. New York: John Wiley
and Sons, 1982.
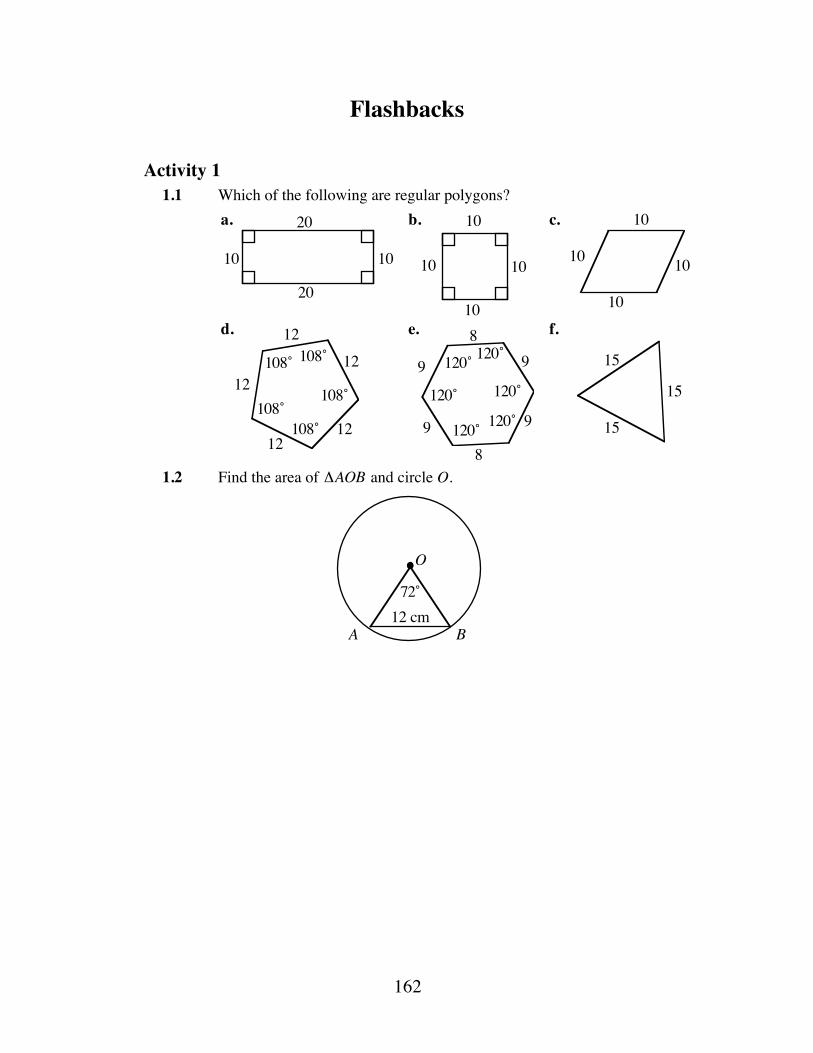
162
Flashbacks
Activity 1 1.1 Which of the following are regular polygons?
1.2 Find the area of ΔAOB and circle O.
d. e. f.
108˚108˚
108˚ 108˚
108˚ 120˚
120˚
120˚
120˚
120˚
12
89
1512
1212
129 9
9
8
15
15
a. b. c.20
10 10
10
10
10 10
10
10
10
1020
120˚
72˚
A B
O
12 cm
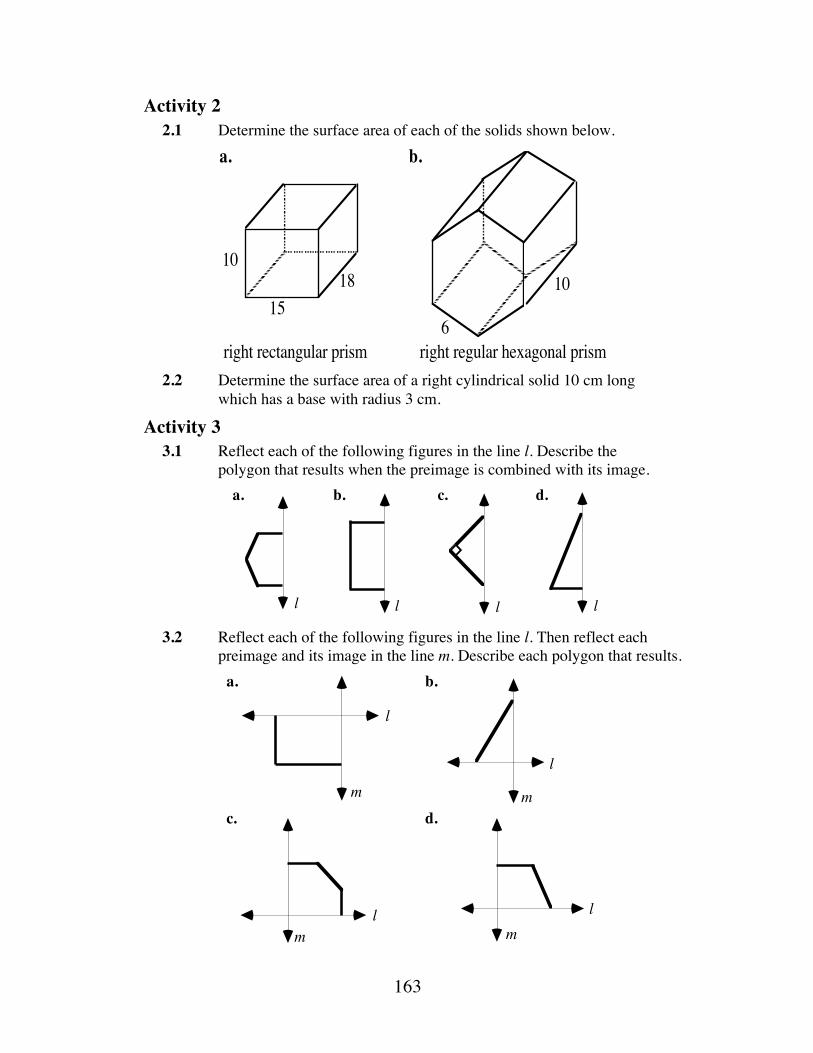
163
Activity 2 2.1 Determine the surface area of each of the solids shown below.
2.2 Determine the surface area of a right cylindrical solid 10 cm long
which has a base with radius 3 cm.
Activity 3 3.1 Reflect each of the following figures in the line l. Describe the
polygon that results when the preimage is combined with its image.
3.2 Reflect each of the following figures in the line l. Then reflect each
preimage and its image in the line m. Describe each polygon that results.
a. b.
10
6right regular hexagonal prism
10
1518
right rectangular prism
a. b. c. d.
l l ll
a.
l
mc.
lm
lm
d.
b.
l
m
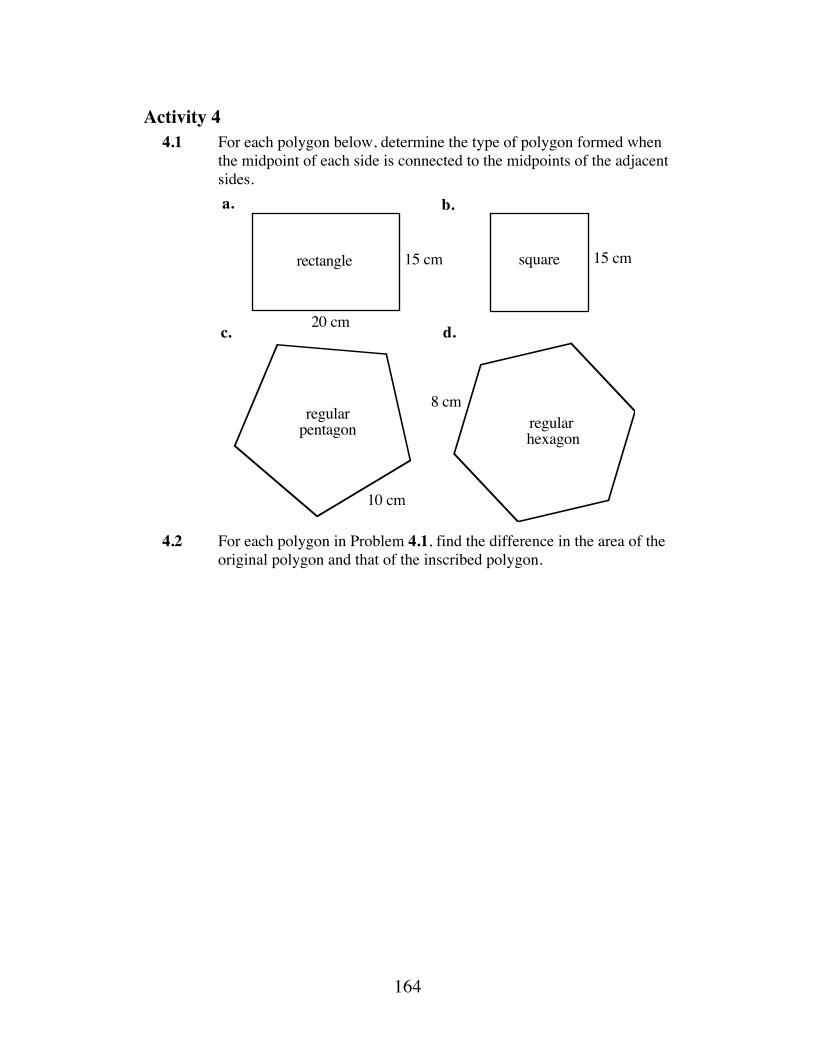
164
Activity 4 4.1 For each polygon below, determine the type of polygon formed when
the midpoint of each side is connected to the midpoints of the adjacent sides.
4.2 For each polygon in Problem 4.1, find the difference in the area of the
original polygon and that of the inscribed polygon.
15 cm
20 cm
15 cm
8 cm
rectangle square
regularpentagon regular
hexagon
a. b.
c. d.
10 cm
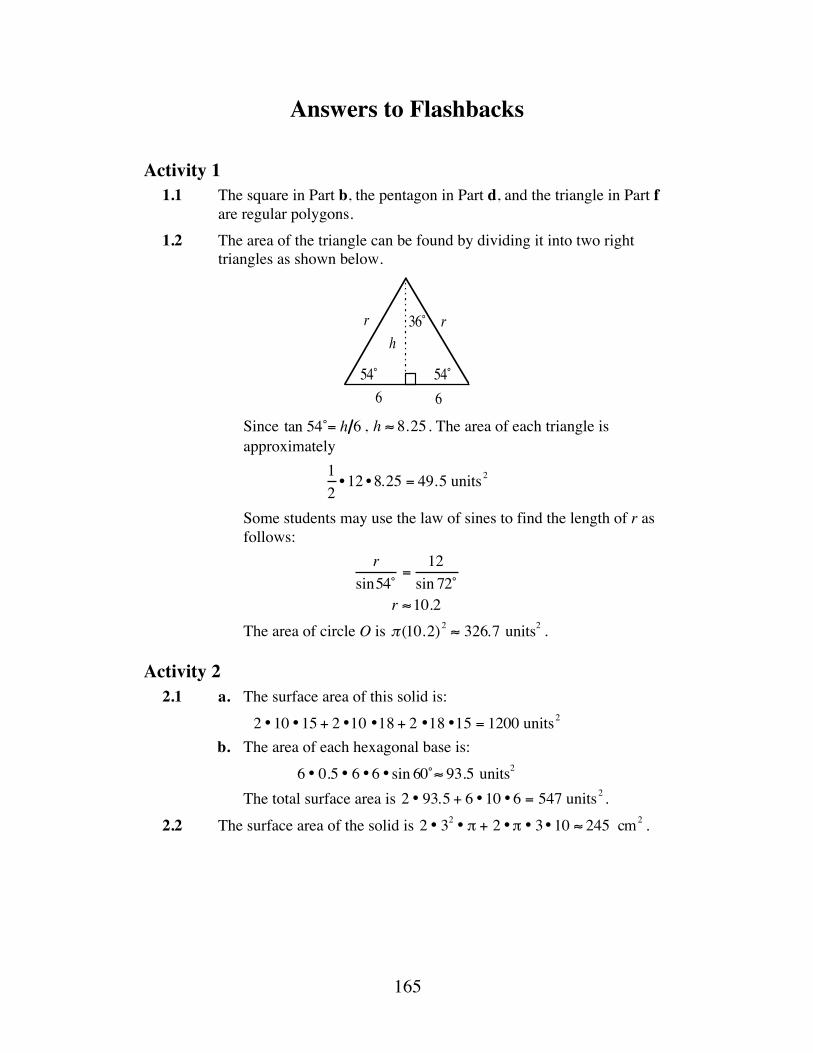
165
Answers to Flashbacks
Activity 1 1.1 The square in Part b, the pentagon in Part d, and the triangle in Part f
are regular polygons. 1.2 The area of the triangle can be found by dividing it into two right
triangles as shown below.
Since tan 54˚= h 6 , h ≈ 8.25 . The area of each triangle is
approximately 12
• 12 • 8.25 = 49.5 units2
Some students may use the law of sines to find the length of r as follows:
rsin54˚
=12
sin 72˚r ≈10.2
The area of circle O is π (10.2)2 ≈ 326.7 units2 .
Activity 2 2.1 a. The surface area of this solid is:
2 •10 •15 + 2 •10 •18 + 2 •18 •15 = 1200 units2 b. The area of each hexagonal base is:
6 • 0.5 • 6 •6 • sin 60˚≈ 93.5 units2 The total surface area is 2 • 93.5 + 6 •10 •6 = 547 units2 . 2.2 The surface area of the solid is 2 • 32 • π + 2 •π • 3•10 ≈ 245 cm2 .
36˚
54˚54˚6 6
hrr
166
Activity 3 3.1 a. hexagon b. square c. square d. triangle 3.2 a. rectangle b. rhombus c. octogon d. hexagon
Activity 4 4.1 a. rhombus b. square c. regular pentagon d. regular hexagon 4.2 a. Since the area of the rectangle is 300 units2 and the area of the
rhombus is 150 units2 , the area of the inscribed polygon is one-half the area of the original polygon.
b. The area of the original square is 225 units2 . The area of the inscribed square is 112.5 units2 , or one-half that of the original.
c. The area of the original pentagon is about 172 units2 . The area of the inscribed pentagon is about 113 units2 , or approximately two-thirds that of the original.
d. The area of the original hexagon is about 166 units2 . The area of the inscribed hexagon is about 125 units2 , or approximately three-fourths that of the original. (Students may conjecture that as the number of sides in the original polygon increases, the area of the inscribed polygon approaches the area of the original.)
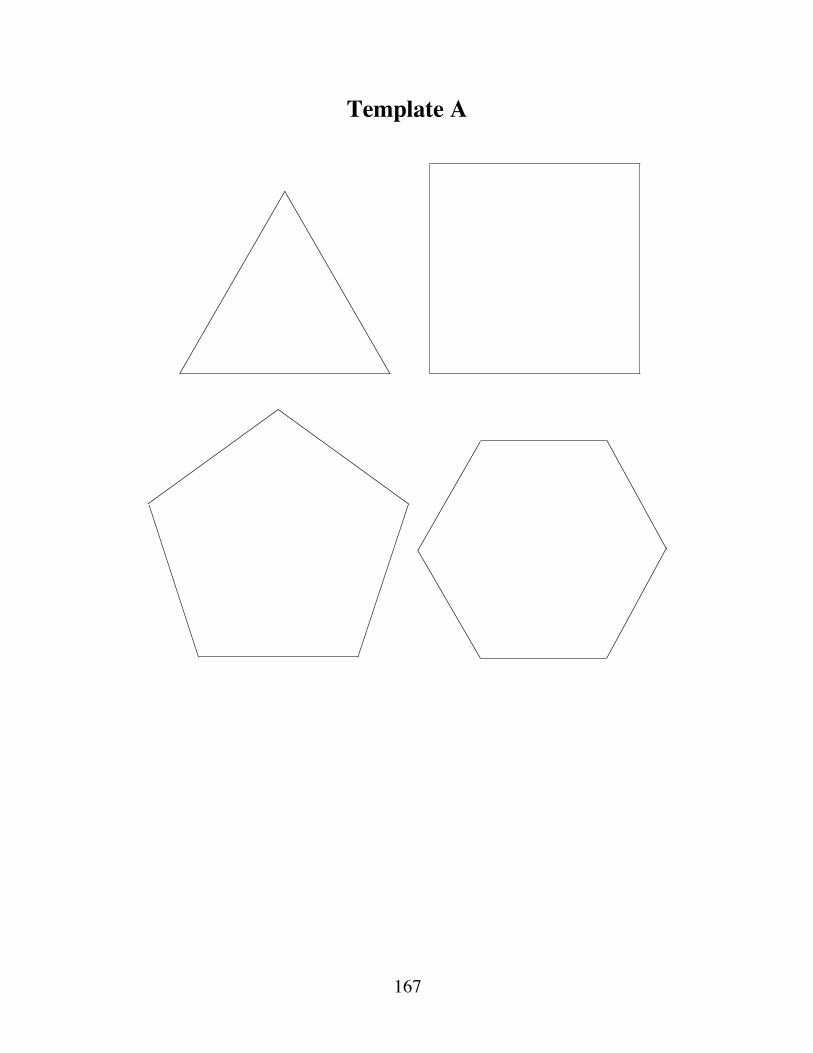
167
Template A
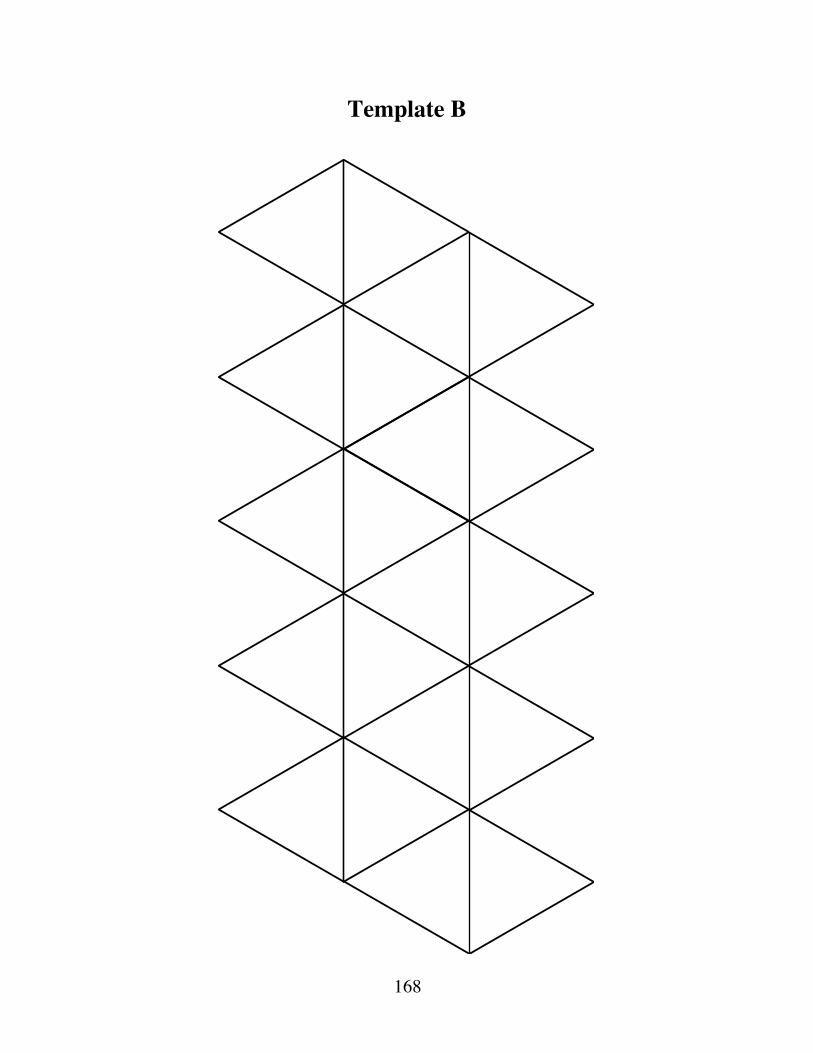
168
Template B
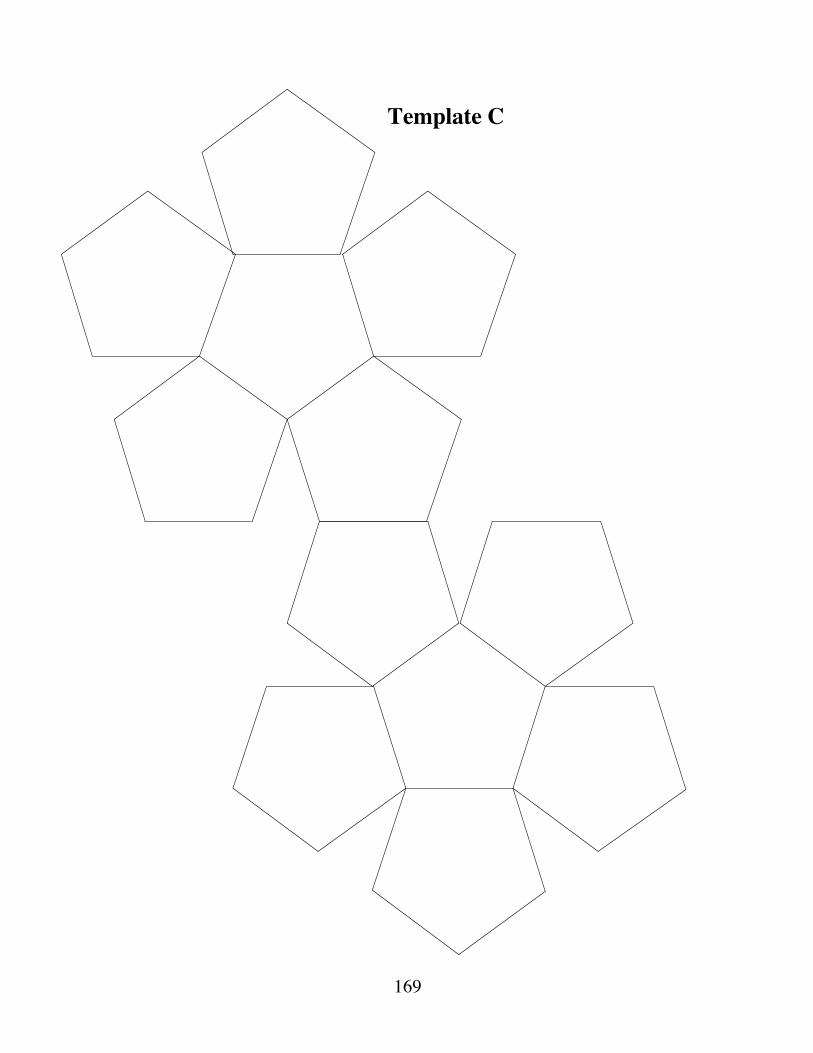
169
Template C


Strive for Quality
The quality of the products we buy affects our lives in many different ways. What is quality and how can we control it? In this module, you examine some statistical methods for evaluating quality.
Anne Merrifield • Pete Stabio
173
Teacher Edition Strive for Quality
Overview Manufacturers constantly monitor their products to assure quality. Quality control requires selecting a sample, testing the sample items for quality, and observing the number of successes or failures. In this module, students investigate binomial experiments and binomial probability distributions in the context of quality control.
Objectives In this module, students will: • model sampling with binomial experiments • develop the binomial probability formula • determine theoretical binomial probabilities • determine the expected value of a binomial experiment.
Prerequisites For this module, students should know: • the difference between theoretical and experimental probability • the definition of independent events • the definition of mutually exclusive events • how to create histograms • how to determine the number of combinations of n items taken r at a time • how to calculate expected value.
Time Line Activity Intro. 1 2 3 Summary
Assessment Total
Days 2 2 2 3 2 11

174
Materials Required Materials Activity
Intro. 1 2 3 Summary Assessment
paper X rulers X
scissors X compasses X
Technology Software Activity
Intro. 1 2 3 Summary Assessment
geometry utility X statistics package X X
spreadsheet X X
175
Strive for Quality
Introduction (page 131) Students investigate the process of quality control.
Materials List • paper (at least 10 sheets per group) • rulers (one per group) • scissors (one pair per group) • compass (one per group)
Technology • geometry utility (optional)
Teacher Note In Part a of the exploration, the diameter of each filter must be within 5 mm of the desired 20 cm. With this liberal tolerance, few, if any, of the filters may fail inspection. In Part c, the tolerance is reduced to 2 mm. Most of the filters produced in Part a probably would not pass this inspection. Manufacturers can normally improve the quality of their products by enhancing the manufacturing process at an increased cost. This trade-off between quality and the cost of production is a key issue that manufacturers continually address.
Exploration (page 132) a–b. Students may work individually or in groups. Each group should
manufacture five coffee filters. c. Students inspect their filters to see if they pass the 5-mm test. d. Students develop their own manufacturing process to meet more precise
quality criteria. They may ask for compasses at this point. In Step 3, they should exchange filters with another individual or group for inspection.
e–f. Percentages will vary. Sample prediction: Since 20% of the filters are defective, the number of filters out of 10,000 that one could expect to fail inspection would be (0.20)(10, 000) = 2000 .
176
Discussion (page 133) a. 1. The characteristic used to define quality was the filter’s diameter. 2. Examples of other criteria could include uniform shape, quality of
paper used, and ability to filter coffee. b. 1. Answers may vary. The limitations of the tools could make it
difficult to produce filters that pass inspection. 2. Answers may vary. Sample response: It is not reasonable to allow
a variation of 5 mm. This would lead to packaging problems and poor performance in coffee makers. Sales could go down.
c. Differences in the individual manufacturing processes, in the tools used, and in the skills of employees (students) could all contribute to the differences in failure rates.
d. Answers may vary. Some students may decide to use a geometry utility to improve the process of drawing a circle of radius 20 cm.
e. 1. Answers may vary. Students may feel that anything above a certain percentage—for example, 10%—is unacceptable.
2. While a high rate of defective filters creates additional costs, it also costs more to improve the manufacturing process. When analyzing quality control, it is important to take both factors into account.
f. Sample response: The prediction was made by multiplying the percentage of failures in the class data by 10,000.
g. Sample response: The time and expense involved would reduce profits or make the price uncompetitive.
h. Sample response: Take a sample of 10 filters every hour and test them for quality. Record the sizes of the filters in the sample and compare them to the desired size. If these sizes are consistently different, it may indicate that the manufacturing process should be improved.
(page 133)
Activity 1 This activity examines binomial experiments in the context of quality control.
Materials List • none
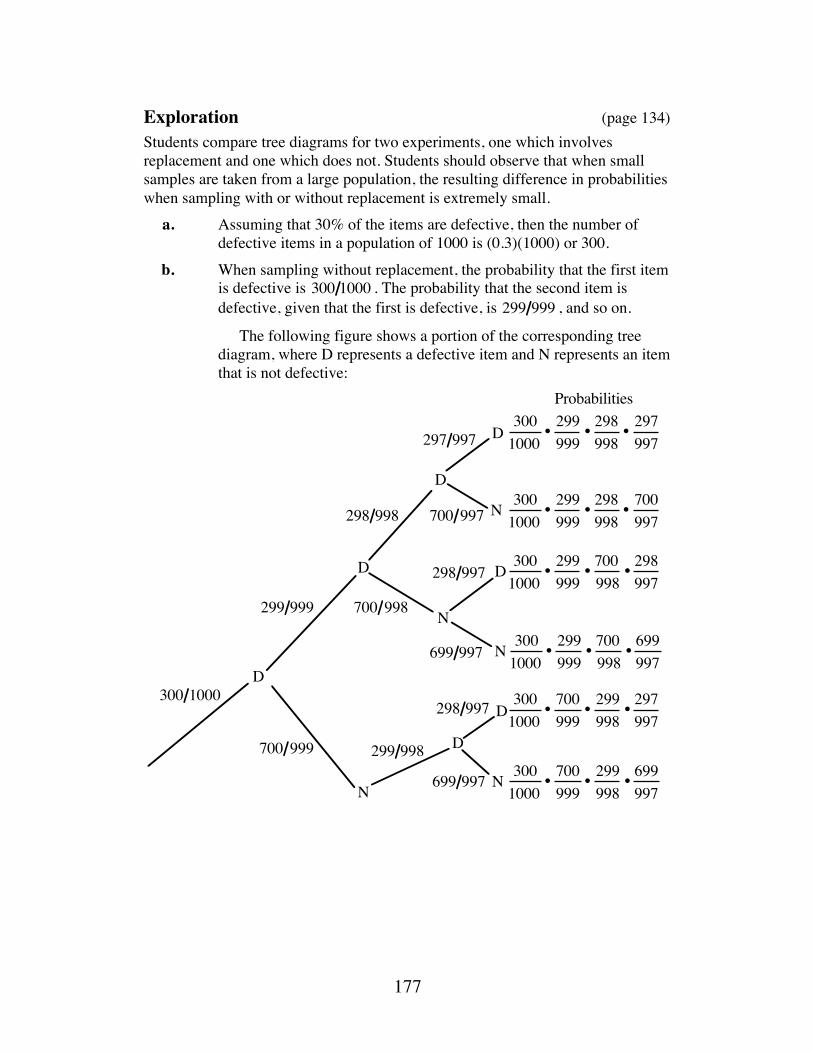
177
Exploration (page 134) Students compare tree diagrams for two experiments, one which involves replacement and one which does not. Students should observe that when small samples are taken from a large population, the resulting difference in probabilities when sampling with or without replacement is extremely small. a. Assuming that 30% of the items are defective, then the number of
defective items in a population of 1000 is (0.3)(1000) or 300. b. When sampling without replacement, the probability that the first item
is defective is 300 1000 . The probability that the second item is defective, given that the first is defective, is 299 999 , and so on.
The following figure shows a portion of the corresponding tree diagram, where D represents a defective item and N represents an item that is not defective:
299 999
298 998
297 997
700 999
700 998
700 997
299 998
D
D
D
D
N
N
N
D
N
D
D
N
298 997
699 997
298 997
699 997
300 1000
3001000
•299999
•298998
•297997
3001000
•299999
•298998
•700997
3001000
•299999
•700998
•298997
3001000
•299999
•700998
•699997
3001000
•700999
•299998
•297997
3001000
•700999
•299998
•699997
Probabilities
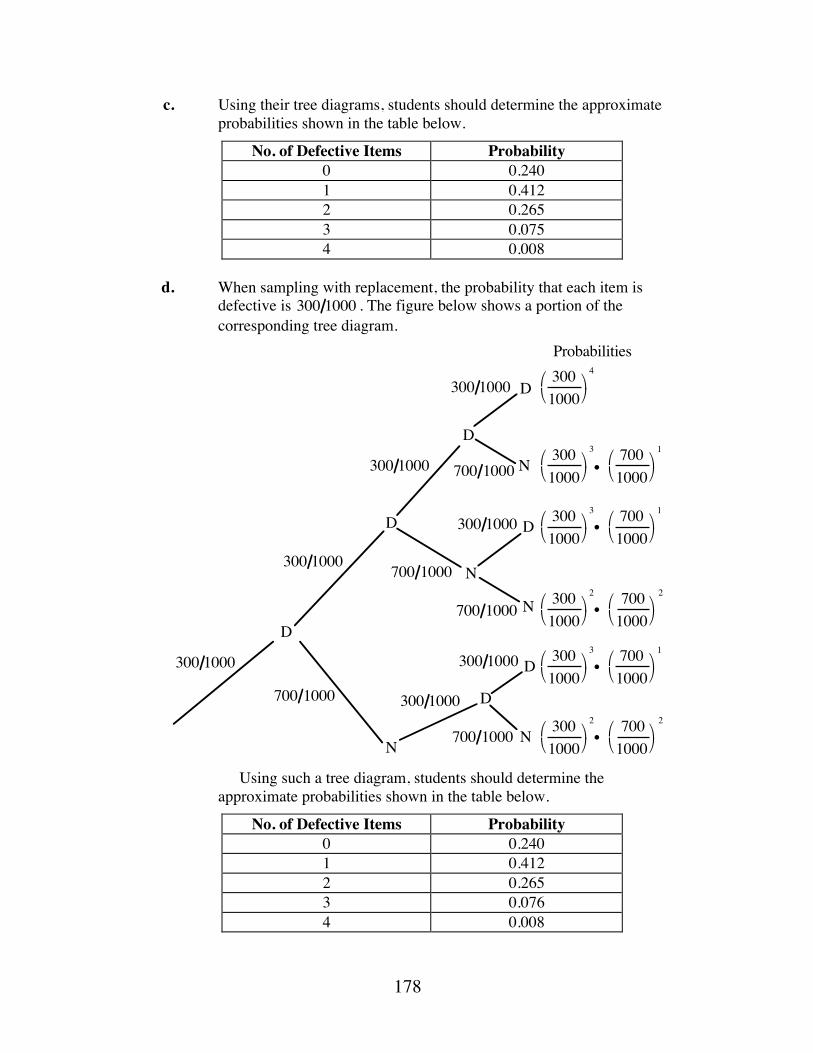
178
c. Using their tree diagrams, students should determine the approximate probabilities shown in the table below.
No. of Defective Items Probability 0 0.240 1 0.412 2 0.265 3 0.075 4 0.008
d. When sampling with replacement, the probability that each item is
defective is 300 1000 . The figure below shows a portion of the corresponding tree diagram.
Using such a tree diagram, students should determine the approximate probabilities shown in the table below.
No. of Defective Items Probability 0 0.240 1 0.412 2 0.265 3 0.076 4 0.008
Probabilities
D
D
D
D
N
N
N
D
N
D
D
N
300 1000
300 1000
300 1000
300 1000
300 1000
300 1000
300 1000
700 1000
700 1000
700 1000
700 1000
700 1000
3001000⎛ ⎝
⎞ ⎠
4
3001000⎛ ⎝
⎞ ⎠
3
•7001000⎛ ⎝
⎞ ⎠
1
3001000⎛ ⎝
⎞ ⎠
3
•7001000⎛ ⎝
⎞ ⎠
1
3001000⎛ ⎝
⎞ ⎠
2
•7001000⎛ ⎝
⎞ ⎠
2
3001000⎛ ⎝
⎞ ⎠
2
•7001000⎛ ⎝
⎞ ⎠
2
3001000⎛ ⎝
⎞ ⎠
3
•7001000⎛ ⎝
⎞ ⎠
1
179
e. Students should observe that the probabilities are approximately equal.
Discussion (page 135) a. Sample response: The differences between the probabilities of each
event when sampling with or without replacement are very small. They can only be observed at the 0.1% level.
b. Sample response: It is easier to represent the probabilities when sampling with replacement. Exponents can be used to simplify the writing of the probabilities on each branch.
c. The sampling done with replacement is a binomial experiment since the events are independent, there are only two possible outcomes, the experiment consists of a fixed number of trials, and the probability for each trial is the same. This is not true when the sampling is done without replacement.
d. Sample response: If the sampling is done with replacement, the quality control engineer could redraw an item that has already been sampled. If this happened, the engineer would not get an accurate picture of what is really going on in the manufacturing process. In addition, if a defective item were returned to the population, it might get sold to a consumer.
e. 1. There are 6 different ways: NNDD, NDDN, NDND, DDNN, DNND, and DNDN.
2. The theoretical probability of each of these possibilities is (0.7)2 • (0.3)2 = 0.0441.
3. Sample response: The event of getting 2 defective items out of a sample of 4 can be represented by (NNDD or NDDN or NDND or DDNN or DNND or DNDN). Since all these possible outcomes are mutually exclusive, the probability is:
P(2 defective out of 4) = P(NNDD or NDDN or ! or DNDN)= P(NNDD) + P(NDDN) +!+ P(DNDN)= 0.0441+ 0.0441 +!+ 0.0441= 6(0.0441) = 0.2646
4. Sample response: The total probability is found by counting the number of possible outcomes in which exactly 3 defective disks occur and multiplying this number by the probability of one of the outcomes.
180
f. 1. Sample response: A binomial experiment can be used to model the sampling without replacement in a large population because the probabilities are extremely close to the ones obtained by sampling with replacement.
2. Sample response: It would not be acceptable to model sampling without replacement if the population is small or when the sample size is large relative to the population size. For example, if there are 5 items, 3 of which are defective, the probability of a sample of 4 items having 3 defective is approximately 0.3 without replacement. With replacement, the probability is 0.4. The difference is even greater using a sample size of 5. The probability of having 3 defective items is approximately 0.3 with replacement, and 1 without replacement.
g. Sample response: From the mathematics note on conditional probability, P(A and B) = P(A) • P(BA) . Dividing both sides of this equation by P(A) results in the following relationship:
P(A and B)P(A)
= P(B A)
Given that A and B are independent events, P(A and B) = P(A) • P(B) . Substituting into the relationship above:
P(A) •P(B)P(A)
= P(BA)
P(B) = P(BA)
Assignment (page 137) *1.1 a. A trial is the selection and inspection of a disc. b. Since the inspected disc is returned to the population, the
population does not change from trial to trial. Hence, the trials are independent.
c. Answers will vary. A success might be defined as selecting a defective disc or selecting a nondefective disc.
d. Sample response: This is a binomial experiment. It consists of repeating a trial, the trials are independent of each other, there are two possible outcomes on each trial, and the possibility of selecting a defective CD remains the same from trial to trial.
1.2 a. The probability of selecting a defective chip is 1050 5000 = 0. 21 . b. If the first chip is not defective, the probability of obtaining a
defective chip on the second draw is 1050 4999 ≈ 0. 2100 . If the first chip is defective, the probability is 1049 4999 ≈ 0. 2098.
c. If a sample of 10 chips including 4 defectives is removed, the probability is 1046 4990 ≈ 0. 2096 .
181
d. Answers may vary. Students should recognize that the changes in the probabilities are very small. This process can be reasonably modeled by a binomial experiment.
*1.3 a. This is a binomial experiment. b. This is not a binomial experiment because it involves sampling
without replacement. A binomial experiment would not be a reasonable model because the sample size is large relative the population size. The change in probabilities between trials would be significant.
c. This is not a binomial experiment because there are more than two possible outcomes.
d. If sampling is done with replacement, this is a binomial experiment. If sampling is done without replacement, this is not a binomial experiment. In this case, a binomial experiment would be a reasonable model because the sample size is very small when compared to the population size.
e. This is a binomial experiment. * * * * *
1.4 a. A trial consists of rolling the die and recording the result. b. The trials are independent because the outcome of one roll of the
die does not affect the outcome of the next roll. c. Most students probably will decide that a success means rolling a
5 or a 6; but rolling a number less than 5 could also be defined as a success as long as a failure is defined as rolling a 5 or a 6.
d. If a 5 or a 6 is a success, then the probability is 1 3 ; if a success is a roll less than 5, the probability is 2 3.
e. This is a binomial experiment because there are a fixed number of repetitions, the trials are independent, there are two possible outcomes, and the probability of a success is constant from one trial to the next.
1.5 Answers may vary. Sample response: Draw 1 card from a deck of 52 and determine if the card is a heart or not. Replace the card. Repeat this trial 5 times. Note: If students design experiments that do not include replacement, they should explain how their experiments can be modeled by a binomial experiment because of a large population and a relatively small sample size.
182
1.6 a. Since a sample of size 30 taken without replacement is the entire population and there are 5 defective bulbs in the population, P(4) = 0 and P(5) = 1.
b. Sample response: The probabilities for the same events when sampling with replacement and without replacement are very different. In this situation, sampling with replacement does not give an accurate estimate of the population parameters.
c. Sample response: In order for the sampling process to be modeled reasonably well by a binomial experiment, the sample size must be small in relation to the population size.
* * * * * * * * * * (page 138)
Activity 2 In this activity, students develop and apply the formula for binomial probability.
Materials List • none
Discussion (page 139) a. Sample response: The tree would be very large. It would have
210 = 1024 separate branches. b. 1. Sample response: If the sample size is small relative to the size of
the population, you could approximate the probability as shown below:
DNDD = (0.3)(0.7)(0.3)(0.3) = (0.7)1 • (0.3)3 = 0.0189
2. Sample response: The exponent on (0.7) represents the number of good disks in the sample. The exponent on (0.3) represents the number of defective disks in the sample.
3. There are 3 other ways that 3 defective items can occur in a sample of 4: DDDN, DDND, and NDDD.
4. Sample response: Yes. The approximate probability of each outcome is a product containing 0.7 one time and 0.3 three times.
5. The number of possible outcomes that contain 3 defective disks in a sample of 4 disks is C(4, 3) . Note: In general, the number of possible outcomes that contain r defective items in a sample of size n, is C(n, r) .
183
6. Sample response: One way to look at this is to add the probabilities of each possible outcome in which 3 of the 4 items are defective. In other words, the total probability is:
P(3 of 4 defective ) = P(DDDN) + P(DDND) + P(DNDD) +P(NDDD)
= 0.0189 + 0.0189 + 0.0189 + 0.0189= 0.0756
Another way is to determine the number of ways that 3 defective disks can occur in a sample of size 4 and multiply this number times the probability of one of the outcomes:
C(4, 3)• (0.3)3 • (0.7)1 = 0.0756 In other words, there are C(4, 3) terms in the sum and each term
equals (0.3)3 •(0.7)1 . c. 1. Sample response: The quantity (1 − p) represents the probability
of failure. Since the total probability for an experiment is 1 and there are only two choices, success or failure, the probability of failure is 1 minus the probability of success, or (1 − p) .
2. Sample response: The expression pr • qn− r describes the probability of any one of the possible outcomes in which r trials are successes and n − r are failures.
d. 1. Sample response: Determine the number of ways that 7 defective disks can occur in a sample of 10 and multiply this number times the probability of one of these outcomes:
C(10, 7) • (0.4)7 • (0.6)3 ≈ 0.0425 2. Sample response: Use the binomial formula to determine the
probability of having 7 defective disks out of 10, 8 defective disks out of 10, 9 defective disks out of 10, and 10 defective disks out of 10, then add those probabilities:
C(10, 7) • (0.4)7(0.6)3 + C(10, 8) • (0.4)8 (0.6)2 +C(10, 9) • (0.4)9(0.6)1 + C(10,10) • (0.4)10(0.6)0 ≈ 0.0548
Assignment (page 140) 2.1 a. Answers will vary. Sample response: DDDNNNNN. b. For the sample response given in Part a, the probability may be
determined as follows:
(0.3)(0.3)(0.3)(0.7)(0.7)(0.7)(0.7)(0.7) = (0.3)3 • (0.7)5
c. C(8, 3)
d. C(8, 3)• (0.3)3 • (0.7)5
e. 56 • (0.3)3 • (0.7)5 ≈ 0.25
184
2.2 a. 0.95 b. 0.05
c. C(100, 20) ≈ 5.36 • 1020
d. C(100,80) ≈ 5.36 •1020
e. C(100, 20) • (0.05)20 • (0.95)80 ≈ 8.44 • 10−8
*2.3 a. 1. C(4, 0) • (0.2)0 • (0.8)4 = 0.4096
2. C(4,1) • (0.2)1 • (0.8)3 = 0.4096
3. C(4, 2) • (0.2)2 • (0.8)2 = 0.1536
4. C(4, 3)• (0.2)3 • (0.8)1 = 0.0256
5. C(4, 4) • (0.2)0 • (0.8)4 = 0.0016
b. The sum of the probabilities is 1 because all the possible outcomes in the experiment are represented.
c. C(4, 3)• (0.2)3 • (0.8)1 + C(4, 4)• (0.2)0 • (0.8)4 = 0.0272
2.4 Sample response: With a defect rate of 10%, it is possible to have 20 defective chips in a sample of 20. However, this occurrence will be very rare if the sampling is random. You can use the binomial formula to calculate the probability of this occurring:
C(20, 20) • (0.1)20 • (0.9)0 = 1•10−20
If the sampling is not random, the probability might be much higher. *2.5 Students should use the binomial formula to determine the probability
of obtaining 20 passing discs out of 20, 19 passing discs out of 20, and 18 passing disks out of 20, then add those probabilities: C(20, 20) • (0.9)20 • (0.1)0 + C(20,19) • (0.9)19 • (0.1)1 +C(20,18)(0.9)18 • (0.1)2 ≈ 0.6769
* * * * * 2.6 a. If the majority of the sample support the booth, then either 3, 4, or
5 students support the booth. The probability is:
C(5,3) • (0.75)3 • (0.25)2 + C(5, 4) • (0.75)4 • (0.25)1 +C(5,5) • (0.75)5 • (0.25)0 ≈ 0.8965
b. C(5,0)• (0.75)0 • (0.25)5 ≈ 0.0010
c. C(5,5) • (0.75)5 • (0.25)0 ≈ 0.2373
185
d. If less than half the sample support the booth, then either 0, 1, or 2 students support the booth. The probability is:
C(5,0)• (0.75)0 • (0.25)5 + C(5,1) • (0.75)1 • (0.25)4 +C(5,2)• (0.75)2 • (0.25)3 ≈ 0.1035
2.7 a. The theoretical probability that Clyde will make at least 9 of his next 10 free throws is 0.376. This can be determined as follows:
C(10, 9)• (0.8)9 • (0.2)1 + C(10,10) • (0.8)10 • (0.2)0 ≈ 0.376
b. The theoretical probability that Clyde will make at least 8 of his next 10 free throws is 0.678. This can be determined as follows:
C(10,8) • (0.8)8 • (0.2)2 +C(10, 9) • (0.8)9 • (0.2)1 +C(10,10) • (0.8)10 • (0.2)0 ≈ 0.678
* * * * * * * * * * (page 142)
Activity 3 In this activity, students create a binomial distribution, find its expected value, and calculate the probability of various outcomes within the distribution.
Materials List • none
Technology • spreadsheet • statistics package (optional)
Teacher Note Students should use technology, such as a spreadsheet, statistics package, or programmable calculator, to create the probability distribution tables in the following exploration. The following program, for example, was written for the TI-92 calculator. It computes the probability distribution for a binomial experiment with N trials and probability of success P. The possible outcomes are stored in List1; the corresponding probabilities are stored in List2.
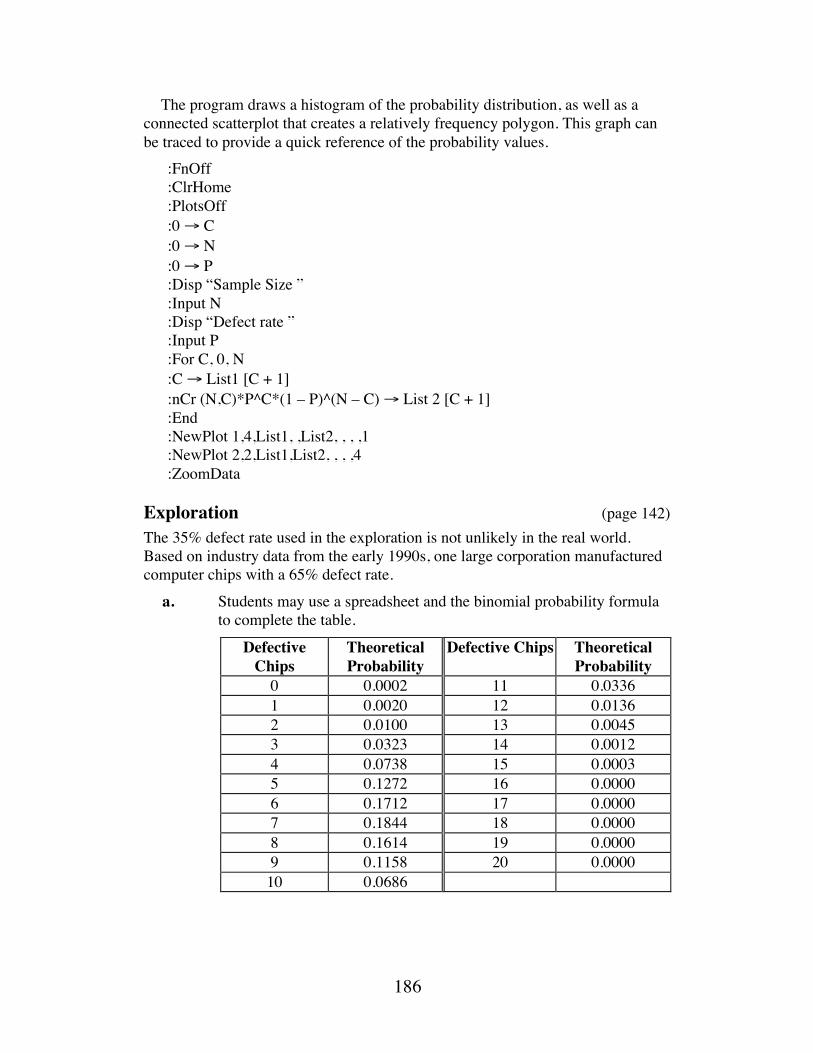
186
The program draws a histogram of the probability distribution, as well as a connected scatterplot that creates a relatively frequency polygon. This graph can be traced to provide a quick reference of the probability values.
:FnOff :ClrHome :PlotsOff :0 → C :0 → N :0 → P :Disp “Sample Size ” :Input N :Disp “Defect rate ” :Input P :For C, 0, N :C → List1 [C + 1] :nCr (N,C)*P^C*(1 – P)^(N – C) → List 2 [C + 1] :End :NewPlot 1,4,List1, ,List2, , , ,1 :NewPlot 2,2,List1,List2, , , ,4 :ZoomData
Exploration (page 142) The 35% defect rate used in the exploration is not unlikely in the real world. Based on industry data from the early 1990s, one large corporation manufactured computer chips with a 65% defect rate. a. Students may use a spreadsheet and the binomial probability formula
to complete the table.
Defective Chips
Theoretical Probability
Defective Chips Theoretical Probability
0 0.0002 11 0.0336 1 0.0020 12 0.0136 2 0.0100 13 0.0045 3 0.0323 14 0.0012 4 0.0738 15 0.0003 5 0.1272 16 0.0000 6 0.1712 17 0.0000 7 0.1844 18 0.0000 8 0.1614 19 0.0000 9 0.1158 20 0.0000 10 0.0686
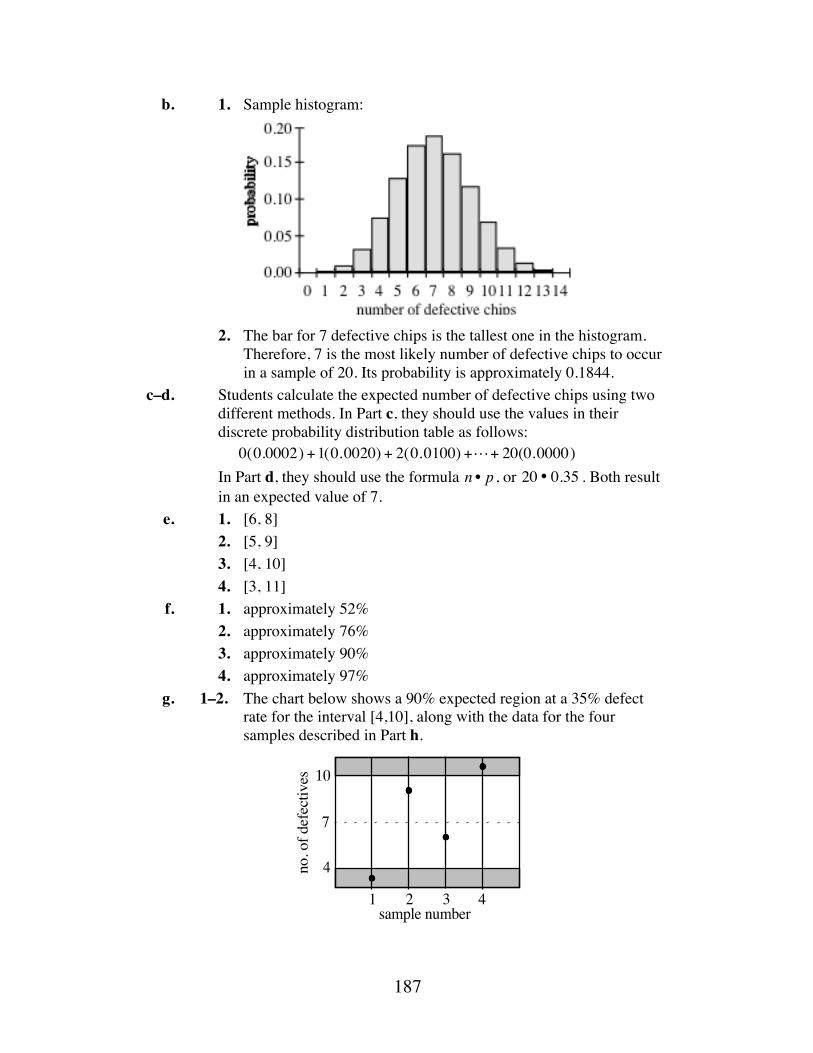
187
b. 1. Sample histogram:
2. The bar for 7 defective chips is the tallest one in the histogram.
Therefore, 7 is the most likely number of defective chips to occur in a sample of 20. Its probability is approximately 0.1844.
c–d. Students calculate the expected number of defective chips using two different methods. In Part c, they should use the values in their discrete probability distribution table as follows:
0(0.0002) +1(0.0020) + 2(0.0100) +!+ 20(0.0000) In Part d, they should use the formula n • p , or 20 • 0.35 . Both result
in an expected value of 7. e. 1. [6, 8] 2. [5, 9] 3. [4, 10] 4. [3, 11] f. 1. approximately 52% 2. approximately 76% 3. approximately 90% 4. approximately 97% g. 1–2. The chart below shows a 90% expected region at a 35% defect
rate for the interval [4,10], along with the data for the four samples described in Part h.
1 2 3 4
sample number
7
10
4no. o
f def
ectiv
es
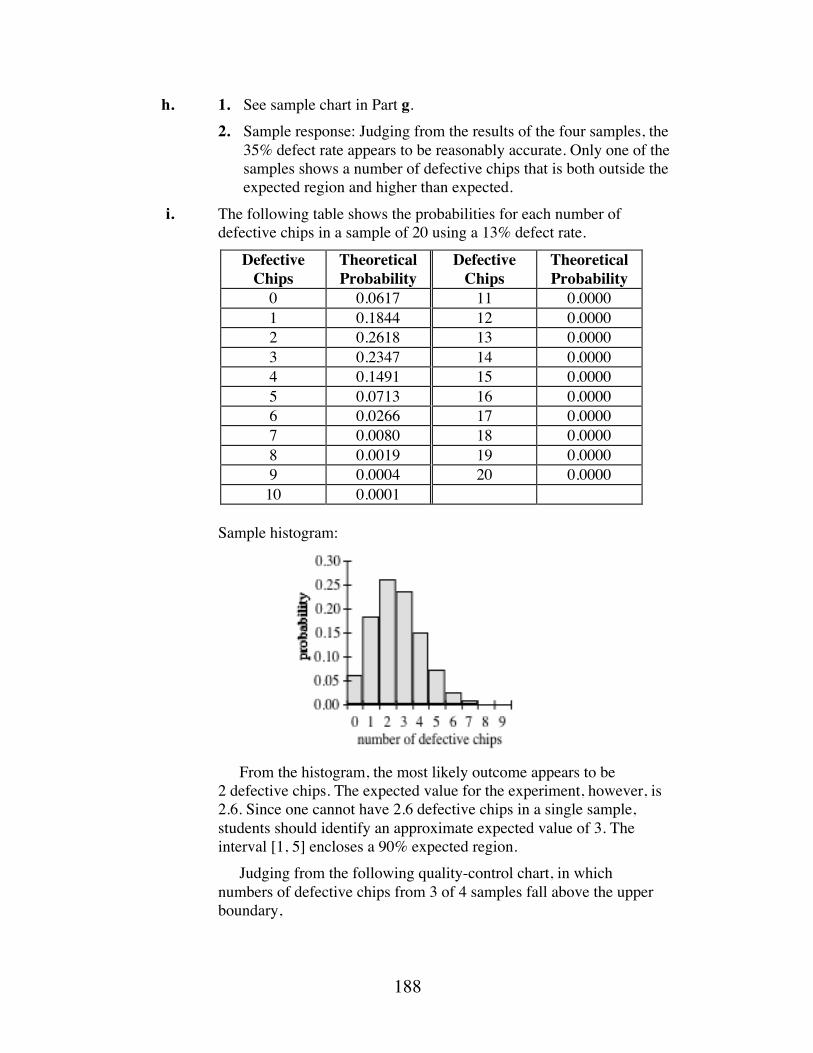
188
h. 1. See sample chart in Part g. 2. Sample response: Judging from the results of the four samples, the
35% defect rate appears to be reasonably accurate. Only one of the samples shows a number of defective chips that is both outside the expected region and higher than expected.
i. The following table shows the probabilities for each number of defective chips in a sample of 20 using a 13% defect rate.
Defective Chips
Theoretical Probability
Defective Chips
Theoretical Probability
0 0.0617 11 0.0000 1 0.1844 12 0.0000 2 0.2618 13 0.0000 3 0.2347 14 0.0000 4 0.1491 15 0.0000 5 0.0713 16 0.0000 6 0.0266 17 0.0000 7 0.0080 18 0.0000 8 0.0019 19 0.0000 9 0.0004 20 0.0000 10 0.0001
Sample histogram:
From the histogram, the most likely outcome appears to be
2 defective chips. The expected value for the experiment, however, is 2.6. Since one cannot have 2.6 defective chips in a single sample, students should identify an approximate expected value of 3. The interval [1, 5] encloses a 90% expected region.
Judging from the following quality-control chart, in which numbers of defective chips from 3 of 4 samples fall above the upper boundary,
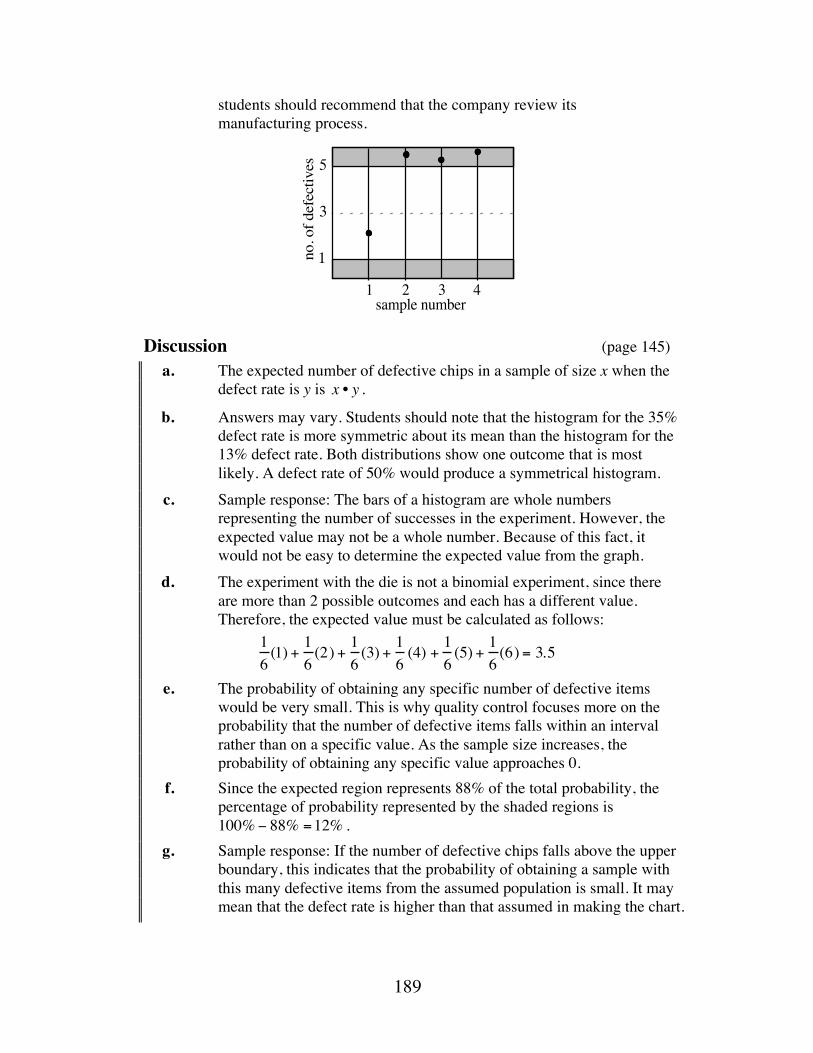
189
students should recommend that the company review its manufacturing process.
Discussion (page 145) a. The expected number of defective chips in a sample of size x when the
defect rate is y is x • y .
b. Answers may vary. Students should note that the histogram for the 35% defect rate is more symmetric about its mean than the histogram for the 13% defect rate. Both distributions show one outcome that is most likely. A defect rate of 50% would produce a symmetrical histogram.
c. Sample response: The bars of a histogram are whole numbers representing the number of successes in the experiment. However, the expected value may not be a whole number. Because of this fact, it would not be easy to determine the expected value from the graph.
d. The experiment with the die is not a binomial experiment, since there are more than 2 possible outcomes and each has a different value. Therefore, the expected value must be calculated as follows:
16(1) + 1
6(2) + 1
6(3) + 1
6(4) + 1
6(5) + 1
6(6) = 3.5
e. The probability of obtaining any specific number of defective items would be very small. This is why quality control focuses more on the probability that the number of defective items falls within an interval rather than on a specific value. As the sample size increases, the probability of obtaining any specific value approaches 0.
f. Since the expected region represents 88% of the total probability, the percentage of probability represented by the shaded regions is 100% − 88% =12% .
g. Sample response: If the number of defective chips falls above the upper boundary, this indicates that the probability of obtaining a sample with this many defective items from the assumed population is small. It may mean that the defect rate is higher than that assumed in making the chart.
1 2 3 4sample number
3
5
1no.
of d
efec
tives
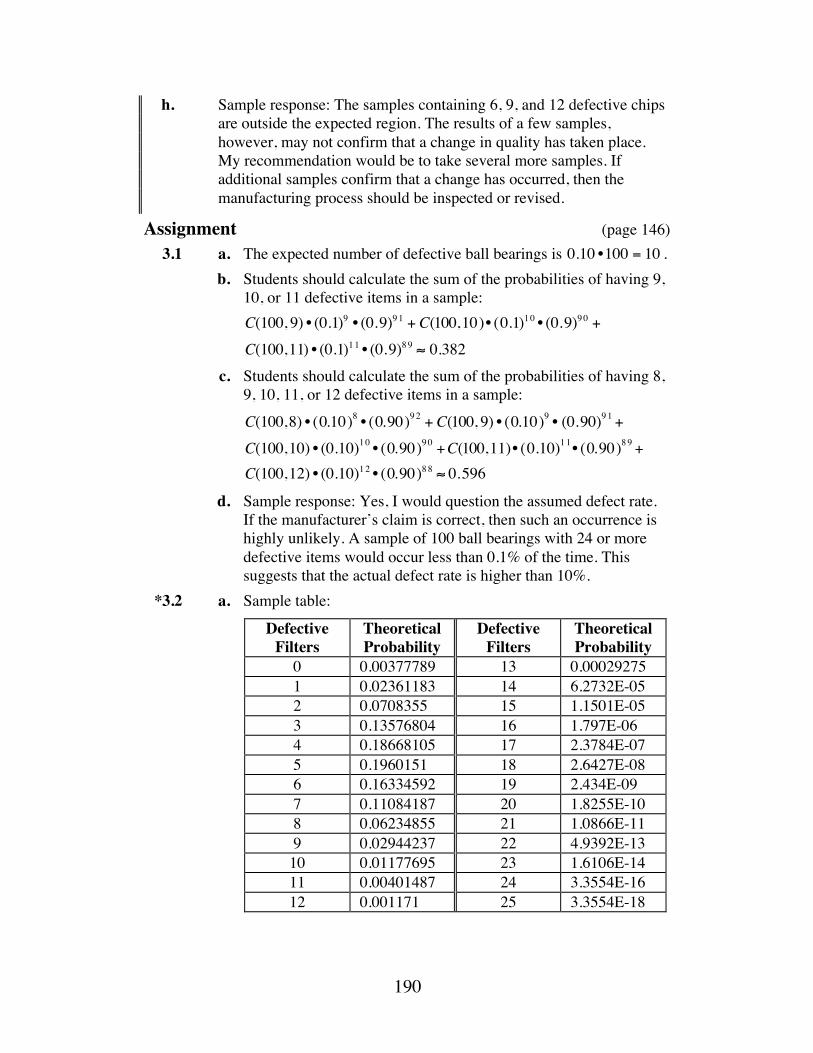
190
h. Sample response: The samples containing 6, 9, and 12 defective chips are outside the expected region. The results of a few samples, however, may not confirm that a change in quality has taken place. My recommendation would be to take several more samples. If additional samples confirm that a change has occurred, then the manufacturing process should be inspected or revised.
Assignment (page 146) 3.1 a. The expected number of defective ball bearings is 0.10 •100 = 10 . b. Students should calculate the sum of the probabilities of having 9,
10, or 11 defective items in a sample:
C(100, 9) • (0.1)9 • (0.9)91 + C(100,10)• (0.1)10 • (0.9)90 +C(100,11) • (0.1)11 • (0.9)89 ≈ 0.382
c. Students should calculate the sum of the probabilities of having 8, 9, 10, 11, or 12 defective items in a sample:
C(100,8) • (0.10)8 • (0.90)92 + C(100, 9) • (0.10)9 • (0.90)91 +C(100,10) • (0.10)10 • (0.90)90 +C(100,11)• (0.10)11• (0.90)89 +C(100,12) • (0.10)12 • (0.90)88 ≈ 0.596
d. Sample response: Yes, I would question the assumed defect rate. If the manufacturer’s claim is correct, then such an occurrence is highly unlikely. A sample of 100 ball bearings with 24 or more defective items would occur less than 0.1% of the time. This suggests that the actual defect rate is higher than 10%.
*3.2 a. Sample table:
Defective Filters
Theoretical Probability
Defective Filters
Theoretical Probability
0 0.00377789 13 0.00029275 1 0.02361183 14 6.2732E-05 2 0.0708355 15 1.1501E-05 3 0.13576804 16 1.797E-06 4 0.18668105 17 2.3784E-07 5 0.1960151 18 2.6427E-08 6 0.16334592 19 2.434E-09 7 0.11084187 20 1.8255E-10 8 0.06234855 21 1.0866E-11 9 0.02944237 22 4.9392E-13 10 0.01177695 23 1.6106E-14 11 0.00401487 24 3.3554E-16 12 0.001171 25 3.3554E-18
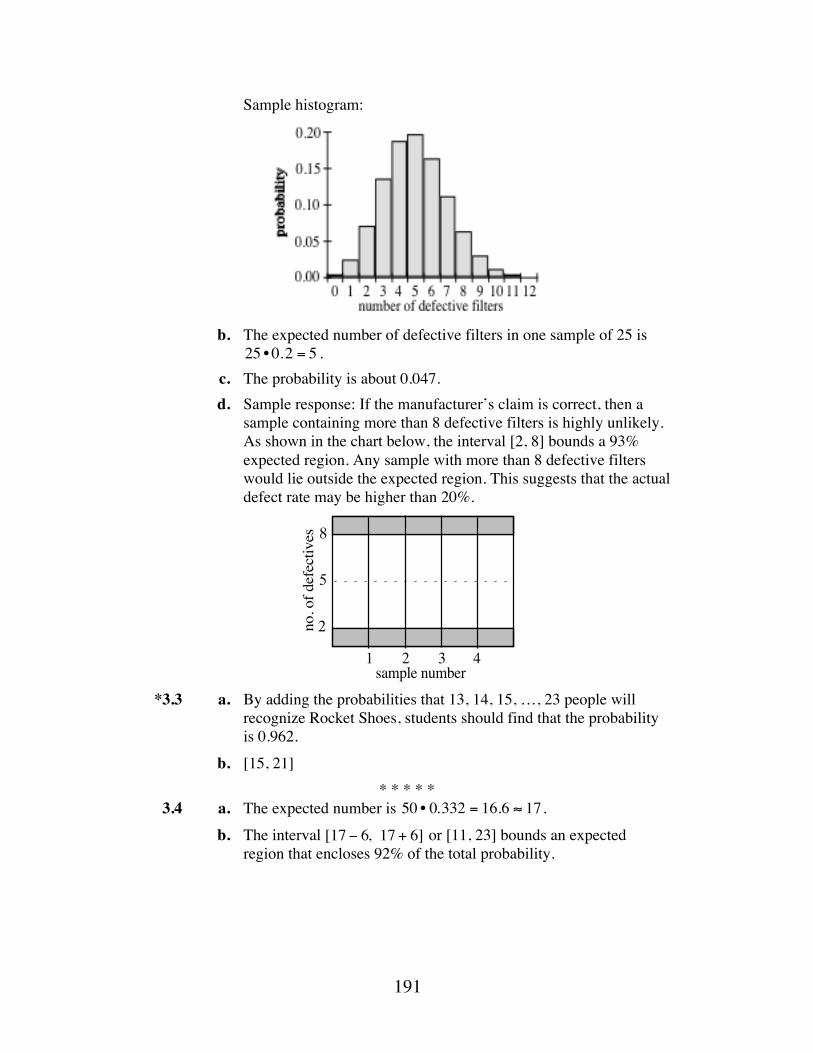
191
Sample histogram:
b. The expected number of defective filters in one sample of 25 is
25 • 0.2 = 5 . c. The probability is about 0.047. d. Sample response: If the manufacturer’s claim is correct, then a
sample containing more than 8 defective filters is highly unlikely. As shown in the chart below, the interval [2, 8] bounds a 93% expected region. Any sample with more than 8 defective filters would lie outside the expected region. This suggests that the actual defect rate may be higher than 20%.
*3.3 a. By adding the probabilities that 13, 14, 15, …, 23 people will
recognize Rocket Shoes, students should find that the probability is 0.962.
b. [15, 21] * * * * *
3.4 a. The expected number is 50 • 0.332 = 16.6 ≈ 17 . b. The interval [17 − 6, 17 + 6] or [11, 23] bounds an expected
region that encloses 92% of the total probability.
1 2 3 4sample number
5
8
2no. o
f def
ectiv
es
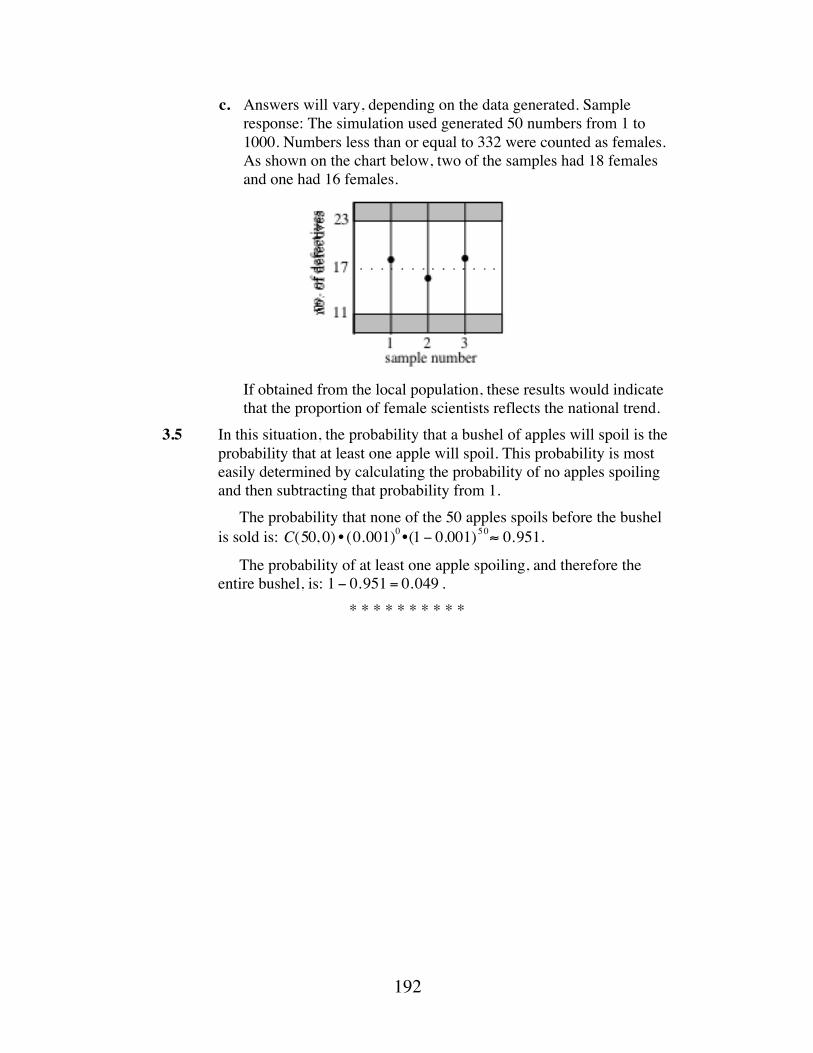
192
c. Answers will vary, depending on the data generated. Sample response: The simulation used generated 50 numbers from 1 to 1000. Numbers less than or equal to 332 were counted as females. As shown on the chart below, two of the samples had 18 females and one had 16 females.
If obtained from the local population, these results would indicate
that the proportion of female scientists reflects the national trend. 3.5 In this situation, the probability that a bushel of apples will spoil is the
probability that at least one apple will spoil. This probability is most easily determined by calculating the probability of no apples spoiling and then subtracting that probability from 1.
The probability that none of the 50 apples spoils before the bushel is sold is: C(50, 0) • (0.001)0 •(1 − 0.001)50≈ 0.951.
The probability of at least one apple spoiling, and therefore the entire bushel, is: 1 − 0.951 = 0.049 .
* * * * * * * * * *
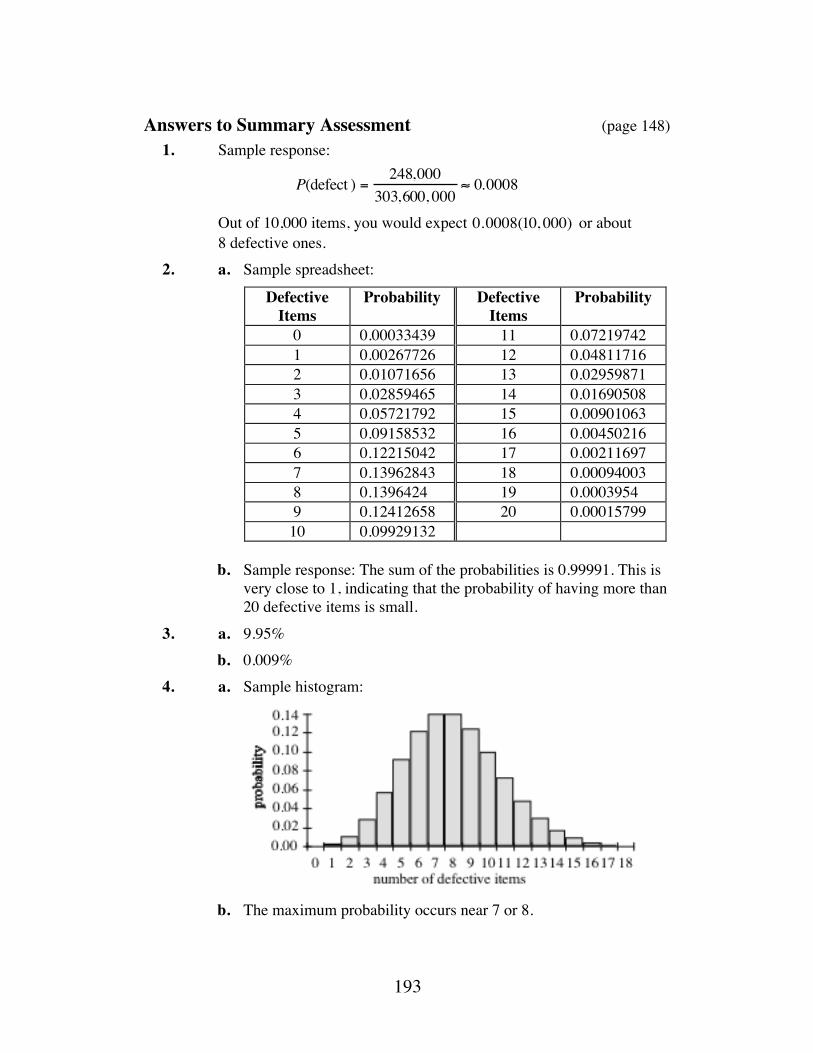
193
Answers to Summary Assessment (page 148) 1. Sample response:
P(defect ) =248,000
303,600, 000≈ 0.0008
Out of 10,000 items, you would expect 0.0008(10, 000) or about 8 defective ones.
2. a. Sample spreadsheet:
Defective Items
Probability Defective Items
Probability
0 0.00033439 11 0.07219742 1 0.00267726 12 0.04811716 2 0.01071656 13 0.02959871 3 0.02859465 14 0.01690508 4 0.05721792 15 0.00901063 5 0.09158532 16 0.00450216 6 0.12215042 17 0.00211697 7 0.13962843 18 0.00094003 8 0.1396424 19 0.0003954 9 0.12412658 20 0.00015799 10 0.09929132
b. Sample response: The sum of the probabilities is 0.99991. This is
very close to 1, indicating that the probability of having more than 20 defective items is small.
3. a. 9.95% b. 0.009% 4. a. Sample histogram:
b. The maximum probability occurs near 7 or 8.

194
c. Sample response: One percent of 10,000 is 100. As shown by the histogram, the probability of having more than 18 defective items is extremely small. The probability of having 100 defective items would be even smaller, but still possible.
5. Answers may vary. Sample response: In a sample of 10,000 items, the expected number of defective items would be 8. An interval of [4, 12] bounds an expected region of about 89%. If more than 12 defective items occur in one sample, this may indicate that more samples need to be taken. If such results continue to occur, it may indicate that a problem exists in the manufacturing process.
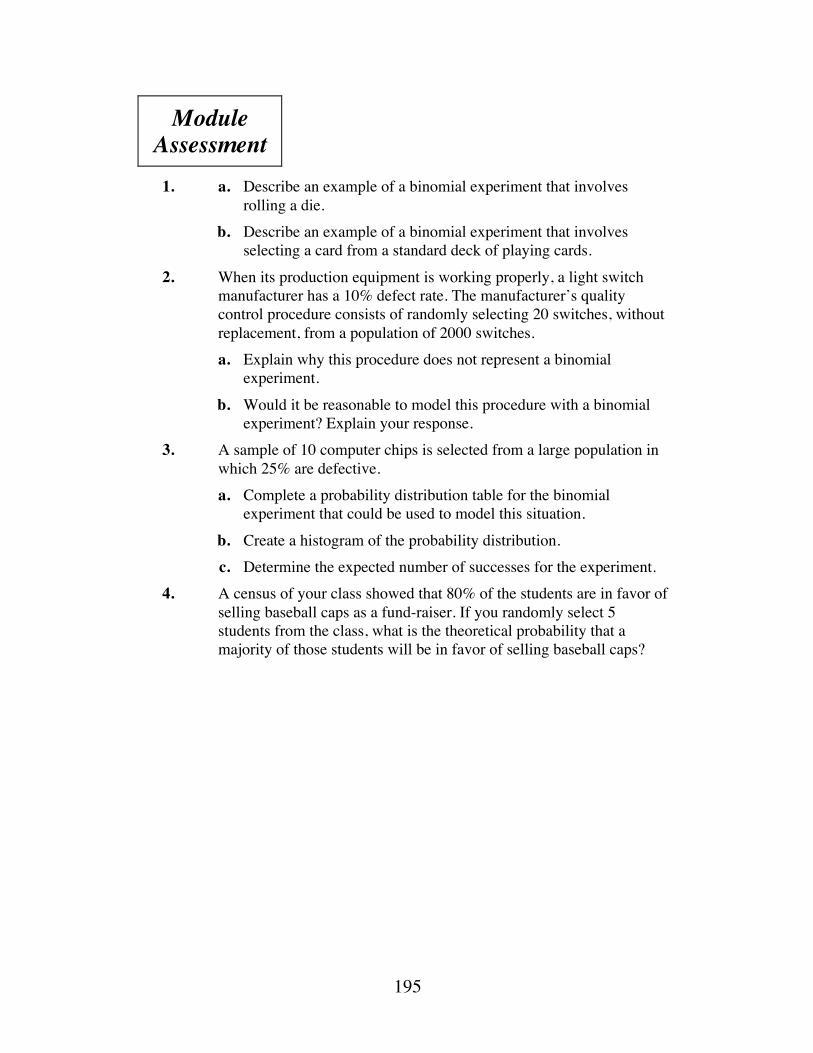
195
Module Assessment
1. a. Describe an example of a binomial experiment that involves
rolling a die. b. Describe an example of a binomial experiment that involves
selecting a card from a standard deck of playing cards. 2. When its production equipment is working properly, a light switch
manufacturer has a 10% defect rate. The manufacturer’s quality control procedure consists of randomly selecting 20 switches, without replacement, from a population of 2000 switches.
a. Explain why this procedure does not represent a binomial experiment.
b. Would it be reasonable to model this procedure with a binomial experiment? Explain your response.
3. A sample of 10 computer chips is selected from a large population in which 25% are defective.
a. Complete a probability distribution table for the binomial experiment that could be used to model this situation.
b. Create a histogram of the probability distribution. c. Determine the expected number of successes for the experiment. 4. A census of your class showed that 80% of the students are in favor of
selling baseball caps as a fund-raiser. If you randomly select 5 students from the class, what is the theoretical probability that a majority of those students will be in favor of selling baseball caps?
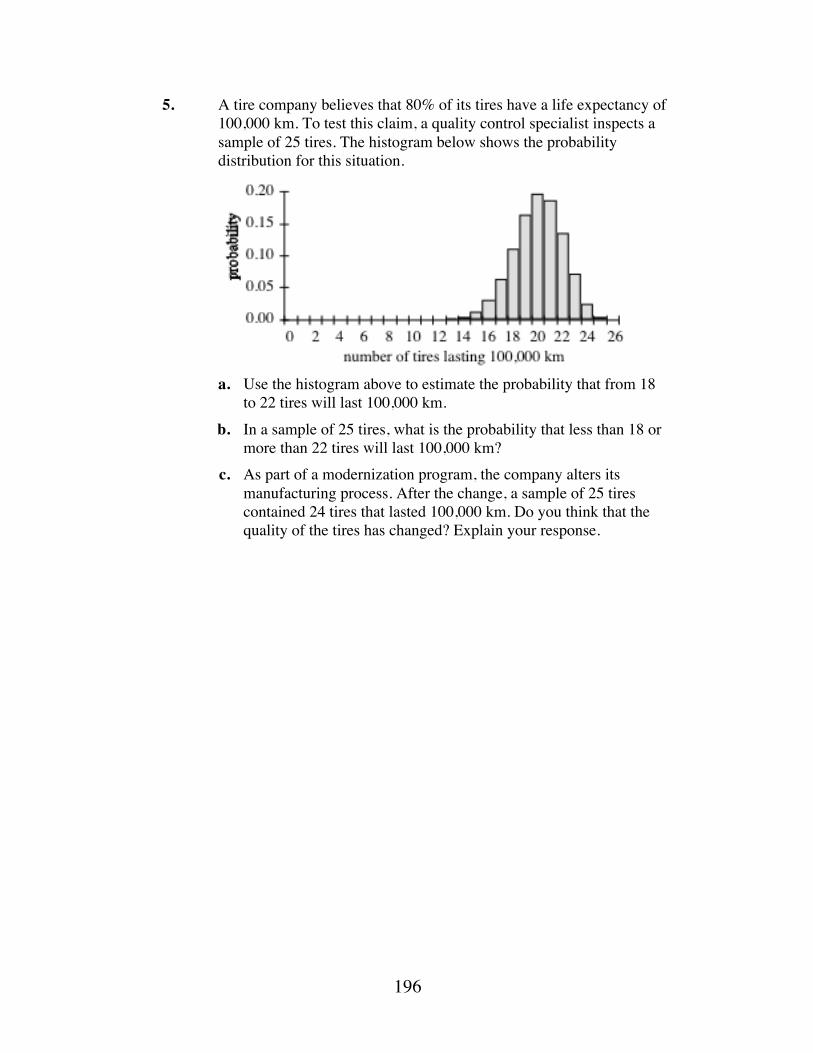
196
5. A tire company believes that 80% of its tires have a life expectancy of 100,000 km. To test this claim, a quality control specialist inspects a sample of 25 tires. The histogram below shows the probability distribution for this situation.
a. Use the histogram above to estimate the probability that from 18
to 22 tires will last 100,000 km. b. In a sample of 25 tires, what is the probability that less than 18 or
more than 22 tires will last 100,000 km? c. As part of a modernization program, the company alters its
manufacturing process. After the change, a sample of 25 tires contained 24 tires that lasted 100,000 km. Do you think that the quality of the tires has changed? Explain your response.
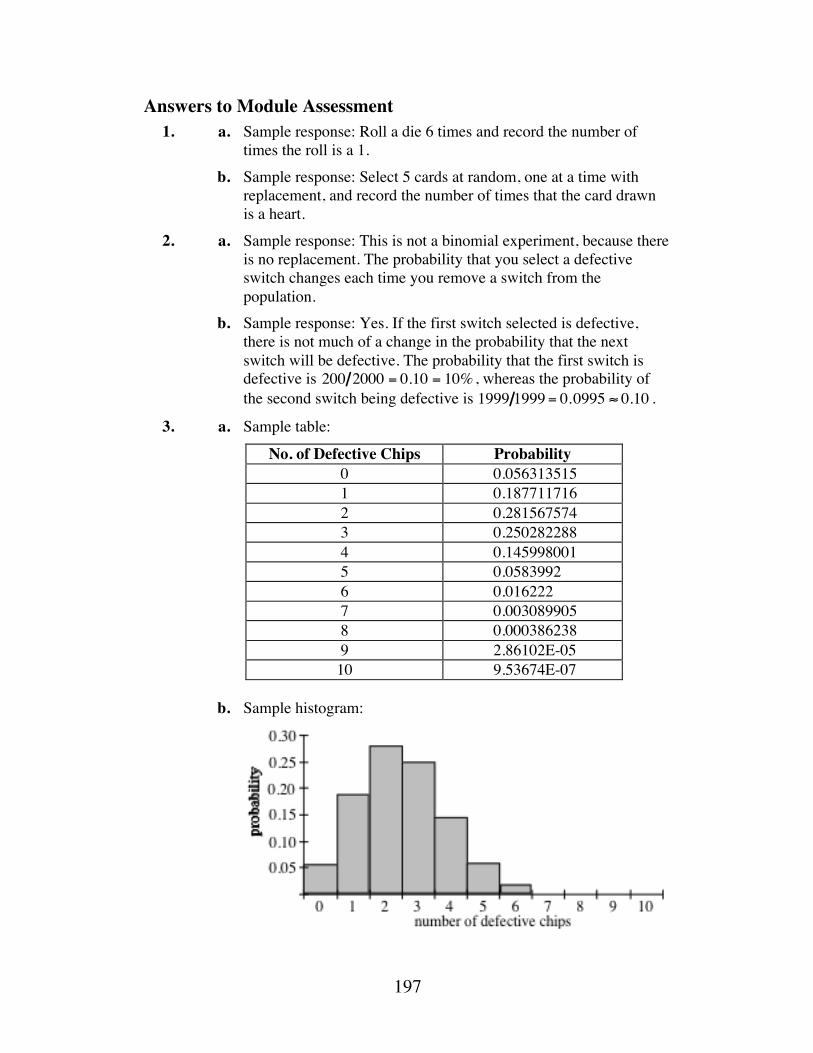
197
Answers to Module Assessment 1. a. Sample response: Roll a die 6 times and record the number of
times the roll is a 1. b. Sample response: Select 5 cards at random, one at a time with
replacement, and record the number of times that the card drawn is a heart.
2. a. Sample response: This is not a binomial experiment, because there is no replacement. The probability that you select a defective switch changes each time you remove a switch from the population.
b. Sample response: Yes. If the first switch selected is defective, there is not much of a change in the probability that the next switch will be defective. The probability that the first switch is defective is 200 2000 = 0.10 = 10% , whereas the probability of the second switch being defective is 1999 1999 = 0.0995 ≈ 0.10 .
3. a. Sample table:
No. of Defective Chips Probability 0 0.056313515 1 0.187711716 2 0.281567574 3 0.250282288 4 0.145998001 5 0.0583992 6 0.016222 7 0.003089905 8 0.000386238 9 2.86102E-05 10 9.53674E-07
b. Sample histogram:
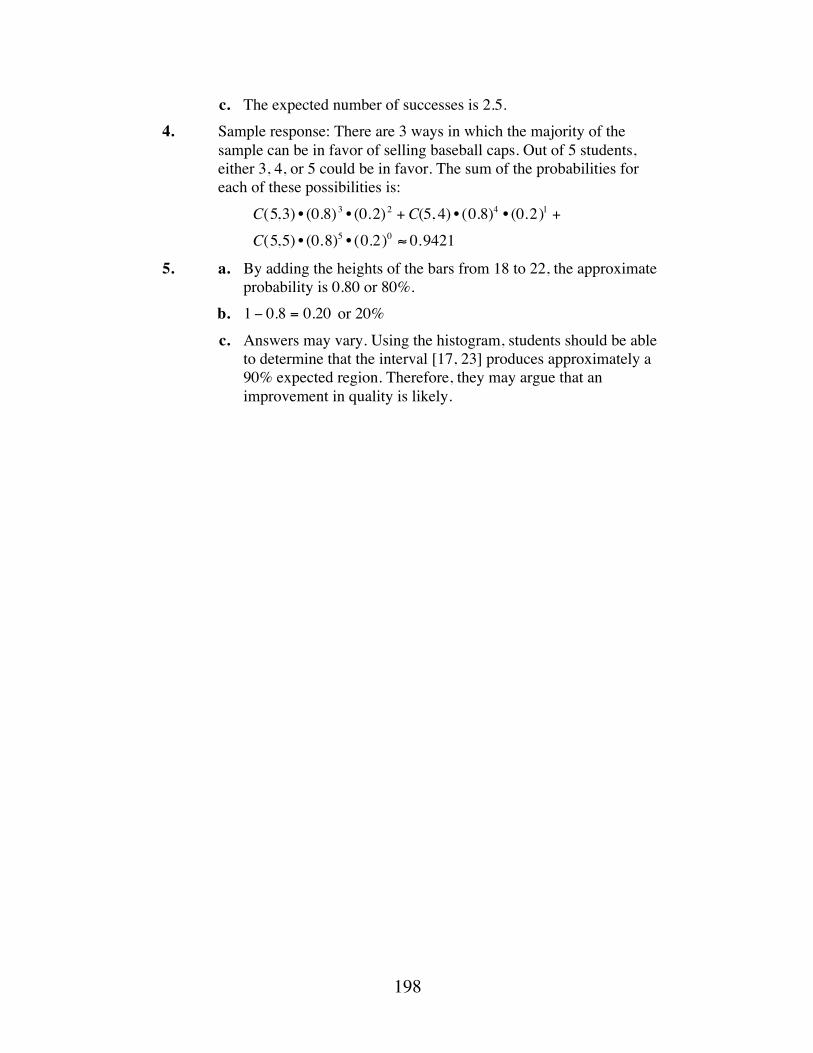
198
c. The expected number of successes is 2.5. 4. Sample response: There are 3 ways in which the majority of the
sample can be in favor of selling baseball caps. Out of 5 students, either 3, 4, or 5 could be in favor. The sum of the probabilities for each of these possibilities is:
C(5,3) • (0.8)3 • (0.2)2 + C(5, 4) • (0.8)4 • (0.2)1 +C(5,5) • (0.8)5 • (0.2)0 ≈ 0.9421
5. a. By adding the heights of the bars from 18 to 22, the approximate probability is 0.80 or 80%.
b. 1 − 0.8 = 0.20 or 20% c. Answers may vary. Using the histogram, students should be able
to determine that the interval [17, 23] produces approximately a 90% expected region. Therefore, they may argue that an improvement in quality is likely.
199
Selected References Kvanli, A. H., C. S. Guynes, and R. J. Pavur. Introduction to Business Statistics.
St. Paul, MN: West Publishing, 1986. Moore, D. S., and G. P. McCabe. Introduction to the Practice of Statistics. New
York: W. H. Freeman and Co., 1989. Whipkey, K. L., M. N. Whipkey, and G. W. Conway, Jr. The Power of
Mathematics. New York: John Wiley & Sons, 1978.
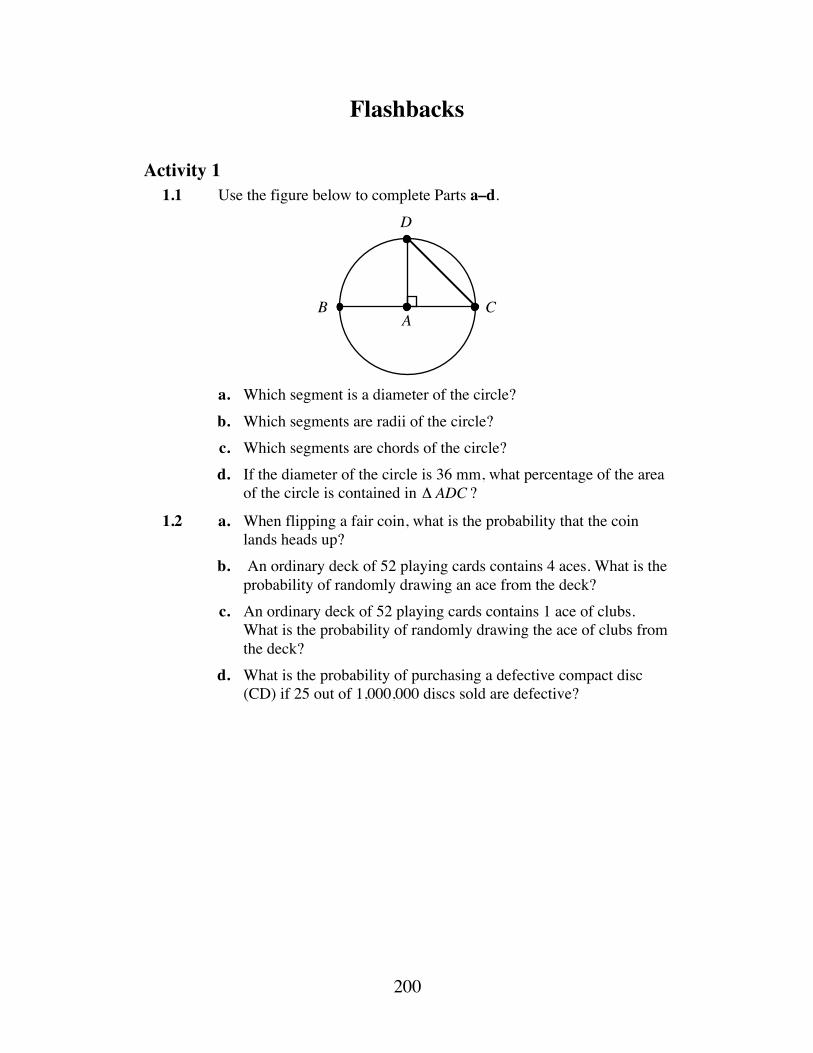
200
Flashbacks
Activity 1 1.1 Use the figure below to complete Parts a–d.
a. Which segment is a diameter of the circle? b. Which segments are radii of the circle? c. Which segments are chords of the circle? d. If the diameter of the circle is 36 mm, what percentage of the area
of the circle is contained in Δ ADC ?
1.2 a. When flipping a fair coin, what is the probability that the coin lands heads up?
b. An ordinary deck of 52 playing cards contains 4 aces. What is the probability of randomly drawing an ace from the deck?
c. An ordinary deck of 52 playing cards contains 1 ace of clubs. What is the probability of randomly drawing the ace of clubs from the deck?
d. What is the probability of purchasing a defective compact disc (CD) if 25 out of 1,000,000 discs sold are defective?
C
D
BA
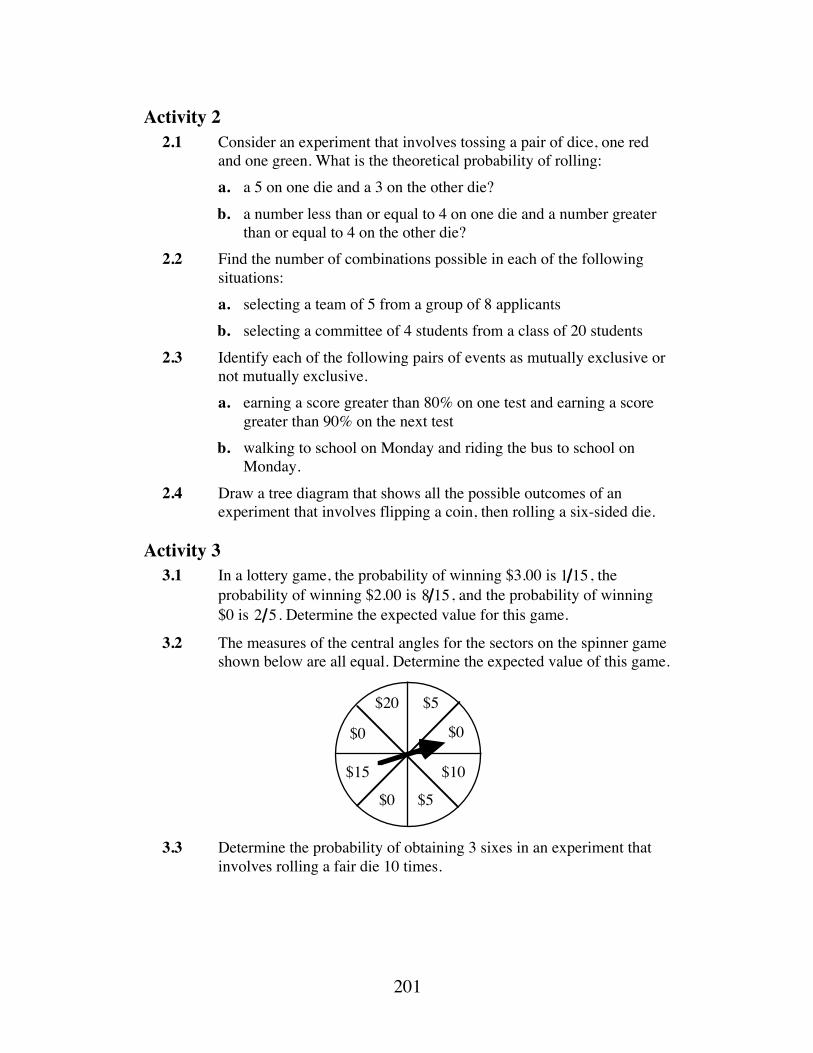
201
Activity 2 2.1 Consider an experiment that involves tossing a pair of dice, one red
and one green. What is the theoretical probability of rolling: a. a 5 on one die and a 3 on the other die? b. a number less than or equal to 4 on one die and a number greater
than or equal to 4 on the other die? 2.2 Find the number of combinations possible in each of the following
situations: a. selecting a team of 5 from a group of 8 applicants b. selecting a committee of 4 students from a class of 20 students 2.3 Identify each of the following pairs of events as mutually exclusive or
not mutually exclusive. a. earning a score greater than 80% on one test and earning a score
greater than 90% on the next test b. walking to school on Monday and riding the bus to school on
Monday. 2.4 Draw a tree diagram that shows all the possible outcomes of an
experiment that involves flipping a coin, then rolling a six-sided die.
Activity 3 3.1 In a lottery game, the probability of winning $3.00 is 1 15 , the
probability of winning $2.00 is 8 15, and the probability of winning $0 is 2 5 . Determine the expected value for this game.
3.2 The measures of the central angles for the sectors on the spinner game shown below are all equal. Determine the expected value of this game.
3.3 Determine the probability of obtaining 3 sixes in an experiment that
involves rolling a fair die 10 times.
$20
$10
$5
$5
$15
$0
$0
$0
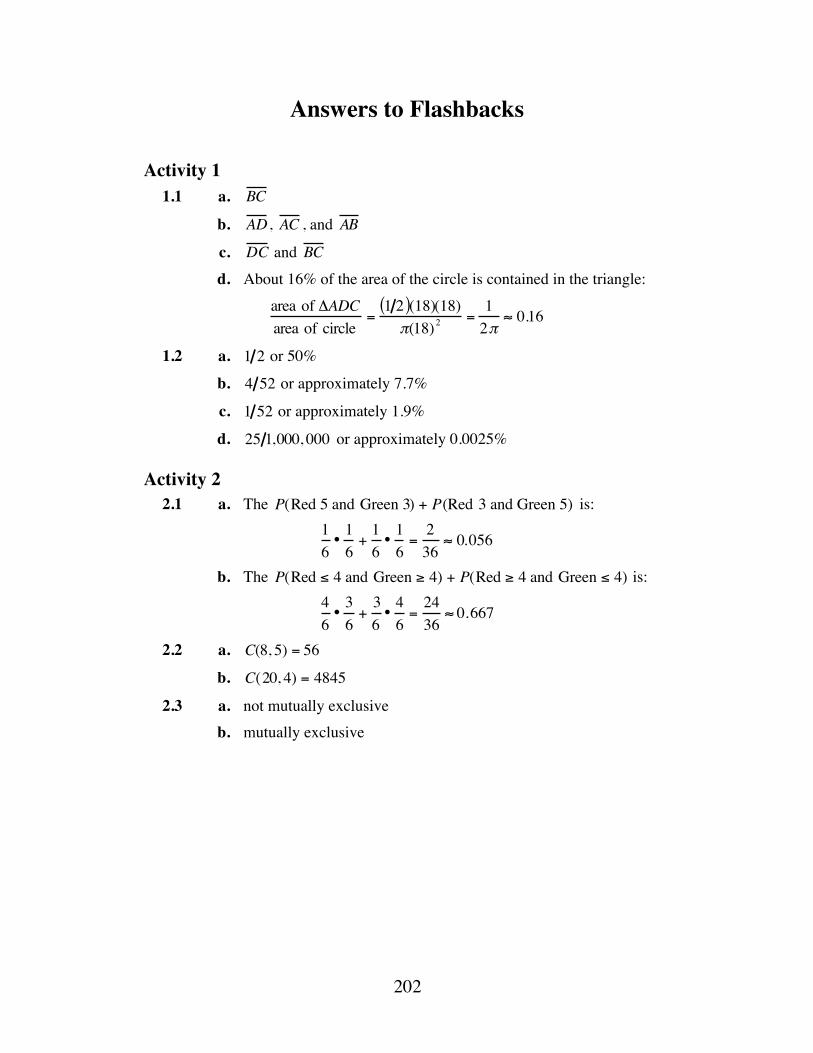
202
Answers to Flashbacks
Activity 1 1.1 a. BC
b. AD , AC , and AB
c. DC and BC d. About 16% of the area of the circle is contained in the triangle:
area of ΔADCarea of circle
=1 2( )(18)(18)π(18)2 =
12π
≈ 0.16
1.2 a. 1 2 or 50%
b. 4 52 or approximately 7.7%
c. 1 52 or approximately 1.9%
d. 25 1,000, 000 or approximately 0.0025%
Activity 2 2.1 a. The P(Red 5 and Green 3) + P(Red 3 and Green 5) is:
16•16+16•16=236
≈ 0.056
b. The P(Red ≤ 4 and Green ≥ 4) + P(Red ≥ 4 and Green ≤ 4) is: 46•36+36•46=2436
≈ 0.667
2.2 a. C(8, 5) = 56
b. C(20, 4) = 4845
2.3 a. not mutually exclusive b. mutually exclusive
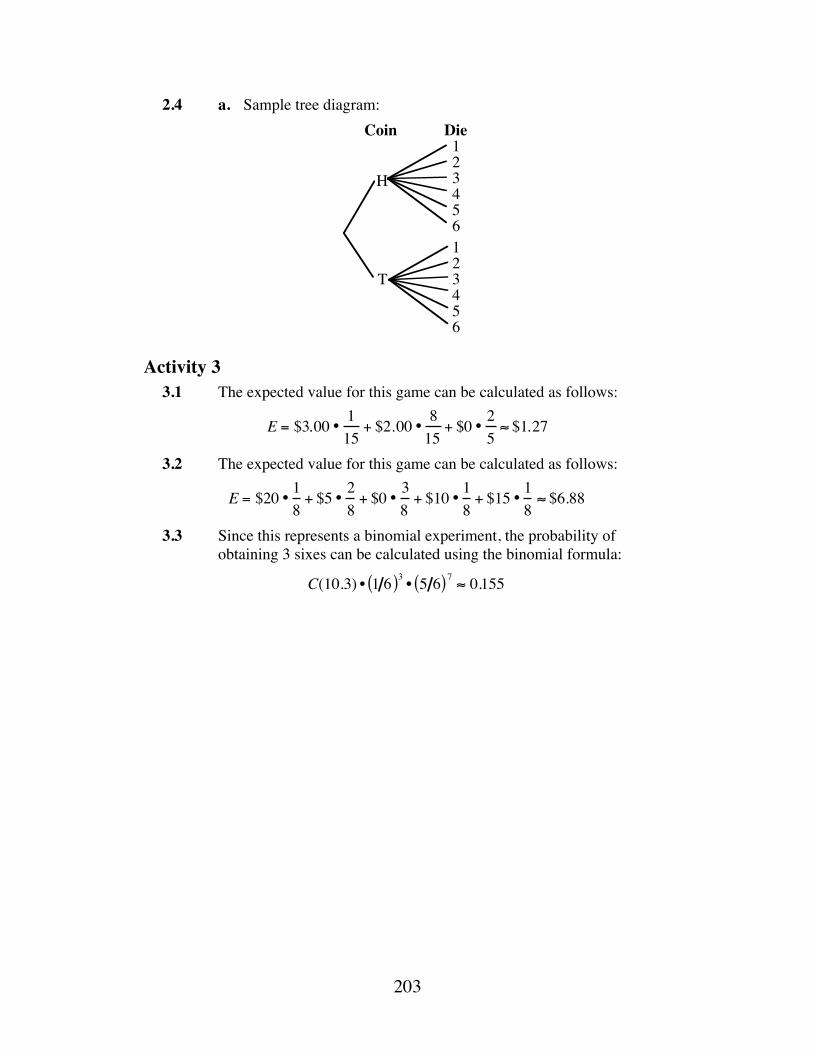
203
2.4 a. Sample tree diagram:
Activity 3 3.1 The expected value for this game can be calculated as follows:
E = $3.00 • 115
+ $2.00 • 815
+ $0 • 25≈ $1.27
3.2 The expected value for this game can be calculated as follows:
E = $20 • 18+ $5 • 2
8+ $0 • 3
8+ $10 • 1
8+ $15 • 1
8≈ $6.88
3.3 Since this represents a binomial experiment, the probability of obtaining 3 sixes can be calculated using the binomial formula:
C(10.3) • 1 6( )3 • 5 6( )7 ≈ 0.155
Coin Die
H
T
123456123456


Graphing the Distance
Scientists and mathematicians often use graphs to help predict the outcomes of real-life situations from experimental results. In this module, you’ll examine the use of graphs in modeling motion.
Maurice Burke • Jeff Hostetter
207
Teacher Edition Graphing the Distance
Overview This module uses distance-time graphs to introduce linear, quadratic, and cubic functions.
Objectives In this module, students will: • create distance-time graphs • distinguish between speed and velocity • calculate average speed and average velocity • calculate average acceleration • express polynomial functions in various forms • transform graphs of polynomial functions • model data using linear, quadratic, and cubic functions • use residuals to compare data models.
Prerequisites For this module, students should know: • how to identify and graph linear equations • how to find the slope and y-intercept of linear graphs and equations • how to find a linear regression equation for a set of data • the definition of a function • how to recognize geometric transformations • how to expand algebraic expressions • how to calculate residuals.
Time Line Activity 1 2 3 4 Summary
Assessment Total
Days 2 2 3 2 1 10

208
Materials Required Materials Activity
1 2 3 4 Summary Assessment
graph paper X X X X masking tape X X
basketball or soccer ball X X track for ball X X
Technology Software Activity
1 2 3 4 Summary Assessment
sonar range finder X X X science interface device X X X
graphing utility X X X X
Teacher Note Several different companies offer technology for collecting distance-time data. For example, the Calculator Based Laboratory (CBL) produced by Texas Instruments is a scientific interface that connects collecting devices to a graphing calculator. The CBL connects to TI-82, TI-85, and TI-92 calculators and comes with its own software. (You will need a TI Graph Link to download this software to calculators.)
209
Graphing the Distance
Introduction (page 155) Distance-time graphs represent one of the most common applications of graphing in engineering and physics. (page 155)
Activity 1 In this activity, students use a sonar range finder and science interface device to investigate different kinds of motion.
Materials List • graph paper (several sheets per student)
Technology • sonar range finder (one per group) • science interface device (one per group) • graphing utility
Teacher Note If you are unfamiliar with the range finder, science interface device, and related software, you may need to refer to appropriate manuals and practice with the equipment before introducing it to students. Actual collection of relevant, useful data in each experiment takes only a few seconds. However, students may require some time to become comfortable with the equipment. Careful and accurate setup, group cooperation, and multiple trial runs are necessary to obtain data sets that give good analytic results.
210
Exploration (page 155) a–b. Students practice generating distance-time graphs using the sonar
range finder. Each point on a distance-time graph represents the distance (y) from the sonar range finder to a flat surface at a given time (x) . Although graphs will vary according to the movements of the students holding the range finders, they should resemble connected scatterplots.
Note: Students should recognize that distance-time graphs are not position plots. For example, the distance-time graph of a ball traveling straight up into the air and straight back down is not a vertical line.
c. Methods will vary. See sample responses in Part d of the following discussion.
d. Students should raise the range finder rapidly, then slowly move it toward the floor.
Discussion (page 157) a. Sample response: Each point represents how far away the range finder
is from the wall at a given time. b. Sample response: The y-intercept represents the distance the range
finder is from the wall when it is first turned on (when the time is 0). The x-intercept represents the time when the distance between the range finder and the wall is 0.
c. Sample response: As the range finder and an object get farther apart, the data points are plotted farther away from the x-axis. As the range finder and the object get closer together, the data points fall closer to the x-axis. The steepness of the line segment between any two points is determined by the speed at which the distance between the range finder and the object is changing—the faster the speed, the steeper the line segment.
d. Sample response: To create the graph in Part c1 of the exploration, move the range finder at a steady rate away from the wall.
To create the graph in Part c2, do not move the range finder at all. To create the graph in Part c3, move the range finder at a steady rate
toward the wall, then move it at a steady rate away from the wall. To create the graph in Part c4, move the range finder at a fairly steady
rate toward the wall, then move it at the same rate away from the wall. This is followed by moving the range finder quickly toward the wall, then slowing the pace and continuing to move toward the wall. The range finder is then moved away from the wall at the slower rate; then the rate is slowed even more. The graph is competed by continuing to move slowly away from the wall, then increasing the rate and continuing to move away from the wall.
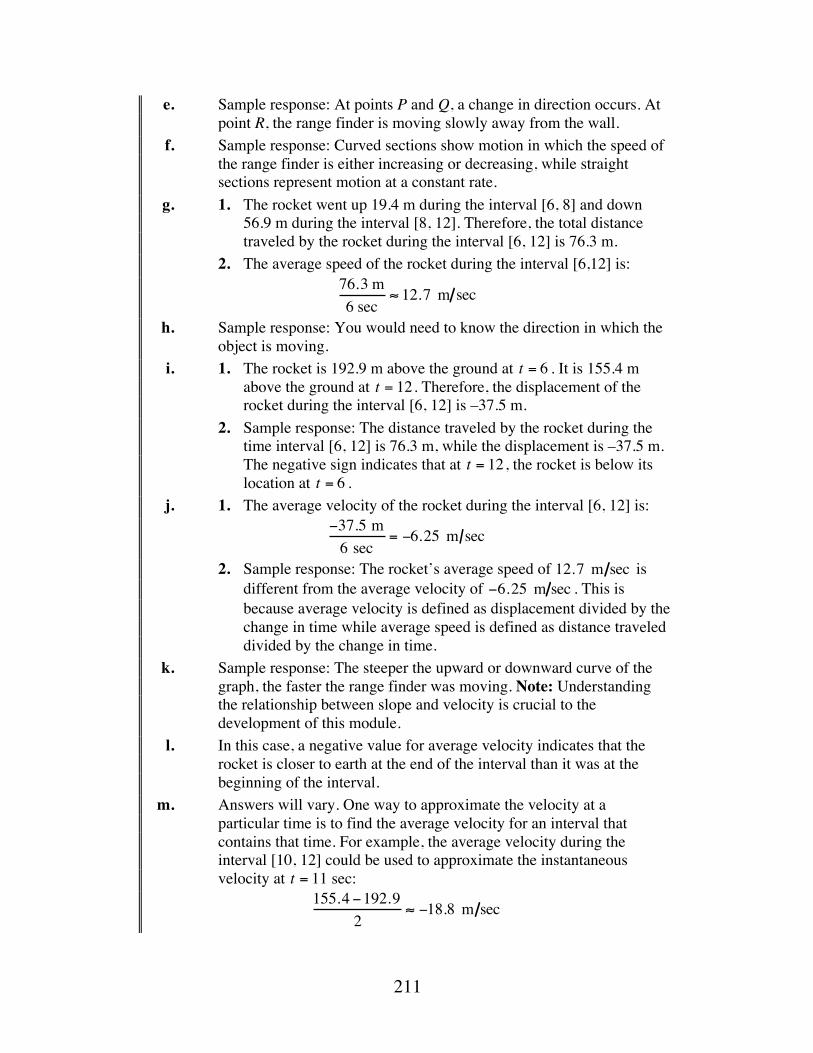
211
e. Sample response: At points P and Q, a change in direction occurs. At point R, the range finder is moving slowly away from the wall.
f. Sample response: Curved sections show motion in which the speed of the range finder is either increasing or decreasing, while straight sections represent motion at a constant rate.
g. 1. The rocket went up 19.4 m during the interval [6, 8] and down 56.9 m during the interval [8, 12]. Therefore, the total distance traveled by the rocket during the interval [6, 12] is 76.3 m.
2. The average speed of the rocket during the interval [6,12] is: 76.3 m6 sec
≈ 12.7 m sec
h. Sample response: You would need to know the direction in which the object is moving.
i. 1. The rocket is 192.9 m above the ground at t = 6 . It is 155.4 m above the ground at t = 12 . Therefore, the displacement of the rocket during the interval [6, 12] is –37.5 m.
2. Sample response: The distance traveled by the rocket during the time interval [6, 12] is 76.3 m, while the displacement is –37.5 m. The negative sign indicates that at t = 12 , the rocket is below its location at t = 6 .
j. 1. The average velocity of the rocket during the interval [6, 12] is: −37.5 m
6 sec= −6.25 m sec
2. Sample response: The rocket’s average speed of 12.7 m sec is different from the average velocity of −6.25 m sec . This is because average velocity is defined as displacement divided by the change in time while average speed is defined as distance traveled divided by the change in time.
k. Sample response: The steeper the upward or downward curve of the graph, the faster the range finder was moving. Note: Understanding the relationship between slope and velocity is crucial to the development of this module.
l. In this case, a negative value for average velocity indicates that the rocket is closer to earth at the end of the interval than it was at the beginning of the interval.
m. Answers will vary. One way to approximate the velocity at a particular time is to find the average velocity for an interval that contains that time. For example, the average velocity during the interval [10, 12] could be used to approximate the instantaneous velocity at t = 11 sec:
155.4 −192.92
≈ −18.8 m sec
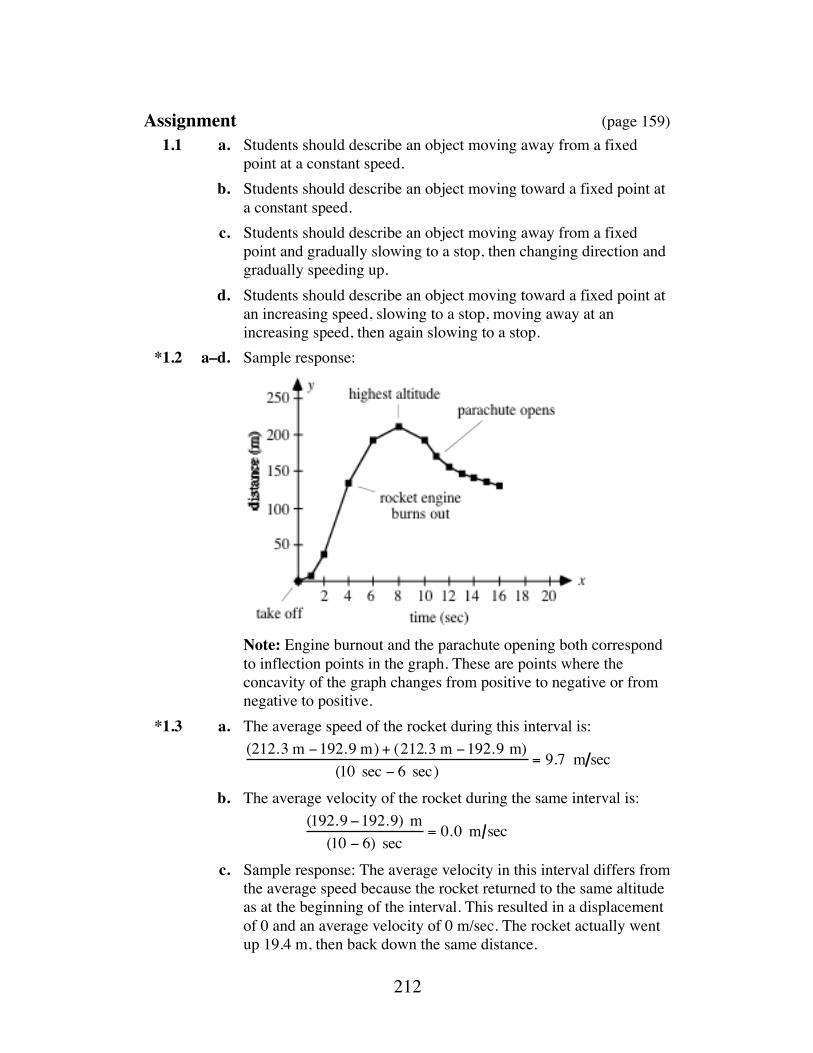
212
Assignment (page 159) 1.1 a. Students should describe an object moving away from a fixed
point at a constant speed. b. Students should describe an object moving toward a fixed point at
a constant speed. c. Students should describe an object moving away from a fixed
point and gradually slowing to a stop, then changing direction and gradually speeding up.
d. Students should describe an object moving toward a fixed point at an increasing speed, slowing to a stop, moving away at an increasing speed, then again slowing to a stop.
*1.2 a–d. Sample response:
Note: Engine burnout and the parachute opening both correspond
to inflection points in the graph. These are points where the concavity of the graph changes from positive to negative or from negative to positive.
*1.3 a. The average speed of the rocket during this interval is:
(212.3 m −192.9 m) + (212.3 m −192.9 m)(10 sec − 6 sec)
= 9.7 m sec
b. The average velocity of the rocket during the same interval is: (192.9 −192.9) m
(10 − 6) sec= 0.0 m sec
c. Sample response: The average velocity in this interval differs from the average speed because the rocket returned to the same altitude as at the beginning of the interval. This resulted in a displacement of 0 and an average velocity of 0 m/sec. The rocket actually went up 19.4 m, then back down the same distance.
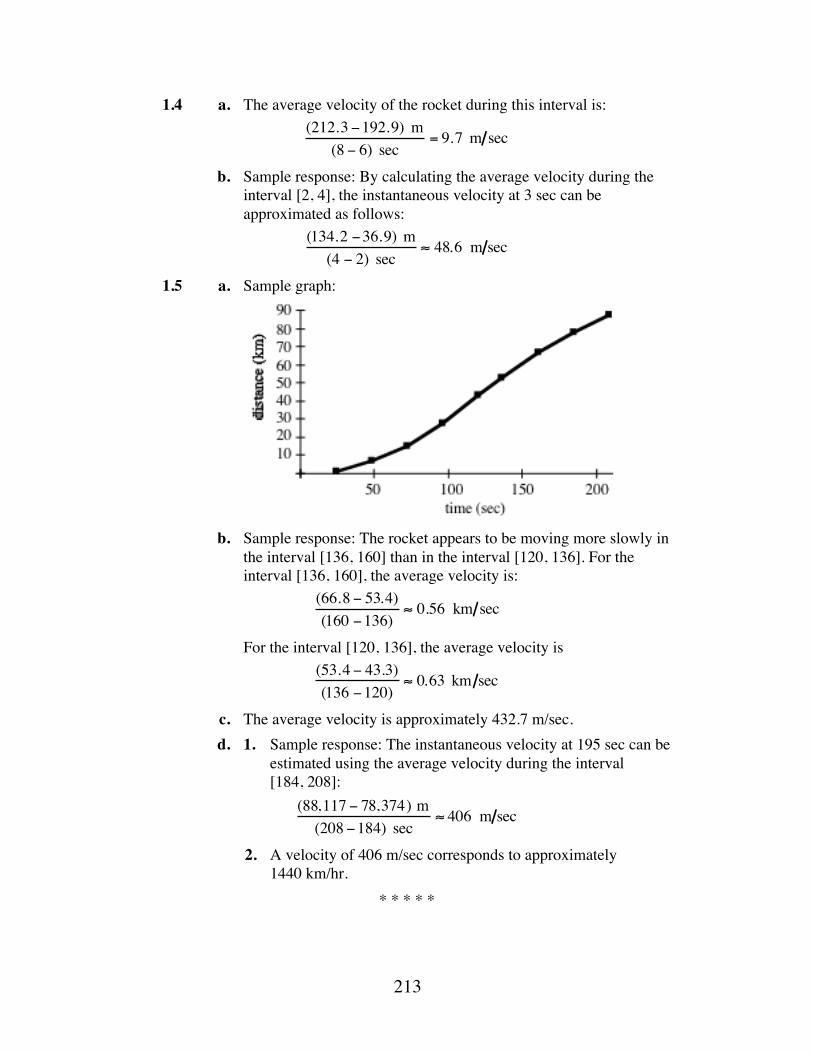
213
1.4 a. The average velocity of the rocket during this interval is: (212.3 −192.9) m
(8 − 6) sec= 9.7 m sec
b. Sample response: By calculating the average velocity during the interval [2, 4], the instantaneous velocity at 3 sec can be approximated as follows:
(134.2 −36.9) m(4 − 2) sec
≈ 48.6 m sec
1.5 a. Sample graph: b. Sample response: The rocket appears to be moving more slowly in
the interval [136, 160] than in the interval [120, 136]. For the interval [136, 160], the average velocity is:
(66.8 − 53.4)(160 −136)
≈ 0.56 km sec
For the interval [120, 136], the average velocity is (53.4 − 43.3)(136 −120)
≈ 0.63 km sec
c. The average velocity is approximately 432.7 m/sec. d. 1. Sample response: The instantaneous velocity at 195 sec can be
estimated using the average velocity during the interval [184, 208]:
(88,117 − 78,374) m(208 −184) sec
≈ 406 m sec
2. A velocity of 406 m/sec corresponds to approximately 1440 km/hr.
* * * * *
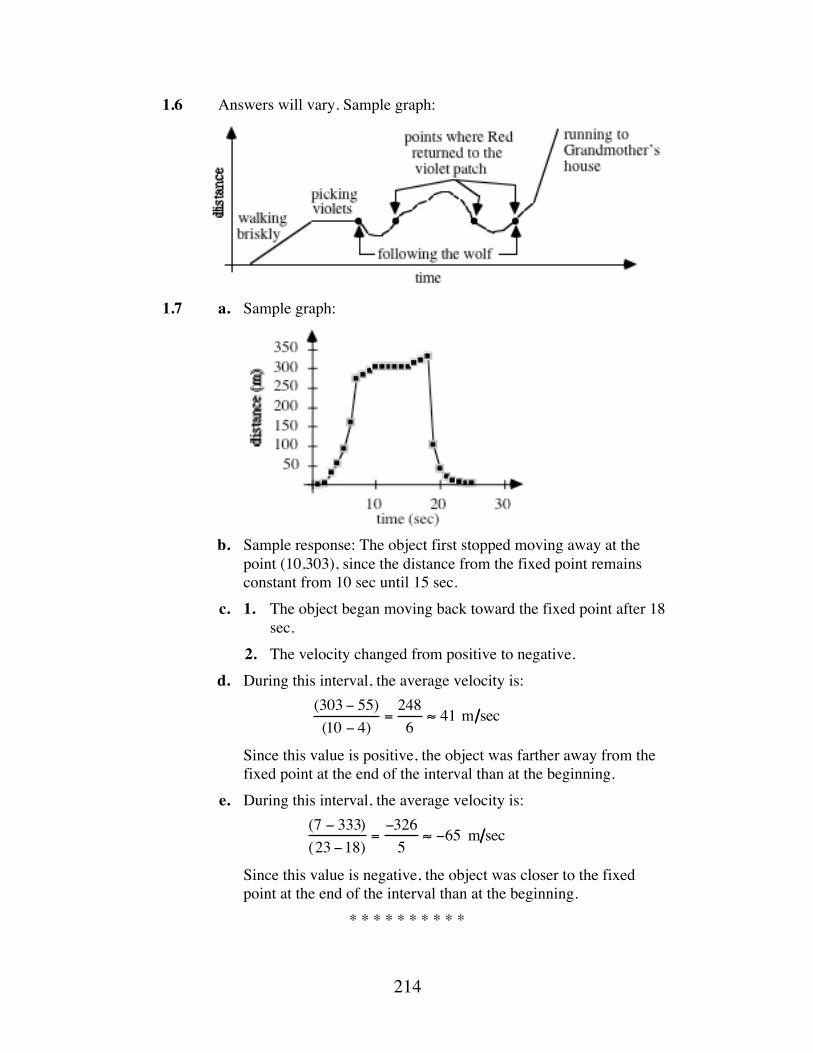
214
1.6 Answers will vary. Sample graph:
1.7 a. Sample graph:
b. Sample response: The object first stopped moving away at the
point (10,303), since the distance from the fixed point remains constant from 10 sec until 15 sec.
c. 1. The object began moving back toward the fixed point after 18 sec.
2. The velocity changed from positive to negative. d. During this interval, the average velocity is:
(303 − 55)(10 − 4)
=2486
≈ 41 m sec
Since this value is positive, the object was farther away from the fixed point at the end of the interval than at the beginning.
e. During this interval, the average velocity is: (7 − 333)(23 −18)
=−326
5≈ −65 m sec
Since this value is negative, the object was closer to the fixed point at the end of the interval than at the beginning.
* * * * * * * * * *
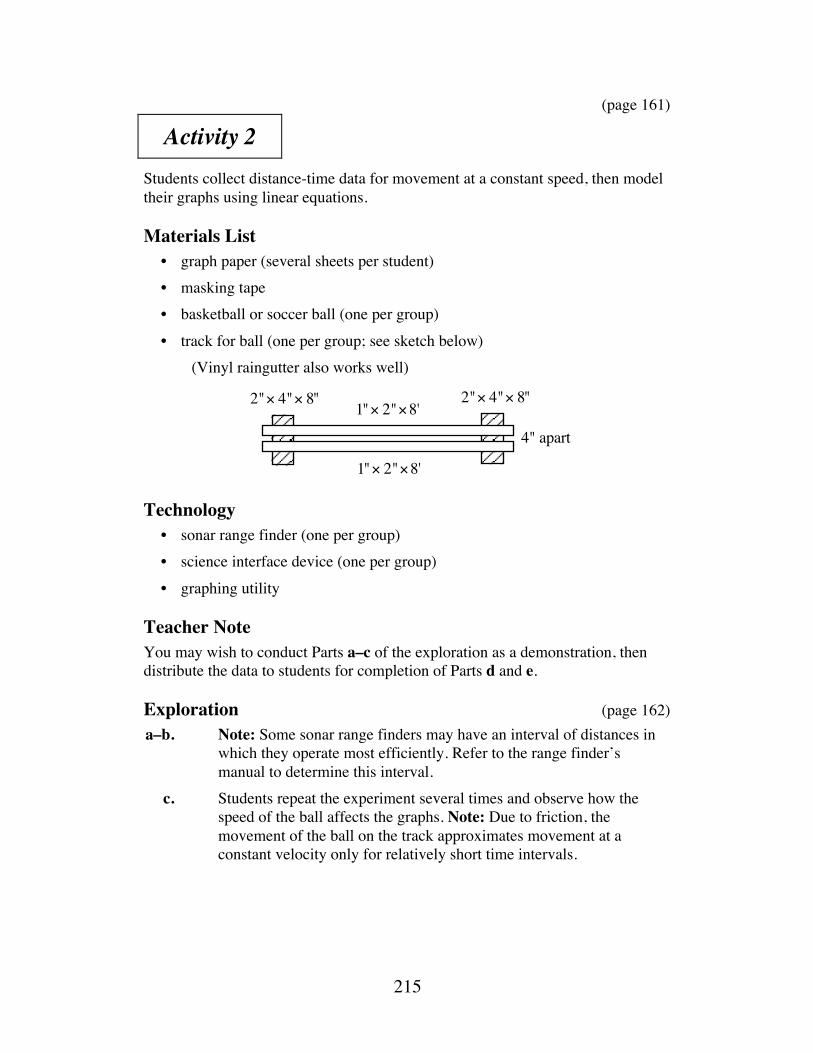
215
(page 161)
Activity 2 Students collect distance-time data for movement at a constant speed, then model their graphs using linear equations.
Materials List • graph paper (several sheets per student) • masking tape • basketball or soccer ball (one per group) • track for ball (one per group; see sketch below) (Vinyl raingutter also works well)
Technology • sonar range finder (one per group) • science interface device (one per group) • graphing utility
Teacher Note You may wish to conduct Parts a–c of the exploration as a demonstration, then distribute the data to students for completion of Parts d and e.
Exploration (page 162) a–b. Note: Some sonar range finders may have an interval of distances in
which they operate most efficiently. Refer to the range finder’s manual to determine this interval.
c. Students repeat the experiment several times and observe how the speed of the ball affects the graphs. Note: Due to friction, the movement of the ball on the track approximates movement at a constant velocity only for relatively short time intervals.
4" apart
2"× 4"× 8" 2"× 4"× 8"1"× 2"×8'
1"× 2"×8'
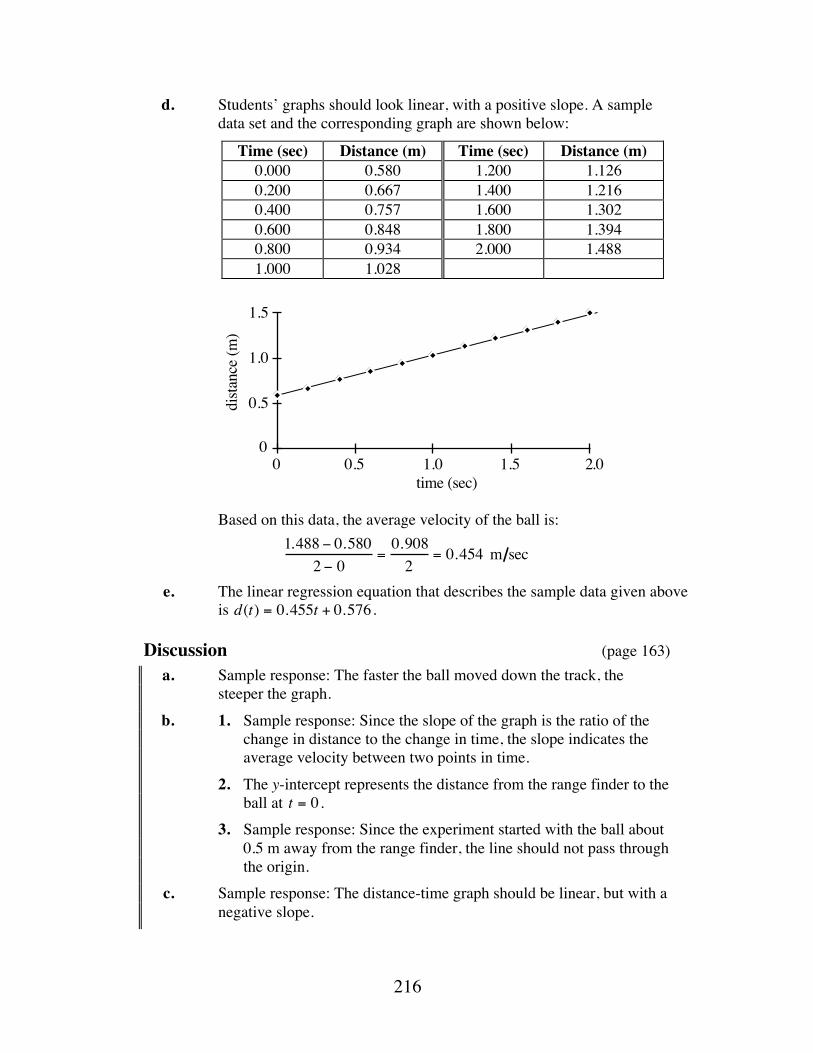
216
d. Students’ graphs should look linear, with a positive slope. A sample data set and the corresponding graph are shown below:
Time (sec) Distance (m) Time (sec) Distance (m) 0.000 0.580 1.200 1.126 0.200 0.667 1.400 1.216 0.400 0.757 1.600 1.302 0.600 0.848 1.800 1.394 0.800 0.934 2.000 1.488 1.000 1.028
Based on this data, the average velocity of the ball is:
1.488 − 0.5802 − 0
=0.908
2= 0.454 m sec
e. The linear regression equation that describes the sample data given above is d(t) = 0.455t + 0.576 .
Discussion (page 163) a. Sample response: The faster the ball moved down the track, the
steeper the graph. b. 1. Sample response: Since the slope of the graph is the ratio of the
change in distance to the change in time, the slope indicates the average velocity between two points in time.
2. The y-intercept represents the distance from the range finder to the ball at t = 0 .
3. Sample response: Since the experiment started with the ball about 0.5 m away from the range finder, the line should not pass through the origin.
c. Sample response: The distance-time graph should be linear, but with a negative slope.
0
0.5
1.0
1.5
0 0.5 1.0 1.5 2.0time (sec)
dista
nce
(m)
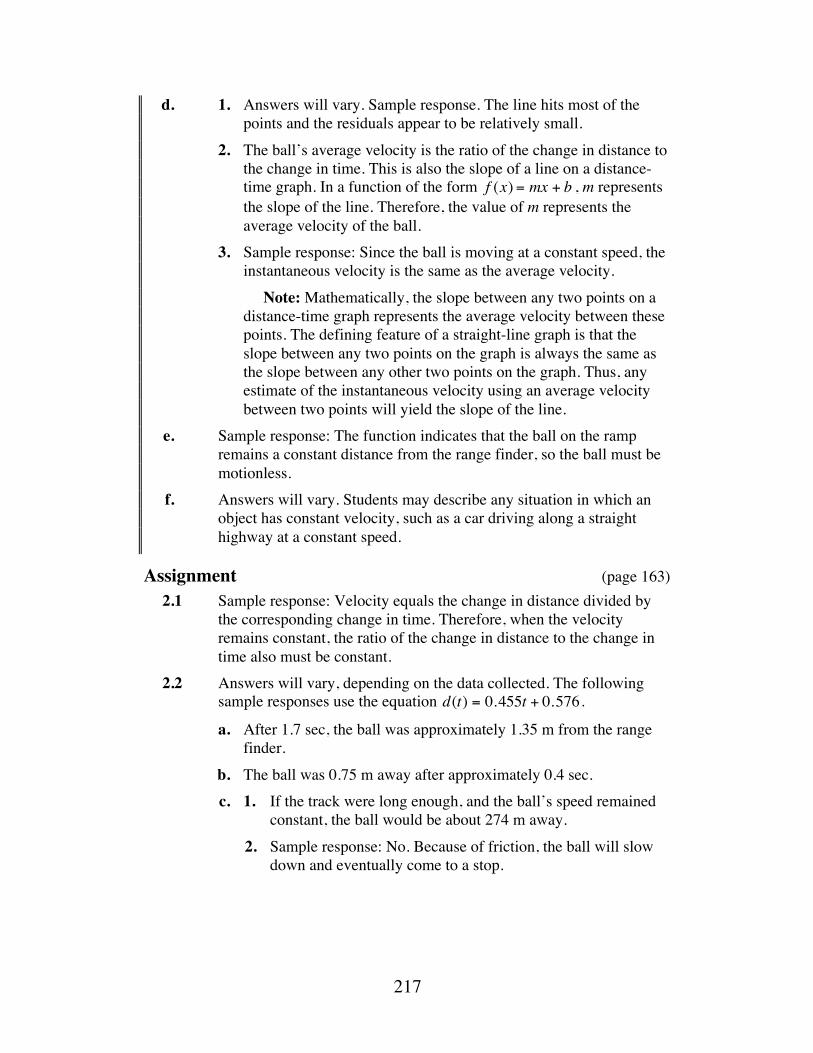
217
d. 1. Answers will vary. Sample response. The line hits most of the points and the residuals appear to be relatively small.
2. The ball’s average velocity is the ratio of the change in distance to the change in time. This is also the slope of a line on a distance-time graph. In a function of the form f (x) = mx + b , m represents the slope of the line. Therefore, the value of m represents the average velocity of the ball.
3. Sample response: Since the ball is moving at a constant speed, the instantaneous velocity is the same as the average velocity.
Note: Mathematically, the slope between any two points on a distance-time graph represents the average velocity between these points. The defining feature of a straight-line graph is that the slope between any two points on the graph is always the same as the slope between any other two points on the graph. Thus, any estimate of the instantaneous velocity using an average velocity between two points will yield the slope of the line.
e. Sample response: The function indicates that the ball on the ramp remains a constant distance from the range finder, so the ball must be motionless.
f. Answers will vary. Students may describe any situation in which an object has constant velocity, such as a car driving along a straight highway at a constant speed.
Assignment (page 163) 2.1 Sample response: Velocity equals the change in distance divided by
the corresponding change in time. Therefore, when the velocity remains constant, the ratio of the change in distance to the change in time also must be constant.
2.2 Answers will vary, depending on the data collected. The following sample responses use the equation d(t) = 0.455t + 0.576.
a. After 1.7 sec, the ball was approximately 1.35 m from the range finder.
b. The ball was 0.75 m away after approximately 0.4 sec. c. 1. If the track were long enough, and the ball’s speed remained
constant, the ball would be about 274 m away. 2. Sample response: No. Because of friction, the ball will slow
down and eventually come to a stop.
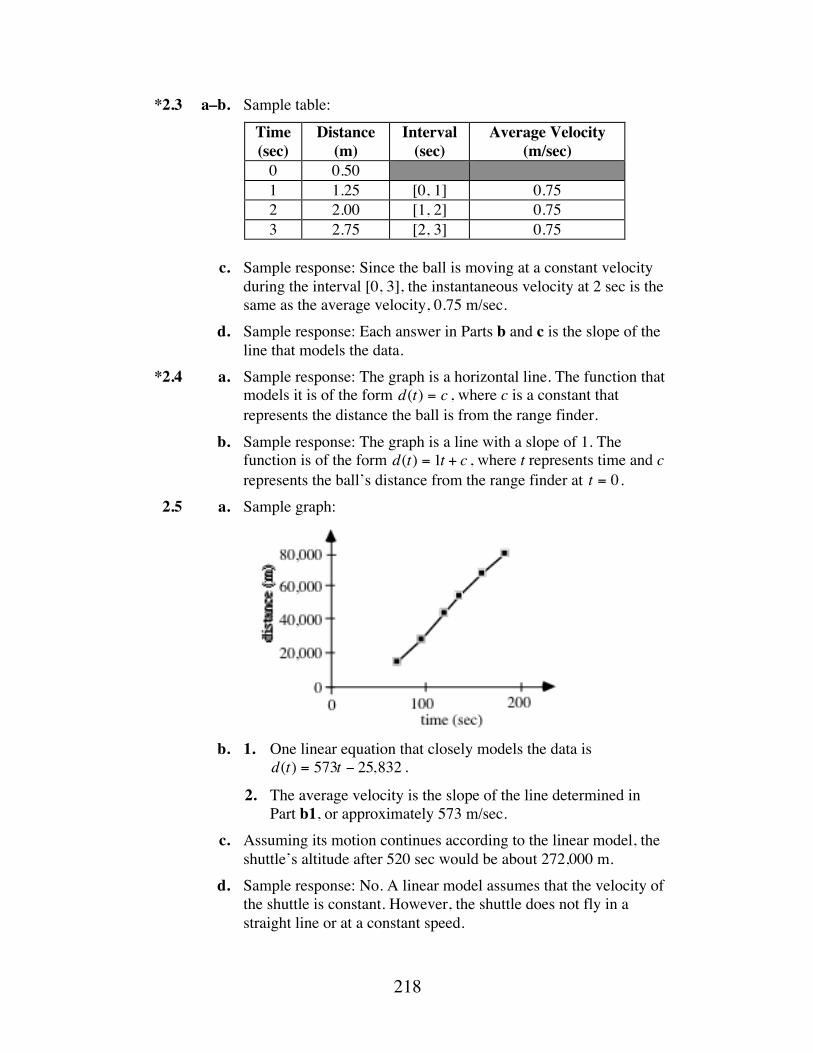
218
*2.3 a–b. Sample table: Time (sec)
Distance (m)
Interval (sec)
Average Velocity (m/sec)
0 0.50 1 1.25 [0, 1] 0.75 2 2.00 [1, 2] 0.75 3 2.75 [2, 3] 0.75
c. Sample response: Since the ball is moving at a constant velocity
during the interval [0, 3], the instantaneous velocity at 2 sec is the same as the average velocity, 0.75 m/sec.
d. Sample response: Each answer in Parts b and c is the slope of the line that models the data.
*2.4 a. Sample response: The graph is a horizontal line. The function that models it is of the form d(t) = c , where c is a constant that represents the distance the ball is from the range finder.
b. Sample response: The graph is a line with a slope of 1. The function is of the form d(t) = 1t + c , where t represents time and c represents the ball’s distance from the range finder at t = 0 .
2.5 a. Sample graph:
b. 1. One linear equation that closely models the data is
d(t) = 573t − 25,832 .
2. The average velocity is the slope of the line determined in Part b1, or approximately 573 m/sec.
c. Assuming its motion continues according to the linear model, the shuttle’s altitude after 520 sec would be about 272,000 m.
d. Sample response: No. A linear model assumes that the velocity of the shuttle is constant. However, the shuttle does not fly in a straight line or at a constant speed.
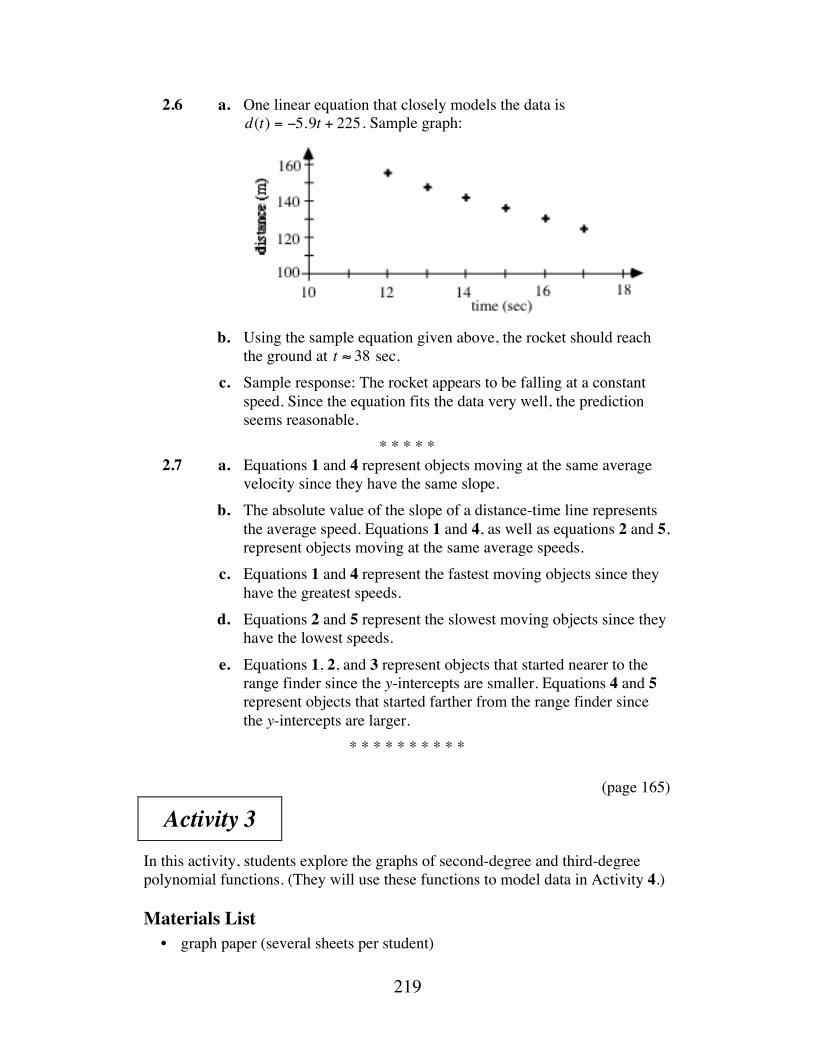
219
2.6 a. One linear equation that closely models the data is d(t) = −5.9t + 225. Sample graph:
b. Using the sample equation given above, the rocket should reach
the ground at t ≈ 38 sec. c. Sample response: The rocket appears to be falling at a constant
speed. Since the equation fits the data very well, the prediction seems reasonable.
* * * * * 2.7 a. Equations 1 and 4 represent objects moving at the same average
velocity since they have the same slope. b. The absolute value of the slope of a distance-time line represents
the average speed. Equations 1 and 4, as well as equations 2 and 5, represent objects moving at the same average speeds.
c. Equations 1 and 4 represent the fastest moving objects since they have the greatest speeds.
d. Equations 2 and 5 represent the slowest moving objects since they have the lowest speeds.
e. Equations 1, 2, and 3 represent objects that started nearer to the range finder since the y-intercepts are smaller. Equations 4 and 5 represent objects that started farther from the range finder since the y-intercepts are larger.
* * * * * * * * * * (page 165)
Activity 3 In this activity, students explore the graphs of second-degree and third-degree polynomial functions. (They will use these functions to model data in Activity 4.)
Materials List • graph paper (several sheets per student)
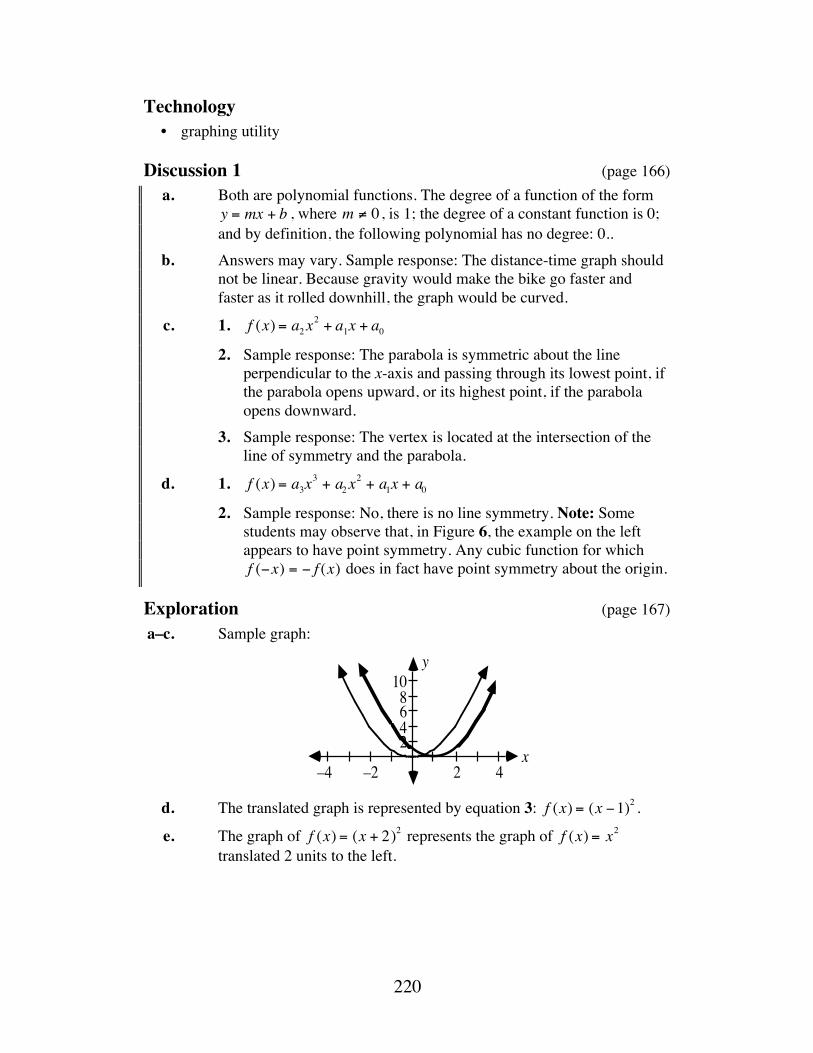
220
Technology • graphing utility
Discussion 1 (page 166) a. Both are polynomial functions. The degree of a function of the form
y = mx + b , where m ≠ 0 , is 1; the degree of a constant function is 0; and by definition, the following polynomial has no degree: 0..
b. Answers may vary. Sample response: The distance-time graph should not be linear. Because gravity would make the bike go faster and faster as it rolled downhill, the graph would be curved.
c. 1. f (x) = a2x2 + a1x + a0
2. Sample response: The parabola is symmetric about the line perpendicular to the x-axis and passing through its lowest point, if the parabola opens upward, or its highest point, if the parabola opens downward.
3. Sample response: The vertex is located at the intersection of the line of symmetry and the parabola.
d. 1. f (x) = a3x3 + a2x
2 + a1x + a0
2. Sample response: No, there is no line symmetry. Note: Some students may observe that, in Figure 6, the example on the left appears to have point symmetry. Any cubic function for which f (−x) = − f (x) does in fact have point symmetry about the origin.
Exploration (page 167) a–c. Sample graph:
d. The translated graph is represented by equation 3: f (x) = (x −1)2 .
e. The graph of f (x) = (x + 2)2 represents the graph of f (x) = x2 translated 2 units to the left.
246810
–2–4 2 4x
y
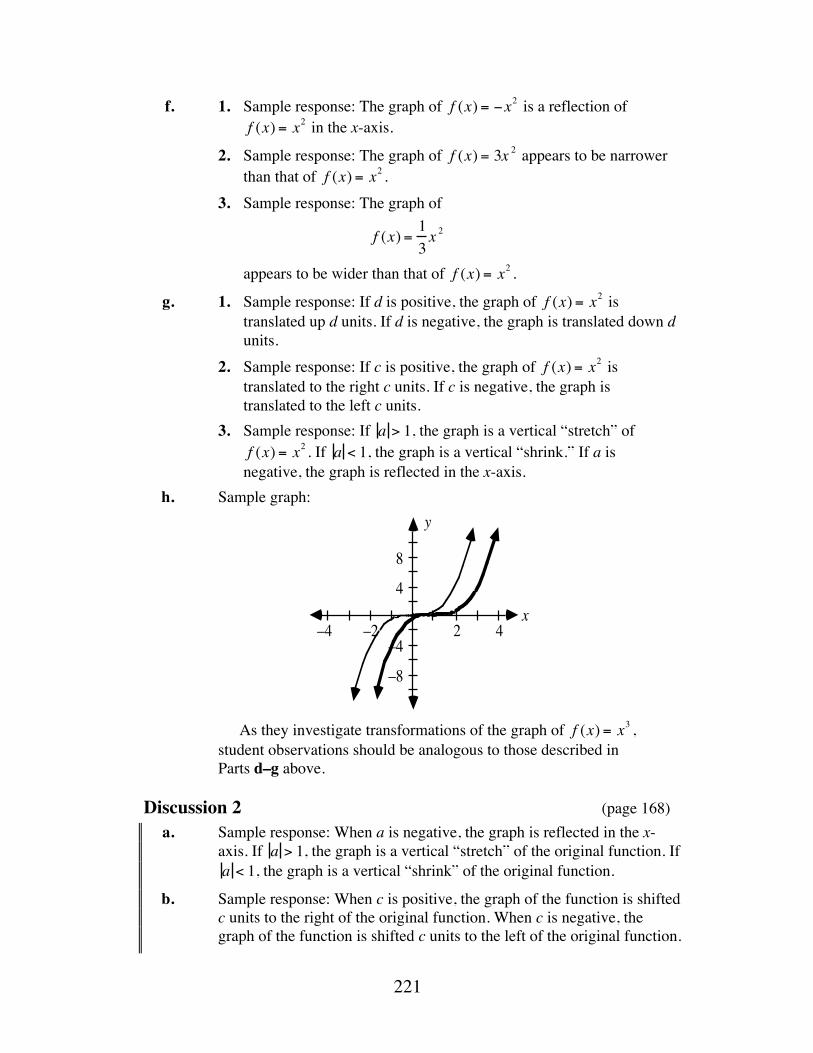
221
f. 1. Sample response: The graph of f (x) = −x2 is a reflection of f (x) = x2 in the x-axis.
2. Sample response: The graph of f (x) = 3x 2 appears to be narrower than that of f (x) = x2 .
3. Sample response: The graph of
f (x) = 13x 2
appears to be wider than that of f (x) = x2 .
g. 1. Sample response: If d is positive, the graph of f (x) = x2 is translated up d units. If d is negative, the graph is translated down d units.
2. Sample response: If c is positive, the graph of f (x) = x2 is translated to the right c units. If c is negative, the graph is translated to the left c units.
3. Sample response: If a > 1, the graph is a vertical “stretch” of f (x) = x2 . If a < 1, the graph is a vertical “shrink.” If a is
negative, the graph is reflected in the x-axis. h. Sample graph:
As they investigate transformations of the graph of f (x) = x3 ,
student observations should be analogous to those described in Parts d–g above.
Discussion 2 (page 168) a. Sample response: When a is negative, the graph is reflected in the x-
axis. If a > 1, the graph is a vertical “stretch” of the original function. If a < 1, the graph is a vertical “shrink” of the original function.
b. Sample response: When c is positive, the graph of the function is shifted c units to the right of the original function. When c is negative, the graph of the function is shifted c units to the left of the original function.
4
8
–2–4 2 4x
y
–4
–8
222
c. Sample response: When d is positive, the graph of the function is shifted d units up from the original function. When d is negative, the graph of the function is shifted d units down from the original function.
d. Sample response: By locating the axis of symmetry, you can determine the vertex of the parabola. The x-coordinate of the vertex equals the value of c, while the y-coordinate equals the value of d in a function of the form f (x) = a(x − c)2 + d .
e. Sample response: The graph is a reflection of the graph of f (x) = x2 in the x-axis. It is wider than the original function and its vertex is 4 units above the origin and 3 units to the right of the origin.
f. Sample response: The equation of the form f (x) = a(x − c)2 + d that models the data is f (x) = −(x + 3)2 + 2 . The parabola opens downward, indicating a reflection of f (x) = x2 in the x-axis, so a must be negative. The vertex of the parabola is located at about (–3,2), which is 3 units to the left of the origin and 2 units above it. Therefore, c must be –3 and d must be 2. Once this much of the function has been determined, the absolute value of a can be found by substituting an x-value into the function and comparing the function value to the data value for y. In this example, they are equal, which indicates that a = 1 .
g. Sample response: Expanding the first equation using the distributive property results in the second form of the equation:
f (x) = a(x − c)2 + d= a(x 2 − 2cx + c2 ) + d= ax2 − 2acx + ac2 + d= ax2 − 2acx + (ac2 + d)
h. This expression is not a polynomial. Although some students may argue that it can be rewritten as x +1 , this is only true for x ≠ 0 . Note: Students investigate rational functions in the Level 4 module “Big Business.”
Assignment (page 169) 3.1 a. degree 7 b. a7 = 3, a6 = 0, a5 = 0, a4 = 0, a3 = 0, a2 = 0, a1 = 0, a0 =1
c. degree 2 d. Yes, 6 is a polynomial of degree 0.
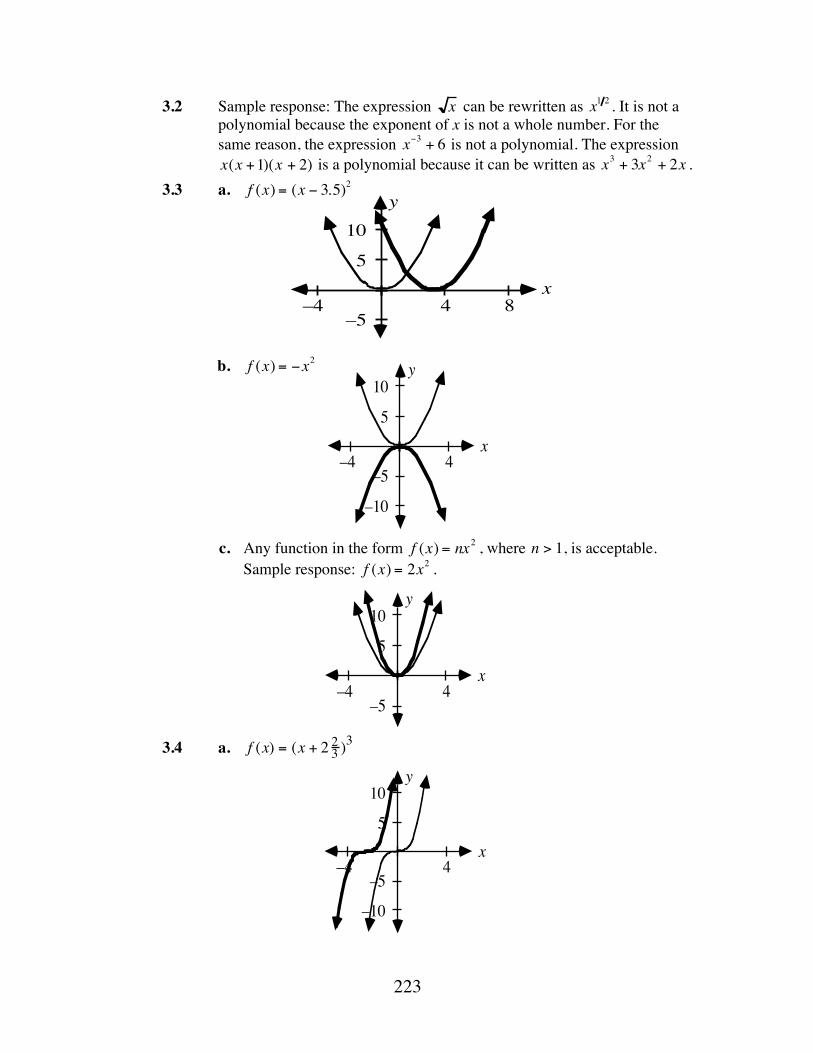
223
3.2 Sample response: The expression x can be rewritten as x1 2 . It is not a polynomial because the exponent of x is not a whole number. For the same reason, the expression x−3 + 6 is not a polynomial. The expression x(x +1)(x + 2) is a polynomial because it can be written as x3 + 3x2 + 2x .
3.3 a. f (x) = (x − 3.5)2
b. f (x) = −x2
c. Any function in the form f (x) = nx2 , where n > 1, is acceptable.
Sample response: f (x) = 2x2 .
3.4 a. f (x) = (x + 2 23 )
3
–5–4 4
5
10
x
y
–5–4 4
5
10
x
y
–10
–4 4 8–5
5
10
x
y
–5–4 4
5
10
x
y
–10
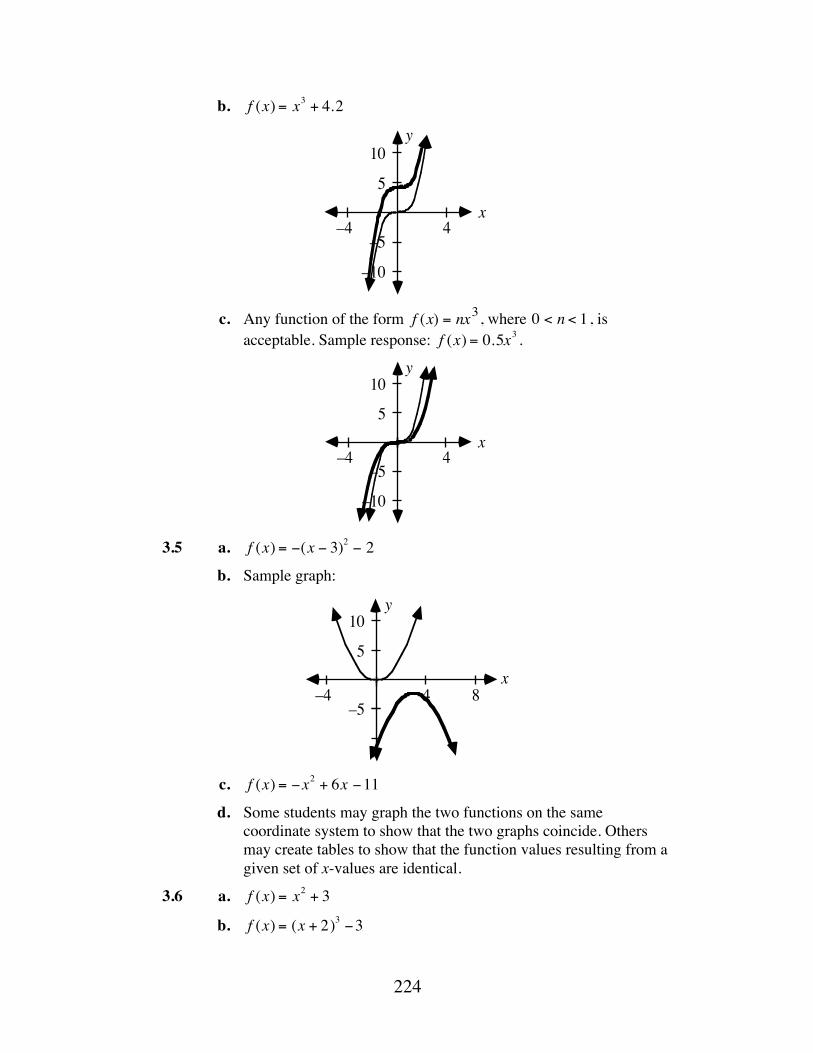
224
b. f (x) = x3 + 4.2
c. Any function of the form f (x) = nx3 , where 0 < n < 1 , is
acceptable. Sample response: f (x) = 0.5x3 .
3.5 a. f (x) = −(x − 3)2 − 2
b. Sample graph:
c. f (x) = −x2 + 6x −11
d. Some students may graph the two functions on the same coordinate system to show that the two graphs coincide. Others may create tables to show that the function values resulting from a given set of x-values are identical.
3.6 a. f (x) = x2 + 3
b. f (x) = (x + 2)3 −3
–5–4 4
5
10
x
y
–10
–5–4 4
5
10
x
y
–10
–4 4 8–5
5
10
x
y
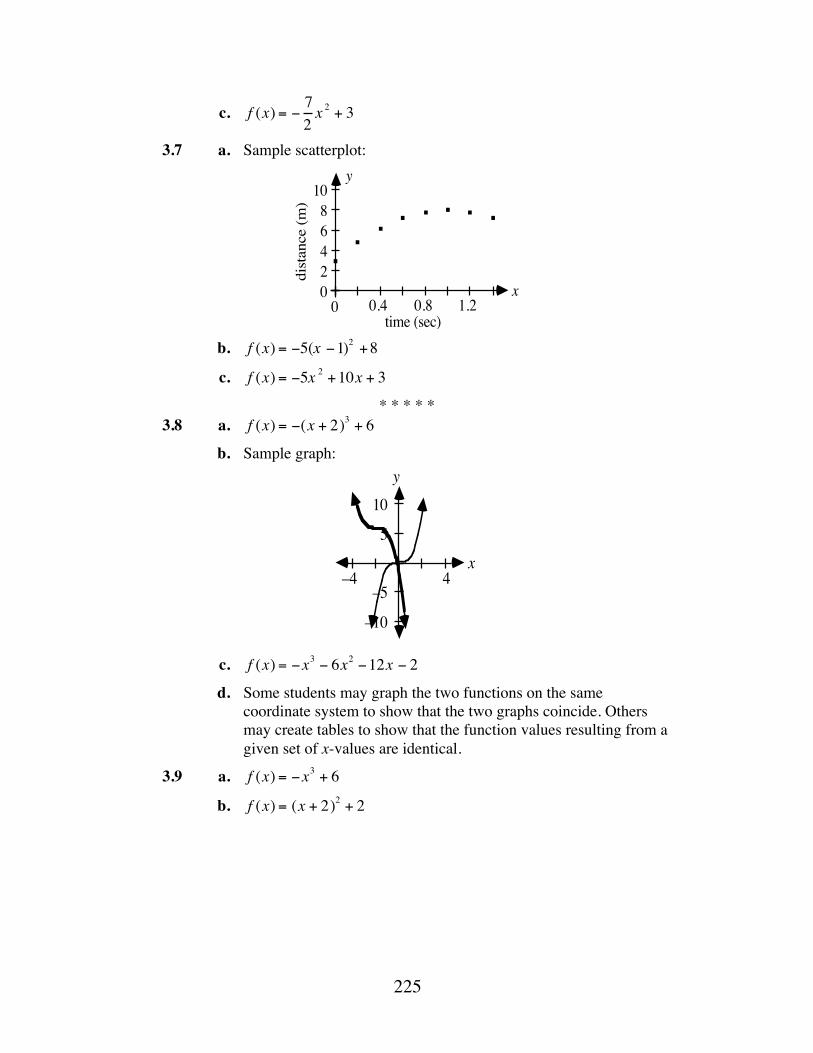
225
c. f (x) = − 72x 2 + 3
3.7 a. Sample scatterplot:
b. f (x) = −5(x −1)2 +8
c. f (x) = −5x 2 +10x + 3
* * * * * 3.8 a. f (x) = −(x + 2)3 + 6
b. Sample graph:
c. f (x) = −x3 − 6x2 −12x − 2
d. Some students may graph the two functions on the same coordinate system to show that the two graphs coincide. Others may create tables to show that the function values resulting from a given set of x-values are identical.
3.9 a. f (x) = −x3 + 6
b. f (x) = (x + 2)2 + 2
0.4 0.8 1.2
2
6
10
4
8
x
y
00
time (sec)di
stan
ce (m
)
4–4–5
–10
5
10
x
y
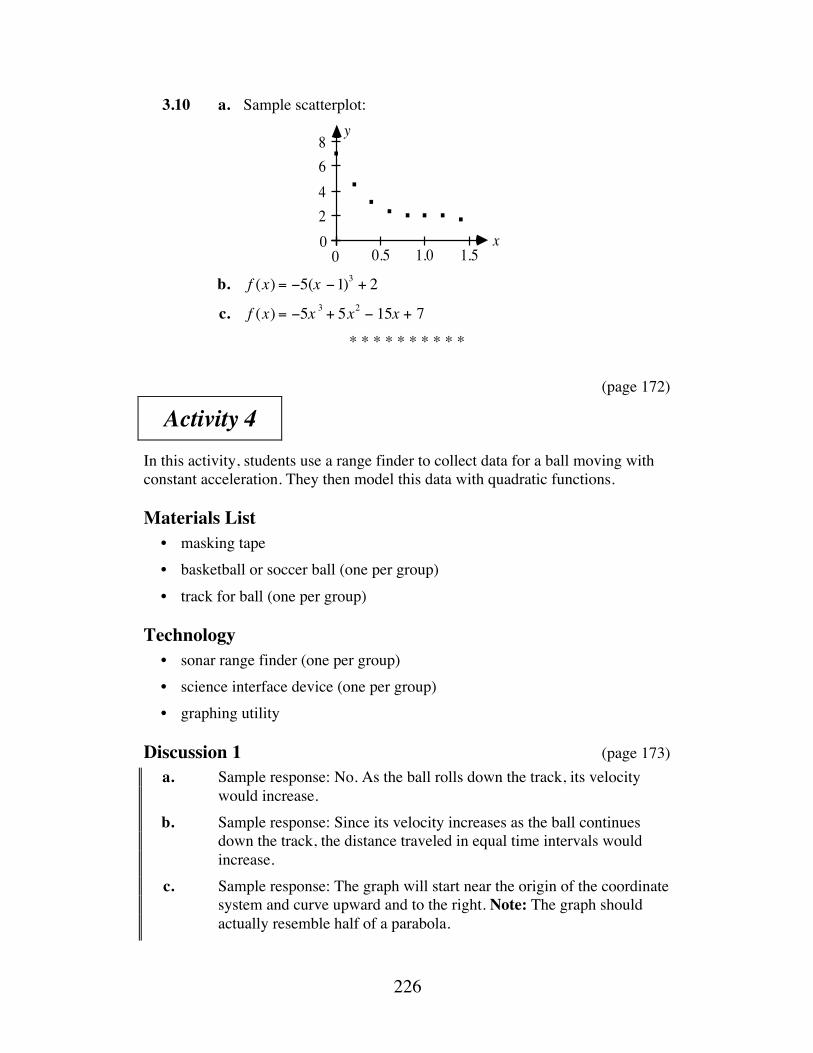
226
3.10 a. Sample scatterplot:
b. f (x) = −5(x −1)3 + 2
c. f (x) = −5x 3 + 5x2 − 15x + 7
* * * * * * * * * * (page 172)
Activity 4 In this activity, students use a range finder to collect data for a ball moving with constant acceleration. They then model this data with quadratic functions.
Materials List • masking tape • basketball or soccer ball (one per group) • track for ball (one per group)
Technology • sonar range finder (one per group) • science interface device (one per group) • graphing utility
Discussion 1 (page 173) a. Sample response: No. As the ball rolls down the track, its velocity
would increase. b. Sample response: Since its velocity increases as the ball continues
down the track, the distance traveled in equal time intervals would increase.
c. Sample response: The graph will start near the origin of the coordinate system and curve upward and to the right. Note: The graph should actually resemble half of a parabola.
0.5 1.0 1.5
2468
x
y
00
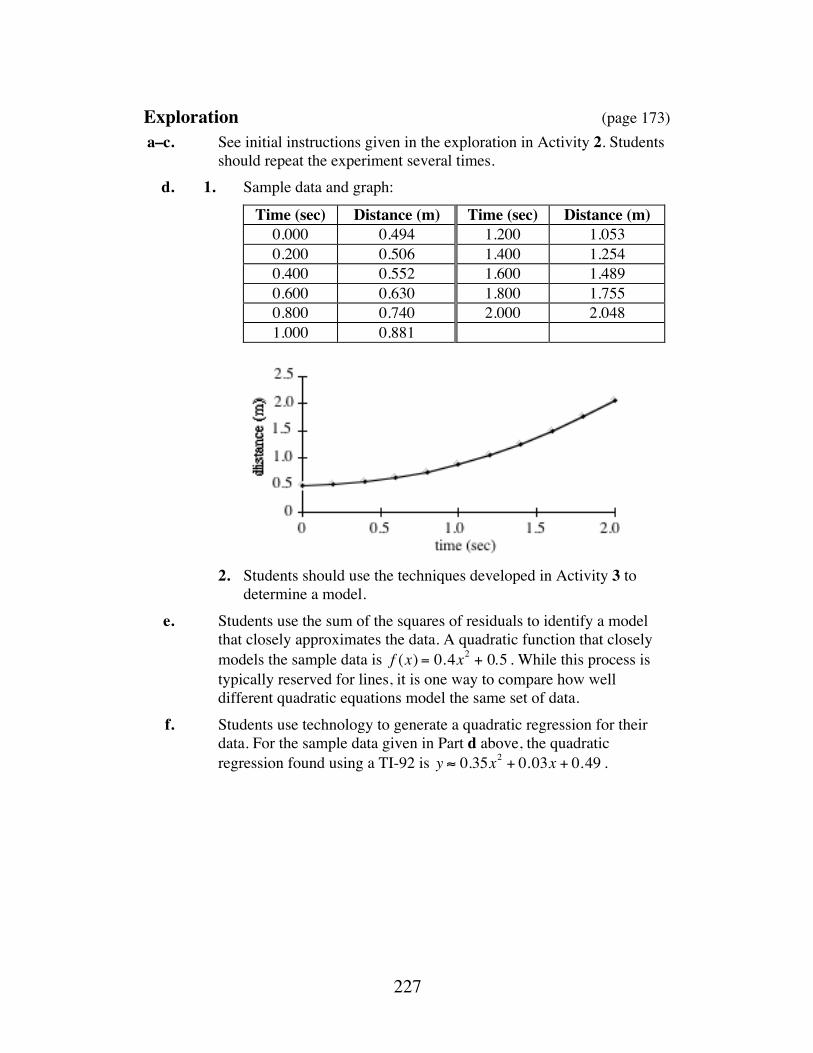
227
Exploration (page 173) a–c. See initial instructions given in the exploration in Activity 2. Students
should repeat the experiment several times. d. 1. Sample data and graph:
Time (sec) Distance (m) Time (sec) Distance (m) 0.000 0.494 1.200 1.053 0.200 0.506 1.400 1.254 0.400 0.552 1.600 1.489 0.600 0.630 1.800 1.755 0.800 0.740 2.000 2.048 1.000 0.881
2. Students should use the techniques developed in Activity 3 to
determine a model. e. Students use the sum of the squares of residuals to identify a model
that closely approximates the data. A quadratic function that closely models the sample data is f (x) = 0.4x2 + 0.5 . While this process is typically reserved for lines, it is one way to compare how well different quadratic equations model the same set of data.
f. Students use technology to generate a quadratic regression for their data. For the sample data given in Part d above, the quadratic regression found using a TI-92 is y ≈ 0.35x2 + 0.03x + 0.49 .
228
g–h. Sample data:
Time (sec) Distance (m) Time (sec) Distance (m) 0.00 0.490 0.12 0.564 0.02 0.493 0.14 0.590 0.04 0.500 0.16 0.621 0.06 0.510 0.18 0.652 0.08 0.524 0.20 0.690 0.10 0.543 0.22 0.721
One equation that closely approximates this data set is f (x) = 5x2 + 0.5.
The quadratic regression equation found using a TI-92 is y ≈ 4.4x2 + 0.11x + 0. 49 .
Discussion 2 (page 174) a. 1. Sample response: The speed of the ball gradually increased as the
ball rolled down the track. The higher the end of the track was raised, the more rapidly the speed of the ball increased.
2. Sample response: This is seen on the distance-time graphs as an upward curve that gradually gets steeper.
b. 1. Responses will vary, based on the data collected in the exploration. The sample function given in Part e can be written as f (x) = 0.4x2 + 0.5 . The sample function in Part g can be written
as f (x) = 5x2 + 0.5.
2. Sample response: The two functions are similar, although the coefficients of corresponding terms are not equal. However, the values predicted by each model are approximately the same.
c. Sample response: The distance-time graphs from Activity 2 could be modeled by lines, while the graphs in this exploration are best modeled with parabolas.
d. 1. Sample response: When the acceleration is 0, the graph is linear. 2. Sample response: When an object is accelerating, the graph is
curved, not straight. The greater the acceleration, the more quickly curve becomes steep.
3. Sample response: As the acceleration increases, the coefficient of the second-degree term also appears to increase.
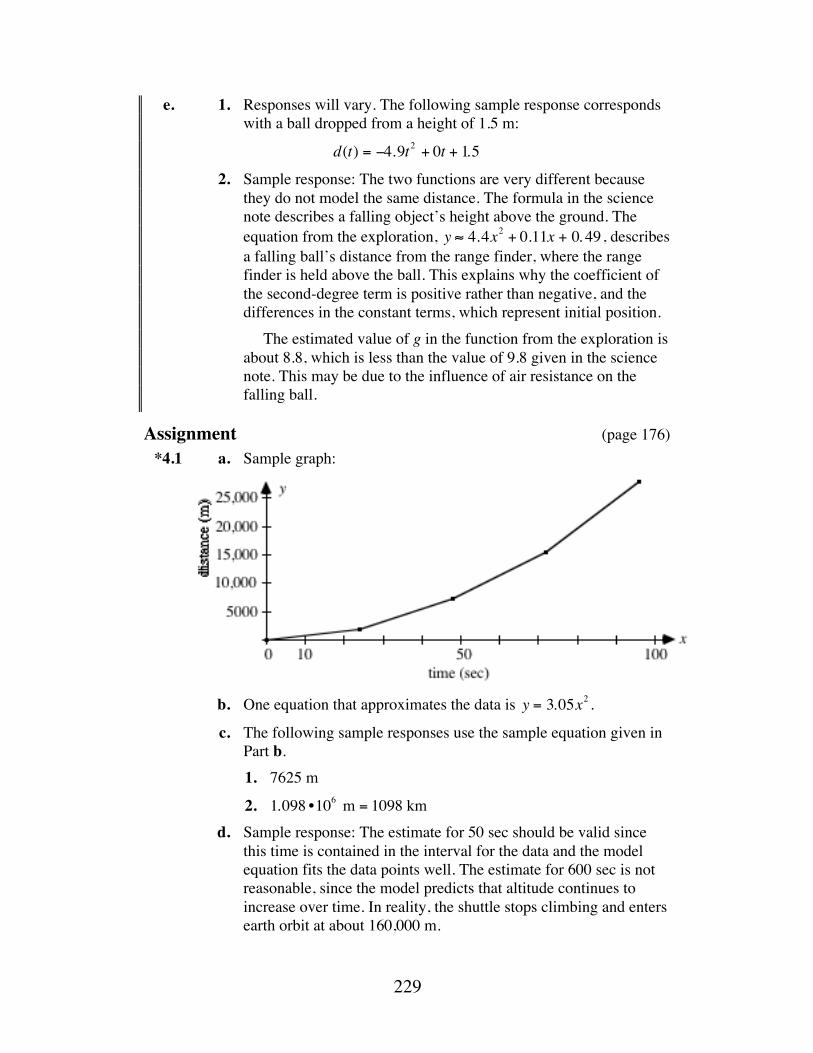
229
e. 1. Responses will vary. The following sample response corresponds with a ball dropped from a height of 1.5 m:
d(t) = −4.9t2 + 0t + 1.5
2. Sample response: The two functions are very different because they do not model the same distance. The formula in the science note describes a falling object’s height above the ground. The equation from the exploration, y ≈ 4.4x2 + 0.11x + 0. 49 , describes a falling ball’s distance from the range finder, where the range finder is held above the ball. This explains why the coefficient of the second-degree term is positive rather than negative, and the differences in the constant terms, which represent initial position.
The estimated value of g in the function from the exploration is about 8.8, which is less than the value of 9.8 given in the science note. This may be due to the influence of air resistance on the falling ball.
Assignment (page 176) *4.1 a. Sample graph:
b. One equation that approximates the data is y = 3.05x2 .
c. The following sample responses use the sample equation given in Part b.
1. 7625 m
2. 1.098 •106 m = 1098 km d. Sample response: The estimate for 50 sec should be valid since
this time is contained in the interval for the data and the model equation fits the data points well. The estimate for 600 sec is not reasonable, since the model predicts that altitude continues to increase over time. In reality, the shuttle stops climbing and enters earth orbit at about 160,000 m.
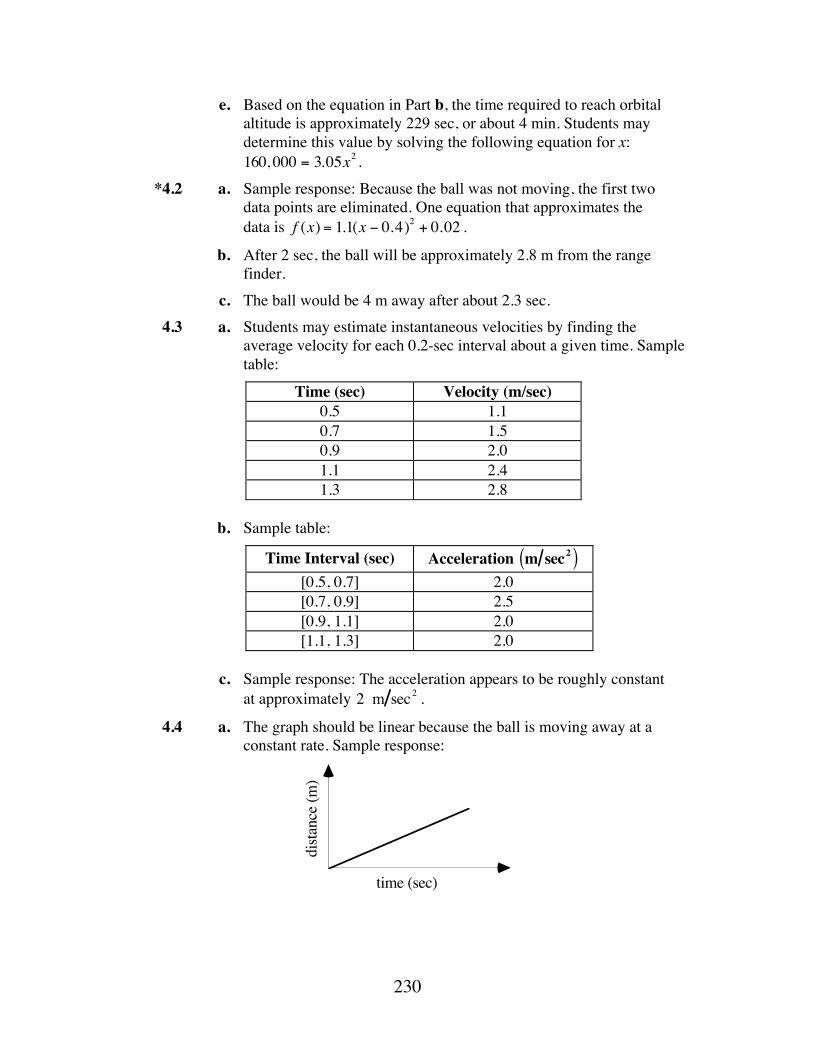
230
e. Based on the equation in Part b, the time required to reach orbital altitude is approximately 229 sec, or about 4 min. Students may determine this value by solving the following equation for x: 160, 000 = 3.05x2 .
*4.2 a. Sample response: Because the ball was not moving, the first two data points are eliminated. One equation that approximates the data is f (x) = 1.1(x − 0.4)2 + 0.02 .
b. After 2 sec, the ball will be approximately 2.8 m from the range finder.
c. The ball would be 4 m away after about 2.3 sec. 4.3 a. Students may estimate instantaneous velocities by finding the
average velocity for each 0.2-sec interval about a given time. Sample table:
Time (sec) Velocity (m/sec) 0.5 1.1 0.7 1.5 0.9 2.0 1.1 2.4 1.3 2.8
b. Sample table:
Time Interval (sec) Acceleration m sec2( ) [0.5, 0.7] 2.0 [0.7, 0.9] 2.5 [0.9, 1.1] 2.0 [1.1, 1.3] 2.0
c. Sample response: The acceleration appears to be roughly constant
at approximately 2 m sec2 .
4.4 a. The graph should be linear because the ball is moving away at a constant rate. Sample response:
time (sec)
dista
nce
(m)
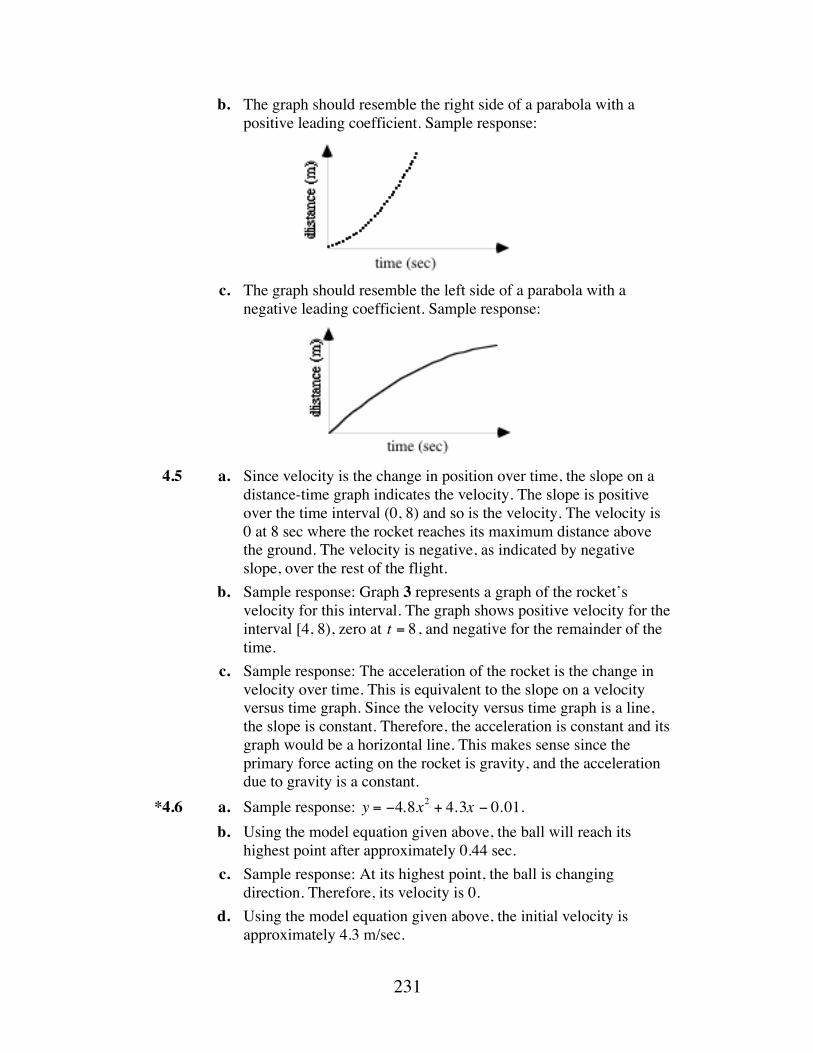
231
b. The graph should resemble the right side of a parabola with a positive leading coefficient. Sample response:
c. The graph should resemble the left side of a parabola with a
negative leading coefficient. Sample response:
4.5 a. Since velocity is the change in position over time, the slope on a
distance-time graph indicates the velocity. The slope is positive over the time interval (0, 8) and so is the velocity. The velocity is 0 at 8 sec where the rocket reaches its maximum distance above the ground. The velocity is negative, as indicated by negative slope, over the rest of the flight.
b. Sample response: Graph 3 represents a graph of the rocket’s velocity for this interval. The graph shows positive velocity for the interval [4, 8), zero at t = 8 , and negative for the remainder of the time.
c. Sample response: The acceleration of the rocket is the change in velocity over time. This is equivalent to the slope on a velocity versus time graph. Since the velocity versus time graph is a line, the slope is constant. Therefore, the acceleration is constant and its graph would be a horizontal line. This makes sense since the primary force acting on the rocket is gravity, and the acceleration due to gravity is a constant.
*4.6 a. Sample response: y = −4.8x2 + 4.3x − 0.01. b. Using the model equation given above, the ball will reach its
highest point after approximately 0.44 sec. c. Sample response: At its highest point, the ball is changing
direction. Therefore, its velocity is 0. d. Using the model equation given above, the initial velocity is
approximately 4.3 m/sec.
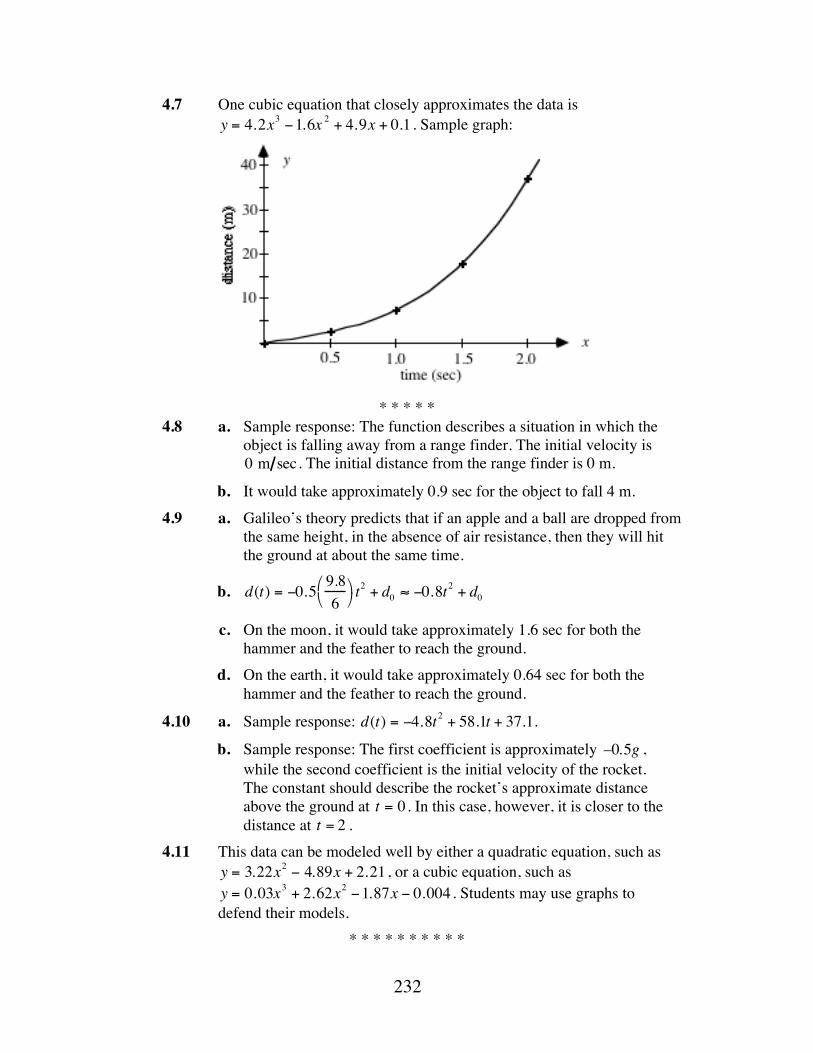
232
4.7 One cubic equation that closely approximates the data is y = 4.2x3 −1.6x 2 + 4.9x + 0.1 . Sample graph:
* * * * *
4.8 a. Sample response: The function describes a situation in which the object is falling away from a range finder. The initial velocity is 0 m sec. The initial distance from the range finder is 0 m.
b. It would take approximately 0.9 sec for the object to fall 4 m. 4.9 a. Galileo’s theory predicts that if an apple and a ball are dropped from
the same height, in the absence of air resistance, then they will hit the ground at about the same time.
b. d(t) = −0.5 9.86
⎛ ⎝
⎞ ⎠ t2 + d0 ≈ −0.8t
2 + d0
c. On the moon, it would take approximately 1.6 sec for both the hammer and the feather to reach the ground.
d. On the earth, it would take approximately 0.64 sec for both the hammer and the feather to reach the ground.
4.10 a. Sample response: d(t) = −4.8t2 + 58.1t + 37.1.
b. Sample response: The first coefficient is approximately –0.5g , while the second coefficient is the initial velocity of the rocket. The constant should describe the rocket’s approximate distance above the ground at t = 0 . In this case, however, it is closer to the distance at t = 2 .
4.11 This data can be modeled well by either a quadratic equation, such as y = 3.22x2 − 4.89x + 2.21 , or a cubic equation, such as y = 0.03x3 + 2.62x2 −1.87x − 0.004 . Students may use graphs to defend their models.
* * * * * * * * * *

233
Research Project (page 180) a. Newton’s second law of motion can be expressed in a formula as
F = ma , where F represents the applied force, m represents the mass of the object, and a represents the resulting acceleration. His third law of motion is often stated as “For every action (or force), there is an equal and opposite reaction.”
b. To obtain more information about space shuttle launches, call or write the NASA Teacher Resource Room, Mail Code AP–4, Johnson Space Center, Houston, TX 77058; 713–483–8696. You also may wish to contact NASA Dryden Flight Research Center, Public Affairs Office, Edwards, CA 93523; 805-258-3449; [email protected].
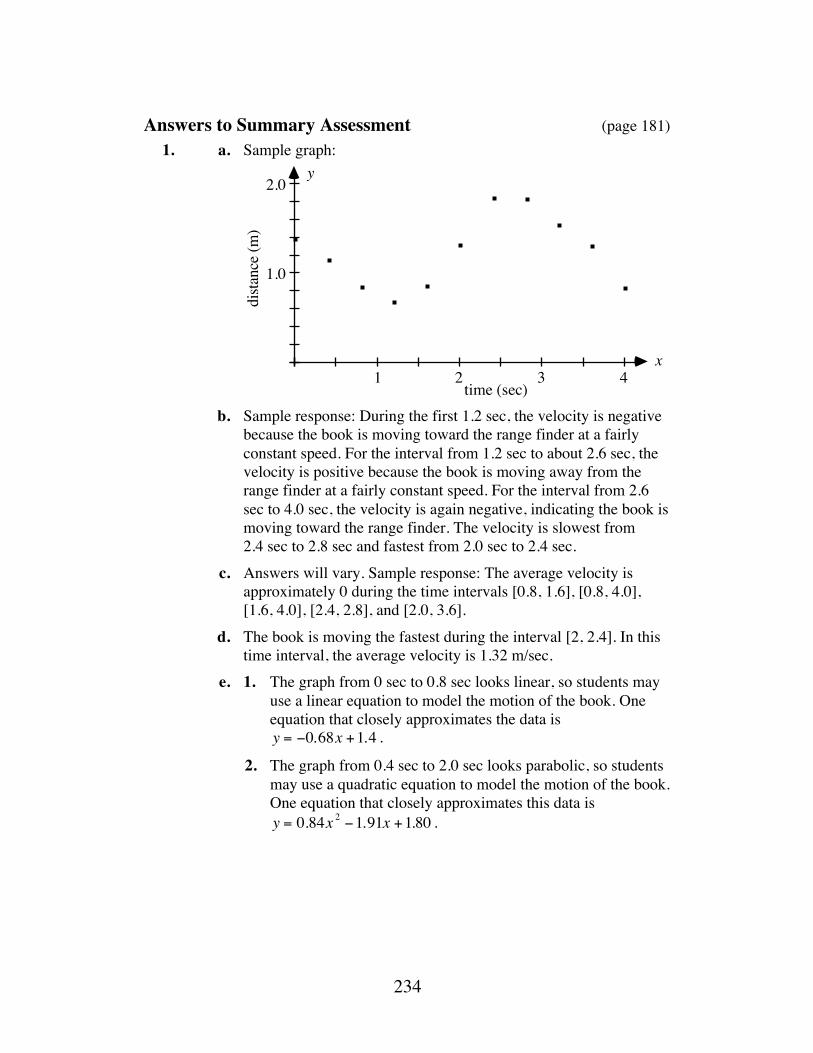
234
Answers to Summary Assessment (page 181) 1. a. Sample graph: b. Sample response: During the first 1.2 sec, the velocity is negative
because the book is moving toward the range finder at a fairly constant speed. For the interval from 1.2 sec to about 2.6 sec, the velocity is positive because the book is moving away from the range finder at a fairly constant speed. For the interval from 2.6 sec to 4.0 sec, the velocity is again negative, indicating the book is moving toward the range finder. The velocity is slowest from 2.4 sec to 2.8 sec and fastest from 2.0 sec to 2.4 sec.
c. Answers will vary. Sample response: The average velocity is approximately 0 during the time intervals [0.8, 1.6], [0.8, 4.0], [1.6, 4.0], [2.4, 2.8], and [2.0, 3.6].
d. The book is moving the fastest during the interval [2, 2.4]. In this time interval, the average velocity is 1.32 m/sec.
e. 1. The graph from 0 sec to 0.8 sec looks linear, so students may use a linear equation to model the motion of the book. One equation that closely approximates the data is y = −0.68x +1.4 .
2. The graph from 0.4 sec to 2.0 sec looks parabolic, so students may use a quadratic equation to model the motion of the book. One equation that closely approximates this data is y = 0.84x 2 −1.91x +1.80 .
2.0
4 x
y
1 2 3
1.0di
stanc
e (m
)
time (sec)
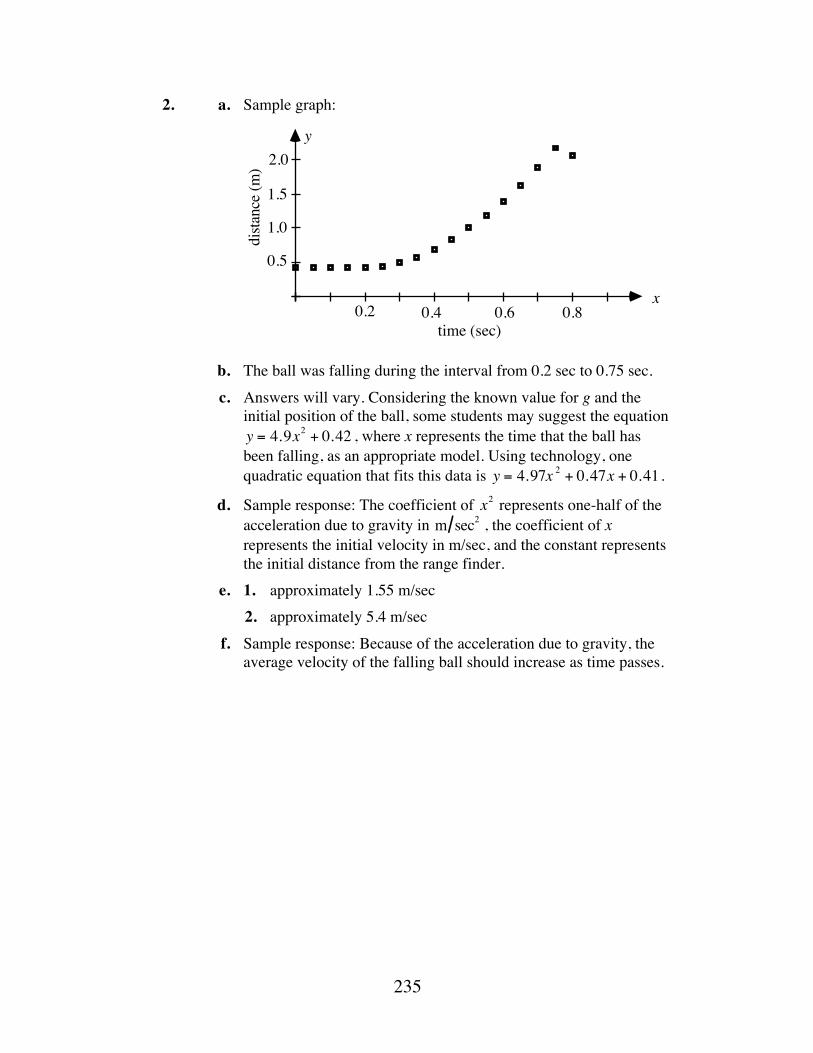
235
2. a. Sample graph: b. The ball was falling during the interval from 0.2 sec to 0.75 sec. c. Answers will vary. Considering the known value for g and the
initial position of the ball, some students may suggest the equation y = 4.9x2 + 0.42 , where x represents the time that the ball has been falling, as an appropriate model. Using technology, one quadratic equation that fits this data is y = 4.97x 2 + 0.47x + 0.41 .
d. Sample response: The coefficient of x2 represents one-half of the acceleration due to gravity in m sec2 , the coefficient of x represents the initial velocity in m/sec, and the constant represents the initial distance from the range finder.
e. 1. approximately 1.55 m/sec 2. approximately 5.4 m/sec f. Sample response: Because of the acceleration due to gravity, the
average velocity of the falling ball should increase as time passes.
x
y
0.2 0.4 0.6 0.8
0.5
1.0
1.5
2.0
dista
nce
(m)
time (sec)
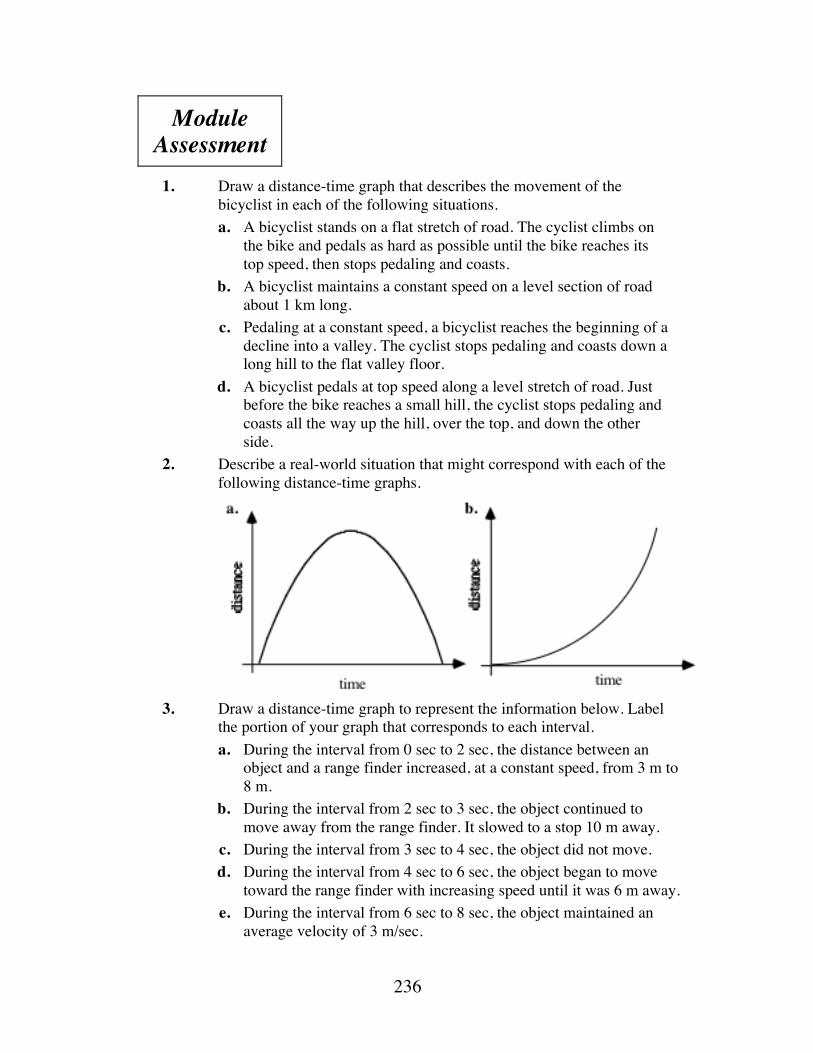
236
Module Assessment
1. Draw a distance-time graph that describes the movement of the
bicyclist in each of the following situations. a. A bicyclist stands on a flat stretch of road. The cyclist climbs on
the bike and pedals as hard as possible until the bike reaches its top speed, then stops pedaling and coasts.
b. A bicyclist maintains a constant speed on a level section of road about 1 km long.
c. Pedaling at a constant speed, a bicyclist reaches the beginning of a decline into a valley. The cyclist stops pedaling and coasts down a long hill to the flat valley floor.
d. A bicyclist pedals at top speed along a level stretch of road. Just before the bike reaches a small hill, the cyclist stops pedaling and coasts all the way up the hill, over the top, and down the other side.
2. Describe a real-world situation that might correspond with each of the following distance-time graphs.
3. Draw a distance-time graph to represent the information below. Label
the portion of your graph that corresponds to each interval. a. During the interval from 0 sec to 2 sec, the distance between an
object and a range finder increased, at a constant speed, from 3 m to 8 m.
b. During the interval from 2 sec to 3 sec, the object continued to move away from the range finder. It slowed to a stop 10 m away.
c. During the interval from 3 sec to 4 sec, the object did not move. d. During the interval from 4 sec to 6 sec, the object began to move
toward the range finder with increasing speed until it was 6 m away. e. During the interval from 6 sec to 8 sec, the object maintained an
average velocity of 3 m/sec.
237
4. Each of the following two equations models a distance-time data set for a ball moving away from a range finder.
1. y = 0.95x + 0.56
2. y = 0.85x +1.25
a. Which equation describes the motion of the ball that started farther from the range finder? Explain your response.
b. Which equation describes the motion of the ball that is farther from the range finder after 3 sec? Explain your response.
c. Which equation describes the motion of the ball that has the greater velocity? Explain your response.
d. The motion of the ball described by equation 1 was videotaped during the interval from 0 sec to 5 sec. Determine an equation that would model the distance-time graph of the ball’s motion if this tape were played in reverse.
5. Each of the following two quadratic equations models a distance-time graph for a ball rolling on an inclined ramp.
1. y = 0.50x2 + 0.58x + 0.40
2. y = 0.93x2 + 0.96x + 0.35
a. Which equation describes the motion of the ball with the greater acceleration? Explain your response.
b. Which equation describes the motion of the ball that is moving faster after 2 sec? Explain your response.
c. Which equation describes the motion of the ball with the greater initial velocity? Explain your response.
d. If the two balls began moving simultaneously, when would they be the same distance from their respective range finders?
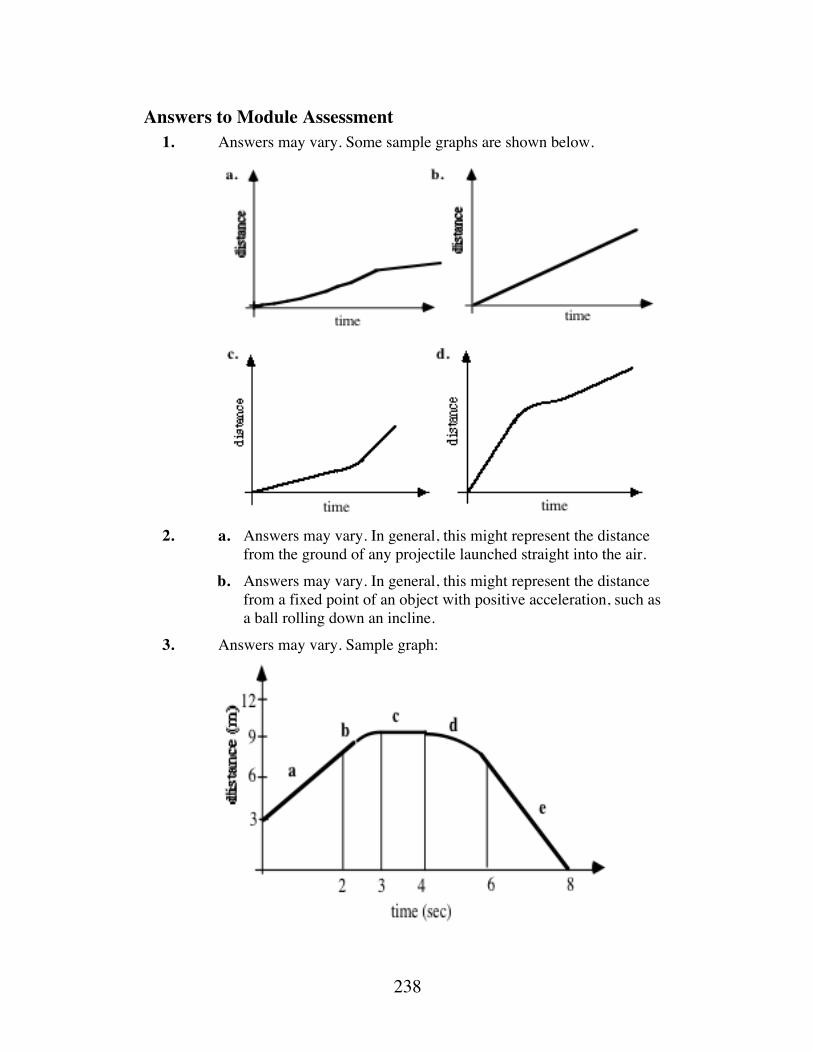
238
Answers to Module Assessment 1. Answers may vary. Some sample graphs are shown below.
2. a. Answers may vary. In general, this might represent the distance
from the ground of any projectile launched straight into the air. b. Answers may vary. In general, this might represent the distance
from a fixed point of an object with positive acceleration, such as a ball rolling down an incline.
3. Answers may vary. Sample graph:
239
4. a. The ball starts farther from the range finder in the data modeled by y = 0.85x +1.25 because this equation has the larger y-intercept.
b. After 3 sec, the ball modeled by y = 0.85x +1.25 is farther from the range finder because it has the larger y-value when x = 3.
c. The velocity of the ball is greater in the data modeled by y = 0.95x + 0.56 because it has the larger slope.
d. The equation that describes the distance-time graph of the reversed motion is y = −0.95x + 5.31 .
5. a. The equation y = 0.93x2 + 0.96x + 0.35 models the ball with the greater acceleration because it has the larger leading coefficient.
b. The equation y = 0.93x2 + 0.96x + 0.35 models the faster-moving ball. The displacement over the same time interval near 2 sec, for example [1.5, 2], is greater using this equation than the other.
c. The initial velocity is greater in the ball modeled by the equation y = 0.93x2 + 0.96x + 0.35 because it has the larger x-coefficient.
d. The balls would be the same distance from their respective range finders after about 0.12 sec.

240
Selected References Frautschi, S., R. Olenick, T. Apostol, and D. Goodstein. The Mechanical
Universe. Cambridge: Cambridge University Press, 1986. Halliday, D., and R. Resnick. Physics. New York: John Wiley & Sons, 1978. Murphy, J., J. Hollon, and P. Zitzewitz. Physics: Principles and Problems.
Toronto: Charles Merrill Publishing, 1972.
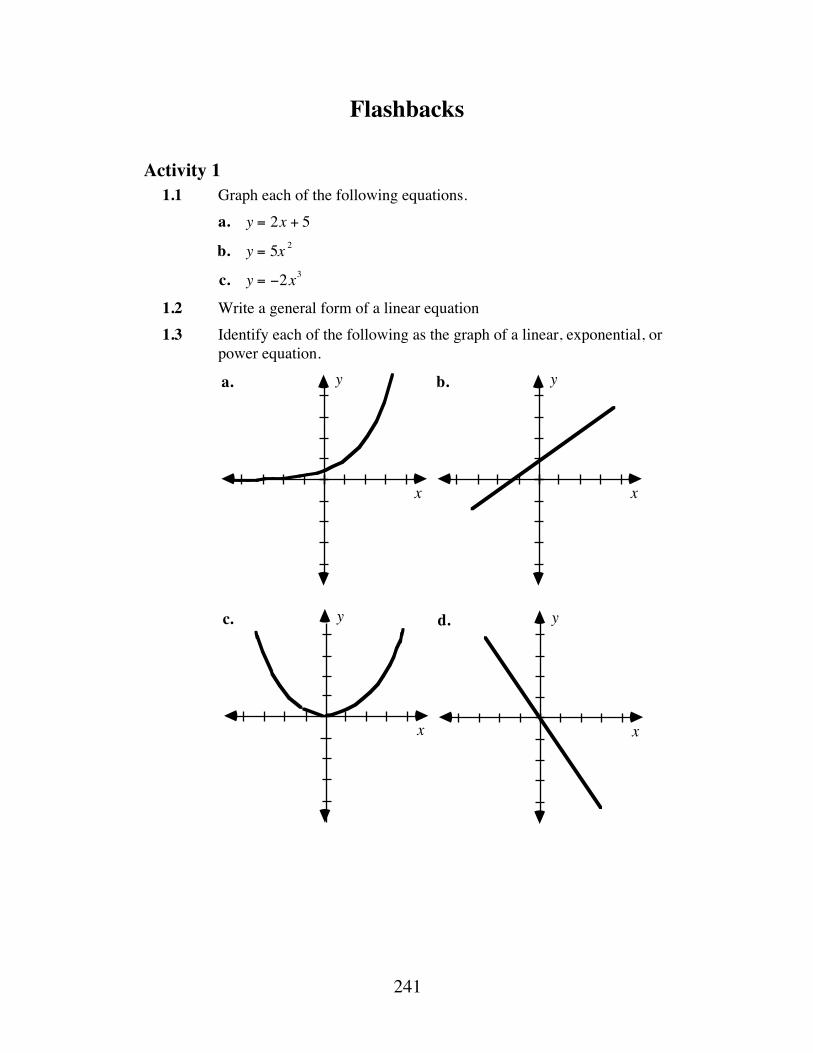
241
Flashbacks
Activity 1 1.1 Graph each of the following equations. a. y = 2x + 5
b. y = 5x 2
c. y = −2x3
1.2 Write a general form of a linear equation 1.3 Identify each of the following as the graph of a linear, exponential, or
power equation.
x
ya.
x
yb.
x
yc.
x
yd.
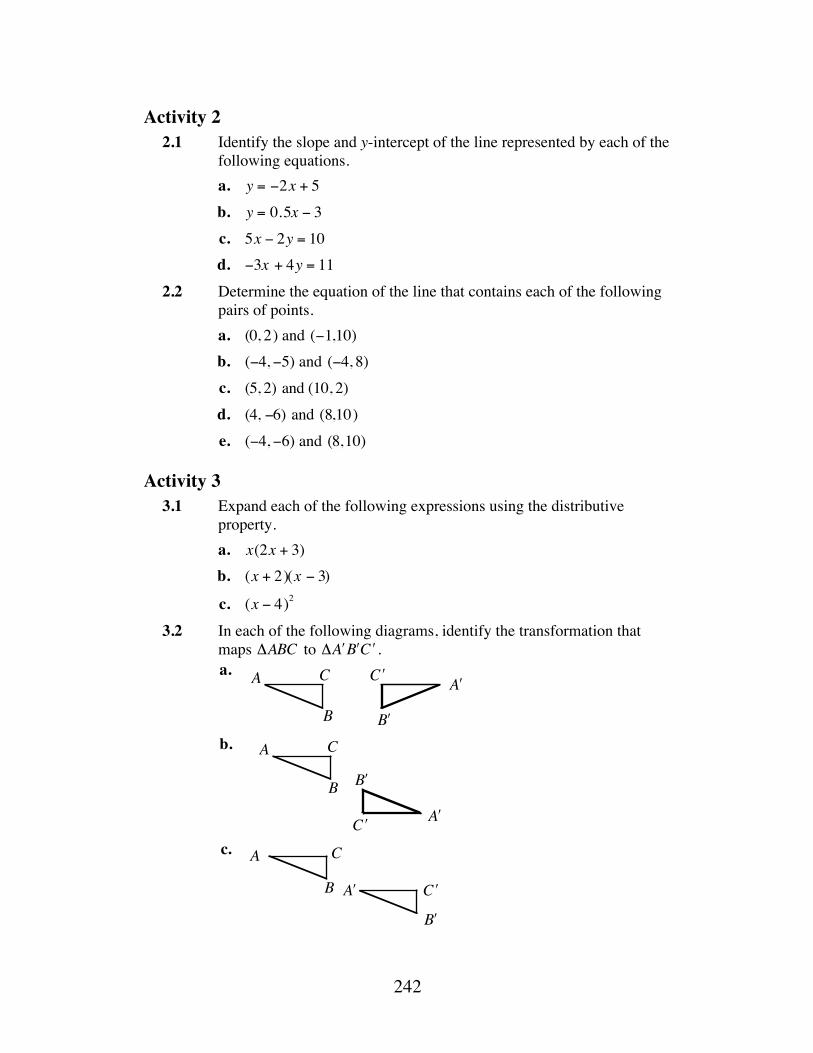
242
Activity 2 2.1 Identify the slope and y-intercept of the line represented by each of the
following equations. a. y = −2x + 5 b. y = 0.5x − 3 c. 5x − 2y = 10 d. −3x + 4y = 11 2.2 Determine the equation of the line that contains each of the following
pairs of points. a. (0, 2) and (−1,10) b. (−4, −5) and (−4, 8) c. (5, 2) and (10, 2) d. (4, −6) and (8,10) e. (−4, −6) and (8,10)
Activity 3 3.1 Expand each of the following expressions using the distributive
property. a. x(2x + 3) b. (x + 2)(x − 3)
c. (x − 4)2 3.2 In each of the following diagrams, identify the transformation that
maps ΔABC to Δ ʹ A ʹ B ʹ C .
A
B
Cʹ A
ʹ B
ʹ C a.
A
B
C
ʹ C
ʹ B
ʹ A
b.
c.
ʹ A
ʹ B
ʹ C
A
B
C

243
Activity 4 4.1 Consider the situation in which the data points (2,10), (–1,6), (0,4),
(3,17), and (–2,10) are modeled by the function f (x) = 2x2 − x + 3 . Determine the sum of the squares of the residuals for this model.
4.2 Graph the function f (x) = −6x2 − 2x + 25 .
a. Determine the corresponding value of f (x) for each of the following values of x:
1. 0 2. 2 3. 10 b. Identify the coordinates of the intersection of the graph and: 1. the x-axis 2. the y-axis
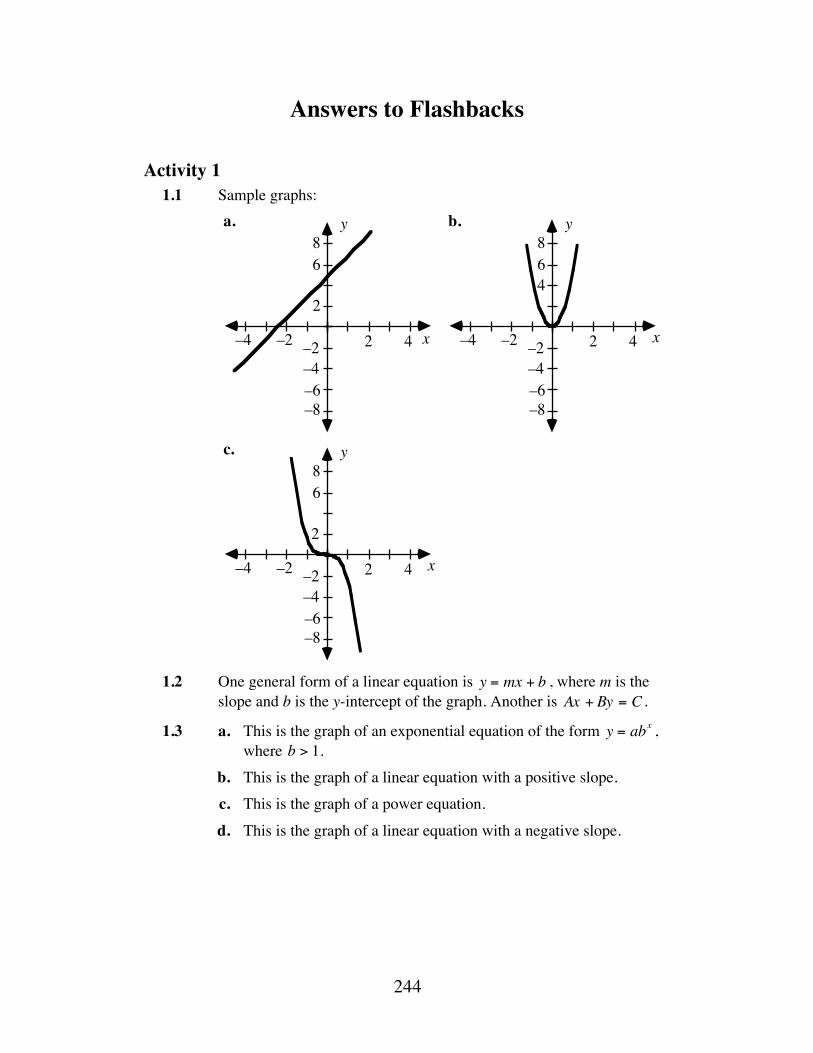
244
Answers to Flashbacks
Activity 1 1.1 Sample graphs:
1.2 One general form of a linear equation is y = mx + b , where m is the
slope and b is the y-intercept of the graph. Another is Ax + By = C .
1.3 a. This is the graph of an exponential equation of the form y = abx , where b > 1.
b. This is the graph of a linear equation with a positive slope. c. This is the graph of a power equation. d. This is the graph of a linear equation with a negative slope.
x
y
2 4–2–4
2
68
–2–4–6–8
a.
x
y
2 4–2–4
68
–2–4–6–8
b.
4
x
y
2 4–2–4
68
–2–4–6–8
c.
2
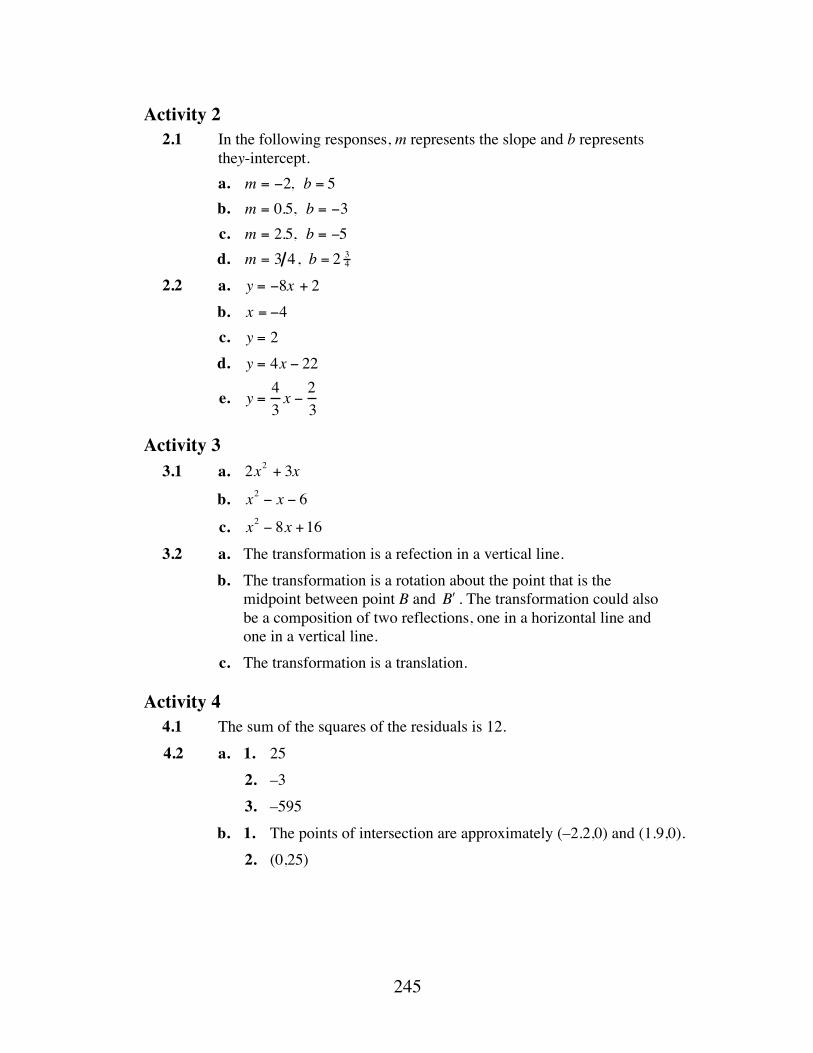
245
Activity 2 2.1 In the following responses, m represents the slope and b represents
they-intercept. a. m = −2, b = 5 b. m = 0.5, b = −3 c. m = 2.5, b = −5 d. m = 3 4, b = 2 3
4 2.2 a. y = −8x + 2 b. x = −4 c. y = 2 d. y = 4x − 22
e. y =43x −
23
Activity 3 3.1 a. 2x2 + 3x
b. x2 − x − 6
c. x2 − 8x +16 3.2 a. The transformation is a refection in a vertical line. b. The transformation is a rotation about the point that is the
midpoint between point B and ʹ B . The transformation could also be a composition of two reflections, one in a horizontal line and one in a vertical line.
c. The transformation is a translation.
Activity 4 4.1 The sum of the squares of the residuals is 12. 4.2 a. 1. 25 2. –3 3. –595 b. 1. The points of intersection are approximately (–2.2,0) and (1.9,0). 2. (0,25)


Fair Is Fair
How would you divide a cake between two hungry people? How would you divide a car among three teenage drivers? And what would you do if everyone in the family wanted the old grandfather clock? In this module, you’ll learn that a fair division doesn’t always have to be equal.
Anne Merrifield • Pete Stabio • Mike Trudnowski • Lisa Wood
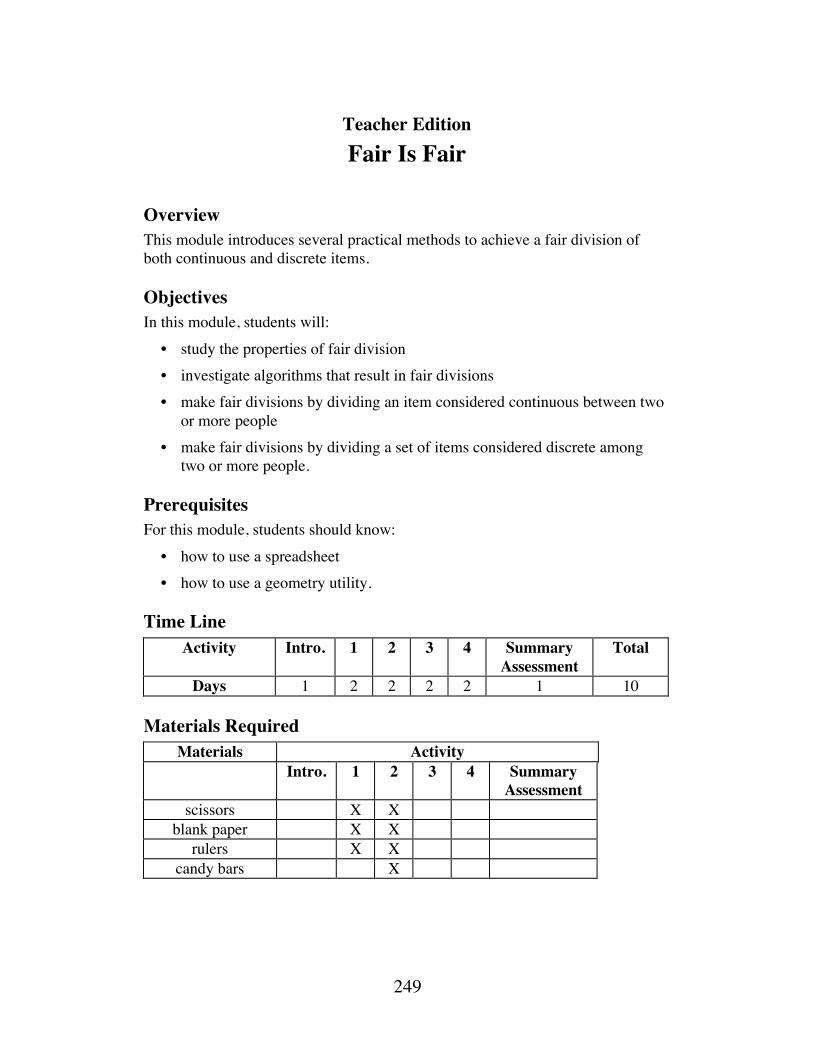
249
Teacher Edition Fair Is Fair
Overview This module introduces several practical methods to achieve a fair division of both continuous and discrete items.
Objectives In this module, students will: • study the properties of fair division • investigate algorithms that result in fair divisions • make fair divisions by dividing an item considered continuous between two
or more people • make fair divisions by dividing a set of items considered discrete among
two or more people.
Prerequisites For this module, students should know: • how to use a spreadsheet • how to use a geometry utility.
Time Line Activity Intro. 1 2 3 4 Summary
Assessment Total
Days 1 2 2 2 2 1 10
Materials Required Materials Activity
Intro. 1 2 3 4 Summary Assessment
scissors X X blank paper X X
rulers X X candy bars X

250
Technology Software Activity
Intro. 1 2 3 4 Summary Assessment
geometry utility X X spreadsheet X X X X
251
Fair Is Fair
Introduction (page 189) A fair division is obtained when each individual involved is satisfied with the share received. What is fair depends upon the value each individual places on the item. It is relatively easy to divide a sum of money into equal parts. But equal does not necessarily mean fair. For example, dividing a plot of land into portions of equal area may leave one person with a slag heap and another with a gold mine. In this module, students explore various ways to achieve a fair division.
Discussion (page 189) a. Students are likely to use descriptions like “equal shares,” “shares of
the same size,” and “equal parts.” You may wish to point out that a fair division does not necessarily mean that all parties involved receive equal amounts. Fairness is based on the method used to divide the items and the value each individual places on them.
b. Answers will vary. 1. Sample response: A fair division would give each person $8.33
and contribute the remaining penny to charity. An unfair division would give $6 to one person, $6 to the second, and $13 to the third.
2. Sample response: A fair division would give each person 2 25 pieces.
An unfair division would give 2 pieces to each of three people and 3 pieces to each of two people.
3. Sample response: A fair division would involve selling both the ring and car and dividing the money equally. An unfair division would give one person both items. Note: Some students might suggest that giving one person the car and the other the ring is an unfair division. However, it is also possible for the two parties to consider this as fair, depending on how they value the items.
4. Sample response: In a fair division, one person keeps the motorcycle and receives $25,333.33, while the other two receive $37,333.33, and the extra penny is given away. In an unfair division, one of the people would receive $80,000 in cash, one would receive $20,000, and the other would get the motorcycle.
5. Sample response: Based on need for water, it would be fair if the large man receives 1.25 L and the child receives 0.75 L. It would be unfair for the man and child each to receive 1 L.
c. Sample response: Sell the item and divide the money equally, or award the item to one individual who would then compensate the others.
252
(page 189)
Activity 1 In this activity, students explore various methods of dividing continuous items between two people.
Materials List • blank paper (two sheets per group) • scissors (one pair per group) • ruler (one per group)
Technology • geometry utility
Teacher Note In the following exploration, students may wish to use shapes drawn with a geometry utility. Once choices have been made, students can then use the utility to determine the areas of their chosen portions and see if their estimates of a fair division also result in an equal division. Note: Regardless of actual area, if both individuals believe the division was fair, then a fair division occurs.
Exploration (page 190) a. Students are likely to determine fairness by estimating area. A coin
toss may be used to decide who cuts and who chooses. b. A ruler may be used to simulate a knife. As in Part a, a coin toss may
be used to decide who controls the “knife.”
Discussion (page 191) a. Since one person determined the size of the pieces and the other
person received the first choice, both should be satisfied. b. Sample response: It was hard to judge a fair portion of the irregularly
shaped object. It also was difficult to decide who should cut and who should pick.
c. Sample response: Since each person has the opportunity to stop the knife, both should be satisfied with the results.
d. Some participants may feel that the process offers too little time to choose.
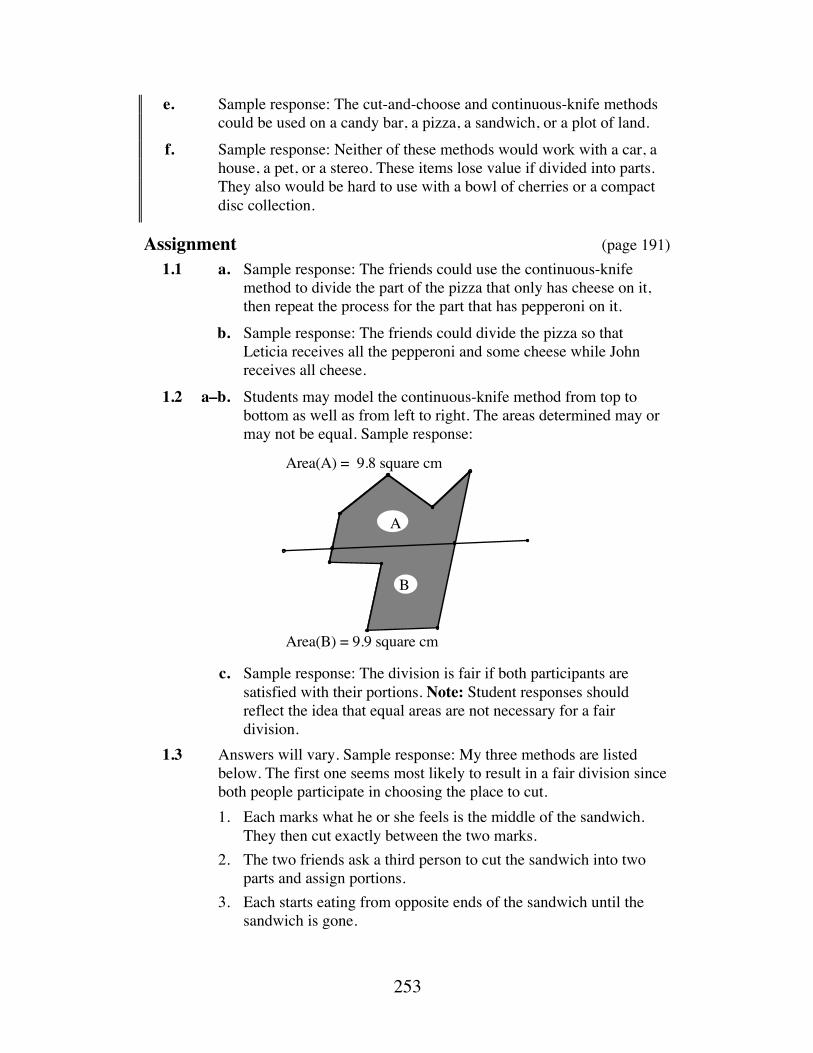
253
e. Sample response: The cut-and-choose and continuous-knife methods could be used on a candy bar, a pizza, a sandwich, or a plot of land.
f. Sample response: Neither of these methods would work with a car, a house, a pet, or a stereo. These items lose value if divided into parts. They also would be hard to use with a bowl of cherries or a compact disc collection.
Assignment (page 191) 1.1 a. Sample response: The friends could use the continuous-knife
method to divide the part of the pizza that only has cheese on it, then repeat the process for the part that has pepperoni on it.
b. Sample response: The friends could divide the pizza so that Leticia receives all the pepperoni and some cheese while John receives all cheese.
1.2 a–b. Students may model the continuous-knife method from top to bottom as well as from left to right. The areas determined may or may not be equal. Sample response:
c. Sample response: The division is fair if both participants are
satisfied with their portions. Note: Student responses should reflect the idea that equal areas are not necessary for a fair division.
1.3 Answers will vary. Sample response: My three methods are listed below. The first one seems most likely to result in a fair division since both people participate in choosing the place to cut.
1. Each marks what he or she feels is the middle of the sandwich. They then cut exactly between the two marks.
2. The two friends ask a third person to cut the sandwich into two parts and assign portions.
3. Each starts eating from opposite ends of the sandwich until the sandwich is gone.
Area(A) = 9.8 square cm
Area(B) = 9.9 square cm
A
B
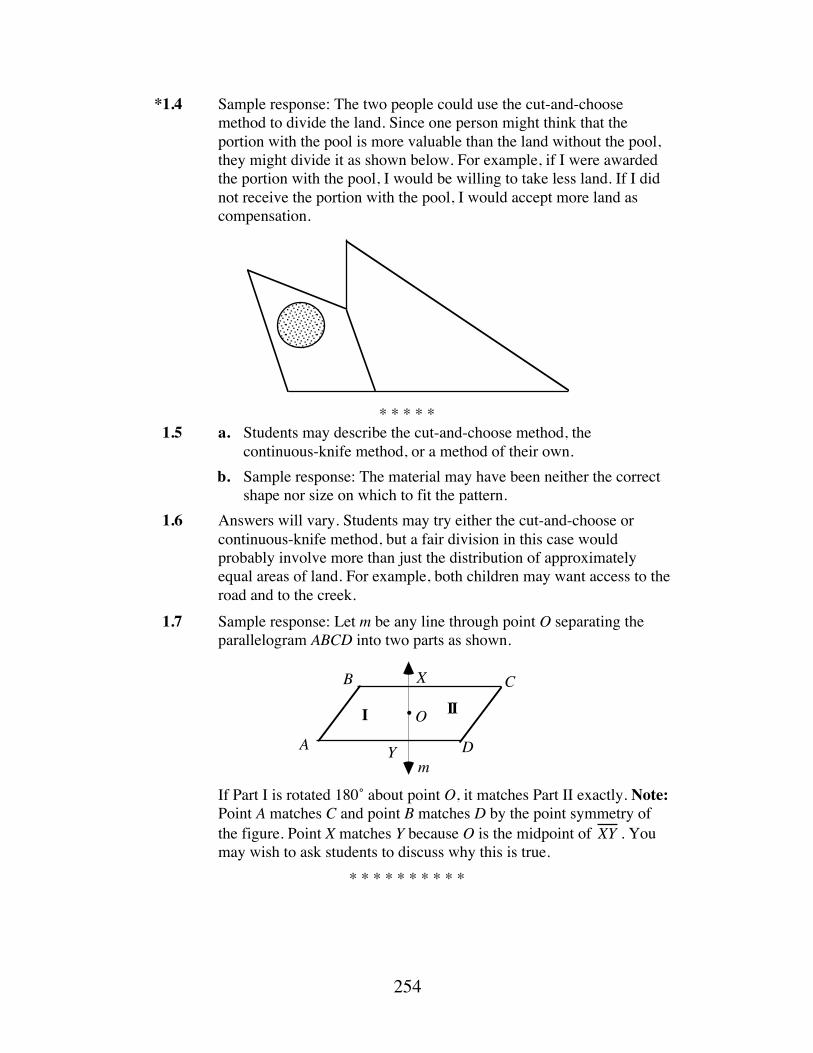
254
*1.4 Sample response: The two people could use the cut-and-choose method to divide the land. Since one person might think that the portion with the pool is more valuable than the land without the pool, they might divide it as shown below. For example, if I were awarded the portion with the pool, I would be willing to take less land. If I did not receive the portion with the pool, I would accept more land as compensation.
* * * * *
1.5 a. Students may describe the cut-and-choose method, the continuous-knife method, or a method of their own.
b. Sample response: The material may have been neither the correct shape nor size on which to fit the pattern.
1.6 Answers will vary. Students may try either the cut-and-choose or continuous-knife method, but a fair division in this case would probably involve more than just the distribution of approximately equal areas of land. For example, both children may want access to the road and to the creek.
1.7 Sample response: Let m be any line through point O separating the parallelogram ABCD into two parts as shown.
If Part I is rotated 180˚ about point O, it matches Part II exactly. Note:
Point A matches C and point B matches D by the point symmetry of the figure. Point X matches Y because O is the midpoint of XY . You may wish to ask students to discuss why this is true.
* * * * * * * * * *
X
Ym
B
A D
C
OI II
255
(page 193)
Activity 2
Materials List • blank paper (two sheets per group) • scissors (one pair per group) • candy bars (optional; one per group)
Teacher Note In the following exploration, students divide an object using the reduction method. As an alternative to using candy bars, you may wish to ask students to create irregularly shaped objects out of paper.
Technology • geometry utility
Exploration (page 193) Students examine an algorithm for dividing a continuous object among three people. This algorithm can be extended to any number of people.
Discussion (page 194) a. Sample response: A person would reduce the share if it seemed to be
too large. b. If no one reduces a portion, the person who cut it receives it. c. Sample response: The reduction method should result in a fair division
since each of the participants has an opportunity to reduce an unfair portion.
d. Sample response: Yes. It is similar to the cut-and-choose method. e. Sample response: Since each person considers the item as a whole
before the division takes place, the sum of the fractional values must be 1. For example, if an item is divided into two parts, one person may assign a value of 1 2 to each part. Another person might consider the same parts as 1 3 and 2 3 of the item. In either case, the sum of the fractional values is 1.
f. As described in Activity 1, the cut-and-choose method can only be used with two people. The other methods can be easily adjusted to allow an unlimited number of participants.
256
Assignment (page 194) 2.1 a. Sample response: I would not reduce this portion because it is
already less than one-third of the candy bar. b. Sample response: I would reduce this potion because it is more
than one-third of the candy bar. 2.2 a. Sample response: The first person cuts the object into two equal
portions. The second person chooses one of the portions. The first person and the second person then cut their portions into thirds. The third person picks one portion from each person. The first person and the second person keep their remaining portions.
b. Sample response: Yes, this method can be modified for five people. For example, consider five people designated by the initials A, B, C, D, and E. Assign A and B to act as a team and C and D to act as a team. Ask the two teams to divide the object into two portions. Next, ask each team to divide its portion into two more portions, for a total of four portions. Now have A, B, C, and D each divide one of the “fourths” into five portions. Let person E pick one piece from each of the other people, who keep their remaining portions.
*2.3 Answers will vary. Sample response: Persons 1 and 2 divide the object into two fair portions. Each person then divides their portion into three additional pieces. Person 3 selects one piece from person 1 and another from person 2, who keep their remaining pieces.
2.4 a. Sample response: In this case, most people would want the smallest share, not the largest. The reduction method would allow the last person making a choice to reduce his area to almost nothing, and one person would end up mowing most of the grass.
b. Sample response: Since the hills and tree groves are harder to cut, it may not be fair to simply divide the park into thirds. A method similar to the reduction method may be used if it is based on expansion instead. Once the first person chooses, the second and third persons have an opportunity to expand the section. The person who makes the last expansion gets that section to mow. The remaining two divide the rest of the park in a similar manner.
c. Answers will vary. Sample response: Rusty should have to cut a greater amount of the park, but he will have to be restricted to the open regions because the riding mower may have problems maneuvering in the groves.
* * * * * 2.5 Sample response: After the first person to stop the knife receives a
portion, the rest continue with what portion remains. The process continues until each person has received a share.
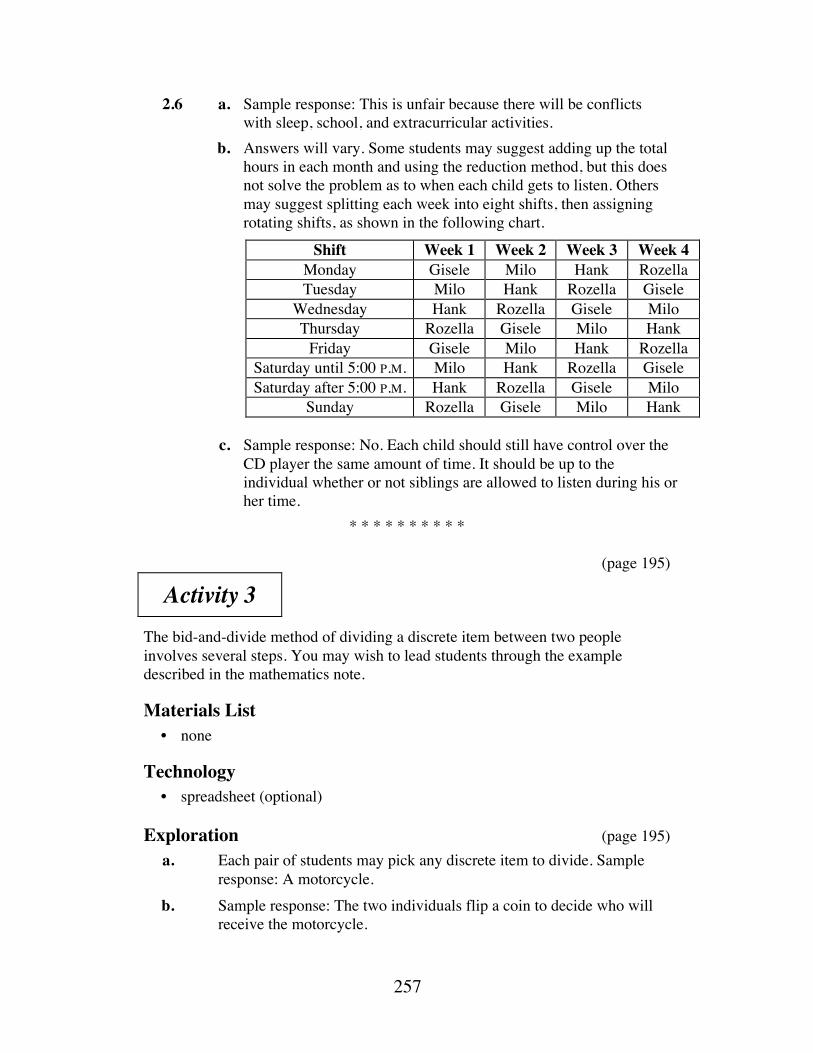
257
2.6 a. Sample response: This is unfair because there will be conflicts with sleep, school, and extracurricular activities.
b. Answers will vary. Some students may suggest adding up the total hours in each month and using the reduction method, but this does not solve the problem as to when each child gets to listen. Others may suggest splitting each week into eight shifts, then assigning rotating shifts, as shown in the following chart.
Shift Week 1 Week 2 Week 3 Week 4 Monday Gisele Milo Hank Rozella Tuesday Milo Hank Rozella Gisele
Wednesday Hank Rozella Gisele Milo Thursday Rozella Gisele Milo Hank
Friday Gisele Milo Hank Rozella Saturday until 5:00 P.M. Milo Hank Rozella Gisele Saturday after 5:00 P.M. Hank Rozella Gisele Milo
Sunday Rozella Gisele Milo Hank c. Sample response: No. Each child should still have control over the
CD player the same amount of time. It should be up to the individual whether or not siblings are allowed to listen during his or her time.
* * * * * * * * * * (page 195)
Activity 3 The bid-and-divide method of dividing a discrete item between two people involves several steps. You may wish to lead students through the example described in the mathematics note.
Materials List • none
Technology • spreadsheet (optional)
Exploration (page 195) a. Each pair of students may pick any discrete item to divide. Sample
response: A motorcycle. b. Sample response: The two individuals flip a coin to decide who will
receive the motorcycle.
258
c. Sample response: The individuals have the motorcycle appraised. The one who receives the motorcycle pays the other person half the appraised value.
d. Sample response: Since the person receiving the motorcycle pays the other person half the appraised value, the value of the settlement for both is the same.
Discussion (page 196) a. Sample response: The person who did not receive the item was paid
cash as compensation. b. Methods devised by students may or may not result in a fair division.
Sample response: Yes, it is fair, since the pair agreed on a method and used an appraised value to assign equal shares.
c. Sample response: No. The fairness of a division is based on each person’s perception of a fair share, not on equal values.
d. Some student methods may not be easily altered to accommodate more than two people and one item. Note: Students modify the bid-and-divide method outlined in this activity to accommodate more people and more items in Activity 4.
e. Sample response: Using the high bid guarantees that all will get at least what they consider fair shares.
f. The high bid is always more than the sum of one-half the high bid and one-half the low bid (the shares of bids). As a result, there is always a positive value-pool balance to contribute to the total fair share.
g. The value pool sets the total value available. The settlements represent how the value pool is divided.
h. Compensation for the person who does not receive the item equals the cash required to create that person’s fair share. That amount is paid by the person who receives the item. The sum of the two is 0.
259
Assignment (page 198) 3.1 Sample chart:
Yoshi Shiho Value Pool Bids 900.00 1050.00 Total of High Bids 1050.00 – Total of Shares
of Bids 975.00
Sum of Bids 900.00 1050.00 Value-pool balance 75.00 Share of Bids 450.00 525.00 + Equal Share of Value-pool balance
37.50 37.50
Total Fair Share 487.50 562.50 (Item Awarded) Total Value Awarded
(none)
0.00
(sword)
1050.00
Compensation +487.50 –487.50 Final Settlement Value
487.50 562.50
3.2 a. Dena must pay Milo $14,000 in compensation. b. Milo receives $14,000 in cash. Dena receives the car less $14,000
or $18,000 of value. *3.3 Sample chart:
Leif Neva Value Pool Bids 120.00 130.00 Total of High Bids 130.00 – Total of Shares
of Bids 125.00
Sum of Bids 120.00 130.00 Value-pool balance 5.00 Share of Bids 60.00 65.00 + Equal Share of Value-pool balance
2.50 2.50
Total Fair Share 62.50 67.50 (Item Awarded) Total Value Awarded
(none)
0.00
(bike)
130.00
Compensation +62.50 –62.50 Final Settlement Value
62.50 67.50
260
3.4 Students may use a spreadsheet to explore different combinations of bids. Sample response: If Neva wants the bike, she should bid $175. Then, even if she doesn’t get it, she will receive the largest possible fair share.
* * * * * 3.5 Sample table:
Alexi Norjar Value Pool Bids 800.00 900.00 Total of High Bids 900.00 – Total of Shares
of Bids 850.00
Sum of Bids 800.00 900.00 Value-pool balance 50.00 Share of Bids 400.00 450.00 + Equal Share of Value-pool balance
25.00 25.00
Total Fair Share 425.00 475.00 (Item Awarded) Total Value Awarded
(none)
0.00
(computer)
900.00
Compensation +425.00 –425.00 Final Settlement Value
425.00 475.00
3.6 a. Sample response: If the expenses paid for the trip do not have to
be considered a discrete item, each could receive half and pay the balance themselves. If it can only be given to one person, the one receiving the prize could reimburse the other half the value.
b. If Miranda and Willis both agree on a way for determining who is the recipient, then the chosen process is fair.
* * * * * * * * * * (page 199)
Activity 4 Students modify the bid-and-divide method described in Activity 3 to fairly divide several items among more than two people.
Materials List • none
Technology • spreadsheet
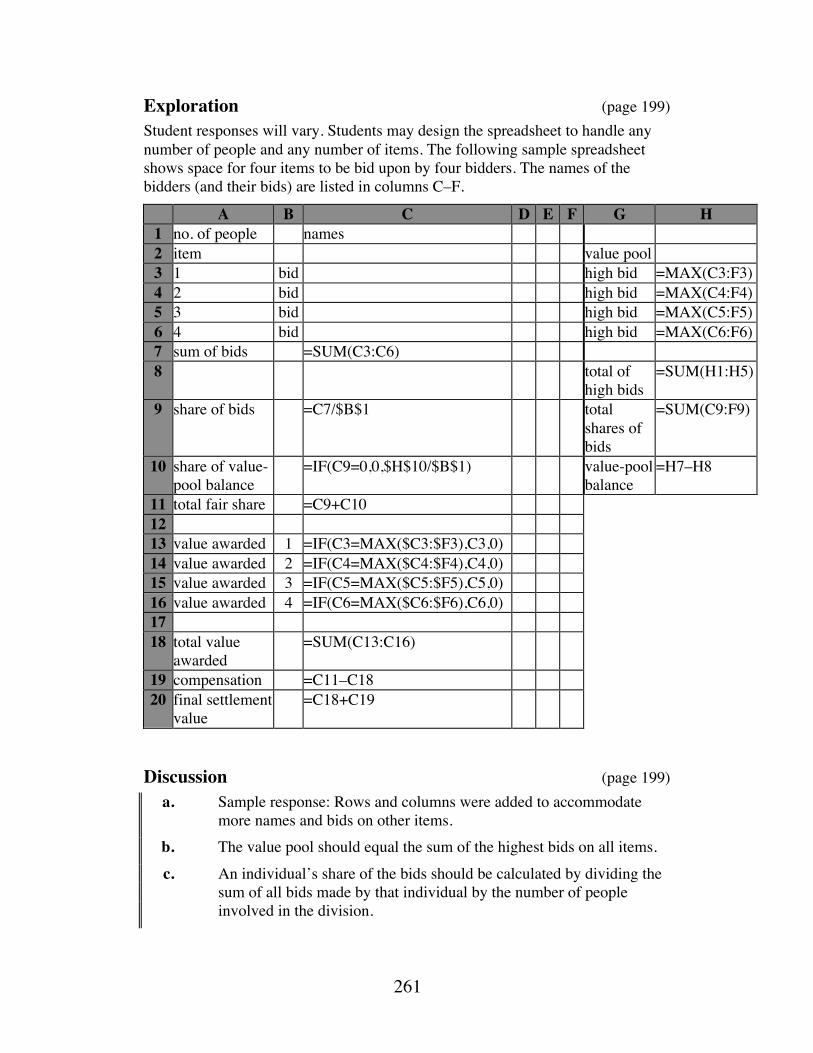
261
Exploration (page 199) Student responses will vary. Students may design the spreadsheet to handle any number of people and any number of items. The following sample spreadsheet shows space for four items to be bid upon by four bidders. The names of the bidders (and their bids) are listed in columns C–F.
A B C D E F G H 1 no. of people names 2 item value pool 3 1 bid high bid =MAX(C3:F3) 4 2 bid high bid =MAX(C4:F4) 5 3 bid high bid =MAX(C5:F5) 6 4 bid high bid =MAX(C6:F6) 7 sum of bids =SUM(C3:C6) 8 total of
high bids =SUM(H1:H5)
9 share of bids =C7/$B$1 total shares of bids
=SUM(C9:F9)
10 share of value-pool balance
=IF(C9=0,0,$H$10/$B$1) value-pool balance
=H7–H8
11 total fair share =C9+C10 12 13 value awarded 1 =IF(C3=MAX($C3:$F3),C3,0) 14 value awarded 2 =IF(C4=MAX($C4:$F4),C4,0) 15 value awarded 3 =IF(C5=MAX($C5:$F5),C5,0) 16 value awarded 4 =IF(C6=MAX($C6:$F6),C6,0) 17 18 total value
awarded =SUM(C13:C16)
19 compensation =C11–C18 20 final settlement
value =C18+C19
Discussion (page 199) a. Sample response: Rows and columns were added to accommodate
more names and bids on other items. b. The value pool should equal the sum of the highest bids on all items. c. An individual’s share of the bids should be calculated by dividing the
sum of all bids made by that individual by the number of people involved in the division.
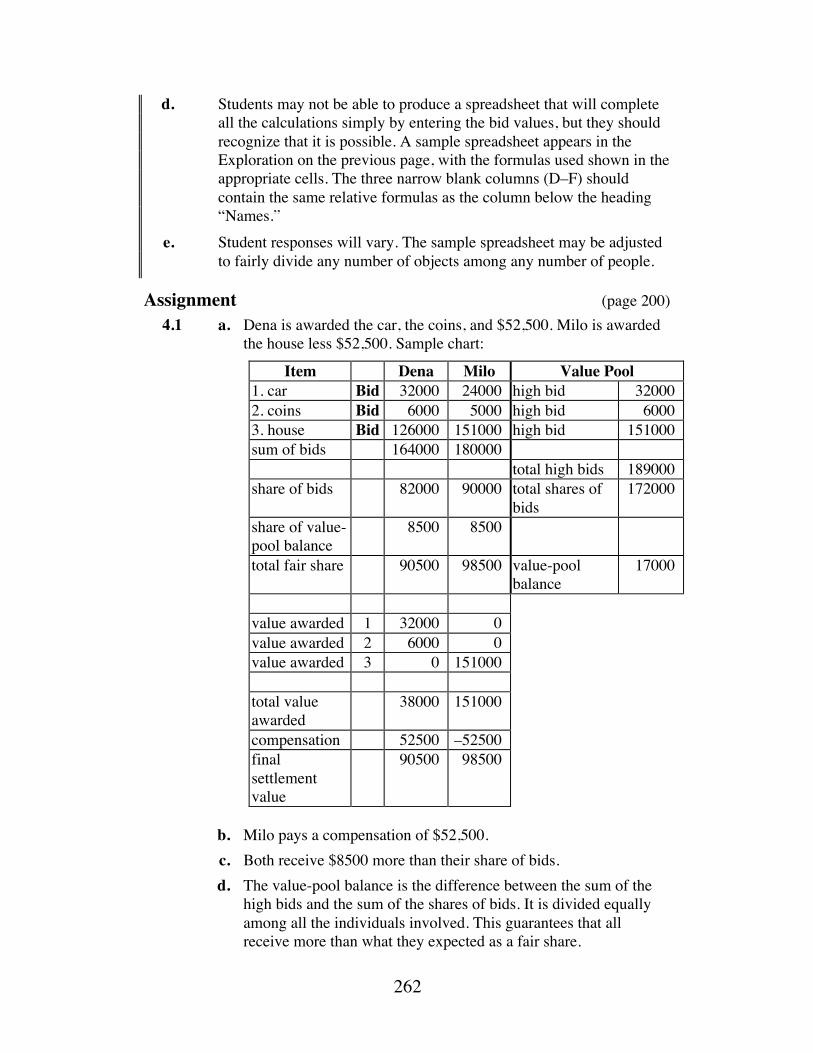
262
d. Students may not be able to produce a spreadsheet that will complete all the calculations simply by entering the bid values, but they should recognize that it is possible. A sample spreadsheet appears in the Exploration on the previous page, with the formulas used shown in the appropriate cells. The three narrow blank columns (D–F) should contain the same relative formulas as the column below the heading “Names.”
e. Student responses will vary. The sample spreadsheet may be adjusted to fairly divide any number of objects among any number of people.
Assignment (page 200) 4.1 a. Dena is awarded the car, the coins, and $52,500. Milo is awarded
the house less $52,500. Sample chart:
Item Dena Milo Value Pool 1. car Bid 32000 24000 high bid 32000 2. coins Bid 6000 5000 high bid 6000 3. house Bid 126000 151000 high bid 151000 sum of bids 164000 180000
total high bids 189000 share of bids 82000 90000 total shares of
bids 172000
share of value-pool balance
8500 8500
total fair share 90500 98500 value-pool balance
17000
value awarded 1 32000 0 value awarded 2 6000 0 value awarded 3 0 151000
total value awarded
38000 151000
compensation 52500 –52500 final settlement value
90500 98500
b. Milo pays a compensation of $52,500. c. Both receive $8500 more than their share of bids. d. The value-pool balance is the difference between the sum of the
high bids and the sum of the shares of bids. It is divided equally among all the individuals involved. This guarantees that all receive more than what they expected as a fair share.
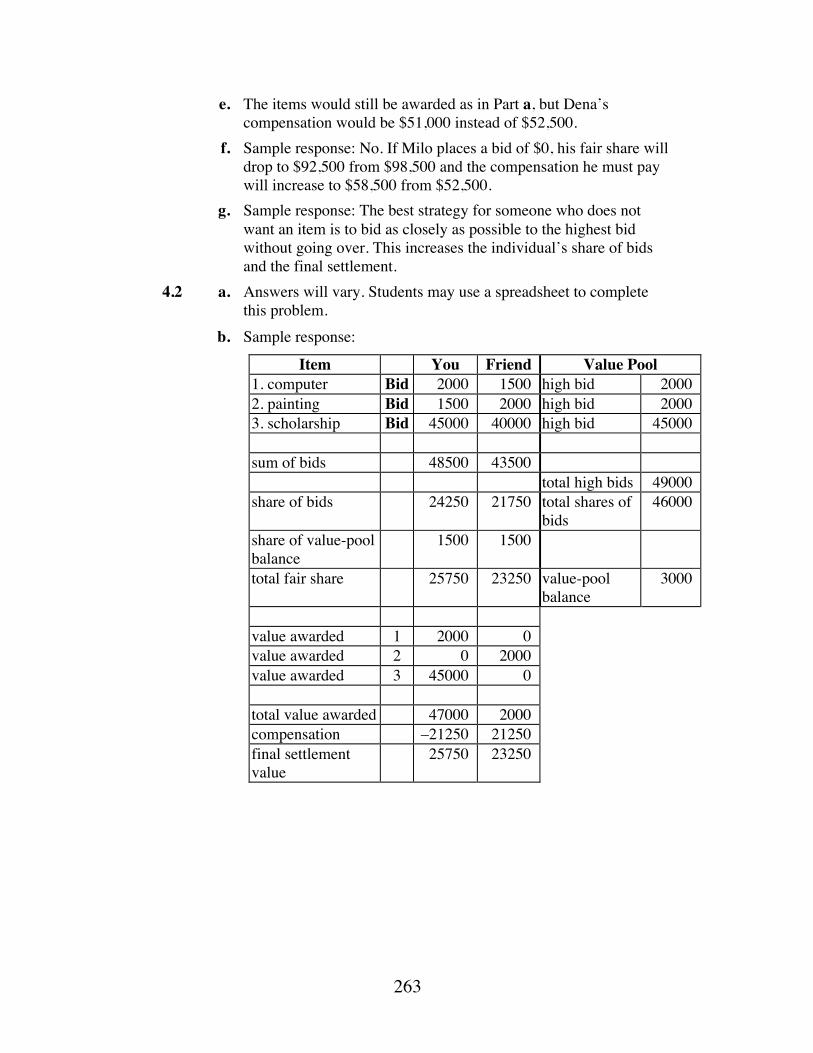
263
e. The items would still be awarded as in Part a, but Dena’s compensation would be $51,000 instead of $52,500.
f. Sample response: No. If Milo places a bid of $0, his fair share will drop to $92,500 from $98,500 and the compensation he must pay will increase to $58,500 from $52,500.
g. Sample response: The best strategy for someone who does not want an item is to bid as closely as possible to the highest bid without going over. This increases the individual’s share of bids and the final settlement.
4.2 a. Answers will vary. Students may use a spreadsheet to complete this problem.
b. Sample response:
Item You Friend Value Pool 1. computer Bid 2000 1500 high bid 2000 2. painting Bid 1500 2000 high bid 2000 3. scholarship Bid 45000 40000 high bid 45000 sum of bids 48500 43500
total high bids 49000 share of bids 24250 21750 total shares of
bids 46000
share of value-pool balance
1500 1500
total fair share 25750 23250 value-pool balance
3000
value awarded 1 2000 0 value awarded 2 0 2000 value awarded 3 45000 0
total value awarded 47000 2000 compensation –21250 21250 final settlement value
25750 23250
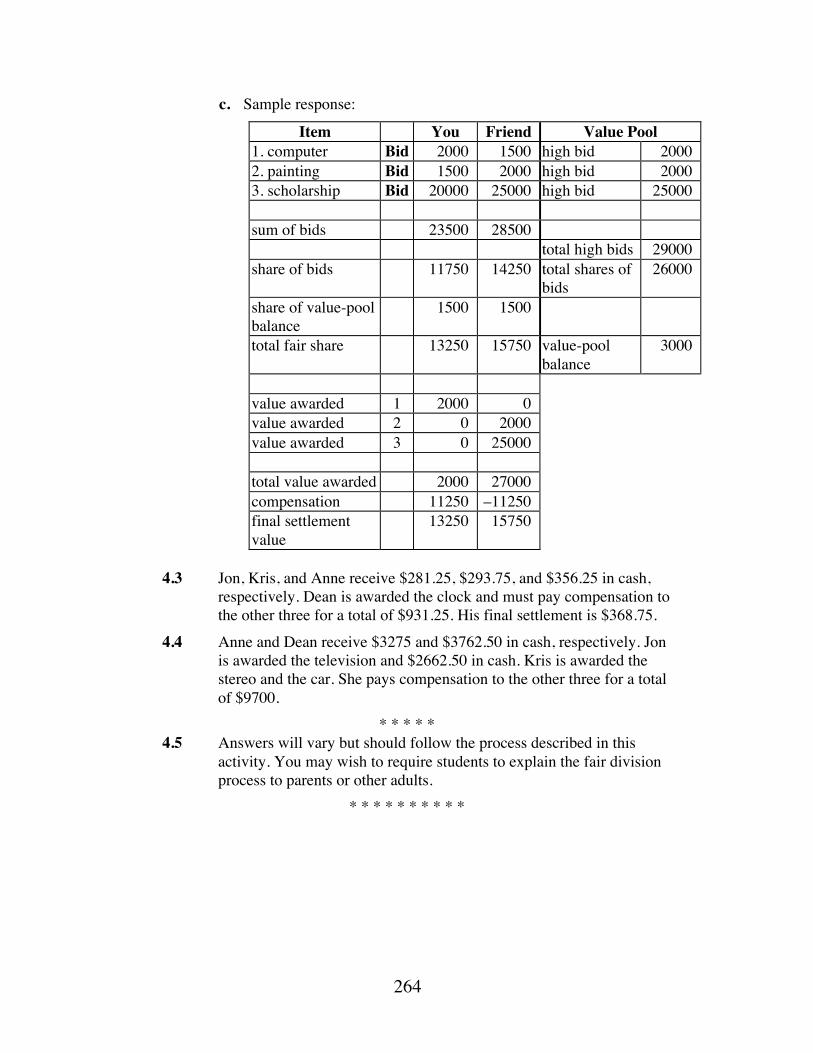
264
c. Sample response:
Item You Friend Value Pool 1. computer Bid 2000 1500 high bid 2000 2. painting Bid 1500 2000 high bid 2000 3. scholarship Bid 20000 25000 high bid 25000 sum of bids 23500 28500
total high bids 29000 share of bids 11750 14250 total shares of
bids 26000
share of value-pool balance
1500 1500
total fair share 13250 15750 value-pool balance
3000
value awarded 1 2000 0 value awarded 2 0 2000 value awarded 3 0 25000
total value awarded 2000 27000 compensation 11250 –11250 final settlement value
13250 15750
4.3 Jon, Kris, and Anne receive $281.25, $293.75, and $356.25 in cash,
respectively. Dean is awarded the clock and must pay compensation to the other three for a total of $931.25. His final settlement is $368.75.
4.4 Anne and Dean receive $3275 and $3762.50 in cash, respectively. Jon is awarded the television and $2662.50 in cash. Kris is awarded the stereo and the car. She pays compensation to the other three for a total of $9700.
* * * * * 4.5 Answers will vary but should follow the process described in this
activity. You may wish to require students to explain the fair division process to parents or other adults.
* * * * * * * * * *
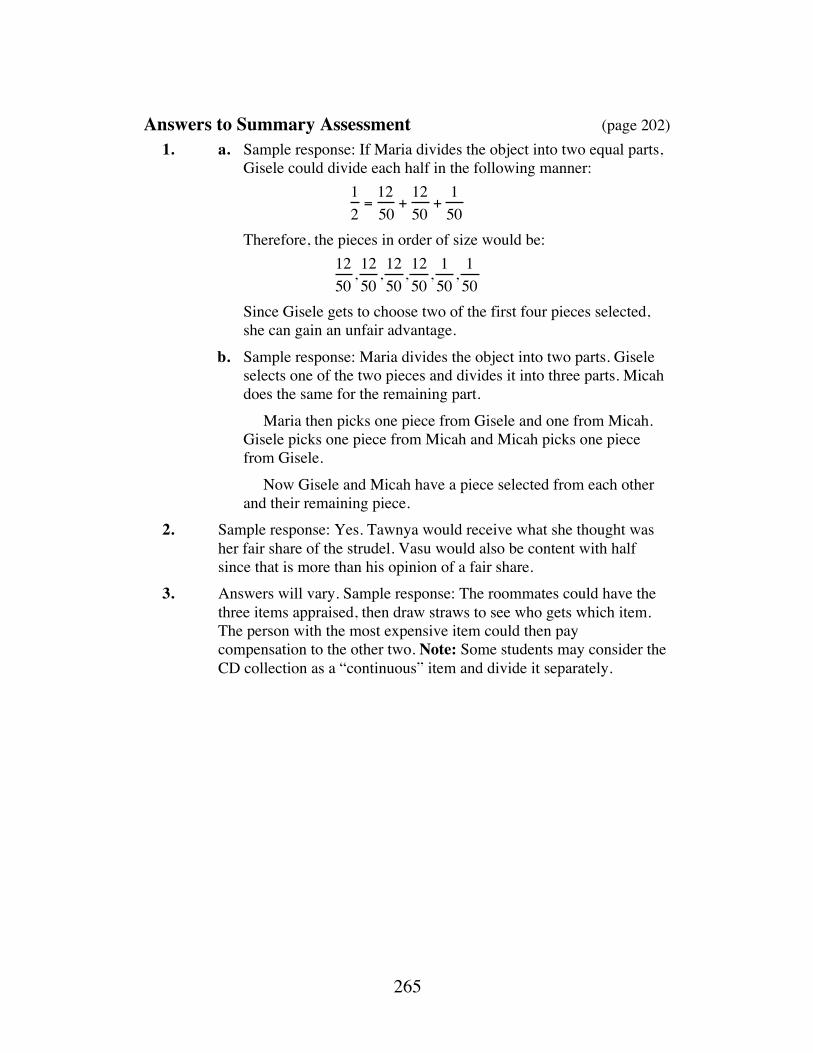
265
Answers to Summary Assessment (page 202) 1. a. Sample response: If Maria divides the object into two equal parts,
Gisele could divide each half in the following manner: 12=1250
+1250
+150
Therefore, the pieces in order of size would be: 1250, 1250, 1250, 1250, 150, 150
Since Gisele gets to choose two of the first four pieces selected, she can gain an unfair advantage.
b. Sample response: Maria divides the object into two parts. Gisele selects one of the two pieces and divides it into three parts. Micah does the same for the remaining part.
Maria then picks one piece from Gisele and one from Micah. Gisele picks one piece from Micah and Micah picks one piece from Gisele.
Now Gisele and Micah have a piece selected from each other and their remaining piece.
2. Sample response: Yes. Tawnya would receive what she thought was her fair share of the strudel. Vasu would also be content with half since that is more than his opinion of a fair share.
3. Answers will vary. Sample response: The roommates could have the three items appraised, then draw straws to see who gets which item. The person with the most expensive item could then pay compensation to the other two. Note: Some students may consider the CD collection as a “continuous” item and divide it separately.
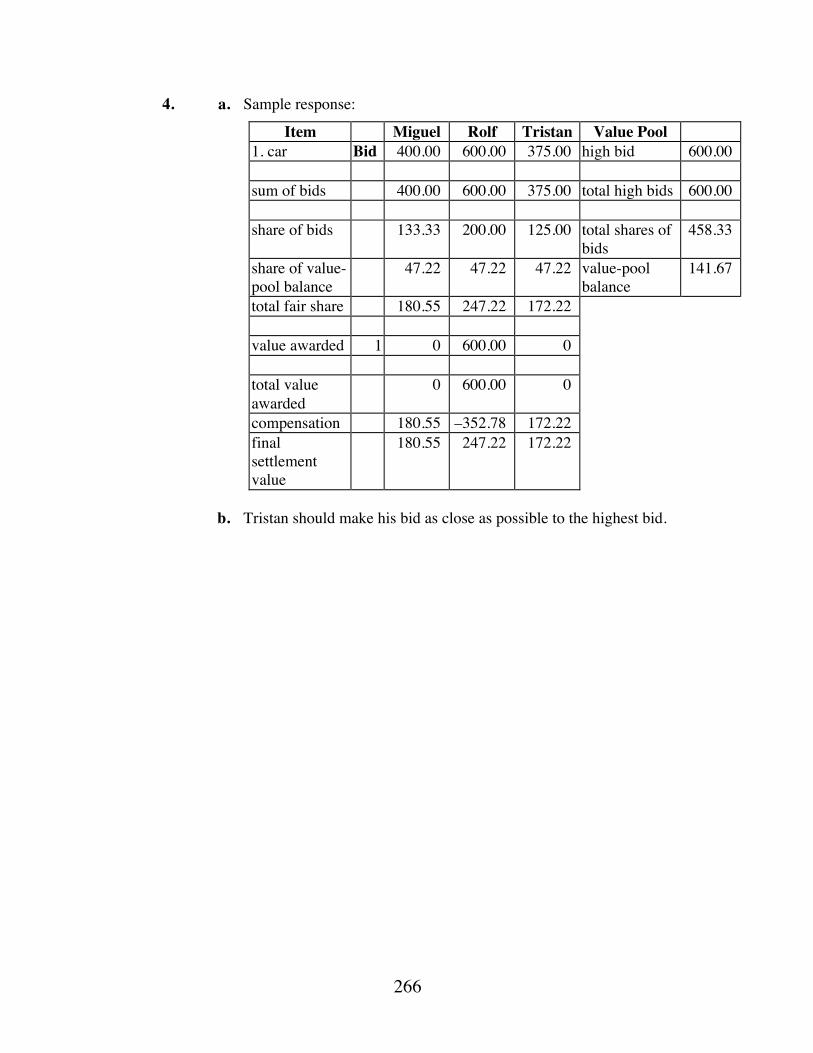
266
4. a. Sample response:
Item Miguel Rolf Tristan Value Pool 1. car Bid 400.00 600.00 375.00 high bid 600.00 sum of bids 400.00 600.00 375.00 total high bids 600.00
share of bids 133.33 200.00 125.00 total shares of
bids 458.33
share of value-pool balance
47.22 47.22 47.22 value-pool balance
141.67
total fair share 180.55 247.22 172.22
value awarded 1 0 600.00 0
total value awarded
0 600.00 0
compensation 180.55 –352.78 172.22 final settlement value
180.55 247.22 172.22
b. Tristan should make his bid as close as possible to the highest bid.
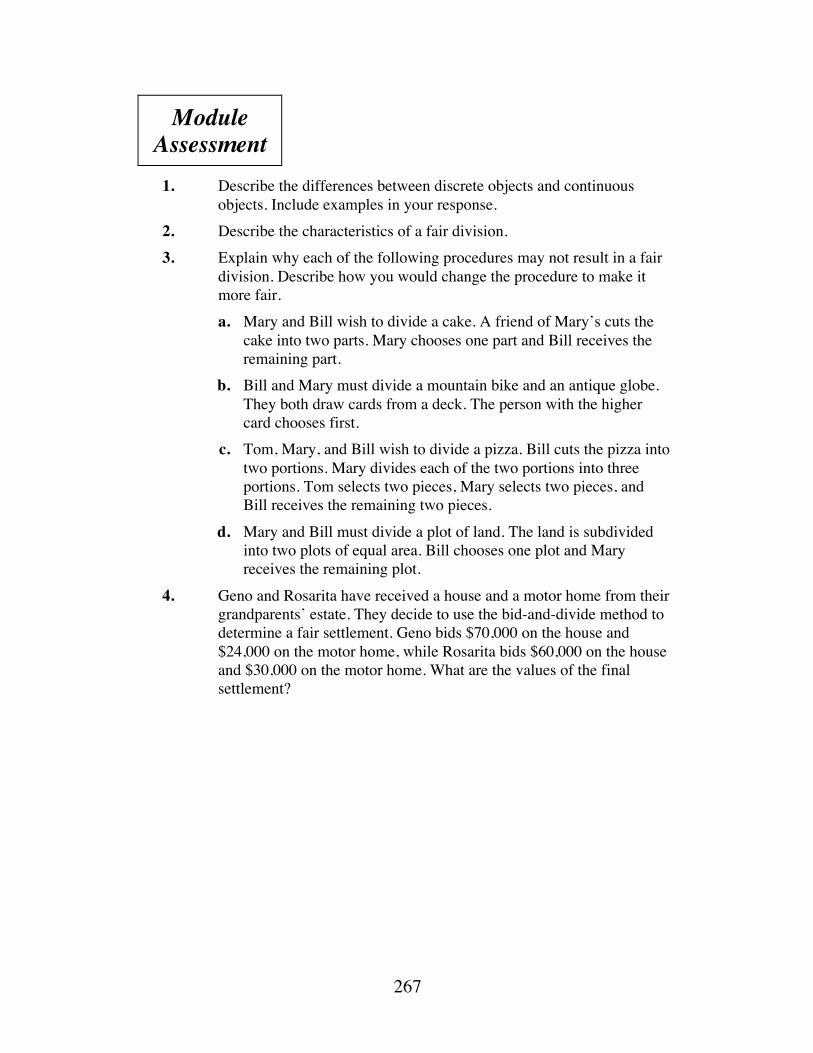
267
Module Assessment
1. Describe the differences between discrete objects and continuous
objects. Include examples in your response. 2. Describe the characteristics of a fair division. 3. Explain why each of the following procedures may not result in a fair
division. Describe how you would change the procedure to make it more fair.
a. Mary and Bill wish to divide a cake. A friend of Mary’s cuts the cake into two parts. Mary chooses one part and Bill receives the remaining part.
b. Bill and Mary must divide a mountain bike and an antique globe. They both draw cards from a deck. The person with the higher card chooses first.
c. Tom, Mary, and Bill wish to divide a pizza. Bill cuts the pizza into two portions. Mary divides each of the two portions into three portions. Tom selects two pieces, Mary selects two pieces, and Bill receives the remaining two pieces.
d. Mary and Bill must divide a plot of land. The land is subdivided into two plots of equal area. Bill chooses one plot and Mary receives the remaining plot.
4. Geno and Rosarita have received a house and a motor home from their grandparents’ estate. They decide to use the bid-and-divide method to determine a fair settlement. Geno bids $70,000 on the house and $24,000 on the motor home, while Rosarita bids $60,000 on the house and $30,000 on the motor home. What are the values of the final settlement?
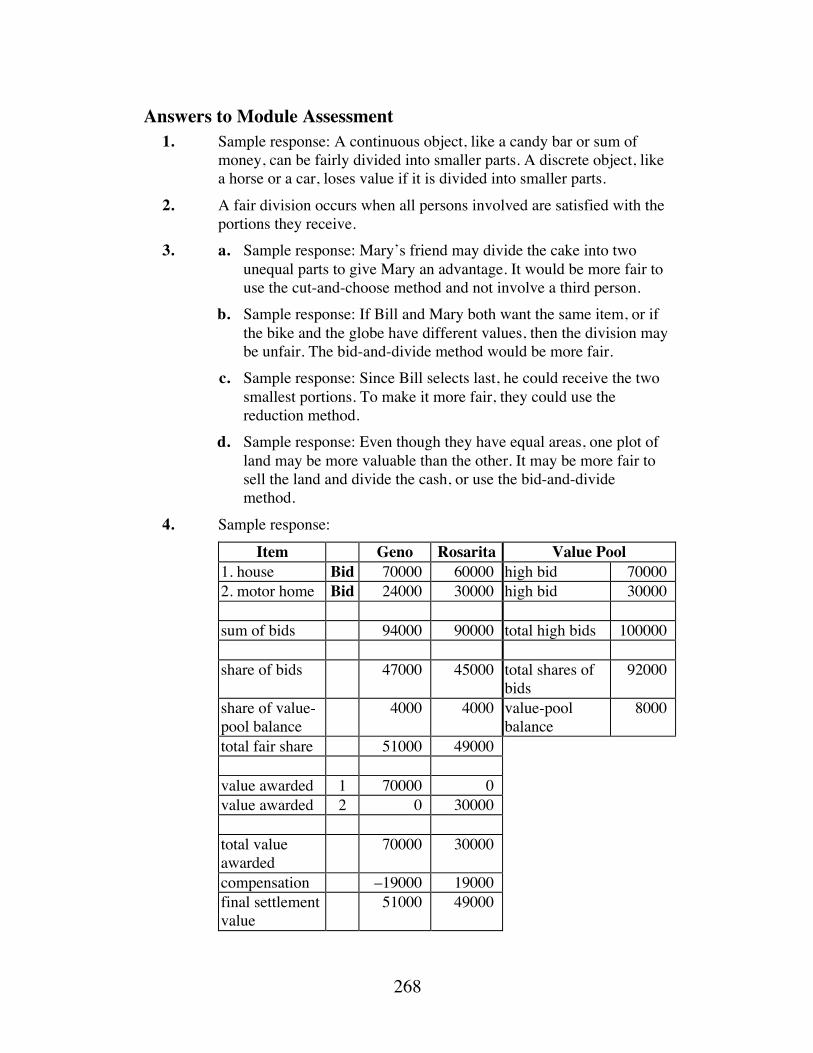
268
Answers to Module Assessment 1. Sample response: A continuous object, like a candy bar or sum of
money, can be fairly divided into smaller parts. A discrete object, like a horse or a car, loses value if it is divided into smaller parts.
2. A fair division occurs when all persons involved are satisfied with the portions they receive.
3. a. Sample response: Mary’s friend may divide the cake into two unequal parts to give Mary an advantage. It would be more fair to use the cut-and-choose method and not involve a third person.
b. Sample response: If Bill and Mary both want the same item, or if the bike and the globe have different values, then the division may be unfair. The bid-and-divide method would be more fair.
c. Sample response: Since Bill selects last, he could receive the two smallest portions. To make it more fair, they could use the reduction method.
d. Sample response: Even though they have equal areas, one plot of land may be more valuable than the other. It may be more fair to sell the land and divide the cash, or use the bid-and-divide method.
4. Sample response:
Item Geno Rosarita Value Pool 1. house Bid 70000 60000 high bid 70000 2. motor home Bid 24000 30000 high bid 30000 sum of bids 94000 90000 total high bids 100000
share of bids 47000 45000 total shares of
bids 92000
share of value-pool balance
4000 4000 value-pool balance
8000
total fair share 51000 49000
value awarded 1 70000 0 value awarded 2 0 30000
total value awarded
70000 30000
compensation –19000 19000 final settlement value
51000 49000

269
Selected References Bennett, S., D. DeTemple, M. Dirks, B. Newell, J. M. Robertson, and B. Tyus.
Fair Divisions: Getting Your Fair Share. High School Mathematics and Its Applications (HiMAP) Project. Module 9. Arlington, MA: COMAP, 1987.
Consortium for Mathematics and Its Applications (COMAP). For All Practical Purposes: Introduction to Contemporary Mathematics. New York: W. H. Freeman and Co., 1988.
Steinhaus, H. Mathematical Snapshots. New York: Oxford University Press, 1960.
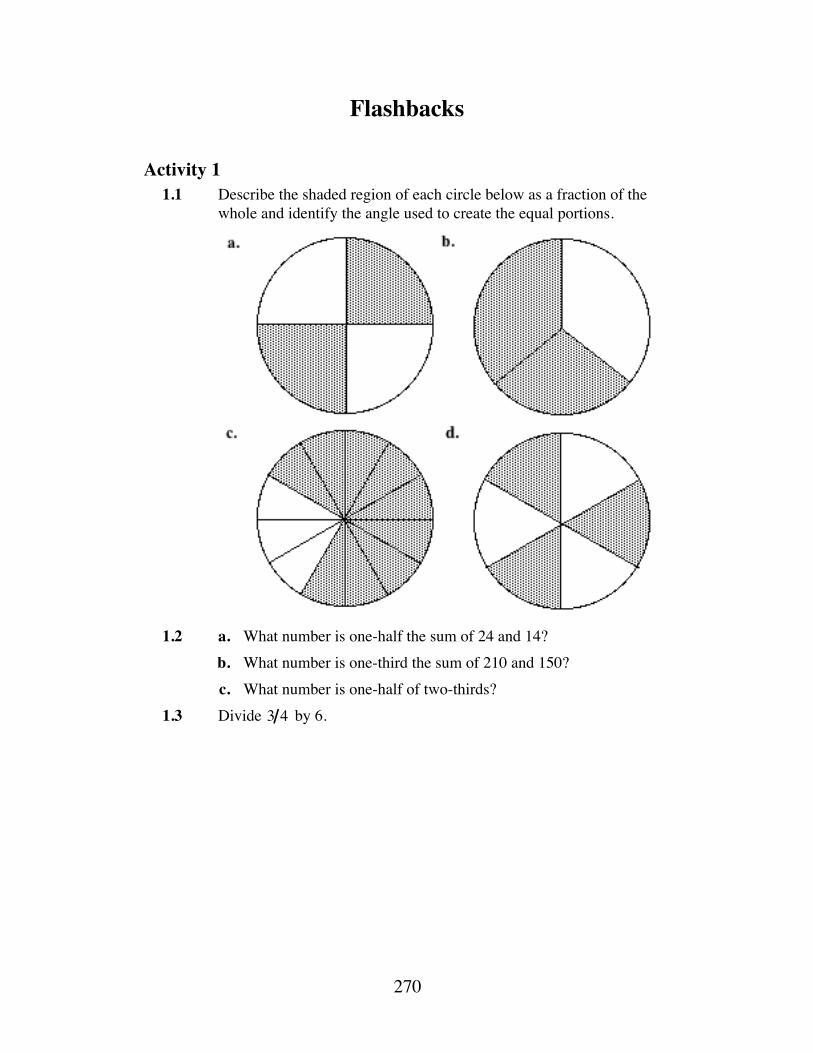
270
Flashbacks
Activity 1 1.1 Describe the shaded region of each circle below as a fraction of the
whole and identify the angle used to create the equal portions.
1.2 a. What number is one-half the sum of 24 and 14? b. What number is one-third the sum of 210 and 150? c. What number is one-half of two-thirds? 1.3 Divide 3 4 by 6.
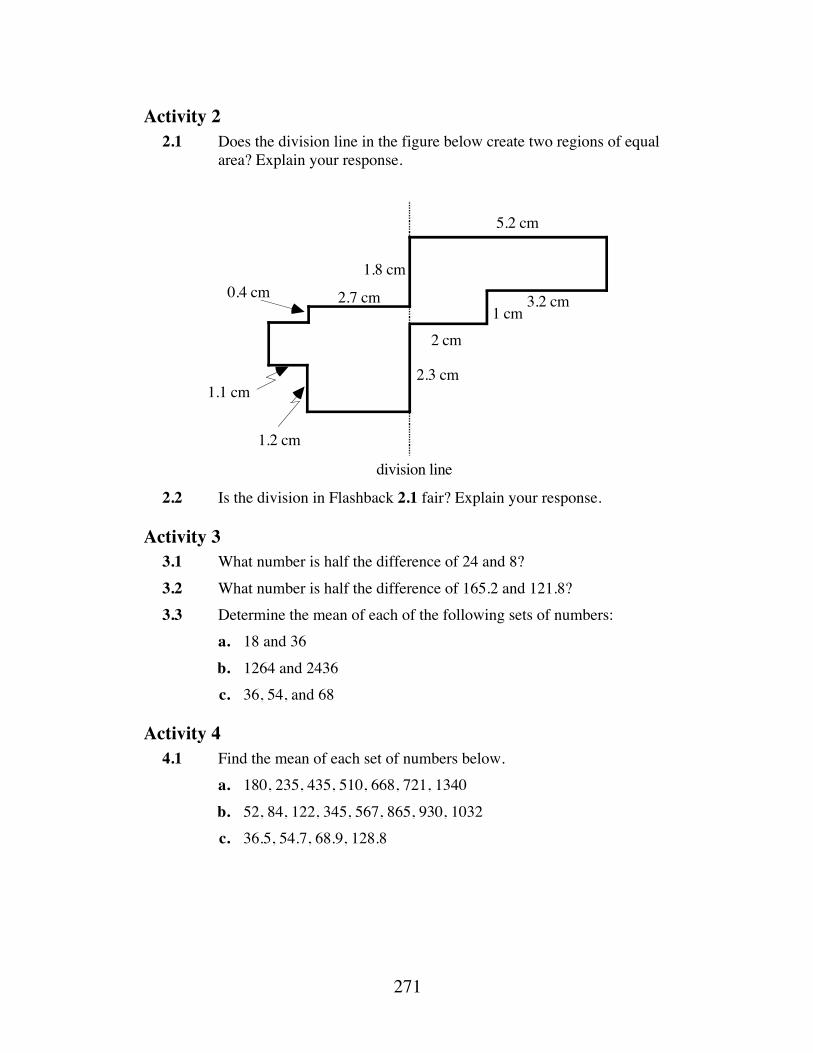
271
Activity 2 2.1 Does the division line in the figure below create two regions of equal
area? Explain your response.
2.2 Is the division in Flashback 2.1 fair? Explain your response.
Activity 3 3.1 What number is half the difference of 24 and 8? 3.2 What number is half the difference of 165.2 and 121.8? 3.3 Determine the mean of each of the following sets of numbers: a. 18 and 36 b. 1264 and 2436 c. 36, 54, and 68
Activity 4 4.1 Find the mean of each set of numbers below. a. 180, 235, 435, 510, 668, 721, 1340 b. 52, 84, 122, 345, 567, 865, 930, 1032 c. 36.5, 54.7, 68.9, 128.8
division line
5.2 cm
3.2 cm1 cm
2 cm
2.3 cm
1.2 cm
1.1 cm
0.4 cm 2.7 cm
1.8 cm
272
Answers to Flashbacks
Activity 1 1.1 a. one-half; 90˚ b. two-thirds; 120˚ c. three-fourths; 30˚ d. one-half; 60˚ 1.2 a. 19 b. 120 c. 1 3 1.3 3 24 = 1 8
Activity 2 2.1 The area of the region to the right of the division line is 8.24 cm2 ; the
area of the region to the left is 8.5 cm 2 . 2.2 Sample response: The division is not equal, but it could be a fair
division if the people receiving each region are satisfied with their respective portions.
Activity 3 3.1 8 3.2 21.7 3.3 a. 27 b. 1850 c. 52 2
3
Activity 4 4.1 The following responses have been rounded to the nearest 0.1. a. 584.1 b. 499.6 c. 72.2


Let the Games Begin
This module uses puzzles and games to introduce logical reasoning and problem-solving strategies.
Masha Albrecht • Darlene Pugh
275
Teacher Edition Let the Games Begin
Overview This module presents some basic concepts of mathematical logic, including logical connectives, negation, conditionals, and truth tables. The logical connectives and and or are used in compound statements.
Objectives In this module, students will: • use and and or to form compound statements • use Venn diagrams and truth tables to illustrate conjunctions and
disjunctions • explore the relationship between the connective and and set intersection and
the relationship between the connective or and set union • use not to negate statements • develop truth tables illustrating negated and compound statements • use logical implications.
Prerequisites For this module, students should know: • the definitions of the union and intersection of sets • how to use set notation • how to generate random numbers.
Time Line Activity 1 2 3 Summary
Assessment Total
Days 2 2 2 1 7
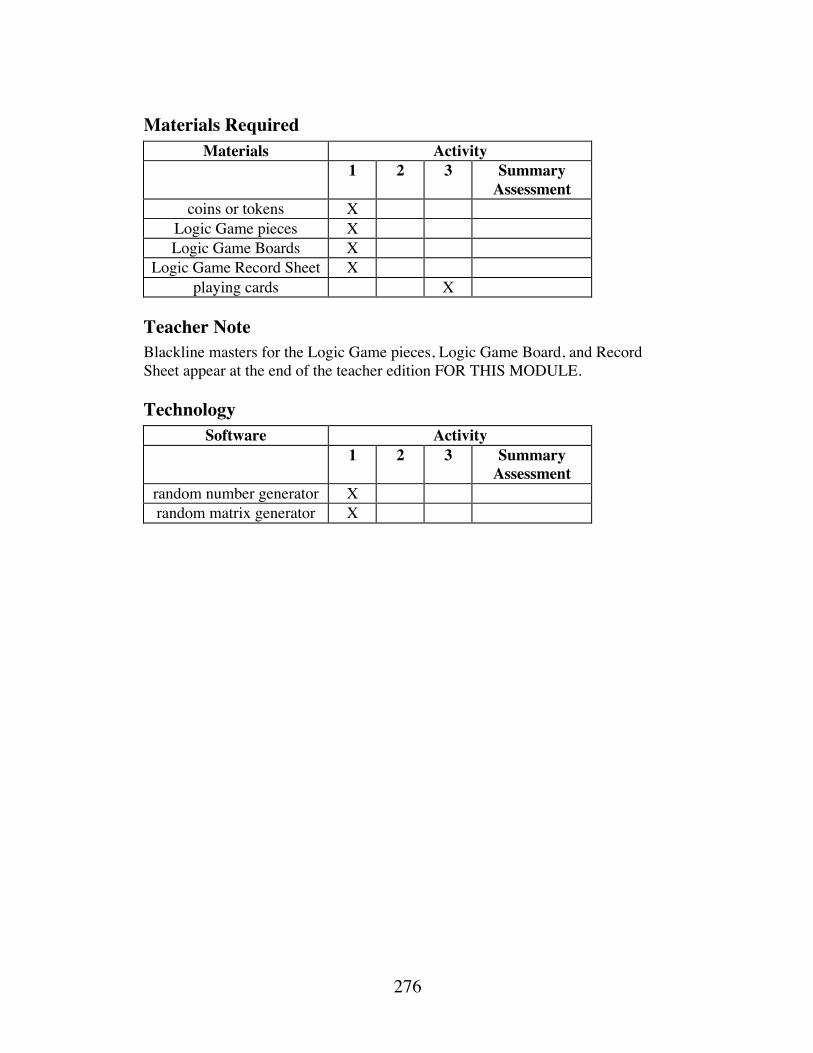
276
Materials Required Materials Activity
1 2 3 Summary Assessment
coins or tokens X Logic Game pieces X Logic Game Boards X
Logic Game Record Sheet X playing cards X
Teacher Note Blackline masters for the Logic Game pieces, Logic Game Board, and Record Sheet appear at the end of the teacher edition FOR THIS MODULE.
Technology Software Activity
1 2 3 Summary Assessment
random number generator X random matrix generator X
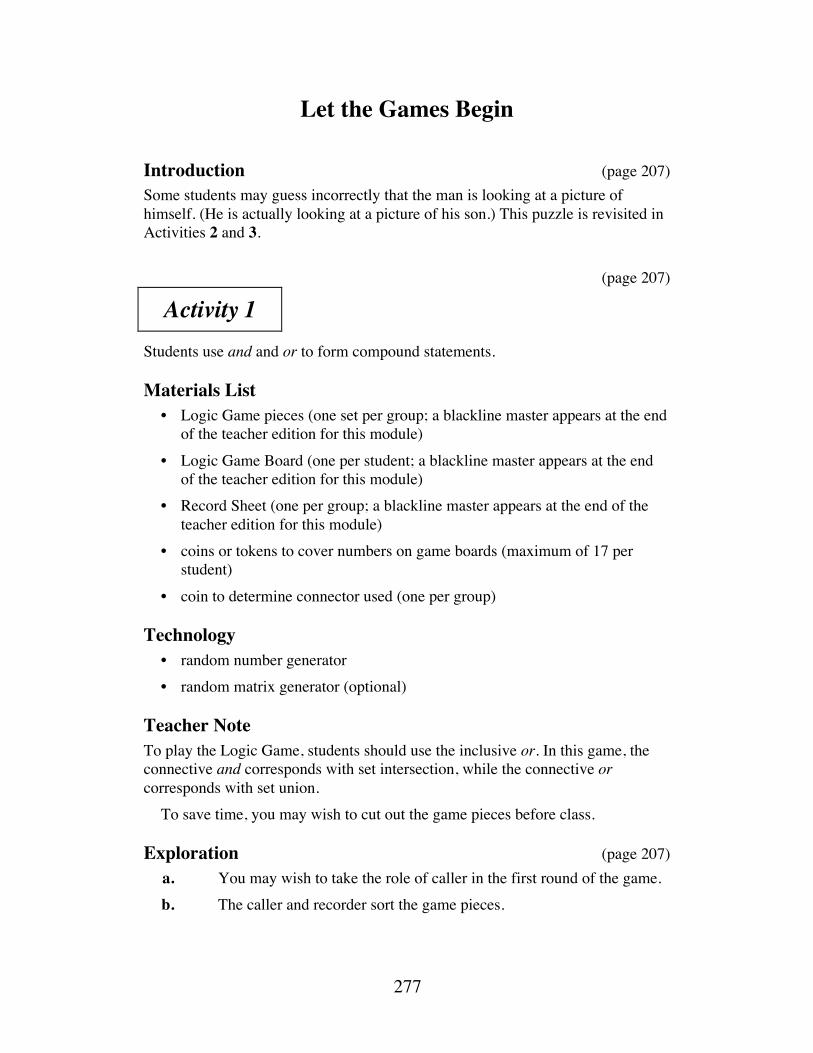
277
Let the Games Begin
Introduction (page 207) Some students may guess incorrectly that the man is looking at a picture of himself. (He is actually looking at a picture of his son.) This puzzle is revisited in Activities 2 and 3. (page 207)
Activity 1 Students use and and or to form compound statements.
Materials List • Logic Game pieces (one set per group; a blackline master appears at the end
of the teacher edition for this module) • Logic Game Board (one per student; a blackline master appears at the end
of the teacher edition for this module) • Record Sheet (one per group; a blackline master appears at the end of the
teacher edition for this module) • coins or tokens to cover numbers on game boards (maximum of 17 per
student) • coin to determine connector used (one per group)
Technology • random number generator • random matrix generator (optional)
Teacher Note To play the Logic Game, students should use the inclusive or. In this game, the connective and corresponds with set intersection, while the connective or corresponds with set union. To save time, you may wish to cut out the game pieces before class.
Exploration (page 207) a. You may wish to take the role of caller in the first round of the game. b. The caller and recorder sort the game pieces.
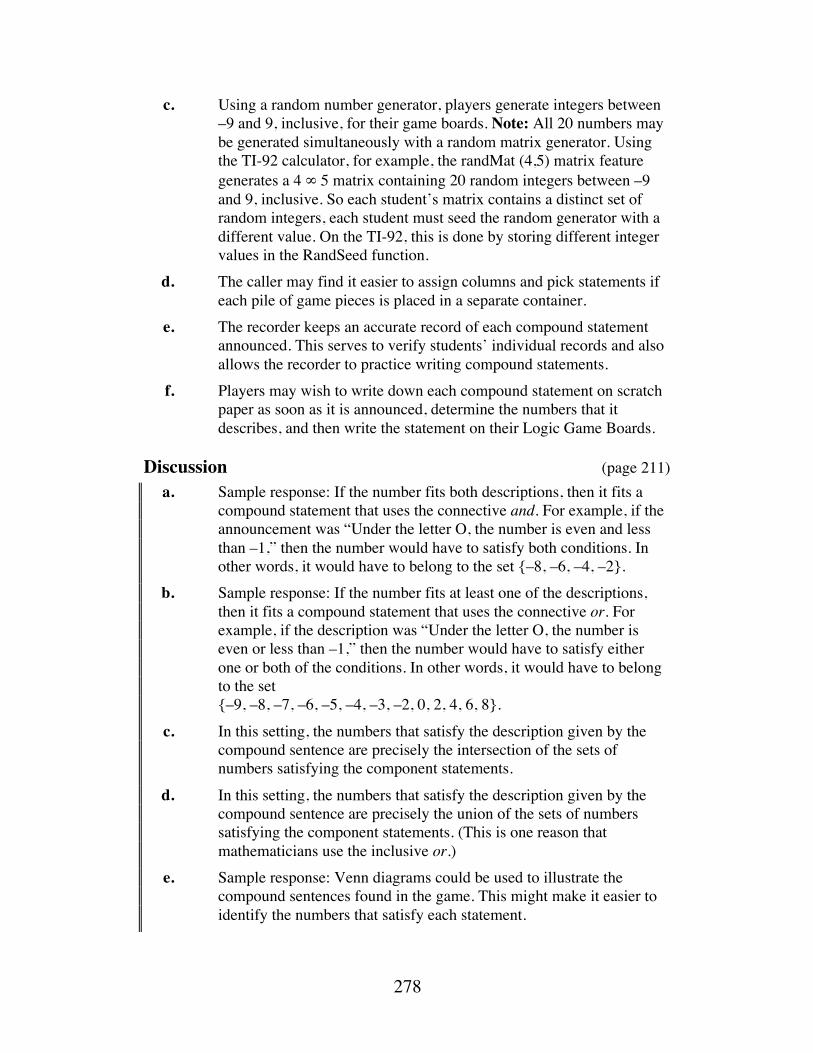
278
c. Using a random number generator, players generate integers between –9 and 9, inclusive, for their game boards. Note: All 20 numbers may be generated simultaneously with a random matrix generator. Using the TI-92 calculator, for example, the randMat (4,5) matrix feature generates a 4 ∞ 5 matrix containing 20 random integers between –9 and 9, inclusive. So each student’s matrix contains a distinct set of random integers, each student must seed the random generator with a different value. On the TI-92, this is done by storing different integer values in the RandSeed function.
d. The caller may find it easier to assign columns and pick statements if each pile of game pieces is placed in a separate container.
e. The recorder keeps an accurate record of each compound statement announced. This serves to verify students’ individual records and also allows the recorder to practice writing compound statements.
f. Players may wish to write down each compound statement on scratch paper as soon as it is announced, determine the numbers that it describes, and then write the statement on their Logic Game Boards.
Discussion (page 211) a. Sample response: If the number fits both descriptions, then it fits a
compound statement that uses the connective and. For example, if the announcement was “Under the letter O, the number is even and less than –1,” then the number would have to satisfy both conditions. In other words, it would have to belong to the set {–8, –6, –4, –2}.
b. Sample response: If the number fits at least one of the descriptions, then it fits a compound statement that uses the connective or. For example, if the description was “Under the letter O, the number is even or less than –1,” then the number would have to satisfy either one or both of the conditions. In other words, it would have to belong to the set {–9, –8, –7, –6, –5, –4, –3, –2, 0, 2, 4, 6, 8}.
c. In this setting, the numbers that satisfy the description given by the compound sentence are precisely the intersection of the sets of numbers satisfying the component statements.
d. In this setting, the numbers that satisfy the description given by the compound sentence are precisely the union of the sets of numbers satisfying the component statements. (This is one reason that mathematicians use the inclusive or.)
e. Sample response: Venn diagrams could be used to illustrate the compound sentences found in the game. This might make it easier to identify the numbers that satisfy each statement.
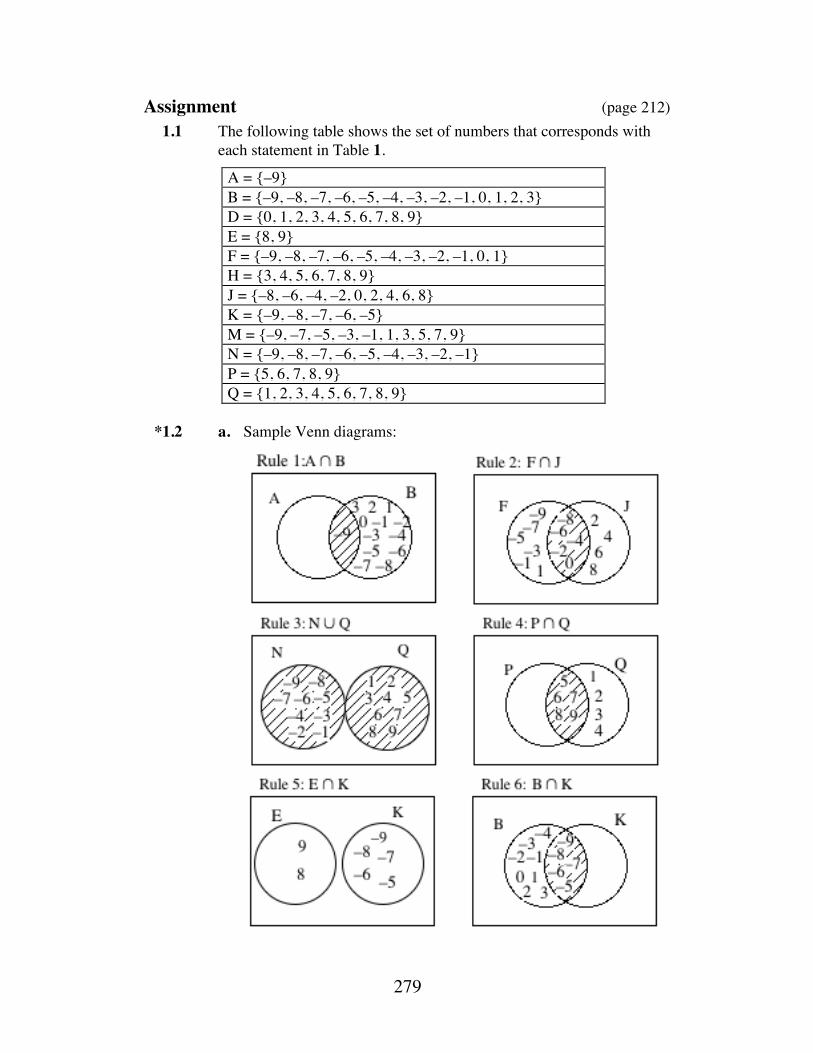
279
Assignment (page 212) 1.1 The following table shows the set of numbers that corresponds with
each statement in Table 1. A = {–9} B = {–9, –8, –7, –6, –5, –4, –3, –2, –1, 0, 1, 2, 3} D = {0, 1, 2, 3, 4, 5, 6, 7, 8, 9} E = {8, 9} F = {–9, –8, –7, –6, –5, –4, –3, –2, –1, 0, 1} H = {3, 4, 5, 6, 7, 8, 9} J = {–8, –6, –4, –2, 0, 2, 4, 6, 8} K = {–9, –8, –7, –6, –5} M = {–9, –7, –5, –3, –1, 1, 3, 5, 7, 9} N = {–9, –8, –7, –6, –5, –4, –3, –2, –1} P = {5, 6, 7, 8, 9} Q = {1, 2, 3, 4, 5, 6, 7, 8, 9}
*1.2 a. Sample Venn diagrams:
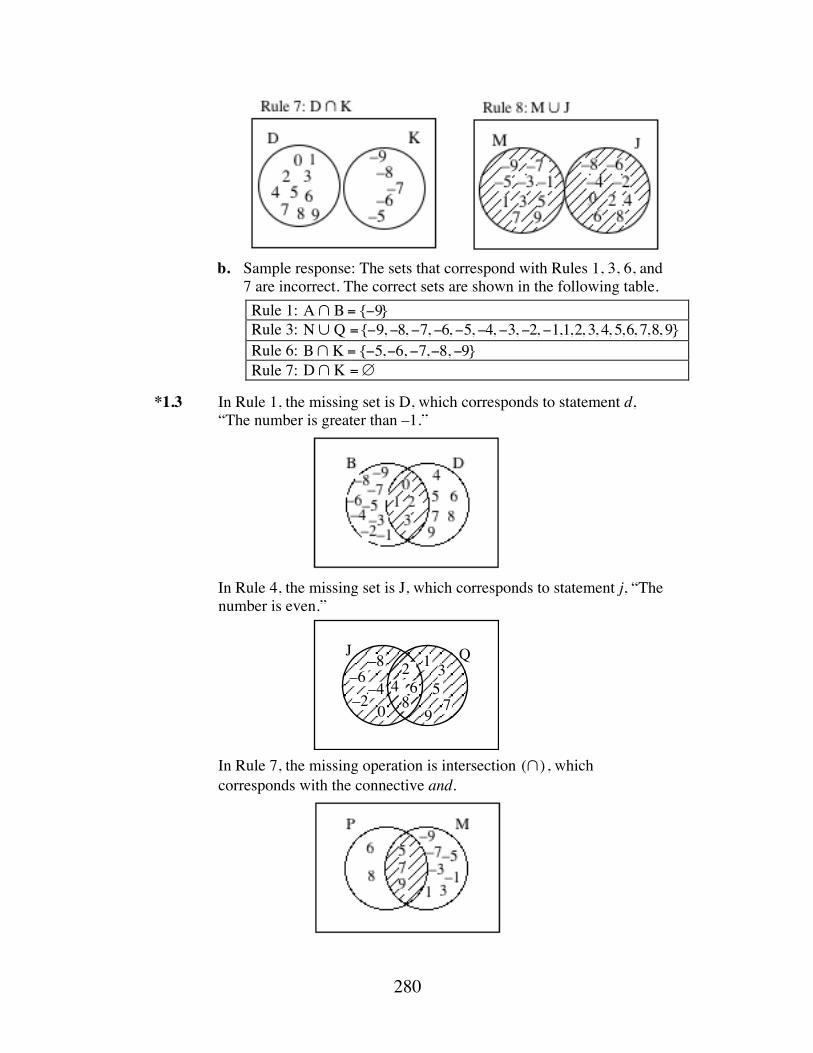
280
b. Sample response: The sets that correspond with Rules 1, 3, 6, and
7 are incorrect. The correct sets are shown in the following table. Rule 1: A∩ B = {−9} Rule 3: N∪ Q ={−9, −8, −7, −6, −5, −4, −3, −2, −1,1,2, 3, 4, 5,6, 7,8, 9} Rule 6: B∩ K = {−5,−6, −7,−8, −9} Rule 7: D∩ K =∅
*1.3 In Rule 1, the missing set is D, which corresponds to statement d,
“The number is greater than –1.”
In Rule 4, the missing set is J, which corresponds to statement j, “The
number is even.”
In Rule 7, the missing operation is intersection (∩) , which
corresponds with the connective and.
J Q
8642–8
–6–4
–2 0
1 3579
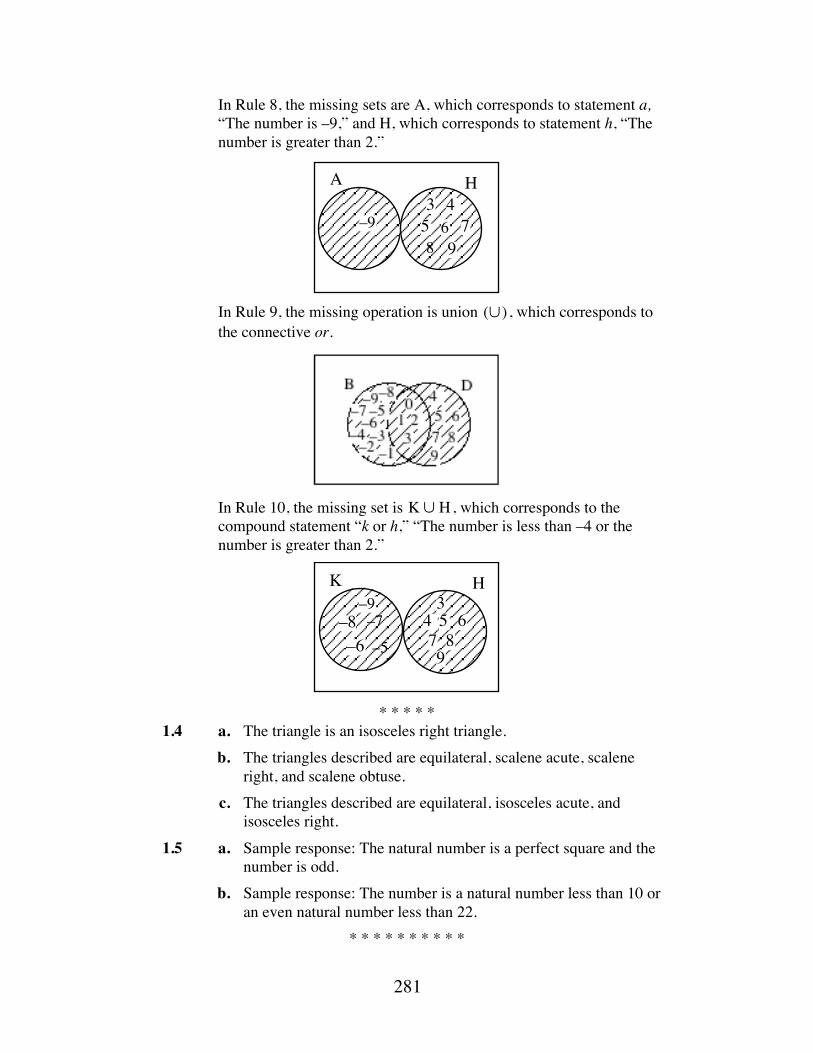
281
In Rule 8, the missing sets are A, which corresponds to statement a, “The number is –9,” and H, which corresponds to statement h, “The number is greater than 2.”
In Rule 9, the missing operation is union (∪) , which corresponds to
the connective or.
In Rule 10, the missing set is K∪ H , which corresponds to the
compound statement “k or h,” “The number is less than –4 or the number is greater than 2.”
* * * * *
1.4 a. The triangle is an isosceles right triangle. b. The triangles described are equilateral, scalene acute, scalene
right, and scalene obtuse. c. The triangles described are equilateral, isosceles acute, and
isosceles right. 1.5 a. Sample response: The natural number is a perfect square and the
number is odd. b. Sample response: The number is a natural number less than 10 or
an even natural number less than 22. * * * * * * * * * *
–943
5 79
A H
68
–9
864–8
–6
3579
K H
–7
–5
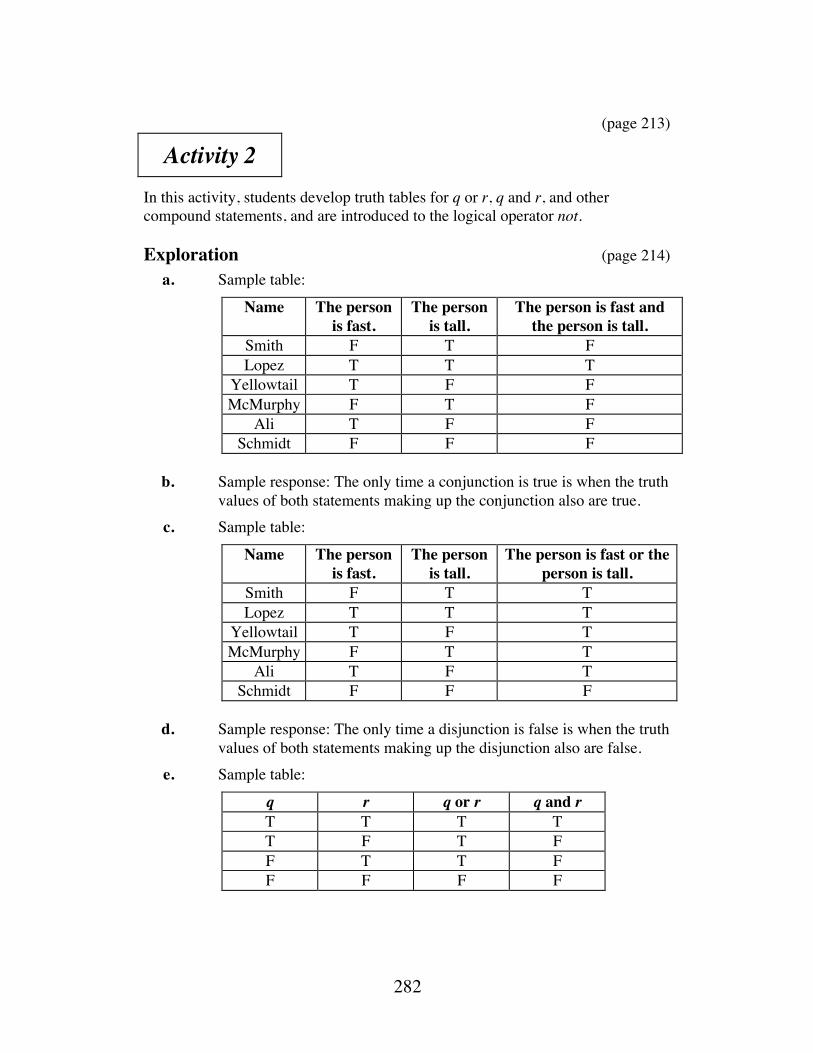
282
(page 213)
Activity 2 In this activity, students develop truth tables for q or r, q and r, and other compound statements, and are introduced to the logical operator not.
Exploration (page 214) a. Sample table:
Name The person is fast.
The person is tall.
The person is fast and the person is tall.
Smith F T F Lopez T T T
Yellowtail T F F McMurphy F T F
Ali T F F Schmidt F F F
b. Sample response: The only time a conjunction is true is when the truth
values of both statements making up the conjunction also are true. c. Sample table:
Name The person is fast.
The person is tall.
The person is fast or the person is tall.
Smith F T T Lopez T T T
Yellowtail T F T McMurphy F T T
Ali T F T Schmidt F F F
d. Sample response: The only time a disjunction is false is when the truth
values of both statements making up the disjunction also are false. e. Sample table:
q r q or r q and r T T T T T F T F F T T F F F F F
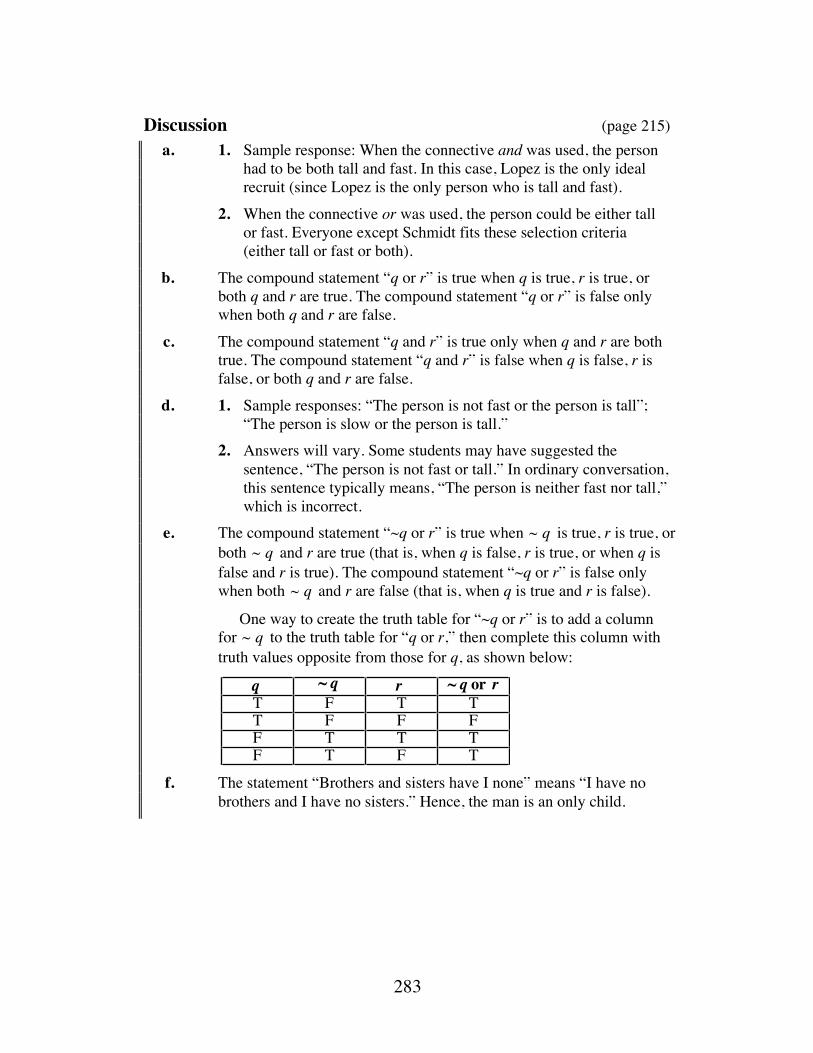
283
Discussion (page 215) a. 1. Sample response: When the connective and was used, the person
had to be both tall and fast. In this case, Lopez is the only ideal recruit (since Lopez is the only person who is tall and fast).
2. When the connective or was used, the person could be either tall or fast. Everyone except Schmidt fits these selection criteria (either tall or fast or both).
b. The compound statement “q or r” is true when q is true, r is true, or both q and r are true. The compound statement “q or r” is false only when both q and r are false.
c. The compound statement “q and r” is true only when q and r are both true. The compound statement “q and r” is false when q is false, r is false, or both q and r are false.
d. 1. Sample responses: “The person is not fast or the person is tall”; “The person is slow or the person is tall.”
2. Answers will vary. Some students may have suggested the sentence, “The person is not fast or tall.” In ordinary conversation, this sentence typically means, “The person is neither fast nor tall,” which is incorrect.
e. The compound statement “~q or r” is true when ~ q is true, r is true, or both ~ q and r are true (that is, when q is false, r is true, or when q is false and r is true). The compound statement “~q or r” is false only when both ~ q and r are false (that is, when q is true and r is false).
One way to create the truth table for “~q or r” is to add a column for ~ q to the truth table for “q or r,” then complete this column with truth values opposite from those for q, as shown below:
f. The statement “Brothers and sisters have I none” means “I have no brothers and I have no sisters.” Hence, the man is an only child.
q T F T TT F F FF T T TF T F T
r ~ q or r~ q
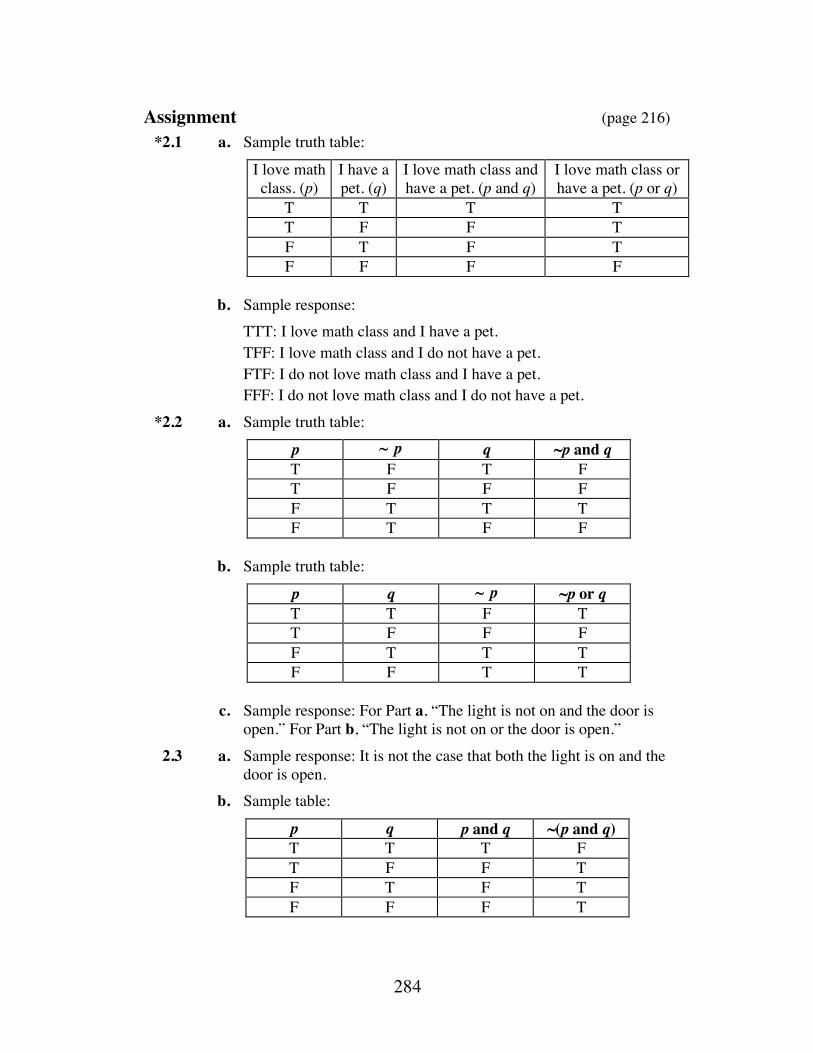
284
Assignment (page 216) *2.1 a. Sample truth table:
I love math class. (p)
I have a pet. (q)
I love math class and have a pet. (p and q)
I love math class or have a pet. (p or q)
T T T T T F F T F T F T F F F F
b. Sample response: TTT: I love math class and I have a pet. TFF: I love math class and I do not have a pet. FTF: I do not love math class and I have a pet. FFF: I do not love math class and I do not have a pet. *2.2 a. Sample truth table:
p ~ p q ~p and q T F T F T F F F F T T T F T F F
b. Sample truth table:
p q ~ p ~p or q T T F T T F F F F T T T F F T T
c. Sample response: For Part a, “The light is not on and the door is
open.” For Part b, “The light is not on or the door is open.” 2.3 a. Sample response: It is not the case that both the light is on and the
door is open. b. Sample table:
p q p and q ~(p and q) T T T F T F F T F T F T F F F T
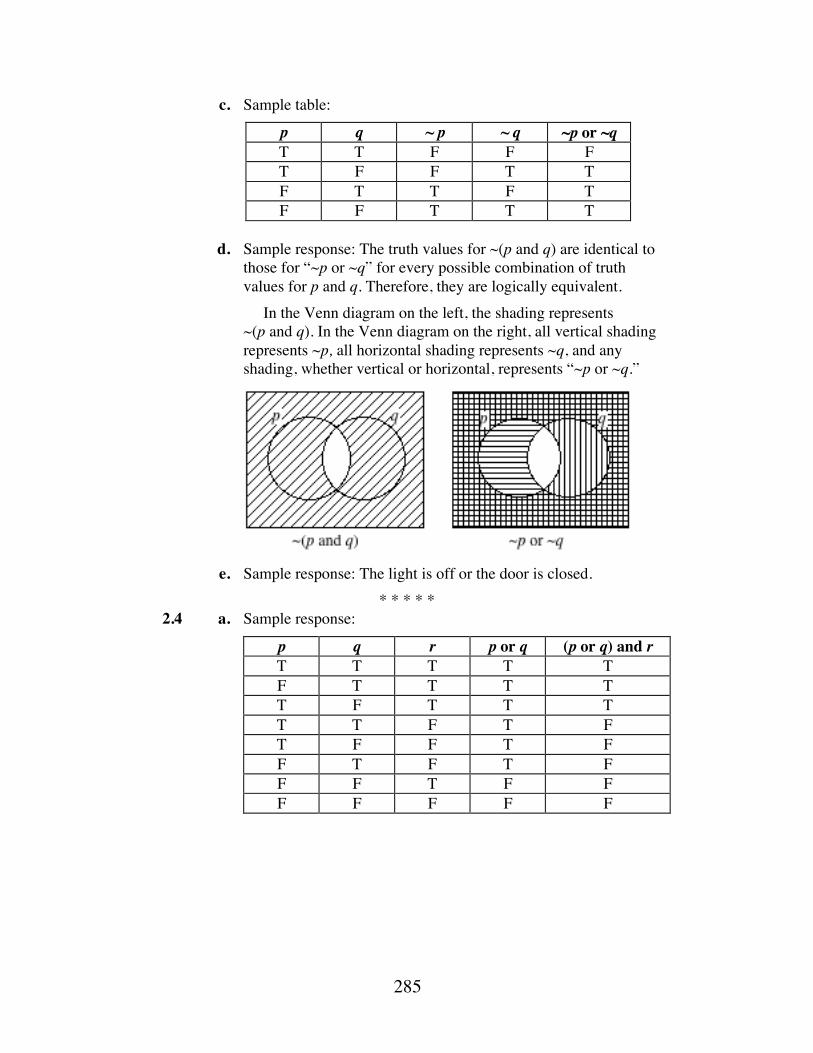
285
c. Sample table:
p q ~ p ~ q ~p or ~q T T F F F T F F T T F T T F T F F T T T
d. Sample response: The truth values for ~(p and q) are identical to
those for “~p or ~q” for every possible combination of truth values for p and q. Therefore, they are logically equivalent.
In the Venn diagram on the left, the shading represents ~(p and q). In the Venn diagram on the right, all vertical shading represents ~p, all horizontal shading represents ~q, and any shading, whether vertical or horizontal, represents “~p or ~q.”
e. Sample response: The light is off or the door is closed.
* * * * * 2.4 a. Sample response:
p q r p or q (p or q) and r T T T T T F T T T T T F T T T T T F T F T F F T F F T F T F F F T F F F F F F F
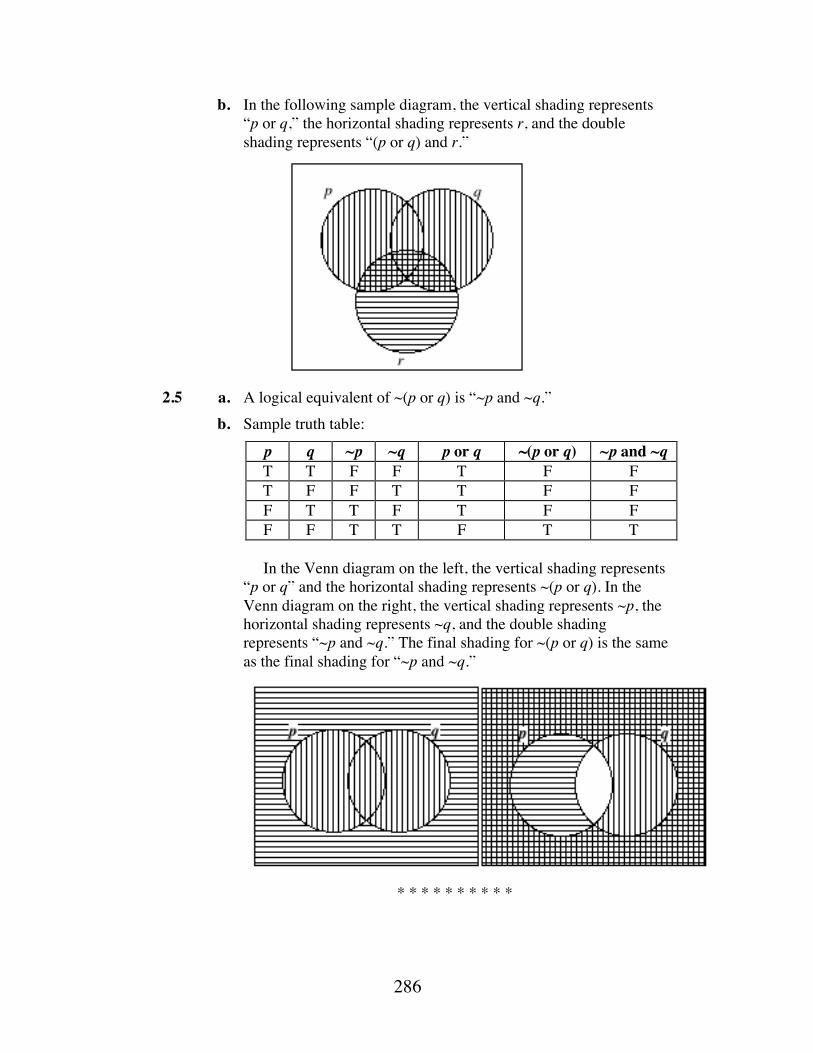
286
b. In the following sample diagram, the vertical shading represents “p or q,” the horizontal shading represents r, and the double shading represents “(p or q) and r.”
2.5 a. A logical equivalent of ~(p or q) is “~p and ~q.” b. Sample truth table:
p q ~p ~q p or q ~(p or q) ~p and ~q T T F F T F F T F F T T F F F T T F T F F F F T T F T T
In the Venn diagram on the left, the vertical shading represents
“p or q” and the horizontal shading represents ~(p or q). In the Venn diagram on the right, the vertical shading represents ~p, the horizontal shading represents ~q, and the double shading represents “~p and ~q.” The final shading for ~(p or q) is the same as the final shading for “~p and ~q.”
* * * * * * * * * *
287
(page 217)
Activity 3 In this activity, students examine conditional statements.
Materials List • playing cards (one deck per group)
Teacher Note Although students are not expected to suggest this terminology, the rules to the game “Color Card” actually involve the use of if and only if. For example, the rule “A player who sees a red card raises one hand,” implies that a player raises one hand if and only if a red card is seen. Since the game is designed only to provide an intuitive sense of “if-then” statements, this need not be explained to students.
Exploration (page 217) a. Students play several rounds of Color Card. b. Since order is not important, the three possible combinations for two
players are RR, RB, and BB. c. Sample response: Yes, the players can always determine the colors of
their cards. When both players raise their hands, the combination of cards is RR. When only one player raises a hand, the combination of cards is RB. When no players raise a hand, the combination is BB.
d. Since order is not important, the four possible combinations for three players are RRR, RRB, RBB, and BBB. In a three-player game, it is not always possible for all players to determine the colors of their cards. All players can determine the colors of their cards only if the combination is RBB or BBB. See response to Part b of the discussion.
Discussion (page 218) a. Sample responses: “If the other player’s hand is up, then my card is
red” or “If the other player’s hand is not up, then my card is black.” b. Sample response: All players can determine the colors of their cards if
the combination is RBB or BBB. When the combination is BBB, no one raises a hand, so all know they have black cards. When the combination RBB occurs, the two players with black cards raise their hands. The player with the red card sees only black cards, but sees the other players’ hands raised. Therefore, this player’s card must be red. Both players with black cards see the red-card player’s hand not raised. They conclude that they each have black cards.
288
When the combination of colors is RRB, then only the players with red cards can determine their colors. For example, if Players 1 and 2 have red cards, while Player 3 has a black card, all will have their hands raised. Since Player 2 does not see a red card on Player 3, and Player 1’s hand is raised, Player 2 concludes she must have a red card. The same is true for Player 1. Player 3 can conclude nothing about card color, since the other two players’ hands would be raised regardless of the color of Player 3’s card.
When all players have red cards (RRR), none of the players can determine card color. All players will have their hands raised, but none sees a black card.
c. Sample response: The player with the red card should reason, “If both of the other players raise their hands and neither of them have red cards, then my card is red.” The two players with black cards should reason, “If one of the other players does not have a hand up, then my card is black.”
d. Sample response: The conditional is true when the hypothesis and conclusion are both true or when the hypothesis is false.
e. Answers will vary. Sample response: Suppose you have a square. The following statement is true because the hypothesis is true and the conclusion is true: “If the polygon is a square, then the polygon is a rectangle.” The following statement is false because the hypothesis is true and the conclusion is false: “If the polygon is a square, then the polygon is not a rectangle.”
When the hypothesis is false, a conditional is true no matter what the truth value of the conclusion, from the definition given in Table 4. For example, the truth value of each of the following conditional statements is true: “If 2 = 3 , then 6 = 6” and “If 2 = 3 , then 6 = 7 .”
Assignment (page 219) 3.1 Sample responses are given below. a. This is true because there are only two possible colors for the
cards. b. This is true because it follows the rules. c. This is true because it follows the rules. d. This is false because the player shouldn’t raise a hand. e. This is false because it doesn’t follow the rules. f. This is true because it follows the rules. g. This is false because the card must be red or black.
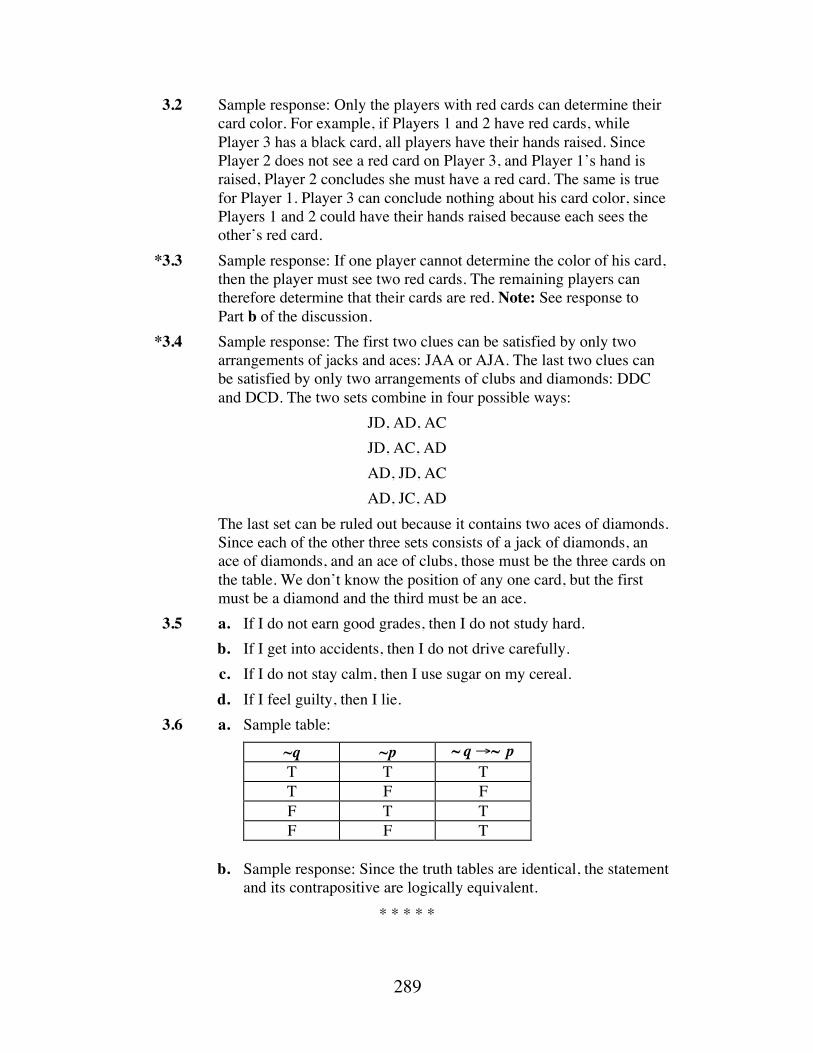
289
3.2 Sample response: Only the players with red cards can determine their card color. For example, if Players 1 and 2 have red cards, while Player 3 has a black card, all players have their hands raised. Since Player 2 does not see a red card on Player 3, and Player 1’s hand is raised, Player 2 concludes she must have a red card. The same is true for Player 1. Player 3 can conclude nothing about his card color, since Players 1 and 2 could have their hands raised because each sees the other’s red card.
*3.3 Sample response: If one player cannot determine the color of his card, then the player must see two red cards. The remaining players can therefore determine that their cards are red. Note: See response to Part b of the discussion.
*3.4 Sample response: The first two clues can be satisfied by only two arrangements of jacks and aces: JAA or AJA. The last two clues can be satisfied by only two arrangements of clubs and diamonds: DDC and DCD. The two sets combine in four possible ways:
JD, AD, AC JD, AC, AD AD, JD, AC AD, JC, AD
The last set can be ruled out because it contains two aces of diamonds. Since each of the other three sets consists of a jack of diamonds, an ace of diamonds, and an ace of clubs, those must be the three cards on the table. We don’t know the position of any one card, but the first must be a diamond and the third must be an ace.
3.5 a. If I do not earn good grades, then I do not study hard. b. If I get into accidents, then I do not drive carefully. c. If I do not stay calm, then I use sugar on my cereal. d. If I feel guilty, then I lie. 3.6 a. Sample table:
~q ~p ~ q→~ p T T T T F F F T T F F T
b. Sample response: Since the truth tables are identical, the statement
and its contrapositive are logically equivalent. * * * * *
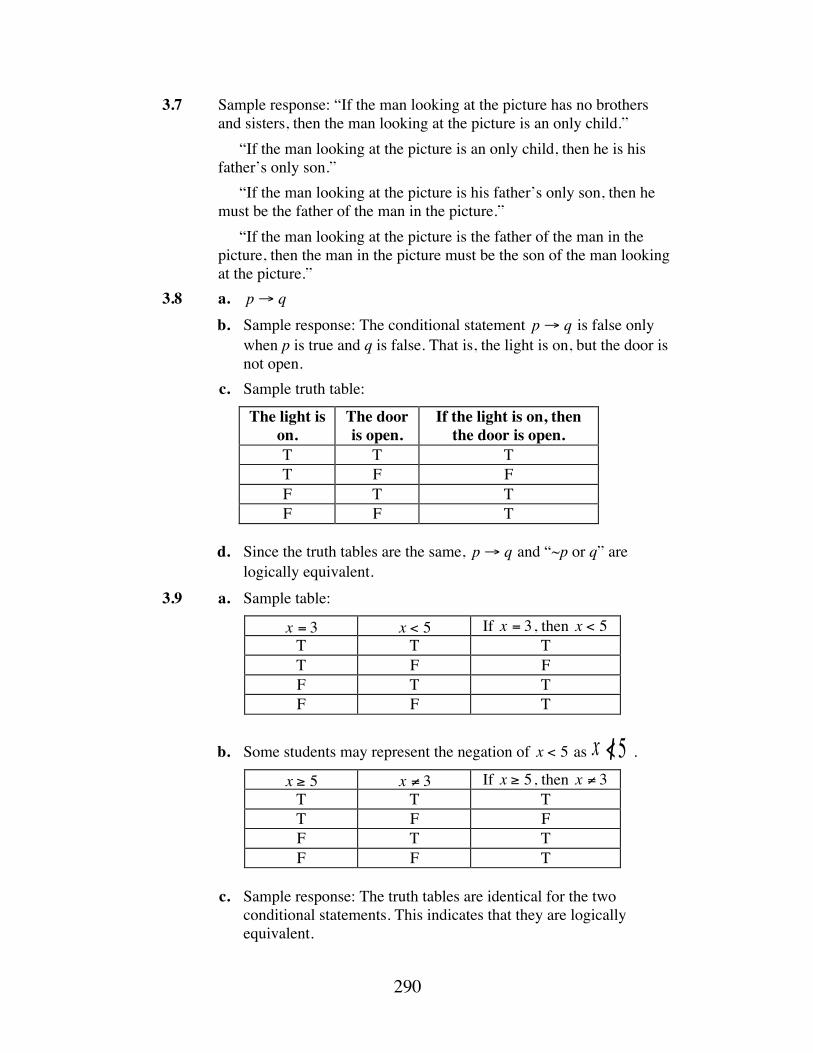
290
3.7 Sample response: “If the man looking at the picture has no brothers and sisters, then the man looking at the picture is an only child.”
“If the man looking at the picture is an only child, then he is his father’s only son.”
“If the man looking at the picture is his father’s only son, then he must be the father of the man in the picture.”
“If the man looking at the picture is the father of the man in the picture, then the man in the picture must be the son of the man looking at the picture.”
3.8 a. p→ q b. Sample response: The conditional statement p→ q is false only
when p is true and q is false. That is, the light is on, but the door is not open.
c. Sample truth table:
The light is on.
The door is open.
If the light is on, then the door is open.
T T T T F F F T T F F T
d. Since the truth tables are the same, p→ q and “~p or q” are
logically equivalent. 3.9 a. Sample table:
x = 3 x < 5 If x = 3 , then x < 5 T T T T F F F T T F F T
b. Some students may represent the negation of x < 5 as .
x ≥ 5 x ≠ 3 If x ≥ 5 , then x ≠ 3 T T T T F F F T T F F T
c. Sample response: The truth tables are identical for the two
conditional statements. This indicates that they are logically equivalent.
x < 5

291
3.10 a. Micah is a mash. b. No logical conclusion is possible. Fermi could be a mash but not a
mish, or Fermi could be both a mash and a mish. c. No logical conclusion is possible. Pretty Eagle could be a mash or
Pretty Eagle could not be a mash. d. Vetrovsky is not a mish.
* * * * * * * * * *
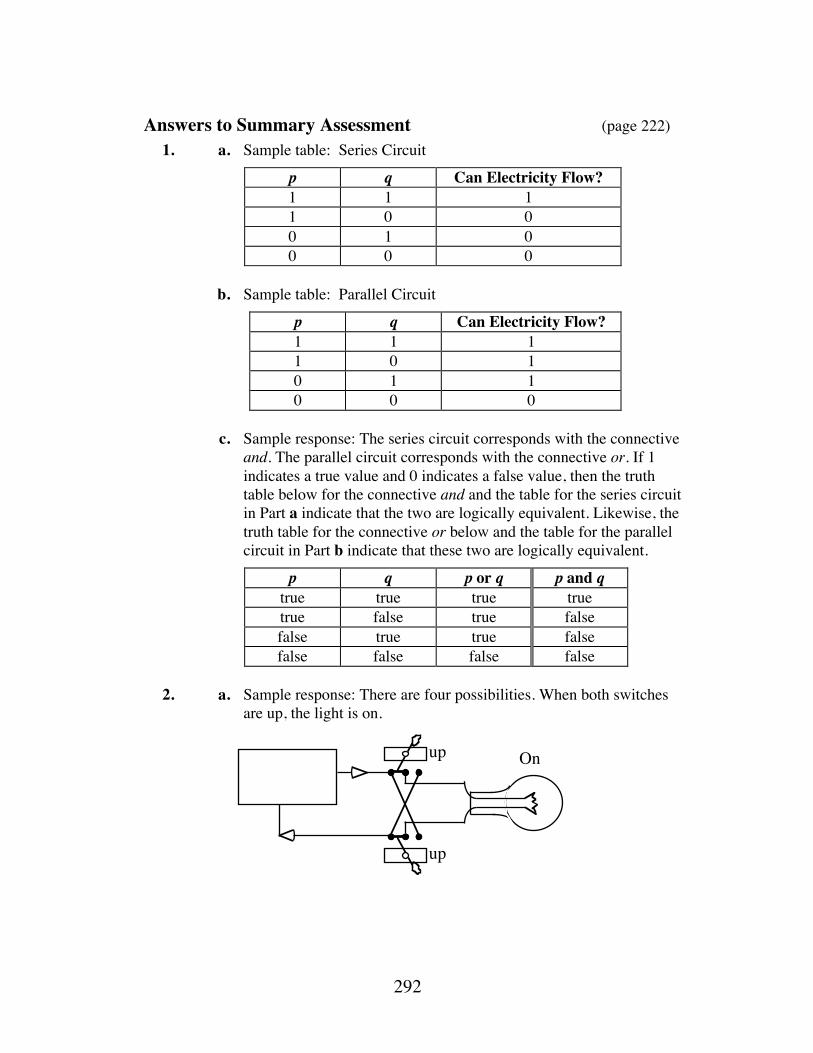
292
Answers to Summary Assessment (page 222) 1. a. Sample table: Series Circuit
p q Can Electricity Flow? 1 1 1 1 0 0 0 1 0 0 0 0
b. Sample table: Parallel Circuit
p q Can Electricity Flow? 1 1 1 1 0 1 0 1 1 0 0 0
c. Sample response: The series circuit corresponds with the connective
and. The parallel circuit corresponds with the connective or. If 1 indicates a true value and 0 indicates a false value, then the truth table below for the connective and and the table for the series circuit in Part a indicate that the two are logically equivalent. Likewise, the truth table for the connective or below and the table for the parallel circuit in Part b indicate that these two are logically equivalent.
p q p or q p and q true true true true true false true false false true true false false false false false
2. a. Sample response: There are four possibilities. When both switches
are up, the light is on.
up
up
On
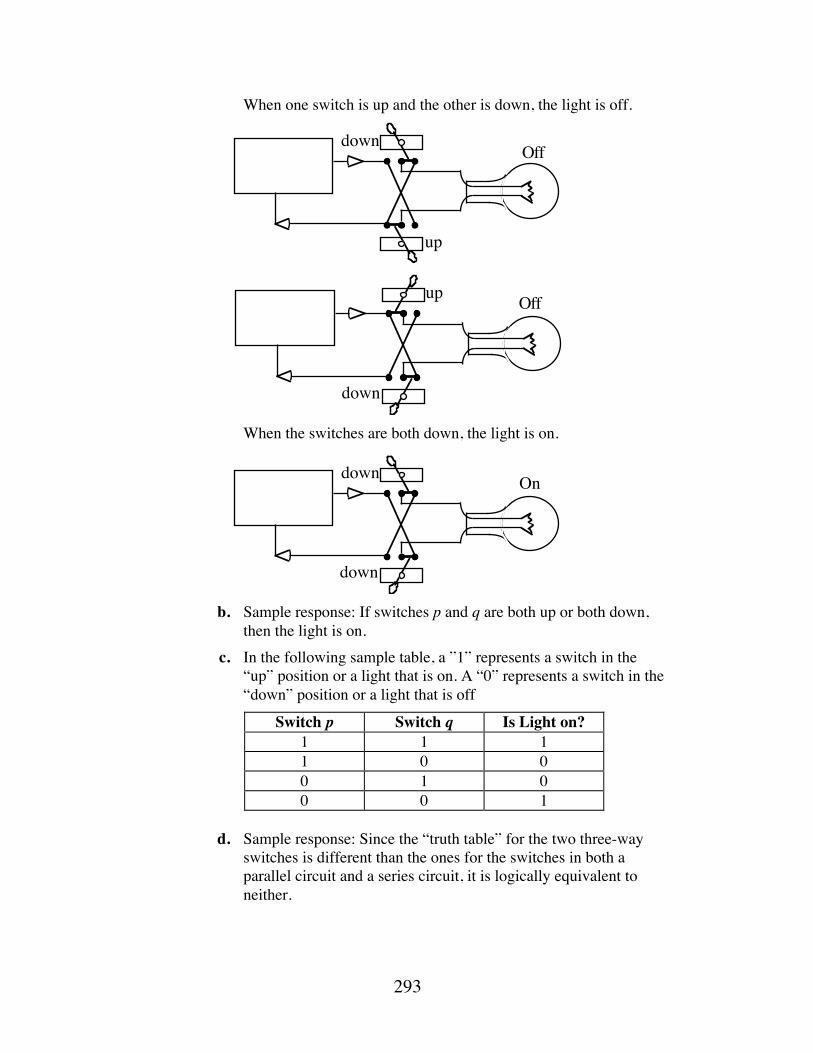
293
When one switch is up and the other is down, the light is off.
When the switches are both down, the light is on.
b. Sample response: If switches p and q are both up or both down,
then the light is on. c. In the following sample table, a ”1” represents a switch in the
“up” position or a light that is on. A “0” represents a switch in the “down” position or a light that is off
Switch p Switch q Is Light on? 1 1 1 1 0 0 0 1 0 0 0 1
d. Sample response: Since the “truth table” for the two three-way
switches is different than the ones for the switches in both a parallel circuit and a series circuit, it is logically equivalent to neither.
down
up
Off
up
down
Off
down
down
On
294
Module Assessment
1. Determine all the possible rolls of two ordinary dice that satisfy each
compound statement below. a. The value of the first die is even and the sum of the dice is 6. b. The sum of the dice is 11 or the sum of the dice is 3. c. The value of each die is not odd and the sum of the dice is odd. 2. Write the negation of the each of the following statements. a. The value of the first die is 3 and the value of the second die is not
even. b. The values of the dice match or the sum of the dice is less than 7. 3. In the game Match It, a player rolls five dice. According to the rules,
there are several ways to earn a “match.” For example, if all five dice have the same value, then a player can record a match. Determine a logical conclusion for each statement below.
a. All five dice have the same value. b. A player does not record a match. c. All five dice do not have the same value.
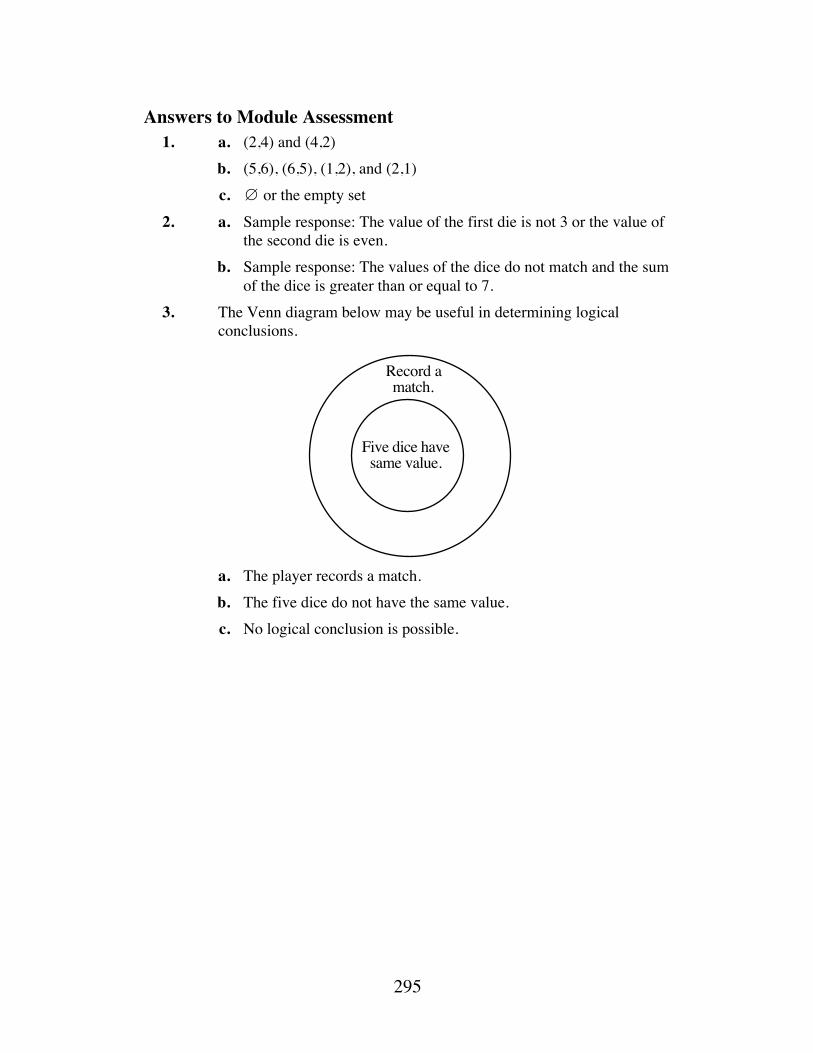
295
Answers to Module Assessment 1. a. (2,4) and (4,2) b. (5,6), (6,5), (1,2), and (2,1) c. ∅ or the empty set 2. a. Sample response: The value of the first die is not 3 or the value of
the second die is even. b. Sample response: The values of the dice do not match and the sum
of the dice is greater than or equal to 7. 3. The Venn diagram below may be useful in determining logical
conclusions.
a. The player records a match. b. The five dice do not have the same value. c. No logical conclusion is possible.
Record amatch.
Five dice havesame value.
296
Selected References Downie, D., T. Slesnick, and J. K. Stenmark. Math for Girls and Other Problem
Solvers. Berkeley, CA: The Regents of the University of California, 1981. Gardner, M. Mathematical Carnival. New York: Alfred A. Knopf, 1975. Gardner, M. “Mathematical Games.” Scientific American (May 1977): 128–135. Mendelson, E. Introduction to Mathematical Logic. Monterey, CA: Litton
Educational Publishing Co., 1979. Shoemaker, R. W. “The Matrix Treatment of Certain Logic-Type Puzzles.”
Mathematics Teacher (February 1983): 134–138. Smullyan, R. M. What Is the Name of This Book? Englewood Cliffs, NJ:
Prentice-Hall, 1978. Summers, G. J. Test Your Logic. New York: Dover Publications, 1972. Wylie, C. R., Jr. 101 Puzzles in Thought and Logic. New York: Dover
Publications, 1957.
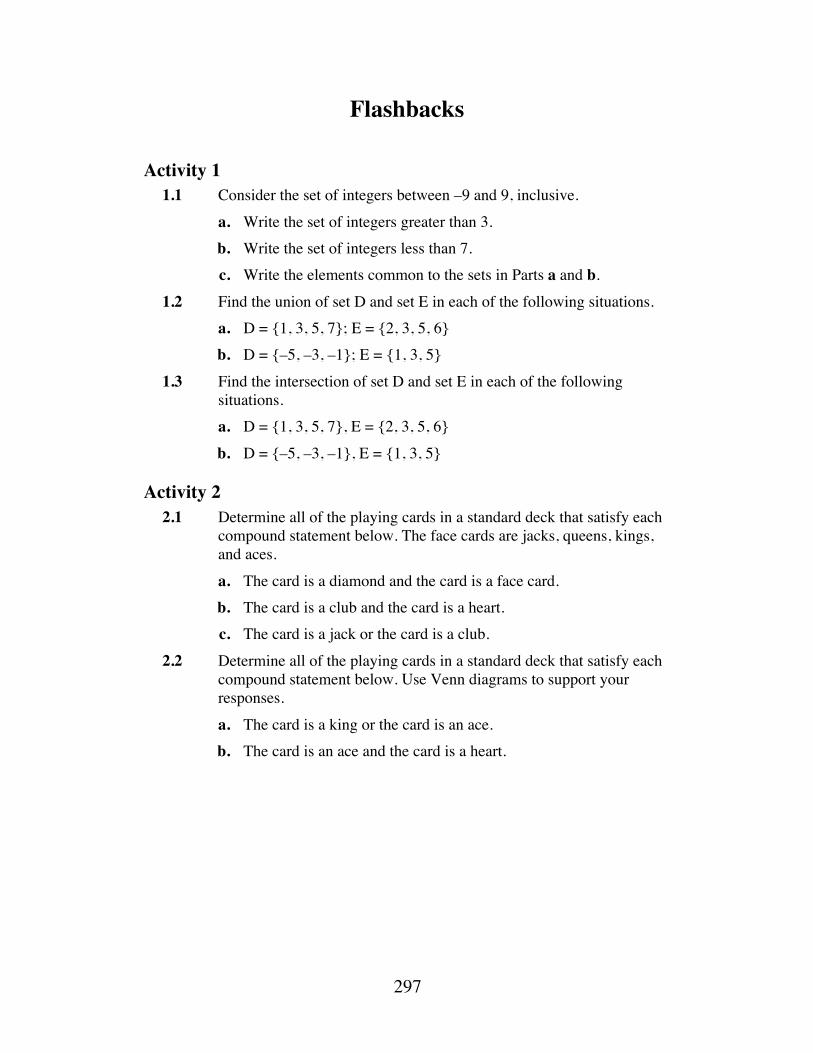
297
Flashbacks
Activity 1 1.1 Consider the set of integers between –9 and 9, inclusive. a. Write the set of integers greater than 3. b. Write the set of integers less than 7. c. Write the elements common to the sets in Parts a and b. 1.2 Find the union of set D and set E in each of the following situations. a. D = {1, 3, 5, 7}; E = {2, 3, 5, 6} b. D = {–5, –3, –1}; E = {1, 3, 5} 1.3 Find the intersection of set D and set E in each of the following
situations. a. D = {1, 3, 5, 7}, E = {2, 3, 5, 6} b. D = {–5, –3, –1}, E = {1, 3, 5}
Activity 2 2.1 Determine all of the playing cards in a standard deck that satisfy each
compound statement below. The face cards are jacks, queens, kings, and aces.
a. The card is a diamond and the card is a face card. b. The card is a club and the card is a heart. c. The card is a jack or the card is a club. 2.2 Determine all of the playing cards in a standard deck that satisfy each
compound statement below. Use Venn diagrams to support your responses.
a. The card is a king or the card is an ace. b. The card is an ace and the card is a heart.

298
Activity 3 3.1 Parts a–c below show incorrect responses to some questions on a
mathematics quiz. Write the correct response for each problem. a. Problem: Write the negation of x > 3. Response: x < 3 b. Problem: Write the negation of “The sky is clear and the wind
is blowing.” Response: “It is cloudy and calm outside.” c. Problem: Solve x < 3 , when x is an integer.
Response: 0, 1, 2
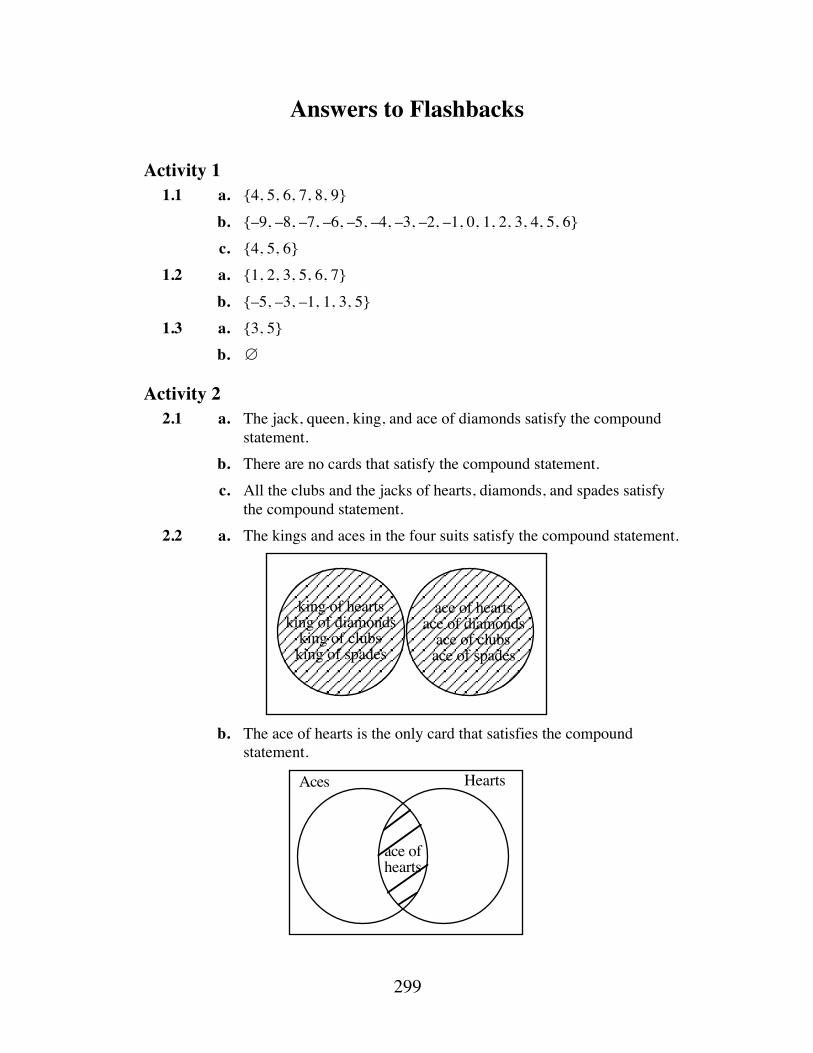
299
Answers to Flashbacks
Activity 1 1.1 a. {4, 5, 6, 7, 8, 9} b. {–9, –8, –7, –6, –5, –4, –3, –2, –1, 0, 1, 2, 3, 4, 5, 6} c. {4, 5, 6} 1.2 a. {1, 2, 3, 5, 6, 7} b. {–5, –3, –1, 1, 3, 5} 1.3 a. {3, 5} b. ∅
Activity 2 2.1 a. The jack, queen, king, and ace of diamonds satisfy the compound
statement. b. There are no cards that satisfy the compound statement. c. All the clubs and the jacks of hearts, diamonds, and spades satisfy
the compound statement. 2.2 a. The kings and aces in the four suits satisfy the compound statement.
b. The ace of hearts is the only card that satisfies the compound
statement.
king of heartsking of diamonds
king of clubsking of spades
ace of heartsace of diamonds
ace of clubsace of spades
Aces Hearts
ace ofhearts

300
Activity 3 3.1 a. x ≤ 3 b. Sample response: “It is cloudy or calm outside.” c. –2, –1, 0, 1, 2
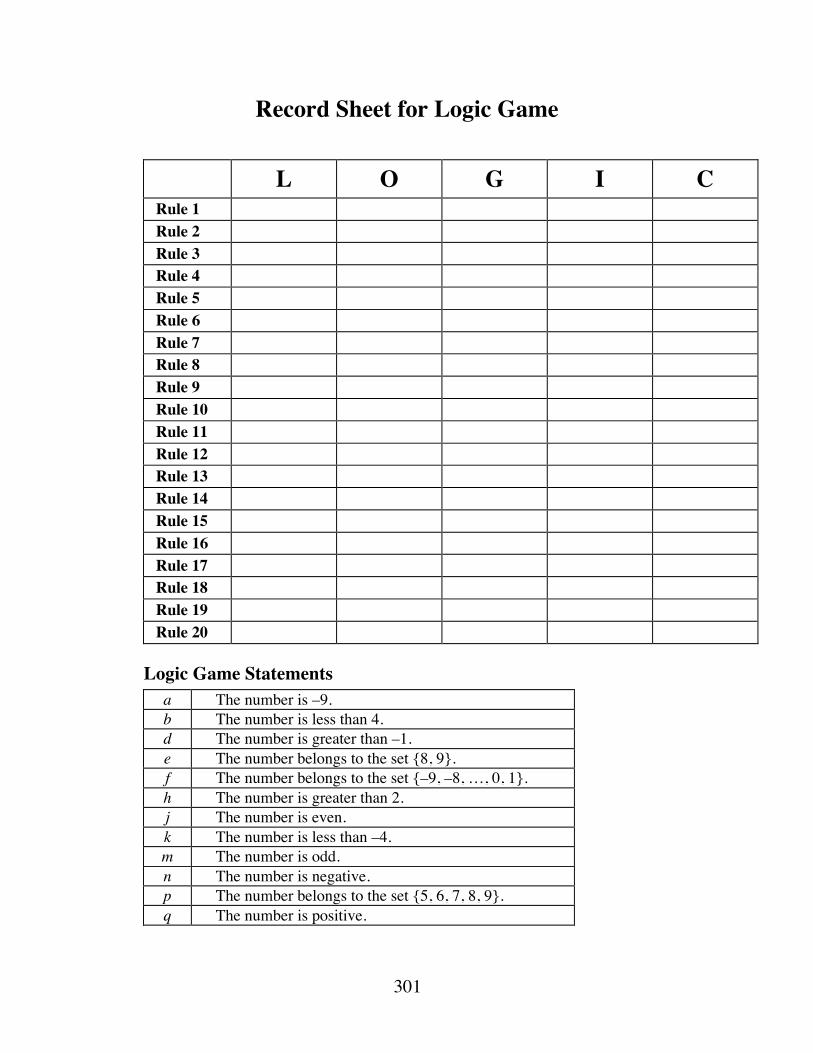
301
Record Sheet for Logic Game
L O G I C Rule 1 Rule 2 Rule 3 Rule 4 Rule 5 Rule 6 Rule 7 Rule 8 Rule 9 Rule 10 Rule 11 Rule 12 Rule 13 Rule 14 Rule 15 Rule 16 Rule 17 Rule 18 Rule 19 Rule 20
Logic Game Statements a The number is –9. b The number is less than 4. d The number is greater than –1. e The number belongs to the set {8, 9}. f The number belongs to the set {–9, –8, …, 0, 1}. h The number is greater than 2. j The number is even. k The number is less than –4. m The number is odd. n The number is negative. p The number belongs to the set {5, 6, 7, 8, 9}. q The number is positive.
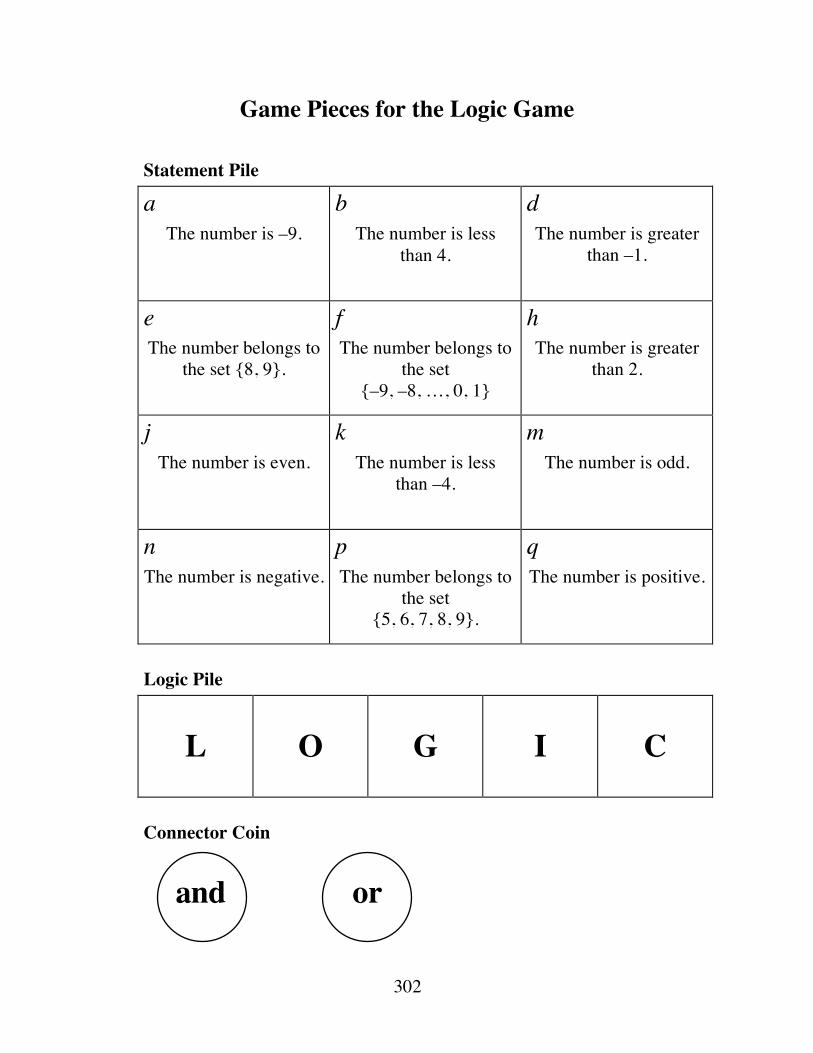
302
Game Pieces for the Logic Game
Statement Pile
a The number is –9.
b The number is less
than 4.
d The number is greater
than –1.
e The number belongs to
the set {8, 9}.
f The number belongs to
the set {–9, –8, …, 0, 1}
h The number is greater
than 2.
j The number is even.
k The number is less
than –4.
m The number is odd.
n The number is negative.
p The number belongs to
the set {5, 6, 7, 8, 9}.
q The number is positive.
Logic Pile
L O G I C
Connector Coin
and or
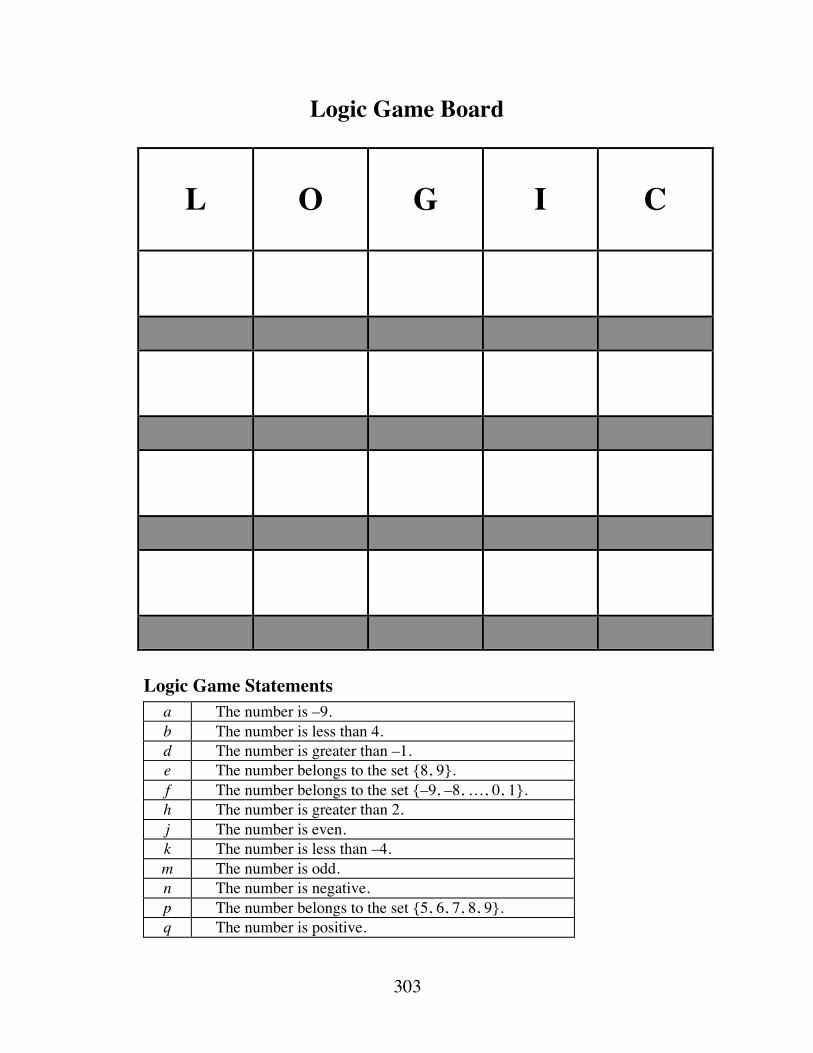
303
Logic Game Board
L O G I C
Logic Game Statements a The number is –9. b The number is less than 4. d The number is greater than –1. e The number belongs to the set {8, 9}. f The number belongs to the set {–9, –8, …, 0, 1}. h The number is greater than 2. j The number is even. k The number is less than –4. m The number is odd. n The number is negative. p The number belongs to the set {5, 6, 7, 8, 9}. q The number is positive.


What’s Your Orbit?
How in the world do astronomers predict the paths of planets? In this module, you’ll examine some planetary data and model it mathematically.
Masha Albrecht • Deanna Turley
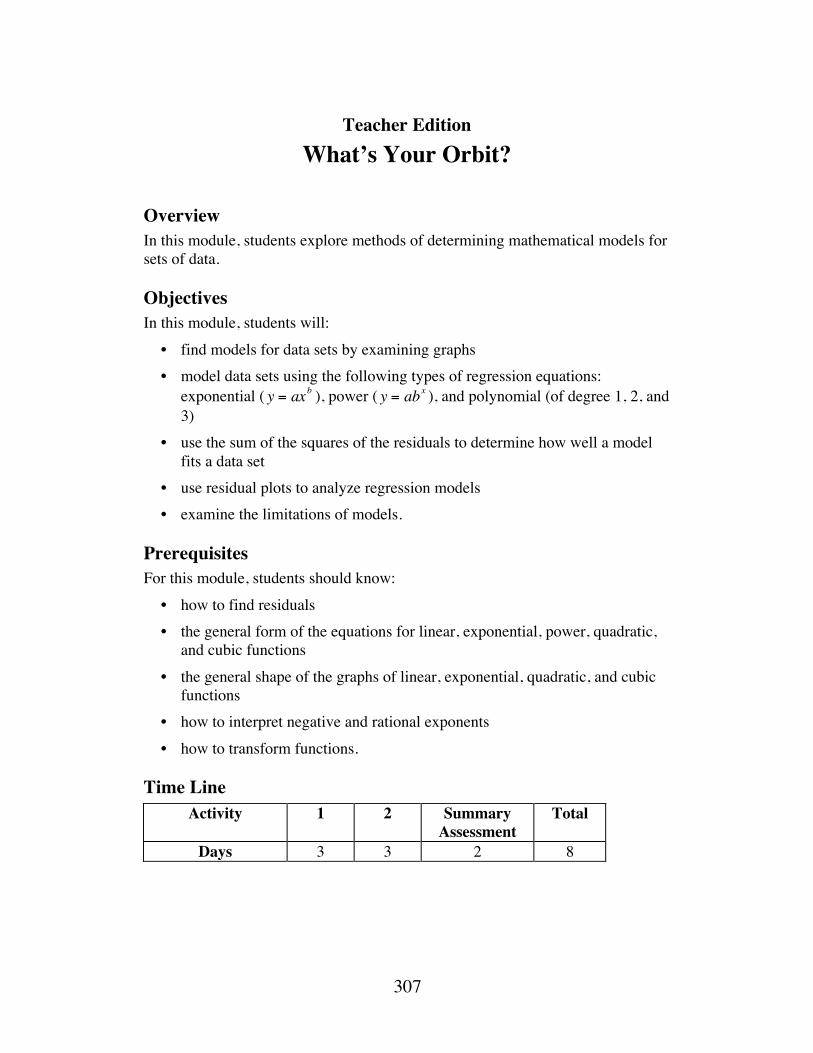
307
Teacher Edition What’s Your Orbit?
Overview In this module, students explore methods of determining mathematical models for sets of data.
Objectives In this module, students will: • find models for data sets by examining graphs • model data sets using the following types of regression equations:
exponential ( y = axb ), power ( y = abx ), and polynomial (of degree 1, 2, and 3)
• use the sum of the squares of the residuals to determine how well a model fits a data set
• use residual plots to analyze regression models • examine the limitations of models.
Prerequisites For this module, students should know: • how to find residuals • the general form of the equations for linear, exponential, power, quadratic,
and cubic functions • the general shape of the graphs of linear, exponential, quadratic, and cubic
functions • how to interpret negative and rational exponents • how to transform functions.
Time Line Activity 1 2 Summary
Assessment Total
Days 3 3 2 8
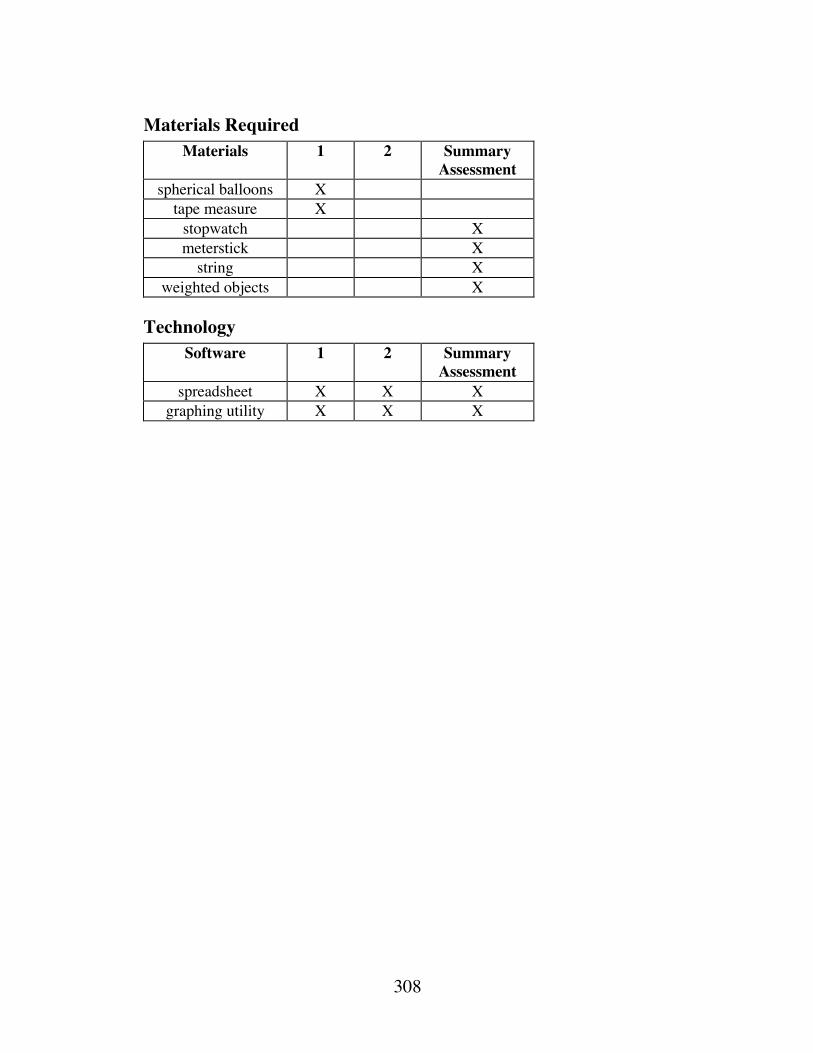
308
Materials Required Materials 1 2 Summary
Assessment spherical balloons X
tape measure X stopwatch X meterstick X
string X weighted objects X
Technology Software 1 2 Summary
Assessment spreadsheet X X X
graphing utility X X X
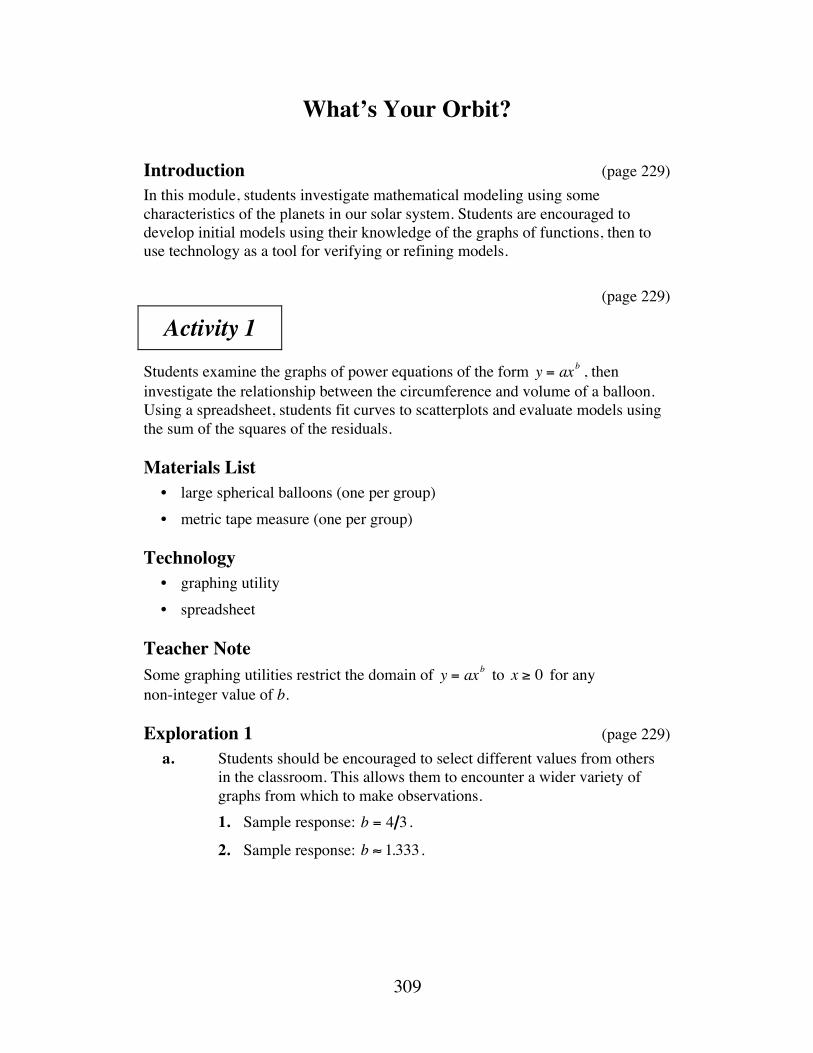
309
What’s Your Orbit?
Introduction (page 229) In this module, students investigate mathematical modeling using some characteristics of the planets in our solar system. Students are encouraged to develop initial models using their knowledge of the graphs of functions, then to use technology as a tool for verifying or refining models. (page 229)
Activity 1 Students examine the graphs of power equations of the form y = axb , then investigate the relationship between the circumference and volume of a balloon. Using a spreadsheet, students fit curves to scatterplots and evaluate models using the sum of the squares of the residuals.
Materials List • large spherical balloons (one per group) • metric tape measure (one per group)
Technology • graphing utility • spreadsheet
Teacher Note Some graphing utilities restrict the domain of y = axb to x ≥ 0 for any non-integer value of b.
Exploration 1 (page 229) a. Students should be encouraged to select different values from others
in the classroom. This allows them to encounter a wider variety of graphs from which to make observations.
1. Sample response: b = 4 3 .
2. Sample response: b ≈ 1.333 .
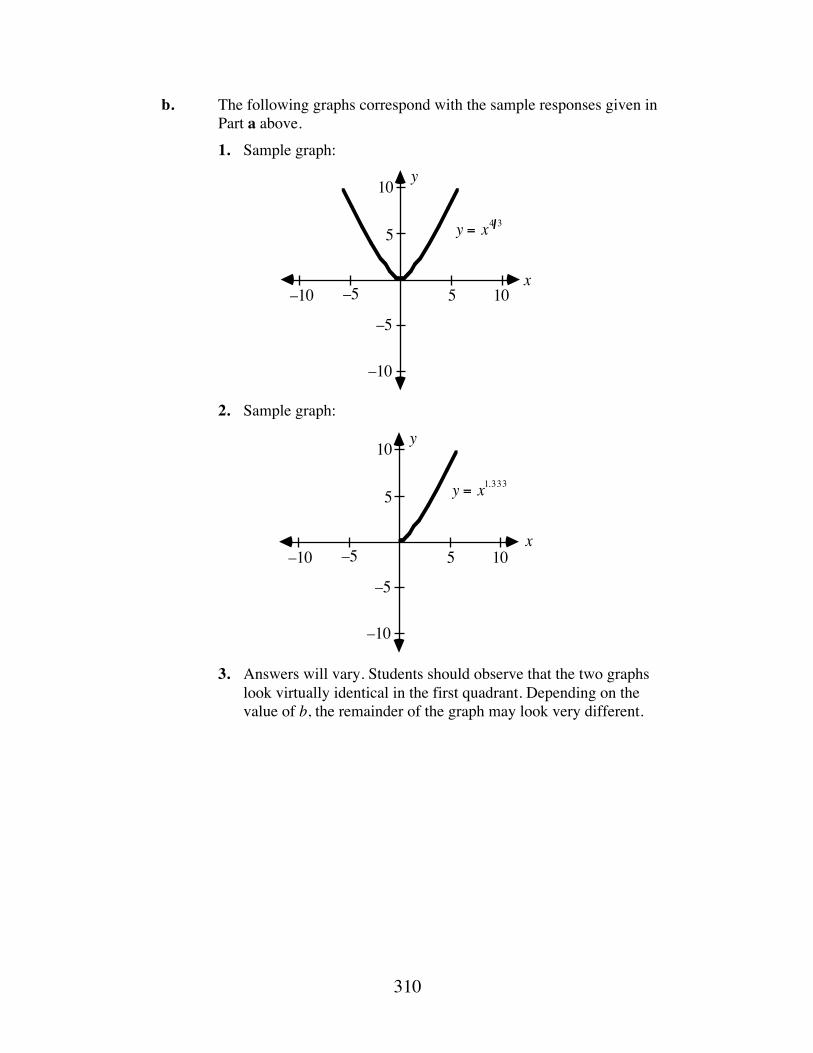
310
b. The following graphs correspond with the sample responses given in Part a above.
1. Sample graph:
2. Sample graph:
3. Answers will vary. Students should observe that the two graphs look virtually identical in the first quadrant. Depending on the value of b, the remainder of the graph may look very different.
y
x
5
10
105
–5
–10
–5–10
y = x4 3
y
x
5
10
105
–5
–10
–5–10
y = x1.333
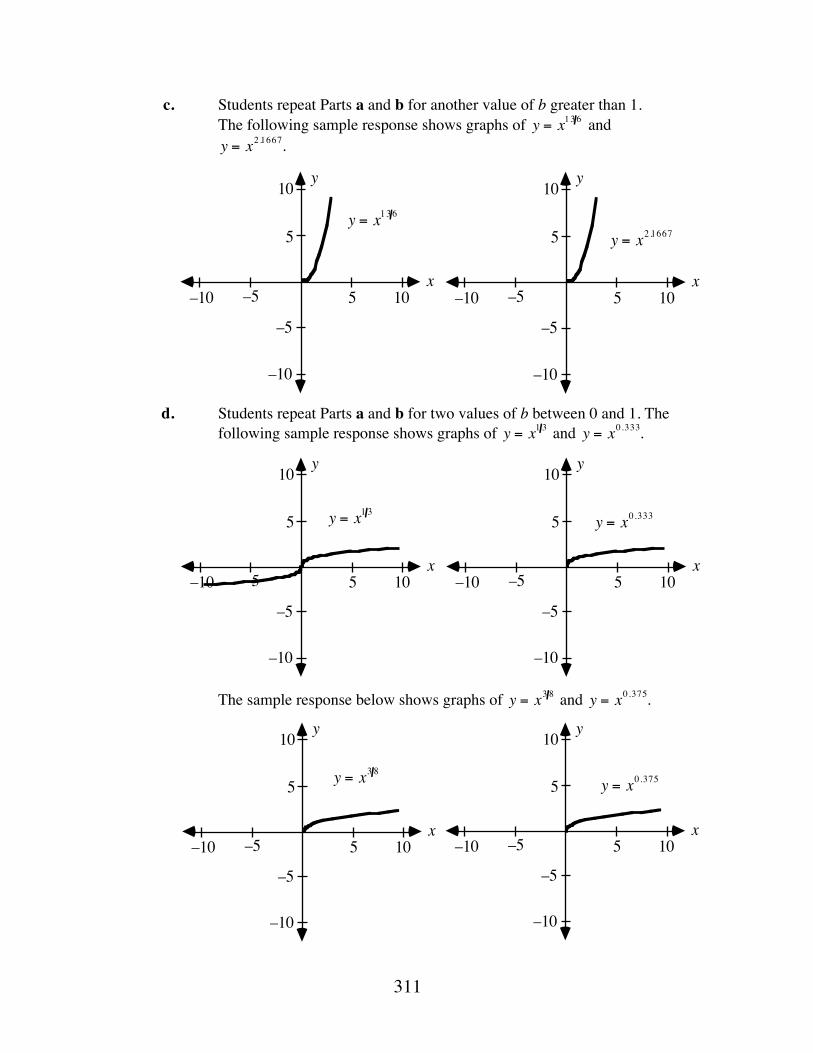
311
c. Students repeat Parts a and b for another value of b greater than 1. The following sample response shows graphs of y = x136 and y = x2.1667.
d. Students repeat Parts a and b for two values of b between 0 and 1. The following sample response shows graphs of y = x1 3 and y = x0.333.
The sample response below shows graphs of y = x3 8 and y = x0.375.
y
x
5
10
105
–5
–10
–5–10
y = x136
y
x
5
10
105
–5
–10
–5–10
y = x2.1667
y
x
5
10
105
–5
–10
–5–10
y = x1 3
y
x
5
10
105
–5
–10
–5–10
y = x0.333
y
x
5
10
105
–5
–10
–5–10
y = x3 8
y
x
5
10
105
–5
–10
–5–10
y = x0.375
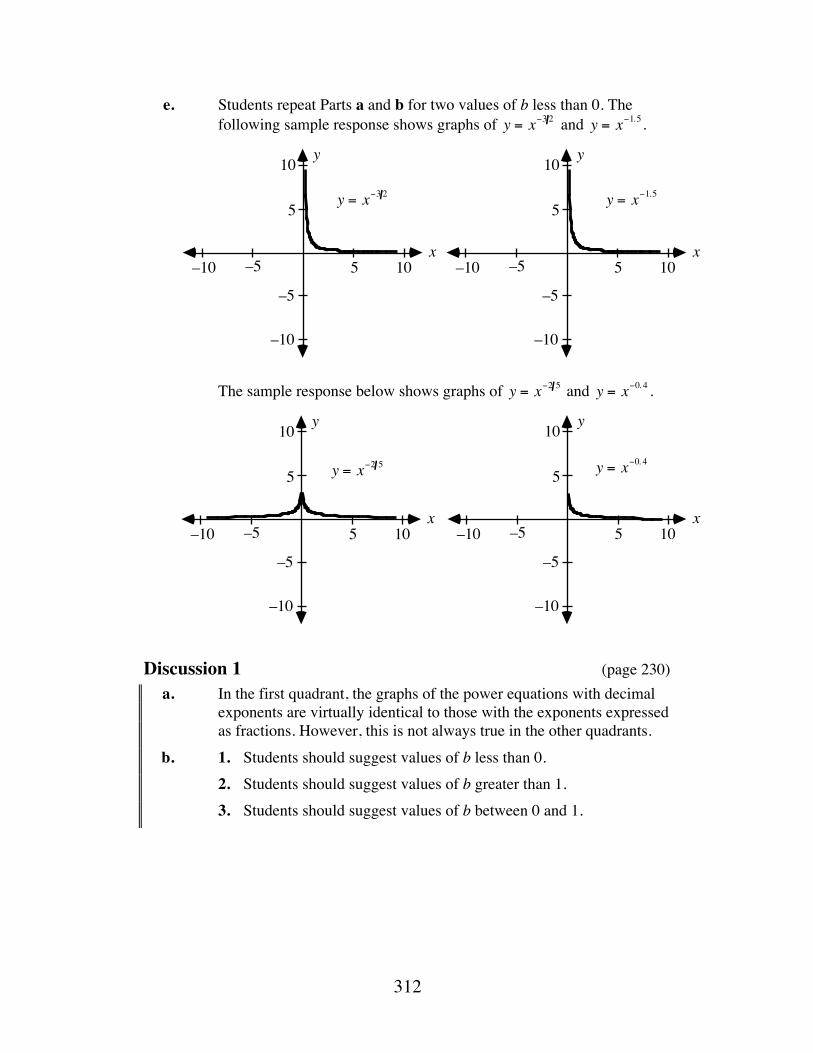
312
e. Students repeat Parts a and b for two values of b less than 0. The following sample response shows graphs of y = x−3 2 and y = x−1.5.
The sample response below shows graphs of y = x−2 5 and y = x−0. 4 .
Discussion 1 (page 230) a. In the first quadrant, the graphs of the power equations with decimal
exponents are virtually identical to those with the exponents expressed as fractions. However, this is not always true in the other quadrants.
b. 1. Students should suggest values of b less than 0. 2. Students should suggest values of b greater than 1. 3. Students should suggest values of b between 0 and 1.
y
x
5
10
105
–5
–10
–5–10
y = x−3 2
y
x
5
10
105
–5
–10
–5–10
y = x−1.5
y
x
5
10
105
–5
–10
–5–10
y = x−2 5
y
x
5
10
105
–5
–10
–5–10
y = x−0. 4
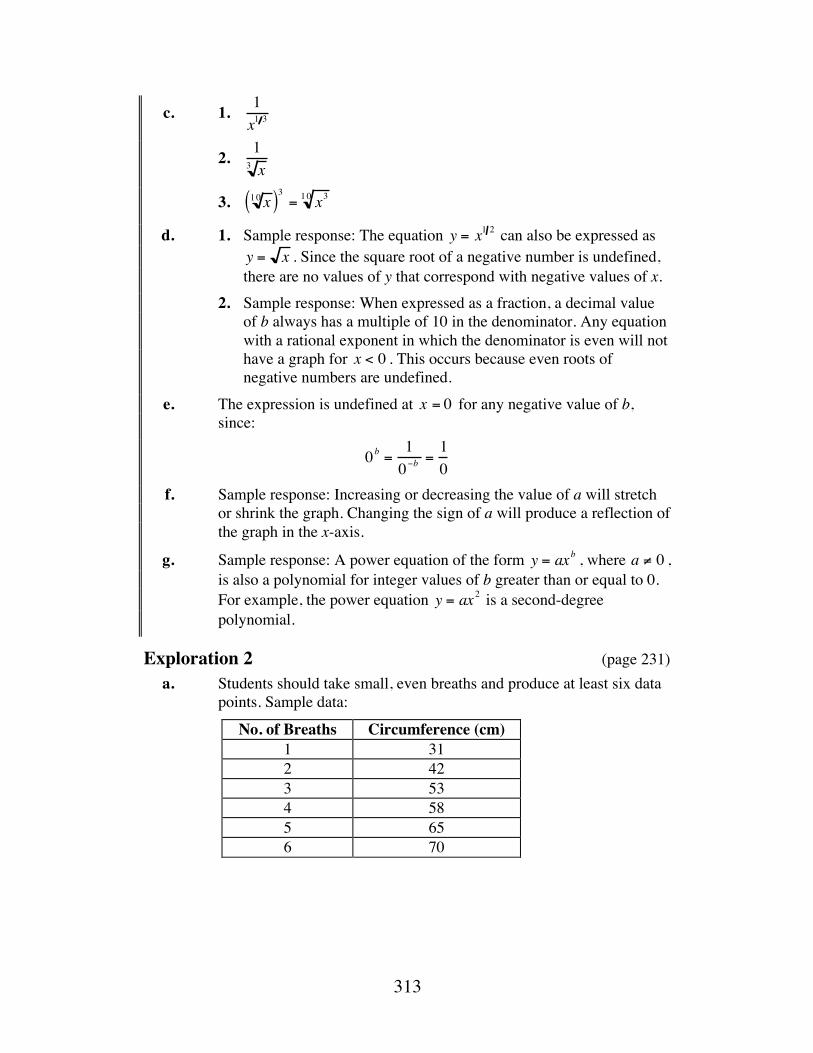
313
c. 1. 1x1 3
2. 1x3
3. x10( )3 = x310
d. 1. Sample response: The equation y = x1 2 can also be expressed as y = x . Since the square root of a negative number is undefined, there are no values of y that correspond with negative values of x.
2. Sample response: When expressed as a fraction, a decimal value of b always has a multiple of 10 in the denominator. Any equation with a rational exponent in which the denominator is even will not have a graph for x < 0 . This occurs because even roots of negative numbers are undefined.
e. The expression is undefined at x = 0 for any negative value of b, since:
0b = 10−b
=10
f. Sample response: Increasing or decreasing the value of a will stretch or shrink the graph. Changing the sign of a will produce a reflection of the graph in the x-axis.
g. Sample response: A power equation of the form y = axb , where a ≠ 0 , is also a polynomial for integer values of b greater than or equal to 0. For example, the power equation y = ax2 is a second-degree polynomial.
Exploration 2 (page 231) a. Students should take small, even breaths and produce at least six data
points. Sample data:
No. of Breaths Circumference (cm) 1 31 2 42 3 53 4 58 5 65 6 70
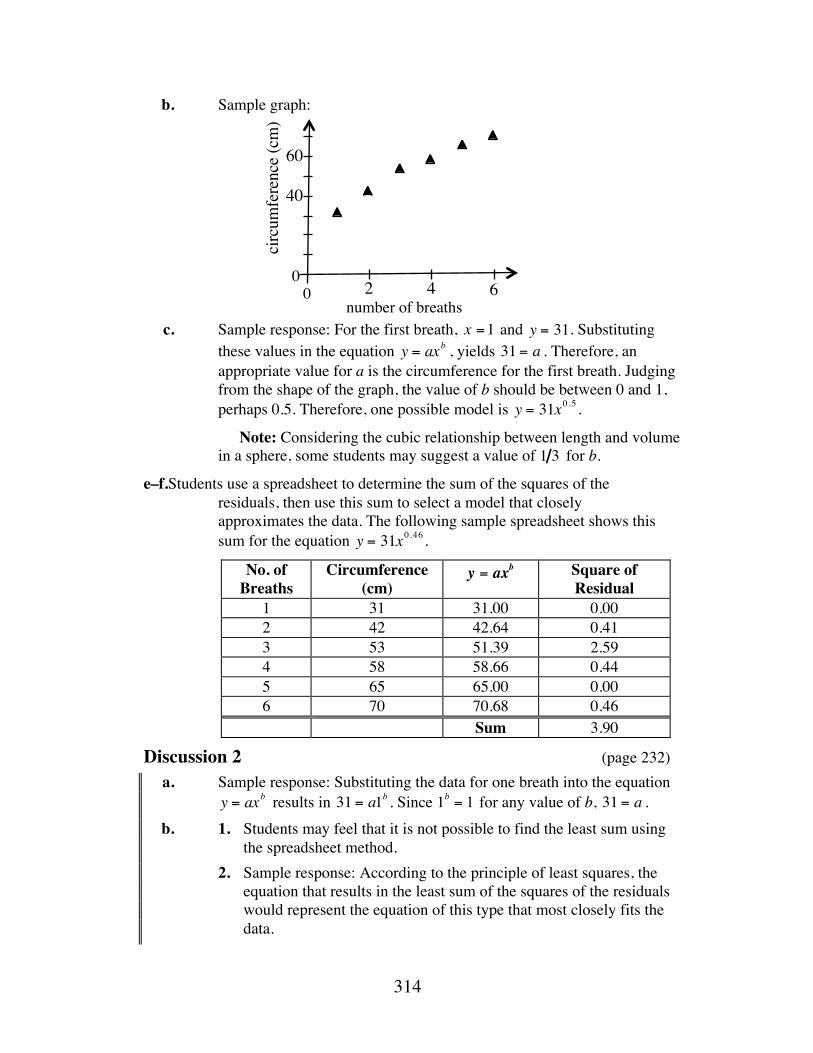
314
b. Sample graph:
c. Sample response: For the first breath, x =1 and y = 31. Substituting
these values in the equation y = axb , yields 31 = a . Therefore, an appropriate value for a is the circumference for the first breath. Judging from the shape of the graph, the value of b should be between 0 and 1, perhaps 0.5. Therefore, one possible model is y = 31x0.5 .
Note: Considering the cubic relationship between length and volume in a sphere, some students may suggest a value of 1 3 for b.
e–f.Students use a spreadsheet to determine the sum of the squares of the residuals, then use this sum to select a model that closely approximates the data. The following sample spreadsheet shows this sum for the equation y = 31x0.46 .
No. of Breaths
Circumference (cm)
y = axb Square of Residual
1 31 31.00 0.00 2 42 42.64 0.41 3 53 51.39 2.59 4 58 58.66 0.44 5 65 65.00 0.00 6 70 70.68 0.46 Sum 3.90
Discussion 2 (page 232) a. Sample response: Substituting the data for one breath into the equation
y = axb results in 31 = a1b . Since 1b = 1 for any value of b, 31 = a . b. 1. Students may feel that it is not possible to find the least sum using
the spreadsheet method. 2. Sample response: According to the principle of least squares, the
equation that results in the least sum of the squares of the residuals would represent the equation of this type that most closely fits the data.
40
60
2 4 6ci
rcum
fere
nce
(cm
)
number of breaths
0 0
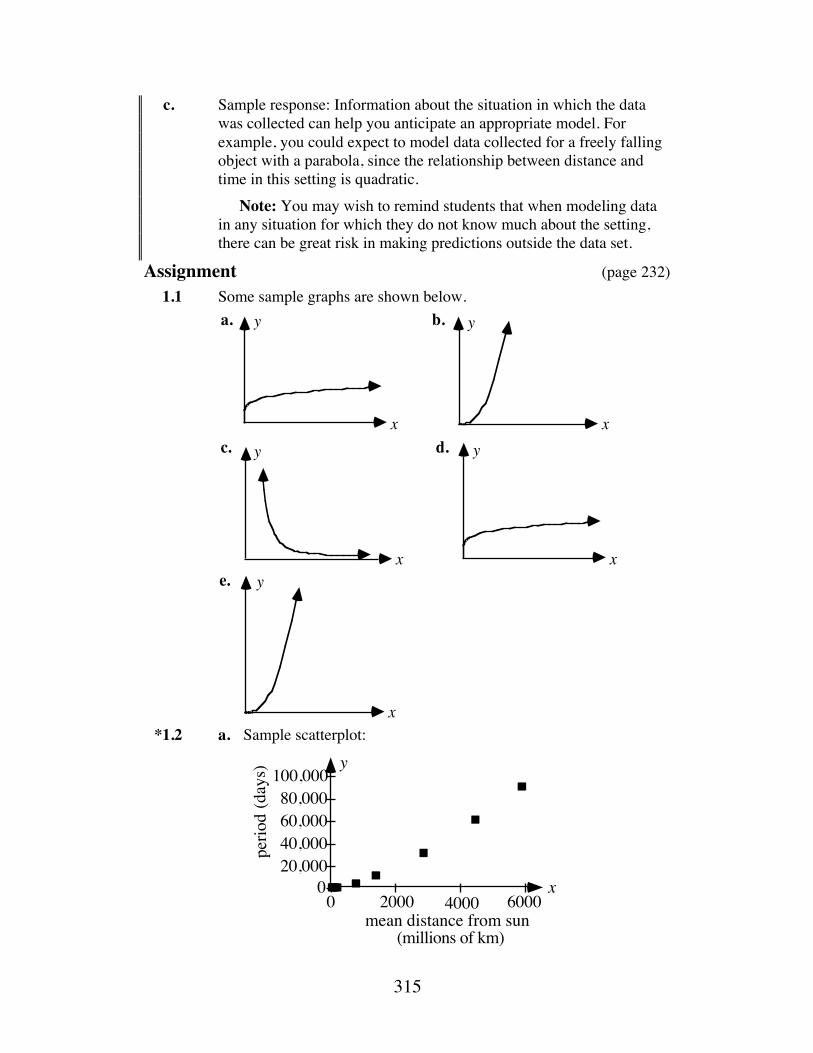
315
c. Sample response: Information about the situation in which the data was collected can help you anticipate an appropriate model. For example, you could expect to model data collected for a freely falling object with a parabola, since the relationship between distance and time in this setting is quadratic.
Note: You may wish to remind students that when modeling data in any situation for which they do not know much about the setting, there can be great risk in making predictions outside the data set.
Assignment (page 232) 1.1 Some sample graphs are shown below.
*1.2 a. Sample scatterplot:
x
ya.
x
yb.
x
yc. d.
x
y
x
ye.
60,00080,000
100,000
2000 4000 6000
y
x
mean distance from sun (millions of km)
40,00020,000
00
perio
d (d
ays)
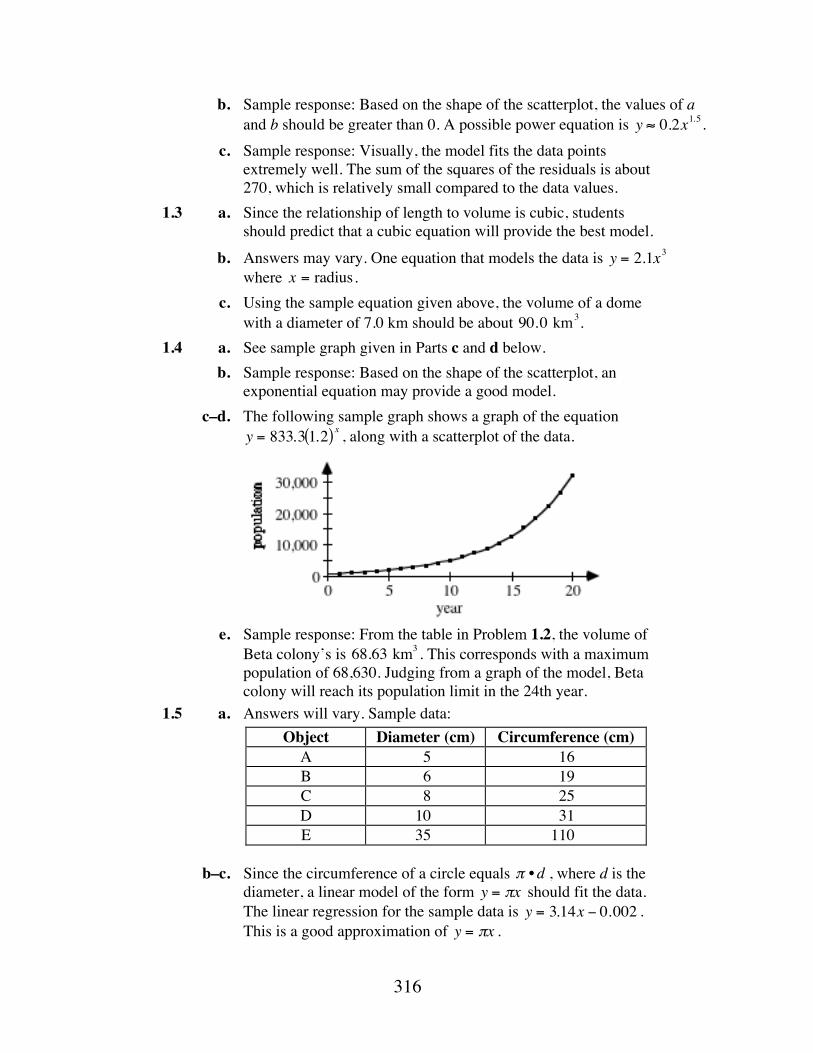
316
b. Sample response: Based on the shape of the scatterplot, the values of a and b should be greater than 0. A possible power equation is y ≈ 0.2x1.5.
c. Sample response: Visually, the model fits the data points extremely well. The sum of the squares of the residuals is about 270, which is relatively small compared to the data values.
1.3 a. Since the relationship of length to volume is cubic, students should predict that a cubic equation will provide the best model.
b. Answers may vary. One equation that models the data is y = 2.1x3 where x = radius.
c. Using the sample equation given above, the volume of a dome with a diameter of 7.0 km should be about 90.0 km3.
1.4 a. See sample graph given in Parts c and d below. b. Sample response: Based on the shape of the scatterplot, an
exponential equation may provide a good model. c–d. The following sample graph shows a graph of the equation
y = 833.3 1.2( ) x , along with a scatterplot of the data.
e. Sample response: From the table in Problem 1.2, the volume of
Beta colony’s is 68.63 km3 . This corresponds with a maximum population of 68,630. Judging from a graph of the model, Beta colony will reach its population limit in the 24th year.
1.5 a. Answers will vary. Sample data: Object Diameter (cm) Circumference (cm)
A 5 16 B 6 19 C 8 25 D 10 31 E 35 110
b–c. Since the circumference of a circle equals π •d , where d is the diameter, a linear model of the form y = πx should fit the data. The linear regression for the sample data is y = 3.14x − 0.002 . This is a good approximation of y = πx .
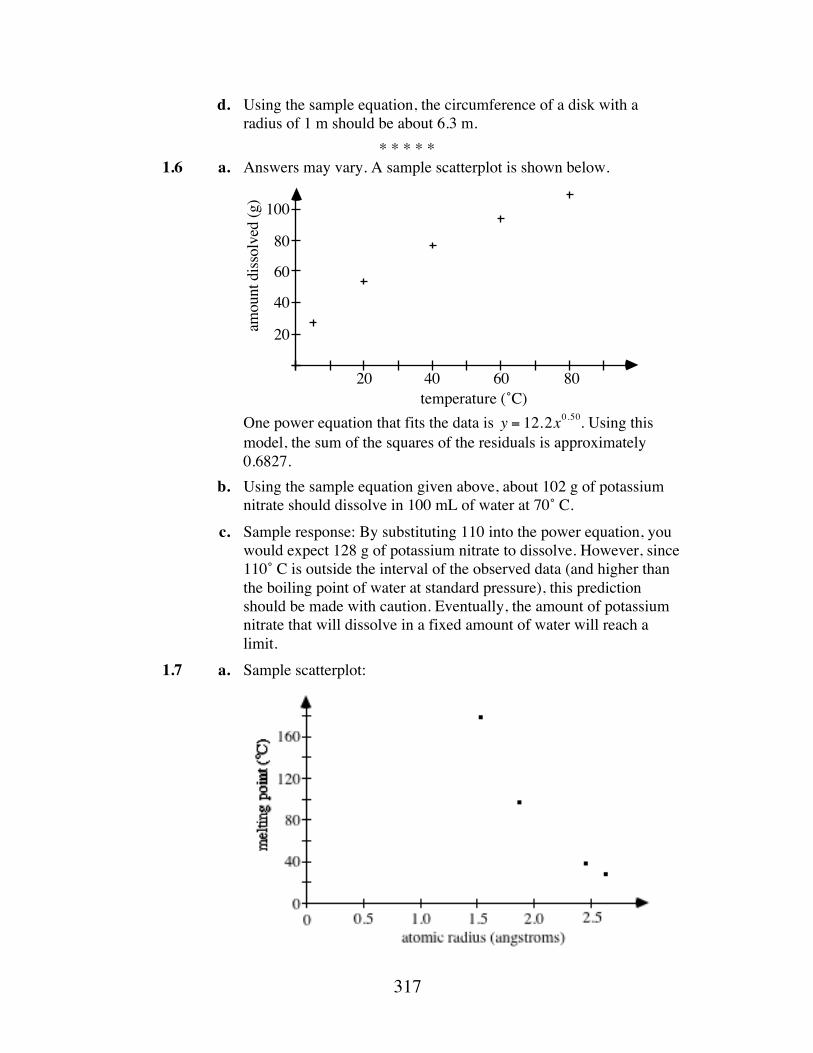
317
d. Using the sample equation, the circumference of a disk with a radius of 1 m should be about 6.3 m.
* * * * * 1.6 a. Answers may vary. A sample scatterplot is shown below. One power equation that fits the data is y = 12.2x0.50. Using this
model, the sum of the squares of the residuals is approximately 0.6827.
b. Using the sample equation given above, about 102 g of potassium nitrate should dissolve in 100 mL of water at 70˚ C.
c. Sample response: By substituting 110 into the power equation, you would expect 128 g of potassium nitrate to dissolve. However, since 110˚ C is outside the interval of the observed data (and higher than the boiling point of water at standard pressure), this prediction should be made with caution. Eventually, the amount of potassium nitrate that will dissolve in a fixed amount of water will reach a limit.
1.7 a. Sample scatterplot:
temperature (˚C)
20
40
60
80
100
20 40 60 80
amou
nt d
issol
ved
(g)
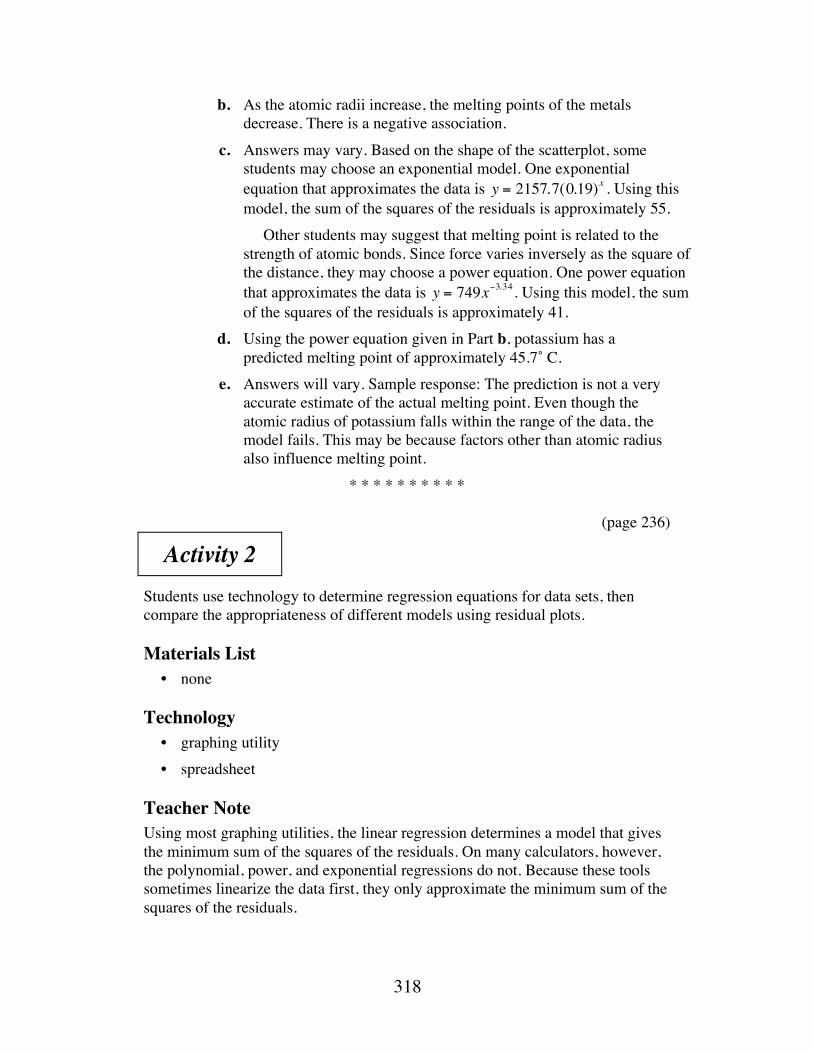
318
b. As the atomic radii increase, the melting points of the metals decrease. There is a negative association.
c. Answers may vary. Based on the shape of the scatterplot, some students may choose an exponential model. One exponential equation that approximates the data is y = 2157.7(0.19) x . Using this model, the sum of the squares of the residuals is approximately 55.
Other students may suggest that melting point is related to the strength of atomic bonds. Since force varies inversely as the square of the distance, they may choose a power equation. One power equation that approximates the data is y = 749x−3.34. Using this model, the sum of the squares of the residuals is approximately 41.
d. Using the power equation given in Part b, potassium has a predicted melting point of approximately 45.7˚ C.
e. Answers will vary. Sample response: The prediction is not a very accurate estimate of the actual melting point. Even though the atomic radius of potassium falls within the range of the data, the model fails. This may be because factors other than atomic radius also influence melting point.
* * * * * * * * * * (page 236)
Activity 2 Students use technology to determine regression equations for data sets, then compare the appropriateness of different models using residual plots.
Materials List • none
Technology • graphing utility • spreadsheet
Teacher Note Using most graphing utilities, the linear regression determines a model that gives the minimum sum of the squares of the residuals. On many calculators, however, the polynomial, power, and exponential regressions do not. Because these tools sometimes linearize the data first, they only approximate the minimum sum of the squares of the residuals.
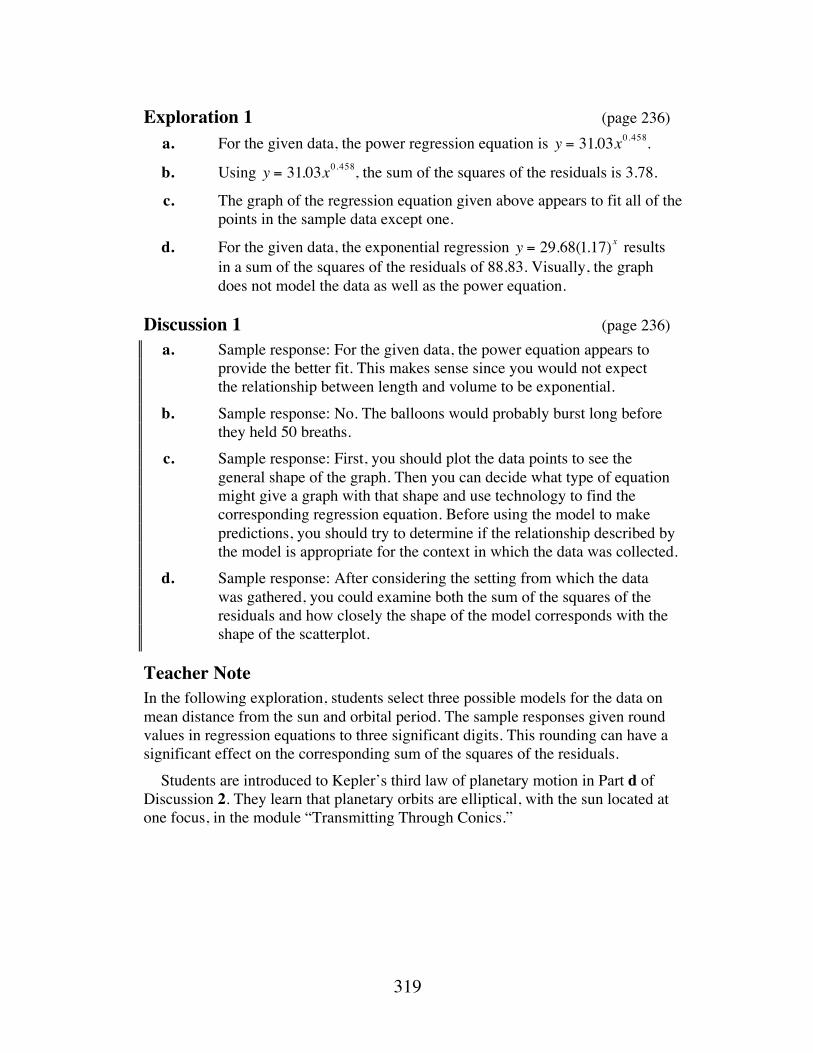
319
Exploration 1 (page 236) a. For the given data, the power regression equation is y = 31.03x0.458.
b. Using y = 31.03x0.458, the sum of the squares of the residuals is 3.78.
c. The graph of the regression equation given above appears to fit all of the points in the sample data except one.
d. For the given data, the exponential regression y = 29.68(1.17) x results in a sum of the squares of the residuals of 88.83. Visually, the graph does not model the data as well as the power equation.
Discussion 1 (page 236) a. Sample response: For the given data, the power equation appears to
provide the better fit. This makes sense since you would not expect the relationship between length and volume to be exponential.
b. Sample response: No. The balloons would probably burst long before they held 50 breaths.
c. Sample response: First, you should plot the data points to see the general shape of the graph. Then you can decide what type of equation might give a graph with that shape and use technology to find the corresponding regression equation. Before using the model to make predictions, you should try to determine if the relationship described by the model is appropriate for the context in which the data was collected.
d. Sample response: After considering the setting from which the data was gathered, you could examine both the sum of the squares of the residuals and how closely the shape of the model corresponds with the shape of the scatterplot.
Teacher Note In the following exploration, students select three possible models for the data on mean distance from the sun and orbital period. The sample responses given round values in regression equations to three significant digits. This rounding can have a significant effect on the corresponding sum of the squares of the residuals. Students are introduced to Kepler’s third law of planetary motion in Part d of Discussion 2. They learn that planetary orbits are elliptical, with the sun located at one focus, in the module “Transmitting Through Conics.”
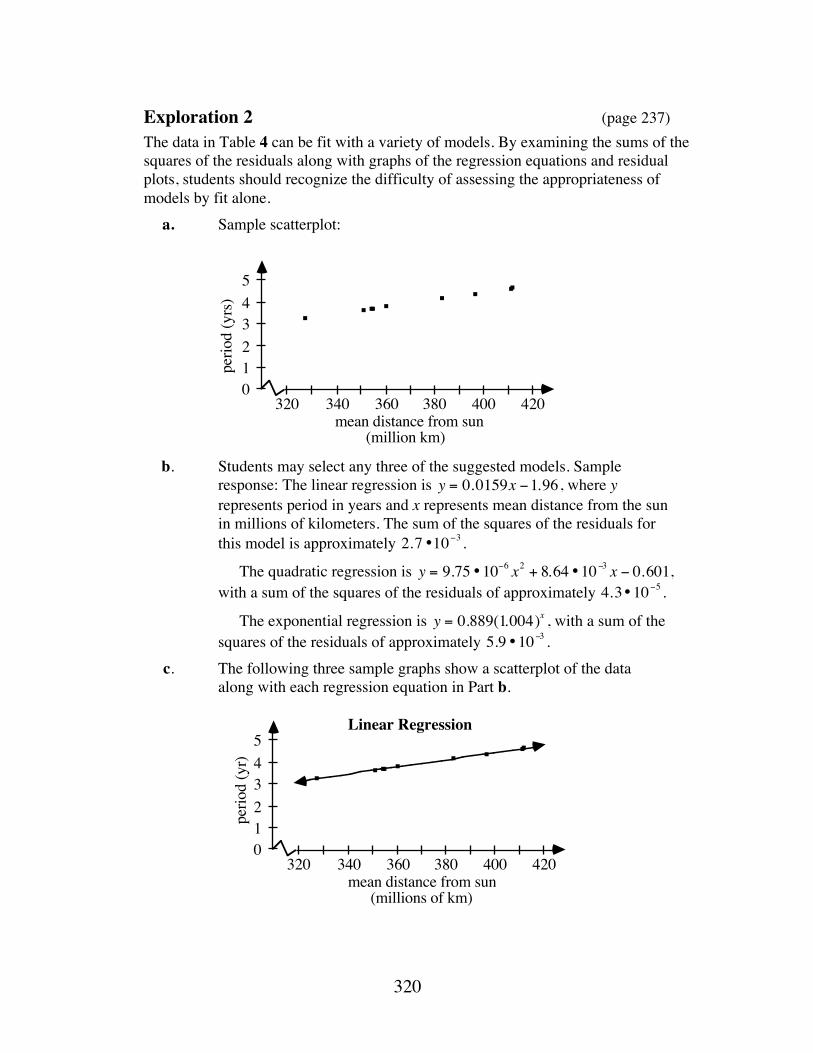
320
Exploration 2 (page 237) The data in Table 4 can be fit with a variety of models. By examining the sums of the squares of the residuals along with graphs of the regression equations and residual plots, students should recognize the difficulty of assessing the appropriateness of models by fit alone. a. Sample scatterplot:
b. Students may select any three of the suggested models. Sample
response: The linear regression is y = 0.0159x −1.96 , where y represents period in years and x represents mean distance from the sun in millions of kilometers. The sum of the squares of the residuals for this model is approximately 2.7 •10−3 .
The quadratic regression is y = 9.75 •10−6 x2 + 8.64 •10−3 x − 0.601, with a sum of the squares of the residuals of approximately 4.3•10−5 .
The exponential regression is y = 0.889(1.004)x , with a sum of the squares of the residuals of approximately 5.9 •10−3 .
c. The following three sample graphs show a scatterplot of the data along with each regression equation in Part b.
320 420340 360 380 4000
2345
1
mean distance from sun (million km)
perio
d (y
rs)
Linear Regression
320 420340 360 380 4000
2345
1
mean distance from sun(millions of km)
perio
d (y
r)
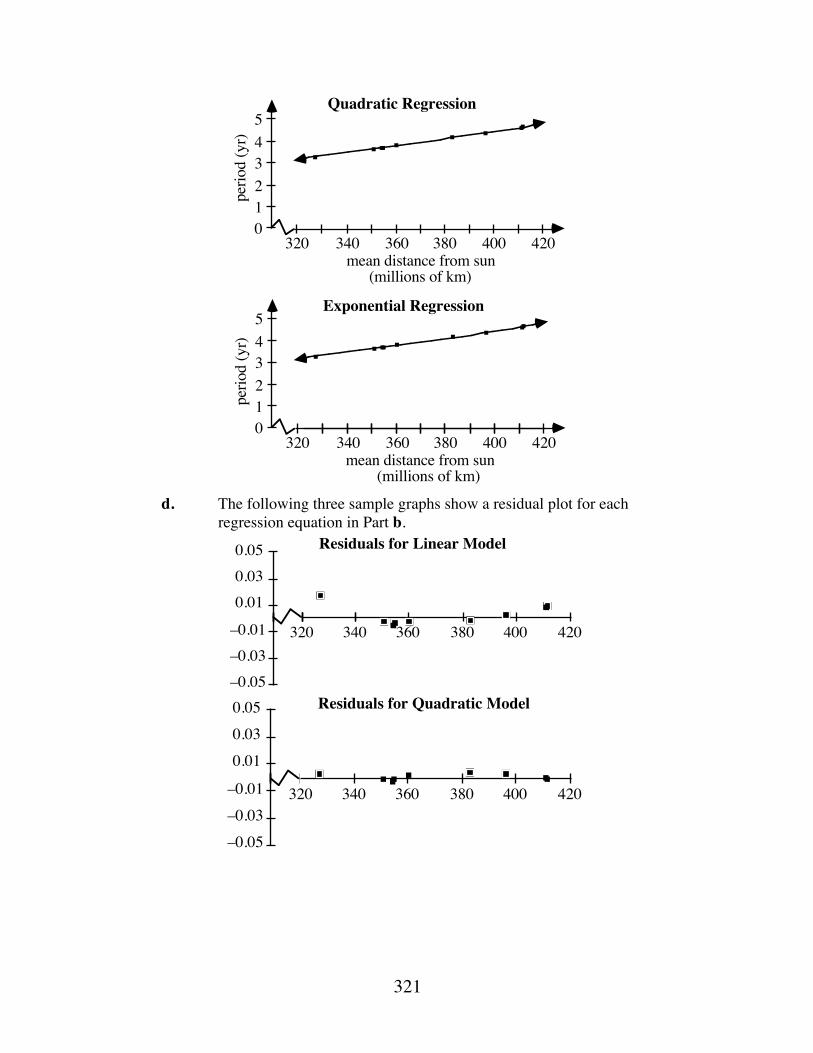
321
d. The following three sample graphs show a residual plot for each
regression equation in Part b.
Quadratic Regression
320 420340 360 380 4000
2345
1
mean distance from sun(millions of km)
perio
d (y
r)
Exponential Regression
320 420340 360 380 4000
2345
1
mean distance from sun (millions of km)
perio
d (y
r)
–0.05–0.03–0.01
0.010.030.05
320 340 360 380 400 420
Residuals for Linear Model
–0.05–0.03–0.01
0.010.030.05
320 340 360 380 400 420
Residuals for Quadratic Model
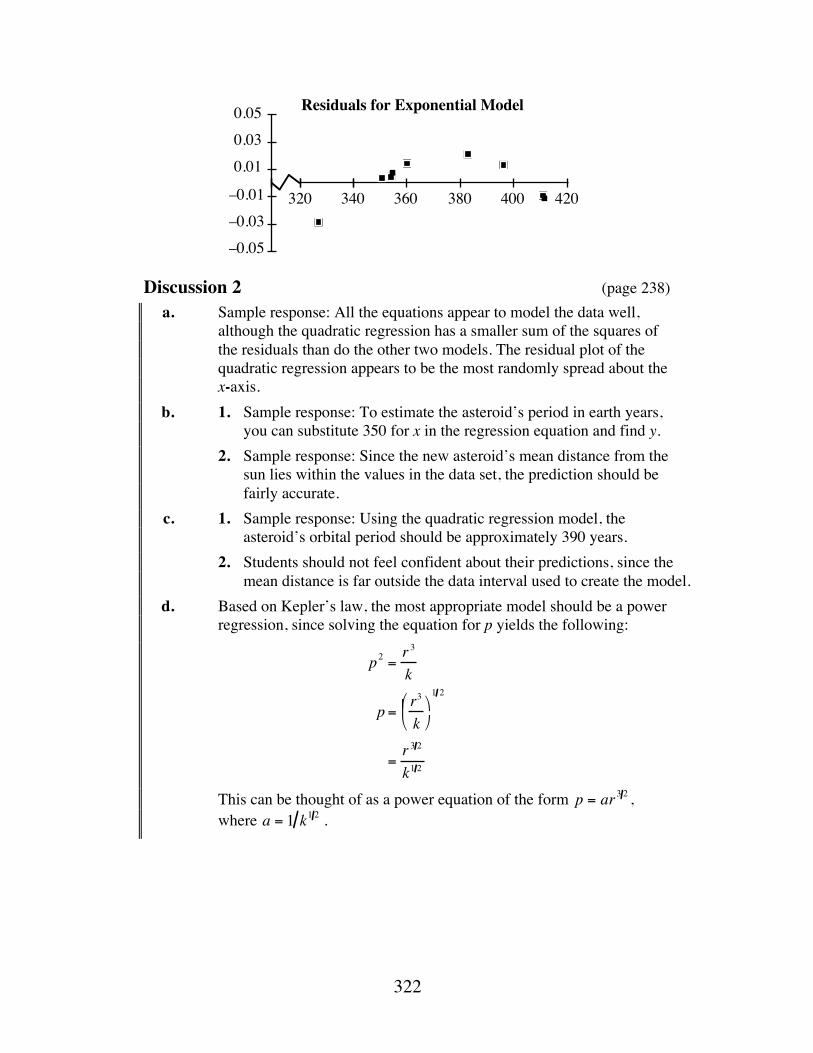
322
Discussion 2 (page 238) a. Sample response: All the equations appear to model the data well,
although the quadratic regression has a smaller sum of the squares of the residuals than do the other two models. The residual plot of the quadratic regression appears to be the most randomly spread about the x-axis.
b. 1. Sample response: To estimate the asteroid’s period in earth years, you can substitute 350 for x in the regression equation and find y.
2. Sample response: Since the new asteroid’s mean distance from the sun lies within the values in the data set, the prediction should be fairly accurate.
c. 1. Sample response: Using the quadratic regression model, the asteroid’s orbital period should be approximately 390 years.
2. Students should not feel confident about their predictions, since the mean distance is far outside the data interval used to create the model.
d. Based on Kepler’s law, the most appropriate model should be a power regression, since solving the equation for p yields the following:
p2 =r 3
k
p =r3
k⎛
⎝ ⎜ ⎞
⎠
1 2
=r 3 2
k1 2
This can be thought of as a power equation of the form p = ar3 2 , where a = 1 k1 2 .
Residuals for Exponential Model
–0.05–0.03–0.01
0.010.030.05
320 340 360 380 400 420
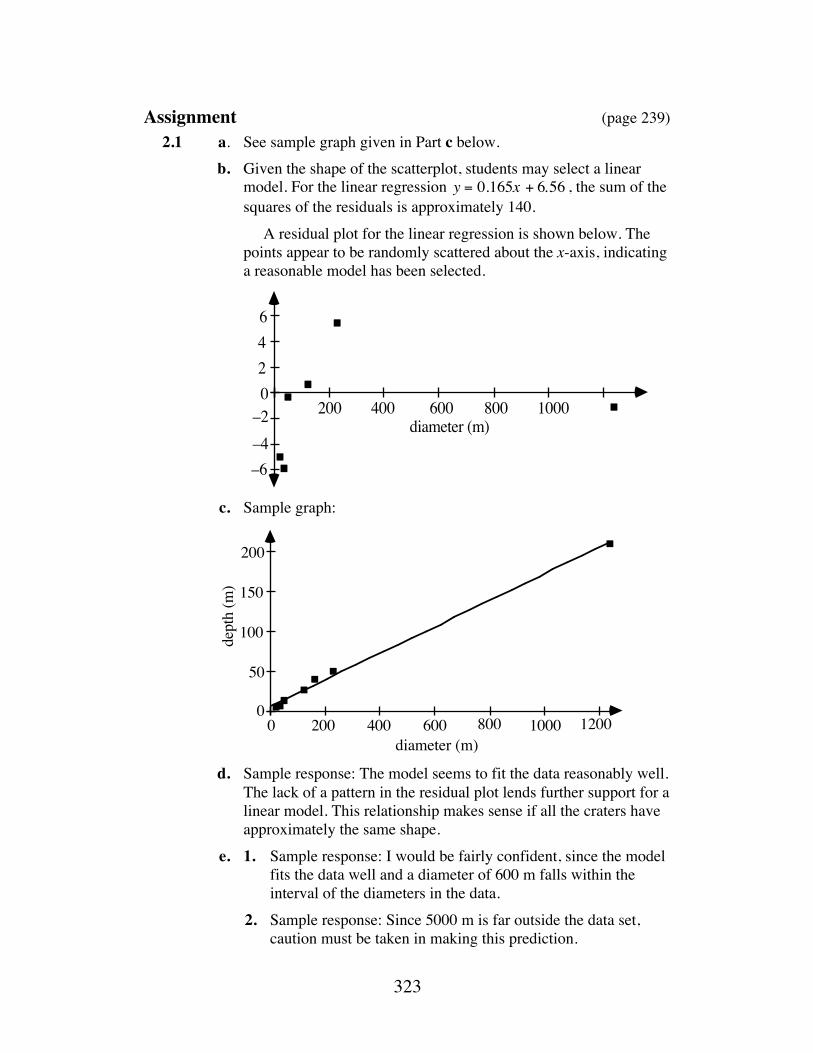
323
Assignment (page 239) 2.1 a. See sample graph given in Part c below. b. Given the shape of the scatterplot, students may select a linear
model. For the linear regression y = 0.165x + 6.56 , the sum of the squares of the residuals is approximately 140.
A residual plot for the linear regression is shown below. The points appear to be randomly scattered about the x-axis, indicating a reasonable model has been selected.
c. Sample graph: d. Sample response: The model seems to fit the data reasonably well.
The lack of a pattern in the residual plot lends further support for a linear model. This relationship makes sense if all the craters have approximately the same shape.
e. 1. Sample response: I would be fairly confident, since the model fits the data well and a diameter of 600 m falls within the interval of the diameters in the data.
2. Sample response: Since 5000 m is far outside the data set, caution must be taken in making this prediction.
246
–2–4–6
0200 400 600 800 1000
diameter (m)
diameter (m) 200 400 600 800 1000 1200
50
100
150
200
00
dept
h (m
)
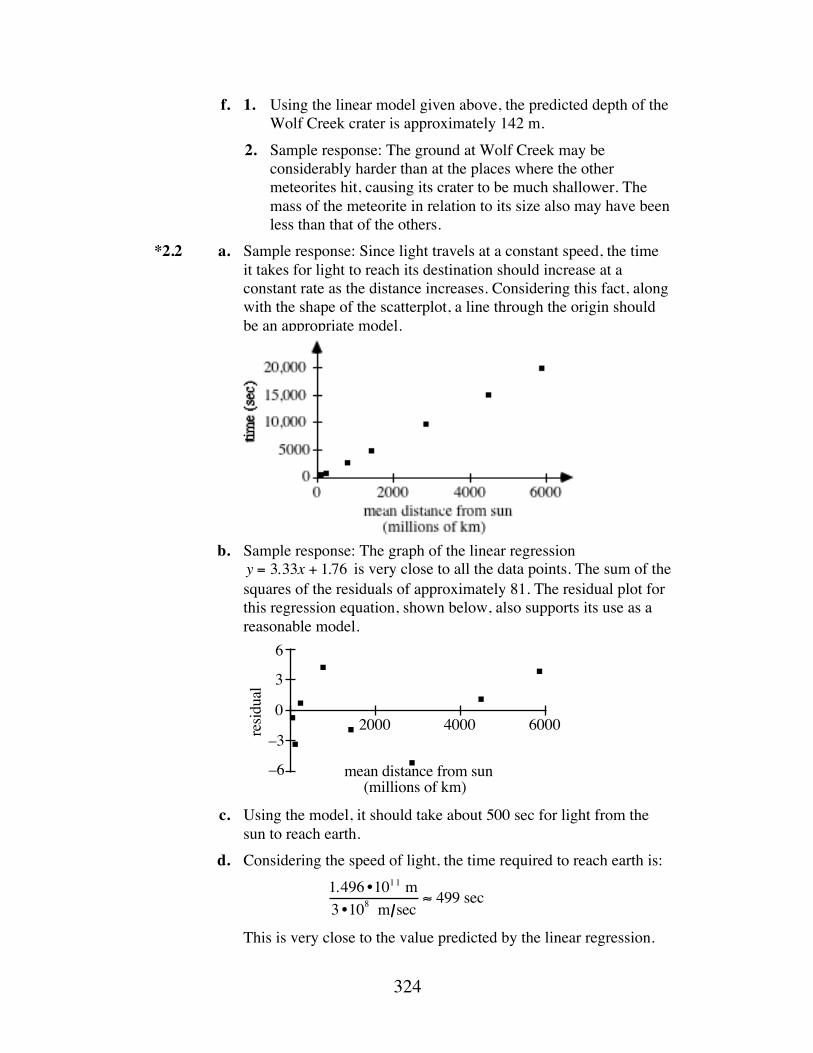
324
f. 1. Using the linear model given above, the predicted depth of the Wolf Creek crater is approximately 142 m.
2. Sample response: The ground at Wolf Creek may be considerably harder than at the places where the other meteorites hit, causing its crater to be much shallower. The mass of the meteorite in relation to its size also may have been less than that of the others.
*2.2 a. Sample response: Since light travels at a constant speed, the time it takes for light to reach its destination should increase at a constant rate as the distance increases. Considering this fact, along with the shape of the scatterplot, a line through the origin should be an appropriate model.
b. Sample response: The graph of the linear regression
y = 3.33x + 1.76 is very close to all the data points. The sum of the squares of the residuals of approximately 81. The residual plot for this regression equation, shown below, also supports its use as a reasonable model.
c. Using the model, it should take about 500 sec for light from the
sun to reach earth. d. Considering the speed of light, the time required to reach earth is:
1.496 •101 1 m3 •108 m sec
≈ 499 sec
This is very close to the value predicted by the linear regression.
–6
–3
0
3
6
2000 4000 6000
mean distance from sun (millions of km)
resid
ual
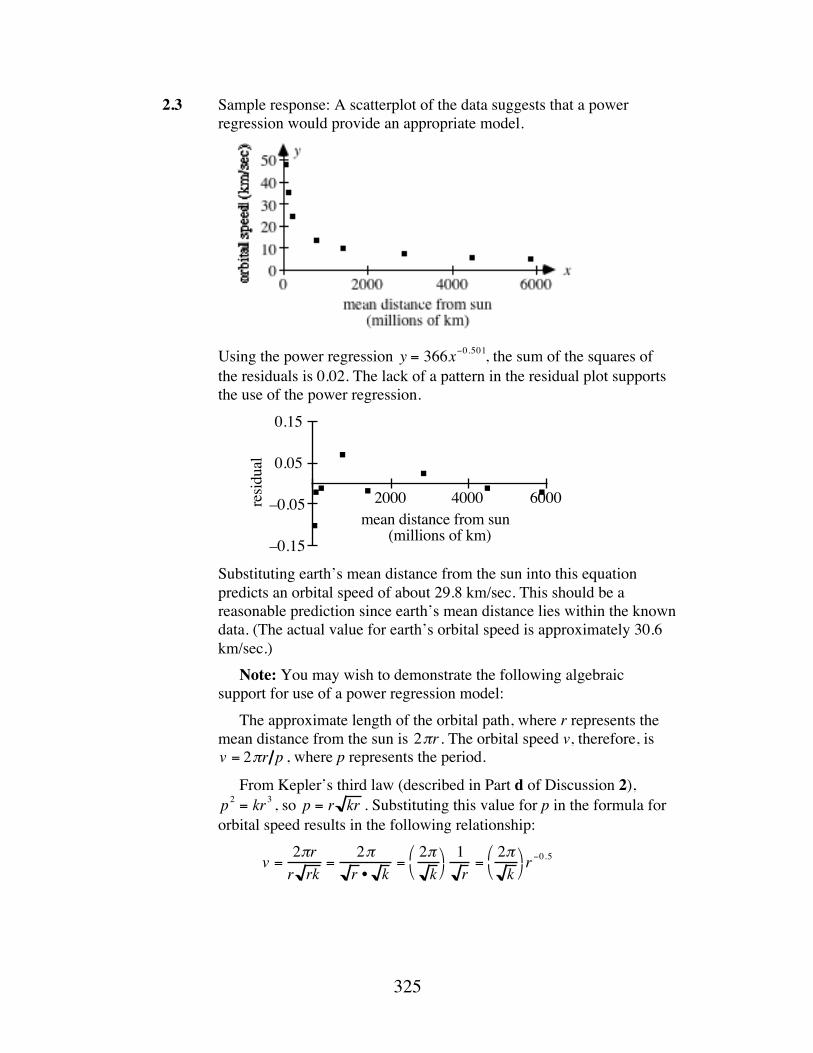
325
2.3 Sample response: A scatterplot of the data suggests that a power regression would provide an appropriate model.
Using the power regression y = 366x−0.501, the sum of the squares of
the residuals is 0.02. The lack of a pattern in the residual plot supports the use of the power regression.
Substituting earth’s mean distance from the sun into this equation
predicts an orbital speed of about 29.8 km/sec. This should be a reasonable prediction since earth’s mean distance lies within the known data. (The actual value for earth’s orbital speed is approximately 30.6 km/sec.)
Note: You may wish to demonstrate the following algebraic support for use of a power regression model:
The approximate length of the orbital path, where r represents the mean distance from the sun is 2πr . The orbital speed v, therefore, is v = 2πr p , where p represents the period.
From Kepler’s third law (described in Part d of Discussion 2), p2 = kr3 , so p = r kr . Substituting this value for p in the formula for orbital speed results in the following relationship:
v =2πrr rk
=2πr • k
=2πk
⎛ ⎝
⎞ ⎠ 1r
=2πk
⎛ ⎝
⎞ ⎠ r −0.5
6000
–0.15
–0.05
0.05
0.15
2000 4000mean distance from sun (millions of km)
resid
ual
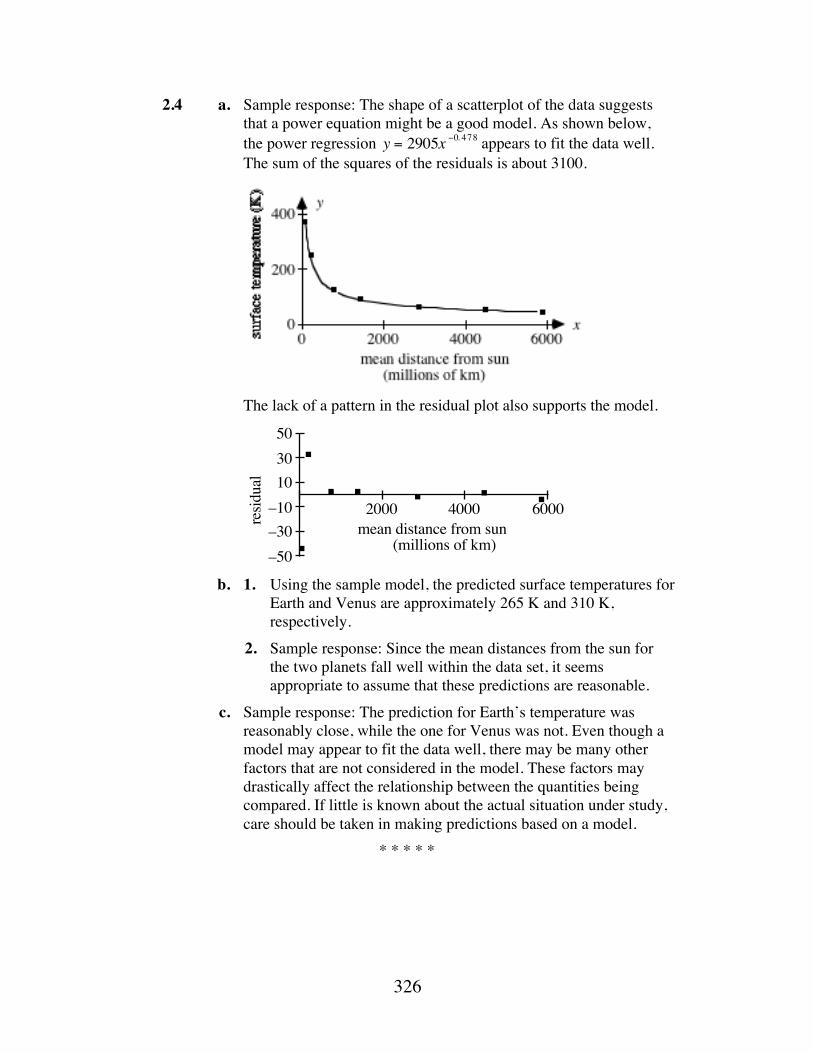
326
2.4 a. Sample response: The shape of a scatterplot of the data suggests that a power equation might be a good model. As shown below, the power regression y = 2905x −0. 478 appears to fit the data well. The sum of the squares of the residuals is about 3100.
The lack of a pattern in the residual plot also supports the model.
b. 1. Using the sample model, the predicted surface temperatures for
Earth and Venus are approximately 265 K and 310 K, respectively.
2. Sample response: Since the mean distances from the sun for the two planets fall well within the data set, it seems appropriate to assume that these predictions are reasonable.
c. Sample response: The prediction for Earth’s temperature was reasonably close, while the one for Venus was not. Even though a model may appear to fit the data well, there may be many other factors that are not considered in the model. These factors may drastically affect the relationship between the quantities being compared. If little is known about the actual situation under study, care should be taken in making predictions based on a model.
* * * * *
–50–30–10103050
2000 4000 6000mean distance from sun (millions of km)
resid
ual
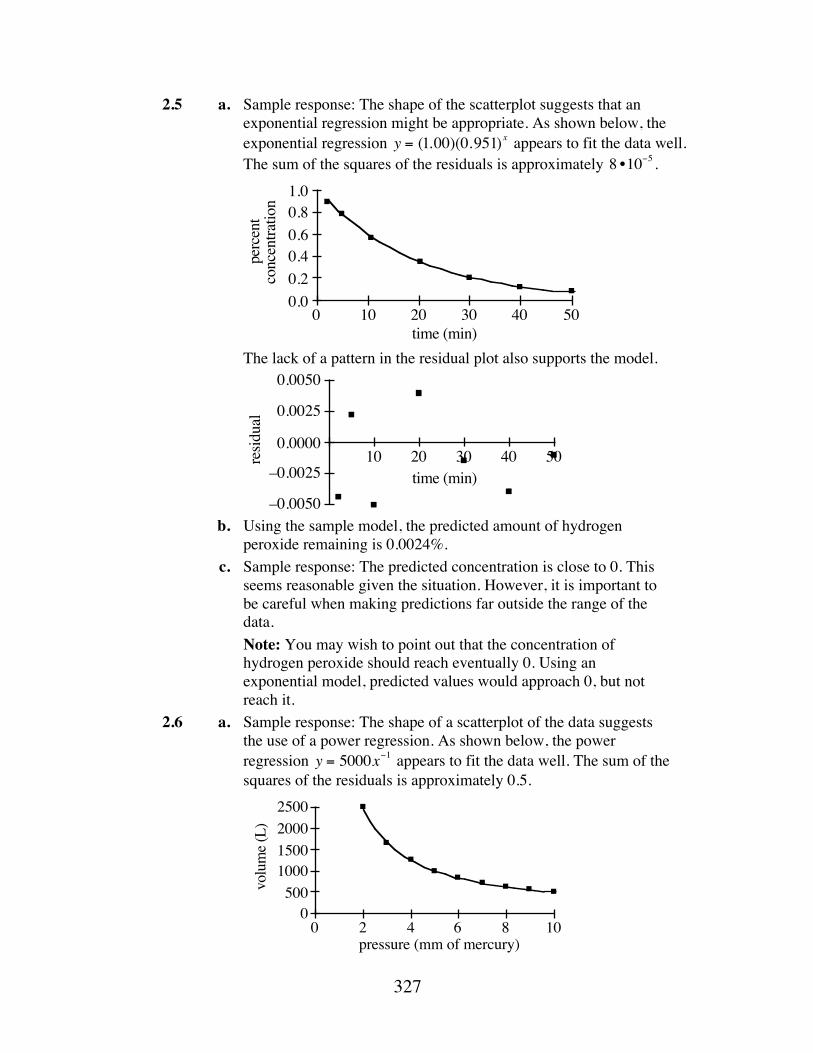
327
2.5 a. Sample response: The shape of the scatterplot suggests that an exponential regression might be appropriate. As shown below, the exponential regression y = (1.00)(0.951) x appears to fit the data well. The sum of the squares of the residuals is approximately 8 •10−5 .
The lack of a pattern in the residual plot also supports the model.
b. Using the sample model, the predicted amount of hydrogen
peroxide remaining is 0.0024%. c. Sample response: The predicted concentration is close to 0. This
seems reasonable given the situation. However, it is important to be careful when making predictions far outside the range of the data.
Note: You may wish to point out that the concentration of hydrogen peroxide should reach eventually 0. Using an exponential model, predicted values would approach 0, but not reach it.
2.6 a. Sample response: The shape of a scatterplot of the data suggests the use of a power regression. As shown below, the power regression y = 5000x−1 appears to fit the data well. The sum of the squares of the residuals is approximately 0.5.
0.00.20.40.60.8
0 10 20 30 40 50time (min)
1.0
perc
ent
conc
entra
tion
5030
–0.0050
–0.0025
0.0025
0.0050
10 20 40time (min)
0.0000
resid
ual
0500
1000150020002500
0 2 4 6 8 10pressure (mm of mercury)
volu
me (
L)
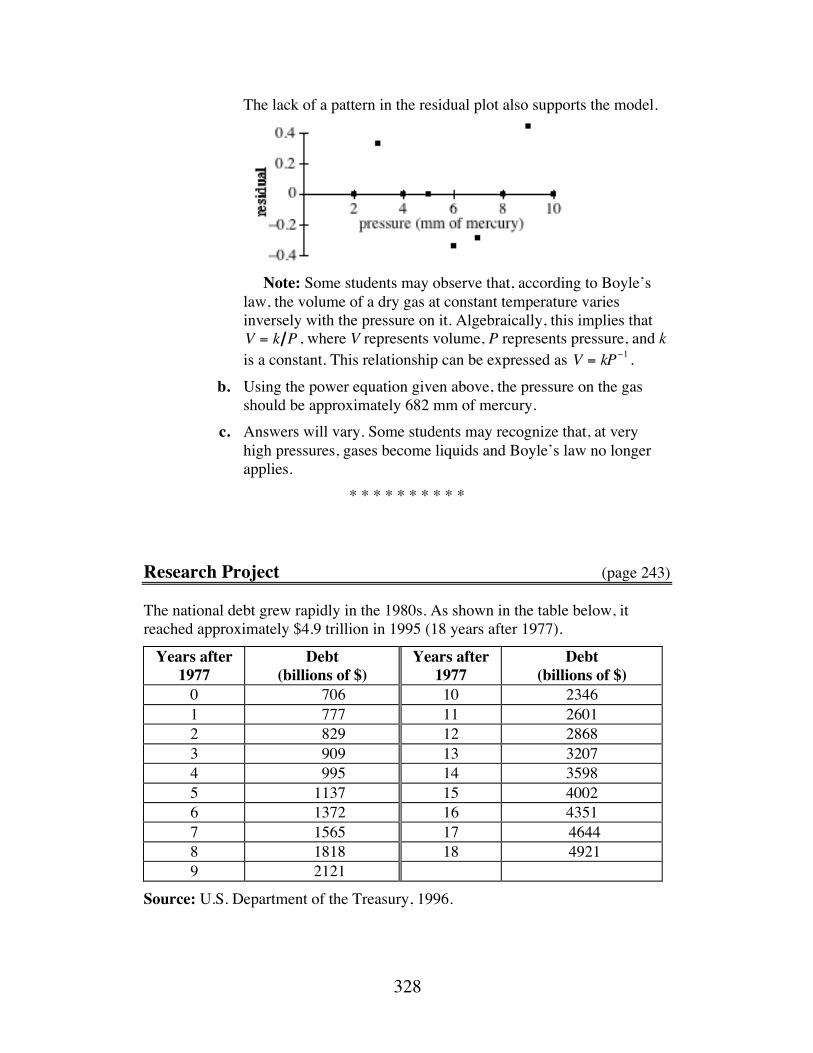
328
The lack of a pattern in the residual plot also supports the model.
Note: Some students may observe that, according to Boyle’s
law, the volume of a dry gas at constant temperature varies inversely with the pressure on it. Algebraically, this implies that V = k P , where V represents volume, P represents pressure, and k is a constant. This relationship can be expressed as V = kP−1 .
b. Using the power equation given above, the pressure on the gas should be approximately 682 mm of mercury.
c. Answers will vary. Some students may recognize that, at very high pressures, gases become liquids and Boyle’s law no longer applies.
* * * * * * * * * *
Research Project (page 243) The national debt grew rapidly in the 1980s. As shown in the table below, it reached approximately $4.9 trillion in 1995 (18 years after 1977).
Years after 1977
Debt (billions of $)
Years after 1977
Debt (billions of $)
0 706 10 2346 1 777 11 2601 2 829 12 2868 3 909 13 3207 4 995 14 3598 5 1137 15 4002 6 1372 16 4351 7 1565 17 4644 8 1818 18 4921 9 2121
Source: U.S. Department of the Treasury, 1996.
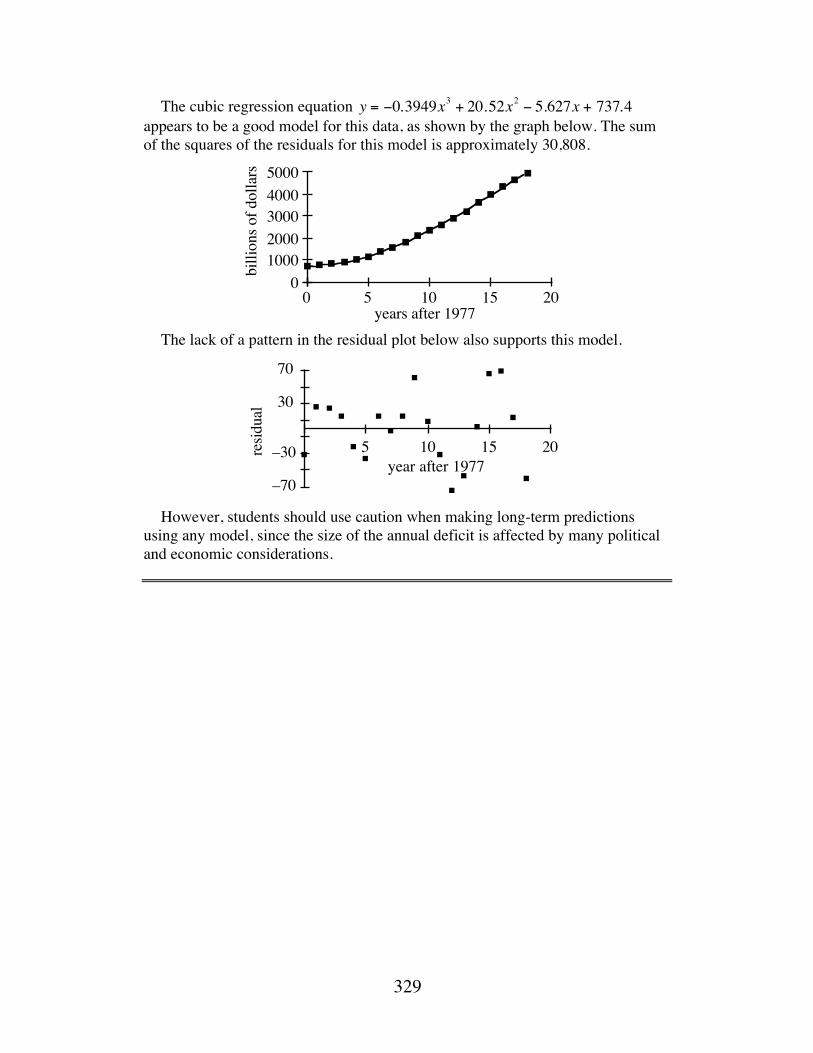
329
The cubic regression equation y = −0.3949x3 + 20.52x2 − 5.627x + 737.4 appears to be a good model for this data, as shown by the graph below. The sum of the squares of the residuals for this model is approximately 30,808.
The lack of a pattern in the residual plot below also supports this model.
However, students should use caution when making long-term predictions using any model, since the size of the annual deficit is affected by many political and economic considerations.
010002000300040005000
0 5 10 15 20years after 1977
billi
ons o
f dol
lars
–70
–30
30
70
5 10 15 20residual
year after 1977
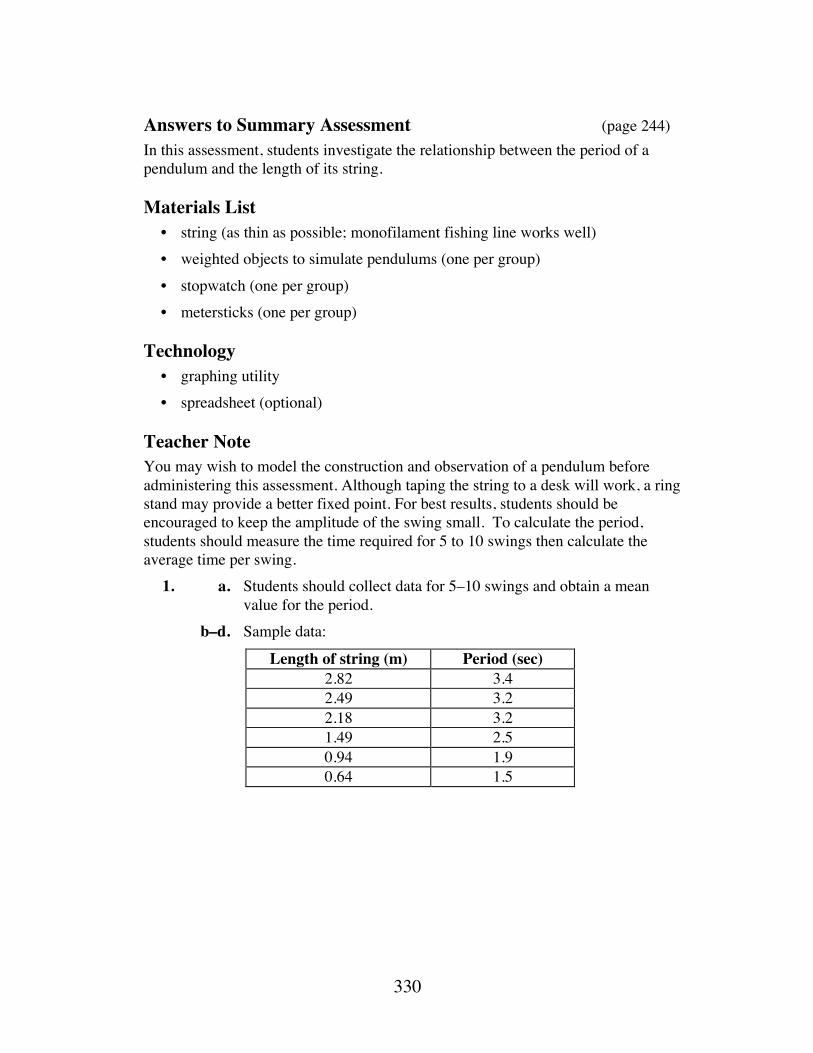
330
Answers to Summary Assessment (page 244) In this assessment, students investigate the relationship between the period of a pendulum and the length of its string.
Materials List • string (as thin as possible; monofilament fishing line works well) • weighted objects to simulate pendulums (one per group) • stopwatch (one per group) • metersticks (one per group)
Technology • graphing utility • spreadsheet (optional)
Teacher Note You may wish to model the construction and observation of a pendulum before administering this assessment. Although taping the string to a desk will work, a ring stand may provide a better fixed point. For best results, students should be encouraged to keep the amplitude of the swing small. To calculate the period, students should measure the time required for 5 to 10 swings then calculate the average time per swing. 1. a. Students should collect data for 5–10 swings and obtain a mean
value for the period. b–d. Sample data:
Length of string (m) Period (sec) 2.82 3.4 2.49 3.2 2.18 3.2 1.49 2.5 0.94 1.9 0.64 1.5
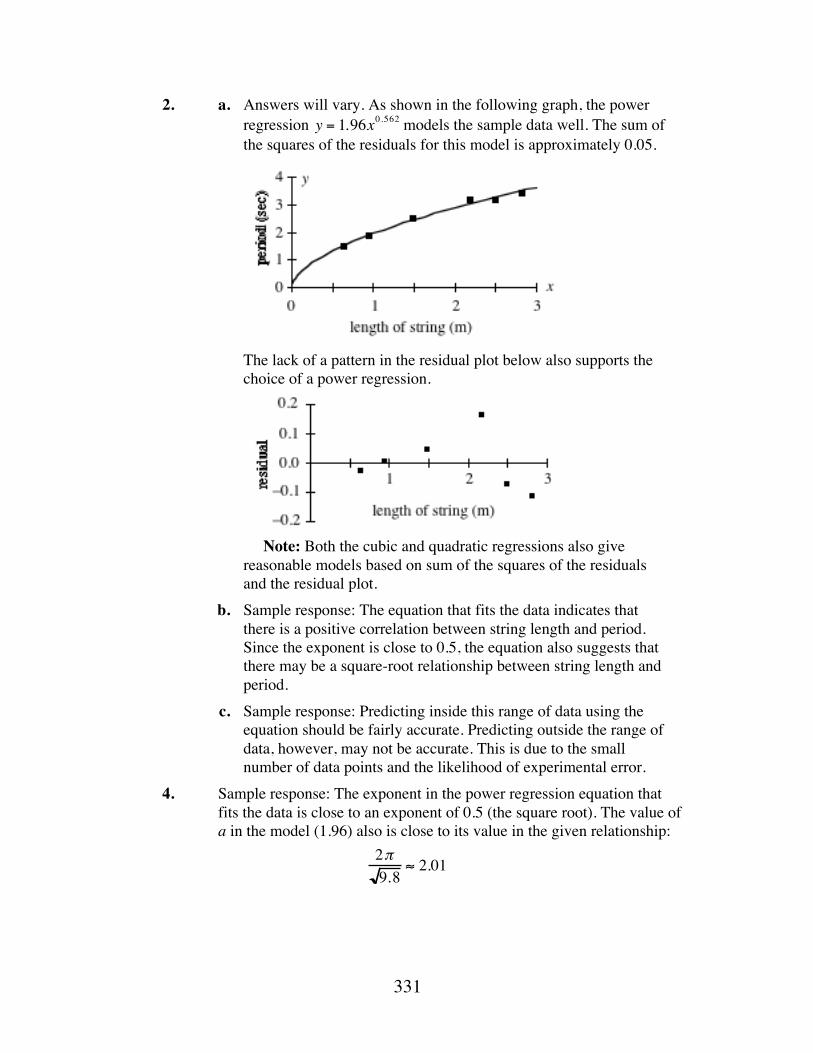
331
2. a. Answers will vary. As shown in the following graph, the power regression y = 1.96x0.562 models the sample data well. The sum of the squares of the residuals for this model is approximately 0.05.
The lack of a pattern in the residual plot below also supports the
choice of a power regression.
Note: Both the cubic and quadratic regressions also give
reasonable models based on sum of the squares of the residuals and the residual plot.
b. Sample response: The equation that fits the data indicates that there is a positive correlation between string length and period. Since the exponent is close to 0.5, the equation also suggests that there may be a square-root relationship between string length and period.
c. Sample response: Predicting inside this range of data using the equation should be fairly accurate. Predicting outside the range of data, however, may not be accurate. This is due to the small number of data points and the likelihood of experimental error.
4. Sample response: The exponent in the power regression equation that fits the data is close to an exponent of 0.5 (the square root). The value of a in the model (1.96) also is close to its value in the given relationship:
2π9.8
≈ 2.01
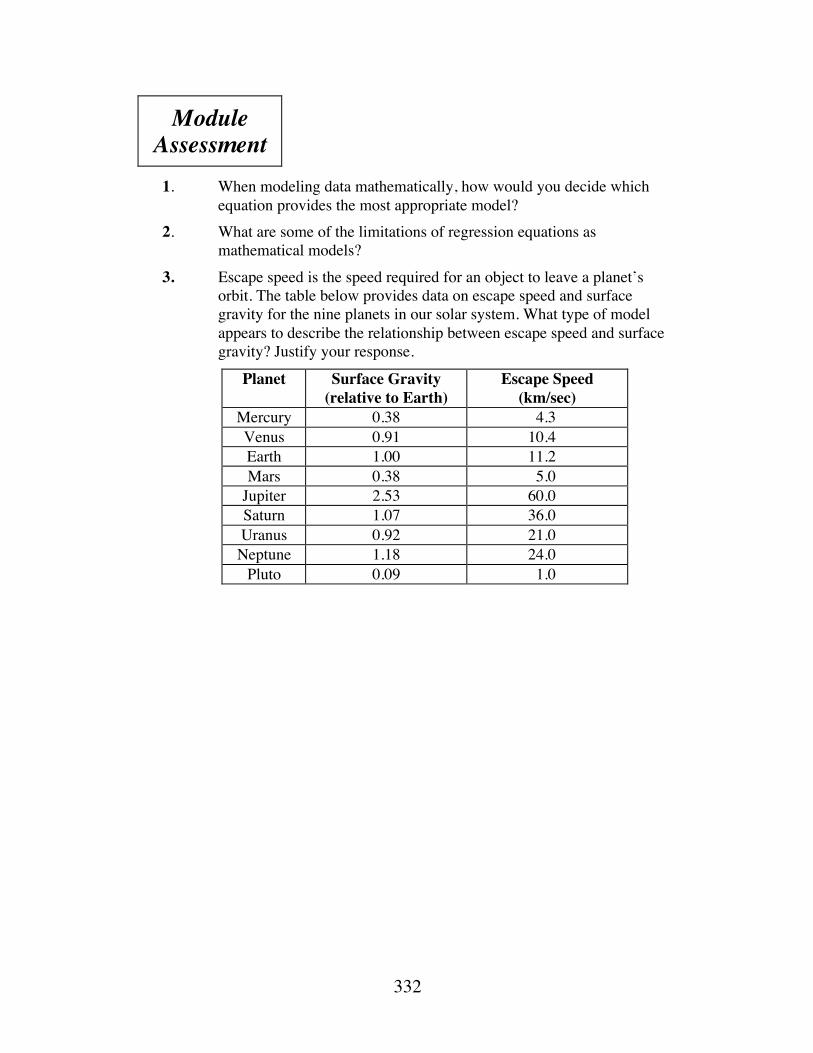
332
Module Assessment
1. When modeling data mathematically, how would you decide which
equation provides the most appropriate model? 2. What are some of the limitations of regression equations as
mathematical models? 3. Escape speed is the speed required for an object to leave a planet’s
orbit. The table below provides data on escape speed and surface gravity for the nine planets in our solar system. What type of model appears to describe the relationship between escape speed and surface gravity? Justify your response.
Planet Surface Gravity (relative to Earth)
Escape Speed (km/sec)
Mercury 0.38 4.3 Venus 0.91 10.4 Earth 1.00 11.2 Mars 0.38 5.0
Jupiter 2.53 60.0 Saturn 1.07 36.0 Uranus 0.92 21.0 Neptune 1.18 24.0
Pluto 0.09 1.0
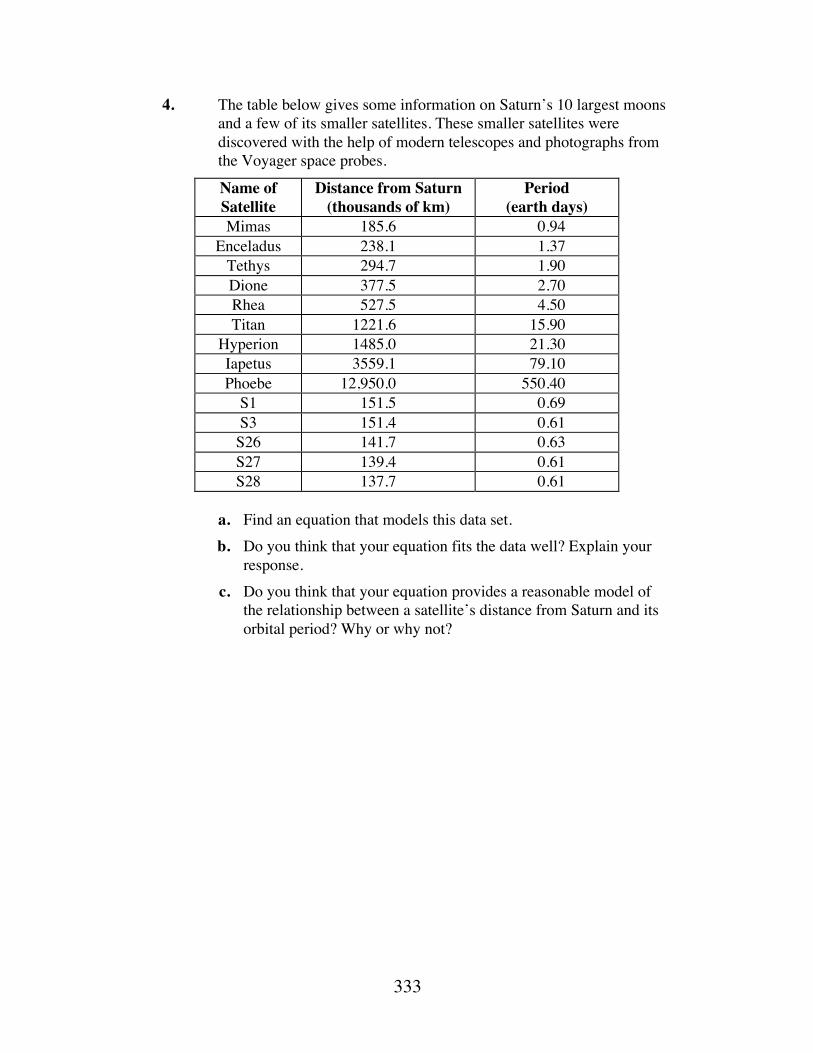
333
4. The table below gives some information on Saturn’s 10 largest moons and a few of its smaller satellites. These smaller satellites were discovered with the help of modern telescopes and photographs from the Voyager space probes.
Name of Satellite
Distance from Saturn (thousands of km)
Period (earth days)
Mimas 185.6 0.94 Enceladus 238.1 1.37
Tethys 294.7 1.90 Dione 377.5 2.70 Rhea 527.5 4.50 Titan 1221.6 15.90
Hyperion 1485.0 21.30 Iapetus 3559.1 79.10 Phoebe 12,950.0 550.40
S1 151.5 0.69 S3 151.4 0.61 S26 141.7 0.63 S27 139.4 0.61 S28 137.7 0.61
a. Find an equation that models this data set. b. Do you think that your equation fits the data well? Explain your
response. c. Do you think that your equation provides a reasonable model of
the relationship between a satellite’s distance from Saturn and its orbital period? Why or why not?
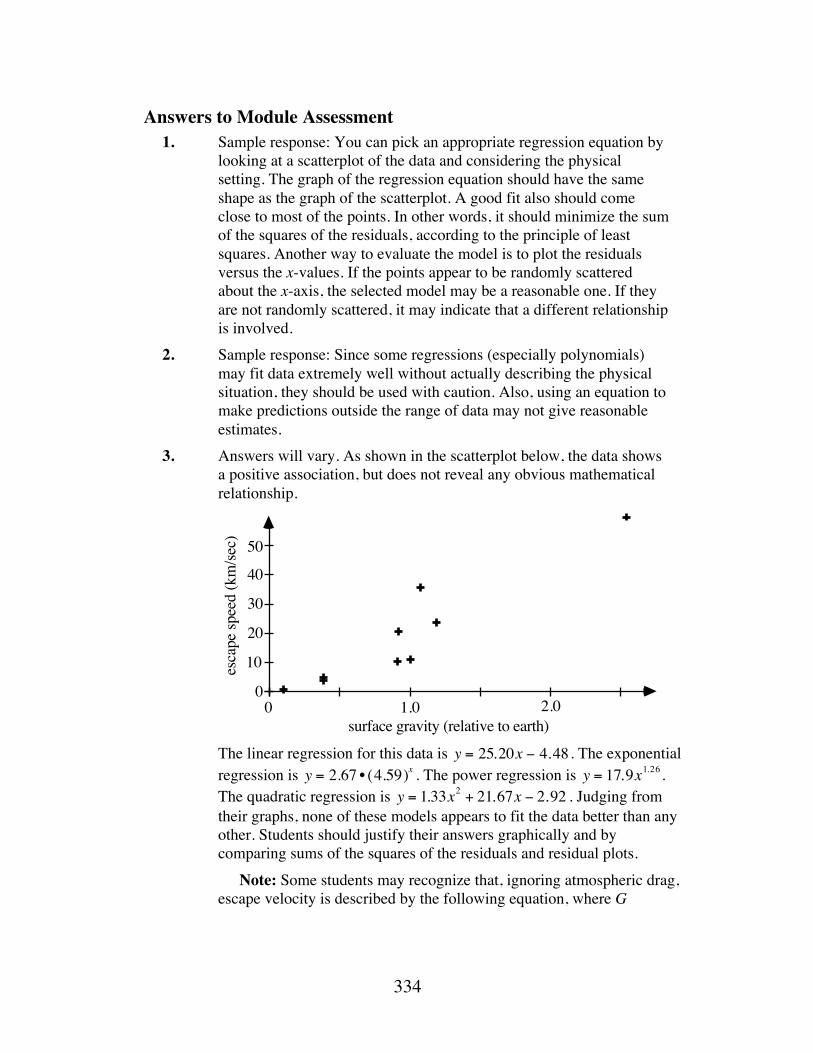
334
Answers to Module Assessment 1. Sample response: You can pick an appropriate regression equation by
looking at a scatterplot of the data and considering the physical setting. The graph of the regression equation should have the same shape as the graph of the scatterplot. A good fit also should come close to most of the points. In other words, it should minimize the sum of the squares of the residuals, according to the principle of least squares. Another way to evaluate the model is to plot the residuals versus the x-values. If the points appear to be randomly scattered about the x-axis, the selected model may be a reasonable one. If they are not randomly scattered, it may indicate that a different relationship is involved.
2. Sample response: Since some regressions (especially polynomials) may fit data extremely well without actually describing the physical situation, they should be used with caution. Also, using an equation to make predictions outside the range of data may not give reasonable estimates.
3. Answers will vary. As shown in the scatterplot below, the data shows a positive association, but does not reveal any obvious mathematical relationship.
The linear regression for this data is y = 25.20x − 4.48 . The exponential
regression is y = 2.67 • (4.59)x . The power regression is y = 17.9x1.26 . The quadratic regression is y = 1.33x2 + 21.67x − 2.92 . Judging from their graphs, none of these models appears to fit the data better than any other. Students should justify their answers graphically and by comparing sums of the squares of the residuals and residual plots.
Note: Some students may recognize that, ignoring atmospheric drag, escape velocity is described by the following equation, where G
10
20
30
40
50
00 1.0 2.0
surface gravity (relative to earth)
esca
pe sp
eed
(km
/sec)
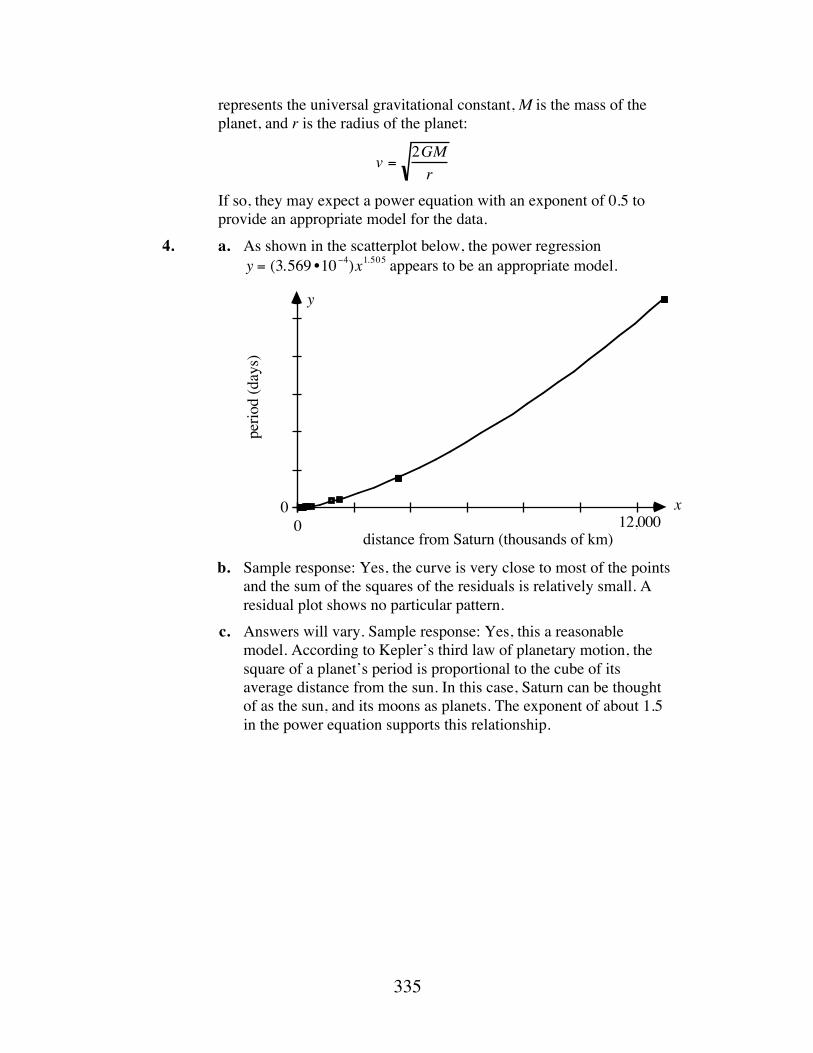
335
represents the universal gravitational constant, M is the mass of the planet, and r is the radius of the planet:
v =2GMr
If so, they may expect a power equation with an exponent of 0.5 to provide an appropriate model for the data.
4. a. As shown in the scatterplot below, the power regression y = (3.569 •10−4)x1.505 appears to be an appropriate model.
b. Sample response: Yes, the curve is very close to most of the points
and the sum of the squares of the residuals is relatively small. A residual plot shows no particular pattern.
c. Answers will vary. Sample response: Yes, this a reasonable model. According to Kepler’s third law of planetary motion, the square of a planet’s period is proportional to the cube of its average distance from the sun. In this case, Saturn can be thought of as the sun, and its moons as planets. The exponent of about 1.5 in the power equation supports this relationship.
00 12,000
distance from Saturn (thousands of km)
y
x
perio
d (d
ays)
336
Selected References Acker, A., and C. Jaschek. Astronomical Methods and Calculations. Chichester,
UK: John Wiley & Sons, 1986. Gates, T. “How Do Planets Stay in Orbit?” Lecture presented at the National
Council of Teachers of Mathematics (NCTM) Convention in Seattle, WA. March 31–April 3, 1993.
Littmann, M. Planets Beyond: Discovering the Outer Solar System. New York: John Wiley & Sons, 1990.
Moore, P., and G. Hunt. Atlas of the Solar System. Chicago, IL: Rand McNally & Co., 1983.
Reimer, W., and L. Reimer. Historical Connections in Mathematics: Resources for Using History of Mathematics in the Classroom. Fresno, CA: AIMS Educational Foundation, 1992.
U.S. Bureau of the Census. Statistical Abstract of the United States: 1995. Washington, DC: U.S. Government Printing Office, 1995.
Wheeler, J. A. A Journey into Gravity and Spacetime. Scientific American Library. New York: W. H. Freeman and Co., 1990.
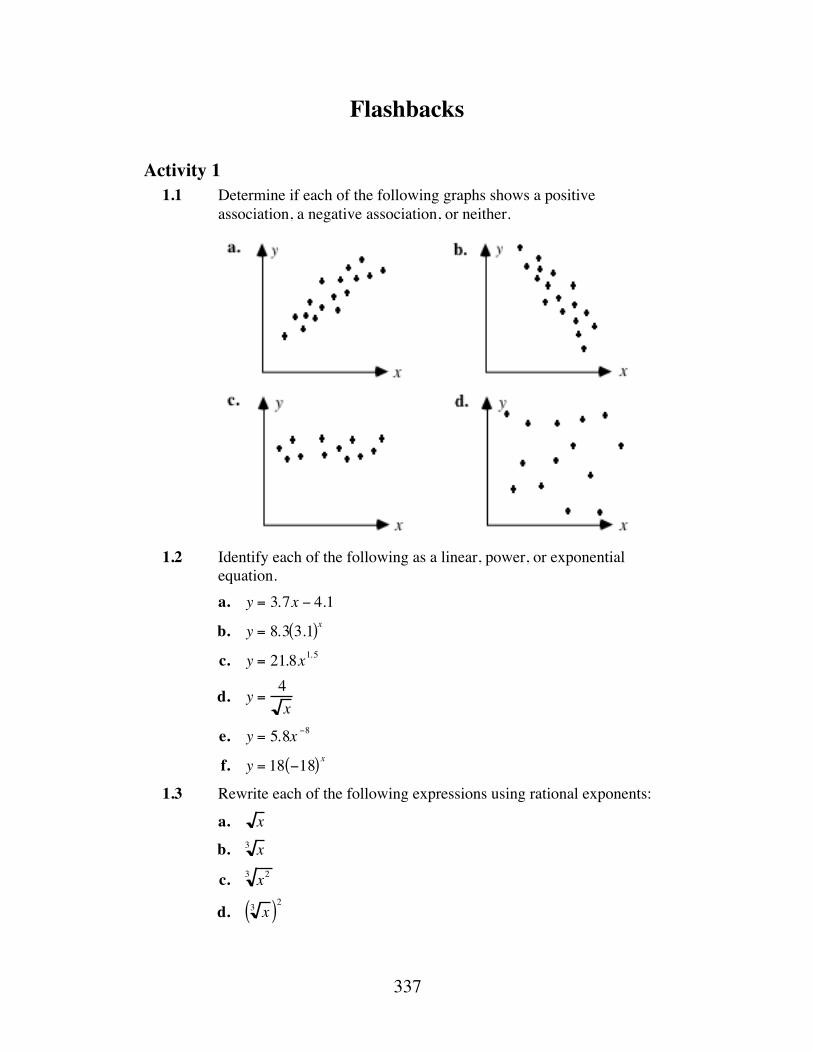
337
Flashbacks
Activity 1 1.1 Determine if each of the following graphs shows a positive
association, a negative association, or neither.
1.2 Identify each of the following as a linear, power, or exponential
equation. a. y = 3.7x − 4.1
b. y = 8.3 3.1( )x
c. y = 21.8x1.5
d. y =4x
e. y = 5.8x −8
f. y = 18 −18( ) x
1.3 Rewrite each of the following expressions using rational exponents:
a. x
b. x3
c. x23
d. x3( )2
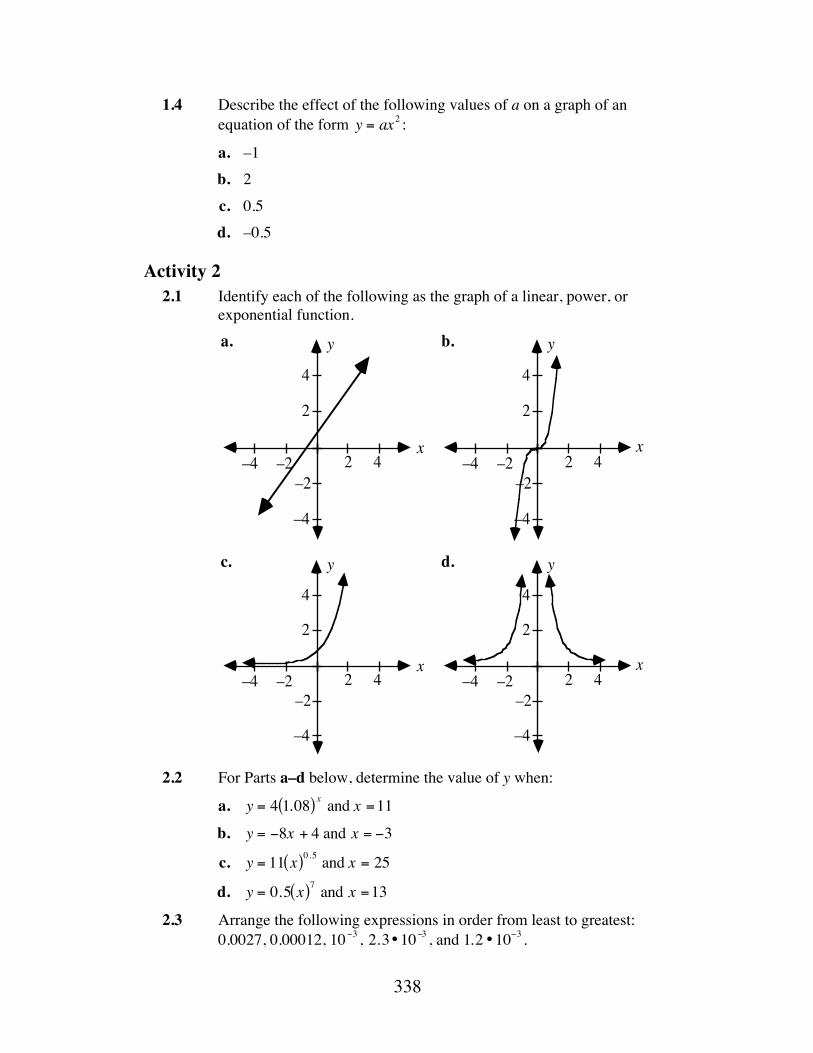
338
1.4 Describe the effect of the following values of a on a graph of an equation of the form y = ax2 :
a. –1 b. 2 c. 0.5 d. –0.5
Activity 2 2.1 Identify each of the following as the graph of a linear, power, or
exponential function.
2.2 For Parts a–d below, determine the value of y when:
a. y = 4 1.08( ) x and x =11
b. y = −8x + 4 and x = −3
c. y = 11 x( )0.5 and x = 25
d. y = 0.5 x( )7 and x =13
2.3 Arrange the following expressions in order from least to greatest: 0.0027, 0.00012, 10−3 , 2.3•10−3 , and 1.2 •10−3 .
x
y
2
4
2 4–2–4–2
–4
a.
x
y
2
4
2 4–2–4–2
–4
b.
x
y
2
4
2 4–2–4–2
–4
c.
x
y
2
4
2 4–2–4–2
–4
d.
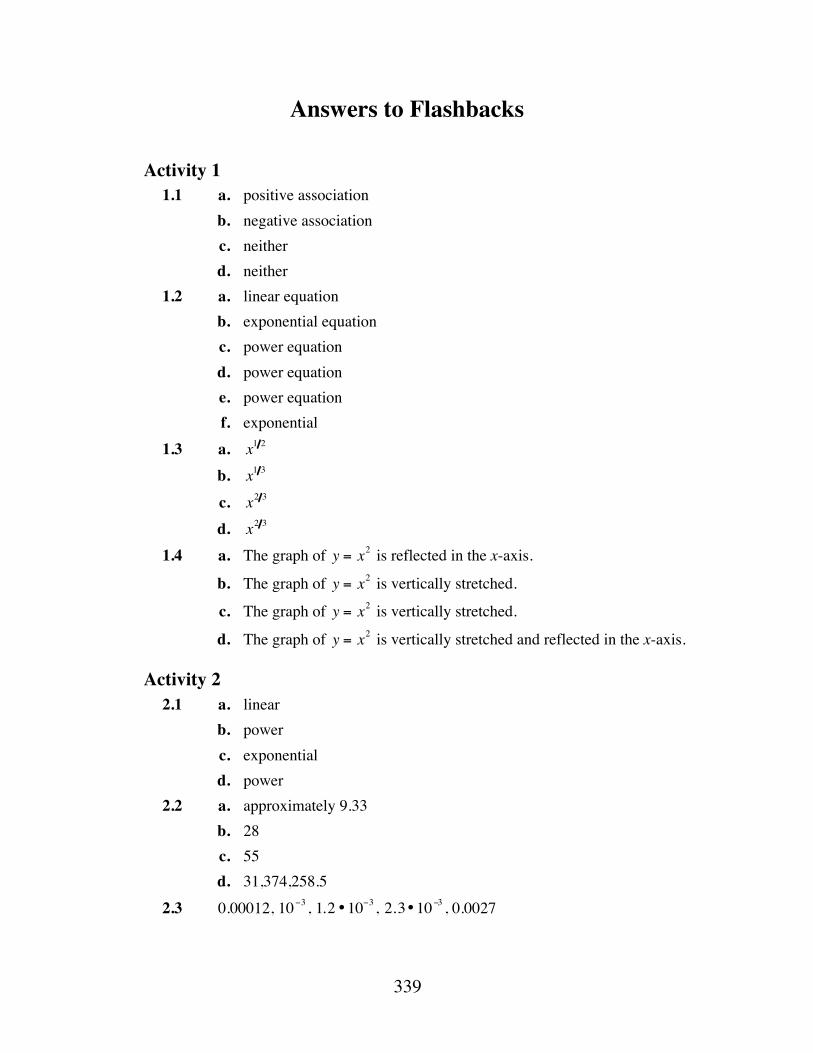
339
Answers to Flashbacks
Activity 1 1.1 a. positive association b. negative association c. neither d. neither 1.2 a. linear equation b. exponential equation c. power equation d. power equation e. power equation f. exponential 1.3 a. x1 2 b. x1 3 c. x2 3 d. x2 3 1.4 a. The graph of y = x2 is reflected in the x-axis.
b. The graph of y = x2 is vertically stretched.
c. The graph of y = x2 is vertically stretched.
d. The graph of y = x2 is vertically stretched and reflected in the x-axis.
Activity 2 2.1 a. linear b. power c. exponential d. power 2.2 a. approximately 9.33 b. 28 c. 55 d. 31,374,258.5 2.3 0.00012, 10−3 , 1.2 •10−3 , 2.3•10−3 , 0.0027


Our Town
In this module, you use one community’s bridges and traffic patterns to explore the applications of graph theory to city planning.
Masha Albrecht • Patricia Bean • Peter Rasmussen
343
Teacher Edition Our Town
Overview Students use city-planning problems to explore some introductory concepts in graph theory. In this context, a graph is a set of vertices connected by one or more edges.
Objectives In this module, students will: • organize information using graphs • use graphs and digraphs to model real-world situations • identify and create traversable graphs • use matrices to analyze graphs.
Prerequisites For this module, students should know: • the definitions of a graph, a path, and a circuit • how to identify a Hamiltonian circuit • how to multiply matrices.
Time Line Activity 1 2 3 Summary
Assessment Total
Days 2 2 2 2 10
Materials Required Materials Activity
1 2 3 Summary Assessment
colored pencils X X X template of Figure 9 X template of Figure 10 X

344
Teacher Note Blackline masters of Figures 9 and 10 appear at the end of the teacher edition FOR THIS MODULE.
Technology Software Activity
1 2 3 Summary Assessment
matrix manipulator X X
345
Our Town
Introduction (page 251) The problem of the bridges of Königsberg was not examined from a mathematical perspective until Leonhard Euler tackled it in 1736. In a paper published that year, Euler proved that it was not possible to devise a route that crosses each of the seven bridges exactly once and returns to some starting point. Today, Euler is considered the father of graph theory. Graph theory has become an important modeling tool in many different fields, including biology, psychology, economics, city planning, and computer science. (page 251)
Activity 1 Students explore some basic concepts of graph theory in the context of shaking hands at a town meeting.
Materials List • colored pencils (optional)
Teacher Note Students may find colored pencils helpful in organizing their graphs. You may wish to conduct Parts a and b of the exploration as a class demonstration.
Exploration (page 252) a. 1 handshake b. 3 handshakes c. 1. 6 handshakes 2. 10 handshakes 3. 15 handshakes 4. 21 handshakes 5. 45 handshakes
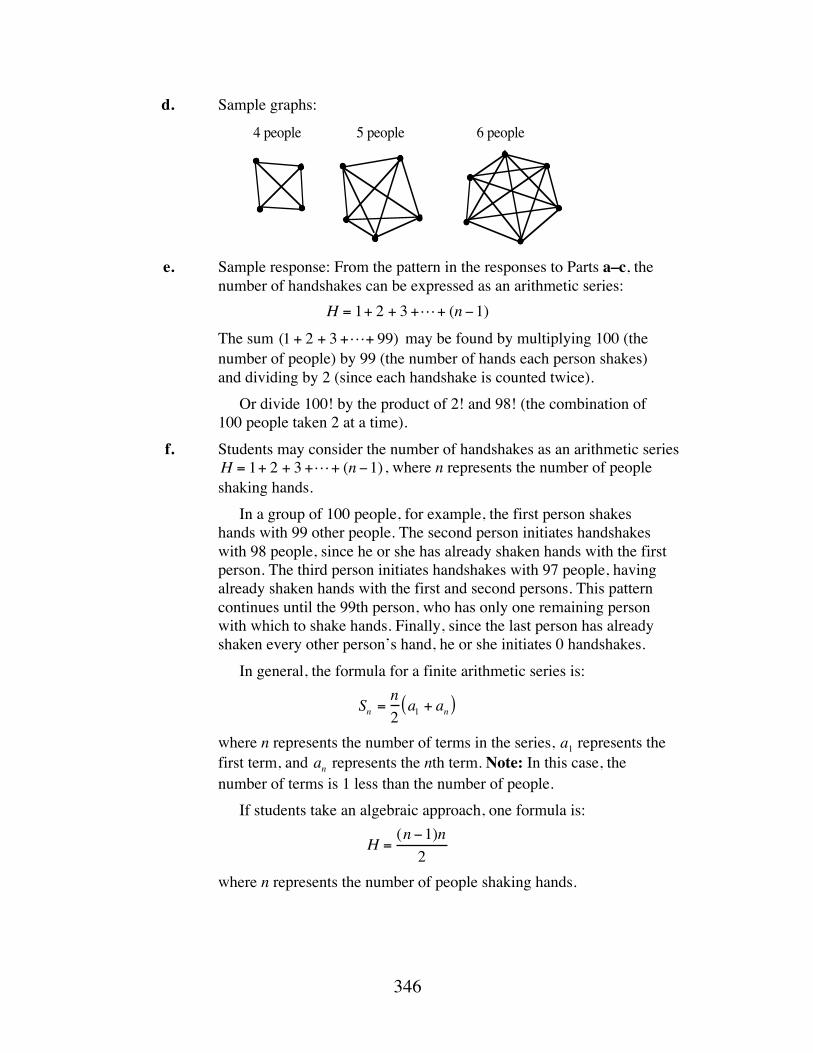
346
d. Sample graphs:
e. Sample response: From the pattern in the responses to Parts a–c, the
number of handshakes can be expressed as an arithmetic series:
H = 1+ 2 + 3 +!+ (n −1)
The sum (1 + 2 + 3 +!+ 99) may be found by multiplying 100 (the number of people) by 99 (the number of hands each person shakes) and dividing by 2 (since each handshake is counted twice).
Or divide 100! by the product of 2! and 98! (the combination of 100 people taken 2 at a time).
f. Students may consider the number of handshakes as an arithmetic series H = 1+ 2 + 3 +!+ (n −1) , where n represents the number of people shaking hands.
In a group of 100 people, for example, the first person shakes hands with 99 other people. The second person initiates handshakes with 98 people, since he or she has already shaken hands with the first person. The third person initiates handshakes with 97 people, having already shaken hands with the first and second persons. This pattern continues until the 99th person, who has only one remaining person with which to shake hands. Finally, since the last person has already shaken every other person’s hand, he or she initiates 0 handshakes.
In general, the formula for a finite arithmetic series is:
Sn =n2a1 + an( )
where n represents the number of terms in the series, a1 represents the first term, and an represents the nth term. Note: In this case, the number of terms is 1 less than the number of people.
If students take an algebraic approach, one formula is:
H =(n −1)n2
where n represents the number of people shaking hands.
•
• •
••
•
••
4 people 5 people 6 people
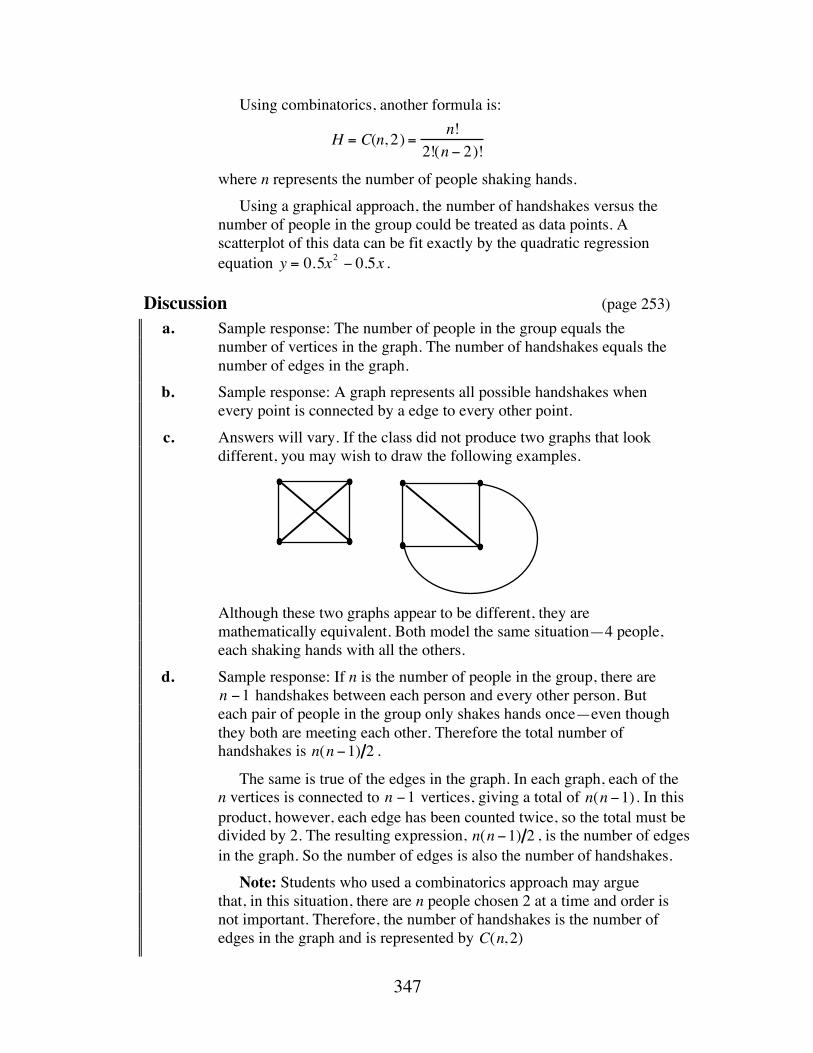
347
Using combinatorics, another formula is:
H = C(n, 2) =n!
2!(n − 2)!
where n represents the number of people shaking hands. Using a graphical approach, the number of handshakes versus the
number of people in the group could be treated as data points. A scatterplot of this data can be fit exactly by the quadratic regression equation y = 0.5x2 − 0.5x .
Discussion (page 253) a. Sample response: The number of people in the group equals the
number of vertices in the graph. The number of handshakes equals the number of edges in the graph.
b. Sample response: A graph represents all possible handshakes when every point is connected by a edge to every other point.
c. Answers will vary. If the class did not produce two graphs that look different, you may wish to draw the following examples.
Although these two graphs appear to be different, they are
mathematically equivalent. Both model the same situation—4 people, each shaking hands with all the others.
d. Sample response: If n is the number of people in the group, there are n −1 handshakes between each person and every other person. But each pair of people in the group only shakes hands once—even though they both are meeting each other. Therefore the total number of handshakes is n(n −1) 2 .
The same is true of the edges in the graph. In each graph, each of the n vertices is connected to n −1 vertices, giving a total of n(n −1). In this product, however, each edge has been counted twice, so the total must be divided by 2. The resulting expression, n(n −1) 2 , is the number of edges in the graph. So the number of edges is also the number of handshakes.
Note: Students who used a combinatorics approach may argue that, in this situation, there are n people chosen 2 at a time and order is not important. Therefore, the number of handshakes is the number of edges in the graph and is represented by C(n, 2)
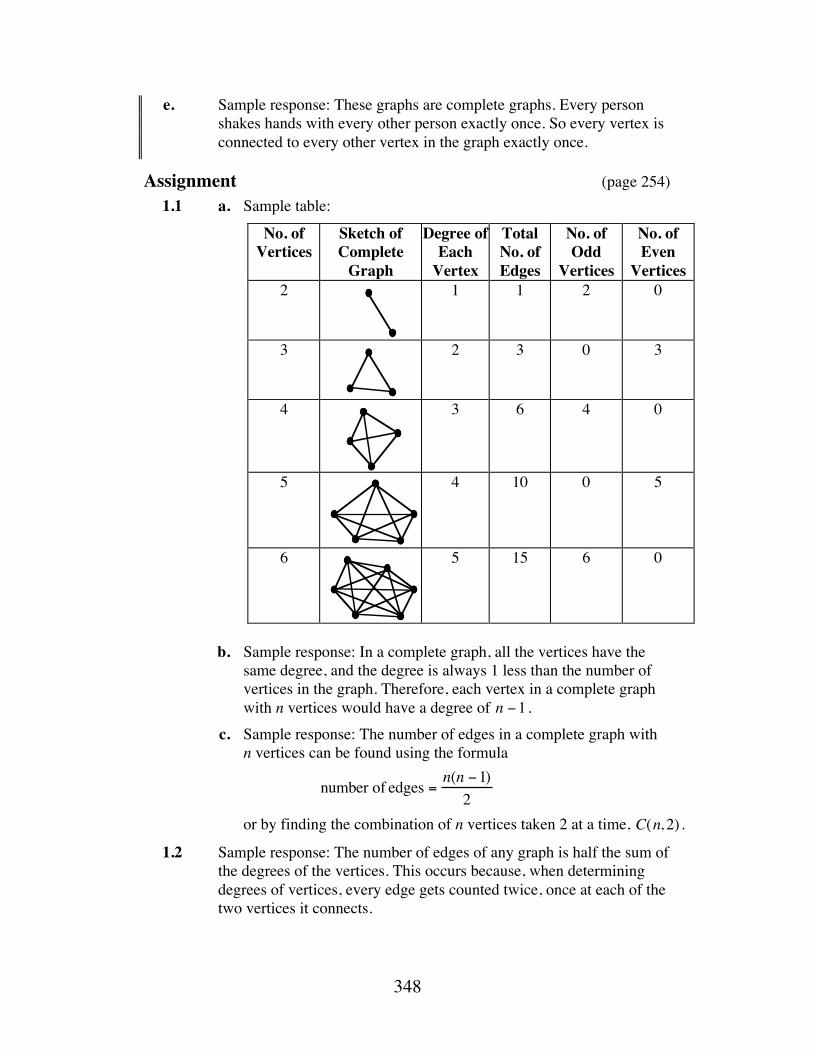
348
e. Sample response: These graphs are complete graphs. Every person shakes hands with every other person exactly once. So every vertex is connected to every other vertex in the graph exactly once.
Assignment (page 254) 1.1 a. Sample table:
No. of Vertices
Sketch of Complete
Graph
Degree of Each
Vertex
Total No. of Edges
No. of Odd
Vertices
No. of Even
Vertices 2
1 1 2 0
3
2 3 0 3
4
3 6 4 0
5
4 10 0 5
6
5 15 6 0
b. Sample response: In a complete graph, all the vertices have the
same degree, and the degree is always 1 less than the number of vertices in the graph. Therefore, each vertex in a complete graph with n vertices would have a degree of n −1 .
c. Sample response: The number of edges in a complete graph with n vertices can be found using the formula
number of edges =n(n −1)2
or by finding the combination of n vertices taken 2 at a time, C(n, 2) .
1.2 Sample response: The number of edges of any graph is half the sum of the degrees of the vertices. This occurs because, when determining degrees of vertices, every edge gets counted twice, once at each of the two vertices it connects.
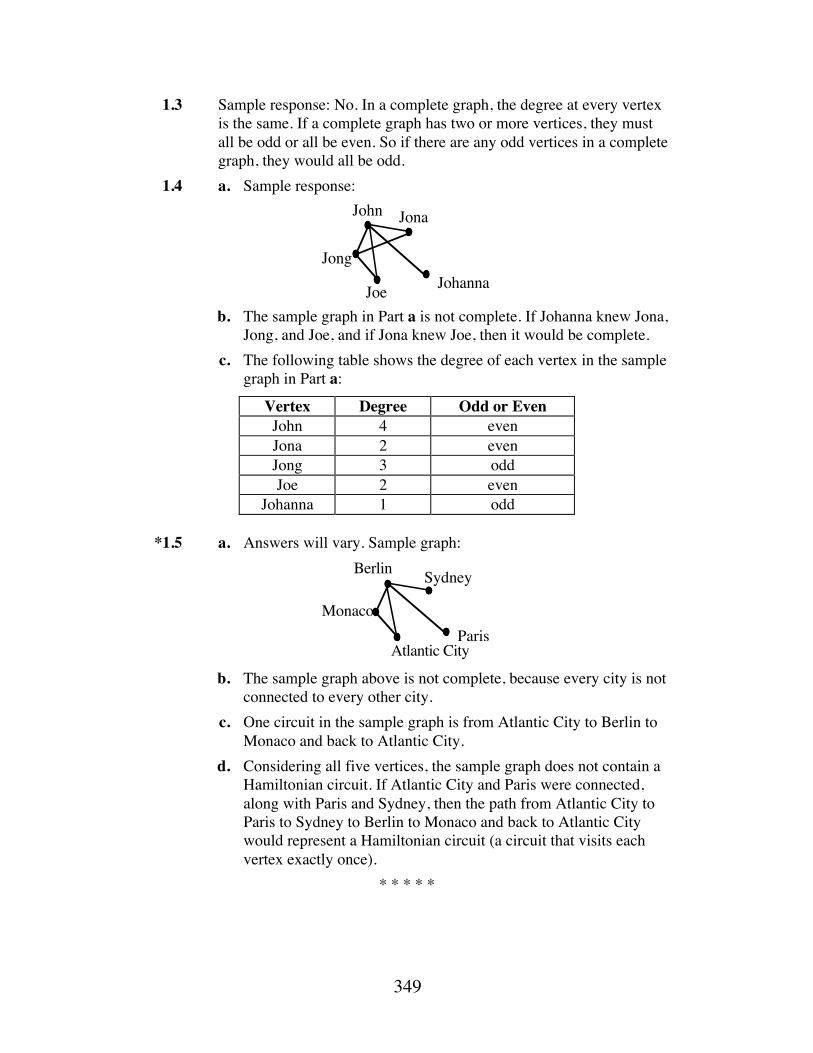
349
1.3 Sample response: No. In a complete graph, the degree at every vertex is the same. If a complete graph has two or more vertices, they must all be odd or all be even. So if there are any odd vertices in a complete graph, they would all be odd.
1.4 a. Sample response:
b. The sample graph in Part a is not complete. If Johanna knew Jona,
Jong, and Joe, and if Jona knew Joe, then it would be complete. c. The following table shows the degree of each vertex in the sample
graph in Part a:
Vertex Degree Odd or Even John 4 even Jona 2 even Jong 3 odd Joe 2 even
Johanna 1 odd *1.5 a. Answers will vary. Sample graph:
b. The sample graph above is not complete, because every city is not
connected to every other city. c. One circuit in the sample graph is from Atlantic City to Berlin to
Monaco and back to Atlantic City. d. Considering all five vertices, the sample graph does not contain a
Hamiltonian circuit. If Atlantic City and Paris were connected, along with Paris and Sydney, then the path from Atlantic City to Paris to Sydney to Berlin to Monaco and back to Atlantic City would represent a Hamiltonian circuit (a circuit that visits each vertex exactly once).
* * * * *
John Jona
Joe
JongJohanna
ParisMonaco
Atlantic City
SydneyBerlin
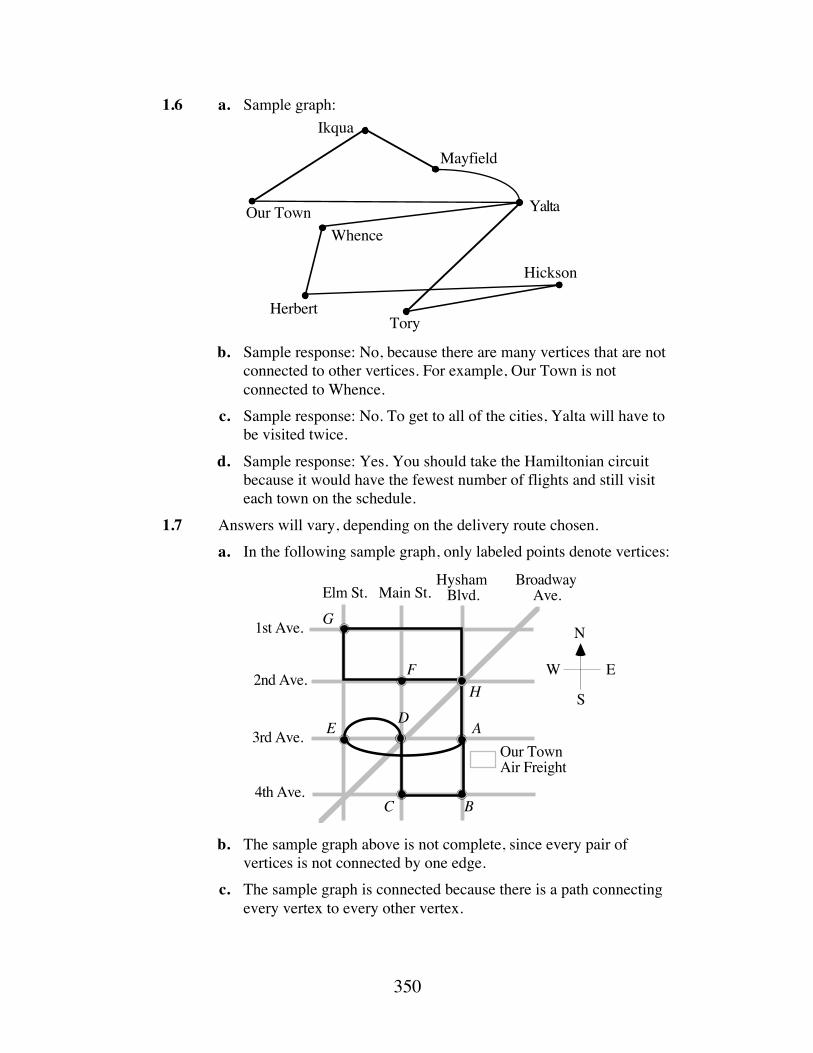
350
1.6 a. Sample graph:
b. Sample response: No, because there are many vertices that are not
connected to other vertices. For example, Our Town is not connected to Whence.
c. Sample response: No. To get to all of the cities, Yalta will have to be visited twice.
d. Sample response: Yes. You should take the Hamiltonian circuit because it would have the fewest number of flights and still visit each town on the schedule.
1.7 Answers will vary, depending on the delivery route chosen. a. In the following sample graph, only labeled points denote vertices:
b. The sample graph above is not complete, since every pair of
vertices is not connected by one edge. c. The sample graph is connected because there is a path connecting
every vertex to every other vertex.
Ikqua
Mayfield
Yalta
Hickson
ToryHerbert
WhenceOur Town
Broadway Ave.
Hysham Blvd.Main St.Elm St.
1st Ave.
2nd Ave.
3rd Ave.
4th Ave.
Our TownAir Freight
G
F
A
BC
DE
H
N
S
W E
351
d. One efficient route on the sample graph in Part a is A-E-D-C-B-A-H-F-G-H-A. This route is as close to a Hamiltonian circuit as possible, given the time constraints in the delivery list (namely, the 11:00 A.M. stop at 3rd & Hysham).
e. Sample response: No, because the delivery route must go through A (the corner of 3rd & Hysham) more than once during the circuit.
1.8 a. Sample response: This is not true. Unless the polygon is a triangle, not all of the vertices are connected by edges.
b. Sample response: This is true, because the vertex of a polygon is the intersection of two edges by definition.
c. Sample response: This is true, because you can start at any vertex and trace around the edges until you return to the starting point, passing through each vertex exactly once.
* * * * * * * * * *
Research Project (page 257) The Irish mathematician Sir William Rowan Hamilton also made important contributions to the study of algebra, physics, and astronomy. Late in his career, he developed a wooden puzzle shaped like a regular dodecahedron in which each of the 20 vertices represented a well-known city. The object of the puzzle was to find a route that visited each city exactly once before returning to the starting point. Although it can be shown that all complete graphs contain a Hamiltonian circuit, there are no simple algorithms for finding all the Hamiltonian circuits in a graph. (This problem is frequently referred to as the “traveling salesman” problem.)
(page 258)
Activity 2 Students investigate traversable graphs.
Materials List • colored pencils (optional) • template for Figure 9 (a blackline master appears at the end of the teacher
edition for this module)
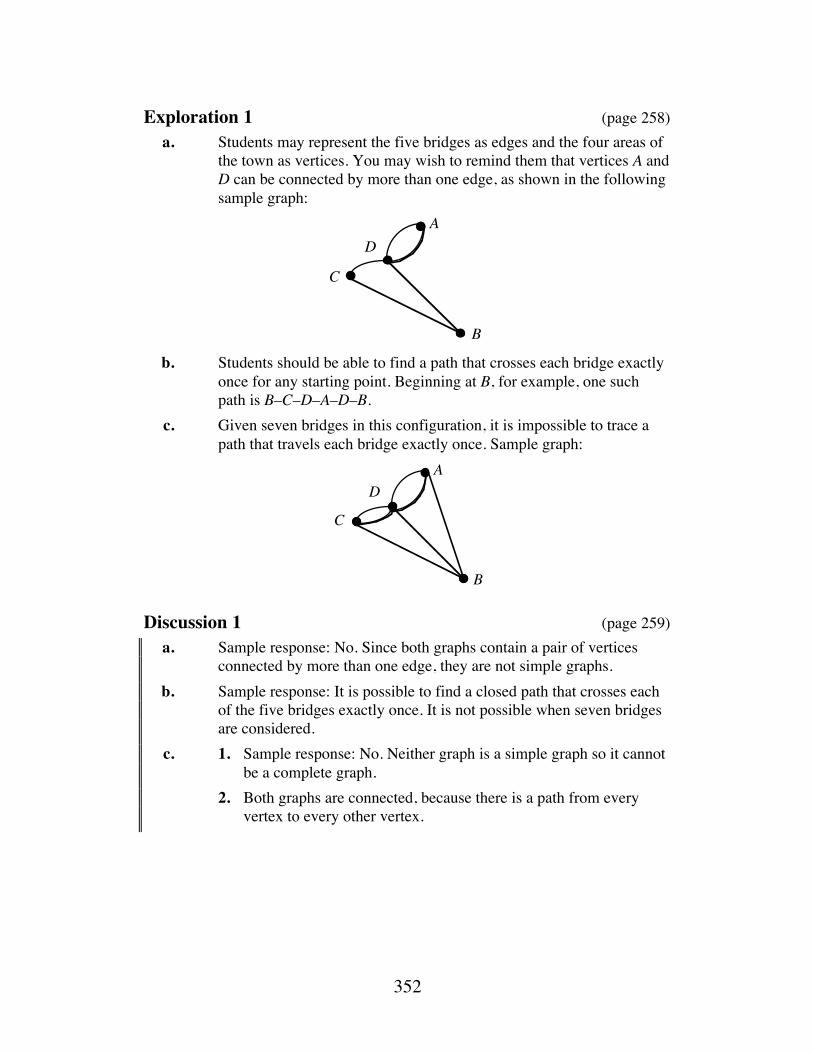
352
Exploration 1 (page 258) a. Students may represent the five bridges as edges and the four areas of
the town as vertices. You may wish to remind them that vertices A and D can be connected by more than one edge, as shown in the following sample graph:
b. Students should be able to find a path that crosses each bridge exactly
once for any starting point. Beginning at B, for example, one such path is B–C–D–A–D–B.
c. Given seven bridges in this configuration, it is impossible to trace a path that travels each bridge exactly once. Sample graph:
Discussion 1 (page 259) a. Sample response: No. Since both graphs contain a pair of vertices
connected by more than one edge, they are not simple graphs. b. Sample response: It is possible to find a closed path that crosses each
of the five bridges exactly once. It is not possible when seven bridges are considered.
c. 1. Sample response: No. Neither graph is a simple graph so it cannot be a complete graph.
2. Both graphs are connected, because there is a path from every vertex to every other vertex.
C
DA
B
C
DA
B
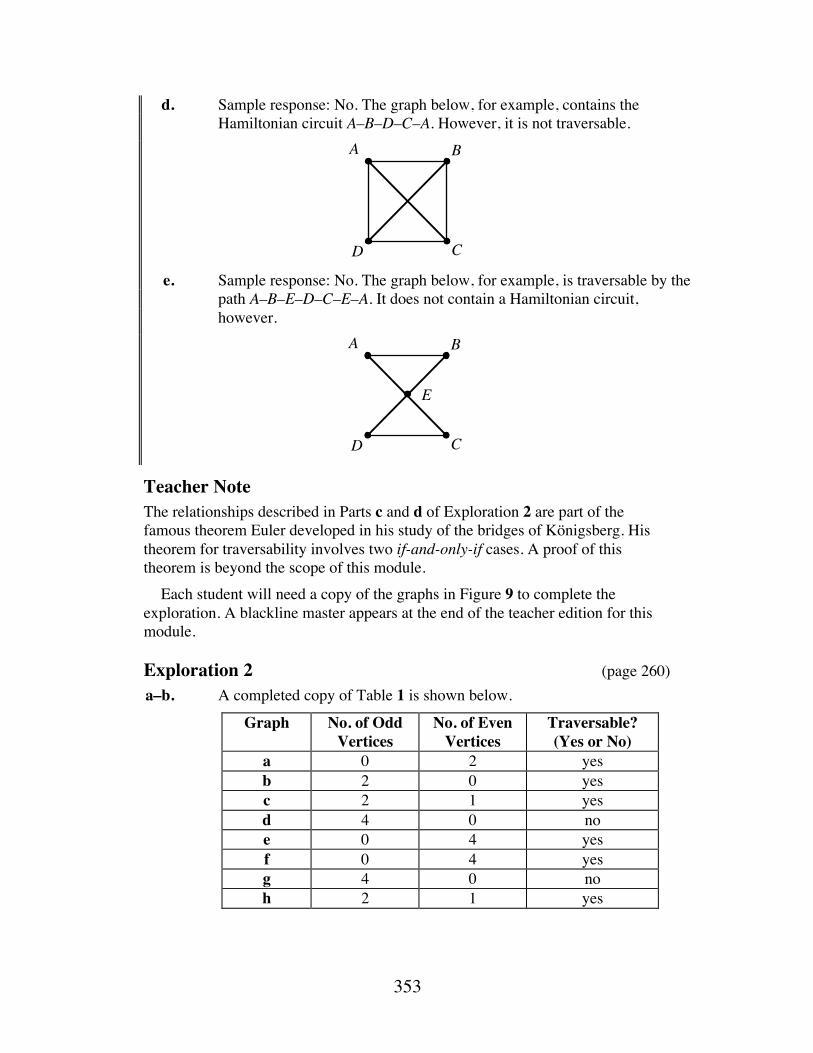
353
d. Sample response: No. The graph below, for example, contains the Hamiltonian circuit A–B–D–C–A. However, it is not traversable.
e. Sample response: No. The graph below, for example, is traversable by the
path A–B–E–D–C–E–A. It does not contain a Hamiltonian circuit, however.
Teacher Note The relationships described in Parts c and d of Exploration 2 are part of the famous theorem Euler developed in his study of the bridges of Königsberg. His theorem for traversability involves two if-and-only-if cases. A proof of this theorem is beyond the scope of this module. Each student will need a copy of the graphs in Figure 9 to complete the exploration. A blackline master appears at the end of the teacher edition for this module.
Exploration 2 (page 260) a–b. A completed copy of Table 1 is shown below.
Graph No. of Odd Vertices
No. of Even Vertices
Traversable? (Yes or No)
a 0 2 yes b 2 0 yes c 2 1 yes d 4 0 no e 0 4 yes f 0 4 yes g 4 0 no h 2 1 yes
A B
CD
A B
CD
E
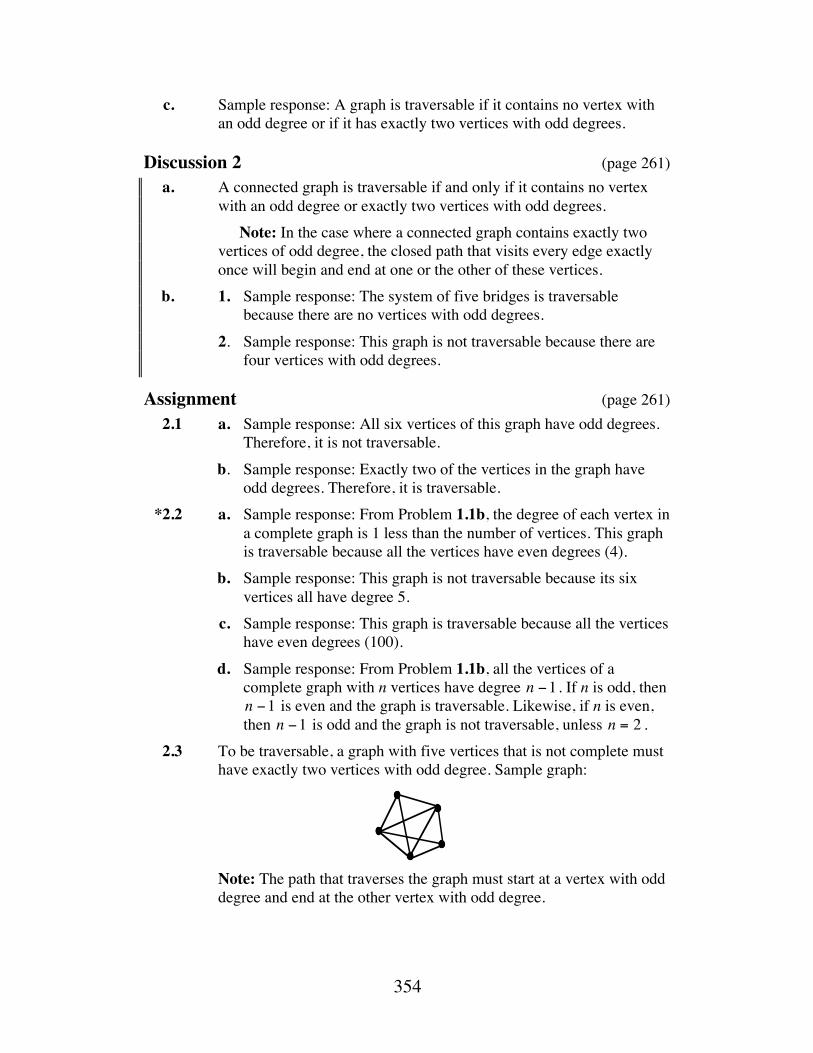
354
c. Sample response: A graph is traversable if it contains no vertex with an odd degree or if it has exactly two vertices with odd degrees.
Discussion 2 (page 261) a. A connected graph is traversable if and only if it contains no vertex
with an odd degree or exactly two vertices with odd degrees. Note: In the case where a connected graph contains exactly two
vertices of odd degree, the closed path that visits every edge exactly once will begin and end at one or the other of these vertices.
b. 1. Sample response: The system of five bridges is traversable because there are no vertices with odd degrees.
2. Sample response: This graph is not traversable because there are four vertices with odd degrees.
Assignment (page 261) 2.1 a. Sample response: All six vertices of this graph have odd degrees.
Therefore, it is not traversable. b. Sample response: Exactly two of the vertices in the graph have
odd degrees. Therefore, it is traversable. *2.2 a. Sample response: From Problem 1.1b, the degree of each vertex in
a complete graph is 1 less than the number of vertices. This graph is traversable because all the vertices have even degrees (4).
b. Sample response: This graph is not traversable because its six vertices all have degree 5.
c. Sample response: This graph is traversable because all the vertices have even degrees (100).
d. Sample response: From Problem 1.1b, all the vertices of a complete graph with n vertices have degree n −1 . If n is odd, then n −1 is even and the graph is traversable. Likewise, if n is even, then n −1 is odd and the graph is not traversable, unless n = 2 .
2.3 To be traversable, a graph with five vertices that is not complete must have exactly two vertices with odd degree. Sample graph:
Note: The path that traverses the graph must start at a vertex with odd
degree and end at the other vertex with odd degree.
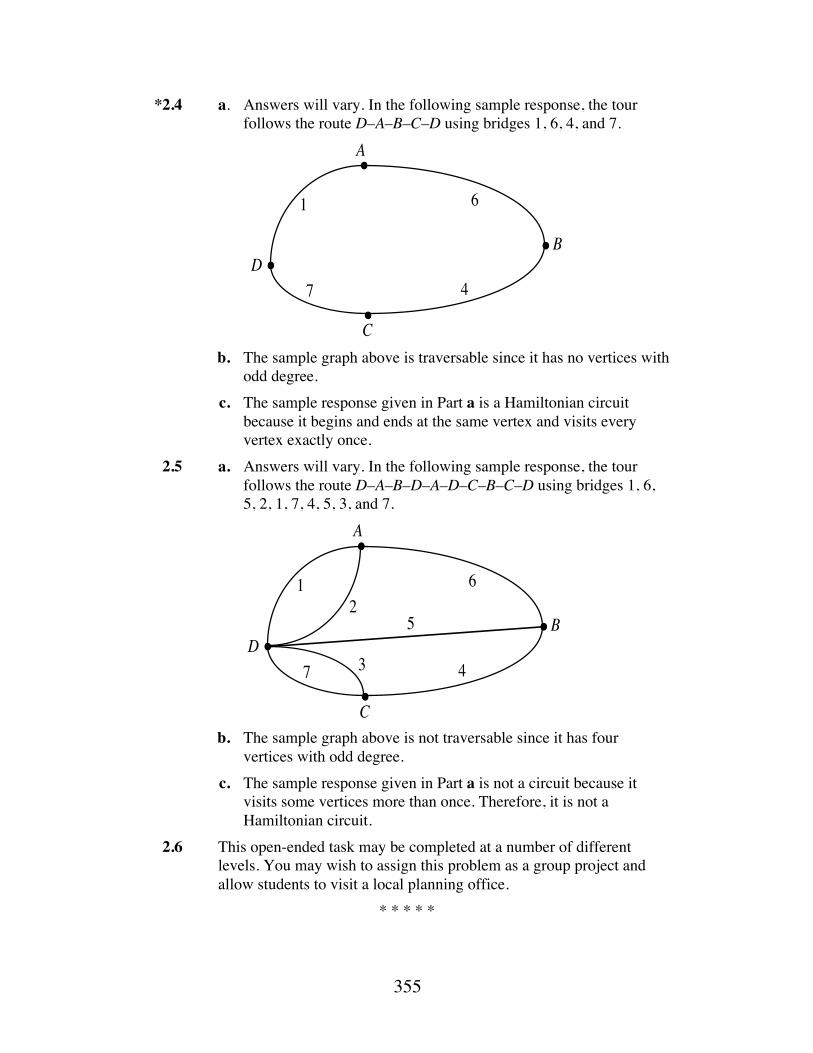
355
*2.4 a. Answers will vary. In the following sample response, the tour follows the route D–A–B–C–D using bridges 1, 6, 4, and 7.
b. The sample graph above is traversable since it has no vertices with
odd degree. c. The sample response given in Part a is a Hamiltonian circuit
because it begins and ends at the same vertex and visits every vertex exactly once.
2.5 a. Answers will vary. In the following sample response, the tour follows the route D–A–B–D–A–D–C–B–C–D using bridges 1, 6, 5, 2, 1, 7, 4, 5, 3, and 7.
b. The sample graph above is not traversable since it has four
vertices with odd degree. c. The sample response given in Part a is not a circuit because it
visits some vertices more than once. Therefore, it is not a Hamiltonian circuit.
2.6 This open-ended task may be completed at a number of different levels. You may wish to assign this problem as a group project and allow students to visit a local planning office.
* * * * *
A
C
D
1 6
7 4
B
A
C
D
1 6
7 4
B2
3
5
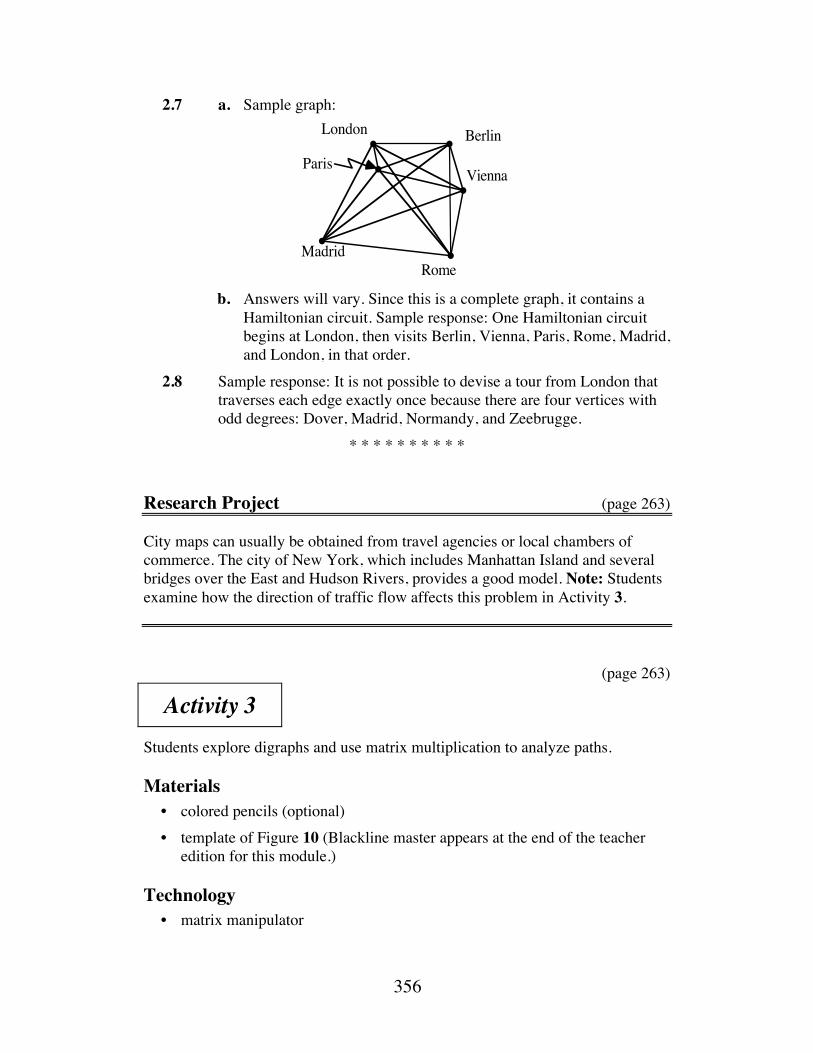
356
2.7 a. Sample graph:
b. Answers will vary. Since this is a complete graph, it contains a
Hamiltonian circuit. Sample response: One Hamiltonian circuit begins at London, then visits Berlin, Vienna, Paris, Rome, Madrid, and London, in that order.
2.8 Sample response: It is not possible to devise a tour from London that traverses each edge exactly once because there are four vertices with odd degrees: Dover, Madrid, Normandy, and Zeebrugge.
* * * * * * * * * *
Research Project (page 263) City maps can usually be obtained from travel agencies or local chambers of commerce. The city of New York, which includes Manhattan Island and several bridges over the East and Hudson Rivers, provides a good model. Note: Students examine how the direction of traffic flow affects this problem in Activity 3.
(page 263)
Activity 3 Students explore digraphs and use matrix multiplication to analyze paths.
Materials • colored pencils (optional) • template of Figure 10 (Blackline master appears at the end of the teacher
edition for this module.)
Technology • matrix manipulator
London
Rome
Paris
Berlin
Madrid
Vienna
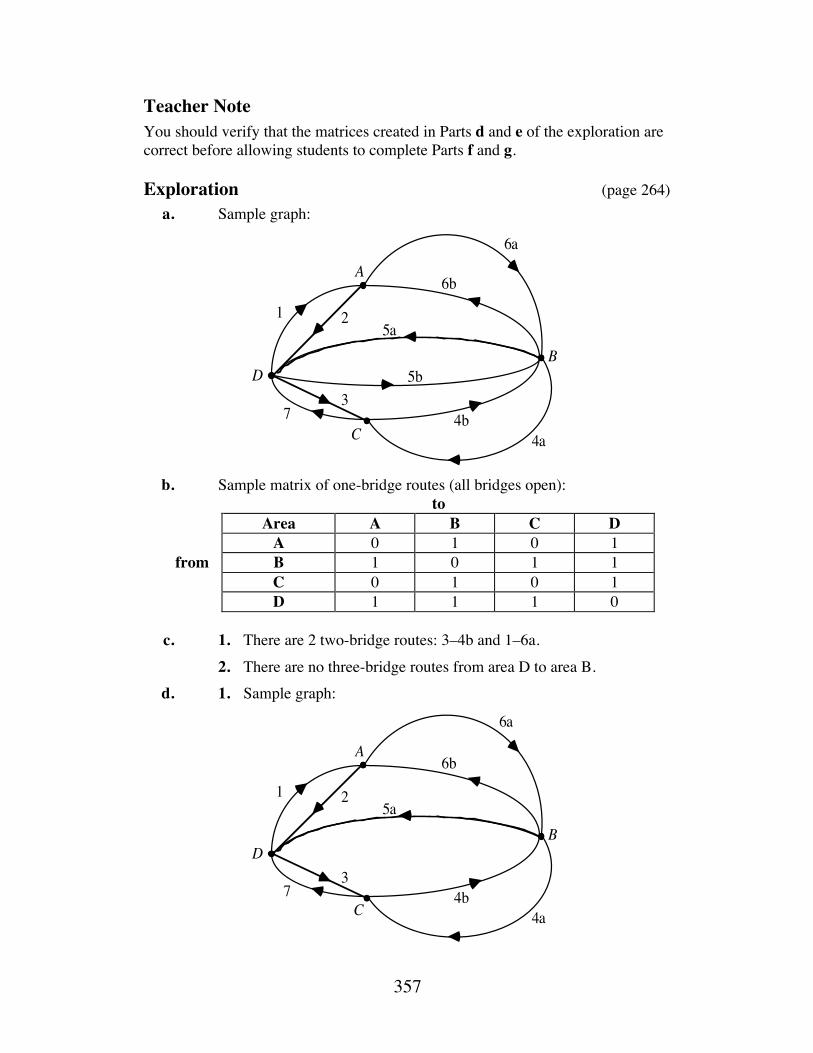
357
Teacher Note You should verify that the matrices created in Parts d and e of the exploration are correct before allowing students to complete Parts f and g.
Exploration (page 264) a. Sample graph:
b. Sample matrix of one-bridge routes (all bridges open):
to Area A B C D A 0 1 0 1
from B 1 0 1 1 C 0 1 0 1 D 1 1 1 0
c. 1. There are 2 two-bridge routes: 3–4b and 1–6a. 2. There are no three-bridge routes from area D to area B. d. 1. Sample graph:
A
C
DB
1 2
37
4a
5a
5b
6a
6b
4b
A
C
DB
1 2
37
4a
5a
6a
6b
4b
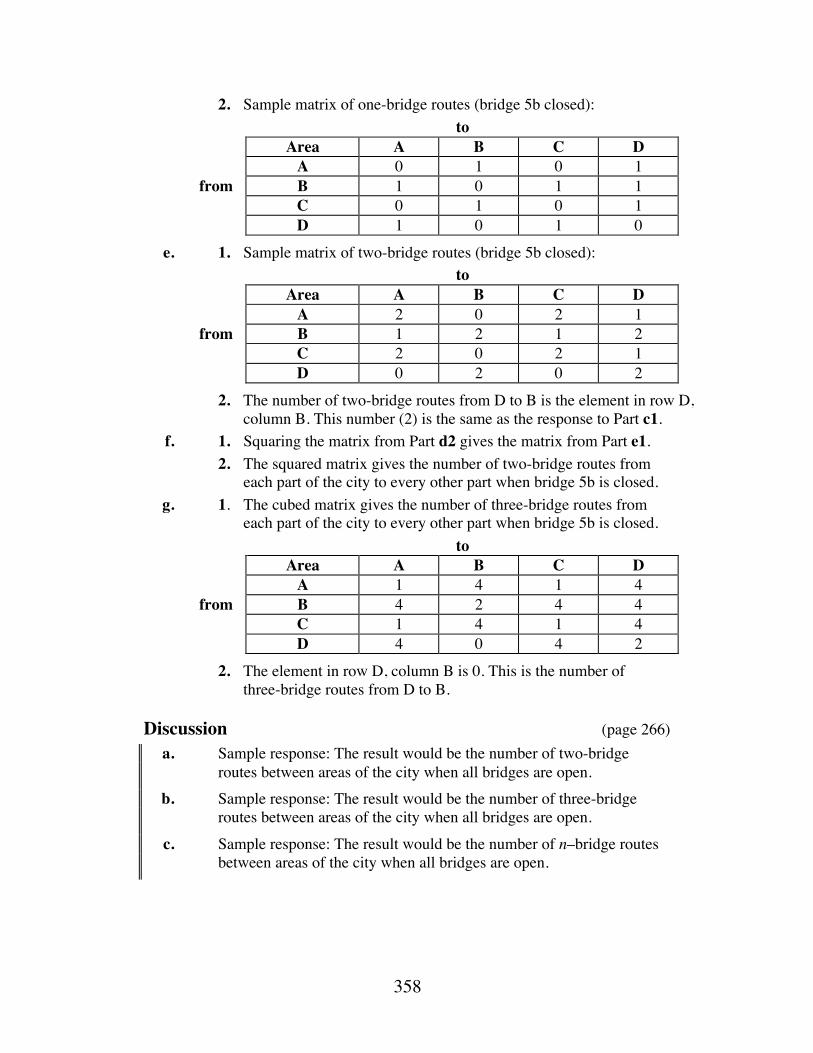
358
2. Sample matrix of one-bridge routes (bridge 5b closed): to
Area A B C D A 0 1 0 1
from B 1 0 1 1 C 0 1 0 1 D 1 0 1 0
e. 1. Sample matrix of two-bridge routes (bridge 5b closed): to
Area A B C D A 2 0 2 1
from B 1 2 1 2 C 2 0 2 1 D 0 2 0 2
2. The number of two-bridge routes from D to B is the element in row D, column B. This number (2) is the same as the response to Part c1.
f. 1. Squaring the matrix from Part d2 gives the matrix from Part e1. 2. The squared matrix gives the number of two-bridge routes from
each part of the city to every other part when bridge 5b is closed. g. 1. The cubed matrix gives the number of three-bridge routes from
each part of the city to every other part when bridge 5b is closed. to
Area A B C D A 1 4 1 4
from B 4 2 4 4 C 1 4 1 4 D 4 0 4 2
2. The element in row D, column B is 0. This is the number of three-bridge routes from D to B.
Discussion (page 266) a. Sample response: The result would be the number of two-bridge
routes between areas of the city when all bridges are open. b. Sample response: The result would be the number of three-bridge
routes between areas of the city when all bridges are open. c. Sample response: The result would be the number of n–bridge routes
between areas of the city when all bridges are open.
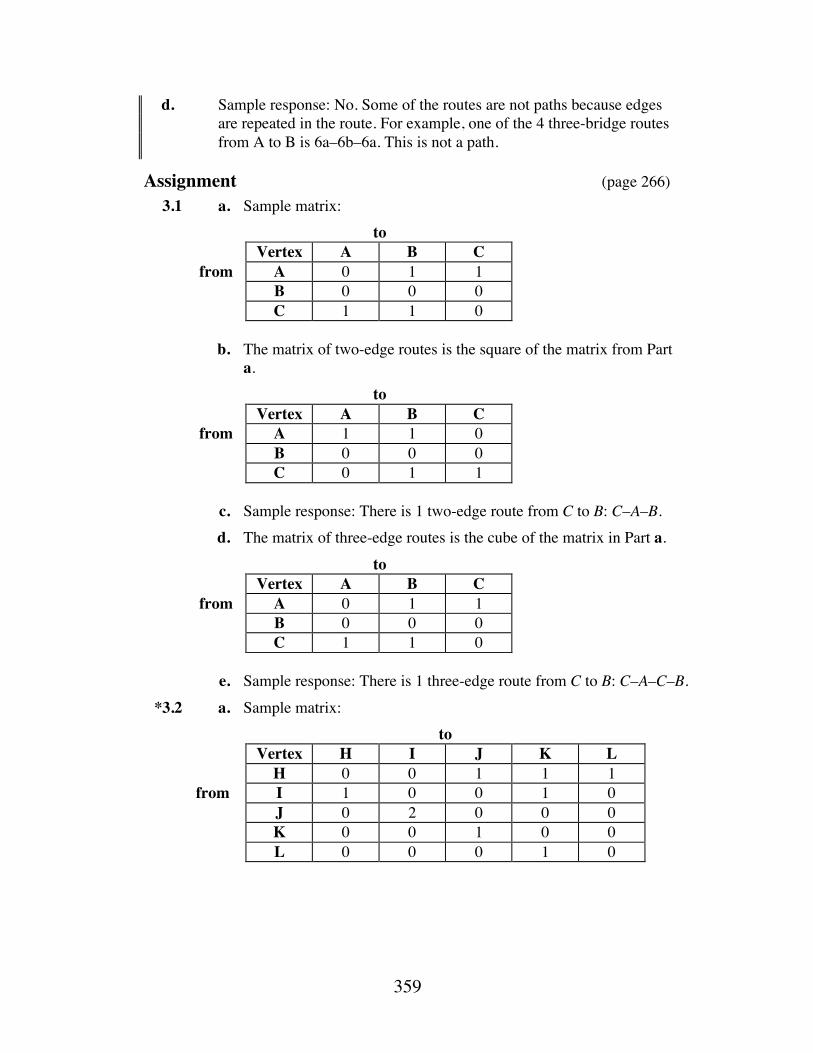
359
d. Sample response: No. Some of the routes are not paths because edges are repeated in the route. For example, one of the 4 three-bridge routes from A to B is 6a–6b–6a. This is not a path.
Assignment (page 266) 3.1 a. Sample matrix:
to Vertex A B C
from A 0 1 1 B 0 0 0 C 1 1 0
b. The matrix of two-edge routes is the square of the matrix from Part
a. to
Vertex A B C from A 1 1 0
B 0 0 0 C 0 1 1
c. Sample response: There is 1 two-edge route from C to B: C–A–B. d. The matrix of three-edge routes is the cube of the matrix in Part a.
to Vertex A B C
from A 0 1 1 B 0 0 0 C 1 1 0
e. Sample response: There is 1 three-edge route from C to B: C–A–C–B. *3.2 a. Sample matrix:
to Vertex H I J K L H 0 0 1 1 1
from I 1 0 0 1 0 J 0 2 0 0 0 K 0 0 1 0 0 L 0 0 0 1 0
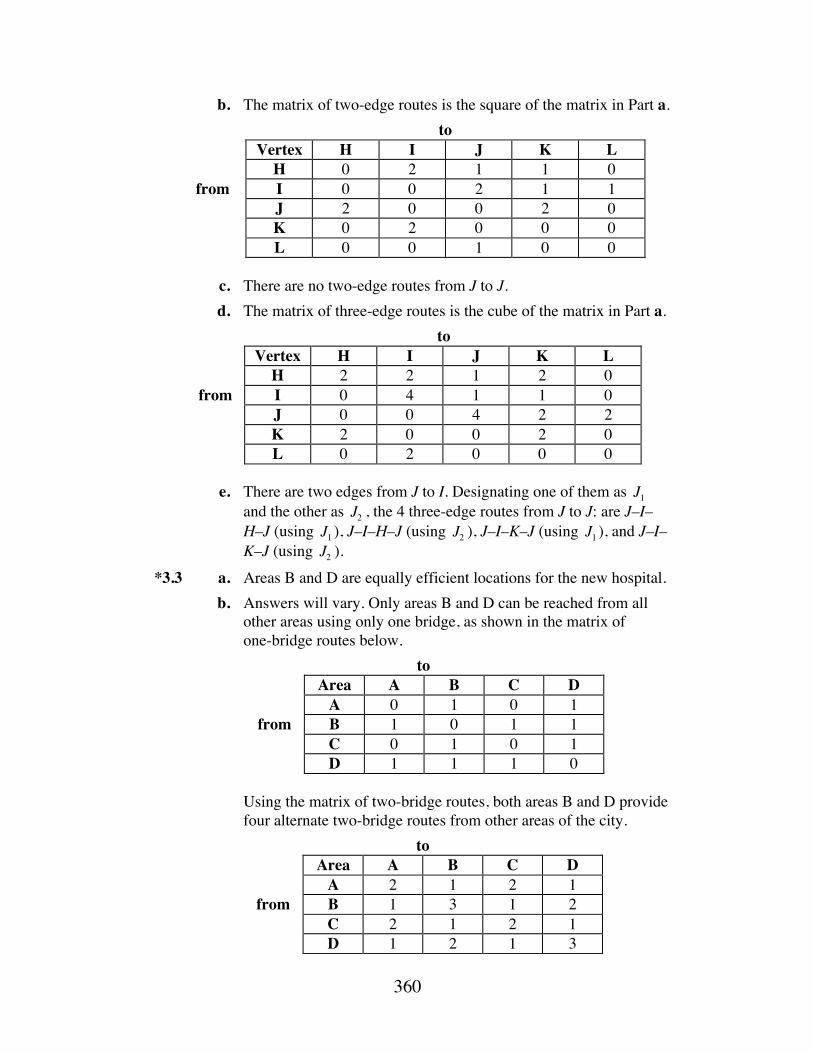
360
b. The matrix of two-edge routes is the square of the matrix in Part a. to
Vertex H I J K L H 0 2 1 1 0
from I 0 0 2 1 1 J 2 0 0 2 0 K 0 2 0 0 0 L 0 0 1 0 0
c. There are no two-edge routes from J to J. d. The matrix of three-edge routes is the cube of the matrix in Part a.
to Vertex H I J K L H 2 2 1 2 0
from I 0 4 1 1 0 J 0 0 4 2 2 K 2 0 0 2 0 L 0 2 0 0 0
e. There are two edges from J to I. Designating one of them as J1
and the other as J2 , the 4 three-edge routes from J to J: are J–I–H–J (using J1 ), J–I–H–J (using J2 ), J–I–K–J (using J1 ), and J–I–K–J (using J2 ).
*3.3 a. Areas B and D are equally efficient locations for the new hospital. b. Answers will vary. Only areas B and D can be reached from all
other areas using only one bridge, as shown in the matrix of one-bridge routes below.
to Area A B C D A 0 1 0 1
from B 1 0 1 1 C 0 1 0 1 D 1 1 1 0
Using the matrix of two-bridge routes, both areas B and D provide
four alternate two-bridge routes from other areas of the city. to
Area A B C D A 2 1 2 1
from B 1 3 1 2 C 2 1 2 1 D 1 2 1 3
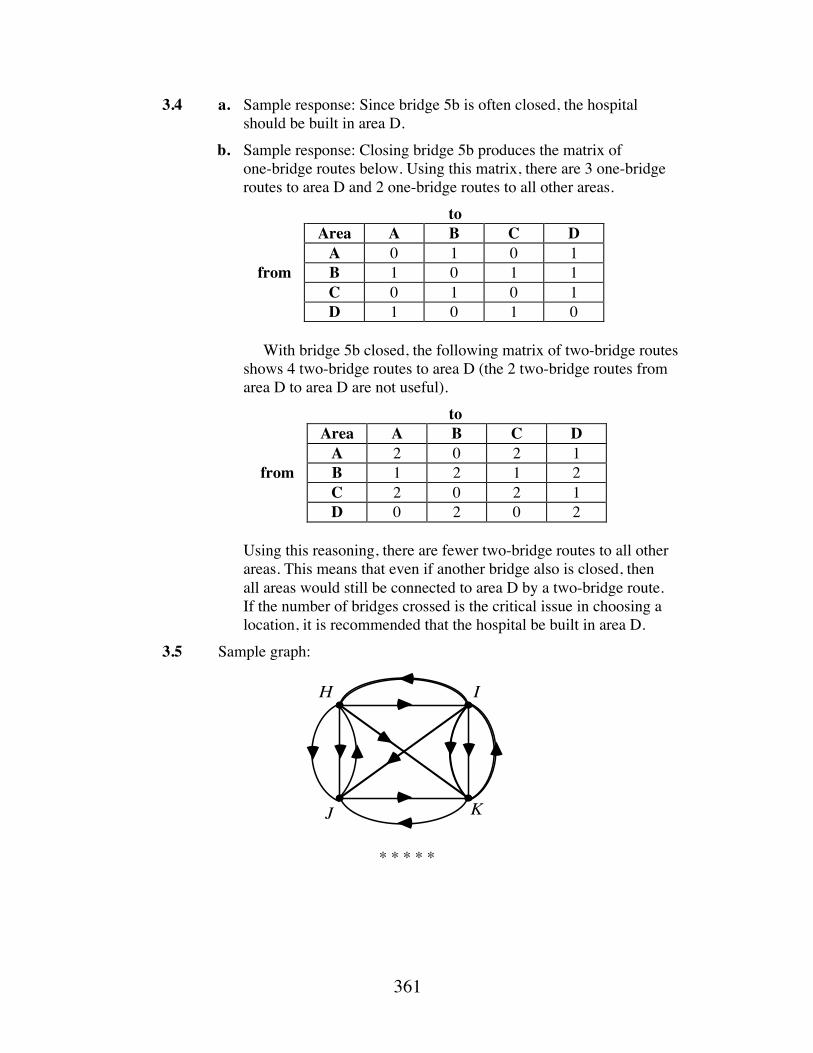
361
3.4 a. Sample response: Since bridge 5b is often closed, the hospital should be built in area D.
b. Sample response: Closing bridge 5b produces the matrix of one-bridge routes below. Using this matrix, there are 3 one-bridge routes to area D and 2 one-bridge routes to all other areas.
to Area A B C D A 0 1 0 1
from B 1 0 1 1 C 0 1 0 1 D 1 0 1 0
With bridge 5b closed, the following matrix of two-bridge routes
shows 4 two-bridge routes to area D (the 2 two-bridge routes from area D to area D are not useful).
to Area A B C D A 2 0 2 1
from B 1 2 1 2 C 2 0 2 1 D 0 2 0 2
Using this reasoning, there are fewer two-bridge routes to all other
areas. This means that even if another bridge also is closed, then all areas would still be connected to area D by a two-bridge route. If the number of bridges crossed is the critical issue in choosing a location, it is recommended that the hospital be built in area D.
3.5 Sample graph:
* * * * *
H I
J K
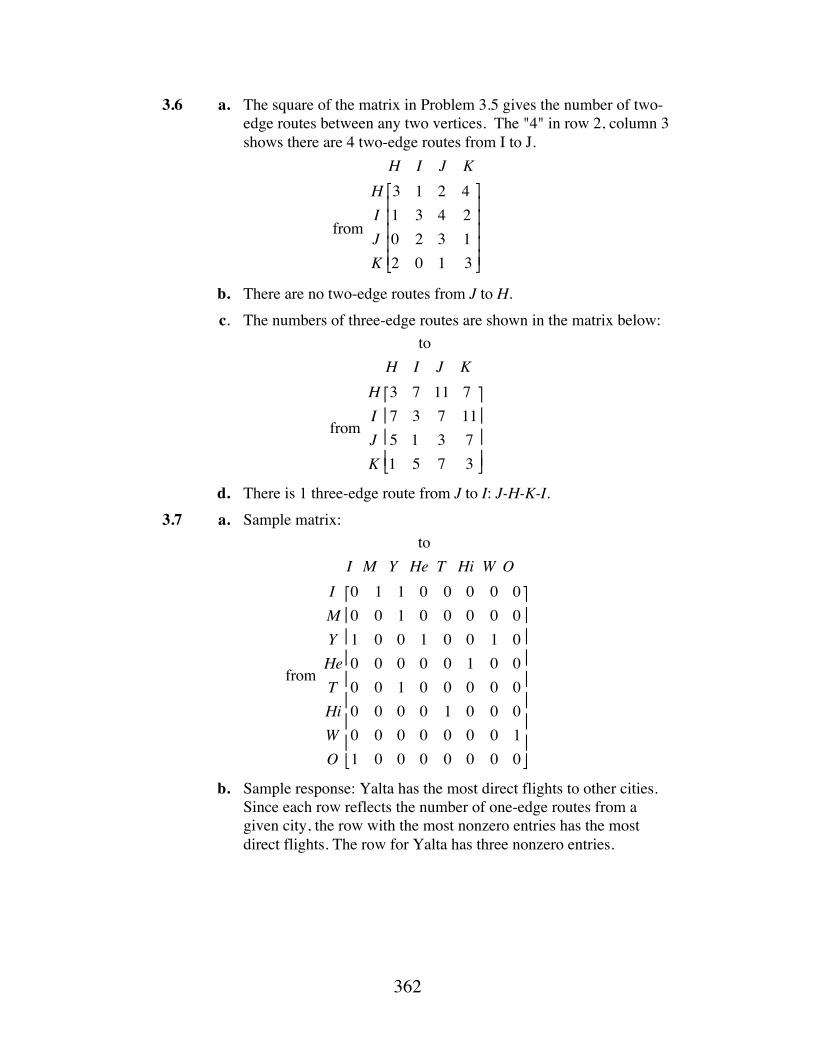
362
3.6 a. The square of the matrix in Problem 3.5 gives the number of two-edge routes between any two vertices. The "4" in row 2, column 3 shows there are 4 two-edge routes from I to J.
H I J K
from
HIJK
3 1 2 4 1 3 4 20 2 3 12 0 1 3
⎡
⎣
⎢ ⎢ ⎢ ⎢ ⎢
⎤
⎦
⎥ ⎥ ⎥ ⎥ ⎥
b. There are no two-edge routes from J to H. c. The numbers of three-edge routes are shown in the matrix below:
to H I J K
from
HIJK
3 7 11 7 7 3 7 115 1 3 71 5 7 3
⎡
⎣
⎢ ⎢ ⎢
⎤
⎦
⎥ ⎥ ⎥
d. There is 1 three-edge route from J to I: J-H-K-I. 3.7 a. Sample matrix:
to I M Y He T Hi W O
from
IMYHeTHiWO
0 1 1 0 0 0 0 00 0 1 0 0 0 0 01 0 0 1 0 0 1 00 0 0 0 0 1 0 00 0 1 0 0 0 0 00 0 0 0 1 0 0 00 0 0 0 0 0 0 11 0 0 0 0 0 0 0
⎡
⎣
⎢ ⎢ ⎢ ⎢ ⎢ ⎢ ⎢
⎤
⎦
⎥ ⎥ ⎥ ⎥ ⎥ ⎥ ⎥
b. Sample response: Yalta has the most direct flights to other cities. Since each row reflects the number of one-edge routes from a given city, the row with the most nonzero entries has the most direct flights. The row for Yalta has three nonzero entries.
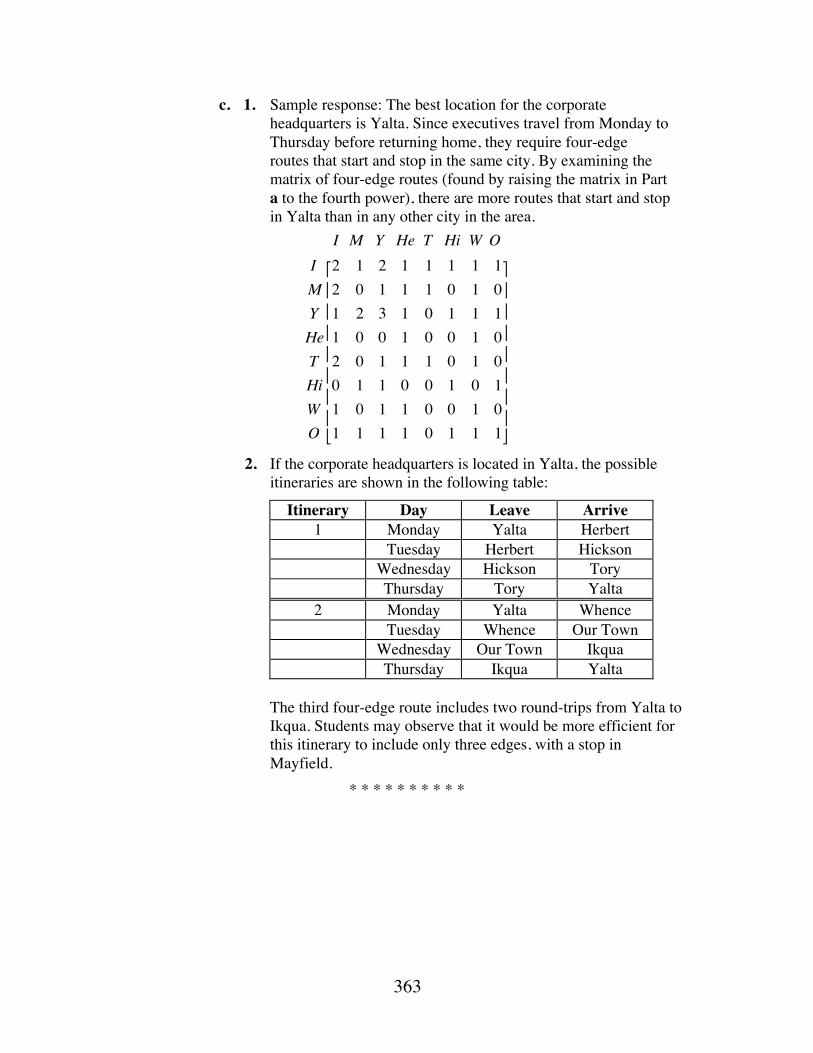
363
c. 1. Sample response: The best location for the corporate headquarters is Yalta. Since executives travel from Monday to Thursday before returning home, they require four-edge routes that start and stop in the same city. By examining the matrix of four-edge routes (found by raising the matrix in Part a to the fourth power), there are more routes that start and stop in Yalta than in any other city in the area.
I M Y He T Hi W OIMYHeTHiWO
2 1 2 1 1 1 1 12 0 1 1 1 0 1 01 2 3 1 0 1 1 11 0 0 1 0 0 1 02 0 1 1 1 0 1 00 1 1 0 0 1 0 11 0 1 1 0 0 1 01 1 1 1 0 1 1 1
⎡
⎣
⎢ ⎢ ⎢ ⎢ ⎢ ⎢ ⎢
⎤
⎦
⎥ ⎥ ⎥ ⎥ ⎥ ⎥ ⎥
2. If the corporate headquarters is located in Yalta, the possible itineraries are shown in the following table:
Itinerary Day Leave Arrive 1 Monday Yalta Herbert Tuesday Herbert Hickson Wednesday Hickson Tory Thursday Tory Yalta 2 Monday Yalta Whence Tuesday Whence Our Town Wednesday Our Town Ikqua Thursday Ikqua Yalta
The third four-edge route includes two round-trips from Yalta to
Ikqua. Students may observe that it would be more efficient for this itinerary to include only three edges, with a stop in Mayfield.
* * * * * * * * * *
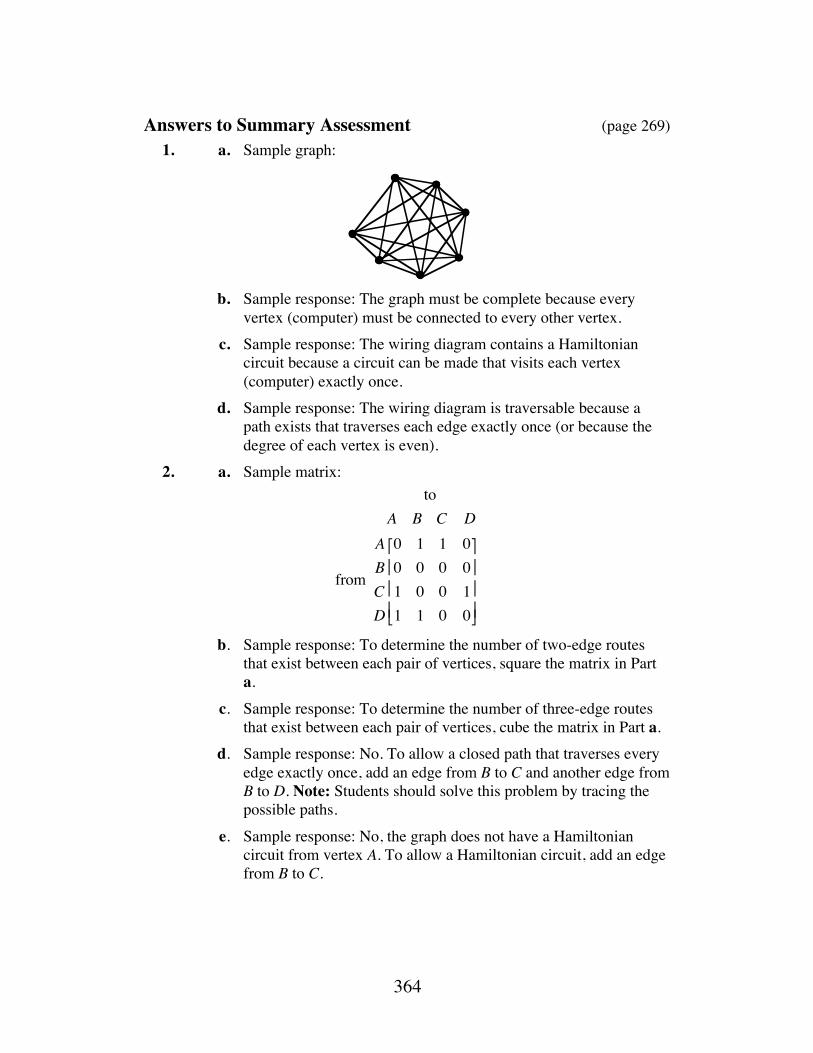
364
Answers to Summary Assessment (page 269) 1. a. Sample graph:
b. Sample response: The graph must be complete because every
vertex (computer) must be connected to every other vertex. c. Sample response: The wiring diagram contains a Hamiltonian
circuit because a circuit can be made that visits each vertex (computer) exactly once.
d. Sample response: The wiring diagram is traversable because a path exists that traverses each edge exactly once (or because the degree of each vertex is even).
2. a. Sample matrix: to A B C D
from
ABCD
0 1 1 00 0 0 01 0 0 11 1 0 0
⎡
⎣
⎢ ⎢ ⎢
⎤
⎦
⎥ ⎥ ⎥
b. Sample response: To determine the number of two-edge routes that exist between each pair of vertices, square the matrix in Part a.
c. Sample response: To determine the number of three-edge routes that exist between each pair of vertices, cube the matrix in Part a.
d. Sample response: No. To allow a closed path that traverses every edge exactly once, add an edge from B to C and another edge from B to D. Note: Students should solve this problem by tracing the possible paths.
e. Sample response: No, the graph does not have a Hamiltonian circuit from vertex A. To allow a Hamiltonian circuit, add an edge from B to C.
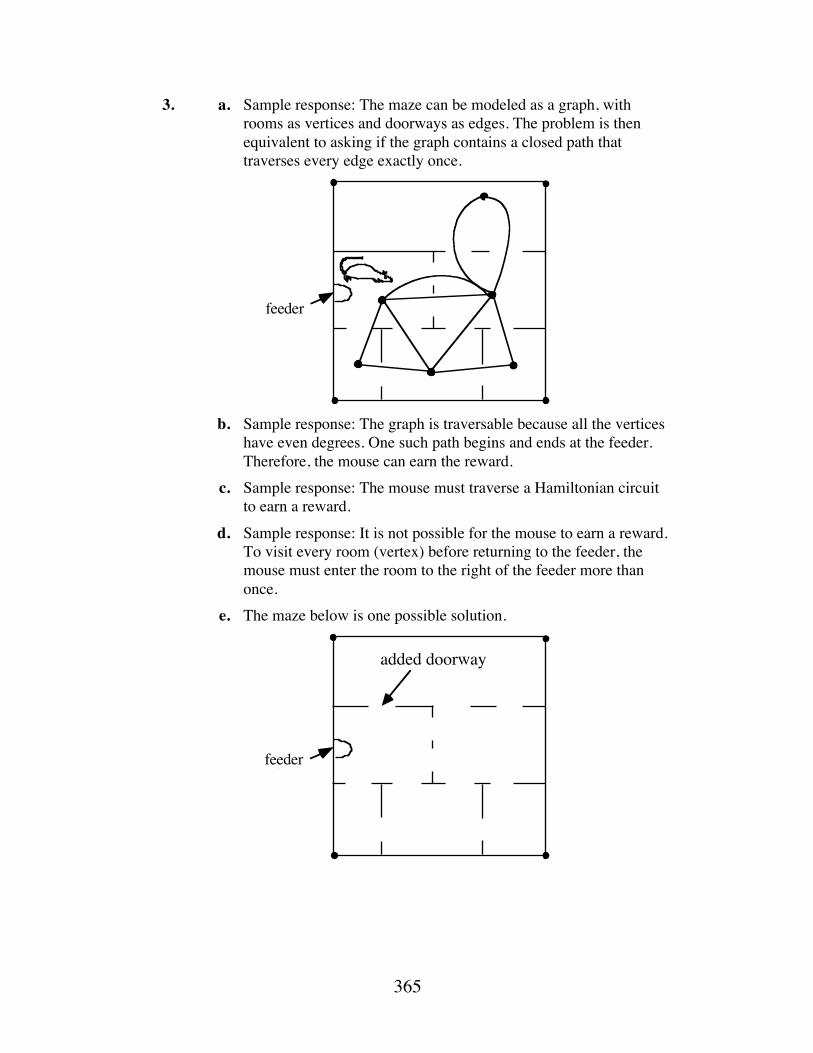
365
3. a. Sample response: The maze can be modeled as a graph, with rooms as vertices and doorways as edges. The problem is then equivalent to asking if the graph contains a closed path that traverses every edge exactly once.
b. Sample response: The graph is traversable because all the vertices
have even degrees. One such path begins and ends at the feeder. Therefore, the mouse can earn the reward.
c. Sample response: The mouse must traverse a Hamiltonian circuit to earn a reward.
d. Sample response: It is not possible for the mouse to earn a reward. To visit every room (vertex) before returning to the feeder, the mouse must enter the room to the right of the feeder more than once.
e. The maze below is one possible solution.
feeder
e
feeder
added doorway
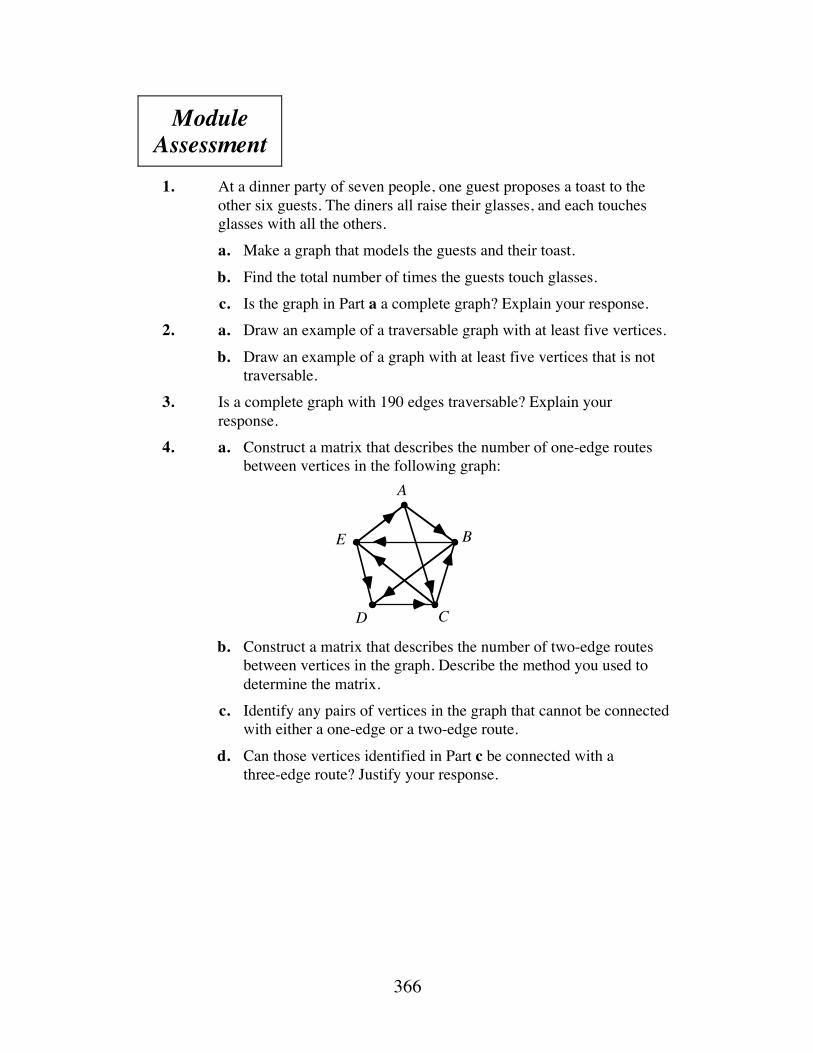
366
Module Assessment
1. At a dinner party of seven people, one guest proposes a toast to the
other six guests. The diners all raise their glasses, and each touches glasses with all the others.
a. Make a graph that models the guests and their toast. b. Find the total number of times the guests touch glasses. c. Is the graph in Part a a complete graph? Explain your response. 2. a. Draw an example of a traversable graph with at least five vertices. b. Draw an example of a graph with at least five vertices that is not
traversable. 3. Is a complete graph with 190 edges traversable? Explain your
response. 4. a. Construct a matrix that describes the number of one-edge routes
between vertices in the following graph:
b. Construct a matrix that describes the number of two-edge routes
between vertices in the graph. Describe the method you used to determine the matrix.
c. Identify any pairs of vertices in the graph that cannot be connected with either a one-edge or a two-edge route.
d. Can those vertices identified in Part c be connected with a three-edge route? Justify your response.
A
B
CD
E
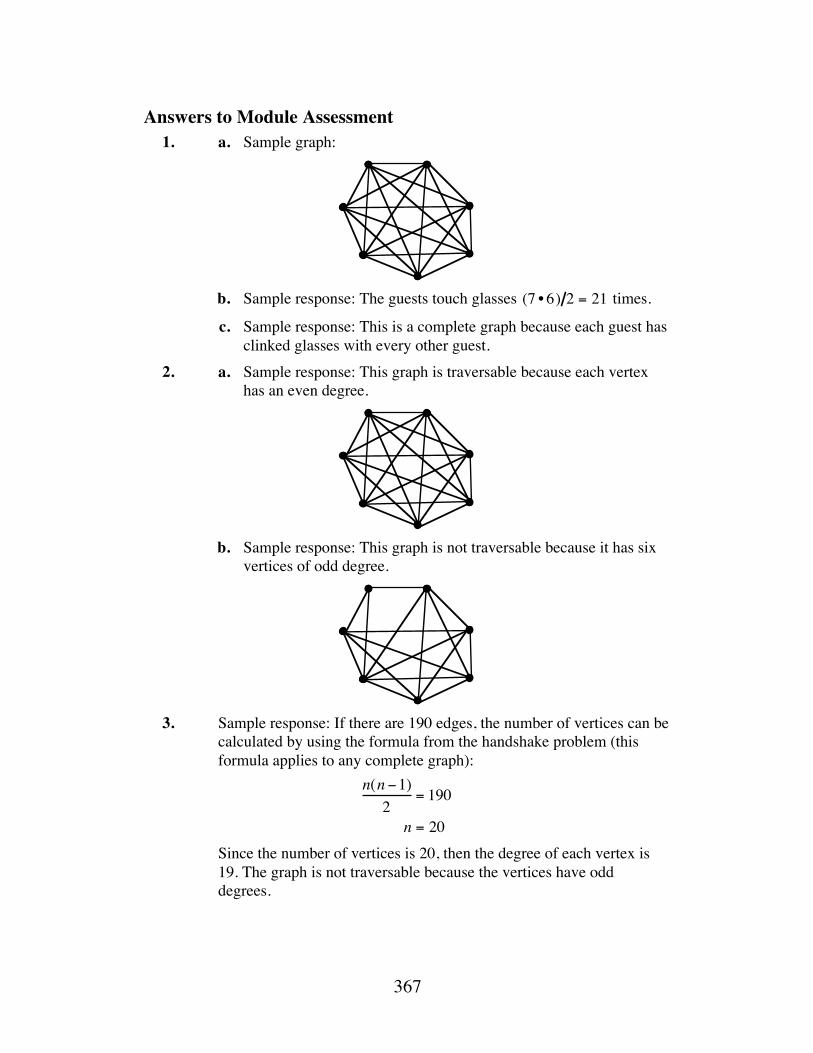
367
Answers to Module Assessment 1. a. Sample graph:
b. Sample response: The guests touch glasses (7 • 6) 2 = 21 times.
c. Sample response: This is a complete graph because each guest has clinked glasses with every other guest.
2. a. Sample response: This graph is traversable because each vertex has an even degree.
b. Sample response: This graph is not traversable because it has six
vertices of odd degree.
3. Sample response: If there are 190 edges, the number of vertices can be
calculated by using the formula from the handshake problem (this formula applies to any complete graph):
n(n −1)2
= 190
n = 20
Since the number of vertices is 20, then the degree of each vertex is 19. The graph is not traversable because the vertices have odd degrees.
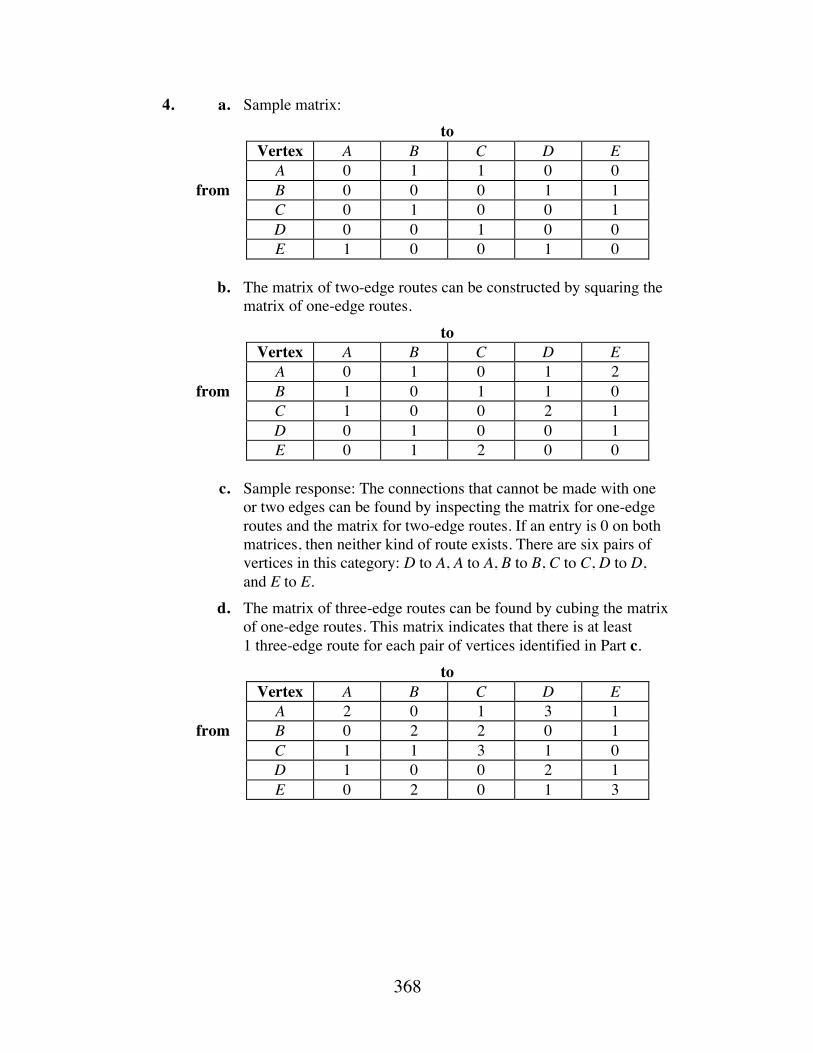
368
4. a. Sample matrix: to
Vertex A B C D E A 0 1 1 0 0
from B 0 0 0 1 1 C 0 1 0 0 1 D 0 0 1 0 0 E 1 0 0 1 0
b. The matrix of two-edge routes can be constructed by squaring the
matrix of one-edge routes. to
Vertex A B C D E A 0 1 0 1 2
from B 1 0 1 1 0 C 1 0 0 2 1 D 0 1 0 0 1 E 0 1 2 0 0
c. Sample response: The connections that cannot be made with one
or two edges can be found by inspecting the matrix for one-edge routes and the matrix for two-edge routes. If an entry is 0 on both matrices, then neither kind of route exists. There are six pairs of vertices in this category: D to A, A to A, B to B, C to C, D to D, and E to E.
d. The matrix of three-edge routes can be found by cubing the matrix of one-edge routes. This matrix indicates that there is at least 1 three-edge route for each pair of vertices identified in Part c.
to Vertex A B C D E A 2 0 1 3 1
from B 0 2 2 0 1 C 1 1 3 1 0 D 1 0 0 2 1 E 0 2 0 1 3
369
Selected References Copes, W., C. Sloyer, R. Stark, and W. Sacco. Graph Theory: Euler’s Rich
Legacy. Providence, RI: Janson Publications, 1987. Consortium for Mathematics and Its Applications (COMAP). For All Practical
Purposes. New York: W. H. Freeman and Co., 1988. Hill, D. R. Experiments in Computations Matrix Algebra. New York: Random
House, 1988. Kenney, M. J., and C. R. Hirsh. Discrete Mathematics Across the Curriculum,
K–12. National Council of Teachers of Mathematics (NCTM) 1991 Yearbook. Reston, VA: NCTM, 1991.
Prather, R. E. Elements of Discrete Mathematics. Boston, MA: Houghton Mifflin Co., 1986.
Skvarcius, R., and W. B. Robinson. Discrete Mathematics with Computer Science Applications. Menlo Park, CA: The Benjamin/Cummings Publishing Co., 1986.
Wilson, R. J., and J. J. Watkins. Graphs: An Introductory Approach. New York: John Wiley and Sons, 1990.
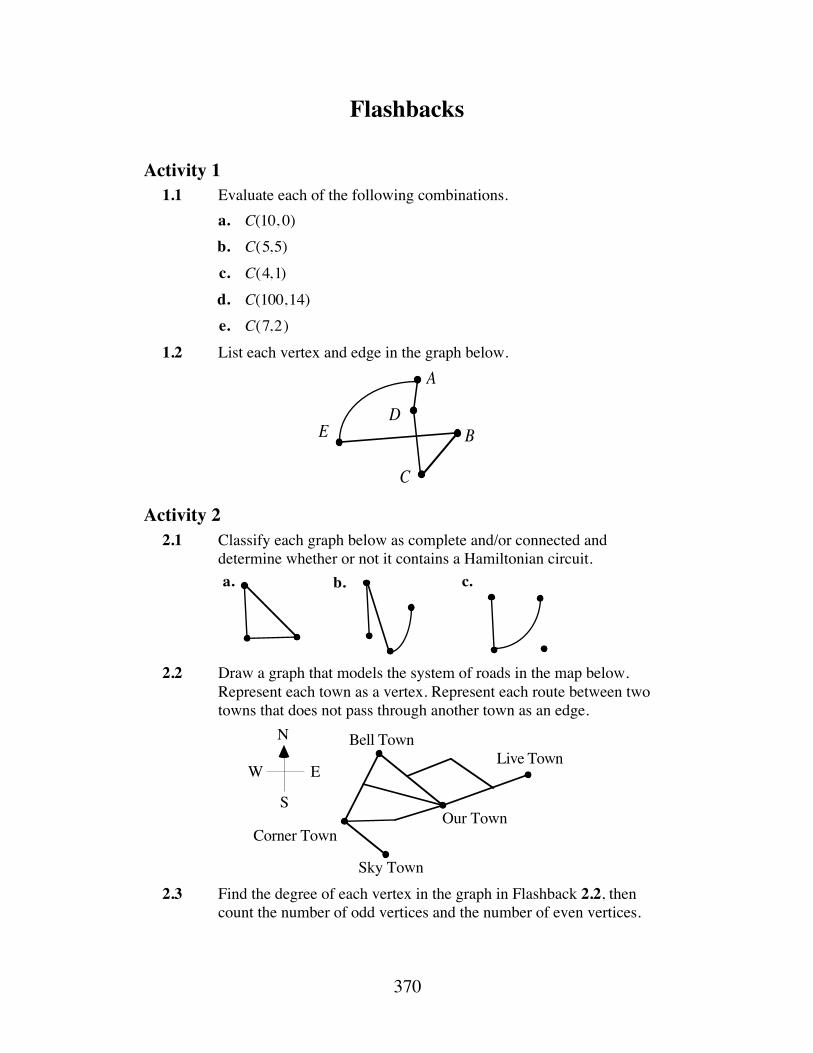
370
Flashbacks
Activity 1 1.1 Evaluate each of the following combinations. a. C(10, 0) b. C(5,5) c. C(4,1) d. C(100,14) e. C(7,2) 1.2 List each vertex and edge in the graph below.
Activity 2 2.1 Classify each graph below as complete and/or connected and
determine whether or not it contains a Hamiltonian circuit.
2.2 Draw a graph that models the system of roads in the map below.
Represent each town as a vertex. Represent each route between two towns that does not pass through another town as an edge.
2.3 Find the degree of each vertex in the graph in Flashback 2.2, then
count the number of odd vertices and the number of even vertices.
A
B
C
DE
b.a. c.
N
S
W ELive Town
Our Town
Bell Town
Corner Town
Sky Town
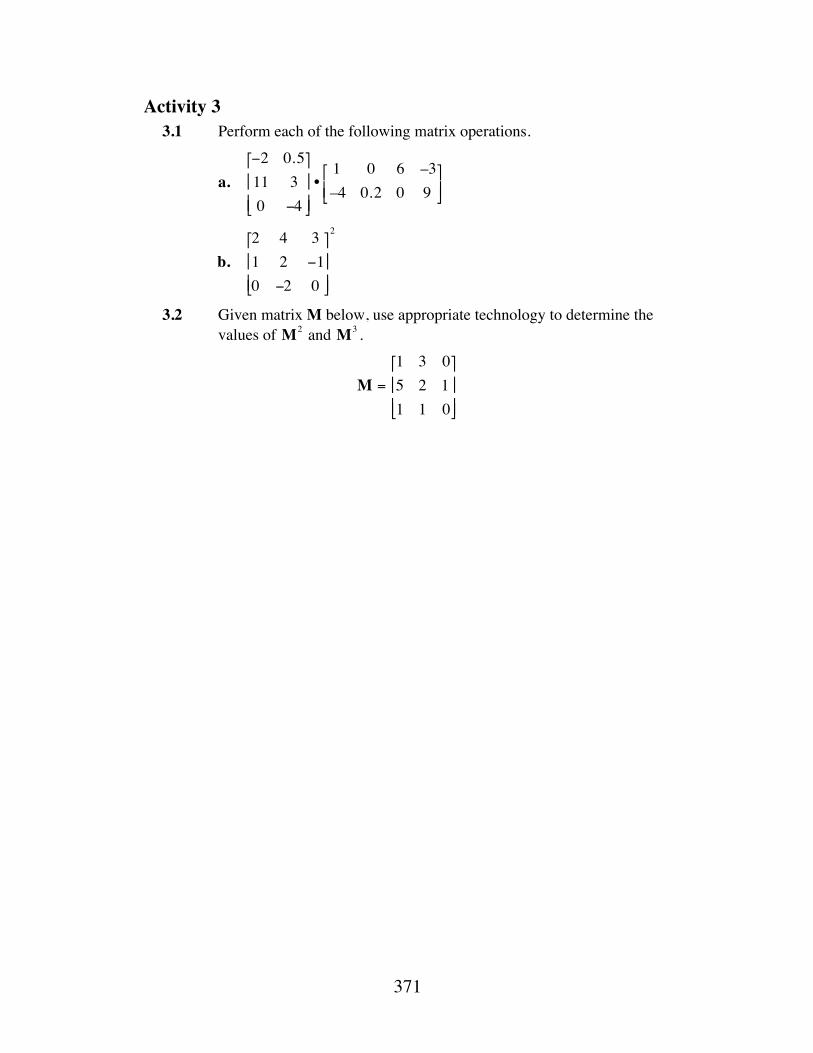
371
Activity 3 3.1 Perform each of the following matrix operations.
a. −2 0.511 30 −4
⎡
⎣
⎢ ⎢
⎤
⎦
⎥ ⎥ •1 0 6 –3–4 0.2 0 9⎡
⎣ ⎢ ⎤
⎦ ⎥
b. 2 4 31 2 −10 −2 0
⎡
⎣
⎢ ⎢
⎤
⎦
⎥ ⎥
2
3.2 Given matrix M below, use appropriate technology to determine the values of M2 and M3 .
M =
1 3 05 2 11 1 0
⎡
⎣
⎢ ⎢
⎤
⎦
⎥ ⎥
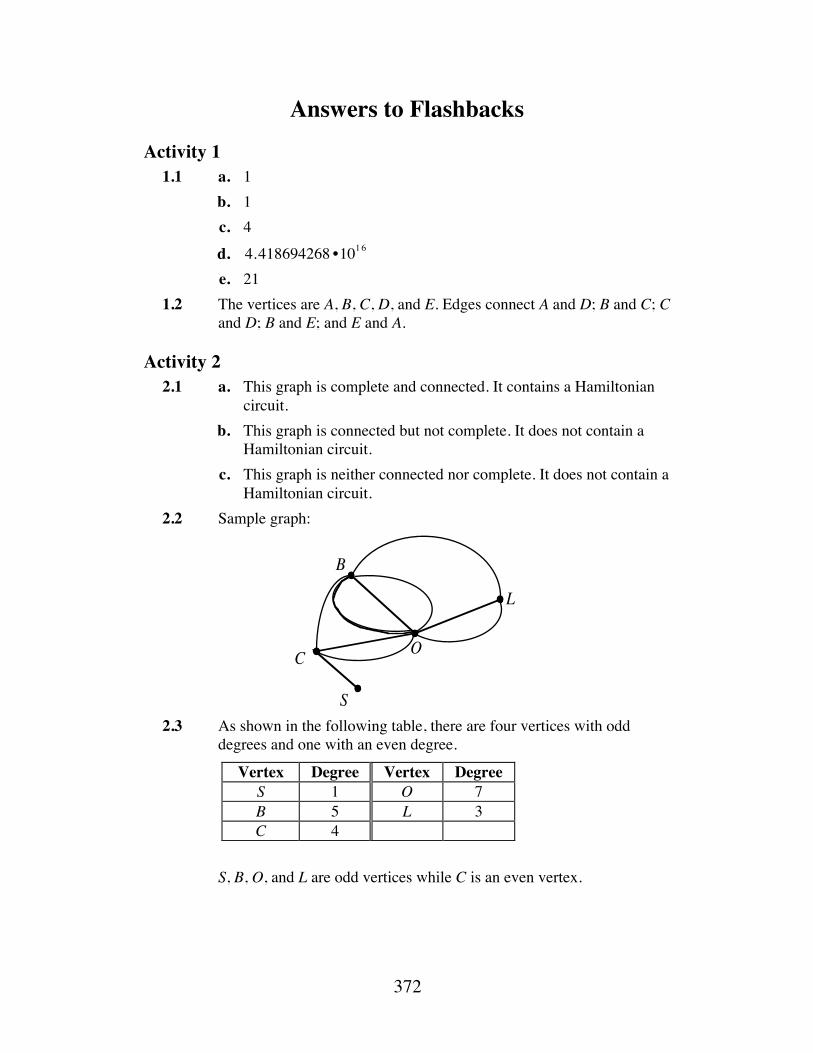
372
Answers to Flashbacks Activity 1 1.1 a. 1 b. 1 c. 4 d. 4.418694268 •1016 e. 21 1.2 The vertices are A, B, C, D, and E. Edges connect A and D; B and C; C
and D; B and E; and E and A.
Activity 2 2.1 a. This graph is complete and connected. It contains a Hamiltonian
circuit. b. This graph is connected but not complete. It does not contain a
Hamiltonian circuit. c. This graph is neither connected nor complete. It does not contain a
Hamiltonian circuit. 2.2 Sample graph:
2.3 As shown in the following table, there are four vertices with odd
degrees and one with an even degree.
Vertex Degree Vertex Degree S 1 O 7 B 5 L 3 C 4
S, B, O, and L are odd vertices while C is an even vertex.
C
B
O
L
S
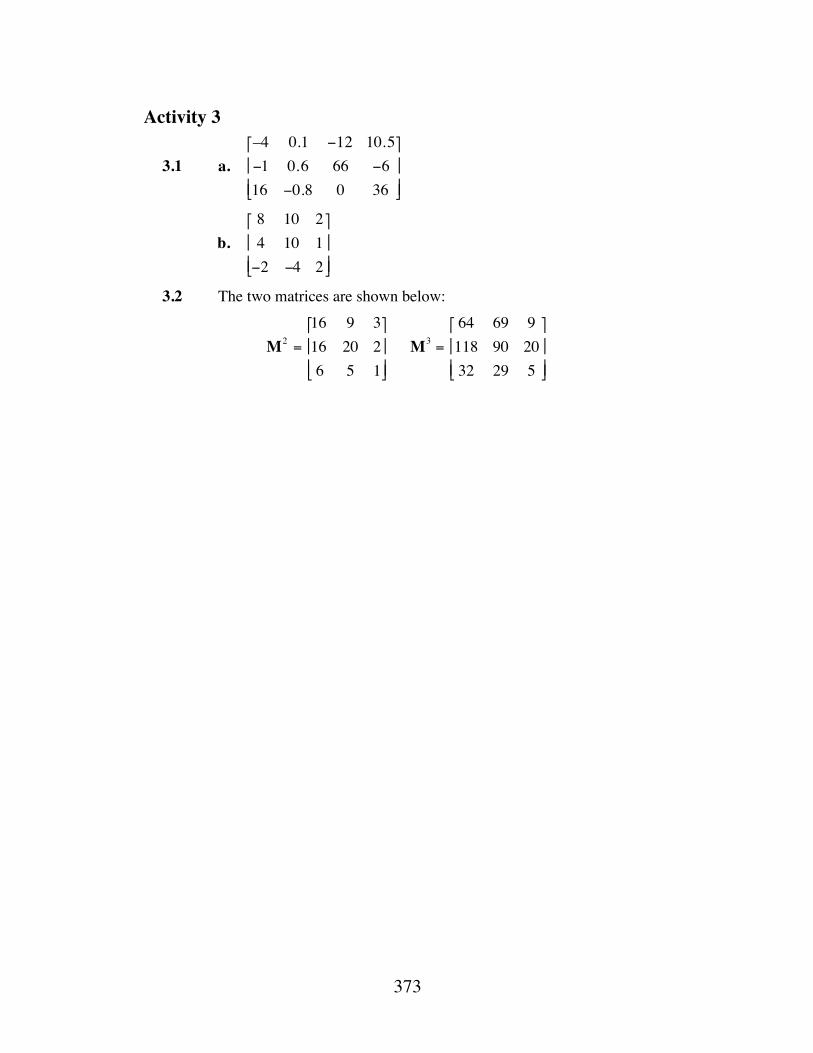
373
Activity 3
3.1 a. –4 0.1 −12 10.5−1 0.6 66 −616 −0.8 0 36
⎡
⎣
⎢ ⎢
⎤
⎦
⎥ ⎥
b. 8 10 24 10 1−2 −4 2
⎡
⎣
⎢ ⎢
⎤
⎦
⎥ ⎥
3.2 The two matrices are shown below:
M2 =
16 9 316 20 26 5 1
⎡
⎣
⎢ ⎢
⎤
⎦
⎥ ⎥
M3 =
64 69 9118 90 2032 29 5
⎡
⎣
⎢ ⎢
⎤
⎦
⎥ ⎥
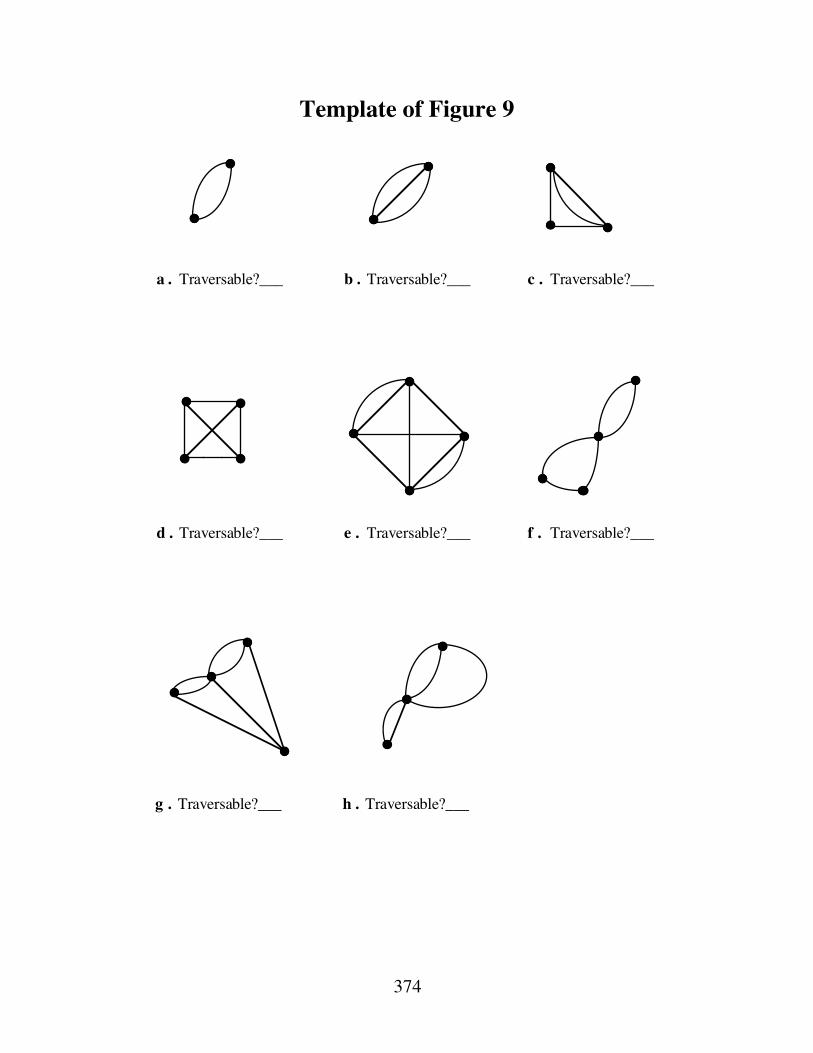
374
Template of Figure 9
a . Traversable?___ b . Traversable?___ c . Traversable?___
d . Traversable?___ e . Traversable?___ f . Traversable?___
g . Traversable?___ h . Traversable?___
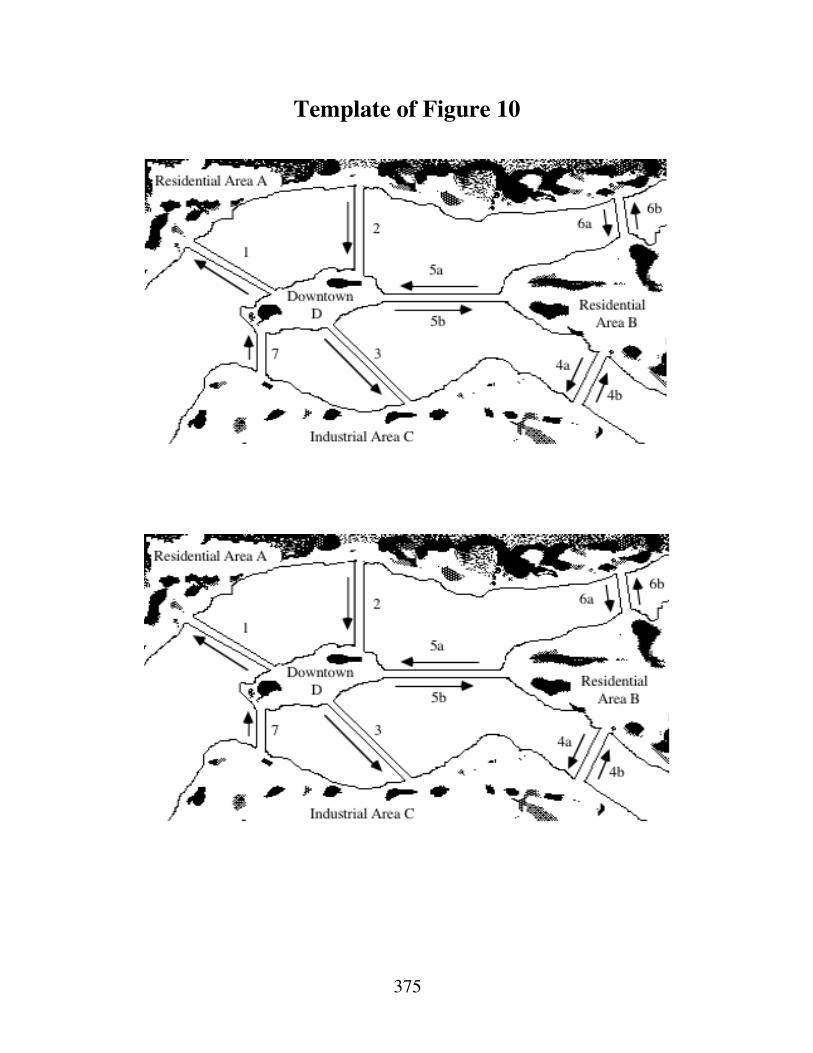
375
Template of Figure 10


One Dish and Two Cones
Shapes based on conic sections are commonplace in our technological society. In this module, you learn to recognize conic shapes and investigate some of their properties.
Wendy Driscoll • Mary Ann Miller • Deanna Turley
379
Teacher Edition One Dish and Two Cones
Overview This module introduces students to conic sections using paper folding and geometric constructions. These activities give students an opportunity to examine the concepts of tangency to a curve and local linearity. In Activity 4, students explore the reflective properties of the parabola.
Objectives In this module, students will: • create four conic sections by tracing a locus of points on a geometry utility • use geometric relationships among preimages and images in a reflection in a
line • investigate the local linearity of curves • explore the reflective properties of the parabola.
Prerequisites For this module, students should know • the definition of perpendicular bisector • the principles of reflection in a line • the definition of a tangent line to a circle • how to recognize line symmetry and rotational symmetry.
Time Line Activity Intro. 1 2 3 4 Summary
Assessment Total
Days 1 2 2 2 1 1 9

380
Materials Required Materials Activity
Intro. 1 2 3 4 Summary Assessment
flashlights X cardboard X
straightedge X X circle template X X
MIRAs™ X X compass X
0.5-cm graph paper X conic template X X X X X
conic graph paper X
Teacher Note Blackline masters for the circle template, conic template, and conic graph paper appear at the end of the teacher edition FOR THIS MODULE.
Technology Software Activity
Intro. 1 2 3 4 Summary Assessment
geometry utility X X X X X graphing utility X
381
One Dish and Two Cones
Introduction (page 275) Students use flashlights to produce the shapes of conic sections.
Materials List • flashlights (one per group) • cardboard or posterboard (one sheet per group)
Exploration (page 275) By holding a flashlight pointed toward the floor, students can move a sheet of cardboard through the cone of light to simulate slicing a cone with a plane. Students should find it easy to recognize a circle and an ellipse. They may have more difficulty distinguishing between a hyperbola and a parabola. You may wish to conduct this exploration as a demonstration. The answer to Discussion Part a provides specific instructions.
Discussion (page 276) a. 1. Sample response: To create a circle, hold the cardboard parallel to
the floor. 2. Sample response: Holding the cardboard at a slight angle from the
parallel produces an ellipse. Note: Slicing a cone with a plane in this manner continues to produce an ellipse until the plane is parallel with an element of the cone.
3. Student descriptions will vary. Slicing the cone with a plane parallel to an element of the cone (but not containing an element) produces a parabola.
4. Sample response: Holding the cardboard so that it slices both nappes of the cone (not at the apex) produces a hyperbola.
b. 1. The degenerate conic sections are a point, a line and two intersecting lines.
2. When the plane intersects the cone only at the apex, the intersection is a point. When the plane intersects the cone in an element generating the cone, the intersection is a line. When the plane contains the apex and is perpendicular to the flat surface, the intersection forms two intersecting lines.
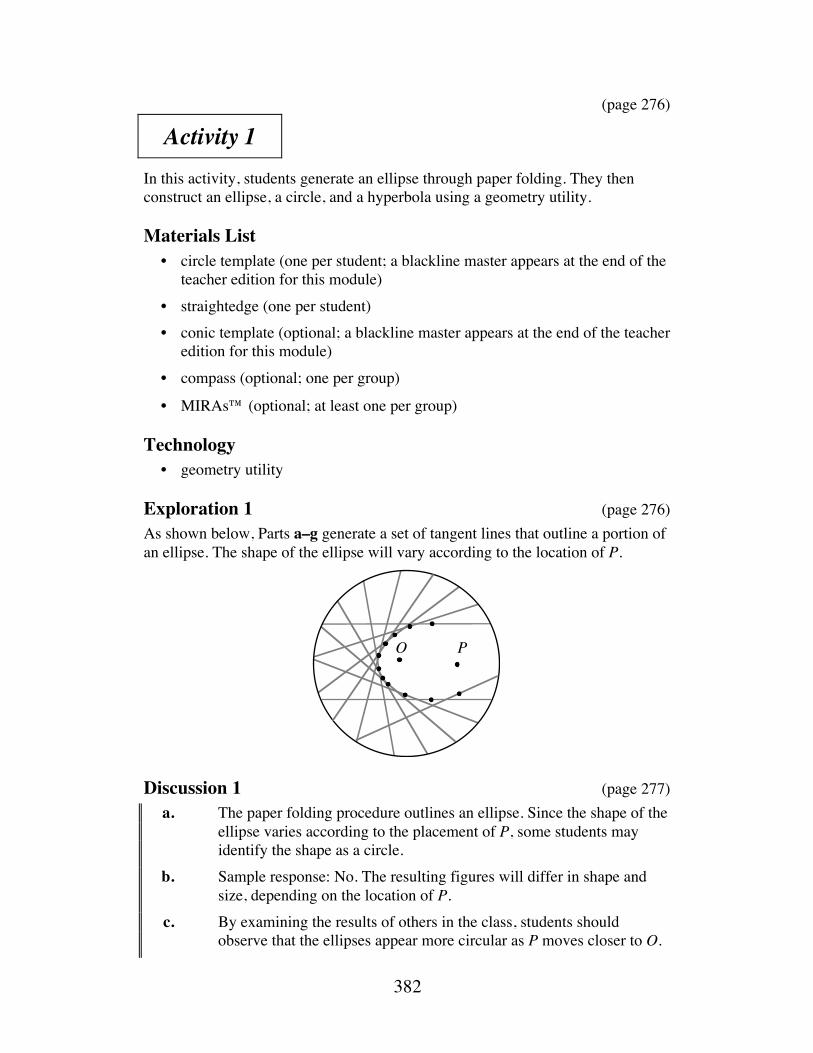
382
(page 276)
Activity 1 In this activity, students generate an ellipse through paper folding. They then construct an ellipse, a circle, and a hyperbola using a geometry utility.
Materials List • circle template (one per student; a blackline master appears at the end of the
teacher edition for this module) • straightedge (one per student) • conic template (optional; a blackline master appears at the end of the teacher
edition for this module) • compass (optional; one per group)
• MIRAs™ (optional; at least one per group)
Technology • geometry utility
Exploration 1 (page 276) As shown below, Parts a–g generate a set of tangent lines that outline a portion of an ellipse. The shape of the ellipse will vary according to the location of P.
Discussion 1 (page 277) a. The paper folding procedure outlines an ellipse. Since the shape of the
ellipse varies according to the placement of P, some students may identify the shape as a circle.
b. Sample response: No. The resulting figures will differ in shape and size, depending on the location of P.
c. By examining the results of others in the class, students should observe that the ellipses appear more circular as P moves closer to O.
O˚
P
383
d. Sample response: The crease line is the perpendicular bisector of PP1 .
e. Sample response: The lines represented by creases determine the shape for the conic. Each of these lines is tangent to the ellipse.
f. Sample response: They are the points of tangency for the ellipse and the lines created by the creases.
Exploration 2 (page 278) Students simulate the paper-folding process in Exploration 1 using a geometry utility. The conic is generated by moving P1 about the circle while tracing the locus of points defined by X, the point of tangency of the line and the conic. a–g. As P1 is moved around the circle, the path traced by X produces an
ellipse. h. When P is located at the center O, a circle is formed. When P1 is
located outside the circle, a hyperbola is formed.
Discussion 2 (page 279) a. Sample response: Part d in Exploration 2 corresponds to forming the
crease because they both result in constructing the perpendicular bisector of PP1 .
b. 1. When P is inside the circle, but not at the center, an ellipse is formed.
2. When P is at the center of the circle, a circle is formed. 3. When P is outside the circle, a hyperbola is formed. 4. When P is on the circle, a point (one of the degenerate conics) is
formed. The point is the circle’s center.
Note: You may wish to point out that PP1 is a chord. The perpendicular bisector of a chord always passes through the center of the circle containing the chord. Students may recall this fact from the Level 2 module “Traditional Design.”
c. For the three conics generated in Exploration 2 (a circle, an ellipse, and a hyperbola), both O and P are contained in the interior of the conic.
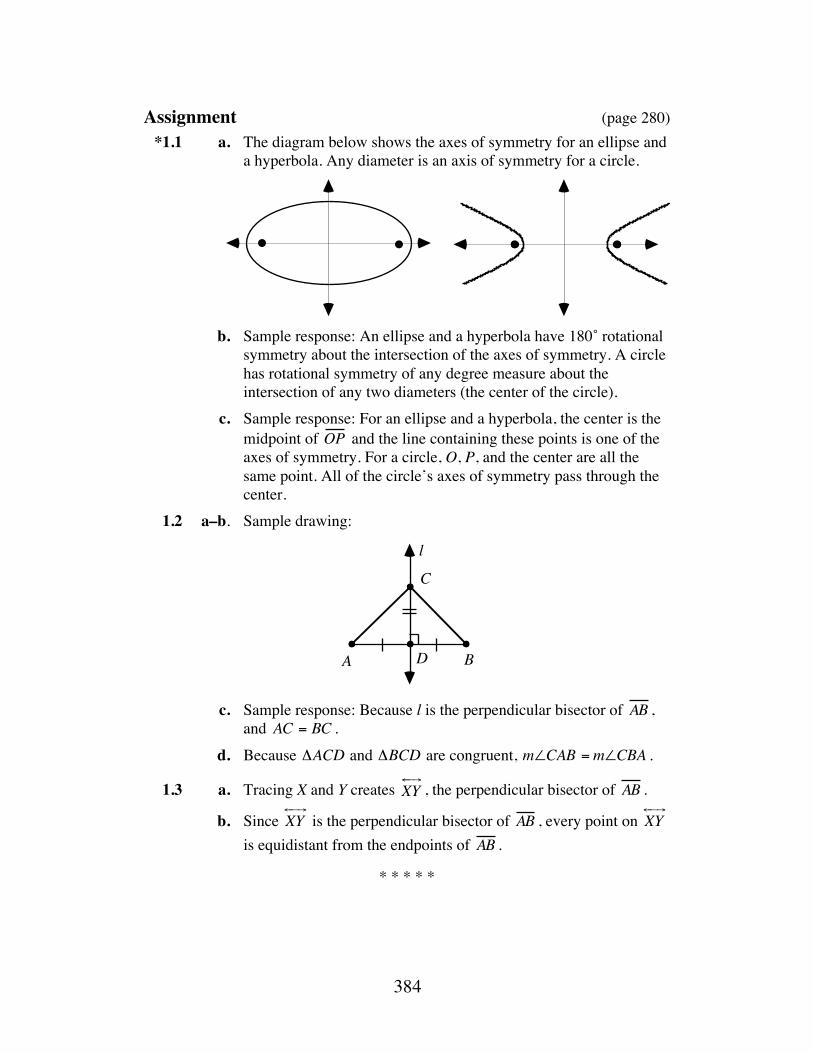
384
Assignment (page 280) *1.1 a. The diagram below shows the axes of symmetry for an ellipse and
a hyperbola. Any diameter is an axis of symmetry for a circle.
b. Sample response: An ellipse and a hyperbola have 180˚ rotational
symmetry about the intersection of the axes of symmetry. A circle has rotational symmetry of any degree measure about the intersection of any two diameters (the center of the circle).
c. Sample response: For an ellipse and a hyperbola, the center is the midpoint of OP and the line containing these points is one of the axes of symmetry. For a circle, O, P, and the center are all the same point. All of the circle’s axes of symmetry pass through the center.
1.2 a–b. Sample drawing:
c. Sample response: Because l is the perpendicular bisector of AB ,
and AC = BC . d. Because ΔACD and ΔBCD are congruent, m∠CAB =m∠CBA .
1.3 a. Tracing X and Y creates ← → ⎯
XY , the perpendicular bisector of AB .
b. Since ← → ⎯
XY is the perpendicular bisector of AB , every point on ← → ⎯
XY is equidistant from the endpoints of AB .
* * * * *
A B
C
l
D
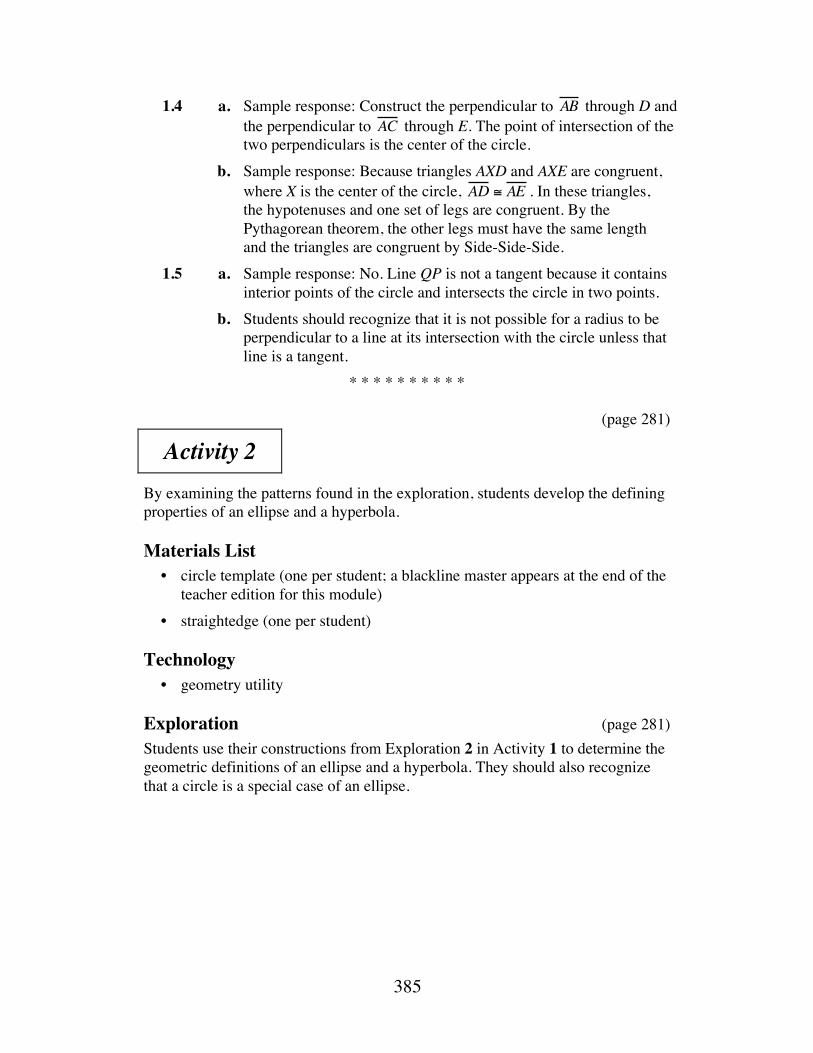
385
1.4 a. Sample response: Construct the perpendicular to AB through D and the perpendicular to AC through E. The point of intersection of the two perpendiculars is the center of the circle.
b. Sample response: Because triangles AXD and AXE are congruent, where X is the center of the circle, AD ≅ AE . In these triangles, the hypotenuses and one set of legs are congruent. By the Pythagorean theorem, the other legs must have the same length and the triangles are congruent by Side-Side-Side.
1.5 a. Sample response: No. Line QP is not a tangent because it contains interior points of the circle and intersects the circle in two points.
b. Students should recognize that it is not possible for a radius to be perpendicular to a line at its intersection with the circle unless that line is a tangent.
* * * * * * * * * * (page 281)
Activity 2 By examining the patterns found in the exploration, students develop the defining properties of an ellipse and a hyperbola.
Materials List • circle template (one per student; a blackline master appears at the end of the
teacher edition for this module) • straightedge (one per student)
Technology • geometry utility
Exploration (page 281) Students use their constructions from Exploration 2 in Activity 1 to determine the geometric definitions of an ellipse and a hyperbola. They should also recognize that a circle is a special case of an ellipse.
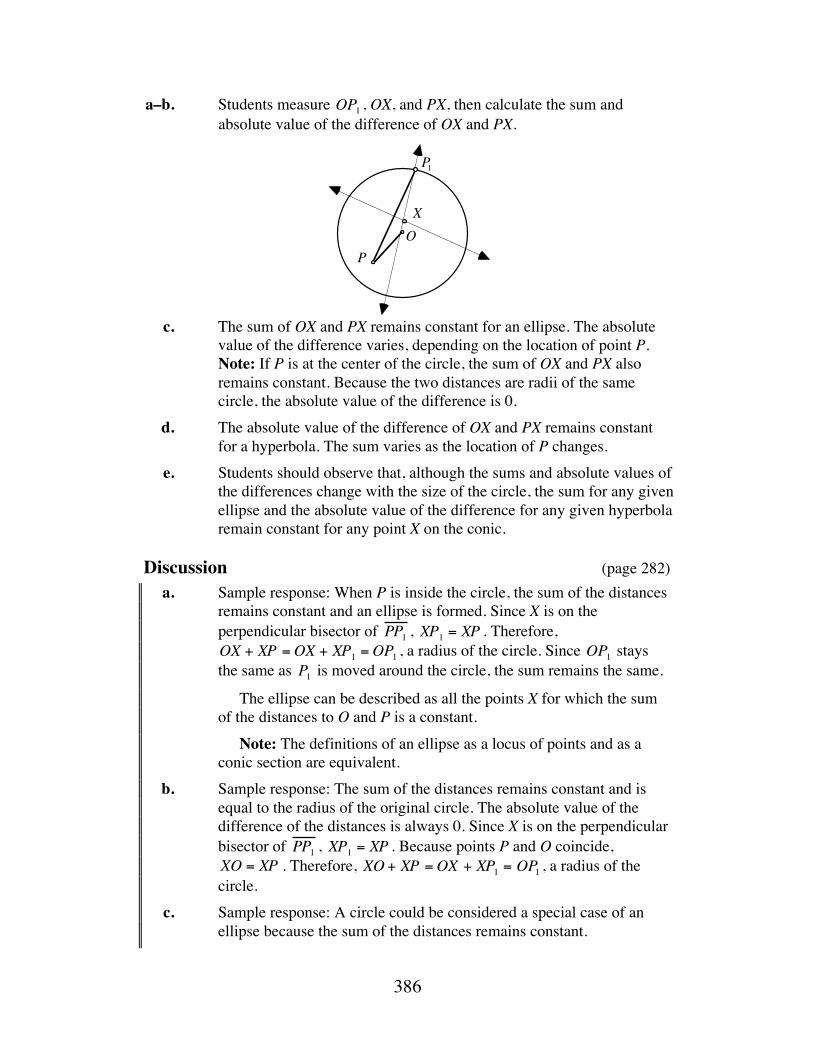
386
a–b. Students measure OP1 , OX, and PX, then calculate the sum and absolute value of the difference of OX and PX.
c. The sum of OX and PX remains constant for an ellipse. The absolute
value of the difference varies, depending on the location of point P. Note: If P is at the center of the circle, the sum of OX and PX also remains constant. Because the two distances are radii of the same circle, the absolute value of the difference is 0.
d. The absolute value of the difference of OX and PX remains constant for a hyperbola. The sum varies as the location of P changes.
e. Students should observe that, although the sums and absolute values of the differences change with the size of the circle, the sum for any given ellipse and the absolute value of the difference for any given hyperbola remain constant for any point X on the conic.
Discussion (page 282) a. Sample response: When P is inside the circle, the sum of the distances
remains constant and an ellipse is formed. Since X is on the perpendicular bisector of PP1 , XP1 = XP . Therefore, OX + XP =OX + XP1 =OP1 , a radius of the circle. Since OP1 stays the same as P1 is moved around the circle, the sum remains the same.
The ellipse can be described as all the points X for which the sum of the distances to O and P is a constant.
Note: The definitions of an ellipse as a locus of points and as a conic section are equivalent.
b. Sample response: The sum of the distances remains constant and is equal to the radius of the original circle. The absolute value of the difference of the distances is always 0. Since X is on the perpendicular bisector of PP1 , XP1 = XP . Because points P and O coincide, XO = XP . Therefore, XO + XP =OX + XP1 = OP1 , a radius of the circle.
c. Sample response: A circle could be considered a special case of an ellipse because the sum of the distances remains constant.
P1
OP
X
387
d. Sample response: When P is outside the circle, the absolute value of the difference of the distances remains constant and a hyperbola is formed. Since X is on the perpendicular bisector of PP1 , XP1 = XP . If PX >OX, then XP1 =OX +OP1 = XP . Therefore, XP −OX =OP1 . If OX > PX , then OX = XP1 +OP1 = XP +OP1. Therefore, OX − XP =OP1 .
The hyperbola can be described as all the points X for which the absolute value of the difference of the distances to O and P is a constant.
e. The foci of the constructed ellipse are located at O and P. f. The foci of the constructed hyperbola are located at O and P.
Assignment (page 283) 2.1 Sample response: In this case, ∠OXE and ∠P1XD are vertical angles;
therefore, they are congruent. Since P1 is the image of P in a reflection in the crease line, ∠PXD and ∠P1XD are congruent. Therefore, ∠OXE and ∠PXD are congruent. Since the outgoing angle must be congruent to the incoming angle, the light ray will be reflected along the path from X to P.
2.2 a. Sample response: These two lengths are equal. This can be demonstrated by folding the paper along the crease or proved by the properties of a perpendicular bisector: any point on the perpendicular bisector of a segment is equidistant from the ends of the segment.
b. Sample response: The lengths of PX and P1X are equal for any location of X on the perpendicular bisector of PP1 . When the paper is folded along the crease, segments drawn from P and P1 to any point on the crease always overlay each other or are the reflection images of each other in the line containing the perpendicular bisector.
*2.3 a. Students use paper folding to investigate the geometric relationships that exist in their constructions of the hyperbola.
b. Sample response: When the paper is folded along the crease, PD and P1D overlay each other and P is the reflection image of P1 in the crease line. Therefore D is the midpoint of PP1 and the crease bisects PP1 . Point X is its own image in the reflection (as is point D). Therefore ∠XDP1 ≅ ∠XDP and the two angles are right angles and the crease is also perpendicular to PP1 . Thus, the crease is the perpendicular bisector of PP1 .
c. Sample response: These two angles are vertical angles formed by intersecting lines and thus are congruent.
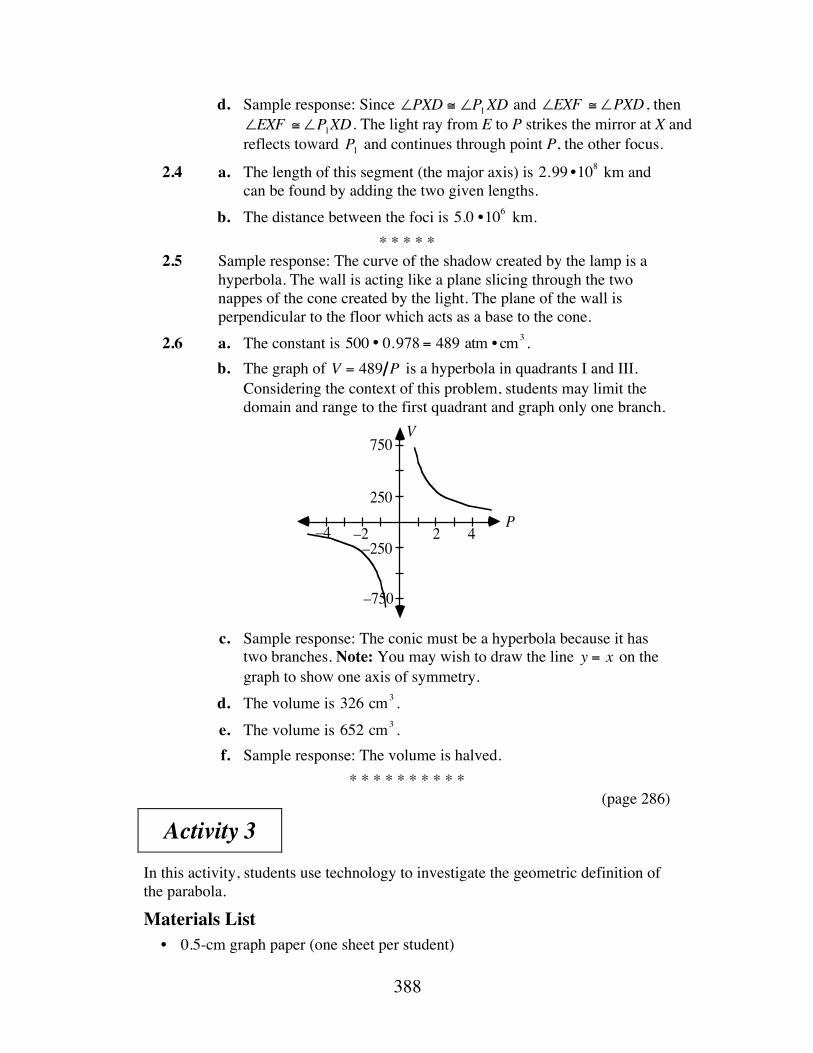
388
d. Sample response: Since ∠PXD ≅ ∠P1XD and ∠EXF ≅ ∠PXD , then ∠EXF ≅ ∠P1XD. The light ray from E to P strikes the mirror at X and reflects toward P1 and continues through point P, the other focus.
2.4 a. The length of this segment (the major axis) is 2.99 •108 km and can be found by adding the two given lengths.
b. The distance between the foci is 5.0 •106 km. * * * * *
2.5 Sample response: The curve of the shadow created by the lamp is a hyperbola. The wall is acting like a plane slicing through the two nappes of the cone created by the light. The plane of the wall is perpendicular to the floor which acts as a base to the cone.
2.6 a. The constant is 500 • 0.978 = 489 atm • cm3 . b. The graph of V = 489 P is a hyperbola in quadrants I and III.
Considering the context of this problem, students may limit the domain and range to the first quadrant and graph only one branch.
c. Sample response: The conic must be a hyperbola because it has
two branches. Note: You may wish to draw the line y = x on the graph to show one axis of symmetry.
d. The volume is 326 cm3 . e. The volume is 652 cm3 . f. Sample response: The volume is halved.
* * * * * * * * * * (page 286)
Activity 3 In this activity, students use technology to investigate the geometric definition of the parabola.
Materials List • 0.5-cm graph paper (one sheet per student)
2 4–2
250
–250
750
–4
–750
V
P
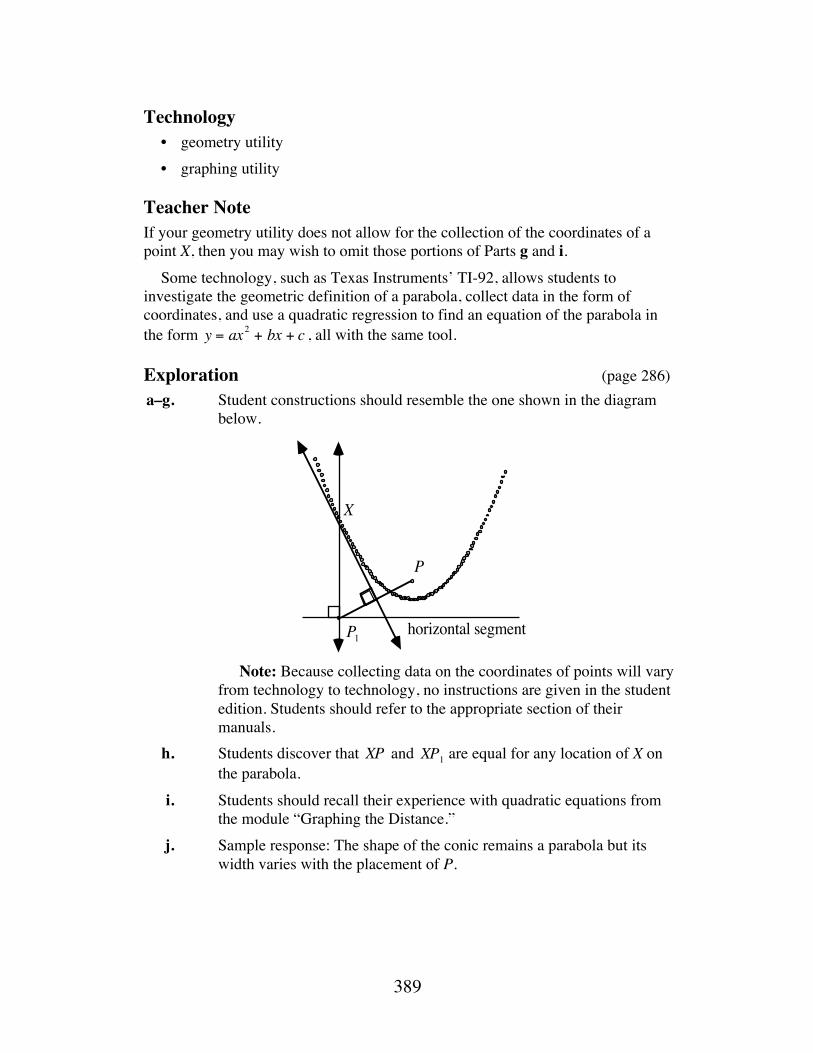
389
Technology • geometry utility • graphing utility
Teacher Note If your geometry utility does not allow for the collection of the coordinates of a point X, then you may wish to omit those portions of Parts g and i. Some technology, such as Texas Instruments’ TI-92, allows students to investigate the geometric definition of a parabola, collect data in the form of coordinates, and use a quadratic regression to find an equation of the parabola in the form y = ax2 + bx + c , all with the same tool.
Exploration (page 286) a–g. Student constructions should resemble the one shown in the diagram
below.
Note: Because collecting data on the coordinates of points will vary
from technology to technology, no instructions are given in the student edition. Students should refer to the appropriate section of their manuals.
h. Students discover that XP and XP1 are equal for any location of X on the parabola.
i. Students should recall their experience with quadratic equations from the module “Graphing the Distance.”
j. Sample response: The shape of the conic remains a parabola but its width varies with the placement of P.
X
horizontal segment
P
P1
390
Discussion (page 287) a. Sample response: The steps in the construction of the parabola are
similar to those used to construct the ellipse. The differences are that a line is used instead of a circle and a perpendicular to the line through P1 is drawn rather than a radius to P1 . Note: Students revisit this question in Part c of the discussion in Activity 4.
b. Sample response: This line is a tangent to the parabola at X. c. Sample response: Point X is the intersection of the parabola and the
tangent line, the perpendicular bisector of PP1 . In other words, X is the point of tangency.
d. Sample response: Point X is on the perpendicular bisector of PP1 . From Problem 2.2, any point on a perpendicular bisector is equidistant from the endpoints of the segment. Therefore, PX = P1X and PX and P1X are congruent.
e. Sample response: A parabola is symmetric with respect to the line that passes through the focus and is perpendicular to the directrix.
f. Sample response: Both the focus and the vertex are located on the axis of symmetry. The directrix is perpendicular to the axis of symmetry. The vertex is the midpoint of the segment with one endpoint on the focus and the other on the directrix. Therefore, if one also knows the coordinates of the focus, one can determine the equation of the directrix, and vice versa.
Assignment (page 288) 3.1 a. Sample response: As the focus gets closer to the directrix, the
parabola gets narrower. b. Sample response: As the focus moves away from the directrix, the
parabola gets wider. *3.2 a. Sample response: 1. Draw a line (the directrix) and a fixed P not on the line (the
focus). 2. Mark a point P1 on the line.
3. Fold the paper so P1 coincides with P and crease the paper.
4. Mark the intersection of the crease and the line perpendicular to the directrix at P1 . (To construct a perpendicular to a line, one folds the line onto itself. The crease becomes the perpendicular.)
5. Repeat steps 2 through 4 for at least 15 points.
391
b. Sample response: The axis of symmetry for the parabola is the line perpendicular to the directrix through the focus.
c. Sample response: The directrix is outside the parabola, perpendicular to the axis of symmetry. The focus is located on the axis of symmetry in the interior of the parabola and is the same distance from the vertex as the directrix.
3.3 Sample response: Use paper folding to find the axis of symmetry and the vertex. Measure the distance from the vertex to the directrix, then use this distance to locate the focus. (One could also fold to locate the focus.) The focus is always located on the axis of symmetry in the interior of the parabola. By definition, the distance from the focus to the parabola equals the distance from the directrix to the parabola along the axis of symmetry.
* * * * * 3.4 a. Sample response: The equation of the axis of symmetry is
x ≈ 2.55 . The axis of symmetry divides the parabola in half. Since the ball is in the air for about 5.1 sec, the time required for it to reach its peak is approximately 5.1 2 = 2.55 sec .
b. Sample response: The approximate coordinates of the vertex are (2.55,32). The vertex represents the highest point that the ball reaches before it starts falling to the ground.
c. Sample response: The focus of each parabola is located in the parabola’s interior. In Problem 3.3, the focus is above the vertex, while the directrix is below the vertex. In this case, the focus is below the vertex and the directrix is above it.
d. Students should recall their experience with this situation from the Level 3 module “Graphing the Distance.” Sample responses: d(t) = −4.9t2 + 25t or d(t) = −4.9(x − 2.55)2 + 32 .
* * * * * * * * * * (page 289)
Activity 4 In this activity, students examine the reflective properties of curved surfaces in general and of the parabola in particular.
Materials List • none
Technology • geometry utility
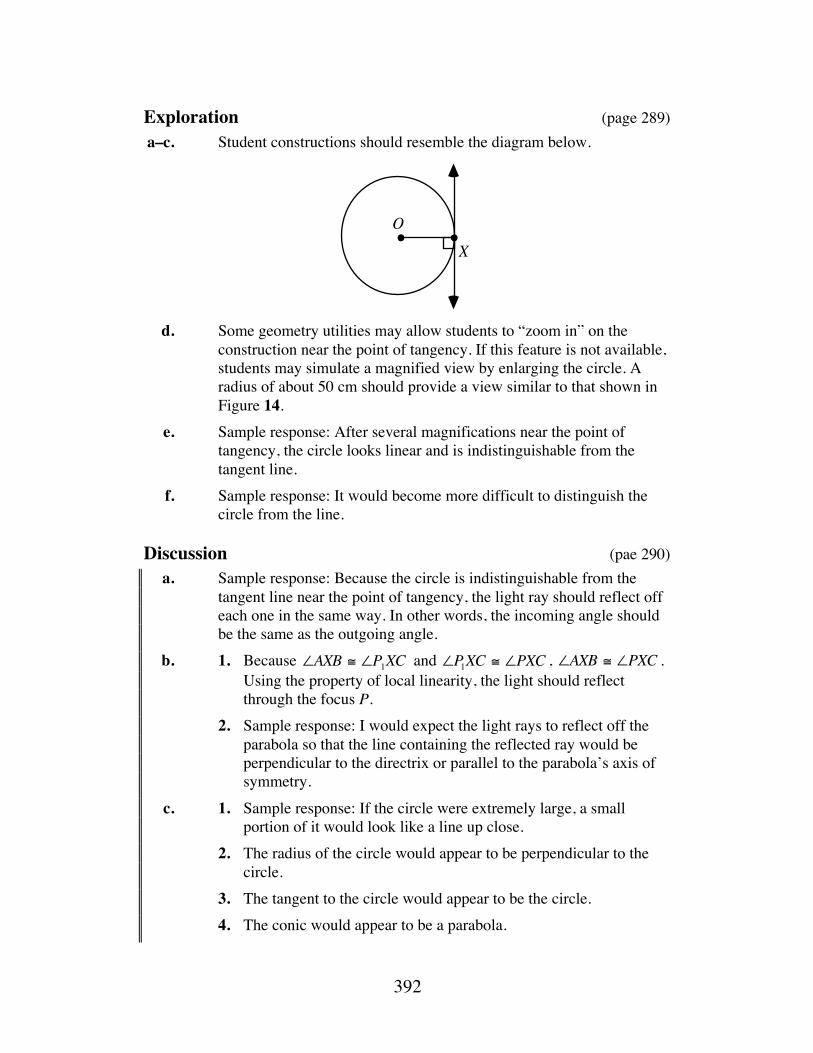
392
Exploration (page 289) a–c. Student constructions should resemble the diagram below.
d. Some geometry utilities may allow students to “zoom in” on the
construction near the point of tangency. If this feature is not available, students may simulate a magnified view by enlarging the circle. A radius of about 50 cm should provide a view similar to that shown in Figure 14.
e. Sample response: After several magnifications near the point of tangency, the circle looks linear and is indistinguishable from the tangent line.
f. Sample response: It would become more difficult to distinguish the circle from the line.
Discussion (pae 290) a. Sample response: Because the circle is indistinguishable from the
tangent line near the point of tangency, the light ray should reflect off each one in the same way. In other words, the incoming angle should be the same as the outgoing angle.
b. 1. Because ∠AXB ≅ ∠P1XC and ∠P1XC ≅ ∠PXC , ∠AXB ≅ ∠PXC . Using the property of local linearity, the light should reflect through the focus P.
2. Sample response: I would expect the light rays to reflect off the parabola so that the line containing the reflected ray would be perpendicular to the directrix or parallel to the parabola’s axis of symmetry.
c. 1. Sample response: If the circle were extremely large, a small portion of it would look like a line up close.
2. The radius of the circle would appear to be perpendicular to the circle.
3. The tangent to the circle would appear to be the circle. 4. The conic would appear to be a parabola.
OX
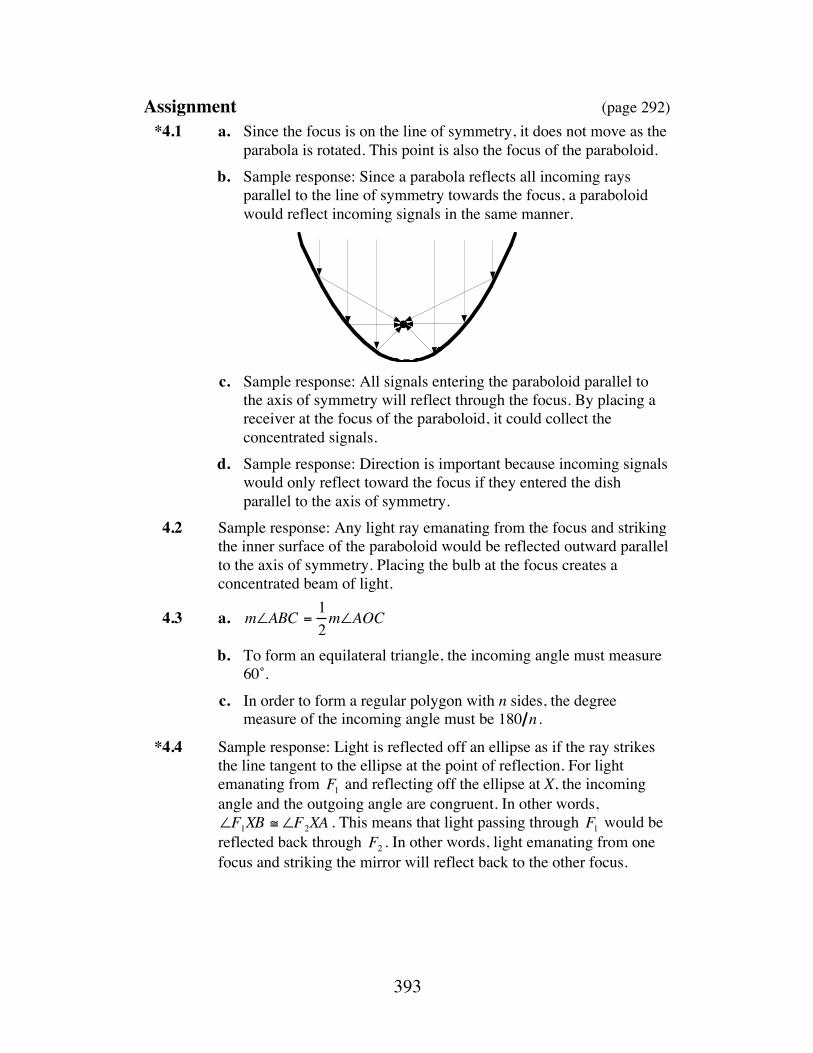
393
Assignment (page 292) *4.1 a. Since the focus is on the line of symmetry, it does not move as the
parabola is rotated. This point is also the focus of the paraboloid. b. Sample response: Since a parabola reflects all incoming rays
parallel to the line of symmetry towards the focus, a paraboloid would reflect incoming signals in the same manner.
c. Sample response: All signals entering the paraboloid parallel to
the axis of symmetry will reflect through the focus. By placing a receiver at the focus of the paraboloid, it could collect the concentrated signals.
d. Sample response: Direction is important because incoming signals would only reflect toward the focus if they entered the dish parallel to the axis of symmetry.
4.2 Sample response: Any light ray emanating from the focus and striking the inner surface of the paraboloid would be reflected outward parallel to the axis of symmetry. Placing the bulb at the focus creates a concentrated beam of light.
4.3 a. m∠ABC =12m∠AOC
b. To form an equilateral triangle, the incoming angle must measure 60˚.
c. In order to form a regular polygon with n sides, the degree measure of the incoming angle must be 180 n .
*4.4 Sample response: Light is reflected off an ellipse as if the ray strikes the line tangent to the ellipse at the point of reflection. For light emanating from F1 and reflecting off the ellipse at X, the incoming angle and the outgoing angle are congruent. In other words, ∠F1XB ≅ ∠F2XA . This means that light passing through F1 would be reflected back through F2 . In other words, light emanating from one focus and striking the mirror will reflect back to the other focus.
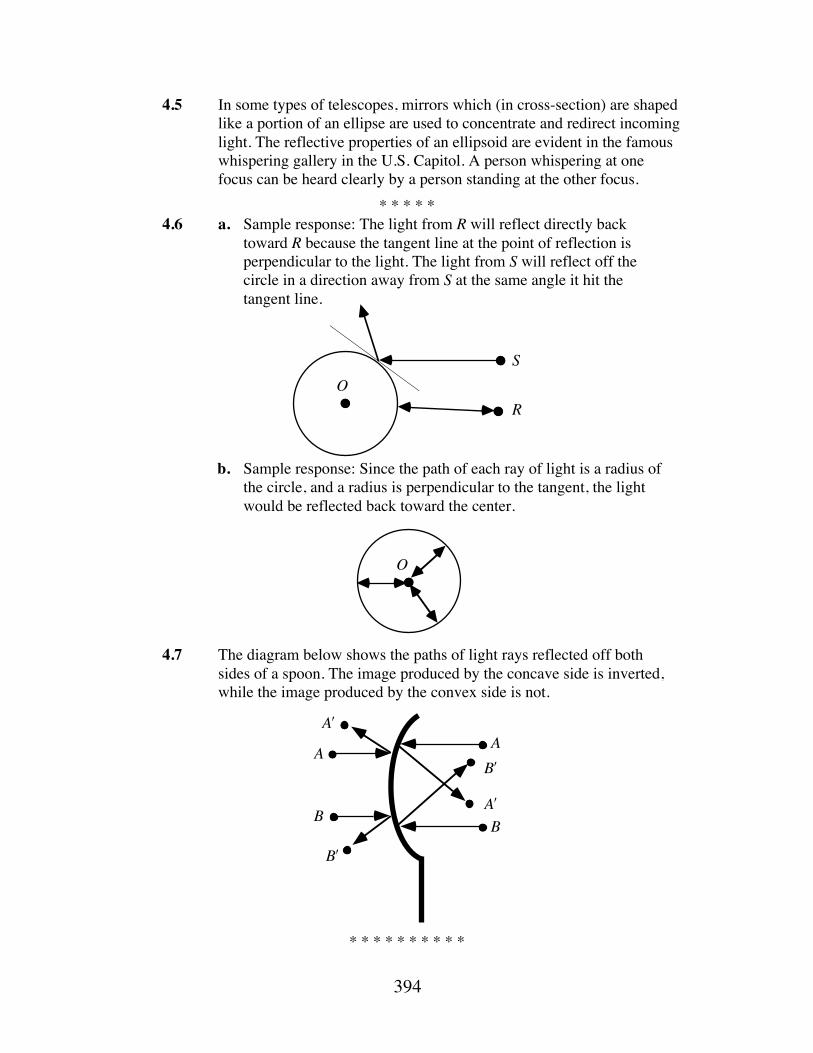
394
OS
R
4.5 In some types of telescopes, mirrors which (in cross-section) are shaped like a portion of an ellipse are used to concentrate and redirect incoming light. The reflective properties of an ellipsoid are evident in the famous whispering gallery in the U.S. Capitol. A person whispering at one focus can be heard clearly by a person standing at the other focus.
* * * * * 4.6 a. Sample response: The light from R will reflect directly back
toward R because the tangent line at the point of reflection is perpendicular to the light. The light from S will reflect off the circle in a direction away from S at the same angle it hit the tangent line.
b. Sample response: Since the path of each ray of light is a radius of
the circle, and a radius is perpendicular to the tangent, the light would be reflected back toward the center.
4.7 The diagram below shows the paths of light rays reflected off both
sides of a spoon. The image produced by the concave side is inverted, while the image produced by the convex side is not.
* * * * * * * * * *
O
AA
BBʹ A
ʹ A
ʹ B
ʹ B
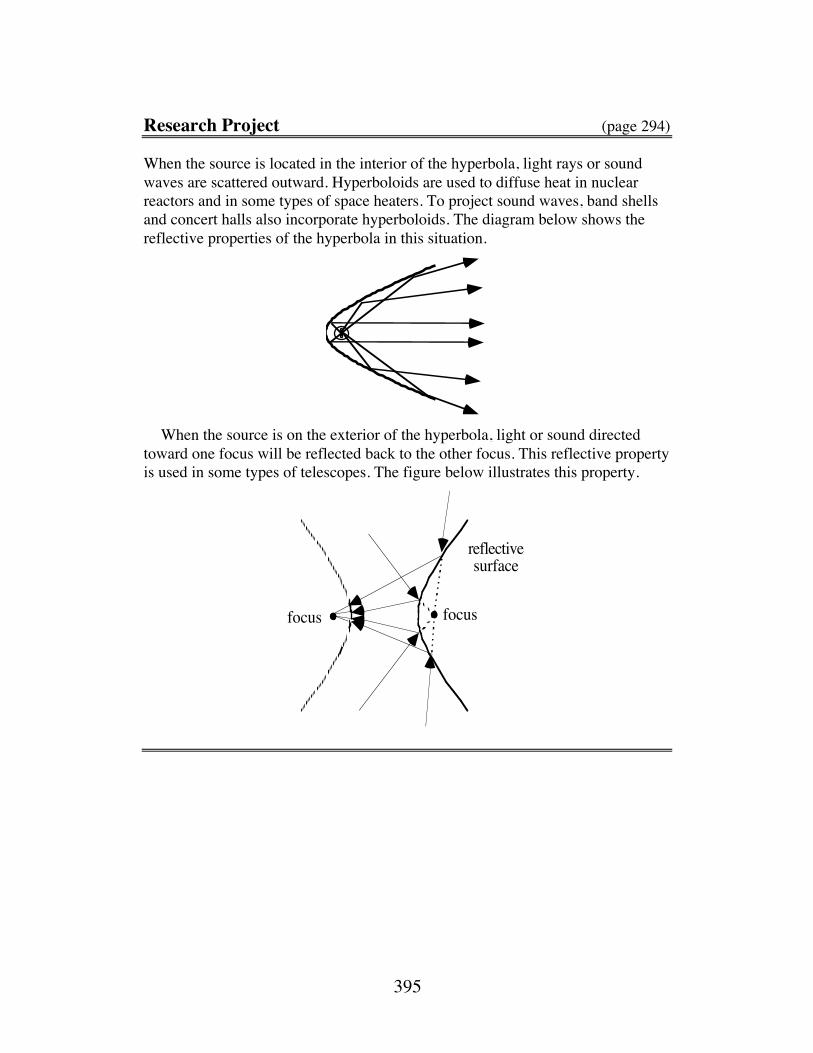
395
Research Project (page 294) When the source is located in the interior of the hyperbola, light rays or sound waves are scattered outward. Hyperboloids are used to diffuse heat in nuclear reactors and in some types of space heaters. To project sound waves, band shells and concert halls also incorporate hyperboloids. The diagram below shows the reflective properties of the hyperbola in this situation.
When the source is on the exterior of the hyperbola, light or sound directed toward one focus will be reflected back to the other focus. This reflective property is used in some types of telescopes. The figure below illustrates this property.
focus focus
reflectivesurface
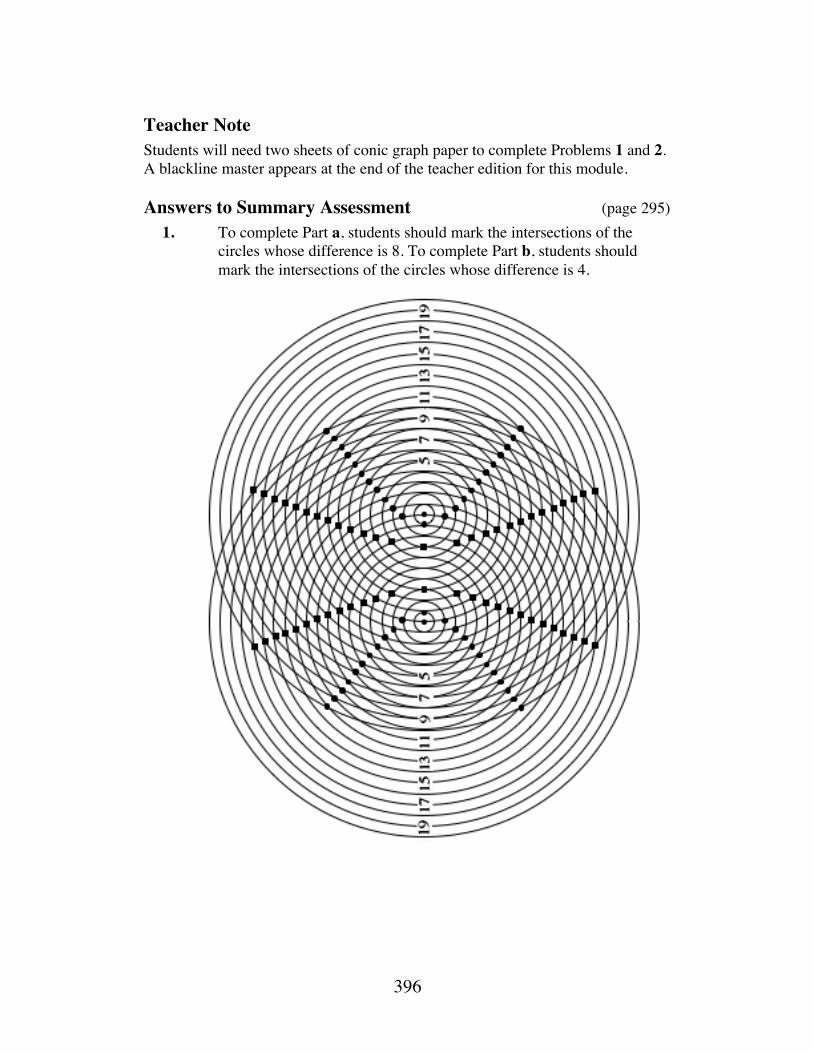
396
Teacher Note Students will need two sheets of conic graph paper to complete Problems 1 and 2. A blackline master appears at the end of the teacher edition for this module.
Answers to Summary Assessment (page 295) 1. To complete Part a, students should mark the intersections of the
circles whose difference is 8. To complete Part b, students should mark the intersections of the circles whose difference is 4.
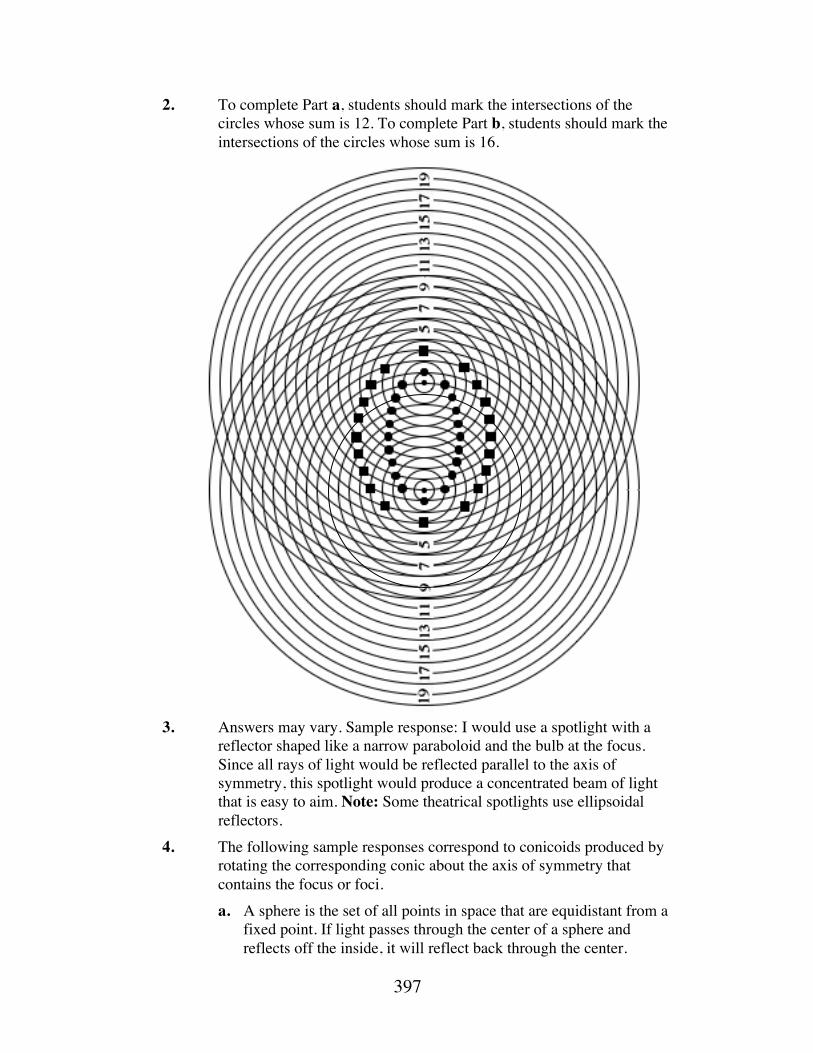
397
2. To complete Part a, students should mark the intersections of the circles whose sum is 12. To complete Part b, students should mark the intersections of the circles whose sum is 16.
3. Answers may vary. Sample response: I would use a spotlight with a
reflector shaped like a narrow paraboloid and the bulb at the focus. Since all rays of light would be reflected parallel to the axis of symmetry, this spotlight would produce a concentrated beam of light that is easy to aim. Note: Some theatrical spotlights use ellipsoidal reflectors.
4. The following sample responses correspond to conicoids produced by rotating the corresponding conic about the axis of symmetry that contains the focus or foci.
a. A sphere is the set of all points in space that are equidistant from a fixed point. If light passes through the center of a sphere and reflects off the inside, it will reflect back through the center.

398
b. A paraboloid is the set of all points in space equidistant from a focus and plane. Light rays emanating from the focus of a paraboloid will reflect off the paraboloid parallel to the axis of symmetry. Any incoming light rays parallel to the axis of symmetry will be reflected through the focus.
c. An ellipsoid is a set of all points in space such that the sum of the distances from two fixed points is a constant. If light passes through one focus of an ellipsoid and reflects off the inside, it will reflect back through the other focus.
d. A hyperboloid is a set of all points in space such that the absolute value of the difference in the distances to two fixed points is constant. Light emanating from one focus is scattered. Light directed toward one focus from the exterior will reflect back toward the other focus.
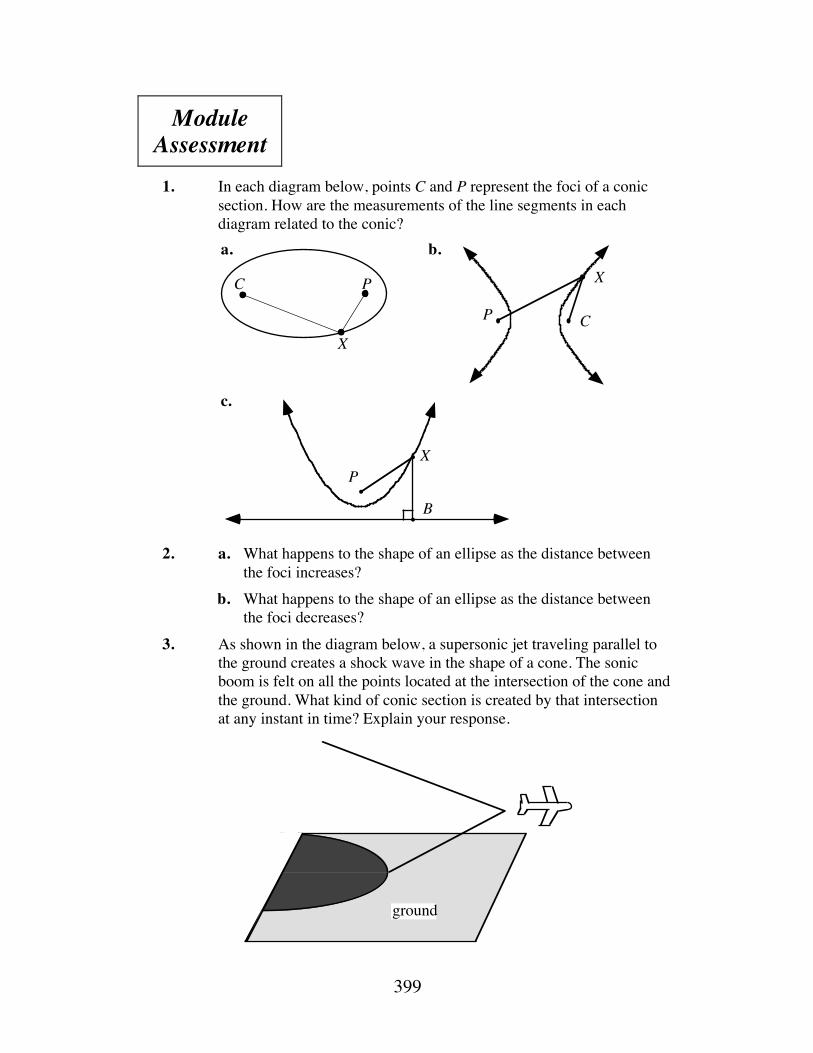
399
Module Assessment
1. In each diagram below, points C and P represent the foci of a conic
section. How are the measurements of the line segments in each diagram related to the conic?
2. a. What happens to the shape of an ellipse as the distance between
the foci increases? b. What happens to the shape of an ellipse as the distance between
the foci decreases? 3. As shown in the diagram below, a supersonic jet traveling parallel to
the ground creates a shock wave in the shape of a cone. The sonic boom is felt on all the points located at the intersection of the cone and the ground. What kind of conic section is created by that intersection at any instant in time? Explain your response.
C P
X
P
a. b.
X
C
c.
PX
B
ground
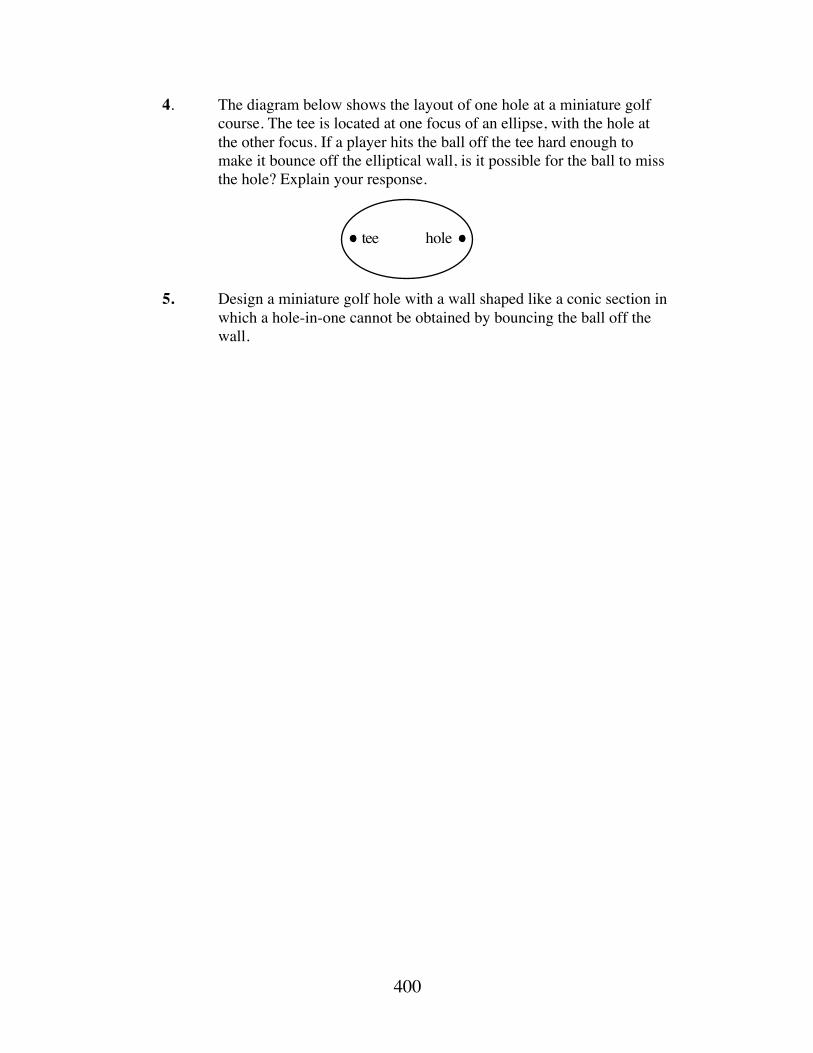
400
4. The diagram below shows the layout of one hole at a miniature golf course. The tee is located at one focus of an ellipse, with the hole at the other focus. If a player hits the ball off the tee hard enough to make it bounce off the elliptical wall, is it possible for the ball to miss the hole? Explain your response.
5. Design a miniature golf hole with a wall shaped like a conic section in
which a hole-in-one cannot be obtained by bouncing the ball off the wall.
tee hole
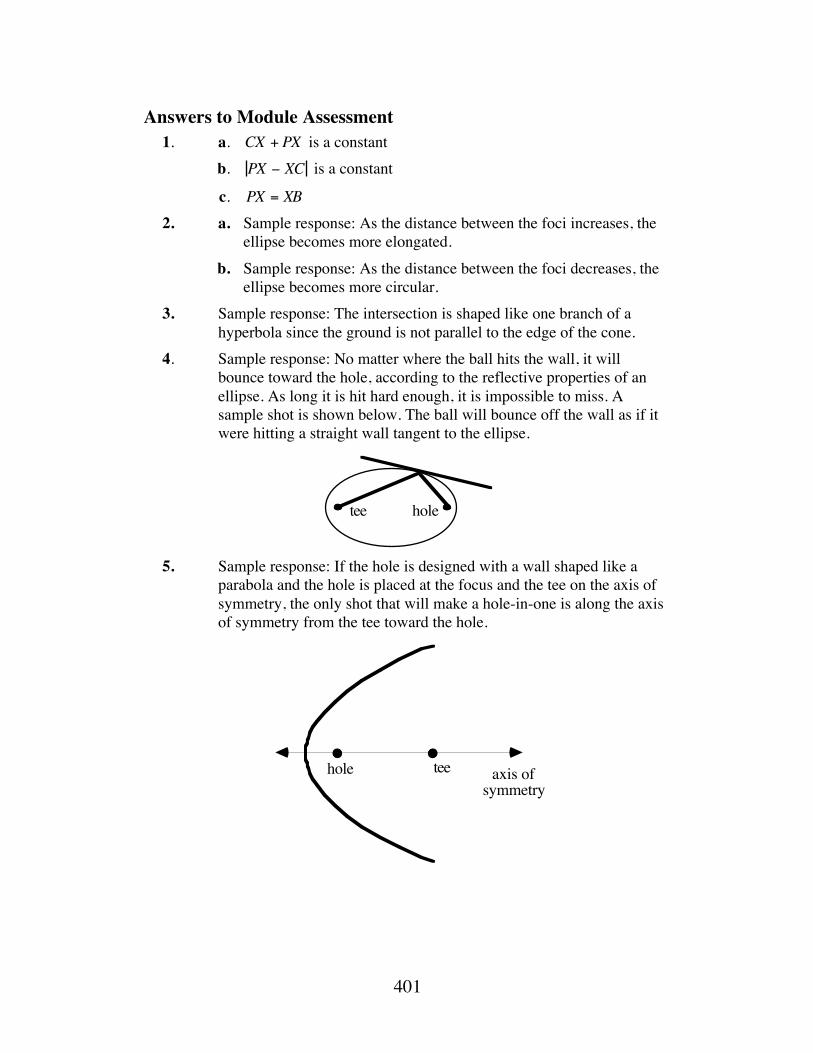
401
Answers to Module Assessment 1. a. CX + PX is a constant b. PX − XC is a constant
c. PX = XB 2. a. Sample response: As the distance between the foci increases, the
ellipse becomes more elongated. b. Sample response: As the distance between the foci decreases, the
ellipse becomes more circular. 3. Sample response: The intersection is shaped like one branch of a
hyperbola since the ground is not parallel to the edge of the cone. 4. Sample response: No matter where the ball hits the wall, it will
bounce toward the hole, according to the reflective properties of an ellipse. As long it is hit hard enough, it is impossible to miss. A sample shot is shown below. The ball will bounce off the wall as if it were hitting a straight wall tangent to the ellipse.
5. Sample response: If the hole is designed with a wall shaped like a
parabola and the hole is placed at the focus and the tee on the axis of symmetry, the only shot that will make a hole-in-one is along the axis of symmetry from the tee toward the hole.
tee hole
teehole axis ofsymmetry
402
Selected References Abell, G. O., D. Morrison, and S. C. Wolff. Exploration of the Universe.
Philadelphia: Saunders College Publishing, 1993. Consortium for Mathematics and Its Applications (COMAP). For All Practical
Purposes: Introduction to Contemporary Mathematics. New York: W. H. Freeman and Co., 1988.
Cook, N. P. Microwave Principles and Systems. Englewood Cliffs, NJ: Prentice-Hall, 1986.
Dayoub, I. M., and J. W. Lott. Geometry: Constructions and Transformations. Palo Alto, CA: Dale Seymour Publications, 1977.
Downs, J. W. Practical Conic Sections. Palo Alto, CA: Dale Seymour Publications, 1993.
Eves, H. An Introduction to the History of Mathematics. New York: Holt, Rinehart, and Winston, 1990.
Sobel, M. A., and E. M. Maletsky. Teaching Mathematics: A Sourcebook of Aids, Activities, and Strategies. Englewood Cliffs, NJ: Prentice-Hall, 1988.
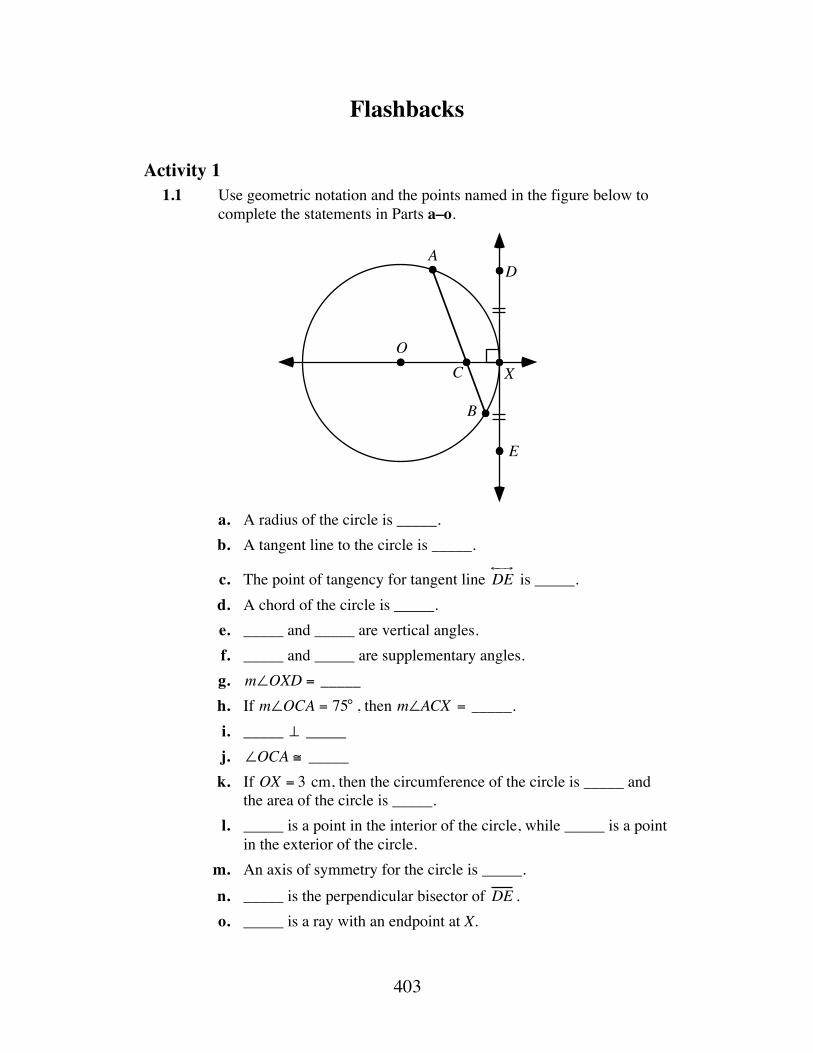
403
Flashbacks
Activity 1 1.1 Use geometric notation and the points named in the figure below to
complete the statements in Parts a–o.
a. A radius of the circle is _____. b. A tangent line to the circle is _____.
c. The point of tangency for tangent line DE← → ⎯
is _____. d. A chord of the circle is _____. e. _____ and _____ are vertical angles. f. _____ and _____ are supplementary angles. g. m∠OXD = _____ h. If m∠OCA = 75° , then m∠ACX = _____. i. _____ ⊥ _____ j. ∠OCA ≅ _____ k. If OX = 3 cm, then the circumference of the circle is _____ and
the area of the circle is _____. l. _____ is a point in the interior of the circle, while _____ is a point
in the exterior of the circle. m. An axis of symmetry for the circle is _____. n. _____ is the perpendicular bisector of DE . o. _____ is a ray with an endpoint at X.
A
OX
B
C
D
E
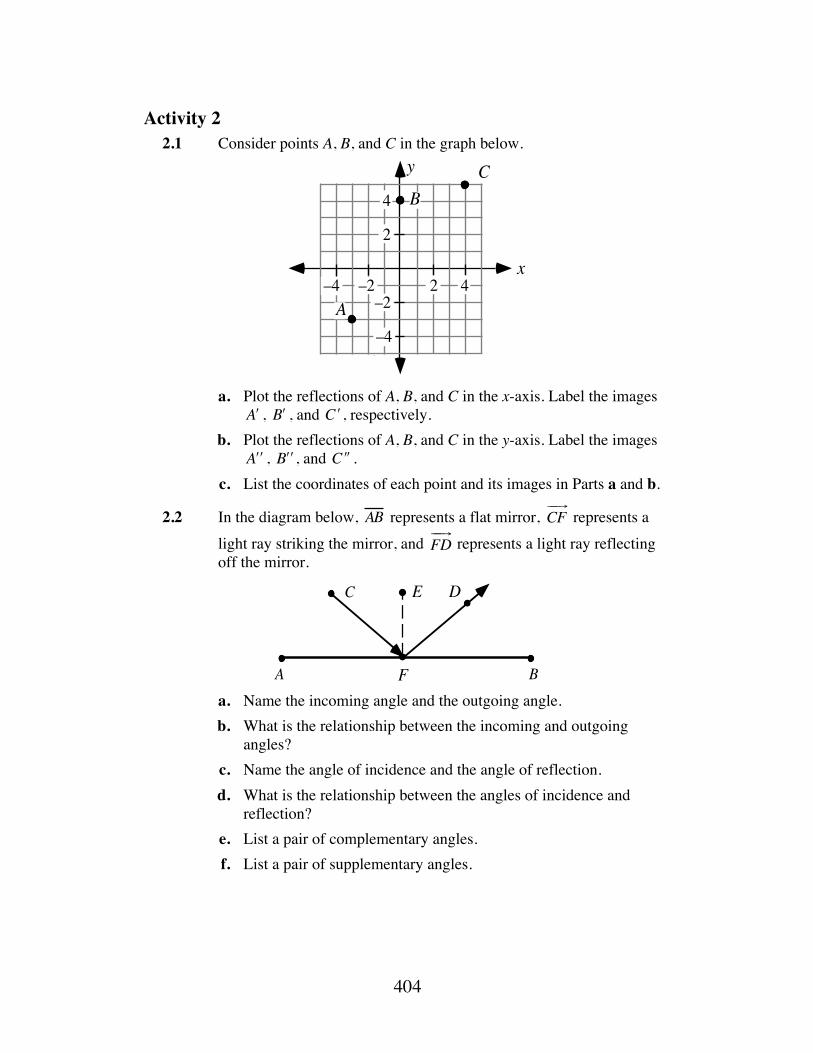
404
Activity 2 2.1 Consider points A, B, and C in the graph below.
a. Plot the reflections of A, B, and C in the x-axis. Label the images
ʹ A , ʹ B , and ʹ C , respectively. b. Plot the reflections of A, B, and C in the y-axis. Label the images
ʹ ́ A , ʹ ́ B , and ʹ ́ C . c. List the coordinates of each point and its images in Parts a and b.
2.2 In the diagram below, AB represents a flat mirror, ⎯ → ⎯
CF represents a light ray striking the mirror, and
⎯ → ⎯
FD represents a light ray reflecting off the mirror.
a. Name the incoming angle and the outgoing angle. b. What is the relationship between the incoming and outgoing
angles? c. Name the angle of incidence and the angle of reflection. d. What is the relationship between the angles of incidence and
reflection? e. List a pair of complementary angles. f. List a pair of supplementary angles.
–5
x
y
A
BC
4
2
2 4–2
–2–4
–4
A
DE
F
C
B
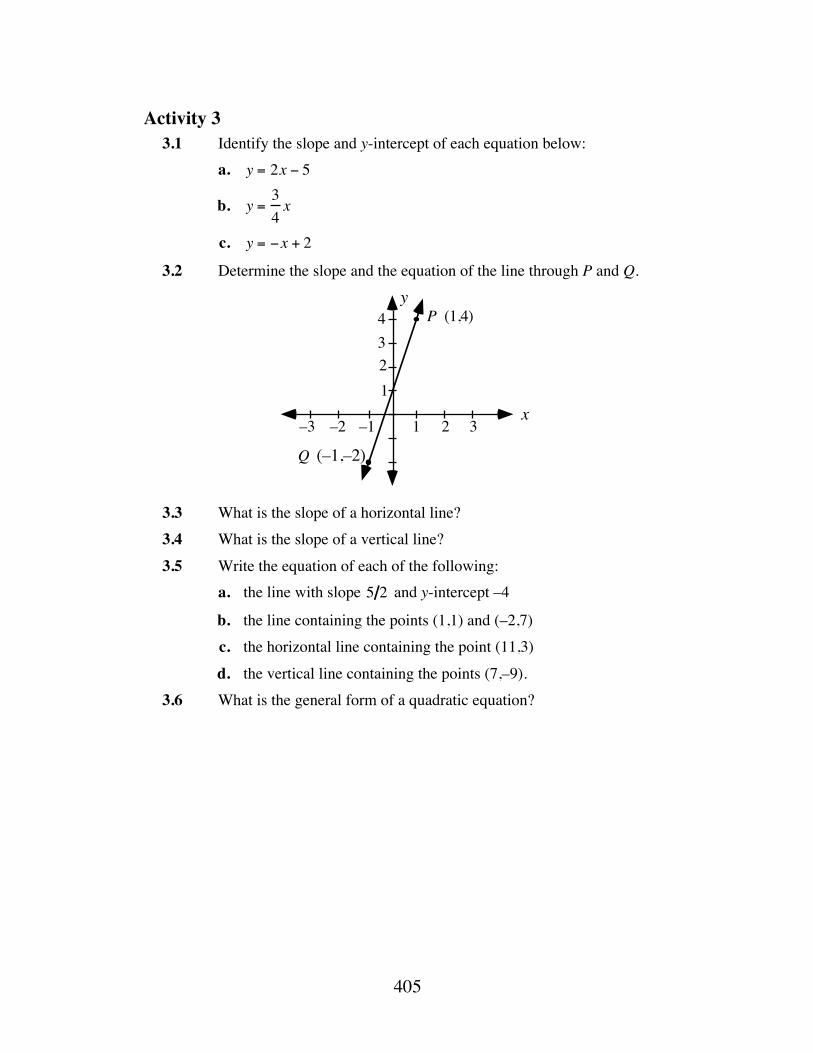
405
Activity 3 3.1 Identify the slope and y-intercept of each equation below: a. y = 2x − 5
b. y =34x
c. y = −x + 2
3.2 Determine the slope and the equation of the line through P and Q.
3.3 What is the slope of a horizontal line? 3.4 What is the slope of a vertical line? 3.5 Write the equation of each of the following: a. the line with slope 5 2 and y-intercept –4 b. the line containing the points (1,1) and (–2,7) c. the horizontal line containing the point (11,3) d. the vertical line containing the points (7,–9). 3.6 What is the general form of a quadratic equation?
(–1,–2)
x
y
–1–2–3 1 2 3
1234 (1,4)P
Q
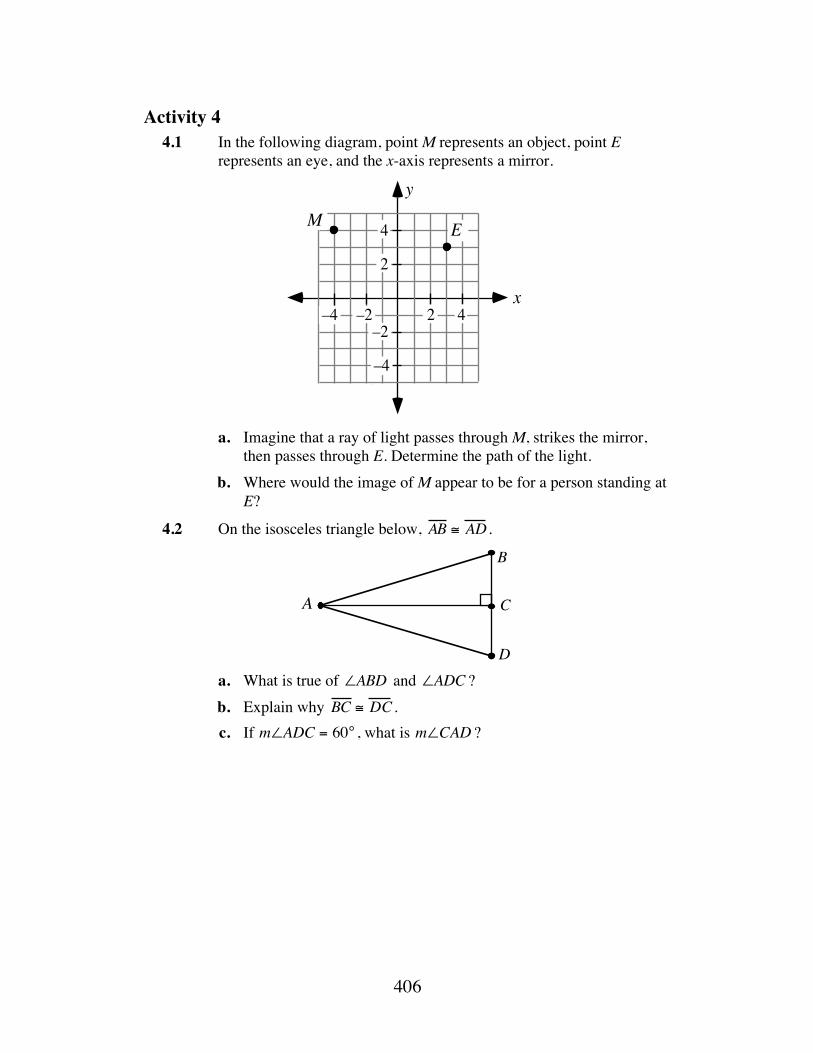
406
Activity 4 4.1 In the following diagram, point M represents an object, point E
represents an eye, and the x-axis represents a mirror.
a. Imagine that a ray of light passes through M, strikes the mirror,
then passes through E. Determine the path of the light. b. Where would the image of M appear to be for a person standing at
E?
4.2 On the isosceles triangle below, AB ≅ AD .
a. What is true of ∠ABD and ∠ADC ? b. Explain why BC ≅ DC . c. If m∠ADC = 60° , what is m∠CAD ?
–5
x
y
M 4
2
2 4–2
–2–4
–4
E
B
A C
D
407
Answers to Flashbacks
Activity 1 1.1 a. OX , OA , or OB
b. ← → ⎯
DE , ← → ⎯
XE , or ← → ⎯
DX c. X
d. AB , AX , or BX e. ∠OCA and ∠BCX or ∠ACX and ∠BCO
f. ∠OCA and ∠ACX , ∠ACX and ∠XCB , ∠XCB and ∠BCO , ∠BCO and ∠OCA , or ∠OXD and ∠OXE
g. 90˚ h. 105˚
i. OX ⊥ DE ; CX⊥DE , etc. j. ∠BCX k. The circumference is 6π cm ≈ 19 cm and the area is
9π cm2 ≈ 28 cm2 . l. Points C and O are in the interior of the circle; points D and E are
in the exterior.
m. ← → ⎯
OX , CX← → ⎯
, or OC← → ⎯
n. ← → ⎯
OX , CX← → ⎯
, or OC← → ⎯
o. ⎯ → ⎯
XO , ⎯ → ⎯
XD , ⎯ → ⎯
XE , ⎯ → ⎯
XC , XA⎯ → ⎯
, or XB⎯ → ⎯
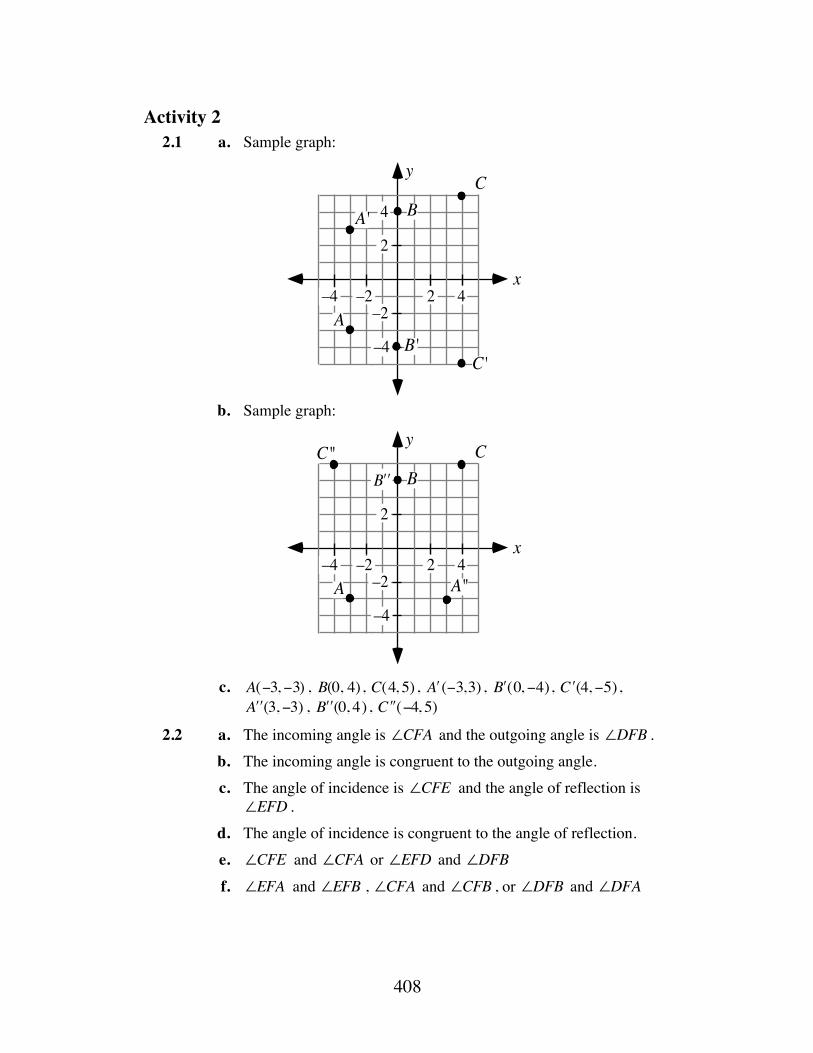
408
Activity 2 2.1 a. Sample graph:
b. Sample graph:
c. A(−3, −3) , B(0, 4), C(4, 5) , ʹ A (−3,3) , ʹ B (0, −4), ʹ C (4, −5),
ʹ ́ A (3, −3) , ʹ ́ B (0, 4) , ʹ ́ C (−4, 5)
2.2 a. The incoming angle is ∠CFA and the outgoing angle is ∠DFB . b. The incoming angle is congruent to the outgoing angle. c. The angle of incidence is ∠CFE and the angle of reflection is
∠EFD . d. The angle of incidence is congruent to the angle of reflection. e. ∠CFE and ∠CFA or ∠EFD and ∠DFB f. ∠EFA and ∠EFB , ∠CFA and ∠CFB , or ∠DFB and ∠DFA
–5
x
y
A
BC
4
2
2 4–2
–2–4
–4C'
A'
B'
–5
x
y
A
BC
2
2 4–2
–2–4
–4
C"ʹ ́ B
A"
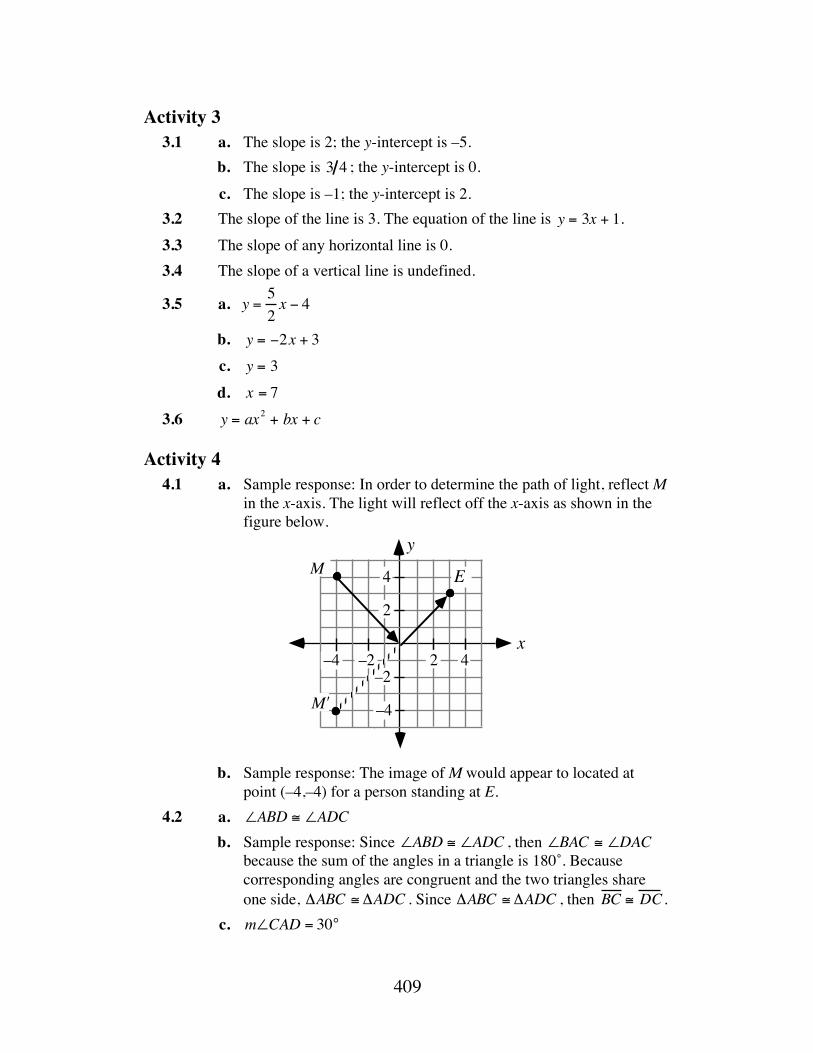
409
Activity 3 3.1 a. The slope is 2; the y-intercept is –5. b. The slope is 3 4 ; the y-intercept is 0. c. The slope is –1; the y-intercept is 2. 3.2 The slope of the line is 3. The equation of the line is y = 3x + 1. 3.3 The slope of any horizontal line is 0. 3.4 The slope of a vertical line is undefined.
3.5 a. y = 52x − 4
b. y = −2x + 3 c. y = 3 d. x = 7 3.6 y = ax2 + bx + c
Activity 4 4.1 a. Sample response: In order to determine the path of light, reflect M
in the x-axis. The light will reflect off the x-axis as shown in the figure below.
b. Sample response: The image of M would appear to located at
point (–4,–4) for a person standing at E. 4.2 a. ∠ABD ≅ ∠ADC b. Sample response: Since ∠ABD ≅ ∠ADC , then ∠BAC ≅ ∠DAC
because the sum of the angles in a triangle is 180˚. Because corresponding angles are congruent and the two triangles share one side, ΔABC ≅ ΔADC . Since ΔABC ≅ ΔADC , then BC ≅ DC .
c. m∠CAD = 30°
–5
x
y
4
2
2 4–2
–2–4
–4
E
ʹ M
M
410
Circle Template
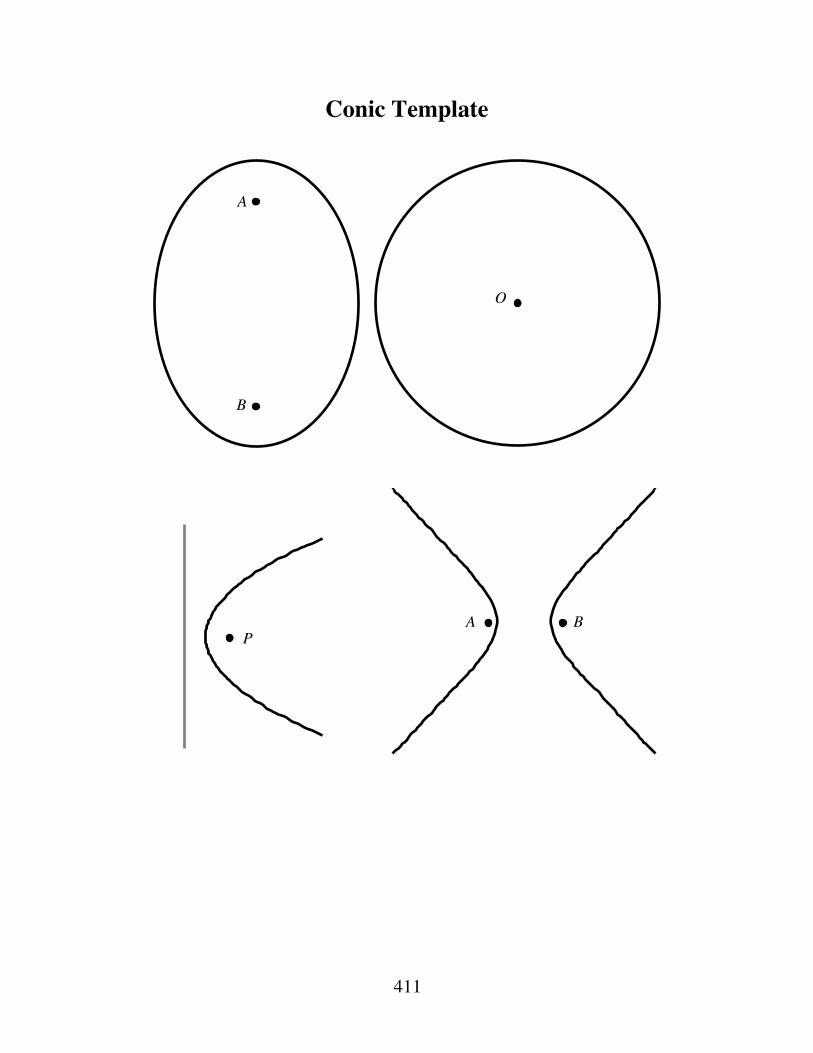
411
Conic Template
A B
O
A
B
P
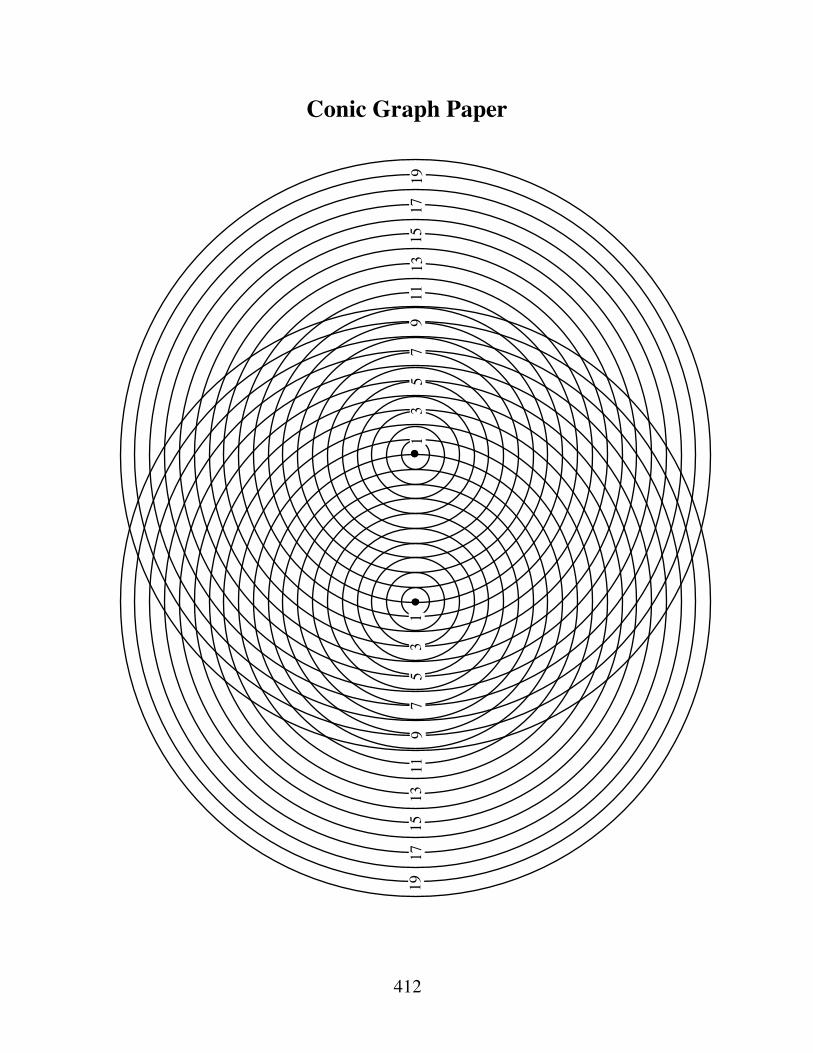
412
Conic Graph Paper
.
13
57
93
57
91
1113
1517
1911
1315
1719

Finding Gold
In this module, you investigate some connections among the golden section, the Fibonacci sequence, and Pythagorean triples.
Tom Teegarden • Deanna Turley
415
Teacher Edition Finding Gold
Overview This module uses the golden ratio, sequences, and Pythagorean triples to investigate some interesting connections between the mathematics of Pythagoras and Fibonacci. Note: In this module, the golden ratio (or golden section), represented by φ , is approximated as 1.618. The reciprocal of the golden ratio, 1 φ , is approximated as 0.618.
Objectives In this module, students will: • examine the golden ratio • investigate numerical relationships involving the golden ratio • generate sets of Pythagorean triples • investigate Fibonacci numbers • explore relationships among Fibonacci numbers, Pythagorean triples, and
the golden ratio • examine proofs of the Pythagorean theorem.
Prerequisites For this module, students should know: • how to write and apply ratios and proportions • how to find the area of a right triangle • the definition and properties of an isosceles triangle • how to represent the terms of a sequence • the definition of the limit of a sequence • how to generate sequences using explicit and recursive formulas • the Pythagorean theorem • right-triangle trigonometry.

416
Time Line Activity 1 2 3 Summary
Assessment Total
Days 2 2 3 2 9
Materials Required Materials 1 2 3 Summary
Assessment survey template X
ruler X X X protractor X X X compass X scissors X X paper X X
Teacher Note A blackline master of the survey template appears at the end of the teacher edition FOR THIS MODULE.
Technology Software 1 2 3 Summary
Assessment geometry utility X
symbolic manipulator X X X spreadsheet X
417
Finding Gold
Introduction (page 301) The introduction gives students a very brief history of the mathematics of Pythagoras and Fibonacci. (page 301)
Activity 1 Students investigate the golden rectangles and the golden ratio.
Teacher Note Before beginning Activity 1, each student should ask at least 10 different people which rectangle on the template looks the “most pleasing” and record the results. (Depending on the participants, this survey may or may not identify the golden rectangle as most pleasing.)
Materials List • rulers (one per student) • protractors (optional; one per student) • template for rectangle survey (one per student; a blackline master appears at
the end of the teacher edition for this module)
Technology • geometry utility (optional) • symbolic manipulator (optional)
Exploration 1 (page 302) a. Note: You may wish to ask students to draw their rectangles on plain,
unlined paper. b–c. The ratio l s in most student rectangles is likely to be between 4 3 and
2. d. Students may find that the majority of those surveyed consider a
golden rectangle “most pleasing” to the eye. The ratio l s in rectangle A is about 2.4, in rectangle B about 1.1, in rectangle C about 4.7, in rectangle D about 1.6, and in rectangle E about 1.2. Rectangle D is approximately a golden rectangle.
418
Discussion 1 (page 302) a. Answers may vary. The ratio l s of many student rectangles may be
about 1.6, or the golden ratio. b. Sample response: About 75% of those surveyed chose rectangle D as
“most pleasing.” Its ratio l s is about 1.6.
c. Many students are likely to draw rectangles that approximate the proportions of a golden rectangle.
d. Sample response: Rectangles with a ratio of longer-to-shorter sides approximately equal to the golden ratio seem to be “most pleasing” to most people.
Exploration 2 (page 303) Students discover the presence of the golden ratio in the ratios of many human dimensions. a–c. Students take measurements and calculate ratios. These ratios may
approximate the golden ratio. d. The means of the class ratios may be approximately 1.6.
Discussion 2 (page 303) a. Sample response: Since the means of the ratios calculated in Part d
were about 1.6, it would seem reasonable for a sculptor to use φ .
b. Answers may vary. Rectangular objects with length-to-width ratios that approximate the golden ratio include index cards and sheets of paper. Some nonrectangular objects also appear to exhibit ratios that approximate the golden ratio—for example, the ratio of height to diameter in flower pots and the ratio of length to width in the leaves of some plants.
Assignment (page 303) 1.1 a. Drawings may vary, though all should be similar. See sample
diagram given in Part e below. b. The length of the side of the square equals the length of the shorter
side of the golden rectangle. c. 1. The ratio of longer-to-shorter sides in the smaller rectangle
should be about 1.6. 2. Sample response: The smaller rectangle appears to be a
golden rectangle because it is similar to the larger rectangle. The ratio of its longer side to its shorter side is approximately the golden ratio.
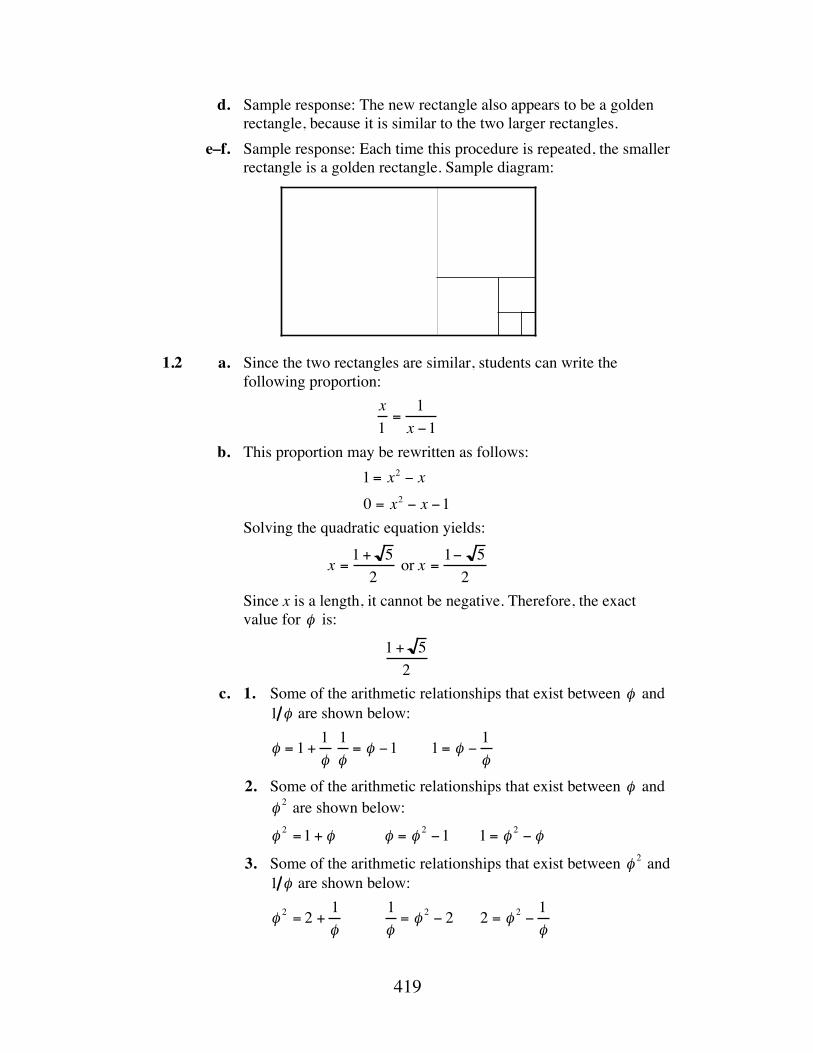
419
d. Sample response: The new rectangle also appears to be a golden rectangle, because it is similar to the two larger rectangles.
e–f. Sample response: Each time this procedure is repeated, the smaller rectangle is a golden rectangle. Sample diagram:
1.2 a. Since the two rectangles are similar, students can write the
following proportion: x1=
1x −1
b. This proportion may be rewritten as follows: 1 = x2 − x
0 = x2 − x −1
Solving the quadratic equation yields:
x =1 + 5
2 or x =
1− 52
Since x is a length, it cannot be negative. Therefore, the exact value for φ is:
1 + 52
c. 1. Some of the arithmetic relationships that exist between φ and 1 φ are shown below:
φ = 1 + 1
φ
1φ= φ −1
1 = φ − 1
φ 2. Some of the arithmetic relationships that exist between φ and
φ 2 are shown below:
φ 2 =1 + φ φ = φ 2 −1 1 = φ 2 − φ
3. Some of the arithmetic relationships that exist between φ 2 and 1 φ are shown below:
φ 2 = 2 + 1φ
1φ= φ 2 − 2 2 = φ 2 − 1
φ
420
*1.3 a. Answers may vary. Using the four sets of congruent segments defined below, the golden ratio is the ratio of any length in set T to any length in set U (3.565 2.203 ≈ 1.6), any length in set U to any length in set V (2.203 1.362 ≈ 1.6), and any length in set W to any length in set T (5.768 3.565 ≈ 1.6 ).
All the lengths in set T are 3.565: T = AB , CE, DH, HF , CG, AF , BD, DE, EF , FG BG{ }
All the lengths in set U have a length of 2.203: U = AD, AE , CD, BC, BH , GH{ }
Both lengths in set V are 1.362: V = AC, CH{ }
All the lengths in set W are 5.768: W = BE , BF , DG, DF , EG{ }
b. The isosceles triangles are ABD, ACD, and BCD. c. Sample response: Triangle ABD appears to be a golden triangle
because it has a leg-to-base ratio of 3.565 2.203 ≈ 1.6 . Triangle ACD appears to be a golden triangle because it has a leg-to-base ratio of 2.203 1.362 ≈ 1.6 . Although triangle BCD contains the golden section (3.565 2.203 ≈ 1.6), it is not a golden triangle because this is a base-to-leg ratio, not a leg-to-base ratio.
d. Sample response: A non-base angle measurement of 36˚ and base angle measurements of 72˚ are found in all golden triangles.
1.4 a. This statement is false. Any isosceles triangle without a non-base angle measuring 36˚ is a counterexample.
b. This statement is false. Any isosceles triangle with base angles measuring 36˚ is a counterexample.
c. This statement is true. d. This statement is false. By definition, the triangle must be
isosceles and have a leg-to-base ratio of φ . Any triangle that is not isosceles and has a golden ratio is a counterexample, as well as any isosceles triangle with a base-to-leg ratio of φ .
* * * * *
421
1.5 a. Answers will vary. Students should name triangles so that the order of the vertices indicates corresponding sides. There are five sets of congruent triangles, as listed below. Any triangle in set T is similar to any triangle in set W. The triangles in sets S, U, and V also are similar to each other.
S = ΔBCH, ΔDAC{ }
T = ΔCBD, ΔHGB, ΔADE{ }
U = ΔBDA, ΔGBC, ΔFGH, ΔDHB, ΔEAF , ΔDCE{ }
V = ΔBEF , ΔDFG, ΔBFG, ΔBDF , ΔDEG{ }
W = ΔBDE , ΔGBD, ΔFGB, ΔEFG, ΔDEF , ΔFHD, ΔGCE, ΔBAF{ }
b. Answers will vary. Since the ratios of corresponding sides of similar triangles must be equal, student proportions should reflect this property. In the following sample responses, all proportions are given in the form below:
base of Δ1
base of Δ2
=leg of Δ1
leg of Δ2
Triangles from sets T and W have the proportion: 3.55.7
≈2.23.5
Triangles from sets S and U have the proportion: 1.42.2
≈2.23.5
Triangles from sets S and V have the proportion: 1.43.5
≈2.25.7
Triangles from sets U and V have the proportion: 2.23.5
≈3.55.7
c. Sample response: All golden triangles are similar to each other. The measures of the angles are 36˚, 72˚ and 72˚. Therefore, by the Angle–Angle-Angle Property, the triangles are similar. Note: Students may recall this property from the Level 2 module, “A New Angle on an Old Pyramid.”
422
1.6 Since triangles CBH and CBG are both golden triangles, they also must be similar triangles. This means:
1φ=
φφ +1
φ2 = φ +1φ 2 − φ −1 = 0
φ =1± 52
Since φ is a positive number and 1 − 5( ) 2 is negative, this is not a possible solution. Therefore, φ = 1 + 5( ) 2 .
1.7 a. Using only the given lengths, there are four possible answers: OI L I , PI MI , CI OI , and MI KI .
b. Sample response: Triangle ALO is a golden triangle because it is formed by a pentagram ACEGI, as described in Problem 1.3.
* * * * * * * * * * (page 307)
Activity 2 In this activity, students discover relationships between the numbers of the Fibonacci sequence and the golden section—including an interesting connection between Pythagorean triples and the terms of Fibonacci sequences.
Materials List • none
Technology • spreadsheet
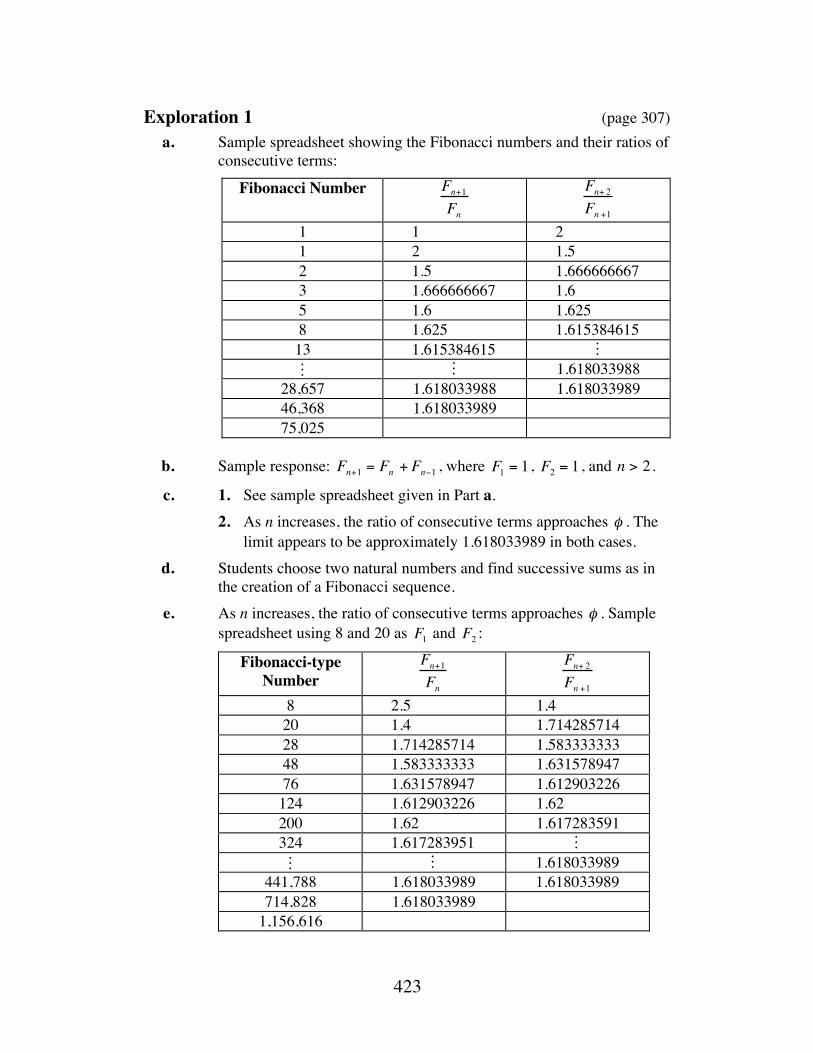
423
Exploration 1 (page 307) a. Sample spreadsheet showing the Fibonacci numbers and their ratios of
consecutive terms:
Fibonacci Number Fn+ 2Fn +1
1 1 2 1 2 1.5 2 1.5 1.666666667 3 1.666666667 1.6 5 1.6 1.625 8 1.625 1.615384615 13 1.615384615 ! 1.618033988
28,657 1.618033988 1.618033989 46,368 1.618033989 75,025
b. Sample response: Fn+1 = Fn + Fn−1 , where F1 = 1 , F2 = 1 , and n > 2.
c. 1. See sample spreadsheet given in Part a. 2. As n increases, the ratio of consecutive terms approaches φ . The
limit appears to be approximately 1.618033989 in both cases. d. Students choose two natural numbers and find successive sums as in
the creation of a Fibonacci sequence. e. As n increases, the ratio of consecutive terms approaches φ . Sample
spreadsheet using 8 and 20 as F1 and F2 :
Fibonacci-type Number
Fn+ 2Fn +1
8 2.5 1.4 20 1.4 1.714285714 28 1.714285714 1.583333333 48 1.583333333 1.631578947 76 1.631578947 1.612903226 124 1.612903226 1.62 200 1.62 1.617283591 324 1.617283951 ! 1.618033989
441,788 1.618033989 1.618033989 714,828 1.618033989
1,156,616
Fn+1Fn
! !
Fn+1Fn
! !
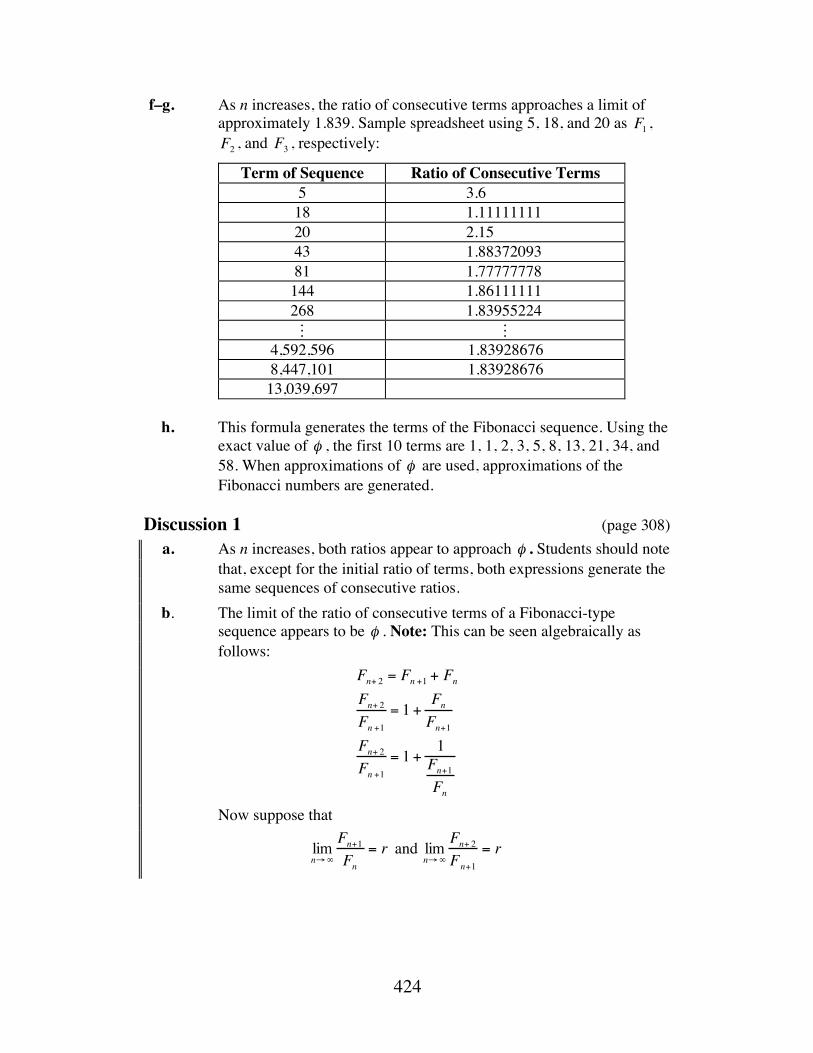
424
f–g. As n increases, the ratio of consecutive terms approaches a limit of approximately 1.839. Sample spreadsheet using 5, 18, and 20 as F1 , F2 , and F3 , respectively:
Term of Sequence Ratio of Consecutive Terms 5 3.6 18 1.11111111 20 2.15 43 1.88372093 81 1.77777778 144 1.86111111 268 1.83955224 ! !
4,592,596 1.83928676 8,447,101 1.83928676 13,039,697
h. This formula generates the terms of the Fibonacci sequence. Using the
exact value of φ , the first 10 terms are 1, 1, 2, 3, 5, 8, 13, 21, 34, and 58. When approximations of φ are used, approximations of the Fibonacci numbers are generated.
Discussion 1 (page 308) a. As n increases, both ratios appear to approach φ . Students should note
that, except for the initial ratio of terms, both expressions generate the same sequences of consecutive ratios.
b. The limit of the ratio of consecutive terms of a Fibonacci-type sequence appears to be φ . Note: This can be seen algebraically as follows:
Fn+ 2 = Fn +1 + FnFn+ 2Fn +1
= 1 + FnFn+1
Fn+ 2Fn +1
= 1 + 1Fn+1Fn
Now suppose that
limn→∞
Fn+1Fn
= r and limn→∞
Fn+ 2Fn+1
= r
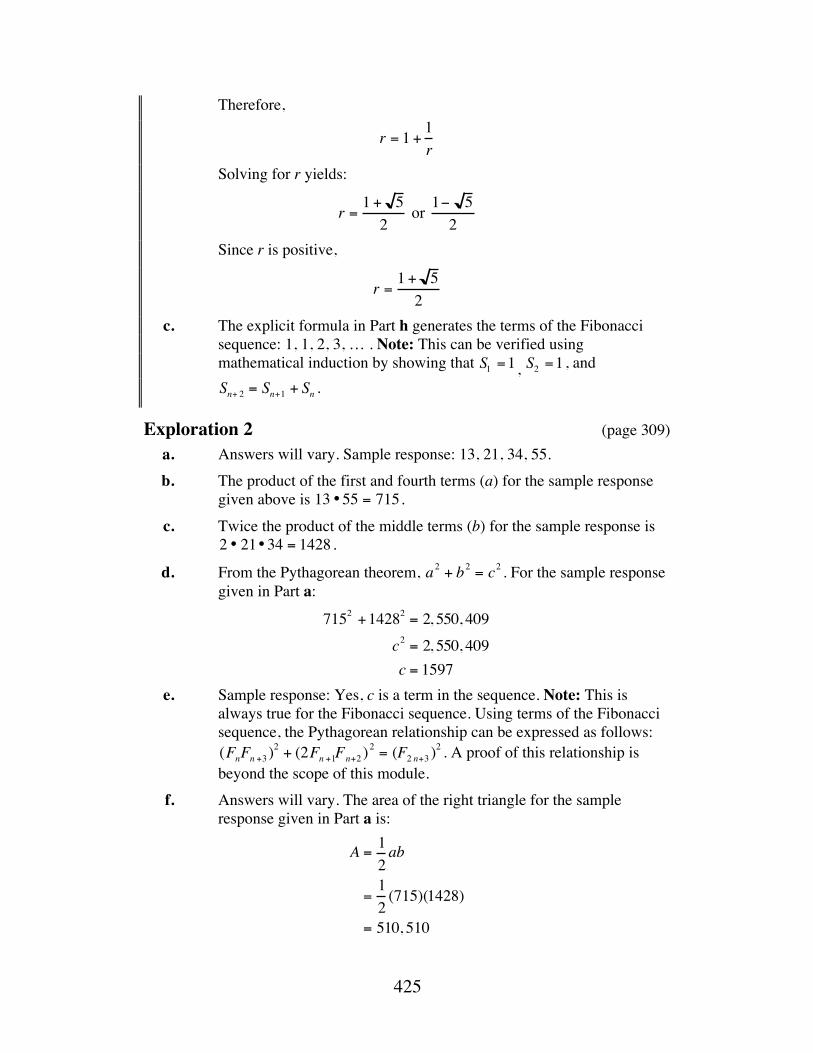
425
Therefore,
r = 1 + 1r
Solving for r yields:
r = 1 + 52
or 1− 5
2
Since r is positive,
r = 1 + 52
c. The explicit formula in Part h generates the terms of the Fibonacci sequence: 1, 1, 2, 3, … . Note: This can be verified using mathematical induction by showing that S1 =1 , S2 =1 , and Sn+ 2 = Sn+1 + Sn .
Exploration 2 (page 309) a. Answers will vary. Sample response: 13, 21, 34, 55. b. The product of the first and fourth terms (a) for the sample response
given above is 13 •55 = 715. c. Twice the product of the middle terms (b) for the sample response is
2 • 21•34 = 1428 .
d. From the Pythagorean theorem, a2 + b2 = c2 . For the sample response given in Part a:
7152 +14282 = 2, 550, 409c2 = 2, 550, 409c = 1597
e. Sample response: Yes, c is a term in the sequence. Note: This is always true for the Fibonacci sequence. Using terms of the Fibonacci sequence, the Pythagorean relationship can be expressed as follows: (FnFn +3 )
2 + (2Fn +1Fn+2 )2 = (F2 n+3 )
2 . A proof of this relationship is beyond the scope of this module.
f. Answers will vary. The area of the right triangle for the sample response given in Part a is:
A = 12ab
=12(715)(1428)
= 510, 510
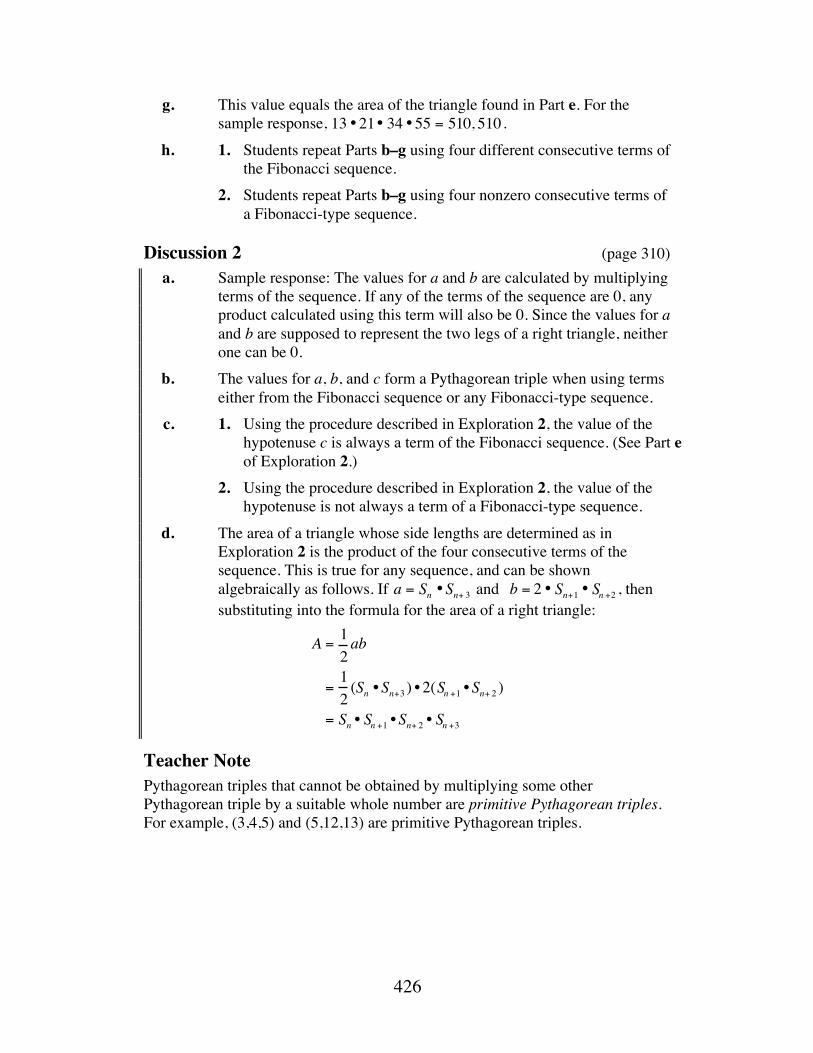
426
g. This value equals the area of the triangle found in Part e. For the sample response, 13 •21• 34 •55 = 510, 510 .
h. 1. Students repeat Parts b–g using four different consecutive terms of the Fibonacci sequence.
2. Students repeat Parts b–g using four nonzero consecutive terms of a Fibonacci-type sequence.
Discussion 2 (page 310) a. Sample response: The values for a and b are calculated by multiplying
terms of the sequence. If any of the terms of the sequence are 0, any product calculated using this term will also be 0. Since the values for a and b are supposed to represent the two legs of a right triangle, neither one can be 0.
b. The values for a, b, and c form a Pythagorean triple when using terms either from the Fibonacci sequence or any Fibonacci-type sequence.
c. 1. Using the procedure described in Exploration 2, the value of the hypotenuse c is always a term of the Fibonacci sequence. (See Part e of Exploration 2.)
2. Using the procedure described in Exploration 2, the value of the hypotenuse is not always a term of a Fibonacci-type sequence.
d. The area of a triangle whose side lengths are determined as in Exploration 2 is the product of the four consecutive terms of the sequence. This is true for any sequence, and can be shown algebraically as follows. If a = Sn •Sn+ 3 and b = 2 • Sn+1 • Sn +2 , then substituting into the formula for the area of a right triangle:
A = 12ab
=12(Sn •Sn+3 ) • 2(Sn +1 •Sn+ 2 )
= Sn • Sn +1 •Sn+ 2 • Sn +3
Teacher Note Pythagorean triples that cannot be obtained by multiplying some other Pythagorean triple by a suitable whole number are primitive Pythagorean triples. For example, (3,4,5) and (5,12,13) are primitive Pythagorean triples.
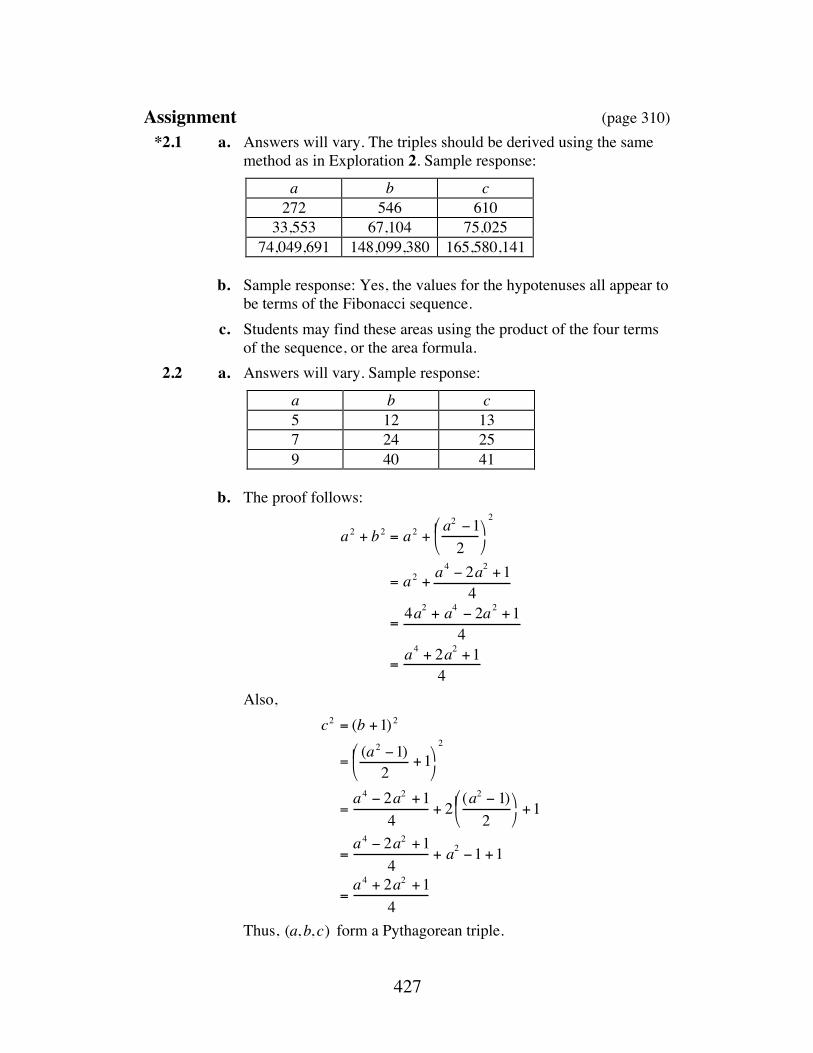
427
Assignment (page 310) *2.1 a. Answers will vary. The triples should be derived using the same
method as in Exploration 2. Sample response:
a b c 272 546 610
33,553 67,104 75,025 74,049,691 148,099,380 165,580,141
b. Sample response: Yes, the values for the hypotenuses all appear to
be terms of the Fibonacci sequence. c. Students may find these areas using the product of the four terms
of the sequence, or the area formula. 2.2 a. Answers will vary. Sample response:
a b c 5 12 13 7 24 25 9 40 41
b. The proof follows:
a2 + b2 = a2 +a2 −12
⎛
⎝ ⎜ ⎞
⎠
2
= a2 +a4 − 2a2 +1
4
=4a2 + a4 − 2a2 +1
4
=a4 + 2a2 +1
4
Also, c2 = (b +1)2
=(a2 −1)2
+1⎛
⎝ ⎜ ⎞
⎠
2
=a4 − 2a2 +1
4+ 2 (a
2 − 1)2
⎛
⎝ ⎜ ⎞
⎠ +1
=a4 − 2a2 +1
4+ a2 −1 +1
=a4 + 2a2 +1
4
Thus, (a,b, c) form a Pythagorean triple.
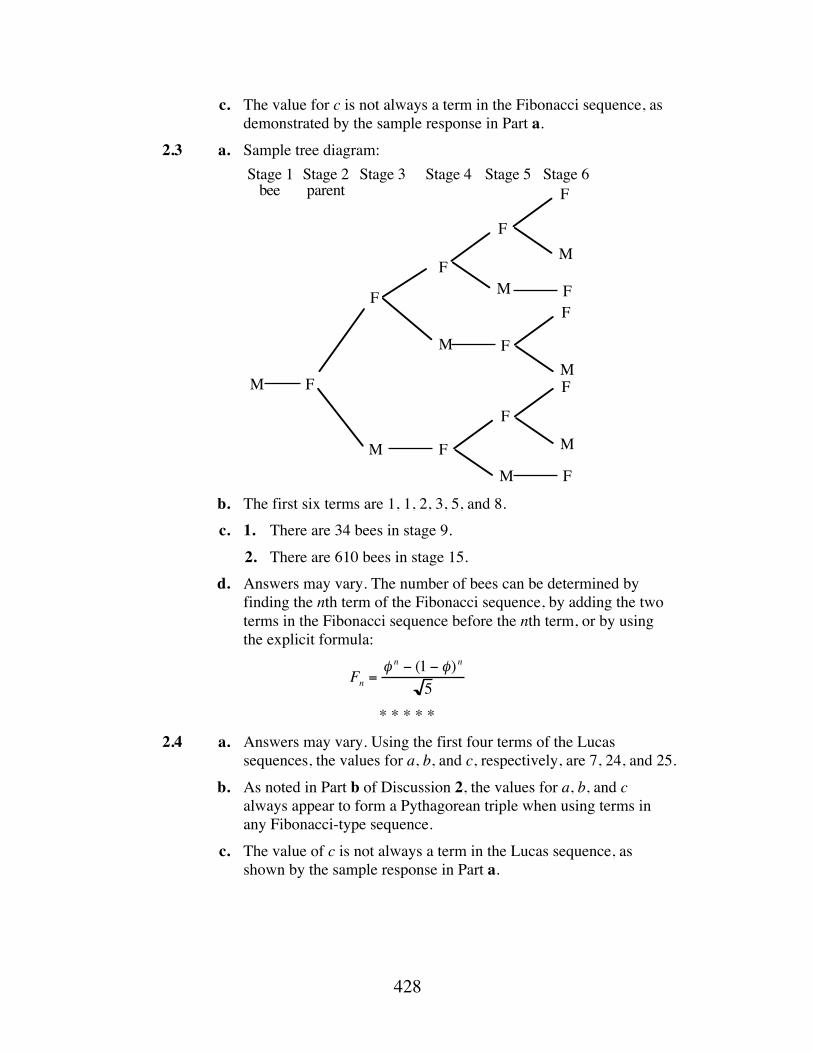
428
c. The value for c is not always a term in the Fibonacci sequence, as demonstrated by the sample response in Part a.
2.3 a. Sample tree diagram:
b. The first six terms are 1, 1, 2, 3, 5, and 8. c. 1. There are 34 bees in stage 9. 2. There are 610 bees in stage 15. d. Answers may vary. The number of bees can be determined by
finding the nth term of the Fibonacci sequence, by adding the two terms in the Fibonacci sequence before the nth term, or by using the explicit formula:
Fn =φ n − (1 − φ)n
5
* * * * * 2.4 a. Answers may vary. Using the first four terms of the Lucas
sequences, the values for a, b, and c, respectively, are 7, 24, and 25. b. As noted in Part b of Discussion 2, the values for a, b, and c
always appear to form a Pythagorean triple when using terms in any Fibonacci-type sequence.
c. The value of c is not always a term in the Lucas sequence, as shown by the sample response in Part a.
M
F
F
M
F
M F
Stage 1bee
Stage 2parent
Stage 3 Stage 4
F
M
F
M
F
F
F
M
F
M
F
M
F
Stage 5 Stage 6
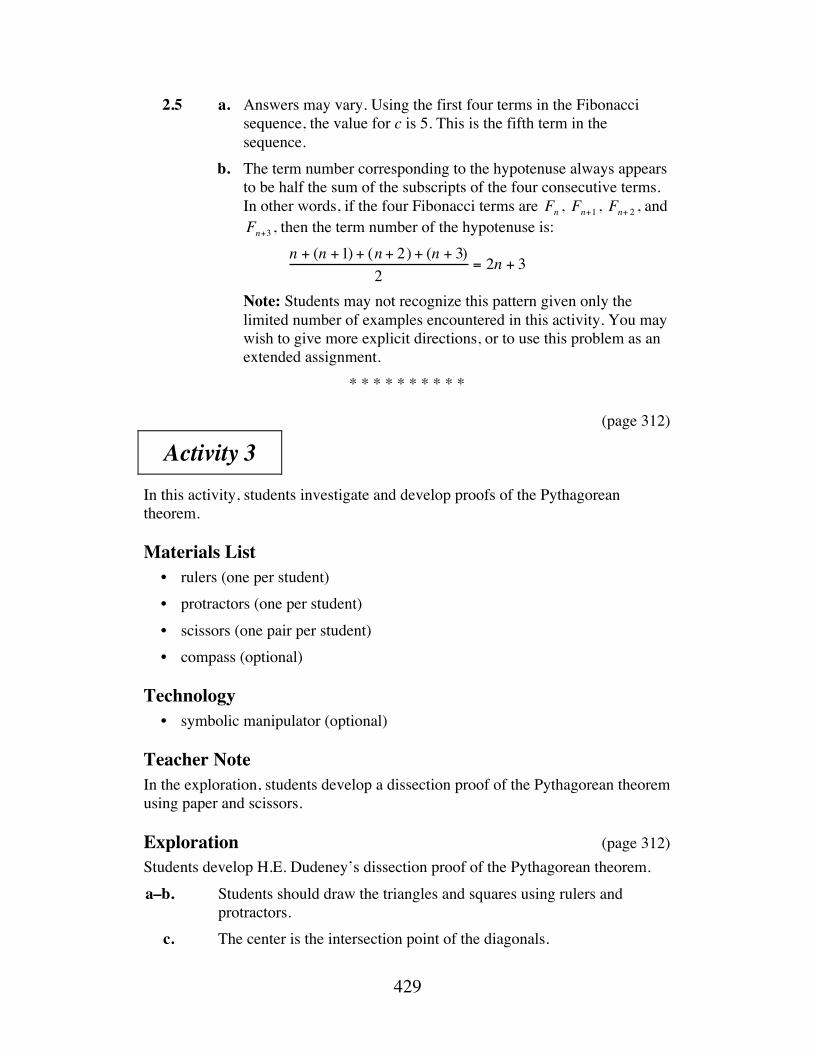
429
2.5 a. Answers may vary. Using the first four terms in the Fibonacci sequence, the value for c is 5. This is the fifth term in the sequence.
b. The term number corresponding to the hypotenuse always appears to be half the sum of the subscripts of the four consecutive terms. In other words, if the four Fibonacci terms are Fn , Fn+1 , Fn+ 2 , and Fn+3 , then the term number of the hypotenuse is:
n + (n +1) + (n + 2) + (n + 3)2
= 2n + 3
Note: Students may not recognize this pattern given only the limited number of examples encountered in this activity. You may wish to give more explicit directions, or to use this problem as an extended assignment.
* * * * * * * * * * (page 312)
Activity 3 In this activity, students investigate and develop proofs of the Pythagorean theorem.
Materials List • rulers (one per student) • protractors (one per student) • scissors (one pair per student) • compass (optional)
Technology • symbolic manipulator (optional)
Teacher Note In the exploration, students develop a dissection proof of the Pythagorean theorem using paper and scissors.
Exploration (page 312) Students develop H.E. Dudeney’s dissection proof of the Pythagorean theorem. a–b. Students should draw the triangles and squares using rulers and
protractors. c. The center is the intersection point of the diagonals.
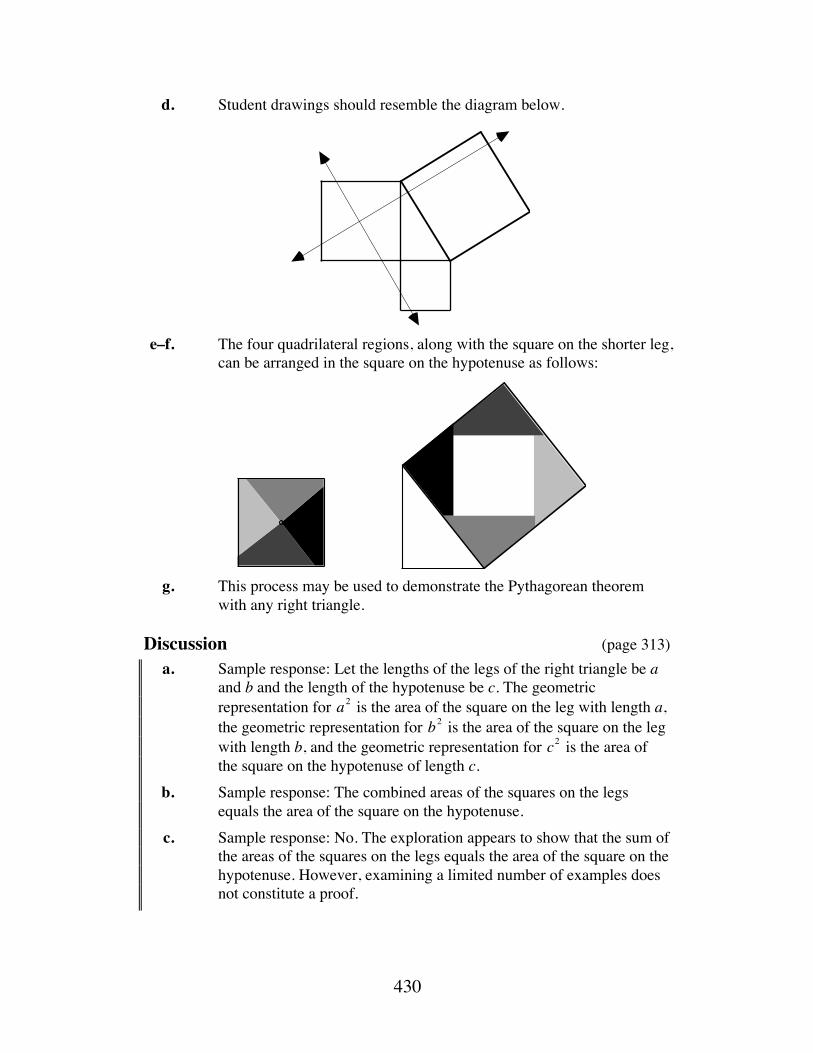
430
d. Student drawings should resemble the diagram below.
e–f. The four quadrilateral regions, along with the square on the shorter leg,
can be arranged in the square on the hypotenuse as follows:
g. This process may be used to demonstrate the Pythagorean theorem
with any right triangle.
Discussion (page 313) a. Sample response: Let the lengths of the legs of the right triangle be a
and b and the length of the hypotenuse be c. The geometric representation for a2 is the area of the square on the leg with length a, the geometric representation for b2 is the area of the square on the leg with length b, and the geometric representation for c2 is the area of the square on the hypotenuse of length c.
b. Sample response: The combined areas of the squares on the legs equals the area of the square on the hypotenuse.
c. Sample response: No. The exploration appears to show that the sum of the areas of the squares on the legs equals the area of the square on the hypotenuse. However, examining a limited number of examples does not constitute a proof.
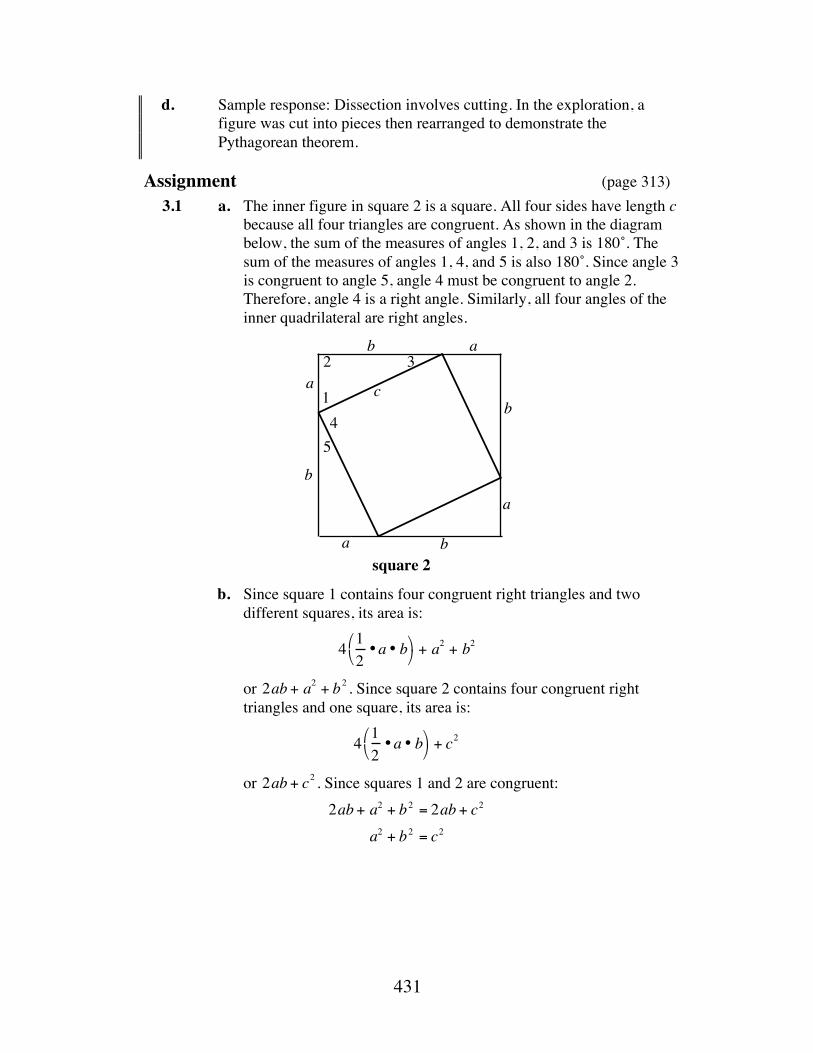
431
d. Sample response: Dissection involves cutting. In the exploration, a figure was cut into pieces then rearranged to demonstrate the Pythagorean theorem.
Assignment (page 313) 3.1 a. The inner figure in square 2 is a square. All four sides have length c
because all four triangles are congruent. As shown in the diagram below, the sum of the measures of angles 1, 2, and 3 is 180˚. The sum of the measures of angles 1, 4, and 5 is also 180˚. Since angle 3 is congruent to angle 5, angle 4 must be congruent to angle 2. Therefore, angle 4 is a right angle. Similarly, all four angles of the inner quadrilateral are right angles.
b. Since square 1 contains four congruent right triangles and two
different squares, its area is:
4 12
•a • b⎛ ⎝
⎞ ⎠ + a2 + b2
or 2ab + a2 + b2 . Since square 2 contains four congruent right triangles and one square, its area is:
4 12
•a • b⎛ ⎝
⎞ ⎠ + c
2
or 2ab + c2 . Since squares 1 and 2 are congruent: 2ab + a2 + b2 = 2ab + c2
a2 + b2 = c2
a
a
a
ab
b
b
b
c
square 2
2
1
3
45
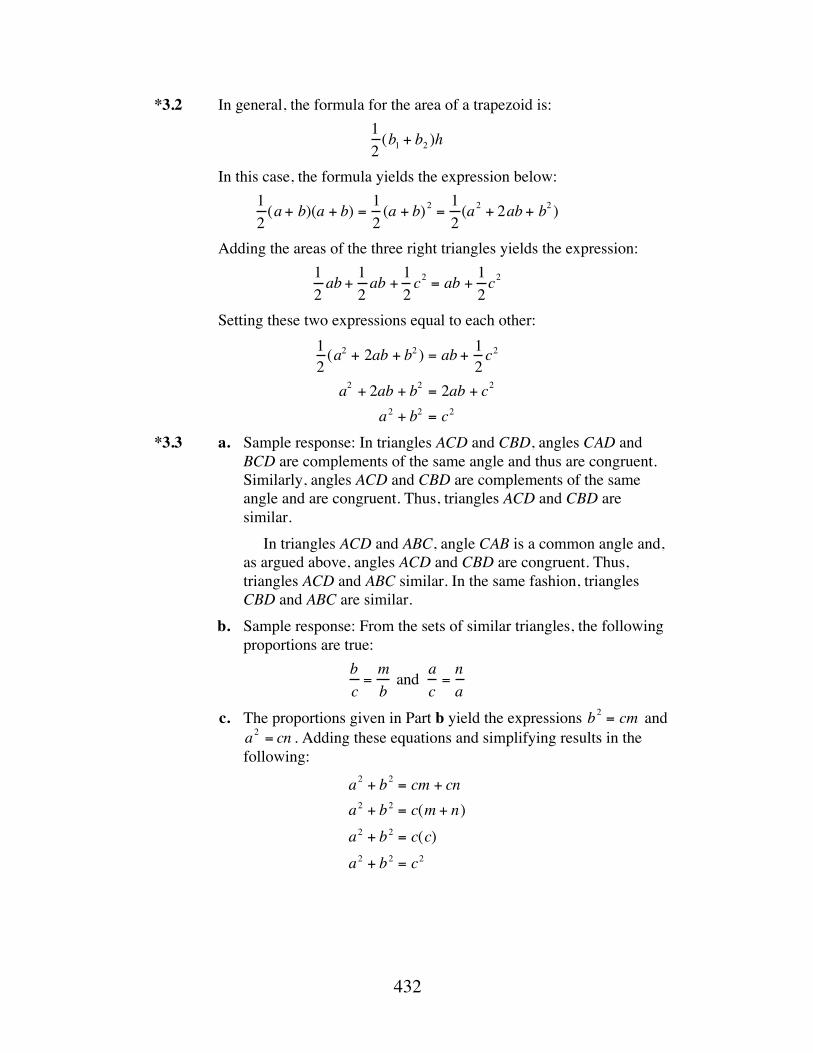
432
*3.2 In general, the formula for the area of a trapezoid is: 12(b1 + b2 )h
In this case, the formula yields the expression below: 12(a + b)(a + b) = 1
2(a + b)2 = 1
2(a2 + 2ab + b2 )
Adding the areas of the three right triangles yields the expression: 12ab + 1
2ab + 1
2c2 = ab + 1
2c2
Setting these two expressions equal to each other: 12(a2 + 2ab + b2 ) = ab + 1
2c2
a2 + 2ab + b2 = 2ab + c2
a2 + b2 = c2
*3.3 a. Sample response: In triangles ACD and CBD, angles CAD and BCD are complements of the same angle and thus are congruent. Similarly, angles ACD and CBD are complements of the same angle and are congruent. Thus, triangles ACD and CBD are similar.
In triangles ACD and ABC, angle CAB is a common angle and, as argued above, angles ACD and CBD are congruent. Thus, triangles ACD and ABC similar. In the same fashion, triangles CBD and ABC are similar.
b. Sample response: From the sets of similar triangles, the following proportions are true:
bc=mb
and ac=na
c. The proportions given in Part b yield the expressions b2 = cm and a2 = cn . Adding these equations and simplifying results in the following:
a2 + b2 = cm + cna2 + b2 = c(m + n)a2 + b2 = c(c)a2 + b2 = c2
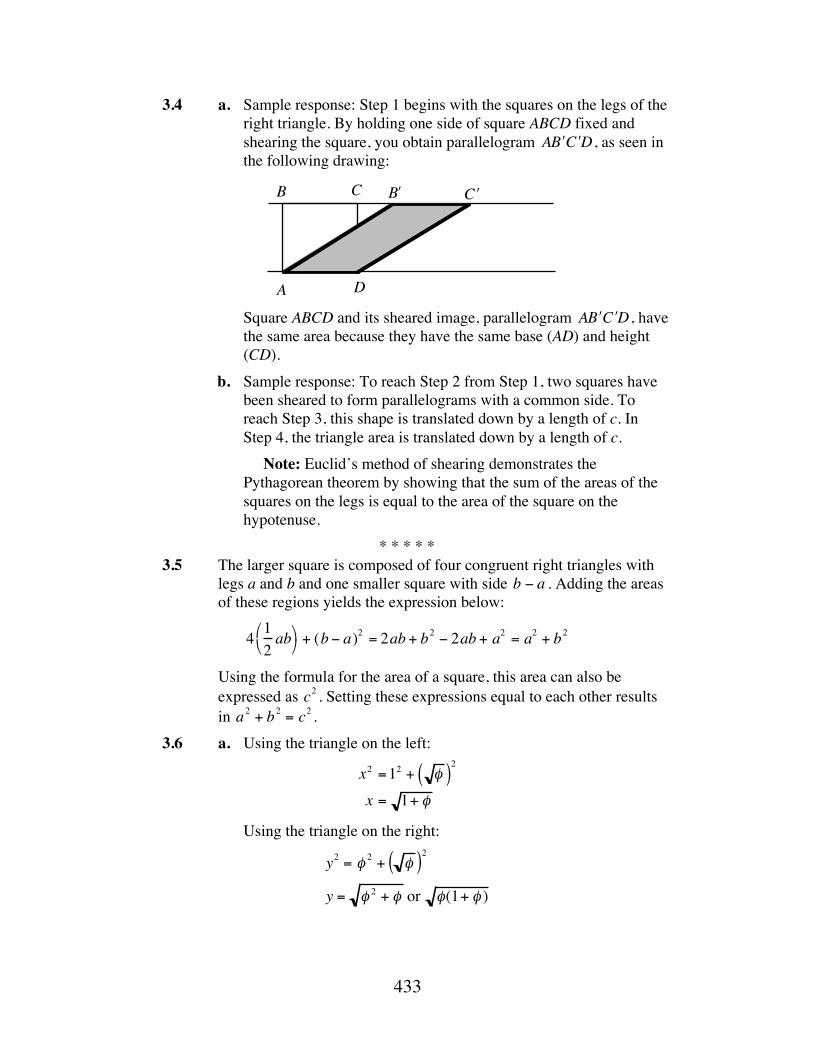
433
3.4 a. Sample response: Step 1 begins with the squares on the legs of the right triangle. By holding one side of square ABCD fixed and shearing the square, you obtain parallelogram A ʹ B ʹ C D, as seen in the following drawing:
Square ABCD and its sheared image, parallelogram A ʹ B ʹ C D , have
the same area because they have the same base (AD) and height (CD).
b. Sample response: To reach Step 2 from Step 1, two squares have been sheared to form parallelograms with a common side. To reach Step 3, this shape is translated down by a length of c. In Step 4, the triangle area is translated down by a length of c.
Note: Euclid’s method of shearing demonstrates the Pythagorean theorem by showing that the sum of the areas of the squares on the legs is equal to the area of the square on the hypotenuse.
* * * * * 3.5 The larger square is composed of four congruent right triangles with
legs a and b and one smaller square with side b − a . Adding the areas of these regions yields the expression below:
4 12ab⎛
⎝ ⎞ ⎠ + (b − a)
2 = 2ab + b2 − 2ab + a2 = a2 + b2
Using the formula for the area of a square, this area can also be expressed as c2 . Setting these expressions equal to each other results in a2 + b2 = c2 .
3.6 a. Using the triangle on the left:
x2 =12 + φ( )2
x = 1+ φ
Using the triangle on the right:
y2 = φ 2 + φ( )2
y = φ 2 + φ or φ(1+ φ )
A
B C
D
ʹ B ʹ C
434
b. Since the ratios of the corresponding sides are all 1 φ and the corresponding angles are congruent—with measures θ , 90˚ and (90 − θ )—the triangles are similar.
c. All the corresponding parts are not congruent. d. Sample response: Using either triangle, the values of the tangent
and cosine are shown below.
tan θ = 1φ
cos θ =φ
1 + φ
From Problem 1.2, φ 2 =1 + φ . This means that φ = 1 + φ . Therefore, the two trigonometric ratios are equal.
e. Sample response: The side length of the Great Pyramid is 1152 +1472 or approximately 187 m. The ratio of the side
length to the length of half the base is about 1.62, which is very close to the golden ratio. If the ratio were actually the golden ratio, this triangle would be similar to the two given in Part a.
* * * * * * * * * *
Research Project (page 317) Using the exact value for φ , the reciprocal of the golden ratio is:
1 + 52
−1 = 12+
52−1
=52−12
By the Pythagorean theorem, the hypotenuse of the right triangle in Figure 5 is 5 2 . To construct the segment, students may use a compass to mark the length
of the shorter leg of the right triangle on the hypotenuse. As shown below, the length of the remaining portion of the hypotenuse is the reciprocal of the golden ratio.
1
12
12
φ −1
435
Answers to Summary Assessment (page 318) 1. a. Answers will vary. Sample response: 7, 0.125, 0.889, 0.529,
0.654, 0.605, 0.623, 0.616, 0.619, 0.618. b. Sample response: 2, 0.333, 0.750, 0.571, 0.636, 0.611, 0.621,
0.617, 0.618, 0.618. c. Sample response: The limit of the sequence appears to be the
reciprocal of the golden ratio. d. Sample response: When Steps 2 and 3 are interchanged, the limit
of the sequence appears to be approximately 1.618, or the golden section.
2. Sample response: The area of square ACDH is or 1. The area of rectangle ABFG is φ φ −1( ) . Setting these expressions equal to each other:
φ (φ −1) = 1
φ 2 − φ = 1φ 2 − φ −1 = 0
Solving the quadratic equation yields:
φ =1 + 52
or φ = 1 − 52
Since φ is a distance, it cannot be negative. Therefore, its exact value is:
φ =1 + 52
12
436
Module Assessment
1. Recall that in a golden rectangle, the ratio of the measures of the
longer side to the shorter side is the golden ratio φ . a. Find the length of the longer side of a golden rectangle whose
shorter side measures 5 cm. b. Find the length of the shorter side of a golden rectangle whose
longer side measures 10 cm. 2. Recall that a golden triangle is an isosceles triangle with a leg-to-base
ratio of φ . To complete, Parts a–c below, consider a golden triangle ABC in which angle C is the non-base angle.
a. Find AB if AC is 7.2 cm. b. Find AC if AB is 13.7 m. c. Find the measures of the three angles A, B, and C. 3. Golden rectangles are “self-generating.” In other words, golden
rectangles can be constructed recursively from other golden rectangles. Determine whether or not golden triangles are self-generating. Use a diagram to support your response.
4. The first two terms of a Fibonacci-type sequence are –4 and –7. a. List the first 10 terms of this sequence. b. Describe the limit of the sequence formed by the following ratios:
Fn+1Fn
5. Draw a rectangle with dimensions equal to the 11th and 12th terms of the Fibonacci sequence. Is this rectangle a golden rectangle? Justify your response.
6. A pet store has decided to breed gerbils. Although its original pair does not reproduce in the first month, they produce a pair of baby gerbils in every month after the first. Assuming that each new pair of gerbils follows this same breeding pattern—producing a new pair of gerbils in every month after the first—complete Parts a–c below.
a. Draw a tree diagram that shows the numbers of pairs that exist at the beginning of each of the next six months.
b. Write the numbers of pairs at the beginning of each month as a sequence.
c. Write a recursive formula that describes the sequence in Part b.
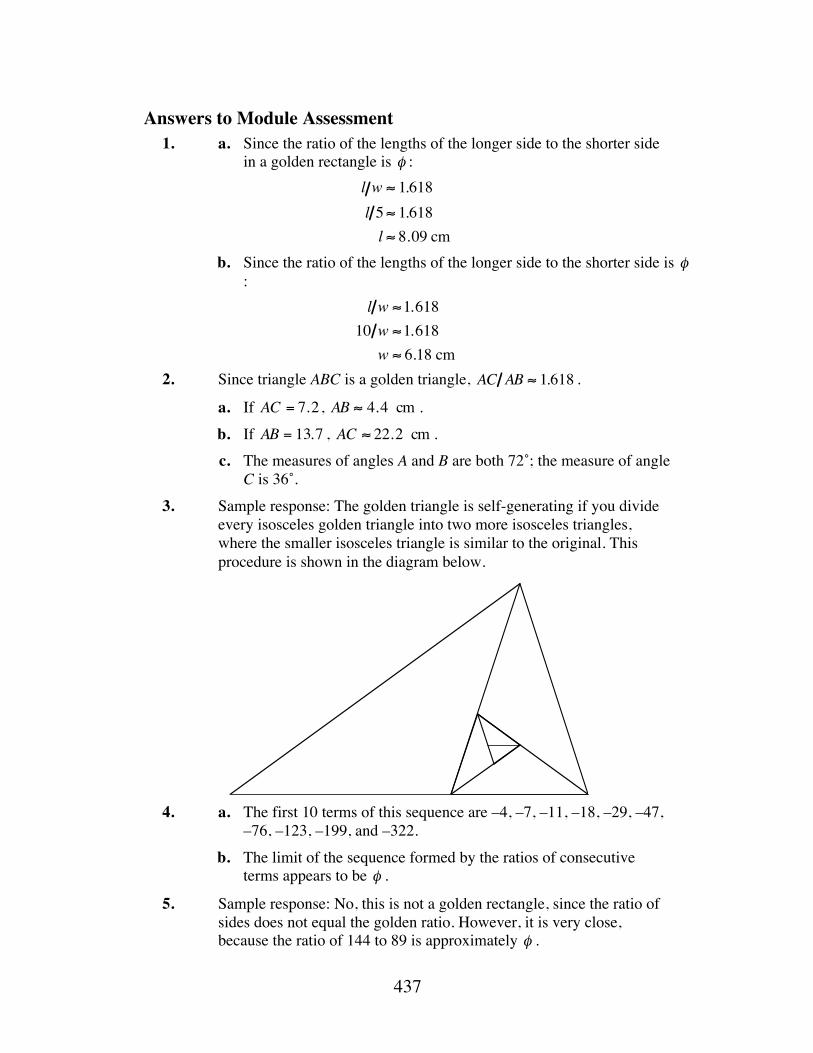
437
Answers to Module Assessment 1. a. Since the ratio of the lengths of the longer side to the shorter side
in a golden rectangle is φ : l w ≈ 1.618l 5 ≈ 1.618l ≈ 8.09 cm
b. Since the ratio of the lengths of the longer side to the shorter side is φ:
l w ≈1.61810 w ≈1.618
w ≈ 6.18 cm
2. Since triangle ABC is a golden triangle, AC AB ≈ 1.618 .
a. If AC = 7.2 , AB ≈ 4.4 cm . b. If AB = 13.7 , AC ≈ 22.2 cm . c. The measures of angles A and B are both 72˚; the measure of angle
C is 36˚. 3. Sample response: The golden triangle is self-generating if you divide
every isosceles golden triangle into two more isosceles triangles, where the smaller isosceles triangle is similar to the original. This procedure is shown in the diagram below.
4. a. The first 10 terms of this sequence are –4, –7, –11, –18, –29, –47,
–76, –123, –199, and –322. b. The limit of the sequence formed by the ratios of consecutive
terms appears to be φ .
5. Sample response: No, this is not a golden rectangle, since the ratio of sides does not equal the golden ratio. However, it is very close, because the ratio of 144 to 89 is approximately φ .
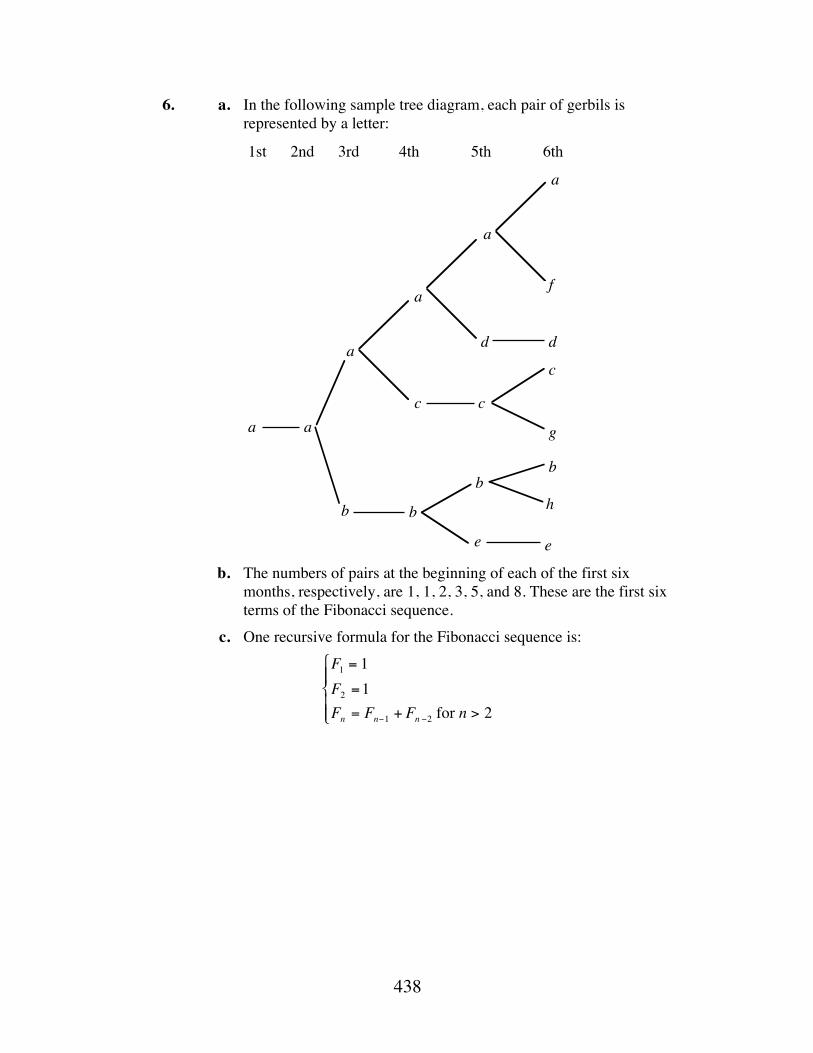
438
6. a. In the following sample tree diagram, each pair of gerbils is represented by a letter:
b. The numbers of pairs at the beginning of each of the first six
months, respectively, are 1, 1, 2, 3, 5, and 8. These are the first six terms of the Fibonacci sequence.
c. One recursive formula for the Fibonacci sequence is: F1 = 1F2 =1Fn = Fn−1 + Fn −2 for n > 2
⎧
⎨ ⎪ ⎪
⎩ ⎪ ⎪
a
b
a
c
b
a
a
c
b
d d
a
e
f
c
g
b
h
e
1st 2nd 3rd 4th 5th 6th
a
439
Selected References Barnard, J. “Those Fascinating Fibonaccis!” Student Math Notes. Reston, VA:
National Council of Teachers of Mathematics (NCTM), January 1996. Billstein, R., and J. W. Lott. “Golden Rectangles and Ratios.” In Evan M.
Maletsky, ed., Teaching with Student Math Notes. Volume 2. Reston, VA: NCTM, 1993: 1–6.
Boles, M., and R. Newman. Universal Patterns: The Golden Relationship: Art, Math, & Nature. Bradford, MA: Pythagorean Press, 1990.
Boulger, W. “Pythagoras Meets Fibonacci.” Mathematics Teacher 82 (April 1989): 277–282.
Boyer, C. B. A History of Mathematics. New York, John Wiley & Sons, 1991. Brunes, T. The Secrets of Ancient Geometry—And Its Use. Copenhagen,
Denmark: Rhodos International Science Publishers, 1967. Burke, M. “5–con Triangles.” Student Math Notes. Reston, VA: NCTM, January 1990. Burton, D. M. The History of Mathematics—An Introduction. Boston, MA: Allyn
and Bacon, 1985. Clason, R. G. “Tiling with Golden Triangles and the Penrose Rhombus Using
Logo.” Journal of Computers in Mathematics and Science Teaching 9.2 (Winter 1989/90): 41–53.
Consortium for Mathematics and Its Applications (COMAP). Historical Notes: Mathematics Through the Ages. Lexington, MA: COMAP, 1992.
Dickey, E. “The Golden Ratio: A Golden Opportunity to Investigate Multiple Representations of a Problem.” Mathematics Teacher 86 (October 1993): 554–557.
Eves, H., and J. H. Eves. An Introduction to the History of Mathematics Philadelphia, PA: Saunders College Publishing, 1990.
Loomis, E. S. The Pythagorean Proposition. Classics in Mathematics Education I. Reston, VA: NCTM, 1968.
National Council of Teachers of Mathematics. Historical Topics for the Mathematics Classroom. Reston, VA: NCTM, 1989.
Nelsen, R. B. Proofs Without Words. Washington, DC: The Mathematical Association of America, 1993.
Pappas, T. Mathematics Appreciation. San Carlos, CA: Math Aids, 1986. Posamentier, A. S., and J. Stepelman. Teaching Secondary School Mathematics:
Techniques and Enrichment Units. Columbus, OH: Charles E. Merrill Publishing Co., 1986.
Seitz, D. T., Sr. “A Geometric Figure Relating the Golden Ratio and Pi.” Mathematics Teacher 79 (May 1986): 340–41.
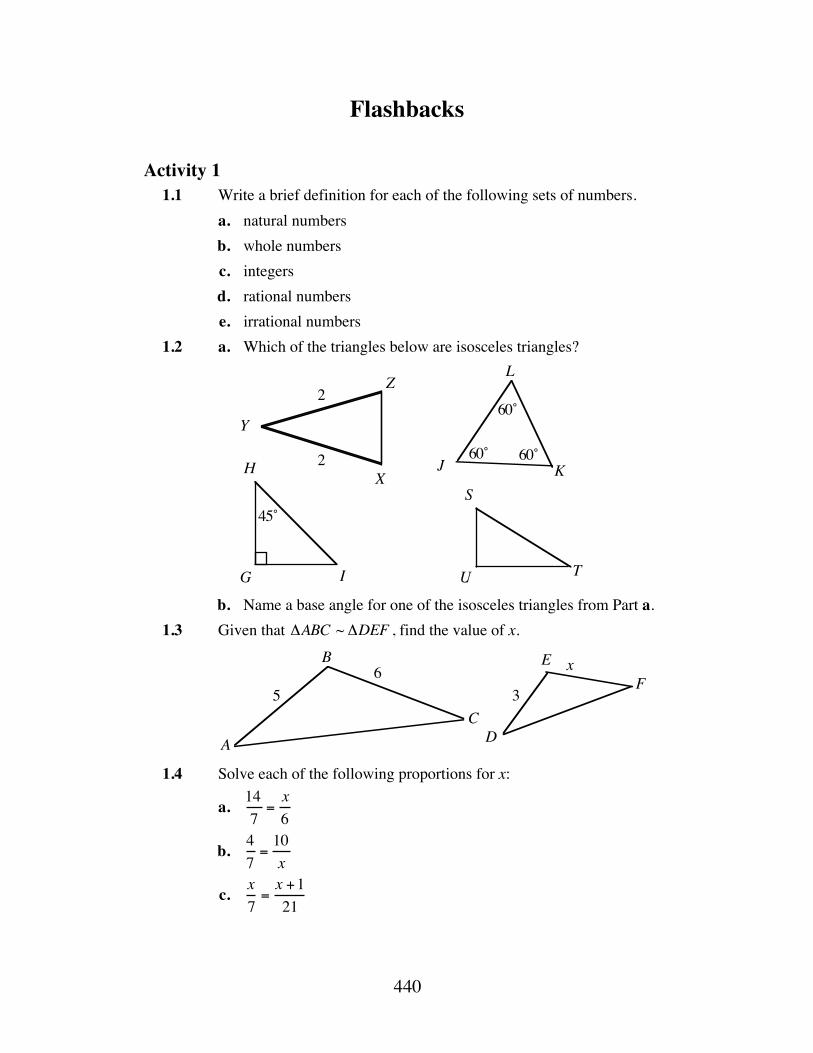
440
Flashbacks
Activity 1 1.1 Write a brief definition for each of the following sets of numbers. a. natural numbers b. whole numbers c. integers d. rational numbers e. irrational numbers 1.2 a. Which of the triangles below are isosceles triangles?
b. Name a base angle for one of the isosceles triangles from Part a. 1.3 Given that ΔABC ~ ΔDEF , find the value of x.
1.4 Solve each of the following proportions for x:
a. 147=x6
b. 47=10x
c. x7=x +121
2
2X
Z
J K
L
60˚
60˚ 60˚
G
H
I
45˚S
TU
Y
A
B
CD
EF
56
3
x
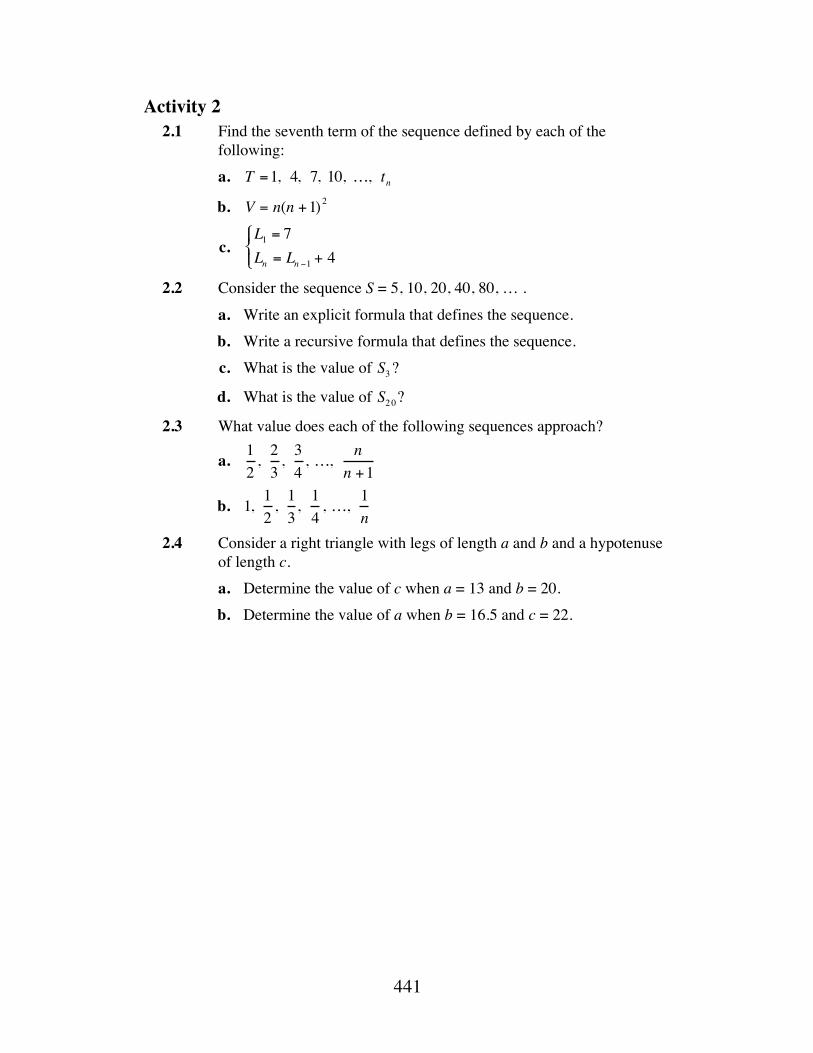
441
Activity 2 2.1 Find the seventh term of the sequence defined by each of the
following: a. T =1, 4, 7, 10, …, tn
b. V = n(n +1)2
c. L1 = 7Ln = Ln −1 + 4⎧ ⎨ ⎪
⎩ ⎪
2.2 Consider the sequence S = 5, 10, 20, 40, 80, … . a. Write an explicit formula that defines the sequence. b. Write a recursive formula that defines the sequence. c. What is the value of S3?
d. What is the value of S20?
2.3 What value does each of the following sequences approach?
a. 12
, 23
, 34
, …, nn +1
b. 1, 12
, 13
, 14
, …, 1n
2.4 Consider a right triangle with legs of length a and b and a hypotenuse of length c.
a. Determine the value of c when a = 13 and b = 20. b. Determine the value of a when b = 16.5 and c = 22.
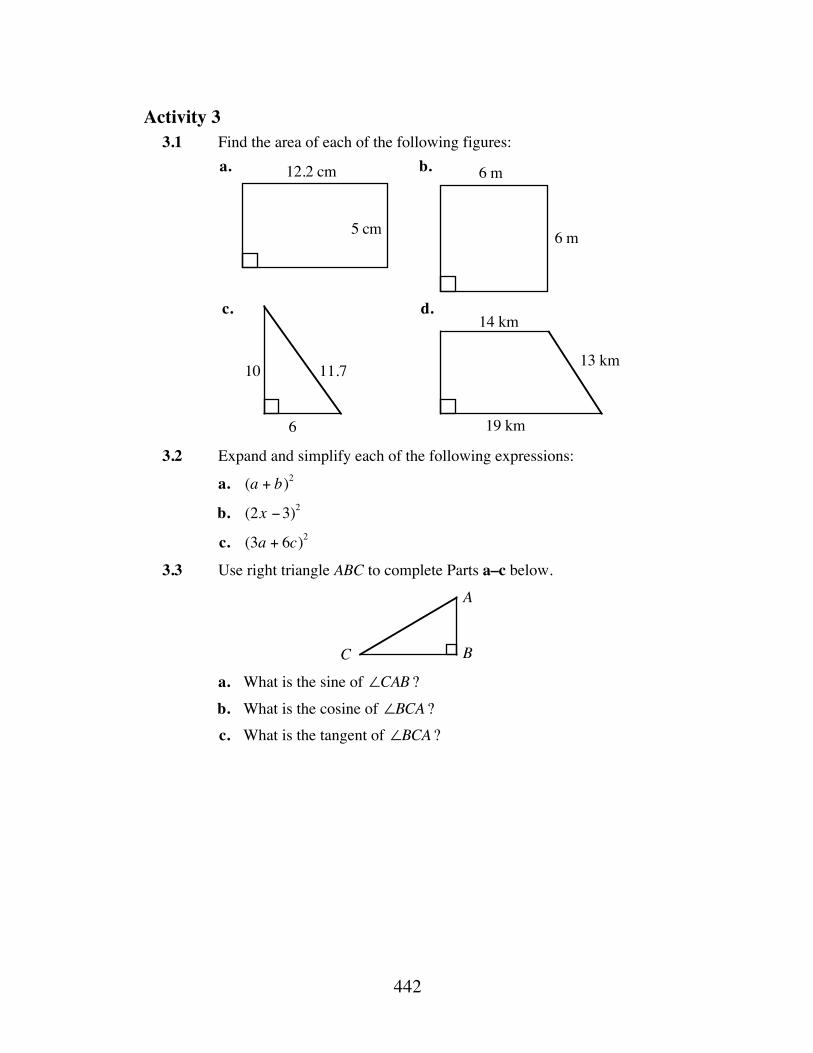
442
Activity 3 3.1 Find the area of each of the following figures:
3.2 Expand and simplify each of the following expressions:
a. (a + b)2
b. (2x −3)2
c. (3a + 6c)2
3.3 Use right triangle ABC to complete Parts a–c below.
a. What is the sine of ∠CAB ? b. What is the cosine of ∠BCA ? c. What is the tangent of ∠BCA ?
a. b.
c. d.
12.2 cm
5 cm
6 m
6 m
10
6
11.7 13 km
14 km
19 km
B
A
C
443
Answers to Flashbacks
Activity 1 1.1 a. Sample response: The set of natural numbers is the set {1, 2, 3, 4,
5, 6, … }. b. Sample response: The set of whole numbers is the union of the set
of natural numbers and the set containing 0. c. Sample response: The set of integers is the union of the set of
whole numbers and the set containing their additive inverses. d. Sample response: The set of rational numbers is the set of
numbers that can be represented by a terminating or repeating decimal. This set can also be written as follows:
a b where a and b are integers with b ≠ 0}{
e. Sample response: The set of irrational numbers is the set of numbers that cannot be represented as either terminating or repeating decimals.
1.2 a. Triangles XYZ, JKL, and GHI are isosceles triangles. b. Angles X and Z are the base angles for triangle XYZ, while angles H
and I are the base angles for triangle GHI. The base angles for triangle JKL can be named only if one side is designated as the base.
1.3 Sample response: 35=x6
18 = 5x3.6 = x
1.4 a. x =12 b. x =17.5 c. x = 0.5
Activity 2 2.1 a. The seventh term is 19. b. The seventh term is 448. c. The seventh term is 31.
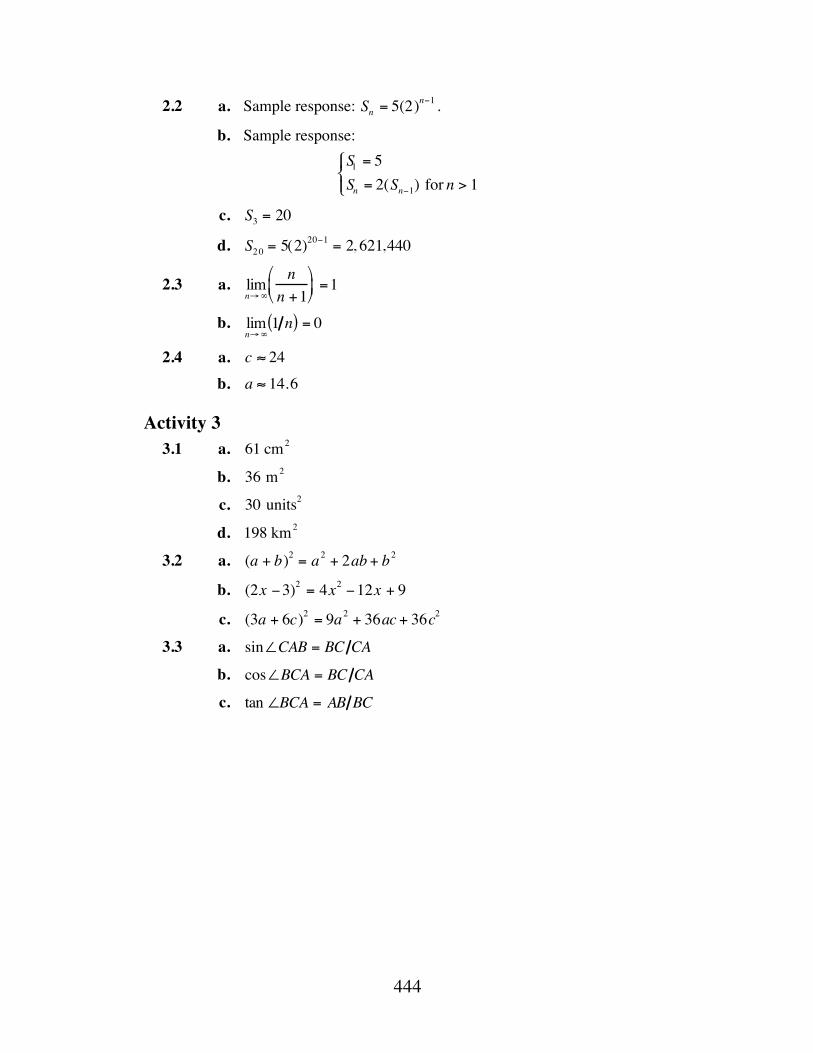
444
2.2 a. Sample response: Sn = 5(2)n−1 .
b. Sample response: S1 = 5Sn = 2(Sn−1) for n > 1⎧ ⎨ ⎪
⎩ ⎪
c. S3 = 20
d. S20 = 5(2)20−1 = 2, 621,440
2.3 a. limn→∞
nn +1⎛
⎝ ⎜
⎞
⎠ ⎟ =1
b. limn→∞
1 n( ) = 0
2.4 a. c ≈ 24 b. a ≈ 14.6
Activity 3 3.1 a. 61 cm2
b. 36 m2
c. 30 units2
d. 198 km2
3.2 a. (a + b)2 = a2 + 2ab + b2
b. (2x −3)2 = 4x2 −12x + 9
c. (3a + 6c)2 = 9a2 + 36ac + 36c2
3.3 a. sin∠CAB = BC CA
b. cos∠BCA = BC CA
c. tan ∠BCA = AB BC
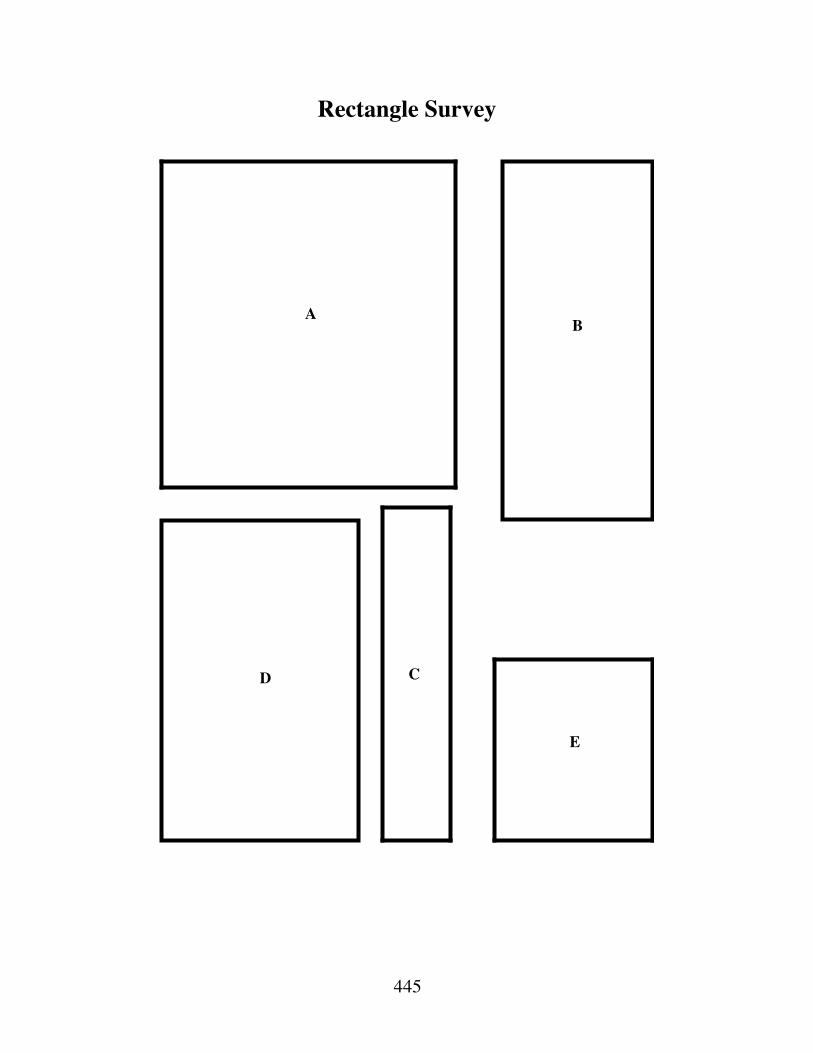
445
Rectangle Survey
AB
D C
E


Banking on Life
The price you pay for borrowing money—as well as the amount you earn by saving it—should be of interest to you. In this module, you learn how financial institutions calculate the interest they pay on savings accounts and the interest they charge on consumer loans.
Gary Bauer • Jeff Hostetter

449
Teacher Edition Banking on Life
Overview In this module, students investigate simple interest, compound interest, and amortization within the context of savings accounts and installment loans. They use spreadsheets to develop some financial formulas and to solve problems using a guess-and-check strategy.
Objectives In this module, students will: • determine simple and compound interest • calculate amortization payments • solve linear and exponential equations • develop an intuitive understanding of e.
Prerequisites For this module, students should know: • how to write recursive and explicit formulas • how to evaluate explicit formulas • how to determine regression equations • the definition of the limit of a sequence.
Time Line Activity 1 2 3 Summary
Assessment Total
Days 3 3 2 1 9

450
Materials Required • none
Technology Software 1 2 3 Summary
Assessment spreadsheet X X X X
graphing utility X X X symbolic manipulator X X X X
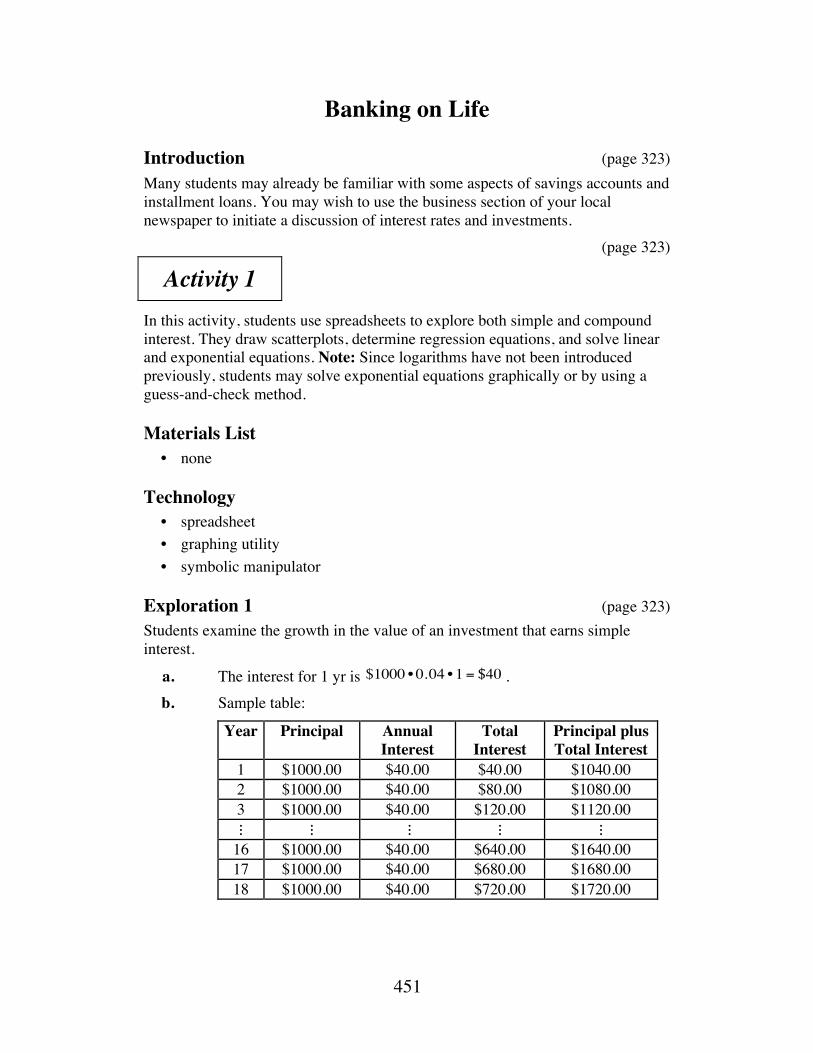
451
Banking on Life
Introduction (page 323) Many students may already be familiar with some aspects of savings accounts and installment loans. You may wish to use the business section of your local newspaper to initiate a discussion of interest rates and investments. (page 323)
Activity 1 In this activity, students use spreadsheets to explore both simple and compound interest. They draw scatterplots, determine regression equations, and solve linear and exponential equations. Note: Since logarithms have not been introduced previously, students may solve exponential equations graphically or by using a guess-and-check method.
Materials List • none
Technology • spreadsheet • graphing utility • symbolic manipulator
Exploration 1 (page 323) Students examine the growth in the value of an investment that earns simple interest.
a. The interest for 1 yr is . b. Sample table:
Year Principal Annual Interest
Total Interest
Principal plus Total Interest
1 $1000.00 $40.00 $40.00 $1040.00 2 $1000.00 $40.00 $80.00 $1080.00 3 $1000.00 $40.00 $120.00 $1120.00 ⋮ ⋮ ⋮ ⋮ ⋮
16 $1000.00 $40.00 $640.00 $1640.00 17 $1000.00 $40.00 $680.00 $1680.00 18 $1000.00 $40.00 $720.00 $1720.00
$1000 • 0.04 • 1 = $40
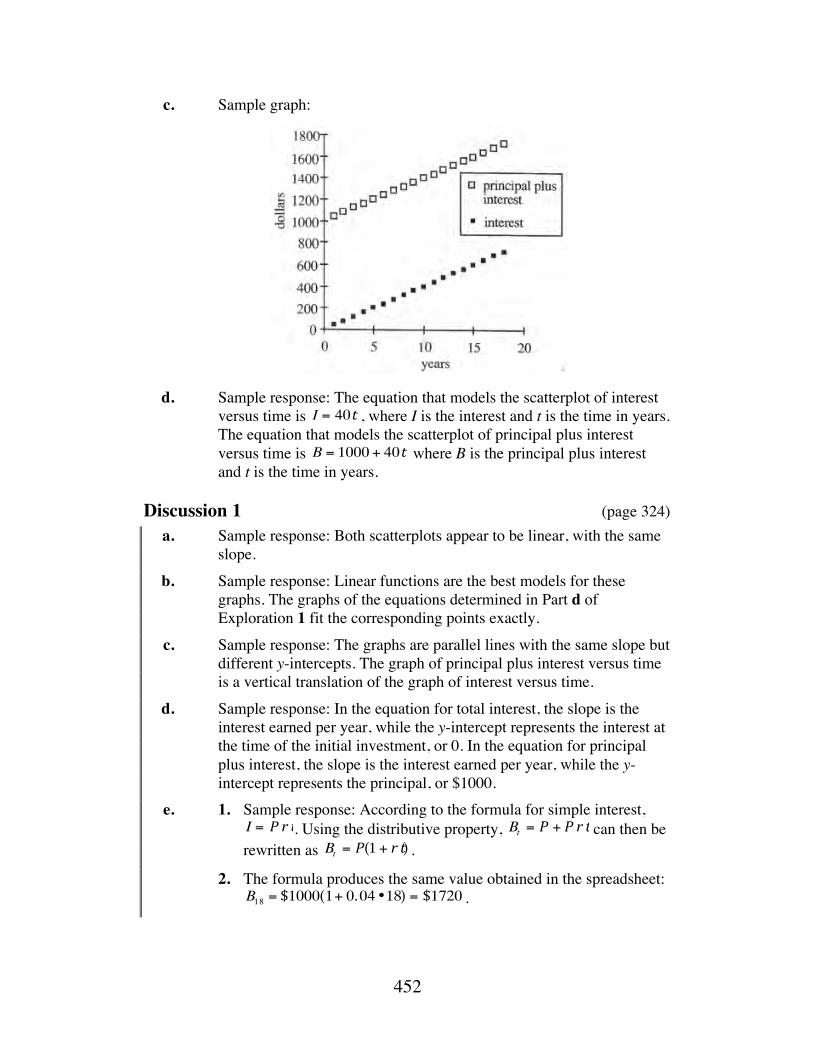
452
c. Sample graph:
d. Sample response: The equation that models the scatterplot of interest versus time is , where I is the interest and t is the time in years. The equation that models the scatterplot of principal plus interest versus time is where B is the principal plus interest and t is the time in years.
Discussion 1 (page 324) a. Sample response: Both scatterplots appear to be linear, with the same
slope. b. Sample response: Linear functions are the best models for these
graphs. The graphs of the equations determined in Part d of Exploration 1 fit the corresponding points exactly.
c. Sample response: The graphs are parallel lines with the same slope but different y-intercepts. The graph of principal plus interest versus time is a vertical translation of the graph of interest versus time.
d. Sample response: In the equation for total interest, the slope is the interest earned per year, while the y-intercept represents the interest at the time of the initial investment, or 0. In the equation for principal plus interest, the slope is the interest earned per year, while the y-intercept represents the principal, or $1000.
e. 1. Sample response: According to the formula for simple interest, . Using the distributive property, can then be
rewritten as .
2. The formula produces the same value obtained in the spreadsheet: .
I = 40t
B = 1000 + 40t
I = P r t Bt = P + P r tBt = P(1 + r t)
B18 = $1000(1+ 0.04 •18) = $1720
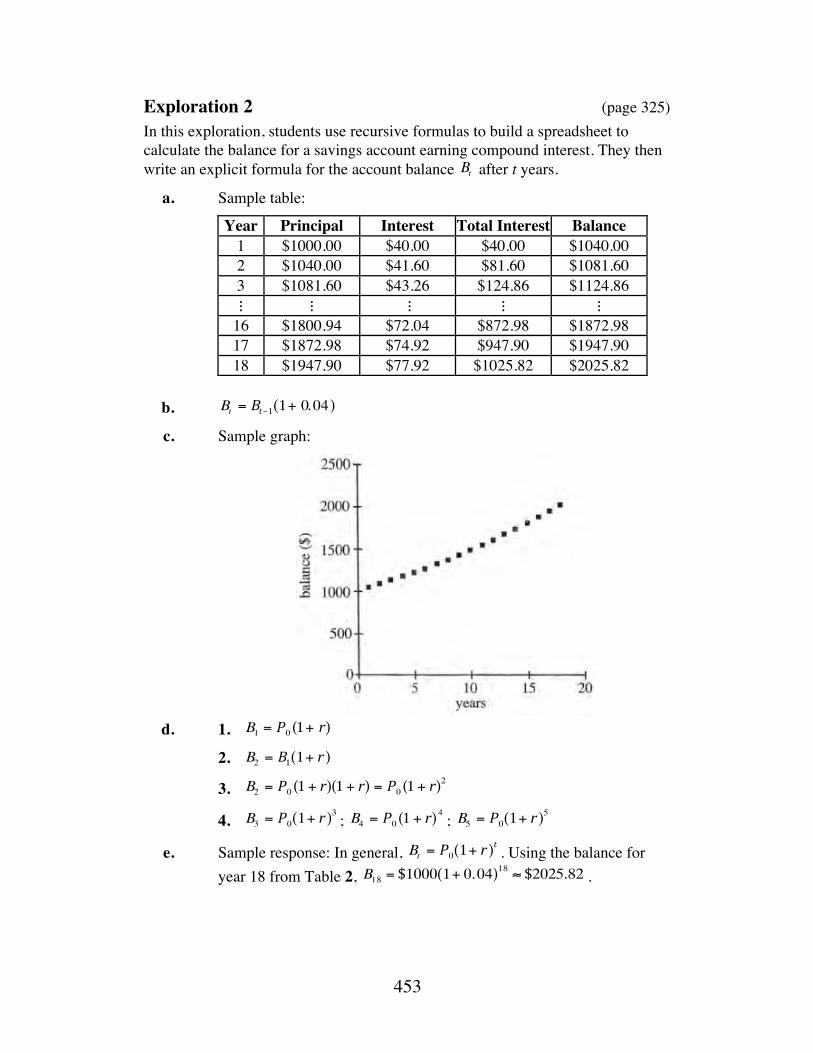
453
Exploration 2 (page 325) In this exploration, students use recursive formulas to build a spreadsheet to calculate the balance for a savings account earning compound interest. They then write an explicit formula for the account balance after t years.
a. Sample table:
Year Principal Interest Total Interest Balance 1 $1000.00 $40.00 $40.00 $1040.00 2 $1040.00 $41.60 $81.60 $1081.60 3 $1081.60 $43.26 $124.86 $1124.86 ⋮ ⋮ ⋮ ⋮ ⋮
16 $1800.94 $72.04 $872.98 $1872.98 17 $1872.98 $74.92 $947.90 $1947.90 18 $1947.90 $77.92 $1025.82 $2025.82
b.
c. Sample graph: d. 1.
2.
3.
4. ; ;
e. Sample response: In general, . Using the balance for year 18 from Table 2, .
Bt
Bt = Bt−1(1+ 0.04)
B1 = P0 (1+ r)
B2 = B1(1+ r)
B2 = P0 (1 + r)(1 + r) = P0 (1 + r)2
B3 = P0(1+ r)3 B4 = P0 (1 + r)
4 B5 = P0(1+ r)5
Bt = P0(1+ r)t
B18 = $1000(1+ 0.04)18 ≈ $2025.82
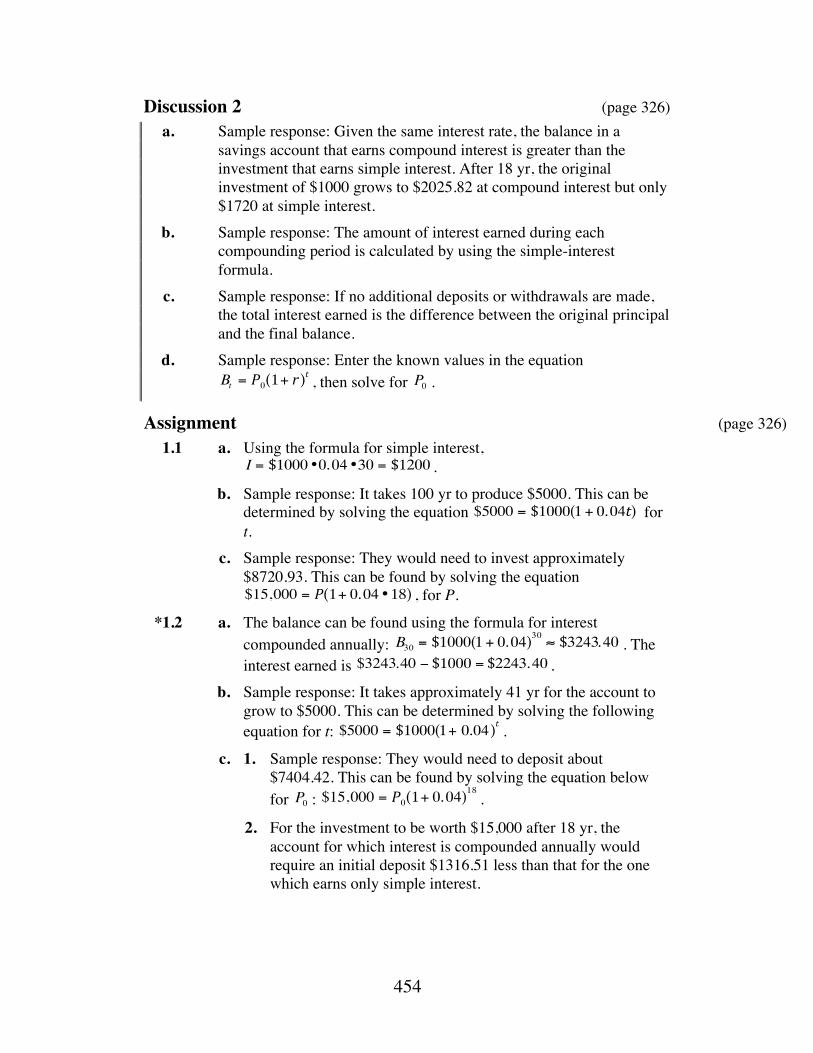
454
Discussion 2 (page 326) a. Sample response: Given the same interest rate, the balance in a
savings account that earns compound interest is greater than the investment that earns simple interest. After 18 yr, the original investment of $1000 grows to $2025.82 at compound interest but only $1720 at simple interest.
b. Sample response: The amount of interest earned during each compounding period is calculated by using the simple-interest formula.
c. Sample response: If no additional deposits or withdrawals are made, the total interest earned is the difference between the original principal and the final balance.
d. Sample response: Enter the known values in the equation , then solve for .
Assignment (page 326) 1.1 a. Using the formula for simple interest,
. b. Sample response: It takes 100 yr to produce $5000. This can be
determined by solving the equation for t.
c. Sample response: They would need to invest approximately $8720.93. This can be found by solving the equation
, for P.
*1.2 a. The balance can be found using the formula for interest compounded annually: . The interest earned is .
b. Sample response: It takes approximately 41 yr for the account to grow to $5000. This can be determined by solving the following equation for t: .
c. 1. Sample response: They would need to deposit about $7404.42. This can be found by solving the equation below for : .
2. For the investment to be worth $15,000 after 18 yr, the account for which interest is compounded annually would require an initial deposit $1316.51 less than that for the one which earns only simple interest.
Bt = P0(1+ r)t P0
I = $1000 •0.04 •30 = $1200
$5000 = $1000(1 + 0.04t)
$15,000 = P(1+ 0.04 •18)
B30 = $1000 1 + 0.04( )30≈ $3243.40
$3243.40 − $1000 = $2243.40
$5000 = $1000 1+ 0.04( )t
P0 $15,000 = P0 1+ 0.04( )18
455
1.3 a. If the deposit is made on the 10th birthday, the total is .
b. Sample response: When $500 dollars are added to the account, it creates a step in the scatterplot. The slope of the remainder of the scatterplot is 60 rather than 40.
* * * * *
1.4 a.
b. Sample response: The price will be less than $10 in the 17th week. This can be calculated as follows: .
c. Sample response: This is not true. Although the price will get very
close to 0, it will never be exactly 0. Even after 52 weeks, for example, the price of a $150 item will still be $0.03. In reality, the owners would probably sell the entire inventory within a few weeks of announcing the sale.
1.5 Sample response: There are 15,000 items to be rotated at 12% each six months. This means that there are , or 1800 of the items on display at any given time. Assuming that 1800 of the items in the rotating collection are on display at the start, one way to find the amount of time required to rotate through all the items is by solving for t in the equation:
It will take approximately 19 six-month periods, or 9.5 years, to
display all the items.
* * * * * * * * * *
$1000(1 + 0.04 •18) + $500(1 + 0.04 •8) = $2380
$150(1 − 0.15)3 = $92.12
$150(1 − 0.15)x < $10⇒ x =17
0.12 •15,000
15,000 = 1800(1 + 0.12)t
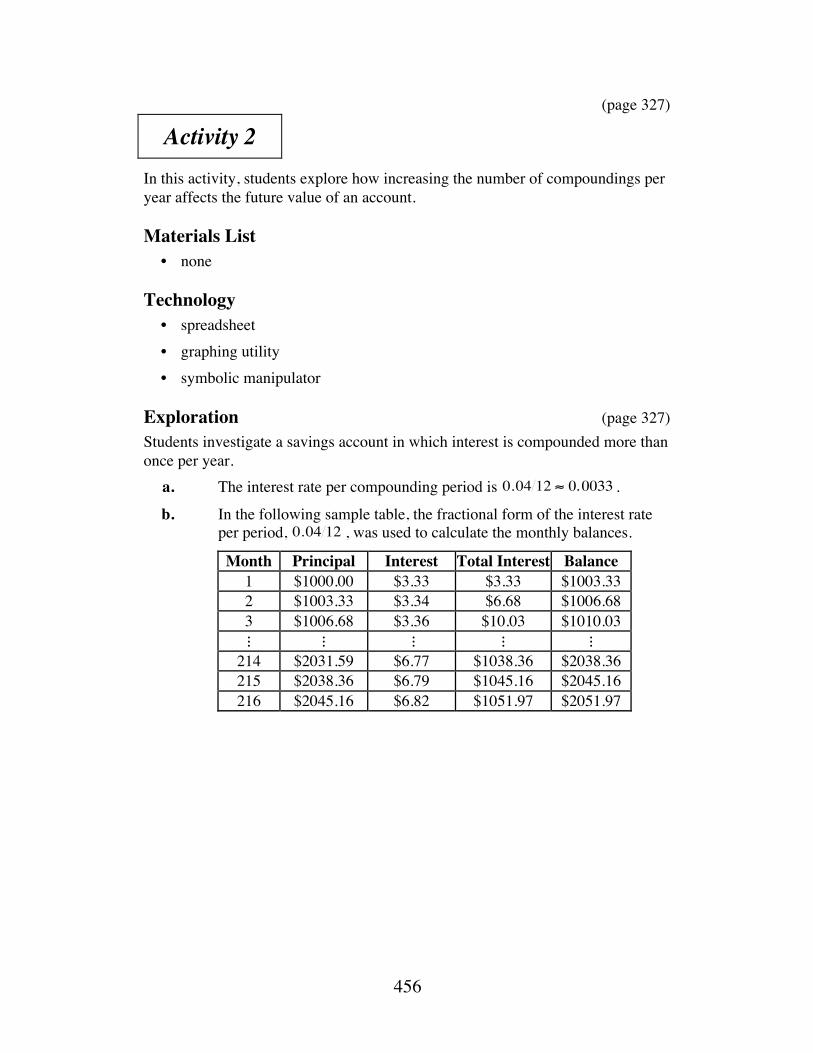
456
(page 327)
Activity 2 In this activity, students explore how increasing the number of compoundings per year affects the future value of an account.
Materials List • none
Technology • spreadsheet • graphing utility • symbolic manipulator
Exploration (page 327) Students investigate a savings account in which interest is compounded more than once per year. a. The interest rate per compounding period is .
b. In the following sample table, the fractional form of the interest rate per period, , was used to calculate the monthly balances.
Month Principal Interest Total Interest Balance 1 $1000.00 $3.33 $3.33 $1003.33 2 $1003.33 $3.34 $6.68 $1006.68 3 $1006.68 $3.36 $10.03 $1010.03 ⋮ ⋮ ⋮ ⋮ ⋮
214 $2031.59 $6.77 $1038.36 $2038.36 215 $2038.36 $6.79 $1045.16 $2045.16 216 $2045.16 $6.82 $1051.97 $2051.97
0.04 12 ≈ 0.0033
0.04 12
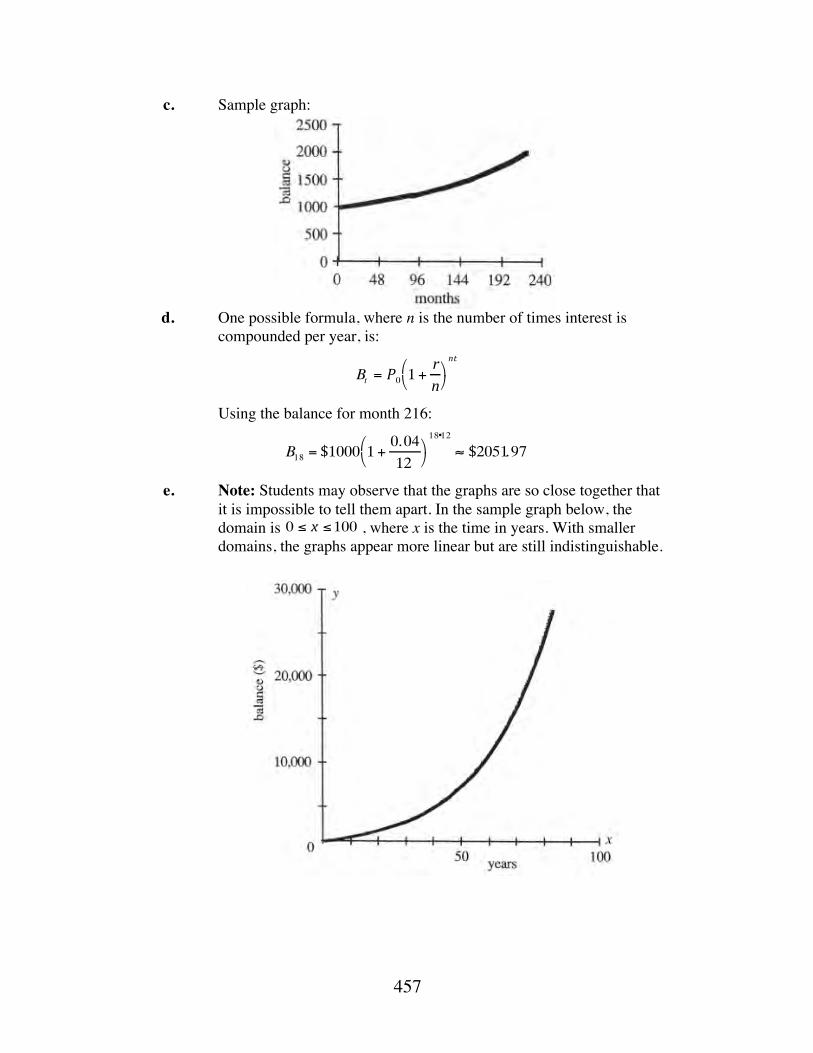
457
c. Sample graph: d. One possible formula, where n is the number of times interest is
compounded per year, is:
Using the balance for month 216:
e. Note: Students may observe that the graphs are so close together that it is impossible to tell them apart. In the sample graph below, the domain is , where x is the time in years. With smaller domains, the graphs appear more linear but are still indistinguishable.
Bt = P0 1 +rn
⎛ ⎝
⎞ ⎠
nt
B18 = $1000 1 +0.04
12⎛ ⎝
⎞ ⎠
18•12
≈ $2051.97
0 ≤ x ≤100
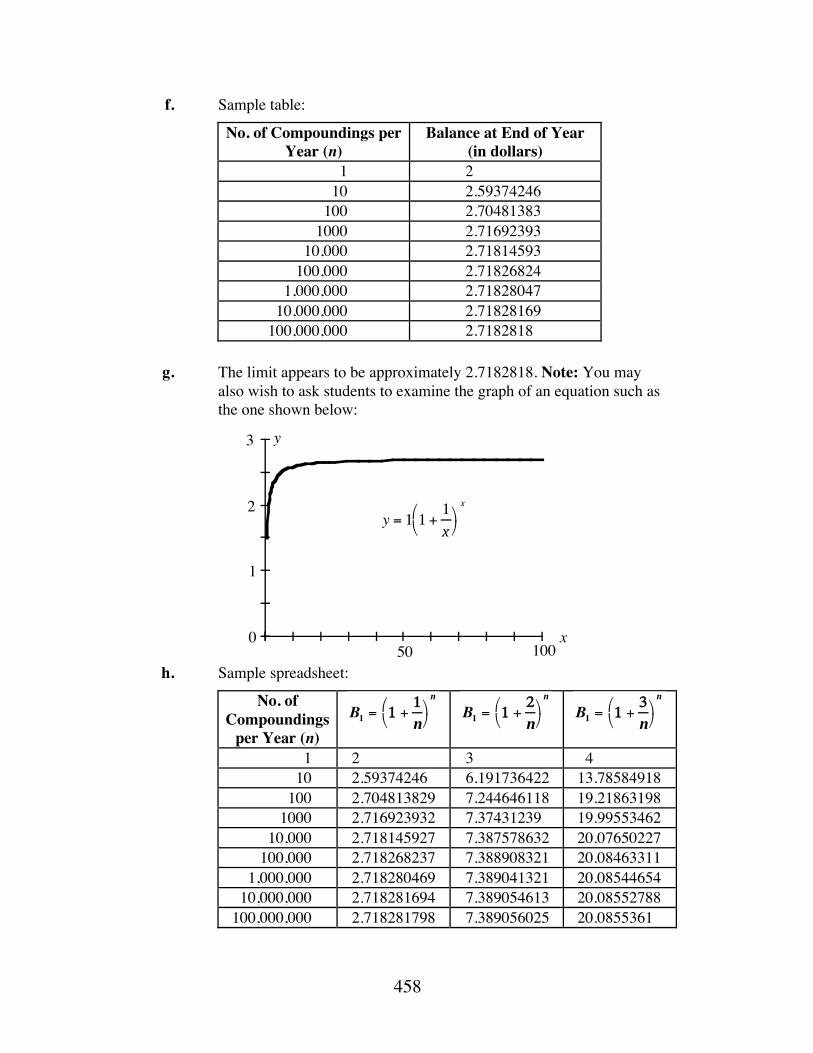
458
f. Sample table:
No. of Compoundings per Year (n)
Balance at End of Year (in dollars)
1 2 10 2.59374246
100 2.70481383 1000 2.71692393
10,000 2.71814593 100,000 2.71826824
1,000,000 2.71828047 10,000,000 2.71828169
100,000,000 2.7182818 g. The limit appears to be approximately 2.7182818. Note: You may
also wish to ask students to examine the graph of an equation such as the one shown below:
h. Sample spreadsheet:
No. of Compoundings
per Year (n)
1 2 3 4 10 2.59374246 6.191736422 13.78584918
100 2.704813829 7.244646118 19.21863198 1000 2.716923932 7.37431239 19.99553462
10,000 2.718145927 7.387578632 20.07650227 100,000 2.718268237 7.388908321 20.08463311
1,000,000 2.718280469 7.389041321 20.08544654 10,000,000 2.718281694 7.389054613 20.08552788
100,000,000 2.718281798 7.389056025 20.0855361
x
y
0
1
2
3
50 100
y = 1 1 +1
x⎛ ⎝
⎞ ⎠
x
B1 = 1 +1
n⎛ ⎝
⎞ ⎠
n
B1 = 1 +2
n⎛ ⎝
⎞ ⎠
n
B1 = 1 +3
n⎛ ⎝
⎞ ⎠
n
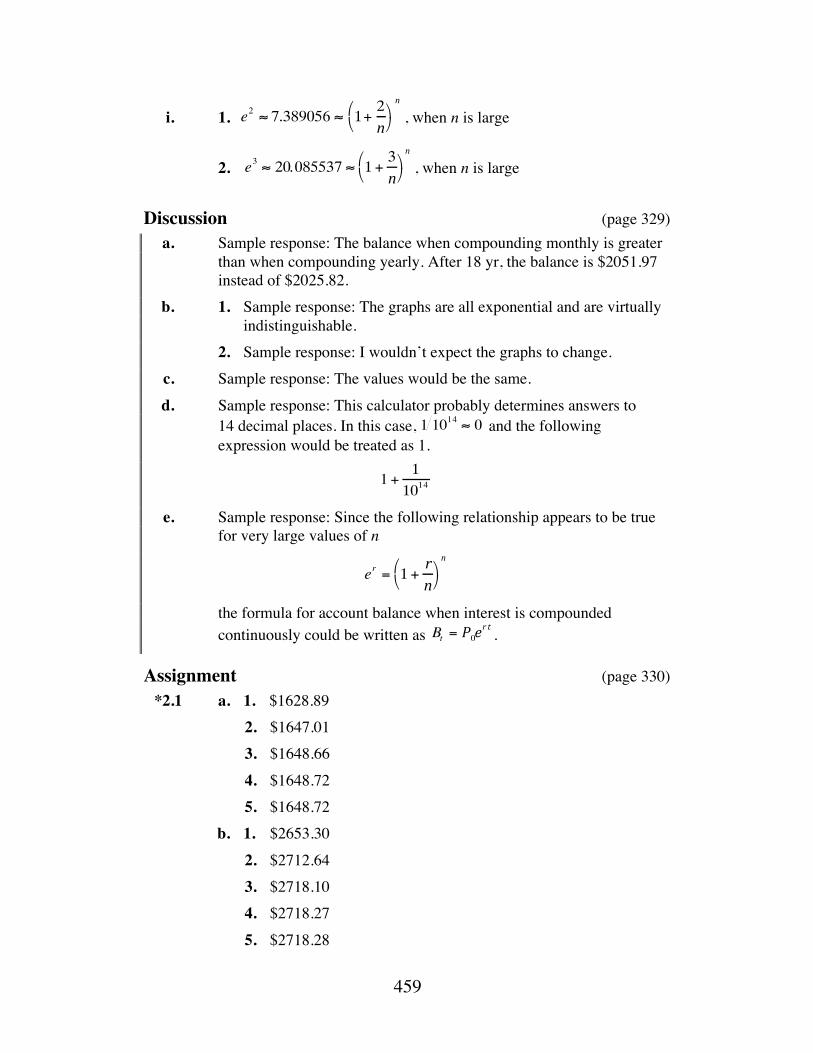
459
i. 1. , when n is large
2. , when n is large
Discussion (page 329) a. Sample response: The balance when compounding monthly is greater
than when compounding yearly. After 18 yr, the balance is $2051.97 instead of $2025.82.
b. 1. Sample response: The graphs are all exponential and are virtually indistinguishable.
2. Sample response: I wouldn’t expect the graphs to change. c. Sample response: The values would be the same. d. Sample response: This calculator probably determines answers to
14 decimal places. In this case, and the following expression would be treated as 1.
e. Sample response: Since the following relationship appears to be true for very large values of n
the formula for account balance when interest is compounded continuously could be written as .
Assignment (page 330) *2.1 a. 1. $1628.89 2. $1647.01 3. $1648.66 4. $1648.72 5. $1648.72 b. 1. $2653.30 2. $2712.64 3. $2718.10 4. $2718.27 5. $2718.28
e2 ≈ 7.389056 ≈ 1+2
n⎛ ⎝
⎞ ⎠
n
e3 ≈ 20.085537 ≈ 1 +3
n⎛ ⎝
⎞ ⎠
n
1 1014 ≈ 0
1 + 1
1014
er = 1 +rn
⎛ ⎝
⎞ ⎠
n
Bt = P0er t
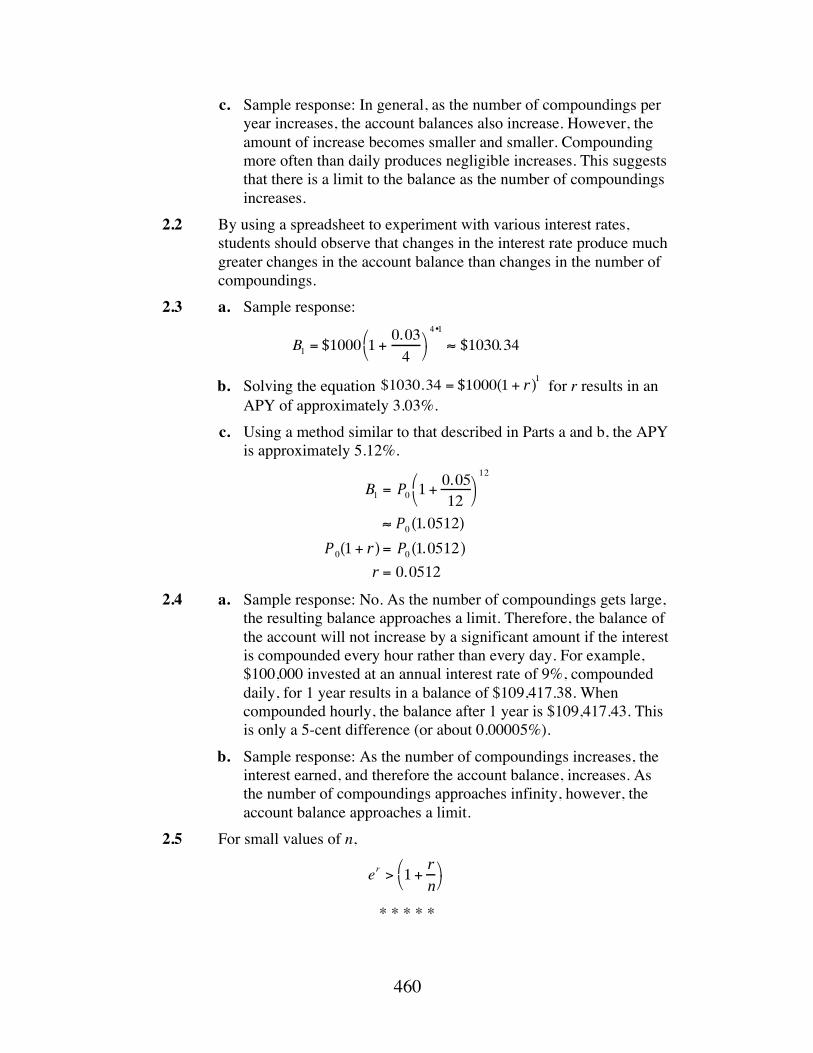
460
c. Sample response: In general, as the number of compoundings per year increases, the account balances also increase. However, the amount of increase becomes smaller and smaller. Compounding more often than daily produces negligible increases. This suggests that there is a limit to the balance as the number of compoundings increases.
2.2 By using a spreadsheet to experiment with various interest rates, students should observe that changes in the interest rate produce much greater changes in the account balance than changes in the number of compoundings.
2.3 a. Sample response:
b. Solving the equation for r results in an
APY of approximately 3.03%. c. Using a method similar to that described in Parts a and b, the APY
is approximately 5.12%.
2.4 a. Sample response: No. As the number of compoundings gets large, the resulting balance approaches a limit. Therefore, the balance of the account will not increase by a significant amount if the interest is compounded every hour rather than every day. For example, $100,000 invested at an annual interest rate of 9%, compounded daily, for 1 year results in a balance of $109,417.38. When compounded hourly, the balance after 1 year is $109,417.43. This is only a 5-cent difference (or about 0.00005%).
b. Sample response: As the number of compoundings increases, the interest earned, and therefore the account balance, increases. As the number of compoundings approaches infinity, however, the account balance approaches a limit.
2.5 For small values of n,
* * * * *
B1 = $1000 1 +0.03
4⎛ ⎝
⎞ ⎠
4•1
≈ $1030.34
$1030.34 = $1000 1 + r( )1
B1 = P0 1 +0.0512
⎛ ⎝
⎞ ⎠
12
≈ P0 (1.0512)
P 0(1 + r) = P0 (1.0512)
r = 0.0512
er > 1 +rn
⎛ ⎝
⎞ ⎠
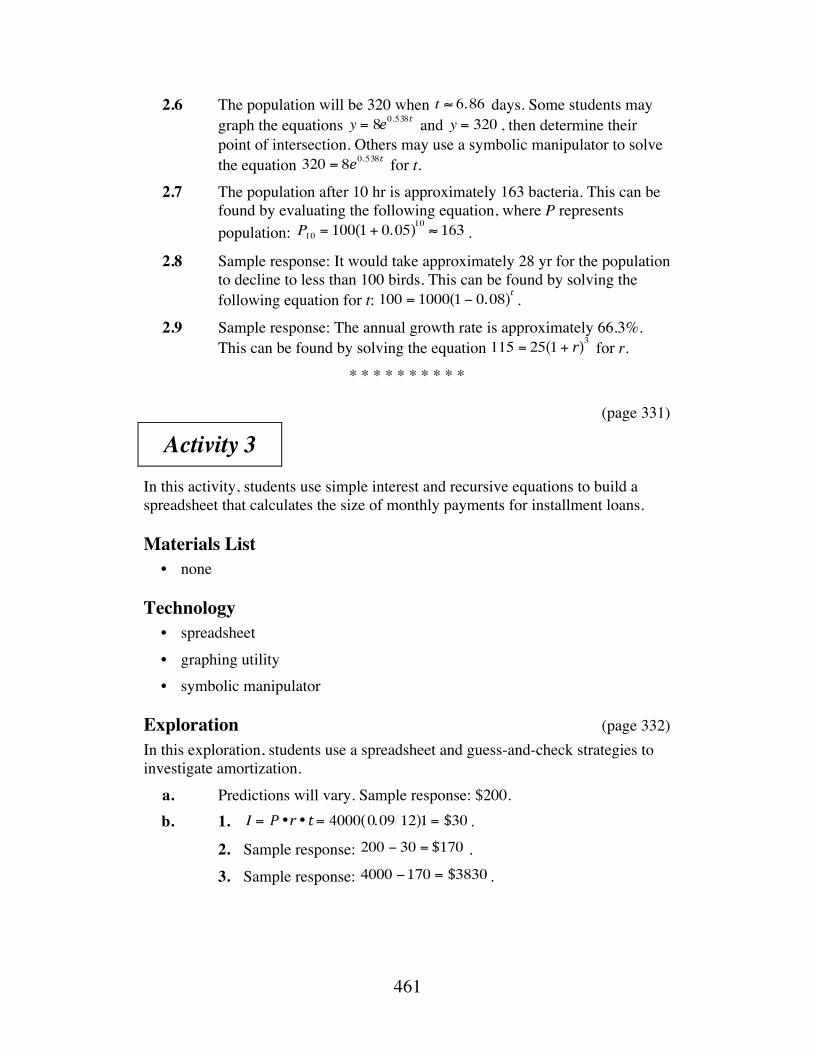
461
2.6 The population will be 320 when days. Some students may graph the equations and , then determine their point of intersection. Others may use a symbolic manipulator to solve the equation for t.
2.7 The population after 10 hr is approximately 163 bacteria. This can be found by evaluating the following equation, where P represents population: .
2.8 Sample response: It would take approximately 28 yr for the population to decline to less than 100 birds. This can be found by solving the following equation for t: .
2.9 Sample response: The annual growth rate is approximately 66.3%. This can be found by solving the equation for r.
* * * * * * * * * * (page 331)
Activity 3 In this activity, students use simple interest and recursive equations to build a spreadsheet that calculates the size of monthly payments for installment loans.
Materials List • none
Technology • spreadsheet • graphing utility • symbolic manipulator
Exploration (page 332) In this exploration, students use a spreadsheet and guess-and-check strategies to investigate amortization. a. Predictions will vary. Sample response: $200. b. 1. .
2. Sample response: .
3. Sample response: .
t ≈ 6.86y = 8e0.538t y = 320
320 = 8e0.538t
P10 = 100 1 + 0.05( )10≈ 163
100 = 1000 1 − 0.08( )t
115 = 25 1 + r( )3
I = P •r • t= 4000(0.09 12)1 = $30200 − 30 = $1704000 −170 = $3830
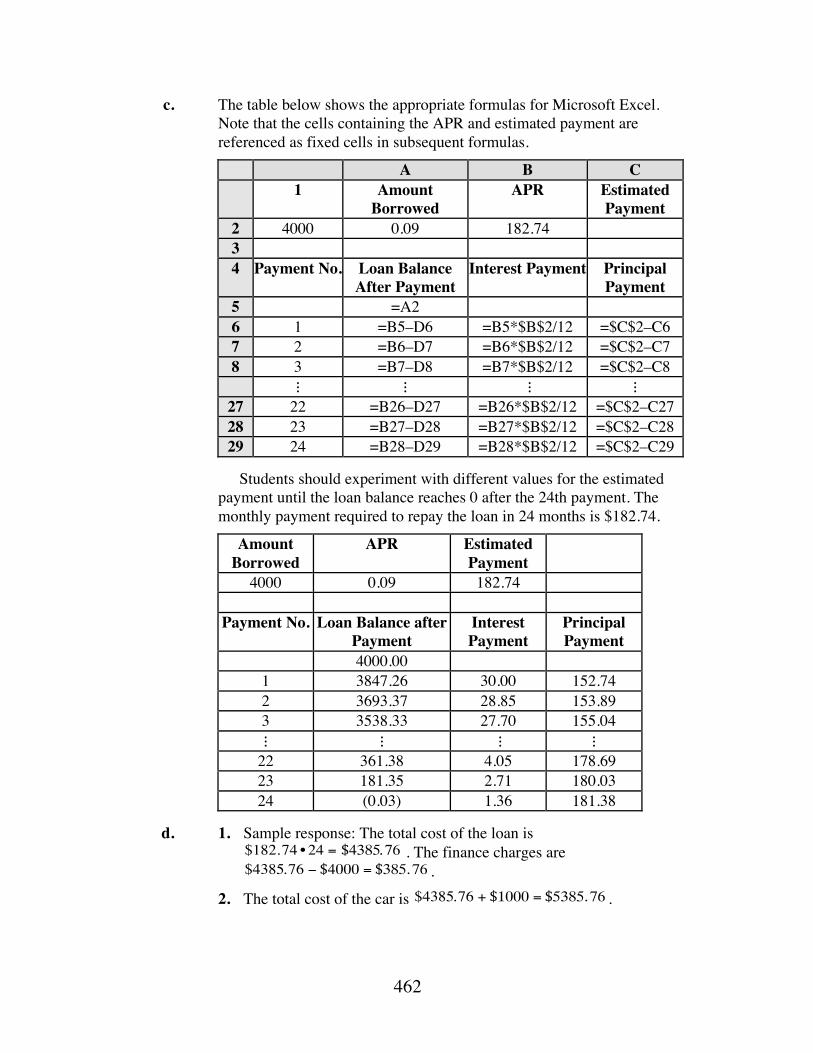
462
c. The table below shows the appropriate formulas for Microsoft Excel. Note that the cells containing the APR and estimated payment are referenced as fixed cells in subsequent formulas.
A B C 1 Amount
Borrowed APR Estimated
Payment 2 4000 0.09 182.74 3 4 Payment No. Loan Balance
After Payment Interest Payment Principal
Payment 5 =A2 6 1 =B5–D6 =B5*$B$2/12 =$C$2–C6 7 2 =B6–D7 =B6*$B$2/12 =$C$2–C7 8 3 =B7–D8 =B7*$B$2/12 =$C$2–C8 ⋮ ⋮ ⋮ ⋮
27 22 =B26–D27 =B26*$B$2/12 =$C$2–C27 28 23 =B27–D28 =B27*$B$2/12 =$C$2–C28 29 24 =B28–D29 =B28*$B$2/12 =$C$2–C29
Students should experiment with different values for the estimated
payment until the loan balance reaches 0 after the 24th payment. The monthly payment required to repay the loan in 24 months is $182.74.
Amount Borrowed
APR Estimated Payment
4000 0.09 182.74
Payment No. Loan Balance after Payment
Interest Payment
Principal Payment
4000.00 1 3847.26 30.00 152.74 2 3693.37 28.85 153.89 3 3538.33 27.70 155.04 ⋮ ⋮ ⋮ ⋮
22 361.38 4.05 178.69 23 181.35 2.71 180.03 24 (0.03) 1.36 181.38
d. 1. Sample response: The total cost of the loan is
. The finance charges are .
2. The total cost of the car is .
$182.74 • 24 = $4385.76$4385.76 − $4000 = $385.76
$4385.76 + $1000 = $5385.76
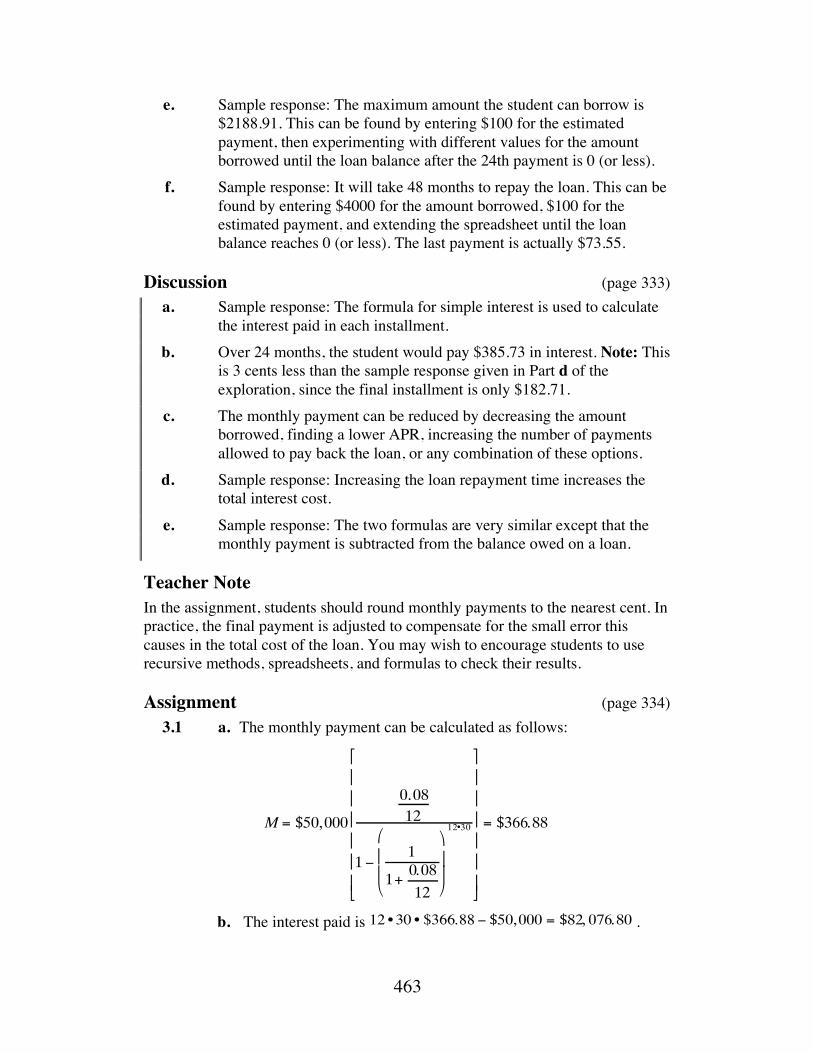
463
e. Sample response: The maximum amount the student can borrow is $2188.91. This can be found by entering $100 for the estimated payment, then experimenting with different values for the amount borrowed until the loan balance after the 24th payment is 0 (or less).
f. Sample response: It will take 48 months to repay the loan. This can be found by entering $4000 for the amount borrowed, $100 for the estimated payment, and extending the spreadsheet until the loan balance reaches 0 (or less). The last payment is actually $73.55.
Discussion (page 333) a. Sample response: The formula for simple interest is used to calculate
the interest paid in each installment. b. Over 24 months, the student would pay $385.73 in interest. Note: This
is 3 cents less than the sample response given in Part d of the exploration, since the final installment is only $182.71.
c. The monthly payment can be reduced by decreasing the amount borrowed, finding a lower APR, increasing the number of payments allowed to pay back the loan, or any combination of these options.
d. Sample response: Increasing the loan repayment time increases the total interest cost.
e. Sample response: The two formulas are very similar except that the monthly payment is subtracted from the balance owed on a loan.
Teacher Note In the assignment, students should round monthly payments to the nearest cent. In practice, the final payment is adjusted to compensate for the small error this causes in the total cost of the loan. You may wish to encourage students to use recursive methods, spreadsheets, and formulas to check their results.
Assignment (page 334) 3.1 a. The monthly payment can be calculated as follows:
b. The interest paid is .
M = $50,000
0.0812
1 −1
1+0.08
12
⎛
⎝
⎜ ⎜
⎞
⎠
⎟ ⎟
12•30
⎡
⎣
⎢ ⎢ ⎢ ⎢ ⎢ ⎢
⎤
⎦
⎥ ⎥ ⎥ ⎥ ⎥ ⎥
= $366.88
12 • 30 • $366.88 − $50,000 = $82, 076.80
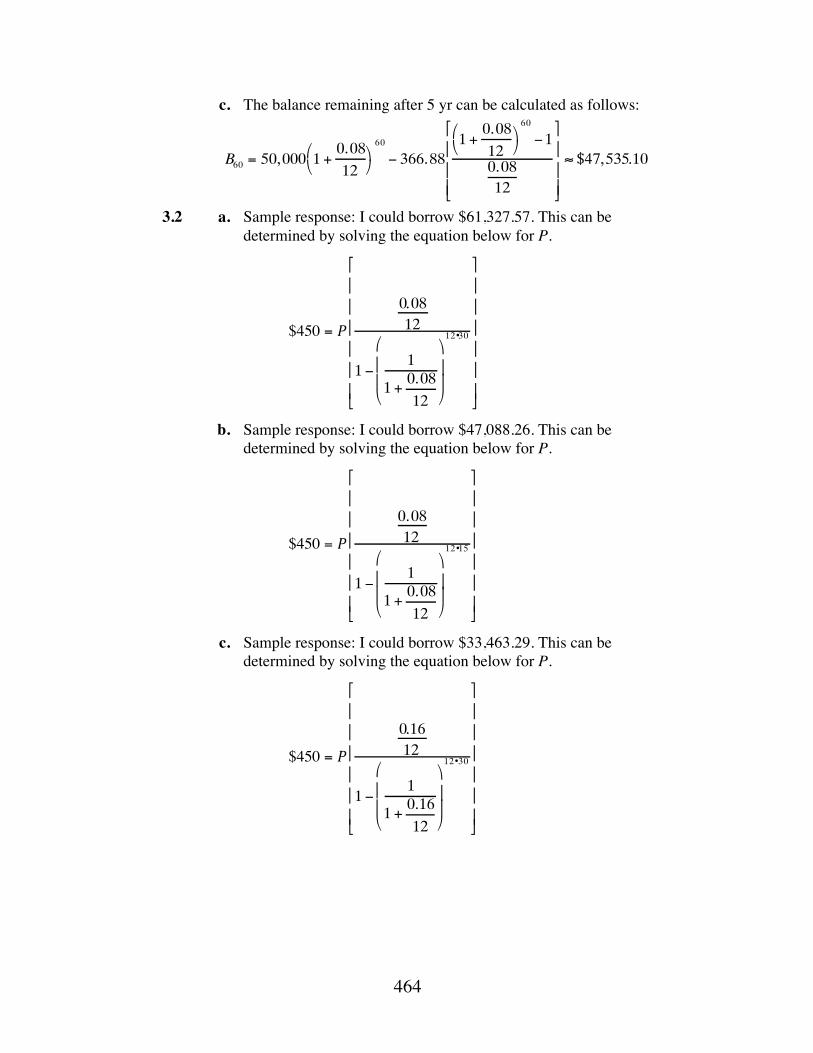
464
c. The balance remaining after 5 yr can be calculated as follows:
3.2 a. Sample response: I could borrow $61,327.57. This can be
determined by solving the equation below for P.
b. Sample response: I could borrow $47,088.26. This can be
determined by solving the equation below for P.
c. Sample response: I could borrow $33,463.29. This can be
determined by solving the equation below for P.
$450 = P
0.0812
1 −1
1 +0.08
12
⎛
⎝
⎜ ⎜
⎞
⎠
⎟ ⎟
12•30
⎡
⎣
⎢ ⎢ ⎢ ⎢ ⎢ ⎢
⎤
⎦
⎥ ⎥ ⎥ ⎥ ⎥ ⎥
$450 = P
0.0812
1 −1
1 +0.08
12
⎛
⎝
⎜ ⎜
⎞
⎠
⎟ ⎟
12•15
⎡
⎣
⎢ ⎢ ⎢ ⎢ ⎢ ⎢
⎤
⎦
⎥ ⎥ ⎥ ⎥ ⎥ ⎥
$450 = P
0.1612
1 −1
1 +0.16
12
⎛
⎝
⎜ ⎜
⎞
⎠
⎟ ⎟
12•30
⎡
⎣
⎢ ⎢ ⎢ ⎢ ⎢ ⎢
⎤
⎦
⎥ ⎥ ⎥ ⎥ ⎥ ⎥
B60 = 50,000 1 +0.08
12⎛ ⎝
⎞ ⎠
60
− 366.881 +
0.08
12⎛ ⎝
⎞ ⎠
60
−1
0.0812
⎡
⎣
⎢ ⎢ ⎢
⎤
⎦
⎥ ⎥ ⎥
≈ $47,535.10
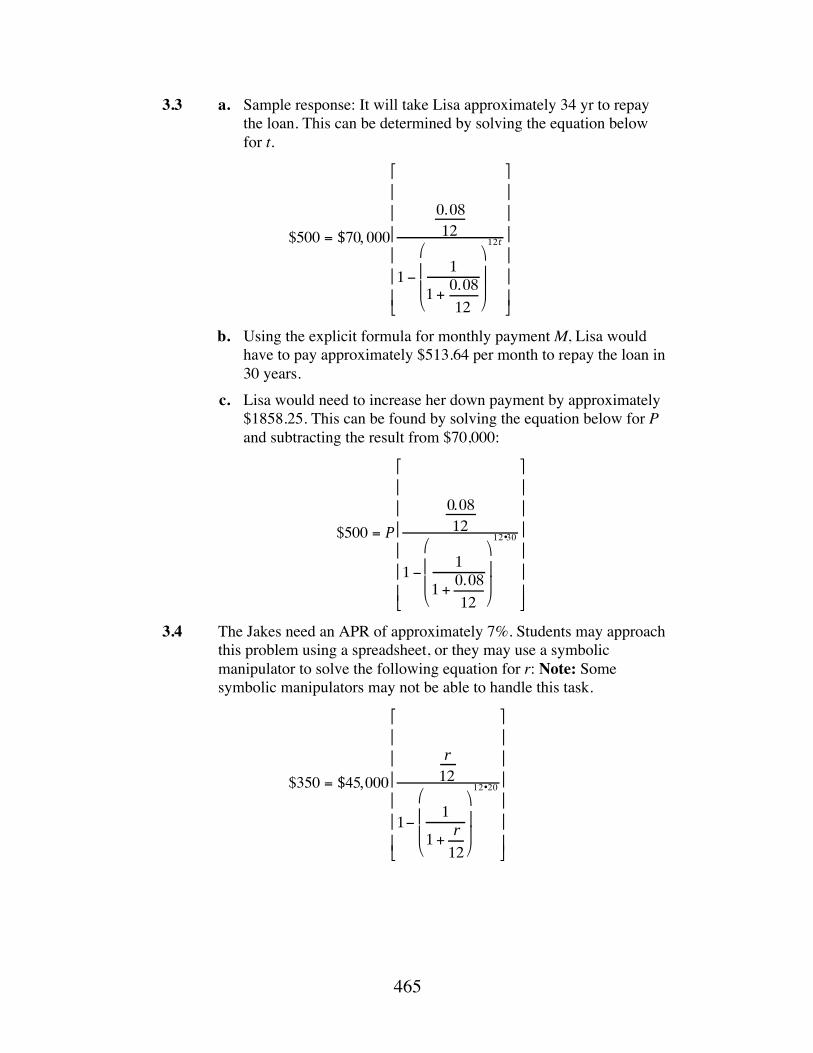
465
3.3 a. Sample response: It will take Lisa approximately 34 yr to repay the loan. This can be determined by solving the equation below for t.
b. Using the explicit formula for monthly payment M, Lisa would
have to pay approximately $513.64 per month to repay the loan in 30 years.
c. Lisa would need to increase her down payment by approximately $1858.25. This can be found by solving the equation below for P and subtracting the result from $70,000:
3.4 The Jakes need an APR of approximately 7%. Students may approach
this problem using a spreadsheet, or they may use a symbolic manipulator to solve the following equation for r: Note: Some symbolic manipulators may not be able to handle this task.
$500 = $70, 000
0.0812
1 −1
1 +0.08
12
⎛
⎝
⎜ ⎜
⎞
⎠
⎟ ⎟
12t
⎡
⎣
⎢ ⎢ ⎢ ⎢ ⎢ ⎢
⎤
⎦
⎥ ⎥ ⎥ ⎥ ⎥ ⎥
$500 = P
0.0812
1 −1
1 +0.08
12
⎛
⎝
⎜ ⎜
⎞
⎠
⎟ ⎟
12•30
⎡
⎣
⎢ ⎢ ⎢ ⎢ ⎢ ⎢
⎤
⎦
⎥ ⎥ ⎥ ⎥ ⎥ ⎥
$350 = $45,000
r12
1−1
1 +r
12
⎛
⎝
⎜ ⎜
⎞
⎠
⎟ ⎟
12•20
⎡
⎣
⎢ ⎢ ⎢ ⎢ ⎢ ⎢
⎤
⎦
⎥ ⎥ ⎥ ⎥ ⎥ ⎥
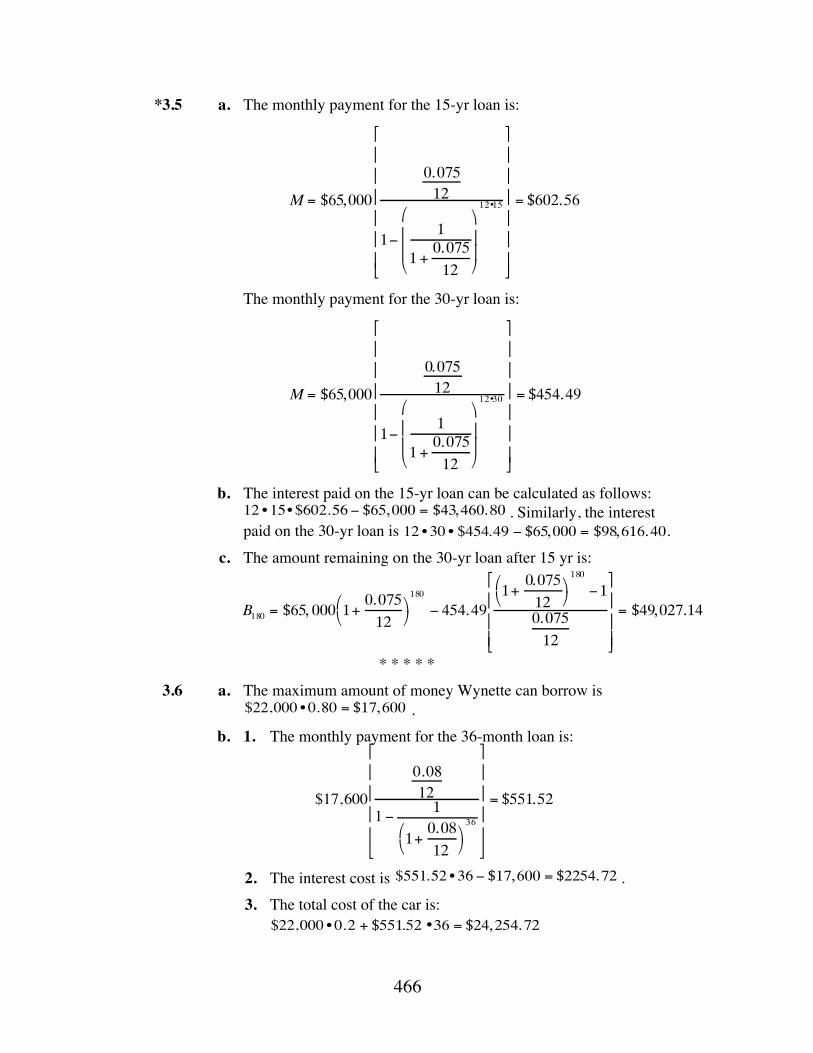
466
12 • 30 • $454.49 − $65,000 = $98,616.40
B180 = $65, 000 1+0.075
12⎛ ⎝
⎞ ⎠
180
− 454.491+
0.075
12⎛ ⎝
⎞ ⎠
180
−1
0.075
12
⎡
⎣
⎢ ⎢ ⎢
⎤
⎦
⎥ ⎥ ⎥
= $49,027.14
$17,600
0.0812
1 − 1
1+0.08
12⎛ ⎝
⎞ ⎠
36
⎡
⎣
⎢ ⎢ ⎢ ⎢
⎤
⎦
⎥ ⎥ ⎥ ⎥
= $551.52
*3.5 a. The monthly payment for the 15-yr loan is:
The monthly payment for the 30-yr loan is:
b. The interest paid on the 15-yr loan can be calculated as follows:
. Similarly, the interest paid on the 30-yr loan is .
c. The amount remaining on the 30-yr loan after 15 yr is:
* * * * * 3.6 a. The maximum amount of money Wynette can borrow is
. b. 1. The monthly payment for the 36-month loan is:
2. The interest cost is . 3. The total cost of the car is:
M = $65,000
0.07512
1−1
1 +0.075
12
⎛
⎝
⎜ ⎜
⎞
⎠
⎟ ⎟
12•15
⎡
⎣
⎢ ⎢ ⎢ ⎢ ⎢ ⎢
⎤
⎦
⎥ ⎥ ⎥ ⎥ ⎥ ⎥
= $602.56
M = $65,000
0.07512
1−1
1 +0.075
12
⎛
⎝
⎜ ⎜
⎞
⎠
⎟ ⎟
12•30
⎡
⎣
⎢ ⎢ ⎢ ⎢ ⎢ ⎢
⎤
⎦
⎥ ⎥ ⎥ ⎥ ⎥ ⎥
= $454.49
12 • 15• $602.56 − $65,000 = $43,460.80
$22,000 • 0.80 = $17,600
$551.52 • 36 − $17,600 = $2254.72
$22,000 • 0.2 + $551.52 •36 = $24,254.72
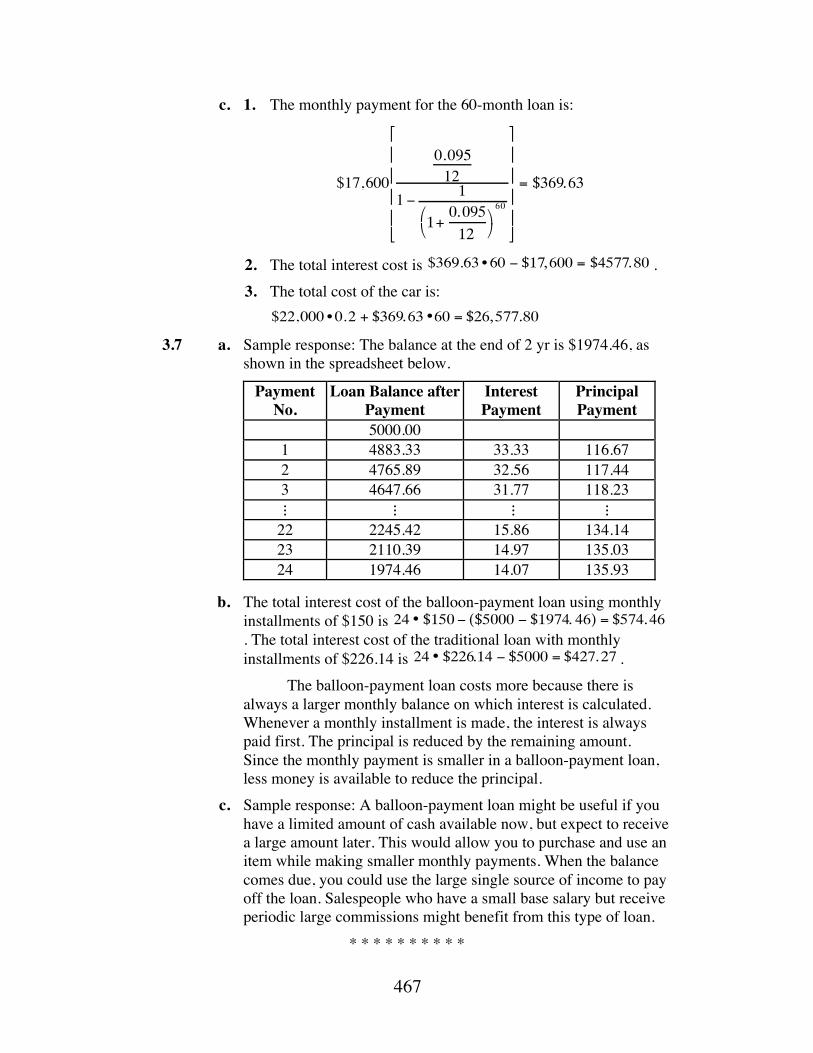
467
c. 1. The monthly payment for the 60-month loan is:
2. The total interest cost is . 3. The total cost of the car is:
3.7 a. Sample response: The balance at the end of 2 yr is $1974.46, as
shown in the spreadsheet below.
Payment No.
Loan Balance after Payment
Interest Payment
Principal Payment
5000.00 1 4883.33 33.33 116.67 2 4765.89 32.56 117.44 3 4647.66 31.77 118.23 ⋮ ⋮ ⋮ ⋮
22 2245.42 15.86 134.14 23 2110.39 14.97 135.03 24 1974.46 14.07 135.93
b. The total interest cost of the balloon-payment loan using monthly
installments of $150 is . The total interest cost of the traditional loan with monthly installments of $226.14 is .
The balloon-payment loan costs more because there is always a larger monthly balance on which interest is calculated. Whenever a monthly installment is made, the interest is always paid first. The principal is reduced by the remaining amount. Since the monthly payment is smaller in a balloon-payment loan, less money is available to reduce the principal.
c. Sample response: A balloon-payment loan might be useful if you have a limited amount of cash available now, but expect to receive a large amount later. This would allow you to purchase and use an item while making smaller monthly payments. When the balance comes due, you could use the large single source of income to pay off the loan. Salespeople who have a small base salary but receive periodic large commissions might benefit from this type of loan.
* * * * * * * * * *
$17,600
0.09512
1 − 1
1+0.095
12⎛ ⎝
⎞ ⎠
60
⎡
⎣
⎢ ⎢ ⎢ ⎢
⎤
⎦
⎥ ⎥ ⎥ ⎥
= $369.63
$369.63 • 60 − $17,600 = $4577.80
$22,000 • 0.2 + $369.63 •60 = $26,577.80
24 • $150 − ($5000 − $1974. 46) = $574.46
24 • $226.14 − $5000 = $427.27

468
Research Project (page 336) Depending on the type of account, interest rates at most financial institutions can vary from year to year, or day to day. Students also may uncover differences in the compounding periods used by full-service banks and credit unions. Interest rates and terms for car loans also will vary among financial institutions. In general, loans for new cars offer lower interest rates and longer terms than those for used cars.
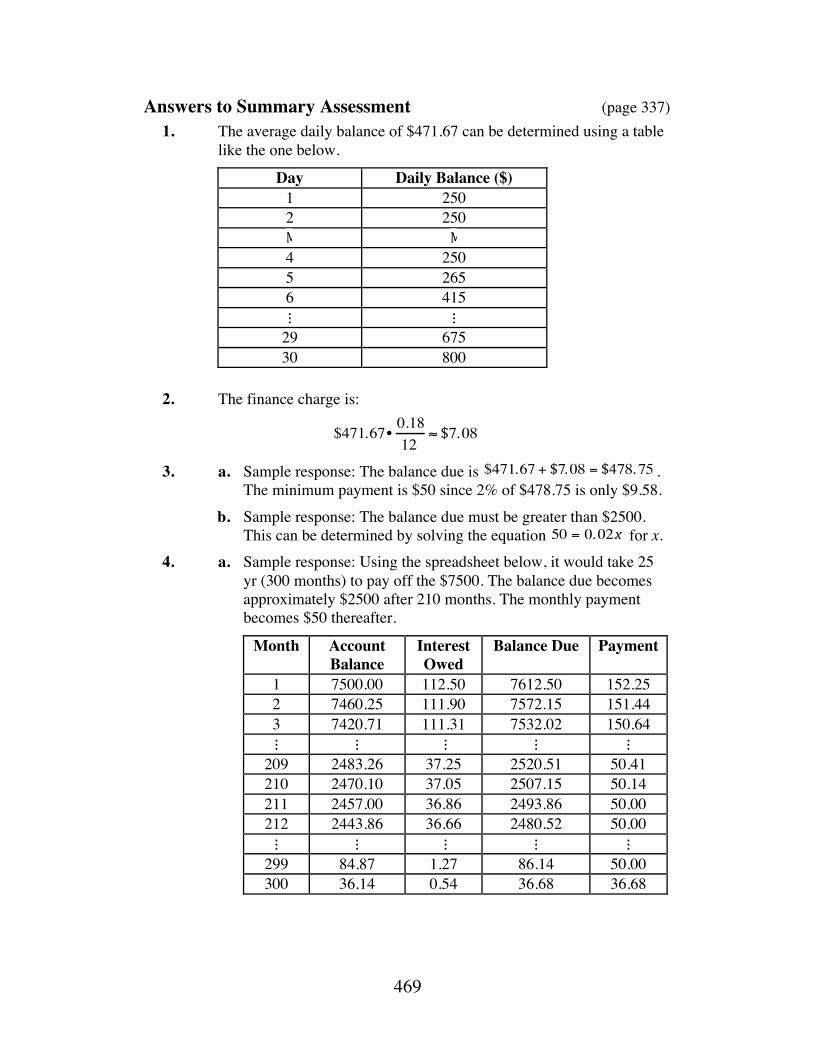
469
Answers to Summary Assessment (page 337) 1. The average daily balance of $471.67 can be determined using a table
like the one below.
Day Daily Balance ($) 1 250 2 250
4 250 5 265 6 415 ⋮ ⋮
29 675 30 800
2. The finance charge is:
3. a. Sample response: The balance due is .
The minimum payment is $50 since 2% of $478.75 is only $9.58. b. Sample response: The balance due must be greater than $2500.
This can be determined by solving the equation for x. 4. a. Sample response: Using the spreadsheet below, it would take 25
yr (300 months) to pay off the $7500. The balance due becomes approximately $2500 after 210 months. The monthly payment becomes $50 thereafter.
Month Account Balance
Interest Owed
Balance Due Payment
1 7500.00 112.50 7612.50 152.25 2 7460.25 111.90 7572.15 151.44 3 7420.71 111.31 7532.02 150.64 ⋮ ⋮ ⋮ ⋮ ⋮
209 2483.26 37.25 2520.51 50.41 210 2470.10 37.05 2507.15 50.14 211 2457.00 36.86 2493.86 50.00 212 2443.86 36.66 2480.52 50.00 ⋮ ⋮ ⋮ ⋮ ⋮
299 84.87 1.27 86.14 50.00 300 36.14 0.54 36.68 36.68
M M
$471.67• 0.1812
≈ $7.08
$471.67 + $7.08 = $478.75
50 = 0.02x
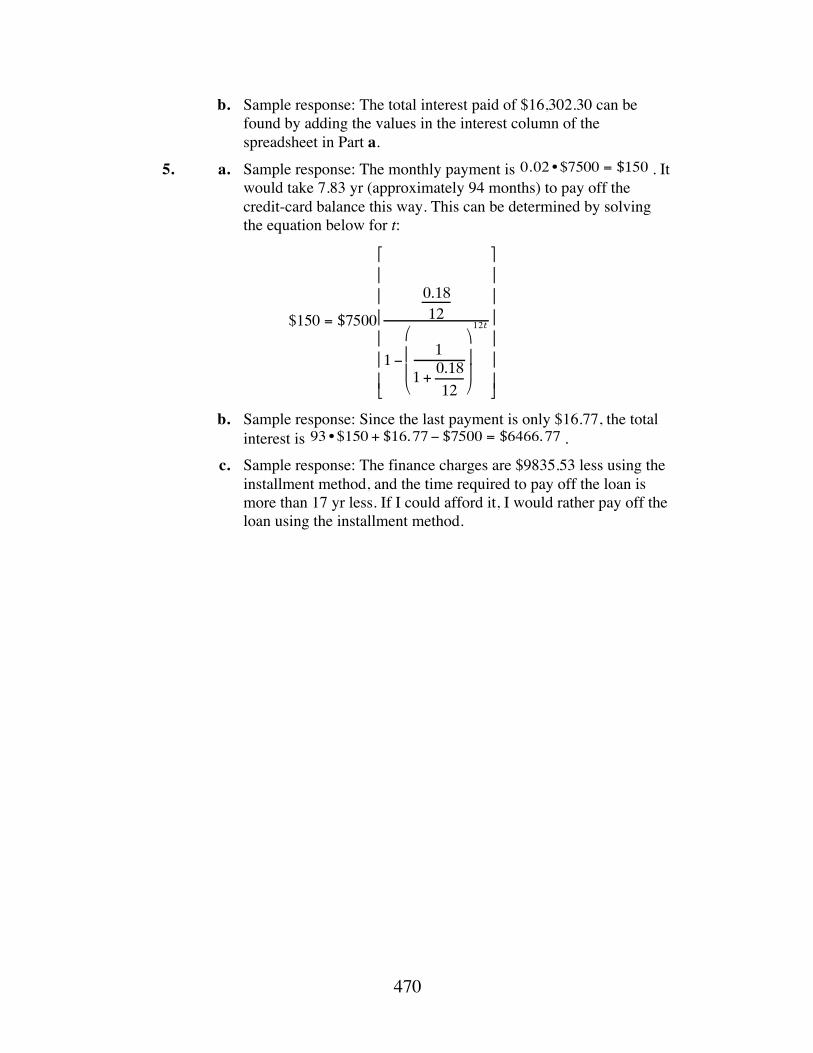
470
b. Sample response: The total interest paid of $16,302.30 can be found by adding the values in the interest column of the spreadsheet in Part a.
5. a. Sample response: The monthly payment is . It would take 7.83 yr (approximately 94 months) to pay off the credit-card balance this way. This can be determined by solving the equation below for t:
b. Sample response: Since the last payment is only $16.77, the total interest is .
c. Sample response: The finance charges are $9835.53 less using the installment method, and the time required to pay off the loan is more than 17 yr less. If I could afford it, I would rather pay off the loan using the installment method.
0.02 • $7500 = $150
$150 = $7500
0.1812
1 −1
1 +0.18
12
⎛
⎝
⎜ ⎜
⎞
⎠
⎟ ⎟
12t
⎡
⎣
⎢ ⎢ ⎢ ⎢ ⎢ ⎢
⎤
⎦
⎥ ⎥ ⎥ ⎥ ⎥ ⎥
93 • $150 + $16.77 − $7500 = $6466.77

471
Module Assessment
1. Imagine that you have invested $7500 in a certificate of deposit (CD)
for 5 yr. a. Calculate the value of your investment after 5 yr if the CD pays
simple interest of 8% per year. b. Calculate the value of your investment after 5 yr if the CD offers
an annual interest rate of 8%, compounded monthly. c. Explain why compound interest and simple interest yield different
values for the investment. Include examples to support your response.
2. Liana plans to deposit $750 in a savings account. In 8 yr, she would like her investment to grow to $1250. What annual interest rate, compounded quarterly, does she need to meet this goal?
3. Which savings account is a better investment: one that offers an annual interest rate of 3.5% compounded daily, or one that earns 4% per year compounded annually? Justify your response.
4. Determine the monthly installment necessary to repay a $12,000 loan with an APR of 13% in 4 yr.
5. The Sojo family is planning to buy a new home. The purchase price of the house is $70,000 and their banker has offered them two possible payment plans.
Under plan A, the Sojos would make a down payment of $20,000, then borrow $50,000 for 20 yr at an APR of 8%.
Under plan B, the family would make a down payment of $30,000, then borrow $40,000 for 30 yr at an APR of 8.5%.
Describe some advantages and disadvantages to each plan and explain which plan you would recommend to the family.
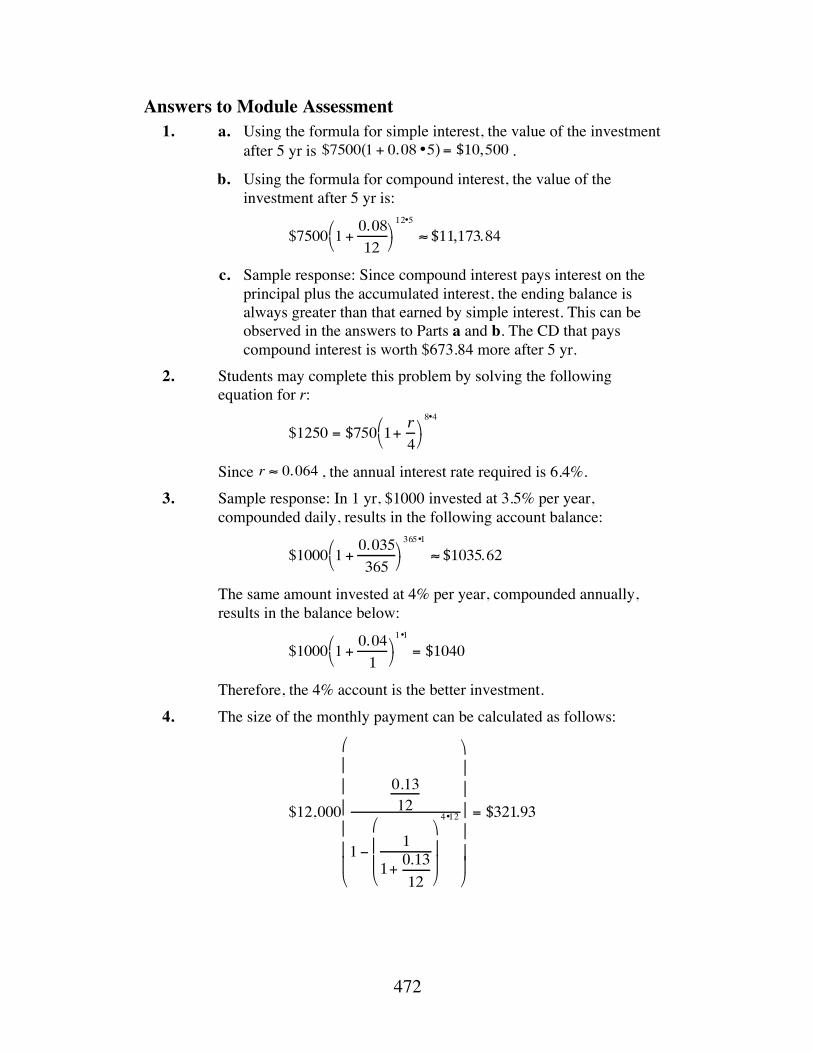
472
Answers to Module Assessment 1. a. Using the formula for simple interest, the value of the investment
after 5 yr is .
b. Using the formula for compound interest, the value of the investment after 5 yr is:
c. Sample response: Since compound interest pays interest on the principal plus the accumulated interest, the ending balance is always greater than that earned by simple interest. This can be observed in the answers to Parts a and b. The CD that pays compound interest is worth $673.84 more after 5 yr.
2. Students may complete this problem by solving the following equation for r:
Since , the annual interest rate required is 6.4%. 3. Sample response: In 1 yr, $1000 invested at 3.5% per year,
compounded daily, results in the following account balance:
The same amount invested at 4% per year, compounded annually, results in the balance below:
Therefore, the 4% account is the better investment. 4. The size of the monthly payment can be calculated as follows:
$7500 1 + 0.08 •5( ) = $10,500
$7500 1 +0.08
12⎛ ⎝
⎞ ⎠
12•5
≈ $11,173.84
$1250 = $750 1+r4
⎛ ⎝
⎞ ⎠
8•4
r ≈ 0.064
$1000 1 +0.035
365⎛ ⎝
⎞ ⎠
365•1
≈ $1035.62
$1000 1 +0.04
1⎛ ⎝
⎞ ⎠
1•1
= $1040
$12,000
0.1312
1 − 1
1+0.13
12
⎛
⎝
⎜ ⎜
⎞
⎠
⎟ ⎟
4•12
⎛
⎝
⎜ ⎜ ⎜ ⎜ ⎜ ⎜
⎞
⎠
⎟ ⎟ ⎟ ⎟ ⎟ ⎟
= $321.93
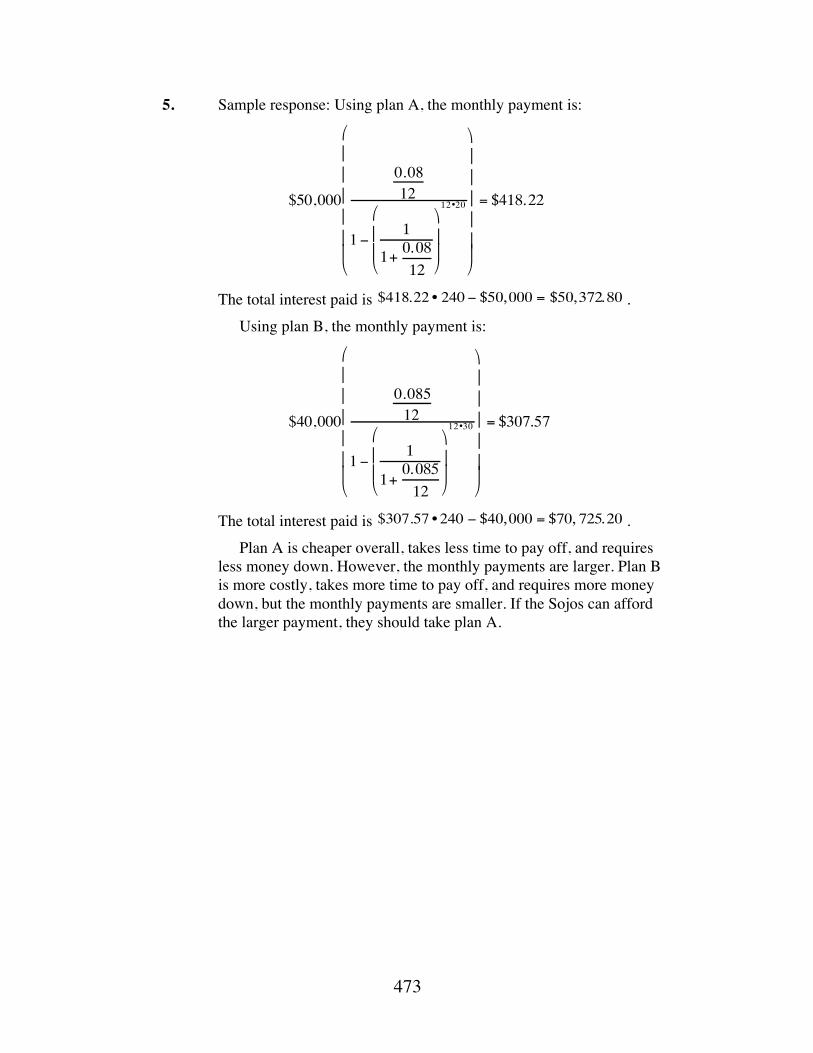
473
5. Sample response: Using plan A, the monthly payment is:
The total interest paid is . Using plan B, the monthly payment is:
The total interest paid is . Plan A is cheaper overall, takes less time to pay off, and requires
less money down. However, the monthly payments are larger. Plan B is more costly, takes more time to pay off, and requires more money down, but the monthly payments are smaller. If the Sojos can afford the larger payment, they should take plan A.
$50,000
0.0812
1 −1
1+0.08
12
⎛
⎝
⎜ ⎜
⎞
⎠
⎟ ⎟
12•20
⎛
⎝
⎜ ⎜ ⎜ ⎜ ⎜ ⎜
⎞
⎠
⎟ ⎟ ⎟ ⎟ ⎟ ⎟
= $418.22
$418.22 • 240 − $50,000 = $50,372.80
$40,000
0.08512
1 − 1
1+0.085
12
⎛
⎝
⎜ ⎜
⎞
⎠
⎟ ⎟
12•30
⎛
⎝
⎜ ⎜ ⎜ ⎜ ⎜ ⎜
⎞
⎠
⎟ ⎟ ⎟ ⎟ ⎟ ⎟
= $307.57
$307.57 • 240 − $40,000 = $70, 725.20

474
Selected References Broverman, S. A. Mathematics of Investment and Credit. Winsted and Avon, CT:
ACTEX Publications, 1991. Brigham, E. F. Financial Management: Theory and Practice. Hinsdale, IL: Holt,
Rinehart and Winston, 1979.
475
Flashbacks
Activity 1 1.1 Use the arithmetic sequence below to complete Parts a and b: 4, 7, 10, 13, 16, ...
a. Write a recursive formula to define , the nth term in the sequence.
b. Write an explicit formula to define , the nth term in the sequence.
1.2 a. Determine the value of V in the equation below when cm:
b. Determine the value of P in the following equation when cm and cm:
1.3 Solve each of the following equations for x. a.
b.
c.
d.
Activity 2 2.1 Solve each of the following equations for d. a.
b.
2.2 a. Solve the following equation for t.
b. Solve the equation below for m:
2.3 Calculate the simple interest earned on an investment of $5000 at an
annual interest rate of 4% for 4 yr.
tn
tn
r = 2.4
V =4
3πr3
l = 3.8w =1.7
P = 2(l +w)
5(x +1) − 3 = x
3x+1 = 27
2.4 x+1 = 11.3
(x + 4)5 = 5.1
S = d t
F = G1
m1 •m2
d2
a =V f −Vi
t
F = mv2
r

476
Activity 3 3.1 A savings account offers an annual interest rate of 4.5%, compounded
monthly. If you make an initial deposit of $2500, what will the balance be after 5 yr?
3.2 How long would it take the account described in Flashback 3.1 to reach a balance $7000?
477
Answers to Flashbacks
Activity 1 1.1 a. The recursive formula is for and .
b. The explicit formula is for .
1.2 a.
b.
1.3 a.
b. c. d.
Activity 2 2.1 a.
b.
2.2 a.
b.
2.3 The simple interest is .
Activity 3 3.1 The balance can be found as follows:
3.2 By solving the equation below for t, students should determine that it would take approximately 23 yr for the balance to reach $7500:
tn = tn−1 + 3 t1 = 4 n ≥ 2
tn = 3n+1 n ≥ 1
V =4
3π(2.4)3 ≈ 58 cm3
P = 2(3.8 +1.7) =11 cmx = −1 2
x = 2
x ≈1.77
x ≈ −2.6
d = St
d = G1m1 •m2
F
t =V f − Via
m =v2
r F$5000 • 0.04 • 4 = $800
$2500 1 +0.045
12⎛ ⎝
⎞ ⎠
12•5
≈ $3129.49
$7000 = $2500 1+0.045
12⎛ ⎝
⎞ ⎠
12t