Embed Size (px)
Citation preview

Education Appropriations Subcommittee
2021 Legislative Session – Presentation Material
January 2021
Day 3 1/22/21
2
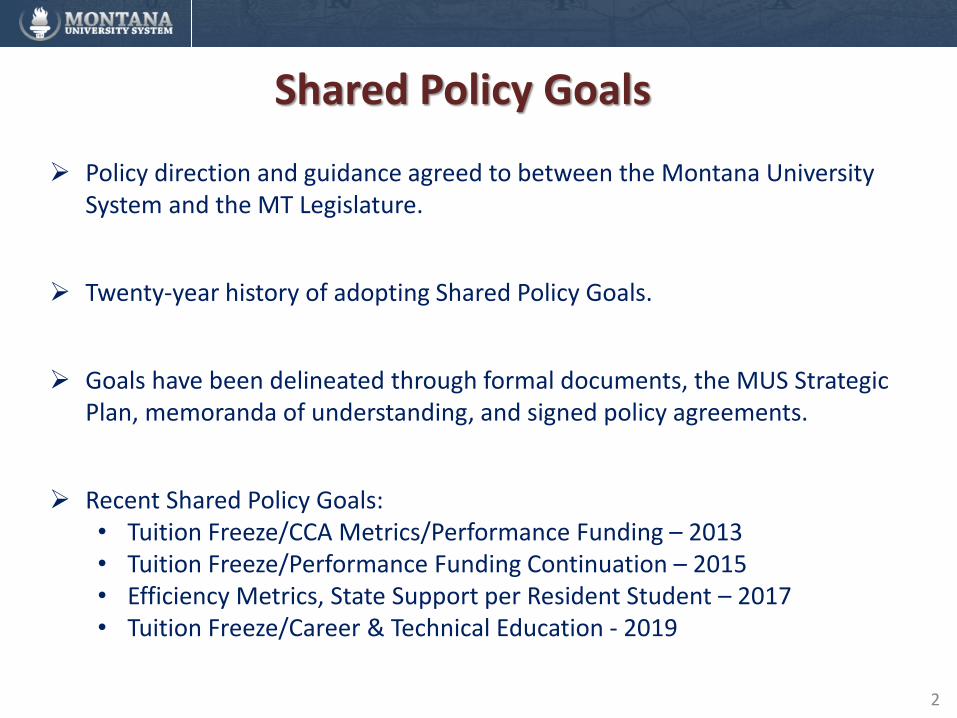
Shared Policy Goals
➢ Policy direction and guidance agreed to between the Montana University System and the MT Legislature.
➢ Twenty-year history of adopting Shared Policy Goals.
➢ Goals have been delineated through formal documents, the MUS Strategic Plan, memoranda of understanding, and signed policy agreements.
➢ Recent Shared Policy Goals: • Tuition Freeze/CCA Metrics/Performance Funding – 2013• Tuition Freeze/Performance Funding Continuation – 2015• Efficiency Metrics, State Support per Resident Student – 2017• Tuition Freeze/Career & Technical Education - 2019
3
System Initiatives
➢ Performance Funding
➢ Workforce Development (CTE)
➢ Resident Student Access
➢ Dual Enrollment
➢ Research
➢ Shared Services
4
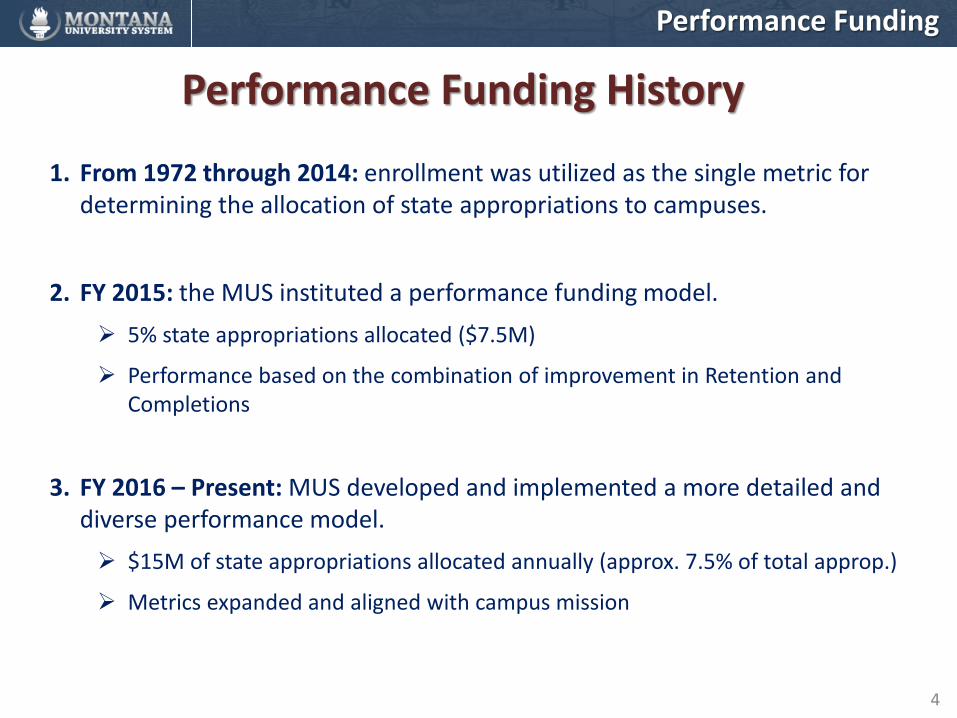
Performance Funding History
1. From 1972 through 2014: enrollment was utilized as the single metric for determining the allocation of state appropriations to campuses.
2. FY 2015: the MUS instituted a performance funding model.
➢ 5% state appropriations allocated ($7.5M)
➢ Performance based on the combination of improvement in Retention and Completions
3. FY 2016 – Present: MUS developed and implemented a more detailed and diverse performance model.
➢ $15M of state appropriations allocated annually (approx. 7.5% of total approp.)
➢ Metrics expanded and aligned with campus mission
Performance Funding
5
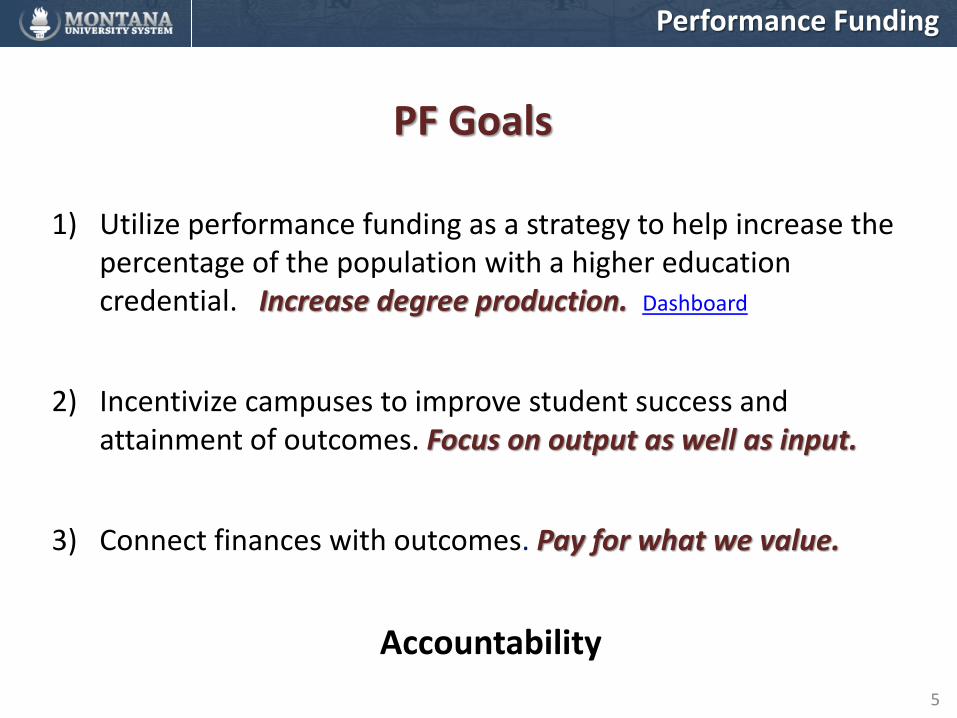
PF Goals
1) Utilize performance funding as a strategy to help increase the percentage of the population with a higher education credential. Increase degree production. Dashboard
2) Incentivize campuses to improve student success and attainment of outcomes. Focus on output as well as input.
3) Connect finances with outcomes. Pay for what we value.
Performance Funding
Accountability
6
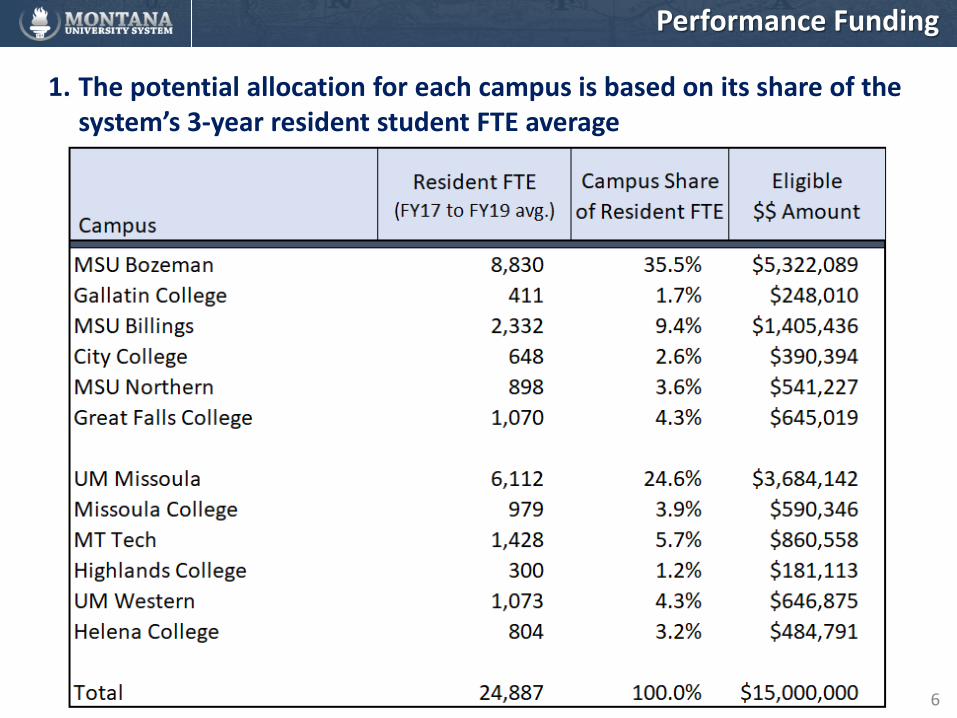
1. The potential allocation for each campus is based on its share of the system’s 3-year resident student FTE average
Performance Funding
7
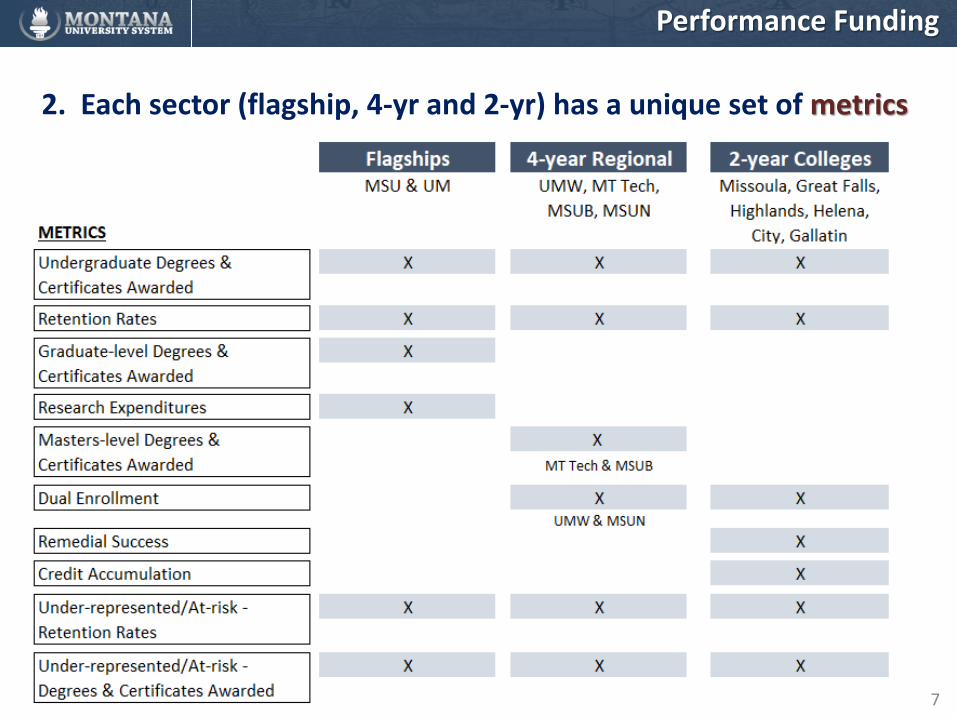
2. Each sector (flagship, 4-yr and 2-yr) has a unique set of metrics
Performance Funding
8
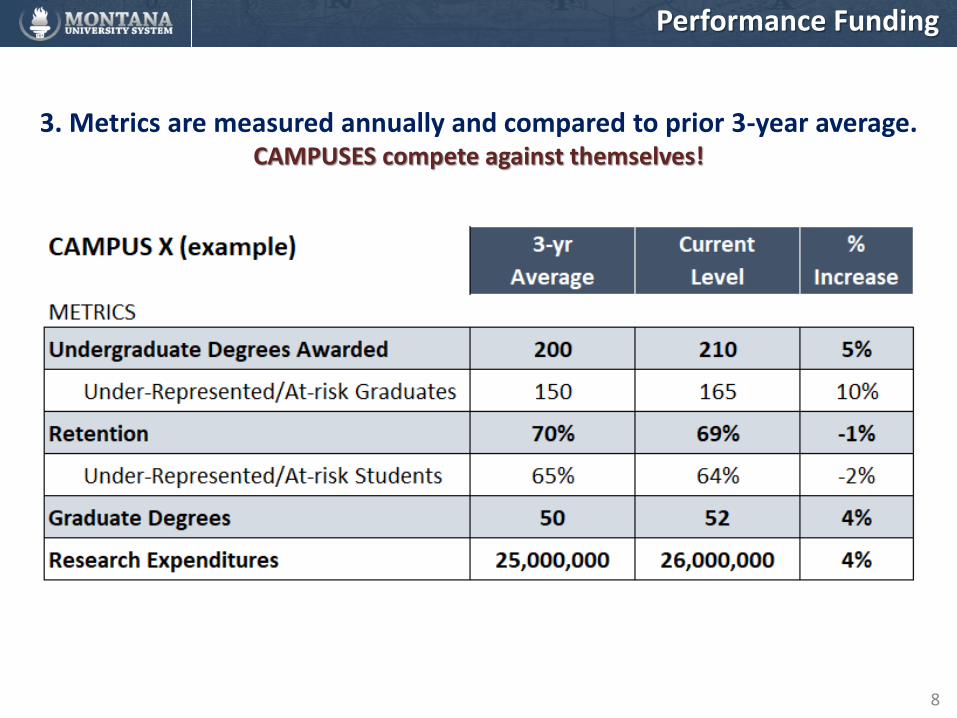
3. Metrics are measured annually and compared to prior 3-year average. CAMPUSES compete against themselves!
Performance Funding
9
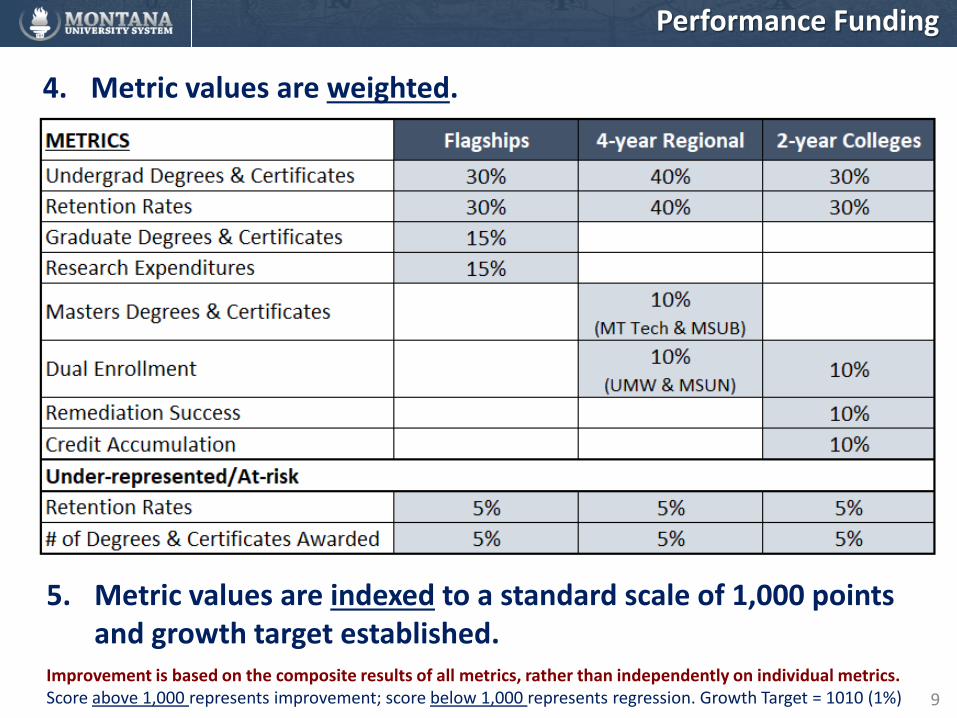
4. Metric values are weighted.
5. Metric values are indexed to a standard scale of 1,000 points and growth target established.
Improvement is based on the composite results of all metrics, rather than independently on individual metrics. Score above 1,000 represents improvement; score below 1,000 represents regression. Growth Target = 1010 (1%)
Performance Funding
10
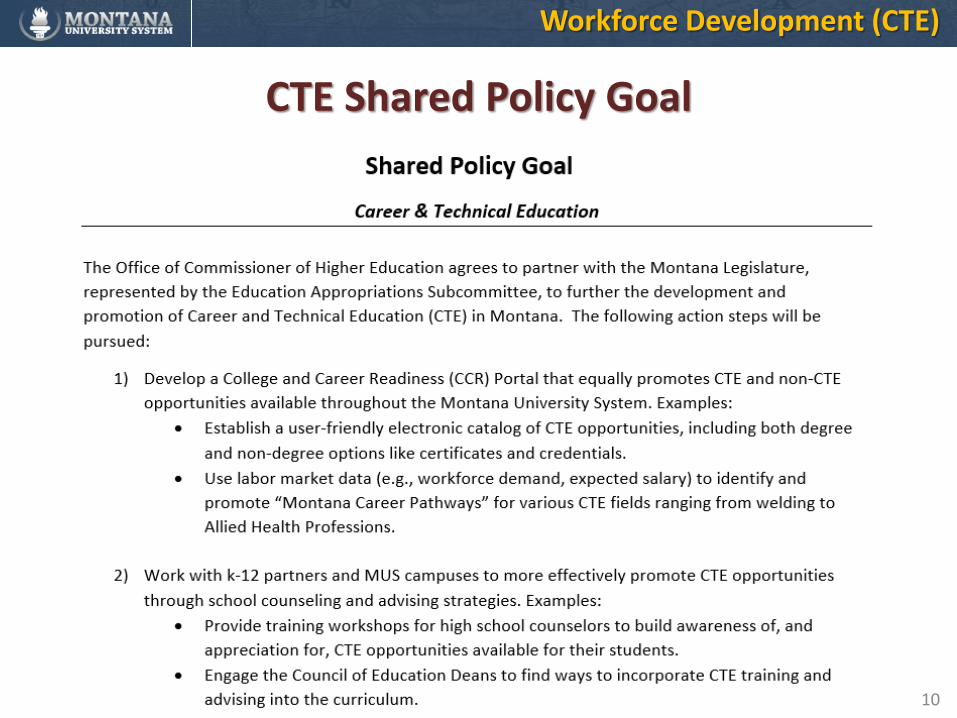
CTE Shared Policy Goal
Workforce Development (CTE)
11
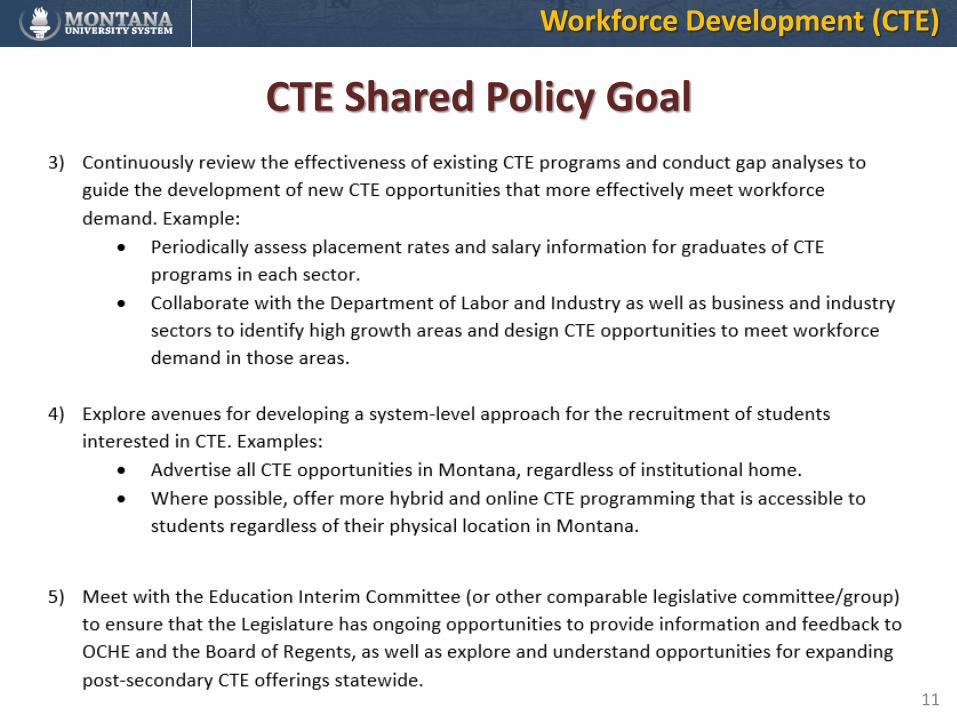
CTE Shared Policy Goal
Workforce Development (CTE)
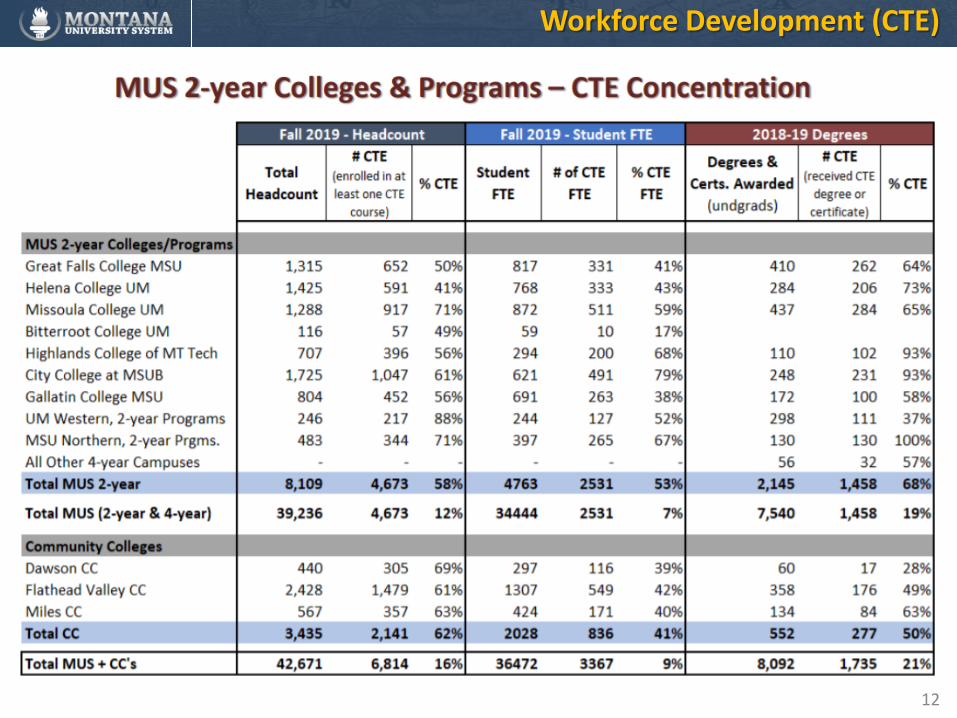
12
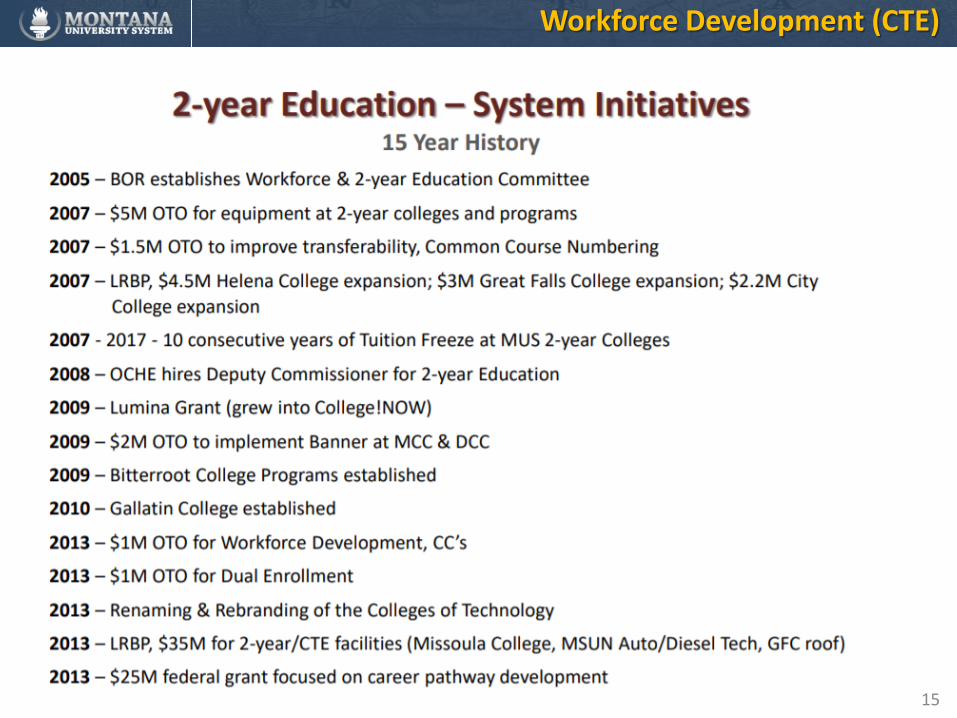
Workforce Development (CTE)
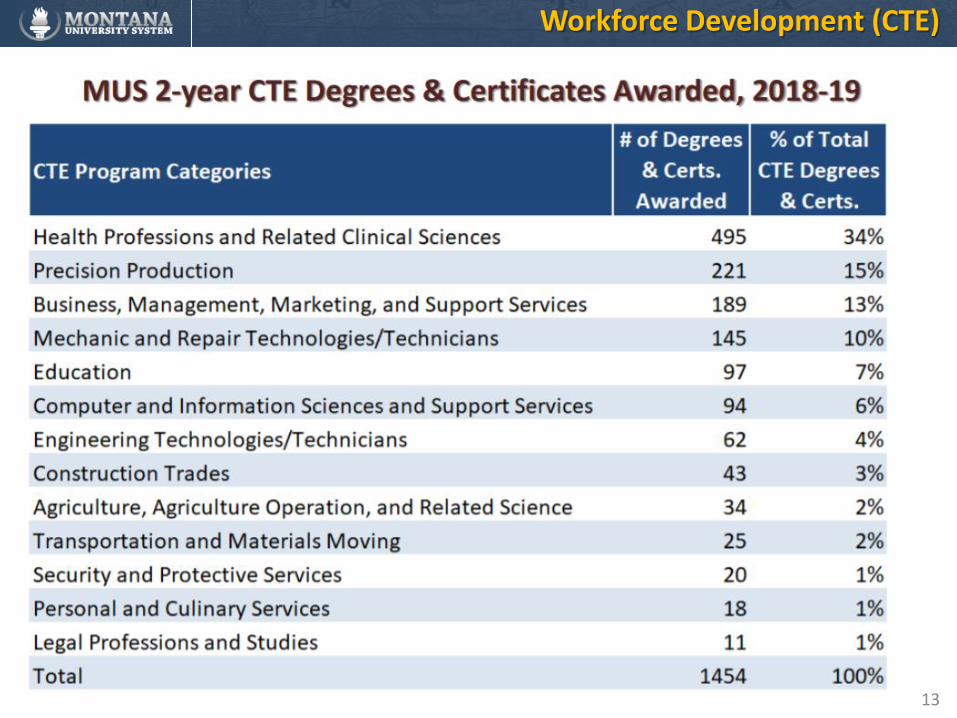
13
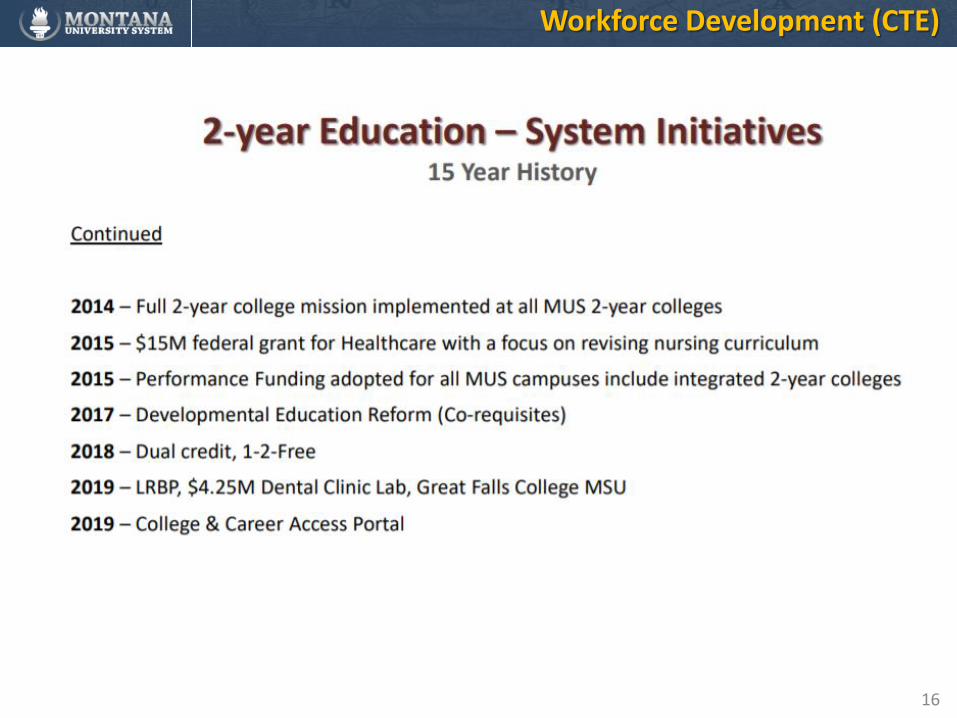
Workforce Development (CTE)
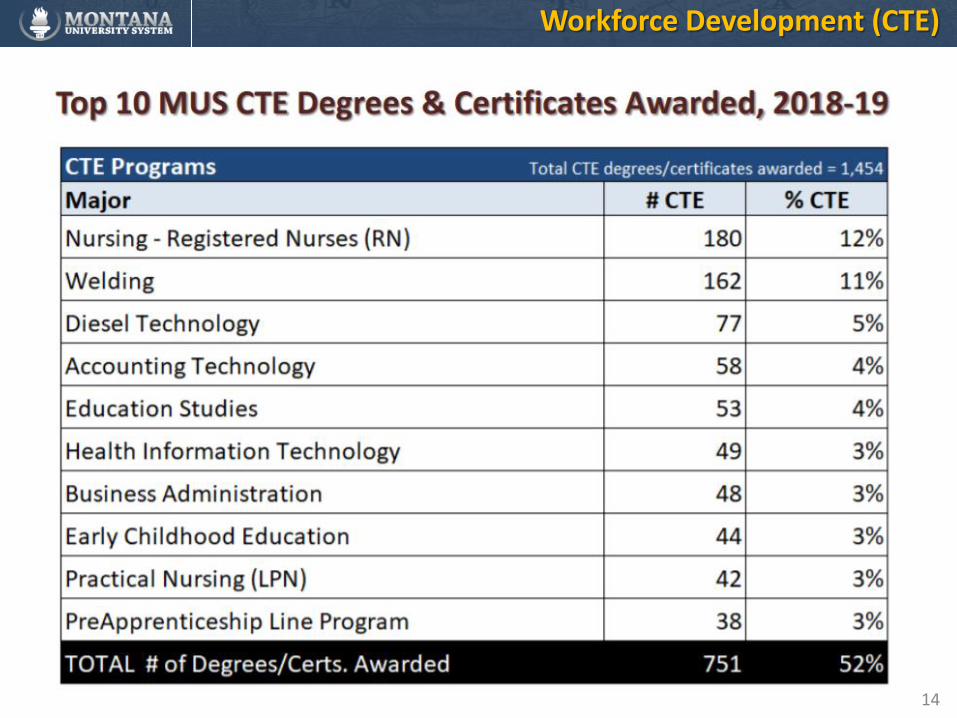
14
Workforce Development (CTE)
15
Workforce Development (CTE)
16
Workforce Development (CTE)
17
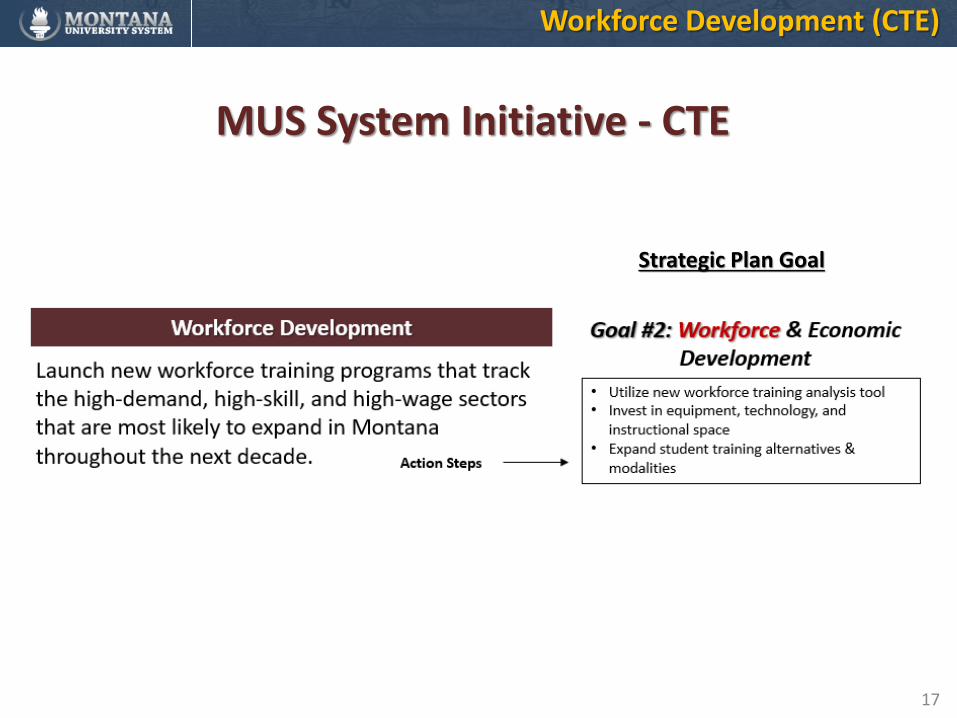
MUS System Initiative - CTE
Strategic Plan Goal
Workforce Development (CTE)
Resident Student Access
Develop a unified approach to resident student
recruitment, admissions, and financial aid, with the
goal of increasing the percentage of MT high school
graduates attending the MUS
19
Resident Student Access
Develop a unified approach to resident student
recruitment, admissions, and financial aid, with the
goal of increasing the percentage of MT high school
graduates attending the MUS
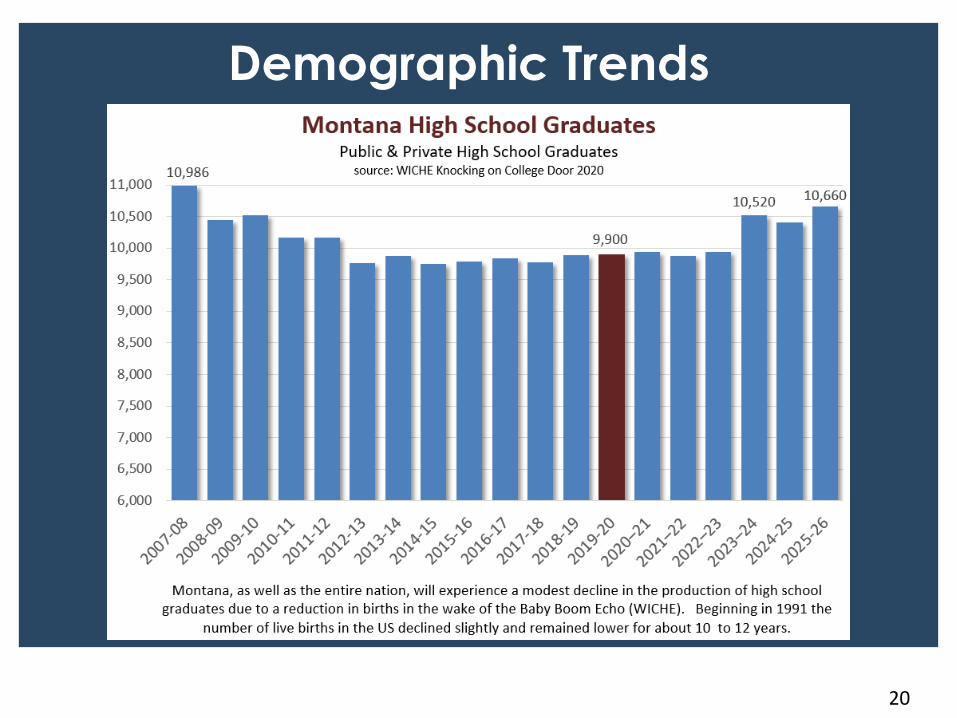
Demographic Trends
20
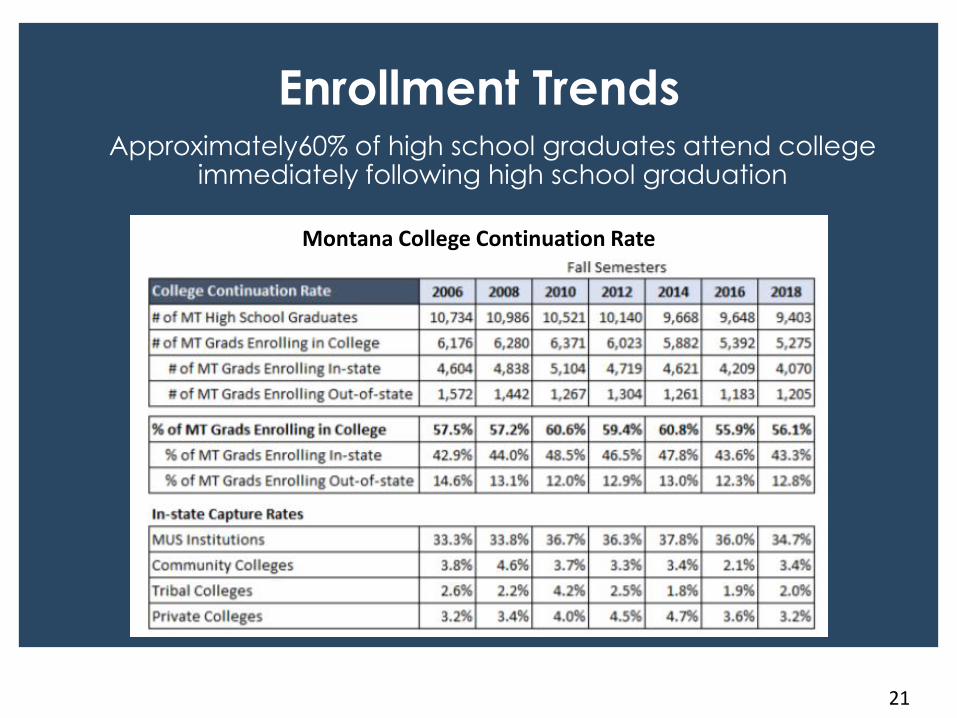
Enrollment TrendsApproximately60% of high school graduates attend college
immediately following high school graduation
Montana College Continuation Rate
21
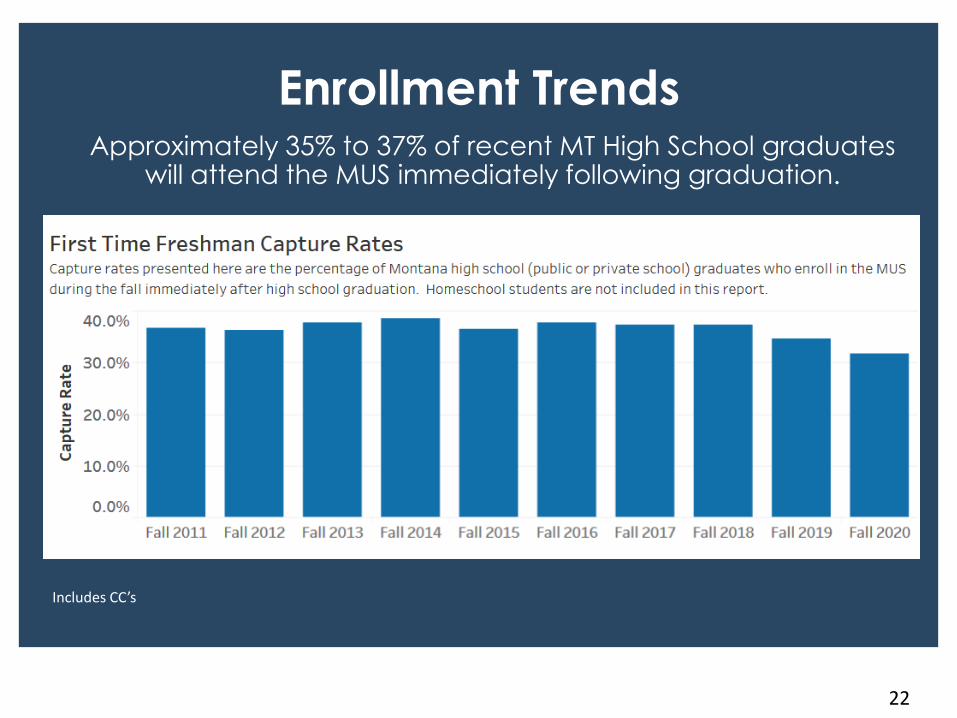
Enrollment TrendsApproximately 35% to 37% of recent MT High School graduates
will attend the MUS immediately following graduation.
22
Includes CC’s
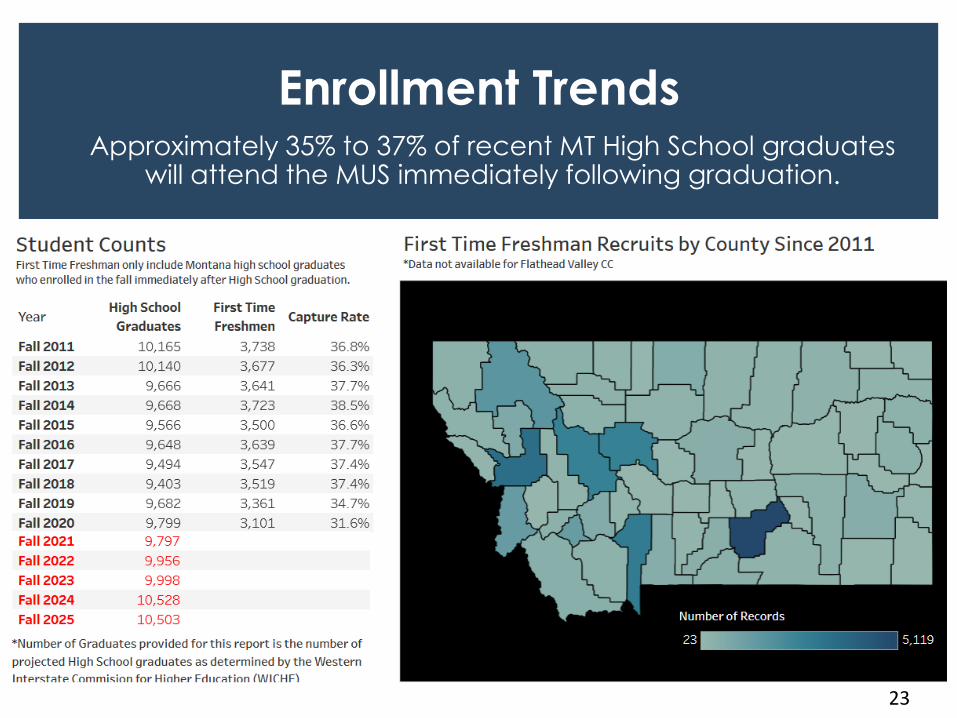
Enrollment TrendsApproximately 35% to 37% of recent MT High School graduates
will attend the MUS immediately following graduation.
23
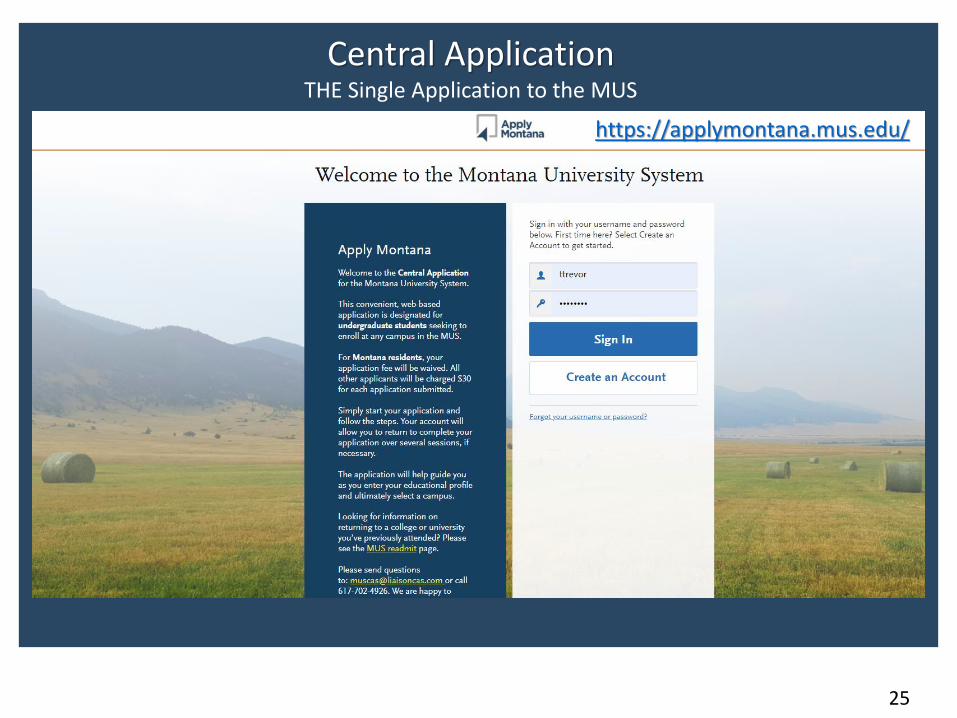
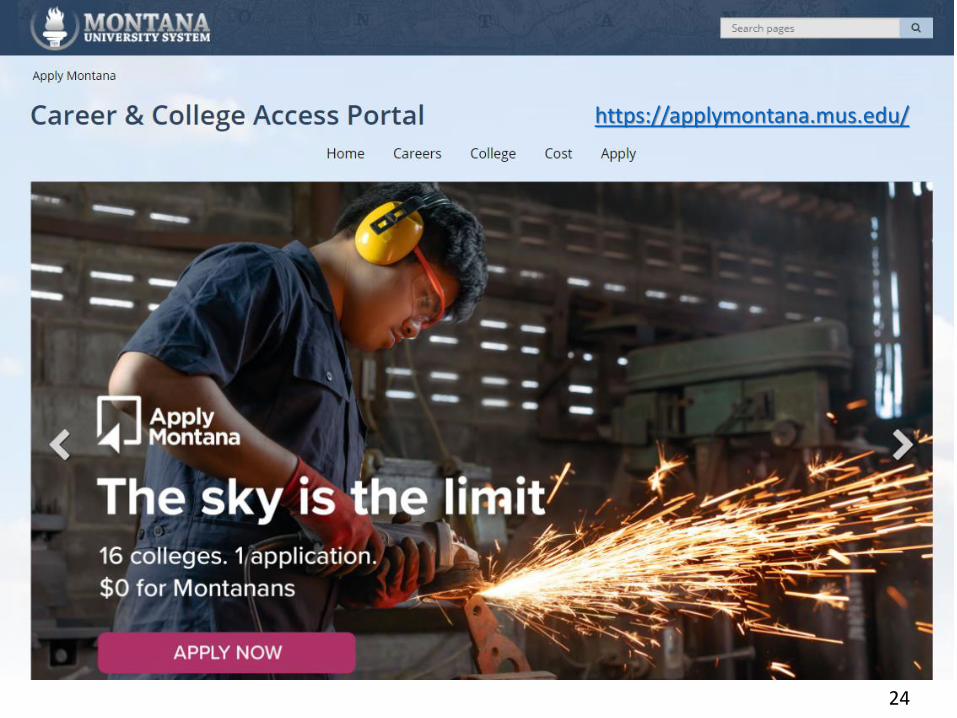
Central Application THE Single Application to the MUS
https://applymontana.mus.edu/
25
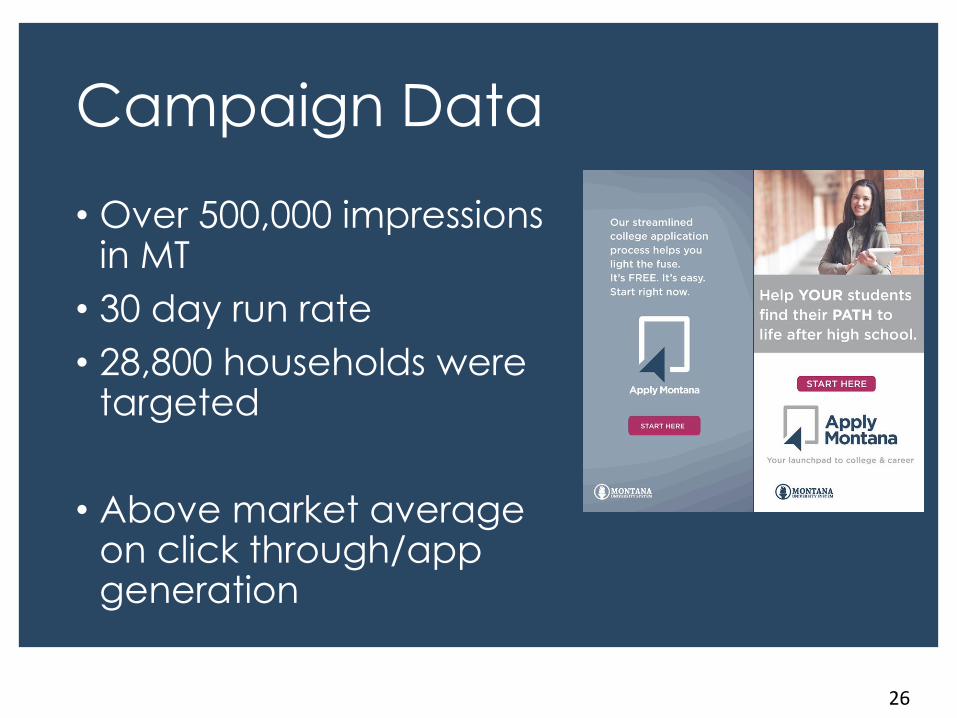
Campaign Data
• Over 500,000 impressions in MT
• 30 day run rate
• 28,800 households were targeted
• Above market average on click through/app generation
26
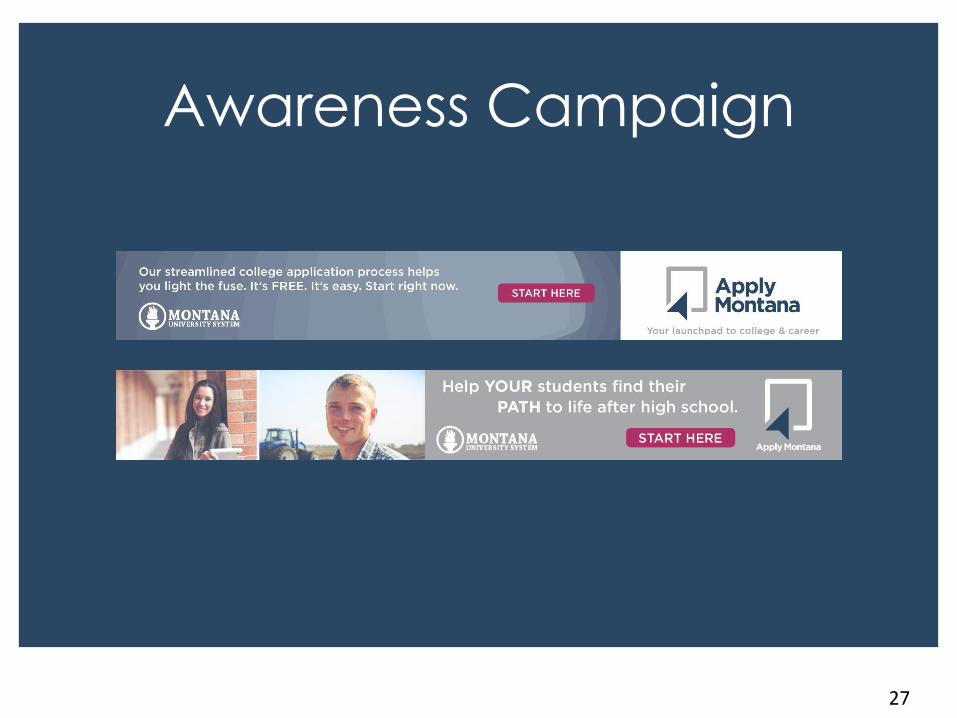
Awareness Campaign
27
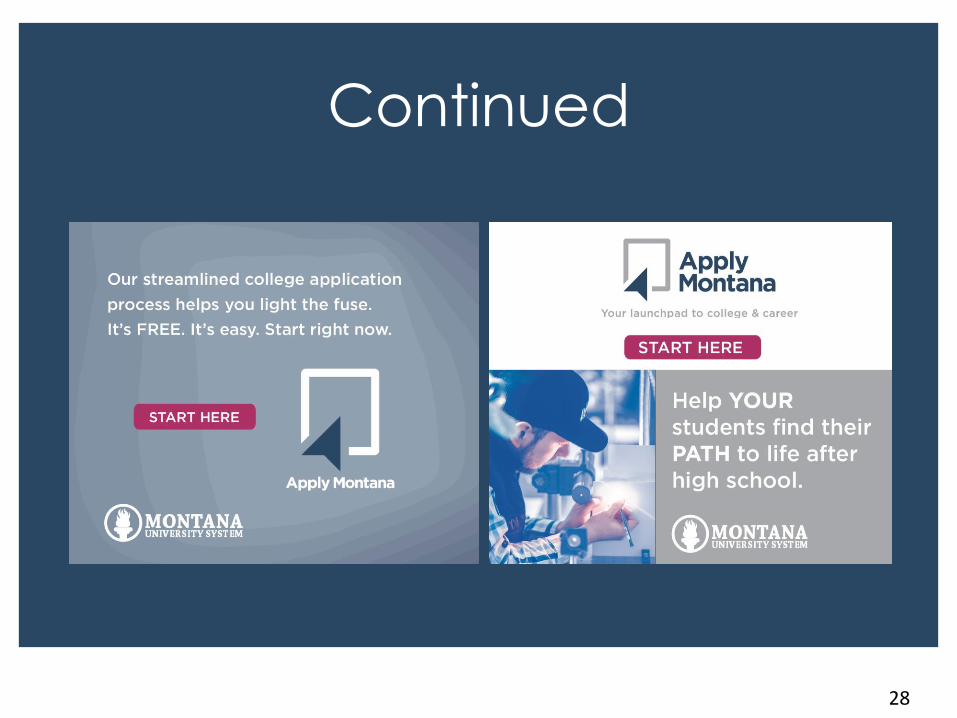
Continued
28
Branding Campaign
29
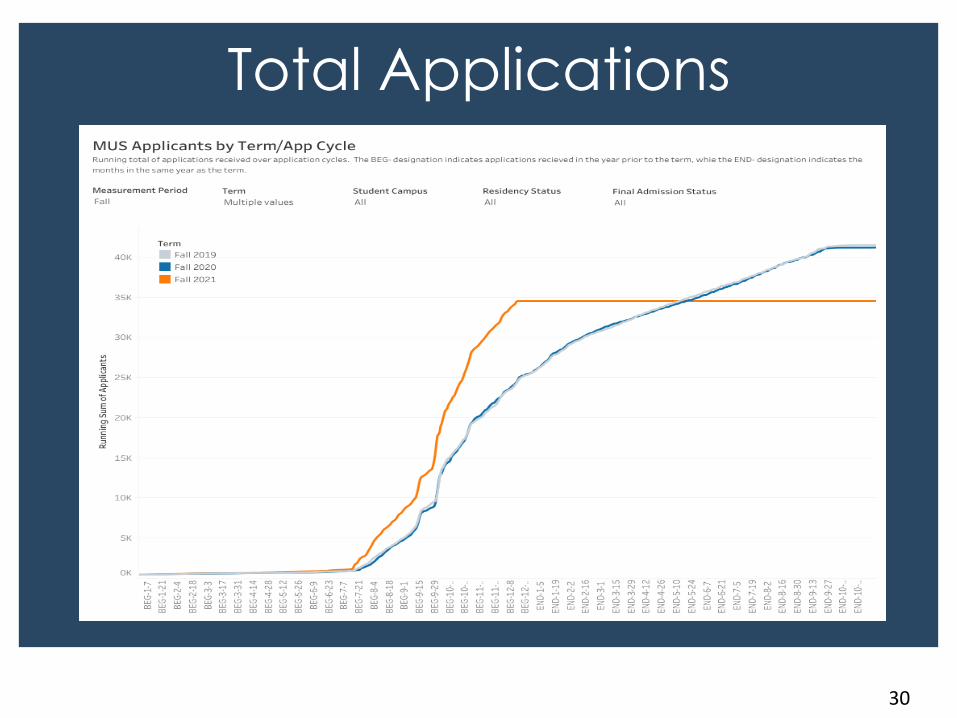
Total Applications
30
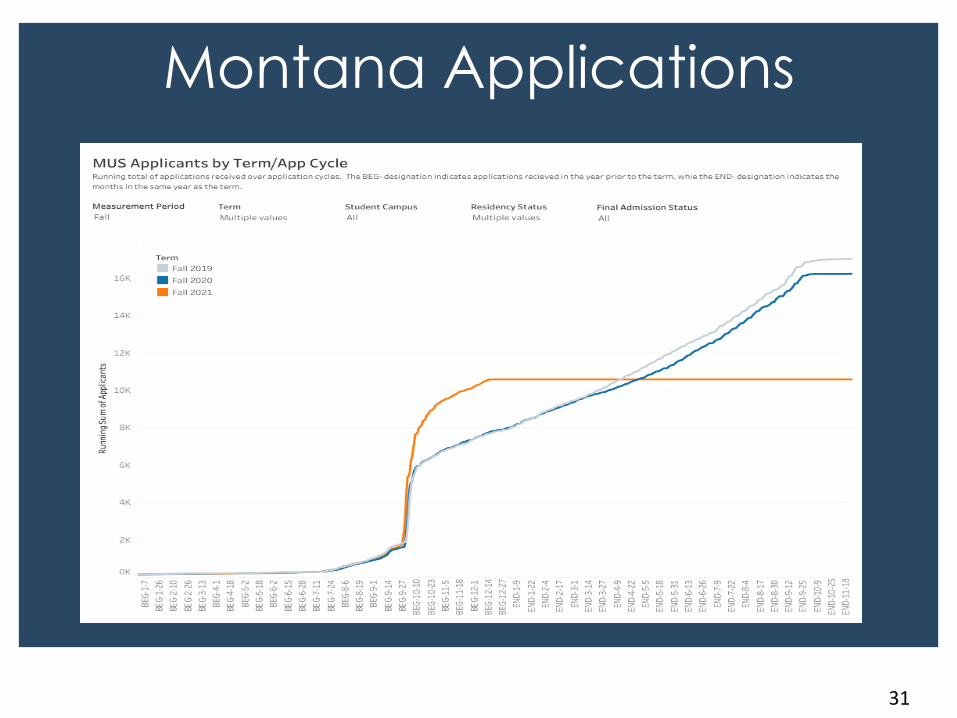
Montana Applications
31
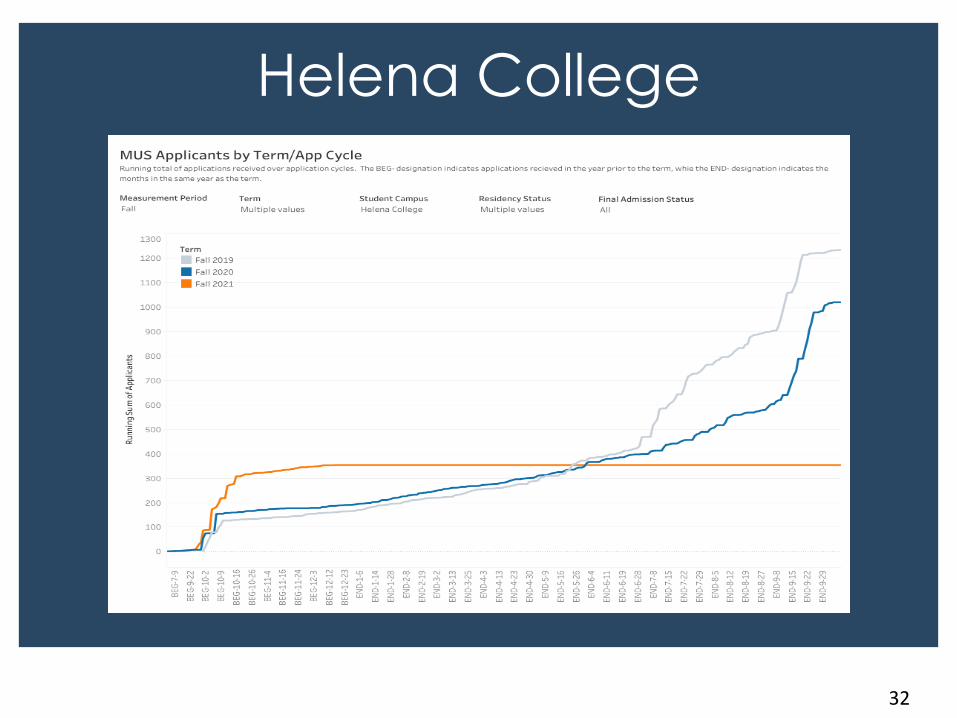
Helena College
32
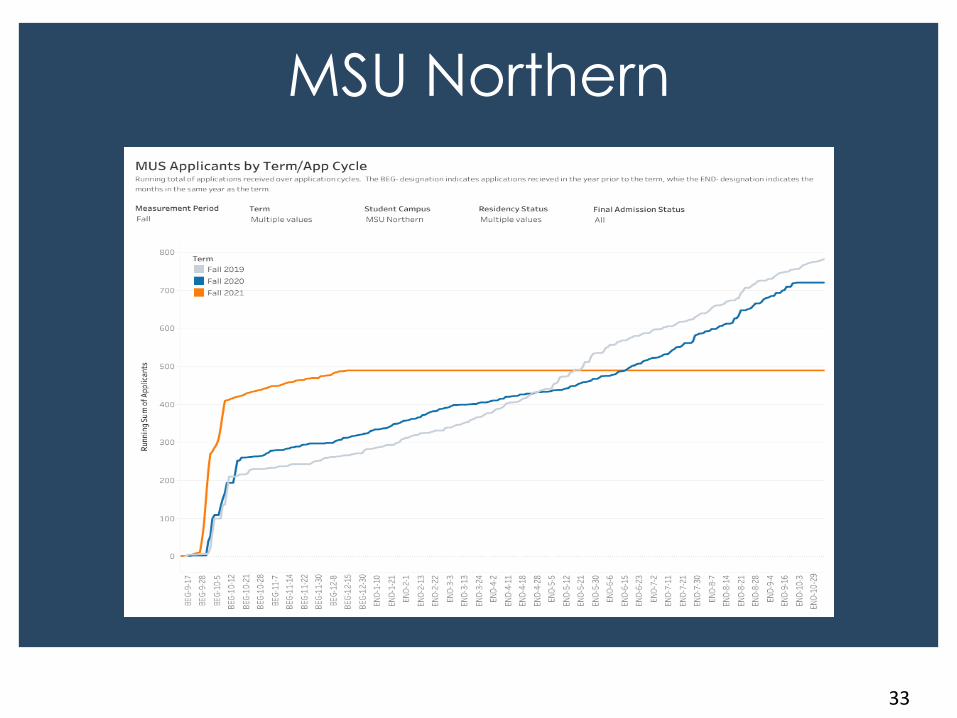
MSU Northern
33
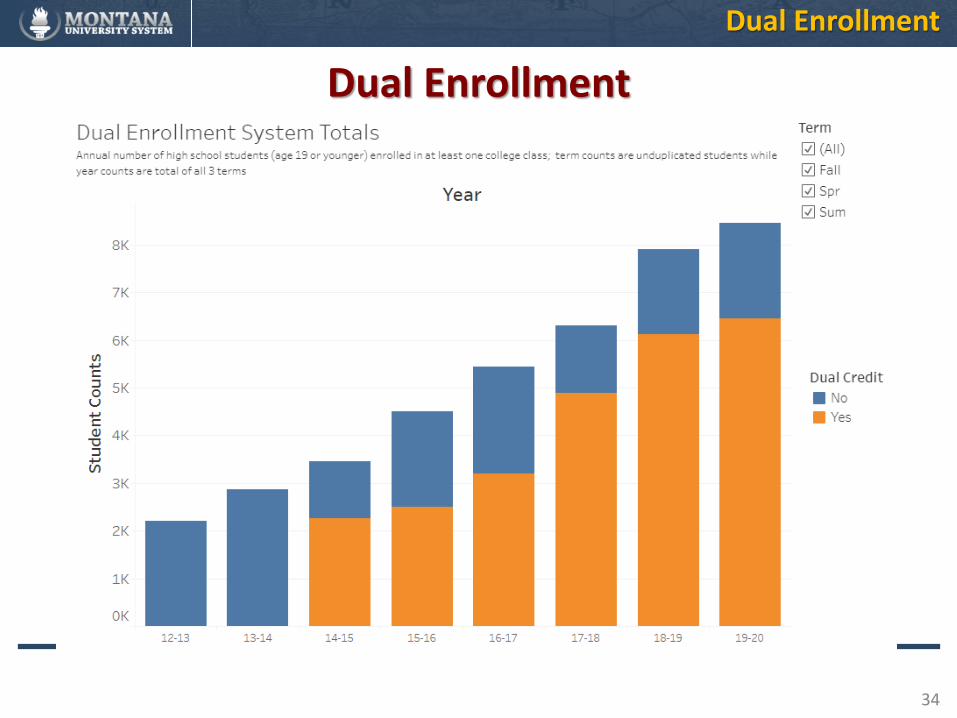
34
Dual Enrollment
Dual Enrollment
35
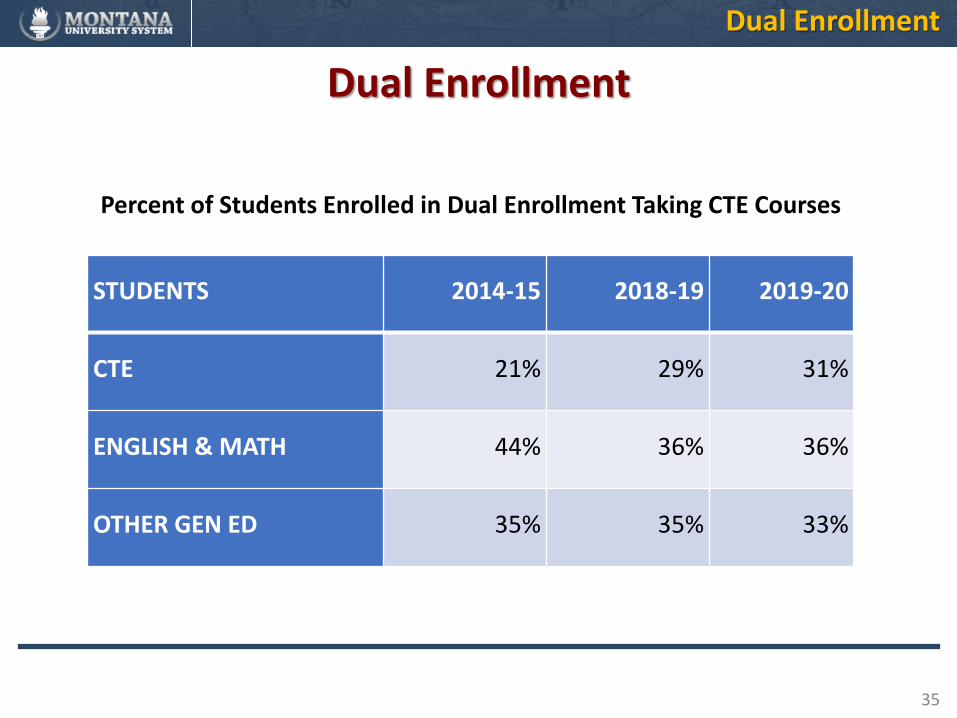
Dual Enrollment
Dual Enrollment
STUDENTS 2014-15 2018-19 2019-20
CTE 21% 29% 31%
ENGLISH & MATH 44% 36% 36%
OTHER GEN ED 35% 35% 33%
Percent of Students Enrolled in Dual Enrollment Taking CTE Courses
36
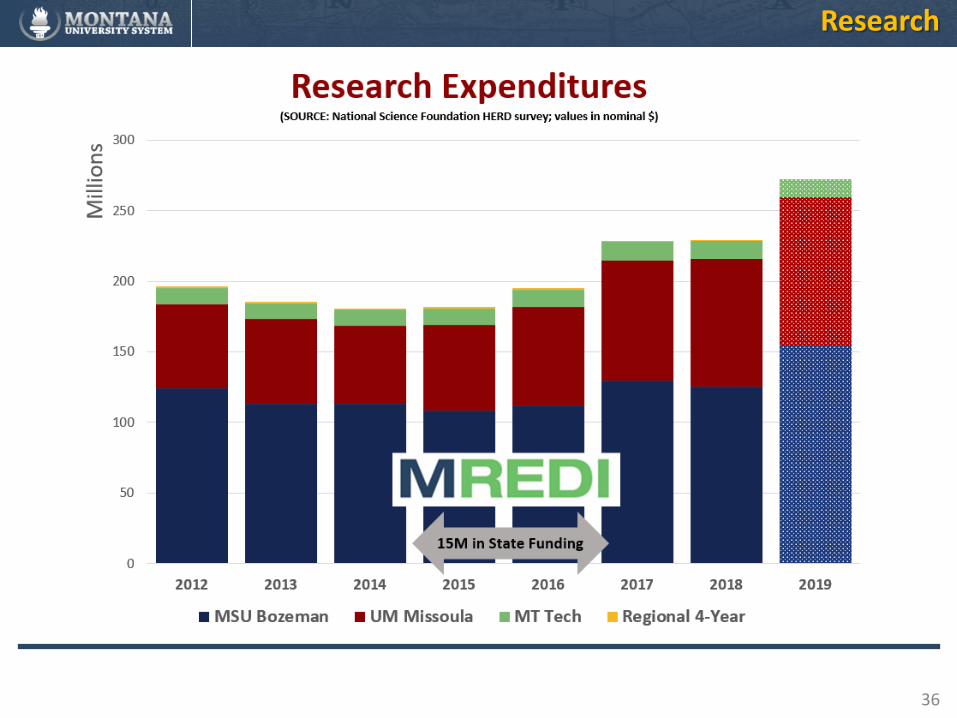
Research
37
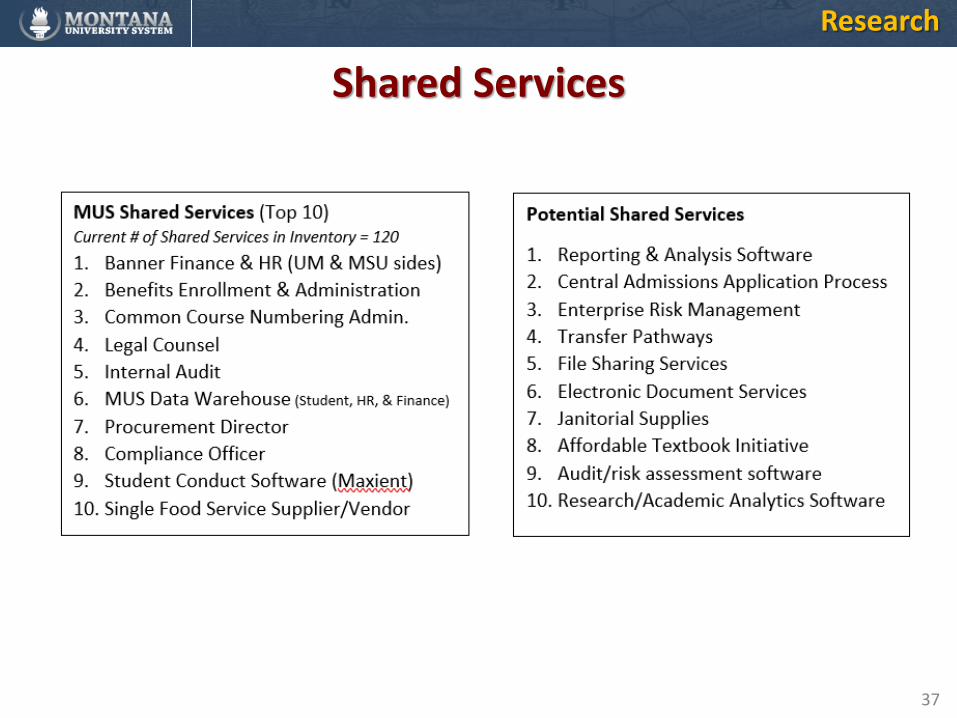
Research
Shared Services


![[Smithsonian Institution appropriations hearings]](https://img.pdfslide.net/doc/110x75/63385740fb95fbb3f40303e6/smithsonian-institution-appropriations-hearings.jpg)