Embed Size (px)
Citation preview
P O S I V A O Y
O l k i l u o t o
F I -27160 EURAJOKI , F INLAND
Tel +358-2-8372 31
Fax +358-2-8372 3809
Ed i to rs :
W.R .A lexander
A .E .M i l odowsk i
A .F .P i t ty
January 2012
Work ing Repor t 2011 -77
Cyprus Natural Analogue Project (CNAP)Phase III Final Report
January 2012
Working Reports contain information on work in progress
or pending completion.
The conclusions and viewpoints presented in the report
are those of author(s) and do not necessarily
coincide with those of Posiva.
E d i t o r s :
W.R.A lexander
Bedrock Geosc iences , Auens te in , Swi t ze r l and
A.E .Mi lodowsk i
Br i t i sh Geo log ica l Su rvey , Keywor th , UK
A . F . P i t t y
P i t t y (E IA ) Consu l t i ng , No rw ich , UK
Work ing Report 2011 -77
Cyprus Natural Analogue Project (CNAP)Phase III Final Report
Cyprus Natural Analogue Project (CNAP), Phase III Final Report ABSTRACT The CNAP Phase III project was carried out following identification of the requirement to support ongoing laboratory and modelling efforts on the potential reaction of the bentonite buffer with cementitious leachates in the repository EBS. Although it is known that the higher pH (12.5 to 13) leachates from OPC cement will degrade bentonite, it is unclear if this will also be the case for the lower pH (10 to 11) leachates typical of low alkali cements. Ongoing laboratory and URL programmes which are currently investigating this face the obstacle of slow kinetics and the production of short-lived metastable phases, meaning obtaining unambiguous results may take decades. This is exacerbated by the limitations of the thermodynamic databases for minerals of interest to models of bentonite/low alkali cement leachate reaction. It was therefore decided to implement a focussed NA study on bentonite/low alkali cement leachate reaction to provide indications of likely long-term reaction products and reaction pathways to provide feedback on the existing short-term investigations noted above and to ascertain if any critical path R&D needs to be instigated now. The results of the analyses presented here suggest that there has been very limited alkaline groundwater reaction with the bentonite. This is generally supported by both the geomorphological evidence and the natural decay series data which imply groundwater groundwater/rock interaction in the last 105 a. When integrated with the novel data currently being produced in the BIGRAD project, the CNAP data tend to indicate that any long-term bentonite reaction in low alkali cement leachates is minimal. Keywords: Natural Analogue, Cyprus, bentonite, alkali reaction, low alkali cement leachates.

Kyproksen luonnonanalogia projekti (CNAP), vaihe III loppuraportti TIIVISTELMÄ CNAP- projektin (Cyprus Natural Analogue Project) III-vaihe toteutettiin loppu-sijoitustilan bentoniittipuskurin ja sementtimäisten suotovesien tutkimiseksi tehtävien laboratoriokokeiden ja mallinnustöiden tueksi. Vaikka tiedetäänkin, että OPC- sementin korkean pH:n (12,5–13) suotovedet hajottavat bentoniittia, on epäselvää, käykö näin myös matalan pH:n sementtien (pH 10–11) suotovesillä. Meneillään olevissa laboratorio- ja URL -tutkimusohjelmissa työtä vaikeuttavat reaktioiden hidas kinetiikka ja lyhytikäisten metastabiilien faasien muodostuminen ja siksi yksiselitteisten tulosten saaminen näillä menetelmillä saattaa kestää vuosikymmeniä. Ongelmaa vaikeuttavat entisestään termodynaamisten tietokantojen puutteellisuus bentoniitti- ja matalan pH:n sementti -suotovesi välisen reaktion kannalta tärkeiden mineraalien osalta. Sen vuoksi päätettiin toteuttaa bentoniitin ja alhaisen pH:n sementin suotovesien välisiin reaktioihin keskittyvä luonnonanalogiaprojekti hankkimaan merkkejä todennäköisimmistä pitkä-aikaisista reaktiotuotteista ja reaktiopoluista ja täten antamaan palautetta edellä mainituille lyhyen aikavälin tutkimuksille ja selvittää, jos jokin kriittinen polku tarvitsee lisää T & K työtä. Raportissa esitetyt analyysitulokset viittaavat siihen, että emäksisen pohjaveden ja bentoniitin välinen reaktio on ollut hyvin vähäistä. Johtopäätöstä tukevat niin geo-morfologiset todisteet kuin radioaktiivisten aineiden hajoamisketjuista saadut tiedot, joissa on viitteitä pohjavesi / kivi -vuorovaikutuksesta viimeisen 105 vuoden aikana. Kun tähän yhdistetään BIGRAD -projektissa (Biogeochemical Gradients and Radionuclide transport) parhaillaan tuotettavat uudet tiedot, CNAP data näyttäisi osoittavan, että bentoniitin ja alhaisen pH:n sementin suotovesien reaktiot ovat minimaalisia. Avainsanat: Luonnonanalogia, Kypros, bentoniitti, alkali reaktio, matala alkalisen sementin suotovesi.

1
TABLE OF CONTENTS ABSTRACT TIIVISTELMÄ
LIST OF CONTRIBUTORS ............................................................................................ 5
1 INTRODUCTION .................................................................................................... 7 1.1 Background .................................................................................................... 7 1.2 The natural analogue concept ........................................................................ 9 1.3 Background to the Cyprus Natural Analogue Project (CNAP) ...................... 11
2 GEOLOGICAL SETTING AND LITHOLOGICAL DEFINITIONS .......................... 13 2.1 Tectonic history ............................................................................................ 13 2.2 Lithological definitions .................................................................................. 13
2.2.1 Ophiolite ............................................................................................ 13 2.2.2 Bentonite ........................................................................................... 15
2.3 Sedimentary sequences ............................................................................... 16 2.4 Production of the alkaline groundwaters ...................................................... 19
3 GEOMORPHOLOGICAL CONTROLS ................................................................. 23 3.1 Uplift and unroofing ...................................................................................... 23 3.2 Landforms, erosion and weathering ............................................................. 24
3.2.1 Massifs .............................................................................................. 24 3.2.2 Valleys, troughs and cols .................................................................. 26 3.2.3 Plateaux and scarps ......................................................................... 27
3.3 Deposition and depositional landforms ......................................................... 28 3.3.1 Slope deposits .................................................................................. 28 3.3.2 Fluvial sediments and forms ............................................................. 31 3.3.3 Coastal deposits. .............................................................................. 35
3.4 Hydrology ..................................................................................................... 36 3.4.1 Surface flow ...................................................................................... 36 3.4.2 Groundwater ..................................................................................... 36
4 CLIMATIC CONTROLS ........................................................................................ 39 4.1 Temperature, sunshine and humidity ........................................................... 39 4.2 Precipitation .................................................................................................. 40 4.3 Evapotranspiration ........................................................................................ 40 4.4 Regional variations ....................................................................................... 41 4.5 Sea level changes ........................................................................................ 41
4.5.1 General considerations ..................................................................... 41 4.5.2 Southern Cyprus ............................................................................... 42
4.6 Soils and duricrusts ...................................................................................... 42 4.6.1 Soils .................................................................................................. 42 4.6.2 Calcrete............................................................................................. 42 4.6.3 Beachrock and eolianites .................................................................. 43 4.6.4 Soil mechanics .................................................................................. 43
4.7 Vegetation .................................................................................................... 43 4.7.1 Lowlands ........................................................................................... 43 4.7.2 Uplands ............................................................................................. 44 4.7.3 Deforestation ..................................................................................... 44
2
5 PARSATA SITE DESCRIPTION........................................................................... 47 5.1 Overview....................................................................................................... 47 5.2 Geology ........................................................................................................ 51 5.3 Geomorphology ............................................................................................ 51 5.4 Environmental changes ................................................................................ 55
5.4.1 Holocene ........................................................................................... 55 5.4.2 Quaternary ........................................................................................ 59 5.4.3 Pre-Quaternary ................................................................................. 61
5.5 Hydrogeology ............................................................................................... 61 5.6 Discussion .................................................................................................... 62
6 SAMPLING AND ANALYTICAL METHODS ......................................................... 65 6.1 Groundwater and solid phase sampling ....................................................... 65
6.1.1 Groundwater samples ....................................................................... 65 6.1.2 Solid phase samples ......................................................................... 65 6.1.3 Description of the lithological profile from the trench ........................ 67
6.2 X-ray diffraction analysis .............................................................................. 73 6.2.1 Introduction ....................................................................................... 73 6.2.2 Sample preparation ........................................................................... 73 6.2.3 X-ray diffraction analysis ................................................................... 74
6.3 Petrographical analysis ................................................................................ 77 6.3.1 Sample preparation: petrographic thin sections ................................ 77 6.3.2 Sample preparation: rock chip samples ............................................ 77 6.3.3 Sample analysis: scanning electron microscopy .............................. 77
6.4 Rock chemical analysis ................................................................................ 80 6.4.1 Introduction ....................................................................................... 80 6.4.2 Loss on Ignition (LOI) ........................................................................ 80 6.4.3 Fused bead major and minor oxide WD-XRFS Analysis .................. 81 6.4.4 Sample preparation for pressed powder pellet analysis by XRFS .... 81 6.4.5 Pressed Powder Trace Element WD-XRFS Analysis ....................... 81 (Sc-Mo and Nd-U) ........................................................................................ 81 6.4.6 Pressed Powder Trace Element ED(P)-XRFS Analysis (Ag-Ce) ...... 82 6.4.7 Stable isotope analysis of carbonate mineralisation ......................... 82 6.4.8 Natural decay series ......................................................................... 83
6.5 Groundwater analysis ................................................................................... 85 6.5.1 Cation analysis......... ......................................................................... 86 6.5.2 Anion analysis ................................................................................... 86 6.5.3 pH and speciated alkalinity analysis ................................................. 86 6.5.4 Total organic carbon ......................................................................... 86 6.5.5 Natural decay series ......................................................................... 87
7 ANALYTICAL RESULTS ...................................................................................... 89 7.1 Mineralogical results ..................................................................................... 89
7.1.1 Results .............................................................................................. 89 7.2 Petrographical results ................................................................................. 100
7.2.1 Introduction ..................................................................................... 100 7.2.2 Bentonite/analogue bentonites ....................................................... 101 7.2.3 Primary Constituents ....................................................................... 101 7.2.4 Secondary constituents ................................................................... 104 7.2.5 Pillow Lavas .................................................................................... 113 7.2.6 Fractures ......................................................................................... 120 7.2.7 Clay chemistry ................................................................................ 129

3
7.3 Whole-rock chemistry results ..................................................................... 145 7.3.1 Introduction ..................................................................................... 145 7.3.2 Parsata trench profile ...................................................................... 145 7.3.3 Parsata borehole 2 profile ............................................................... 146 7.3.4 Parsata borehole 1 profile ............................................................... 148 7.3.5 Parsata borehole 4 profile ............................................................... 148 7.3.6 Stable isotopes results for carbonate mineralisation ...................... 151 7.3.7 Natural decay series ....................................................................... 154
7.4 Groundwater results ................................................................................... 159 7.4.1 Introduction ..................................................................................... 159 7.4.2 Major and trace elements ............................................................... 159 7.4.3 Stable isotopes and tritium .............................................................. 160 7.4.4 Natural decay series ....................................................................... 164
8 DISCUSSION...................................................................................................... 167 8.1 Why Parsata? ............................................................................................. 167 8.2 Rock and bentonite/bentonite analogue ..................................................... 168
8.2.1 The Parsata bentonite analogue and rock-water interaction .......... 168 8.2.2 Relationship of the Parsata bentonite/analogue bentonite sequence to
the bentonitic clays of Cyprus ......................................................... 169 8.2.3 Water-rock interaction and alteration of the bentonitic strata .......... 171
8.3 Groundwater evolution at the site ............................................................... 175 8.4 Updated conceptual model ......................................................................... 176
9 CONCLUSIONS AND RECOMMENDATIONS ................................................... 179
10 ACKNOWLEDGEMENTS ................................................................................... 183
REFERENCES ........................................................................................................... 185
LIST OF APPENDICES .............................................................................................. 199

4
5
LIST OF CONTRIBUTORS Bedrock Geosciences, Auenstein, Switzerland W.Russell Alexander British Geological Survey (BGS), Keyworth, UK Simon J.Kemp Antoni E.Milodowski Ian Mounteney Jeremy C.Rushton Doris Wagner Geological Survey Department of Cyprus (GSD), Lefkosia, Cyprus Michael Regis Pitty (EIS) Consulting, Norwich, UK Alistair F.Pitty Scottish Universities Environmental Research Centre (SUERC), East Kilbride, UK Susie Fawley Angus B. MacKenzie

6

7
1 INTRODUCTION 1.1 Background Bentonite makes an important contribution to the performance of the engineered barrier system for the disposal concepts developed for many types of radioactive waste. The choice of bentonite results from its favourable properties for isolation and containment of the waste – such as plasticity, swelling capacity, colloid filtration, low hydraulic conductivity, high retardation of key radionuclides – and its stability in relevant geological environments. However, bentonite – especially the swelling clay component (smectite) that contributes to its essential barrier functions – is unstable under high pH conditions. According to NDA (2010a), the most important processes which could impact the bentonite’s safety functions are:
Diffusive transport of cement porewaters into the bentonite, with mixing and reaction with the bentonite porewaters. Sharp gradients in pH (and pCO2) across the interface would encourage rapid precipitation of solid carbonates (e.g. aragonite, calcite) and hydroxides (e.g. brucite), leading to a decrease in porosity
Fast exchange of cations in cement porewaters for cations in montmorillonite interlayer sites, leading to a decrease of swelling pressure
Slow dissolution of montmorillonite and other minerals such as quartz, feldspar, pyrite and gypsum. At elevated pH, such reactions consume hydroxyl ions, thus neutralising the incoming cement porewaters. This leads to an increase in porosity and may decrease the bentonite swelling pressure due to mass loss
This led to some repository designs (especially for disposal of high-level vitrified waste, HLW or spent fuel, SF) that exclude use of concrete from any sensitive areas containing bentonite, so avoiding any potential bentonite degradation in the case that it is contacted by cementitious porewaters (which have an initial pH of up to about 13: see, for example, Atkinson et al. 1985; Haworth et al. 1987) which leach of out any concrete used in the repository. The option of avoiding the problem of incompatibility with conventional cement and concrete by constraining the design was considered acceptable during early, generic studies. However, as projects move closer to implementation, it is increasingly recognised that constructing extensive facilities underground without using concrete will be problematic. This is especially the case in countries like Japan and the UK, where a volunteering approach to siting a repository means that repository construction could be in a technically challenging host rock. The topic is also relevant for transuranic wastes (TRU, or other high toxicity/long half-life intermediate-level waste, ILW), particularly if this is co-disposed with HLW/SF. TRU waste contains large inventories of cementitious materials (cf. JAEA, 2007) and hence, in principle, could pose a risk to the engineered barrier system (EBS) of HLW/SF, even if concrete was excluded from the HLW part of the repository (e.g. scenarios discussed in Nagra’s Projekt Entsorgungsnachweis; Nagra 2002). Indeed, some designs of the EBS for various kinds of low- and intermediate level waste (L/ILW) include a bentonite layer, which is planned to act as an external barrier around concrete structures To date, there has been no comprehensive demonstration that the

8
performance of such a barrier can be assured for relevant periods of time (see comments in Umeki 2009). The MX-80 bentonite, for example, has been shown to have a porewater pH of 8 in ambient groundwaters (Bradbury and Baeyens 2002), significantly less than that of low-alkali cement pH of 11 or less. The three pH units difference is the equivalent of three orders of magnitude in the OH- activity, meaning there will still be potential for significant reaction with bentonite, it will simply be less than at pH 13. Karnland et al. (2005) and Ahokas et al. (2006) both noted that “According to Sellin et al. (2003) the dissolution rate for a number of silicates and aluminium silicates, e.g. quartz, kaolinite, increases by a factor of 10 if pH is increased from 11 to 13 and laboratory experiments referred to implied that bentonite is much more stable at pH 11 as compared to pH 13.” Recently, therefore, there have been extensive efforts to better understand the interactions of alkaline fluids with bentonite, coupled with studies aimed at reducing the risk by development (cf. NDA 2010b) and testing (cf. Alonso et al. 2009) of low alkali cement formulations. The greatest challenge is bringing the information produced by laboratory (conventional and underground rock laboratories, URL) and modelling studies together to form a robust safety case. This is complicated by the inherently slow kinetics of such reactions and the commonly observed persistence of metastable phases for geological time periods (for a good overview of the issues involved, see Metcalfe and Walker 2004). Clearly, this is an area where analogues could play a valuable role – bridging the disparity in realism and timescales between laboratory studies and the systems represented in repository performance assessment (see also discussion in Alexander et al. 1998; Miller et al. 2000). Indeed, in this case, the particularly slow kinetics of bentonite reaction in low alkali cement porewaters suggests natural analogues would appear to be the only viable method of studying bentonite reaction. Before looking any further at possible bentonite reaction, it is important to clarify the terminology surrounding the material and also the use of the term in this report. The term bentonite was first proposed in the 19th century by Knight (1898) and the name is from the Benton Shale in which the clay was thought at that time to occur. Once the origins of bentonite were understood, several updated definitions followed, but all have limitations. The strict geological definition of “bentonite” is a soft, plastic, porous light-coloured rock composed essentially of clay minerals from the smectite group plus colloidal silica, and produced by chemical alteration of volcanic ash (cf. Hallsworth and Knox 1999). The name implies a definite genetic origin from alteration of volcanic ash, either in situ or transported material. The non-genetic term “smectite-claystone” is now recommended where the origin of the smectite-rich clay sediment is uncertain (Hallsworth and Knox 1999). Industrial bentonite, such as the “bentonite” that will be used in the engineered barrier of a radioactive waste repository, is derived from natural bentonite rock but may be processed to improve the smectite content (i.e. beneficiated) of the material and/or chemically treated to enhance its cation exchange, swelling or other physico-chemical properties (e.g. conversion or “activation” of natural calcium montmorillonite to sodium montmorillonite by treatment with sodium carbonate). As such, the physical and chemical properties of industrial bentonite may differ significantly from that of the natural rock.
9
In order to avoid confusion in this report, the term “bentonite analogue” is used to refer to the natural smectite-rich rocks, soils and sediments that are being studied as natural analogues for the interaction between cement-derived high pH porefluids and the “industrial bentonite” that will be used as buffer material in the repository. The focus of this natural analogue study is on geochemical and mineralogical alteration of smectite clay minerals as an analogue of the long-term geochemical and mineralogical alteration that might be expected during the geochemical evolution of the repository engineered barrier system, over timescales exceeding those that can be studied in laboratory experimental systems. The term “bentonite analogue” as used in this report does not necessarily refer to a true bentonite in the “geological sense” nor does it imply that the material has similar physical or hydrogeological properties to the “bentonite buffer” of the repository engineered barrier. 1.2 The natural analogue concept Argumentation by use of analogy is well established in many fields including philosophy, biology, linguistics and law (e.g. Petit 1992). For the specific case of radioactive waste management, the term “natural analogue” (NA) has developed a particular meaning associated with supporting arguments for the long-term safety of repositories (see Chapman et al. 1984; Miller et al. 2000 and www.natural-analogues.com for discussion). Key factors here are the heterogeneity and complexity of natural systems and, in particular, the very long timescales over which safety must be assured. The potential evolution of repositories, designed for specific types of waste and disposal site, can be simulated by the use of mathematical models, but the extent to which such models can be validated by conventional approaches is inherently limited. Here natural and archaeological analogues (NA) – systems which have similar properties to components of repositories – have a unique role to play. The extent to which NA system evolution in the past can be understood and modelled with existing tools and data, gives an indication of the ability to determine future development of the repository. The initial use of NAs focussed on improving understanding of key processes and model/database testing (e.g. McKinley 1989) and, indeed, this is still a major justification for some analogue projects. More recently, however, additional roles in public communication (e.g. West et al. 2002) and staff training (e.g. Alexander et al. 2008a) have received greater emphasis. In particular, using natural analogues to provide general support for the safety case (by studying the evolution relevant systems over geological timescales) and to increase confidence in extrapolating results from laboratory and field experiments to the repository (e.g. NDA 2010c) have been a recent focus. This study most certainly belongs in this more recent domain. Improving system understanding can range from examining global concepts (e.g. fundamental feasibility of preserving geochemical anomalies for millions of years – see discussions on Oklo and Cigar Lake in Miller et al. 2000) to direct quantification of specific processes (e.g. matrix diffusion depths – see Smellie et al. 1985). Similarly, model testing can range from rather weak qualitative comparison of expectations with observations (e.g. relative retention of elements within Oklo reactor cores) to quantitative assessment of the relevance of laboratory databases (e.g. for material
10
corrosion) to more formal assessment of the predictive capability of specific model and databases (e.g. blind predictive modelling of solubility limits). As such, for this project, an initial literature study with search parameters that included both aspects of the target geology and also themes of relevance to radioactive waste management programmes was carried out. Factors considered included:
Details of ophiolite terrains available Existence of relevant alkaline groundwaters Availability of bentonites/ clay-rich (and particularly smectite-rich) bentonite
analogues H2 or CH4 gas in groundwaters tuffaceous deposits coastal sites logistics (e.g. potential support from local mining operations, ease of transport
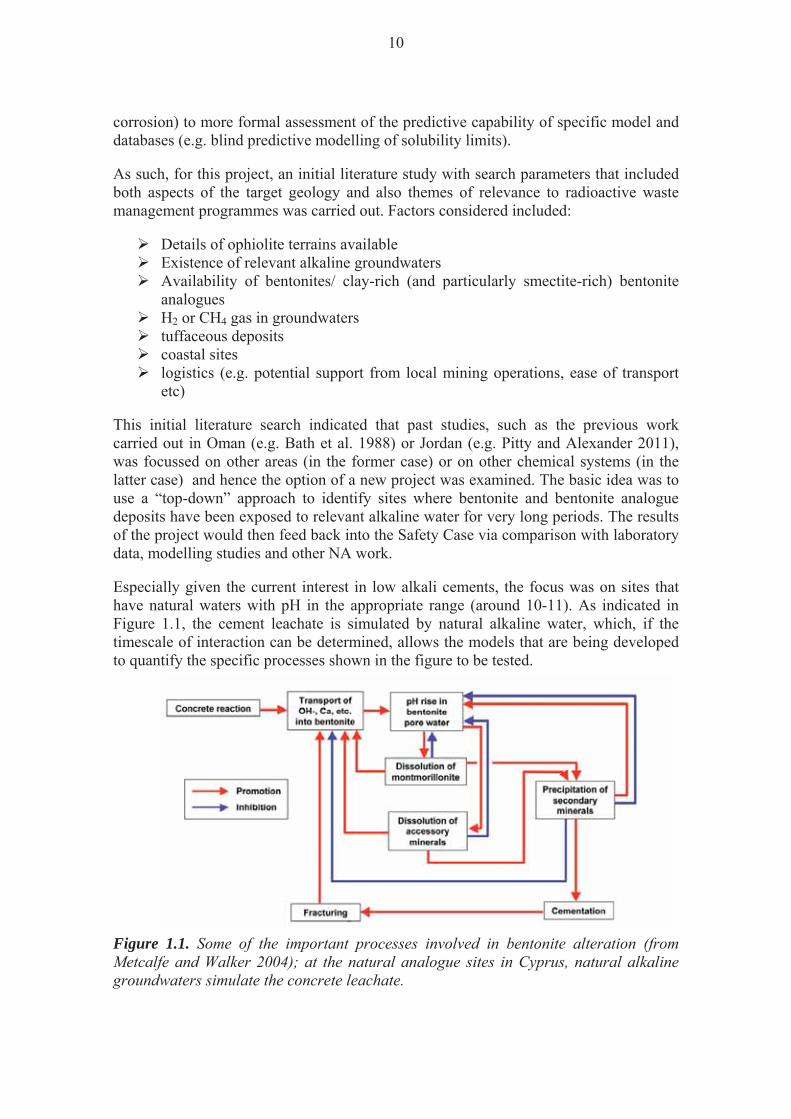
etc) This initial literature search indicated that past studies, such as the previous work carried out in Oman (e.g. Bath et al. 1988) or Jordan (e.g. Pitty and Alexander 2011), was focussed on other areas (in the former case) or on other chemical systems (in the latter case) and hence the option of a new project was examined. The basic idea was to use a “top-down” approach to identify sites where bentonite and bentonite analogue deposits have been exposed to relevant alkaline water for very long periods. The results of the project would then feed back into the Safety Case via comparison with laboratory data, modelling studies and other NA work. Especially given the current interest in low alkali cements, the focus was on sites that have natural waters with pH in the appropriate range (around 10-11). As indicated in Figure 1.1, the cement leachate is simulated by natural alkaline water, which, if the timescale of interaction can be determined, allows the models that are being developed to quantify the specific processes shown in the figure to be tested. Figure 1.1. Some of the important processes involved in bentonite alteration (from Metcalfe and Walker 2004); at the natural analogue sites in Cyprus, natural alkaline groundwaters simulate the concrete leachate.

11
The challenge is to maximise the value of this test, by assuring that materials and boundary conditions are as similar as possible to those in a repository. Nevertheless, it must be emphasised that such sites are no more than an analogy of a repository, not a copy, and hence certain differences are inevitable (discussed below). The technical focus was on:
long-term bentonite stability in analogue low alkali cement leachates if possible, same system as above interacting with seawater/brines for a coastal
repository if possible, same system as above interacting with a range of leachate
chemistries as the precise situation in a repository will depend both on the site conditions and the composition of the cementitious materials – neither of which have been fixed as yet
low alkali cement leachate/host rock interaction – is there any? integration with existing laboratory data identifying any requirements for future R&D providing feedback to the Safety Case
In principle, there are a number of locations worldwide where such a NA might be found, including New Caledonia, Bosnia, California, China, Japan, Korea and the Philippines. Based on a multi-attribute analysis, considering factors such as probability of finding suitable locations, relevance to European programmes, low risk of disrupting calls for volunteers, political stability and cost-effectiveness, Cyprus was selected by the Technical Steering Committee (TSC, consisting of the NDA, Posiva and SKB) as the preferred option and has since been the focus of more detailed literature studies and a limited number of field investigations to confirm fundamental feasibility. 1.3 Background to the Cyprus Natural Analogue Project (CNAP) The island of Cyprus was proposed as the focus for the project primarily due to the known widespread occurrence of both alkaline springs (resulting from serpentinisation of ophiolites) and extensive bentonite and bentonite analogue deposits (e.g. Bear, 1960, Christidis, 2006, Edwards et al. 2010). Other attributes of relevance include: Good support infrastructure available at reasonable cost Ease of access from Europe (compared to other potential NA sites internationally) Existence of a national Geological Survey (the GSD) for local information and advice Lack of political sensitivity to field work Good transport infrastructure and easily available accommodation (out of the tourist season) To most efficiently utilise resources, the project was split into three phases with go/no go decision points at the end of Phases I and II. Phase I – data mining The actual sites to be investigated in Phase II were determined on the basis of a data-mining project, which was based on the significant volume of literature on the island

12
geology. Although much of the existing literature is focussed on the ophiolites (which are the source of the alkaline leachates), enough information was found on the bentonites/bentonite analogues (e.g. Pantazis 1967) and alkaline groundwaters (e.g. Neal and Shand, 2002) to indicate that it was worthwhile moving on to Phase II (Alexander and Milodowski 2008). Phase II – site reconnaissance and preliminary mineralogical and geochemical study Following identification of likely sites, a short reconnaissance field trip took place from 26th November to 3rd December, 2008 to confirm their appropriateness to the project aims (Alexander and Milodowski 2009). In addition to a preliminary assessment of sites identified in Phase I, meetings were held with the GSD to assess their potential interest in the project. After an assessment of the outcome of the first trip, the go ahead was given for a second field trip (9th to 14th February, 2009). In addition to confirming groundwater pH and the presence of appropriate bentonite sources, samples were taken at several sites for full groundwater chemical characterisation (i.e. major and trace elements, stable isotopes) and for mineralogical, petrographical and chemical (major and trace elements) characterisation of the host rock and bentonite/bentonite analogues to assess evidence of interaction with alkaline groundwaters. The most promising sites were also assessed for future detailed study (as part of any potential future Phase III programme) and other sampling considerations, such as borehole drilling, were examined (see Alexander and Milodowski 2011). Additional tasks included assessing potential coastal sites where leachate/bentonite and leachate/host rock interaction could be examined in a saline environment. Finally, on the basis of the findings from the Phase II study, a detailed programme for Phase III was proposed, including selection of sites for detailed field work using a formal MAA (multi-attribute analysis) methodology. Phase III – main project Following the reconnaissance mission making a successful report and the positive decision to proceed, the main project phase began soon afterwards (so as to maintain project momentum). A short field trip was carried out in February, 2010 to assess additional sites recommended by the GSD and to hold discussions with local geoscience (for drilling) and construction (for trenching) companies. The main field trip was planned for April, 2010, but this was cancelled at the last minute due to the disruption to air travel caused by the eruption of the Eyjafjallajokull volcano in Iceland. Due to the drilling company’s previous work commitments, field work could not then get under way until October, 2010.
13
2 GEOLOGICAL SETTING AND LITHOLOGICAL DEFINITIONS 2.1 Tectonic history The island of Cyprus is essentially a plate fragment, pressed between the African Plate and the Eurasian Plate. It was originally a slab of ocean floor which was pushed up (obducted) rather than being subducted during this collision of these major plates. Faulting is inevitable in rocks subjected to tectonic stresses like this, with lateral (strike-slip) as well as vertical displacements and thrust faults. All are recognisable in ophiolite massifs, and often affect adjacent sedimentary strata, too. Due to the ongoing tectonic uplift in Cyprus, several later fault movements are along the lines of original E-W trending strike-slip faults and part of the uplift is achieved by block faulting. Tectonism is responsible for frequent large earthquakes of more than Mb 6, especially in the Paphos area (Papadimitriou and Karakostas 2006). These are associated with recurrent shearing in the subduction zone between the colliding major plates which run just south of the island. Major tremors may have an impact on settlements, like the destruction of Old Paphos in 15 BC, and may trigger landslides and debris flows in clayey materials, readily susceptible to mass movement. 2.2 Lithological definitions 2.2.1 Ophiolite
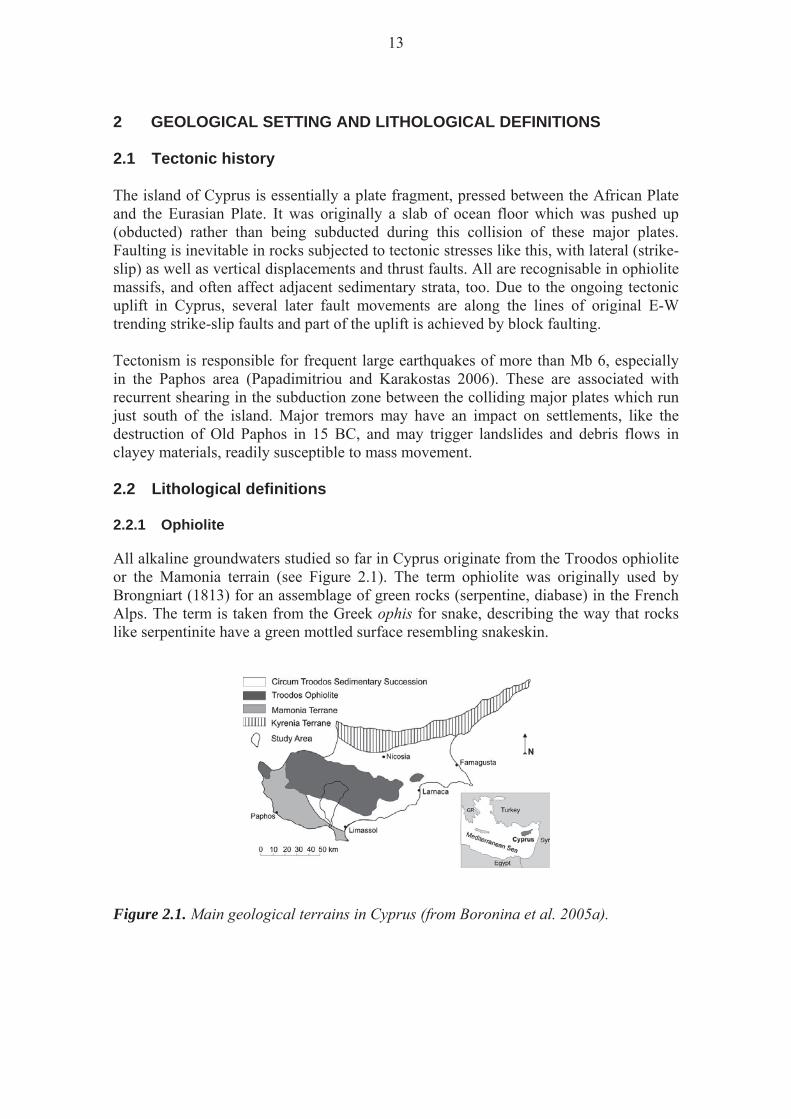
All alkaline groundwaters studied so far in Cyprus originate from the Troodos ophiolite or the Mamonia terrain (see Figure 2.1). The term ophiolite was originally used by Brongniart (1813) for an assemblage of green rocks (serpentine, diabase) in the French Alps. The term is taken from the Greek ophis for snake, describing the way that rocks like serpentinite have a green mottled surface resembling snakeskin.
Figure 2.1. Main geological terrains in Cyprus (from Boronina et al. 2005a).
14
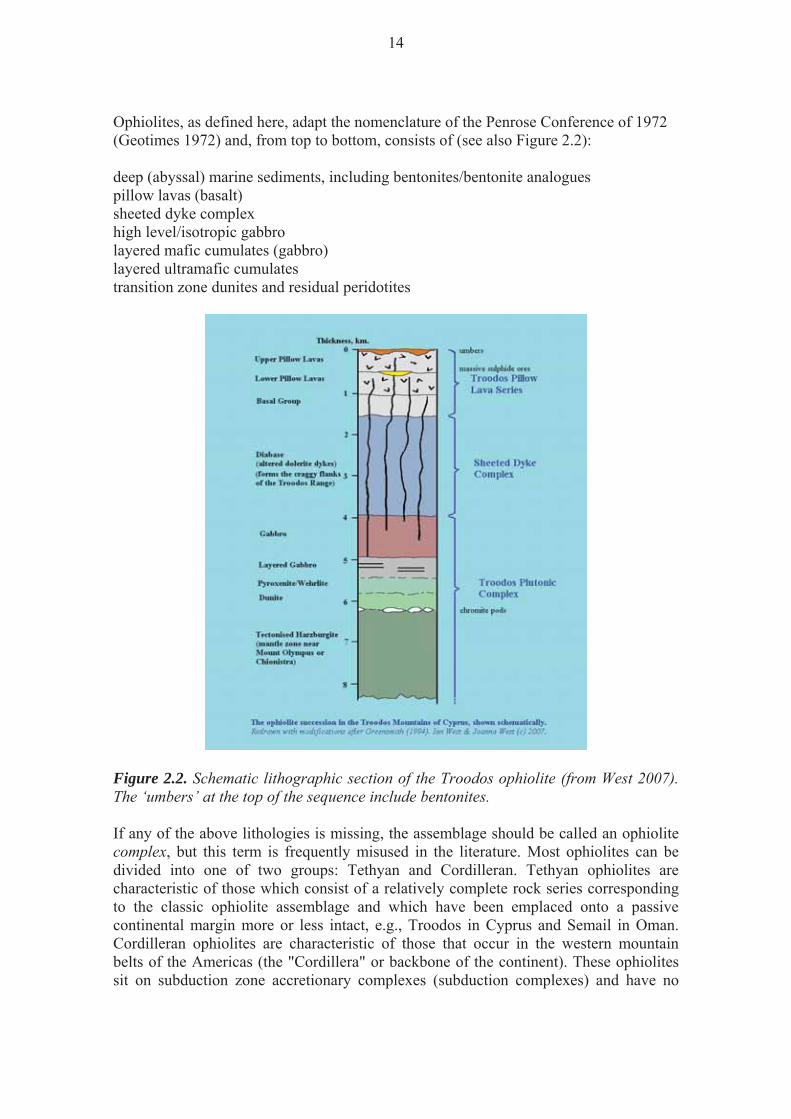
Ophiolites, as defined here, adapt the nomenclature of the Penrose Conference of 1972 (Geotimes 1972) and, from top to bottom, consists of (see also Figure 2.2): deep (abyssal) marine sediments, including bentonites/bentonite analogues pillow lavas (basalt) sheeted dyke complex high level/isotropic gabbro layered mafic cumulates (gabbro) layered ultramafic cumulates transition zone dunites and residual peridotites
Figure 2.2. Schematic lithographic section of the Troodos ophiolite (from West 2007). The ‘umbers’ at the top of the sequence include bentonites.
If any of the above lithologies is missing, the assemblage should be called an ophiolite complex, but this term is frequently misused in the literature. Most ophiolites can be divided into one of two groups: Tethyan and Cordilleran. Tethyan ophiolites are characteristic of those which consist of a relatively complete rock series corresponding to the classic ophiolite assemblage and which have been emplaced onto a passive continental margin more or less intact, e.g., Troodos in Cyprus and Semail in Oman. Cordilleran ophiolites are characteristic of those that occur in the western mountain belts of the Americas (the "Cordillera" or backbone of the continent). These ophiolites sit on subduction zone accretionary complexes (subduction complexes) and have no

15
association with a passive continental margin. These include the Coast Range and Josephine ophiolites of California and the Quebradagrande Complex of Western Colombia and the Larsen Harbour Complex on South Georgia. Ophiolites are additionally sub-classified as either supra-subduction zone (SSZ), which exhibit island-arc geochemical and petrological characteristics, or mid-ocean ridge (MOR) which possess deep ocean crust geochemical and petrological features.
2.2.2 Bentonite
Before looking any further at possible bentonite reaction, it is important to clarify the terminology surrounding the material and also the use of the term in this report. The term bentonite was first proposed in the 19th century by Knight (1898) and the name is from the Benton Shale in which the clay was thought at that time to occur. Once the origins of bentonite were understood, several updated definitions followed, but all have limitations. The strict geological definition of “bentonite” is a soft, plastic, porous light-coloured rock composed essentially of clay minerals from the smectite group plus colloidal silica, and produced by chemical alteration of volcanic ash (cf. Hallsworth and Knox 1999). The name implies a definite genetic origin from alteration of volcanic ash, either in situ or transported material. The non-genetic term “smectite-claystone” is now recommended where the origin of the smectite-rich clay sediment is uncertain (Hallsworth and Knox 1999), but see also the discussion in section 7.2.2. Industrial bentonite, such as the “bentonite” used in the engineered barrier of a radioactive waste repository, is derived from natural bentonite rock but may be processed to improve the smectite content (i.e. beneficiated) of the material and/or chemically treated to enhance its cation exchange, swelling or other physico-chemical properties (e.g. conversion or “activation” of natural calcium montmorillonite to sodium montmorillonite by treatment with sodium carbonate). As such, the physical and chemical properties of industrial bentonite may differ significantly from that of the natural rock. In order to avoid confusion in this report, the term “bentonite analogue” is used to refer to the natural smectite-rich rocks, soils and sediments that are being studied as natural analogues for the interaction between cement-derived high pH porefluids and the “industrial bentonite” that will be used as buffer material in the repository. The focus of this natural analogue study is on geochemical and mineralogical alteration of smectite clay minerals as an analogue of the long-term geochemical and mineralogical alteration that might be expected during the geochemical evolution of the repository engineered barrier system. The term “bentonite analogue” as used in this report does not necessarily refer to a true bentonite in the “geological sense” nor does it imply that the material has similar physical or hydrogeological properties to the “bentonite buffer” of the repository engineered barrier.
16
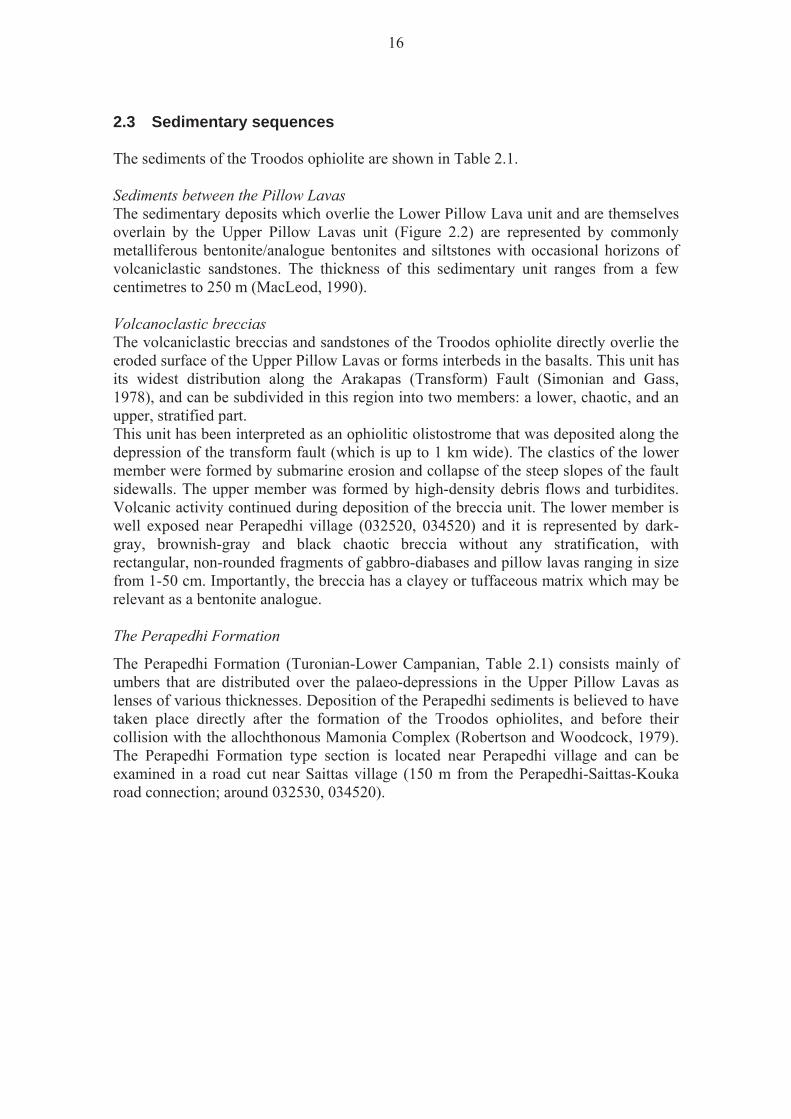
2.3 Sedimentary sequences The sediments of the Troodos ophiolite are shown in Table 2.1. Sediments between the Pillow Lavas The sedimentary deposits which overlie the Lower Pillow Lava unit and are themselves overlain by the Upper Pillow Lavas unit (Figure 2.2) are represented by commonly metalliferous bentonite/analogue bentonites and siltstones with occasional horizons of volcaniclastic sandstones. The thickness of this sedimentary unit ranges from a few centimetres to 250 m (MacLeod, 1990). Volcanoclastic breccias The volcaniclastic breccias and sandstones of the Troodos ophiolite directly overlie the eroded surface of the Upper Pillow Lavas or forms interbeds in the basalts. This unit has its widest distribution along the Arakapas (Transform) Fault (Simonian and Gass, 1978), and can be subdivided in this region into two members: a lower, chaotic, and an upper, stratified part. This unit has been interpreted as an ophiolitic olistostrome that was deposited along the depression of the transform fault (which is up to 1 km wide). The clastics of the lower member were formed by submarine erosion and collapse of the steep slopes of the fault sidewalls. The upper member was formed by high-density debris flows and turbidites. Volcanic activity continued during deposition of the breccia unit. The lower member is well exposed near Perapedhi village (032520, 034520) and it is represented by dark-gray, brownish-gray and black chaotic breccia without any stratification, with rectangular, non-rounded fragments of gabbro-diabases and pillow lavas ranging in size from 1-50 cm. Importantly, the breccia has a clayey or tuffaceous matrix which may be relevant as a bentonite analogue. The Perapedhi Formation The Perapedhi Formation (Turonian-Lower Campanian, Table 2.1) consists mainly of umbers that are distributed over the palaeo-depressions in the Upper Pillow Lavas as lenses of various thicknesses. Deposition of the Perapedhi sediments is believed to have taken place directly after the formation of the Troodos ophiolites, and before their collision with the allochthonous Mamonia Complex (Robertson and Woodcock, 1979). The Perapedhi Formation type section is located near Perapedhi village and can be examined in a road cut near Saittas village (150 m from the Perapedhi-Saittas-Kouka road connection; around 032530, 034520).

17
Table 2.1. Details of the Troodos ophiolite sedimentary carapace (Robertson et al. 2003).
Age (Ma) Formation Lithology
2.0 Pleistocene 'Fanglomerate' Apalos
Kakkaristra Athalassa
Conglomerates and Sandstones, Calcarenite,
Sandstones, Conglomerates
5.2 Pliocene Nicosia Marls, Silts, Muds,
Sandstones, Conglomerates
Kalavasos Evaporites
23.3 Miocene
Upper
Pakhna
Reefal and Bioclastic Limestone
Pelagic Chalks, Marls, Calcarenites, Conglomerates Middle
Lower Reefal and Bioclastic Limestone
35.4 Oligocene Upper Lefkara1 Pelagic Chalk and Marls
56.5 Eocene Middle Lefkara
Massive Pelagic Chalks
65.0 Palaeocene Pelagic Chalks, Replacement Chert
74.0 Maastrichtian Lower Lefkara Pelagic Chalks
83.0 Campanian Kannaviou Volcaniclastic Sandstones, Bentonite
90.4 Turonian Perapedhi Umbers2, Radiolarites
Ophiolitic Basement
1 Formerly the Lapithos Group
2 This is often no more than a field classification, however, and can also include bentonites (see comments in Wilson and Ingham, 1959; Christidis, 2006).
18
The sequence is represented by (Bragina and Bragin 1996):
volcaniclastic breccias with a tuffaceous matrix and fragments of basalt and diabase. The observed thickness in this outcrop is 1 m.
red and yellow to rust-colored clays which fill the depressions on the eroded surface of the breccias. The thickness varies from 0 to 1 m.
black and dark-brown loose manganese-bearing bentonite/analogue bentonites with weakly rounded fragments (up to 2 cm) of yellowish-gray phosphatic clayey limestones (8-10 cm). Thickness is 0.1-0.2 m.
umbers that are dark brown and yellow, platy, sometimes massive, with brownish-black intercalations of massive Fe/Mn bearing cherts
According to Bragin et al. (2005), much of the umber is composed of “...uncrystallised substance and mixed-layered mineral like smectite-illite with minor goethite. Nearly 25 % of the total volume of these rocks is represented by an argillirated [sic] volcanoclastic substance (secondary clayey material).” In the central part of the Akamas Peninsula (around 032230, 035001), the umbers of the Perapedhi Formation (0.5 m) lie upon the Upper Pillow Lavas and is itself directly overlain in this section by the bentonitic clays of the Kannaviou Formation. Finally, it is of note that umbers in the area of the Mamonia Allochthonous Complex include hyaloclastite intercalations composed of vitroclasts and fragments of basaltoids (up to 7-10 cm in size) are completely replaced by dioctahedrical smectite-like montmorillonite. The Kannaviou Formation The Kannaviou Formation (Campanian-Lower Maastrichtian, Table 1.1) is represented by bentonites that lie on the Perapedhi Formation and directly on the Upper Pillow Lavas (Robertson 1977). The Kannaviou Formation is widely distributed along the southern flank of the Troodos Massif and in the area of the Mamonia Terrain (see Figures 1.4). The Formation thickness varies between several 10s of m up to 100m at the type locality (near Kannaviou village; 032350, 034550). The lower part is exposed along the Kannaviou-Pano Panagia (032380, 034550) road. Green non-layered bentonites with intercalation of clayey siltstones lie directly on the Upper Pillow Lavas and are overlain by greenish-gray bentonites, tuffaceous sandstones, and thin-layered light gray cherty bentonite/analogue bentonites. A final exposure is at the Mavrokolymos River (032240, 034530) where the bentonites lie on umbers and Upper Pillow Lavas. The total thickness of the basal unit is ~25m. The upper part of the Kannaviou Formation has been studied (Bragina and Bragin, 1995) along the Kritou Marattou-Agios Dimitrianos road (032330,034555 to 032325,034540) and it consists of greenish-gray bentonites and massive, interlayers of light-gray cherty claystone and greenish-gray tuffaceous siltstones. A 2m thick horizon in the lower part of the outcrop consists of white and light-gray massive lithoclastic tuffs and the total thickness of the upper unit is ~30 m. Slope deposits are common at altitudes above 500 m, and can be well over 5 m thick. Recurrently during the Quaternary, huge quantities gravels, sands and silts were
19
transported downstream from the ophiolite massifs to the lowlands. Some of these materials remain as river terraces, and fine silt and mud particles were spread out in elongated floodplains downstream. The fluvial pebbles, sands, silts and marls carried into the sea also included materials eventually derived from the ophiolite massifs. 2.4 Production of the alkaline groundwaters The alkaline pH values (generally between pH 10 and 11, but 12 has been reported by Alexander et al. 2011) observed in the groundwaters are a product of the serpentinisation of the ophiolites, a reaction which has several possible pathways with the exact reaction pathway depending on Mg content of the precursor olivine/pyroxene or serpentine product, CO2 fugacity, water-rock ratio, Ca2+ content of groundwater, etc. When considering the origin of the alkaline groundwaters at most ophiolites, two processes generally need to be considered:
high to medium temperature alteration low temperature precipitation
The former often shows itself in the form of pervasive serpentinisation of the entire mantle sequence (locally very common in Cyprus) and is presumed to be pre- or syn-tectonic. This hydrothermal alteration may be characterised by the reaction: 6Mg2SiO4 + Mg3Si4O10(OH) 2 + 9H2O 5Mg3Si2O5(OH)4 Equation 1 forsterite talc serpentine which fixes the upper temperature of serpentine formation at 500 °C (Moody 1976). In addition, serpentinisation may occur at slightly lower temperatures (down to 180 °C at atmospheric pressure), but as these are all associated with the original alteration on the seabed, they are considered no further here. Of more relevance to the conditions of meteoric groundwater circulation of interest here is low temperature serpentinisation (e.g. Barnes and O’Neil 1969; Barnes et al. 1972). In this case, Mg(HCO3)2-type meteoric groundwaters react with the ultramafic rocks of the ophiolite in an essentially open system and produce Ca(OH)2-type (spring) waters. The partial reactions may be expressed as (but see also alternatives in Moody 1976): olivine dissolution 3H2O + 2 Mg2SiO4 5Mg3Si2O5(OH)4 + Mg2+ + 2OH- Equation 2 forsterite serpentine 2H2O + Fe2SiO4 2Fe(OH) 2 + SiO2 Equation 3 fayalite pyroxene dissolution 2H2O + 3MgSiO3 Mg3Si2O5(OH)4 + SiO2 Equation 4 H2O + FeSiO3 Fe(OH) 2 + SiO2 Equation 5
20
H2O + CaSiO3 Ca2+ + 2OH- + SiO2 Equation 6 precipitation 3(Mg2+ + 2OH-) + 2SiO2 Mg3Si2O5(OH)4 + H2O Equation 7 along with the groundwater components: Mg2+ + HCO3
- + OH- MgCO3 + H2O Equation 8 Ca2+ + HCO3
- + OH- CaCO3 + H2O Equation 9 Of course, without full petrological details and kinetic information, the total reaction equation is always indeterminate. Nevertheless, from the viewpoint of the cement leachate analogy, it is worth noting that:
the fluid output (Table 2.2) contains low Mg and SiO2, regardless of the input water chemistry, so they are conserved within the system
equation 7 involves a balance between Mg (from equation 2) and the input groundwater, with SiO2 derived from equations 3 to 6 – so serpentine precipitation is buffered by differential olivine-pyroxene dissolution
hydroxide is produced in equations 2, 3, 5 and 6, but the (Mg2+ + 2OH-) of equation 2 is consumed in equation 7, leaving only Ca and Fe sources, with Ca likely to dominate based on the source mineralogy
any HCO3- in the input groundwater is generally consumed in equations 8 and 9,
giving rise to aragonitic, magnesitic to dolomitic secondary carbonates and output groundwaters dominated by Ca-OH-Na-Cl compositions
The serpentinite mineral assemblages are strongly reducing and the alkaline waters are often effervescent with H2 and/or CH4 gas. Some of the reaction pathways are also strongly exothermic, frequently producing hydrothermal groundwaters: although only one thermal spring has been reported in Cyprus (Neal and Shand 2002), they are commonplace in the ophiolites of the Philippines, for example (Alexander et al. 2008a).

21
Table 2.2. Hydrochemistry of alkaline groundwaters: examples from around the world for comparison with the Cyprus groundwater data and low pH cement leachates. All data in ppm.
Location pH Na K Ca Mg Cl Cyprus1 Cyprus 3a 11.5 385 15.1 1.0 0.3 420.0 Cyprus 3b 11.2 163.0 1.2 93.0 0.5 190.0 Worldwide2 Greece 11.3 24.0 1.0 34.0 0.3 15.0 Bosnia 11.7 35.0 1.5 29.0 7.0 20.0 Oman 11.5 132 4.8 34.0 1.3 127.5 PNG 10.8 15.0 3.0 14.0 2.3 22.0 Western USA 11.5 19.0 1.0 40.0 0.3 63.0 Philippines3 Manleluag 1 11.1 28.0 0.5 18.6 0.2 17.4 Manleluag 2 10.4 20.6 0.4 18.1 --- 15.8 Poon Bato 10.9 18.4 0.9 33.1 0.05 20.9 Narra 1 10.8 158 0.9 3.1 0.0 95.0 Narra 3 10.3 157 0.9 2.4 0.1 80.0 Cement leachate4 ALL-MR f63 11.0 42 7.3 20 <0.5 52 OL-SR f63 10.0 4400 150 4300 0.56 13000
1: Neal and Shand (2002), 2: Neal and Stanger (1983), 3: Alexander et al. (2008a), 4: Vuorinen et al. 2005.

22
23
3 GEOMORPHOLOGICAL CONTROLS 3.1 Uplift and unroofing Initially, the Cyprus plate fragment was gradually uplifted from late-Cretaceous to late-Oligocene times, followed by more rapid phase during the Miocene (Orszag-Sperber et al. 1989). In pre-Pliocene times, the ophiolitic basement of Troodos Massif formed locally emerging island associated with the initiation of the northwards dipping subduction zone. Uplift and extension continued from the Neogene to present day (McCallum and Robertson 1995), amounting to approximately 2 km of uplift since latest Pliocene to earliest Pleistocene (Eaton and Robertson 1993; Stow et al. 1995). This produced the present domal shape of the Troodos massif. Tectonism, therefore, through uplift and creation of relief, provided the increased energy necessary for fluvial systems to incise and erode and, together with heavy rainfall, leads to deeply incised valleys and gorges being cut into the rising dome. Periodic sea-level falls and further uplifts of the Cyprus landmass in the past 2 Ma facilitated continued downcutting (Greensmith 1998), and enormous quantities of rock material were stripped from the mountain dome and spread over lowlands or carried into the sea. The manner, scale and timing of this subsequent erosional unroofing of the dome are key considerations in the present report for assessing when geohydrological systems were initiated in the underlying ophiolitic mass. With the uplifting during active faulting (McCallum and Robertson 1995), the unroofing began with the lower Tertiary Lefkara Formation and the Miocene Pankhna Formation cover. The sediment eroded was channeled seawards across the southern margin of the Mesaoria Basin, and included siltstones, coarse sandstone pebbles, and clasts of chalk and reef limestone (Figure 3.1.1). This formed the coarse-grained sediment of the lower part of the Nicosia Formation fan-delta system. In the Late-Pliocene the coastal fan-delta system of the Kakkaristra Formation was deposited when basin subsidence had virtually ceased. Deposition of the Apalós Formation (early Quaternary) followed a fluvial facies of mudstones with minor quantities of sandstones and conglomerates (Weber et al. 2011). These two formations were deposited between 2.58 and 1.95 Ma, and 1.2 and 0.8 Ma, respectively (Kinneard et al. 2011). The upper surface of the Apalós Formation was then truncated by a major unconformity, by erosion possibly related to a major glacio-eustatic fall and rise of global sea levels of a glacial maximum. Subsequently, with renewed uplift of the Troodos Massif in mid-Quaternary times, coarse alluvial conglomerates were shed radially from the now-exposed and rising ophiolitic massif (Poole and Robertson 1991).

24
Figure 3.1.1. Schematic block diagram showing sediment derived from the uplifting Troodos Massif being channelled into the Mesaoria Basin (from McCallum and Robertson 1995). 3.2 Landforms, erosion and weathering 3.2.1 Massifs
The mountains which form the main west-east ridge across central Cyprus (Figure 3.2.1) are termed ‘massifs’, a general term in the description of orogenic belts. It refers to a mountain mass formed of rocks which are more rigid than those of its surroundings (Bates and Jackson 1980). In Cyprus, the geographical term Troodos may refer to the entire mountain range, or to smaller entities within it, including the Limassol Forest and Machairas Forest massifs, as well as the highest ground around Mount Olympus of the Troodos Forest itself. The Limassol Forest massif, with a highest point of 1001 m at Eloros, is made up of similar rocks to those in the Troodos, but experienced a much more complex structural history. This included solid deformation of rocks both during and after their original emplacement, with repeated overthrusting in Miocene times (Greensmith 1998). Within the massifs, different rocks may have distinctive relief and ground-surface characteristics. Lavas are areas of irregular but lower ground, whereas diabase rocks give rise to irregular, craggy hillslopes. Gabbro outcrops, although still rugged, generally have more rounded summits and are recognised by extensive talus of rock debris on valley sides (Figure 3.2.2). In mountains in mid- and higher-latitudes, such accumulations of angular clasts are attributed to riving by freeze-thaw action in winter or during longer, colder spells.

25
Figure 3.2.1. Sketch map of central Cyprus showing relief, drainage and selected locations. The Parsata sampling site is in the bottom right of the map.
Figure 3.2.2. Tributary valley in the High Troodos, showing extent of scree mantle and valley-side gullying.
26
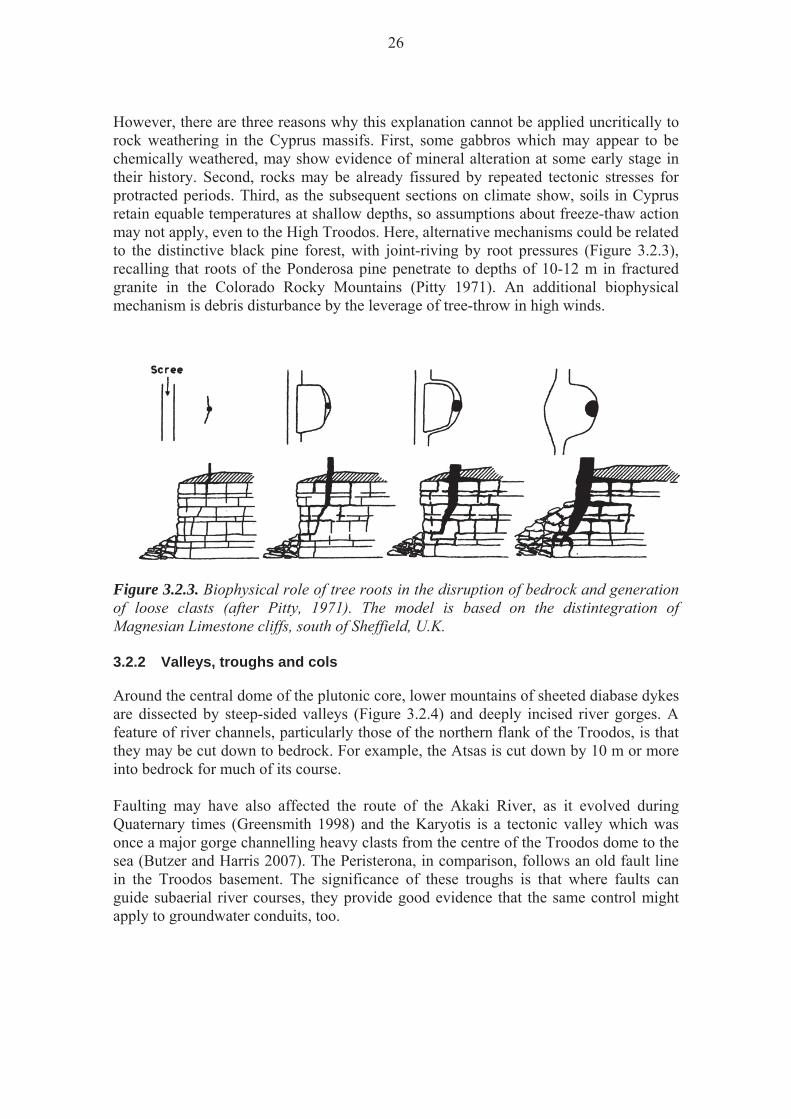
However, there are three reasons why this explanation cannot be applied uncritically to rock weathering in the Cyprus massifs. First, some gabbros which may appear to be chemically weathered, may show evidence of mineral alteration at some early stage in their history. Second, rocks may be already fissured by repeated tectonic stresses for protracted periods. Third, as the subsequent sections on climate show, soils in Cyprus retain equable temperatures at shallow depths, so assumptions about freeze-thaw action may not apply, even to the High Troodos. Here, alternative mechanisms could be related to the distinctive black pine forest, with joint-riving by root pressures (Figure 3.2.3), recalling that roots of the Ponderosa pine penetrate to depths of 10-12 m in fractured granite in the Colorado Rocky Mountains (Pitty 1971). An additional biophysical mechanism is debris disturbance by the leverage of tree-throw in high winds.
Figure 3.2.3. Biophysical role of tree roots in the disruption of bedrock and generation of loose clasts (after Pitty, 1971). The model is based on the distintegration of Magnesian Limestone cliffs, south of Sheffield, U.K. 3.2.2 Valleys, troughs and cols
Around the central dome of the plutonic core, lower mountains of sheeted diabase dykes are dissected by steep-sided valleys (Figure 3.2.4) and deeply incised river gorges. A feature of river channels, particularly those of the northern flank of the Troodos, is that they may be cut down to bedrock. For example, the Atsas is cut down by 10 m or more into bedrock for much of its course. Faulting may have also affected the route of the Akaki River, as it evolved during Quaternary times (Greensmith 1998) and the Karyotis is a tectonic valley which was once a major gorge channelling heavy clasts from the centre of the Troodos dome to the sea (Butzer and Harris 2007). The Peristerona, in comparison, follows an old fault line in the Troodos basement. The significance of these troughs is that where faults can guide subaerial river courses, they provide good evidence that the same control might apply to groundwater conduits, too.

27
Figure 3.2.4 General view of steep-sided, deep valleys in the High Troodos Although the drainage pattern of central Cyprus is generally radial, there are short but striking departures from this pattern. The most significant is the right-angle turn of the Germasogeia headstream, to the west of Arakapas (Figure 3.2.1), to follow the Arakapas (Transform) Fault Zone (AFZ). This forms a prominent and extensive W-E belt of largely lower ground, separating the Troodos Forest ophiolitic massif from the Limassol Forest ophiolitic massif, including the area just to the immediate north of Parsata. The col between the Troodos Forest (Mount Olympus peak at 1,952 m) and the Machairas Forest (1,423 m at the Kionia peak) may be significant, as it makes the latter area the more likely collecting ground for groundwater draining towards Parsata (Figure 3.2.5). 3.2.3 Plateaux and scarps To the south of the massifs, much of the higher relief is made up of massive pale-coloured limestones, chalks, chalky marls, conglomerates and calcareous sandstones. The more resistant of these strata give rise to plateaux, where the disposition is horizontal, or conspicuous ramps (structural dip slopes) if slightly inclined. North-facing scarps are common, where shales and clays underlie resistant cliff-forming strata. These weaker outcrops are eroded by streams, or are prone to landslips, as is the case where the Pakhna Formation outcrops. Overall, these features create comparatively minor irregularities in the general southward inclination of the southern flank of the massifs (Figure 3.2.6).
28
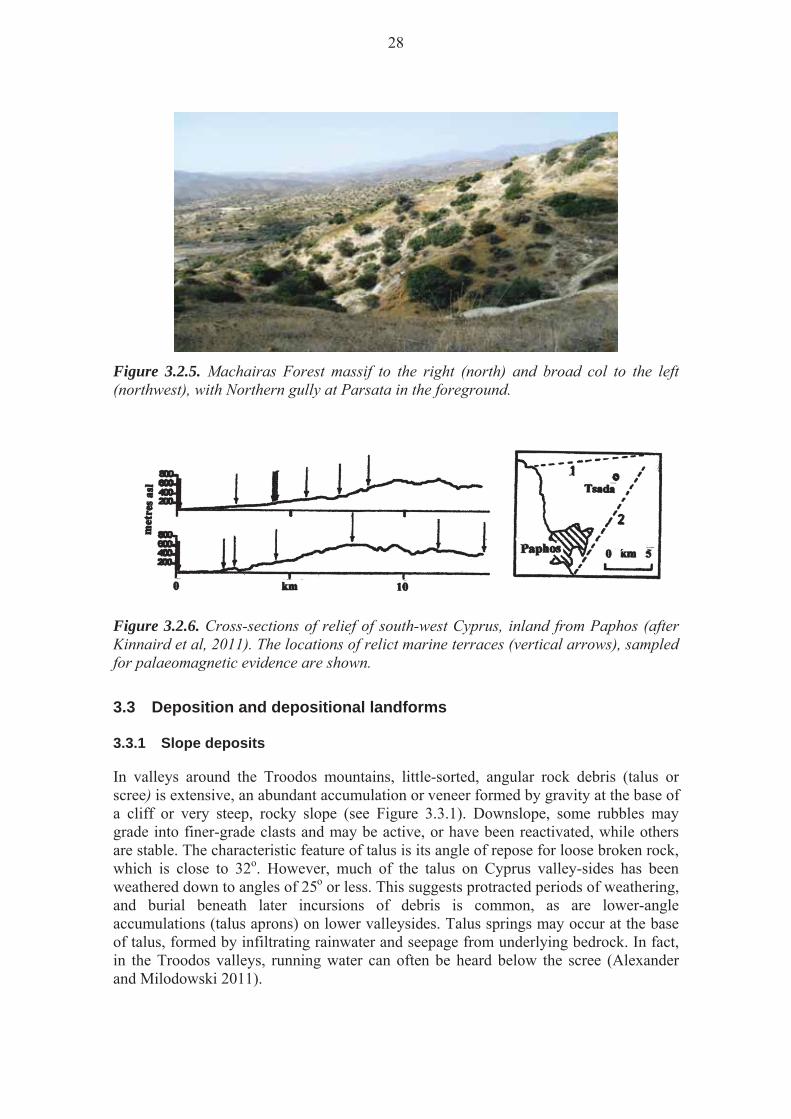
Figure 3.2.5. Machairas Forest massif to the right (north) and broad col to the left (northwest), with Northern gully at Parsata in the foreground.
Figure 3.2.6. Cross-sections of relief of south-west Cyprus, inland from Paphos (after Kinnaird et al, 2011). The locations of relict marine terraces (vertical arrows), sampled for palaeomagnetic evidence are shown. 3.3 Deposition and depositional landforms 3.3.1 Slope deposits
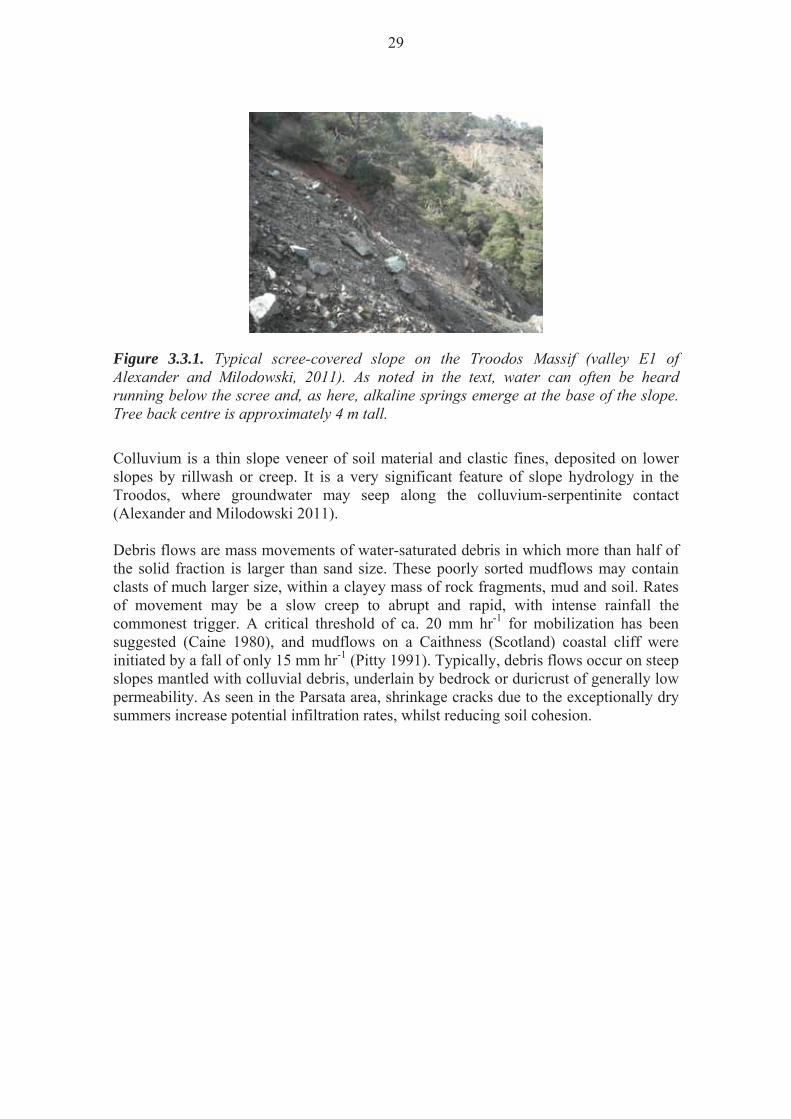
In valleys around the Troodos mountains, little-sorted, angular rock debris (talus or scree) is extensive, an abundant accumulation or veneer formed by gravity at the base of a cliff or very steep, rocky slope (see Figure 3.3.1). Downslope, some rubbles may grade into finer-grade clasts and may be active, or have been reactivated, while others are stable. The characteristic feature of talus is its angle of repose for loose broken rock, which is close to 32o. However, much of the talus on Cyprus valley-sides has been weathered down to angles of 25o or less. This suggests protracted periods of weathering, and burial beneath later incursions of debris is common, as are lower-angle accumulations (talus aprons) on lower valleysides. Talus springs may occur at the base of talus, formed by infiltrating rainwater and seepage from underlying bedrock. In fact, in the Troodos valleys, running water can often be heard below the scree (Alexander and Milodowski 2011).
29
Figure 3.3.1. Typical scree-covered slope on the Troodos Massif (valley E1 of Alexander and Milodowski, 2011). As noted in the text, water can often be heard running below the scree and, as here, alkaline springs emerge at the base of the slope. Tree back centre is approximately 4 m tall. Colluvium is a thin slope veneer of soil material and clastic fines, deposited on lower slopes by rillwash or creep. It is a very significant feature of slope hydrology in the Troodos, where groundwater may seep along the colluvium-serpentinite contact (Alexander and Milodowski 2011). Debris flows are mass movements of water-saturated debris in which more than half of the solid fraction is larger than sand size. These poorly sorted mudflows may contain clasts of much larger size, within a clayey mass of rock fragments, mud and soil. Rates of movement may be a slow creep to abrupt and rapid, with intense rainfall the commonest trigger. A critical threshold of ca. 20 mm hr-1 for mobilization has been suggested (Caine 1980), and mudflows on a Caithness (Scotland) coastal cliff were initiated by a fall of only 15 mm hr-1 (Pitty 1991). Typically, debris flows occur on steep slopes mantled with colluvial debris, underlain by bedrock or duricrust of generally low permeability. As seen in the Parsata area, shrinkage cracks due to the exceptionally dry summers increase potential infiltration rates, whilst reducing soil cohesion.

30
Figure 3.3.2. Exposure of debris flow overlying Pillow lava in a road cutting on the southern flank of the Parsata hilltop.
Figure 3.3.3. Detail of the debris flow on the southern flank of the Parsata hilltop. Bentonite debris flows (a specific geological term; Bates and Jackson, 1980), are particularly common in southern Cyprus, where easily hydrated bentonite-rich sediments have been exposed to rainfall and surface water. Such areas include the higher reaches of headwater gullies and valleys in the Vasilikos catchment in the vicinity of Parsata (Figures 3.3.2 and 3.3.3). Where such materials reach valley floors, they may be funnelled out onto terraces, as seen in the Vasilikos valley, just 5 km south of Parsata. As debris flows follow channel floors and gullies, some fluvial component in flow mechanisms may be involved, too (Figure 3.3.4), and creep rates accelerated (Campbell 1974). As a result, the sediments of turbulent debris flow may have been incorporated into the Vasiliko alluvial fans by the seasonal and relatively high-magnitude floods of perennial streams (Waters et al. 2010).
31
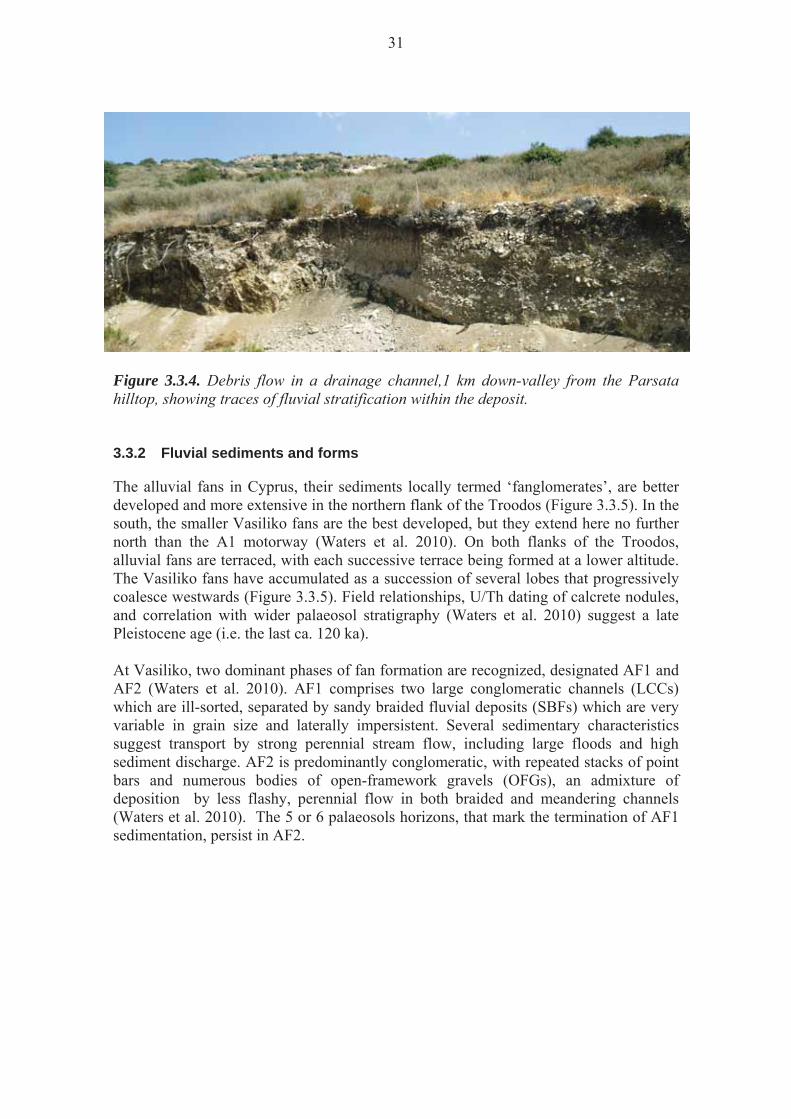
Figure 3.3.4. Debris flow in a drainage channel,1 km down-valley from the Parsata hilltop, showing traces of fluvial stratification within the deposit. 3.3.2 Fluvial sediments and forms
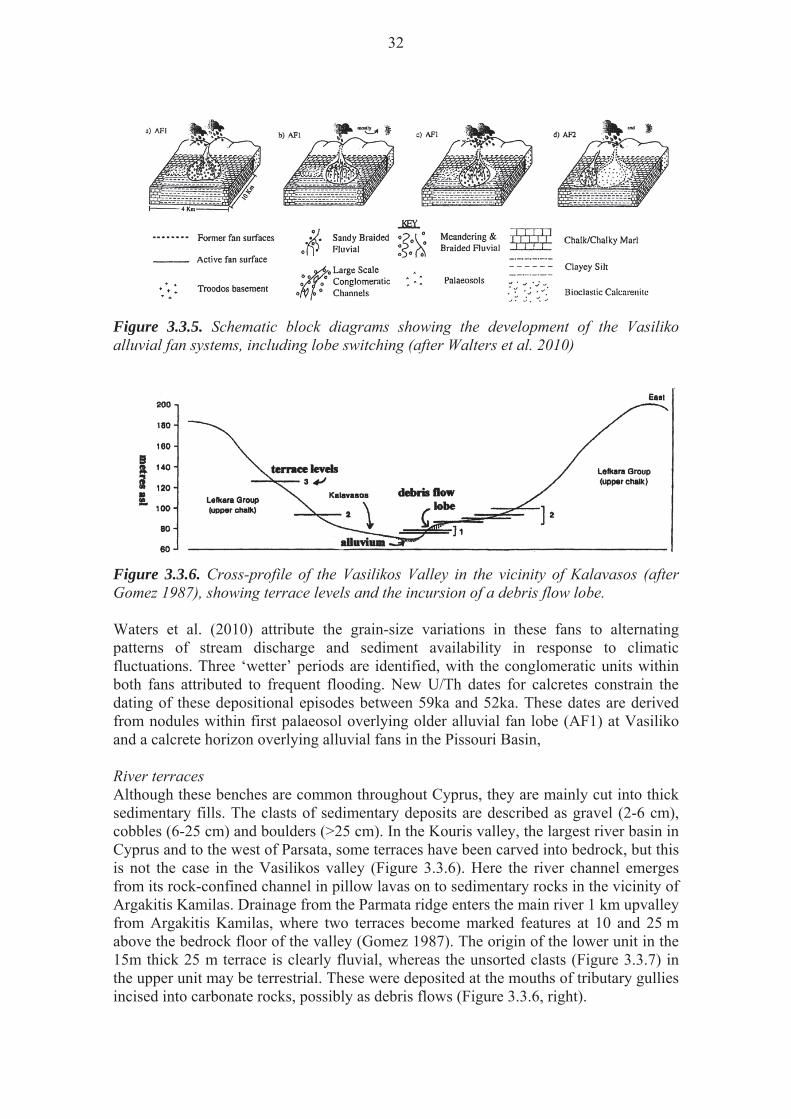
The alluvial fans in Cyprus, their sediments locally termed ‘fanglomerates’, are better developed and more extensive in the northern flank of the Troodos (Figure 3.3.5). In the south, the smaller Vasiliko fans are the best developed, but they extend here no further north than the A1 motorway (Waters et al. 2010). On both flanks of the Troodos, alluvial fans are terraced, with each successive terrace being formed at a lower altitude. The Vasiliko fans have accumulated as a succession of several lobes that progressively coalesce westwards (Figure 3.3.5). Field relationships, U/Th dating of calcrete nodules, and correlation with wider palaeosol stratigraphy (Waters et al. 2010) suggest a late Pleistocene age (i.e. the last ca. 120 ka). At Vasiliko, two dominant phases of fan formation are recognized, designated AF1 and AF2 (Waters et al. 2010). AF1 comprises two large conglomeratic channels (LCCs) which are ill-sorted, separated by sandy braided fluvial deposits (SBFs) which are very variable in grain size and laterally impersistent. Several sedimentary characteristics suggest transport by strong perennial stream flow, including large floods and high sediment discharge. AF2 is predominantly conglomeratic, with repeated stacks of point bars and numerous bodies of open-framework gravels (OFGs), an admixture of deposition by less flashy, perennial flow in both braided and meandering channels (Waters et al. 2010). The 5 or 6 palaeosols horizons, that mark the termination of AF1 sedimentation, persist in AF2.
32
Figure 3.3.5. Schematic block diagrams showing the development of the Vasiliko alluvial fan systems, including lobe switching (after Walters et al. 2010)
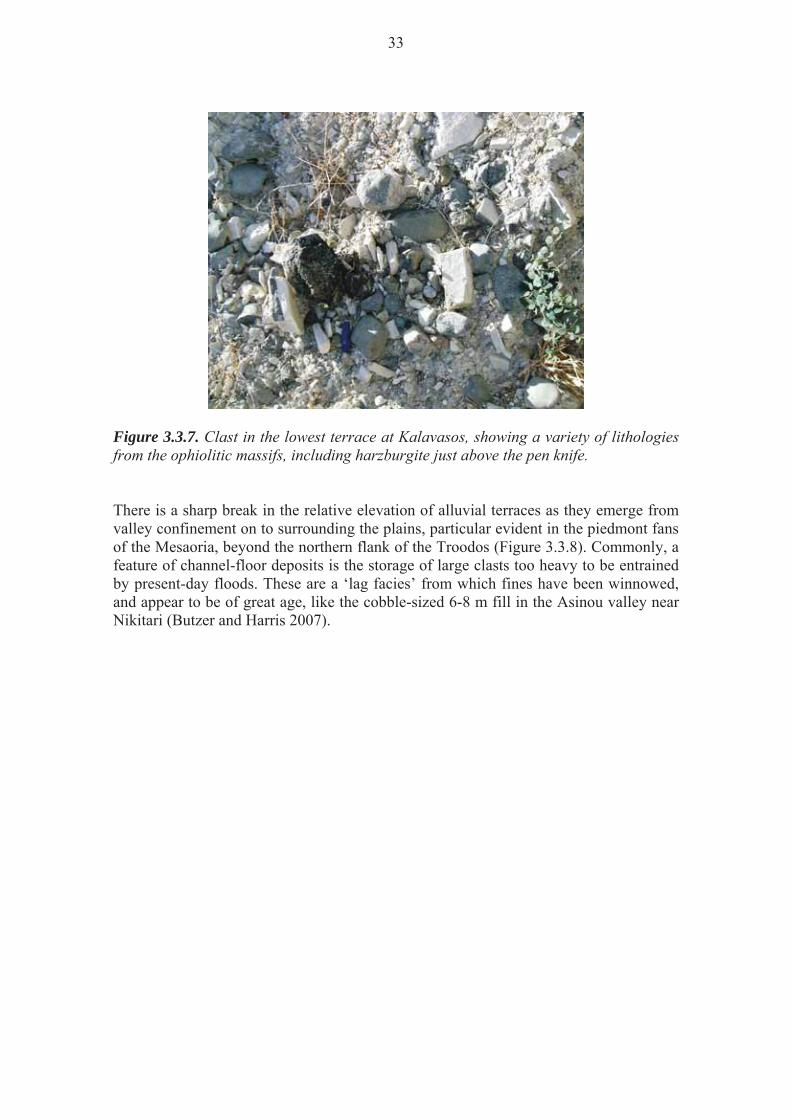
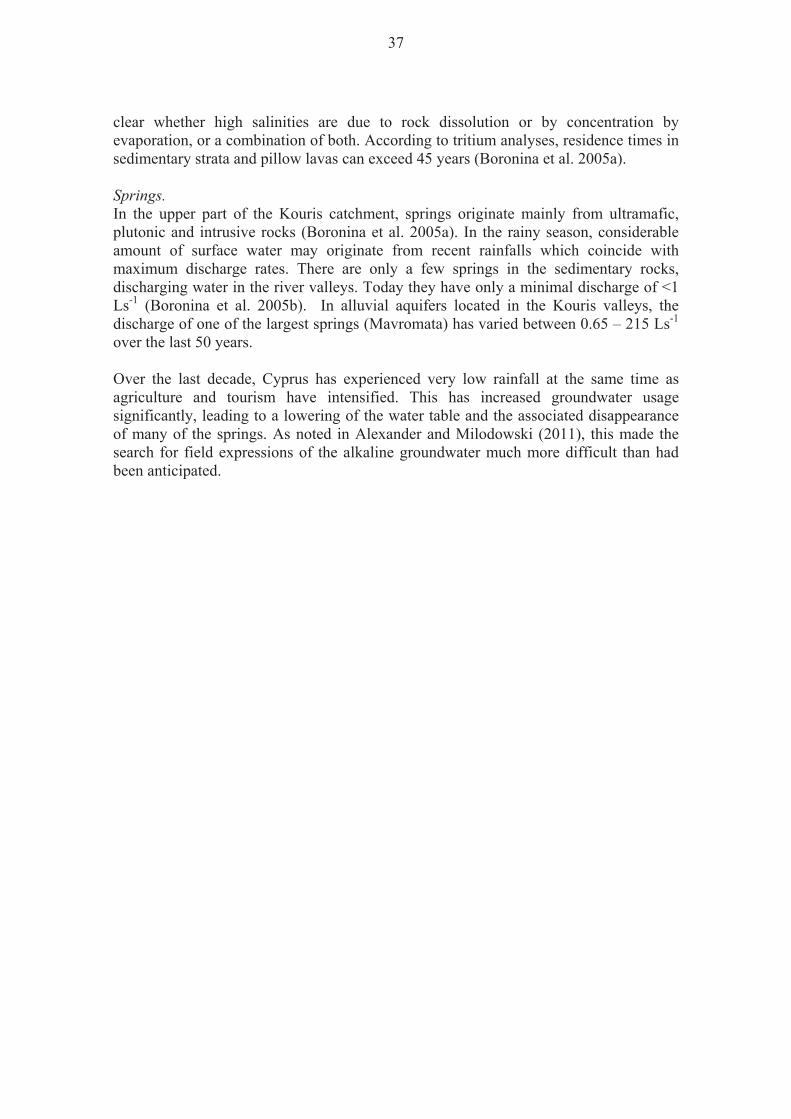
Figure 3.3.6. Cross-profile of the Vasilikos Valley in the vicinity of Kalavasos (after Gomez 1987), showing terrace levels and the incursion of a debris flow lobe. Waters et al. (2010) attribute the grain-size variations in these fans to alternating patterns of stream discharge and sediment availability in response to climatic fluctuations. Three ‘wetter’ periods are identified, with the conglomeratic units within both fans attributed to frequent flooding. New U/Th dates for calcretes constrain the dating of these depositional episodes between 59ka and 52ka. These dates are derived from nodules within first palaeosol overlying older alluvial fan lobe (AF1) at Vasiliko and a calcrete horizon overlying alluvial fans in the Pissouri Basin, River terraces Although these benches are common throughout Cyprus, they are mainly cut into thick sedimentary fills. The clasts of sedimentary deposits are described as gravel (2-6 cm), cobbles (6-25 cm) and boulders (>25 cm). In the Kouris valley, the largest river basin in Cyprus and to the west of Parsata, some terraces have been carved into bedrock, but this is not the case in the Vasilikos valley (Figure 3.3.6). Here the river channel emerges from its rock-confined channel in pillow lavas on to sedimentary rocks in the vicinity of Argakitis Kamilas. Drainage from the Parmata ridge enters the main river 1 km upvalley from Argakitis Kamilas, where two terraces become marked features at 10 and 25 m above the bedrock floor of the valley (Gomez 1987). The origin of the lower unit in the 15m thick 25 m terrace is clearly fluvial, whereas the unsorted clasts (Figure 3.3.7) in the upper unit may be terrestrial. These were deposited at the mouths of tributary gullies incised into carbonate rocks, possibly as debris flows (Figure 3.3.6, right).
33
Figure 3.3.7. Clast in the lowest terrace at Kalavasos, showing a variety of lithologies from the ophiolitic massifs, including harzburgite just above the pen knife. There is a sharp break in the relative elevation of alluvial terraces as they emerge from valley confinement on to surrounding the plains, particular evident in the piedmont fans of the Mesaoria, beyond the northern flank of the Troodos (Figure 3.3.8). Commonly, a feature of channel-floor deposits is the storage of large clasts too heavy to be entrained by present-day floods. These are a ‘lag facies’ from which fines have been winnowed, and appear to be of great age, like the cobble-sized 6-8 m fill in the Asinou valley near Nikitari (Butzer and Harris 2007).

34
Figure 3.3.8. Schematic cross-sections of the valleys on the northern side of the Troodos massif (after Butzer and Harris 2007). The sequences for the Asinou Valley (left) and the Peristerona Valley (right) begin with the up-valley cross-sections at the base of the diagrams Table 3.3.1. Provisional stratigraphy of Quaternary sediments, north-central Troodos (after K.W.Butzer and S.E.Harris 2007)
Unit number Age Unit thickness Lithology and depositional form
0 Sub-contemporary 1.5-2m channel bars
1 Late Holocene, mainly Medieval?
3-5 m Alluvial fill
2A End-Pleistocene or Early Holocene?
<1.2 m flood loam c.10 k yr
2B Late Pleistocene? 6-15 m coarse/cobble gravel with erosional phases
3 Mid-Pleistocene? 16-40 m coarse/cobble gravel interstraified with scree
(Asinou)
4 Early to Mid- Pleistocene?
c.30 m Vast piedmont fanglomerate accumulation, dissected in 3
stages

35
3.3.3 Coastal deposits.
There are three aspects of coastal deposits of particular interest for CNAP. First, the mineralogy of beach sands indicates the lithologies currently being eroded in the Troodos massifs. Second, the volume of some coastal forms reflects, in part, the scale of terrestial erosion during the Holocene. Third, some of the relict features, left inland by relative falls in sea level, can be dated.
Figure 3.3.9. Map of mounds of relict marine terraces (raised beaches), capped with calcrete (from Cottiss 1984) Longshore drift refers both to the littoral currents in the zone of wave turbulence along a shore, and to the sediments there entrained. As the prevailing winds in southern Cyprus are from W and SW, sand, shingle and pebbles moves eastwards and are trapped on the W side of protruding headlands, such as Cape Zevgari and Cape Gata (Figure 3.2.1). Material brought downstream by the Kouris river is an important addition to shore sediment already entrained by longshore drift. Beach deposits are the unconsolidated sediments that line a shore. Usually, beach materials are siliceous but those along Cyprus coasts may contain ferromagnesian mineral and epidote mineral grains and basic igneous pebbles. These have been eroded

36
from source rocks in the Troodos ophiolitic massifs, transported downstream, and then reworked during longshore drift. As the Mediterranean is an essentially tideless sea, longshore drift is particularly important in the reworking of shore sediments. Beach ridges are linear mounds, heaped up on a backshore. The example which starts at Cape Zevgari is about 9 km long, bounding the southern shore of the Akrotiri peninsula. Its unusual height suggesting the particular importance of accumulation by eolian dune processes on the shore of a tideless sea, and the presence of a calcrete cap. Marine terraces may include raised beach deposits, comprising seams and layers of gravels, sands and silts. In southern Cyprus, their capping may incorporate calcrete, and may be found as a sequence progressing inland, and usually at increasing altitudes. Those at lowest altitudes may retain remnants of a wave-trimmed, bedrock platform, and be backed by a degraded former sea-cliff. Raised beaches have been mapped in detail along parts of the Limassol-Nicosia A1 motorway (Figure 3.3.9), where they overlie the Moni Formation and remain as calcrete-capped mounds or hillocks (Cottiss 1984).
3.4 Hydrology 3.4.1 Surface flow
Catchments in Cyprus are characterised by variability in time and space of climatic conditions, with intermittent stream flow being the norm. In fact, the Pediaios River may flow for only a few weeks and rarely reaches the sea. Other contrasts include the steepness of catchment slopes and the highly heterogeneous nature of geohydrological properties underground. The River Kouris, including its Kryos and Limnatis tributaties, is the largest river in Cyprus,.with a 30 year average flow of 36 Mm3a-1 (Boronina, 2003). River channels are generally floored by unconsolidated sediments of sands gravels and boulders. These form narrow (50-100 m) and discontinuous aquifers, although they may contain major amounts of water in the lower reaches of catchments. Given that snow packs may last for several weeks, if not months, in the high Troodos, spring snowmelt floods may be an important feature of seasonal fluctuations in steam flow. 3.4.2 Groundwater
Within the Troodos massif, water is stored in the fractured and altered zones of harzburgites, dunites, gabbros and diabase dykes. Transmissivities of the gabbros and diabase dykes vary from 2 to 703 m2day-1. The Pillow Lavas are generally less permeable, although local zones of high conductivity may exist (Boronina et al. 2005a). In sedimentary strata the average is about 3m2day-1. Mineralisation. Cation and anion compositions vary considerably with local lithology. The amounts of total dissolved solids (TDS) are higher in the pillow lavas than in ultramafic, plutonic and intrusive rocks (500-950 mgL-1). Groundwaters in hard sedimentary rocks are generally moderately mineralised with salinities higher than in the ophiolites (600-1600 mgL-1). Those in the alluvial aquifer are less mineralised (500-600 mgL-1). It may not be
37
clear whether high salinities are due to rock dissolution or by concentration by evaporation, or a combination of both. According to tritium analyses, residence times in sedimentary strata and pillow lavas can exceed 45 years (Boronina et al. 2005a). Springs. In the upper part of the Kouris catchment, springs originate mainly from ultramafic, plutonic and intrusive rocks (Boronina et al. 2005a). In the rainy season, considerable amount of surface water may originate from recent rainfalls which coincide with maximum discharge rates. There are only a few springs in the sedimentary rocks, discharging water in the river valleys. Today they have only a minimal discharge of <1 Ls-1 (Boronina et al. 2005b). In alluvial aquifers located in the Kouris valleys, the discharge of one of the largest springs (Mavromata) has varied between 0.65 – 215 Ls-1 over the last 50 years. Over the last decade, Cyprus has experienced very low rainfall at the same time as agriculture and tourism have intensified. This has increased groundwater usage significantly, leading to a lowering of the water table and the associated disappearance of many of the springs. As noted in Alexander and Milodowski (2011), this made the search for field expressions of the alkaline groundwater much more difficult than had been anticipated.

38
39
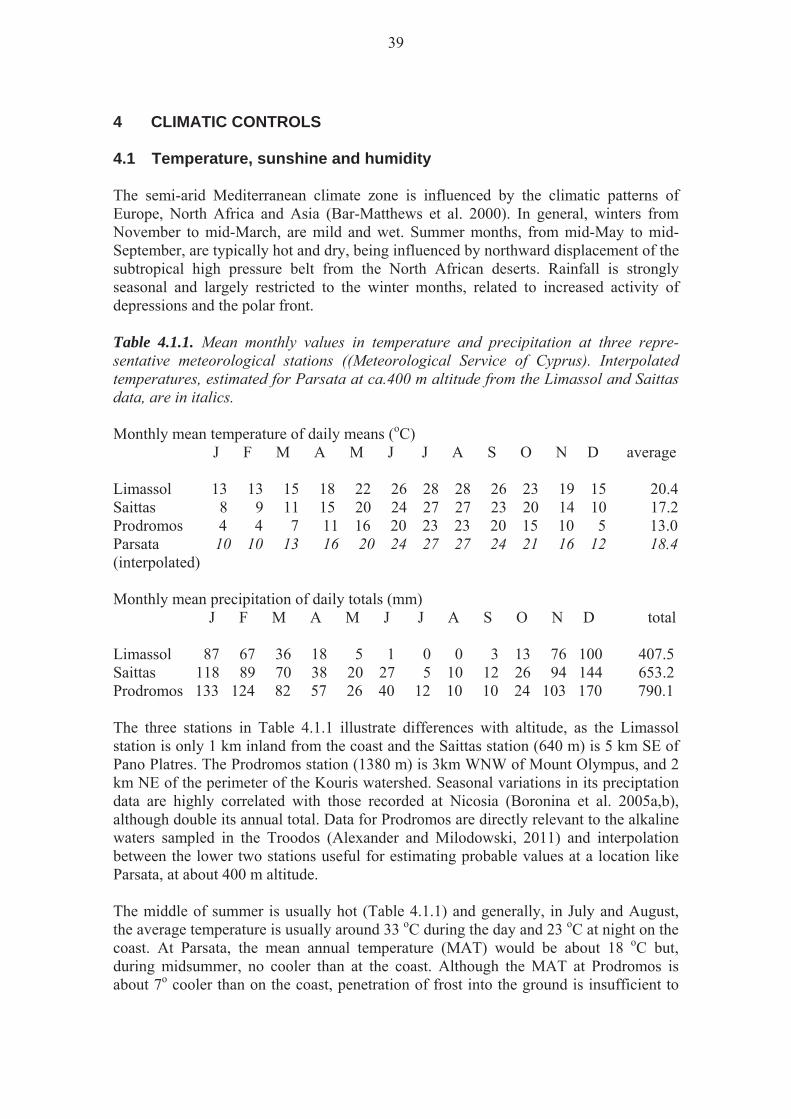
4 CLIMATIC CONTROLS 4.1 Temperature, sunshine and humidity The semi-arid Mediterranean climate zone is influenced by the climatic patterns of Europe, North Africa and Asia (Bar-Matthews et al. 2000). In general, winters from November to mid-March, are mild and wet. Summer months, from mid-May to mid-September, are typically hot and dry, being influenced by northward displacement of the subtropical high pressure belt from the North African deserts. Rainfall is strongly seasonal and largely restricted to the winter months, related to increased activity of depressions and the polar front. Table 4.1.1. Mean monthly values in temperature and precipitation at three repre-sentative meteorological stations ((Meteorological Service of Cyprus). Interpolated temperatures, estimated for Parsata at ca.400 m altitude from the Limassol and Saittas data, are in italics. Monthly mean temperature of daily means (oC) J F M A M J J A S O N D average Limassol 13 13 15 18 22 26 28 28 26 23 19 15 20.4 Saittas 8 9 11 15 20 24 27 27 23 20 14 10 17.2 Prodromos 4 4 7 11 16 20 23 23 20 15 10 5 13.0 Parsata 10 10 13 16 20 24 27 27 24 21 16 12 18.4 (interpolated) Monthly mean precipitation of daily totals (mm) J F M A M J J A S O N D total Limassol 87 67 36 18 5 1 0 0 3 13 76 100 407.5 Saittas 118 89 70 38 20 27 5 10 12 26 94 144 653.2 Prodromos 133 124 82 57 26 40 12 10 10 24 103 170 790.1 The three stations in Table 4.1.1 illustrate differences with altitude, as the Limassol station is only 1 km inland from the coast and the Saittas station (640 m) is 5 km SE of Pano Platres. The Prodromos station (1380 m) is 3km WNW of Mount Olympus, and 2 km NE of the perimeter of the Kouris watershed. Seasonal variations in its preciptation data are highly correlated with those recorded at Nicosia (Boronina et al. 2005a,b), although double its annual total. Data for Prodromos are directly relevant to the alkaline waters sampled in the Troodos (Alexander and Milodowski, 2011) and interpolation between the lower two stations useful for estimating probable values at a location like Parsata, at about 400 m altitude. The middle of summer is usually hot (Table 4.1.1) and generally, in July and August, the average temperature is usually around 33 oC during the day and 23 oC at night on the coast. At Parsata, the mean annual temperature (MAT) would be about 18 oC but, during midsummer, no cooler than at the coast. Although the MAT at Prodromos is about 7o cooler than on the coast, penetration of frost into the ground is insufficient to

40
cause problems, even in the highest areas. Mid-winter soil temperatures may be little below 10 oC at 1 m depths. Summer is a season of high temperatures with almost cloudless skies. Sunshine hours on the coast are 3,300-3,500 per year, which is more than twice that of London, for example, and this increases to more than 4 times in December. Specific examples include Larnaca, Saittas and Prodromos with 3,357, 2,994 and 2,713 hours per year, respectively. Relative humidity of the air averages 60-80 % in winter and 40-60 % in summer, with even lower values inland around midday. 4.2 Precipitation The seasonal contrast is a hallmark of a Mediterranean climate. In winter, Cyprus is near the track of fairly frequent small depressions which cross the Mediterranean Sea from west to east between the continental anticyclone of Eurasia and the generally low pressure belt of North Africa. These produce most of the annual precipitation. The average from December to February accounts for about 60 % of the average annual total, and that between November to March is usually ca. 80 % of total. Variability in annual rainfall is also a characteristic of the Cyprus climate and droughts are frequent and sometimes severe. In addition, large amounts of rainfall are often caused by intensive rains rather than by a large number of rainy days. In the case of rainfall intensity exceeding infiltration capacity, water drains to the rivers without infiltration in the deep aquifer. Sediment supply and rates of erosion are related to stream power, which is generally attributed to precipitation intensity. Thus, the role of precipitation is essential for deposition of sediment on to alluvial fans. Another distinctive feature of the island is the increase in annual rainfall from 300 mm along the coast to nearly 1200 mm in Troodos. Interpolation in Table 4.1.1 indicates that amounts for altitudes like Parsata would be about 560 mma-1. Additionally, the higher reaches of Olympus are capped by snow in winter, and snowstorms may be heavy. Although snow cover is not continuous during the coldest months, it may lie for several weeks especially on the northern slopes of the high Troodos. 4.3 Evapotranspiration Evapotranspiration (ET) is a crucial feature of the Cyprus environment, where rainfall is rapidly absorbed by the very dry soil, and soon evaporated in high temperatures and low humidities. Equally, transpiration by deep-rooted vegetation draws up groundwater from depth, driven by long hours of sunshine as well as the high temperatures. As a result, ET impacts significantly on the recharge to groundwaters, calculated as the residue of water balance after deducting ET from precipitation totals. For example, in the Kouris catchment, with a mean annual precipitation of 1210 mm, recharge is only 100-130 mma-1 (Boronina et al. 2005b). ET is also a vital consideration in the mineralisation of groundwaters, both by concentrating fluids by evaporation, and by holding them in contact with rock for longer periods than in more freely draining systems.
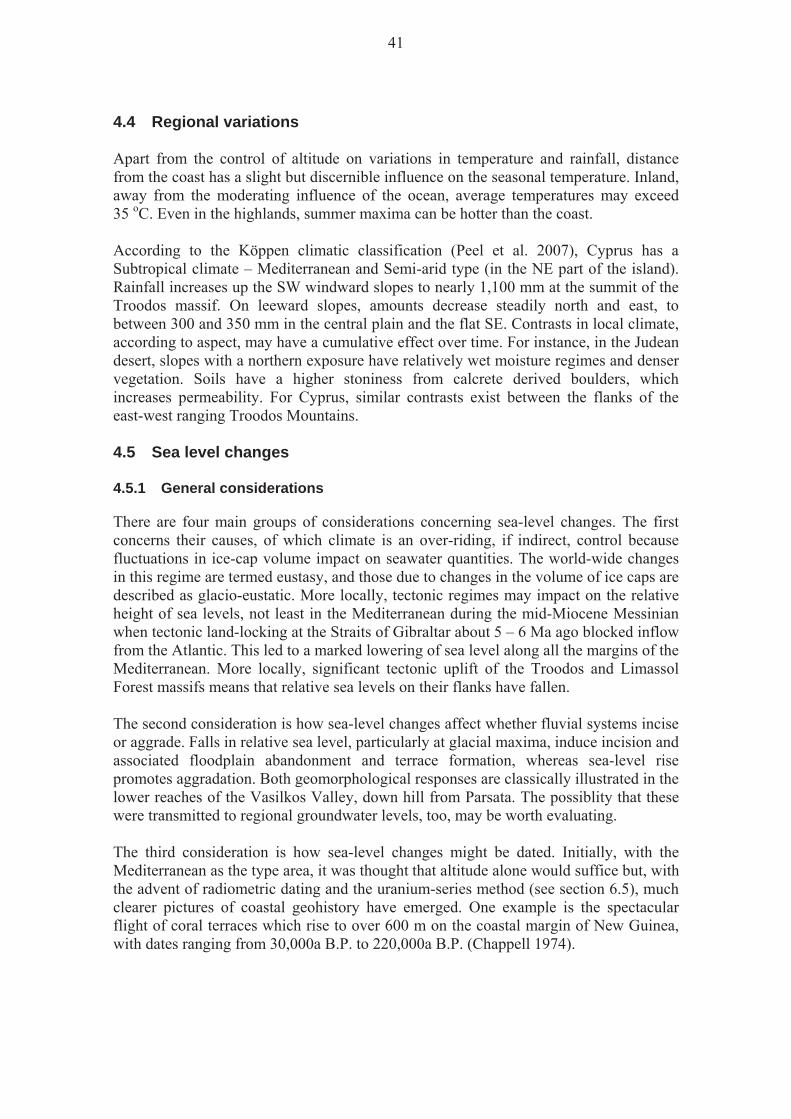
41
4.4 Regional variations Apart from the control of altitude on variations in temperature and rainfall, distance from the coast has a slight but discernible influence on the seasonal temperature. Inland, away from the moderating influence of the ocean, average temperatures may exceed 35 oC. Even in the highlands, summer maxima can be hotter than the coast. According to the Köppen climatic classification (Peel et al. 2007), Cyprus has a Subtropical climate – Mediterranean and Semi-arid type (in the NE part of the island). Rainfall increases up the SW windward slopes to nearly 1,100 mm at the summit of the Troodos massif. On leeward slopes, amounts decrease steadily north and east, to between 300 and 350 mm in the central plain and the flat SE. Contrasts in local climate, according to aspect, may have a cumulative effect over time. For instance, in the Judean desert, slopes with a northern exposure have relatively wet moisture regimes and denser vegetation. Soils have a higher stoniness from calcrete derived boulders, which increases permeability. For Cyprus, similar contrasts exist between the flanks of the east-west ranging Troodos Mountains. 4.5 Sea level changes 4.5.1 General considerations
There are four main groups of considerations concerning sea-level changes. The first concerns their causes, of which climate is an over-riding, if indirect, control because fluctuations in ice-cap volume impact on seawater quantities. The world-wide changes in this regime are termed eustasy, and those due to changes in the volume of ice caps are described as glacio-eustatic. More locally, tectonic regimes may impact on the relative height of sea levels, not least in the Mediterranean during the mid-Miocene Messinian when tectonic land-locking at the Straits of Gibraltar about 5 – 6 Ma ago blocked inflow from the Atlantic. This led to a marked lowering of sea level along all the margins of the Mediterranean. More locally, significant tectonic uplift of the Troodos and Limassol Forest massifs means that relative sea levels on their flanks have fallen. The second consideration is how sea-level changes affect whether fluvial systems incise or aggrade. Falls in relative sea level, particularly at glacial maxima, induce incision and associated floodplain abandonment and terrace formation, whereas sea-level rise promotes aggradation. Both geomorphological responses are classically illustrated in the lower reaches of the Vasilkos Valley, down hill from Parsata. The possiblity that these were transmitted to regional groundwater levels, too, may be worth evaluating. The third consideration is how sea-level changes might be dated. Initially, with the Mediterranean as the type area, it was thought that altitude alone would suffice but, with the advent of radiometric dating and the uranium-series method (see section 6.5), much clearer pictures of coastal geohistory have emerged. One example is the spectacular flight of coral terraces which rise to over 600 m on the coastal margin of New Guinea, with dates ranging from 30,000a B.P. to 220,000a B.P. (Chappell 1974).

42
Finally, even with some reliable dating available, it not always clear whether eustatic or local tectonic factors were responsible for the observed changes in relative sea level and disagreements in interpretation are common. For southern Cyprus, however, it seems clear that the dating of marine terraces (raised beaches) provides an invaluable indication of rates of tectonic uplift. 4.5.2 Southern Cyprus
In southern Cyprus, marine terraces are present at altitudes of ca.350 m, 100 m, 60 m, 20 m, 10 m and 5 m. All but the 350 m fall within Pleistocene times. In the lower Vasilkos area, the clearest seem to be at 20 and 10 m levels. Four main marine terrace horizons have been recognised and correlated around southern Cyprus, termed F0 – F4 (Poole and Robertson, 1991). Using uranium-series dating on corals, the F4 terrace was dated at 116-130 ka and F3 at 185-192 ka. This record suggests episodic uplift, with an estimated rate of ca. 240 mm ka-1 between 185 and 130 ka (Poole et al. 1990), but note that this was much reduced to ca. 50 mm ka-1 from 116 ka to the present day An implication of these calculations is that groundwaters in the Parsata area perhaps began to circulate to deeper levels during the 185 – 130 ka interval. That uplift rates were much less before and after this interval is implied by magnetic polarity evidence from bioclastic, littoral calcarenites. This suggest that these coastal areas were uplifted by >600 m during the past 780 ka, indicating a rate of uplift >80 mm ka-1 (Kinnaird et al. 2011). Figure 3.3.8 shows the location of the terraces sampled during their study. 4.6 Soils and duricrusts 4.6.1 Soils
The absence of well-marked soil horizons is attributable to dry conditions, to erosion continually renewing the top soils and, additionally, to aeolian inputs of dust and fine sand from the Arabian and African deserts. These are not just annual events, but may occur several times a year, and account for the reddish colour of the soil which characterises drier Mediterranean environments, the terra rossa. In such higher areas, the construction of terraces and check dams, from Roman times onwards, demonstrates that much effort has gone into building up strips of deeper soils and to protecting soil from erosion. Soils derived from limestone or gypsiferous rocks, as on the dry, chalky uplands, around Parsata, are typically grey or very light brown in colour, mostly shallow and highly calcareous. Hillslope hydrology is affected by the impermeability of accumulation of carbonates and gypsum in such subsoil. This changes the direction of drainage of subsurface water from vertical to lateral (Lavee et al.. 1989), and is accentuated in the Parsata area by the weathering out of bentonitic clays. 4.6.2 Calcrete
In semi-arid environments with a strongly seasonal precipitation regime, soils have some highly distinctive features. In particular, these include hard cemented layers that develop within the soil profile and underlying weathered rocks, or as a hard crust at the

43
ground surface itself. These are formed by the accumulation of soluble minerals deposited from mineralized soil water and groundwater that moves upward by capillary action and, in the dry season, evaporates. In areas of calcareous bedrock, these soil horizons or crusts are termed calcrete and known locally as havara or kafkalla in Cyprus. Calcrete development typically occurs within the same climatic setting as terra rossa, where regions can experience high rainfall but with dry seasons and warm temperatures. Intercalations of terra rossa and calcrete horizons are common on alluvial fans and the development of both pedogenetic features signifies localised fan stability 4.6.3 Beachrock and eolianites
In coastal environments, the formation of beachrock and eolianites is analogous to that of duricrusts and terra rossa palaeosols in terrestrial environments. In hot summer weather, pebbles and sand in the ‘splash zone’ undergo a cycle of wetting by carbonate-rich seawater and sun-drying. Gradually, clasts of mixed and well-rounded pebbles are cemented together, resembling concrete. Thick beds of such conglomerate found inland from the present shoreline are surviving parts of old beaches or river beds, up to 25 m thick. Similarly, eolianites are coastal accumulations of wind-borne sands which become cemented by evaporation of carbonate-rich coastal groundwaters. Eolianites are often interbedded with soils, and may include molluscan fragments and other biogenic debris, deflated from the emerging shallow-water zone during sea-level regressions. As such, they can be invaluable in dating glacioeustatic oscillations of sea levels. 4.6.4 Soil mechanics
Shrink-swell clays are prone to slip after prolonged spells of wet weather. Smectites are prime examples of such clay minerals, commonly originating from breakdown of materials such as pyroxenes or glassy shards of a pumiceous igneous nature. In the Kannaviou Formation, smectite content may be as much as 75%. Contemporary engineering reports illustrate how dramatically the bentonite of the Moni Formation expands when exposed to the sub-aerial environment (Cottiss, 1984). 4.7 Vegetation 4.7.1 Lowlands
The lowland plains are semi-arid, due to the coincidence of the hot and the dry season, and the littoral zone is characterised by plants that can withstand appreciable drought, or high salt content in saline soils. Inland, great tracts of brushwood, heath, and thistles are common. Batha is a low (<1 m) scrub, dominated by Spiny Burnet and Thyme. Garrigue and Maquis are taller scrub (1-4 m high), the latter including low pine, oak and juniper.

44
4.7.2 Uplands
In lower valleys where open woodland survives, maple, popular, willow, alder and plane may still be found. The Troodos are renowned for being well–wooded with live oak and arbutus, as well as the almost exclusive stands of mature black pine (Pinus nigra pallasiana) at c.1250 – 1950 m elevation (Tsintides et al. 2002). 4.7.3 Deforestation
Deforestation is a particular consideration on steep slopes, disturbance reduces the soils organic store as well as biomass, and soil surface horizons may be lost within a decade (Furley, 1987). An example is the widespread gullying in the Rif Mountains of northern Morocco, associated with large-scale deforestation of areas upslope during the Spanish colonisation between 1926 and 1956 (van den Brink and Jungerius 1983). For Cyprus, there is some uncertainty about when deforestation may have first occurred and the environmental impact that might have ensued. Apart from fuel and domestic constructions, other demands included charcoal for smelting, supports for underground galleries in mines, in the sinking and lining of wells, and ship building. Some interpretations of Eratosthenes suggest that the entire island had once been covered by dense forest, which would be consistent with the former cedars of Lebanon. He claimed that forests covered the entire plains to 13 fathoms deep. Removal of vegetation eliminates the protection of interception of rainfall by the forest canopy, and exposes the ground to erosion by rainfall impact and surface runoff. Theophrastus warned of the dangers to soils and surface waters from deforestation in 2400-2300 BP. The removal of the leaf canopy, leaving bare ground exposed raindrop impact when forest is cut down, also applies to loss of crop cover in abandoned agricultural areas. This could have been a critical feature after the desertion of Parsata and explain the ‘badland’ appearance of its neighbourhood (Figure 4.7.1).

45
Figure 4.7.1. Northern gully is an example of the ‘badland’ below the Parsata hilltop.

46
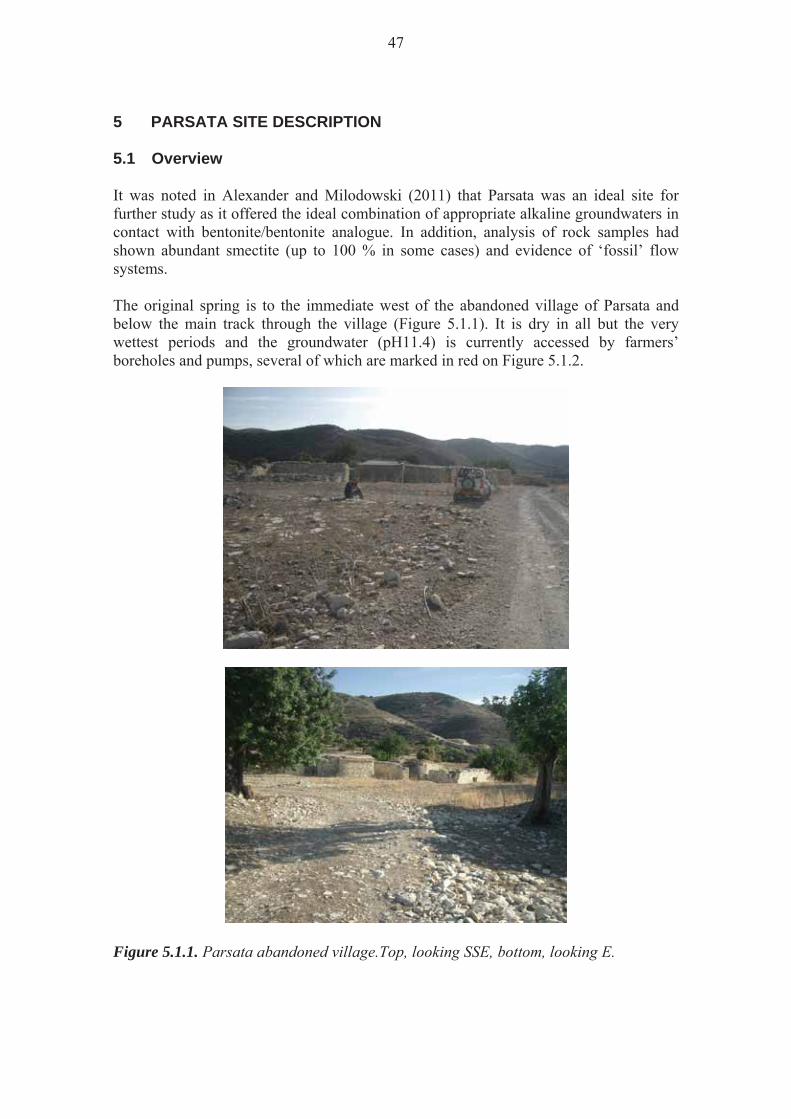
47
5 PARSATA SITE DESCRIPTION 5.1 Overview It was noted in Alexander and Milodowski (2011) that Parsata was an ideal site for further study as it offered the ideal combination of appropriate alkaline groundwaters in contact with bentonite/bentonite analogue. In addition, analysis of rock samples had shown abundant smectite (up to 100 % in some cases) and evidence of ‘fossil’ flow systems. The original spring is to the immediate west of the abandoned village of Parsata and below the main track through the village (Figure 5.1.1). It is dry in all but the very wettest periods and the groundwater (pH11.4) is currently accessed by farmers’ boreholes and pumps, several of which are marked in red on Figure 5.1.2.
Figure 5.1.1. Parsata abandoned village.Top, looking SSE, bottom, looking E.
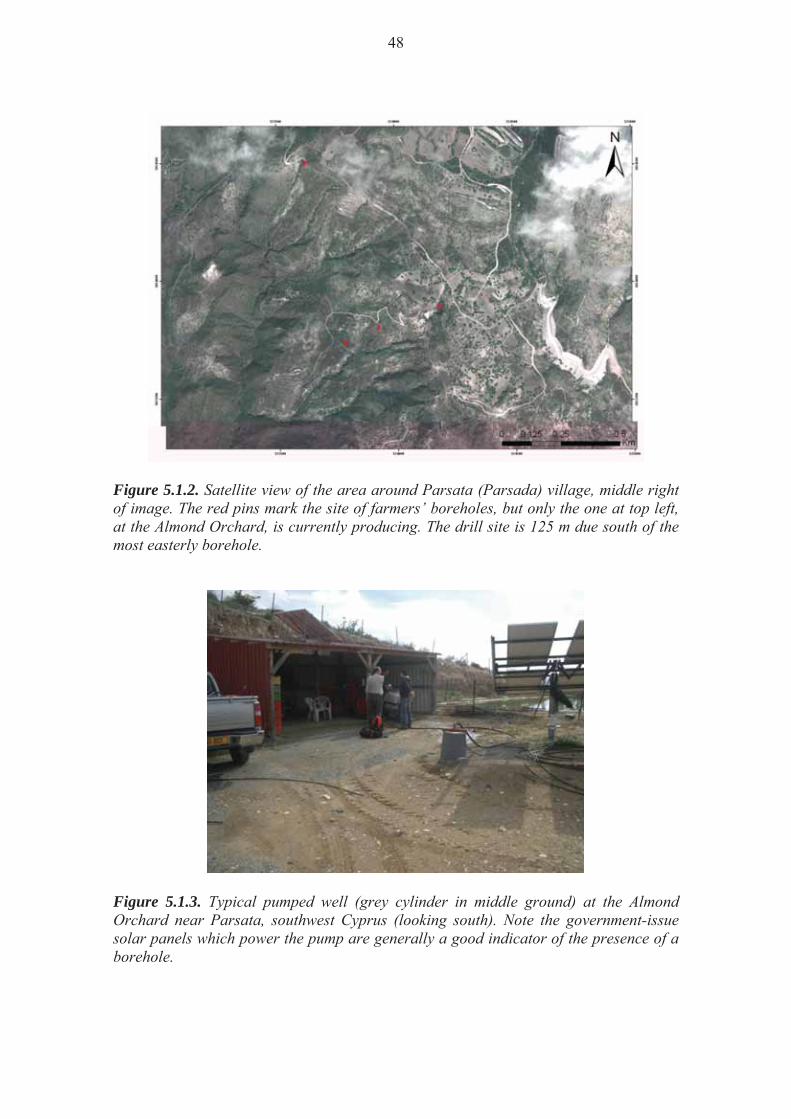
48
Figure 5.1.2. Satellite view of the area around Parsata (Parsada) village, middle right of image. The red pins mark the site of farmers’ boreholes, but only the one at top left, at the Almond Orchard, is currently producing. The drill site is 125 m due south of the most easterly borehole.
Figure 5.1.3. Typical pumped well (grey cylinder in middle ground) at the Almond Orchard near Parsata, southwest Cyprus (looking south). Note the government-issue solar panels which power the pump are generally a good indicator of the presence of a borehole.
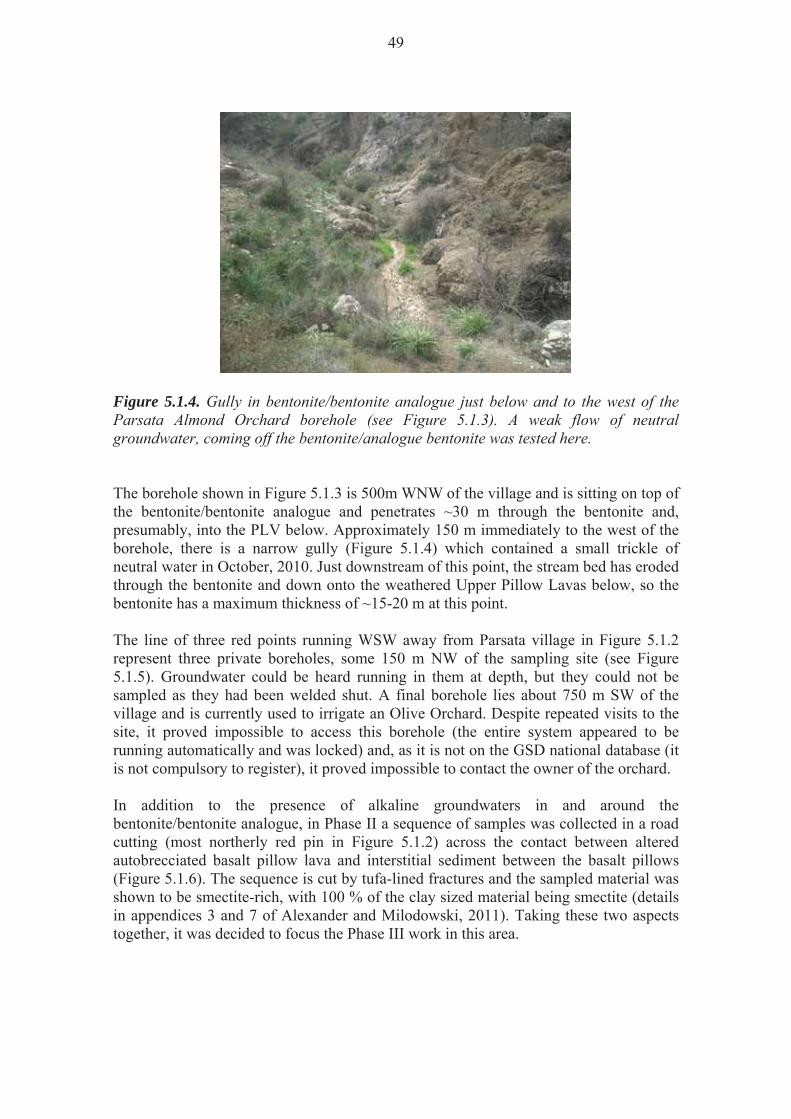
49
Figure 5.1.4. Gully in bentonite/bentonite analogue just below and to the west of the Parsata Almond Orchard borehole (see Figure 5.1.3). A weak flow of neutral groundwater, coming off the bentonite/analogue bentonite was tested here. The borehole shown in Figure 5.1.3 is 500m WNW of the village and is sitting on top of the bentonite/bentonite analogue and penetrates ~30 m through the bentonite and, presumably, into the PLV below. Approximately 150 m immediately to the west of the borehole, there is a narrow gully (Figure 5.1.4) which contained a small trickle of neutral water in October, 2010. Just downstream of this point, the stream bed has eroded through the bentonite and down onto the weathered Upper Pillow Lavas below, so the bentonite has a maximum thickness of ~15-20 m at this point. The line of three red points running WSW away from Parsata village in Figure 5.1.2 represent three private boreholes, some 150 m NW of the sampling site (see Figure 5.1.5). Groundwater could be heard running in them at depth, but they could not be sampled as they had been welded shut. A final borehole lies about 750 m SW of the village and is currently used to irrigate an Olive Orchard. Despite repeated visits to the site, it proved impossible to access this borehole (the entire system appeared to be running automatically and was locked) and, as it is not on the GSD national database (it is not compulsory to register), it proved impossible to contact the owner of the orchard. In addition to the presence of alkaline groundwaters in and around the bentonite/bentonite analogue, in Phase II a sequence of samples was collected in a road cutting (most northerly red pin in Figure 5.1.2) across the contact between altered autobrecciated basalt pillow lava and interstitial sediment between the basalt pillows (Figure 5.1.6). The sequence is cut by tufa-lined fractures and the sampled material was shown to be smectite-rich, with 100 % of the clay sized material being smectite (details in appendices 3 and 7 of Alexander and Milodowski, 2011). Taking these two aspects together, it was decided to focus the Phase III work in this area.

50
Figure 5.1.5. Capped borehole on edge of valley immediately below and west of Parsata village. Another two boreholes follow on a straight line towards the valley bottom (cf. Figure 5.1.2).
Figure 5.1.6. A sequence of samples was collected across autobreccia and associated samples to the NW of Parsata village.
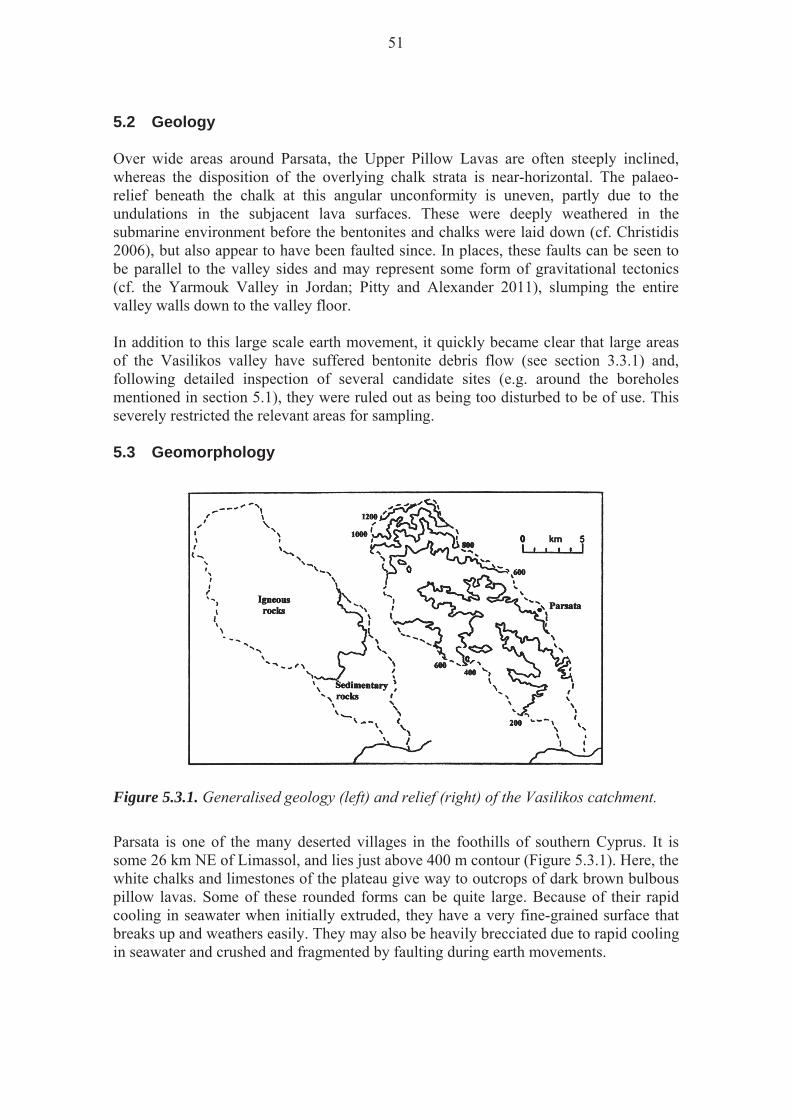
51
5.2 Geology Over wide areas around Parsata, the Upper Pillow Lavas are often steeply inclined, whereas the disposition of the overlying chalk strata is near-horizontal. The palaeo-relief beneath the chalk at this angular unconformity is uneven, partly due to the undulations in the subjacent lava surfaces. These were deeply weathered in the submarine environment before the bentonites and chalks were laid down (cf. Christidis 2006), but also appear to have been faulted since. In places, these faults can be seen to be parallel to the valley sides and may represent some form of gravitational tectonics (cf. the Yarmouk Valley in Jordan; Pitty and Alexander 2011), slumping the entire valley walls down to the valley floor. In addition to this large scale earth movement, it quickly became clear that large areas of the Vasilikos valley have suffered bentonite debris flow (see section 3.3.1) and, following detailed inspection of several candidate sites (e.g. around the boreholes mentioned in section 5.1), they were ruled out as being too disturbed to be of use. This severely restricted the relevant areas for sampling. 5.3 Geomorphology
Figure 5.3.1. Generalised geology (left) and relief (right) of the Vasilikos catchment. Parsata is one of the many deserted villages in the foothills of southern Cyprus. It is some 26 km NE of Limassol, and lies just above 400 m contour (Figure 5.3.1). Here, the white chalks and limestones of the plateau give way to outcrops of dark brown bulbous pillow lavas. Some of these rounded forms can be quite large. Because of their rapid cooling in seawater when initially extruded, they have a very fine-grained surface that breaks up and weathers easily. They may also be heavily brecciated due to rapid cooling in seawater and crushed and fragmented by faulting during earth movements.

52
Figure 5.3.2. Central gully, looking upslope towards the Parsata hilltop (village just visible on the hill crest). The Parsata hilltop is close to the eastern watershed of the Vasilikos Valley, where a couple of headwater ravines to one of its tributaries begin. Although streamflow only occurs here intermittently in winter, these two ravines are the site of active erosion, with incised valley sides as steep as 36o (Figure 5.3.3). The flanks of the upper reaches of the northern ravine expose bare chalk (Figure 4.8.1). In contrast, between the two ravines, there is the dry Central gully, with its gently concave floor, where olives trees are well established (Figure 5.3.2). Based on tree girth and estimated growth rates, some of these olive trees have been established for generations (Figure 5.3.4). A striking feature of the southern ravine is the knickpoint in its channel floor. This is a locally steeper reach or waterfall marking the point reached by regressive erosion (Figure 5.3.5), achieved by a ‘hosepipe’ effect when an occasional flood jets water on to the channel floor below. Channel incision accelerates erosion at the foot of valley-side slopes, a feature referred to as parallel retreat of slopes. Exposure of the roots of mature olive trees on the ridge confirms that parallel retreat has been significant, remains currently active, and that the recent incision may postdate the time when the grove was well-established (Figure 5.3.6). The interfluve on the left bank of the ravine also suggests active erosion. Here, the remnants of a former bench, capped by a resistant stratum, survive as a miniature but conspicuous, flat-topped butte (Figure 5.3.5).
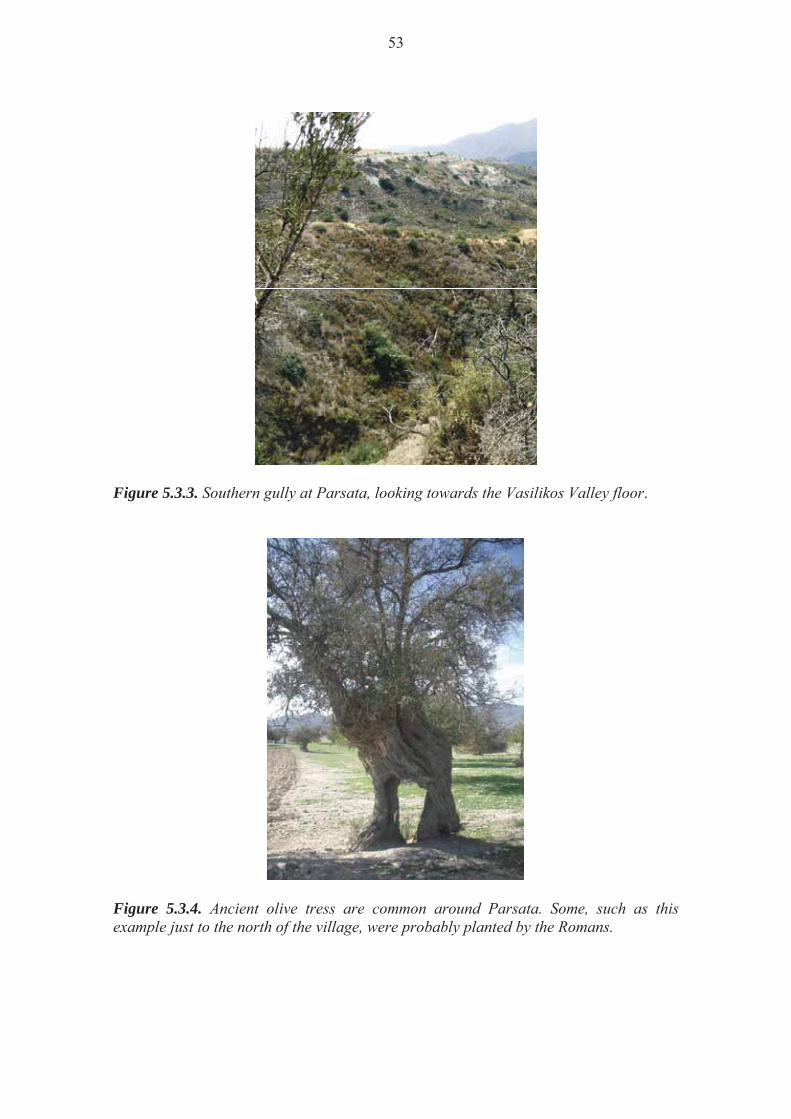
53
Figure 5.3.3. Southern gully at Parsata, looking towards the Vasilikos Valley floor.
Figure 5.3.4. Ancient olive tress are common around Parsata. Some, such as this example just to the north of the village, were probably planted by the Romans.
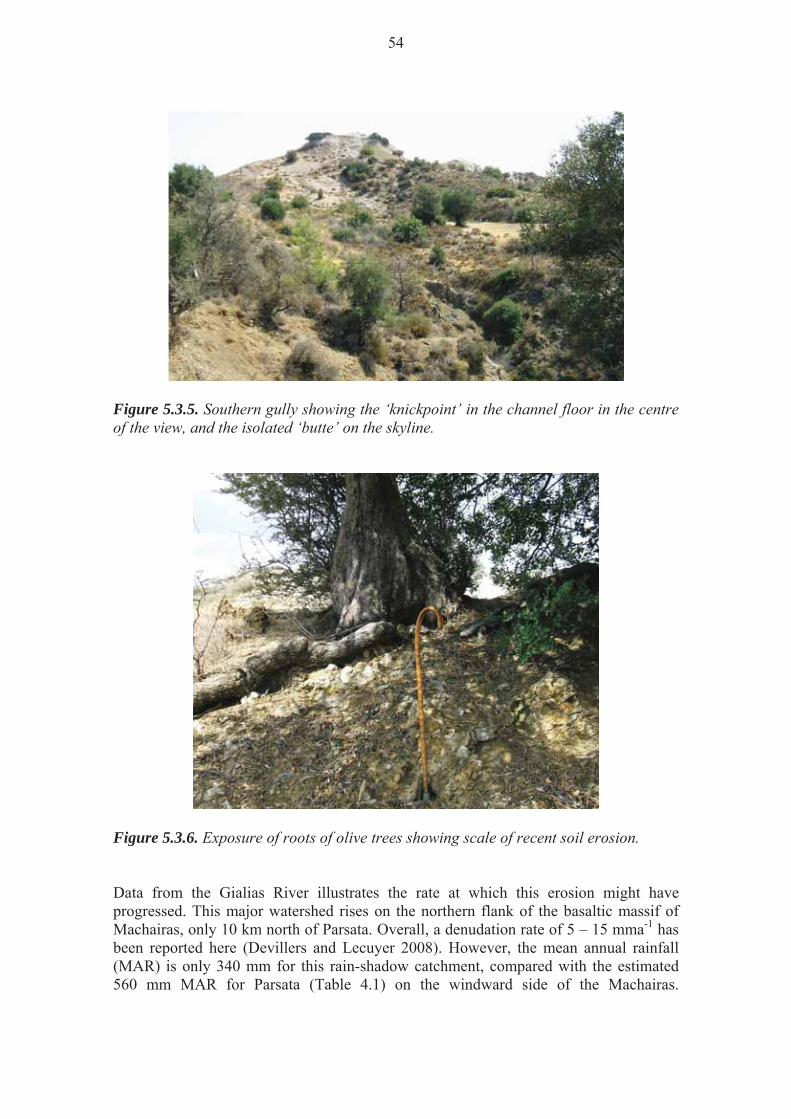
54
Figure 5.3.5. Southern gully showing the ‘knickpoint’ in the channel floor in the centre of the view, and the isolated ‘butte’ on the skyline.
Figure 5.3.6. Exposure of roots of olive trees showing scale of recent soil erosion. Data from the Gialias River illustrates the rate at which this erosion might have progressed. This major watershed rises on the northern flank of the basaltic massif of Machairas, only 10 km north of Parsata. Overall, a denudation rate of 5 – 15 mma-1 has been reported here (Devillers and Lecuyer 2008). However, the mean annual rainfall (MAR) is only 340 mm for this rain-shadow catchment, compared with the estimated 560 mm MAR for Parsata (Table 4.1) on the windward side of the Machairas.
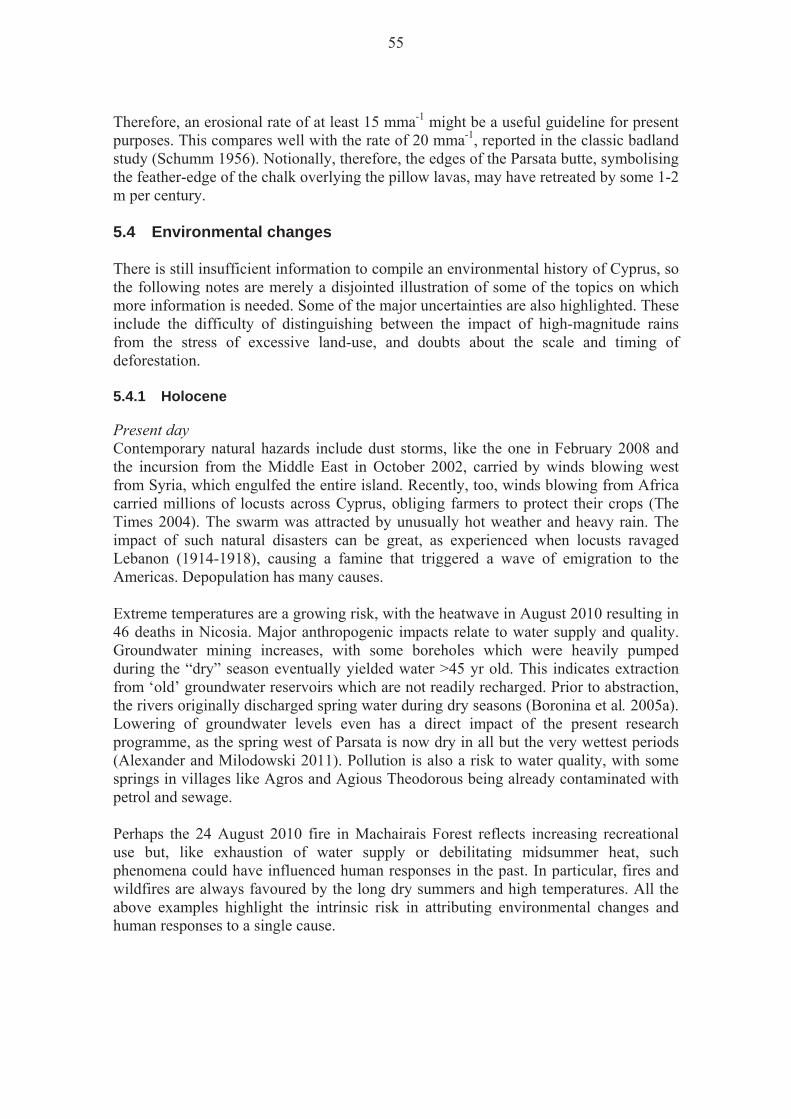
55
Therefore, an erosional rate of at least 15 mma-1 might be a useful guideline for present purposes. This compares well with the rate of 20 mma-1, reported in the classic badland study (Schumm 1956). Notionally, therefore, the edges of the Parsata butte, symbolising the feather-edge of the chalk overlying the pillow lavas, may have retreated by some 1-2 m per century. 5.4 Environmental changes There is still insufficient information to compile an environmental history of Cyprus, so the following notes are merely a disjointed illustration of some of the topics on which more information is needed. Some of the major uncertainties are also highlighted. These include the difficulty of distinguishing between the impact of high-magnitude rains from the stress of excessive land-use, and doubts about the scale and timing of deforestation. 5.4.1 Holocene
Present day Contemporary natural hazards include dust storms, like the one in February 2008 and the incursion from the Middle East in October 2002, carried by winds blowing west from Syria, which engulfed the entire island. Recently, too, winds blowing from Africa carried millions of locusts across Cyprus, obliging farmers to protect their crops (The Times 2004). The swarm was attracted by unusually hot weather and heavy rain. The impact of such natural disasters can be great, as experienced when locusts ravaged Lebanon (1914-1918), causing a famine that triggered a wave of emigration to the Americas. Depopulation has many causes. Extreme temperatures are a growing risk, with the heatwave in August 2010 resulting in 46 deaths in Nicosia. Major anthropogenic impacts relate to water supply and quality. Groundwater mining increases, with some boreholes which were heavily pumped during the “dry” season eventually yielded water >45 yr old. This indicates extraction from ‘old’ groundwater reservoirs which are not readily recharged. Prior to abstraction, the rivers originally discharged spring water during dry seasons (Boronina et al. 2005a). Lowering of groundwater levels even has a direct impact of the present research programme, as the spring west of Parsata is now dry in all but the very wettest periods (Alexander and Milodowski 2011). Pollution is also a risk to water quality, with some springs in villages like Agros and Agious Theodorous being already contaminated with petrol and sewage. Perhaps the 24 August 2010 fire in Machairais Forest reflects increasing recreational use but, like exhaustion of water supply or debilitating midsummer heat, such phenomena could have influenced human responses in the past. In particular, fires and wildfires are always favoured by the long dry summers and high temperatures. All the above examples highlight the intrinsic risk in attributing environmental changes and human responses to a single cause.

56
20th Century Many contemporary changes had already been evident in the last century. For instance, groundwater resources in sedimentary strata are becoming sporadic. Of 73 boreholes drilled for irrigation in the1970-1990s, 70 % were unsuccessful (Boronina et al., 2005a). Also, seasonal changes in spring flow became no longer systematic, depending rather on pumping regime. A worldwide feature which complicates the study of fluvial processes became apparent after 1952-60, when reservoir construction began. This not just traps silt, but results in inevitable stream incision downvalley, as the sediment-free overspill water takes up bedload from channel floors. This explains why a sediment plume from the now dammed River Kouris can still be observed offshore. Global trends in climate change became apparent, too. In Nicosia, average annual temperatures in increased from 18.9 oC, in the first 30-year period of the 20th C, to 19.7o in the last 30 years, with a very severe heat wave in August 1998. Precipitation has decreased by an average of 1 mma-1, mainly during the second half of the century, due to an increase in the number of years with below-average precipitation and droughts, amounting to a decrease of 17% in the last 30 years. Large-scale quarrying of serpentinite went on at Pano Amiandos throughout most of the 20th C, a reminder of the millennia of exploitation of the island’s mineral wealth. So was the short-lived railway era (1922-1952), where an extension was designed to carry firewood from the Troodos foothills to the copper mine at Skouriotissa (Lee and Lee, 1973). At least the avenue of eucalyptus trees, planted to protect rolling stock from the sun, demonstrates greater awareness of afforestation which was a positive feature of the British colonial era. The invasion of the island in the 20th C sounds like an emphatic echo of its past. It is important, for present purposes, to reiterate that much of past changes in Cyprus, in so many ways, are observable at the present. The Little Ice Age (LIA) The LIA is known as a cool and humid climatic period, between the mid-16th to mid 19th C. It was linked largely with the ‘North Atlantic Oscillation’ (NAO (Bond et al. 1992), and was characterised by increased fluvial activity and flood frequency. In Cyprus, this episode also coincides with increased agricultural activity, and a link between fluvial changes and land-use variability was identified in Gialias watershed near Potamia village (Devillers and Lecuyer 2008). As there was a decrease in flash floods of a semi-arid climate, the higher sedimentation rates are due to the larger number of temperate-climate floods. The Gialias River is a major watershed in Cyprus, with a MAR of 340 mm. Here, excavations at Paleomylos mill, which operated during the French Lusignan period 1190-1480 AD, revealed that sedimentation accelerated greatly between 16th and 18th C (Ottoman period, 1570-1870). Also, a greater proportion of sediments from the upper basin were transported downstream during the LIA (Devillers and Lecuyer, 2008). Overall, the impact was a denudation rate of 5-15 mma-1, based on terrace materials some 7 m thick accumulating at a mill in the historic period after its abandonment in the 14th C. The effect of the cooler, more humid environment of the LIA in Cyprus is not, however, readily translated into human impact because of additional factors, mainly the abandonment of villages (Grivaud 1998). This peaked at the end of the Venetian period
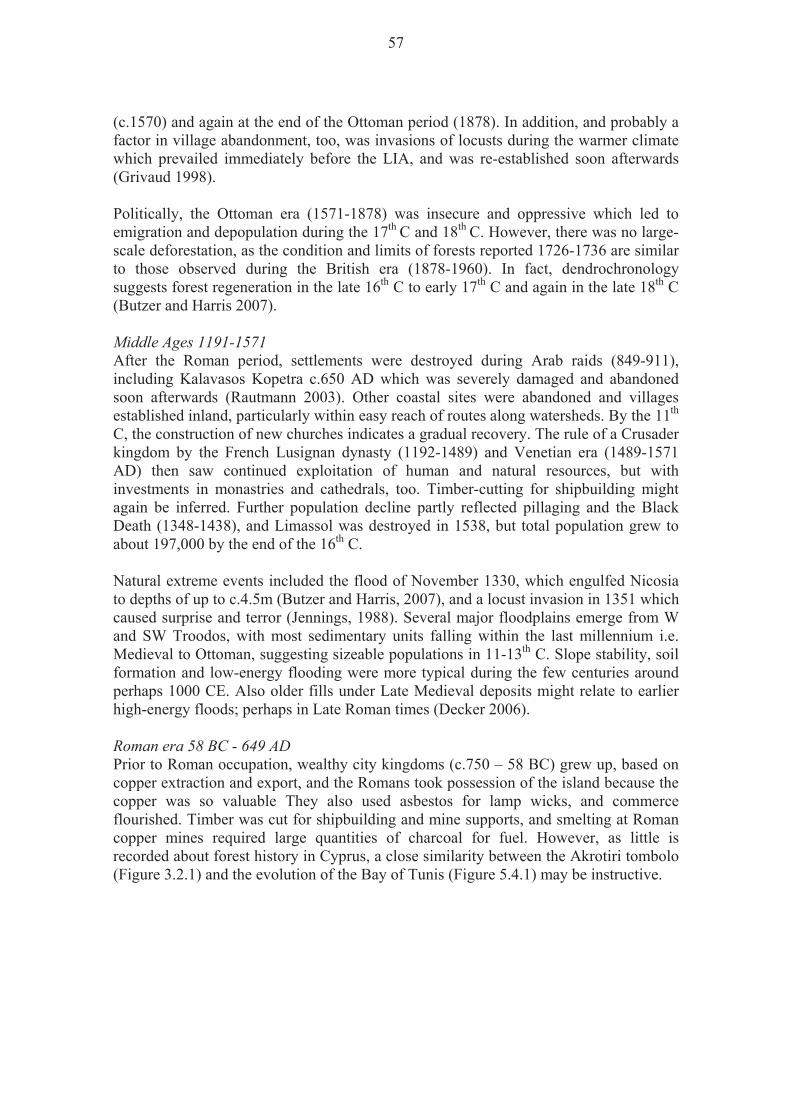
57
(c.1570) and again at the end of the Ottoman period (1878). In addition, and probably a factor in village abandonment, too, was invasions of locusts during the warmer climate which prevailed immediately before the LIA, and was re-established soon afterwards (Grivaud 1998). Politically, the Ottoman era (1571-1878) was insecure and oppressive which led to emigration and depopulation during the 17th C and 18th C. However, there was no large-scale deforestation, as the condition and limits of forests reported 1726-1736 are similar to those observed during the British era (1878-1960). In fact, dendrochronology suggests forest regeneration in the late 16th C to early 17th C and again in the late 18th C (Butzer and Harris 2007). Middle Ages 1191-1571 After the Roman period, settlements were destroyed during Arab raids (849-911), including Kalavasos Kopetra c.650 AD which was severely damaged and abandoned soon afterwards (Rautmann 2003). Other coastal sites were abandoned and villages established inland, particularly within easy reach of routes along watersheds. By the 11th C, the construction of new churches indicates a gradual recovery. The rule of a Crusader kingdom by the French Lusignan dynasty (1192-1489) and Venetian era (1489-1571 AD) then saw continued exploitation of human and natural resources, but with investments in monastries and cathedrals, too. Timber-cutting for shipbuilding might again be inferred. Further population decline partly reflected pillaging and the Black Death (1348-1438), and Limassol was destroyed in 1538, but total population grew to about 197,000 by the end of the 16th C. Natural extreme events included the flood of November 1330, which engulfed Nicosia to depths of up to c.4.5m (Butzer and Harris, 2007), and a locust invasion in 1351 which caused surprise and terror (Jennings, 1988). Several major floodplains emerge from W and SW Troodos, with most sedimentary units falling within the last millennium i.e. Medieval to Ottoman, suggesting sizeable populations in 11-13th C. Slope stability, soil formation and low-energy flooding were more typical during the few centuries around perhaps 1000 CE. Also older fills under Late Medieval deposits might relate to earlier high-energy floods; perhaps in Late Roman times (Decker 2006). Roman era 58 BC - 649 AD Prior to Roman occupation, wealthy city kingdoms (c.750 – 58 BC) grew up, based on copper extraction and export, and the Romans took possession of the island because the copper was so valuable They also used asbestos for lamp wicks, and commerce flourished. Timber was cut for shipbuilding and mine supports, and smelting at Roman copper mines required large quantities of charcoal for fuel. However, as little is recorded about forest history in Cyprus, a close similarity between the Akrotiri tombolo (Figure 3.2 ) and the evolution of the Bay of Tunis (Figure 5. ) may be instructive.
58
Figure 5. . . The Holocene evolution of a coastal lagoon, Lake of Tunis, illustrating the scale and chain reaction of environmental repercussions from human impact (after Pitty 1984). Originally, Akrotiri was a small number of low-lying offshore islands, of which the two capes are relicts. These became a tombolo – a tied island – as the islands were gradually joined by a pebble and sand spit linked to the cliffs near Episkopi. The Limassol side of the bay then became a bay sheltered from westerly winds and wave action. Maps of Cyprus, dating from the 16thC and 17thC, show the salt lake as a lagoon, still open to the east, before its closure over the past 400 years. In the case of coastal lowlands of Tunisia (Figure 5. ), a chain reaction of accelerated erosion began after the Romans had defeated the Carthaginians in North Africa in 146 BC. Deforestation in the Medjerda watershed accelerated denudation which then caused delta progradation. This supply of sand then increased longshore drift which eventually obscured the peninsula on which Carthage had been built. By about the 5th C AD, barrier spits began to develop and by the 16th C a barrier bar completely sealed the lagoon. The similarity between these two histories might suggest that, as in Tunisia, increased sediment flux, due to deforestation of watersheds, was very significant in southern Cyprus during the Roman era, and lagged into later times. Pre-Roman times In early prehistoric (Neolithic) times (c.8.8 – 3.8 ka) economies were too localised to affect fluvial activities and to cause agropastoral damage (Butzer and Harris 2007). However, by the Bronze and Iron Ages (ca. 3800-750 BC) almost pure bands of copper and iron pyrites were mined as early as 3000 BC. Their export brought great wealth to the island. Some of the ores were smelted on the spot in primitive furnaces burning wood and charcoal, suggesting appreciable impact. More locally, the Lower Vasilikos Valley, to the south of Parsata, has been the site of long standing archaeological research (Todd 1989). The two units of flood siltstone which rest on igneous cobble gravels include a charcoal date of 5300 B.C. which falls within the Aceramic Neolithic (Gomez 1987) which may reflect Neolithic disturbance. At Dhali-Potamia, beyond confines of the Troodos, at junction of the Gialias and
59
Alykos rivers, 3 Holocene fills totalling 8 m have been attributed to accelerated erosion. Alluviation ceased with depopulation at end of Bronze Age, but then briefly resumed. Conclusions Over the last few thousand years the energy expended by people and their technologies has been a significant ‘abrupt’ event in accelerating denudation. However, dating such impacts is imprecise, partly because denudation does not accelerate instantly. Equally, the transport of the greater sediment yields may be halted for long periods between extreme events. The Cyprus environment has impacted by human attrition rather than devastation, with long intervals of partial ecological recovery, followed by periods of pressure on land use and resources, of which the present-day is a clear example. This impression compares well with land use in Morocco, where an earlier Roman phase of deforestation and soil erosion was followed by restoration of woodland (van den Brink and Jungerius 1983). 5.4.2 Quaternary
Distinctively, Cyprus was well beyond the limits of Quatenary glaciation, but the climate was much wetter. This generally positive reconstruction of the hydrological balance agrees with postulated more southerly position of the jet stream, and the associated westerlies, during glacial maxima (Prentice at al. 1992). Heavier rainfall, combined with continuing uplift of the Troodos, gave the rivers extra power to dissect and erode the mountain mass more effectively. This impression is supported by geo-archaeological field studies which suggest that most of the slope and stream deposits in Cyprus are of Quaternary age (Butzer and Harris 2007). By Late Quaternary time, erosion was exceeding deposition in peripheral areas around the margin of the massif, resulting in progressive downcutting into the sedimentary valley fills. Late Quaternary The Northern Hemisphere deglaciation began between 19 and 20 ka (Clark et al. 2009), but the subsequent Interglacial, the Holocene, was not established until 10 ka. Valley-floor sediments of the Vasilikos River, just 5 km S of Parsata, suggests greater denudation during a wetter period in latest Pleistocene times (Gomez, 1987). Here, coarse unsorted debris funnels out on to alluvial terraces from tributary valleys, like the Parsata headwater drainage (Figures 3.3.3 and 3.3.4). Last Glacial Maximum (LGM) Like many climate-related issues, the LGM was a very complex system, relating fundamentally to the strength of the Earth’s orbital frequencies. These vary with time, being 41 ka for obliquity, 23 ka and 19 ka for precessions, and 100ka for eccentricity. The greatest extent of nearly all LGM ice sheets corresponded to a minimum in these astronomical forcing functions, and was greatest from 26.5 ka to 19-20 ka. (Clark et al. 2009). Precipitation variability was controlled, like today, by Mediterranean cyclonic disturbances. A more southerly position of the jet stream and the associated westerlies is postulated, leading to relatively wet conditions in the Mediterranean area. (Kwiecien et al. 2009).
60
Penultimate Interglacial The combination of high-precision U-series dating of corals with eustatic sea-level models indicates the Penultimate Interglacial period occurred from at least 130 to 117 ka (Stirling et al. 1995). Climatically, this comparatively brief period would have been similar to the present-day, but is too far back in time to have left any discernible imprint. With the higher temperatures, however, greater mineralisation of groundwaters might be envisaged. Cooler transition periods The last clearly discernible geomorphological changes in the Parsata area are the deposition and lobe switching of the alluvial fans at Valisko. These have been dated at a time about midway between the LGM and the Last Interglacial. Waters et al. (2010) equate the deposition of conglomerates and open-framework gravels to increased river discharge during wetter summers, and attribute this change to increased activity of west Mediterranean depressions. The explanation offered for this slight climate change is that it coincides with a precession minima. Spelothems in Israel caves also reveal wetter climatic conditions at precession mimima (Bar-Mathews et al. 2000). Precession is the change in the orientation axis of a rotating body, like the Earth, which completes a gyration approximately every 26k yr. During this cycle, the amount of solar energy received in the Northern Hemisphere varies, depending on whether the orbiting Earth’s axis points towards, or away from, the Sun. . Probably all that might be surmised for geohydrological conditions at this transition time relates to glacial maxima and interglacials being comparatively short periods of Quaternary time. Longer periods of slightly cooler periods must have persisted in which, inevitably, damper conditions prevailed simply because evapotranspiration.was reduced and effective precipitation increased. Earlier Quaternary Some of the fluvial features of the northern flank of the Troodos (Figure 3.13) appear to be early Quaternary age. The bedrock channels have changed their sinuous and entrenched channel configurations very slowly (Butzer and Harris 2007). The Karyotis tectonic valley was once a major channel from the core of the Troodos to the sea. Early Quaternary sediments then accumulated in and beyond such valleys, notably the thick and extensive alluvial fans of the ‘Fanglomerate Group’ (Poole and Robertson 1991). The scale of these fans is evident today near Orounda, where about 30 m of clast-supported gravels are exposed on Peristerona valley side, some 45 m above the present-day channel. Streams developed on this Fanglomerate surface in a northwesterly direction, with knickpoints indicating three stages of incision. The river then cut due north across the inclination of the fan, but following an old fault line in the Troodos basement (Butzer and Harris 2007). With the reworking of the Fanglomerate clasts, terraces and channel fans were formed. These include a cobble lag near the town of Peristerona and an extensive valley fan. This now forms a 6-8 m alluvial terrace, similar to those at Kikitari and in the Karyotis Valley.
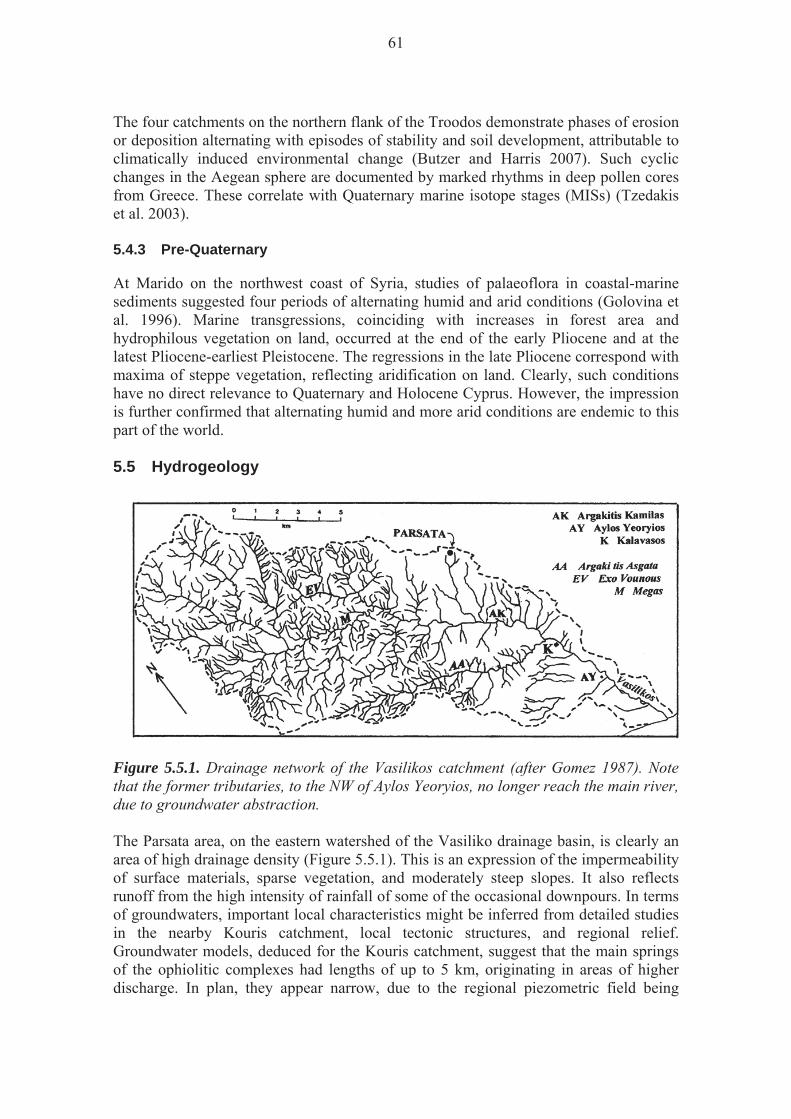
61
The four catchments on the northern flank of the Troodos demonstrate phases of erosion or deposition alternating with episodes of stability and soil development, attributable to climatically induced environmental change (Butzer and Harris 2007). Such cyclic changes in the Aegean sphere are documented by marked rhythms in deep pollen cores from Greece. These correlate with Quaternary marine isotope stages (MISs) (Tzedakis et al. 2003). 5.4.3 Pre-Quaternary
At Marido on the northwest coast of Syria, studies of palaeoflora in coastal-marine sediments suggested four periods of alternating humid and arid conditions (Golovina et al. 1996). Marine transgressions, coinciding with increases in forest area and hydrophilous vegetation on land, occurred at the end of the early Pliocene and at the latest Pliocene-earliest Pleistocene. The regressions in the late Pliocene correspond with maxima of steppe vegetation, reflecting aridification on land. Clearly, such conditions have no direct relevance to Quaternary and Holocene Cyprus. However, the impression is further confirmed that alternating humid and more arid conditions are endemic to this part of the world. 5.5 Hydrogeology
Figure 5.5.1. Drainage network of the Vasilikos catchment (after Gomez 1987). Note that the former tributaries, to the NW of Aylos Yeoryios, no longer reach the main river, due to groundwater abstraction. The Parsata area, on the eastern watershed of the Vasiliko drainage basin, is clearly an area of high drainage density (Figure 5.5.1). This is an expression of the impermeability of surface materials, sparse vegetation, and moderately steep slopes. It also reflects runoff from the high intensity of rainfall of some of the occasional downpours. In terms of groundwaters, important local characteristics might be inferred from detailed studies in the nearby Kouris catchment, local tectonic structures, and regional relief. Groundwater models, deduced for the Kouris catchment, suggest that the main springs of the ophiolitic complexes had lengths of up to 5 km, originating in areas of higher discharge. In plan, they appear narrow, due to the regional piezometric field being
62
controlled by river valleys. In addition, conduit flow may feature, too, as the Loumata springs in harzburgites have a different hydrochemistry, although less than 200 m apart (Boronina et al. 2005b). In the Parsata area, the apparently close relation between E and NE-trending faults and the ore bodies in the Kalavasos mine suggests that the fractures acted as natural conduits for the mineralising fluids from depth (Greensmith 1998). Groundwaters, therefore, might be assumed to follow a similar direction, particularly since Quaternary deformation has been dominated by strike-slip faults along NE and NW trends (Harrison et al. 2004). Finally, since the Parsata area is remote from the Troodos Forest massif, and separated from it by a col and lower ground, groundwater recharge may well come from the adjacent Machairas Forest uplands (although deeper groundwaters may be controlled by the ATF). 5.6 Discussion Three phases in the interaction between tectonic uplift and denudation have been suggested from extensive data collections in Japan. Yoshikawa (1985) suggests that initially uplift exceeds denudation, and then the two forces are approximately in balance. Finally, denudation prevails. Thus, it can be argued hypothetically that, if uplift of Taiwan ceased now, the island would be leveled within 0.5 Ma. In Cyprus, four phases of geomorphic activity can be recognized during the past 2 Ma:
first, weathering of a recently emerged land mass began. This was a prolonged phase, as the ferromagnetic minerals, when eventually exposed, were altered and oxidized only slowly. With further in-situ weathering and soil formation, haematite was then formed (Weber et al. 2011). This probably accounts for the reddish colour of reworked soils, regolith and debris that accumulated later in lower valley locations on the northern flank of the Troodos
second, with continued uplift, radial drainage patterns and fault-guided channels
began to develop on the central dome of the Troodos. Fluvial incision then advanced along these drainage lines by knickpoint recession. This mechanism is evident at the deep bedrock knickpoint in the Atsas valley near Ayios Theodoros. A rate of long-term knickpoint recession has been accurately calculated for the 100 m thick Cover Basalt in the Yarmouk Valley in northern Jordan at 18 mka-1 (Pitty, 1998). For several reasons, it could be justifiable to apply this rate to the Troodos dome. Taking an average distance of drainage of 15 km from its crest to the southern boundary of the Mesaoria Basin, suggests that incision could have reached the core by about 0.8 Ma ago. In some locations, such knickpoint retreats may be attributed to the periodic falls in sea level by as much as 150 m at glacial maxima, due to orbitally forced climate changes. At such times, too, it seems that Cyprus, in a cooler but extra-glacial environment, would have been dominated by snow accumulation on the mountains and by substantial snowmelt floods in spring.
third, knickpoint recession inevitably slows down, since stream incision
progressively reduces the catchment area of headstreams as it approaches a watershed. Concurrently, valley sides begin to enlarge, due to increasing
63
tributary stream action and by hillslope processes. Trunk valleys then become conduits for the storage and/or evacuation of huge volumes of sediment.
fourth, alluvial fans were dissected and valley-floor sediments incised, leaving
terrace flights. Evacuation of the sediment eroded may have been accelerated by human activity from the mid-Holocene onwards.
Due to limited chronological data, the controls on denudation by tectonic uplift, sea-level oscillations, and climate change are only partially understood (Kinnaird et al. 2011). Another uncertainty is the time lags that almost certainly elapse between inputs and responses. There is also a circular argument to accommodate, that uplift generates increased sediment yields and that, therefore, greater sedimentation rates are an indicator of accelerated uplift! Nonetheless, it remains possible to estimate when groundwaters around Mt Olympus might have begun to circulate. This would have been when knickpoint recession approached the core of the massif, towards the end of the second notional phase of geomorphic activity. This phase was preceded by a long period of in-situ weathering, and followed by another, in which huge volumes of sediment were deposited, weathered and reworked, and subsequently dissected. Therefore, intuitively, some midway point over the last 2 Ma might be inferred, such as the start of the Brunhes chron about 0.8 Ma ago, perhaps during a severe glacial maximum, or two. For Parsata, the situation is complicated by the presence of the Arakapas Transform Fault (ATF) just to the north of the site (Gass et al. 1994). There are unpublished hydrogeological data which suggest the ATF acts as some form of hydraulic barrier (C. Constantinou GSD, pers. com., February, 2009) between the Troodos Massif and the Parsata area. Alexander and Milodowski (2011) argue that this is discernible in the limited stable isotope data for the groundwaters, suggesting that the Parsata area is disconnected from the regional flow originating in the Troodos Massif. Otherwise, a similar argument to the Troodos groundwater flow initiation could apply to the original incision of the Vasilikos Valley in which Parsata sits, with valley widening a longer-term change, too. Here, the pillow lavas, epiclastics and bentonites/analogue bentonites are currently becoming more exposed, metre by metre. Deeper groundwater systems may have been initiated whilst the valley floor approached its present level, which is now some 260 m below the Parsasta hilltop. However, shallow-depth groundwaters could have been modified in more recent times, when effective precipitation was greater than today. Several episodes of groundwater recharge might be envisaged in the Parsata area, most recently during the cooler and damper conditions of the Little Ice Age mid-16th to mid-19th centuries (when the River Thames in London froze over). This had followed the lengthy Roman period 2-1.4 ka ago, when much effective precipitation was lost to runoff on deforested terrain, with groundwaters therefore depleted. Groundwater recharge was also probable during the Last Glacial Maximum. The northern watershed of the Machairas massif (Figure 3.2.1) is a ridge rather than a dome,
64
so there was little flatter ground on which snowfields might build up. The greater insolation on its south-facing flank, inclined towards Parsata, would also ensure that greater proportion of rain falling would infiltrate into the ground, instead of accumulating as snow and then runoff as snowmelt flood. The same argument applies to the long, cooler interval identified and dated at about 50-60 ka ago when the Vasiliko alluvial fans were deposited (Walters et al. 2010). The Parsata hilltop is at least 13 km inland and there is a local baselevel, just downvalley from Kalavasos, where the outcrop of the Lefkara Formation crosses the Vasilkos channel. Nonetheless, sea level changes and oscillations might have influenced groundwater regimes beneath the Parsata hilltop, with dewatering associated with sea-level fall. This would have been relatively abrupt during glacial maxima, and as recent as the Last Glacial Maximum c.20 ka ago. It could also have been on a large scale as local Mediterranean falls in sea level of as much as 150±10 m have been reported (Rabineau et al. 2006). In addition to glacio-eustatic changes in sea level, a long-term progressive fall in relative sea level is a feature of stretches of Cyprus coastlands, particularly near the focus of uplift in the Troodos. However, the highest marine terrace in the Limassol area is about 65 m asl, and an uplift rate of only 8 cm ka-1 over the last ca. 0.8 Ma is calculated (Kinnaird et al. 2011).
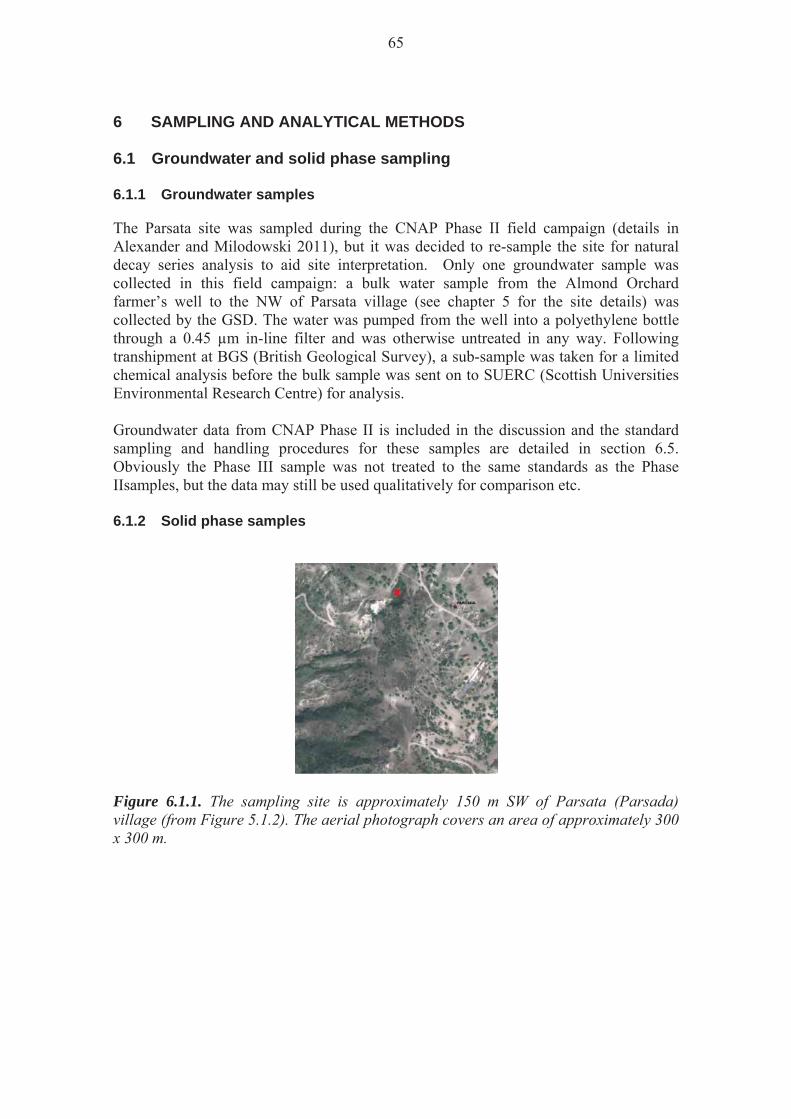
65
6 SAMPLING AND ANALYTICAL METHODS
6.1 Groundwater and solid phase sampling 6.1.1 Groundwater samples
The Parsata site was sampled during the CNAP Phase II field campaign (details in Alexander and Milodowski 2011), but it was decided to re-sample the site for natural decay series analysis to aid site interpretation. Only one groundwater sample was collected in this field campaign: a bulk water sample from the Almond Orchard farmer’s well to the NW of Parsata village (see chapter 5 for the site details) was collected by the GSD. The water was pumped from the well into a polyethylene bottle through a 0.45 μm in-line filter and was otherwise untreated in any way. Following transhipment at BGS (British Geological Survey), a sub-sample was taken for a limited chemical analysis before the bulk sample was sent on to SUERC (Scottish Universities Environmental Research Centre) for analysis. Groundwater data from CNAP Phase II is included in the discussion and the standard sampling and handling procedures for these samples are detailed in section 6.5. Obviously the Phase III sample was not treated to the same standards as the Phase IIsamples, but the data may still be used qualitatively for comparison etc. 6.1.2 Solid phase samples
Figure 6.1.1. The sampling site is approximately 150 m SW of Parsata (Parsada) village (from Figure 5.1.2). The aerial photograph covers an area of approximately 300 x 300 m.

66
Figure 6.1.2. Parsata sampling site: the area was partially leveled for rig access. The sampling site (Figure 6.1.1) was first cleared and partially leveled for rig access with a bulldozer (Figure 6.1.2) before solid phase samples were collected by a combination of drilling (rock chip logging and coring) and trenching. In the former, the mobile rig and associated support equipment of Geoinvest Ltd (Nicosia, Cyprus; www.geoinvest-cy.org/index.html) was used on site to drill four boreholes (Figure 6.1.3). Drilling was with air to avoid disturbing any geochemical signatures in the bentonite/analogue bentonite and the majority of samples were collected as rock chips during venting of the returned air from the borehole neck. When an interesting feature was encountered, coring was employed (Figure 6.1.4), but this could only be for a short duration due to overheating and complete loss of the downhole equipment. The full core logs are presented in appendix 1.
Figure 6.1.3. Geoinvest’s mobile drilling rig and support vehicle on-site at Parsata.

67
Figure 6.1.4. Bentonite/analogue bentonite core material from the boreholes at Parsata. Note Swiss Army Knife for scale is approximately 10 cm long. Once target horizons had been identified by the drilling, a JCB mechanical digger with backhoe then dug a sampling trench (Figure 6.1.5) for more detailed investigations and sampling by hand. 6.1.3 Description of the lithological profile from the trench
As described above, most of the material from the four boreholes was recovered as fragmented drill cuttings, with only very limited and short lengths of core. The core samples that were recovered were also highly deformed and distorted by the drilling process. Consequently, the boreholes could not provide a detailed picture of the lithological characteristics of the bentonitic sedimentary sequence. However, the profile exposed in the Parsata trench enabled the lithlogical variation, and sedimentological, fracturing and alteration fabrics of the sequence to be examined in detail (Figure 6.1.6). A summary of the lithological sequence in the trench is illustrated in Figure 6.1.7, and described in detail below.
Figure 6.1.5. A JCB mechanical digger excavated a trench at the site of Parsata borehole 3 (see appendix 1). The full trench log is presented in appendix 2.
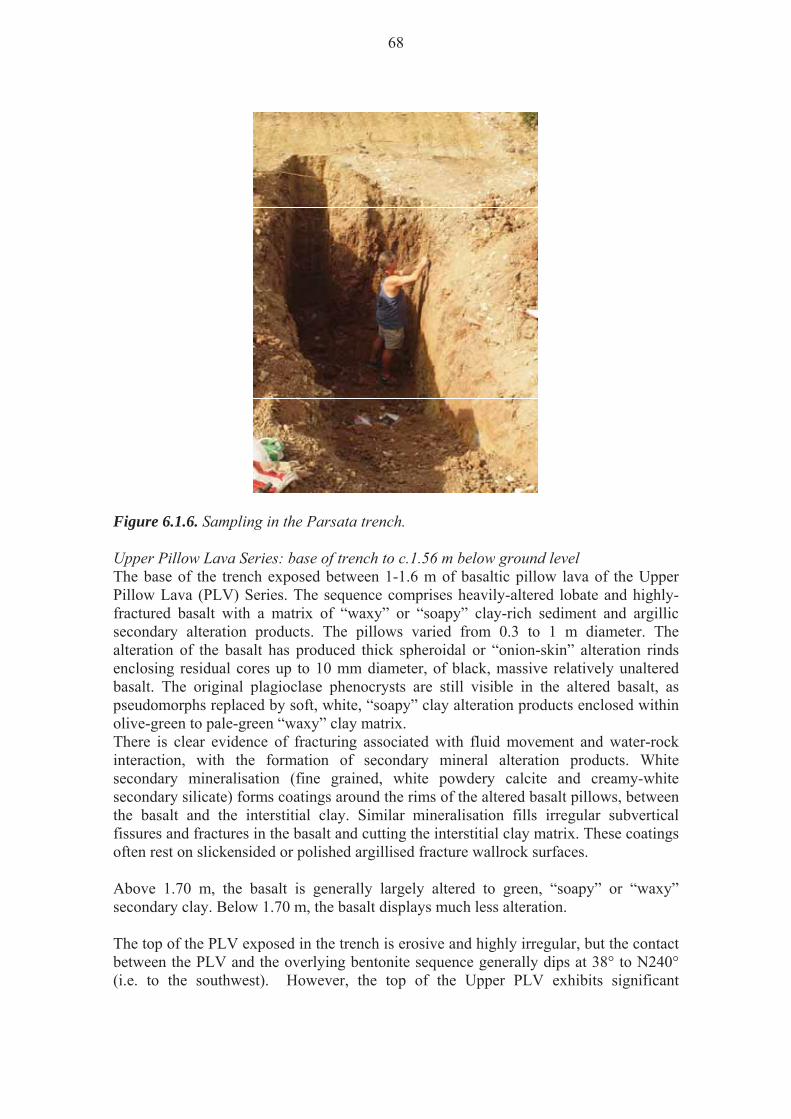
68
Figure 6.1.6. Sampling in the Parsata trench. Upper Pillow Lava Series: base of trench to c.1.56 m below ground level The base of the trench exposed between 1-1.6 m of basaltic pillow lava of the Upper Pillow Lava (PLV) Series. The sequence comprises heavily-altered lobate and highly-fractured basalt with a matrix of “waxy” or “soapy” clay-rich sediment and argillic secondary alteration products. The pillows varied from 0.3 to 1 m diameter. The alteration of the basalt has produced thick spheroidal or “onion-skin” alteration rinds enclosing residual cores up to 10 mm diameter, of black, massive relatively unaltered basalt. The original plagioclase phenocrysts are still visible in the altered basalt, as pseudomorphs replaced by soft, white, “soapy” clay alteration products enclosed within olive-green to pale-green “waxy” clay matrix. There is clear evidence of fracturing associated with fluid movement and water-rock interaction, with the formation of secondary mineral alteration products. White secondary mineralisation (fine grained, white powdery calcite and creamy-white secondary silicate) forms coatings around the rims of the altered basalt pillows, between the basalt and the interstitial clay. Similar mineralisation fills irregular subvertical fissures and fractures in the basalt and cutting the interstitial clay matrix. These coatings often rest on slickensided or polished argillised fracture wallrock surfaces. Above 1.70 m, the basalt is generally largely altered to green, “soapy” or “waxy” secondary clay. Below 1.70 m, the basalt displays much less alteration. The top of the PLV exposed in the trench is erosive and highly irregular, but the contact between the PLV and the overlying bentonite sequence generally dips at 38° to N240° (i.e. to the southwest). However, the top of the Upper PLV exhibits significant
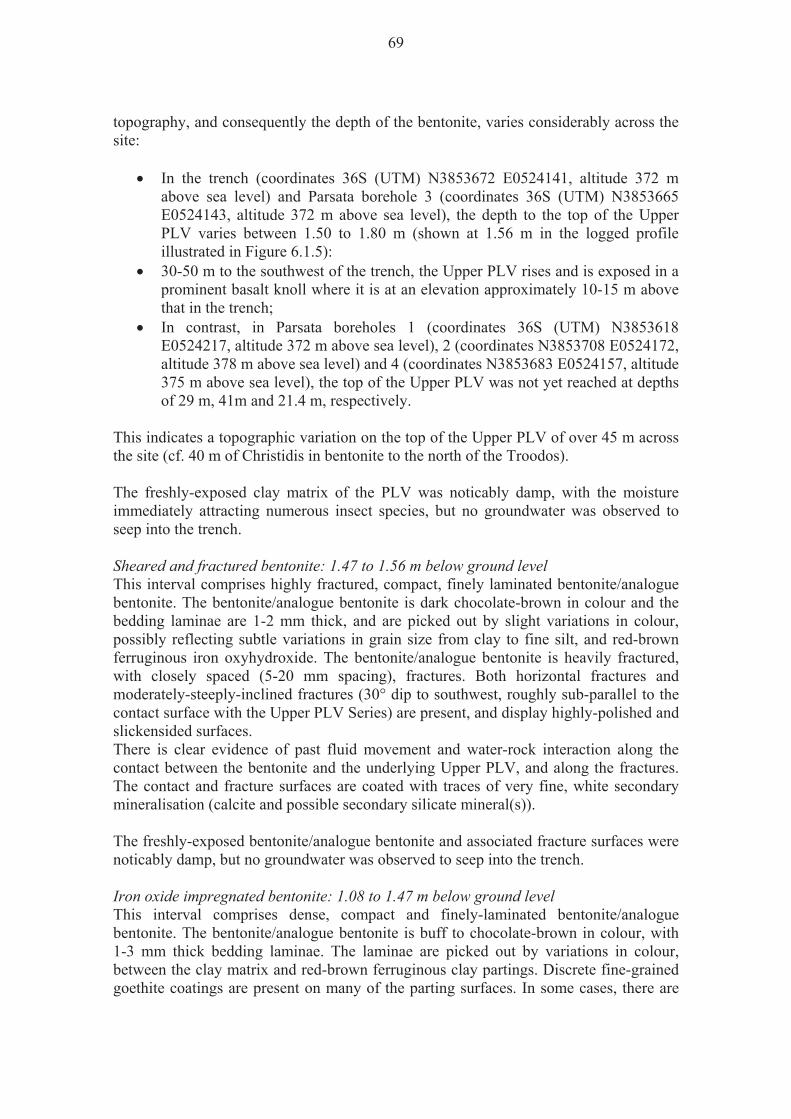
69
topography, and consequently the depth of the bentonite, varies considerably across the site:
In the trench (coordinates 36S (UTM) N3853672 E0524141, altitude 372 m above sea level) and Parsata borehole 3 (coordinates 36S (UTM) N3853665 E0524143, altitude 372 m above sea level), the depth to the top of the Upper PLV varies between 1.50 to 1.80 m (shown at 1.56 m in the logged profile illustrated in Figure 6.1.5):
30-50 m to the southwest of the trench, the Upper PLV rises and is exposed in a prominent basalt knoll where it is at an elevation approximately 10-15 m above that in the trench;
In contrast, in Parsata boreholes 1 (coordinates 36S (UTM) N3853618 E0524217, altitude 372 m above sea level), 2 (coordinates N3853708 E0524172, altitude 378 m above sea level) and 4 (coordinates N3853683 E0524157, altitude 375 m above sea level), the top of the Upper PLV was not yet reached at depths of 29 m, 41m and 21.4 m, respectively.
This indicates a topographic variation on the top of the Upper PLV of over 45 m across the site (cf. 40 m of Christidis in bentonite to the north of the Troodos). The freshly-exposed clay matrix of the PLV was noticably damp, with the moisture immediately attracting numerous insect species, but no groundwater was observed to seep into the trench. Sheared and fractured bentonite: 1.47 to 1.56 m below ground level This interval comprises highly fractured, compact, finely laminated bentonite/analogue bentonite. The bentonite/analogue bentonite is dark chocolate-brown in colour and the bedding laminae are 1-2 mm thick, and are picked out by slight variations in colour, possibly reflecting subtle variations in grain size from clay to fine silt, and red-brown ferruginous iron oxyhydroxide. The bentonite/analogue bentonite is heavily fractured, with closely spaced (5-20 mm spacing), fractures. Both horizontal fractures and moderately-steeply-inclined fractures (30° dip to southwest, roughly sub-parallel to the contact surface with the Upper PLV Series) are present, and display highly-polished and slickensided surfaces. There is clear evidence of past fluid movement and water-rock interaction along the contact between the bentonite and the underlying Upper PLV, and along the fractures. The contact and fracture surfaces are coated with traces of very fine, white secondary mineralisation (calcite and possible secondary silicate mineral(s)). The freshly-exposed bentonite/analogue bentonite and associated fracture surfaces were noticably damp, but no groundwater was observed to seep into the trench. Iron oxide impregnated bentonite: 1.08 to 1.47 m below ground level This interval comprises dense, compact and finely-laminated bentonite/analogue bentonite. The bentonite/analogue bentonite is buff to chocolate-brown in colour, with 1-3 mm thick bedding laminae. The laminae are picked out by variations in colour, between the clay matrix and red-brown ferruginous clay partings. Discrete fine-grained goethite coatings are present on many of the parting surfaces. In some cases, there are

70
clear differences in grain size between occasional thin coarser, siltier greenish laminae and chocolate-brown bentonite/analogue bentonite, that may represent discrete tuff bands. The bentonite is unfractured and there is no evidence of discrete manganese oxide mineralisation. The interface between this interval and the overlying bentonite/analogue bentonite is sharply defined by a very marked colour change.
The freshly-exposed bentonite/analogue bentonite was notably damp towards the base of this interval, but no groundwater was observed to seep into the trench.
Manganese oxide impregnated bentonite: 0.82 to 1.08 m below ground level This interval comprises dense, compact, hard, finely-laminated buff-brown bentonite/analogue bentonite, with very thin (< 1mm) partings of black to dark-grey manganese oxide. The lamination is similar in scale to that seen in the underlying iron oxide impregnated bentonite. The manganese oxide coatings on the laminae partings have a metallic luster, and often form fine dendritic films on the bedding parting surfaces. Small (1-2 mm diameter) nodules of manganese oxide are also present along many laminations and partings.
71
Figure 6.1.7. Lithogical sequence exposed in the Parsata trench. The bentonite is unfractured and there is no evidence of discrete goethitic iron oxide mineralisation. The interface between this interval and the overlying weathered or disrupted bentonite coincides with a very marked colour change. Weathered bentonite regolith: 0.22 to 0.82 m below ground level This interval comprises, massive, compacted, dark brown to red-brown clay, with residual fragments (up to 4 mm) of hard, olive-green clay. There is no evidence of the primary sedimentary lamination seen in the underlying bentonite. The clay is strongly

72
fissured with discontinuous, orthogonal sub-vertical and sub-horizontal fractures that break the clay up into a blocky fabric. White, powdery calcite coats and partially fills the fractures, and forms diffuse patches filling irregular cavities in the matrix. This probably represents the incipient formation of calcrete within the upper part of the profile. Above 0.39 m, the clay grades into more weathered clay, the olive-green hard clay fragments become less obvious. Also, above this depth the white, powdery calcite coatings in the fissures are much less common. This interval may represent enhanced in-situ weathering of the bentonite sequence close to the surface (i.e. bentonite regolith). However, the residual angular fragmented fabric of the residual olive-green clay dispersed within the dark brown massive clay matrix, and the lack of any primary sedimentary fabric, may indicate that the clay or bentonite/analogue bentonite at the top of the profile has been disrupted and is not in-situ. This may represent bentonite/analogue bentonite or clay that has been reworked, transported and re-deposited on top of the underlying finely laminated bentonite as a debris-flow deposit or as a result of landslip movement. The lack of inclusion of extraneous basalt, chert, chalk or limestone clasts (common in the soils around the area of the site) and the similarity in mineralogy to the underlying bentonitic bentonite/analogue bentonite (see chapter 7) would imply that this “disturbed” clay has probably been derived locally from the same bentonite/analogue bentonite sequence It is evident from consideration of the geomorphological features that landslip activity has affected the hillsides around the trench site (see also discussion in chapter 3), and a debris-flow or landslip-derived origin for this upper part of the bentonite sequence seems highly plausible. Fissured clay with possible calcrete nodules: 0.11 to 0.22 m below ground level The top of the debris-flow bentonite/analogue bentonite or highly weathered bentonite regolith is overlain by a thin horizon of dark-brown, compact, highly fissured clay. An orthogonal network of fissures breaks the clay up into small blocks. The block surfaces are coated by powdery white calcite. Scattered small rounded “clasts” of calcium carbonate are present that may represent calcrete nodules or possibly clasts of locally-derived chalky limestone. This horizon may represent the top of the underlying debris-flow deposit or a later thin debris-flow or hill-wash deposit. Terra rossa soil: surface to 0.11 m below ground level The top of the trench profile is marked by a thin (0.11 m) thick dark red-brown to chocolate-brown soil. This is moderately stoney, and contains abundant angular clasts (up to 40 mm diameter) of limestone, chalk, basalt and chert of local original. The clast abundance increases upwards. The soil is strongly fissured with a block size ranging from <5-50 mm. Faulting The western edge of the trench exposed a fault juxtaposing the bentonite against the Upper PLV Series with a steeply-inclined contact, dipping 68-70° to N038°. Both the bentonitic bentonite/analogue bentonite and the adjacent pillow lava are strongly
73
sheared and fractured for up to 0.4 m either side of the fault, with fractures in both lithlogies exhibiting polished and slickensided surfaces. The fractures were seen to be coated with traces of fine, white crystalline calcite and possibly silicate mineralisation. 6.2 X-ray diffraction analysis 6.2.1 Introduction
A suite of 45 samples were selected to represent the bentonite profiles from the trench and Parsata boreholes 1, 2 and 4, and submitted for whole-rock and clay mineralogical analysis by X-ray diffraction (XRD) and major and trace element geochemistry by X-ray fluorescence spectroscopy (XRFS). The samples were air dried and then jawcrushed, followed by milling in an agate ball mill. Full sample details and the techniques applied to each are summarised in Table 6.2.1. Owing to the limited amounts of material available for 4 of the samples, it was not possible to also carry out XRFS analysis on these samples 6.2.2 Sample preparation
Whole-rock X-ray diffraction preparation In order to achieve a finer and uniform particle-size for powder XRD analysis, approximately 4.5 g portions of the tema-milled material were micronised under deionised water for 10 minutes with 10 % (i.e. 0.5 g) corundum (American Elements, Al2O3, AL-OX-03-P) (here the amount of material available was more limited, smaller weights of sample were also combined with 10% corundum). The addition of an internal standard allows validation of quantification data and also the detection of any amorphous species in the samples. Corundum was selected as its principle XRD peaks are suitably remote from those produced by most of the phases present in the samples and its mass absorption coefficient is similar to the sample matrix. All corundum-spiked samples were then spray-dried following the method and apparatus described by Hillier (1999). The spray-dried materials were then front-loaded into standard stainless steel sample holders for analysis. <2 μm fraction separation and oriented mount preparation Approximately 10 g jawcrushed material was dispersed in deionised water using a reciprocal shaker combined with treatment with ultrasound. The resulting suspensions were then sieved on 63 μm and the <63 μm material placed in measuring cylinders and allowed to stand. In order to prevent flocculation of the clay crystals, 1 ml 0.1M 'Calgon' (sodium hexametaphosphate) was added to each suspension. After a period determined using Stokes' Law, a nominal <2 μm fraction was removed and dried at 55°C. Ca.100 mg of the <2 μm material was then re-suspended in a minimum of deionised water and pipetted onto a ceramic tile in a vacuum apparatus to produce an oriented mount. The mounts were Ca-saturated using 2 ml 0.1M CaCl2.6H2O solution and washed twice to remove excess reagent and allowed to dry at room temperature.
74
6.2.3 X-ray diffraction analysis
Whole-rock analysis XRD analysis was carried out using a PANalytical X’Pert Pro series diffractometer equipped with a cobalt-target tube, X’Celerator detector and operated at 45kV and 40mA. The whole-rock samples were scanned from 4.5-85°2 at 2.76°2 /minute. The diffraction data were then initially analysed using PANalytical X’Pert Pro software coupled to the latest version of the International Centre for Diffraction Data (ICDD) database (ICDD 2008). Following identification of the mineral species present in the samples, mineral quantification was achieved using the Rietveld refinement technique (e.g. Snyder and Bish 1989) using Siroquant v2.5 software. This method avoids the need to produce synthetic mixtures and involves the least squares fitting of measured to calculated XRD profiles. Errors for the quoted mineral concentrations are typically ±2.5 % for concentrations >60 wt%, ±5 % for concentrations between 60 and 30 wt%, ±10 % for concentrations between 30 and 10 wt%, ±20 % for concentrations between 10 and 3 wt% and ±40 % for concentrations <3 wt% (Hillier et al. 2001). Where a phase was detected but its concentration was indicated to be below 0.5 %, it is assigned a value of <0.5 %, since the error associated with quantification at such low levels becomes too large. Clay mineral analysis <2 μm oriented mounts were scanned from 2-40°2 at 1.02°2 /minute after air-drying, ethylene glycol solvation and heating at 550°C for 2 hours. Clay mineral species were then identified from their characteristic peak positions and their reaction to the diagnostic testing program. In order to gain further information about the nature of the clay minerals present in the samples, modelling of the <2 μm glycol-solvated XRD profiles was carried out using Newmod-for-Windows™ (Reynolds and Reynolds, 1996) software. Modelling was also used to assess the relative proportions of clay minerals present in the <2 μm fractions by comparison of sample XRD traces with Newmod-for-Windows™ modelled profiles. The modelling process requires the input of diffractometer, scan parameters and a quartz intensity factor (instrumental conditions), and the selection of different sheet compositions and chemistries. In addition, an estimate of the crystallite size distribution of the species may be determined by comparing peak profiles of calculated diffraction profiles with experimental data. By modelling the individual clay mineral species in this way, mineral reference intensities were established and used for quantitative standardization following the method outlined in Moore and Reynolds (1997).
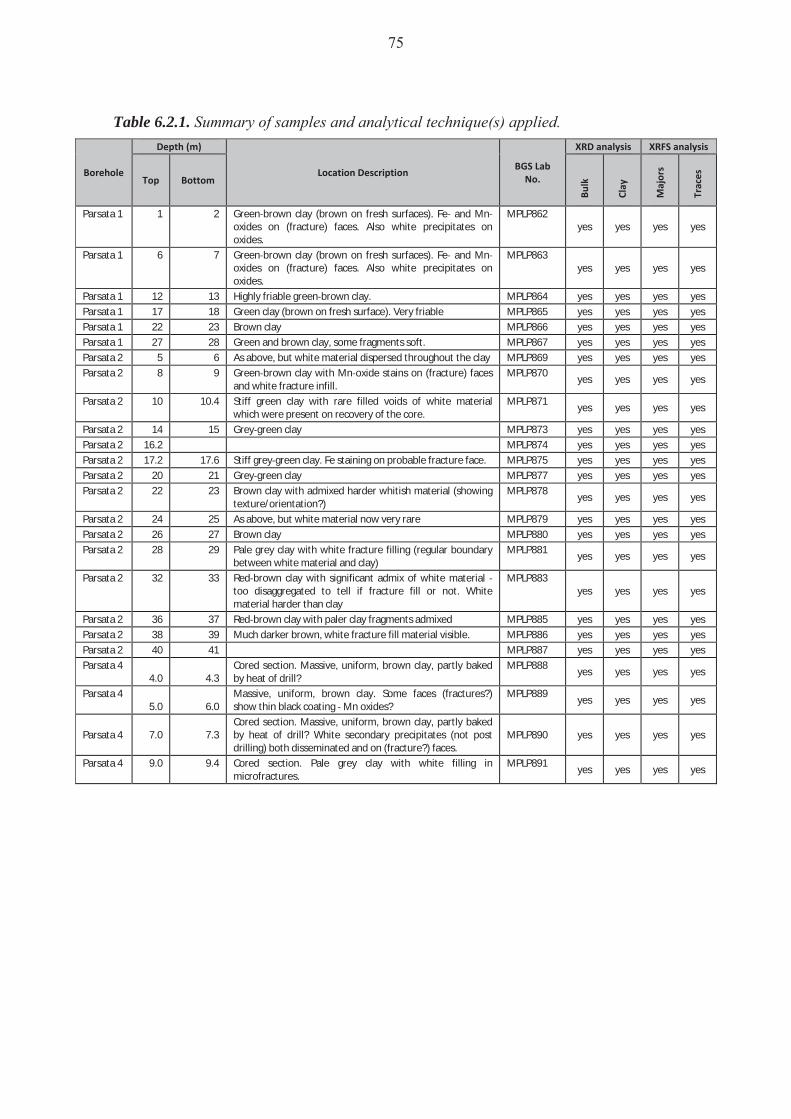
75
Table 6.2.1. Summary of samples and analytical technique(s) applied.
Borehole
Depth (m)
Location DescriptionBGS LabNo.
XRD analysis XRFS analysis
Top Bottom
Bulk
Clay
Majors
Traces
Parsata 1 1 2 Green brown clay (brown on fresh surfaces). Fe and Mnoxides on (fracture) faces. Also white precipitates onoxides.
MPLP862yes yes yes yes
Parsata 1 6 7 Green brown clay (brown on fresh surfaces). Fe and Mnoxides on (fracture) faces. Also white precipitates onoxides.
MPLP863yes yes yes yes
Parsata 1 12 13 Highly friable green brown clay. MPLP864 yes yes yes yes
Parsata 1 17 18 Green clay (brown on fresh surface). Very friable MPLP865 yes yes yes yes
Parsata 1 22 23 Brown clay MPLP866 yes yes yes yes
Parsata 1 27 28 Green and brown clay, some fragments soft. MPLP867 yes yes yes yes
Parsata 2 5 6 As above, but white material dispersed throughout the clay MPLP869 yes yes yes yes
Parsata 2 8 9 Green brown clay with Mn oxide stains on (fracture) facesand white fracture infill.
MPLP870yes yes yes yes
Parsata 2 10 10.4 Stiff green clay with rare filled voids of white materialwhich were present on recovery of the core.
MPLP871yes yes yes yes
Parsata 2 14 15 Grey green clay MPLP873 yes yes yes yes
Parsata 2 16.2 MPLP874 yes yes yes yes
Parsata 2 17.2 17.6 Stiff grey green clay. Fe staining on probable fracture face. MPLP875 yes yes yes yes
Parsata 2 20 21 Grey green clay MPLP877 yes yes yes yes
Parsata 2 22 23 Brown clay with admixed harder whitish material (showingtexture/orientation?)
MPLP878yes yes yes yes
Parsata 2 24 25 As above, but white material now very rare MPLP879 yes yes yes yes
Parsata 2 26 27 Brown clay MPLP880 yes yes yes yes
Parsata 2 28 29 Pale grey clay with white fracture filling (regular boundarybetween white material and clay)
MPLP881yes yes yes yes
Parsata 2 32 33 Red brown clay with significant admix of white materialtoo disaggregated to tell if fracture fill or not. Whitematerial harder than clay
MPLP883yes yes yes yes
Parsata 2 36 37 Red brown clay with paler clay fragments admixed MPLP885 yes yes yes yes
Parsata 2 38 39 Much darker brown, white fracture fill material visible. MPLP886 yes yes yes yes
Parsata 2 40 41 MPLP887 yes yes yes yes
Parsata 44.0 4.3
Cored section. Massive, uniform, brown clay, partly bakedby heat of drill?
MPLP888yes yes yes yes
Parsata 45.0 6.0
Massive, uniform, brown clay. Some faces (fractures?)show thin black coating Mn oxides?
MPLP889yes yes yes yes
Parsata 4 7.0 7.3Cored section. Massive, uniform, brown clay, partly bakedby heat of drill? White secondary precipitates (not postdrilling) both disseminated and on (fracture?) faces.
MPLP890 yes yes yes yes
Parsata 4 9.0 9.4 Cored section. Pale grey clay with white filling inmicrofractures.
MPLP891yes yes yes yes

76
Table 6.2.1. Summary of samples and analytical technique(s) applied (continued).
Borehole
Depth (m)
Location DescriptionBGS LabNo.
XRD analysis XRFS analysis
Top Bottom
Bulk
Clay
Majors
Traces
Parsata 4 11.0 12.0 Friable brown clay MPLP892 yes yes yes yes
Parsata 414.0 15.0
Dark grey (black on fresh surface) friable clay dominates,but also hard brown clay and some light grey clay
MPLP893yes yes yes yes
Parsata 416.0 16.3 Cored section. Dark brown, massive clay with white to light
pink secondary phases on (fracture?) faces and 0.5 cmnodules (vugs?)
MPLP894yes yes yes yes
Parsata 4 20.0 21.0Thoroughgoing PLV. Most fragments show white coating onsome surfaces, individual secondary phases present(fracture fill?).
MPLP895 yes yes yes yes
Parsata 421.0 21.4 Cored section. As above. Despite the heat of coring, this
sample was moist on recovery now dried out.MPLP896
yes yes yes yes
Trench
Sample
no.
Depth(inches)
Depth(cm)
Location DescriptionBGS LabNo.
XRD analysis XRFS analysis
Bulk
Clay
Major
s Traces
Trench 1 3 20.0 50.8 red clay, obvious white veins and blebs in thered clay
MPLP897yes yes yes yes
Trench 1 4 30.0 76.2 beginning of a zone of black staining inlaminations of the red clay
MPLP898yes yes yes yes
Trench 1 5 40.0 101.6 clay is now thorough going black MPLP899 yes yes yes yes
Trench 1 6 44.0 111.8 top of zone of heavy red staining in the clay MPLP901 yes yes yes yes
Trench 1 11 44.0 111.8 green vein at the base of the clay MPLP962 yes yes no no
Trench 1 13 45.0 114.3 red clay immediately adjacent to 11 MPLP963 yes yes no no
Trench 1 14 50.0 127.0 green material right at the top of the PLV MPLP964 yes yes no no
Trench 1 15 50.0 127.0 red clay immediately adjacent to 14 MPLP965 yes yes yes yes
Trench 1 7 60.0 152.4 base of zone of heavy red staining MPLP966 yes yes yes yes
Trench 1 19 60 152.4 bulk' clay sample MPLP967 yes yes yes yes
Trench 1 8 63.0 160.0 top of the pillow lavas (PLV), green coloured MPLP968 yes yes yes yes
Trench 1 12 65.0 165.1 a white vein around the PLV MPLP969 yes yes no no
Trench 1 10 68.0 172.7 large piece of PLV (representative of 'bulk' PLV) MPLP970 yes yes yes yes
Trench 1 9 70 177.8 green brown stained zone in the PLV MPLP971 yes yes yes yes
Trench 1 17a 70 177.8 black clay MPLP972 yes yes yes yes
77
6.3 Petrographical analysis A sub-set of samples was selected for detailed petrographic analysis, as detailed below in Table 6.3.1. 6.3.1 Sample preparation: petrographic thin sections
A standard-sized (28 x 48 mm) polished-surface thin-section (PTS) was prepared from each of the selected samples. Samples were initially impregnated with epoxy-resin under vacuum in order to stabilise friable or unstable material. A blue dye was added to the epoxy-resin to enable any natural porosity to be readily identified and distinguished. Use of water during section preparation was avoided in order to prevent the swelling of water sensitive clays and the dissolution of water soluble phases. After preparation the polished sections were digitised at a 1200 ppi resolution using an Epson Perfection 1240U flatbed scanner with transparency adaptor. Each polished section was then coated with a thin film of carbon approximately 25 nm thick using an EMITECH 960L evaporation-coating unit to facilitate analysis by scanning electron microscope (SEM). 6.3.2 Sample preparation: rock chip samples
Small fragments, approximately 1 cm on each side, were freshly broken from the petrography sample sub-set. These were mounted on 10mm diameter aluminium pin stubs using carbon paint with freshly fractured faces presented for analysis. As with the polished sections, each of these prepared rock chip samples were coated with a thin film of carbon approximately 25 nm thick using an EMITECH 960L evaporation-coating unit to facilitate analysis by SEM. A few samples that had surface textures unlikely to survive the sample preparation as described above were examined in an unprepared and uncoated state using the variable pressure SEM technique as described below. Where appropriate, rock chip and polished section sample portions were only selected after this initial analysis had been performed. 6.3.3 Sample analysis: scanning electron microscopy
Detailed mineralogical and petrographical observations were made on both the thin sections and rock chips using either an FEI Company Quanta 600 environmental scanning electron microscope (ESEM) equipped with an Oxford Instruments INCA Energy 450 energy-dispersive X-ray microanalysis (EDXA) system using a 50 mm2 Peltier-cooled silicon drift X-ray detector (SDD), or a LEO 435VP scanning electron microscope equipped with an Oxford Instruments INCA Energy 450 energy-dispersive X-ray microanalysis (EDXA) system using a thin-window Si-Li solid-state X-ray detector. Each of the EDXA systems (under the operating conditions used) are capable of detecting elements from atomic number 4 (B) to atomic number 92 (U), and has a detection limit of the order of between 0.2 to 0.5 wt % for most elements. The EDXA systems are used as a guide to mineral phase identification as well as to record quantitative compositional data.
78
All of the carbon-coated polished sections and rock chip samples selected were analysed under high vacuum conditions (<1x10⁻⁴ torr). The unprepared, uncoated samples were analysed under variable vacuum conditions (20-90 torr) in the FEI Quanta 600 using water as the atmosphere. Accelerating voltages of 10 – 20kV were used. SEM photomicrographs were obtained under backscatter electron imaging (BSEM) and secondary electron imaging (SE) conditions as 8 bit greyscale TIF format digital images. Images were collected over a range of magnifications, primarily at resolutions of 1024 x 884 (FEI) and 1024x768 (LEO) pixels. The brightness of a phase under BSEM is proportional to its mean atomic number. This means that many minerals can be distinguished by differences in brightness. Additionally, porosity in the thin sections, which has been impregnated by a carbon-rich resin, typically shows as black or near-black and has a strong brightness contrast with most mineral phases. Consequently BSEM images are very good for showing mineral phase distributions and variations in chemistry, but are less good at showing the surface topography of rock chip samples and mineral morphologies. SE imaging is more suited to showing topography and morphology. Rock chips were primarily imaged in SE mode to examine phase morphologies, paragenetic relationships and sample textures. Fracture surfaces were also primarily analysable in the rock chip samples, where surface textures, phase relationships and deposits can be examined and identified. Polished sections were primarily examined in BSEM mode, allowing internal phase relationships and textures to be examined. The quantitative chemical data were all obtained from the polished sections. Quantitative microchemical analysis was performed on polished sections selected from the Parsata trench 1 sample site by SEM EDXA (6.3.1). This was done as both an aid to phase identifications and to determine if there are any systematic compositional variations in the clay mineralogies, particularly in association with fractures. All of the quantitative analyses were performed on the LEO 435VP SEM operating at 20kV, with the iprobe current set at 700pA. Quantitative data was collected for livetimes of 60 s with a process time setting of 5.
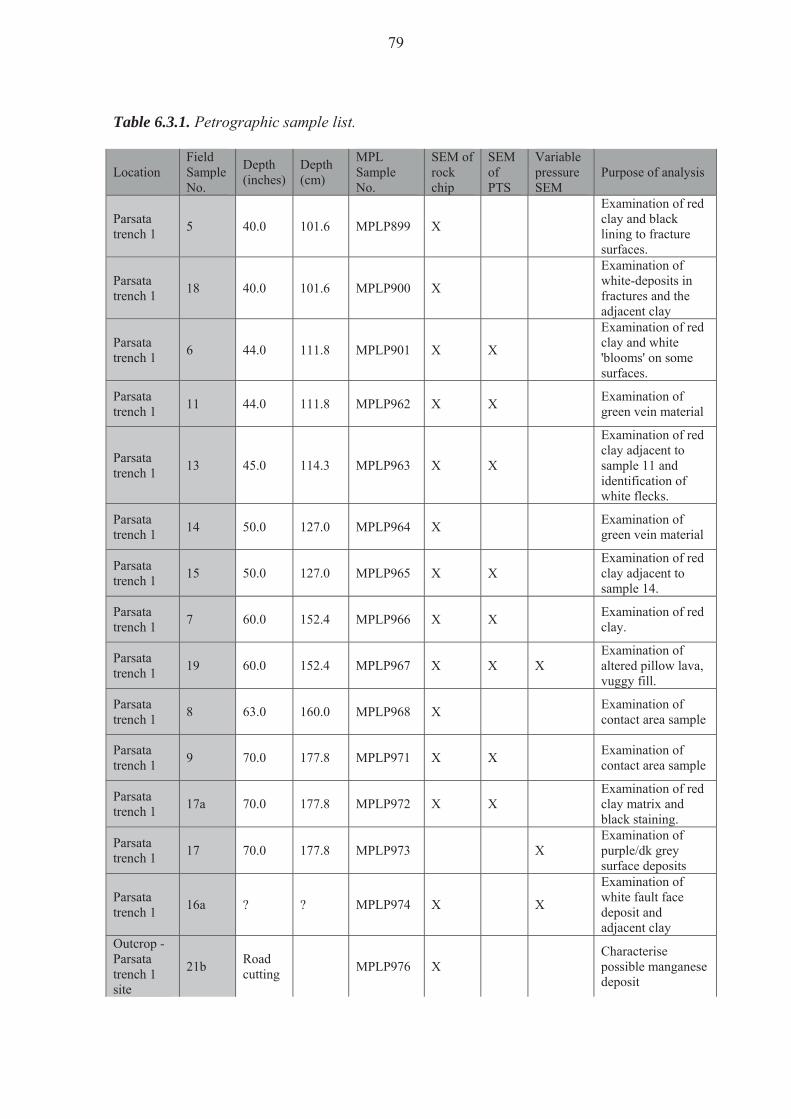
79
Table 6.3.1. Petrographic sample list.
Location Field Sample No.
Depth (inches)
Depth (cm)
MPL Sample No.
SEM of rock chip
SEM of PTS
Variable pressure SEM
Purpose of analysis
Parsata trench 1 5 40.0 101.6 MPLP899 X
Examination of red clay and black lining to fracture surfaces.
Parsata trench 1 18 40.0 101.6 MPLP900 X
Examination of white-deposits in fractures and the adjacent clay
Parsata trench 1 6 44.0 111.8 MPLP901 X X
Examination of red clay and white 'blooms' on some surfaces.
Parsata trench 1 11 44.0 111.8 MPLP962 X X Examination of
green vein material
Parsata trench 1 13 45.0 114.3 MPLP963 X X
Examination of red clay adjacent to sample 11 and identification of white flecks.
Parsata trench 1 14 50.0 127.0 MPLP964 X Examination of
green vein material
Parsata trench 1 15 50.0 127.0 MPLP965 X X
Examination of red clay adjacent to sample 14.
Parsata trench 1 7 60.0 152.4 MPLP966 X X Examination of red
clay.
Parsata trench 1 19 60.0 152.4 MPLP967 X X X
Examination of altered pillow lava, vuggy fill.
Parsata trench 1 8 63.0 160.0 MPLP968 X Examination of
contact area sample
Parsata trench 1 9 70.0 177.8 MPLP971 X X Examination of
contact area sample
Parsata trench 1 17a 70.0 177.8 MPLP972 X X
Examination of red clay matrix and black staining.
Parsata trench 1 17 70.0 177.8 MPLP973 X
Examination of purple/dk grey surface deposits
Parsata trench 1 16a ? ? MPLP974 X X
Examination of white fault face deposit and adjacent clay
Outcrop - Parsata trench 1 site
21b Road cutting MPLP976 X
Characterise possible manganese deposit
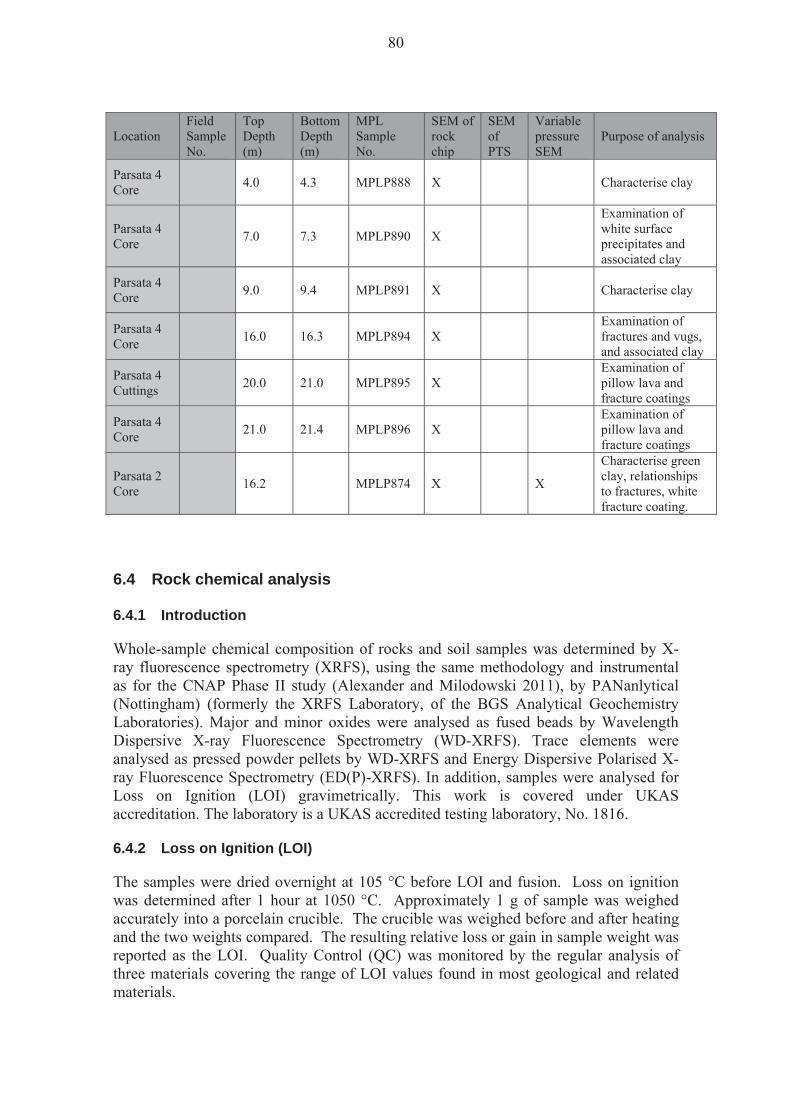
80
Location Field Sample No.
Top Depth (m)
Bottom Depth (m)
MPL Sample No.
SEM of rock chip
SEM of PTS
Variable pressure SEM
Purpose of analysis
Parsata 4 Core 4.0 4.3 MPLP888 X Characterise clay
Parsata 4 Core 7.0 7.3 MPLP890 X
Examination of white surface precipitates and associated clay
Parsata 4 Core 9.0 9.4 MPLP891 X Characterise clay
Parsata 4 Core 16.0 16.3 MPLP894 X
Examination of fractures and vugs, and associated clay
Parsata 4 Cuttings 20.0 21.0 MPLP895 X
Examination of pillow lava and fracture coatings
Parsata 4 Core 21.0 21.4 MPLP896 X
Examination of pillow lava and fracture coatings
Parsata 2 Core 16.2 MPLP874 X X
Characterise green clay, relationships to fractures, white fracture coating.
6.4 Rock chemical analysis 6.4.1 Introduction
Whole-sample chemical composition of rocks and soil samples was determined by X-ray fluorescence spectrometry (XRFS), using the same methodology and instrumental as for the CNAP Phase II study (Alexander and Milodowski 2011), by PANanlytical (Nottingham) (formerly the XRFS Laboratory, of the BGS Analytical Geochemistry Laboratories). Major and minor oxides were analysed as fused beads by Wavelength Dispersive X-ray Fluorescence Spectrometry (WD-XRFS). Trace elements were analysed as pressed powder pellets by WD-XRFS and Energy Dispersive Polarised X-ray Fluorescence Spectrometry (ED(P)-XRFS). In addition, samples were analysed for Loss on Ignition (LOI) gravimetrically. This work is covered under UKAS accreditation. The laboratory is a UKAS accredited testing laboratory, No. 1816. 6.4.2 Loss on Ignition (LOI)
The samples were dried overnight at 105 °C before LOI and fusion. Loss on ignition was determined after 1 hour at 1050 °C. Approximately 1 g of sample was weighed accurately into a porcelain crucible. The crucible was weighed before and after heating and the two weights compared. The resulting relative loss or gain in sample weight was reported as the LOI. Quality Control (QC) was monitored by the regular analysis of three materials covering the range of LOI values found in most geological and related materials.
81
6.4.3 Fused bead major and minor oxide WD-XRFS Analysis
Fused beads were prepared by fusing 0.9000 g sample plus 9.000 g flux (66/34 Li2B4O7 and LiBO2) at 1200 °C. After fusion the melt was cast into a 40 mm glass bead which was then analysed by WD-XRFS. The XRF spectrometer used was a Philips MagiX-PRO with a 60 kV generator and 4 kW rhodium (Super Sharp) end–window X-ray tube. The instrument is controlled via a PC running PANalytical SuperQ XRF application packages (PANalytical, 2008). The PANalytical calibration algorithm is used to fit calibration curves and inter-element effects are corrected by theoretical alpha coefficients, calculated by the PANalytical method. All spectral backgrounds and peaks are corrected for instrument drift using two external ratio monitors. Routine calibrations cater for a wide variety of environmental and geological matrices; the application quantifies 19 elements on fused beads, calibrated as oxides with the reporting limits shown in Table 6.4.1. The lower limits of detection (LLD) were calculated from instrument sensitivity at calibration and lower limits of reporting (LLR) were calculated from the LLDs. The upper reporting limits (URL) were determined from the highest concentration standard used on the calibration. Fused bead QC was monitored by the analysis of two bulk rock materials chosen for their variety of matrix type and analyte values. The results were entered into run charts for statistical analysis using a Statistical Process Control (SPC) package. 6.4.4 Sample preparation for pressed powder pellet analysis by XRFS
Pressed powder pellets are prepared by grinding 12.00 g of sample and 3.00 g of binder in an agate planetary ball mill for 30 minutes. The mixture is then pressed at 25 tonnes load into 40 mm diameter pellets. The binder used is a mixture of 9 parts EMU120FD, a styrene copolymer, and 1 part Ceridust 3620, a micronised polyethylene wax. 6.4.5 Pressed Powder Trace Element WD-XRFS Analysis
(Sc-Mo and Nd-U)
The XRF spectrometer used was an Axios Advanced with a 60 kV generator and 4 kW rhodium (Super Sharp Max) end–window X-ray tube. The instrument is controlled via a PC running PANalytical SuperQ XRF Pro-Trace application packages. For trace element analysis, a set of synthetic standards (Pro-Trace) is used to calibrate the instruments and to determine background and spectral interference correction factors. The PANalytical Pro-Trace calibration algorithm is used to fit calibration lines, applying matrix correction using mass attenuation coefficients and jump edge correction for the iron, manganese and titanium absorption edges. The Pro-Trace package also corrects for background, tube spectral lines and spectral line overlap interferences. The calibrations were validated by analysis of a wide range of Reference Materials. Quality Control is maintained by regular analysis of two glass monitor samples containing 47 elements at nominally 30 ppm and 300 ppm and the results entered into

82
run charts for statistical analysis using a SPC package. Lower limits of detection (LLD) are theoretical values for the concentration equivalent to three standard deviations (99.7 % confidence interval) above the background count rate for the analyte in an iron-rich alumino-silicate matrix. High instrumental stability results in the practical detection limits for most elements in silicates approaching the theoretical values. LLDs are calculated from a matrix blank and the synthetic Pro-Trace standards using Equation 10. The lower (LLR) and upper limits (URL) of reporting for the slow speed, low LLD WD-XRFS application used for the analysis are shown in Table 6.4.2 Equation 10. The theoretical lower limit of detection L.L.D. = Where: sensitivity (counts per second per %) the background count rate (counts per second) the counting time on the background (s) 6.4.6 Pressed Powder Trace Element ED(P)-XRFS Analysis (Ag-Ce)
The ED(P)-XRFS Spectrometer used was an Epsilon 5 with 100 kV generator, 600W gadolinium side–window X-ray tube with liquid nitrogen cooled germanium detector. The polarising target used was an Al2O3 Barkla target and matrix correction was achieved by means of Compton scatter using a CsI target. The lower (LLR) and upper limits of reporting (URL) for the slow speed, low LLD ED(P)-XRF application used for the analysis are shown in Table 6.4.3 6.4.7 Stable isotope analysis of carbonate mineralisation
Very few samples of suitable carbonate mineralisation could be sampled and examined from the Parsata Trench 1 and the four boreholes drilled for the Phase III study. Most of the carbonate material encountered in Trench 1 and the boreholes was detrital or derived/reworked clasts and fragments of limestone/chalk sedimentary rock, or very fine grained, and finely disseminated authigenic calcite admixed and largely physically inseparable from sedimentary calcium carbonate components in the same bentonite material. Stable isotope analysis of bulk samples of these materials would have given results reflecting mixed carbonate generations / types that would be extremely difficult to interpret given the limited number of samples that could be analysed within the constraints of the project budget. Only 4 samples of suitable secondary calcite mineralisation could be analysed from the bentonitic Lower Pillow Lava - Perapedhi Formation sequence in Trench 1, and the from the altered Lower Pillow Lava outcrop in the nearby basalt knoll adjacent to Trench 1 (Table 6.4.4) were analysed. These were then compared with data from samples (also analysed during the present study) of travertine / tufa and carbonate mineralisation that had been collected previously during the Phase II study (Alexander
b
b
TR
m3
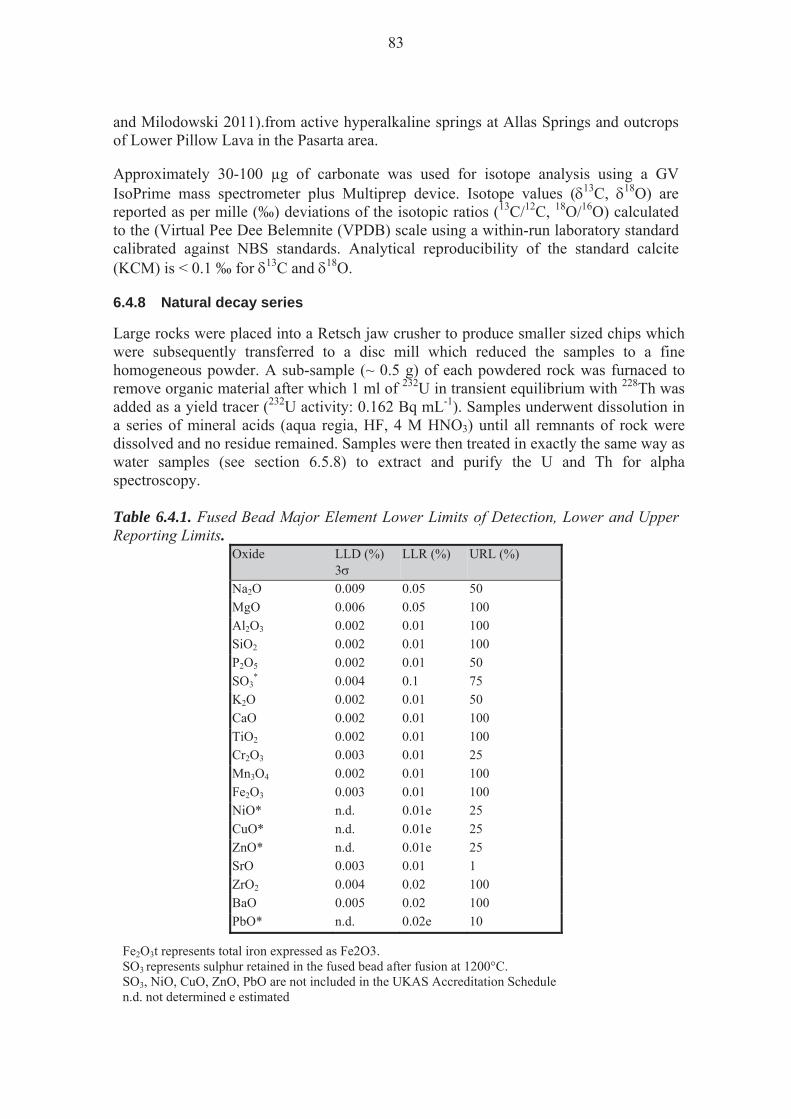
83
and Milodowski 2011).from active hyperalkaline springs at Allas Springs and outcrops of Lower Pillow Lava in the Pasarta area. Approximately 30-100 μg of carbonate was used for isotope analysis using a GV IsoPrime mass spectrometer plus Multiprep device. Isotope values ( 13C, 18O) are reported as per mille (‰) deviations of the isotopic ratios (13C/12C, 18O/16O) calculated to the (Virtual Pee Dee Belemnite (VPDB) scale using a within-run laboratory standard calibrated against NBS standards. Analytical reproducibility of the standard calcite (KCM) is < 0.1 ‰ for 13C and 18O. 6.4.8 Natural decay series
Large rocks were placed into a Retsch jaw crusher to produce smaller sized chips which were subsequently transferred to a disc mill which reduced the samples to a fine homogeneous powder. A sub-sample (~ 0.5 g) of each powdered rock was furnaced to remove organic material after which 1 ml of 232U in transient equilibrium with 228Th was added as a yield tracer (232U activity: 0.162 Bq mL-1). Samples underwent dissolution in a series of mineral acids (aqua regia, HF, 4 M HNO3) until all remnants of rock were dissolved and no residue remained. Samples were then treated in exactly the same way as water samples (see section 6.5.8) to extract and purify the U and Th for alpha spectroscopy. Table 6.4.1. Fused Bead Major Element Lower Limits of Detection, Lower and Upper Reporting Limits.
Oxide LLD (%) 3
LLR (%) URL (%)
Na2O 0.009 0.05 50 MgO 0.006 0.05 100 Al2O3 0.002 0.01 100 SiO2 0.002 0.01 100 P2O5 0.002 0.01 50 SO3
* 0.004 0.1 75
K2O 0.002 0.01 50 CaO 0.002 0.01 100 TiO2 0.002 0.01 100 Cr2O3 0.003 0.01 25 Mn3O4 0.002 0.01 100 Fe2O3 0.003 0.01 100 NiO* n.d. 0.01e 25 CuO* n.d. 0.01e 25 ZnO* n.d. 0.01e 25 SrO 0.003 0.01 1 ZrO2 0.004 0.02 100 BaO 0.005 0.02 100 PbO* n.d. 0.02e 10
Fe2O3t represents total iron expressed as Fe2O3. SO3 represents sulphur retained in the fused bead after fusion at 1200°C. SO3, NiO, CuO, ZnO, PbO are not included in the UKAS Accreditation Schedule n.d. not determined e estimated
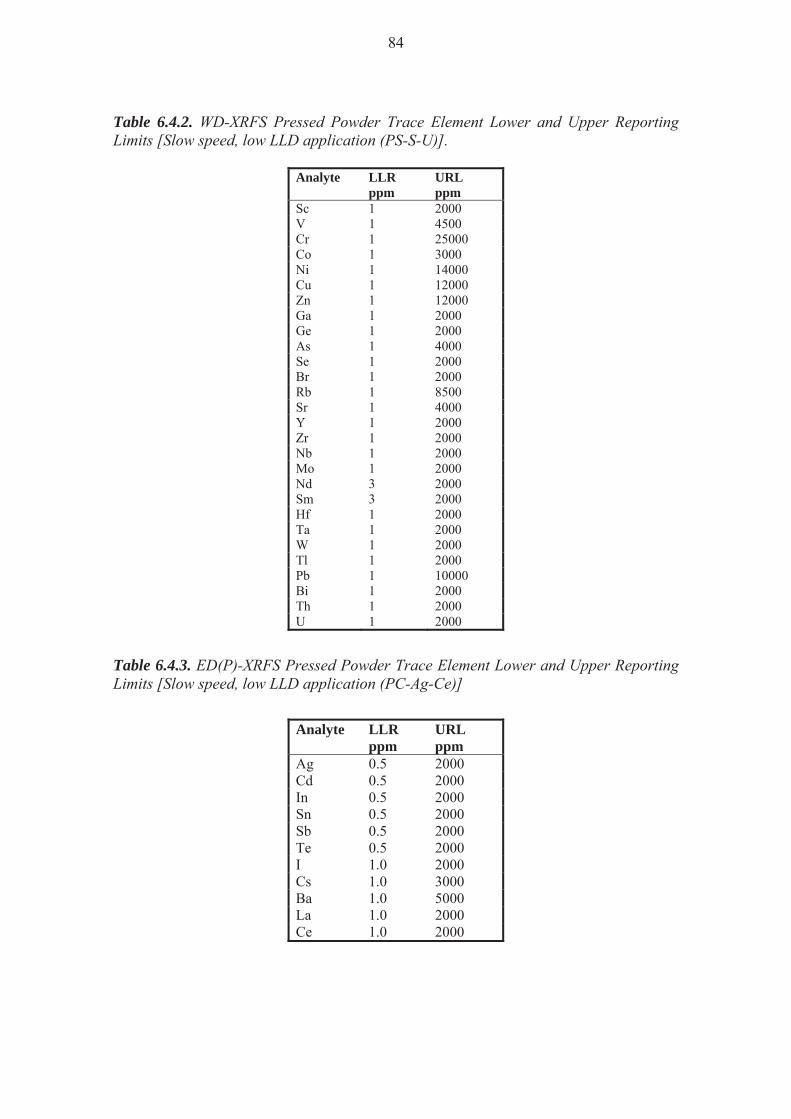
84
Table 6.4.2. WD-XRFS Pressed Powder Trace Element Lower and Upper Reporting Limits [Slow speed, low LLD application (PS-S-U)].
Analyte LLR ppm
URL ppm
Sc 1 2000 V 1 4500 Cr 1 25000 Co 1 3000 Ni 1 14000 Cu 1 12000 Zn 1 12000 Ga 1 2000 Ge 1 2000 As 1 4000 Se 1 2000 Br 1 2000 Rb 1 8500 Sr 1 4000 Y 1 2000 Zr 1 2000 Nb 1 2000 Mo 1 2000 Nd 3 2000 Sm 3 2000 Hf 1 2000 Ta 1 2000 W 1 2000 Tl 1 2000 Pb 1 10000 Bi 1 2000 Th 1 2000 U 1 2000
Table 6.4.3. ED(P)-XRFS Pressed Powder Trace Element Lower and Upper Reporting Limits [Slow speed, low LLD application (PC-Ag-Ce)]
Analyte LLR ppm
URL ppm
Ag 0.5 2000 Cd 0.5 2000 In 0.5 2000 Sn 0.5 2000 Sb 0.5 2000 Te 0.5 2000 I 1.0 2000 Cs 1.0 3000 Ba 1.0 5000 La 1.0 2000 Ce 1.0 2000

85
Table 6.4.4. Sample locations for stable oxygen and carbon isotope analyses ( 18O and 13C) for travertine deposits and carbonate mineralisation associated with the altered
Lower Pillow Lava and Perapedhi Formation bentonite sequence at Parsata and active hyperalkaline groundwater discharges at Allas Spings.
Sample Location BGS Lab No Description Analytical
Comment
Parsata Trench** MPLP897**
Irregular / discontinuous powdery calcite-filled fissures in partially weathered bentonite regolith or bentonite debris flow: Sample 3a: 50.8cm depth**
Pure calcite
Parsata Trench** MPLP897**
Irregular / discontinuous powdery calcite-filled fissures in partially weathered bentonite regolith or bentonite debris flow: Sample 3a: 50.8cm depth**
Pure calcite
Parsata: Basalt knoll adjacent
Trench 1 **
MPLQ306a
Fine carbonate mineralisation impregnating top of altered altered pillow lava**
Low carbonate content sample, admixed with altered basalt material
Parsata: Basalt knoll adjacent
Trench 1 **
MPLQ306b
Fine carbonate mineralisation impregnating top of altered altered pillow lava**
Low carbonate content sample, admixed with altered basalt material
Parsata (Kalavasos-Parsata road cutting)* MPLN847*
Calcite fracture filling in altered autobrecciated Lower Pillow Lava immediately beneath contact with overlying Perapedhi Formation: Sample P2-3*
Pure calcite
Parsata (Kalavasos-Parsata road cutting)* MPLN848* Powdery calcite fracture fill in autobrecciated Lower Pillow
Lava: Sample P2-4*
Low carbonate content sample diluted by altered basalt
Parsata (Kalavasos-Parsata road cutting)* MPLN850*
Powdery calcite fracture coating in conglomeratic sediments (basalt in chalky matrix) overlying Lower Pillow Lava: Sample P3-2*
Pure calcite
Allas Springs, Troodos A1 site *
MPLN805*
Tufa (travertine) deposit precipitated directly from hyperalkaline groundwater actively discharging through fracture in hartzbergite at Allas Springs A1 site: Sample A1-1*
Pure calcite
Allas Springs, Troodos A4 site*
MPLN814a*
Tufa (travertine) flowstone deposit precipitated directly from actively discharging hyperalkaline groundwater through fracture in hartzbergite at Allas Springs A4 site: Sample A4* Isotope sample taken from base (oldest) flowstone layer.
Pure calcite
Allas Springs, Troodos A4 site*
MPLN814b
Tufa (travertine) flowstone deposit covering stream bed, and precipitated directly from actively discharging hyperalkaline groundwater at Allas Springs A4 site: Sample A4* Isotope sample taken from youngest (top) travertine layer
Pure calcite
Allas Springs, Troodos
A1 site**
MPLQ305
Calcite cementing matrix of hartzbergite stream gravels / colluvium beneath tufa (travertine) flowstone deposit at Allas SpringsA4 site. Sample collected May 2011**
Pure calcite
* denotes samples taken from material collected and described during CNAP Phase II (Alexander and Milodowski, 2011) ** denotes samples taken from material collected and described in the present study.
6.5 Groundwater analysis Most of the analysis of the groundwater samples was carried out in the Analytical Geochemistry Laboratories of the BGS which are accredited by the United Kingdom Accreditation Service (UKAS Testing Laboratory 1816). Because a single groundwater sample was collectecd by the Cyprus Geological Survey Department, and not by the
86
BGS, and because this was collected simply as a filtered water sample with no special sample preservation in the field, for the analysed sample a reduced suite of analytes was determined compared to the previous groundwater samples analysed by Alexander and Milodowski (2011). The groundwater sample was analysed by the following methods. 6.5.1 Cation analysis
Cations were determined using inductively coupled plasma-atomic emission spectrometry (ICP-AES). The nitric acid-preserved groundwater samples were aspirated into an argon plasma and undergo rapid desolvation, atomisation and ionisation with the resultant emission of characteristic radiation from the excited atoms and ions. ICP-AES analysis is carried out on a Varian/Vista AX CCD simultaneous instrument. The instrument views the plasma along its axis and is equipped with a high resolution echelle polychromator with a 70,000 pixel charge coupled device (CCD) detector with continuous wavelength coverage from 167-785 nm. The system is controlled by a dedicated PC, running software supplied by the instrument manufacturer.
6.5.2 Anion analysis
Anions were determined using ion chromatography (IC). A known volume of sample is injected into a mobile eluent phase which passes through a separating column containing a stationary phase which differentially retards the aqueous anions, according to charge and charge mass, relative to the mobile phase. The anions are detected by suppressed conductivity detection and UV/visible absorbance detection using a Dionex DX-600 Ion Chromatograph system. The whole system is controlled and data captured by a dedicated PC, installed with the Chromeleon Software. 6.5.3 pH and speciated alkalinity analysis
pH was measured potentiometrically by immersing a hydrogen ion selective electrode and a reference electrode into the solution to be analysed. Alkalinity was measured titrimetrically by monitoring the change in pH of the solution as a function of the volume of titrant added. The pH and total alkalinity measurements are made on a Radiometer TIM 865 TitraLab with accompanying PC software TitraMaster 85 Data Collector. 6.5.4 Total organic carbon
Total organic carbon (TOC) of water samples was determined as non-purgeable organic carbon (NPOC) content. This was carried out using a Shimadzu TOC-V CPH analyser with an associated ASI-V auto-sampler. The system is controlled and data captured by a PC, installed with TOC Control V Software. NPOC analysis involves the removal of inorganic carbon content by acidification and sparging prior to analysis. The oxidation of organic carbon to carbon dioxide is achieved by high temperature combustion; the evolved carbon dioxide is then measured using a non-dispersive infra-red (NDIR) detector.
87
6.5.5 Natural decay series
Purification and separation of U and Th A subsample of groundwater was transferred from its container to a glass beaker and dried down to approximately 300 ml on a hotplate; small amounts of iron (Fe3+) and aluminium (Al3+) carriers were added (to aid precipitation during scavenging) along with 1 mL of 232U in transient equilibrium with 228Th as a yield tracer (232U activity: 0.162 Bq ml-1). An Fe(OH)3 scavenge was performed to remove U and Th by dropwise addition of ammonia solution (35 %, Fischer Scientific, UK) until precipitation occurred. The precipitate formed (containing the U and Th) was washed thoroughly with reverse osmosis water via centrifugation until all of the ammonia was removed. Once washed the precipitate was dissolved in a small amount of conc. HCl (Acros Organics, UK), dried and taken up in ~ 25 mL of 9 M HCl before being transferred to a centrifuge tube. A DIPE extraction (Isopropyl ether, 99+%, Acros Organics, UK) was then performed to remove iron. Separation of uranium from thorium was performed by ion exchange using Bio Rad AG1-X8 exchange resin (100-200 mesh). Columns were plugged with quartz glass wool before adding approximately 6 cm of the prepared resin after which, the column was acid conditioned with firstly 1.2 M HCl followed by 9 M HCl. The sample was quantitatively transferred to the column and washed through with approximately 75 mL HCl allowing the Th to pass straight through the column whilst simultaneously trapping the U. The Th fraction was completely dried and taken up in 4 M HNO3. An aluminium precipitation was performed by addition of ammonia solution until a white precipitate formed. The resultant precipitate was washed in reverse osmosis water to remove any traces of ammonia solution before dissolution in a minimal amount of conc. HNO3. The solution was taken to dryness and ~ 50 mL of 8 M HNO3 added. A second column was prepared (as described above) and pre-conditioned with firstly 1.2 M HCl followed by 8 M HNO3 respectively. The thorium fraction was added to the second column, followed by ~ 75 mL 8 M HNO3. The Th fraction was then eluted from the second column with 100 mL 9 M HCl. Finally the Th fraction was taken to dryness and prepared for electrodeposition. The U fraction was eluted from the first ion exchange column with 150 ml of 1.2 M HCl and dried to ~ 30 mL. Electrodeposition of U and Th for alpha spectroscopy Both U and Th were electrodeposited in the same way. Each fraction was first dried and then dissolved in a few drops of 1.2M HCl, after which 30ml of plating solution (3.75 % ammonium chloride) was added. Each fraction was then introduced to an individual plating cell, ensuring that the electrode was positioned correctly over the stainless steel planchette. Samples were then plated for ~ 1.5 hours at a current of 3 amps. Once electroplating was complete the planchettes were dried and transferred to an Ortec Octete Plus alpha spectroscopy system and alpha spectra were recorded for approximately 1 week.

88
89
7 ANALYTICAL RESULTS 7.1 Mineralogical results 7.1.1 Results
Whole-rock analysis The results of quantitative whole-rock XRD analyses are summarised in Tables 7.1.1a and b and the general distribution of the amorphous and major crystalline phases is illustrated in Figure 7.1.1. The samples are predominantly composed of smectite (10 to 40 %, mean 25 %), cristobalite (nd to 45.5 %, mean 12 %), quartz (0.6 to 16 %, mean 8 %), zeolites (nd to 15 %, mean 7 %), plagioclase feldspar (nd to 12 %, mean 4 %) and ‘mica’ (undifferentiated mica species possibly including muscovite, biotite, illite, illite/smectite, nd to 6 %, mean 3 %) ± calcite, pyroxene, palygorskite, manganite, goethite, pyrite, pyrolusite, chlorite, hematite and amphibole. Quantitative XRD also suggest that the samples contain a significant amount of X-ray amorphous material (19 to 53 %, mean 34 %). The amorphous content shows no apparent systematic variation with borehole/trench depth but appears to generally correspond with smectite content. The highest amorphous contents were found in the Trench 1 samples from ca.112 cm and ca.165 cm (note that 2-ethoxethanol surface area analyses carried out on four of the samples produced values ranging from 398 to 682 m2g-1, equivalent to smectite contents between 50 and 85 %. The surface-area derived contents approximate to the combined XRD smectite and amorphous contents which would seem to indicate that the XRD amorphous content has a similar surface area to smectite. It is therefore probable that the amorphous content is a more poorly-ordered form of smectite. Cristobalite contents typically exhibit a ‘zig-zag’ type distribution in the borehole samples (e.g. Parsata 1 and 2). However in the Parsata 4 borehole samples, cristobalite content increases with increasing depth to ca.15 m, below which it was not detected or only detected in trace amounts. Cristobalite was not detected or only detected in trace amounts in the Trench 1 samples. Four different zeolite-group minerals were identified in the Cyprus samples. Clinoptilolite/heulandite species were almost ubiquitously encountered in the samples while significant amounts of phillipsite were also identified in the lowermost samples from Parsata 4 and Trench 1, apparently associated with the pillow lavas. Traces of stilbite were also tentatively identified in the sample from 127 cm in Trench 1. Overall, zeolite concentrations show an increase with increasing depth in Parsata 1 and 2 but a general decrease with depth in Parsata 4 and Trench 1, although in the latter two cases the deepest samples show increased zeolite proportions. Carbonate species are generally absent from the majority of the borehole profiles (e.g. Parsata 1) but calcite forms a significant component of the shallowest samples from Parsata 2 and the deepest samples from Parsata 4. Small quantities of calcite were also
90
identified in the upper part of Trench 1 with more significant concentrations at ca.152 and 178 cm. Plagioclase feldspar forms a minor component of all the samples with the exception of a zone towards the base of Trench 1. XRD analysis suggests that the plagioclase generally has an albitic composition, but this changes to a more calcic composition from ca.101 to 160 cm in Trench 1. Minor to trace proportions of the manganese-bearing minerals manganite and pyrolusite were also identified in some of the samples and particularly those where a black colouration was noted (e.g. Trench 1 shallow samples). The pillow lava samples from 165 and 173 cm in Trench 1 are characterised by the presence of pyroxene and minor amounts of amphibole. Clay mineral analysis The results of quantitative <2 μm XRD analyses are summarised in Table 7.1.2 and the downhole variation plots of Figure 7.1.2. XRD analysis suggests that the clay mineral assemblages of the samples are predominantly composed of smectite together with minor amounts of palygorskite and illite and traces of chlorite. In all cases, the separated <2 μm fractions also contain a variety of non-clay minerals including quartz, albite, zeolites and calcite. In the Parsata 1 and 2 boreholes, the clay mineral assemblages show little overall variation except for a minor decrease in smectite and the removal of trace quantities of chlorite with increasing depth that corresponds with an increase in illite. Similar distributions are shown by the samples from the top ca.16 m of Parsata 4. However below ca.16 m in Parsata 4, smectite contents increase and illite is absent, reflecting the change in lithology from clay to pillow lavas. The distribution of clay minerals in the Trench 1 samples is again similar to those described for Parsata 1 and 2 and shows an overall decrease in smectite and increase in illite over the sampled interval. However, perhaps reflecting the more limited depth interval sampled, the clay mineral profiles shows a greater degree of fluctuation in their concentrations. The following criteria were used to identify and quantify the clay mineral assemblages: Smectite was identified by its typical air-dry d001 spacing of ca.14.5Å which expands to a similarly typical ca.16.9Å on glycol-solvation and collapses under heating to 550 °C for 2 hours to an ‘illite-like’ 10Å d001 spacing. Newmod-modelling suggests some variation but that the smectite has an average mean defect-free distance of ca.3 layers (14Å units) and a size range between 1 and 8 layers. Smectite was quantified from the area beneath the d003 peak. Corrected measurements of the smectite d060 spacing on the random powder traces (Table 7.1.3) produces a mean spacing of ca.1.51Å indicating that the smectite is dioctahedral and probably a montmorillonite. However, this slightly larger value than typically produced by montmorillonites (1.49-1.50Å) indicates a degree of Fe-enrichment (Figures 7.1.2 and 7.1.3). On the basis of
91
the d060 spacings, the montmorillonite appears to become more Fe-rich with depth in the borehole profiles (with the exception of the deepest samples in Parsata 4). In some of the samples a double d060 peak is discernable, this secondary d060 spacing suggesting the additional presence of another more Fe-rich montmorillonite. In the shallowest sample in Parsata 2, the two deepest samples in Parsata 4 and two of the deeper samples in Trench 1, this secondary d060 spacing reaches c.1.52Å which may indicate the presence of nontronite together with the montmorillonite (Table 7.1.2 and Figures 7.1.2 and 7.1.3). Peak intensity ratios for the smectite d002/d003 may also provide an indication of Fe substitution or scattering from the octahedral sheet (Table 7.1.2). Newmod-modelled profiles were produced for the increasing Fe content categories: montmorillonite senso stricto, non-ideal montmorillonite, Fe-rich montmorillonite and nontronite identified by Newman and Brown (1987) and their d002/d003 measured. The data for the samples are compared to these standard measurements in Figures 7.1.2 and 7.1.3. The majority of the samples consistently fall within the non-ideal montmorillonite composition (0.5 to 1.2 Fe3+ per O20(OH)4). The two deepest samples in Parsata 4 (Figure 7.1.4) together with two samples (ca.20 and ca.38 m) in Parsata 2 show Fe-rich montmorillonite compositions (1.2 to 3.0 Fe3+ per O20(OH)4). Several samples towards the base of Trench 1 show montmorillonite senso stricto compositions (<0.5 Fe3+ per O20(OH)4). None of the samples produce overall d002/d003 peak ratios indicative of nontronite, perhaps suggesting that if it is present, it is subordinate to less Fe-rich montmorillonite. Illite was identified as a minor-trace component of the clay mineral assemblage by its characteristic air-dry d001 spacing of ca.10.0Å which remains invariant after glycol-solvation and heating. Quantification was based on the area beneath the illite d002 peak on the ethylene glycol trace. Newmod-modelling suggests a range of crystallite-size distributions with mean defect-free distances of between 9 and 25 layers (10Å units) and a size range of between 1 to 80 layers. Chlorite was tentatively identified as a trace component of some of the clay mineral assemblages by its characteristic air-dry and glycol-solvated basal spacing peaks at 7.1, 4.73 and 3.54Å. The low intensity of these peaks and non-resolution of the 14.2Å spacing due to overlap with the more intense smectite d001, meant that further characterisation of the chlorite was impossible. An intermediate Mg/Fe- chlorite composition was therefore adopted for Newmod-modelling and chlorite quantification was based on the area beneath its d001 peak on the ethylene glycol trace. Palygorskite was identified as a minor component of many of the samples. In most cases this identification was based solely on the appearance of a broad peak/shoulder at ca.10.5 Å (d011) which remains invariant after glycol-solvation. Occasionally a second peak at ca.6.4Å was discernable. The fibrous nature of the palygorskite precludes the production of oriented mounts to enhance d00l planes and therefore quantification using Newmod-modelling. However, on the basis of its relative X-ray peak heights/areas, it is likely that palygorskite forms only a minor component of most of the <2 μm fractions. Palygorskite forms a greater proportion of the clay assemblage of the sample from Trench 1, 160 cm. For completeness, semi-quantitative descriptors are therefore shown in Table 7.1.2. Example <2 μm XRD traces are shown in Figure 7.1.5.
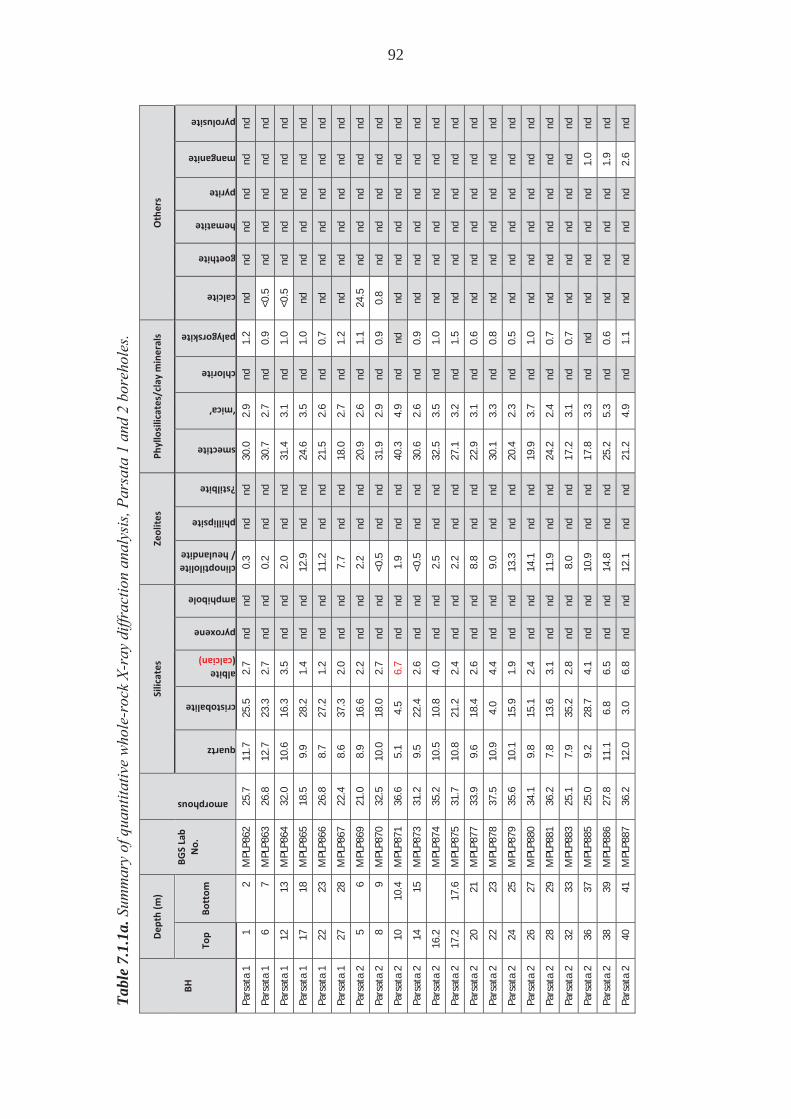
Tabl
e 7.
1.1a
. Sum
mar
y of
qua
ntita
tive
who
le-r
ock
X-ra
y di
ffrac
tion
anal
ysis
, Par
sata
1 a
nd 2
bor
ehol
es.
BH
Dep
th(m
)
BGSLab
No.
amorphous
Silicates
Zeolites
Phyllosilicates/clayminerals
Others
Top
Bottom
quartz
cristobalite
albite(calcian)
pyroxene
amphibole
clinoptilolite/heulandite
phillipsite
?stilbite
smectite
‘mica’
chlorite
palygorskite
calcite
goethite
hematite
pyrite
manganite
pyrolusite
Pars
ata
11
2M
PLP8
6225
.711
.725
.52.
7nd
nd0.
3nd
nd30
.02.
9nd
1.2
ndnd
ndnd
ndnd
Pars
ata
16
7M
PLP8
6326
.812
.723
.32.
7nd
nd0.
2nd
nd30
.72.
7nd
0.9
<0.5
ndnd
ndnd
nd
Pars
ata
112
13M
PLP8
6432
.010
.616
.33.
5nd
nd2.
0nd
nd31
.43.
1nd
1.0
<0.5
ndnd
ndnd
nd
Pars
ata
117
18M
PLP8
6518
.59.
928
.21.
4nd
nd12
.9nd
nd24
.63.
5nd
1.0
ndnd
ndnd
ndnd
Pars
ata
122
23M
PLP8
6626
.88.
727
.21.
2nd
nd11
.2nd
nd21
.52.
6nd
0.7
ndnd
ndnd
ndnd
Pars
ata
127
28M
PLP8
6722
.48.
637
.32.
0nd
nd7.
7nd
nd18
.02.
7nd
1.2
ndnd
ndnd
ndnd
Pars
ata
25
6M
PLP8
6921
.08.
916
.62.
2nd
nd2.
2nd
nd20
.92.
6nd
1.1
24.5
ndnd
ndnd
nd
Pars
ata
28
9M
PLP8
7032
.510
.018
.02.
7nd
nd<0
.5nd
nd31
.92.
9nd
0.9
0.8
ndnd
ndnd
nd
Pars
ata
210
10.4
MPL
P871
36.6
5.1
4.5
6.7
ndnd
1.9
ndnd
40.3
4.9
ndnd
ndnd
ndnd
ndnd
Pars
ata
214
15M
PLP8
7331
.29.
522
.42.
6nd
nd<0
.5nd
nd30
.62.
6nd
0.9
ndnd
ndnd
ndnd
Pars
ata
216
.2M
PLP8
7435
.210
.510
.84.
0nd
nd2.
5nd
nd32
.53.
5nd
1.0
ndnd
ndnd
ndnd
Pars
ata
217
.217
.6M
PLP8
7531
.710
.821
.22.
4nd
nd2.
2nd
nd27
.13.
2nd
1.5
ndnd
ndnd
ndnd
Pars
ata
220
21M
PLP8
7733
.99.
618
.42.
6nd
nd8.
8nd
nd22
.93.
1nd
0.6
ndnd
ndnd
ndnd
Pars
ata
222
23M
PLP8
7837
.510
.94.
04.
4nd
nd9.
0nd
nd30
.13.
3nd
0.8
ndnd
ndnd
ndnd
Pars
ata
224
25M
PLP8
7935
.610
.115
.91.
9nd
nd13
.3nd
nd20
.42.
3nd
0.5
ndnd
ndnd
ndnd
Pars
ata
226
27M
PLP8
8034
.19.
815
.12.
4nd
nd14
.1nd
nd19
.93.
7nd
1.0
ndnd
ndnd
ndnd
Pars
ata
228
29M
PLP8
8136
.27.
813
.63.
1nd
nd11
.9nd
nd24
.22.
4nd
0.7
ndnd
ndnd
ndnd
Pars
ata
232
33M
PLP8
8325
.17.
935
.22.
8nd
nd8.
0nd
nd17
.23.
1nd
0.7
ndnd
ndnd
ndnd
Pars
ata
236
37M
PLP8
8525
.09.
228
.74.
1nd
nd10
.9nd
nd17
.83.
3nd
ndnd
ndnd
nd1.
0nd
Pars
ata
238
39M
PLP8
8627
.811
.16.
86.
5nd
nd14
.8nd
nd25
.25.
3nd
0.6
ndnd
ndnd
1.9
nd
Pars
ata
240
41M
PLP8
8736
.212
.03.
06.
8nd
nd12
.1nd
nd21
.24.
9nd
1.1
ndnd
ndnd
2.6
nd
92
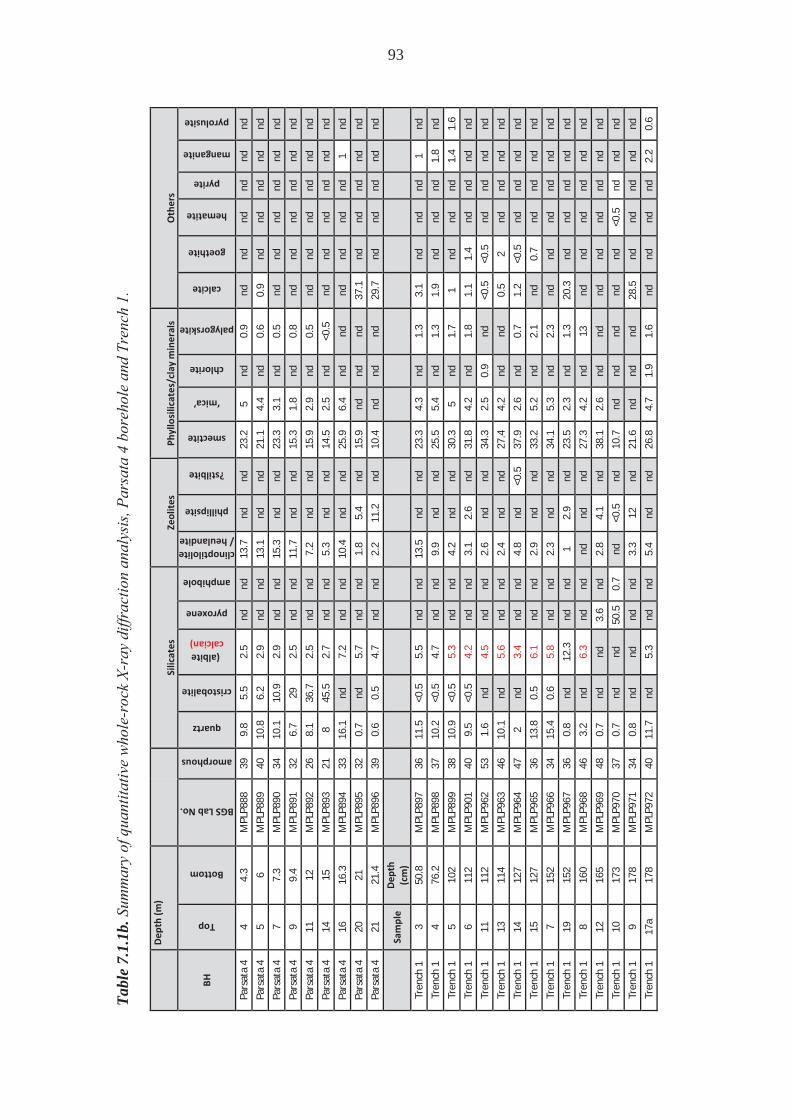
Tabl
e 7.
1.1b
. Sum
mar
y of
qua
ntita
tive
who
le-r
ock
X-ra
y di
ffrac
tion
anal
ysis
, Par
sata
4 b
oreh
ole
and
Tren
ch 1
.
Dep
th(m
)Silicates
Zeolites
Phyllosilicates/clayminerals
Others
BHTop
Bottom
BGSLabNo.
amorphous
quartz
cristobalite
(albitecalcian)
pyroxene
amphibole
clinoptilolite/heulandite
phillipsite
?stilbite
smectite
‘mica’
chlorite
palygorskite
calcite
goethite
hematite
pyrite
manganite
pyrolusite
Pars
ata
44
4.3
MPL
P888
399.
85.
52.
5nd
nd13
.7nd
nd23
.25
nd0.
9nd
ndnd
ndnd
nd
Pars
ata
45
6M
PLP8
8940
10.8
6.2
2.9
ndnd
13.1
ndnd
21.1
4.4
nd0.
60.
9nd
ndnd
ndnd
Pars
ata
47
7.3
MPL
P890
3410
.110
.92.
9nd
nd15
.3nd
nd23
.33.
1nd
0.5
ndnd
ndnd
ndnd
Pars
ata
49
9.4
MPL
P891
326.
729
2.5
ndnd
11.7
ndnd
15.3
1.8
nd0.
8nd
ndnd
ndnd
nd
Pars
ata
411
12M
PLP8
9226
8.1
36.7
2.5
ndnd
7.2
ndnd
15.9
2.9
nd0.
5nd
ndnd
ndnd
nd
Pars
ata
414
15M
PLP8
9321
845
.52.
7nd
nd5.
3nd
nd14
.52.
5nd
<0.5
ndnd
ndnd
ndnd
Pars
ata
416
16.3
MPL
P894
3316
.1nd
7.2
ndnd
10.4
ndnd
25.9
6.4
ndnd
ndnd
ndnd
1nd
Pars
ata
420
21M
PLP8
9532
0.7
nd5.
7nd
nd1.
85.
4nd
15.9
ndnd
nd37
.1nd
ndnd
ndnd
Pars
ata
421
21.4
MPL
P896
390.
60.
54.
7nd
nd2.
211
.2nd
10.4
ndnd
nd29
.7nd
ndnd
ndnd
Sample
Dep
th(cm)
Tren
ch1
350
.8M
PLP8
9736
11.5
<0.5
5.5
ndnd
13.5
ndnd
23.3
4.3
nd1.
33.
1nd
ndnd
1nd
Tren
ch1
476
.2M
PLP8
9837
10.2
<0.5
4.7
ndnd
9.9
ndnd
25.5
5.4
nd1.
31.
9nd
ndnd
1.8
nd
Tren
ch1
510
2M
PLP8
9938
10.9
<0.5
5.3
ndnd
4.2
ndnd
30.3
5nd
1.7
1nd
ndnd
1.4
1.6
Tren
ch1
611
2M
PLP9
0140
9.5
<0.5
4.2
ndnd
3.1
2.6
nd31
.84.
2nd
1.8
1.1
1.4
ndnd
ndnd
Tren
ch1
1111
2M
PLP9
6253
1.6
nd4.
5nd
nd2.
6nd
nd34
.32.
50.
9nd
<0.5
<0.5
ndnd
ndnd
Tren
ch1
1311
4M
PLP9
6346
10.1
nd5.
6nd
nd2.
4nd
nd27
.44.
2nd
nd0.
52
ndnd
ndnd
Tren
ch1
1412
7M
PLP9
6447
2nd
3.4
ndnd
4.8
nd<0
.537
.92.
6nd
0.7
1.2
<0.5
ndnd
ndnd
Tren
ch1
1512
7M
PLP9
6536
13.8
0.5
6.1
ndnd
2.9
ndnd
33.2
5.2
nd2.
1nd
0.7
ndnd
ndnd
Tren
ch1
715
2M
PLP9
6634
15.4
0.6
5.8
ndnd
2.3
ndnd
34.1
5.3
nd2.
3nd
ndnd
ndnd
nd
Tren
ch1
1915
2M
PLP9
6736
0.8
nd12
.3nd
nd1
2.9
nd23
.52.
3nd
1.3
20.3
ndnd
ndnd
nd
Tren
ch1
816
0M
PLP9
6846
3.2
nd6.
3nd
ndnd
ndnd
27.3
4.2
nd13
ndnd
ndnd
ndnd
Tren
ch1
1216
5M
PLP9
6948
0.7
ndnd
3.6
nd2.
84.
1nd
38.1
2.6
ndnd
ndnd
ndnd
ndnd
Tren
ch1
1017
3M
PLP9
7037
0.7
ndnd
50.5
0.7
nd<0
.5nd
10.7
ndnd
ndnd
nd<0
.5nd
ndnd
Tren
ch1
917
8M
PLP9
7134
0.8
ndnd
ndnd
3.3
12nd
21.6
ndnd
nd28
.5nd
ndnd
ndnd
Tren
ch1
17a
178
MPL
P972
4011
.7nd
5.3
ndnd
5.4
ndnd
26.8
4.7
1.9
1.6
ndnd
ndnd
2.2
0.6
93
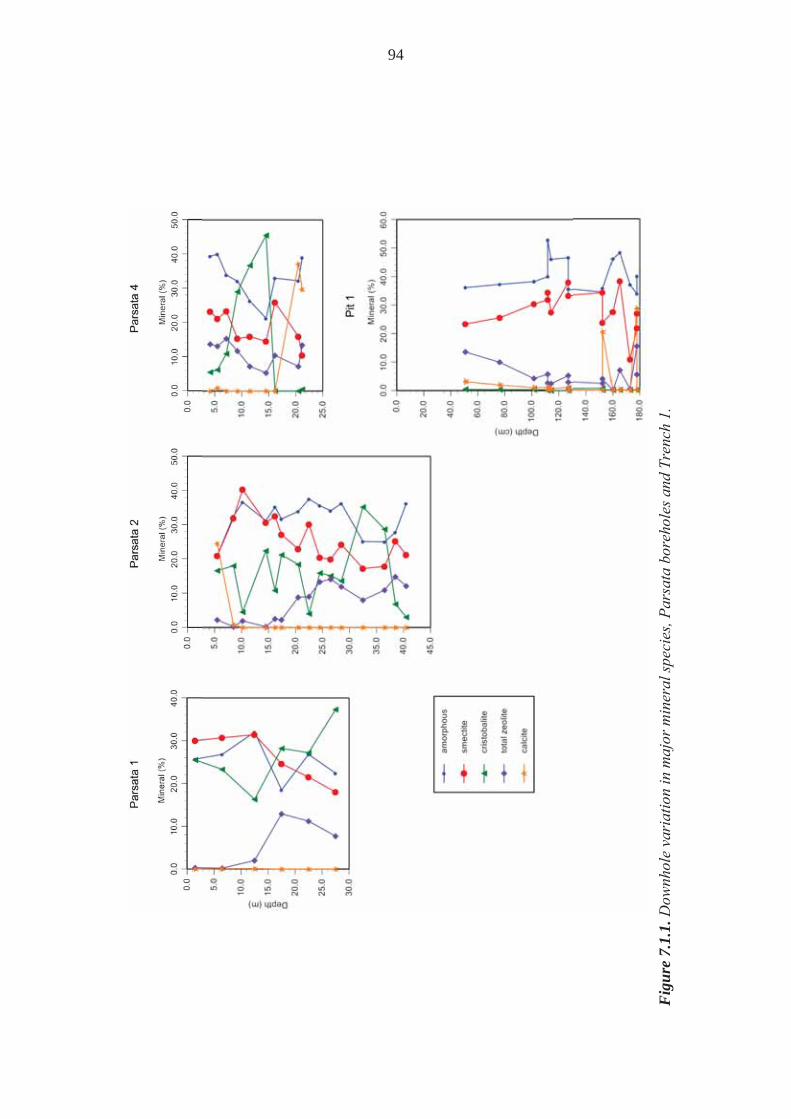
Fig
ure
7.1.
1. D
ownh
ole
vari
atio
n in
maj
or m
iner
al sp
ecie
s, Pa
rsat
a bo
reho
les a
nd T
renc
h 1.
94

Tabl
e 7.
1.2.
Sum
mar
y of
<2 μm
cla
y m
iner
al X
-ray
diff
ract
ion
anal
yses
(inc
reas
ed c
once
ntra
tions
show
n in
red)
. Pa
rsata
BHDep
th(m
)MPL
code
Relative
%of
clay
mineralsin
<2μm
fraction
Non
clay
minerals
Smectite
Top
Bottom
Smectite
Illite
Chlorite
Palygo
rskite
d060
002/00
3
1 1
2MPLP8
6296
30.
6m
inor
quar
tz,z
eolit
e,al
bite
1.50
130.
9
1 6
7MPLP8
6396
4<0
.5m
inor
quar
tz,a
lbite
1.50
250.
9
1 12
13MPLP8
6495
50.
5m
inor
quar
tz,z
eolit
e,al
bite
1.50
190.
9
1 17
18MPLP8
6594
6<0
.5m
inor
quar
tz,z
eolit
e,al
bite
1.50
320.
9
1 22
23MPLP8
6693
7nd
min
orqu
artz
,zeo
lite,
albi
te1.
5048
0.9
1 27
28MPLP8
6783
17nd
min
orqu
artz
,zeo
lite,
albi
te1.
5066
0.9
2 5
6MPLP8
6995
5<0
.5m
inor
quar
tz,c
alci
te,z
eolit
e,al
bite
1.50
89(1
.524
4)0.
9
2 8
9MPLP8
7097
2<0
.5m
inor
quar
tz,a
lbite
1.50
170.
9
2 10
10.4
MPLP8
7198
2<0
.5nd
quar
tz,a
lbite
1.49
920.
7
2 14
15MPLP8
7398
2<0
.5nd
quar
tz1.
5007
0.8
2 16
.2MPLP8
7496
3<0
.5m
inor
quar
tz,z
eolit
e,al
bite
1.50
240.
9
2 17
.217
.6MPLP8
7593
6<0
.5m
inor
quar
tz,z
eolit
e,al
bite
1.50
200.
9
2 20
21MPLP8
7797
3<0
.5m
inor
quar
tz1.
5032
1.1
2 22
23MPLP8
7896
4nd
min
orqu
artz
,zeo
lite,
albi
te1.
5045
1.0
2 24
25MPLP8
7995
5nd
min
orqu
artz
,zeo
lite,
albi
te1.
5049
0.9
2 26
27MPLP8
8095
5nd
min
orqu
artz
,zeo
lite
1.50
460.
9
2 28
29MPLP8
8195
5nd
min
orqu
artz
,zeo
lite
1.50
400.
9
2 32
33MPLP8
8390
10nd
min
orqu
artz
,zeo
lite
1.50
64(1
.510
7)0.
9
2 36
37MPLP8
8593
7nd
min
orqu
artz
,zeo
lite,
albi
te1.
5074
(1.5
103)
1.0
2 38
39MPLP8
8690
10nd
min
orqu
artz
,zeo
lite
(?2)
,alb
ite1.
5069
(1.5
112)
1.1
2 40
41MPLP8
8784
16nd
min
orqu
artz
,zeo
lite
(?2)
,alb
ite1.
5053
(1.5
101)
0.9
4 4.
04.
3MPLP8
8895
5nd
min
orqu
artz
,zeo
lite,
albi
te1.
5047
1.0
4 5.
06.
0MPLP8
8993
7nd
min
orqu
artz
,zeo
lite,
albi
te1.
5041
0.9
4 7.
07.
3MPLP8
9094
6nd
min
orqu
artz
,zeo
lite,
albi
te1.
5046
1.0
4 9.
09.
4MPLP8
9192
8nd
min
orqu
artz
,zeo
lite,
albi
te1.
5037
0.8
4 11
.012
.0MPLP8
9292
8nd
min
orqu
artz
,zeo
lite
1.50
64(1
.510
5)0.
9
4 14
.015
.0MPLP8
9385
15nd
min
orqu
artz
,zeo
lite,
albi
te1.
5069
(1.5
107)
0.8
4 16
.016
.3MPLP8
9475
25nd
ndqu
artz
,zeo
lite,
albi
te1.
5079
(1.5
103)
0.9
4 20
.021
.0MPLP8
9510
00
ndnd
calc
ite,q
uart
z,ze
olite
,alb
ite1.
5043
(1.5
228)
1.6
4 21
.021
.4MPLP8
9699
01.
2nd
calc
ite,q
uart
z,ze
olite
,alb
ite1.
5028
(1.5
238)
1.8
95

Ta
ble
7.1.
2. S
umm
ary
of <
2 μm
cla
y m
iner
al X
-ray
diff
ract
ion
anal
yses
(inc
reas
ed c
once
ntra
tions
show
n in
red)
(con
tinue
d).
Trench
SampleDep
th(cm)
MPL
code
Relative
%of
clay
mineralsin
<2μm
fraction
Non
clay
minerals
Smectite
Smectite
Illite
Chlorite
Palygo
rskite
d060
002/00
3
1 3
50.8
MPLP8
9792
8nd
min
orqu
artz
,zeo
lite
(?2)
,alb
ite1.
5067
0.9
1 4
76.2
MPLP8
9889
11<0
.5m
inor
quar
tz,z
eolit
e,al
bite
1.50
610.
9
1 5
101.
6MPLP8
9984
15<0
.5m
inor
quar
tz,z
eolit
e,al
bite
1.50
510.
7
1 6
111.
8MPLP9
0189
10<0
.5m
inor
quar
tz,z
eolit
e,al
bite
1.50
670.
7
1 11
111.
8MPLP9
6298
1<0
.5nd
quar
tz,a
lbite
1.50
580.
7
1 13
114.
3MPLP9
6381
19<0
.5m
inor
quar
tz,z
eolit
e,al
bite
1.50
750.
8
1 14
127.
0MPLP9
6496
3<0
.5m
inor
quar
tz,a
lbite
1.50
500.
7
1 15
127.
0MPLP9
6588
110.
6m
inor
quar
tz,z
eolit
e,al
bite
1.50
690.
7
1 7
152.
4MPLP9
6685
14<0
.5m
inor
quar
tz,a
lbite
1.50
640.
8
1 19
152.
4MPLP9
6798
2<0
.5m
inor
quar
tz,z
eolit
e,al
bite
1.50
92(1
.523
49)
0.7
1 8
160.
0MPLP9
6896
4<0
.5m
inor
quar
tz,z
eolit
e1.
5063
0.6
1 12
165.
1MPLP9
6998
2<0
.5m
inor
quar
tz,z
eolit
e,al
bite
1.50
100.
5
1 10
172.
7MPLP9
7010
00
ndnd
quar
tz1.
5028
0.6
1 9
177.
8MPLP9
7194
41.
2nd
quar
tz,a
lbite
,cal
cite
1.50
94(1
.522
75)
0.9
1 17
a17
7.8
MPLP9
7280
181.
5m
inor
quar
tz,z
eolit
e,al
bite
,7.9
A1.
5045
0.6
96
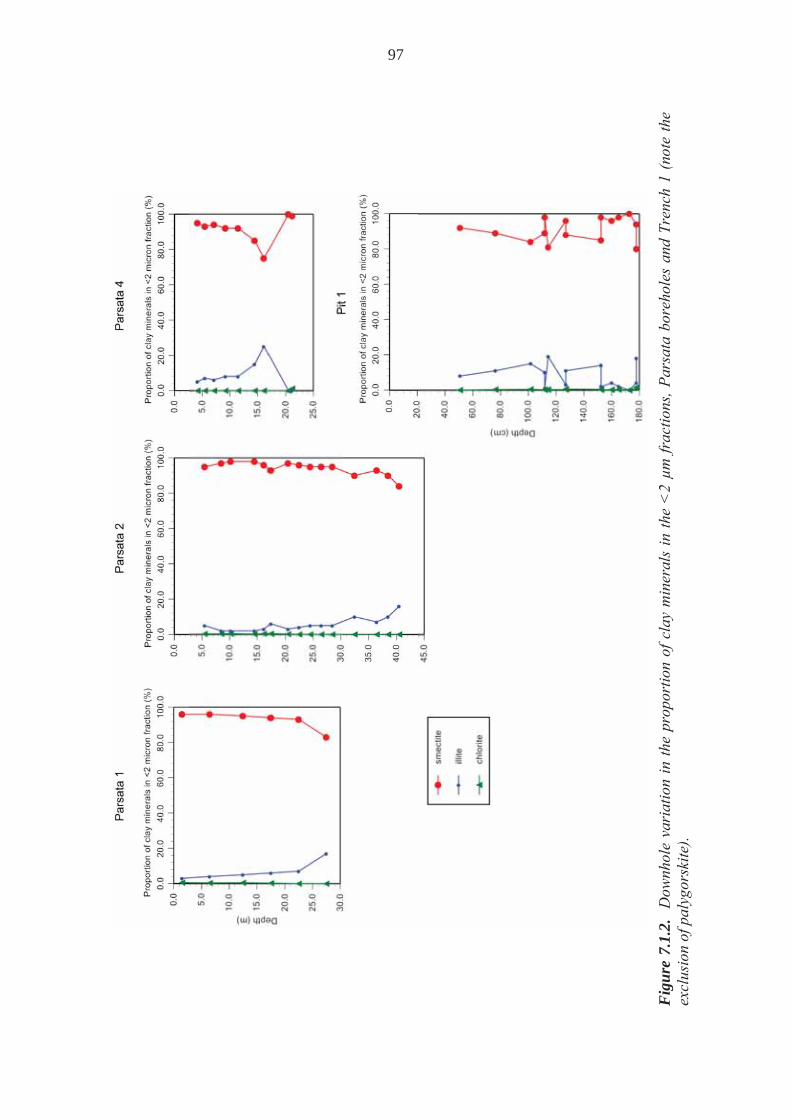
F
igur
e 7.
1.2.
D
ownh
ole
vari
atio
n in
the
prop
ortio
n of
cla
y m
iner
als
in th
e <
2 μm
frac
tions
, Par
sata
bor
ehol
es a
nd T
renc
h 1
(not
e th
e ex
clus
ion
of p
alyg
orsk
ite).
97
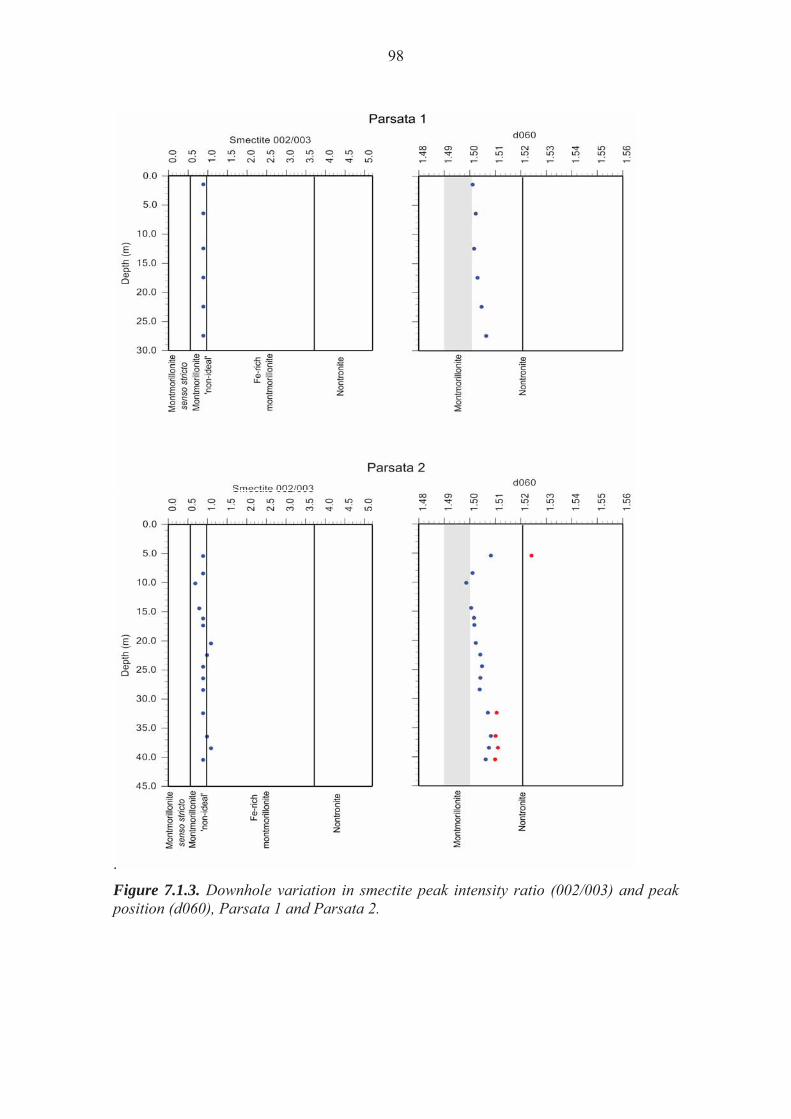
98
.
Figure 7.1.3. Downhole variation in smectite peak intensity ratio (002/003) and peak position (d060), Parsata 1 and Parsata 2.
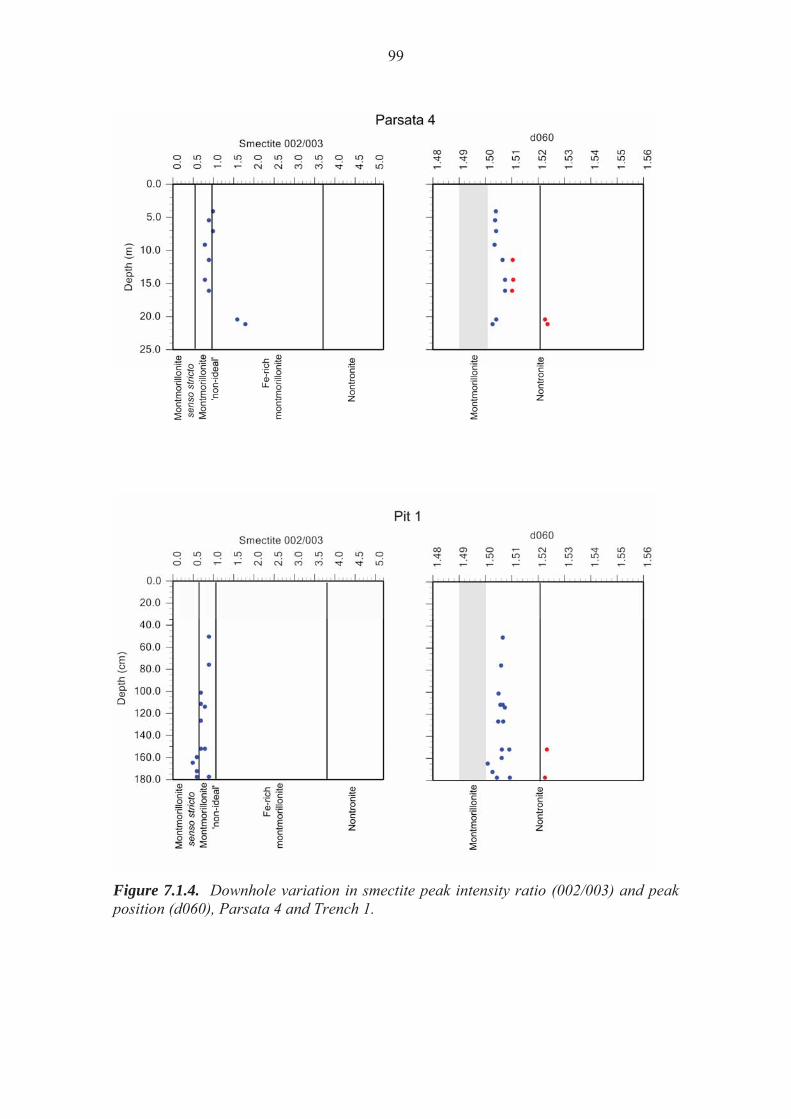
99
Figure 7.1.4. Downhole variation in smectite peak intensity ratio (002/003) and peak position (d060), Parsata 4 and Trench 1.
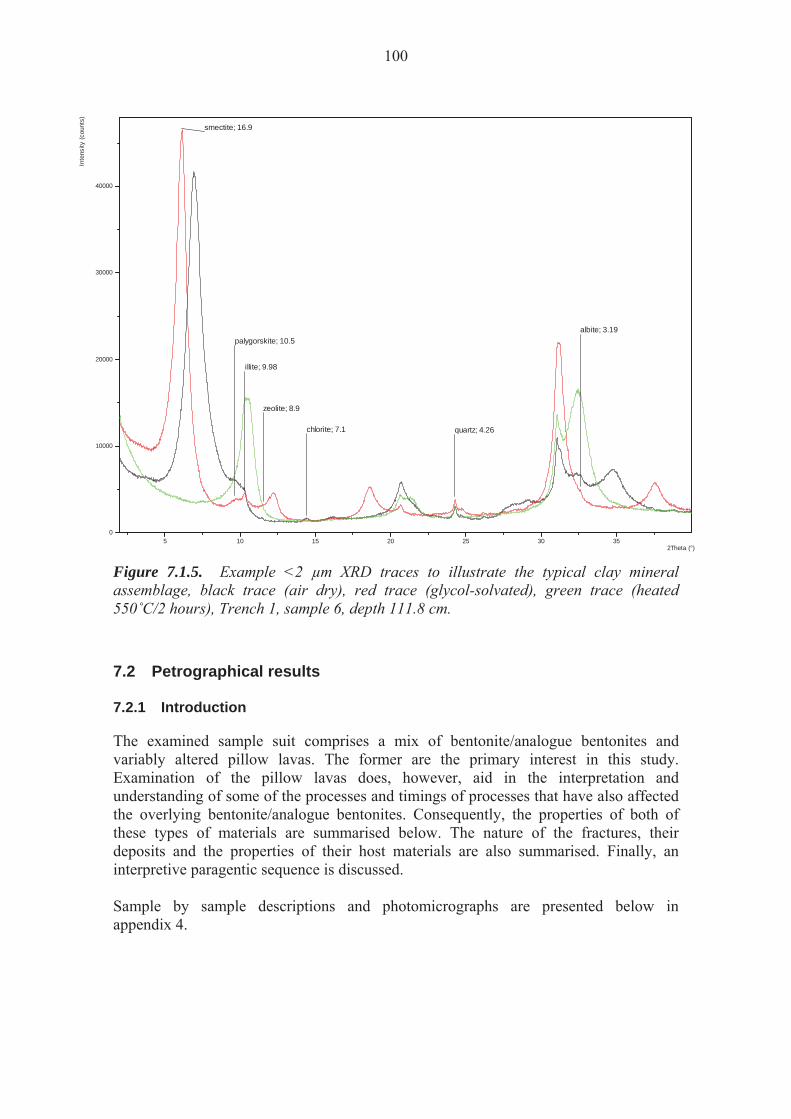
100
5 10 15 20 25 30 352Theta (°)
0
10000
20000
30000
40000
Inte
nsity
(cou
nts)
smectite; 16.9
palygorskite; 10.5
illite; 9.98
chlorite; 7.1
zeolite; 8.9
quartz; 4.26
albite; 3.19
Figure 7.1.5. Example <2 μm XRD traces to illustrate the typical clay mineral assemblage, black trace (air dry), red trace (glycol-solvated), green trace (heated 550 C/2 hours), Trench 1, sample 6, depth 111.8 cm. 7.2 Petrographical results 7.2.1 Introduction
The examined sample suit comprises a mix of bentonite/analogue bentonites and variably altered pillow lavas. The former are the primary interest in this study. Examination of the pillow lavas does, however, aid in the interpretation and understanding of some of the processes and timings of processes that have also affected the overlying bentonite/analogue bentonites. Consequently, the properties of both of these types of materials are summarised below. The nature of the fractures, their deposits and the properties of their host materials are also summarised. Finally, an interpretive paragentic sequence is discussed. Sample by sample descriptions and photomicrographs are presented below in appendix 4.
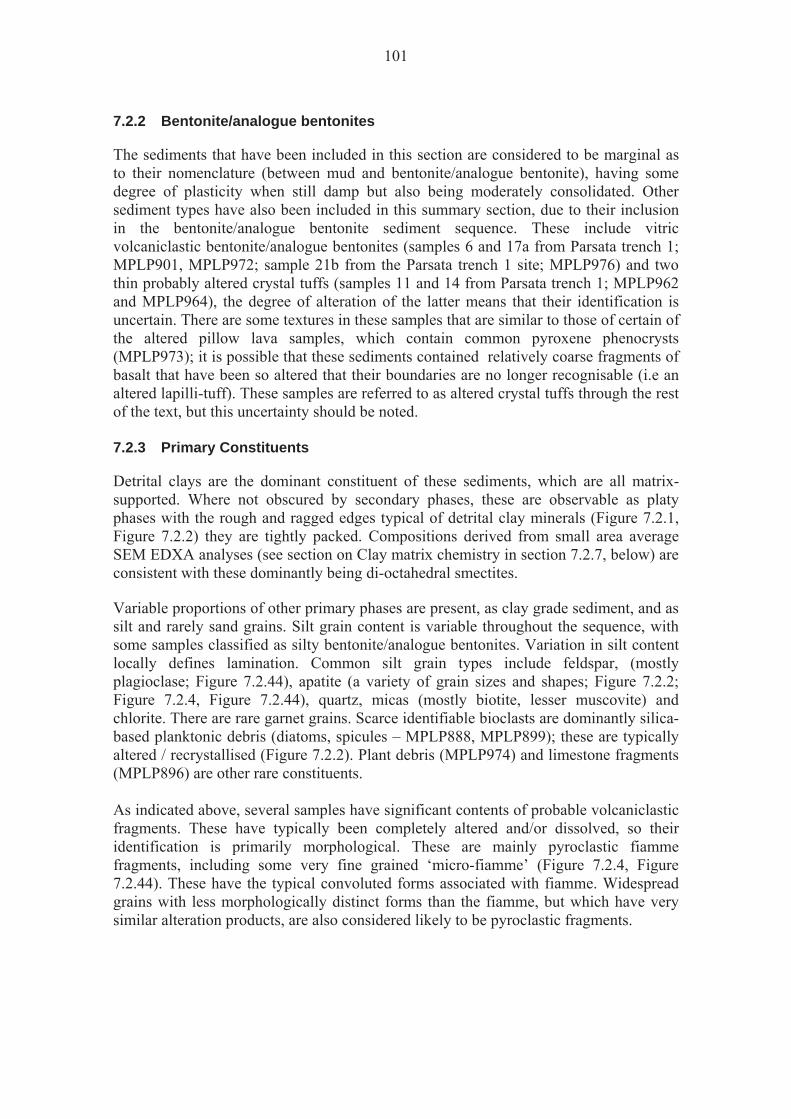
101
7.2.2 Bentonite/analogue bentonites
The sediments that have been included in this section are considered to be marginal as to their nomenclature (between mud and bentonite/analogue bentonite), having some degree of plasticity when still damp but also being moderately consolidated. Other sediment types have also been included in this summary section, due to their inclusion in the bentonite/analogue bentonite sediment sequence. These include vitric volcaniclastic bentonite/analogue bentonites (samples 6 and 17a from Parsata trench 1; MPLP901, MPLP972; sample 21b from the Parsata trench 1 site; MPLP976) and two thin probably altered crystal tuffs (samples 11 and 14 from Parsata trench 1; MPLP962 and MPLP964), the degree of alteration of the latter means that their identification is uncertain. There are some textures in these samples that are similar to those of certain of the altered pillow lava samples, which contain common pyroxene phenocrysts (MPLP973); it is possible that these sediments contained relatively coarse fragments of basalt that have been so altered that their boundaries are no longer recognisable (i.e an altered lapilli-tuff). These samples are referred to as altered crystal tuffs through the rest of the text, but this uncertainty should be noted. 7.2.3 Primary Constituents
Detrital clays are the dominant constituent of these sediments, which are all matrix-supported. Where not obscured by secondary phases, these are observable as platy phases with the rough and ragged edges typical of detrital clay minerals (Figure 7.2.1, Figure 7.2.2) they are tightly packed. Compositions derived from small area average SEM EDXA analyses (see section on Clay matrix chemistry in section 7.2.7, below) are consistent with these dominantly being di-octahedral smectites. Variable proportions of other primary phases are present, as clay grade sediment, and as silt and rarely sand grains. Silt grain content is variable throughout the sequence, with some samples classified as silty bentonite/analogue bentonites. Variation in silt content locally defines lamination. Common silt grain types include feldspar, (mostly plagioclase; Figure 7.2.44), apatite (a variety of grain sizes and shapes; Figure 7.2.2; Figure 7.2.4, Figure 7.2.44), quartz, micas (mostly biotite, lesser muscovite) and chlorite. There are rare garnet grains. Scarce identifiable bioclasts are dominantly silica-based planktonic debris (diatoms, spicules – MPLP888, MPLP899); these are typically altered / recrystallised (Figure 7.2.2). Plant debris (MPLP974) and limestone fragments (MPLP896) are other rare constituents. As indicated above, several samples have significant contents of probable volcaniclastic fragments. These have typically been completely altered and/or dissolved, so their identification is primarily morphological. These are mainly pyroclastic fiamme fragments, including some very fine grained ‘micro-fiamme’ (Figure 7.2.4, Figure 7.2.44). These have the typical convoluted forms associated with fiamme. Widespread grains with less morphologically distinct forms than the fiamme, but which have very similar alteration products, are also considered likely to be pyroclastic fragments.
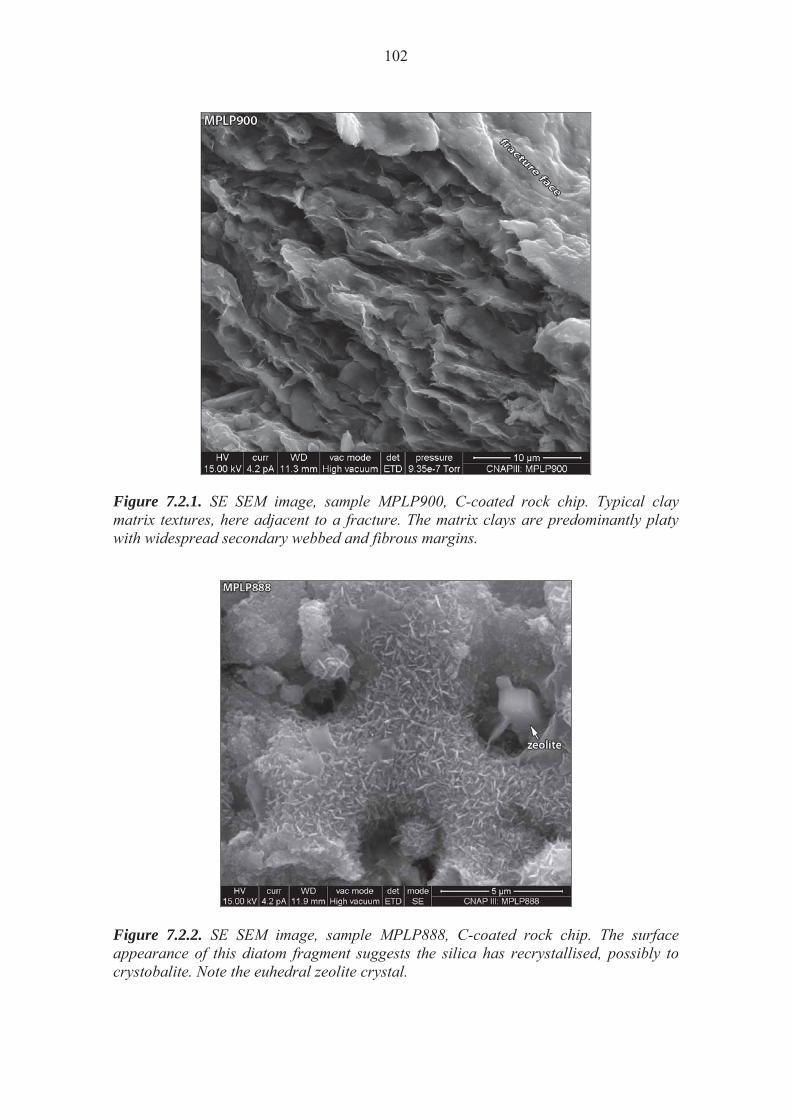
102
Figure 7.2.1. SE SEM image, sample MPLP900, C-coated rock chip. Typical clay matrix textures, here adjacent to a fracture. The matrix clays are predominantly platy with widespread secondary webbed and fibrous margins.
Figure 7.2.2. SE SEM image, sample MPLP888, C-coated rock chip. The surface appearance of this diatom fragment suggests the silica has recrystallised, possibly to crystobalite. Note the euhedral zeolite crystal.

103
Figure 7.2.3. SE SEM image, sample MPLP901, C-coated rock chip. Typical clay matrix with embedded silt grains of plagioclase (pl) and apatite (ap).
Figure 7.2.4. BSE SEM image, Sample MPLP972, C-coated PTS. Fiamme textures are defined by darker areas. These now comprise alteration products (EDXA-derived compositions are consistent with palygorskite). An Mn-rich phase is identifiable as the high brightness specks (Mn rich label is in a concentration of these). Note the silt-sized apatite particle (ap).

104
Figure 7.2.5. SE SEM image, sample MPLP974, C-coated rock chip. Rare coarse zeolite crystals are present filling macropores adjacent to a coarse multi-cellular plant fragment . 7.2.4 Secondary constituents
Secondary minerals are those formed post sedimentation through alteration of the primary constituents or through neoformation. In the bentonite/analogue bentonite sequence the main secondary mineral phases identified are:
Clay minerals associated with matrix clays and through alteration of detrital clasts (e.g. pyroclastic fragments)
Zeolites, analcite Feldspars, silica phases Mn and Fe oxides / hydroxides Calcium Carbonate Calcium Sulphate
Clay minerals
The secondary clay minerals are primarily identified as such through their distinctive morphologies. In association with detrital clays these are mainly finely webbed forms and fine fibres. The former are common throughout the matrix at detrital Figure margins (possible alteration of the detrital host, or as a fresh secondary ‘overgrowth’), also coating and bridging between other detrital and secondary constituents (Figure 7.2.6, Figure 7.2.7, Figure 7.2.8, Figure 7.2.13). Fibrous forms are widespread also coating and bridging between detrital and secondary constituents, notably extending from detrital and secondary clay edges (Figure 7.2.7). Local curled clay edges to some

105
webbed clay developments suggest some shrinkage and/or collapse (Figure 7.2.14); it is not possible to determine if this is a post-or pre-sampling texture. Altered pyroclastic fragments primarily comprise a matted and extending fibrous phase (Figure 7.2.). Both qualitative and quantitative EDXA-derived compositions (Figure 7.2., see Altered grains in section 7.2.7, below) suggest that this phase is an iron-bearing palygorskite. The alteration products of the crystals and matrix within the possible basaltic veins are strongly webbed phases (Figure 7.2. 9, Figure 7.2.10) with qualitative and quantitative EDXA-derived compositions (see Altered grains in section 7.2.7, below) that suggest they are smectitic clay minerals. Fibrous forms are also present as a lesser phase here (Figure 7.2.10). As the constituents that are associated with the matrix clays are very finely developed and typically intimately associated with other constituents, then no reliable EDXA-derived compositions could be obtained to aid in their identification. From morphology alone the webbed and fibrous forms are potentially smectites and palygorskite respectively. The latter identification is supported by the similar morphology of the pyroclastic fragment alteration products and the fact that local fibre clusters within the matrix have qualitatively similar EDXA-derived compositions to those alteration products. However, it should be noted that a number of phases have similar webbed and fibrous morphologies; identification of these phases as clay minerals, particularly the fibrous phase(s), is not definite. There are rarely identifiable plates of possible secondary chlorite associated with fractures (MPLP966) and altered grains (Figure 7.2.16).
Zeolites, analcite
Zeolites are widespread secondary phases, present in nearly all the samples, primarily scattered throughout the matrix clays, also in secondary pores and associated with altered grains. They mostly have euhedral to subhedral blocky crystal morphologies (Figure 7.2.2, Figure 7.2.6, Figure 7.2.11, Figure 7.2.12, and Figure 7.2.14) with lesser tabular forms. Compositionally (EDXA-derived qualitative), they contain varied proportions of the cations Na, Ca and K (Figure 7.2.18 is an example of a zeolite EDXA spectrum). Some zeolites also contain significant Mg (possible contamination from clays) and others have higher Al contents. In any one sample there can be up to three compositionally (but not necessarily morphologically) distinct zeolite phases. Their morphologies and qualitative compositions are consistent with mineralogies in the clinoptilolite – heulandite group. The zeolites show varied paragenetic relationships towards each other where there are multiple compositional types, suggesting several episodes of development. Typically the secondary clay minerals are either developed or draped on top of the zeolites, or bridge to them (Figure 7.2.6, Figure 7.2.13, Figure 7.2.15). However, some zeolites do partially enclose secondary clays (e.g. Figure 7.2.12), suggesting overlapping and/or interspersed multiple periods of formation for the two groups of secondary minerals. Calcium carbonate crystals partially enclose zeolite crystals.
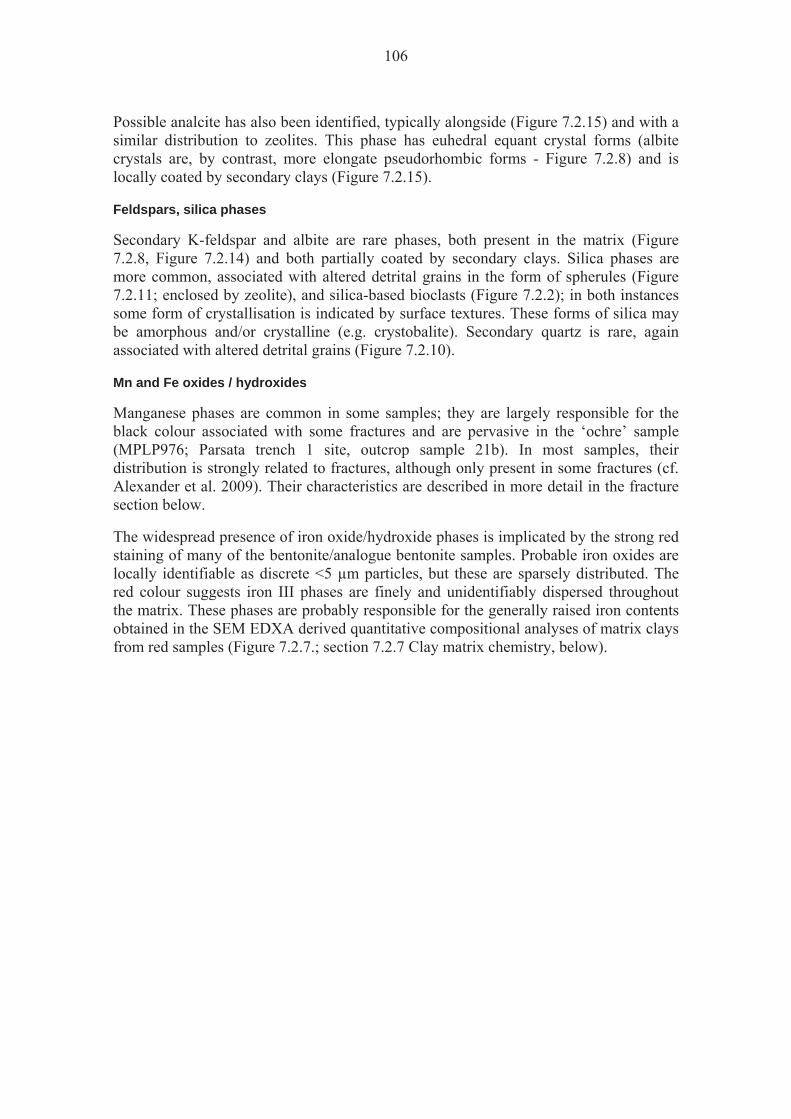
106
Possible analcite has also been identified, typically alongside (Figure 7.2.15) and with a similar distribution to zeolites. This phase has euhedral equant crystal forms (albite crystals are, by contrast, more elongate pseudorhombic forms - Figure 7.2.8) and is locally coated by secondary clays (Figure 7.2.15).
Feldspars, silica phases
Secondary K-feldspar and albite are rare phases, both present in the matrix (Figure 7.2.8, Figure 7.2.14) and both partially coated by secondary clays. Silica phases are more common, associated with altered detrital grains in the form of spherules (Figure 7.2.11; enclosed by zeolite), and silica-based bioclasts (Figure 7.2.2); in both instances some form of crystallisation is indicated by surface textures. These forms of silica may be amorphous and/or crystalline (e.g. crystobalite). Secondary quartz is rare, again associated with altered detrital grains (Figure 7.2.10).
Mn and Fe oxides / hydroxides
Manganese phases are common in some samples; they are largely responsible for the black colour associated with some fractures and are pervasive in the ‘ochre’ sample (MPLP976; Parsata trench 1 site, outcrop sample 21b). In most samples, their distribution is strongly related to fractures, although only present in some fractures (cf. Alexander et al. 2009). Their characteristics are described in more detail in the fracture section below. The widespread presence of iron oxide/hydroxide phases is implicated by the strong red staining of many of the bentonite/analogue bentonite samples. Probable iron oxides are locally identifiable as discrete <5 μm particles, but these are sparsely distributed. The red colour suggests iron III phases are finely and unidentifiably dispersed throughout the matrix. These phases are probably responsible for the generally raised iron contents obtained in the SEM EDXA derived quantitative compositional analyses of matrix clays from red samples (Figure 7.2.7.; section 7.2.7 Clay matrix chemistry, below).

107
Figure 7.2.6. SE SEM image, sample MPLP891, C-coated rock chip. An area of matrix containing scattered fine subhedral to euhedral zeolite crystals. Arrows highlight sites where webbed secondary clays are particularly discernible. The secondary clays locally on top of the zeolites.
Figure 7.2.7. SE SEM image, sample MPLP965, C-coated rock chip. Webbed ridges of secondary clay are common in this area of matrix adjacent to a surface partially coated bycalcium carbonate (Ca carb.). Some webbed clays coat the carbonate. Common fibrous forms extend from the margins of other clay types (arrowed).

108
Figure 7.2.8. SE SEM image, sample MPLP966, C-coated rock chip. At this freshly exposed surface, common webbed forms on the detrital clay matrix components are taken as evidence of widespread secondary clay formation. Here, fibrous extensions are minor constituents. The webbed clay is present on the surfaces of probable secondary albite.
Figure 7.2.9. SE SEM image, sample MPLP964, C-coated rock chip. Webbed secondary clays within a secondary pore that has radial rim textures also formed from secondary clay minerals. The matrix has a massive texture also dominated by secondary webbed forms.
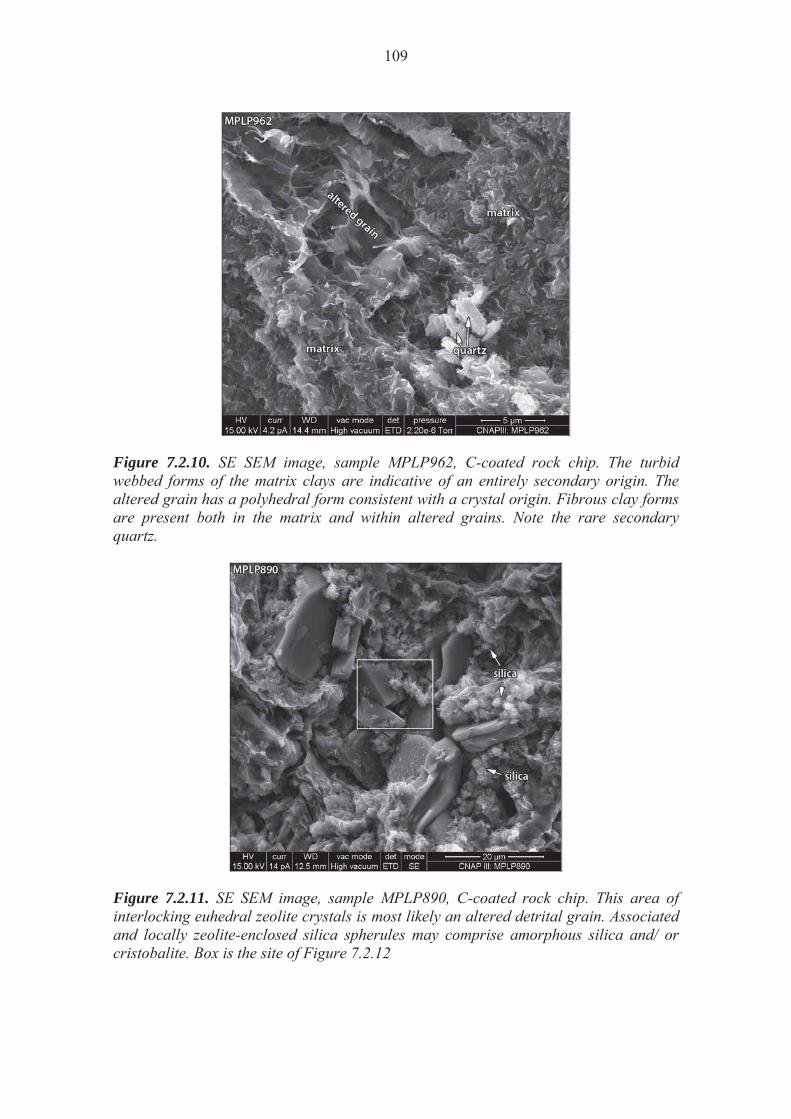
109
Figure 7.2.10. SE SEM image, sample MPLP962, C-coated rock chip. The turbid webbed forms of the matrix clays are indicative of an entirely secondary origin. The altered grain has a polyhedral form consistent with a crystal origin. Fibrous clay forms are present both in the matrix and within altered grains. Note the rare secondary quartz.
Figure 7.2.11. SE SEM image, sample MPLP890, C-coated rock chip. This area of interlocking euhedral zeolite crystals is most likely an altered detrital grain. Associated and locally zeolite-enclosed silica spherules may comprise amorphous silica and/ or cristobalite. Box is the site of Figure 7.2.12
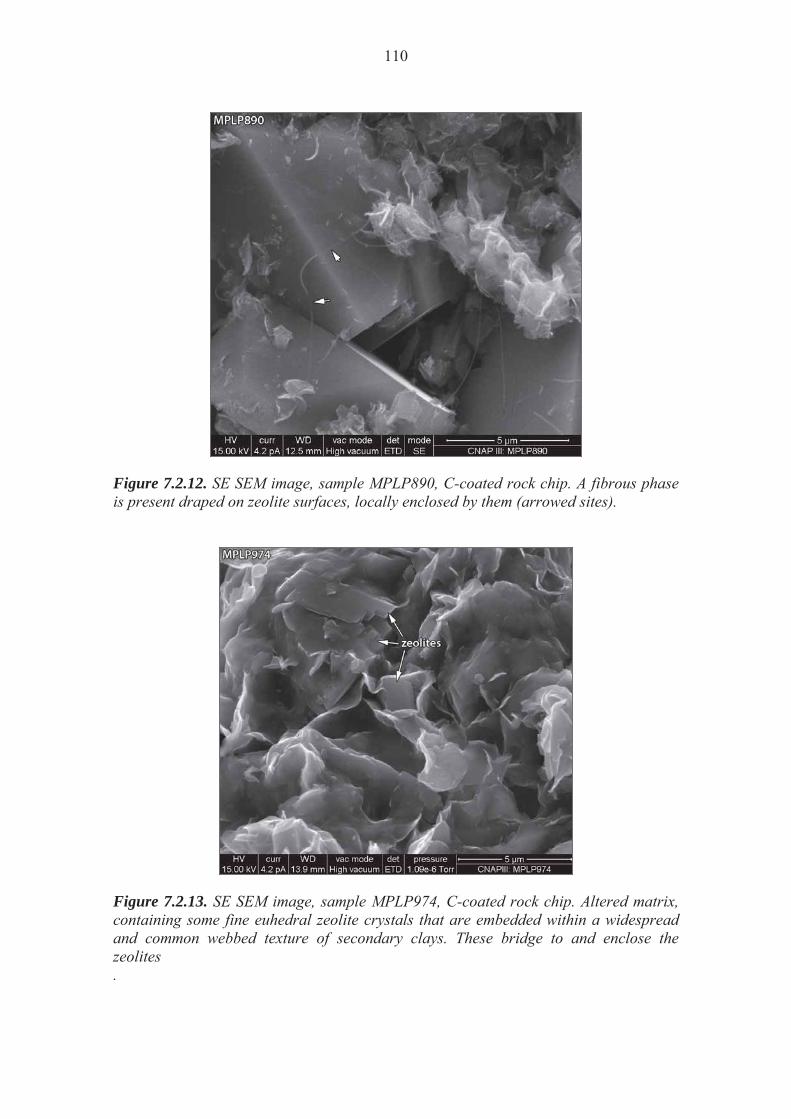
110
Figure 7.2.12. SE SEM image, sample MPLP890, C-coated rock chip. A fibrous phase is present draped on zeolite surfaces, locally enclosed by them (arrowed sites).
Figure 7.2.13. SE SEM image, sample MPLP974, C-coated rock chip. Altered matrix, containing some fine euhedral zeolite crystals that are embedded within a widespread and common webbed texture of secondary clays. These bridge to and enclose the zeolites .

111
Figure 7.2.14. SE SEM image, sample MPLP965, C-coated rock chip. Matrix, showing widespread evidence of secondary clay developments in the form of ridged and bridging webbed forms; local curled edges suggesting minor collapse. Other secondary phases include zeolite and possible K-feldspar.
Figure 7.2.15. SE SEM image, sample MPLP890, C-coated rock chip. Typical matrix containing scattered euhedral zeolite crystals and an equant crystal of probable analcite. Arrows highlight sites where webbed secondary clays are particularly discernible. The secondary clays are on top of both the zeolites and the probable analcite.
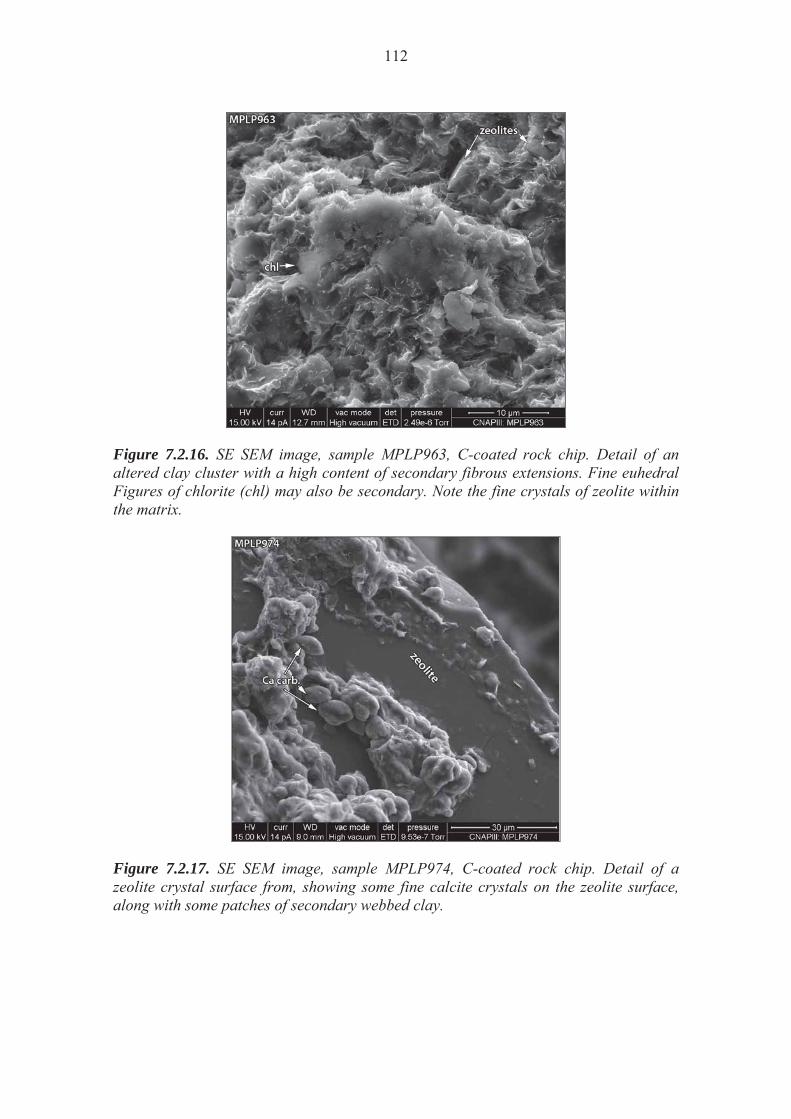
112
Figure 7.2.16. SE SEM image, sample MPLP963, C-coated rock chip. Detail of an altered clay cluster with a high content of secondary fibrous extensions. Fine euhedral Figures of chlorite (chl) may also be secondary. Note the fine crystals of zeolite within the matrix.
Figure 7.2.17. SE SEM image, sample MPLP974, C-coated rock chip. Detail of a zeolite crystal surface from, showing some fine calcite crystals on the zeolite surface, along with some patches of secondary webbed clay.
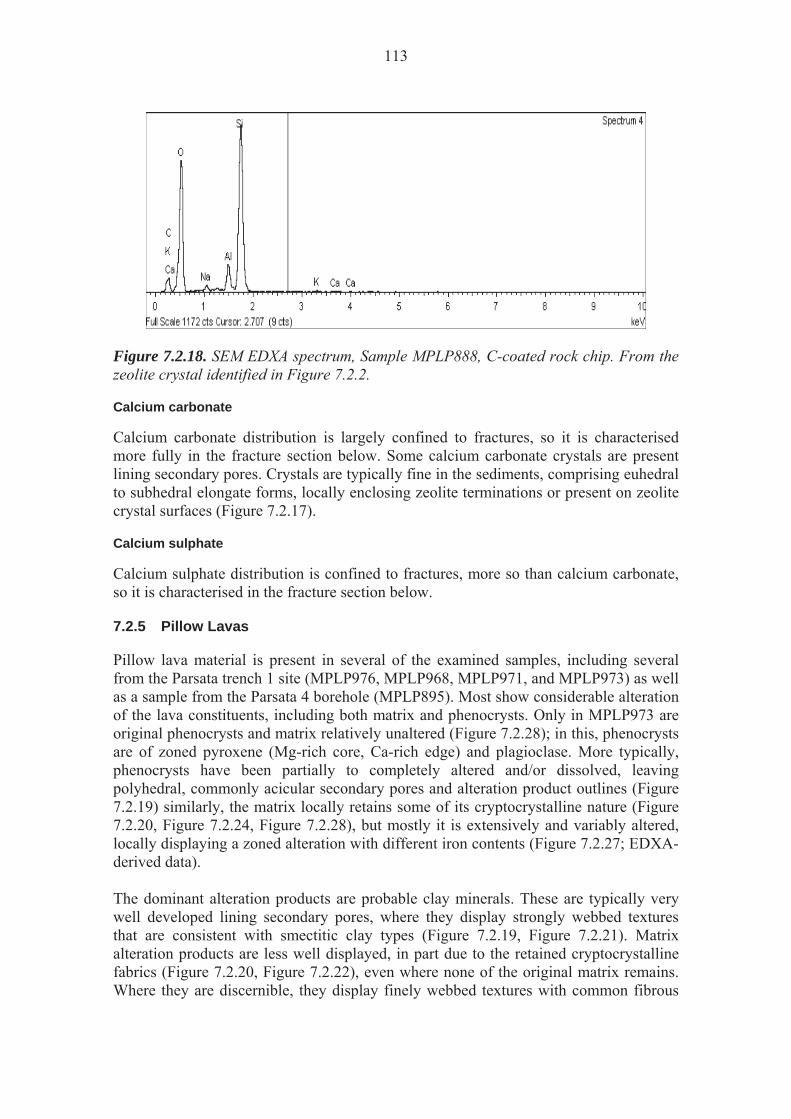
113
Figure 7.2.18. SEM EDXA spectrum, Sample MPLP888, C-coated rock chip. From the zeolite crystal identified in Figure 7.2.2.
Calcium carbonate
Calcium carbonate distribution is largely confined to fractures, so it is characterised more fully in the fracture section below. Some calcium carbonate crystals are present lining secondary pores. Crystals are typically fine in the sediments, comprising euhedral to subhedral elongate forms, locally enclosing zeolite terminations or present on zeolite crystal surfaces (Figure 7.2.17).
Calcium sulphate
Calcium sulphate distribution is confined to fractures, more so than calcium carbonate, so it is characterised in the fracture section below. 7.2.5 Pillow Lavas
Pillow lava material is present in several of the examined samples, including several from the Parsata trench 1 site (MPLP976, MPLP968, MPLP971, and MPLP973) as well as a sample from the Parsata 4 borehole (MPLP895). Most show considerable alteration of the lava constituents, including both matrix and phenocrysts. Only in MPLP973 are original phenocrysts and matrix relatively unaltered (Figure 7.2.28); in this, phenocrysts are of zoned pyroxene (Mg-rich core, Ca-rich edge) and plagioclase. More typically, phenocrysts have been partially to completely altered and/or dissolved, leaving polyhedral, commonly acicular secondary pores and alteration product outlines (Figure 7.2.19) similarly, the matrix locally retains some of its cryptocrystalline nature (Figure 7.2.20, Figure 7.2.24, Figure 7.2.28), but mostly it is extensively and variably altered, locally displaying a zoned alteration with different iron contents (Figure 7.2.27; EDXA-derived data). The dominant alteration products are probable clay minerals. These are typically very well developed lining secondary pores, where they display strongly webbed textures that are consistent with smectitic clay types (Figure 7.2.19, Figure 7.2.21). Matrix alteration products are less well displayed, in part due to the retained cryptocrystalline fabrics (Figure 7.2.20, Figure 7.2.22), even where none of the original matrix remains. Where they are discernible, they display finely webbed textures with common fibrous

114
and wispy constituents (Figure 7.2.22). Identifying the composition of these clays from SEM EDXA is compromised by the typically intermixed nature of phases and the fine nature of the clays. Fine fibrous clays are present in secondary pores both in isolation (Figure 7.2.20) and associated with the more abundant webbed clays (Figure 7.2.21). Morphological similarities with the fibrous clays described above suggest they are palygorskite, but this identification is tenuous at best, although rare EDXA-derived compositional data does not contradict this identification. Various webbed and fibrous phases, probably clay minerals, are also present lining various pore types (mostly vuggy; Figure 7.2.24, Figure 7.2.25, Figure 7.2.26) Wherever these probable clay minerals are present, they partially coat or bridge to other secondary phases present alongside them (K-feldspar, Figure 7.2.20; zeolites, Figure 7.2.22, Figure 7.2.24; calcium carbonate, Figure 7.2.26; iron sulphide, Figure 7.2.21). The iron sulphide may be a primary mineral. Other paragenetic relationships shown in the altered lava samples are between calcium carbonate and zeolite, with the former consistently enclosing the latter (Figure 7.2.22, Figure 7.2.27). The zeolites themselves show similarities in their properties to those in the bentonite/analogue bentonites, mostly displaying varied proportions of the cations Na, Ca and K (EDXA-derived qualitative). In MPLP971, an elongate zeolite constituent shows evidence of dissolution and has been enclosed by both a more blocky euehdral zeolite and calcium carbonate that encloses both zeolites. Zeolites are typically best developed within vuggy pores (Figure 7.2.24).Calcium carbonate is present as a cement in pillow lava portions where matrix dissolution has created local areas of more open secondary porosity. Some of these portions are associated with fractures that also contain secondary deposits. Where the calcium carbonate has formed in this porosity, it typically encloses zeolites, some of which show evidence of dissolution and might therefore have formed before the dissolution event (Figure 7.2.23, Figure 7.2.27). Some of this calcium carbonate shows compositional zoning, with the earliest formed containing no detectable manganese, whilst the later carbonate contains significant manganese (Figure 7.2.27).Manganese-rich deposits are also present where the manganese-bearing phases have formed along fractures in at least two phases, separated by a calcium carbonate formation episode, and by further fracturing (MPLP967, Figure 7.2.23).
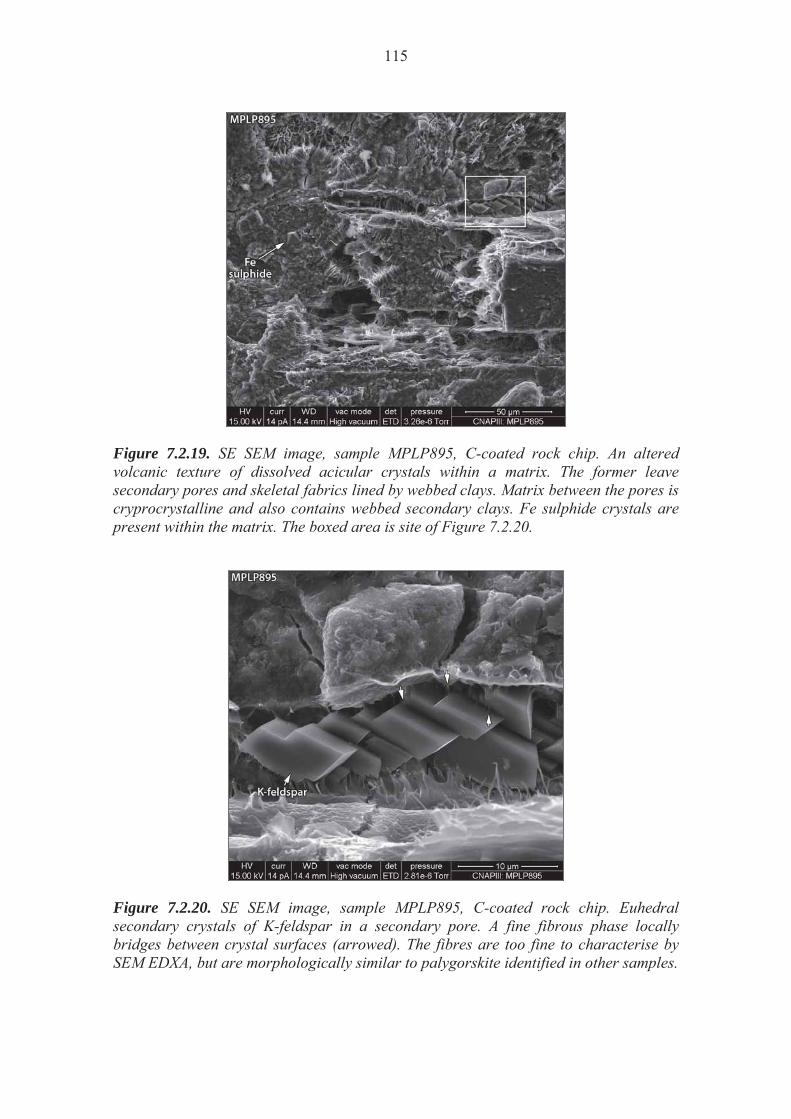
115
Figure 7.2.19. SE SEM image, sample MPLP895, C-coated rock chip. An altered volcanic texture of dissolved acicular crystals within a matrix. The former leave secondary pores and skeletal fabrics lined by webbed clays. Matrix between the pores is cryprocrystalline and also contains webbed secondary clays. Fe sulphide crystals are present within the matrix. The boxed area is site of Figure 7.2.20.
Figure 7.2.20. SE SEM image, sample MPLP895, C-coated rock chip. Euhedral secondary crystals of K-feldspar in a secondary pore. A fine fibrous phase locally bridges between crystal surfaces (arrowed). The fibres are too fine to characterise by SEM EDXA, but are morphologically similar to palygorskite identified in other samples.

116
Figure 7.2.21. SE SEM image, sample MPLP895, C-coated rock chip. Webbed clays partially coating an iron sulphide crystal, both within a secondary pore. The surfaces of the sulphide crystal are finely stepped, notched and striated; whilst these are mostly growth textures there is some evidence of minor dissolution.
Figure 7.2.22. SE SEM image, sample MPLP967, C-coated rock chip. Altered matrix margin. Zeolite is partially enclosed by the subhedral calcium carbonate (Ca carb.). Both phases are partially coated by and bridged to by a fibrous phase.
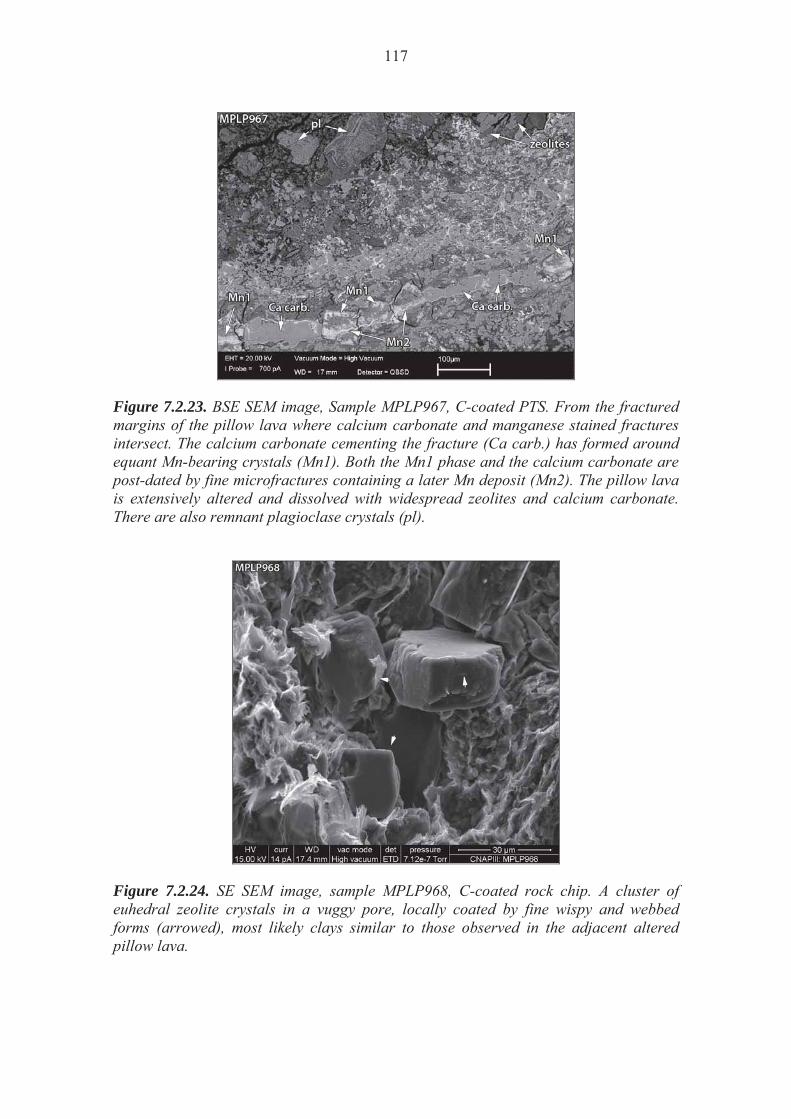
117
Figure 7.2.23. BSE SEM image, Sample MPLP967, C-coated PTS. From the fractured margins of the pillow lava where calcium carbonate and manganese stained fractures intersect. The calcium carbonate cementing the fracture (Ca carb.) has formed around equant Mn-bearing crystals (Mn1). Both the Mn1 phase and the calcium carbonate are post-dated by fine microfractures containing a later Mn deposit (Mn2). The pillow lava is extensively altered and dissolved with widespread zeolites and calcium carbonate. There are also remnant plagioclase crystals (pl).
Figure 7.2.24. SE SEM image, sample MPLP968, C-coated rock chip. A cluster of euhedral zeolite crystals in a vuggy pore, locally coated by fine wispy and webbed forms (arrowed), most likely clays similar to those observed in the adjacent altered pillow lava.
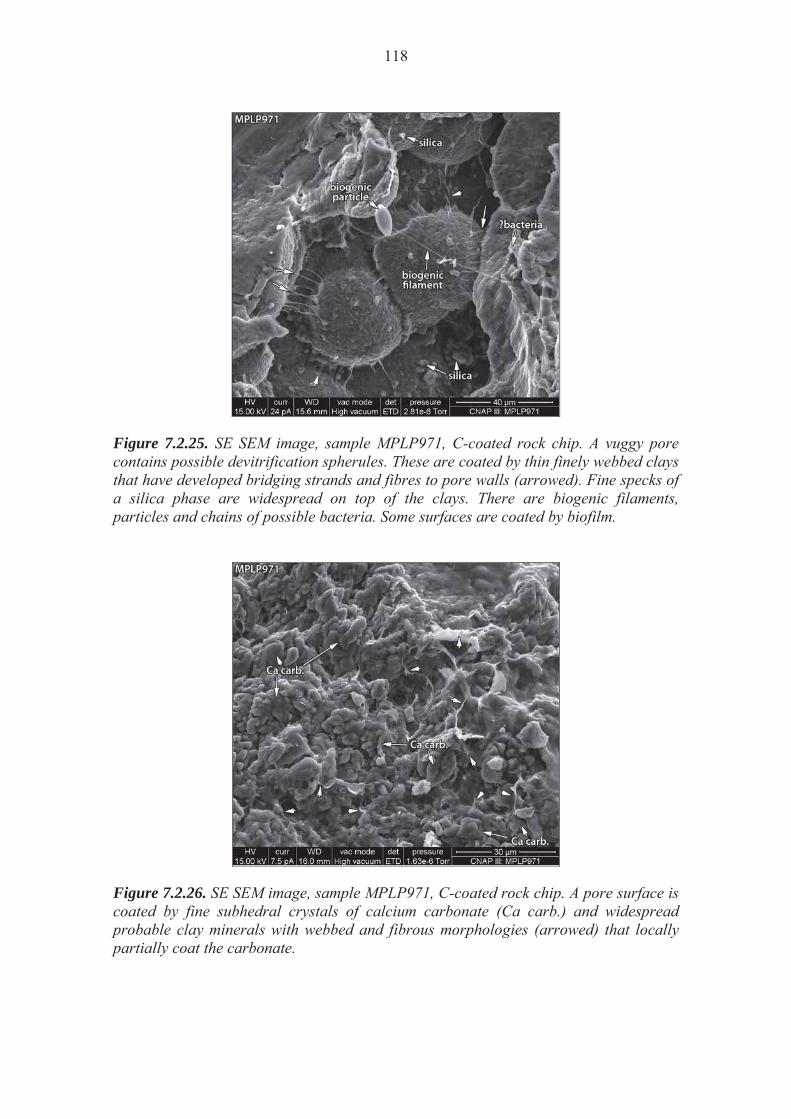
118
Figure 7.2.25. SE SEM image, sample MPLP971, C-coated rock chip. A vuggy pore contains possible devitrification spherules. These are coated by thin finely webbed clays that have developed bridging strands and fibres to pore walls (arrowed). Fine specks of a silica phase are widespread on top of the clays. There are biogenic filaments, particles and chains of possible bacteria. Some surfaces are coated by biofilm.
Figure 7.2.26. SE SEM image, sample MPLP971, C-coated rock chip. A pore surface is coated by fine subhedral crystals of calcium carbonate (Ca carb.) and widespread probable clay minerals with webbed and fibrous morphologies (arrowed) that locally partially coat the carbonate.
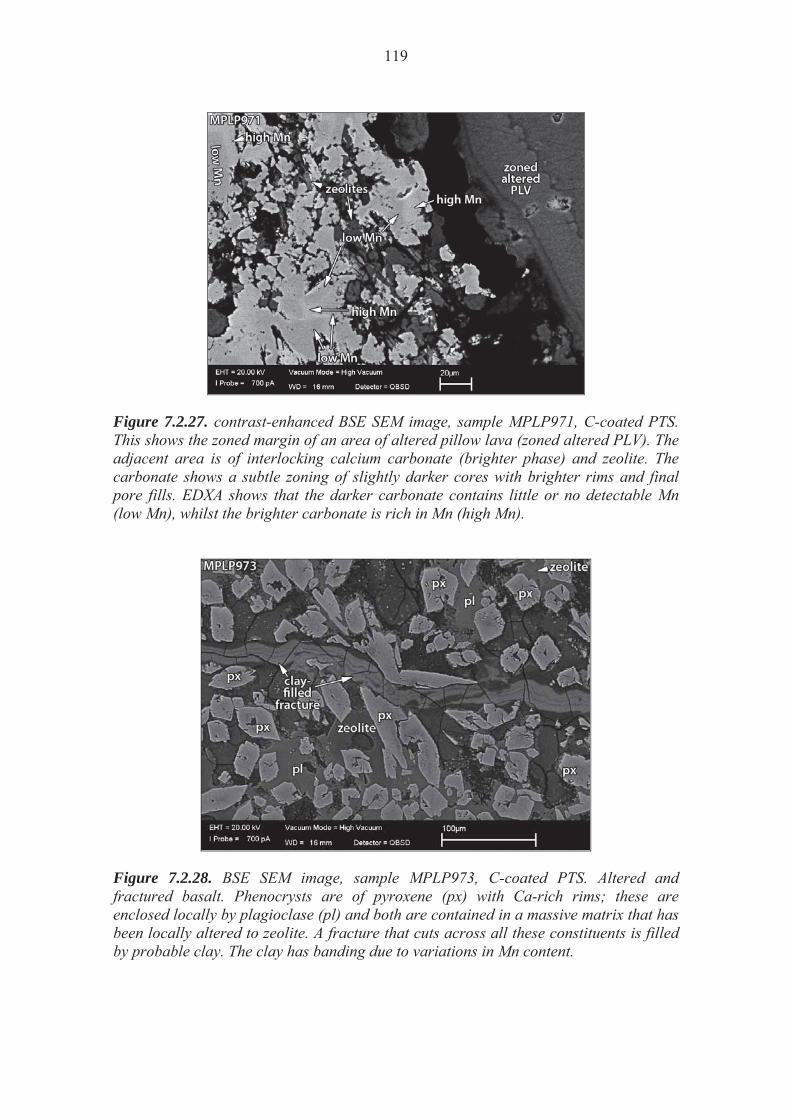
119
Figure 7.2.27. contrast-enhanced BSE SEM image, sample MPLP971, C-coated PTS. This shows the zoned margin of an area of altered pillow lava (zoned altered PLV). The adjacent area is of interlocking calcium carbonate (brighter phase) and zeolite. The carbonate shows a subtle zoning of slightly darker cores with brighter rims and final pore fills. EDXA shows that the darker carbonate contains little or no detectable Mn (low Mn), whilst the brighter carbonate is rich in Mn (high Mn).
Figure 7.2.28. BSE SEM image, sample MPLP973, C-coated PTS. Altered and fractured basalt. Phenocrysts are of pyroxene (px) with Ca-rich rims; these are enclosed locally by plagioclase (pl) and both are contained in a massive matrix that has been locally altered to zeolite. A fracture that cuts across all these constituents is filled by probable clay. The clay has banding due to variations in Mn content.
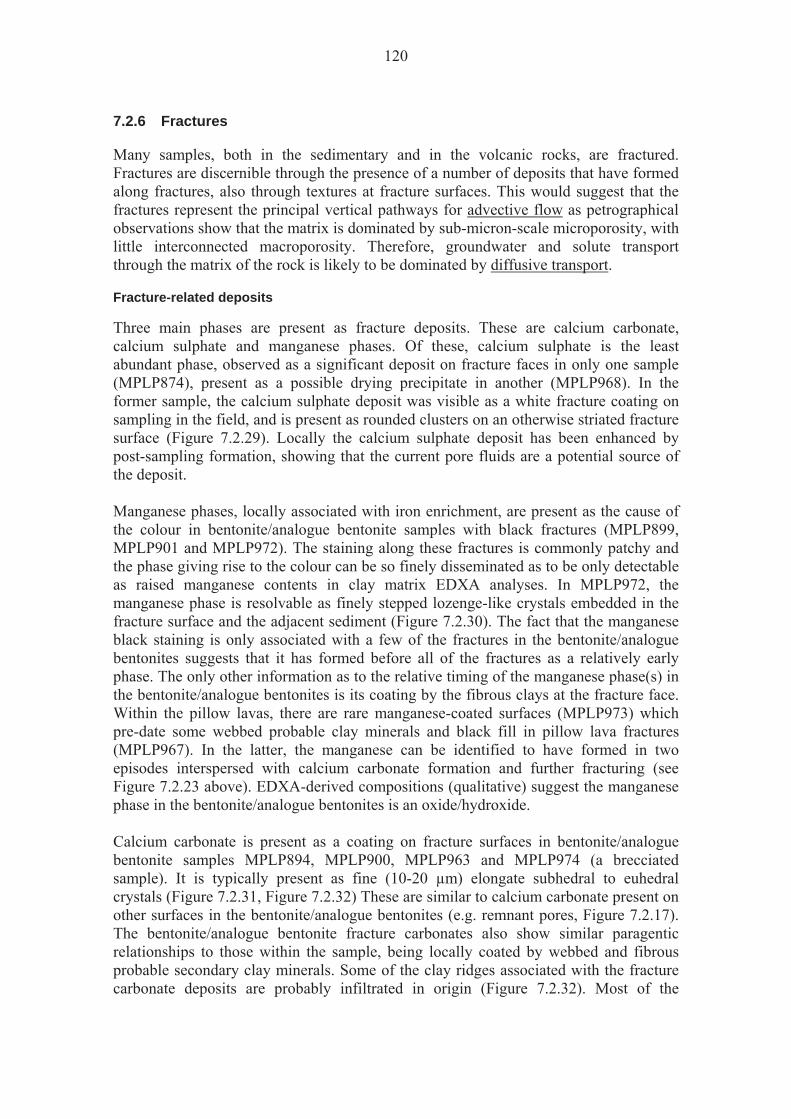
120
7.2.6 Fractures
Many samples, both in the sedimentary and in the volcanic rocks, are fractured. Fractures are discernible through the presence of a number of deposits that have formed along fractures, also through textures at fracture surfaces. This would suggest that the fractures represent the principal vertical pathways for advective flow as petrographical observations show that the matrix is dominated by sub-micron-scale microporosity, with little interconnected macroporosity. Therefore, groundwater and solute transport through the matrix of the rock is likely to be dominated by diffusive transport.
Fracture-related deposits
Three main phases are present as fracture deposits. These are calcium carbonate, calcium sulphate and manganese phases. Of these, calcium sulphate is the least abundant phase, observed as a significant deposit on fracture faces in only one sample (MPLP874), present as a possible drying precipitate in another (MPLP968). In the former sample, the calcium sulphate deposit was visible as a white fracture coating on sampling in the field, and is present as rounded clusters on an otherwise striated fracture surface (Figure 7.2.29). Locally the calcium sulphate deposit has been enhanced by post-sampling formation, showing that the current pore fluids are a potential source of the deposit. Manganese phases, locally associated with iron enrichment, are present as the cause of the colour in bentonite/analogue bentonite samples with black fractures (MPLP899, MPLP901 and MPLP972). The staining along these fractures is commonly patchy and the phase giving rise to the colour can be so finely disseminated as to be only detectable as raised manganese contents in clay matrix EDXA analyses. In MPLP972, the manganese phase is resolvable as finely stepped lozenge-like crystals embedded in the fracture surface and the adjacent sediment (Figure 7.2.30). The fact that the manganese black staining is only associated with a few of the fractures in the bentonite/analogue bentonites suggests that it has formed before all of the fractures as a relatively early phase. The only other information as to the relative timing of the manganese phase(s) in the bentonite/analogue bentonites is its coating by the fibrous clays at the fracture face. Within the pillow lavas, there are rare manganese-coated surfaces (MPLP973) which pre-date some webbed probable clay minerals and black fill in pillow lava fractures (MPLP967). In the latter, the manganese can be identified to have formed in two episodes interspersed with calcium carbonate formation and further fracturing (see Figure 7.2.23 above). EDXA-derived compositions (qualitative) suggest the manganese phase in the bentonite/analogue bentonites is an oxide/hydroxide. Calcium carbonate is present as a coating on fracture surfaces in bentonite/analogue bentonite samples MPLP894, MPLP900, MPLP963 and MPLP974 (a brecciated sample). It is typically present as fine (10-20 μm) elongate subhedral to euhedral crystals (Figure 7.2.31, Figure 7.2.32) These are similar to calcium carbonate present on other surfaces in the bentonite/analogue bentonites (e.g. remnant pores, Figure 7.2.17). The bentonite/analogue bentonite fracture carbonates also show similar paragentic relationships to those within the sample, being locally coated by webbed and fibrous probable secondary clay minerals. Some of the clay ridges associated with the fracture carbonate deposits are probably infiltrated in origin (Figure 7.2.32). Most of the

121
fracture-lining calcium carbonate has some euhedral growth-defined terminations (Figure 7.2.31), with subhedral forms possibly due to a partially enclosing relationship with some secondary clays and with infiltrated clays (Figure 7.2.31). The MPLP894 sample (from the Parsata 4 borehole) has calcium carbonate remnants after significant dissolution (Figure 7.2.33). Calcium carbonate associated with fractures in the pillow lavas is very different in its modes of occurrence to that in the bentonite/analogue bentonite, typically completely cementing fractures, and showing evidence of multi-stage developments (see section 7.2.5 Pillow Lavas, above). It is not possible to determine if the two occurrences are linked, but given the small depth difference between the bentonite/analogue bentonite samples and pillow lava samples in the Parsata trench 1 samples, it is likely that there are connections between carbonate formation episodes. It is likely therefore, that the carbonates in the bentonites/analogue bentonites also have multi-stage development.
Figure 7.2.29. SE image, sample MPLP874, variable pressure conditions; unprepared, uncoated material. A striated fracture face partially coated by rounded clusters of calcium sulphate (probable gypsum) that are partially embedded in the fracture surface (note pluck site). Striations have also affected a rare exposed zeolite crystal.

122
Figure 7.2.30. SE SEM image, sample MPLP972, C-coated rock chip. Detail of a black-stained fracture surface that contains a high abundance of a manganese rich phase (Mn); this is resolvable as finely stepped lozenge-like crystals embedded in the matted and fibrous fracture surface. The manganese phase is also present in adjacent sediment.
Figure 7.2.31. SE SEM image, sample MPLP963, C-coated rock chip. A fracture surface with a white coating. The latter is due to the presence of fine calcium carbonate crystals, comprising subhedral elongate to lozenge-shaped crystals with thin clay coatings that bridge between crystals (arrowed); some of the clays on carbonate crystal surfaces are probably infiltrated. There are euhedral clay-free edges and terminations.
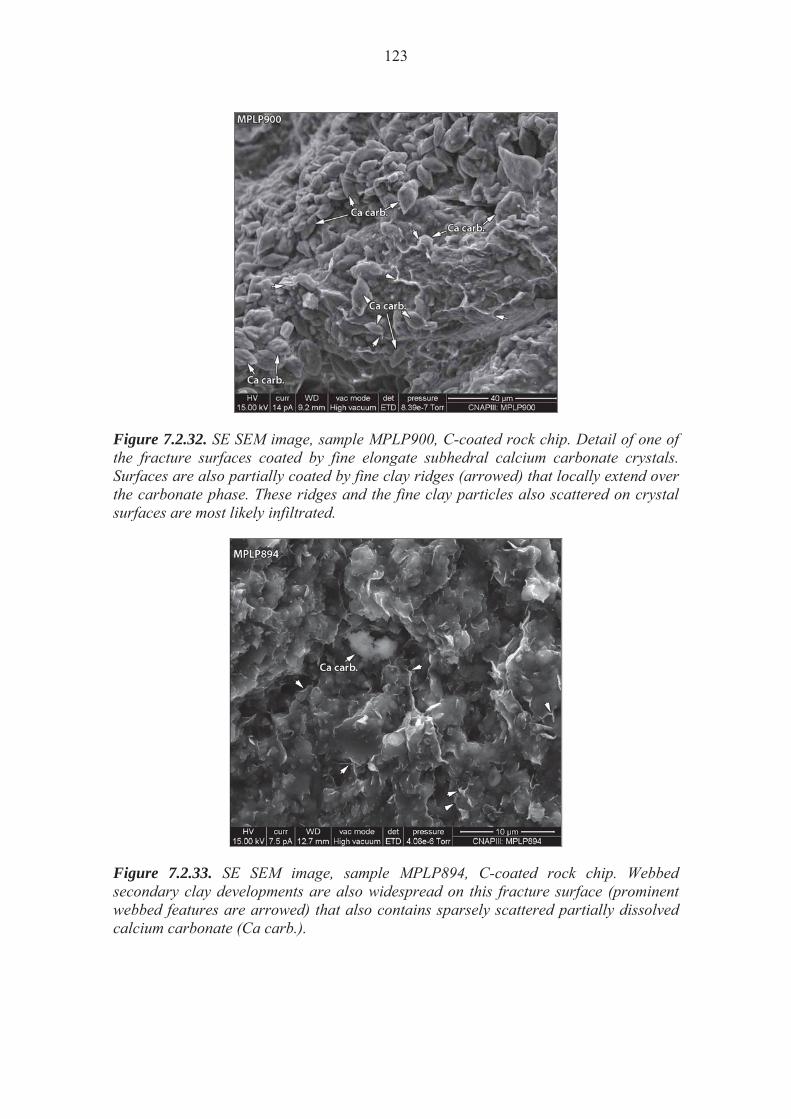
123
Figure 7.2.32. SE SEM image, sample MPLP900, C-coated rock chip. Detail of one of the fracture surfaces coated by fine elongate subhedral calcium carbonate crystals. Surfaces are also partially coated by fine clay ridges (arrowed) that locally extend over the carbonate phase. These ridges and the fine clay particles also scattered on crystal surfaces are most likely infiltrated.
Figure 7.2.33. SE SEM image, sample MPLP894, C-coated rock chip. Webbed secondary clay developments are also widespread on this fracture surface (prominent webbed features are arrowed) that also contains sparsely scattered partially dissolved calcium carbonate (Ca carb.).

124
Surface textures
Many of the bentonite/analogue bentonite fractures are marked by the presence of surface striations (Figure 7.2.29, Figure 7.2.34, Figure 7.2.35, Figure 7.2.36, Figure 7.2.37). These are variably developed, from just discernible to well developed on near-planar surfaces. The striae mark where there has been movement at the fracture surface. Many of these surfaces have fine secondary webbed probable clay mineral developments that bridge across striae (Figure 7.2.34, Figure 7.2.35, Figure 7.2.36), suggesting clay formation in part post-dates the last significant fracture movement. Zeolite exposed at a fracture surface that is itself striated, shows that the zeolite pre-dates the fracture movement (Figure 7.2.29). In detail, fracture surfaces have high contents, compared to the adjacent sediment, of a fibrous phase morphologically and compositionally (qualitatively EDXA-derived) similar to palygorskite (Figure 7.2.37, Figure 7.2.38). Fibres are commonly aligned parallel to striae (Figure 7.2.37).
Figure 7.2.34. SE image, Sample MPLP874, C-coated rock chip. A typical striated fracture surface with a partial coating of finely webbed clays.
125
Figure 7.2.35. SE SEM image, sample MPLP891, C-coated rock chip. A finely striated fracture surface is locally coated by webbed secondary clays. In detail the webbed clays have formed on top of the striae.
Figure 7.2.36. SE SEM image, sample MPLP888, C-coated rock chip. A finely striated fracture surface is locally coated by webbed secondary clays. In detail the webbed clays have formed on top of the striae. Note an emergent zeolite and a needle of Ti oxide aligned with the striae in the fracture surface.
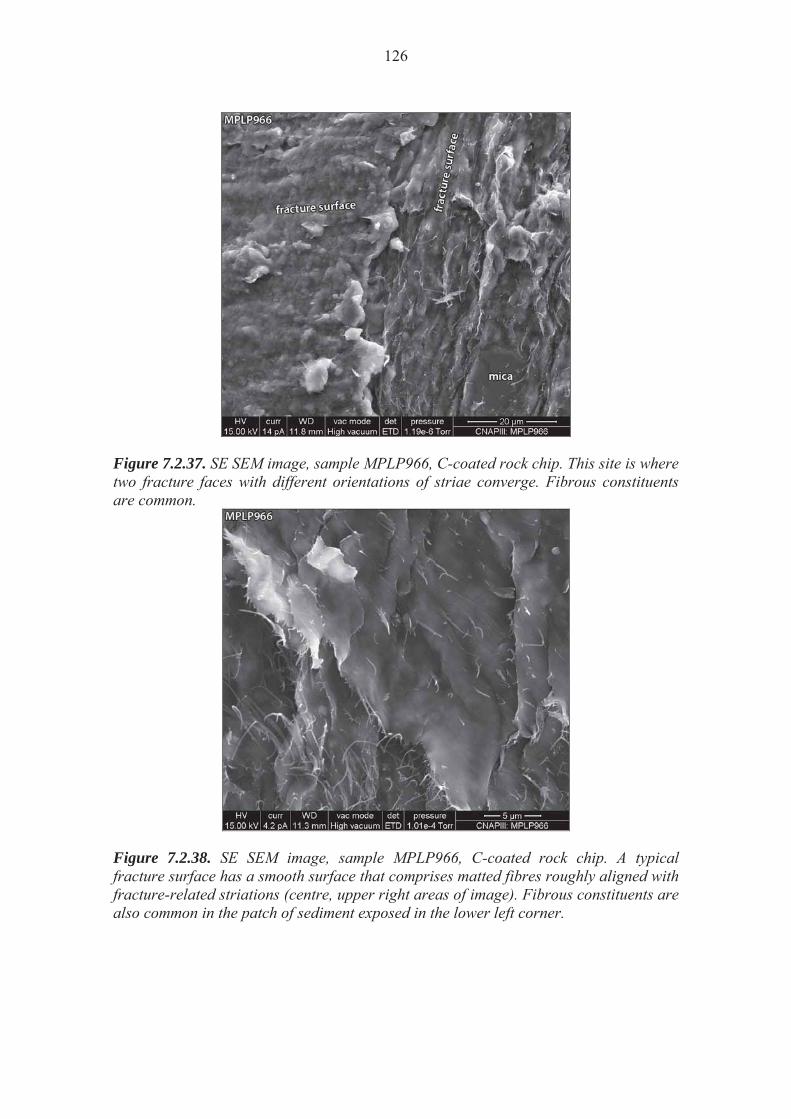
126
Figure 7.2.37. SE SEM image, sample MPLP966, C-coated rock chip. This site is where two fracture faces with different orientations of striae converge. Fibrous constituents are common.
Figure 7.2.38. SE SEM image, sample MPLP966, C-coated rock chip. A typical fracture surface has a smooth surface that comprises matted fibres roughly aligned with fracture-related striations (centre, upper right areas of image). Fibrous constituents are also common in the patch of sediment exposed in the lower left corner.

127
Matrix textures
As noted above, many fracture faces in the bentonite/analogue bentonites are marked by high concentrations of a fibrous phase, possibly palygorskite, typically matted at the surface and locally aligned with striations. In the sediment matrix adjacent to some fractures, the webbed and fibrous secondary developments that are common throughout the matrix of most of the bentonite/analogue bentonite samples, appear to be more abundant adjacent to fractures than at some distance from them (on a scale of millimetres; see Figure 7.2.39, Figure 7.2.40 and Figure 7.2.41). This feature was not observed with all fractures, and the observation is tentative, since many fractures run parallel or sub-parallel to bedding, and the degree of development of the secondary textures is likely to also be influenced by bedding related textures. Similarly, it is also possible that the association of fibrous constituents with some fractures may be due to the pre-existence of the fibrous phase as an alteration product presenting a line of weakness along which the fractures have formed preferentially. It is also, however, reasonable to expect that fractures would present sites of more extensive development of secondary phases, since they are conduits of increased fluid flow.
Paragenetic sequence
Combining the observations and deductions of the relative timings for the main processes identified within the bentonite/analogue bentonites described above, the following paragentic sequence is suggested (Figure 7.2.42):
Figure 7.2.39. SE SEM image, sample MPLP972, C-coated rock chip. A striated fracture face. One area contains abundant fine crystals of a manganese rich phase (Mn). Where the fracture face has been fractured during sample preparation the sediment textures are revealed (upper left corner). Boxed area shows the site of Figure 7.2.40.
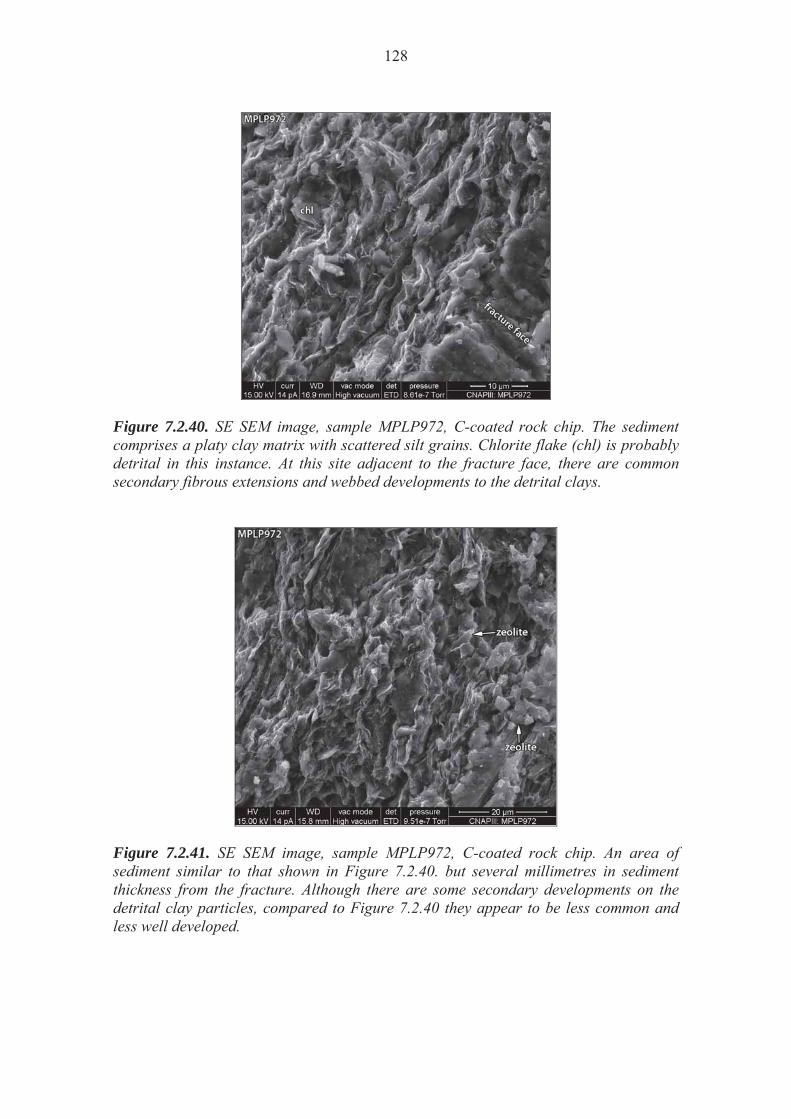
128
Figure 7.2.40. SE SEM image, sample MPLP972, C-coated rock chip. The sediment comprises a platy clay matrix with scattered silt grains. Chlorite flake (chl) is probably detrital in this instance. At this site adjacent to the fracture face, there are common secondary fibrous extensions and webbed developments to the detrital clays.
Figure 7.2.41. SE SEM image, sample MPLP972, C-coated rock chip. An area of sediment similar to that shown in Figure 7.2.40. but several millimetres in sediment thickness from the fracture. Although there are some secondary developments on the detrital clay particles, compared to Figure 7.2.40 they appear to be less common and less well developed.
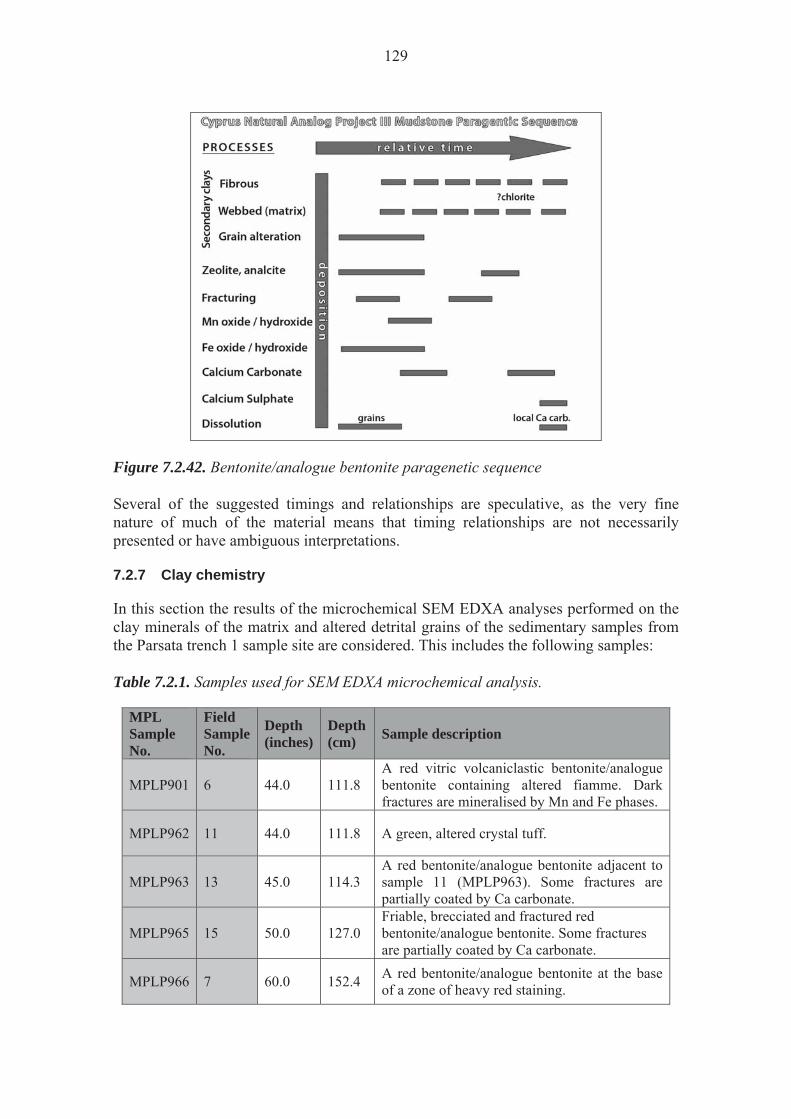
129
Figure 7.2.42. Bentonite/analogue bentonite paragenetic sequence Several of the suggested timings and relationships are speculative, as the very fine nature of much of the material means that timing relationships are not necessarily presented or have ambiguous interpretations. 7.2.7 Clay chemistry
In this section the results of the microchemical SEM EDXA analyses performed on the clay minerals of the matrix and altered detrital grains of the sedimentary samples from the Parsata trench 1 sample site are considered. This includes the following samples: Table 7.2.1. Samples used for SEM EDXA microchemical analysis.
MPL Sample No.
Field Sample No.
Depth (inches)
Depth (cm) Sample description
MPLP901 6 44.0 111.8 A red vitric volcaniclastic bentonite/analogue bentonite containing altered fiamme. Dark fractures are mineralised by Mn and Fe phases.
MPLP962 11 44.0 111.8 A green, altered crystal tuff.
MPLP963 13 45.0 114.3 A red bentonite/analogue bentonite adjacent to sample 11 (MPLP963). Some fractures are partially coated by Ca carbonate.
MPLP965 15 50.0 127.0 Friable, brecciated and fractured red bentonite/analogue bentonite. Some fractures are partially coated by Ca carbonate.
MPLP966 7 60.0 152.4 A red bentonite/analogue bentonite at the base of a zone of heavy red staining.

130
Quantitative analyses were typically recorded from small areas of the clay matrix of these samples, with sites being selected so as to minimise contamination by other sample phases (e.g. zeolites, calcium carbonate, iron and manganese phases). Where fractures were identified within a polished section, analytical sites were selected from fracture wall clays along the length of the fracture and from clay matrix at measured distances from the fracture. Point and small area analyses were also performed on some of the clay-altered detrital clasts. Quantitative element data have been converted to compound data (assuming iron to be present in the Fe III valency) and then to atoms per functional unit (APFU), normalised to 22 O equivalents, ignoring H2O. Full data sets are presented in appendix 4. Octahedral Al has been calculated assuming 8 APFU for tetrahedral Si+Al. Three sets of triaxial plots are used, below, to aid in the identification of any mineralogical, structural or compositional variations. The Figure 7.2.43 plot is a useful guide to mineral identification. It shows that the bulk of the data plots around the end member montmorillonite point. Two data ‘tails’ are towards the end member palygorskite composition point, and towards the apex of the Si axis. The palgorskite tail is shown most strongly in the altered grain values; with the most palygorskite-like compositions coming from altered fiamme structures (e.g. sample MPLP901, Figure 7.2.44).
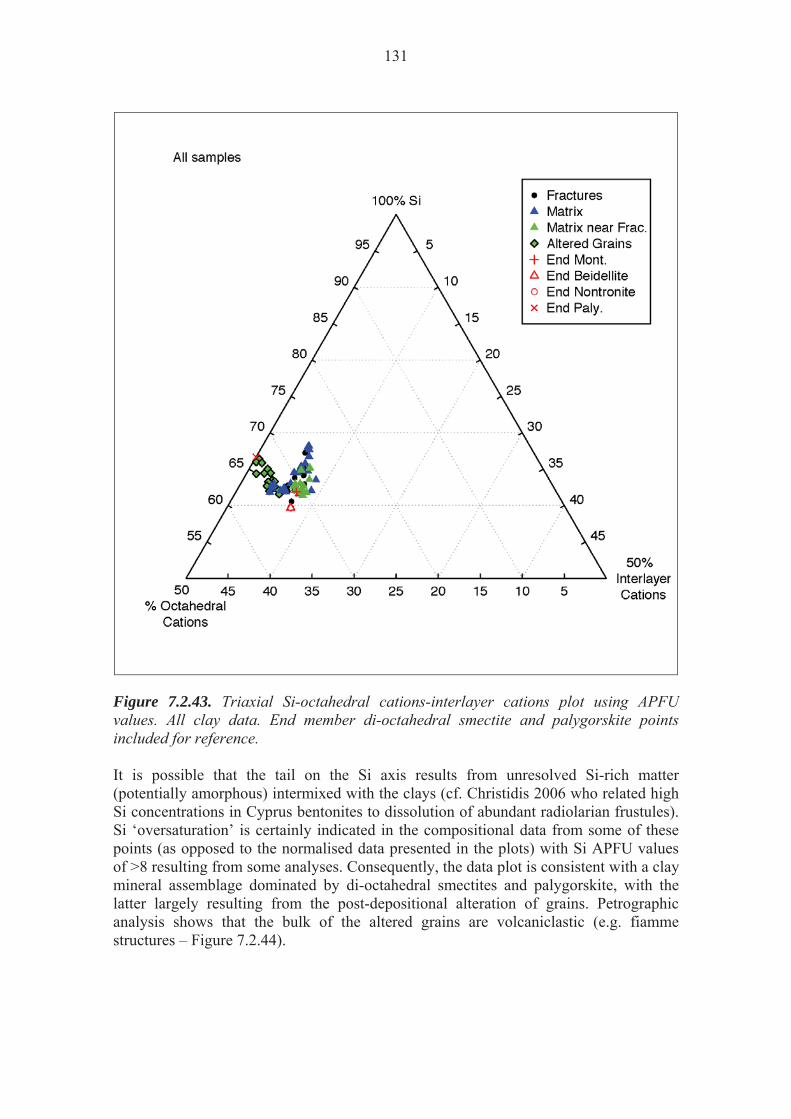
131
Figure 7.2.43. Triaxial Si-octahedral cations-interlayer cations plot using APFU values. All clay data. End member di-octahedral smectite and palygorskite points included for reference. It is possible that the tail on the Si axis results from unresolved Si-rich matter (potentially amorphous) intermixed with the clays (cf. Christidis 2006 who related high Si concentrations in Cyprus bentonites to dissolution of abundant radiolarian frustules). Si ‘oversaturation’ is certainly indicated in the compositional data from some of these points (as opposed to the normalised data presented in the plots) with Si APFU values of >8 resulting from some analyses. Consequently, the data plot is consistent with a clay mineral assemblage dominated by di-octahedral smectites and palygorskite, with the latter largely resulting from the post-depositional alteration of grains. Petrographic analysis shows that the bulk of the altered grains are volcaniclastic (e.g. fiamme structures – Figure 7.2.44).

132
Figure 7.2.44. BSEM image (top) and EDXA spectrum (bottom). Polished section from MPLP901 showing micro-fiamme textures. Silt- and sand-sized grains are mostly of plagioclase (pl) and apatite (ap). The EDXA spectrum is from the site marked in the image and is typical of those recorded from this phase. These give chemistries consistent with palygorskite compositions. The octahedral Al-Mg-Fe triaxial plot (Figure 7.2.45) is used to show the variations in the composition of the layer structural elements of clay minerals. The bulk of the matrix and fracture points plot in the region typical of Fe-rich montmorillonite, with a higher Fe content than is typical. The spread of data shows that the variation is primarily between octahedral Al and Fe; Mg content is relatively consistent. Part of this variation may be anomalous, resulting from an over-allocation of Al to the octahedral site in samples enriched in Si, as discussed above. Additionally, some of the detected Fe may come from associated non-structural iron in the matrix (most of these samples are red in colour).
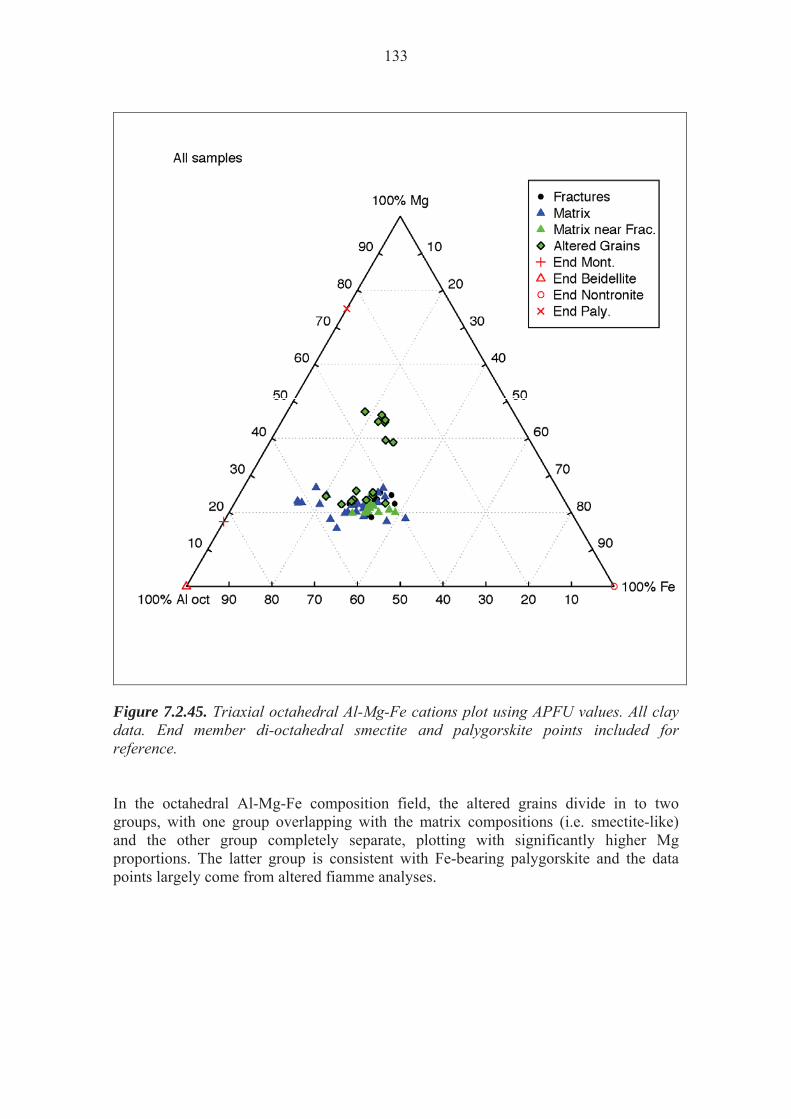
133
Figure 7.2.45. Triaxial octahedral Al-Mg-Fe cations plot using APFU values. All clay data. End member di-octahedral smectite and palygorskite points included for reference. In the octahedral Al-Mg-Fe composition field, the altered grains divide in to two groups, with one group overlapping with the matrix compositions (i.e. smectite-like) and the other group completely separate, plotting with significantly higher Mg proportions. The latter group is consistent with Fe-bearing palygorskite and the data points largely come from altered fiamme analyses.

134
Figure 7.2.46. Triaxial Ca-K-Na interlayer cations plot using APFU values. All clay data. End member di-octahedral smectite points included for reference. Some altered grain points are nominal, as their interlayer cation totals are low. The triaxial Ca-K-Na plot (Figure 7.2.46) maps the proportions of the main interlayer cations. The altered grain points have a widely scattered distribution, reflecting a low total interlayer cation content (see Figure 7.2.43). Outside of these and a small number of the matrix compositions, most points show relatively consistent and low proportions of Ca (at around 20 %). These mostly plot on a mixing line between Na and K, typically being relatively enriched with respect to K. The greater consistency of the Ca content is probably a consequence, at least in part, of its lower replaceability relative to K and Na. The fracture and fracture-adjacent-matrix points are notably more tightly clustered than are the general matrix values.

135
Clay matrix chemistry
Examination of the clay matrix compositional data on a sample by sample basis shows that compositions typically cluster by sample (Figure 7.2.47. to Figure 7.2.49.). Matrix data from sample MPLP962 plot separately to all the other sample matrix data in each of the plots (red triangles in above figures). This reflects its distinctively different petrology, being the only of the analysed samples that is green in colour and which does not contain additional iron phases intermixed with the clay minerals of the matrix; consequently the data from this sample have the lowest Fe proportions in the octahedral Al-Mg-Fe plot (Figure 7.2.). The implication of this observation, combined with the red colour of the other samples, is that the Fe contents of the other samples have likely been supplemented by the presence of other Fe-bearing phases (e.g. oxide/hydroxides); this creates the data separation and the Fe-rich tail in Figure 7.2.48. Interlayer cation compositions for MPLP962 data plot closer to the end member di-octahedral smectite points (Figure 7.2.49.), whilst other samples plot in clusters with higher K proportions, with the data from MPLP966 showing the highest K values. It is likely that this separation reflects the higher content of clays of detrital origin present in the other samples. The MPLP962 sample has been identified as a probable altered crystal tuff where the matrix clearly dominantly comprises clay minerals of secondary origin (see Figure 7.2.50.). Observations suggest that the matrix of the other samples contain a mix of dominantly detrital with lesser secondary clay minerals. In the Si-octahedral cations-interlayer cations plot (Figure 7.2.47.) the MPLP962 data plot near to the end member di-octahedral smectite points and on the mixing line with the palygorskite end member point. If the fibrous clay morphology observed in many samples is palygorskite, then this distribution is consistent with the observed presence of fibrous forms alongside the webbed clay forms typical of smectites observed in the matrix of MPLP962 (Figure 7.2.50.). Other sample data plot on a line from end-member di-octahedral smectite points towards the apex of the Si axis; as noted previously, this suggests the presence in the matrix of intermixed Si-rich constituents alongside the smectites. It is notable that the most Si-enriched points come from the MPLP966 sample, which also shows the highest K values (Figure 7.2.49.); it is possible that the Si and K are both enriched from a single unidentified intermixed phase.

136
Figure 7.2.47. Triaxial Si-octahedral cations-interlayer cations plot using APFU values. Matrix data colour coded by sample. End member di-octahedral smectite and palygorskite points included for reference.
Figure 7.2.48. Triaxial octahedral Al-Mg-Fe cations plot using APFU values. Matrix data colour coded by sample. End member di-octahedral smectite and palygorskite points included for reference.
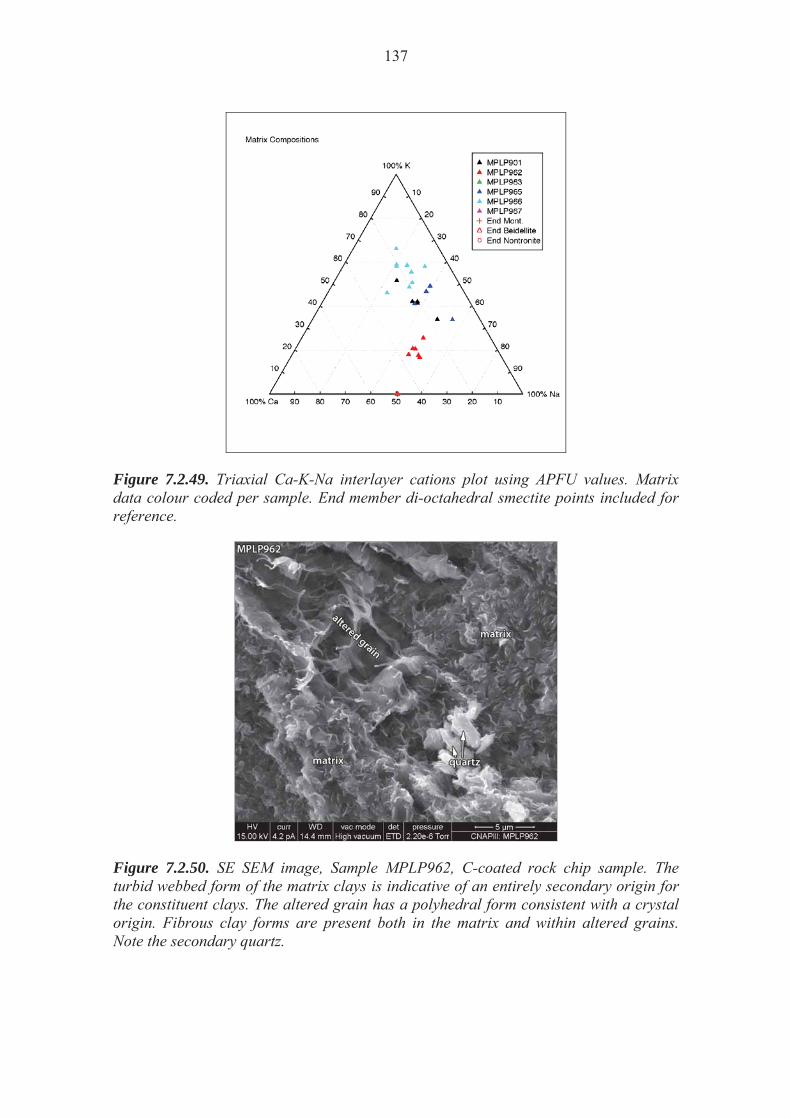
137
Figure 7.2.49. Triaxial Ca-K-Na interlayer cations plot using APFU values. Matrix data colour coded per sample. End member di-octahedral smectite points included for reference.
Figure 7.2.50. SE SEM image, Sample MPLP962, C-coated rock chip sample. The turbid webbed form of the matrix clays is indicative of an entirely secondary origin for the constituent clays. The altered grain has a polyhedral form consistent with a crystal origin. Fibrous clay forms are present both in the matrix and within altered grains. Note the secondary quartz.
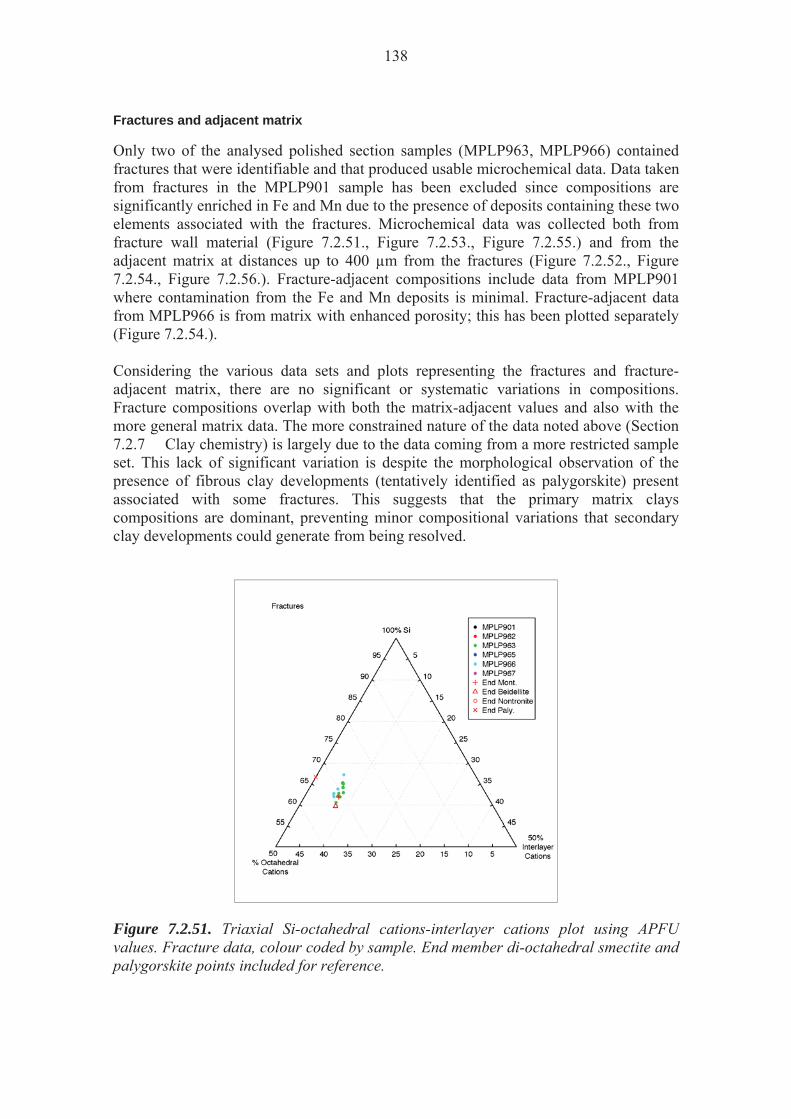
138
Fractures and adjacent matrix
Only two of the analysed polished section samples (MPLP963, MPLP966) contained fractures that were identifiable and that produced usable microchemical data. Data taken from fractures in the MPLP901 sample has been excluded since compositions are significantly enriched in Fe and Mn due to the presence of deposits containing these two elements associated with the fractures. Microchemical data was collected both from fracture wall material (Figure 7.2.51., Figure 7.2.53., Figure 7.2.55.) and from the adjacent matrix at distances up to 400 μm from the fractures (Figure 7.2.52., Figure 7.2.54., Figure 7.2.56.). Fracture-adjacent compositions include data from MPLP901 where contamination from the Fe and Mn deposits is minimal. Fracture-adjacent data from MPLP966 is from matrix with enhanced porosity; this has been plotted separately (Figure 7.2.54.). Considering the various data sets and plots representing the fractures and fracture-adjacent matrix, there are no significant or systematic variations in compositions. Fracture compositions overlap with both the matrix-adjacent values and also with the more general matrix data. The more constrained nature of the data noted above (Section 7.2.7 Clay chemistry) is largely due to the data coming from a more restricted sample set. This lack of significant variation is despite the morphological observation of the presence of fibrous clay developments (tentatively identified as palygorskite) present associated with some fractures. This suggests that the primary matrix clays compositions are dominant, preventing minor compositional variations that secondary clay developments could generate from being resolved.
Figure 7.2.51. Triaxial Si-octahedral cations-interlayer cations plot using APFU values. Fracture data, colour coded by sample. End member di-octahedral smectite and palygorskite points included for reference.
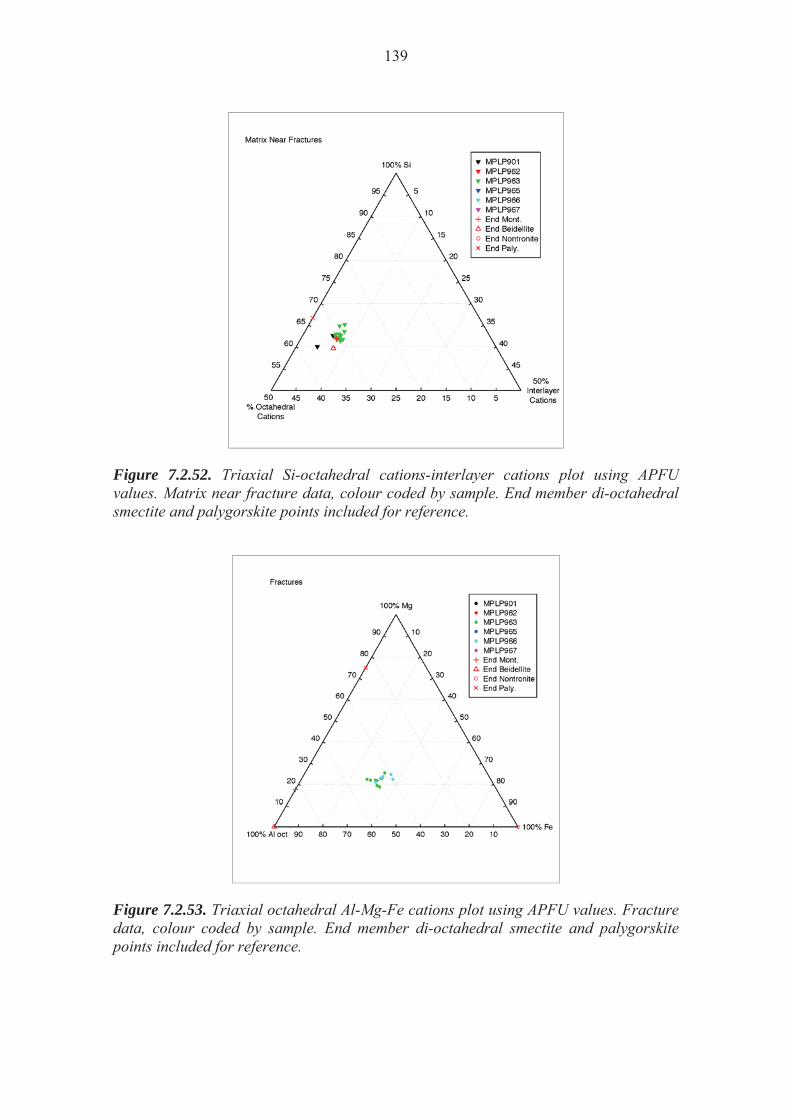
139
Figure 7.2.52. Triaxial Si-octahedral cations-interlayer cations plot using APFU values. Matrix near fracture data, colour coded by sample. End member di-octahedral smectite and palygorskite points included for reference.
Figure 7.2.53. Triaxial octahedral Al-Mg-Fe cations plot using APFU values. Fracture data, colour coded by sample. End member di-octahedral smectite and palygorskite points included for reference.
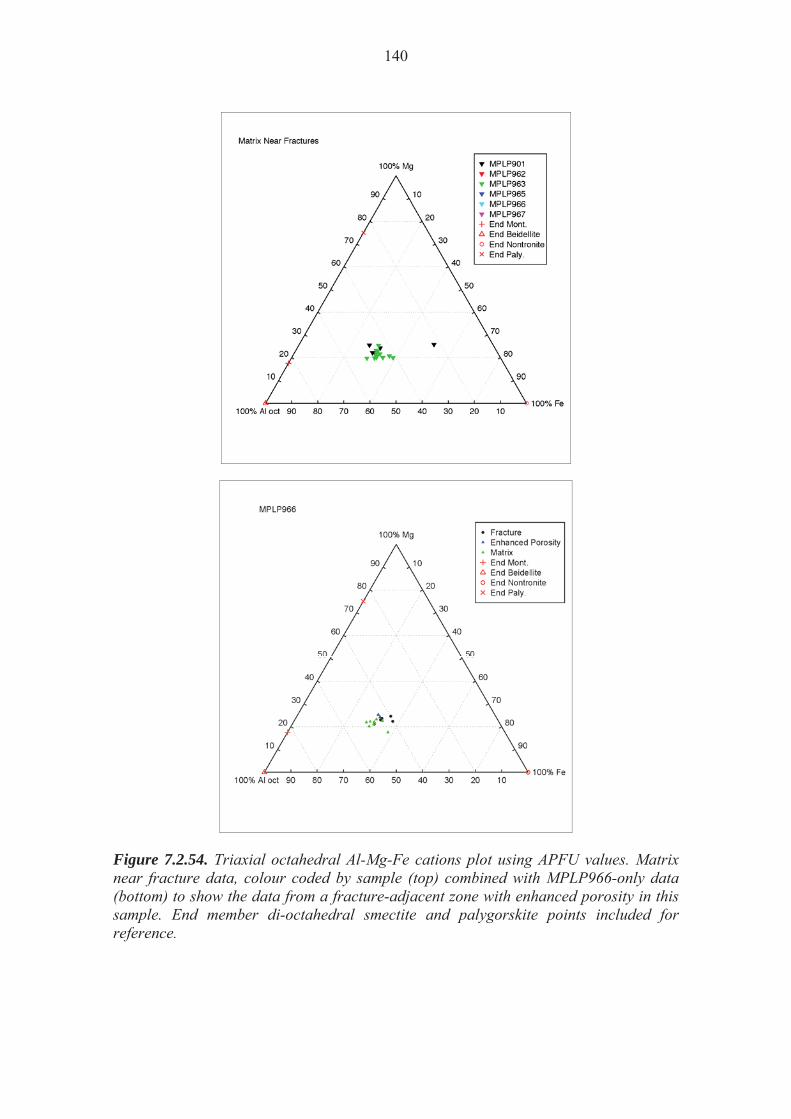
140
Figure 7.2.54. Triaxial octahedral Al-Mg-Fe cations plot using APFU values. Matrix near fracture data, colour coded by sample (top) combined with MPLP966-only data (bottom) to show the data from a fracture-adjacent zone with enhanced porosity in this sample. End member di-octahedral smectite and palygorskite points included for reference.
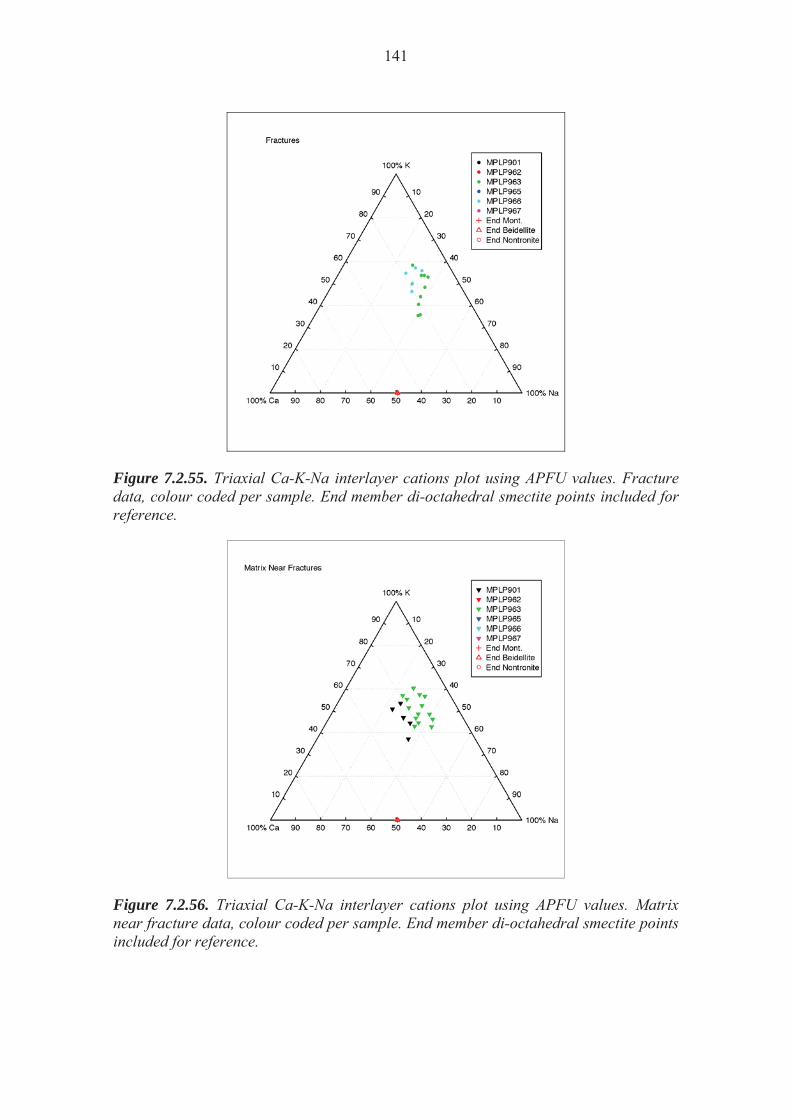
141
Figure 7.2.55. Triaxial Ca-K-Na interlayer cations plot using APFU values. Fracture data, colour coded per sample. End member di-octahedral smectite points included for reference.
Figure 7.2.56. Triaxial Ca-K-Na interlayer cations plot using APFU values. Matrix near fracture data, colour coded per sample. End member di-octahedral smectite points included for reference.
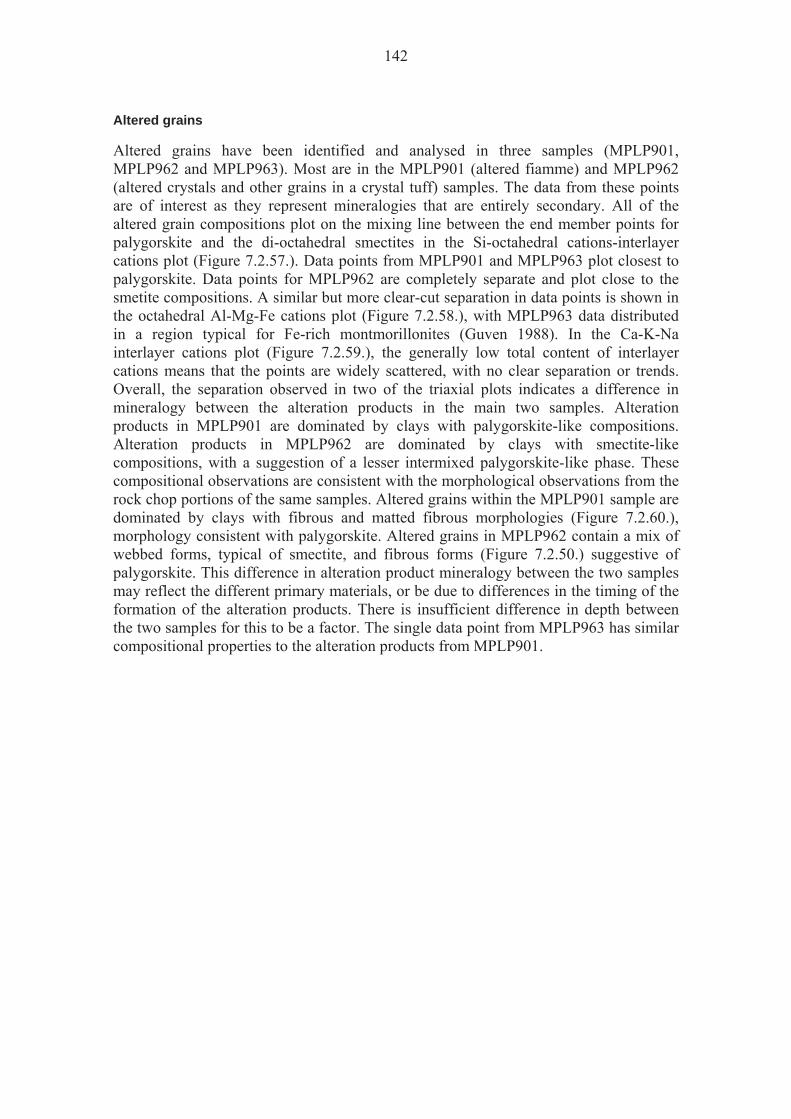
142
Altered grains
Altered grains have been identified and analysed in three samples (MPLP901, MPLP962 and MPLP963). Most are in the MPLP901 (altered fiamme) and MPLP962 (altered crystals and other grains in a crystal tuff) samples. The data from these points are of interest as they represent mineralogies that are entirely secondary. All of the altered grain compositions plot on the mixing line between the end member points for palygorskite and the di-octahedral smectites in the Si-octahedral cations-interlayer cations plot (Figure 7.2.57.). Data points from MPLP901 and MPLP963 plot closest to palygorskite. Data points for MPLP962 are completely separate and plot close to the smetite compositions. A similar but more clear-cut separation in data points is shown in the octahedral Al-Mg-Fe cations plot (Figure 7.2.58.), with MPLP963 data distributed in a region typical for Fe-rich montmorillonites (Guven 1988). In the Ca-K-Na interlayer cations plot (Figure 7.2.59.), the generally low total content of interlayer cations means that the points are widely scattered, with no clear separation or trends. Overall, the separation observed in two of the triaxial plots indicates a difference in mineralogy between the alteration products in the main two samples. Alteration products in MPLP901 are dominated by clays with palygorskite-like compositions. Alteration products in MPLP962 are dominated by clays with smectite-like compositions, with a suggestion of a lesser intermixed palygorskite-like phase. These compositional observations are consistent with the morphological observations from the rock chop portions of the same samples. Altered grains within the MPLP901 sample are dominated by clays with fibrous and matted fibrous morphologies (Figure 7.2.60.), morphology consistent with palygorskite. Altered grains in MPLP962 contain a mix of webbed forms, typical of smectite, and fibrous forms (Figure 7.2.50.) suggestive of palygorskite. This difference in alteration product mineralogy between the two samples may reflect the different primary materials, or be due to differences in the timing of the formation of the alteration products. There is insufficient difference in depth between the two samples for this to be a factor. The single data point from MPLP963 has similar compositional properties to the alteration products from MPLP901.
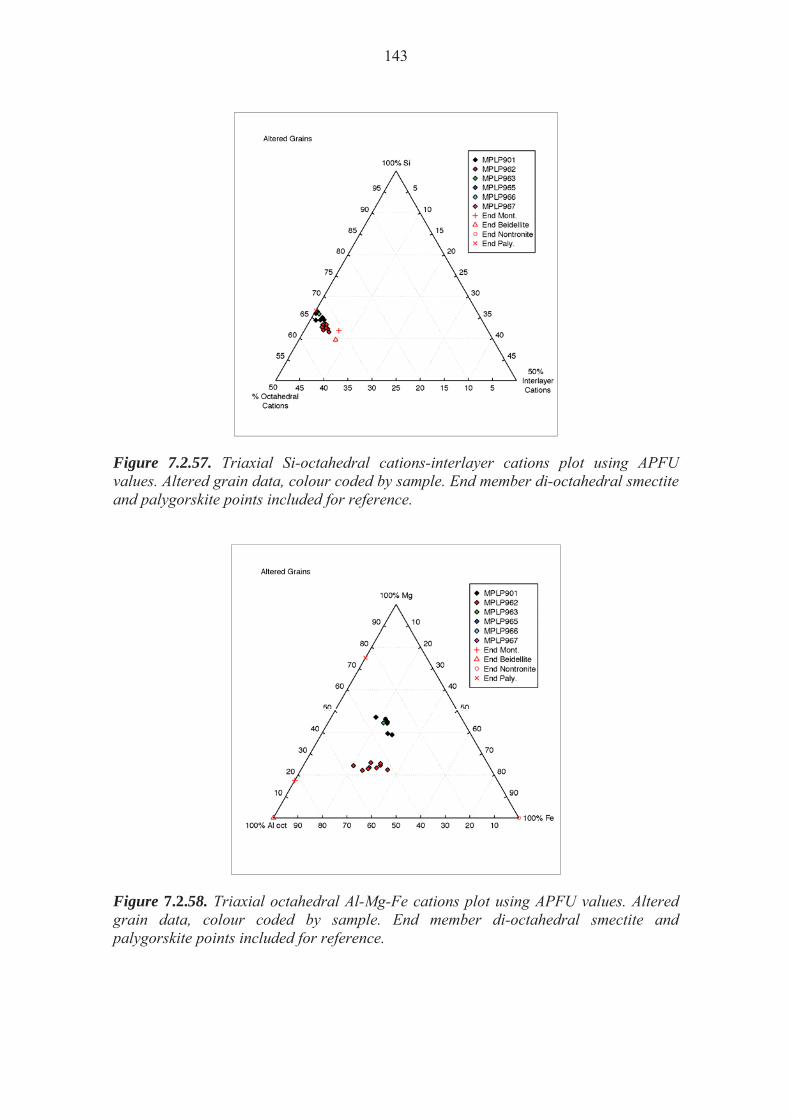
143
Figure 7.2.57. Triaxial Si-octahedral cations-interlayer cations plot using APFU values. Altered grain data, colour coded by sample. End member di-octahedral smectite and palygorskite points included for reference.
Figure 7.2.58. Triaxial octahedral Al-Mg-Fe cations plot using APFU values. Altered grain data, colour coded by sample. End member di-octahedral smectite and palygorskite points included for reference.
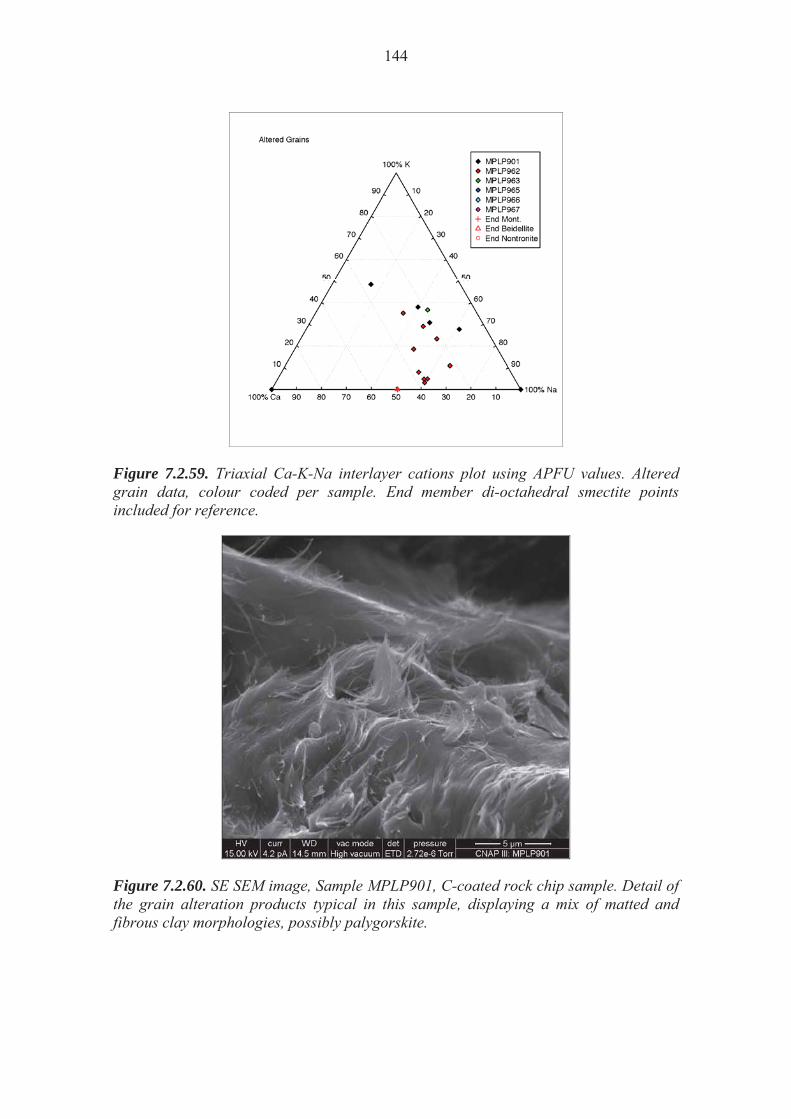
144
Figure 7.2.59. Triaxial Ca-K-Na interlayer cations plot using APFU values. Altered grain data, colour coded per sample. End member di-octahedral smectite points included for reference.
Figure 7.2.60. SE SEM image, Sample MPLP901, C-coated rock chip sample. Detail of the grain alteration products typical in this sample, displaying a mix of matted and fibrous clay morphologies, possibly palygorskite.
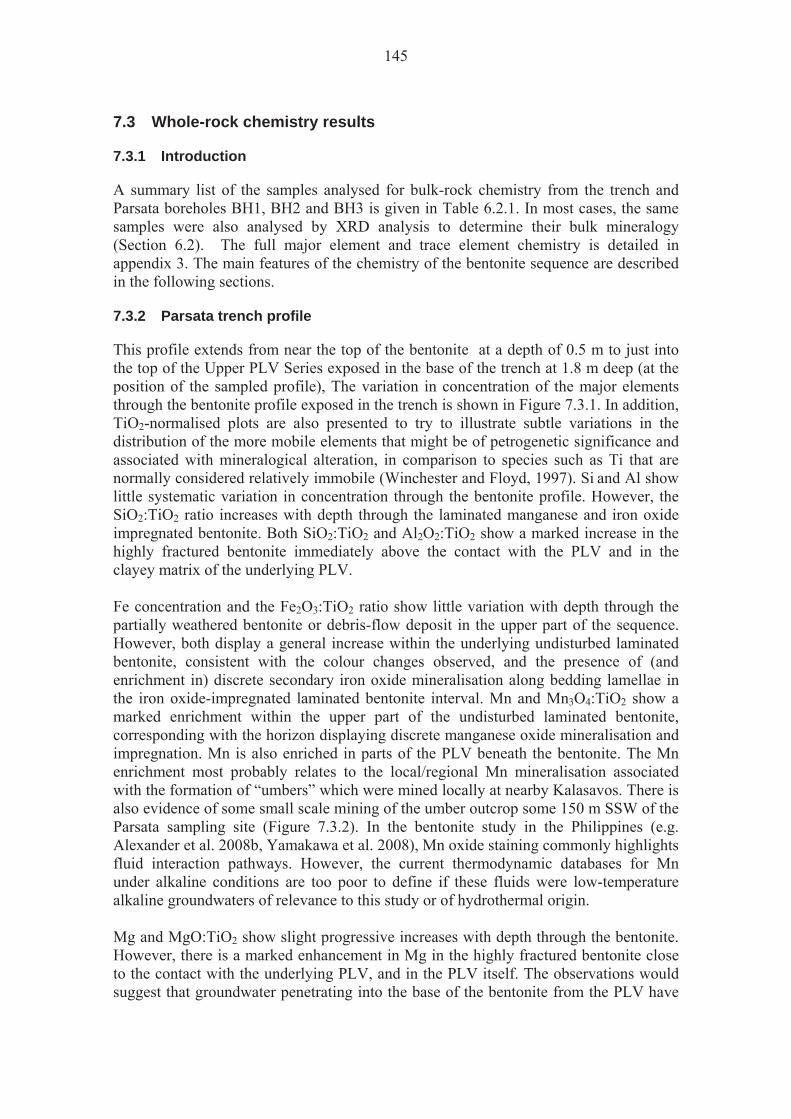
145
7.3 Whole-rock chemistry results 7.3.1 Introduction
A summary list of the samples analysed for bulk-rock chemistry from the trench and Parsata boreholes BH1, BH2 and BH3 is given in Table 6.2.1. In most cases, the same samples were also analysed by XRD analysis to determine their bulk mineralogy (Section 6.2). The full major element and trace element chemistry is detailed in appendix 3. The main features of the chemistry of the bentonite sequence are described in the following sections. 7.3.2 Parsata trench profile
This profile extends from near the top of the bentonite at a depth of 0.5 m to just into the top of the Upper PLV Series exposed in the base of the trench at 1.8 m deep (at the position of the sampled profile), The variation in concentration of the major elements through the bentonite profile exposed in the trench is shown in Figure 7.3.1. In addition, TiO2-normalised plots are also presented to try to illustrate subtle variations in the distribution of the more mobile elements that might be of petrogenetic significance and associated with mineralogical alteration, in comparison to species such as Ti that are normally considered relatively immobile (Winchester and Floyd, 1997). Si and Al show little systematic variation in concentration through the bentonite profile. However, the SiO2:TiO2 ratio increases with depth through the laminated manganese and iron oxide impregnated bentonite. Both SiO2:TiO2 and Al2O2:TiO2 show a marked increase in the highly fractured bentonite immediately above the contact with the PLV and in the clayey matrix of the underlying PLV. Fe concentration and the Fe2O3:TiO2 ratio show little variation with depth through the partially weathered bentonite or debris-flow deposit in the upper part of the sequence. However, both display a general increase within the underlying undisturbed laminated bentonite, consistent with the colour changes observed, and the presence of (and enrichment in) discrete secondary iron oxide mineralisation along bedding lamellae in the iron oxide-impregnated laminated bentonite interval. Mn and Mn3O4:TiO2 show a marked enrichment within the upper part of the undisturbed laminated bentonite, corresponding with the horizon displaying discrete manganese oxide mineralisation and impregnation. Mn is also enriched in parts of the PLV beneath the bentonite. The Mn enrichment most probably relates to the local/regional Mn mineralisation associated with the formation of “umbers” which were mined locally at nearby Kalasavos. There is also evidence of some small scale mining of the umber outcrop some 150 m SSW of the Parsata sampling site (Figure 7.3.2). In the bentonite study in the Philippines (e.g. Alexander et al. 2008b, Yamakawa et al. 2008), Mn oxide staining commonly highlights fluid interaction pathways. However, the current thermodynamic databases for Mn under alkaline conditions are too poor to define if these fluids were low-temperature alkaline groundwaters of relevance to this study or of hydrothermal origin. Mg and MgO:TiO2 show slight progressive increases with depth through the bentonite. However, there is a marked enhancement in Mg in the highly fractured bentonite close to the contact with the underlying PLV, and in the PLV itself. The observations would suggest that groundwater penetrating into the base of the bentonite from the PLV have

146
introduced Mg into the bentonite. Petrographical observations (see Section 7.2) also show that there has been minor late-stage alteration of the original bentonite, associated with the formation of secondary Mg-rich clays (palygorskite-like phase) within the bentonite, and this may be associated with this introduction of Mg. Ca and CaO:TiO2 show little variation through most the sequence. However, both show a significant increase in the bentonite close to the contact with the PLV and in the underlying PLV. This corresponds closely with the observation of fine white powdery coatings of secondary calcite and possible silicate mineralization on fracture surfaces in the basal part of the bentonite and in the PLV. It may indicate some penetration of Ca-rich mineralised groundwater from the PLV into the base of the bentonite sequence. Na and K concentrations show little variation with depth within the bentonite. The TiO2-normalised plots suggest a slight enhancement of K and Na relative to Ti. However, it is difficult to ascertain whether this is an artefact of a slightly lower Ti content at this point in the sequence, reflecting a primary variation in the original sedimentary mineralogical composition (e.g. heavy mineral content) of this sequence. 7.3.3 Parsata borehole 2 profile
Although borehole 2 presents the thickest and deepest profile through the bentonitic bentonite/analogue bentonite sequence, the contact with the PLV was not seen or reached in this borehole.The patterns of major elemental variation seen in the cuttings and core material recovered from borehole 2 (Figure 7.3.3), broadly resemble the chemical variations observed in the bentonite from the trench. Si and Al appear to show very little change with depth. The variations observed may represent variations in the primary detrital mineralogy such as detrital quartz content (Section 7.1), rather than any evidence for chemical alteration. Fe progressively increases slightly with depth, although the Fe2O3:TiO2 ratio shows a sharp increase below about 32 m, which also corresponds to amarked increase in Mn concentration. This Mn enrichment may correspond to the position of the horizon of the zone of manganese oxide impregnated bentonite observed in the trench (Section 7.3.2). Mg and Ca concentrations also show little variation with depth through the bentonite. However, the MgO;TiO2 and CaO:TiO2 ratios increase slightly below about 32 m, corresponding to the zone of Mn-enrichment. Both K and Na show a general slight increase with depth through the bentonite. Apart from significant Mn-enrichment in the bentonite below 32 m, there is no evidence of any other major chemical changes that could be associated with interaction of bentonite with alkaline groundwater from depth. The Mn enrichment is probably associated with the regional Mn mineralisation related to the formation of “umbers” worked locally (cf. section 7.3.2).
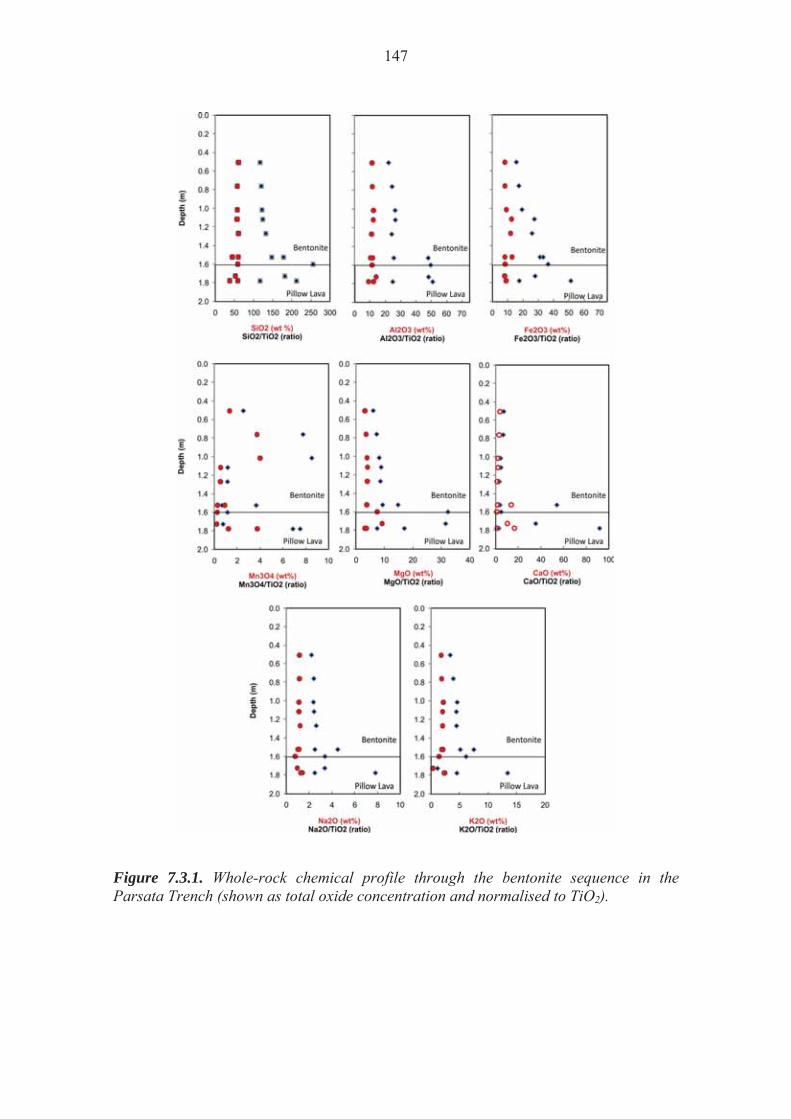
147
Figure 7.3.1. Whole-rock chemical profile through the bentonite sequence in the Parsata Trench (shown as total oxide concentration and normalised to TiO2).

148
7.3.4 Parsata borehole 1 profile
The patterns of major elemental variation seen in the cuttings and core material recovered from borehole 1 (Figure 7.3.4), broadly resemble the chemical variations observed in the bentonite from the trench and borehole 2. However, as in borehole 2, the contact with the PLV was not seen in this borehole.
Figure 7.3.2. Umber outcrop some 150 m SSW of the Parsata sampling site.
Fe possibly shows a subtle slight increase with depth, shown more strongly by the Fe2O3:TiO2 ratio shows a sharp increase below about 20 m. This increase also corresponds to a slight increase in Mn and Mg concentration at the same depth. This Mn enrichment may correspond to the position of the top of the horizon of the zone of manganese oxide impregnated bentonite defined in the trench (Section 7.3.2). Ca, K and Na concentrations show little systematic variation with depth through the bentonite. The TiO2–normalised ratios increase slightly with depth but this may be an artefact more likely to reflect the in-situ primary detrital mineral components containing Ti (i.e. heavy minerals) rather, that indicative of any alteration processes. 7.3.5 Parsata borehole 4 profile
The patterns of major elemental variation seen in the cuttings and core material recovered from borehole 1 (Figure 7.3.5), broadly resemble the chemical variations observed in the bentonite from the trench and boreholes 2 and 4. As in the previous boreholes, the contact with the PLV was not seen in this borehole. Si and Al concentrations show very little change with depth. As discussed earlier, the variations observed in SiO2:TiO2 and Al2O3:TiO2 may represent variations in the primary detrital mineralogy such as detrital quartz content (Section 7.1) and heavy minerals, rather than for any evidence of chemical alteration.
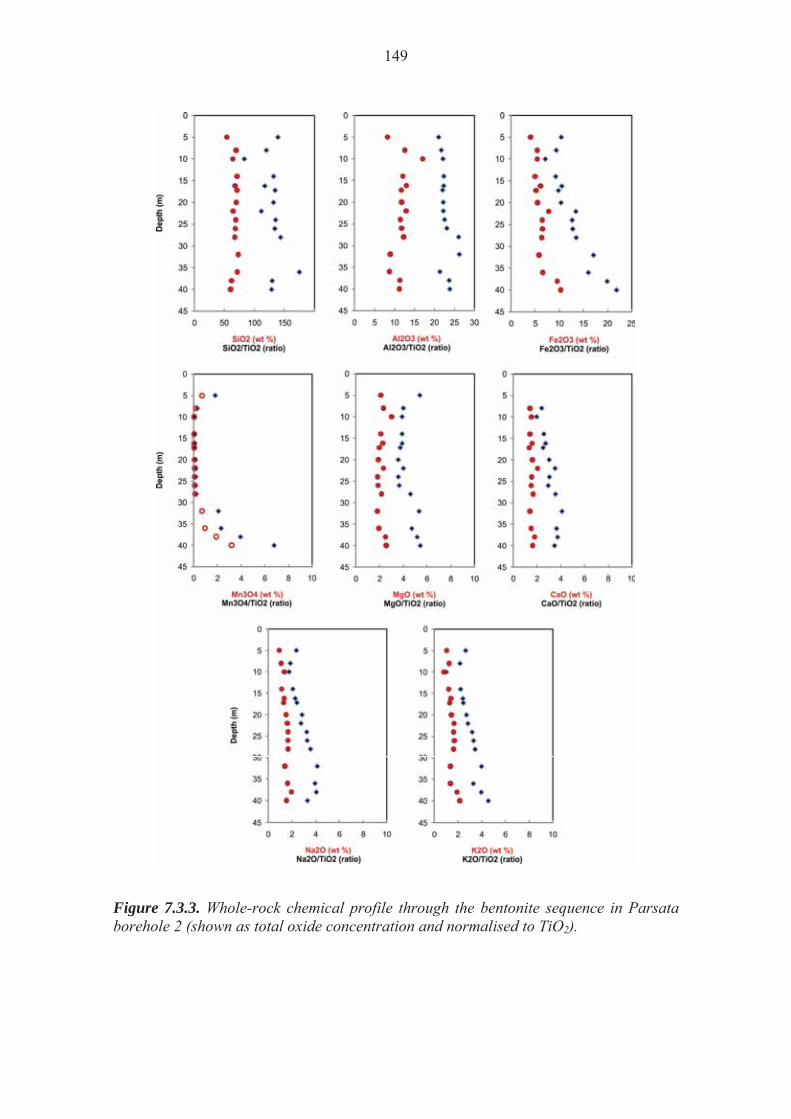
149
Figure 7.3.3. Whole-rock chemical profile through the bentonite sequence in Parsata borehole 2 (shown as total oxide concentration and normalised to TiO2).

150
Figure 7.3.4. Whole-rock chemical profile through the bentonite sequence in Parsata borehole 1 (shown as total oxide concentration and normalised to TiO2). Fe shows little variation with depth, whereas a slight increase in Mn concentration and enhancement of Mn relative to TiO2 is observed below 12 m. This Mn increase probably corresponds to the position of the top of the horizon of the zone of manganese oxide impregnated bentonite defined in the trench and seen in the other two boreholes (Sections 7.3.2 to 7.3.4). Ca and Mg are observed to show a slight increase at the bottom of the borehole. K and Na concentrations show little systematic variation with depth through the bentonite. The TiO2–normalised ratios increase slightly with depth but as discussed earlier this may be an artefact more likely to reflect the in-situ primary detrital mineral components containing Ti (i.e. heavy minerals) rather, that indicative of any alteration processes.
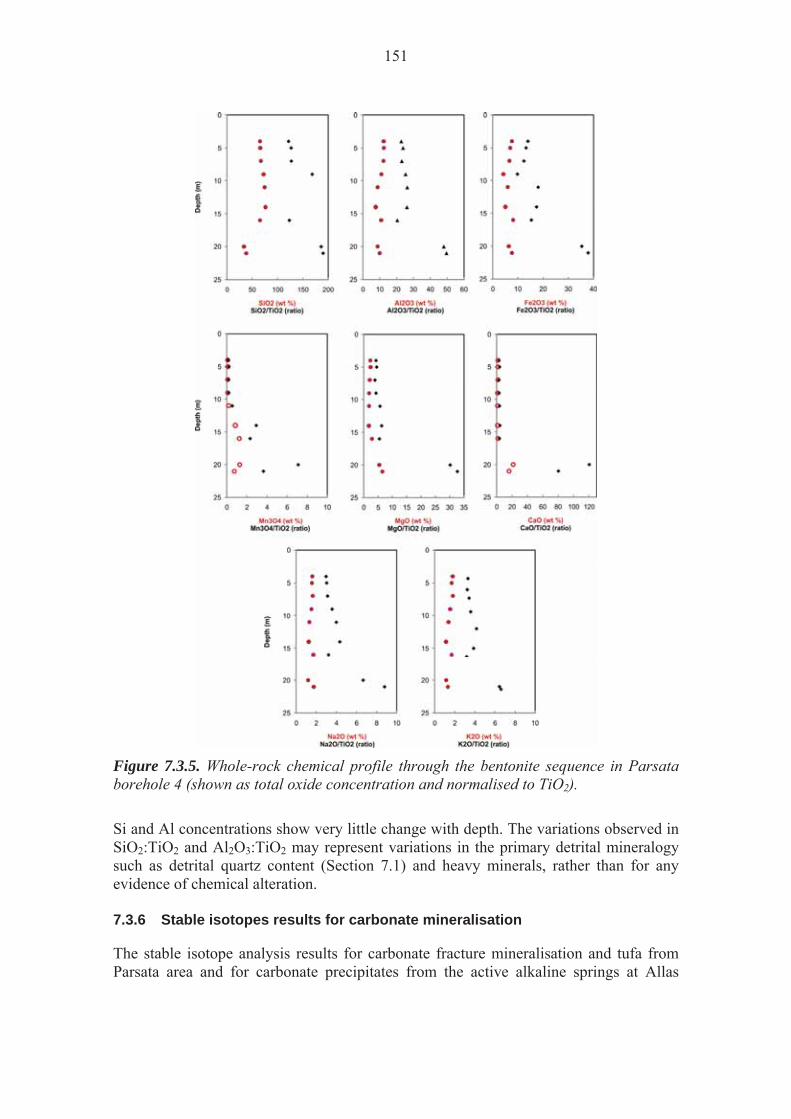
151
Figure 7.3.5. Whole-rock chemical profile through the bentonite sequence in Parsata borehole 4 (shown as total oxide concentration and normalised to TiO2). Si and Al concentrations show very little change with depth. The variations observed in SiO2:TiO2 and Al2O3:TiO2 may represent variations in the primary detrital mineralogy such as detrital quartz content (Section 7.1) and heavy minerals, rather than for any evidence of chemical alteration. 7.3.6 Stable isotopes results for carbonate mineralisation
The stable isotope analysis results for carbonate fracture mineralisation and tufa from Parsata area and for carbonate precipitates from the active alkaline springs at Allas
152
Springs in the Troodos mountains are presented in Table 7.3.1. The variation in 18O and 13C for these carbonate deposits mineralisation is illustrated Figure 7.3.6. The Allas Springs travertines and tufa deposits show remarkable depletion in both 13C and 18O, and displaying a linear trend in 18O and 13C values, ranging from -26.5 ‰
18O and -17.8 13C in travertine precipitating from artesian groundwater discharging directly from fractures in hartzbergite (A1-1 site) to from -13.2 ‰ 18O and -5.6 13C in tufa/calcite cementing gravels and scree beneath the flowstone deposited in the small stream at Allas Springs (A4 site). These carbonates display similar isotopic compositions to travertines precipitated from alkaline groundwaters associated with low-temperature serpentinisation of ultrabasic rocks in the Semail Ophiolite in the United Arab Emirates and Oman (Clark and Fontes, 1992; Clark et al. 1992; Stephen et al. 2011), and from experimental carbonate precipitates formed by diffusive reaction of atmospheric CO2 with hyperalkaline solution where 13C values as low as 27.5 ‰ and
18O values of 16.9 ‰ PDB have been recorded (Clark et al. 1992). Similar, isotopically depleted carbonate precipitates have been more recently observed in unusual speleothem deposits in the UK that are associated with alkaline (Ca(OH)2) leachetes from old industrial limeworks (Hartland et al. 2010). The marked depletion of 13C and 18O in the carbonate phase is the result of strong kinetic fractionation of 13C during the essentially irreversible hydroxylation of CO2 coupled with strong 18O depletion in the reacting OH- in the groundwater (Clark et al. 1992). The observed variation from for the Allas Springs samples can be explained by mixing of the alkaline groundwater with shallow bicarbonate groundwater or rainwater (as noted by Alexander and Milodowski 2011, on the basis of the groundwater stable isotope and tritium signatures). The most depleted carbonate (A1-1 site) represents precipitation from the deeper-sourced, “end-member” alkaline groundwater that is discharging directly from the fractured harzbergite before mixing with bicarbonate groundwater or rainwater; whereas the samples of travertine in the small stream at Allas Springs (e.g. A4 site) represent precipitates that have deposited from alkaline groundwater that is probably mixing with shallow bicarbonate groundwater and rainwater pecolating through the scree and colluvial deposits, along the course of the stream. One sample of tufa filling fractures in conglomeratic sediments overlying the altered Lower Pillow Lava exposed in the road cutting at Parsata (sample P3-2: BGS lab No. MPLN850), would appear to possible lie on the alkaline groundwater-bicarbonate groundwater mixing trend (Figure 7.3.6). Although this might potentially provide some indication for palaeo-alkaline groundwater interaction across the Parsata area, caution must be exercised as this is only represented by one analysis in this very limited dataset. The remaining carbonate data from calcite fracture fillings in the Pillow Lavas and bentonitic strata encountered in Trench 1 and in outcrop in the Parsata area (Figure 7.3.6) are most consistent with carbonate precipitated in arid soil environments, influenced by C4-type plant-derived CO2 (cf. Clarke and Fontes 1990) or calcrete formation (e.g. Salomon et al. 1978).
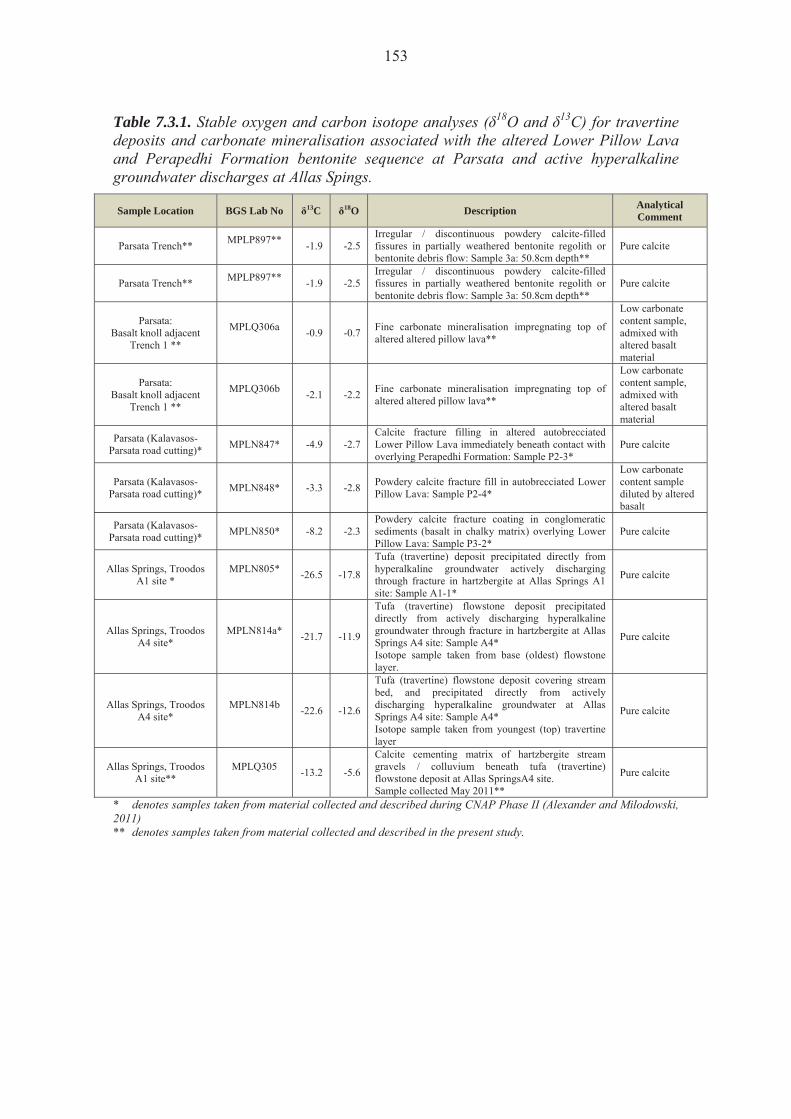
153
Table 7.3.1. Stable oxygen and carbon isotope analyses ( 18O and 13C) for travertine deposits and carbonate mineralisation associated with the altered Lower Pillow Lava and Perapedhi Formation bentonite sequence at Parsata and active hyperalkaline groundwater discharges at Allas Spings.
Sample Location BGS Lab No 13C 18O Description Analytical Comment
Parsata Trench** MPLP897** -1.9 -2.5
Irregular / discontinuous powdery calcite-filled fissures in partially weathered bentonite regolith or bentonite debris flow: Sample 3a: 50.8cm depth**
Pure calcite
Parsata Trench** MPLP897** -1.9 -2.5
Irregular / discontinuous powdery calcite-filled fissures in partially weathered bentonite regolith or bentonite debris flow: Sample 3a: 50.8cm depth**
Pure calcite
Parsata: Basalt knoll adjacent
Trench 1 **
MPLQ306a -0.9 -0.7 Fine carbonate mineralisation impregnating top of
altered altered pillow lava**
Low carbonate content sample, admixed with altered basalt material
Parsata: Basalt knoll adjacent
Trench 1 **
MPLQ306b -2.1 -2.2 Fine carbonate mineralisation impregnating top of
altered altered pillow lava**
Low carbonate content sample, admixed with altered basalt material
Parsata (Kalavasos-Parsata road cutting)* MPLN847* -4.9 -2.7
Calcite fracture filling in altered autobrecciated Lower Pillow Lava immediately beneath contact with overlying Perapedhi Formation: Sample P2-3*
Pure calcite
Parsata (Kalavasos-Parsata road cutting)* MPLN848* -3.3 -2.8 Powdery calcite fracture fill in autobrecciated Lower
Pillow Lava: Sample P2-4*
Low carbonate content sample diluted by altered basalt
Parsata (Kalavasos-Parsata road cutting)* MPLN850* -8.2 -2.3
Powdery calcite fracture coating in conglomeratic sediments (basalt in chalky matrix) overlying Lower Pillow Lava: Sample P3-2*
Pure calcite
Allas Springs, Troodos A1 site *
MPLN805* -26.5 -17.8
Tufa (travertine) deposit precipitated directly from hyperalkaline groundwater actively discharging through fracture in hartzbergite at Allas Springs A1 site: Sample A1-1*
Pure calcite
Allas Springs, Troodos A4 site*
MPLN814a* -21.7 -11.9
Tufa (travertine) flowstone deposit precipitated directly from actively discharging hyperalkaline groundwater through fracture in hartzbergite at Allas Springs A4 site: Sample A4* Isotope sample taken from base (oldest) flowstone layer.
Pure calcite
Allas Springs, Troodos A4 site*
MPLN814b -22.6 -12.6
Tufa (travertine) flowstone deposit covering stream bed, and precipitated directly from actively discharging hyperalkaline groundwater at Allas Springs A4 site: Sample A4* Isotope sample taken from youngest (top) travertine layer
Pure calcite
Allas Springs, Troodos A1 site**
MPLQ305 -13.2 -5.6
Calcite cementing matrix of hartzbergite stream gravels / colluvium beneath tufa (travertine) flowstone deposit at Allas SpringsA4 site. Sample collected May 2011**
Pure calcite
* denotes samples taken from material collected and described during CNAP Phase II (Alexander and Milodowski, 2011) ** denotes samples taken from material collected and described in the present study.
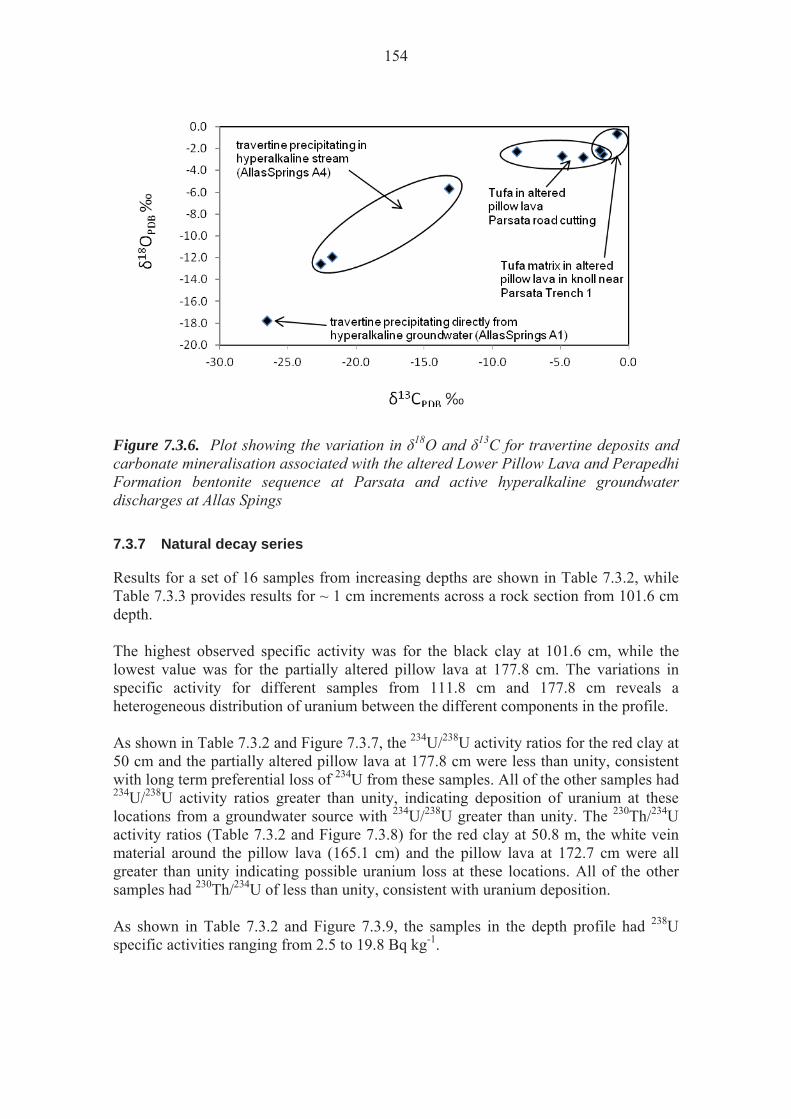
154
Figure 7.3.6. Plot showing the variation in 18O and 13C for travertine deposits and carbonate mineralisation associated with the altered Lower Pillow Lava and Perapedhi Formation bentonite sequence at Parsata and active hyperalkaline groundwater discharges at Allas Spings 7.3.7 Natural decay series
Results for a set of 16 samples from increasing depths are shown in Table 7.3.2, while Table 7.3.3 provides results for ~ 1 cm increments across a rock section from 101.6 cm depth. The highest observed specific activity was for the black clay at 101.6 cm, while the lowest value was for the partially altered pillow lava at 177.8 cm. The variations in specific activity for different samples from 111.8 cm and 177.8 cm reveals a heterogeneous distribution of uranium between the different components in the profile. As shown in Table 7.3.2 and Figure 7.3.7, the 234U/238U activity ratios for the red clay at 50 cm and the partially altered pillow lava at 177.8 cm were less than unity, consistent with long term preferential loss of 234U from these samples. All of the other samples had 234U/238U activity ratios greater than unity, indicating deposition of uranium at these locations from a groundwater source with 234U/238U greater than unity. The 230Th/234U activity ratios (Table 7.3.2 and Figure 7.3.8) for the red clay at 50.8 m, the white vein material around the pillow lava (165.1 cm) and the pillow lava at 172.7 cm were all greater than unity indicating possible uranium loss at these locations. All of the other samples had 230Th/234U of less than unity, consistent with uranium deposition. As shown in Table 7.3.2 and Figure 7.3.9, the samples in the depth profile had 238U specific activities ranging from 2.5 to 19.8 Bq kg-1.
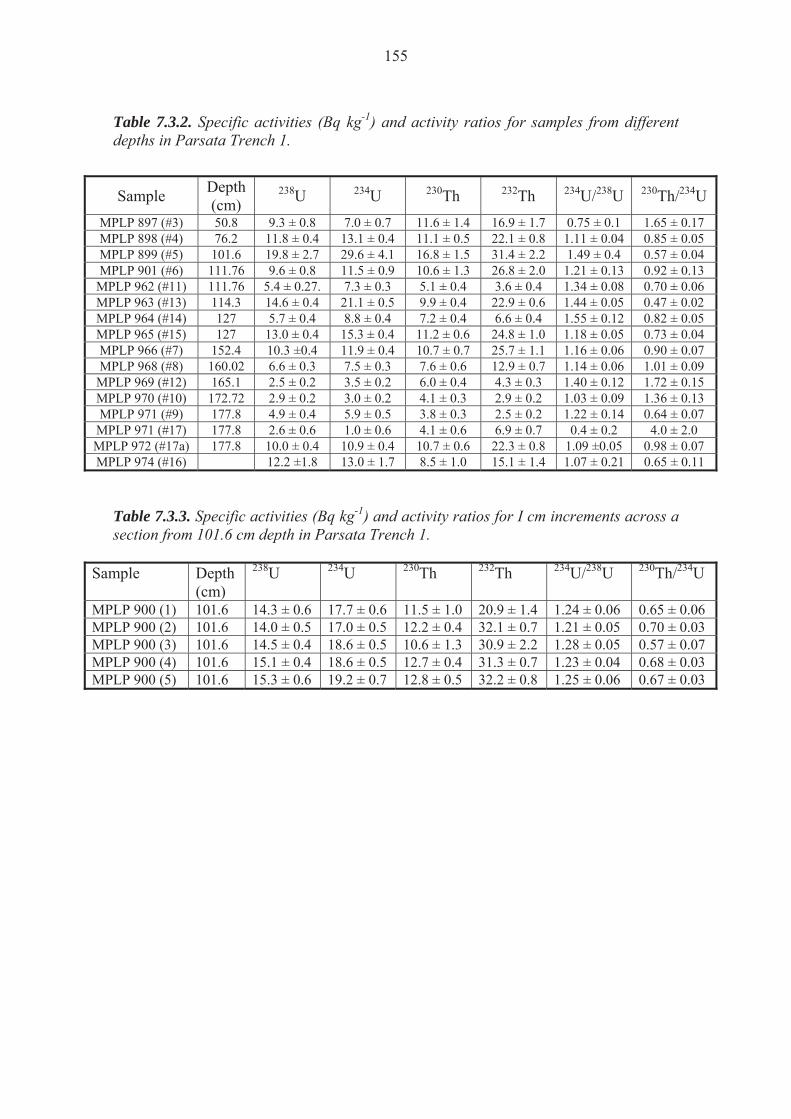
155
Table 7.3.2. Specific activities (Bq kg-1) and activity ratios for samples from different depths in Parsata Trench 1.
Sample Depth (cm)
238U 234U 230Th 232Th 234U/238U 230Th/234U MPLP 897 (#3) 50.8 9.3 ± 0.8 7.0 ± 0.7 11.6 ± 1.4 16.9 ± 1.7 0.75 ± 0.1 1.65 ± 0.17 MPLP 898 (#4) 76.2 11.8 ± 0.4 13.1 ± 0.4 11.1 ± 0.5 22.1 ± 0.8 1.11 ± 0.04 0.85 ± 0.05 MPLP 899 (#5) 101.6 19.8 ± 2.7 29.6 ± 4.1 16.8 ± 1.5 31.4 ± 2.2 1.49 ± 0.4 0.57 ± 0.04 MPLP 901 (#6) 111.76 9.6 ± 0.8 11.5 ± 0.9 10.6 ± 1.3 26.8 ± 2.0 1.21 ± 0.13 0.92 ± 0.13
MPLP 962 (#11) 111.76 5.4 ± 0.27. 7.3 ± 0.3 5.1 ± 0.4 3.6 ± 0.4 1.34 ± 0.08 0.70 ± 0.06 MPLP 963 (#13) 114.3 14.6 ± 0.4 21.1 ± 0.5 9.9 ± 0.4 22.9 ± 0.6 1.44 ± 0.05 0.47 ± 0.02 MPLP 964 (#14) 127 5.7 ± 0.4 8.8 ± 0.4 7.2 ± 0.4 6.6 ± 0.4 1.55 ± 0.12 0.82 ± 0.05 MPLP 965 (#15) 127 13.0 ± 0.4 15.3 ± 0.4 11.2 ± 0.6 24.8 ± 1.0 1.18 ± 0.05 0.73 ± 0.04 MPLP 966 (#7) 152.4 10.3 ±0.4 11.9 ± 0.4 10.7 ± 0.7 25.7 ± 1.1 1.16 ± 0.06 0.90 ± 0.07 MPLP 968 (#8) 160.02 6.6 ± 0.3 7.5 ± 0.3 7.6 ± 0.6 12.9 ± 0.7 1.14 ± 0.06 1.01 ± 0.09
MPLP 969 (#12) 165.1 2.5 ± 0.2 3.5 ± 0.2 6.0 ± 0.4 4.3 ± 0.3 1.40 ± 0.12 1.72 ± 0.15 MPLP 970 (#10) 172.72 2.9 ± 0.2 3.0 ± 0.2 4.1 ± 0.3 2.9 ± 0.2 1.03 ± 0.09 1.36 ± 0.13 MPLP 971 (#9) 177.8 4.9 ± 0.4 5.9 ± 0.5 3.8 ± 0.3 2.5 ± 0.2 1.22 ± 0.14 0.64 ± 0.07
MPLP 971 (#17) 177.8 2.6 ± 0.6 1.0 ± 0.6 4.1 ± 0.6 6.9 ± 0.7 0.4 ± 0.2 4.0 ± 2.0 MPLP 972 (#17a) 177.8 10.0 ± 0.4 10.9 ± 0.4 10.7 ± 0.6 22.3 ± 0.8 1.09 ±0.05 0.98 ± 0.07 MPLP 974 (#16) 12.2 ±1.8 13.0 ± 1.7 8.5 ± 1.0 15.1 ± 1.4 1.07 ± 0.21 0.65 ± 0.11
Table 7.3.3. Specific activities (Bq kg-1) and activity ratios for I cm increments across a section from 101.6 cm depth in Parsata Trench 1.
Sample Depth (cm)
238U 234U 230Th 232Th 234U/238U 230Th/234U
MPLP 900 (1) 101.6 14.3 ± 0.6 17.7 ± 0.6 11.5 ± 1.0 20.9 ± 1.4 1.24 ± 0.06 0.65 ± 0.06 MPLP 900 (2) 101.6 14.0 ± 0.5 17.0 ± 0.5 12.2 ± 0.4 32.1 ± 0.7 1.21 ± 0.05 0.70 ± 0.03 MPLP 900 (3) 101.6 14.5 ± 0.4 18.6 ± 0.5 10.6 ± 1.3 30.9 ± 2.2 1.28 ± 0.05 0.57 ± 0.07 MPLP 900 (4) 101.6 15.1 ± 0.4 18.6 ± 0.5 12.7 ± 0.4 31.3 ± 0.7 1.23 ± 0.04 0.68 ± 0.03 MPLP 900 (5) 101.6 15.3 ± 0.6 19.2 ± 0.7 12.8 ± 0.5 32.2 ± 0.8 1.25 ± 0.06 0.67 ± 0.03
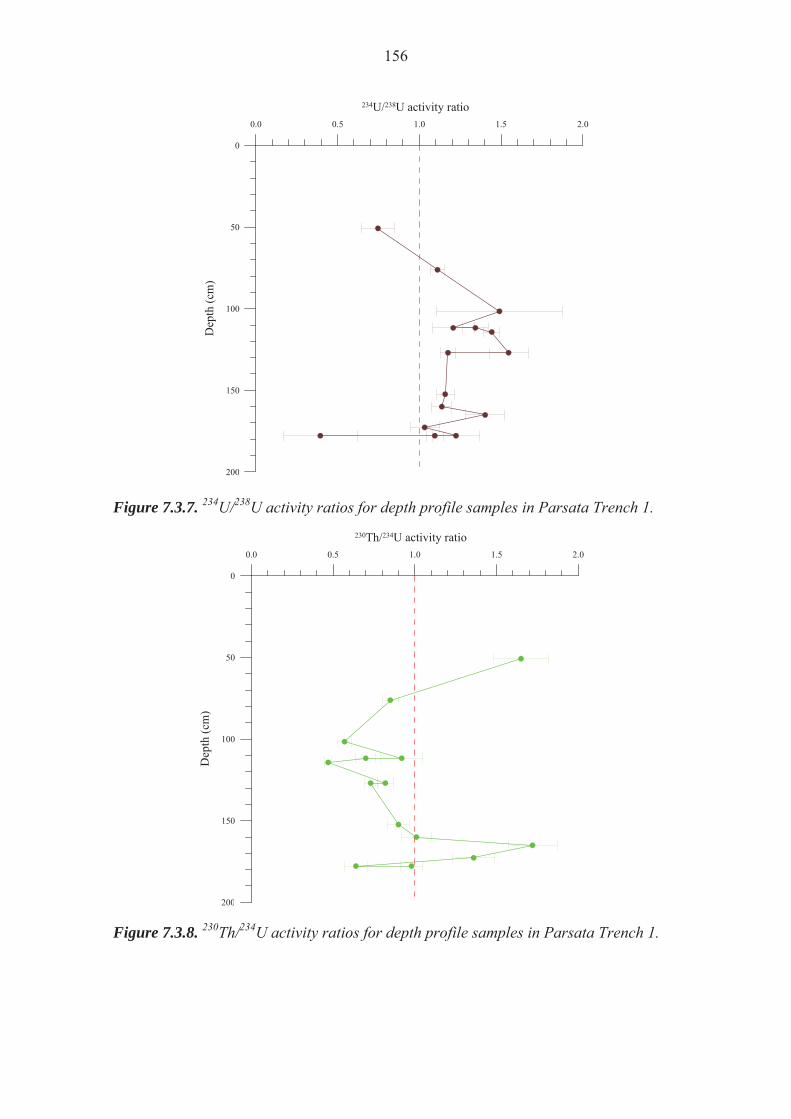
156
0.0 0.5 1.0 1.5 2.0
234U/238U activity ratio
200
150
100
50
0
Dep
th (c
m)
0.0 0.5 1.0 1.5 2.0
230Th/234U activity ratio
200
150
100
50
0
Dep
th (c
m)
Figure 7.3.7. 234U/238U activity ratios for depth profile samples in Parsata Trench 1. Figure 7.3.8. 230Th/234U activity ratios for depth profile samples in Parsata Trench 1.

157
0 5 10 15 20 25
238U (Bq kg-1)
200
150
100
50
0
Dep
th (c
m)
Figure 7.3.9. 238U specific activities for depth profile samples in Parsata Trench 1. The composite 238U-234U-230Th data set is summarised in Figure 7.3.8 as a plot of 234U/238U activity ratio against 230Th/238U activity ratio. Sample 897, from 50.8 cm depth, plots in a “complex process” position suggesting that this location has been subject to varying conditions of uranium deposition and removal. Sample 899, the black clay with the highest 238U specific activity, and sample 971,.the green brown stained zone in the pillow lava at 177.8 cm, both plot within error of the boundary between the upper complex process sector and positions indicating long term (105 a timescale) uranium deposition. Sample 964, a green material from the top of the pillow lava, plots in a position indicative of long term (105 a timescale) uranium deposition. The pillow lava sample at 172.7 cm depth (sample 970) lies within error of equilibrium, indicating that the sample has been affected by negligible uranium loss or deposition. All of the other samples plot in positions consistent with recent uranium deposition from groundwater with 234U/238U activity ratio greater than unity. Analysis of contiguous ~ 1 cm subsamples of a rock section from 101.6 cm (Figure 7.3.11) revealed relatively constant 238U specific activities ranging from 14.0 to 15.3 Bq kg-1 (Table 7.3.2). All of the 234U/238U activity ratios for these samples were greater than unity and all of the 230Th/234U activity ratios were less than unity suggesting uranium deposition throughout the section. Consistent with this, in the plot of 234U/238U activity ratio against 230Th/238U activity ratio, all of the samples plot in positions consistent with recent deposition of uranium from groundwater with 234U/238U greater than unity.
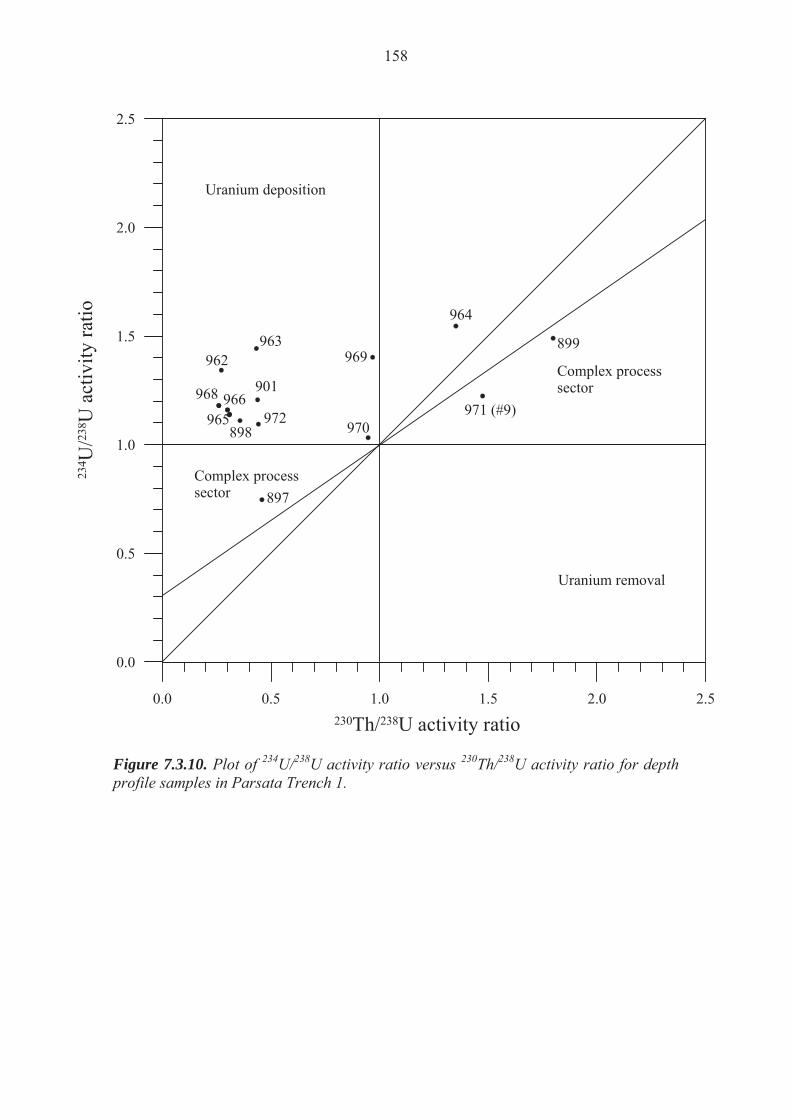
158
0.0 0.5 1.0 1.5 2.0 2.5230Th/238U activity ratio
0.0
0.5
1.0
1.5
2.0
2.5
234 U
/238 U
act
ivity
ratio
Uranium deposition
Uranium removal
897
898
899
901
962963
964
965966968
970971 (#9)972
969Complex processsector
Complex processsector
Figure 7.3.10. Plot of 234U/238U activity ratio versus 230Th/238U activity ratio for depth profile samples in Parsata Trench 1.
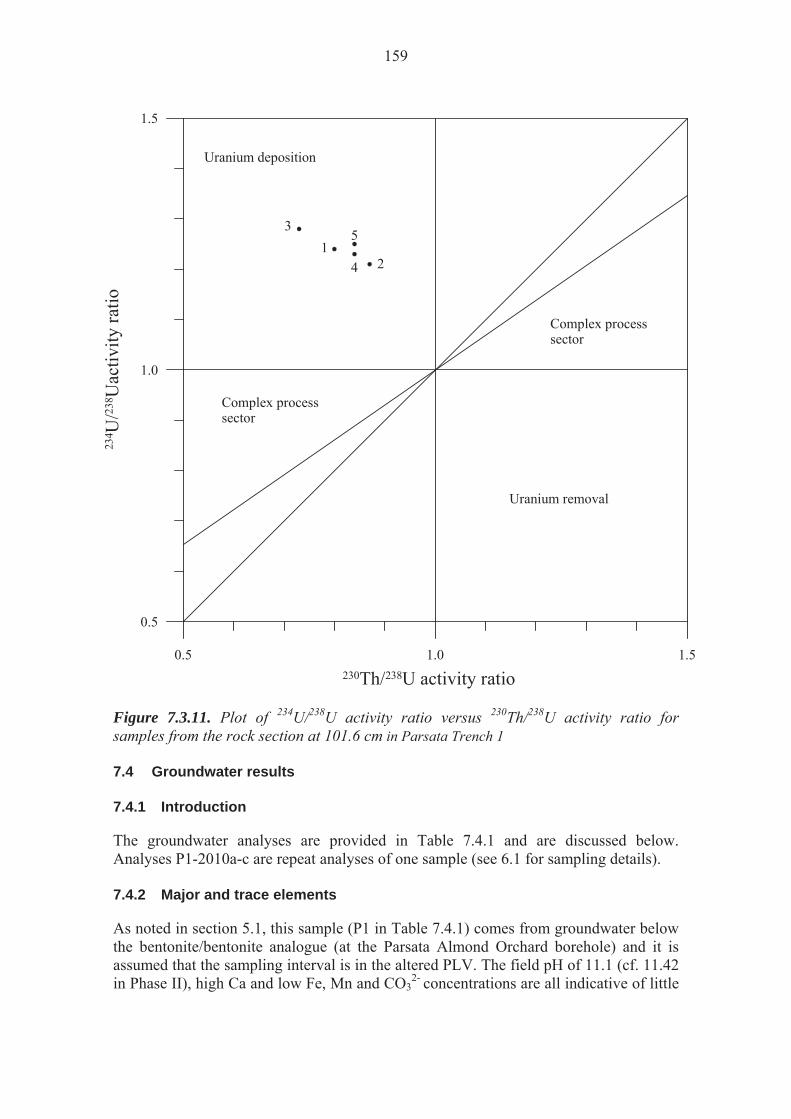
159
0.5 1.0 1.5230Th/238U activity ratio
0.5
1.0
1.523
4 U/23
8 Uac
tivity
ratio
12
3
4
5
Uranium deposition
Uranium removal
Complex processsector
Complex processsector
Figure 7.3.11. Plot of 234U/238U activity ratio versus 230Th/238U activity ratio for samples from the rock section at 101.6 cm in Parsata Trench 1 7.4 Groundwater results 7.4.1 Introduction
The groundwater analyses are provided in Table 7.4.1 and are discussed below. Analyses P1-2010a-c are repeat analyses of one sample (see 6.1 for sampling details). 7.4.2 Major and trace elements
As noted in section 5.1, this sample (P1 in Table 7.4.1) comes from groundwater below the bentonite/bentonite analogue (at the Parsata Almond Orchard borehole) and it is assumed that the sampling interval is in the altered PLV. The field pH of 11.1 (cf. 11.42 in Phase II), high Ca and low Fe, Mn and CO3
2- concentrations are all indicative of little

160
or no reaction with the atmosphere. Considering the less than perfect sampling conditions for the 2010 sample, there few significant differences between both P1 samples (other than the lower CO3
2- in 2010, but this may simply reflect degassing during transport and storage). Although ophiolite groundwater chemistry does vary significantly from one ophiolite to another (cf. examples in I.Barnes and J.R.O’Neill, 1969; Alexander et al. 2008b), both P1 samples stand out significantly from all the other Cyprus samples in Table 7.4.1 and in Neal and Shand (2002) in having very low K amd Mg concentrations. The Cl concentration is also low (80.9 mgL-1) compared with the other alkaline groundwaters in Cyprus, but the Br/Cl ratio is that of seawater (whereas the others are generally lower). In addition, the Si, F and Sr concentrations are all one to two orders of magnitude higher in sample P1 than the other samples in Table 7.4.1. The trace element concentrations are almost uniformly below detection for all samples. Only in the case of Li and B are there significant deviations above background. Davis and Elderfield (2004) note that Li is preferentially leached during early stages of high temperature serpentinisation of ocean crust and that the Li/Cl and B/Cl ratios provide a useful guide to the fluid/rock mass ratios (when the ophiolite Li and B concentrations are known). At Allas Springs, most samples have a B/Cl ratio of between and 4.2 - 4.4x10⁻³, somewhat greater than that of seawater (3.3x10⁻³; Kreitler and Bledsoe 1993). P1, in comparison, has a B/Cl ratio of 9.7 x10⁻³, indicating B enrichment. Interestingly, the Li/Cl ratios of these same samples all lie very close to 3x10⁻³ (cf. seawater with ~8.4x10⁻⁶; Presley et al. 1973), suggesting B enrichment in the Parsata groundwaters from a different source than the ophiolite. 7.4.3 Stable isotopes and tritium
The groundwater stable isotope and tritium data are presented in Table 7.4.2 and the D vs. 18O plot is shown in Figure 7.4.1. It can be clearly seen that the samples plot between the Mediterranean Meteoric Water Line (MMWL; from IAEA 2005) and the Global Meteoric Water Line (GMWL; from Craig and Gordon 1965). The all-sample regression line is D = 5.92* 18O + 4.99 (R2 = 0.84), whereas removing sediment-hosted samples (such as P1 and D23) produces a regression line of D = 1.93* 18O – 23.55 (R2 = 0.32).
3 D2 is a site in the Kouris Valley, on the west side of the road from Ayos Mamas to Limassol (full details in Alexander and Milodowski, 2011). It is not relevant to the current discussion.
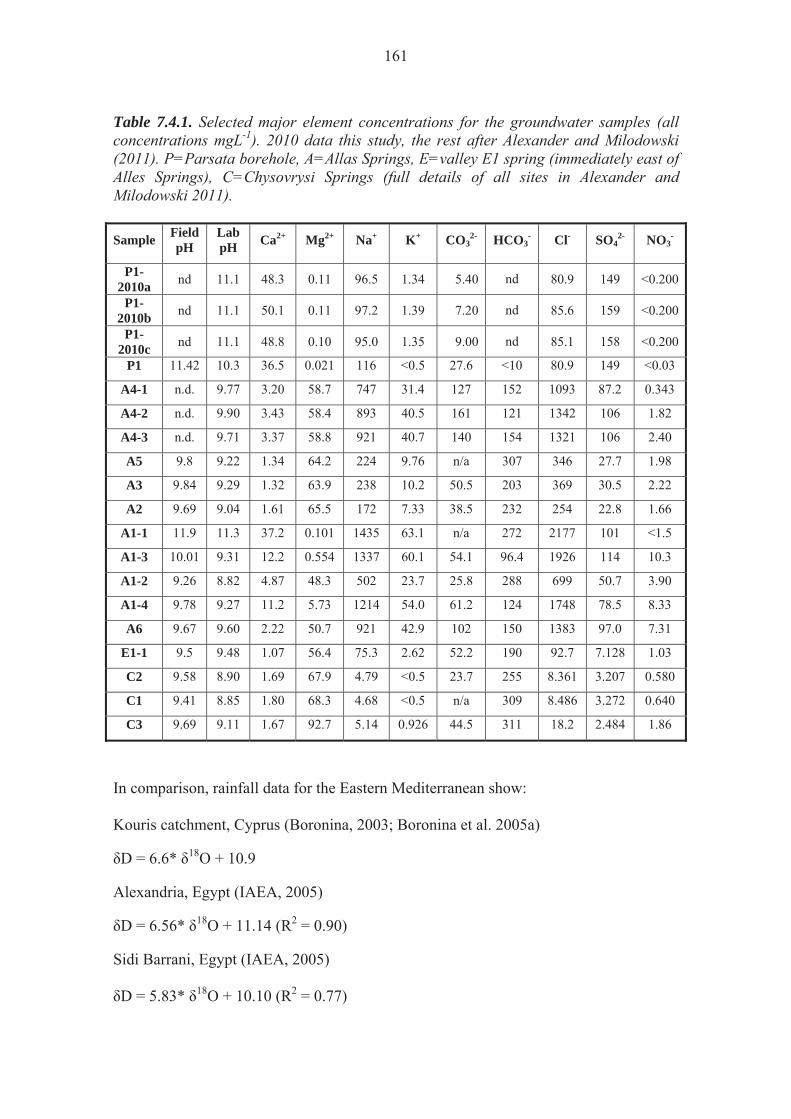
161
Table 7.4.1. Selected major element concentrations for the groundwater samples (all concentrations mgL-1). 2010 data this study, the rest after Alexander and Milodowski (2011). P=Parsata borehole, A=Allas Springs, E=valley E1 spring (immediately east of Alles Springs), C=Chysovrysi Springs (full details of all sites in Alexander and Milodowski 2011). Sample Field
pH Lab pH Ca2+ Mg2+ Na+ K+ CO3
2- HCO3- Cl- SO4
2- NO3-
P1-2010a nd 11.1 48.3 0.11 96.5 1.34 5.40 nd 80.9 149 <0.200
P1-2010b nd 11.1 50.1 0.11 97.2 1.39 7.20 nd 85.6 159 <0.200
P1-2010c nd 11.1 48.8 0.10 95.0 1.35 9.00 nd 85.1 158 <0.200
P1 11.42 10.3 36.5 0.021 116 <0.5 27.6 <10 80.9 149 <0.03
A4-1 n.d. 9.77 3.20 58.7 747 31.4 127 152 1093 87.2 0.343
A4-2 n.d. 9.90 3.43 58.4 893 40.5 161 121 1342 106 1.82
A4-3 n.d. 9.71 3.37 58.8 921 40.7 140 154 1321 106 2.40
A5 9.8 9.22 1.34 64.2 224 9.76 n/a 307 346 27.7 1.98
A3 9.84 9.29 1.32 63.9 238 10.2 50.5 203 369 30.5 2.22
A2 9.69 9.04 1.61 65.5 172 7.33 38.5 232 254 22.8 1.66
A1-1 11.9 11.3 37.2 0.101 1435 63.1 n/a 272 2177 101 <1.5
A1-3 10.01 9.31 12.2 0.554 1337 60.1 54.1 96.4 1926 114 10.3
A1-2 9.26 8.82 4.87 48.3 502 23.7 25.8 288 699 50.7 3.90
A1-4 9.78 9.27 11.2 5.73 1214 54.0 61.2 124 1748 78.5 8.33
A6 9.67 9.60 2.22 50.7 921 42.9 102 150 1383 97.0 7.31
E1-1 9.5 9.48 1.07 56.4 75.3 2.62 52.2 190 92.7 7.128 1.03
C2 9.58 8.90 1.69 67.9 4.79 <0.5 23.7 255 8.361 3.207 0.580
C1 9.41 8.85 1.80 68.3 4.68 <0.5 n/a 309 8.486 3.272 0.640
C3 9.69 9.11 1.67 92.7 5.14 0.926 44.5 311 18.2 2.484 1.86
In comparison, rainfall data for the Eastern Mediterranean show: Kouris catchment, Cyprus (Boronina, 2003; Boronina et al. 2005a) D = 6.6* 18O + 10.9
Alexandria, Egypt (IAEA, 2005) D = 6.56* 18O + 11.14 (R2 = 0.90)
Sidi Barrani, Egypt (IAEA, 2005) D = 5.83* 18O + 10.10 (R2 = 0.77)
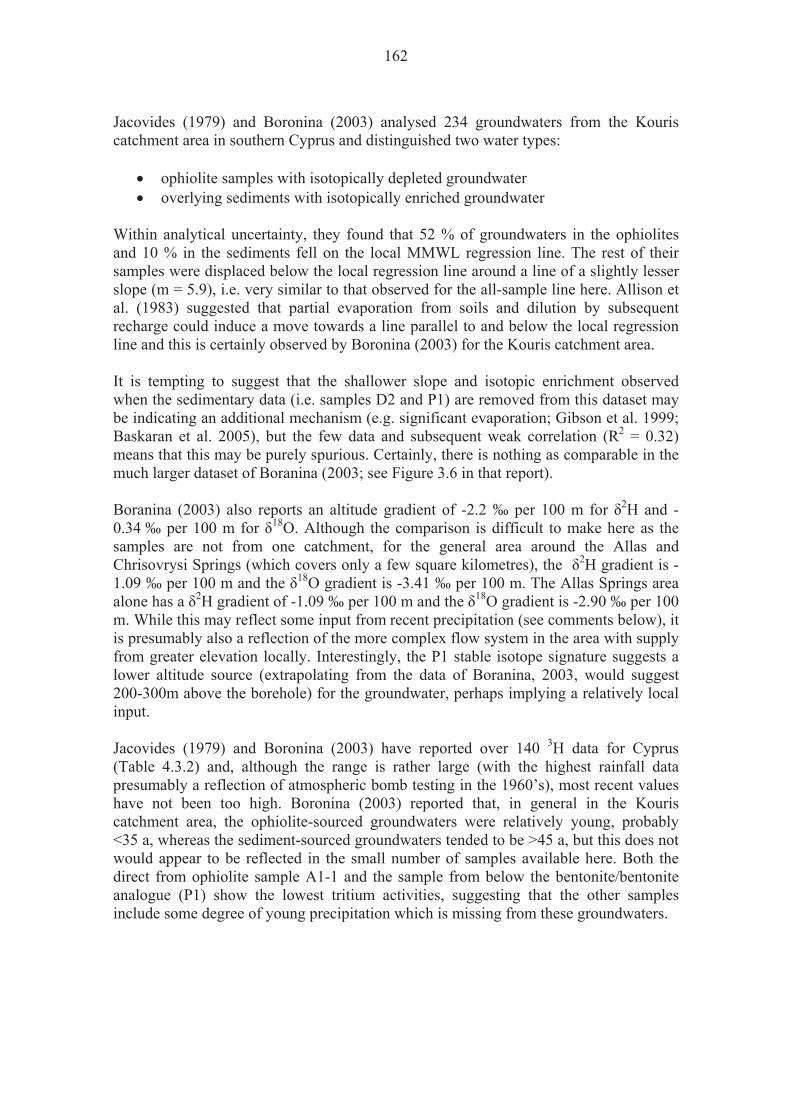
162
Jacovides (1979) and Boronina (2003) analysed 234 groundwaters from the Kouris catchment area in southern Cyprus and distinguished two water types:
ophiolite samples with isotopically depleted groundwater overlying sediments with isotopically enriched groundwater
Within analytical uncertainty, they found that 52 % of groundwaters in the ophiolites and 10 % in the sediments fell on the local MMWL regression line. The rest of their samples were displaced below the local regression line around a line of a slightly lesser slope (m = 5.9), i.e. very similar to that observed for the all-sample line here. Allison et al. (1983) suggested that partial evaporation from soils and dilution by subsequent recharge could induce a move towards a line parallel to and below the local regression line and this is certainly observed by Boronina (2003) for the Kouris catchment area. It is tempting to suggest that the shallower slope and isotopic enrichment observed when the sedimentary data (i.e. samples D2 and P1) are removed from this dataset may be indicating an additional mechanism (e.g. significant evaporation; Gibson et al. 1999; Baskaran et al. 2005), but the few data and subsequent weak correlation (R2 = 0.32) means that this may be purely spurious. Certainly, there is nothing as comparable in the much larger dataset of Boranina (2003; see Figure 3.6 in that report). Boranina (2003) also reports an altitude gradient of -2.2 ‰ per 100 m for 2H and -0.34 ‰ per 100 m for 18O. Although the comparison is difficult to make here as the samples are not from one catchment, for the general area around the Allas and Chrisovrysi Springs (which covers only a few square kilometres), the 2H gradient is -1.09 ‰ per 100 m and the 18O gradient is -3.41 ‰ per 100 m. The Allas Springs area alone has a 2H gradient of -1.09 ‰ per 100 m and the 18O gradient is -2.90 ‰ per 100 m. While this may reflect some input from recent precipitation (see comments below), it is presumably also a reflection of the more complex flow system in the area with supply from greater elevation locally. Interestingly, the P1 stable isotope signature suggests a lower altitude source (extrapolating from the data of Boranina, 2003, would suggest 200-300m above the borehole) for the groundwater, perhaps implying a relatively local input. Jacovides (1979) and Boronina (2003) have reported over 140 3H data for Cyprus (Table 4.3.2) and, although the range is rather large (with the highest rainfall data presumably a reflection of atmospheric bomb testing in the 1960’s), most recent values have not been too high. Boronina (2003) reported that, in general in the Kouris catchment area, the ophiolite-sourced groundwaters were relatively young, probably <35 a, whereas the sediment-sourced groundwaters tended to be >45 a, but this does not would appear to be reflected in the small number of samples available here. Both the direct from ophiolite sample A1-1 and the sample from below the bentonite/bentonite analogue (P1) show the lowest tritium activities, suggesting that the other samples include some degree of young precipitation which is missing from these groundwaters.
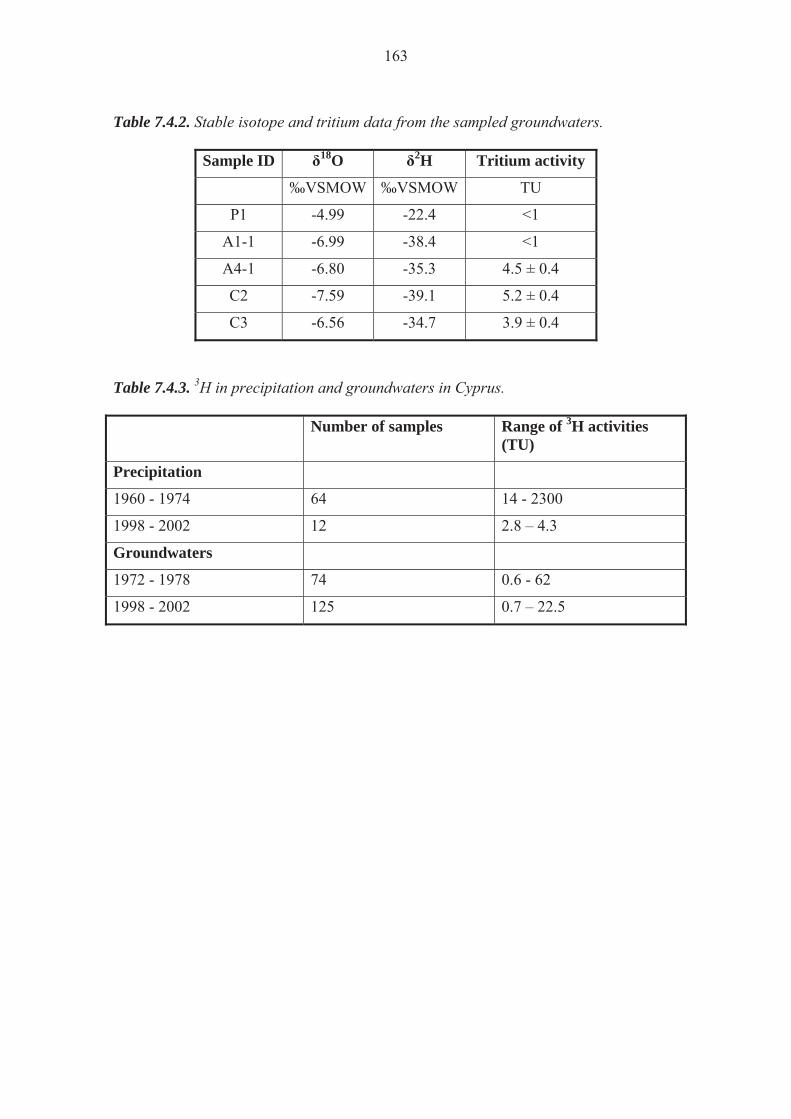
163
Table 7.4.2. Stable isotope and tritium data from the sampled groundwaters.
Sample ID 18O 2H Tritium activity
‰VSMOW ‰VSMOW TU
P1 -4.99 -22.4 <1
A1-1 -6.99 -38.4 <1
A4-1 -6.80 -35.3 4.5 ± 0.4
C2 -7.59 -39.1 5.2 ± 0.4
C3 -6.56 -34.7 3.9 ± 0.4
Table 7.4.3. 3H in precipitation and groundwaters in Cyprus. Number of samples Range of 3H activities
(TU)
Precipitation
1960 - 1974 64 14 - 2300
1998 - 2002 12 2.8 – 4.3
Groundwaters
1972 - 1978 74 0.6 - 62
1998 - 2002 125 0.7 – 22.5

164
However, as Boronina (2003) did not discuss the groundwater chemistry in anything but a superficial manner, it is difficult to judge the meaning of this apparent age difference. In the context of the samples reported here, it could be taken to show that the sub-bentonite alkaline groundwaters (such as sampled at Parsata) are indeed older and representative of a deeper groundwater flow system trapped under the bentonite/bentonite analogue. Examination of the groundwater chemistry of the Allas Springs samples from site A4 shows that the pH increases and the Cl concentration drops with distance away from the spring (Table 7.4.1) and this suggests that there is probably some dilution from low chlorinity snow meltwater4 along the course of the stream. This would probably be enough to provide the observed 3H signal in the spring samples.
Figure 7.4.1. D vs 18O in the sampled groundwaters (GMWL from Craig and Gordon 1965, MMWL from Gat, 1971) 7.4.4 Natural decay series
As shown in Table 7.4.4, analysis of the groundwater sample revealed that uranium and thorium nuclides were below the limit of detection in the groundwater.
4 The Troodos area received its first significant snowfall in a decade in the winter of 2008-2009 and the snowline was just above the springline during the sampling period.

165
Table 7.4.4. Natural decay seriesin groundwater from the Almond Orchard borehole at Parsata.
Nuclide Specific Activity (Bq L-1) 238U < 1 235U < 1 234U < 1 230Th < 1 232Th < 1
As the solid phase data (section 7.3.7) show clear evidence of interaction with mobile uranium, it is assumed that this reflects a sampling and storage problem, rather than the presence of groundwaters almost free of uranium and thorium.

166
167
8 DISCUSSION
8.1 Why Parsata? Why choose to sample at Parsata and not elsewhere in Cyprus? Three main reasons:
The Phase II analytical results indicated that the seemingly most promising sites of presently-active alkaline groundwater flow, such as Allas Springs or the Chrysovrysi Spring (see Alexander and Milodowski 2011 for details) had very little relevant clays (smectites) present and, indeed, showed thorough serpentinisation on a scale previously unsuspected in Cyprus.
The areas of extensive bentonite coverage such as in the neighbourhood of Sarama or Monagroulli (see Alexander and Milodowski 2011 for details) had little or no readily-accessible or active alkaline groundwater present. This is due to the long-term drought in Cyprus coupled with the massive increase in groundwater extraction for agriculture, industry and tourism. This was brought home to the authors when they tried to examine the water sources sampled in the late 1970s in the Neal and Shand (2002) paper ”Spring and surface water quality of the Cyprus ophiolites”. In the 25 years since the springs were sampled by Neal and Shand, they can no longer be described as either ’springs’ nor ’surface water’, all had to be accessed by locked/sealed boreholes – and the spring in the valley bottom at Parsata (”spring in pillow lavas”) was now ephemeral and flowed only periodically, probably due to local abstraction for irrigation (the abstraction boreholes was sampled previously by Alexander and Milodowski, 2011).
Further, when additional promising ’fossil’ sites (i.e. where no groundwater is currently flowing, but there were indications of previous reaction with alkaline groundwaters) such as at Trimiklini or just outside Kalavasos or Pambajera Hill (see Alexander and Milodowski 2011 for details), were re-examined, much of the material was found to be allochthonous (i.e. it had been transported into the area from elsewhere, probably by landslips). As discussed in chapter 3, this is especially common in the bentonite areas and so it proved to be very difficult to find a site where any reaction in the bentonite/analogue bentonite could be directly traced to an underlying source in the Pillow Lavas with any certainty. This even proved problematic in Parsata as the initial drilling sites were intended to be 1: about 50 m NW and 2: 100 m SE from the existing Almond Orchard borehole (see section 5.1 for details). Unfortunately, further detailed examination indicted that both areas were almost certainly bentonite debris flows, as was much of the valley bottom. As a such, the bentonite was considered unlikely to be in-situ. However, there may still be future potential to look at alkaline groundwater interaction even within these translocated bentonite deposits, but the timescale of interaction would probably not be as long as that for in-situ bentonite.

168
When viewed in this light, the actual site drilled was an excellent compromise: although it was not possible to find a site closer to a known active alkaline groundwater source5, the area drilled is certainly within an area of active, low temperature serpentinisation. Additionally, the drill site, whilst possibly undergoing general gavitational tectonics (section 5.2), had no obvious major flow of hillslip deposits around the drill and trench sites. Finally, logistically, it was also an appropriate site with relatively good access (good enough to get a low-loader along the dirt track to the village with a bulldozer and mechanical digger), no excessive access restrictions and within a short drive of several villages for supplies. 8.2 Rock and bentonite/bentonite analogue 8.2.1 The Parsata bentonite analogue and rock-water interaction
General mineralogical characteristics and similarities to bentonite buffer material Bentonite is a generic term applied to a class of silicate-mudstones that comprise predominantly clay particle size material composed of largely of smectite that is clearly derived from the alteration of volcanic ash material. Bentonite sensu stricto is defined (Hallsworth and Knox 1999) as “a soft, plastic, porous, light-coloured rock composed essentially of clay minerals from the smectite group plus colloidal silica, and produced by chemical alteration of volcanic ash.” However, the use of genetic terms such as “bentonite” is discouraged in modern geological rock classification terminology because of its stratigraphical and industrial implications (Hallsworth and Knox 1999). The generic terms smectite-mudstone (more general name, where the proportion of clay size fraction is undefined) or smectite-claystone (>50 % clay) are now recommended (based on the criteria for classifying lithified silicate mudstones after Twenhofel 1937 and Tucker 1991). The equivalent terms for unlithified silicate mud sediments are smectite-mud (clay content undefined) and smectite-clay (>50 % clay). These terms are preferred, particularly for field descriptions, because they do not imply any generic process for the origin of the rock (or sediment). Nevertheless, this report has followed the definition outlined in section 2.2.2 and will continue to do so here. With regard to the Parsata site, the bentonite/analogue bentonite sequence encountered in the trench and boreholes is certainly highly smectitic. XRD analyses (Section 7.1) show that these rocks contain between 17-40 % crystalline montmorillonite with a further 18-53 % of amorphous material, which has extremely high surface area (398-682 m2g-1 determined by 2-ethoxyethanol monolayer adsorption) that suggests it is probably also largely a poorly crystalline smectite phase. Petrographic observations (Section 7.2) show that the material is dominantly of clay particle size (>50 % clay). Therefore, on the basis of their mineralogical and textural characteristics, the Parsata bentonites/analogue bentonites can be classified as smectite-mudstones, or more specifically as smectite claystones. As such, they are definitely a good analogue for both
5 Note that an additional (unregistered) borehole was found ca. 150 m SE of the drilling site in May, 2011 and the line of sealed boreholes running across the valley (see Figure 5.1.2) were noted to contain flowing groundwater at that time.

169
the MX-80 (e.g. Pusch 1998) and Kunigel VI (e.g. Idemitsu et al. 1998) bentonites that are planned to be used in several radioactive waste repositories (see Table 8.2.1). The chemical composition of the montmorillonite in the Parsata bentonite/analogue bentonite is slightly different to that in both bentonite commercial products. XRD analyses (Section 7.1) and electron probe microanalyses (Section 7.2) show that the Parsata montmorillonite is Fe-rich (generally between 0.5 to 1.2 Fe3+ per O20(OH)4 structural unit, with higher Fe contents of between 1.2 to 3.0 Fe3+ per O20(OH)4 structural unit in some cases) and that the iron-smectite notronite may also be present in some samples. Weathering and low-temperature hydrothermal alteration of basic rocks typically produces dioactahedral Fe-rich smectites (Brigatti 1983; Cicel et al. 1992; Decarreau et al. 1987) or the Mg-rich trioctahedral smectite mineral, saponite (Alt and Honnorez 1984; Grillis and Robinson 1990). Fe-rich montmorillonite is characteristic of the Cyprus bentonite deposits (Christidis 2006), which have formed from the hydrothermal alteration of basaltic volcanic material overlying the basaltic Upper Pillow Lavas of the Troodos ophiolite complex. In contrast, MX-80 bentonite is composed of low-Fe montmorillonite sensu stricto (<0.5 Fe3+ per O20(OH)4 structural unit). However, XRD data suggests that the montmorillonite in samples from the base of the Parsata trench is of the low-Fe montmorillonite variety. Table 8.2.1. Mineralogy of representative MX-80 and Kunigel VI bentonites.
Mineral phase MX-80 % Kunigel VI %
montmorillonite 65-75 46-49
Quartz 10-14 0.5-0.7
Chalcedony - 37-38
Feldspar 5-9 2.7-5.5
Mica and chlorite 2-4 -
Carbonate 3-5 4.1-5.4
Analcime - 3.0-3.5
Heavy minerals 1-3 0.5-0.7
8.2.2 Relationship of the Parsata bentonite/analogue bentonite sequence to the bentonitic clays of Cyprus
As noted in chapter 2, the bentonite deposits of the Troodos area are located at the contact between the Upper Pillow Lavas and the overlying carbonate sedimentary rocks, around the margins of the Troodos ophiolite complex, particularly within the Campanian-age (Upper Cretaceous) Kannaviou and Moni Formations, in the southern and southwestern Cyprus (Gass et al. 1994; Christidis 2006). However, Christidis
170
(2006) also describes bentonites occurring within the older (Turonian) Perapedhi Formation that forms scattered outcrops, only a few metres thick (but locally may reach 35 m), filling hollows in the highly irregular topographic surface of the Pillow Lavas (Gass et al. 1994). The precise age of the Perapedhi Formation is controversial, and some studies consider it as Jurassic (see discussion in Gass et al. 1994). The bentonite/analogue bentonite sequence encountered in the CNAP trench and boreholes at Parsata appear to correlate most closely with the sedimentary strata of the Perapedhi Formation, rather than the bentonite deposits of the younger Kannaviou and Moni Formation. The geological map of the Parsata study area (Gass et al. 1994) shows that the boreholes and trench sites lie on, or close to, a thin selvedge of the Perapedhi Formation, resting on the Upper Pillow Lavas, and are overlain to the east and north by flaggy chalks of the Upper Cretaceous to Lower Miocene Lefkara Formation (clasts of which were abundant on the soil surface around the area, see section 4.7). The Perapedhi Formation comprises ophiolitic sediments consisting predominantly of fine-grained, finely-bedded mudstones, radiolarian-rich shales and finely-bedded radiolarian-rich silicified bands (chert), and manganese- and iron-rich shales (umbers and umberiferous shales) with thin tuff bands (Gass et al. 1994). The very finely-laminated bedding fabric, and the manganese- and iron-rich mineralised character of the “iron-oxide-impregnated bentonite” and “manganese oxide-impregnated bentonite” encountered in the lower half of the bentonite/analogue bentonite sequence in the Parsata trench, below 0.82 m and resting on the Upper Pillow Lava (Section 6.1.3 and Figure 6.1.5), are more consistent with manganoan and ferroan sediments of the Perapedhi Formation rather than the bentonites of the Kannaviou and Moni Formations. The Kannaviou and Moni bentonites have much lower Fe and Mn contents (Cristidis, 2006), and are shown on the 1:25,000 geological map (Gass et al. 1994) only to crop out in the area around Moni and Monagroulli, which is some 8 km further south. Furthermore, the Parsata rocks display elevated concentrations of Cr, V, C, Co, Ni, Cu, Zn and Pb (appendix 4) that are also consistent with the sea-floor exhalative “black-smoker” mineralisation closely associated with metal enrichment in the Perapedhi Formation (Gass et al. 1994). The upper part of the bentonite/analogue bentonite sequence exposed in the Parsata trench has a disturbed, fragmented or disrupted fabric (Section 6.1.3). There is no evidence of the finely laminated mudstone or shale fabric seen in the deeper mudstones. The original finely-bedded sedimentary fabric may have been lost through weathering, in which case the upper part of the sequence might simply represent the residual weathered mudrock regolith. However, the fragmented fabric suggests that the upper part of the bentonite/analogue bentonite sequence represents reworked bentonite or mudstone that is not in-situ, and may be a debris-flow deposit. As discussed in section 3.3.1, bentonite debris flows are particularly common in southern Cyprus, where easily hydrated bentonite-rich sediments have been exposed to rainfall and surface water. Such areas include the higher reaches of headwater gullies and valleys in the Vasilikos catchment in the vicinity of Parsata. This latter explanation is considered to be most probable. The upper part of the bentonite/analogue bentonite sequence exposed in the trench has relatively high Mn, Cu, Zn and Ni concentrations, which would seem to suggest that has been derived by local erosion and redeposition of bentonite from the
171
Perapedhi Formation strata higher up-slope (cf. Figures 5.3.2 – 5.3.4). Gass et al. (1994) consider the succession of managoan- and radiolarian-rich strata at Parsata to be overlain by a 10 m thick layer of grey bentonitic clay that separates the sequence from the overlying Lefkara Formation. This grey bentonitic clay was not encountered in the boreholes nor in the trench. However, grey bentonite or smectitic-claystone was exposed in trial quarry workings about 1 km southeast of the study site. 8.2.3 Water-rock interaction and alteration of the bentonitic strata
On the basis of petrographical observations a paragenetic sequence of mineralisation and mineralogical alteration has been presented in section 7.2 and illustrated in Figure 7.2.41, above. However, this is speculative because it is difficult to evaluate the temporal-fabric relationships between all of the secondary minerals in these very fine grained rocks, and many of the mineral relationships have ambiguous interpretations. Nevertheless, several types and stages of alteration can be defined. Early hydrothermal alteration Based on the petrographical relationships, an early stage of high-temperature hydrothermal alteration and mineralisation can be recognised. This is associated with the zeolitic and chloritic alteration of the Upper Pillow Lavas and interstitial sediments. The alteration is probably related to the hydrothermal circulation of seawater accompanying the basaltic volcanic activity on the sea floor. This is consistent with both the stable isotope (section 7.3.6) and natural decay series (section 7.3.7) data which indicate young and ongoing reaction in the rock column. Hydrothermal alteration associated with manganese and iron oxide mineralisation. Manganese and iron oxide mineralisation affects the Upper Pillow Lavas and appears to impregnate the overlying bentonitic strata at Parsata. There is a major time gap between this mineralisation event and the early hydrothermal alteration because the top of the Pillow Lava Sequence was eroded before deposition of the overlying finely laminated bentonite/analogue bentonite sequence. Manganese and iron oxides fill fractures that cross-cut the earlier zeolitic hydrothermal alteration in basalt pillow lavas and manganese and iron oxides penetrate along bedding planes and locally replace laminations or be interbedded with muddy sediment in the overlying mudrocks. This mineralisation most probably corresponds to the regional manganese mineralisation associated with the ophiolite, that is related to hot metal-enriched brines (up to 350 °C) that passed through the uppermost part of the oceanic (ophilite) crust and discharging through hydrothermal vents on the deep oceanic floor during the deposition of the Perapedhi Formation. This event produced the umbers and possibly the manganese-enriched bentonitic sediments within this formation. However, as noted in section 7.3.2, it cannot be ruled out that the Mn enrichment in the bentonite was not associated with a later mobilisation due to alkaline groundwaters, as would seem to be the case in the Philippines. Zeolite and smectite alteration Zeolitic and smectitic alteration is a major feature throughout the bentonite/analogue bentonite sequence encountered in the boreholes and trench at Parsata. It is associated with the alteration of unstable glassy basaltic volcanic detritus that was a major
172
component of the rocks, evidence of which is still preserved as altered fiammé and glass shard fabrics that are replaced and pesudomorphed by smectite and zeolite. The relationships between authigenic zeolite and smectite, and some of the iron and manganese mineralisation is often unclear, and there may be several generations of zeolitic and smectitic alteration. Some of the zeolitization of the sediment predates (and is cross-cut by) fracturing. Other zeolitic alteration alteration may be associated with the hydrothermal alteration that was accompanied by manganese and iron oxide mineralisation (see above). Zeolite and smectite authigenesis probably also occurred as a result of sediment diagenesis during burial. Carbonate mineralisation Several generations of calcite mineralisation are recognised in the sequence. Early calcite mineralisation is seen to be closely associated with the manganese and iron oxide mineralisation in the Upper Pillow Lavas. There is also a very late-stage of calcite mineralisation that forms fine powdery coatings on the surfaces of late cross-cutting fractures in the Upper Pillow Lava and also coats fractures in the highly fractured laminated bentonite at the base of the overlying sediments seen in the Parsata trench. Towards the top of the sequence, fine powdery calcite occurs in irregular patches, filling very late shrinkage cracks and fissures, and as scattered “nodules” in the blocky-fractured bentonite regolith or bentonite debris-flow horizon above 0.82 m. This type of calcite was seen to be widespread in occurrence near to the surface in the soil profiles debris-flows exposed in road cuttings and ditches around the Parsarta area. This is interpreted to represent calcrete or caliche calcite formed by evaporation of capillary porewater within the soil-sediment profile under the prevailing arid climate conditions. It is a common feature of the soils in Cyprus (cf. section 4.7.2). As noted in section 7.3.6, there is also evidence that secondary carbonates in the bentonites and Upper Pillow Lavas were formed during reaction of the rock with alkaline groundwaters, but these data are too limited to assess just how widespread these reactions have been. Smectite alteration Analysis of the clay mineral fraction XRD patterns from the Parsata bentonites/ analogue bentonites revealed no evidence for the denaturing or decomposition of the montmorillonite component(s). However, detailed SEM-petrographic observations (Section 7.2) identified a secondary Mg-rich fibrous clay mineral, with a palygorskite-like (or Fe-rich palygorskite) composition to be forming from the surfaces of altering sheet-like montmorillonite particles. SEM revealed that the surface layers of montomorillonite particles were exfoliating and breaking down to form the fibrous secondary Mg-rich silicate phase. The presence of palygorskite, as a minor component throughout the bentonite/analogue bentonite sequence was confirmed by XRD analysis. The relative paragenesis of the palygorskite was difficult to determine unambiguously but it does appears to be a relatively late-stage alteration product in many samples. The presence of palygorskite in the bentonites of southern Cyprus has been mentioned previously by Gass et al. (1994). Christidis (2006) also described a late-stage partial replacement of smectite by fibrous palygorskite in these deposits. He attributed the
173
alteration to the interaction of the smectite with Si-rich porewaters produced by the dissolution of abundant siliceous radiolarian frustules, which he considered was facilitated by the high heat flow from the ocean floor and by the circulation of hydrothermal fluids (but this would presumably be a relatively early event and therefore unlikely to be associated with the late-stage palygorskite observed here). Equally, dissolution of amorphous or poorly-crystalline biogenic (radiolarian) silica could also occur by interaction with alkaline groundwater, to produce high-Si porewaters that would then led to smectite alteration. Palygorskite can also be formed by pedogenic processes, and is found as an authigenic mineral under evaporative conditions, often associated with calcrete formation, in arid environment soils and palaeosols (Singer 1991; Colson et al. 1998). It is also formed in highly saline, playa and alkaline lake sediments (Singer 1991; Botha and Hughes 1992; Colson et al. 1998; Akbulut and Kadir 2003; Chen et al. 2004), where it may also form as an alteration product of smectite. The formation of palygorskite in these environments appears to be favoured by the alkaline conditions and high concentration of Mg. The destabilisation of smectite and its breakdown to palygorskite in saline/alkaline lake environments is encouraged by increasing Mg:Ca ratios in the porewater (Botha and Hughes 1992; Chen et al. 2004). Secondary palygorskite is associated with low-temperature serpentinisation and alteration of ultrabasic rocks. It has been found as an alteration product, associated with secondary serpentine minerals, dolomite calcite and chalcedonic silica in altered ultrabasic rocks and sediments derived from these rocks in ophiolite from the United Arab Emirates (unpublished BGS data: A.Lacinska, pers comm., 2011). Authigenic palygorskite has also been described as a reaction product of the interaction of Mg-rich hydrothermal fluids on smectite in deep-sea sediment cores recovered from the Barracuda Escarpment in the western Atlantic, where it is associated with quartz, zeolites and serpentine minerals (Boatti and Joensuu 1968). These authors suggested the following reaction occurs:
montorillonite+silica+[Ca and Mg in solution] palygorskite+clinoptilolite (equation 11)
Although it was not possible to quantify the palygorskite distribution (cf. section 7.1), qualitative evaluation of the XRD diffraction intensities suggested that palygorskite forms a greater proportion of the clay assemblage in the deepest clay sampled from the Trench 1. The whole-rock geochemical profile in the Parsata trench indicates a progressive increase in Mg with depth through laminated bentonite, with a very sharp increase in both Mg and Ca concentration in the highly fractured bentonite immediately above the contact with the Upper Pillow Lava (Figure 7.2.1). This Mg enrichment would be consistent with the greater abundance of palygorskite indicated qualitatively by XRD at the base of the sequence. Whilst, this does not conclusively prove that the observed alteration of smectite to palygorskite is the result of interaction with alkaline groundwater, it would be consistent with reaction with low-temperature hydrothermal alteration by Mg-rich fluids associated with serpentinisation from the underlying Pillow Lava sequence and ophiolite assemblage. This is consistent with the natural decay series data (section 7.3.7) which indicate that there has been uptake of uranium (presumably from the groundwater) throughout the sediment column, indicating ongoing reaction for
174
the last 105 a. In particular, Trench 1 sample 964 (Table 7.3.2) from just above the Pillow Lavas shows evidence of long-term uranium deposition, indicating a zone of long-term groundwater-bentonite reaction. Unfortunately, no groundwater could be sampled from either the nearby boreholes or the trench6 to confirm the presence of alkaline groundwater. However, alkaline groundwater springs discharge through the Upper Pillow Lava in the valley bottom about 500 m to the northwest and were previously sampled during the CNAP II study from the nearby irrigation borehole in the valley bottom (Alexander and Milodowski, 2011) and these data are discussed further below. In addition, a new borehole was discovered some 150 m to the SE of Trench 1 which could be sampled in future. Recently published mineralogical studies (Moyce et al. 2011) by the BGS and University of Leeds, undertaken as part of the UK Natural Environment Research Council (NERC) "BIGRAD" Project (BIogeochemical Gradients and RADionuclide transport - www.bigradnerc.com/) have identified palygorskite-like and sepiolite-like fibrous Mg-rich silicate as alteration products in batch experiments (i.e. multiple closed container rock-water interaction experiments; cf. Bradbury et al. 1990) to examine the interaction of "young" (K, Na-rich) and "evolved" (Ca-rich) hyperalkaine cement porefluids with Borrwdale Volcanic Group (BVG) rock from the Sellafield area. The experiments were originally set up over 15 years ago in replicate suites (see Rochelle et al. 1997 for details), and reaction products were examined over the first 2 years as part of the United Kingdom Nirex Limited (Nirex) Safety Assessment Research Programme (NSARP). At the time, BGS prepared a number of additional batch experiments beyond that required for the original project and has maintained these for over 15 years. The BVG rock used in the experiments was a low-grade, regionally-metamorphosed, andesitic volcaniclastic rock containing an assemblage of mainly quartz, K-feldspar, albite, white mica (muscovite), chlorite, dolomite and calcite with minor ilmenite, anatase, magnetite and haematite. The original experimental study reported that, after 2 years, cement phases such as amorphous calcium silicate hydrate (CSH), ettringite and possibly apophyllite were produced as reaction products. Mineralogical observations after 15 years have shown that the early-formed CSH, ettringite and possible apophyllite reaction products are no longer present, dolomite has been extensively dissolved and partially-replaced by calcite and the silicate reaction products are now dominated by palygorskite-like Mg-rich silicate. The pH of the reacting fluid has now been buffered (presumably by reaction with the rock) down to <9. These observations, from these very long-term BGS batch experiments suggest that, as the alkaline fluids evolve and reduce in pH, Mg-rich silicates may be formed. These observations may also provide some indirect evidence for the palygorskite replacement of smectite observed in the bentonites from Parsata. If so, this suggests that the rock-water interaction at the site has been ongoing for decades, if not longer (in accordance with both the geomorphological and natural decay series evidence), to produce these phases which would appear to be typical of late smectite/alkaline fluid reaction products.
6 The base of the trench was damp, but no flowing water was found.

175
8.3 Groundwater evolution at the site Although much has been written on the primary, high temperature serpentinisation of the Troodos ophiolite, little information exists on the low temperature serpentinisation of interest here. Clearly, it is still ongoing, with relatively young ages reported for the Allas Springs groundwaters (see discussion in section 7.4), but to understand any potential bentonite reaction, it is also necessary to estimate when it started. As a rule, serpentinisation reactions are multi-phase (e.g. Power et al. 1997) and may stop and start depending on groundwater supply, temperature etc so this may be of little help. Here, both a geomorphological (as in section 5.6) and a radio-dating (as in section 7.3.7) approaches have be taken to gain an insight into when groundwater flow may have been initiated. The geomorphological evidence suggests for the Troodos Massif that this was some 0.8 Ma ago and was probably of a similar date for the Parsata area. This is supported by the natural decay series data which indicate ongoing groundwater-rock reaction in the Parsata area over the last 105 a. This is important as the potential (but still unproven) de-coupling of the Parsata groundwater flow from that of the Troodos flow means that Parsata should probably be viewed in isolation from the Troodos system. Clearly the deep groundwater penetration into the ophiolite has changed with the climate (and associated sea level and precipitation rates) and it seems likely then that the flow of alkaline groundwater in the area has also undergone pulses and fluctuations (as evidenced in some of the more complex uranium uptake histories noted in section 7.3.7), making any assessment of the fluxes of hyperalkaine water involved in any bentonite reaction very difficult. That the Parsata groundwater is different to the other sites sampled during the project is quite clear. What remains unclear, however, is whether this a reflection of a different source, sink or both. The Parsata groundwater is seemingly older and has a distinct chemical and stable isotope signature, but this may simply be a reflection of the isolation of the site from the Troodos source by the Arakapas Transform Fault just to the north. Certainly the stable isotope signature of the Parsata groundwater is consistent with local infiltration, probably a few hundred metres above the site. Unfortunately, a lack of stable isotope data for precipitation in the area makes this difficult to check thoroughly. It is tempting to assign the differences in the Parsata groundwaters to reaction with the bentonite, with the lower groundwater Mg concentration being related to the presence of Mg-rich palygorskite in the bentonite, especially at the base of the bentonite. However, the dataset of Neal and Shand (2002) of 21 samples collected from 21 ‘ophiolite’ sites across Cyprus in the late 1970s shows significant differences in the groundwater chemistry, but a lack of any site information other than ‘stream draining serpentinite’ or ‘spring in pillow lavas’ makes any quantitative comparison with the data in Table 7.4.1 difficult. The range of parameters measured also restricts comparison, but it should be noted that many of the groundwaters also have low Mg concentrations (0-1.2 mgL-1). Perhaps a more useful comparison is between sample P1 (along with the P1

176
samples from 2010, see section 7.4) and the Neil and Shand (2002) Parsata sample (19: “spring in pillow lavas”) in Table 8.3.1. Only those analysed parameters common to both sites are shown, but the differences between the analyses cannot be explained simply by linear evaporation or dilution (based on Cl behaving conservatively), so could it simply be a different transport pathway through the ophilite? This cannot be ruled out, but the similarity in chemistry of the Allas and Chysovrysi Springs (Table 7.4.1) which, even though they are sourced in the same host rock, are separated by several kilometres suggests that this is probably not the case. Rather, the fact that the Neal and Shand (2002) sample 19 emerges directly from the PLV whereas CNAP’s sample P1 was collected under the bentonite, indicates that reaction may be involved. It is also of note that the very small amount of water collected in the stream bed near P1 was neutral and had run off the top of the bentonite. Table 8.3.1. Comparison of two groundwater samples from Parsata (all in mgL-1).
Sample Field pH
Lab pH Ca2+ Mg2+ Na+ K+ Cl- SO4
2- Sr B Br Si
P1 11.42 10.3 36.5 0.021 116 <0.5 80.9 149 0.054 0.788 0.273 3.9 P1-
2010a nd 11.1 48.3 0.11 96.5 1.34 85.6 159 0.072 0.865 0.279 3.68
P1-2010b nd 11.1 50.1 0.11 97.2 1.39 85.1 158 0.074 0.877 0.274 3.55
P1-2010c nd 11.1 48.8 0.10 95.0 1.35 85.7 159 0.071 0.875 0.277 3.70
19 11.2 nd 93.1 0.0 163 1.23 190 207 0.110 1.450 0.720 3.4 It was hoped to gain a better insight on possible reaction by examining a suite of tracers in the rock (87/86Sr in carbonates and silicates, 13C/ 18O in carbonates, 18O in silicates, whole rock U/Th/Ra) and the associated groundwater (87/86Sr, 18O, U/Th/Ra) which would help elucidate reaction pathways and allow comparison with existing data on the ophiolite (e.g. the 87/86Sr rock data of Kawahata and Scott, 1990),. Unfortunately, no groundwater could be collected at the drill and trench sampling site and the bentonite/analogue bentonite proved to be far too fine grained to be able to separate out enough material to make meaningful analyses. 8.4 Updated conceptual model The data collected in CNAP Phase III call for a minor re-evaluation of the current conceptual model and this is shown in Figure 8.4.1. The only change is to note that the bentonite/pillow lava surface depth can vary significantly due to the presence of step faults within the pillow lavas and bentonite. This was noted during the drilling campaign in 2010 and was verified during the subsequent field work in the Parsata area. Interestingly, similar features are evident in the Bigbiga area in Luzon (Philippines) and they seriously complicate the groundwater flow interpretation there (RWMC 2011). Such features are common at current active spreading centres (e.g. Reston and Ranero 2011) and may be widespread at slow moving spreading ridges.
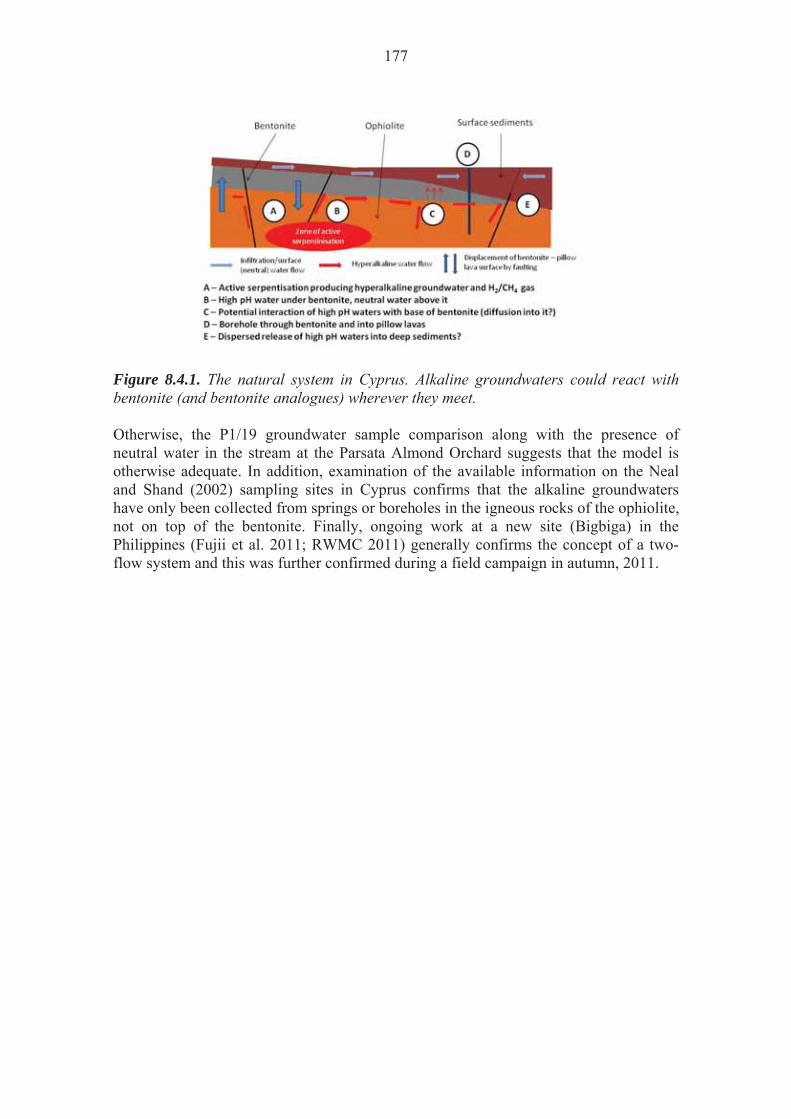
177
Figure 8.4.1. The natural system in Cyprus. Alkaline groundwaters could react with bentonite (and bentonite analogues) wherever they meet. Otherwise, the P1/19 groundwater sample comparison along with the presence of neutral water in the stream at the Parsata Almond Orchard suggests that the model is otherwise adequate. In addition, examination of the available information on the Neal and Shand (2002) sampling sites in Cyprus confirms that the alkaline groundwaters have only been collected from springs or boreholes in the igneous rocks of the ophiolite, not on top of the bentonite. Finally, ongoing work at a new site (Bigbiga) in the Philippines (Fujii et al. 2011; RWMC 2011) generally confirms the concept of a two-flow system and this was further confirmed during a field campaign in autumn, 2011.

178
179
9 CONCLUSIONS AND RECOMMENDATIONS The CNAP Phase III was carried out following identification of the requirement to support ongoing laboratory and modelling efforts on the potential reaction of the bentonite buffer with cementitious leachates in the repository EBS (NDA 2010c). Although it is known that the higher pH (12.5 to 13) leachates from OPC cement will degrade bentonite, it is unclear if this will also be the case for the lower pH (10 to 11) leachates typical of low alkali cements (Sellin et al. 2003). Ongoing laboratory (e.g. Karnland et al. 2007) and URL (e.g. NDA, 2010b) programmes which are currently investigating this face the obstacle of slow kinetics and the production of short-lived metastable phases (cf. Moyce et al. 2011), meaning obtaining unambiguous results may take decades (cf. Alexander 2010). This is exacerbated by the limitations of the thermodynamic databases for minerals of interest to models of bentonite/low alkali cement leachate reaction (e.g. Soler 2010, Savage et al. 2011a). It was therefore decided to implement a focussed NA study on bentonite/low alkali cement leachate reaction to provide indications of likely long-term reaction products and reaction pathways to provide feedback on the existing short-term investigations noted above and to ascertain if any critical path R&D needs to be instigated now. The results of the analyses presented here suggest that there has been some form of limited alkaline groundwater reaction with the bentonite. However, ambiguity in some of the boundary conditions means that it is not possible to conclude with absolute certainty that the cause of reaction is alkali groundwater. Nevertheless, the alternative thesis, that the presence of palygorskite at the base of the bentonite is due to reaction with Mg-rich hydrothermal fluids, would appear to be unlikely on the basis of the natural decay series results and the geomorphological interpretation. As noted in section 8.2.3, two or perhaps three hydrothermal events can be traced in the bentonite/analogue bentonite mineralogy, but these are probably early stage, sub- and supra-marine processes (i.e. when the ophiolite was still part of the ocean crust), whereas the smectite-to-palygorskite transformation observed here appears to be a very late stage event. This is generally supported by both the geomorphological evidence and the natural decay series data which imply groundwater activation and groundwater/rock interaction in the last 105 a. Assuming that the presence of the palygorskite is due to alkaline fluid reaction, there are several points worth noting:
The presence of the smectite-to-palygorskite transformation zone at the base of the bentonite/analogue bentonite is unlikely to be due to surface water reaction. As noted in section 4.7.1, “Soils derived from limestone or gypsiferous rocks, as on the dry, chalky uplands, around Parsata, are typically grey or very light brown in colour, mostly shallow and highly calcareous. Hillslope hydrology is affected by the impermeability of accumulation of carbonates and gypsum in such subsoil. This changes the direction of drainage of subsurface water from vertical to lateral (Lavee et al. 1989), and is accentuated in the Parsata area by the weathering out of bentonitic clays.”

180
The smectite-to-palygorskite transformation zone is confined to a volume of the bentonite very close to the pillow lava source of the alkaline groundwaters (i.e. it is seen at the base of the trench, but not significantly in the drillcores). This could be because the source of reaction (i.e. the alkaline groundwaters) is limited, but this seems unlikely considering the geomorphological arguments for groundwater circulation for some 0.8 Ma. And, as noted in section 4.5.2, “An implication of these calculations is that groundwaters in the Parsata area perhaps began to circulate to deeper levels during the 185 – 130 ka interval.”, suggesting a more active system for some 55 ka at least
Certainly, it will not have been continuous for that period, but this seems a long enough period to induce reaction when compared to the 15 years required for the BIGRAD laboratory experiment discussed in section 8.2.3.
It is possible that enough of the bentonite/analogue bentonite remains unaltered for the swelling clays to effectively seal what already appears to be a relatively impermeable rock system against further reaction. Certainly, this is consistent with section 7.2.6 where it was noted that, “This would suggest that the fractures represent the principal vertical pathways for advective flow as petrographical observations show that the matrix is dominated by sub-micron-scale microporosity, with little interconneced macroporosity. Therefore, groundwater and solute transport through the matrix of the rock is likely to be dominated by diffusive transport.
Similarly, where palygorskite is thought to be present in fractures in the bentonite/analogue bentonite (see section 7.2), “…in the sediment matrix adjacent to some fractures, the webbed and fibrous secondary developments that are common throughout the matrix of most of the bentonite/analogue bentonite samples, appear to be more abundant adjacent to fractures than at some distance from them (on a scale of millimetres).” This suggests (spacially limited) buffering of the alkaline fluids by the bentonite/analogue bentonite matrix minerals in a manner not dissimilar to that seen in Maqarin in Jordan (see discussions in Linklater 1998; Smellie 1998; Pitty and Alexander 2011).
The recent laboratory experiments from the BIGRAD project (section 8.2.3) indicate that palygorskite can develop relatively rapidly and in a closed system which is not unlike that present in the bentonite at Parsata (and, more importantly, similar to what is expected in a repository EBS), suggesting a common reaction sequence which would be worth investigating further. Recent work from the open (and advective) system at Searles Lake (Savage et al. 2010a) reports different reaction products and claim smectite susceptibility to alter from pH 9 upwards, but the authors acknowledge that this is in a system which is far from the low flux, diffusion dominated system expected in a repository.
These points are based on observation in the bentonite/analogue bentonite and on an interpretation which is based on limited physical data on the bentonite and spatially and temporally limited data on the groundwater. However, some of these open points could be addressed quite simply:

181
As noted above, the kinetics of reaction tend to work against conducting further, repository relevant closed laboratory bentonite/alkaline fluid experiments at this moment in time. However, the ongoing work on the 15 year old experiments within the BIGRAD programme (e.g. Moyce et al. 2011) should be conducted so as to allow comparison with the results from sites such as Parsata. Equally, the results from CNAP and BIGRAD should be integrated with the data which will eventually be produced from other, ongoing, laboratory experiments.
There remain some uncertainties in the Parsata boundary conditions which would be reduced with some minor, additional effort:
o some simple permeability measurements should be carried out on bentonite carefully sampled in soil-sampling boxes in a new trench immediately adjacent to Parsata Trench 1. Samples could be collected at several distances vertically from the top of the pillow lavas to assess the actual in-situ permeability and if this varies much throughout the bentonite. This would allow a better comparison between the data collected at Parsata and the environment in a repository bentonite buffer or barrier and would be useful in placing the larger volume of data from open systems in perspective
o with a large enough sample volume, the material can also be analysed for indications of 226Ra/230Th disequilibria which would place a lower limit on the time frame of alkali groundwater/bentonite reaction (226Ra t1/2 = 1.6x10³ a, allowing a ‘window’ of up to 8 ka BP to be examined) and give a better assessment of how sporadic groundwater flow has been
o if the above work could be carried out in the winter wet season, there is a better chance of obtaining a groundwater sample at the base of the trench and not just damp bentonite as was the case here (which was unfortunately near the end of the dry season due to the travel disruptions caused by the Eyjafjallajokull volcano). Simultaneously, following negotiations with the owners of the Almond and Olive Orchards (via the GSD) an additional groundwater sample could be collected from both boreholes to help verify the conceptual model with additional natural decay series data
As they currently stand, the results from CNAP Phase III, when integrated with the novel data currently being produced in the BIGRAD project, tend to indicate that any long-term bentonite reaction in low alkali cement leachates is minimal. A small additional effort at the sampling site in Parsata would, however, greatly increase the confidence in these conclusions, allowing direct feedback to the Safety Case and allowing more focussed R&D on the remaining open questions in the immediate future.

182

183
10 ACKNOWLEDGEMENTS The editors would like to thank their colleagues at the GSD in Lefkosia for all their unstinting help, recommendations and advice throughout the duration of this project. Special mention must go to the GSD Director, Dr E.G.Morisseau and the Head of Hydrology, Dr C.A.Constantinou for their support. Thanks also to Mr A.Siathas of Geoinvest Limited of Aglantzia, Cyprus for the contributions of him and his skilled staff to the success of the project. Finally, the project would have gone nowhere but for the financial support of the three Project Partners, NDA-RWMD (UK), Posiva (Finland) and SKB (Sweden) along with Nagra (Switzerland – in Phase I). More than this, however, has been the direct technical input from several staff members at the Project Partners and we would like to thank Drs P.Korkeakoski (Posiva), S.Norris (NDA-RWMD), I.Puigdomenech (SKB), P.Sellin (SKB) and C.Tweed (NDA-RWMD).

184

185
REFERENCES H.Ahokas, P.Hellä, et al. (2006). Control of water inflow and use of cement in ONKALO after penetration of fracture zone R19. Posiva Working Report 2006-45, Posiva, Olkiluoto, Finland. A.Akbulut, and S.Kadir. (2003). The geology and origin of sepiolite, palygorskite and saponite in Neogene lacustrine sediments of the Serinhisar-Acipayan Basin, Denizili, SW Turkey. Clays and Clay Minerals, 51, 279-292. W.R.Alexander (2010). The impact of a hyperalkaline plume on fractured crystalline rock. Proc. NEA-IGSC Workshop on cementitious materials in safety cases for geological repositories for radioactive waste: role, evolution and interaction. Brussels, 17-20th November, 2009. NEA/OECD, Paris, France. W.R.Alexander and F.B.Neall (2007). Assessment of potential perturbations to Posiva’s SF repository at Olkiluoto caused by construction and operation of the ONKALO facility. Posiva Working Report 2007-35, Posiva, Olkiluoto, Finland. W.R.Alexander and A.E.Milodowski (2008). Low-alkali cement leachate/bentonite interaction natural analogue study. Cyprus Natural Analogue Project (CNAP) Phase I. Bedrock Geosciences Technical Report BG08-01, Bedrock Geosciences, Auenstein, Switzerland. W.R.Alexander and A.E.Milodowski (2009). Cyprus Natural Analogue Project (CNAP) Phase II Reconnaissance Trip Report November-December 2008 Bedrock Geosciences Technical Report BG08-02, Bedrock Geosciences, Auenstein, Switzerland. W.R.Alexander and A.E.Milodowski (eds) (2011). Cyprus Natural Analogue Project (CNAP) Phase II Final Report. Posiva Working Report WR 2011-08, Posiva, Eurajoki, Finland. W.R.Alexander, A.Gautschi and P.Zuidema (1998). Thorough testing of performance assessment models: the necessary integration of in situ experiments, natural analogues and laboratory work. Sci. Basis Nucl. Waste Manag. XXI, 1013-1014. W.R.Alexander, I.G.McKinley, C.A.Arcilla, Y.Takahashi, H.Kawamura, M.Yamakawa and K.Aoki (2008a). Alkaline Natural Analogue Potential in the Philippines. Proc. 2nd East Asia Forum on Radwaste Management (EAFORM) Conference, 20-23 October 2008, Tokyo, Japan. RWMC, Tokyo, Japan. W.R.Alexander, C.A. Arcilla, I.G.McKinley, H.Kawamura, Y.Takahashi, K.Aoki and S.Miyoshi (2008b). A new natural analogue study of the interaction of low-alkali cement leachates and the bentonite buffer. Sci Basis Nucl Waste Manag XXXI, 493-500. W.R.Alexander, M. L.Honran, C.A.Arcilla, C.Pascua, E.Vargas, I.G.McKinley, K.Namiki and H.Kawamura (2009). A natural analogue of bentonite alteration by
186
alkaline water: results from the FY’08 field programme in the Philippines. Bedrock Geosciences Technical Report 09-01, Bedrock Geosciences, Auenstein, Switzerland. W.R.Alexander, A.E.Milodowski, C.A.Constantinou, M.Rigas, C.Tweed, P.Sellin, P.Korkeakoski and I.Puigdomenech (2011). Reaction of bentonite in low-alkali cement leachates: results from the Cyprus Natural Analogue Project. Proc. ICEM 2011 Conference, Reims, France, September, 2011, ASME, Washington, USA (submitted). G.B.Allison, C.J.Barnes, M.W.Hughes and F.W.J.Leaney (1983). Effect of climate and vegetation on oxygen-18 and deuterium profiles in soils. Isotope Hydrology. IAEA, Vienna, Austria. J.Alonso, J.L.Garcia-Sineriz et al. (2009). ESDRED Module 4 report : temporary sealing technology, final technical report. EC Report, EC, Luxembourg. J.C.Alt and J.Honnorez. (1984). Alteration of the upper oceanic crust, DSPD site 417: Mineralogy and chemistry. Contribution to Mineralogy and Petrology, 87, 149-169. A.Atkinson (1985). The time-dependence of pH within a repository for radioactive waste disposal UKAEA Tech. Rep. AERE-R11777, Harwell, Oxon, GB. T.Baldwin, N.A.Chapman and F.B.Neall (2008). Geological Disposal Options for High-Level Waste and Spent Fuel. Contractors report for the NDA-RWMD, NDA-RWMD, Harwell, UK. M.Bar-Matthews, A.Ayalon and and A.Kaufman (1997). Late Qutaernary paleoclimate in the eastern Medietteranean region from stable isotope analysis of speleothems at Soreq Cave, Israel. Quaternary Res, 47, 155-168. I.Barnes and J.R.O’Neill (1969). The relationship between fluids in some fresh alpine-type ultramafics and possible modern serpentinisation, western United States. Geol. Soc. Amer. Bull., 80, 1947-1960. I.Barnes, J.B.Rapp, J.R.O`Neil, R.A.Sheppard and A.J.Gude (1972). Metamorphic assemblages and the direction of flow of metamorphic fluids in four instances of serpentinisation. Contrib. Min. Pet. 35, 263-276. R.L.Bates and J.A.Jackson (eds) (1980). Glossary of Geology. American Geological Institute, Falls Church, Virginia, USA. 2nd edition, 751 pp. A.H.Bath., N. Christofi, C. Neal, J.C. Philp, M.R. Cave, I.G. McKinley and U.Berner (1987). Trace Element and Microbiological Studies of Alkaline Groundwaters in Oman, Arabian Gulf: A Natural Analogue for Cement Pore Waters. BGS Report FLPU 87-2, BGS, Keyworth, UK. L.M.Bear (1960). The geology and mineral resources of the Akaki-Lythrodondha area. Geological Survey Department Memoirs No. 3, GSD, Lefkosia, Cyprus.
187
E.Bonatti and O.Joensuu. (1968). Palygorskite from Atlantic deep sediments. America Mineralogist, 53, 975-983. G.Bond, H.Heinrich, W.Broecker and seven others (1992). Evidence for massive discharges of icebergs into the North Atlantic Ocean during the last glacial period. Nature, 360, 245-245. A.V.Boronina (2003). Application of numerical modelling, isotope studies and streamflow observations for quantitative description of hydrogeology of the Kouris catchment (Cyprus). ETH PhD Thesis No. 15338, ETH, Zürich, Switzerland. A.V.Boronina, W.Balderer, P:Renard and W.Stichler (2005a). Study of stable isotopes in the Kouris catchment (Cyprus) for the description of the regional groundwater flow. J.Hydrol. 308, 214 – 226. A.Boronina, P.Renard, W.Balderer and W.Stichler (2005b). Application of tritium in precipitation and in groundwater of the Kouris catchment (Cyprus) for description of the regional groundwater flow. Appl Geochim, 20, 1292-1308. G.Botha and J.C.Hughes. (1992). Pedogenic palygorskite and dolomite in a late Neogene sedimentary succession, northwestern Transvaal, South Africa. Geoderma, 53, 139-154. M.H.Bradbury and B.Baeyens (2002). Porewater chemistry in compacted, re-saturated MX-80 bentonite: physico-chemical characterisation and geochemical modelling. PSI Report 02-10, PSI, Villigen, Switzerland. M.H.Bradbury, B.Baeyens and W.R.Alexander (1990). Experimental proposals for procedures to investigate the water chemistry, sorption and transport properties of marl. Nagra Technical Report Series NTB 90-16, Nagra, Wettingen, Switzerland. L.G.Bragina and N.Y.Bragin (1996). Stratigraphy and radiolarians of the type section of the Upper Cretaceous Perapedhi Formation (Cyprus). Stratigraphy and Geol. Correlation, 4, 38-45, Moscow (in Russian). N.Y.Bragin, L.G.Bragina, K.G.Kaleda and K.A.Krylov (2005). The Sedimentary Cover of the Troodos Massif. Ch. 1H (pp41-48) in Geological Framework of the Levant Volume I: Cyprus and Syria. Historical Productions-Hall, London, UK, ISBN 965-7297-02-8. M.F.Brigatti and L.Poppi.(1981). A mathematical model to distinguish the members of the dioctahedral smectite series. Clay Minerals, 16, 81-89. A.Brogniart (1813). Essai de classifacation mineralogique des roches melanges, Journal des Mines, v. XXXIV, 190-199 (in French). K.W.Butzer and S.E.Harris (2007). Geoarchaeological approaches to the environmental history of Cyprus. J Archaeol Sci, 34, 1932-1952.

188
N.Caine (1980). The rainfall intensity duration control of shallow landslides and debris flows. Geogr Ann Ser A-Phys Geogr, 62A, 23-27. R.H.Campbell (1974). Debris flows originating from soil slips during rainstorms in southern California. Quart J Eng Geol, 7, 339-349. N.A.Chapman, I.G.McKinley and J.A.T.Smellie (1984). The Potential of Natural Analogues in Assessing Systems for Deep Disposal of High-Level Radioactive Waste; Nagra Technical Report NTB 85-41, Nagra, Wettingen, Switzerland. J.Chappell (1974). Geology of coral terraces, Huon Peninsula, New Guinea: a study of Quaternary tectonic movements and sea-level changes. Geol Soc Amer Bull, 85,553-570. G.E.Christidis (2006). Genesis and compositional heterogeneity of smectites. Part III: Alteration of basic pyroclastic rocks—A case study from the Troodos Ophiolite Complex, Cyprus. Amer. Min. 91, 685-701. B.Cicel, P.Komadel, E.Bednarikova and J.Madejova. (1992). Mineralogical composition and distribution of Si, Al, Fe, Mg and Ca in the fine fractions of some Czech and Slovak bentonites. Geologica Carpathica-Series Clays,1, 3-7.
I.D.Clark and J-C.Fontes (1990). Palaeoclimatic reconstruction in northern Oman based on carbonates from hyperalkaline groundwaters. Quaternary Research, 33, 320-336.
.D.Clark and J-C.Fontes and P.Fritz (1992). Stable isotope disequilibria in travertine from high pH waters: Laboratory investigations and field observations from Oman. Geochimica et Cosmochmica Acta, 56, 2041-2050. P.U.Clark, A.S.Dyke, et al (2009). The Last Glacial Maximum. Science, 325, 710-714. J.Colson, I.Cojan, and M.Thiry. (1998). A hydrogeological model for palygorskite formation in the Danian continental facies of the Provence Basin (France). Clay Minerals, 33, 333-347. G.I.Cottiss (1984). Preliminary observations on the design and construction of a four-lane highway through expansive clay in Cyprus. Quart J Eng Geol, 17, 179-192. H.Craig (1961). Isotopic variations in meteoric waters. Science 133, 1702–1703. H.Craig and L.Gordon (1965). Deuterium and Oxygen-18 variations in the ocean and the marine atmosphere in Stable isotopes in oceanographic studies and paleotemperatures. Spoleta. pp.9–130. E.E.Davies and H.Elderfield (eds) (2004). Hydrogeology of the Oceanic Lithosphere, Cambridge University Press, Cambridge, UK.
189
A.Decarreau, F.Colin, A.Herbillon, A.Manceau, D.Nahon, H.Paquet, D.Trauth-Badeaud, and J.J.Trescases. (1987). Domain segregation in Ni-Fe-Mg-smectites. Clays and Clay Minerals, 35, 1-10. K.Deckers (2006). Post-Roman history of river systems in western Cyprus: causes and archaeological implications. J Mediterr Archaeol, 18, 155-181. B.Devillers and N.Lecuyer (2008). Le Petit Âge Glaciaire en milieu semi-aride: le basin versant du Gialias (Chypre) et ses relations avec l’occupation des sols. Z Geomorphologie, 52, 207-224 (in French). S.Eaton and A.Robertson (1993). The Miocene Pakhna Formation, southern Cyprus and its relationship to the Neogene tectonic evolution of the Eastern Mediterranean. Sedimentary Geology, 86, 273-296. S.Edwards, K.Hudson-Edwards, J.cann, J.Malpas and C.Xenophontos (2010). Classic geology in Europe 7: Cyprus. Terra Publishing, Herpenden, UK. N.Fujii, T.Namiki et al. (2011). IPHAP field season 2010 summary report. RWMC Technical Report, RWMC, Tokyo, Japan. P.A.Furley (1987). Impact of forest clearance on soils of tropical cone karst. Earth Surf Process Landf, 12, 523-529. I.D.Gass, C.J.MacCleod, B.J.Murton, A.Panayiotou, K.O.Simonian and C.Xenophontos (1994). The Geology of the Southern Troodos Transform Fault Zone. Geological Survey Department Memoir No.9, GSD, Lefkosia, Cyprus. J.R.Gat (1971). Comments on stable isotope method in regional groundwater investigations. Water Resources. Research, 7, 980-993. Geotimes (1972). Penrose Conference report. Geotimes, pp24-25, Am. Geol. Inst., Alexandria, USA. K.M.Gillis and P.T.Robinson. (1990). Patterns and processes of alteration in the lavas and dykes of the Troodos ophiolite, Cyprus. Journal of Geophysical Research, 95, 21523-21548. M.Given (2000). Agriculture, settlement and landscape in Ottoman Cyprus. Levant, 32, 215-236. L.A.Golovina, S.S. Gablina, S.S. and A.S.N.Simakova (1996). Paleogeographic interpretation of paleoflora from the Pliocene-Pleistocene sediments of western Syria. Stratigr Geolog Correlation, 4, 202-205. B.Gomes (1987). The alluvial terraces and fills of the Lower Vasilikos Valley, in the vicinity of Kalavasos, Cyprus. Trans Inst Brit Geogr, N.S. 12, 345-359.

190
T.Greensmith (1998). Southern Cyprus. Geologists’ Association Guide, 50, Geologists’ Association, London, UK. G.Grivaud (1998). Villages désertés á Chypre (Fin XIIe – Fin XIXe Siècle). Meletai kai Ipomnimata. Volume 3. Archbishop Makarious III Foundation, Nicosia. [original not seen – quoted by B.Devillers and N.Lecuyer and by L.H.Sollars, op cit.] N.Guven (1988). Smectites. 497–559 in Reviews in Mineralogy Volume 19: Hydrous Phyllosilicates (exclusive of micas). S.W.Bailey (editor). (Mineralogical Society of America.) ISBN 0 939950-23-5. C.R.Hallsworth and R.W.O’B.Knox (1999). BGS Rock Classification Scheme. Volume 3: Classification of Sediments and Sedimentary Rocks. British Geological Survey Research Report, RR99-03. British Geological Survey, Keyworth, Nottingham, UK. R.W.Harrison, W.L.Newell, et al. (2004). Tectonic framework and Late Cenozoic tectonic history of the northern part of Cyprus: implications for earthquake hazards and regional tectonics. J Asian Earth Sci, 23, 191-210.
A.Hartland, I.J.Fairchild et al. (2010). The dripwaters and speleothems of Poole’s Cavern: a review of recent and ongoing research. Cave and Karst Science, 36, 37-46.
A.Haworth, S.M.Sharland, P.W.Tasker and C.J.Tweed (1987) Evolution of the groundwater chemistry around a nuclear waste repository. Sci. Basis Nucl. Waste Manag., XI, 425-434 S.Hillier (1999). Use of an air-brush to spray dry samples for X-ray powder diffraction. Clay Minerals, 34, 127-135. S.Hillier, K.Suzuki and J. Cotter-Howells (2001). Quantitative determination of Cerussite (lead carbonate) by X-ray powder diffraction and inferences for lead speciation and transport in stream sediments from a former lead mining area of Scotland. Applied Geochemistry, 16, 597-608. IAEA (2005). Isotopic composition of precipitation in the Mediterranean Basin in relation to air circulation patterns and climate. Final report of a coordinated research project, 2000-2004. IAEA-TECDOC-1453, IAEA, Vienna, Austria. ICDD (2008). CDD PDF-4+ 2008 database, International Centre for Diffraction Data (ICDD), 12 Campus Boulevard, Newton Square, PA, USA. K.Idemitsu, YTachi, H.Furuya, Y.Inagaki and T.Arima (1998). Diffusion of Cs and Sr in compacted bentonites under reducing conditions and in the presence of corrosion products of iron. Mat. Res. Soc. Symp. Proc. 506, 351-358. J.Jacovides (1979). Environmental isotope survey (Cyprus), Final report on I.A.E.A., research contract No: 1039/RB, Technical Report, Ministry of Agriculture and Natural Resources, Department of Water Development, Nicosia, Cyprus, 82 p.
191
JAEA (2007). Second progress report on R&D for TRU waste disposal in Japan. JAEA Review 2007-010/FEPC TRU-TR2-2007-01, JAEA, Tokai, Japan. R.C.Jennings (1988). The locust problem in Cyprus. Bull Sch Orient Afr Stud, 51, 279-313. O.Karnland, U.Nilsson, S.Olsson and P.Sellin (2005). Laboratory experiments with compacted bentonite in contact with highly alkaline solutions, R&D on Low-pH cement for a geological repository. Ch. 3 in Bäckblom, G. (2005) (ed). ESDRED: supporting documents of the first training workshop: proceedings of the 2nd low pH workshop, Madrid, 15-16 June, 2005. ANDRA Unpubl. Internal Report, ANDRA, Paris, France. O.Karnland, S.Olsson, U.Nilsson and P.Sellin (2007) Experimentally determined swelling pressures and geochemical interactions of compacted Wyoming bentonite with highly alkaline solutions. Physics and Chemistry of the Earth, vol. 32, pp. 275-286. H.Kawahata and S.D.Scott (1990). Strontium isotopes and water-rock interaction of the Agrokipia 'B' stockwork deposit in the Troodos ophiolite, Cyprus: a fossil subseafloor ore body. Geochem. J. 24, 349-356. T.C.Kinneard, A.H.F.Robertson and A.Morris (2011). Timing of uplift of the Troodos Massif (Cyprus) constrained by sedimentary and magnetic polarity evidence. Journal of the Geological Society, 168, 457-470. W.C.Knight (1898) Bentonite. Engineering & Mining Journal, 66, p491. C.W.Kreitler and B.E.Bledsoe (1993). Geochemical techniques for identifying sources of ground-water salinization. CRC Press, London, UK. O.Kwiecien, H.W.Arz, F.Lamy, B.Plessen, A.Bahr and G.H.Haug (2009). North Atlantic control on precipitation pattern in the Eastern Mediterranean/Black Sea region during the last glacial. Quaternary Res, 71, 375-384 H.Lavee, M.Wieder and S.Pariente (1989). Pedogenic indicators of subsurface flow on Judean desert hillslopes. Earth Surf Process Landf, 14, 545-555. M.Lee and H. Lee (1973). Cyprus. David & Charles, Newton Abbot, 208 pp. C.M.Linklater (1998). (ed), A natural analogue study of cement-buffered, alkaline groundwaters and their interaction with a repository host rock. Phase II. Nirex Science Studies Report S/98/003, Nirex, Harwell, UK. C.J.MacLeod (1990). Role of the Southern Troodos Transform Fault in the rotation of the Cyprus microplate: evidence from the Eastern Limassol Forest Complex. In: J. Malpas, E. M. Moores, A. Panayiotou and C. Xenophontos (eds.), Ophiolites: Oceanic Crustal Analogues, Proceedings of the Symposium Troodos 1987, Nicosia, 1987, Cyprus, p. 75-85.
192
J.E.McCallum and A.H.F.Robertson (1995). Sedimentology of two fan delta systems in the Pliocene-Pleistocene of the Mesaoria Basin, Cyprus. Sediment Geol, 98, 215-244. I.G.McKinley (1989). Applying natural analogues in predictive performance assessment (1): principles and requirements; (2): examples and discussions. Risk analysis in nuclear waste management, pp.357-396, Klewer Academic Publ., The Netherlands. I.G.McKinley, A.H.Bath, U.Berner, M.Cave and C.Neal (1988). Results of the Oman analogue study. Radiochim Acta 44/45, 311-316. I.G.McKinley, W.R.Alexander, C.A. Arcilla, H.Kawamura and Y.Takahashi (2008) IPHAP: a new natural analogue of bentonite alteration by cement leachates, Proc. Int. Symp. Radiation Safety Management, Daejeon, Korea, 7-9 Nov. 2007, pp 492-498. R.Metcalfe and C.Walker (2004). Proceedings of the International Workshop on Bentonite-Cement Interaction in Repository Environments 14–16 April 2004, Tokyo, Japan. NUMO Tech. Rep. NUMO-TR-04-05, NUMO, Tokyo, Japan. Meteorological Service of Cyprus. http://www.moa.gov.cy/moa/ms/ms.nsf/dmlindex_en/dmlindex_en?opendocument M.Mihara, K.Iriya and K.Torii (2008). Development of low-alkaline cement using pozzolans for geological disposal of long-lived radioactive waste. Doboku Gakkai Ronbunshuu T, 64, 92-103. W.M.Miller, W.R.Alexander, N.A.Chapman, I.G.McKinley, and J.A.T.Smellie (2000). Geological disposal of radioactive wastes and natural analogues. Waste management series, vol. 2, Pergamon, Amsterdam, The Netherlands. J.B.Moody (1976). Serpentinisation: a review. Lithos, 9, 125-138. D.M.Moore and R.C.Reynolds (1997) X-Ray Diffraction and the Identification and Analysis of Clay Minerals, Second Edition. Oxford University Press, New York. E.B.A. Moyce, K. Morris, A. E. Milodowski, C.A.Rochelle, A. Brown and S. Shaw (2011). Long Term Rock Alteration in the Chemically Disturbed Zone of a Geological Disposal Facility. Proceedings of the RSC Conference on Geological Disposal of Radioactive Waste: Underpinning Science and Technology for Radioactive Waste. 18 - 20 October 2011, Loughborough University, UK. RSC Spec. Publ. (in press). Nagra (2002). Project Opalinus Clay – Safety Report. Nagra Technical Report NTB 02-05, Nagra, Wettingen, Switzerland. NDA (2010a). Geological disposal: near field evolution status report. NDA Report No. NDA/RWMD/033. NDA-RWMD, Harwell, UK.

193
NDA (2010b). Geological disposal: geosphere status report. NDA Report No. NDA/RWMD/035. NDA-RWMD, Harwell, UK. NDA (2010c). Geological disposal: generic environmental safety case, main report. NDA Report No. NDA/RWMD/021. NDA-RWMD, Harwell, UK. C.Neal and G.Stanger (1983). Hydrogen generation from mantle source rocks in Oman. Earth Planet. Sci. Lett., 66, 315–320. C.Neal and P.Shand (2002). Spring and surface water quality of the Cyprus Ophiolites. Hydrol. Earth System Sci., 6, 797-817. A.C.D.Newman and G.Brown (1987). The chemical constitution of clays pp 1–128 in: Chemistry of Clays and Clay Minerals (A.C.D. Newman, ed). Mineralogical Society Monograph, 6. Longman Technical and Scientific, Harlow, Essex, UK. F.Orszag-Sperber, J.M.Rouchy and P.Elion (1989). The sedimentary expression of regional tectonic events during the Miocene-Pliocene transition in the southern Cyprus basins. Geol Mag, 126, 291-299. PANalytical (2008). PANalytical SuperQ version 4.0o, 2008 (including Protrace application package). PANalytical B.V., Amelo, The Netherlands http://www.panalytical.com/index.cfm?pid=190 T.M.Pantazis (1967). The geology and mineral resources of the Pharmakas-Kalavasos area. Geological Survey Department Memoirs No. 8, GSD, Lefkosia, Cyprus. T.M.Pantazis (1969). Landslides in Cyprus. Geol Surv Dep Bull no.4, GSD, Lefkosia, Cyprus, 98 pp. E.E.Papadimitrikou and V.G.Karakostas (2006). Earthquake generation in Cyprus revealed by the evolving stress field. Tectonophysics, 423, 61-72. M.C.Peel, B.L.Finlayson and T.A.McMahon (2007). Updated world map of the Köppen-Geiger climate classification. Hydrol Earth Syst Sci, 11, 1633-1644. J.C.Petit (1992). Reasoning by analogy: rational foundation of natural analogue studies. Appl. Geochem. (Suppl. Issue 1), 9-12. A.F.Pitty (1971). Introduction to Geomorphology. Methuen, London, 526 pp. A.F.Pitty (1984). Geomorphology (and Geography Applied). Basil Blackwell, Oxford, 50-51. A.F.Pitty (ed) (1985). Themes in Geomorphology. Croom Helm, Beckenham, Kent, 280 pp.
194
A.F.Pitty (1991). Geomorphological survey of the Dounreay foreshore near the old and new sewage pipes. Commercial-in-Confidence Report, UKAEA(Dounreay). A.F.Pitty (1998). Geomorphology of the Maqarin area in J.A.T.Smellie (ed) Maqarin natural analogue study: Phase III. SKB Technical Report TR-98-04, 71-103, SKB, Stockholm, Sweden. A.F.Pitty and W.R.Alexander (eds), (2011). A natural analogue study of cement buffered, alkaline groundwaters and their interaction with a repository host rock IV: an examination of the Khushaym Matruk (central Jordan) and Maqarin (northern Jordan) sites. NDA-RWMD Contractor’s Report, NDA-RWMD, Harwell, UK. A.J.Poole and A.H.F.Robertson (1991). Quaternary uplift and sea-level change at an active plate boundary, Cyprus. J Geol Soc, 148, 909-921. A.J.Poole and A.H.F.Robertson (1998). Pleistocene fanglomerate deposition related to uplift of the Troodos ophiolite in A.H.F.Robertson, K.C. Emeis, C.Richter and A.Camerlenghi (eds), Proc Ocean Drill Prog Sci Results, 160, 544-568. A.J.Poole, G.B.Shimmield and A.H.F.Robertson (1990). Late Quaternary uplift of the Troodos ophiolite, Cyprus: uranium-series dating of Pleistocene coral. Geology, 18, 894-897. M.R.Power, R.K.Shail., A.C.Alexander and P.W.Scott (1997). Alteration and vein mineralisation within the Lizard complex, south Cornwall: constraints on the timing of serpentinisation. Proceedings of the Ussher Society, 9, 188-194. I.C.Prentice, J.Guiot and S.P.Harrison (1992). Mediterranean vegetation, lake levels and palaeoclimate at the Last Glacial Maximum. Nature, 360, 658-660. B.J.Presley, C.Petrowski, and I.R.Kaplan (1973). Ch 31.2. Interstitial water chemistry: DSDP Leg 13, pp809-811. Deep Sea Drilling Project Initial Reports, IODP, Housten, USA (doi:10.2973/dsdp.proc.13.1973). R.Pusch. (1998). Backfilling with mixtures of bentonite/ballast material ornatural smectitic clay? SKB Technical Report, TR-98-16, Svensk Kärnbränslehantering AB, Stockholm, Sweden, 53pp. M.Rabineau, S.Berné, J-L.Olivet, D.Aslanian, F.Guillocheau and P.Joseph (2006). Paleo sea levels reconsidered from direct observation of paleoshoreline position during Glacial Maxima (for the last 500,000 yr). Earth Planet. Sci. Lett. 252, 119–137. M.Rautman (2003). A Cypriot village of Late Antiquity: Kalavasos-Kopetra in the Vasilikos Valley. J Roman Archaeol, Supp Ser, 52. T. J.Reston and C.R.Ranero (2011). The 3-D geometry of detachment faulting at mid-ocean ridges, Geochem. Geophys. Geosyst., 12, Q0AG05, 19pp.
195
R.C.Reynolds and R.C.Reynolds (1996). Description of Newmod-for-Windows™. The calculation of one-dimensional X-ray diffraction patterns of mixed layered clay minerals. R.C.Reynolds Jr., 8 Brook Road, Hanover, USA. A.H.F.Robertson (1977). Tertiary uplift history of the Troodos massif (Cyprus). Geol Soc Amer Bull, 88, 1763-1772. A.H.F.Robertson and N.H.Woodcock (1979). Mamonia Complex, Southwest Cyprus: evolution and emplacement of a Mesozoic continental margin. Geol. Soc. Am. Bull., 90, 651-655. A.H.F.Robertson, J.E.Dixon, et al., (2003). Edinburgh University School of GeoSciences Honours Geology and GPG excursion to Cyprus Field Guide. Unpubl. internal note, The School of GeoSciences, University of Edinburgh, UK. C.A.Rochelle, J.M.Pearce, K.Bateman, P.Coombs and P.D.Wetton (1997). The evaluation of chemical mass transfer in the disturbed zone of a deep geological disposal facility for radioactive wastes. X: Interaction between synthetic cement porefluids and BVG: Observations from experiments of 4, 9 and 15 months duration. British Geological Survey (BGS), Fluid Processes and Waste Management Group Report, WE/97/16C, 79p. BGS, Keyworth, UK.
RWMC (2011). FY 2010 final report on the Philippines natural analogue project. RWMC Technical Report RWMC, Tokyo, Japan (in Japanese). W.Salomons, A.Goudie and W.G.Mook (1978). Isotopic composition of calcrete deposits from Europe, Africa and India. Earth Surface Processes, 3, 43-57. D.Savage, R.Arthur, C.Watson and J.Wilson (2010a). An Evaluation of Models of Bentonite Pore Water Evolution. Swedish Radiation Safety Authority (SSM) Report 2010-12, SSM, Stockholm, Sweden. D.Savage, S.Benbow, C.Watson, H.Takase, K.Ono, C.Oda and A.Honda (2010b). Natural systems evidence for the alteration of clay under alkaline conditions: an example from Searles Lake, California. Applied Clay Science, vol. 47, pp. 72-81. S.A.Schumm (1956). The role of creep and rainwash on the retreat of badland slopes. Amer J Sci, 254, 693-706. P.Sellin, F.Karlsson, L.Werme, K.Spahiu and I.Puigdomenech (2003). Effect of pH on the safety of KBS-3 deep repository and the confidence in safety assessments. Proceedings of a workshop on Qualification of Low pH Cement for a Geological Repository, Oct 15-16, 2003, Stockholm. SKB, Stockholm, Sweden. K.O.Simonian and I.G.Gass (1978). Arakapas fault belt, Cyprus: a fossil transform fault. Geol. Soc. Am. Bull., 89, 1220-1230. A.Singer. (1991). Palygorskite in sediments: Detrital, diagenetic or neoformed – A critical review. Geologische Rundschau, 68, 996-1008.

196
R.L.Snyder and D.L.Bish (1989). Chapter 5 Quantitative analysis (pp. 101-144). In: Bish, D.L., Post, J.E. (eds), Modern Powder Diffraction, Reviews in Mineralogy, Volume 20, Mineralogical Society of America, USA. J.A.T.Smellie (1998). (ed), A natural analogue study of cement-buffered, alkaline groundwaters and their interaction with a repository host rock. Phase III. SKB Report TR 98-04, SKB, Stockholm. J.A.T.Smellie, A.B.MacKenzie and R.D.Scott (1985). An analogue validation study of natural radionuclide migration in crystalline rocks using uranium series disequilibrium: preliminary results; Sci. Basis Nucl. Waste Manag. IX, pp.91-98. P.Soler (2010). Reactive Transport Modeling of Grout-Rock Interaction at the ONKALO Site. Posiva WR 2010-73, Posiva, Eurajoki, Finland. A.L.Stephen, G.R.T.Jenkin, J.Naden, M.T.Styles, D.J.Smith and A.J.Boyce (2011). Hyperalkaline geothermal systems in ophiolites and their role in natural CO2 sequestration. (Poster and Abstract). Environmental Mineralogy and Biogeochemistry Research-in-Progress Meeting, Environmental Mineralogy Group (Mineralogical Society of Great Britain and Ireland), Grant Institute, Edinburgh, May 2011. C.H.Stirling, T.M.Esat, M.T.McCulloch and K.Lambeck (1995). High precision U-series dating of corals from Western Australia and implications for the timing and duration of the Last Interglacial. Earth Planet Sci Lett, 135, 115-130. D.A.V.Stow, N.E.Braakenburg and C.Xenophontas (1995). The Pissouri Basin fan-delta complex, southwestern Cyprus. Sediment Geol, 98, 245-262. The Times (2004). November 3, 2004, London, UK. I.A.Todd (1989). Early prehistoric society: a view from the Vasilikos valley, in E.Peltenburg (ed) Early Society in Cyprus. Edinburgh University Press, Edinburgh, 2-13. T.C.Tsintides, G.N.Hadjikyriakou and C.S.Chritodoulou (2002). Trees and shrubs in Cyprus. Leventis Foundation and Cyprus Forest Association, Nicosia. M.E.Tucker. (1991) Sedimentary Petrology. Blackwell Scientific Publications, Oxford, England. W.H.Twenhofel. (1937). Terminology of the fine-grained mechanical sediments. National Resources Council, Report Committee. Sedimentation (1936-1937). P.C.Tzedakis, J.F.McManus, H.Hooghiemstra, D.W.Oppo and T.A.Wijmstra (2003). Comparison of changes in vegetation in northeast Greece with records of climate variability on orbital and suborbital frequencies over the last 450,000 years. Earth Planet Sci Lett, 212, 197-212.
197
H.Umeki (2009). Holistic assessment to put mobile radionuclides in perspective. Proc. MOFAP’07, January 16-19 2007, La Baule, France, pp11-20. NEA/OECD Report No. 6310, NEA/OECD, Paris, France. J.W.Van den Brink and P.D.Jungerius (1983). The deposition of stony colluvium on clay soil as a cause of gully formation in the Rif Mountains, Morocco. Earth Surf Process Landf, 8, 281-285. U.Vuorinen, J.Lehikoinen, H.Imoto, T.Yamamoto and M.Cruz Alonso (2005). Injection Grout for Deep Repositories, Subproject 1: Low-pH cementitious Grout for Larger Fractures, Leach Testing of Grout Mixes and Evaluation of the Long-Term Safety. Posiva Working Report 2004-46, Posiva, Olkiluoto, Finland. J.V.Waters, S.J.Jones and H.A.Armstrong (2010). Climatic controls on late Pleistocene alluvial fans, Cyprus. Geomorphology, 115, 228-251. J.Weber, W.Schirmer, F.Heller and V.Bachtadse (2011). Magnetostratigraphy of the Apalós Formation (early Pleistocene): Evidence for pulsed uplift of Cyprus. Geochem Geophys Geosys, 12, in press. I.M.West (2007). Geology of the Salt Lake and Coast of the Akrotiri Peninsula, Cyprus. National Oceanography Centre, Southampton, UK. Internet site. http://www.soton.ac.uk/~imw/Cyprus-Akrotiri-Lake-Coast.htm. Version: 16 January 2007. J.West, W.R.Alexander, K.Kaku, I.G.McKinley and A.Shimmura (2002). Communication of nuclear power concepts to stakeholders - the use of nature's own laboratories. Proceedings for NUCEF 2001 - Scientific Bases for Criticality Safety, Separation Process and Waste Disposal. 31 Oct to 2 Nov 2001, Tokai, Japan. Japan Atomic Energy Research Institute Report JAERI Conf 2002-004. pp 47 – 54. R.A.M.Wilson and F.T.Ingham (1959). The geology of the Xeros-Troodos area. Geological Survey Department Memoir Number 1, Nicosia, Cyprus. J.A.Winchester and P.A.Floyd (1977). Geochemical discrimination of different magma series and their differentiation products using immobile elements. Chemical Geology, 20, 325-343. D.H.Yaalon and S.Singer (1974). Vertical variation in strength and porosity of calcrete (Nari) on chalk, Shefela, Israel and interpretation of its origin. J Sediment Petrol, 44, 1016-1023. M.Yamakawa, W.R.Alexander, I.G.McKinley, C.A.Arcilla, Y.Takahashi and K.Namiki (2008). The potential in the Philippines for studying natural analogues of the interaction of low-alkali cement leachates and bentonite barriers in a radioactive waste repository. Proc. Japan-Korea Joint Meeting, 30th April – 1st May, 2008, Tokyo. RWMC, Tokyo, Japan. T.Yoshikawa (1985). Landform development by tectonics and denudation, in A.F.Pitty (ed), op cit., pp.194-210.

198

199
LIST OF APPENDICES Appendix 1: Parsata core logs
Appendix 2: Parsata trench log
Appendix 3: Petrographic data
Appendix 4: Whole rock chemical data
Appendix 5: Groundwater data

200

201
Appendix 1: Parsata core logs
Parsata 1 co-ordinates N3853618 E0524217 +/-5 m altitude 372 m
Depth Description 0-1 m Green-brown clay (brown on fresh surfaces). Some white precipitate
through the matrix in places. 1-2 m Green-brown clay (brown on fresh surfaces). Fe- and Mn-oxides on
(fracture) faces. Also white precipitates on oxides. 2-3 m As above. 3-4 m As above. 4-5 m As above. 5-6 m As above. Fragments softer than before (putty like). 6-7 m Green-brown clay (brown on fresh surfaces). Fe- and Mn-oxides on
(fracture) faces. Also white precipitates on oxides. 7-8 m As above. 8-9 m As above, but no obvious fracture face coatings. 9-10 m Highly friable green-brown clay. 10-11 m As above. 11-12 m As above. 12-13 m As above. 13-14 m Light grey, friable clay 14-15 m Green clay (brown on fresh surface) 15-16 m As above. 16-17 m As above. 17-18 m As above. Very friable. 18-19 m As above. 19-20 m Brown clay 20-21 m As above. 21-22 m As above 22-23 m As above 23-24 m 24-25 m As above. 25-26 m As above. 26-27 m Green abd brown clay, some fragments soft. 27-28 m As above. 28-29 m As above, fragments of white fracture fill. Parsata 2 co-ordinates N3853708 E0524172 +/-0 m altitude 378 m Depth Description 0-1 m Brown clay and suficial debris 1-2 m Brown clay with white fracture fill in places. 2-3 m As above. 3-4 m As above, but white material dispersed throughout the clay 4-5 m As above. 5-6 m As above

202
6-7 m As above. 7-8 m Grey-green clay with Mn-oxides coating (fracture?) faces. 8-9 m Green-brown clay with Mn-oxide stains on (fracture) faces and white
fracture infill. 9-10 m As above 10-10.4 m 10.4-11 m Cored. Stiff, green clay with rare filled voids of white material which
were present on recovery of the core (i.e. not storage effect) 11-12 m Grey-green clay. 12-13 m As above. 13-14 m Greenish clay with Mn oxide coatings on (fracture?) faces. 14-15 m Grey-green clay. 15-16 m As above. 16-16.4 m Cored. Stiff, grey-green clay. 16.4-16.8 m Cored. Stiff, grey-green clay with white post-coring 'bloom' on
surfaces. 16.8-17.3 m Cored. Stiff, grey-green clay with white post-coring 'bloom' on
surfaces. Fe staining on probable fracure face. 17.3-17.6 m Cored. Stiff, grey-green clay. Fe staining on probable fracture
face. 17-18 m Grey-green clay 18-19 m As above. 19-20 m As above. 20-21 m As above. 21-22 m As above. 22-23 m Brown clay with admixed harder whitish material (showing
texture/orientation?) 23-24 m As above, but brown-white mix now about 50:50 24-25 m As above, but white material now very rare. 25-26 m As above. 26-27 m Brown clay 27-28 m Pale grey clay 28-29 m As above, but with white fracture filling (regular boundary between
white material and clay) 29-30 m As above. 30-31 m As above. 31-32 m Red-brown clay with significant admix of white material - too
disaggregated to tel if fracture fill or not. White material harder than clay.
32-33 m As above 33-34 m As above. 34-35 m Red-brown clay with paler clay fragments admixed 35-36 m As above. 36-37 m As above 37-38 m Much darker brown, white fracture fill material visable. 38-39 m As above 39-40 m As above. 40-41 m As above

203
Parsata 3 co-ordinates N3853665 E0524143 +/-0 m, altitude 372 m Depth Description 0-1 m surficial soils and organics mixed with brown clay and light brown to
grey, fresh to altered PLV 1-2 m brown clay and light brown to grey, fresh to altered PLV. Some PLV
shows Mn-oxide staining 2-3 m Light grey to almost black PLV fragments plus minor brown clay. PLV
fragments show 1 mm black crystals plus red fracture faces 3-4 m Soft, light grey (serpentinised?) to black (fresh) PLV fragments plus
minor brown clay. Clear Mn-oxide filled fractures in white PLV. 4-5 m As above, PLV fragments more generally altered and friable with no
obvious fractures. 5-6 m As above with a general Fe oxide hue to everything 6-7 m As above. Possible calcite-filled fractures. 7-8 m Material much finer (coarse sand), PLV fragments friable, grey. Possible
serpentinite fracture fill observed as fragments. 8-9 m Generaly darker (dark grey to black), less friable PLV fragments. 9-10 m As above, darker still Parsata 4 co-ordinates N3853683 E0524157 +/-0 m altitude 375 m Depth Description 0-1 m Slope debris - soild, greenish clay, limestaone. 1-2 m Greenish friable clay with white secondary precipitates in places 2-3 m Greenish to brown friable clay with discrete fragments of white material
(carbonate?). Looks like fracture fill. 3-4 m Highly friable greenish to brown clay. 4-4.3 m Cored section. Massive, uniform, brown clay, partly baked by heat of
drill? 4.3-5 m Massive, uniform, brown clay. Parts show white phases disseminated
through the clay and possible filled fractures. 5-6 m As above. Some faces (fractures?) show thin black coating - Mn oxides? 6-7 m As above. 7-7.3 m Cored section. Massive, uniform, brown clay, partly baked by heat of
drill? White secondary precipitates (not post drilling) both disseminated and on (fracture?) faces.
7.3-8 m Massive, uniform, brown clay,white secondary precipitates common, almost nodular (1-2 cm diameter) in places
8-9 m As above. 9-9.4 m Cored section. Pale grey clay with white filling in microfractures. 9.4-10 m Mixture of previous 2 sections - pale grey clay and brown clay 10-11 m As above. 11-12 m Friable brown clay 12-13 m As above. 13-14 m 14-15 m dark grey (black on fresh surface) friable clay dominates, but also hard
brown clay and some light grey clay

204
15-16 m As above. Dark grey clay sticky, but may be from condensation in the bag.
16-16.3 m Cored section. Dark brown, massive clay with white to light pink secondary phases on (fracture?) faces and 0.5 cm nodules (vugs?)
16.3-17 m Crushed version of the above. 17-18 m As above, but including fragments with the appearance of altered PLV
(light grey with lithographic texture of PLV) 18-19 m As above, but with minor admixture of light grey fragments (black on
fresh surface) which are finer grained than above. 19-20 m Fine grained (i.e. heavily crushed) blue-grey material of PLV-like colour.
Rare, larger fragments show PLV internal structure. 20-21 m Thoroughgoing PLV. Most fragments show white coating on some
surfaces, individual secondary phases present (fracture fill?). 21-21.4 Cored section. As above. Despite the heat of coring, this sample was
moist on recovery - now dried out.

205
Appendix 2: Parsata trench log
SampleNo
Approx.Depth (cm) Description
1 0 soil with white veins and roots2 25 red clay, rare white veins, thin roots3 50 red clay, obvious white veins and blebs in the red clay3a 50 sub sample of the white material4 75 beginning of a zone of black staining in laminations of the red clay5 100 clay is now thorough going black6 110 top of zone of heavy red staining in the clay7 110 base of zone of heavy red staining8 110 top of the pillow lavas (PLV), green coloured9 178 green brown stained zone in the PLV10 178 large piece of PLV (representative of 'bulk' PLV)11 178 green vein at the base of the clay12 178 a white vein around the PLV13 178 red clay immediately adjacent to 1114 178 green material right at the top of the PLV15 178 red clay immediately adjacent to 1416 178 fault face material from the narrow part of the trench16a 178 fault face material from the narrow part of the trench17 178 black clay18 120 soil box sample of the clay19 145 bulk' clay sample
20Road
cutting potential Mn carbonate (from around PLV pillow)21 “ bulk' Mn oxide

206

207
Appendix 3: Petrographic data
Sample Site: Parsata 2 Borehole Sample Depth: 16.2 m
BGS Sample ID: MPLP874 Preparation(s): Rock chip, PTS
Field Description: Green clay with white-coated fractures
Sample Description A: PTS A mudstone with a tight clay matrix (A), fractured with a deposit of fine calcium sulphate crystal on fracture surfaces (C). Fracture surfaces are finely striated (B, C). Secondary clays are indicated by the presence of finely webbed morphologies developed on both matrix clay edges and on fracture surfaces (B). There are rare zeolites (and / or possibly analcite) dispersed throughout the matrix. Where exposed at fracture surfaces, zeolites are also striated (C) showing some have formed before some of the fractures.
B: SE image, C-coated rock chip. The image shows a typical striated fracture surface with a partial coating of finely webbed clays.
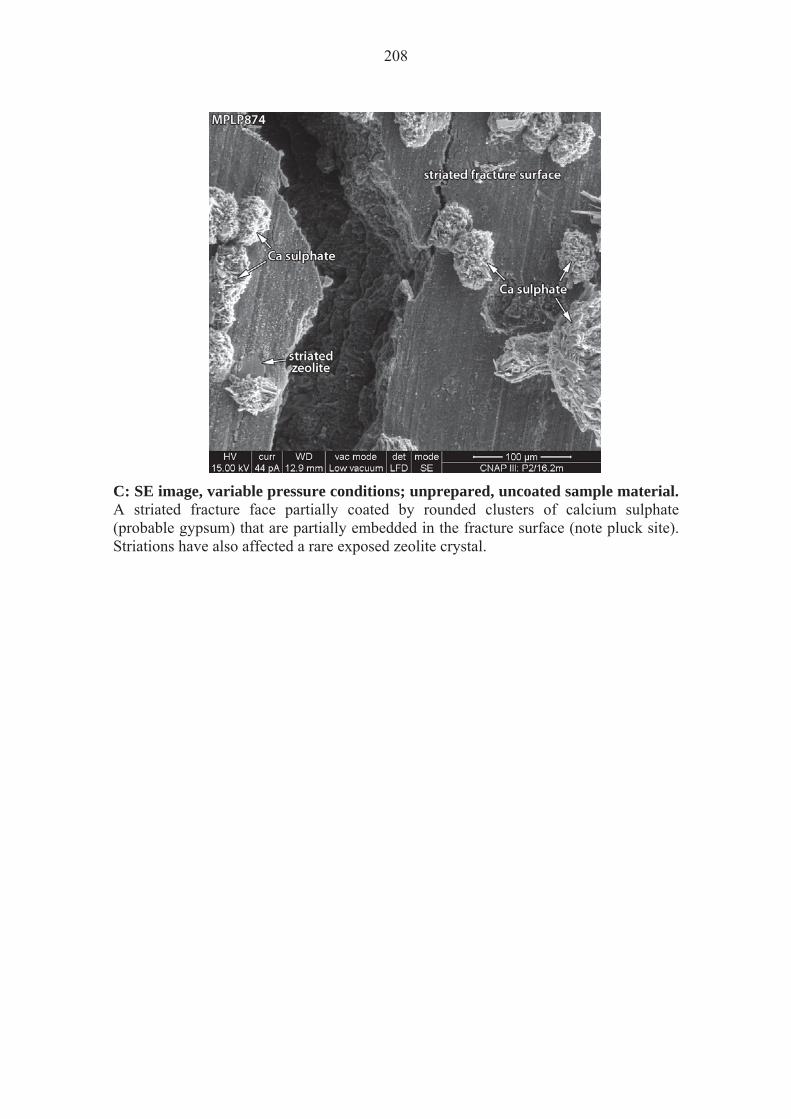
208
C: SE image, variable pressure conditions; unprepared, uncoated sample material. A striated fracture face partially coated by rounded clusters of calcium sulphate (probable gypsum) that are partially embedded in the fracture surface (note pluck site). Striations have also affected a rare exposed zeolite crystal.

209
Sample Site: Parsata 4 Borehole Sample Depth: 4.0-4.3 m
BGS Sample ID: MPLP888 Preparation(s): Rock chip, PTS
Field Description:
Cored section. Massive, uniform, brown clay, partly baked by heat of drill?
Sample Description A: PTS Tight clay matrix with scattered silt-grade grains, including diatom debris and probable apatite, but many are partially altered and rarely recognisable. Alteration products and void cements include probable zeolites (B, C, D - typically with Na-based compositions that also includes traces of K and Ca – see E). The silica of the diatom has also been altered / recrystalised (B; possibly cristobalite). The clay matrix displays some webbed and crenulated alteration morphologies and has compositions that include Na, Mg, K, Ca and Fe. The webbed constituents locally partially coat zeolite crystals (C). Fracture faces are finely striated (D). There are lines and patches of webbed and crenulated clays that have formed over the fracture striations (D).
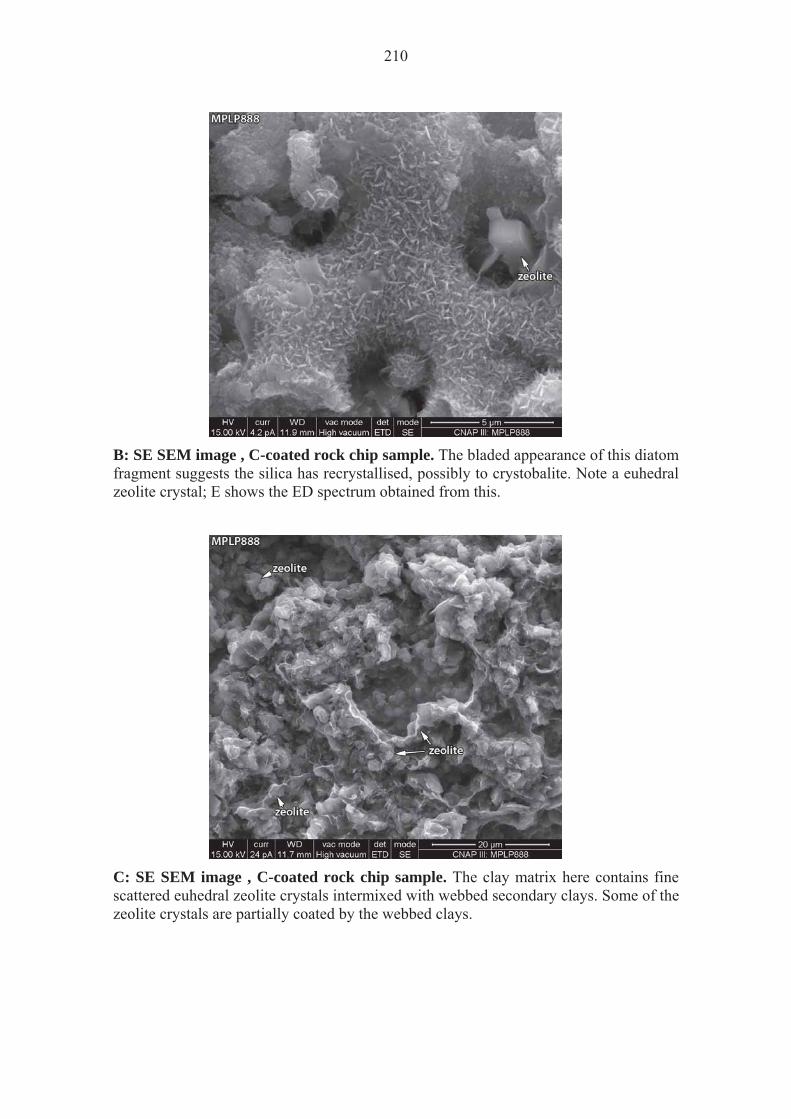
210
B: SE SEM image , C-coated rock chip sample. The bladed appearance of this diatom fragment suggests the silica has recrystallised, possibly to crystobalite. Note a euhedral zeolite crystal; E shows the ED spectrum obtained from this.
C: SE SEM image , C-coated rock chip sample. The clay matrix here contains fine scattered euhedral zeolite crystals intermixed with webbed secondary clays. Some of the zeolite crystals are partially coated by the webbed clays.

211
D: SE SEM image , C-coated rock chip sample. A finely striated fracture surface is locally coated by webbed secondary clays. In detail the webbed clays have formed on top of the striae. Note the emergent zeolite and a needle of Ti oxide aligned with the striae in the fracture surface.
E: ED spectrum, from zeolite in B.
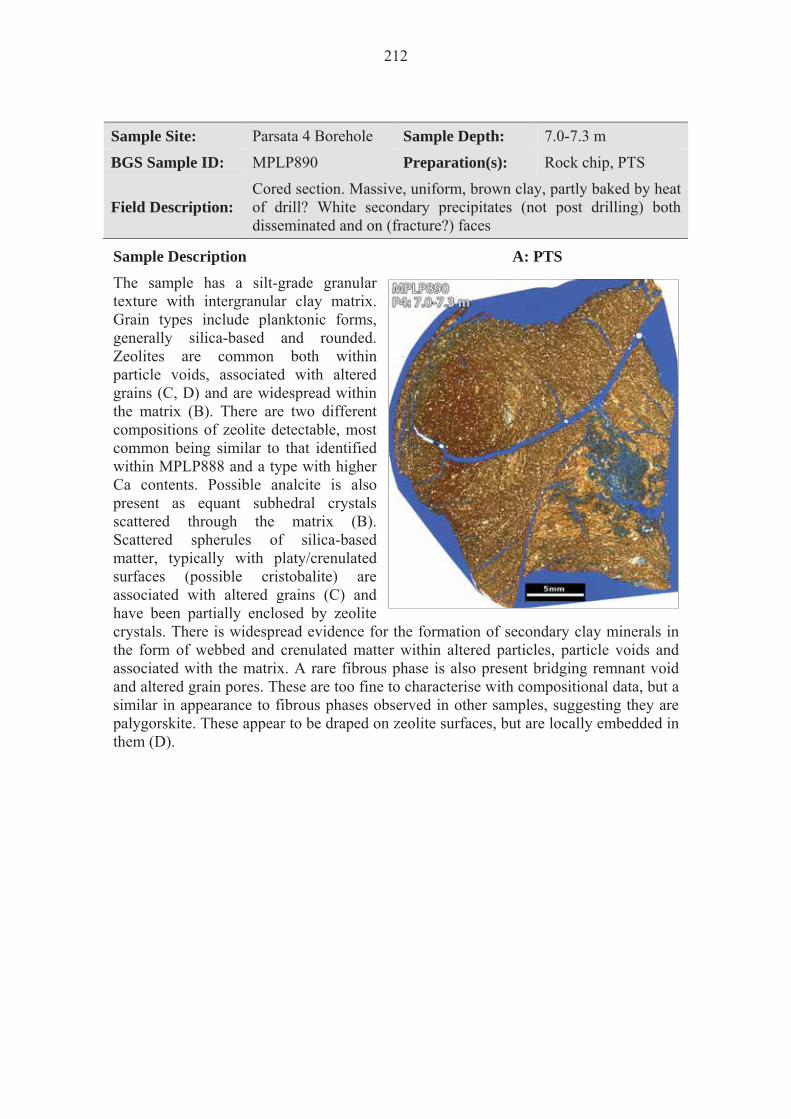
212
Sample Site: Parsata 4 Borehole Sample Depth: 7.0-7.3 m
BGS Sample ID: MPLP890 Preparation(s): Rock chip, PTS
Field Description: Cored section. Massive, uniform, brown clay, partly baked by heat of drill? White secondary precipitates (not post drilling) both disseminated and on (fracture?) faces
Sample Description A: PTS The sample has a silt-grade granular texture with intergranular clay matrix. Grain types include planktonic forms, generally silica-based and rounded. Zeolites are common both within particle voids, associated with altered grains (C, D) and are widespread within the matrix (B). There are two different compositions of zeolite detectable, most common being similar to that identified within MPLP888 and a type with higher Ca contents. Possible analcite is also present as equant subhedral crystals scattered through the matrix (B). Scattered spherules of silica-based matter, typically with platy/crenulated surfaces (possible cristobalite) are associated with altered grains (C) and have been partially enclosed by zeolite crystals. There is widespread evidence for the formation of secondary clay minerals in the form of webbed and crenulated matter within altered particles, particle voids and associated with the matrix. A rare fibrous phase is also present bridging remnant void and altered grain pores. These are too fine to characterise with compositional data, but a similar in appearance to fibrous phases observed in other samples, suggesting they are palygorskite. These appear to be draped on zeolite surfaces, but are locally embedded in them (D).

213
B: SE SEM image, C-coated rock chip sample. Typical matrix containing scattered euhedral zeolite crystals and an equant crystal of probable analcite. Arrows highlight sites where webbed secondary clays are particularly discernible. The secondary clays have formed on top of both the zeolites and the probable analcite.
C: SE SEM image, C-coated rock chip sample. Site of interlocking euhedral zeolite crystals is most likely an altered detrital silt grain. Associated silica spherules have crenulated / bladed surface morphologies; these may comprise amorphous silica and / or cristobalite. Box is the site of the following image.

214
D: SE SEM image, C-coated rock chip sample. A fibrous phase, possibly palygorskite, is present draped on zeolitesurfaces, locally enclosed by them (arrowed sites).
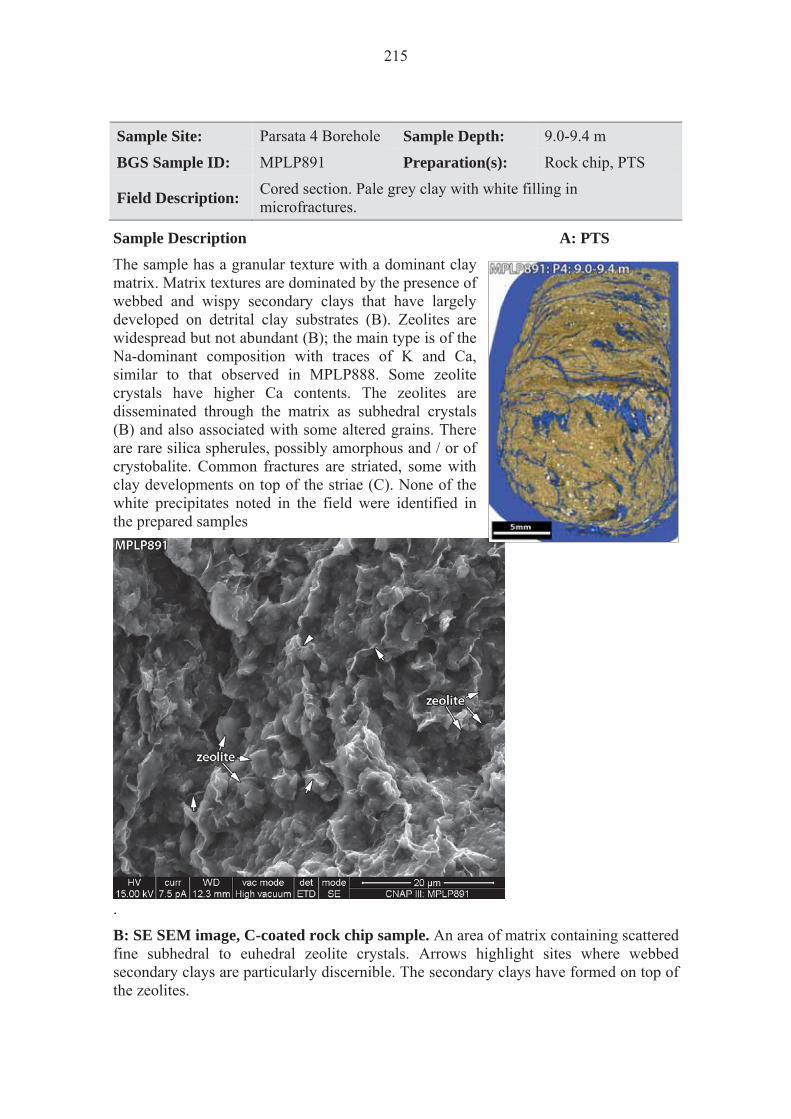
215
Sample Site: Parsata 4 Borehole Sample Depth: 9.0-9.4 m
BGS Sample ID: MPLP891 Preparation(s): Rock chip, PTS
Field Description: Cored section. Pale grey clay with white filling in microfractures.
Sample Description A: PTS The sample has a granular texture with a dominant clay matrix. Matrix textures are dominated by the presence of webbed and wispy secondary clays that have largely developed on detrital clay substrates (B). Zeolites are widespread but not abundant (B); the main type is of the Na-dominant composition with traces of K and Ca, similar to that observed in MPLP888. Some zeolite crystals have higher Ca contents. The zeolites are disseminated through the matrix as subhedral crystals (B) and also associated with some altered grains. There are rare silica spherules, possibly amorphous and / or of crystobalite. Common fractures are striated, some with clay developments on top of the striae (C). None of the white precipitates noted in the field were identified in the prepared samples
.
B: SE SEM image, C-coated rock chip sample. An area of matrix containing scattered fine subhedral to euhedral zeolite crystals. Arrows highlight sites where webbed secondary clays are particularly discernible. The secondary clays have formed on top of the zeolites.
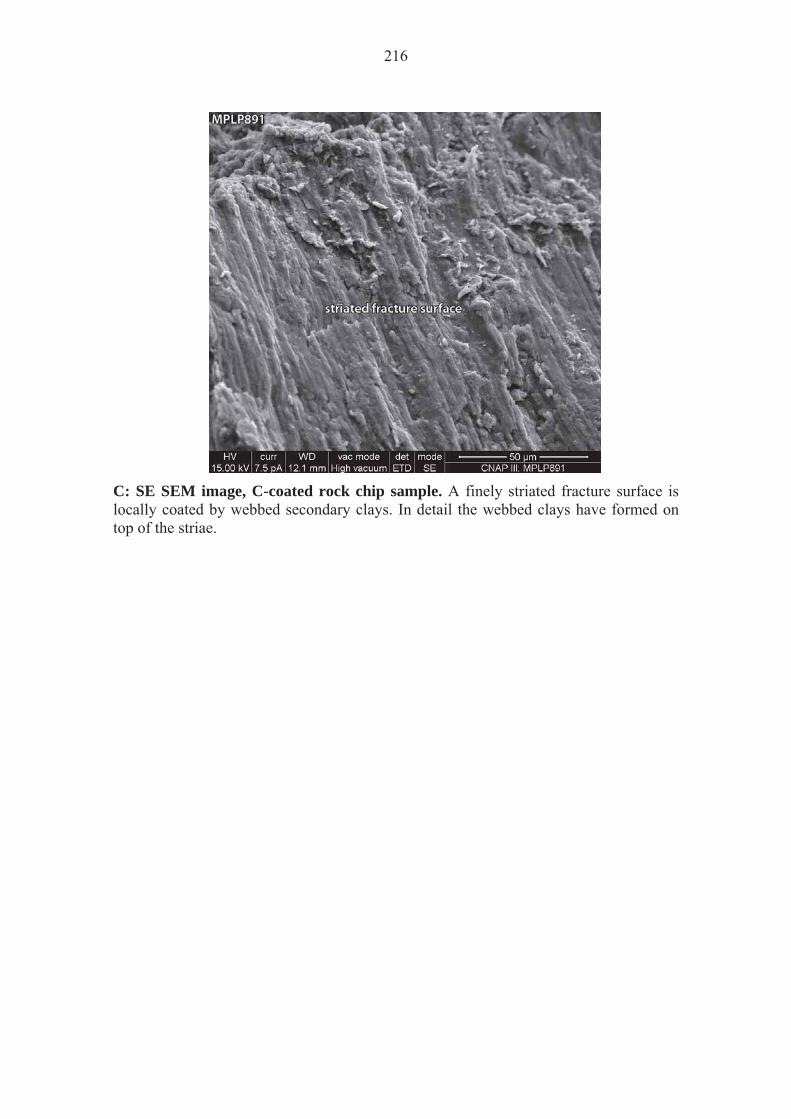
216
C: SE SEM image, C-coated rock chip sample. A finely striated fracture surface is locally coated by webbed secondary clays. In detail the webbed clays have formed on top of the striae.
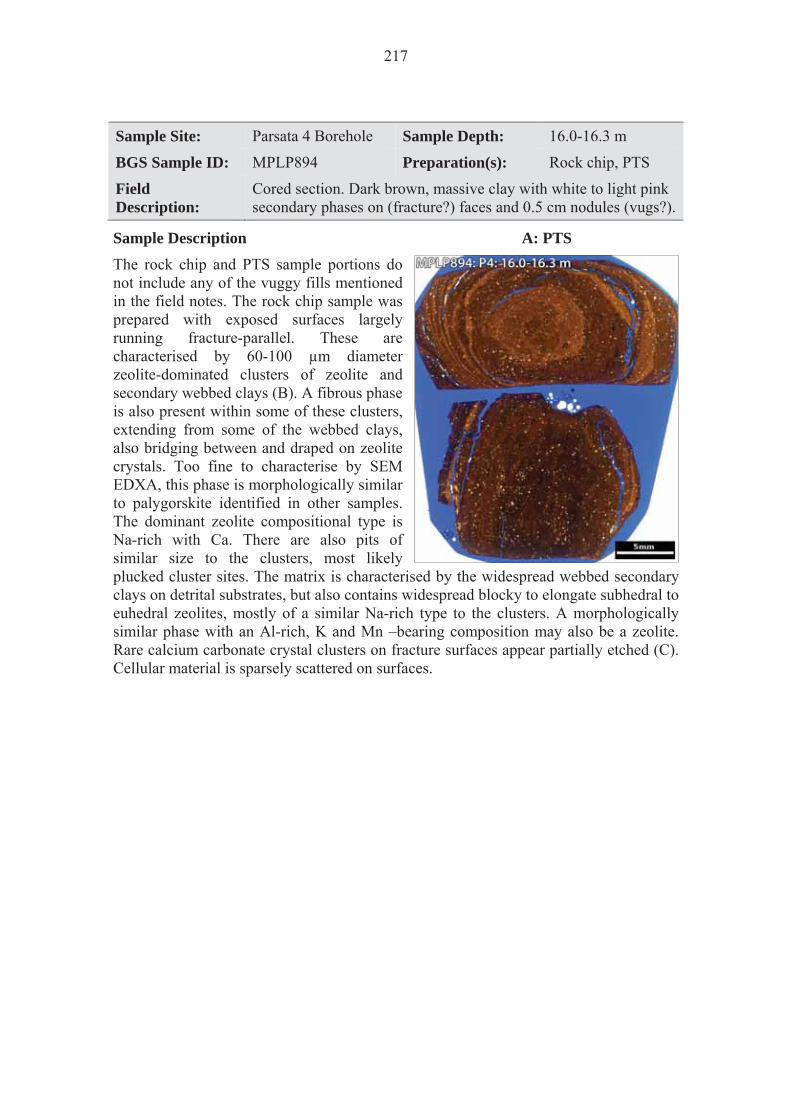
217
Sample Site: Parsata 4 Borehole Sample Depth: 16.0-16.3 m
BGS Sample ID: MPLP894 Preparation(s): Rock chip, PTS
Field Description:
Cored section. Dark brown, massive clay with white to light pink secondary phases on (fracture?) faces and 0.5 cm nodules (vugs?).
Sample Description A: PTS The rock chip and PTS sample portions do not include any of the vuggy fills mentioned in the field notes. The rock chip sample was prepared with exposed surfaces largely running fracture-parallel. These are characterised by 60-100 μm diameter zeolite-dominated clusters of zeolite and secondary webbed clays (B). A fibrous phase is also present within some of these clusters, extending from some of the webbed clays, also bridging between and draped on zeolite crystals. Too fine to characterise by SEM EDXA, this phase is morphologically similar to palygorskite identified in other samples. The dominant zeolite compositional type is Na-rich with Ca. There are also pits of similar size to the clusters, most likely plucked cluster sites. The matrix is characterised by the widespread webbed secondary clays on detrital substrates, but also contains widespread blocky to elongate subhedral to euhedral zeolites, mostly of a similar Na-rich type to the clusters. A morphologically similar phase with an Al-rich, K and Mn –bearing composition may also be a zeolite. Rare calcium carbonate crystal clusters on fracture surfaces appear partially etched (C). Cellular material is sparsely scattered on surfaces.
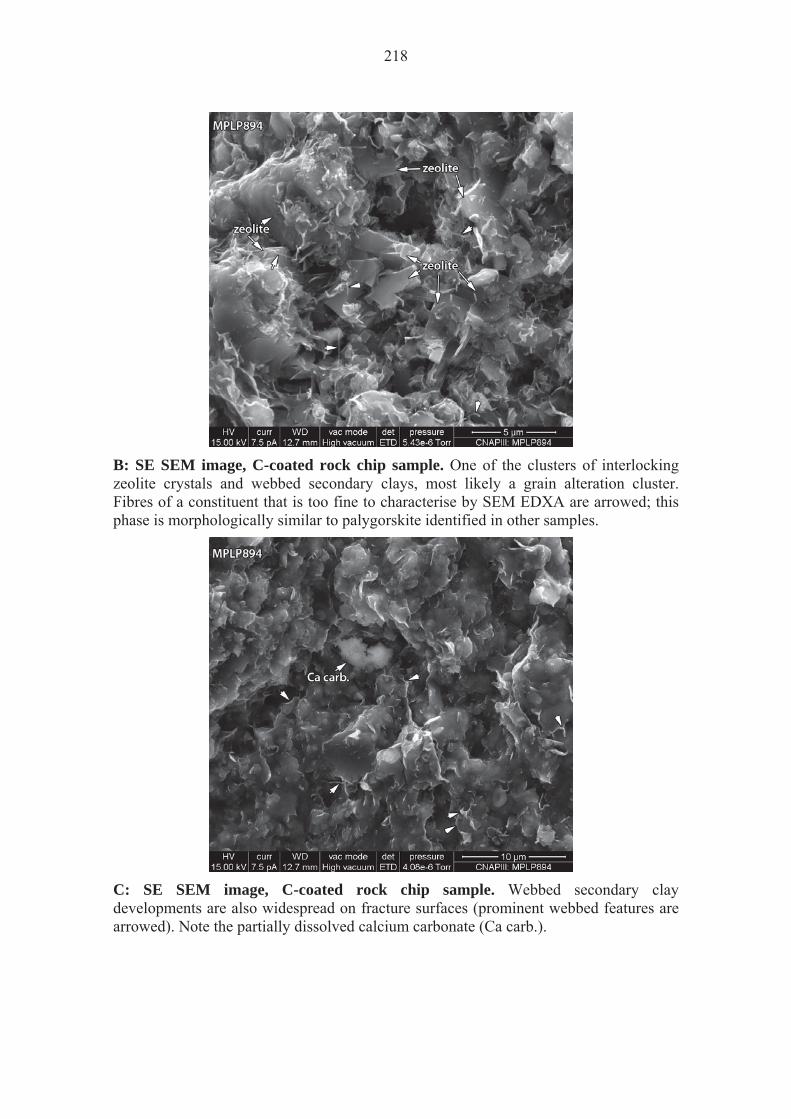
218
B: SE SEM image, C-coated rock chip sample. One of the clusters of interlocking zeolite crystals and webbed secondary clays, most likely a grain alteration cluster. Fibres of a constituent that is too fine to characterise by SEM EDXA are arrowed; this phase is morphologically similar to palygorskite identified in other samples.
C: SE SEM image, C-coated rock chip sample. Webbed secondary clay developments are also widespread on fracture surfaces (prominent webbed features are arrowed). Note the partially dissolved calcium carbonate (Ca carb.).
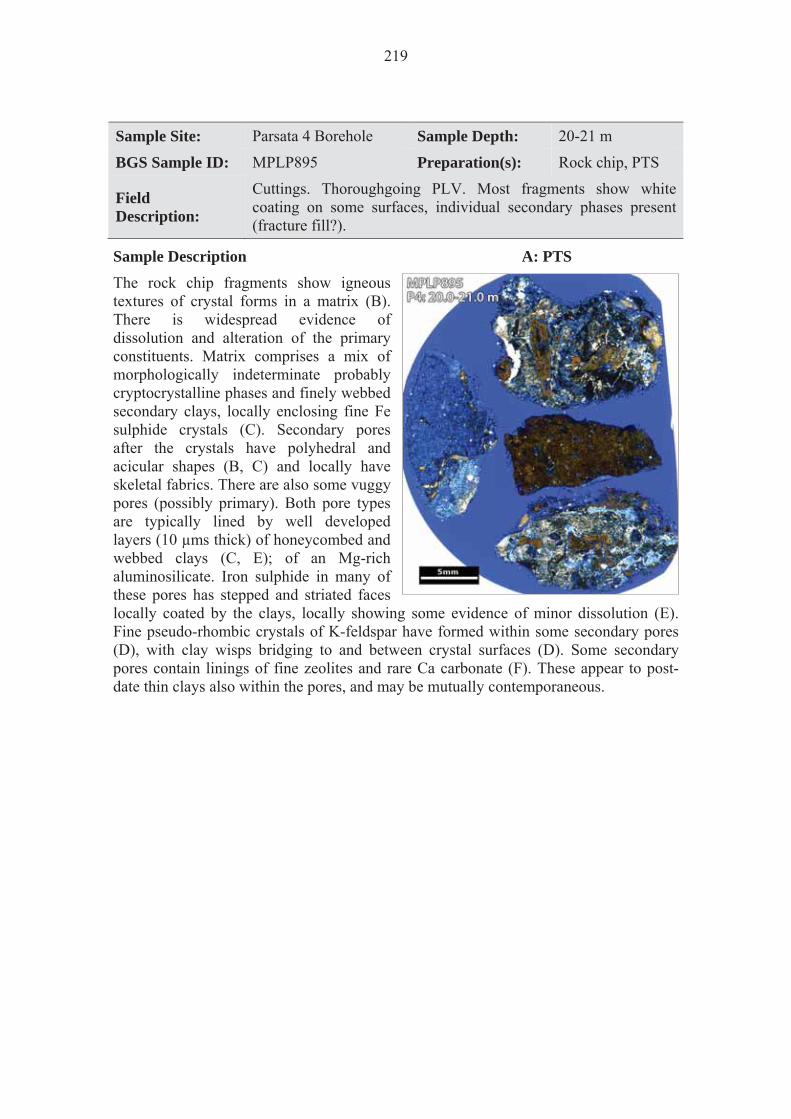
219
Sample Site: Parsata 4 Borehole Sample Depth: 20-21 m
BGS Sample ID: MPLP895 Preparation(s): Rock chip, PTS
Field Description:
Cuttings. Thoroughgoing PLV. Most fragments show white coating on some surfaces, individual secondary phases present (fracture fill?).
Sample Description A: PTS The rock chip fragments show igneous textures of crystal forms in a matrix (B). There is widespread evidence of dissolution and alteration of the primary constituents. Matrix comprises a mix of morphologically indeterminate probably cryptocrystalline phases and finely webbed secondary clays, locally enclosing fine Fe sulphide crystals (C). Secondary pores after the crystals have polyhedral and acicular shapes (B, C) and locally have skeletal fabrics. There are also some vuggy pores (possibly primary). Both pore types are typically lined by well developed layers (10 μms thick) of honeycombed and webbed clays (C, E); of an Mg-rich aluminosilicate. Iron sulphide in many of these pores has stepped and striated faces locally coated by the clays, locally showing some evidence of minor dissolution (E). Fine pseudo-rhombic crystals of K-feldspar have formed within some secondary pores (D), with clay wisps bridging to and between crystal surfaces (D). Some secondary pores contain linings of fine zeolites and rare Ca carbonate (F). These appear to post-date thin clays also within the pores, and may be mutually contemporaneous.
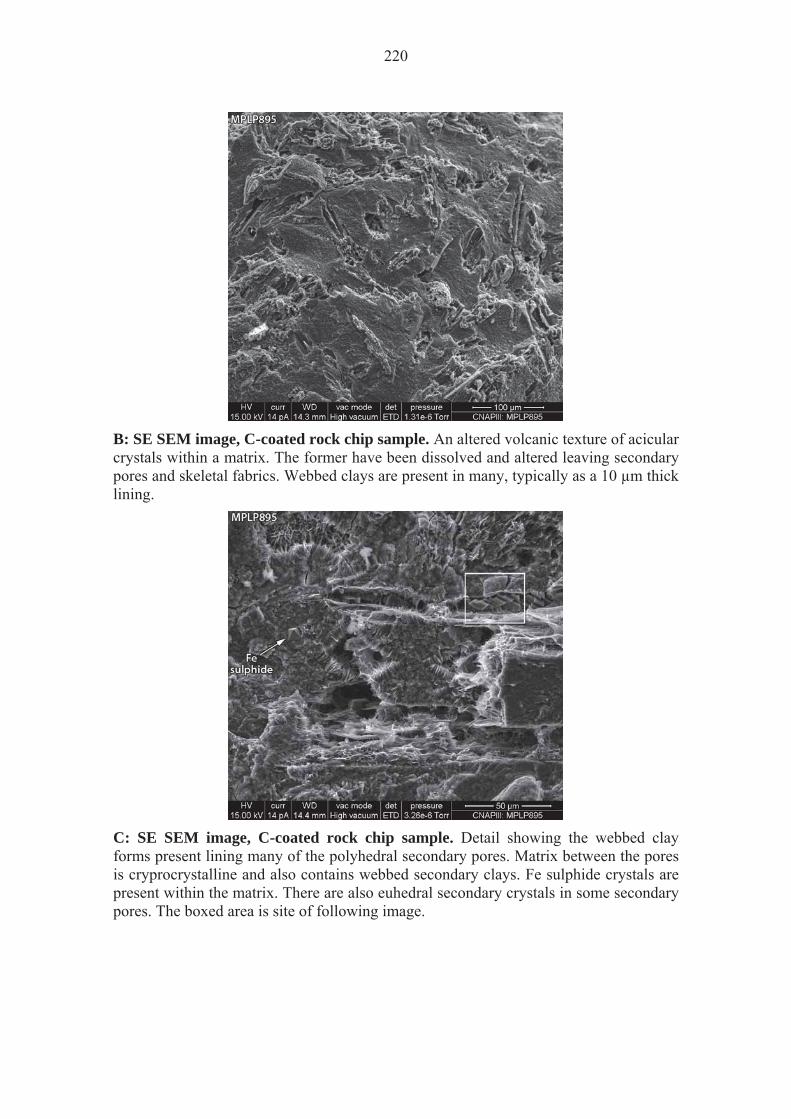
220
B: SE SEM image, C-coated rock chip sample. An altered volcanic texture of acicular crystals within a matrix. The former have been dissolved and altered leaving secondary pores and skeletal fabrics. Webbed clays are present in many, typically as a 10 μm thick lining.
C: SE SEM image, C-coated rock chip sample. Detail showing the webbed clay forms present lining many of the polyhedral secondary pores. Matrix between the pores is cryprocrystalline and also contains webbed secondary clays. Fe sulphide crystals are present within the matrix. There are also euhedral secondary crystals in some secondary pores. The boxed area is site of following image.
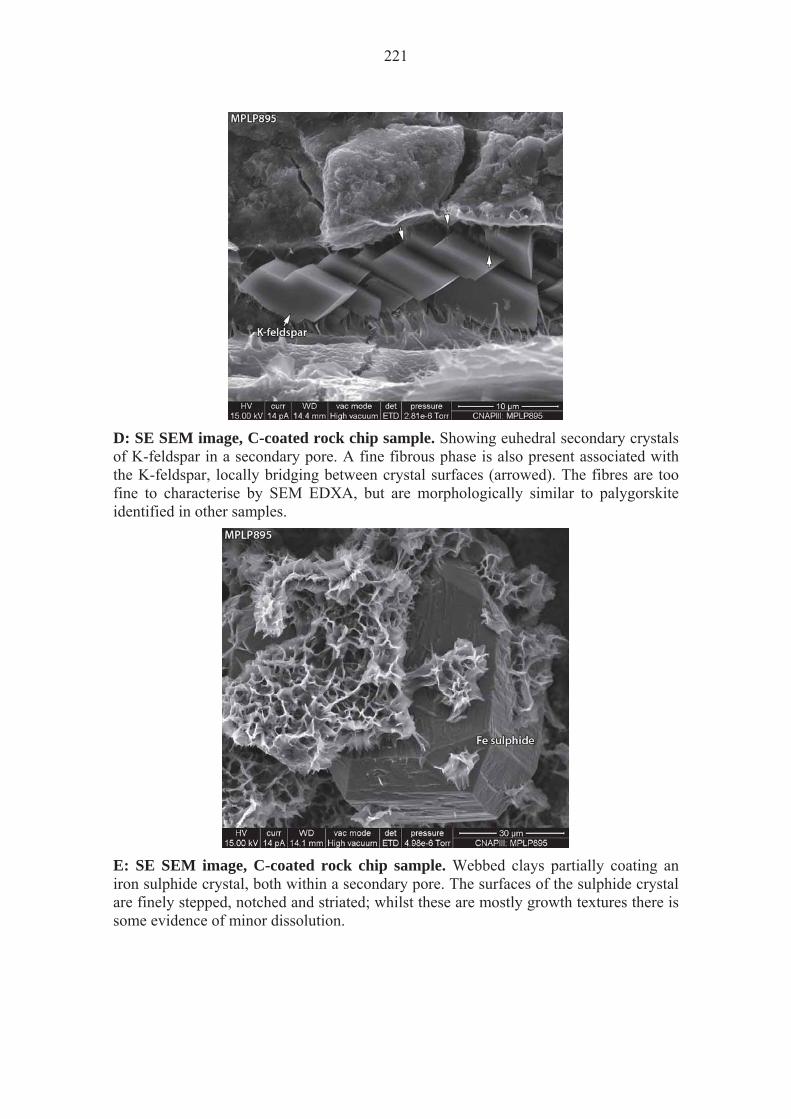
221
D: SE SEM image, C-coated rock chip sample. Showing euhedral secondary crystals of K-feldspar in a secondary pore. A fine fibrous phase is also present associated with the K-feldspar, locally bridging between crystal surfaces (arrowed). The fibres are too fine to characterise by SEM EDXA, but are morphologically similar to palygorskite identified in other samples.
E: SE SEM image, C-coated rock chip sample. Webbed clays partially coating an iron sulphide crystal, both within a secondary pore. The surfaces of the sulphide crystal are finely stepped, notched and striated; whilst these are mostly growth textures there is some evidence of minor dissolution.

222
F: SE SEM image, C-coated rock chip sample. A secondary pore lined by a mix of low relief webbed clays, zeolites and calcium carbonate (Ca carb.). The last two show no definitive relative timing relationships and may have formed contemporaneously. The clays pre-date the other phases, at least partially.

223
Sample Site: Parsata 4 Borehole Sample Depth: 21.0-21.4 m
BGS Sample ID: MPLP896 Preparation(s): Rock chip, PTS
Field Description: Cored section. Dark brown, massive clay with white to light pink secondary phases on (fracture?) faces and 0.5 cm nodules (vugs?). Sample moist on recovery.
Sample Description A: PTS The sample portions are mud-dominated sediment that contains widespread sand and silt grains that include probable limestone fragments that in turn contain peloids with clay-rich rims. There is evidence of aggrading neomorphism within the peloids and the formation of a euhedral and interlocking interparticle cement; these, however, are probably inherited pre-depositional textures. The clays of the mud-dominated sediment are of an Mg-rich aluminosilicate and locally display webbed edge morphologies that suggest secondary formation / alteration. Fine crystals of Fe sulphide are concentrated in the clay-rich sediment portions. Clay-rich surfaces with smoothed and striated appearances (B) are most likely microfractures; these are also thinly coated by webbed clays (C) and scattered crystals of calcium carbonate (B).

224
B: SE SEM image, C-coated rock chip sample. A smooth locally striated surface is most likely a fracture face. This has a sparce coating of secondary calcium carbonate (Ca carb). Boxed area is the site of the following image.
C: SE SEM image, C-coated rock chip sample. Detail of the fracture surface. It has a thin clay coating locally with webbed and bridging forms (arrowed). Some of these have a curled edge form that suggests some collapse may have occurred.

225
Sample Site: Parsata Trench 1 Sample No. (Depth): 5 (101.6 cm)
BGS Sample ID: MPLP899 Preparation(s): Rock chip, PTS
Field Description: Through going black clay.
Sample Description A: PTS A red mudstone with black stained fractures (A). The matrix is rich in clays (B), typically these have Mg-rich Al-silicate compositions with lesser Fe, and with an overall fairly granular appearance. Clays are typically ragged plates, most likely primary with secondary alteration fabrics in the form of webbed textures and wispy extensions (C, D). Detrital silt grains are present throughout, proportions varying with the strong bedding. These include quartz, micas and possible bioclasts (silica spicules). Some fractures run parallel to bedding and clays at fracture surfaces display smoothed and striated morphologies. Black stained fractures have high manganese contents, with the manganese-bearing constituent discernible as subhedral <5 μm crystals intermixed with the matrix constituents in the adjacent material (B, C). Fibrous content appears to be higher in fracture adjacent matrix, possibly more so where there is also black staining.
Aside from the clay alteration, the dominant secondary minerals are zeolites (C, D), of which several compositional types are present, including Na-Ca, Na-K and Na-Mg rich types. Some interlocking of zeolites suggests sequential formation, but relative timing relationships are rarely displayed such that no consistent sequence can be deduced. Zeolites have no compositional or spatial relationships with respect to the fractures. Fibrous and webbed clays are present on some zeolite surfaces (D).
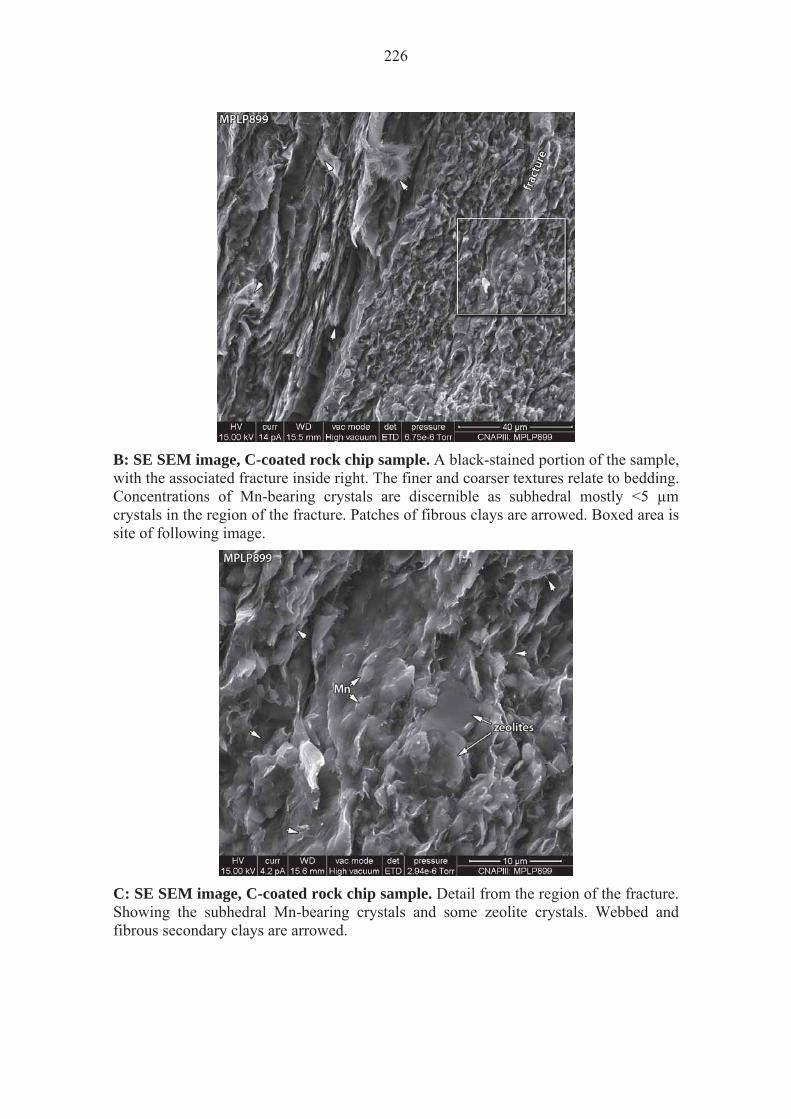
226
B: SE SEM image, C-coated rock chip sample. A black-stained portion of the sample, with the associated fracture inside right. The finer and coarser textures relate to bedding. Concentrations of Mn-bearing crystals are discernible as subhedral mostly <5 μm crystals in the region of the fracture. Patches of fibrous clays are arrowed. Boxed area is site of following image.
C: SE SEM image, C-coated rock chip sample. Detail from the region of the fracture. Showing the subhedral Mn-bearing crystals and some zeolite crystals. Webbed and fibrous secondary clays are arrowed.
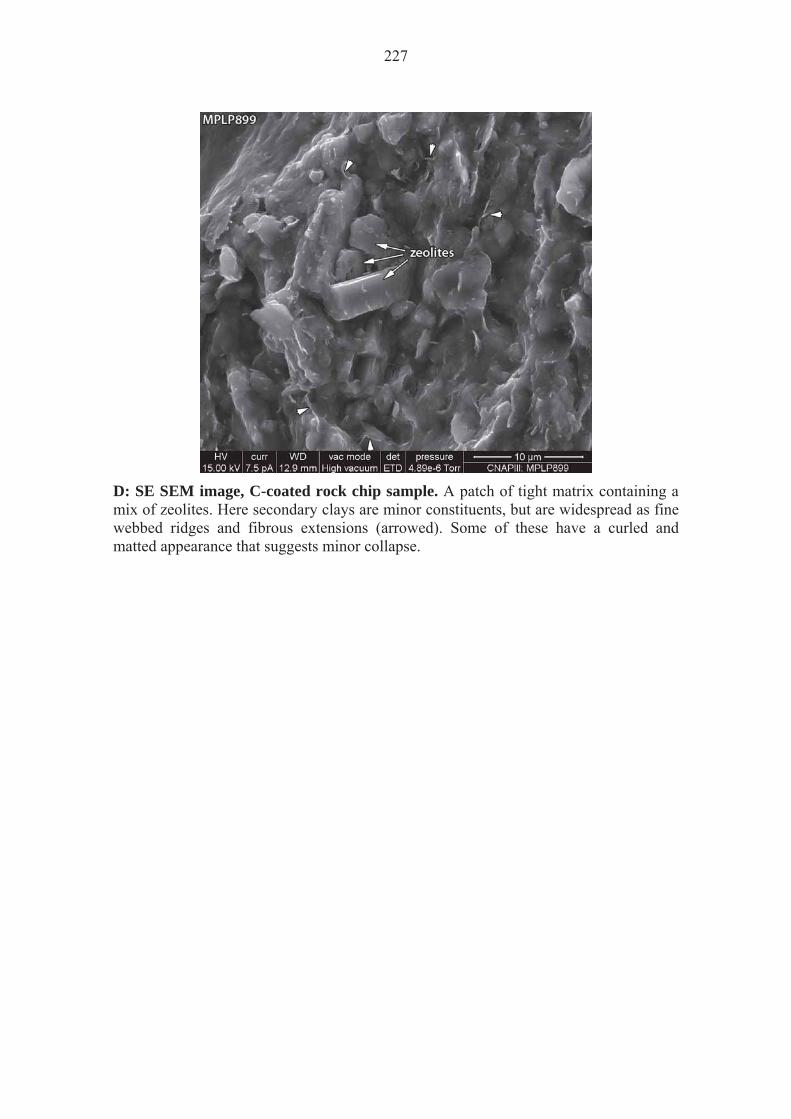
227
D: SE SEM image, C-coated rock chip sample. A patch of tight matrix containing a mix of zeolites. Here secondary clays are minor constituents, but are widespread as fine webbed ridges and fibrous extensions (arrowed). Some of these have a curled and matted appearance that suggests minor collapse.
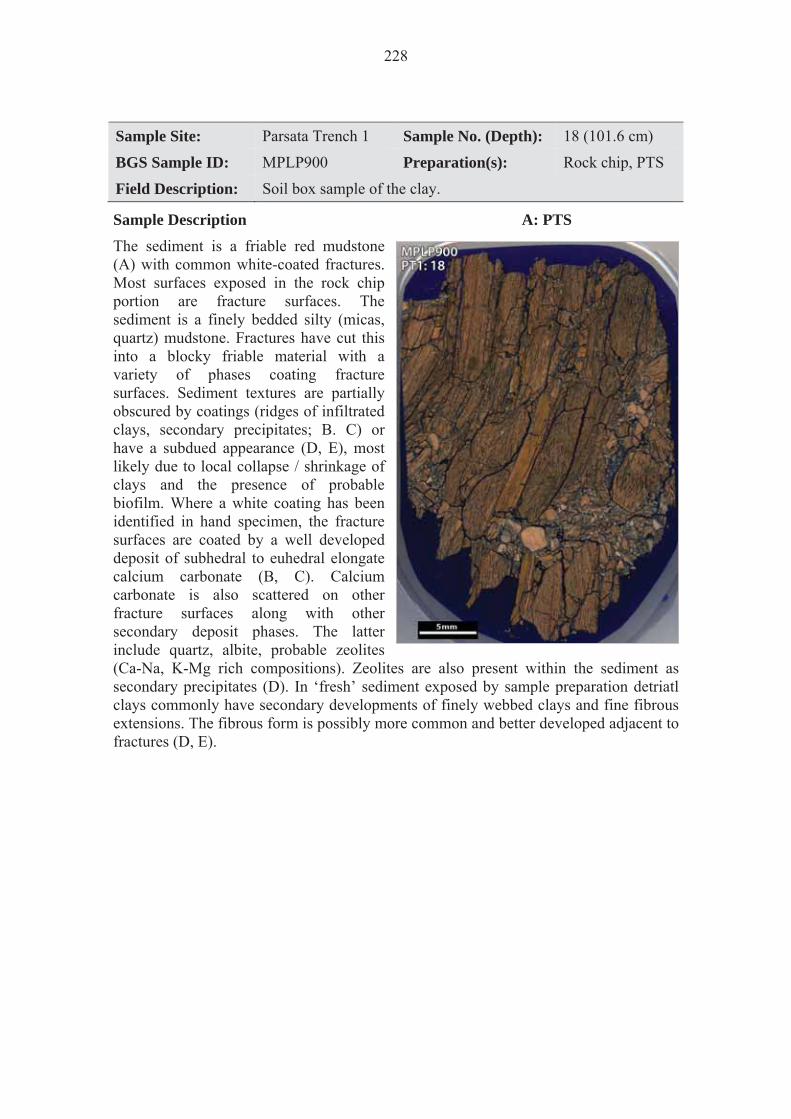
228
Sample Site: Parsata Trench 1 Sample No. (Depth): 18 (101.6 cm)
BGS Sample ID: MPLP900 Preparation(s): Rock chip, PTS
Field Description: Soil box sample of the clay.
Sample Description A: PTS The sediment is a friable red mudstone (A) with common white-coated fractures. Most surfaces exposed in the rock chip portion are fracture surfaces. The sediment is a finely bedded silty (micas, quartz) mudstone. Fractures have cut this into a blocky friable material with a variety of phases coating fracture surfaces. Sediment textures are partially obscured by coatings (ridges of infiltrated clays, secondary precipitates; B. C) or have a subdued appearance (D, E), most likely due to local collapse / shrinkage of clays and the presence of probable biofilm. Where a white coating has been identified in hand specimen, the fracture surfaces are coated by a well developed deposit of subhedral to euhedral elongate calcium carbonate (B, C). Calcium carbonate is also scattered on other fracture surfaces along with other secondary deposit phases. The latter include quartz, albite, probable zeolites (Ca-Na, K-Mg rich compositions). Zeolites are also present within the sediment as secondary precipitates (D). In ‘fresh’ sediment exposed by sample preparation detriatl clays commonly have secondary developments of finely webbed clays and fine fibrous extensions. The fibrous form is possibly more common and better developed adjacent to fractures (D, E).
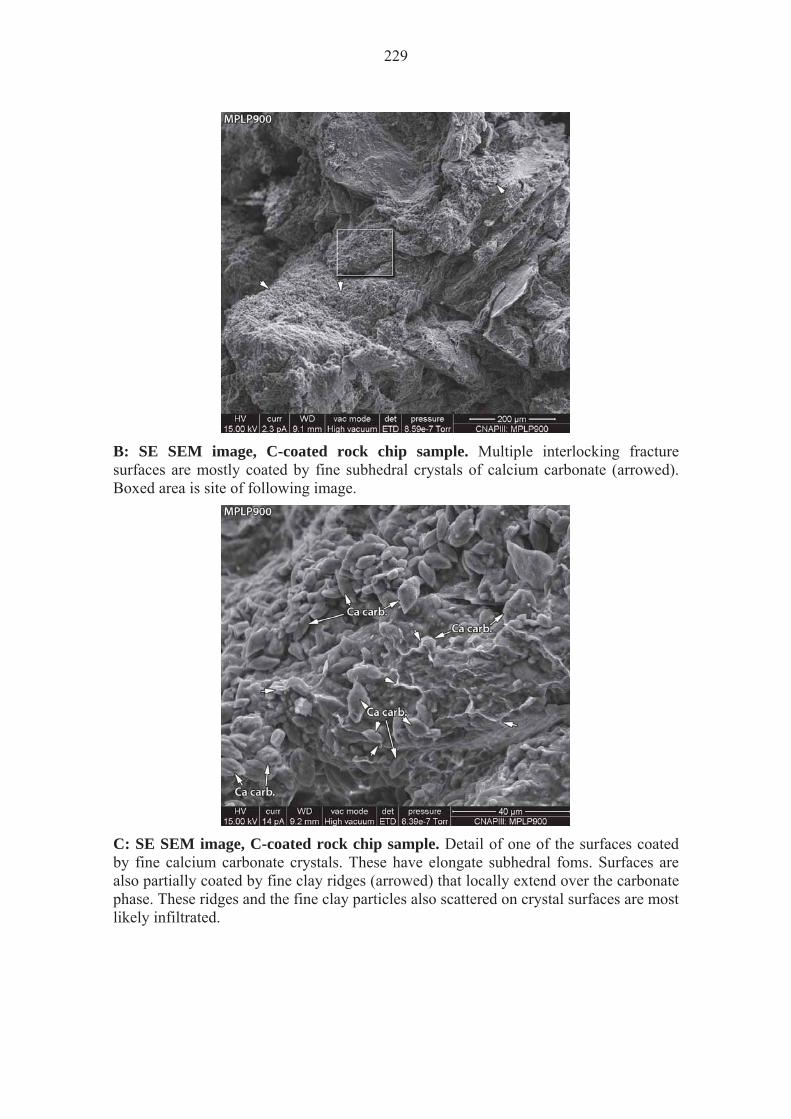
229
B: SE SEM image, C-coated rock chip sample. Multiple interlocking fracture surfaces are mostly coated by fine subhedral crystals of calcium carbonate (arrowed). Boxed area is site of following image.
C: SE SEM image, C-coated rock chip sample. Detail of one of the surfaces coated by fine calcium carbonate crystals. These have elongate subhedral foms. Surfaces are also partially coated by fine clay ridges (arrowed) that locally extend over the carbonate phase. These ridges and the fine clay particles also scattered on crystal surfaces are most likely infiltrated.
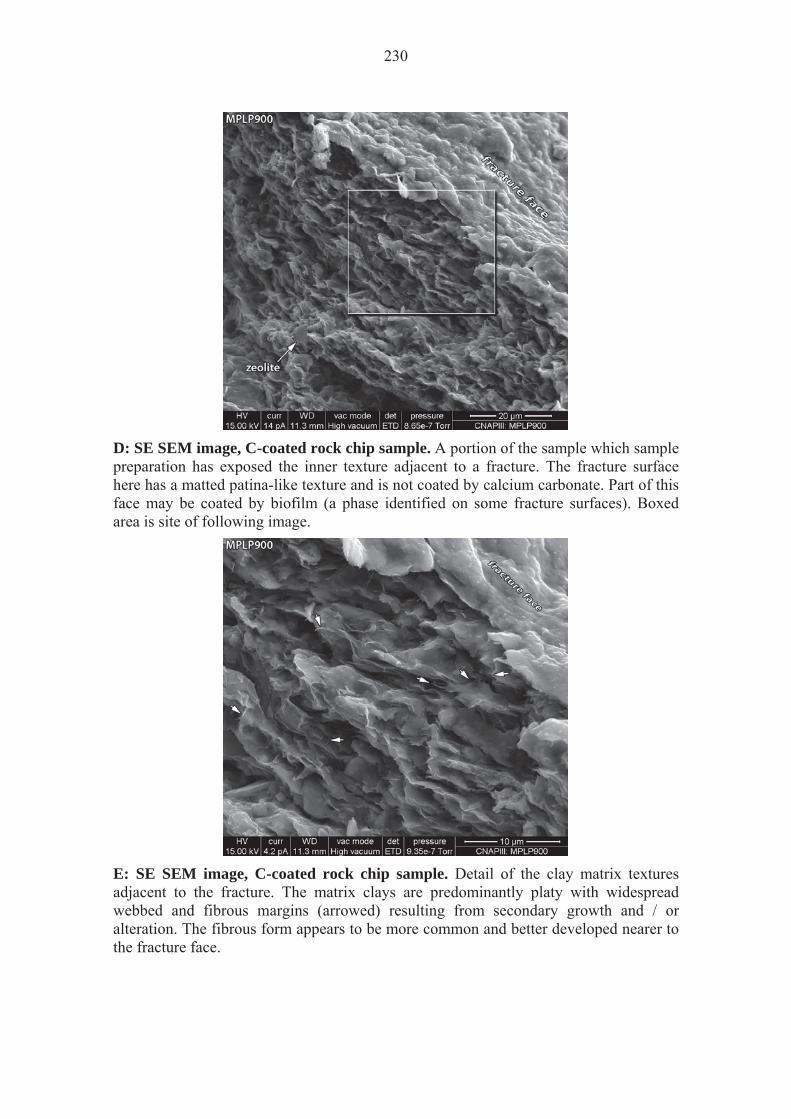
230
D: SE SEM image, C-coated rock chip sample. A portion of the sample which sample preparation has exposed the inner texture adjacent to a fracture. The fracture surface here has a matted patina-like texture and is not coated by calcium carbonate. Part of this face may be coated by biofilm (a phase identified on some fracture surfaces). Boxed area is site of following image.
E: SE SEM image, C-coated rock chip sample. Detail of the clay matrix textures adjacent to the fracture. The matrix clays are predominantly platy with widespread webbed and fibrous margins (arrowed) resulting from secondary growth and / or alteration. The fibrous form appears to be more common and better developed nearer to the fracture face.
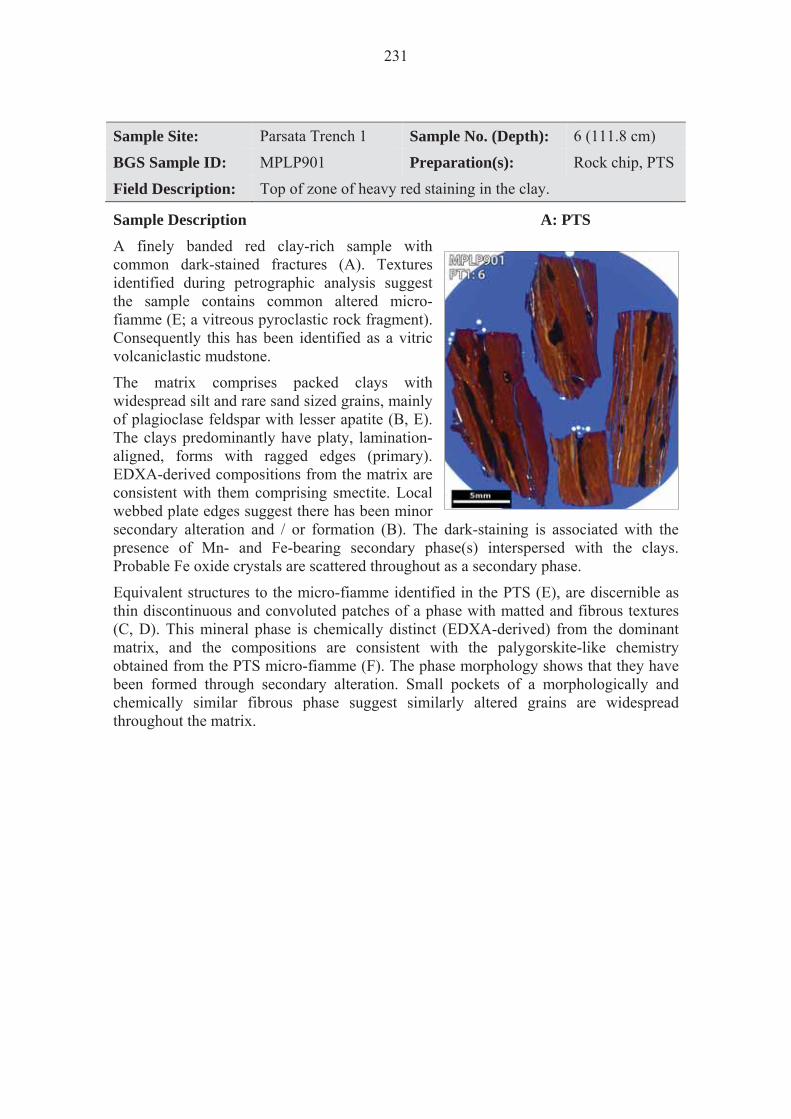
231
Sample Site: Parsata Trench 1 Sample No. (Depth): 6 (111.8 cm)
BGS Sample ID: MPLP901 Preparation(s): Rock chip, PTS
Field Description: Top of zone of heavy red staining in the clay.
Sample Description A: PTS A finely banded red clay-rich sample with common dark-stained fractures (A). Textures identified during petrographic analysis suggest the sample contains common altered micro-fiamme (E; a vitreous pyroclastic rock fragment). Consequently this has been identified as a vitric volcaniclastic mudstone.
The matrix comprises packed clays with widespread silt and rare sand sized grains, mainly of plagioclase feldspar with lesser apatite (B, E). The clays predominantly have platy, lamination-aligned, forms with ragged edges (primary). EDXA-derived compositions from the matrix are consistent with them comprising smectite. Local webbed plate edges suggest there has been minor secondary alteration and / or formation (B). The dark-staining is associated with the presence of Mn- and Fe-bearing secondary phase(s) interspersed with the clays. Probable Fe oxide crystals are scattered throughout as a secondary phase.
Equivalent structures to the micro-fiamme identified in the PTS (E), are discernible as thin discontinuous and convoluted patches of a phase with matted and fibrous textures (C, D). This mineral phase is chemically distinct (EDXA-derived) from the dominant matrix, and the compositions are consistent with the palygorskite-like chemistry obtained from the PTS micro-fiamme (F). The phase morphology shows that they have been formed through secondary alteration. Small pockets of a morphologically and chemically similar fibrous phase suggest similarly altered grains are widespread throughout the matrix.
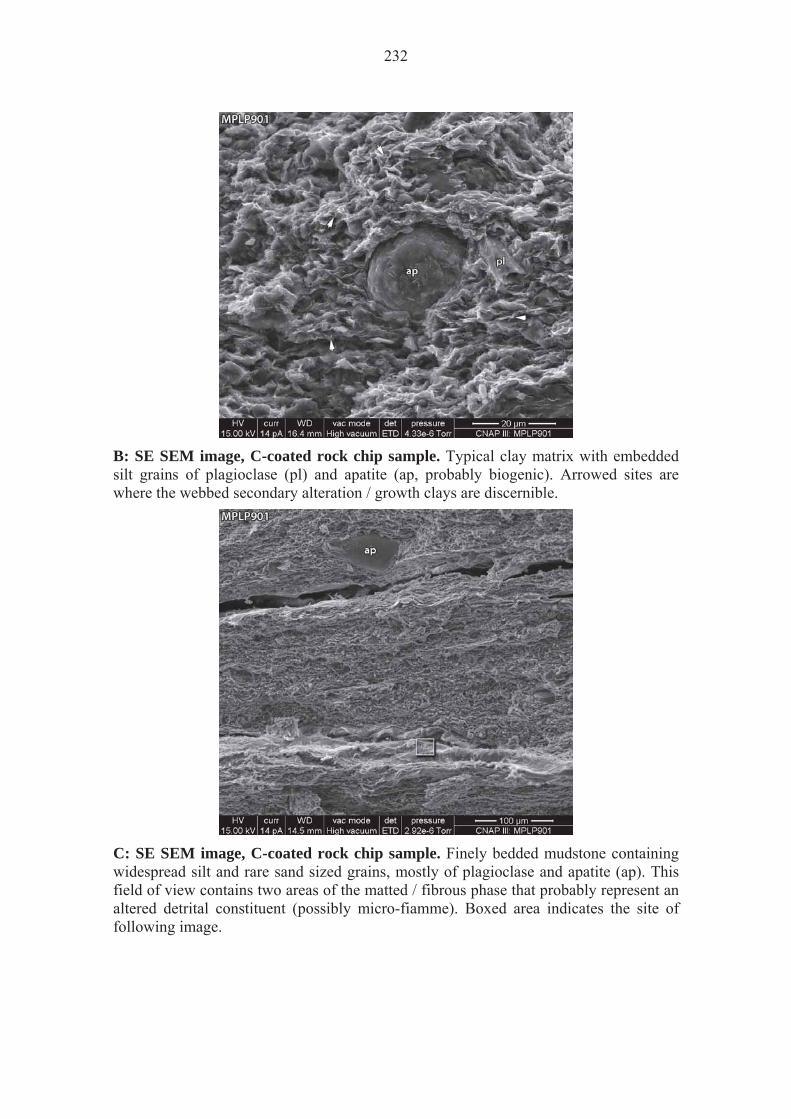
232
B: SE SEM image, C-coated rock chip sample. Typical clay matrix with embedded silt grains of plagioclase (pl) and apatite (ap, probably biogenic). Arrowed sites are where the webbed secondary alteration / growth clays are discernible.
C: SE SEM image, C-coated rock chip sample. Finely bedded mudstone containing widespread silt and rare sand sized grains, mostly of plagioclase and apatite (ap). This field of view contains two areas of the matted / fibrous phase that probably represent an altered detrital constituent (possibly micro-fiamme). Boxed area indicates the site of following image.

233
D: SE SEM image, C-coated rock chip sample. Detail of the matted / fibrous clay phase, possibly palygorskite. The upstanding fibrous constituent is secondary. Ribbons and fibrous forms are also identifiable in the structure of the matted surfaces, suggesting that all of the material is the same phase.
E: BSE SEM image, C-coated PTS. Showing sinuous and contorted forms (micro-fiamme), resolved by brightness variation. These have a similar EDXA-derived composition to that of the matted / fibrous phase identified in the rock chip sample (see below). Silt and sand sized grains are mostly of plagioclase (pl) and apatite (ap).

234
F: EDXA spectrum from the site identified in E. This gives a composition consistent with an iron-bearing palygorskite. Similar spectra were obtained from the fibrous alteration products shown in C and D.

235
Sample Site: Parsata Trench 1 Sample No. (Depth): 11 (111.8 cm)
BGS Sample ID: MPLP962 Preparation(s): Rock chip, PTS
Field Description: Green ‘vein’ at the base of the clay..
Sample Description A: PTS In both the rock chip and PTS samples the dominant texture is of polyhedral skeletal grains and secondary pores in a massive to locally turbid matrix (A-E). The polyhedral forms, particularly notable in the PTS (E), have crystal outlines, suggesting that this sample is an altered crystal tuff.
The turbid webbed forms of the matrix clays (D) are indicative of an entirely secondary origin for the constituent clays. The secondary pores are typically thinly lined by webbed (D), matted (C) and / or fibrous clays (D). Chemically (compositions derived from EDXA), differences between these various constituents are minor, with matrix clays being Mg-based Al-silicate with minor Na, and traces of K, Ca and Fe, secondary pore-lining clays perhaps containing less K, and grain remnants less K still. Locally K is not detectable in the matrix either. The matrix is a very pure clay, showing varied degrees of ragged and webbed morphologies, suggesting varied degrees of further secondary development. Quartz is a rare secondary mineral.

236
B: SE SEM image, C-coated rock chip sample. The massive matrix contains scattered secondary pores and skeletal grain remnants typically with elongate, polyhedral forms. The boxed area is the site of the following image.
C: SE SEM image, C-coated rock chip sample. Skeletal crystal remnant actually comprises matted and webbed clay minerals. The matrix has a massive turbid texture.
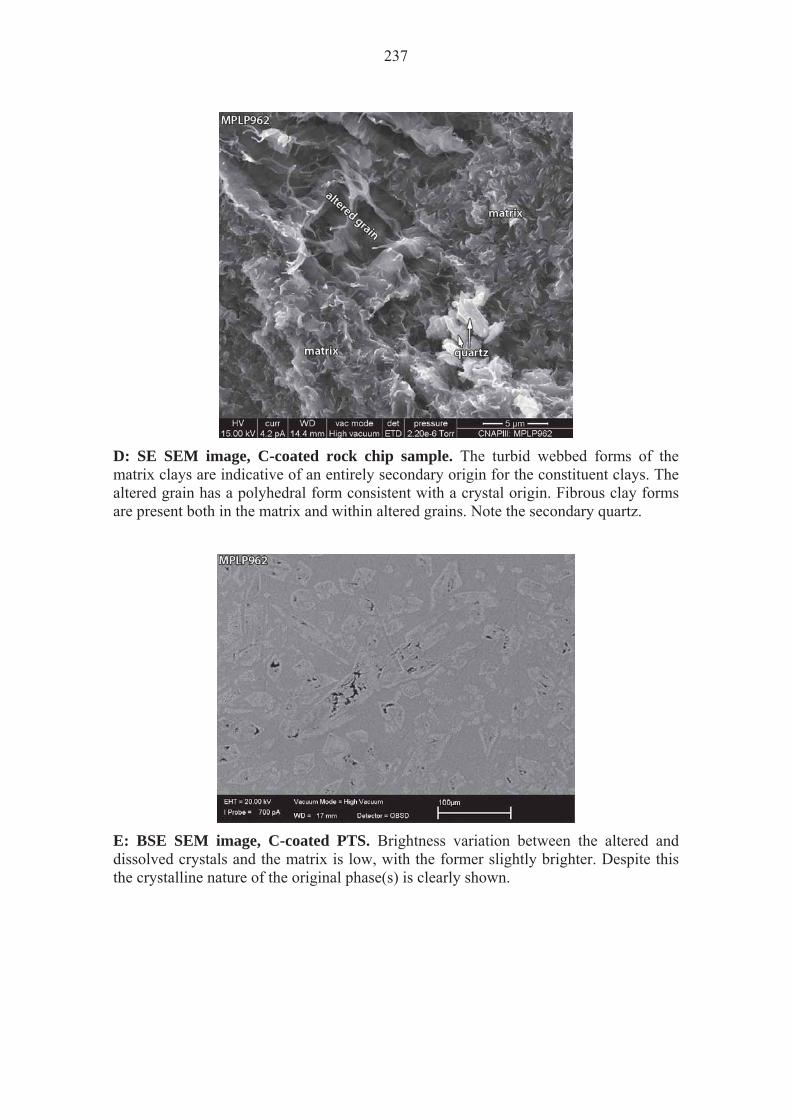
237
D: SE SEM image, C-coated rock chip sample. The turbid webbed forms of the matrix clays are indicative of an entirely secondary origin for the constituent clays. The altered grain has a polyhedral form consistent with a crystal origin. Fibrous clay forms are present both in the matrix and within altered grains. Note the secondary quartz.
E: BSE SEM image, C-coated PTS. Brightness variation between the altered and dissolved crystals and the matrix is low, with the former slightly brighter. Despite this the crystalline nature of the original phase(s) is clearly shown.
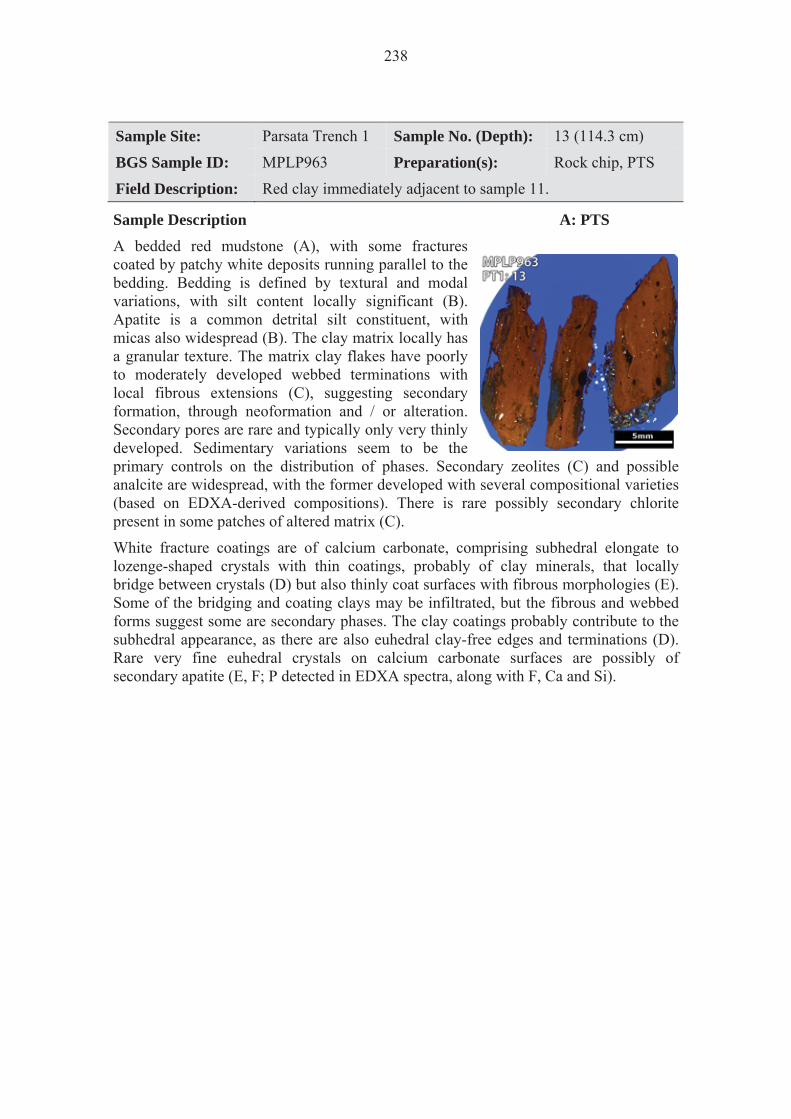
238
Sample Site: Parsata Trench 1 Sample No. (Depth): 13 (114.3 cm)
BGS Sample ID: MPLP963 Preparation(s): Rock chip, PTS
Field Description: Red clay immediately adjacent to sample 11.
Sample Description A: PTS A bedded red mudstone (A), with some fractures coated by patchy white deposits running parallel to the bedding. Bedding is defined by textural and modal variations, with silt content locally significant (B). Apatite is a common detrital silt constituent, with micas also widespread (B). The clay matrix locally has a granular texture. The matrix clay flakes have poorly to moderately developed webbed terminations with local fibrous extensions (C), suggesting secondary formation, through neoformation and / or alteration. Secondary pores are rare and typically only very thinly developed. Sedimentary variations seem to be the primary controls on the distribution of phases. Secondary zeolites (C) and possible analcite are widespread, with the former developed with several compositional varieties (based on EDXA-derived compositions). There is rare possibly secondary chlorite present in some patches of altered matrix (C).
White fracture coatings are of calcium carbonate, comprising subhedral elongate to lozenge-shaped crystals with thin coatings, probably of clay minerals, that locally bridge between crystals (D) but also thinly coat surfaces with fibrous morphologies (E). Some of the bridging and coating clays may be infiltrated, but the fibrous and webbed forms suggest some are secondary phases. The clay coatings probably contribute to the subhedral appearance, as there are also euhedral clay-free edges and terminations (D). Rare very fine euhedral crystals on calcium carbonate surfaces are possibly of secondary apatite (E, F; P detected in EDXA spectra, along with F, Ca and Si).
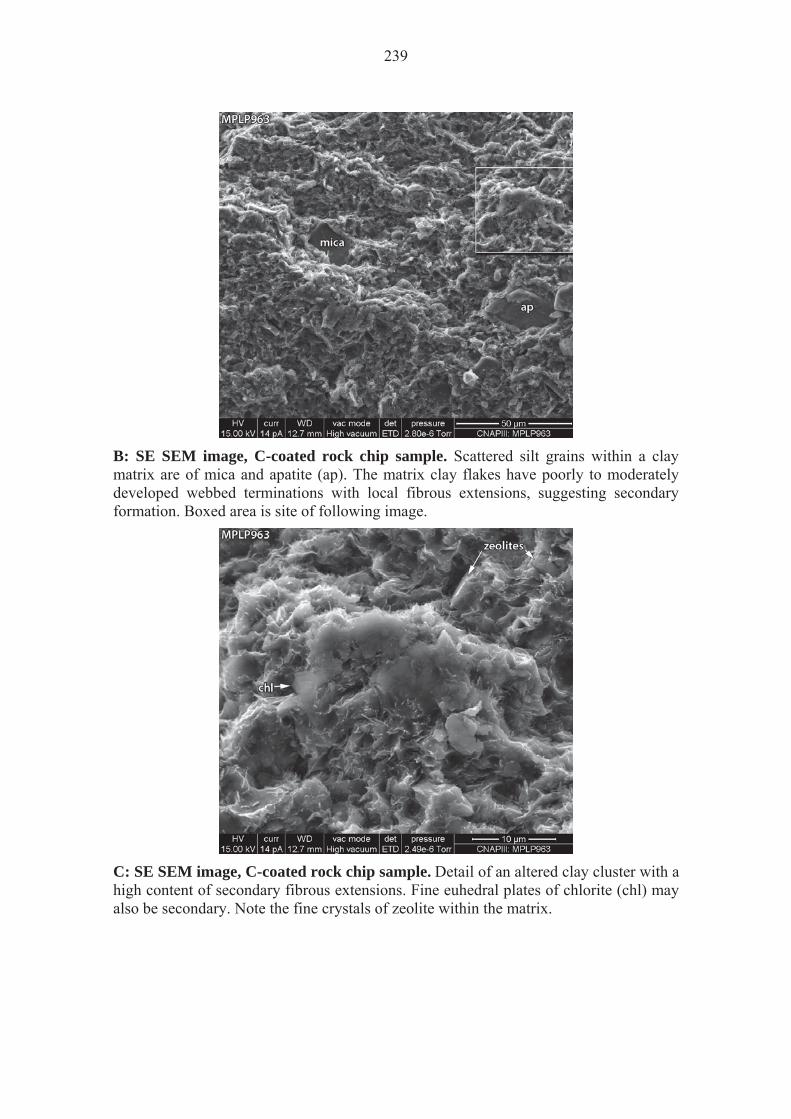
239
B: SE SEM image, C-coated rock chip sample. Scattered silt grains within a clay matrix are of mica and apatite (ap). The matrix clay flakes have poorly to moderately developed webbed terminations with local fibrous extensions, suggesting secondary formation. Boxed area is site of following image.
C: SE SEM image, C-coated rock chip sample. Detail of an altered clay cluster with a high content of secondary fibrous extensions. Fine euhedral plates of chlorite (chl) may also be secondary. Note the fine crystals of zeolite within the matrix.
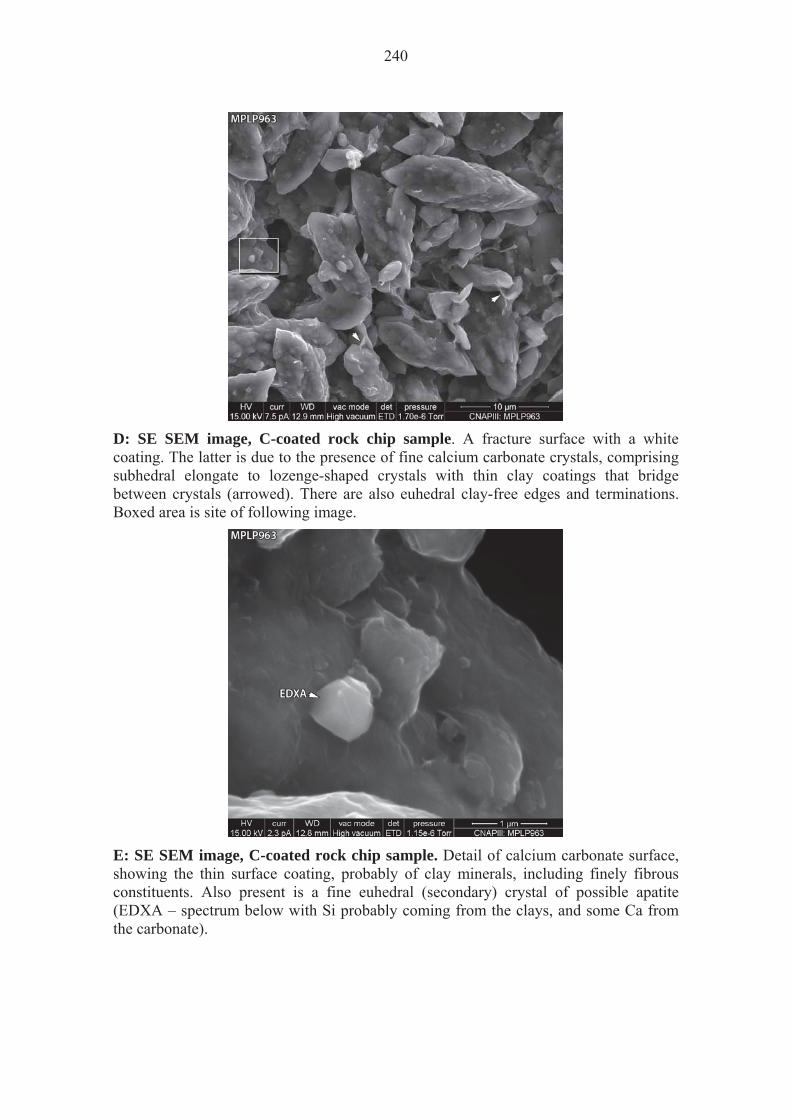
240
D: SE SEM image, C-coated rock chip sample. A fracture surface with a white coating. The latter is due to the presence of fine calcium carbonate crystals, comprising subhedral elongate to lozenge-shaped crystals with thin clay coatings that bridge between crystals (arrowed). There are also euhedral clay-free edges and terminations. Boxed area is site of following image.
E: SE SEM image, C-coated rock chip sample. Detail of calcium carbonate surface, showing the thin surface coating, probably of clay minerals, including finely fibrous constituents. Also present is a fine euhedral (secondary) crystal of possible apatite (EDXA – spectrum below with Si probably coming from the clays, and some Ca from the carbonate).

241
F: EDXA spectrum, C-coated rock chip sample. Spectrum from the euhedral crystal in E.

242
Sample Site: Parsata Trench 1 Sample No. (Depth): 14 (127.0 cm)
BGS Sample ID: MPLP964 Preparation(s): Rock chip
Field Description: Green material right at the top of the pillow lava.
Sample Description A: Rock chip The sample has two textures; one where the colour is a dense green and another which is more friable and brecciated (A).
The dense green portion has a massive clay matrix with common polyhedral altered and skeletal grains, and secondary pores (B). This sample texture is similar to that of sample 11 (MPLP962). This portion of the sample is therefore most likely an altered crystal tuff. As with sample 11, the turbid webbed forms of the matrix clays (D) are indicative of an entirely secondary origin for the constituent clays Altered and dissolved grain margins commonly display radial textures (B, D). Intraparticle pores are lined and bridged by webbed to stringy secondary clays (D). Zoned radial and parallel textures in some altered grains may be representations of twinned precursor crystal textures (C). Webbed clays are also present coating altered grains, possibly from a later stage of alteration. Compositionally (EDXA derived) the various constituents are similar. Trace K is detectable in the matrix and radial / parallel margins, but is absent in the pore lining / bridging clays. No zeolites were detected.
The brecciated sample portion is a silty mudstone. Many grains are altered to secondary clays with similar compositions (EDXA derived) to that of the matrix of the dense green sample portion, although there are also identifiable mineral fragments present (e.g. albite, quartz). Ridges of infiltrated clays are widespread on brecciated fragment surfaces, as are calcium carbonate crystals (E, F). The latter are typically subhedral elongate crystals and locally partially coated by thin webbed and fibrous phases (E), most likely secondary clays. Cluster of secondary fibrous forms are also found on these walls (F). Detrital albite grains have some overgrowth development. Possible analcite and a Na-Ca based zeolite are minor secondary constituents.

243
B: SE SEM image, C-coated rock chip sample. Widespread polyhedral altered and skeletal grains, and secondary pores, suggest the sample is an altered crystal tuff. Boxed area is the site of the following image.
C: SE SEM image, C-coated rock chip sample. Detail from B of an altered grain, showing zoned radial and parallel textures in the secondary clays. The zoning may be a representation of twinned precursor crystal textures.
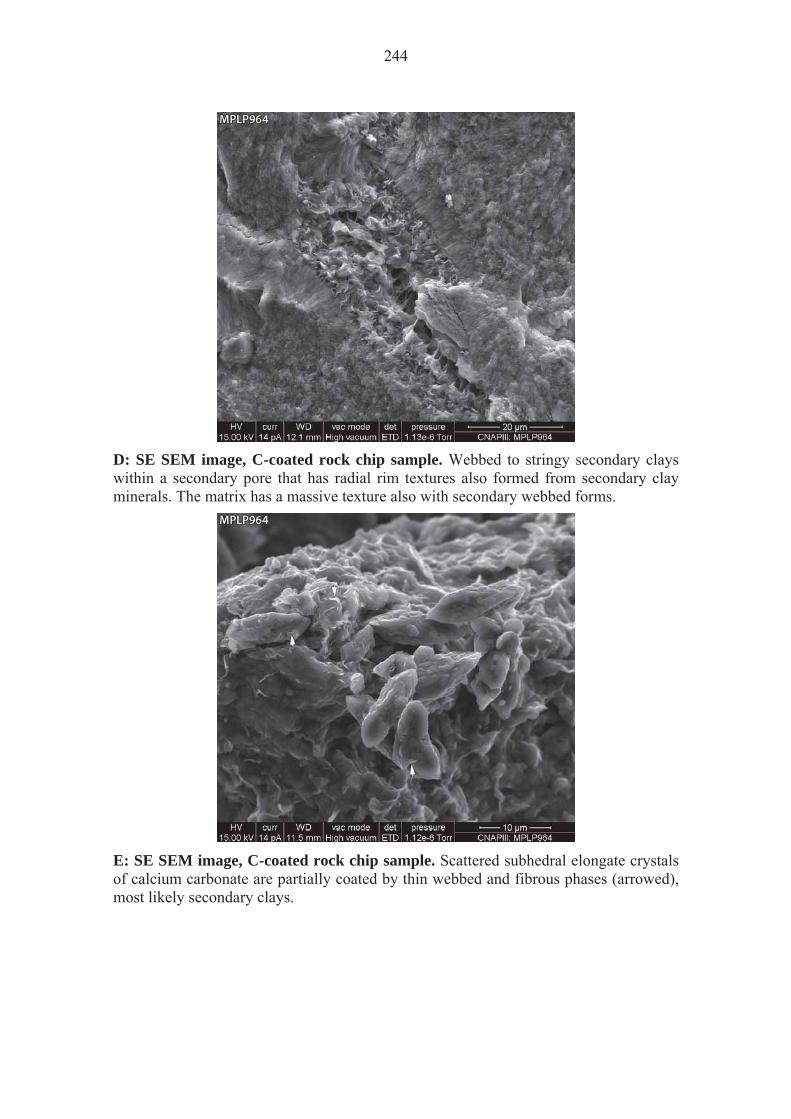
244
D: SE SEM image, C-coated rock chip sample. Webbed to stringy secondary clays within a secondary pore that has radial rim textures also formed from secondary clay minerals. The matrix has a massive texture also with secondary webbed forms.
E: SE SEM image, C-coated rock chip sample. Scattered subhedral elongate crystals of calcium carbonate are partially coated by thin webbed and fibrous phases (arrowed), most likely secondary clays.
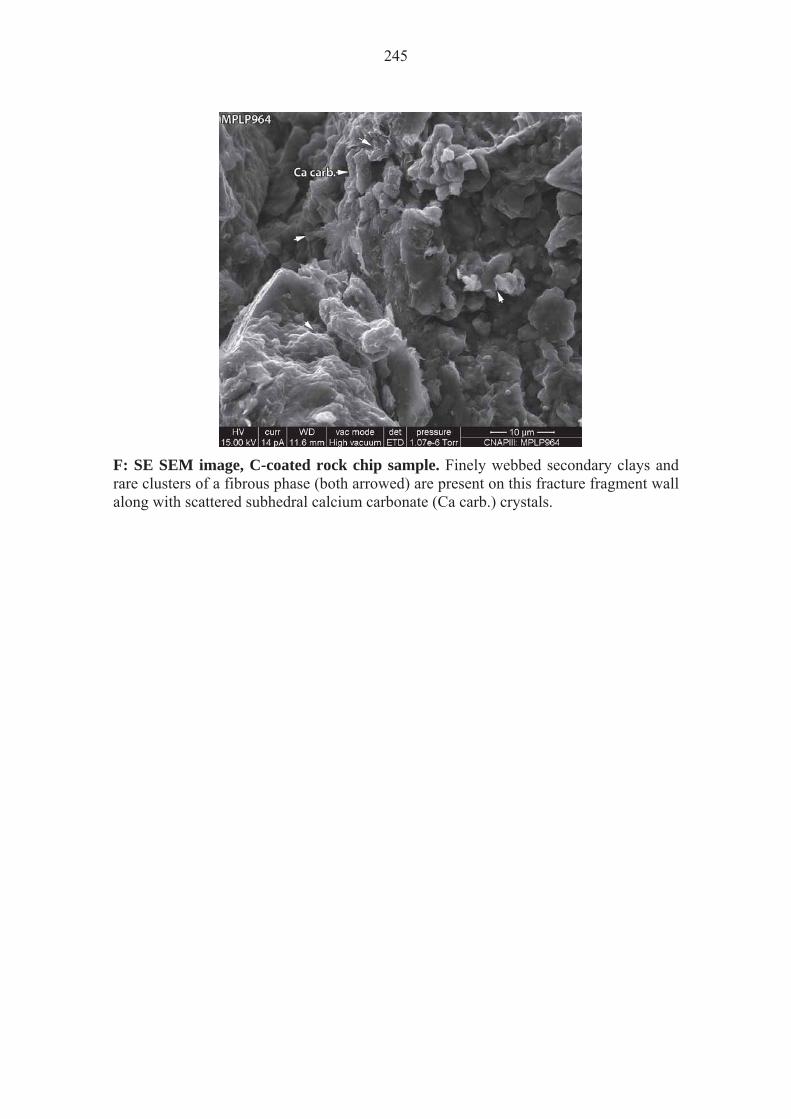
245
F: SE SEM image, C-coated rock chip sample. Finely webbed secondary clays and rare clusters of a fibrous phase (both arrowed) are present on this fracture fragment wall along with scattered subhedral calcium carbonate (Ca carb.) crystals.

246
Sample Site: Parsata Trench 1 Sample No. (Depth): 15 (127.0 cm)
BGS Sample ID: MPLP965 Preparation(s): Rock chip, PTS
Field Description: Red clay immediately adjacent to sample 14.
Sample Description A: PTS A friable, brecciated red mudstone (A). Many fragments have fracture surfaces. These are locally coated by fine subhedral calcium carbonate crystals (C), possibly partially dissolved. The clay matrix comprises ragged platy clays with secondary developments indicated by common webbed margins and local wispy extensions (B, C). Fibrous extensions are possibly associated with an enriched Mg content (EDXA analyses from rock chip sample). Similar webbed clays are also present on some fracture surfaces and appear to have formed around and partially coating some of the calcium carbonate (C). Local curled clay edges suggest some shrinkage (B); it is not possible to determine if this is a post-or pre-sampling texture.
Other secondary minerals are zeolites, possible K-feldspar (both B) and silica (possibly microquartz crystals). The zeolites are mostly Na-Ca compositional types and are dispersed through the matrix.

247
B: SE SEM image, C-coated rock chip sample. Showing the widespread evidence of secondary clay developments in the form of ridged and bridging webbed forms, there are local curled edges suggesting minor collapse. Other secondary phases include zeolite and possible K-feldspar.
C: SE SEM image, C-coated rock chip sample. Widespread webbed ridges of secondary clay are common in this area of matrix adjacent to a calcium carbonate (Ca carb.) coated surface. Some webbed clays coat the calcium carbonate. There are common fibrous forms extending from clay margins (arrowed).
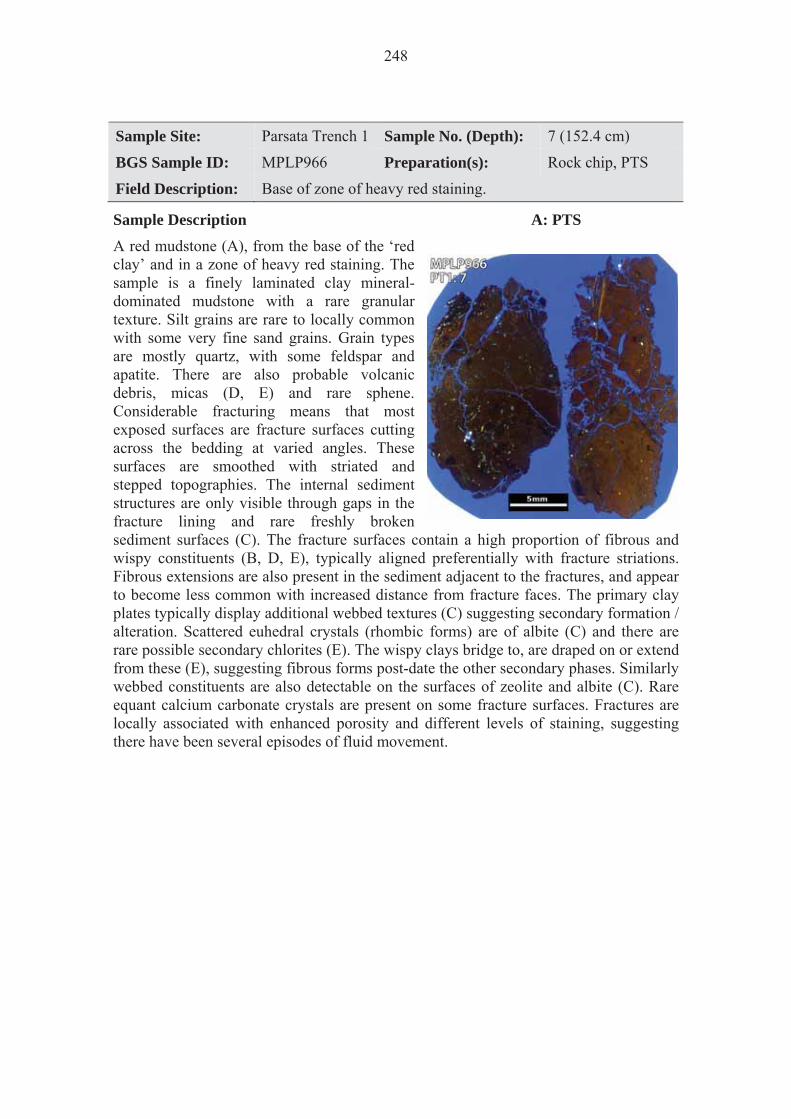
248
Sample Site: Parsata Trench 1 Sample No. (Depth): 7 (152.4 cm)
BGS Sample ID: MPLP966 Preparation(s): Rock chip, PTS
Field Description: Base of zone of heavy red staining.
Sample Description A: PTS A red mudstone (A), from the base of the ‘red clay’ and in a zone of heavy red staining. The sample is a finely laminated clay mineral-dominated mudstone with a rare granular texture. Silt grains are rare to locally common with some very fine sand grains. Grain types are mostly quartz, with some feldspar and apatite. There are also probable volcanic debris, micas (D, E) and rare sphene. Considerable fracturing means that most exposed surfaces are fracture surfaces cutting across the bedding at varied angles. These surfaces are smoothed with striated and stepped topographies. The internal sediment structures are only visible through gaps in the fracture lining and rare freshly broken sediment surfaces (C). The fracture surfaces contain a high proportion of fibrous and wispy constituents (B, D, E), typically aligned preferentially with fracture striations. Fibrous extensions are also present in the sediment adjacent to the fractures, and appear to become less common with increased distance from fracture faces. The primary clay plates typically display additional webbed textures (C) suggesting secondary formation / alteration. Scattered euhedral crystals (rhombic forms) are of albite (C) and there are rare possible secondary chlorites (E). The wispy clays bridge to, are draped on or extend from these (E), suggesting fibrous forms post-date the other secondary phases. Similarly webbed constituents are also detectable on the surfaces of zeolite and albite (C). Rare equant calcium carbonate crystals are present on some fracture surfaces. Fractures are locally associated with enhanced porosity and different levels of staining, suggesting there have been several episodes of fluid movement.
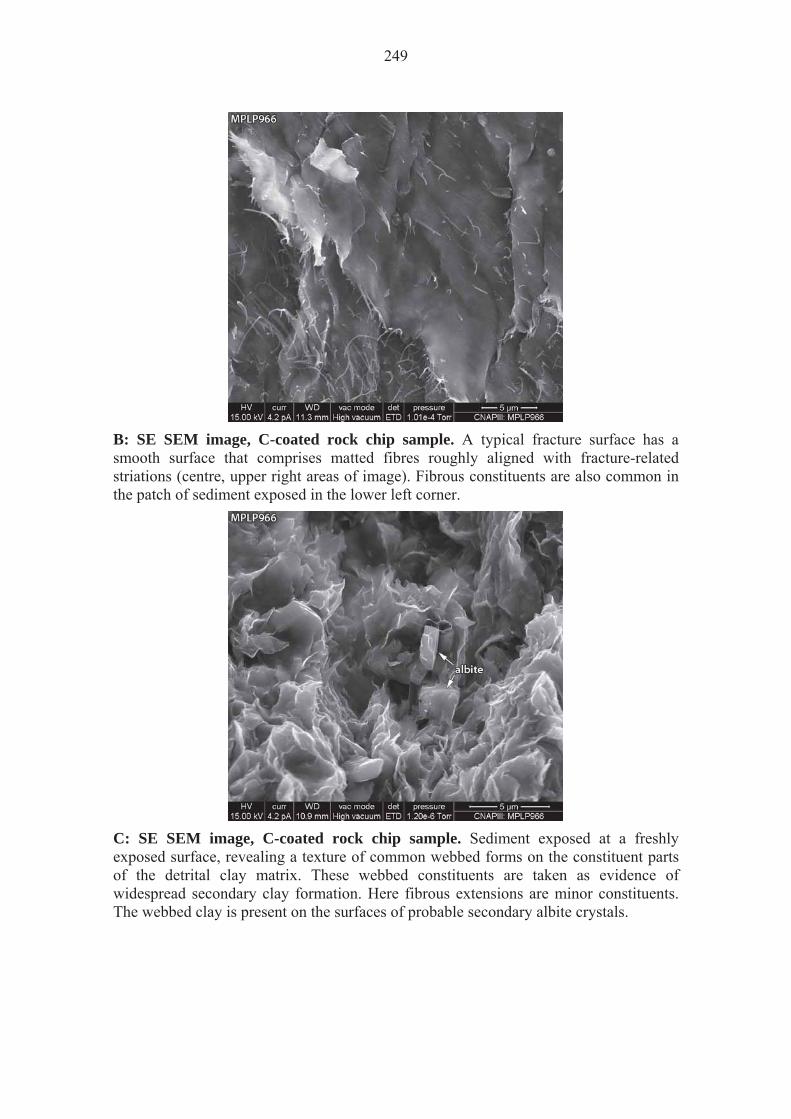
249
B: SE SEM image, C-coated rock chip sample. A typical fracture surface has a smooth surface that comprises matted fibres roughly aligned with fracture-related striations (centre, upper right areas of image). Fibrous constituents are also common in the patch of sediment exposed in the lower left corner.
C: SE SEM image, C-coated rock chip sample. Sediment exposed at a freshly exposed surface, revealing a texture of common webbed forms on the constituent parts of the detrital clay matrix. These webbed constituents are taken as evidence of widespread secondary clay formation. Here fibrous extensions are minor constituents. The webbed clay is present on the surfaces of probable secondary albite crystals.
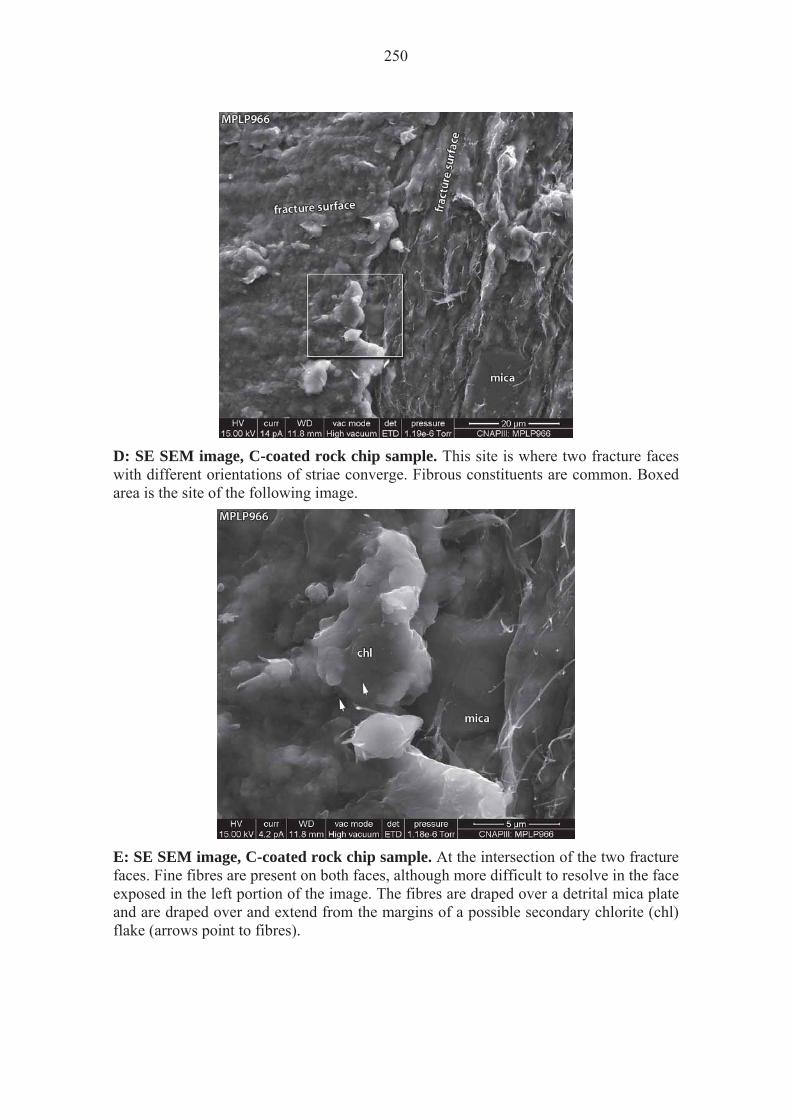
250
D: SE SEM image, C-coated rock chip sample. This site is where two fracture faces with different orientations of striae converge. Fibrous constituents are common. Boxed area is the site of the following image.
E: SE SEM image, C-coated rock chip sample. At the intersection of the two fracture faces. Fine fibres are present on both faces, although more difficult to resolve in the face exposed in the left portion of the image. The fibres are draped over a detrital mica plate and are draped over and extend from the margins of a possible secondary chlorite (chl) flake (arrows point to fibres).
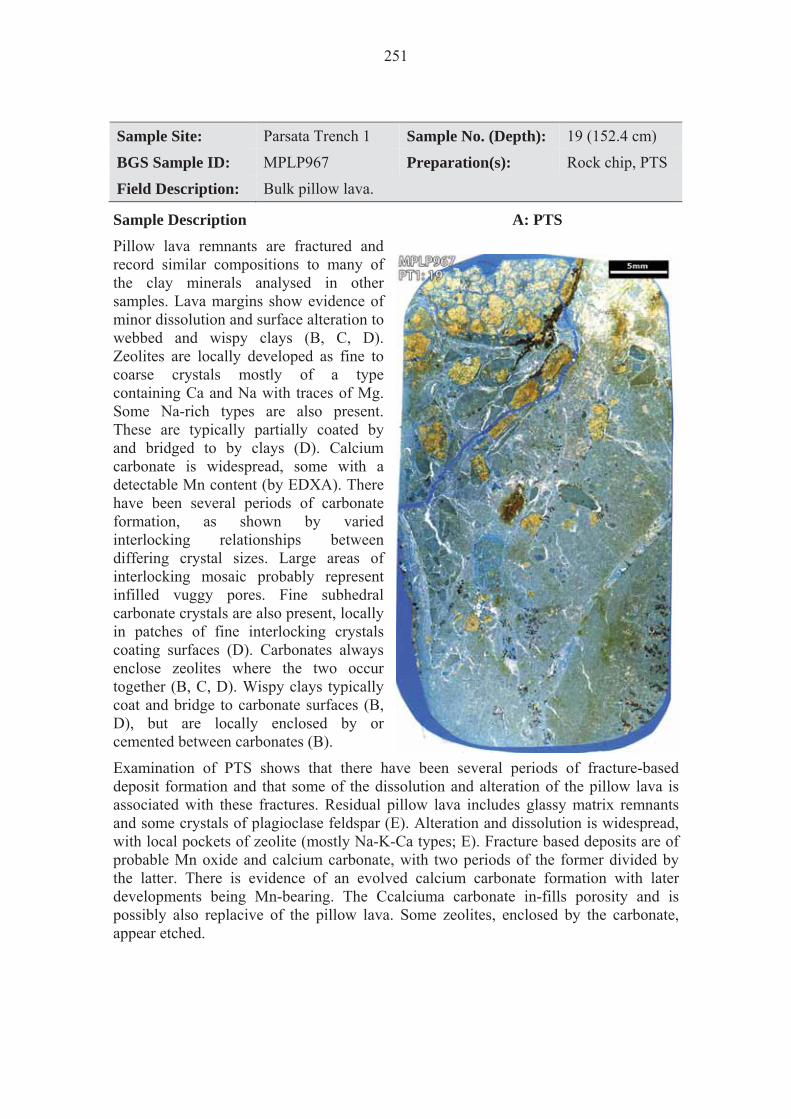
251
Sample Site: Parsata Trench 1 Sample No. (Depth): 19 (152.4 cm)
BGS Sample ID: MPLP967 Preparation(s): Rock chip, PTS
Field Description: Bulk pillow lava.
Sample Description A: PTS Pillow lava remnants are fractured and record similar compositions to many of the clay minerals analysed in other samples. Lava margins show evidence of minor dissolution and surface alteration to webbed and wispy clays (B, C, D). Zeolites are locally developed as fine to coarse crystals mostly of a type containing Ca and Na with traces of Mg. Some Na-rich types are also present. These are typically partially coated by and bridged to by clays (D). Calcium carbonate is widespread, some with a detectable Mn content (by EDXA). There have been several periods of carbonate formation, as shown by varied interlocking relationships between differing crystal sizes. Large areas of interlocking mosaic probably represent infilled vuggy pores. Fine subhedral carbonate crystals are also present, locally in patches of fine interlocking crystals coating surfaces (D). Carbonates always enclose zeolites where the two occur together (B, C, D). Wispy clays typically coat and bridge to carbonate surfaces (B, D), but are locally enclosed by or cemented between carbonates (B).
Examination of PTS shows that there have been several periods of fracture-based deposit formation and that some of the dissolution and alteration of the pillow lava is associated with these fractures. Residual pillow lava includes glassy matrix remnants and some crystals of plagioclase feldspar (E). Alteration and dissolution is widespread, with local pockets of zeolite (mostly Na-K-Ca types; E). Fracture based deposits are of probable Mn oxide and calcium carbonate, with two periods of the former divided by the latter. There is evidence of an evolved calcium carbonate formation with later developments being Mn-bearing. The Ccalciuma carbonate in-fills porosity and is possibly also replacive of the pillow lava. Some zeolites, enclosed by the carbonate, appear etched.
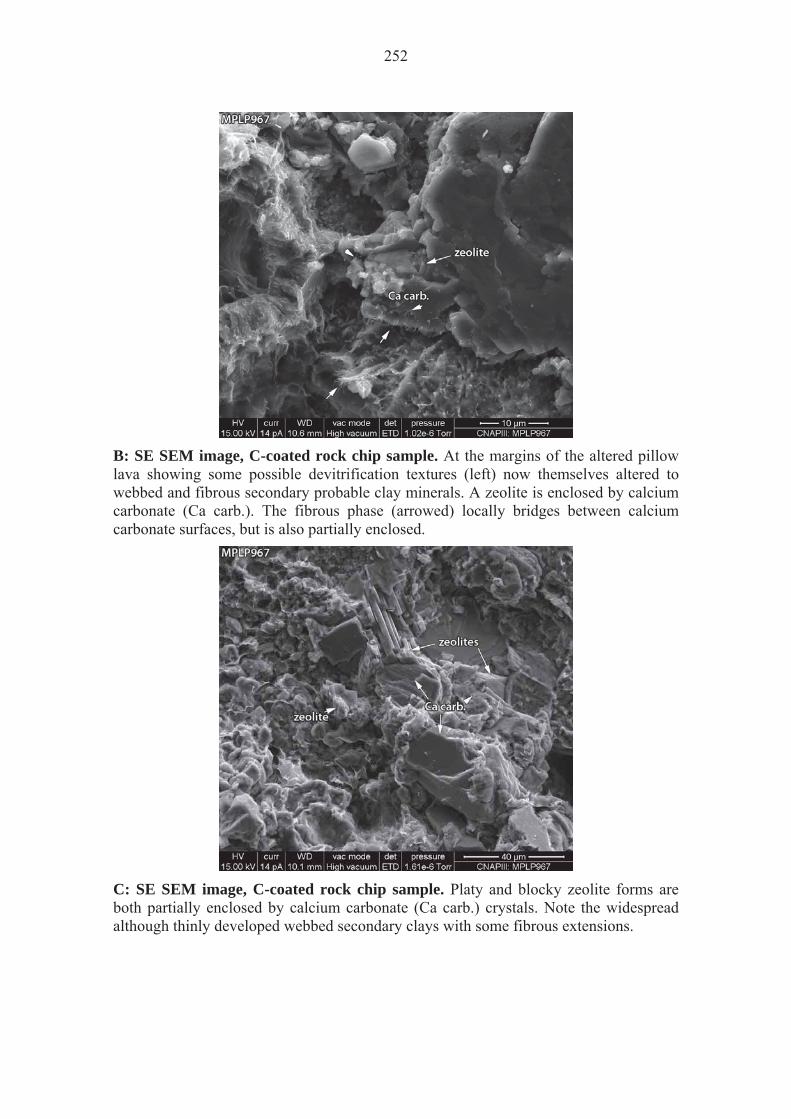
252
B: SE SEM image, C-coated rock chip sample. At the margins of the altered pillow lava showing some possible devitrification textures (left) now themselves altered to webbed and fibrous secondary probable clay minerals. A zeolite is enclosed by calcium carbonate (Ca carb.). The fibrous phase (arrowed) locally bridges between calcium carbonate surfaces, but is also partially enclosed.
C: SE SEM image, C-coated rock chip sample. Platy and blocky zeolite forms are both partially enclosed by calcium carbonate (Ca carb.) crystals. Note the widespread although thinly developed webbed secondary clays with some fibrous extensions.

253
D: SE SEM image, C-coated rock chip sample. Here a stepped zeolite crystal is partially enclosed by the subhedral calcium carbonate crystals (Ca carb.). Both phases are partially coated by and bridged to by the fibrous phase.
E: BSE SEM image, C-coated PTS. From the fractured margins of the pillow lava where calcium carbonate and manganese stained fractures intersect. The calcium carbonate cementing the fracture (Ca carb.) has formed around equant Mn-bearing crystals (Mn1). Both the Mn1 phase and the calcium carbonate are post-dated by fine microfractures containing a later Mn deposit (Mn2). The pillow lava is extensively altered and dissolved with widespread zeolites and calcium carbonate. There are also remnant plagioclase crystals (pl).

254
Sample Site: Parsata Trench 1 Sample No. (Depth): 8 (160.0 cm)
BGS Sample ID: MPLP968 Preparation(s): Rock chip, PTS
Field Description: Top of the pillow lavas, coloured green.
Sample Description A: PTS The sample is an altered pillow lava containing scattered unaltered or partially altered grains (garnet, plagioclase) as well as possible vuggy pores. The altered lava matrix dominantly comprises fibrous clays with an Mg-rich composition (D, EDXA derived) that is consistent with palygorskite. Webbed and sheet-like forms are also present; these are probably smectitic clays. Minor fractures are defined by smoothed and striated surfaces formed from matted layers of the fibrous phase. Altered grains and open pores are typically lined by zeolites (compositions indicated by EDXA typically have cation abundances Na>Mg>Ca) and / or possible analcite. Possible smectitic clays, post-dating the zeolites, are also associated with some of these (but not all) pores / alteration products. Calcium sulphate is present as a minor late-stage precipitate on some surfaces commonly associated with the clay matrix (possibly a post-sampling precipitate).
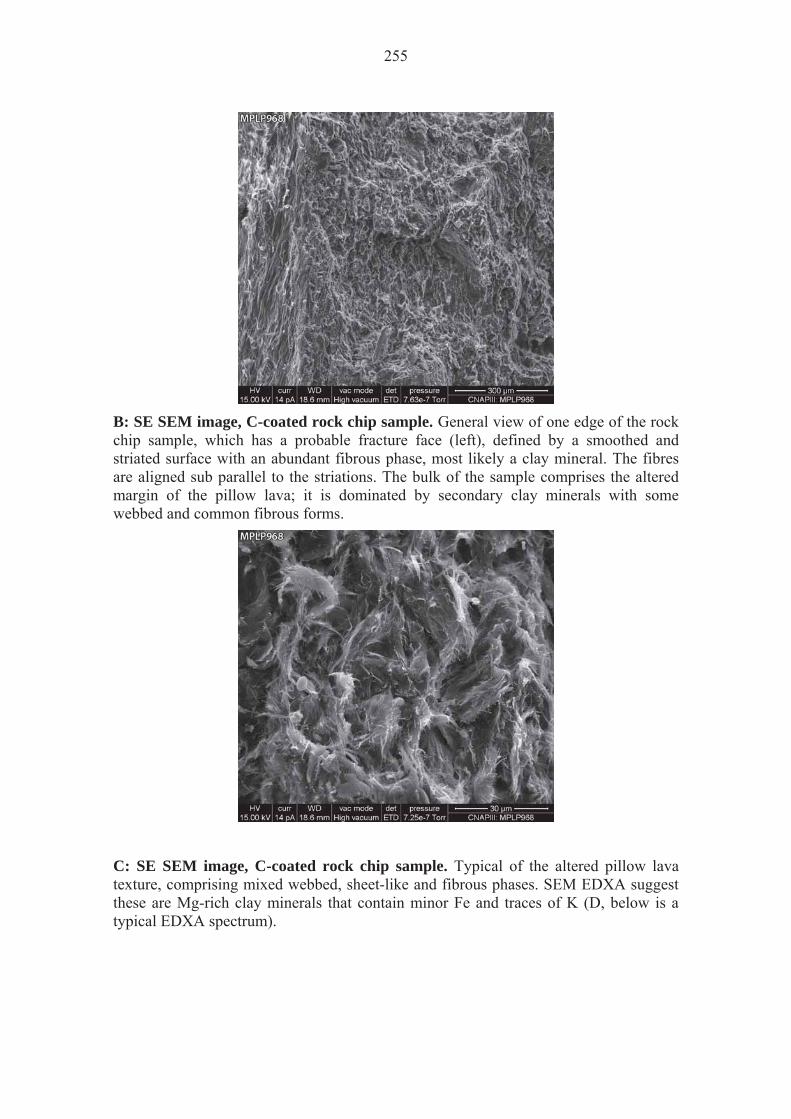
255
B: SE SEM image, C-coated rock chip sample. General view of one edge of the rock chip sample, which has a probable fracture face (left), defined by a smoothed and striated surface with an abundant fibrous phase, most likely a clay mineral. The fibres are aligned sub parallel to the striations. The bulk of the sample comprises the altered margin of the pillow lava; it is dominated by secondary clay minerals with some webbed and common fibrous forms.
C: SE SEM image, C-coated rock chip sample. Typical of the altered pillow lava texture, comprising mixed webbed, sheet-like and fibrous phases. SEM EDXA suggest these are Mg-rich clay minerals that contain minor Fe and traces of K (D, below is a typical EDXA spectrum).

256
D: SEM EDXA spectrum, C-coated rock chip sample. Typical spectrum obtained from the altered pillow lava, as shown in C, above.
E: SE SEM image, C-coated rock chip sample. A cluster of euhedral zeolite crystals. These are locally coated by fine wispy and webbed forms (arrowed), most likely clays similar to those observed in the adjacent altered pillow lava. The zeolites are best developed within vuggy pores.

257
Sample Site: Parsata Trench 1 Sample No. (Depth): 9 (177.8 cm)
BGS Sample ID: MPLP971 Preparation(s): Rock chip, PTS
Field Description: Green-brown stained zone in the pillow lavas.
Sample Description A: PTS The sample comprises partially fragmented pillow lava cemented by carbonate veins (A). The latter comprise an interlocking mosaic of fine crystals with varied Mn contents (D). Textures show the earliest carbonate has the lowest Mn content (below EDXA detection threshold), the latest carbonate has the highest Mn content. The PLV fragments have a banded and zoned structure (D) that has been cut by and therefore pre-dates the carbonate veins. The banding is largely related to varied Fe content, with a variation in K content also detectable.
Sediment is present interspersed with the PLV, containing fractured flakes of clay and silt grains that include quartz. Zeolite is a common secondary constituent in this material, with an equant phase post-dating a more elongate partially dissolved phase. The latter has a K-Na based composition, the former equant phase has a Na-Mg-K-Ca based composition. There is evidence that the carbonate phase has intergrown with some of the zeolite; it post-dates most, particularly the etched K-Na zeolite (possibly a replacive relationship). Where possibly enclosed by zeolite, it is the low Mn carbonate (i.e. earliest) that is enclosed.
The Ca carbonate that coats fracture surfaces itself contains associated webbed and wispy clay minerals, some enclosed by carbonates, some draped on them (C). Similar clays are also present on surfaces without Ca carbonate. Local pockets with spherulitic linings (EDXA results show that spherule surfaces comprise clay minerals) have common wispy developments (B). There are scattered very fine silica-based particles also lining these surfaces.
Biological activity is indicated in the form of probable bacterial chains on some surfaces (B); this means that textures must be interpreted carefully as there may be biofilms present. Their presence is, however, typically indicated by raised C contents in EDXA spectra.
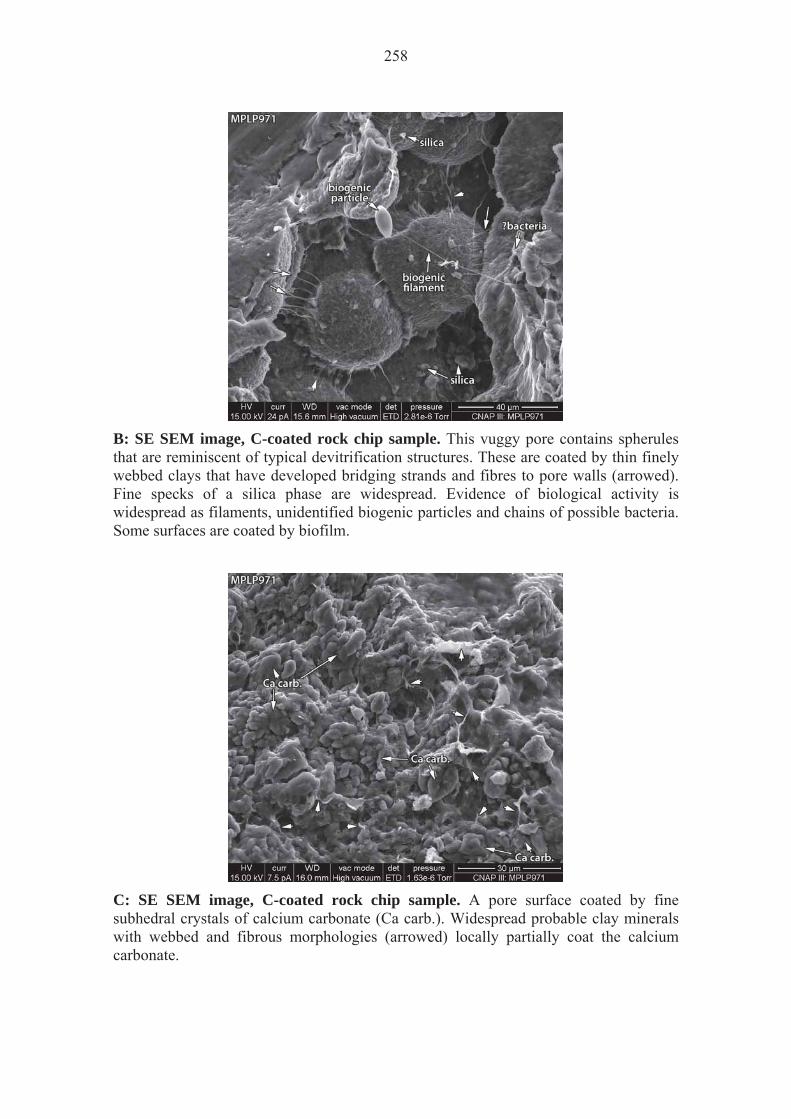
258
B: SE SEM image, C-coated rock chip sample. This vuggy pore contains spherules that are reminiscent of typical devitrification structures. These are coated by thin finely webbed clays that have developed bridging strands and fibres to pore walls (arrowed). Fine specks of a silica phase are widespread. Evidence of biological activity is widespread as filaments, unidentified biogenic particles and chains of possible bacteria. Some surfaces are coated by biofilm.
C: SE SEM image, C-coated rock chip sample. A pore surface coated by fine subhedral crystals of calcium carbonate (Ca carb.). Widespread probable clay minerals with webbed and fibrous morphologies (arrowed) locally partially coat the calcium carbonate.
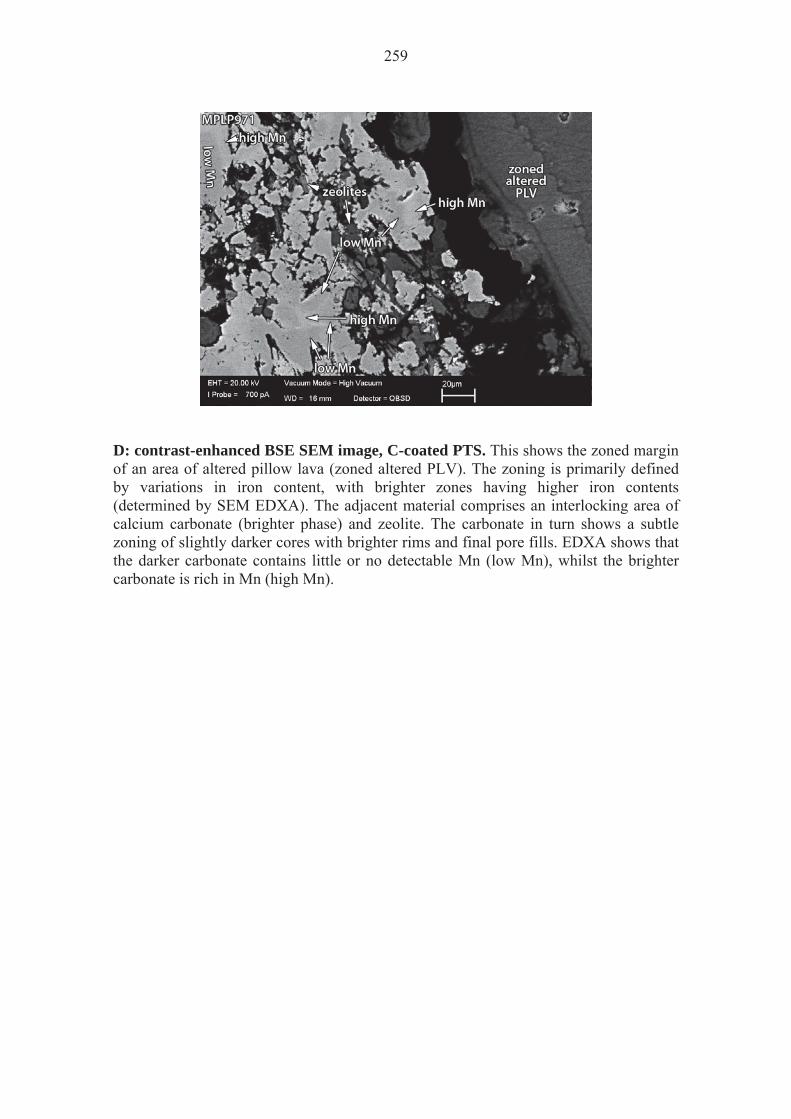
259
D: contrast-enhanced BSE SEM image, C-coated PTS. This shows the zoned margin of an area of altered pillow lava (zoned altered PLV). The zoning is primarily defined by variations in iron content, with brighter zones having higher iron contents (determined by SEM EDXA). The adjacent material comprises an interlocking area of calcium carbonate (brighter phase) and zeolite. The carbonate in turn shows a subtle zoning of slightly darker cores with brighter rims and final pore fills. EDXA shows that the darker carbonate contains little or no detectable Mn (low Mn), whilst the brighter carbonate is rich in Mn (high Mn).
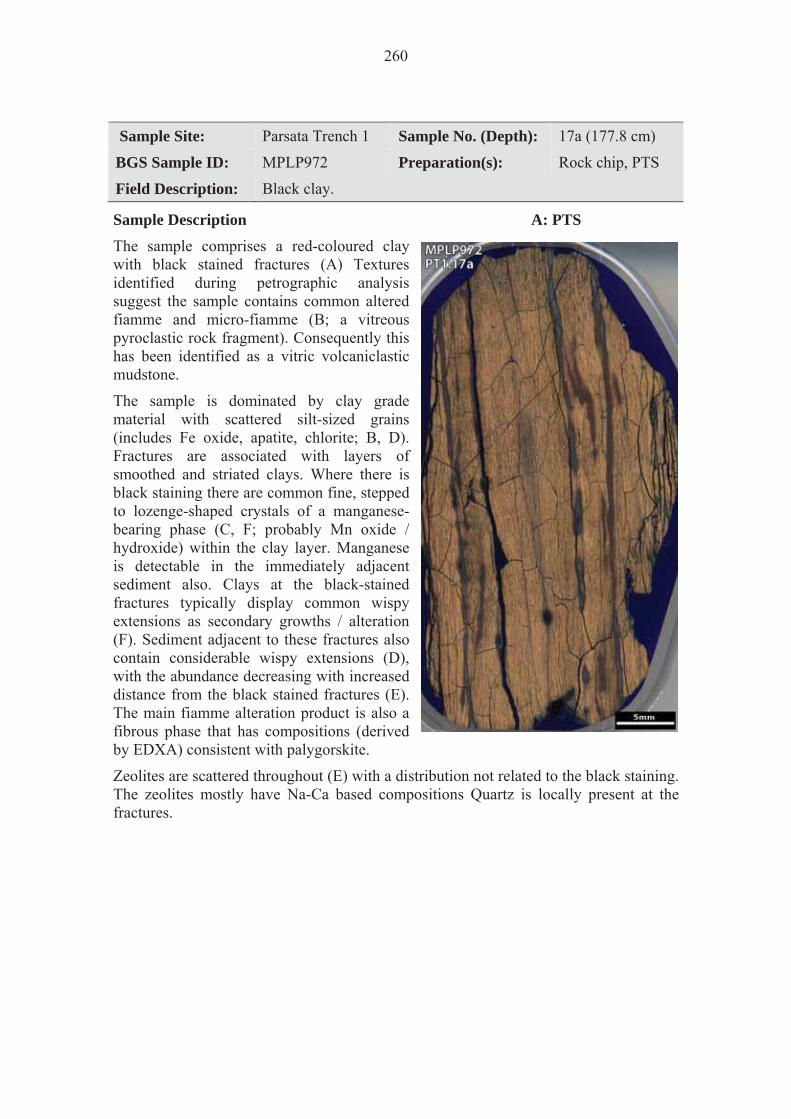
260
Sample Site: Parsata Trench 1 Sample No. (Depth): 17a (177.8 cm)
BGS Sample ID: MPLP972 Preparation(s): Rock chip, PTS
Field Description: Black clay.
Sample Description A: PTS The sample comprises a red-coloured clay with black stained fractures (A) Textures identified during petrographic analysis suggest the sample contains common altered fiamme and micro-fiamme (B; a vitreous pyroclastic rock fragment). Consequently this has been identified as a vitric volcaniclastic mudstone.
The sample is dominated by clay grade material with scattered silt-sized grains (includes Fe oxide, apatite, chlorite; B, D). Fractures are associated with layers of smoothed and striated clays. Where there is black staining there are common fine, stepped to lozenge-shaped crystals of a manganese-bearing phase (C, F; probably Mn oxide / hydroxide) within the clay layer. Manganese is detectable in the immediately adjacent sediment also. Clays at the black-stained fractures typically display common wispy extensions as secondary growths / alteration (F). Sediment adjacent to these fractures also contain considerable wispy extensions (D), with the abundance decreasing with increased distance from the black stained fractures (E). The main fiamme alteration product is also a fibrous phase that has compositions (derived by EDXA) consistent with palygorskite.
Zeolites are scattered throughout (E) with a distribution not related to the black staining. The zeolites mostly have Na-Ca based compositions Quartz is locally present at the fractures.
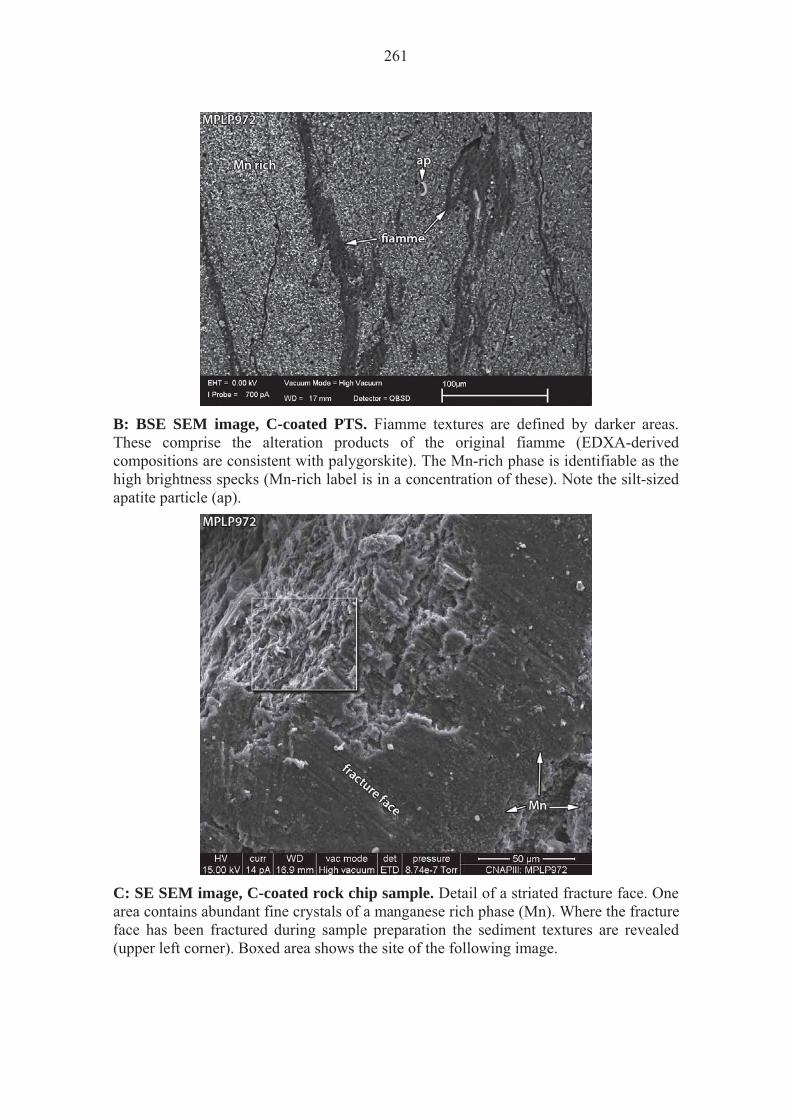
261
B: BSE SEM image, C-coated PTS. Fiamme textures are defined by darker areas. These comprise the alteration products of the original fiamme (EDXA-derived compositions are consistent with palygorskite). The Mn-rich phase is identifiable as the high brightness specks (Mn-rich label is in a concentration of these). Note the silt-sized apatite particle (ap).
C: SE SEM image, C-coated rock chip sample. Detail of a striated fracture face. One area contains abundant fine crystals of a manganese rich phase (Mn). Where the fracture face has been fractured during sample preparation the sediment textures are revealed (upper left corner). Boxed area shows the site of the following image.

262
D: SE SEM image, C-coated rock chip sample. The sediment comprises a platy clay matrix with scattered silt grains. Chlorite flake (chl) is probably detrital in this instance. There are common secondary fibrous extensions and webbed developments to the detrital clays.
E: SE SEM image, C-coated rock chip sample. An area of sediment similar to that shown in C, but several millimetres in sediment thickness from a Mn-bearing fracture. Although there are some secondary developments on the detrital clay particles, compared to C they appear to be less common and less well developed.

263
F: SE SEM image, C-coated rock chip sample. Detail of a black-stained fracture surface that contains a high abundance of a manganese rich phase (Mn); this is resolvable as finely stepped lozenge-like crystals embedded in the matted and fibrous fracture surface. The manganese phase is also present in adjacent sediment.
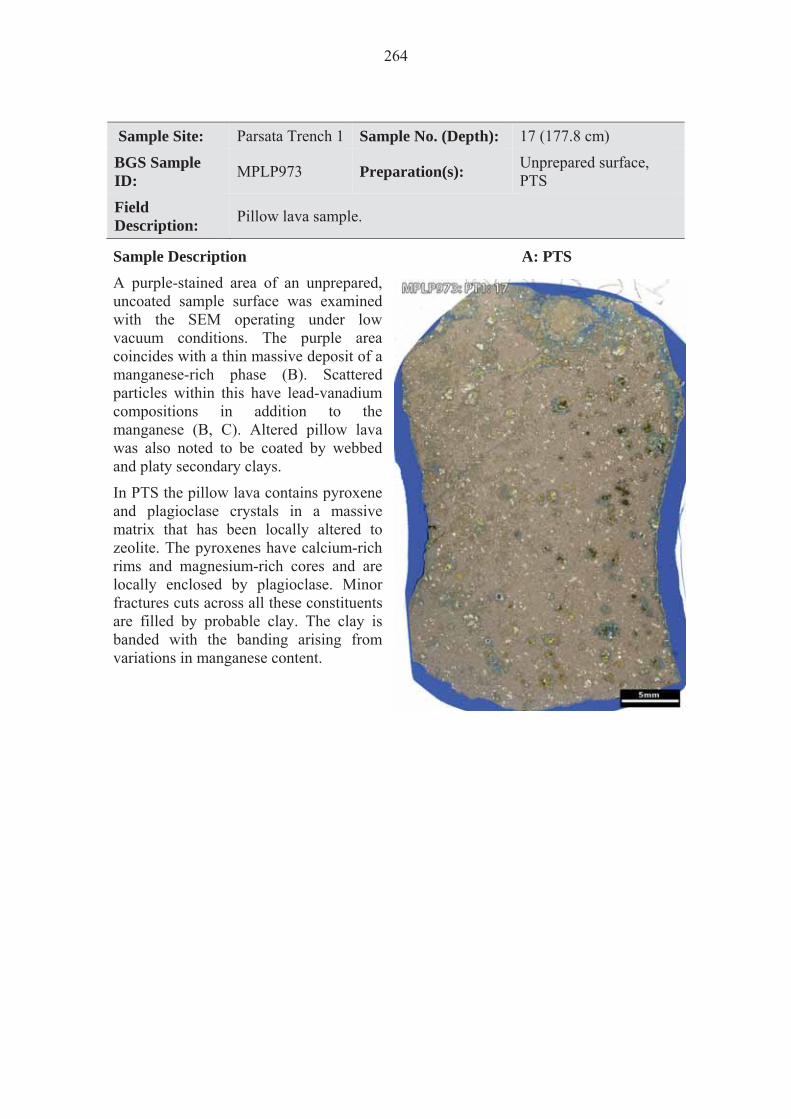
264
Sample Site: Parsata Trench 1 Sample No. (Depth): 17 (177.8 cm)
BGS Sample ID: MPLP973 Preparation(s): Unprepared surface,
PTS
Field Description: Pillow lava sample.
Sample Description A: PTS A purple-stained area of an unprepared, uncoated sample surface was examined with the SEM operating under low vacuum conditions. The purple area coincides with a thin massive deposit of a manganese-rich phase (B). Scattered particles within this have lead-vanadium compositions in addition to the manganese (B, C). Altered pillow lava was also noted to be coated by webbed and platy secondary clays.
In PTS the pillow lava contains pyroxene and plagioclase crystals in a massive matrix that has been locally altered to zeolite. The pyroxenes have calcium-rich rims and magnesium-rich cores and are locally enclosed by plagioclase. Minor fractures cuts across all these constituents are filled by probable clay. The clay is banded with the banding arising from variations in manganese content.

265
B: BSE SEM image, unprepared, uncoated sample surface, low vacuum mode. The intermediate brightness material coincides with the areas of purple staining and comprise a manganese-rich phase. High brightness speckles present in this deposit contain additional lead and vanadium (Pb,V; see example spectrum below).
C: SEM EDXA spectrum, analysis from unprepared, uncoated sample surface, SEM operating under low vacuum conditions. Spectrum from bright specks within the manganese-rich deposit. The elements silicon (Si), aluminium (Al) and magnesium (Mg) probably from altered pillow lava substrate.
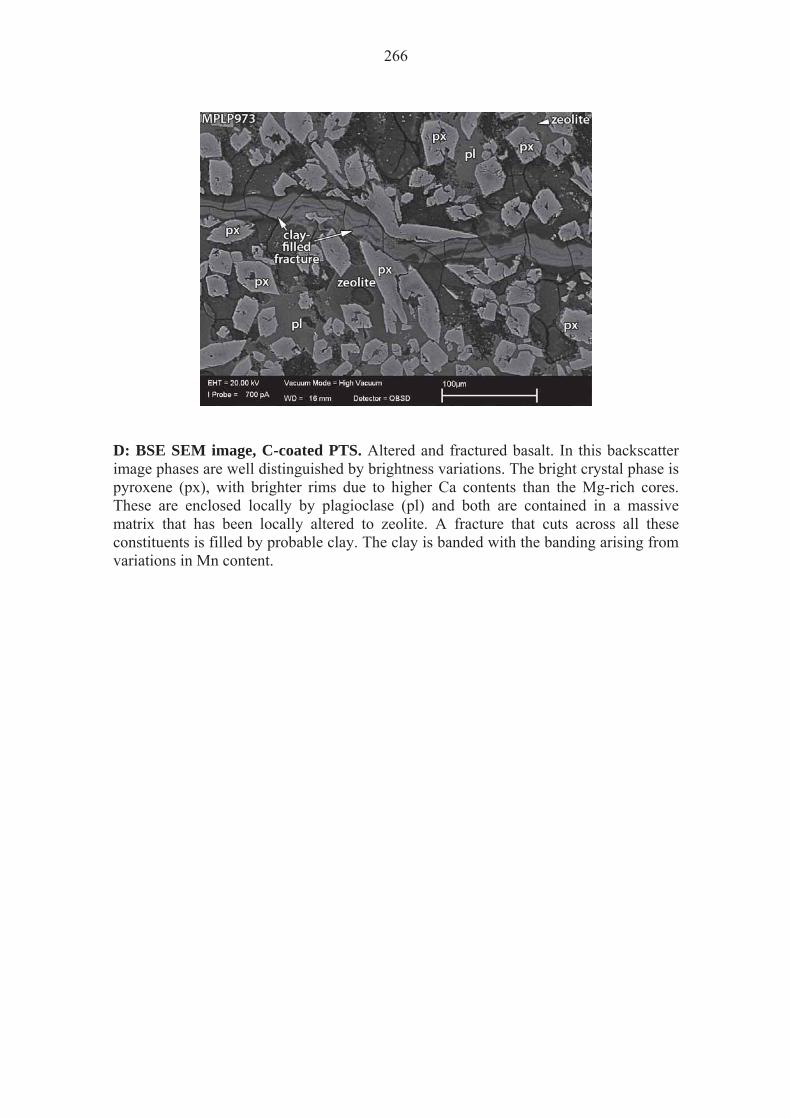
266
D: BSE SEM image, C-coated PTS. Altered and fractured basalt. In this backscatter image phases are well distinguished by brightness variations. The bright crystal phase is pyroxene (px), with brighter rims due to higher Ca contents than the Mg-rich cores. These are enclosed locally by plagioclase (pl) and both are contained in a massive matrix that has been locally altered to zeolite. A fracture that cuts across all these constituents is filled by probable clay. The clay is banded with the banding arising from variations in Mn content.
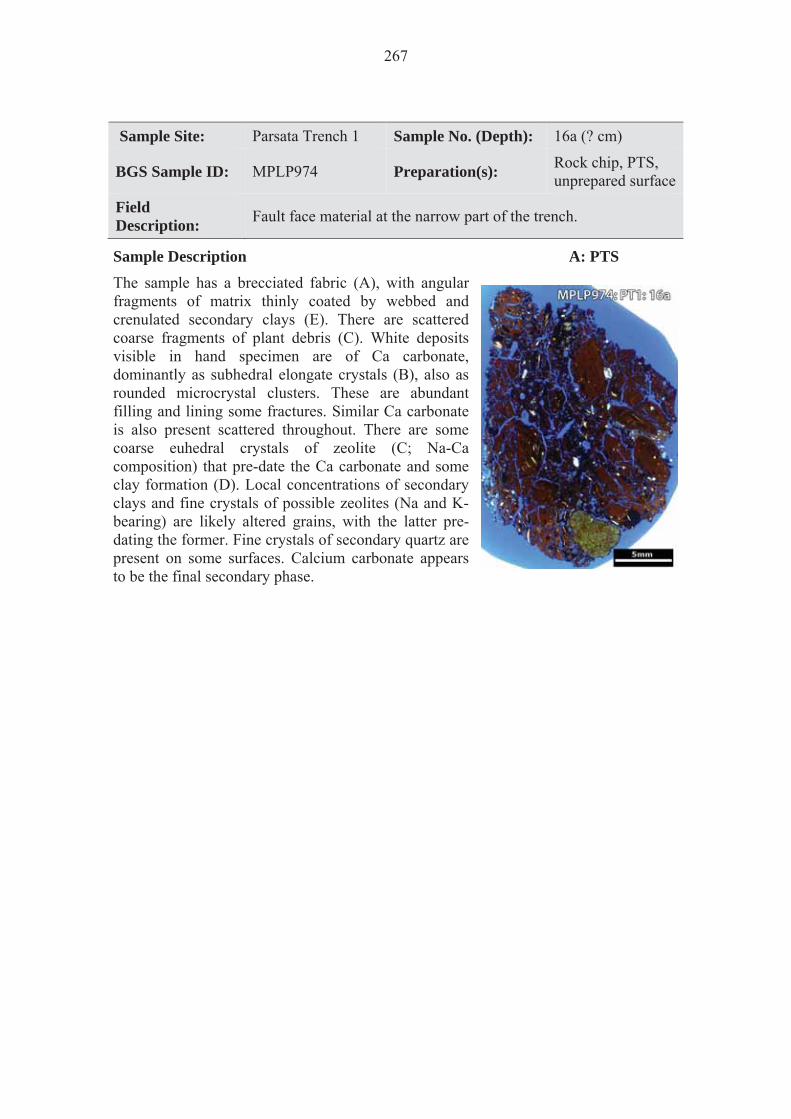
267
Sample Site: Parsata Trench 1 Sample No. (Depth): 16a (? cm)
BGS Sample ID: MPLP974 Preparation(s): Rock chip, PTS, unprepared surface
Field Description: Fault face material at the narrow part of the trench.
Sample Description A: PTS The sample has a brecciated fabric (A), with angular fragments of matrix thinly coated by webbed and crenulated secondary clays (E). There are scattered coarse fragments of plant debris (C). White deposits visible in hand specimen are of Ca carbonate, dominantly as subhedral elongate crystals (B), also as rounded microcrystal clusters. These are abundant filling and lining some fractures. Similar Ca carbonate is also present scattered throughout. There are some coarse euhedral crystals of zeolite (C; Na-Ca composition) that pre-date the Ca carbonate and some clay formation (D). Local concentrations of secondary clays and fine crystals of possible zeolites (Na and K-bearing) are likely altered grains, with the latter pre-dating the former. Fine crystals of secondary quartz are present on some surfaces. Calcium carbonate appears to be the final secondary phase.
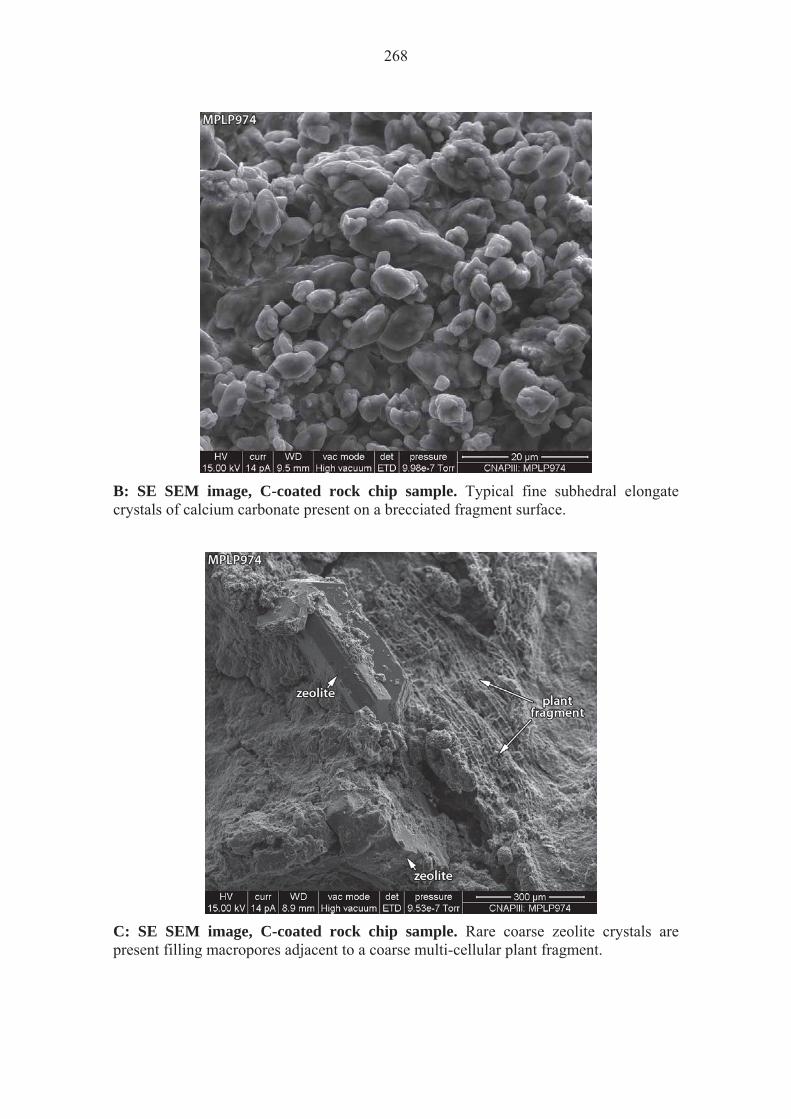
268
B: SE SEM image, C-coated rock chip sample. Typical fine subhedral elongate crystals of calcium carbonate present on a brecciated fragment surface.
C: SE SEM image, C-coated rock chip sample. Rare coarse zeolite crystals are present filling macropores adjacent to a coarse multi-cellular plant fragment.

269
D: SE SEM image, C-coated rock chip sample. Detail of a zeolite crystal surface from the preceding image, showing some fine calcite crystals on the zeolite surface, along with some patches of secondary webbed clay.
E: SE SEM image, C-coated rock chip sample. Matrix. Some fine euhedral zeolite crystals are embedded within a widespread and common webbed texture of secondary clays. These bridge to and enclose the zeolites.
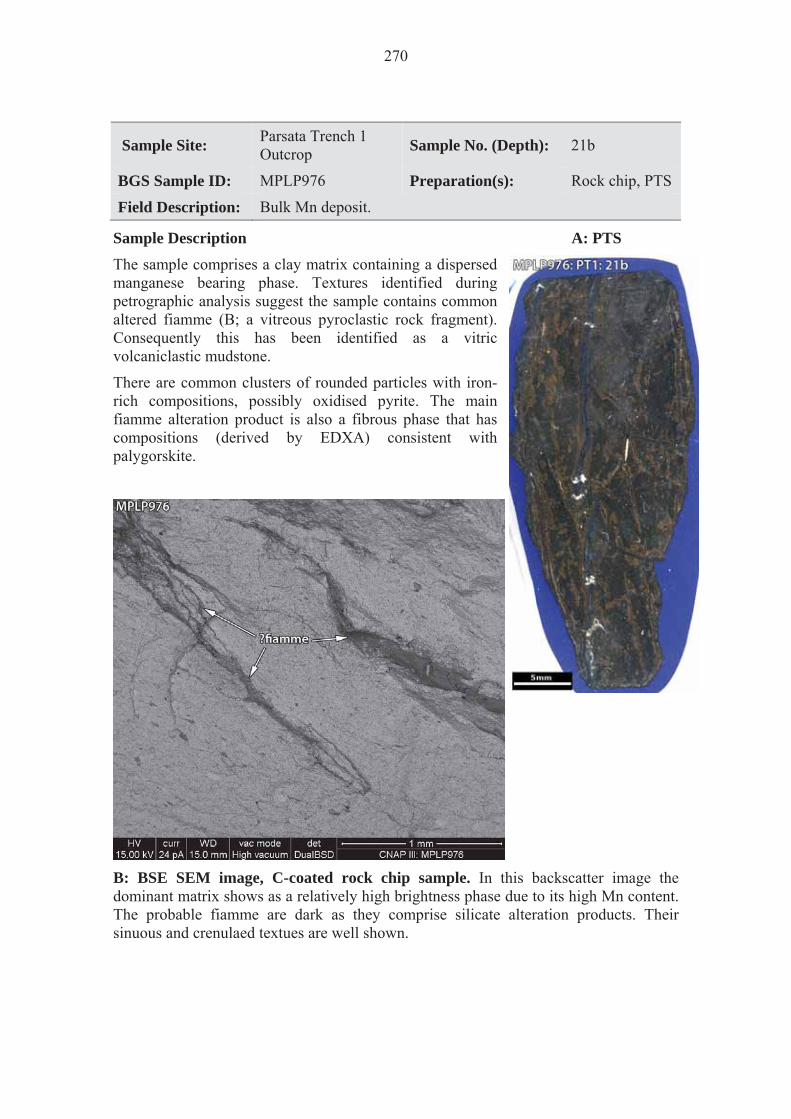
270
Sample Site: Parsata Trench 1 Outcrop Sample No. (Depth): 21b
BGS Sample ID: MPLP976 Preparation(s): Rock chip, PTS
Field Description: Bulk Mn deposit.
Sample Description A: PTS The sample comprises a clay matrix containing a dispersed manganese bearing phase. Textures identified during petrographic analysis suggest the sample contains common altered fiamme (B; a vitreous pyroclastic rock fragment). Consequently this has been identified as a vitric volcaniclastic mudstone.
There are common clusters of rounded particles with iron-rich compositions, possibly oxidised pyrite. The main fiamme alteration product is also a fibrous phase that has compositions (derived by EDXA) consistent with palygorskite.
B: BSE SEM image, C-coated rock chip sample. In this backscatter image the dominant matrix shows as a relatively high brightness phase due to its high Mn content. The probable fiamme are dark as they comprise silicate alteration products. Their sinuous and crenulaed textues are well shown.

271
C: SE SEM image, C-coated rock chip sample. Detail from one of the possible fiamme, showing the dominant fibrous form of the alteration product. This phase that has compositions (derived by EDXA) consistent with palygorskite.
D: SE SEM image, C-coated rock chip sample. Typical matrix with rounded clusters of Fe-rich matter, possibly altered pyrite clusters. The surrounding matrix comprises a mix of sheet-like clays and a finely granular constituent that is responsible for the high Mn content.
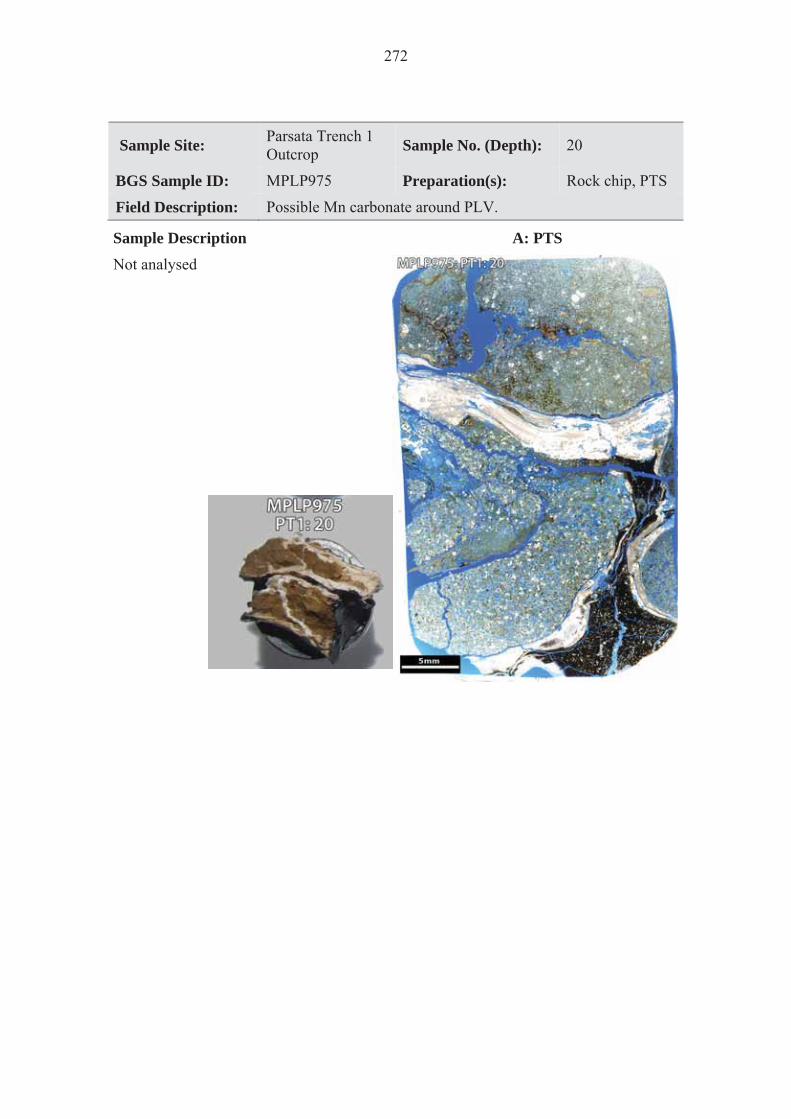
272
Sample Site: Parsata Trench 1 Outcrop Sample No. (Depth): 20
BGS Sample ID: MPLP975 Preparation(s): Rock chip, PTS
Field Description: Possible Mn carbonate around PLV.
Sample Description A: PTS Not analysed
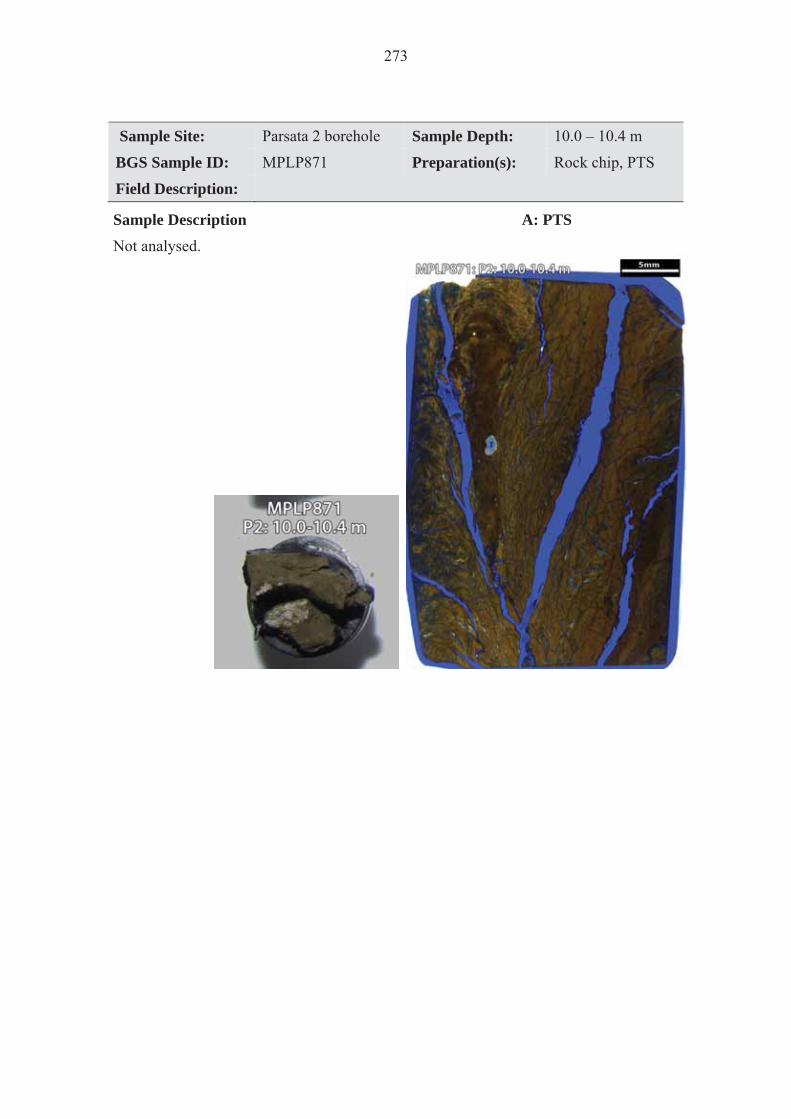
273
Sample Site: Parsata 2 borehole Sample Depth: 10.0 – 10.4 m
BGS Sample ID: MPLP871 Preparation(s): Rock chip, PTS
Field Description:
Sample Description A: PTS Not analysed.
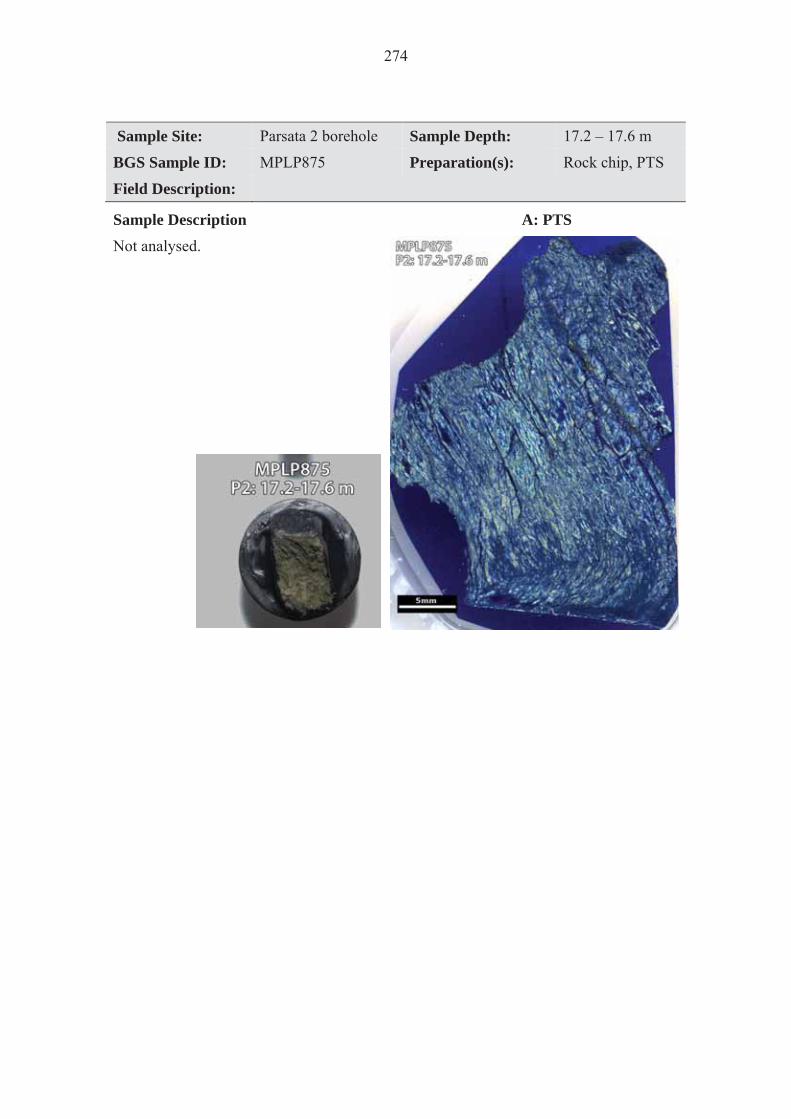
274
Sample Site: Parsata 2 borehole Sample Depth: 17.2 – 17.6 m
BGS Sample ID: MPLP875 Preparation(s): Rock chip, PTS
Field Description:
Sample Description A: PTS Not analysed.
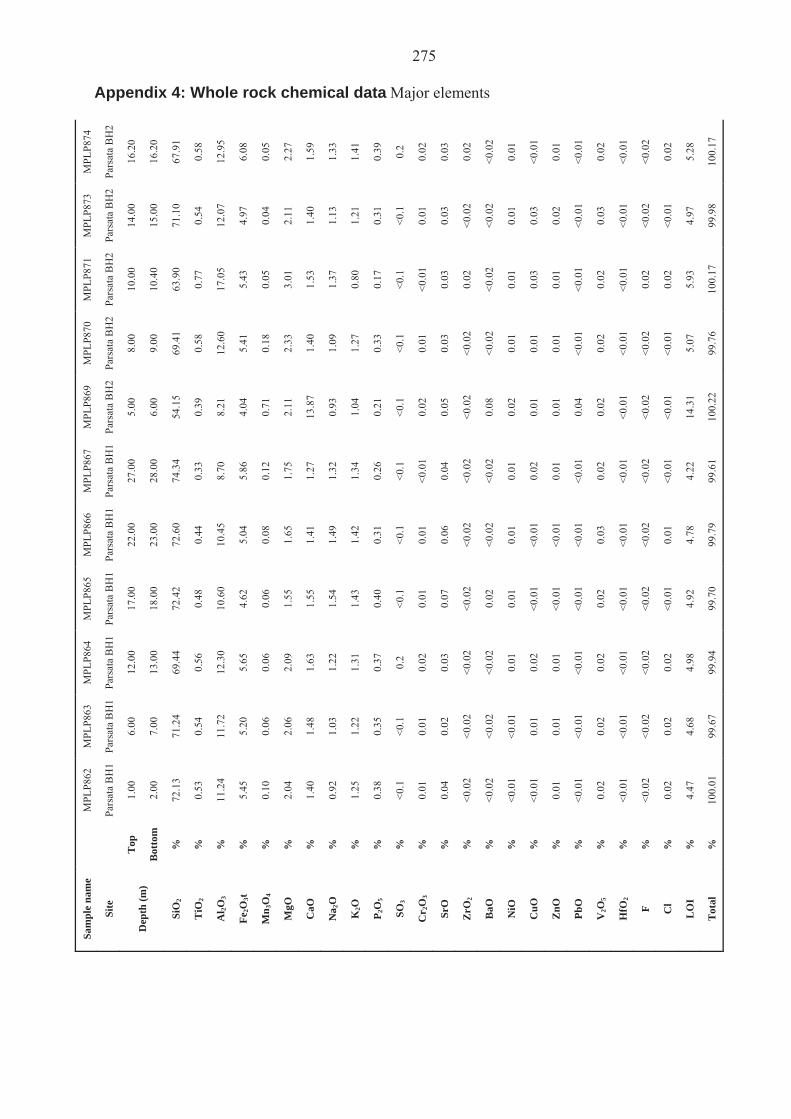
275
Appendix 4: Whole rock chemical data Major elements
MPL
P874
Pars
ata
BH
2
16.2
0
16.2
0
67.9
1
0.58
12.9
5
6.08
0.05
2.27
1.59
1.33
1.41
0.39
0.2
0.02
0.03
0.02
<0.0
2
0.01
<0.0
1
0.01
<0.0
1
0.02
<0.0
1
<0.0
2
0.02
5.28
100.
17
MPL
P873
Pars
ata
BH
2
14.0
0
15.0
0
71.1
0
0.54
12.0
7
4.97
0.04
2.11
1.40
1.13
1.21
0.31
<0.1
0.01
0.03
<0.0
2
<0.0
2
0.01
0.03
0.02
<0.0
1
0.03
<0.0
1
<0.0
2
<0.0
1
4.97
99.9
8
MPL
P871
Pars
ata
BH
2
10.0
0
10.4
0
63.9
0
0.77
17.0
5
5.43
0.05
3.01
1.53
1.37
0.80
0.17
<0.1
<0.0
1
0.03
0.02
<0.0
2
0.01
0.03
0.01
<0.0
1
0.02
<0.0
1
0.02
0.02
5.93
100.
17
MPL
P870
Pars
ata
BH
2
8.00
9.00
69.4
1
0.58
12.6
0
5.41
0.18
2.33
1.40
1.09
1.27
0.33
<0.1
0.01
0.03
<0.0
2
<0.0
2
0.01
0.01
0.01
<0.0
1
0.02
<0.0
1
<0.0
2
<0.0
1
5.07
99.7
6
MPL
P869
Pars
ata
BH
2
5.00
6.00
54.1
5
0.39
8.21
4.04
0.71
2.11
13.8
7
0.93
1.04
0.21
<0.1
0.02
0.05
<0.0
2
0.08
0.02
0.01
0.01
0.04
0.02
<0.0
1
<0.0
2
<0.0
1
14.3
1
100.
22
MPL
P867
Pars
ata
BH
1
27.0
0
28.0
0
74.3
4
0.33
8.70
5.86
0.12
1.75
1.27
1.32
1.34
0.26
<0.1
<0.0
1
0.04
<0.0
2
<0.0
2
0.01
0.02
0.01
<0.0
1
0.02
<0.0
1
<0.0
2
<0.0
1
4.22
99.6
1
MPL
P866
Pars
ata
BH
1
22.0
0
23.0
0
72.6
0
0.44
10.4
5
5.04
0.08
1.65
1.41
1.49
1.42
0.31
<0.1
0.01
0.06
<0.0
2
<0.0
2
0.01
<0.0
1
<0.0
1
<0.0
1
0.03
<0.0
1
<0.0
2
0.01
4.78
99.7
9
MPL
P865
Pars
ata
BH
1
17.0
0
18.0
0
72.4
2
0.48
10.6
0
4.62
0.06
1.55
1.55
1.54
1.43
0.40
<0.1
0.01
0.07
<0.0
2
0.02
0.01
<0.0
1
<0.0
1
<0.0
1
0.02
<0.0
1
<0.0
2
<0.0
1
4.92
99.7
0
MPL
P864
Pars
ata
BH
1
12.0
0
13.0
0
69.4
4
0.56
12.3
0
5.65
0.06
2.09
1.63
1.22
1.31
0.37
0.2
0.02
0.03
<0.0
2
<0.0
2
0.01
0.02
0.01
<0.0
1
0.02
<0.0
1
<0.0
2
0.02
4.98
99.9
4
MPL
P863
Pars
ata
BH
1
6.00
7.00
71.2
4
0.54
11.7
2
5.20
0.06
2.06
1.48
1.03
1.22
0.35
<0.1
0.01
0.02
<0.0
2
<0.0
2
<0.0
1
0.01
0.01
<0.0
1
0.02
<0.0
1
<0.0
2
0.02
4.68
99.6
7
MPL
P862
Pars
ata
BH
1
1.00
2.00
72.1
3
0.53
11.2
4
5.45
0.10
2.04
1.40
0.92
1.25
0.38
<0.1
0.01
0.04
<0.0
2
<0.0
2
<0.0
1
<0.0
1
0.01
<0.0
1
0.02
<0.0
1
<0.0
2
0.02
4.47
100.
01
T
op
Bot
tom
%
%
%
%
%
%
%
%
%
%
%
%
%
%
%
%
%
%
%
%
%
%
%
%
%
Sam
ple
nam
e
Site
Dep
th (m
)
SiO
2
TiO
2
Al 2O
3
Fe2O
3t
Mn 3
O4
MgO
CaO
Na 2
O
K2O
P 2O
5
SO3
Cr 2
O3
SrO
ZrO
2
BaO
NiO
CuO
ZnO
PbO
V2O
5
HfO
2
F Cl
LO
I
Tot
al
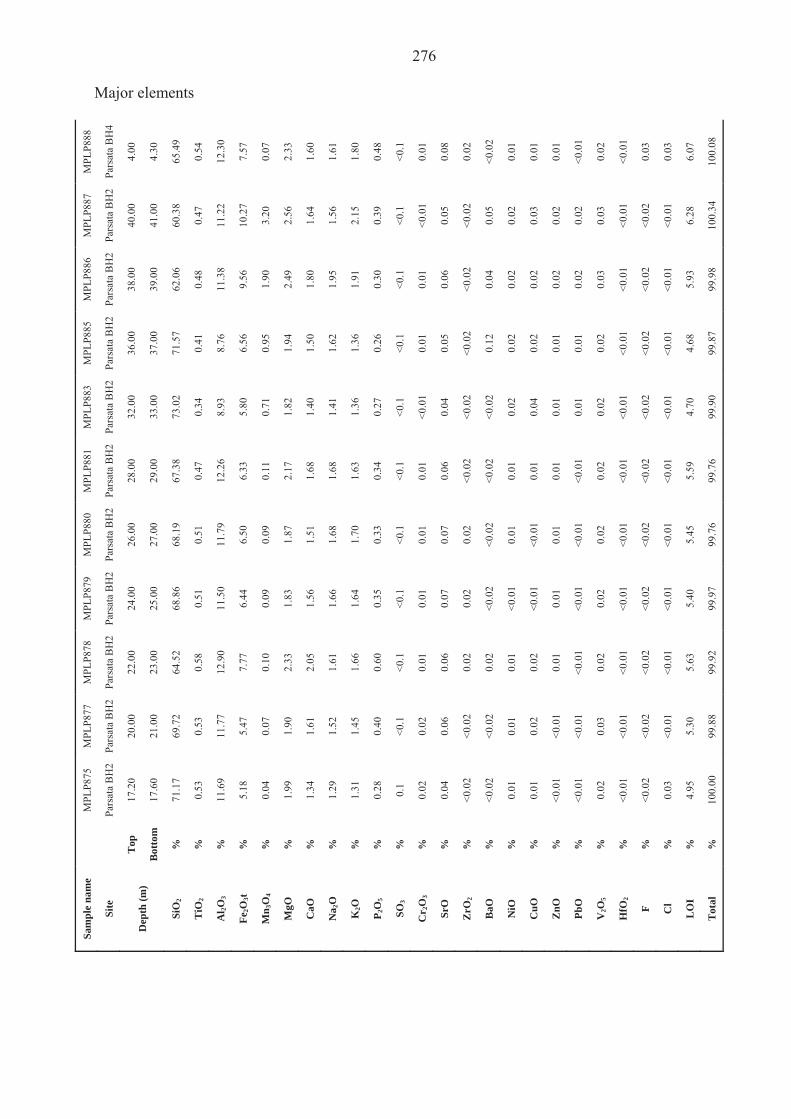
276
Major elements
MPL
P888
Pars
ata
BH
4
4.00
4.30
65.4
9
0.54
12.3
0
7.57
0.07
2.33
1.60
1.61
1.80
0.48
<0.1
0.01
0.08
0.02
<0.0
2
0.01
0.01
0.01
<0.0
1
0.02
<0.0
1
0.03
0.03
6.07
100.
08
MPL
P887
Pars
ata
BH
2
40.0
0
41.0
0
60.3
8
0.47
11.2
2
10.2
7
3.20
2.56
1.64
1.56
2.15
0.39
<0.1
<0.0
1
0.05
<0.0
2
0.05
0.02
0.03
0.02
0.02
0.03
<0.0
1
<0.0
2
<0.0
1
6.28
100.
34
MPL
P886
Pars
ata
BH
2
38.0
0
39.0
0
62.0
6
0.48
11.3
8
9.56
1.90
2.49
1.80
1.95
1.91
0.30
<0.1
0.01
0.06
<0.0
2
0.04
0.02
0.02
0.02
0.02
0.03
<0.0
1
<0.0
2
<0.0
1
5.93
99.9
8
MPL
P885
Pars
ata
BH
2
36.0
0
37.0
0
71.5
7
0.41
8.76
6.56
0.95
1.94
1.50
1.62
1.36
0.26
<0.1
0.01
0.05
<0.0
2
0.12
0.02
0.02
0.01
0.01
0.02
<0.0
1
<0.0
2
<0.0
1
4.68
99.8
7
MPL
P883
Pars
ata
BH
2
32.0
0
33.0
0
73.0
2
0.34
8.93
5.80
0.71
1.82
1.40
1.41
1.36
0.27
<0.1
<0.0
1
0.04
<0.0
2
<0.0
2
0.02
0.04
0.01
0.01
0.02
<0.0
1
<0.0
2
<0.0
1
4.70
99.9
0
MPL
P881
Pars
ata
BH
2
28.0
0
29.0
0
67.3
8
0.47
12.2
6
6.33
0.11
2.17
1.68
1.68
1.63
0.34
<0.1
0.01
0.06
<0.0
2
<0.0
2
0.01
0.01
0.01
<0.0
1
0.02
<0.0
1
<0.0
2
<0.0
1
5.59
99.7
6
MPL
P880
Pars
ata
BH
2
26.0
0
27.0
0
68.1
9
0.51
11.7
9
6.50
0.09
1.87
1.51
1.68
1.70
0.33
<0.1
0.01
0.07
0.02
<0.0
2
0.01
<0.0
1
0.01
<0.0
1
0.02
<0.0
1
<0.0
2
<0.0
1
5.45
99.7
6
MPL
P879
Pars
ata
BH
2
24.0
0
25.0
0
68.8
6
0.51
11.5
0
6.44
0.09
1.83
1.56
1.66
1.64
0.35
<0.1
0.01
0.07
0.02
<0.0
2
<0.0
1
<0.0
1
0.01
<0.0
1
0.02
<0.0
1
<0.0
2
<0.0
1
5.40
99.9
7
MPL
P878
Pars
ata
BH
2
22.0
0
23.0
0
64.5
2
0.58
12.9
0
7.77
0.10
2.33
2.05
1.61
1.66
0.60
<0.1
0.01
0.06
0.02
0.02
0.01
0.02
0.01
<0.0
1
0.02
<0.0
1
<0.0
2
<0.0
1
5.63
99.9
2
MPL
P877
Pars
ata
BH
2
20.0
0
21.0
0
69.7
2
0.53
11.7
7
5.47
0.07
1.90
1.61
1.52
1.45
0.40
<0.1
0.02
0.06
<0.0
2
<0.0
2
0.01
0.02
<0.0
1
<0.0
1
0.03
<0.0
1
<0.0
2
<0.0
1
5.30
99.8
8
MPL
P875
Pars
ata
BH
2
17.2
0
17.6
0
71.1
7
0.53
11.6
9
5.18
0.04
1.99
1.34
1.29
1.31
0.28
0.1
0.02
0.04
<0.0
2
<0.0
2
0.01
0.01
<0.0
1
<0.0
1
0.02
<0.0
1
<0.0
2
0.03
4.95
100.
00
T
op
Bot
tom
%
%
%
%
%
%
%
%
%
%
%
%
%
%
%
%
%
%
%
%
%
%
%
%
%
Sam
ple
nam
e
Site
Dep
th (m
)
SiO
2
TiO
2
Al 2O
3
Fe2O
3t
Mn 3
O4
MgO
CaO
Na 2
O
K2O
P 2O
5
SO3
Cr 2
O3
SrO
ZrO
2
BaO
NiO
CuO
ZnO
PbO
V2O
5
HfO
2
F Cl
LO
I
Tot
al
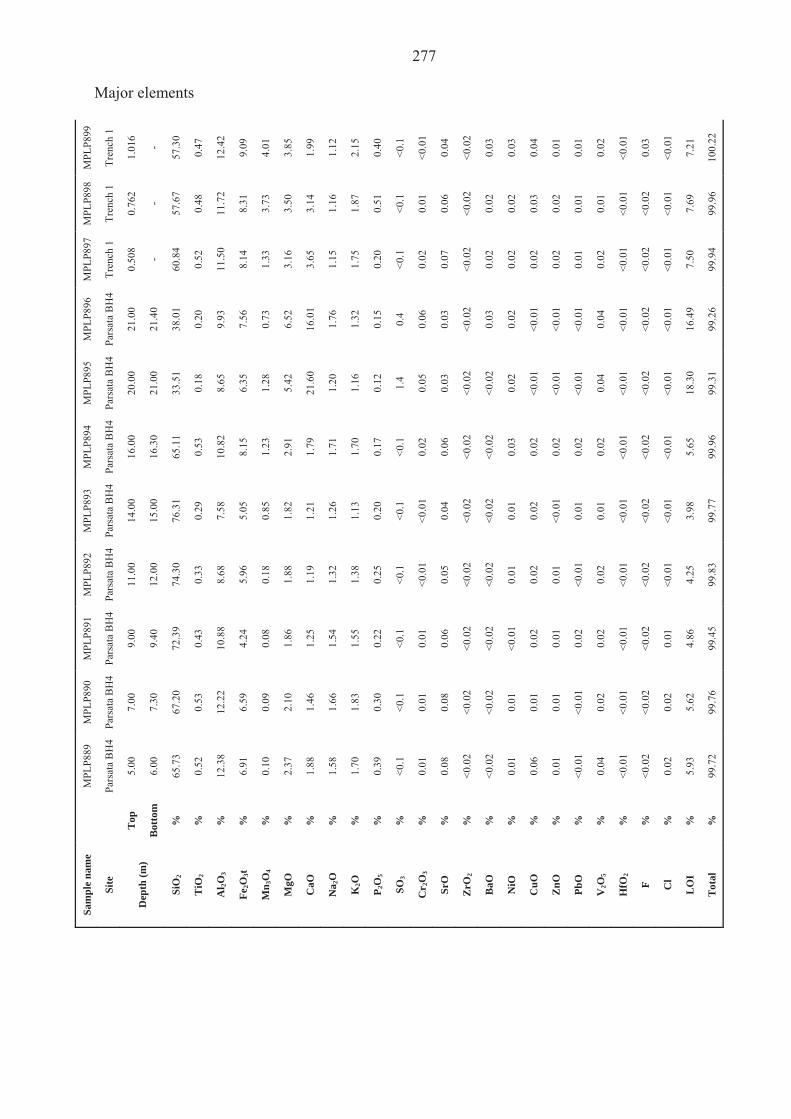
277
Major elements
MPL
P899
Tren
ch 1
1.01
6
-
57.3
0
0.47
12.4
2
9.09
4.01
3.85
1.99
1.12
2.15
0.40
<0.1
<0.0
1
0.04
<0.0
2
0.03
0.03
0.04
0.01
0.01
0.02
<0.0
1
0.03
<0.0
1
7.21
100.
22
MPL
P898
Tren
ch 1
0.76
2
-
57.6
7
0.48
11.7
2
8.31
3.73
3.50
3.14
1.16
1.87
0.51
<0.1
0.01
0.06
<0.0
2
0.02
0.02
0.03
0.02
0.01
0.01
<0.0
1
<0.0
2
<0.0
1
7.69
99.9
6
MPL
P897
Tren
ch 1
0.50
8
-
60.8
4
0.52
11.5
0
8.14
1.33
3.16
3.65
1.15
1.75
0.20
<0.1
0.02
0.07
<0.0
2
0.02
0.02
0.02
0.02
0.01
0.02
<0.0
1
<0.0
2
<0.0
1
7.50
99.9
4
MPL
P896
Pars
ata
BH
4
21.0
0
21.4
0
38.0
1
0.20
9.93
7.56
0.73
6.52
16.0
1
1.76
1.32
0.15
0.4
0.06
0.03
<0.0
2
0.03
0.02
<0.0
1
<0.0
1
<0.0
1
0.04
<0.0
1
<0.0
2
<0.0
1
16.4
9
99.2
6
MPL
P895
Pars
ata
BH
4
20.0
0
21.0
0
33.5
1
0.18
8.65
6.35
1.28
5.42
21.6
0
1.20
1.16
0.12
1.4
0.05
0.03
<0.0
2
<0.0
2
0.02
<0.0
1
<0.0
1
<0.0
1
0.04
<0.0
1
<0.0
2
<0.0
1
18.3
0
99.3
1
MPL
P894
Pars
ata
BH
4
16.0
0
16.3
0
65.1
1
0.53
10.8
2
8.15
1.23
2.91
1.79
1.71
1.70
0.17
<0.1
0.02
0.06
<0.0
2
<0.0
2
0.03
0.02
0.02
0.02
0.02
<0.0
1
<0.0
2
<0.0
1
5.65
99.9
6
MPL
P893
Pars
ata
BH
4
14.0
0
15.0
0
76.3
1
0.29
7.58
5.05
0.85
1.82
1.21
1.26
1.13
0.20
<0.1
<0.0
1
0.04
<0.0
2
<0.0
2
0.01
0.02
<0.0
1
0.01
0.01
<0.0
1
<0.0
2
<0.0
1
3.98
99.7
7
MPL
P892
Pars
ata
BH
4
11.0
0
12.0
0
74.3
0
0.33
8.68
5.96
0.18
1.88
1.19
1.32
1.38
0.25
<0.1
<0.0
1
0.05
<0.0
2
<0.0
2
0.01
0.02
0.01
<0.0
1
0.02
<0.0
1
<0.0
2
<0.0
1
4.25
99.8
3
MPL
P891
Pars
ata
BH
4
9.00
9.40
72.3
9
0.43
10.8
8
4.24
0.08
1.86
1.25
1.54
1.55
0.22
<0.1
0.01
0.06
<0.0
2
<0.0
2
<0.0
1
0.02
0.01
0.02
0.02
<0.0
1
<0.0
2
0.01
4.86
99.4
5
MPL
P890
Pars
ata
BH
4
7.00
7.30
67.2
0
0.53
12.2
2
6.59
0.09
2.10
1.46
1.66
1.83
0.30
<0.1
0.01
0.08
<0.0
2
<0.0
2
0.01
0.01
0.01
<0.0
1
0.02
<0.0
1
<0.0
2
0.02
5.62
99.7
6
MPL
P889
Pars
ata
BH
4
5.00
6.00
65.7
3
0.52
12.3
8
6.91
0.10
2.37
1.88
1.58
1.70
0.39
<0.1
0.01
0.08
<0.0
2
<0.0
2
0.01
0.06
0.01
<0.0
1
0.04
<0.0
1
<0.0
2
0.02
5.93
99.7
2
T
op
Bot
tom
%
%
%
%
%
%
%
%
%
%
%
%
%
%
%
%
%
%
%
%
%
%
%
%
%
Sam
ple
nam
e
Site
Dep
th (m
)
SiO
2
TiO
2
Al 2O
3
Fe2O
3t
Mn 3
O4
MgO
CaO
Na 2
O
K2O
P 2O
5
SO3
Cr 2
O3
SrO
ZrO
2
BaO
NiO
CuO
ZnO
PbO
V2O
5
HfO
2
F Cl
LO
I
Tot
al
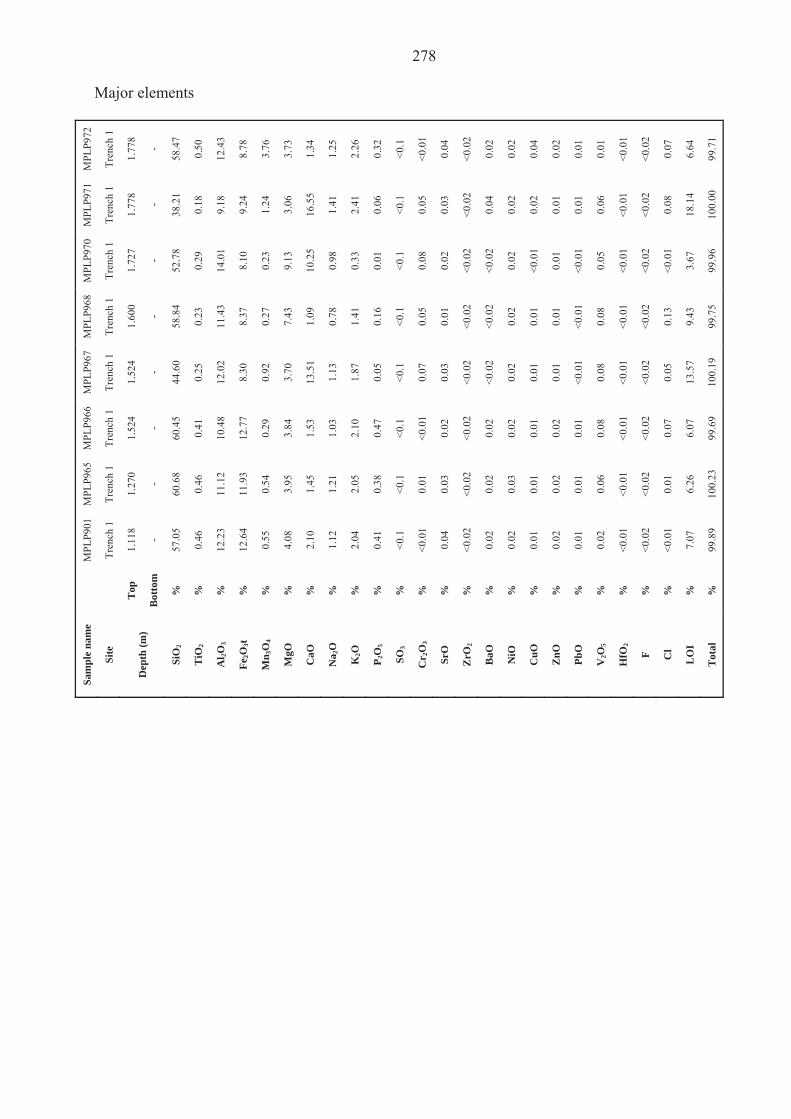
278
Major elements
MPL
P972
Tren
ch 1
1.77
8
-
58.4
7
0.50
12.4
3
8.78
3.76
3.73
1.34
1.25
2.26
0.32
<0.1
<0.0
1
0.04
<0.0
2
0.02
0.02
0.04
0.02
0.01
0.01
<0.0
1
<0.0
2
0.07
6.64
99.7
1
MPL
P971
Tren
ch 1
1.77
8
-
38.2
1
0.18
9.18
9.24
1.24
3.06
16.5
5
1.41
2.41
0.06
<0.1
0.05
0.03
<0.0
2
0.04
0.02
0.02
0.01
0.01
0.06
<0.0
1
<0.0
2
0.08
18.1
4
100.
00
MPL
P970
Tren
ch 1
1.72
7
-
52.7
8
0.29
14.0
1
8.10
0.23
9.13
10.2
5
0.98
0.33
0.01
<0.1
0.08
0.02
<0.0
2
<0.0
2
0.02
<0.0
1
0.01
<0.0
1
0.05
<0.0
1
<0.0
2
<0.0
1
3.67
99.9
6
MPL
P968
Tren
ch 1
1.60
0
-
58.8
4
0.23
11.4
3
8.37
0.27
7.43
1.09
0.78
1.41
0.16
<0.1
0.05
0.01
<0.0
2
<0.0
2
0.02
0.01
0.01
<0.0
1
0.08
<0.0
1
<0.0
2
0.13
9.43
99.7
5
MPL
P967
Tren
ch 1
1.52
4
-
44.6
0
0.25
12.0
2
8.30
0.92
3.70
13.5
1
1.13
1.87
0.05
<0.1
0.07
0.03
<0.0
2
<0.0
2
0.02
0.01
0.01
<0.0
1
0.08
<0.0
1
<0.0
2
0.05
13.5
7
100.
19
MPL
P966
Tren
ch 1
1.52
4
-
60.4
5
0.41
10.4
8
12.7
7
0.29
3.84
1.53
1.03
2.10
0.47
<0.1
<0.0
1
0.02
<0.0
2
0.02
0.02
0.01
0.02
0.01
0.08
<0.0
1
<0.0
2
0.07
6.07
99.6
9
MPL
P965
Tren
ch 1
1.27
0
-
60.6
8
0.46
11.1
2
11.9
3
0.54
3.95
1.45
1.21
2.05
0.38
<0.1
0.01
0.03
<0.0
2
0.02
0.03
0.01
0.02
0.01
0.06
<0.0
1
<0.0
2
0.01
6.26
100.
23
MPL
P901
Tren
ch 1
1.11
8
-
57.0
5
0.46
12.2
3
12.6
4
0.55
4.08
2.10
1.12
2.04
0.41
<0.1
<0.0
1
0.04
<0.0
2
0.02
0.02
0.01
0.02
0.01
0.02
<0.0
1
<0.0
2
<0.0
1
7.07
99.8
9
T
op
Bot
tom
%
%
%
%
%
%
%
%
%
%
%
%
%
%
%
%
%
%
%
%
%
%
%
%
%
Sam
ple
nam
e
Site
Dep
th (m
)
SiO
2
TiO
2
Al 2O
3
Fe2O
3t
Mn 3
O4
MgO
CaO
Na 2
O
K2O
P 2O
5
SO3
Cr 2
O3
SrO
ZrO
2
BaO
NiO
CuO
ZnO
PbO
V2O
5
HfO
2
F Cl
LO
I
Tot
al

279
Trace elements (all concentrations ppm)
U
2 2 2 2 2 1 <1
3 2 3 2 4 3 2 2 2
Th
6 5 6 6 5 5 3 5 3 5 7 6 6 8 6 7
Bi
<1
<1
1 <1
1 <1
<1
<1
1 1 <1
<1
<1
<1
1 1
Pb
12
18
18
12
23
26
19
19
17
20
13
13
16
18
20
21
Tl
1 1 <1
<1
<1
1 1 <1
<1
1 1 1 <1
<1
<1
<1
W
3 3 3 3 4 4 2 4 3 3 2 2 3 4 4 4
Ta
<1
<1
<1
<1
<1
<1
<1
<1
<1
<1
<1
<1
<1
<1
<1
<1
Hf
2 4 3 4 4 3 2 3 6 3 3 4 3 4 3 3
Yb
2 1 3 4 2 4 1 3 <1
2 2 2 4 5 2 2
Sm
6 6 7 8 7 8 3 5 <3
5 6 5 5 11
4 5
Nd
30
28
31
35
31
41
25
33
16
27
33
25
34
59
32
35
Mo
1 2 1 <1
2 1 3 4 4 2 1 2 1 2 2 1
Nb
11
11
11
9 9 7 7 11
6 11
11
10
10
11
10
10
Zr
88
91
96
89
85
67
61
101
154
97
100
90
95
114
91
94
Y
35
35
35
44
35
41
23
36
19
27
36
25
40
67
37
37
Sr
274
236
295
573
522
349
404
232
253
222
288
301
478
461
559
570
Rb
46
48
52
49
54
51
35
48
29
48
55
52
51
59
61
64
Br
2 <1
<1
2 <1
<1
4 5 5 3 <1
<1
<1
<1
2 1
Se
<1
<1
<1
<1
<1
<1
<1
<1
<1
<1
<1
<1
<1
<1
<1
<1
As
2 3 2 2 2 15
6 10
10
7 2 <1
2 2 3 3
Ge
1 1 2 <1
<1
1 <1
1 <1
<1
1 <1
1 1 1 1
Ga
13
13
14
12
11
9 9 14
16
14
15
13
13
14
12
13
Zn
90
104
74
72
80
93
70
102
102
138
77
67
82
108
86
89
Cu
55
65
79
61
61
92
102
79
233
261
59
84
55
130
51
49
Ni
53
51
88
74
64
75
98
79
97
79
89
88
82
101
64
70
Co
20
22
53
28
22
27
37
29
30
30
44
47
35
33
22
25
Cr
85
90
96
79
67
44
94
89
49
92
103
91
102
97
77
80
V
97
109
111
122
121
102
88
110
79
125
112
122
103
135
87
93
Sc
13
14
15
14
13
13
14
15
22
13
16
14
15
18
14
15
Dep
th (m
)
Bot
tom
2 7 13
18
23
28
6 9 10.4
15
16.2
17.6
21
23
25
27
Top
1 6 12
17
22
27
5 8 10
14
16.2
17.2
20
22
24
26
Site
Pars
ata
BH
1
Pars
ata
BH
1
Pars
ata
BH
1
Pars
ata
BH
1
Pars
ata
BH
1
Pars
ata
BH
1
Pars
ata
BH
2
Pars
ata
BH
2
Pars
ata
BH
2
Pars
ata
BH
2
Pars
ata
BH
2
Pars
ata
BH
2
Pars
ata
BH
2
Pars
ata
BH
2
Pars
ata
BH
2
Pars
ata
BH
2
Sam
ple
nam
e
MPL
P862
MPL
P863
MPL
P864
MPL
P865
MPL
P866
MPL
P867
MPL
P869
MPL
P870
MPL
P871
MPL
P873
MPL
P874
MPL
P875
MPL
P877
MPL
P878
MPL
P879
MPL
P880

280
Trace elements (all concentrations ppm)
U
2 1 <1
<1
1 3 2 1 3 1 1 1 1 1 <1
<1
Th
7 6 3 6 9 7 7 6 6 4 4 4 <1
<1
5 5
Bi
<1
<1
1 <1
2 1 2 1 <1
2 <1
2 2 <1
<1
2
Pb
27
88
49
89
115
12
39
21
117
31
52
80
6 8 76
56
Tl
<1
<1
<1
2 1 <1
<1
<1
<1
<1
1 <1
<1
<1
<1
1
W
4 4 4 4 7 3 2 4 4 4 3 3 <1
<1
3 6
Ta
<1
<1
<1
<1
<1
<1
<1
<1
<1
1 <1
<1
<1
<1
<1
<1
Hf
4 3 2 3 3 5 5 3 3 2 2 2 <1
<1
3 3
Yb
3 3 4 4 7 4 3 4 2 3 4 3 2 <1
3 5
Sm
6 8 6 11
10
10
5 6 5 9 4 5 <3
<3
6 9
Nd
41
46
40
56
74
41
37
34
30
41
33
36
12
10
40
66
Mo
2 4 3 7 8 2 2 2 <1
2 2 2 <1
<1
3 3
Nb
10
6 5 7 9 11
10
10
8 6 5 7 1 1 7 8
Zr
92
69
67
87
103
101
99
95
80
68
55
78
8 8 78
89
Y
44
43
43
53
65
49
39
36
33
40
33
31
13
10
35
71
Sr
525
345
430
513
429
652
600
645
528
368
312
435
234
209
573
512
Rb
59
50
50
74
85
64
62
65
54
51
40
55
21
27
56
61
Br
<1
1 <1
1 2 3 2 2 2 <1
<1
<1
<1
<1
3 2
Se
<1
<1
<1
<1
<1
<1
<1
<1
<1
<1
<1
<1
<1
<1
<1
<1
As
4 15
12
28
45
3 2 26
4 15
7 9 13
21
14
23
Ge
<1
2 <1
<1
1 1 3 <1
<1
1 1 <1
1 1 <1
1
Ga
14
9 9 12
12
15
14
13
12
9 8 11
8 8 11
12
Zn
100
92
109
144
144
103
100
90
87
92
84
137
58
65
115
122
Cu
93
237
120
165
195
74
408
62
177
121
124
143
73
74
145
226
Ni
88
94
133
171
166
71
82
84
70
73
97
210
116
118
168
168
Co
32
35
55
81
80
18
25
23
55
26
36
64
58
48
41
41
Cr
82
45
86
65
46
77
77
78
59
41
50
131
285
346
113
87
V
118
74
82
146
168
93
205
90
72
76
60
81
179
187
95
81
Sc
15
12
15
19
16
15
14
15
14
12
12
18
24
30
18
19
Dep
th (m
)
Bot
tom
29
33
37
39
41
4.3
6 7.3
9.4
12
15
16.3
21
21.4
- -
Top
28
32
36
38
40
4 5 7 9 11
14
16
20
21
0.50
8
0.76
2
Site
Pars
ata
BH
2
Pars
ata
BH
2
Pars
ata
BH
2
Pars
ata
BH
2
Pars
ata
BH
2
Pars
ata
BH
4
Pars
ata
BH
4
Pars
ata
BH
4
Pars
ata
BH
4
Pars
ata
BH
4
Pars
ata
BH
4
Pars
ata
BH
4
Pars
ata
BH
4
Pars
ata
BH
4
Tren
ch 1
Tren
ch 1
Sam
ple
nam
e
MPL
P881
MPL
P883
MPL
P885
MPL
P886
MPL
P887
MPL
P888
MPL
P889
MPL
P890
MPL
P891
MPL
P892
MPL
P893
MPL
P894
MPL
P895
MPL
P896
MPL
P897
MPL
P898

281
Trace elements (all concentrations ppm)
U
<1
<1
2 2 <1
1 <1
<1
<1
Th
7 6 6 6 <1
1 <1
<1
7
Bi
<1
2 <1
<1
<1
<1
<1
<1
3
Pb
51
63
40
31
15
16
37
16
46
Tl
2 <1
1 1 <1
<1
<1
<1
1
W
7 4 4 5 <1
<1
<1
<1
5
Ta
<1
<1
<1
<1
1 <1
<1
<1
<1
Hf
4 3 1 3 <1
2 <1
<1
4
Yb
5 6 5 7 <1
1 <1
2 5
Sm
9 10
9 10
<3
<3
<3
<3
4
Nd
65
64
59
64
8 16
5 12
57
Mo
2 3 2 <1
<1
<1
<1
<1
3
Nb
9 7 7 7 1 2 2 2 9
Zr
101
97
88
88
10
23
8 9 102
Y
62
66
62
72
8 20
8 11
50
Sr
357
289
252
184
213
116
110
245
307
Rb
73
68
68
69
37
37
9 59
74
Br
1 3 5 6 2 6 <1
5 3
Se
<1
<1
<1
<1
<1
<1
<1
<1
<1
As
37
151
56
34
8 12
<1
14
29
Ge
1 3 6 6 <1
4 2 1 1
Ga
12
13
11
12
9 11
9 9 12
Zn
121
151
164
152
97
103
97
102
128
Cu
260
107
99
71
74
78
89
172
265
Ni
189
166
200
160
138
136
115
124
153
Co
40
41
57
54
62
56
69
50
38
Cr
52
52
67
48
444
287
495
275
50
V
75
106
294
432
393
393
249
346
72
Sc
16
17
16
15
36
27
41
23
15
Dep
th (m
)
Bot
tom
- - - - - - - - -
Top
1.01
6
1.11
8
1.27
1.52
4
1.52
4
1.6
1.72
7
1.77
8
1.77
8
Site
Tren
ch 1
Tren
ch 1
Tren
ch 1
Tren
ch 1
Tren
ch 1
Tren
ch 1
Tren
ch 1
Tren
ch 1
Tren
ch 1
Sam
ple
nam
e
MPL
P899
MPL
P901
MPL
P965
MPL
P966
MPL
P967
MPL
P968
MPL
P970
MPL
P971
MPL
P972

282
Appendix 5: Groundwater data 12
081-
0011
C1
C1
11.8
421
9.41
4 426
8.85
1.80
68.3
4.68
<0.5
n/a
309
8.48
6
3.27
2
1208
1-00
12
C2
C2 10
n.d.
9.58
5.5
425
8.90
1.69
67.9
4.79
<0.5
23
.7
255
8.36
1
3.20
7
1208
1-00
05
E1-1
E1-1
n.d.
n.d.
9.5
n.d.
n.d.
9.48
1.07
56.4
75.3
2.62
52
.2
190
92.7
7.12
8
1208
1-00
10
A6
A6 9
4360
9.67
4
5010
9.60
2.22
50.7
921
42.9
10
2
150
1383
97.0
1208
1-00
04
A1-
4
A1-
4
9
5150
9.78
3.5
6010
9.27
11.2
5.73
1214
54.0
61
.2
124
1748
78.5
1208
1-00
02
A1-
2
A1-
2
10.2
295
9.26
3
2970
8.82
4.87
48.3
502
23.7
25
.8
288
699
50.7
1208
1-00
03
A1-
3
A1-
3
8.2
5690
10.0
1
3
6500
9.31
12.2
0.55
4
1337
60.1
54
.1
96.4
1926
114
1208
1-00
01
A1-
1
A1-
1
8.5
6820
11.9
4 n.d.
11.3
37.2
0.10
1
1435
63.1
n/a
272
2177
101
1208
1-00
14
AL-
2-1
A2
10.1
1260
9.69
5
1207
9.04
1.61
65.5
172
7.33
38
.5
232
254
22.8
1208
1-00
15
AL-
3-1
A3
10.9
1445
9.84
4
1489
9.29
1.32
63.9
238
10.2
50
.5
203
369
30.5
1208
1-00
09
A5-
1
A5
9.5
1430
9.8 3
1449
9.22
1.34
64.2
224
9.76
n/a
307
346
27.7
1208
1-00
06
A4-
2
A4-
3
n.d.
n.d.
n.d.
n.d.
4970
9.71
3.37
58.8
921
40.7
14
0
154
1321
106
1208
1-00
07
A4-
3
A4-
2
n.d.
n.d.
n.d.
n.d.
4990
9.90
3.43
58.4
893
40.5
16
1
121
1342
106
1208
1-00
08
A4-
4
A4-
1
n.d.
n.d.
n.d.
n.d.
4160
9.77
3.20
58.7
747
31.4
12
7
152
1093
87.2
°C
μS c
m-1
mg
L-1
μS c
m-1
m
g L-1
mg
L-1
mg
L-1
mg
L-1
mg
L-1
mg
L-1
mg
L-1
mg
L-1
mg
L-1
BG
S La
bora
tory
(L
IMS)
Cod
e
Orig
inal
sam
ple
num
ber
Cor
rect
ed
sam
ple
Cod
e
Fiel
d Te
mp
Fiel
d C
ondu
ctiv
ity
Fiel
d pH
(te
mpe
ratu
re-
corr
ecte
d)
Fiel
d D
O2
Con
duct
ivity
pH
Ca2+
Mg2+
Na+
K+
OH
-
CO
32-
HC
O3-
Cl-
SO42-

283
12
081-
0011
C1
C1
0.64
0
5.91
5.38
4.73
<0.0
3
<0.0
2
<0.1
<0.0
1
0.51
2
<0.0
1
1.36
4
0.02
19.9
7
<0.3
0.84
8
1.81
0.00
2
1208
1-00
12
C2
C2
0.58
0
5.88
5.29
5.30
0.03
6
<0.0
2
<0.1
<0.0
1
<1
<0.0
1
1.35
2
0.02
20.8
3
<0.3
0.70
5
1.51
<0.0
02
1208
1-00
05
E1-1
E1-1
1.03
8.07
7.63
2.79
0.22
1
<0.0
2
<0.1
<0.0
1
<1
<0.0
1
2.79
6
0.1
14.9
2
<0.3
<0.0
75
<0.1
6044
75
<0.0
02
1208
1-00
10
A6
A6
7.31
46.0
1
47.0
3
-1.0
9
3.21
<1
<0.1
<0.0
1
0.86
5
<0.0
1
32.2
0.02
<0.6
3
<0.3
0.13
2
0.28
2
0.00
2
1208
1-00
04
A1-
4
A1-
4
8.33
55.9
6
55.2
0
0.69
3.93
<1
<5
<0.5
4.27
0.01
0
35.4
0.01
26.0
9
<0.3
0.92
0
1.97
0.00
8
1208
1-00
02
A1-
2
A1-
2
3.90
27.0
1
26.4
3
1.07
1.69
-1.0
0
<0.1
<0.0
1
1.03
<0.0
1
16.9
<0.0
1
<0.2
9
1.7
2.01
4.29
0.00
5
1208
1-00
03
A1-
3
A1-
3
10.3
61.2
2
60.3
1
0.75
4.47
<1
<0.1
<0.0
1
6.88
0.02
2
38.3
<0.0
1
0.26
0.5
0.15
3
0.32
6
0.01
0
1208
1-00
01
A1-
1
A1-
1
<1.5
67.4
7
68.0
5
-0.4
3
6.27
<1
<5
<0.5
0.59
9
<0.0
1
42.5
0.02
20.9
6
10.7
<0.0
75
<0.1
61
0.01
9
1208
1-00
14
AL-
2-1
A2
1.66
13.2
3
12.7
5
1.85
0.51
0
<0.2
<0.1
0.01
1
0.54
2
<0.0
1
8.17
5
0.02
7.04
<0.3
0.34
5
0.73
7
<0.0
02
1208
1-00
15
AL-
3-1
A3
2.22
16.1
2
16.1
0
0.06
0.94
5
<0.2
<0.1
<0.0
1
<0.5
<0.0
1
10.7
0.02
4.70
<0.3
0.09
0
0.19
3
<0.0
02
1208
1-00
09
A5-
1
A5
1.98
15.4
9
15.4
1
0.26
0.84
8
<0.2
<0.1
<0.0
1
0.53
3
<0.0
1
9.83
1
0.02
5.95
<0.3
0.10
5
0.22
6
<0.0
02
1208
1-00
06
A4-
2
A4-
3
2.40
47.1
3
46.7
2
0.44
3.14
<1
<0.1
<0.0
1
0.96
0
<0.0
1
35.2
<0.0
1
<0.3
8
8.1
0.29
7
0.63
5
0.00
3
1208
1-00
07
A4-
3
A4-
2
1.82
45.8
2
47.4
8
-1.7
8
3.09
<1
<0.1
<0.0
1
1.11
<0.0
1
35.0
0.02
<1.2
1
7.3
0.31
1
0.66
6
0.00
3
1208
1-00
08
A4-
4
A4-
1
0.34
3
38.8
6
39.4
1
-0.7
0
2.49
<1
<0.1
<0.0
1
0.90
0
<0.0
1
28.4
0.02
<2.3
2
2.4
0.33
9
0.72
5
0.00
4
mg
L-1
meq
L-1
meq
L-1
%
mg
L-1
mg
L-1
mg
L-1
mg
L-1
mg
L-1
mg
L-1
mg
L-1
mg
L-1
%
mg
L-1
mg
L-1
mg
L-1
mg
L-1
BG
S La
bora
tory
(L
IMS)
Cod
e
Orig
inal
sam
ple
num
ber
Cor
rect
ed
sam
ple
Cod
e
NO
3-
Cat
ion
Tota
l
Ani
on T
otal
Bal
ance
Br-
NO
2-
HPO
42-
F-
NPO
C
Tota
l P
Tota
l S
Red
uced
S
S D
iff
NH
4+
Si
SiO
2
Ba
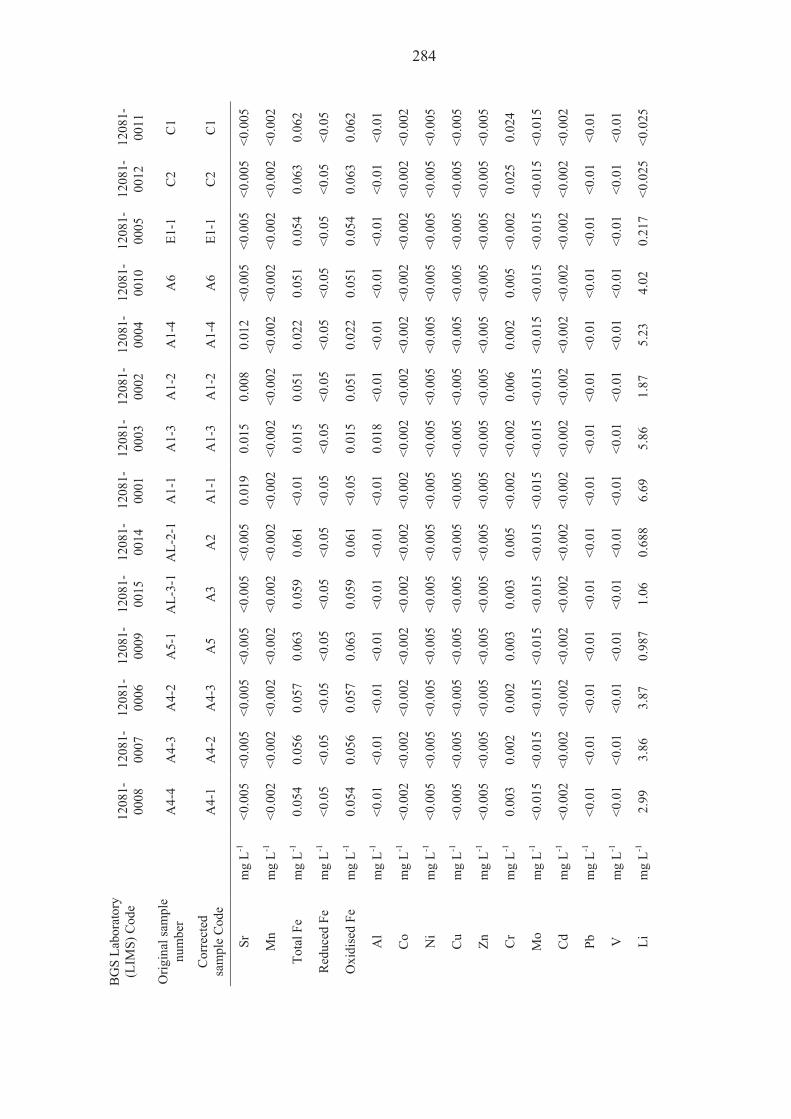
284
1208
1-00
11
C1
C1
<0.0
05
<0.0
02
0.06
2
<0.0
5
0.06
2
<0.0
1
<0.0
02
<0.0
05
<0.0
05
<0.0
05
0.02
4
<0.0
15
<0.0
02
<0.0
1
<0.0
1
<0.0
25
1208
1-00
12
C2
C2
<0.0
05
<0.0
02
0.06
3
<0.0
5
0.06
3
<0.0
1
<0.0
02
<0.0
05
<0.0
05
<0.0
05
0.02
5
<0.0
15
<0.0
02
<0.0
1
<0.0
1
<0.0
25
1208
1-00
05
E1-1
E1-1
<0.0
05
<0.0
02
0.05
4
<0.0
5
0.05
4
<0.0
1
<0.0
02
<0.0
05
<0.0
05
<0.0
05
<0.0
02
<0.0
15
<0.0
02
<0.0
1
<0.0
1
0.21
7
1208
1-00
10
A6
A6
<0.0
05
<0.0
02
0.05
1
<0.0
5
0.05
1
<0.0
1
<0.0
02
<0.0
05
<0.0
05
<0.0
05
0.00
5
<0.0
15
<0.0
02
<0.0
1
<0.0
1
4.02
1208
1-00
04
A1-
4
A1-
4
0.01
2
<0.0
02
0.02
2
<0.0
5
0.02
2
<0.0
1
<0.0
02
<0.0
05
<0.0
05
<0.0
05
0.00
2
<0.0
15
<0.0
02
<0.0
1
<0.0
1
5.23
1208
1-00
02
A1-
2
A1-
2
0.00
8
<0.0
02
0.05
1
<0.0
5
0.05
1
<0.0
1
<0.0
02
<0.0
05
<0.0
05
<0.0
05
0.00
6
<0.0
15
<0.0
02
<0.0
1
<0.0
1
1.87
1208
1-00
03
A1-
3
A1-
3
0.01
5
<0.0
02
0.01
5
<0.0
5
0.01
5
0.01
8
<0.0
02
<0.0
05
<0.0
05
<0.0
05
<0.0
02
<0.0
15
<0.0
02
<0.0
1
<0.0
1
5.86
1208
1-00
01
A1-
1
A1-
1
0.01
9
<0.0
02
<0.0
1
<0.0
5
<0.0
5
<0.0
1
<0.0
02
<0.0
05
<0.0
05
<0.0
05
<0.0
02
<0.0
15
<0.0
02
<0.0
1
<0.0
1
6.69
1208
1-00
14
AL-
2-1
A2
<0.0
05
<0.0
02
0.06
1
<0.0
5
0.06
1
<0.0
1
<0.0
02
<0.0
05
<0.0
05
<0.0
05
0.00
5
<0.0
15
<0.0
02
<0.0
1
<0.0
1
0.68
8
1208
1-00
15
AL-
3-1
A3
<0.0
05
<0.0
02
0.05
9
<0.0
5
0.05
9
<0.0
1
<0.0
02
<0.0
05
<0.0
05
<0.0
05
0.00
3
<0.0
15
<0.0
02
<0.0
1
<0.0
1
1.06
1208
1-00
09
A5-
1
A5
<0.0
05
<0.0
02
0.06
3
<0.0
5
0.06
3
<0.0
1
<0.0
02
<0.0
05
<0.0
05
<0.0
05
0.00
3
<0.0
15
<0.0
02
<0.0
1
<0.0
1
0.98
7
1208
1-00
06
A4-
2
A4-
3
<0.0
05
<0.0
02
0.05
7
<0.0
5
0.05
7
<0.0
1
<0.0
02
<0.0
05
<0.0
05
<0.0
05
0.00
2
<0.0
15
<0.0
02
<0.0
1
<0.0
1
3.87
1208
1-00
07
A4-
3
A4-
2
<0.0
05
<0.0
02
0.05
6
<0.0
5
0.05
6
<0.0
1
<0.0
02
<0.0
05
<0.0
05
<0.0
05
0.00
2
<0.0
15
<0.0
02
<0.0
1
<0.0
1
3.86
1208
1-00
08
A4-
4
A4-
1
<0.0
05
<0.0
02
0.05
4
<0.0
5
0.05
4
<0.0
1
<0.0
02
<0.0
05
<0.0
05
<0.0
05
0.00
3
<0.0
15
<0.0
02
<0.0
1
<0.0
1
2.99
mg
L-1
mg
L-1
mg
L-1
mg
L-1
mg
L-1
mg
L-1
mg
L-1
mg
L-1
mg
L-1
mg
L-1
mg
L-1
mg
L-1
mg
L-1
mg
L-1
mg
L-1
mg
L-1
BG
S La
bora
tory
(L
IMS)
Cod
e
Orig
inal
sam
ple
num
ber
Cor
rect
ed
sam
ple
Cod
e
Sr
Mn
Tota
l Fe
Red
uced
Fe
Oxi
dise
d Fe
Al
Co Ni
Cu Zn
Cr
Mo
Cd Pb
V
Li

285
12
081-
0011
C1
C1
0.09
8
<0.0
15
<0.0
25
<7.4
8
<37.
6
n/a
QC
failu
re fo
r B a
nd K
aff
ectin
g 1
and
4 du
ps o
nly:
v g
ood
agre
emen
t with
orig
inal
ana
lysi
s, da
ta a
ccep
ted,
cav
eat o
n A
RC
N
Not
e: fi
eld
cond
uctiv
ity m
easu
rem
ent f
or sa
mpl
e A
1-2
appe
ars t
o be
a fa
ctor
of 1
0 to
o lo
w, w
hich
may
be
due
to a
n er
ror i
n re
cord
ing
the
wro
ng sc
ale
in th
e fie
ld.
1208
1-00
12
C2
C2
0.06
0
<0.0
15
<0.0
25
<7.5
9
<39.
1
5.2
± 0.
4
Sam
ples
1 a
nd 4
- al
l IC
ana
lyse
s fro
m 2
0x d
ilutio
n
1208
1-00
05
E1-1
E1-1
0.49
2
<0.0
15
<0.0
25
<7.5
4
<37.
5
n/a
1208
1-00
10
A6
A6
6.19
<0.0
15
<0.0
25
<6.9
3
<37.
9
n/a
1208
1-00
04
A1-
4
A1-
4
9.16
<0.0
15
<0.0
25
<7.1
2
<36.
7
n/a
ICP
data
from
sam
ples
120
81-0
002,
-000
3, -0
006,
-000
7, -0
008,
-000
09, -
0010
and
-001
5 re
porte
d ou
tsid
e U
KA
S ow
ing
to h
igh
Na
conc
entra
ions
in so
lutio
ns a
naly
sed.
1208
1-00
02
A1-
2
A1-
2
3.65
<0.0
15
<0.0
25
<7.0
1
<35.
6
n/a
1208
1-00
03
A1-
3
A1-
3
9.32
<0.0
15
<0.0
25
<6.2
6
<36.
9
n/a
1208
1-00
01
A1-
1
A1-
1
10
<0.0
15
<0.0
25
<6.9
9
<38.
4
<1
1208
1-00
14
AL-
2-1
A2
1.32
<0.0
15
<0.0
25
<7.4
2
<37.
1
n/a
1208
1-00
15
AL-
3-1
A3
1.85
<0.0
15
<0.0
25
<7.2
<39.
3
n/a
1208
1-00
09
A5-
1
A5
1.73
<0.0
15
<0.0
25
<7.5
1
<38.
7
n/a
1208
1-00
06
A4-
2
A4-
3
5.55
<0.0
15
<0.0
25
<7.2
4
<37.
5
n/a
1208
1-00
07
A4-
3
A4-
2
5.61
<0.0
15
<0.0
25
<6.7
4
<37.
1
n/a
1208
1-00
08
A4-
4
A4-
1
4.49
<0.0
15
<0.0
25
<6.8
<35.
3
4.5
± 0.
4
mg
L-1
mg
L-1
mg
L-1
‰V
SMO
W
‰V
SMO
W
TU
Cav
eats
for A
RC
N
BG
S La
bora
tory
(L
IMS)
Cod
e
Orig
inal
sam
ple
num
ber
Cor
rect
ed sa
mpl
e C
ode
B
As
Se
18O
2H
Triti
um a
ctiv
ity

286
1208
1-00
12
dup2
C2
C2 10
n.d.
9.58
5.5
n.d.
8.87
1.70
68.9
4.67
<0.5
21
.9
258
8.20
4
3.08
7
1208
1-00
12
dup1
C2
C2 10
n.d.
9.58
5.5
n.d.
8.84
1.70
68.9
4.80
<0.5
23
.4
258
8.26
4
3.15
1
1208
1-00
05
dup2
E1-1
E1-1
n.d.
n.d.
n.d.
n.d.
n.d.
9.42
1.09
57.6
76.1
2.81
49
.3
188
90.9
6.80
1
1208
1-00
05
dup1
E1-1
E1-1
n.d.
n.d.
n.d.
n.d.
n.d.
9.45
1.10
57.9
76.9
2.82
48
.2
192
90.6
6.93
1
1208
1-00
04
dup2
A1-
4
A1-
4
9
5150
9.78
3.5
6040
9.31
11.5
5.89
1108
50.6
57
.7
131
1755
82.2
1208
1-00
04
dup1
A1-
4
A1-
4
9
5150
9.78
3.5
6040
9.33
11.3
5.91
1155
52.9
64
.5
113
1750
81.5
1208
1-00
01
dup2
A1-
1
A1-
1
8.5
6820
11.9
4 n.d.
11.4
37.4
0.10
4
1456
65.6
n/a
280
2180
101
1208
1-00
01
dup1
A1-
1
A1-
1
8.5
6820
11.9
4 n.d.
11.3
35.9
0.10
1
1462
64.9
n/a
282
2193
103
1208
1-00
18
Dis
tille
d w
ater
B
lank
D
istil
led
wat
er
Bla
nk
n/a
n/a
n/a
n/a
n/a
n/a
<0.1
<0.0
1
<0.3
5
<0.5
n/a
n/a
<0.0
5
<0.0
5
1208
1-00
16
D2
D2
14.8
1394
8.25
6
1334
8.21
154.
7
69.3
82.8
1.01
n/a
413
204
151
°C
μS c
m-1
mg
L-1
μS c
m-1
m
g L-1
mg
L-1
mg
L-1
mg
L-1
mg
L-1
mg
L-1
mg
L-1
mg
L-1
mg
L-1
BG
S La
bora
tory
(L
IMS)
Cod
e
Orig
inal
sam
ple
num
ber
Cor
rect
ed sa
mpl
e C
ode
Fiel
d Te
mp
Fiel
d C
ondu
ctiv
ity
Fiel
d pH
(te
mpe
ratu
re-
corr
ecte
d)
Fiel
d D
O2
Con
duct
ivity
pH
Ca2+
Mg2+
Na+
K+
OH
-
CO
32-
HC
O3-
Cl-
SO42-
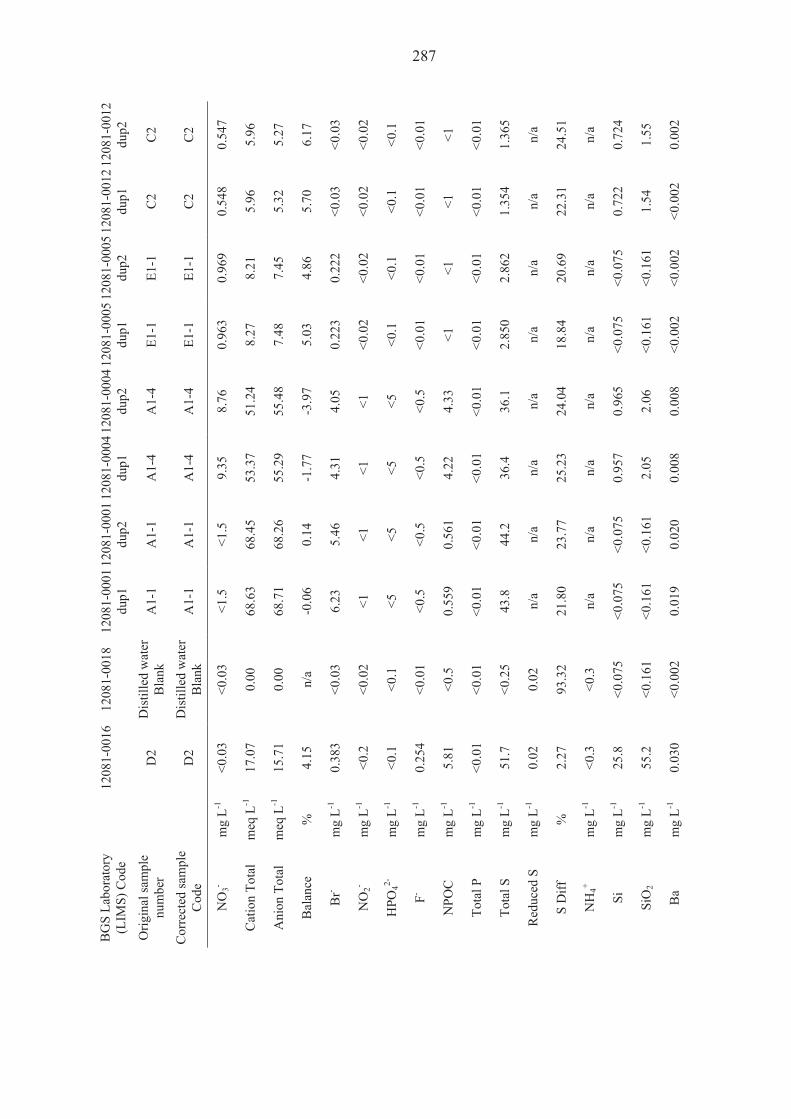
287
12
081-
0012
du
p2
C2
C2
0.54
7
5.96
5.27
6.17
<0.0
3
<0.0
2
<0.1
<0.0
1
<1
<0.0
1
1.36
5
n/a
24.5
1
n/a
0.72
4
1.55
0.00
2
1208
1-00
12
dup1
C2
C2
0.54
8
5.96
5.32
5.70
<0.0
3
<0.0
2
<0.1
<0.0
1
<1
<0.0
1
1.35
4
n/a
22.3
1
n/a
0.72
2
1.54
<0.0
02
1208
1-00
05
dup2
E1-1
E1-1
0.96
9
8.21
7.45
4.86
0.22
2
<0.0
2
<0.1
<0.0
1
<1
<0.0
1
2.86
2
n/a
20.6
9
n/a
<0.0
75
<0.1
61
<0.0
02
1208
1-00
05
dup1
E1-1
E1-1
0.96
3
8.27
7.48
5.03
0.22
3
<0.0
2
<0.1
<0.0
1
<1
<0.0
1
2.85
0
n/a
18.8
4
n/a
<0.0
75
<0.1
61
<0.0
02
1208
1-00
04
dup2
A1-
4
A1-
4
8.76
51.2
4
55.4
8
-3.9
7
4.05
<1
<5
<0.5
4.33
<0.0
1
36.1
n/a
24.0
4
n/a
0.96
5
2.06
0.00
8
1208
1-00
04
dup1
A1-
4
A1-
4
9.35
53.3
7
55.2
9
-1.7
7
4.31
<1
<5
<0.5
4.22
<0.0
1
36.4
n/a
25.2
3
n/a
0.95
7
2.05
0.00
8
1208
1-00
01
dup2
A1-
1
A1-
1
<1.5
68.4
5
68.2
6
0.14
5.46
<1
<5
<0.5
0.56
1
<0.0
1
44.2
n/a
23.7
7
n/a
<0.0
75
<0.1
61
0.02
0
1208
1-00
01
dup1
A1-
1
A1-
1
<1.5
68.6
3
68.7
1
-0.0
6
6.23
<1
<5
<0.5
0.55
9
<0.0
1
43.8
n/a
21.8
0
n/a
<0.0
75
<0.1
61
0.01
9
1208
1-00
18
Dis
tille
d w
ater
B
lank
D
istil
led
wat
er
Bla
nk
<0.0
3
0.00
0.00
n/a
<0.0
3
<0.0
2
<0.1
<0.0
1
<0.5
<0.0
1
<0.2
5
0.02
93.3
2
<0.3
<0.0
75
<0.1
61
<0.0
02
1208
1-00
16
D2
D2
<0.0
3
17.0
7
15.7
1
4.15
0.38
3
<0.2
<0.1
0.25
4
5.81
<0.0
1
51.7
0.02
2.27
<0.3
25.8
55.2
0.03
0
mg
L-1
meq
L-1
meq
L-1
%
mg
L-1
mg
L-1
mg
L-1
mg
L-1
mg
L-1
mg
L-1
mg
L-1
mg
L-1
%
mg
L-1
mg
L-1
mg
L-1
mg
L-1
BG
S La
bora
tory
(L
IMS)
Cod
e
Orig
inal
sam
ple
num
ber
Cor
rect
ed sa
mpl
e C
ode
NO
3-
Cat
ion
Tota
l
Ani
on T
otal
Bal
ance
Br-
NO
2-
HPO
42-
F-
NPO
C
Tota
l P
Tota
l S
Red
uced
S
S D
iff
NH
4+
Si
SiO
2
Ba

288
1208
1-00
12
dup2
C2
C2
<0.0
05
<0.0
02
0.06
2
<0.0
5
0.06
2
<0.0
1
<0.0
02
<0.0
05
<0.0
05
<0.0
05
0.02
5
<0.0
15
<0.0
02
<0.0
1
<0.0
1
<0.0
25
1208
1-00
12
dup1
C2
C2
<0.0
05
<0.0
02
0.06
1
<0.0
5
0.06
1
<0.0
1
<0.0
02
<0.0
05
<0.0
05
<0.0
05
0.02
4
<0.0
15
<0.0
02
<0.0
1
<0.0
1
<0.0
25
1208
1-00
05
dup2
E1-1
E1-1
<0.0
05
<0.0
02
0.05
5
<0.0
5
0.05
5
<0.0
1
<0.0
02
<0.0
05
<0.0
05
<0.0
05
<0.0
02
<0.0
15
<0.0
02
<0.0
1
<0.0
1
0.22
0
1208
1-00
05
dup1
E1-1
E1-1
<0.0
05
<0.0
02
0.05
6
<0.0
5
0.05
6
<0.0
1
<0.0
02
<0.0
05
<0.0
05
<0.0
05
<0.0
02
<0.0
15
<0.0
02
<0.0
1
<0.0
1
0.22
4
1208
1-00
04
dup2
A1-
4
A1-
4
0.01
1
<0.0
02
0.02
4
<0.0
5
0.02
4
<0.0
1
<0.0
02
<0.0
05
<0.0
05
<0.0
05
0.00
2
<0.0
15
<0.0
02
<0.0
1
<0.0
1
4.79
1208
1-00
04
dup1
A1-
4
A1-
4
0.01
2
<0.0
02
0.02
3
<0.0
5
0.02
3
<0.0
1
<0.0
02
<0.0
05
<0.0
05
<0.0
05
<0.0
02
<0.0
15
<0.0
02
<0.0
1
<0.0
1
5.05
1208
1-00
01
dup2
A1-
1
A1-
1
0.02
0
<0.0
02
<0.0
1
<0.0
5
<0.0
5
<0.0
1
<0.0
02
<0.0
05
<0.0
05
0.01
1
<0.0
02
<0.0
15
<0.0
02
<0.0
1
<0.0
1
6.70
1208
1-00
01
dup1
A1-
1
A1-
1
0.02
1
<0.0
02
<0.0
1
<0.0
5
<0.0
5
<0.0
1
<0.0
02
<0.0
05
<0.0
05
<0.0
05
<0.0
02
<0.0
15
<0.0
02
<0.0
1
<0.0
1
6.74
1208
1-00
18
Dis
tille
d w
ater
B
lank
Dis
tille
d w
ater
B
lank
<0.0
05
<0.0
02
<0.0
1
n/a
n/a
<0.0
1
<0.0
02
<0.0
05
<0.0
05
0.00
7
<0.0
02
<0.0
15
<0.0
02
<0.0
1
<0.0
1
<0.0
25
1208
1-00
16
D2
D2
0.72
1
0.00
7
0.06
4
<0.0
5
0.06
4
<0.0
1
<0.0
02
<0.0
05
<0.0
05
<0.0
05
0.01
3
<0.0
15
<0.0
02
<0.0
1
0.02
6
<0.0
25
mg
L-1
mg
L-1
mg
L-1
mg
L-1
mg
L-1
mg
L-1
mg
L-1
mg
L-1
mg
L-1
mg
L-1
mg
L-1
mg
L-1
mg
L-1
mg
L-1
mg
L-1
mg
L-1
BG
S La
bora
tory
(L
IMS)
Cod
e
Orig
inal
sam
ple
num
ber
Cor
rect
ed sa
mpl
e C
ode
Sr
Mn
Tota
l Fe
Red
uced
Fe
Oxi
dise
d Fe
Al
Co Ni
Cu Zn
Cr
Mo
Cd Pb
V
Li
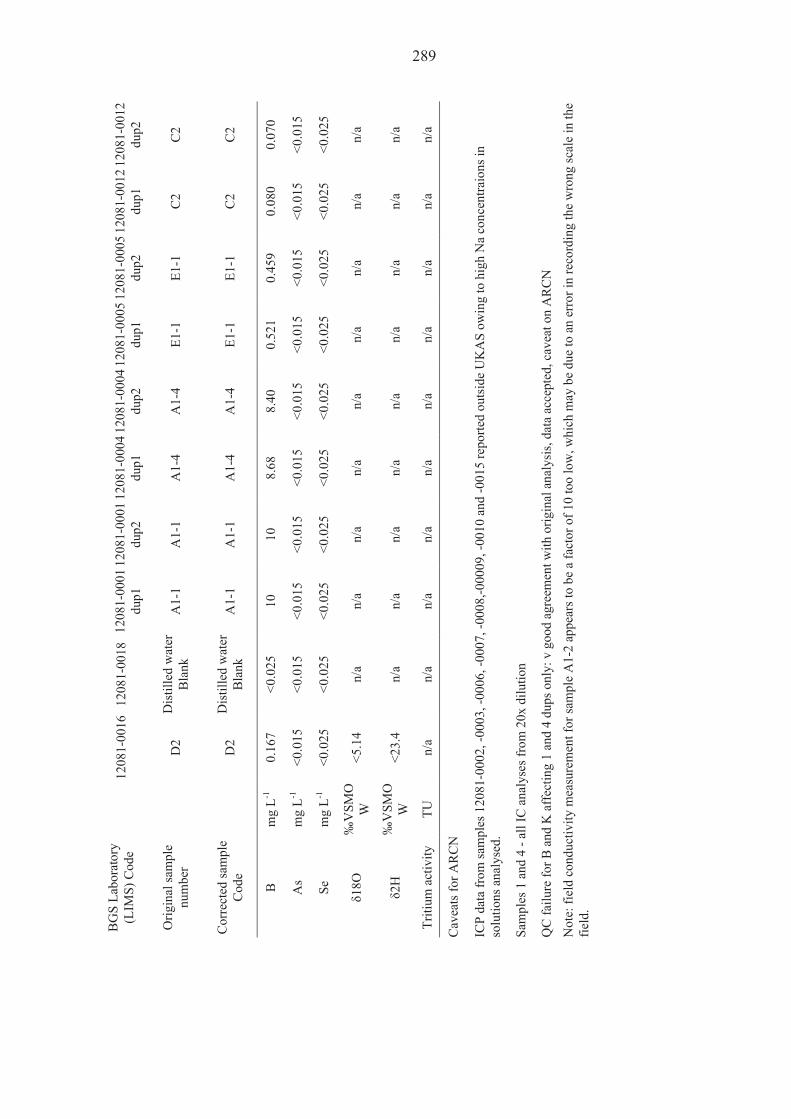
289
12
081-
0012
du
p2
C2
C2
0.07
0
<0.0
15
<0.0
25
n/a
n/a
n/a
ICP
data
from
sam
ples
120
81-0
002,
-000
3, -0
006,
-000
7, -0
008,
-000
09, -
0010
and
-001
5 re
porte
d ou
tsid
e U
KA
S ow
ing
to h
igh
Na
conc
entra
ions
in
solu
tions
ana
lyse
d.
Sam
ples
1 a
nd 4
- al
l IC
ana
lyse
s fro
m 2
0x d
ilutio
n
QC
failu
re fo
r B a
nd K
aff
ectin
g 1
and
4 du
ps o
nly:
v g
ood
agre
emen
t with
orig
inal
ana
lysi
s, da
ta a
ccep
ted,
cav
eat o
n A
RC
N
Not
e: fi
eld
cond
uctiv
ity m
easu
rem
ent f
or sa
mpl
e A
1-2
appe
ars t
o be
a fa
ctor
of 1
0 to
o lo
w, w
hich
may
be
due
to a
n er
ror i
n re
cord
ing
the
wro
ng sc
ale
in th
e fie
ld.
1208
1-00
12
dup1
C2
C2
0.08
0
<0.0
15
<0.0
25
n/a
n/a
n/a
1208
1-00
05
dup2
E1-1
E1-1
0.45
9
<0.0
15
<0.0
25
n/a
n/a
n/a
1208
1-00
05
dup1
E1-1
E1-1
0.52
1
<0.0
15
<0.0
25
n/a
n/a
n/a
1208
1-00
04
dup2
A1-
4
A1-
4
8.40
<0.0
15
<0.0
25
n/a
n/a
n/a
1208
1-00
04
dup1
A1-
4
A1-
4
8.68
<0.0
15
<0.0
25
n/a
n/a
n/a
1208
1-00
01
dup2
A1-
1
A1-
1
10
<0.0
15
<0.0
25
n/a
n/a
n/a
1208
1-00
01
dup1
A1-
1
A1-
1
10
<0.0
15
<0.0
25
n/a
n/a
n/a
1208
1-00
18
Dis
tille
d w
ater
B
lank
Dis
tille
d w
ater
B
lank
<0.0
25
<0.0
15
<0.0
25
n/a
n/a
n/a
1208
1-00
16
D2
D2
0.16
7
<0.0
15
<0.0
25
<5.1
4
<23.
4
n/a
mg
L-1
mg
L-1
mg
L-1
‰V
SMO
W
‰V
SMO
W
TU
Cav
eats
for A
RC
N
BG
S La
bora
tory
(L
IMS)
Cod
e
Orig
inal
sam
ple
num
ber
Cor
rect
ed sa
mpl
e C
ode
B
As
Se
18O
2H
Triti
um a
ctiv
ity

290