Embed Size (px)
Citation preview
1
Cytoskeletal forces during signaling activation in Jurkat T cells
King Lam Hui1, Lakshmi Balagopalan2, Lawrence E. Samelson2, and Arpita Upadhyaya1,3*
1Department of Physics and 3Institute for Physical Sciences and Technology, University of
Maryland, College Park, MD 20742; 2 Laboratory of Cellular and Molecular Biology, Center for
Cancer Research, National Cancer Institute, National Institutes of Health, Bethesda, MD, USA.
* Corresponding author:
Arpita Upadhyaya
1115A, IPST, Building 85
University of Maryland,
College Park, MD 20742
Phone: 301-405-9939
Email: [email protected]
Keywords: Jurkat T cell, traction forces, actin cytoskeleton, receptor, signaling,
mechanosensitivity
Running title: Forces in Jurkat T cells
Abstract T cells are critical for the adaptive immune response in the body. The binding of the T cell
receptor (TCR) with antigen on the surface of antigen presenting cells leads to cell spreading and
signaling activation. The underlying mechanism of signaling activation is not completely
understood. While cytoskeletal forces have been implicated in this process, the contribution of
different cytoskeletal components and their spatial organization is unknown. Here, we use
traction force microscopy to measure the forces exerted by Jurkat T cells during TCR activation.
Perturbation experiments reveal that these forces are largely due to actin assembly and dynamics
with myosin contractility contributing to the development of force but not its maintenance. We
find that Jurkat T cells are mechanosensitive, with cytoskeletal forces and signaling dynamics
both sensitive to the stiffness of the substrate. Our results delineate the cytoskeletal contributions
to interfacial forces exerted by T cells during activation.
http://www.molbiolcell.org/content/suppl/2014/12/16/mbc.E14-03-0830v1.DC1.htmlSupplemental Material can be found at:
2
INTRODUCTION
T lymphocytes are central effectors of the adaptive immune response, circulating through the
body and scanning antigen-presenting cells (APC) for their cognate antigens (Monks et al., 1998;
Wulfing and Davis, 1998). Contact and adhesion between the T-cell and APC results in the T
cell spreading on the APC ensuring close proximity between the cells. Receptors on the T cell
surface (TCR) recognize peptide-MHC complexes on the APC surface. This results in the
activation of TCRs and the formation of signaling microclusters that consist of activated TCR
and various downstream signaling molecules (Bunnell et al., 2002; Campi et al., 2005; Douglass
and Vale, 2005; Varma et al., 2006; Yokosuka et al., 2005). Despite extensive study of the
biochemical signaling pathways involved, much further work is required to elucidate the precise
mechanism of T cell activation (Choudhuri and van der Merwe, 2007).
Signaling activation of T cells critically depends upon T cell adhesion to the antigen presenting
cell (Kandula and Abraham, 2004) and extensive rearrangements of the actin cytoskeleton and
cell deformation (Yu et al., 2013). These observations suggest that physical forces exerted on
the TCR may contribute to activation by facilitating conformational changes in the TCR/CD3
complex, resulting in signaling activation, TCR clustering and the assembly of signaling
microclusters (Ma and Finkel; Ma et al., 2008). Alternately, the applied forces may directly act
on signaling molecules, resulting in conformational changes that activate additional signaling
cascades (Babich et al., 2012; Yu et al., 2012). In support of these views, direct application of
external forces to stimulatory beads or antigen-coated AFM tips can lead to activation of the
TCR (Husson et al., 2011; Kim et al., 2009; Li et al., 2010). A recent study using primary human
CD4+ cells on elastomer pillar arrays coated with anti-CD3 or MHC peptides has shown that T
cells exert traction forces in response to CD3 or CD28 stimulation (Bashour et al., 2014),
suggesting that cellular forces may be directly involved in T cell activation.
In most adherent cells, stresses are generated by the coordinated action of actin polymerization
and myosin contraction, which drive actin flows. While several studies suggest that cytoskeletal
dynamics play a crucial role in TCR signaling (Hammer and Burkhardt, 2013; Jacobelli et al.,
2004; Kumari et al., 2012; Wulfing and Davis, 1998; Yi et al., 2012; Yu et al., 2013),, the
delineation of contribution of different cytoskeletal components to force generation is unclear.
Regardless of the origin of the force, the overall magnitude of generated forces will depend on
3
the elastic properties of the cellular actin network and the dynamics of actin assembly and
disassembly. The effective internal stress generated in the viscoelastic actin network can be
estimated from the material parameters of the cell (Betz et al., 2011). Independent measures of
Jurkat cell stiffness suggest that these are soft (Young’s modulus ~ 50-100 Pa (pN/µm2))
(Rosenbluth et al., 2006), which likely limits the peak internal stresses to 100 Pa at best. Whether
these forces are sufficient for activation is unknown, although force probe experiments suggest
that primary T cells pull and engulf anti-CD3 coated beads with small loading rates (Husson et
al., 2011). However, the small size of the beads precludes any analysis of the forces exerted
across the entire cell-substrate contact, which can be significantly larger.
Here, we have used traction force microscopy to measure the forces exerted by T cells during
activation. We find that Jurkat T cells are weak force generators on anti-CD3 coated elastic
substrates, exerting peak stresses reaching 20-30 Pa and total forces of a few nN, which is
consistent with the amount of externally applied forces required for T cell activation (Kim et al.,
2009). We find that these forces are largely driven by actin polymerization dynamics. Myosin
contractility contributes to the generation of forces during the early phase of stimulation but is
not required for the maintenance of force at later times. We find that T cell signaling activation is
sensitive to the stiffness of the activating substrates as previously observed (Judokusumo et al.,
2012) and this mechanosensitivity is correlated with increased cytoskeletal forces. Our results
suggest that forces generated by the actomyosin cytoskeleton are sufficient for receptor
activation in T cells, and modulate the efficacy of signal transduction.
RESULTS
Traction forces generated by Jurkat T cells
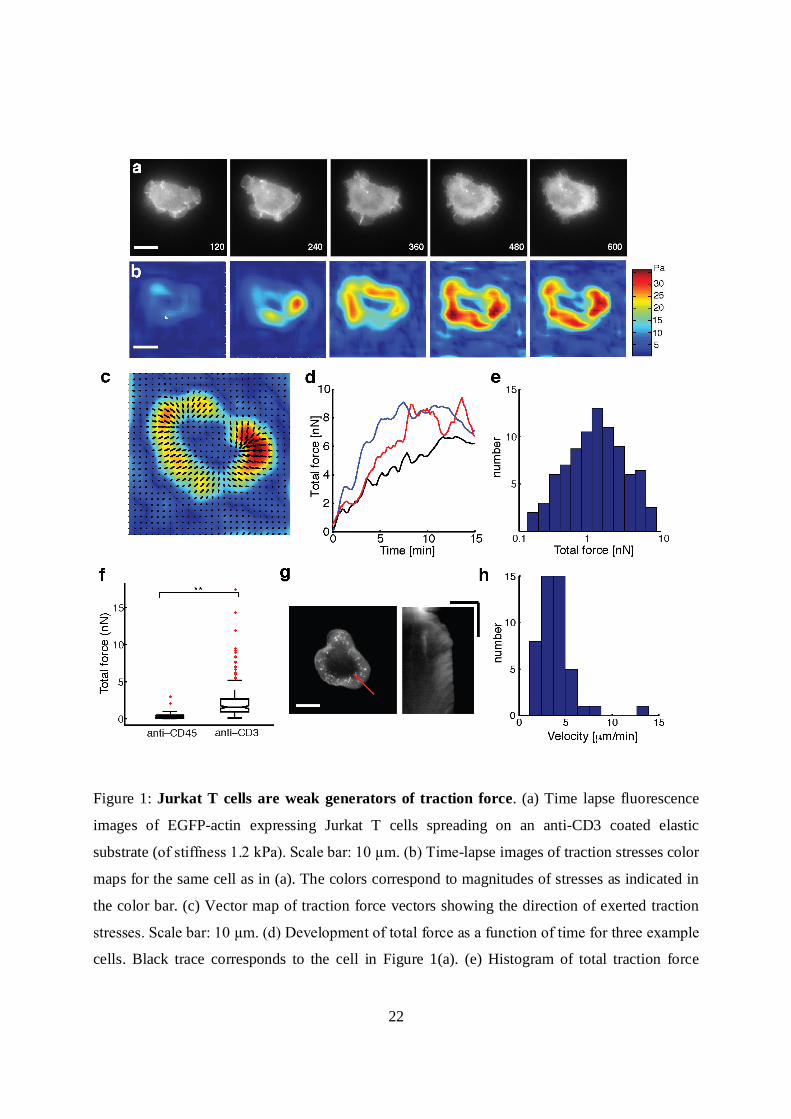
In order to measure the forces exerted by T cells, we performed traction force microscopy which
allows the measurement of spatially resolved traction stresses (Dembo and Wang, 1999). Jurkat
T cells expressing EGFP-actin were allowed to spread on polyacrylamide (PAA) gels coated
with anti-CD3 antibody and embedded with fluorescent beads on the top surface as fiduciary
markers. We imaged the spreading dynamics of cells starting from the earliest time points before
the cell established contact with the substrate and continued imaging for at least 15 minutes.
Typically, cells were completely spread prior to 15 minutes, as shown in the EGFP-actin images
(Fig. 1a) of a typical cell spreading on a gel of stiffness 1.7 kPa (which approximates the
stiffness of antigen presenting cells (Rosenbluth et al., 2006)). To measure the traction stresses
4
exerted by cells, we tracked the fluorescent beads using particle image velocimetry (PIV). The
first frame of the live cell image sequence, before the cell exerted traction on the surface, was
used as the “zero displacement” or reference image. Unconstrained Fourier Transform Traction
Cytometry (FTTC) (Butler et al., 2002) was used to calculate the traction stress map from the
measured bead displacements at different times (Fig. 1b). The average traction stresses exerted
by cells were in the range of 5-10 Pa, while the peak traction stresses exerted were in the range
of 10-30 Pa, in the same range as stresses exerted by neuronal growth cones (Betz et al., 2011;
Koch et al., 2012). By contrast, rapidly migrating keratocytes and strongly adherent fibroblasts
are known to exert traction stresses in the range of 100 Pa to several kPa (Dembo and Wang,
1999; Lee et al., 1994).
We found that the traction stress was concentrated at the periphery of the spread area coincident
with lamellipodia. The stresses exerted were higher a few microns internal to the periphery of the
cell, which corresponded to actin dense regions. Stresses were exerted centripetally and directed
towards the cell center as seen in the spatial map of vectors corresponding to the exerted stresses
(Fig. 1c). We used EGFP-actin images to track cell edges (as shown by the black line in Fig. 1c)
and obtain the contact area of the spreading cell at each time point. The total force exerted by the
cell was calculated using , where is the traction stress at the
location (x,y). The force by exerted by the cell rapidly increased over the first 5 min. after
initiation of spreading, until it reached a maximum and subsequently either saturated over the
rest of the observation period, or showed a slight decrease (Fig. 1d). The total force exerted by
cells (average force between 14-15 min of spreading initiation on gels of stiffness 1-2 kPa)
showed considerable variation with a median value of 2 nN (Fig. 1e). Based on the observed
stiffness of Jurkat cells (Young’s modulus E ~ 50-100 Pa (Rosenbluth et al., 2006)), the expected
value of maximum force, F ~ E × area ~ 2-5 nN.
We further verified that the observed forces were specific to TCR-ligand mediated activation and
spreading. Cells barely spread or established attachments on elastic substrates coated with poly-
L-lysine alone indicating that anti-CD3 coating was essential for spreading and force exertion.
On substrates coated with the non-stimulatory antibody, anti-CD45, cells established contact and
spread but to a smaller extent than on stimulating surfaces. The total forces exerted by cells on a
non-stimulating surface were significantly lower than the forces exerted on stimulating surfaces
5
(anti-CD3 coated) (Fig. 1f). This indicates that the observed forces are largely a direct
consequence of TCR-ligand binding leading to T cell activation.
A previous study on neurons has established a connection between traction forces exerted by
cells, cell stiffness and internal cellular forces with the rate of actin retrograde flows in the cell
lamellipodia (Betz et al., 2011). We examined whether the actin flows in Jurkat T cells were
consistent with these observations. We quantified the rate of actin flow using kymography of
actin structures in the lamellipodia of spread cells (Figure 1g). The distribution of actin flow
speeds for cells spreading on gels of stiffness 1-2 kPa is shown in Fig. 1h. The median value of
retrograde flow of actin was measured to be 3 µm/min, which was consistent with other soft cells
such as hippocampal neurons (Koch et al., 2012).
Role of the actin cytoskeleton in force generation
We next wished to examine the molecular basis of force generation and maintenance in Jurkat T
cells. The acto-myosin cytoskeleton is likely the most important component responsible for force
generation in these cells similar to other cell types (Babich et al., 2012; Mossman et al., 2005).
We perturbed the activity of the acto-myosin cytoskeleton using small molecule inhibitors,
which are powerful agents for rapid and reversible inhibition of target molecules. Since pre-
incubation of cells with inhibitors can affect cell spreading, we added inhibitors to cells after
they had spread and measured the changes in cellular traction stress following inhibitor
application. Unless specified, we added inhibitors to cells after 15 minutes of stimulation on anti-
CD3 coated gels of stiffness in the range of 1-2 kPa, and continued to image the bead movements
and GFP-actin dynamics simultaneously for an additional 15 min in order to measure the effect
of the drug on forces. This method allows us to examine the effects of inhibitors on a single cell
basis and additionally avoid the caveats of population averaging on cells that exhibit some
heterogeneity in their exerted forces.
We first focused on the role of actin polymerization and depolymerization dynamics on cellular
traction forces with Latrunculin-A (Lat-A) to inhibit polymerization of actin, Jasplakinolide
(Jasp) to stabilize pre-existing actin filaments and CK-666 to inhibit the activity of Arp2/3 – an
actin nucleating protein. Inhibition of actin polymerization by Lat-A resulted in the disruption of
pre-existing lamellipodia and actin rich structures visible in the cell surface contact zone (Fig.
2a) with a reduction in traction (Fig. 2b). Application of Lat-A 5 min after initiation of spreading
resulted in similar disruption of actin and loss of traction (data not shown). Initial TCR signaling
6
upon stimulation has been shown to result in immediate recruitment of signaling proteins that
subsequently lead to Arp2/3 activation (Beemiller and Krummel, 2010; Billadeau et al., 2007;
Burkhardt et al., 2008; Dustin and Groves, 2012). Hence, the Arp2/3 complex might also be
important in mechanically linking TCR to the f-actin cytoskeleton and therefore involved in the
force generation process. Inhibition of Arp2/3 activation by addition of CK-666, an inhibitor that
locks the Arp2/3 complex in an inactive conformation (Nolen et al., 2009), led to the retraction
of lamellipodia and termination of edge dynamics (Fig. 2c). This is in accordance with several
previous observations that the Arp2/3 complex is essential for maintaining lamellipodial
structure (Gomez et al., 2007). Consistent with our expectations, addition of CK-666 led to a
reduction in the traction forces as seen from the before and after traction maps (Fig. 2d). CK-666
application also led to a reduction in F-actin intensity and retrograde flow but not a complete
inhibition of actin flow (Fig. S1, in Supplementary Material). Stabilization of F-actin upon
addition of Jasp reduces the retrograde flow of actin in cells (Babich et al., 2012). Addition of 1
µM Jasp resulted in the reduction of traction forces in most cells, as shown in the traction maps
before and after inhibitor addition (Fig. 2e-f). However, the effect of Jasp was somewhat variable
with some cells showing little effect of Jasp on actin flow and edge dynamics. These cells
typically did not show a decrease in traction. As a control, addition of DMSO carrier alone did
not significantly affect the actin structures in the cell or the traction forces generated (Fig. 2g, h)
and Fig. S1.
Representative curves of the time evolution of total traction force upon addition of inhibitors or
control (DMSO carrier alone) are shown in Fig. 2i. The force dropped significantly and rapidly
after the addition of Lat-A, while addition of CK-666 and Jasp led to a decrease in force with a
more gradual decline as compared to Lat-A. To characterize the change in stress upon inhibitor
application for a population of cells, we quantified the ratio of mean stress after (between 9-12
min) and before (-3 to 0 min) application of drug for each cell. Lat-A treatment decreased the
traction stresses by almost 50% (ratio = 0.55) while CK-666 resulted in a stress ratio of 0.75 and
the stress ratio for Jasp addition was 0.85 (Fig. 2j). All of these were significantly different from
the control (stress ratio 0.95). Comparisons made at different time-points after drug application
showed similar reductions in traction stress (Fig. S2). Our results indicate that actin
polymerization and depolymerization dynamics as well as retrograde flows of actin are important
for the generation of forces in Jurkat T cells. We also found that inhibitors targeting the
7
microtubule cytoskeleton and dynein motors did not have any significant effect on the traction
forces (Fig. S3).
Role of myosin activity in force generation
In order to examine the effect of myosin IIA activity on traction stress generation in Jurkat T
cells, we used blebbistatin, a specific inhibitor of the ATPase activity of myosin IIA (Cheung et
al., 2002); ML-7, a myosin light chain kinase inhibitor (Saitoh et al., 1987); and Y-27632, a
specific Rho-kinase (ROCK) inhibitor (Uehata et al., 1997). The inhibitors were added in the
same manner as the actin inhibitors (15 min after spreading initiation) and the stress ratios after
and before drug application were compared with the corresponding control conditions.
We first examined the effect of blebbistatin on traction force generation. Since blue light inhibits
blebbistatin, we turned off the 491 nm illumination just before adding 50 µM blebbistatin to
spreading Jurkat cells and compared the traction stress, as shown in the ‘before’ and ‘after’ stress
maps (Fig. 3a, b) for a representative cell. Qualitatively, we found that the cell edge continued to
behave in a dynamic manner upon blebbistatin addition. We measured actin retrograde flow in
the presence of blebbistatin using TagRFP-T-actin labeled cells and found that the flow was
largely intact, indicating that myosin IIA does not play a significant role in maintaining actin
flow in these cells (Fig. S2). We also found that myosin activity contributed to the formation of
the actin ring (Fig. S4). We noted that the average stress ratio (0.96) was not significantly
different from the control (stress ratio 0.95) (Fig. 3e). We further found that 10 µM ML-7 had no
effect on the traction stresses (stress ratio 0.97; Fig. 3e). On the other hand, treatment with 100
µM Y-27632 decreased the stresses exerted as shown in the stress maps (Fig. 3 c-d). The cell
contact area did not decrease upon drug application and actin lamellipodial structures were
maintained even after the addition of Y-27632 (Fig. 3c-d). However, there was a slight decrease
in the dynamics of the cell edge upon Y-27632 addition. The summary data shows a modest
decrease in stresses (stress ratio of 0.8) as compared to the ddH20-control (Fig. 3e).
Since myosin II contraction affects conjugate formation (Ilani et al., 2009) and T cell activation
in the early stages (Yu et al., 2012), it is possible that myosin II is required for the initial
generation of forces but not at later stages. To test this, we applied blebbistatin 5 min after the
initiation of spreading and examined the effect on the exerted forces. We found that while the
total force exerted by the cell continued to increase until saturation upon vehicle (DMSO)
application (Fig. 3f), the total force exerted by the cell plateaued near the value at 5 min or
8
decreased slightly upon blebbistatin application. However, blebbistatin did not abolish the forces
(Fig. 3g-h) and a few cells continued to show increase in traction. Summary data of the stress
ratios after and before treatment shows that blebbistatin treated cells have a significantly lower
stress ratio as compared to DMSO (carrier) treated cells. This confirms that myosin II is required
for the initial phase of force generation, but is not involved at later time-points (Fig. 3i).
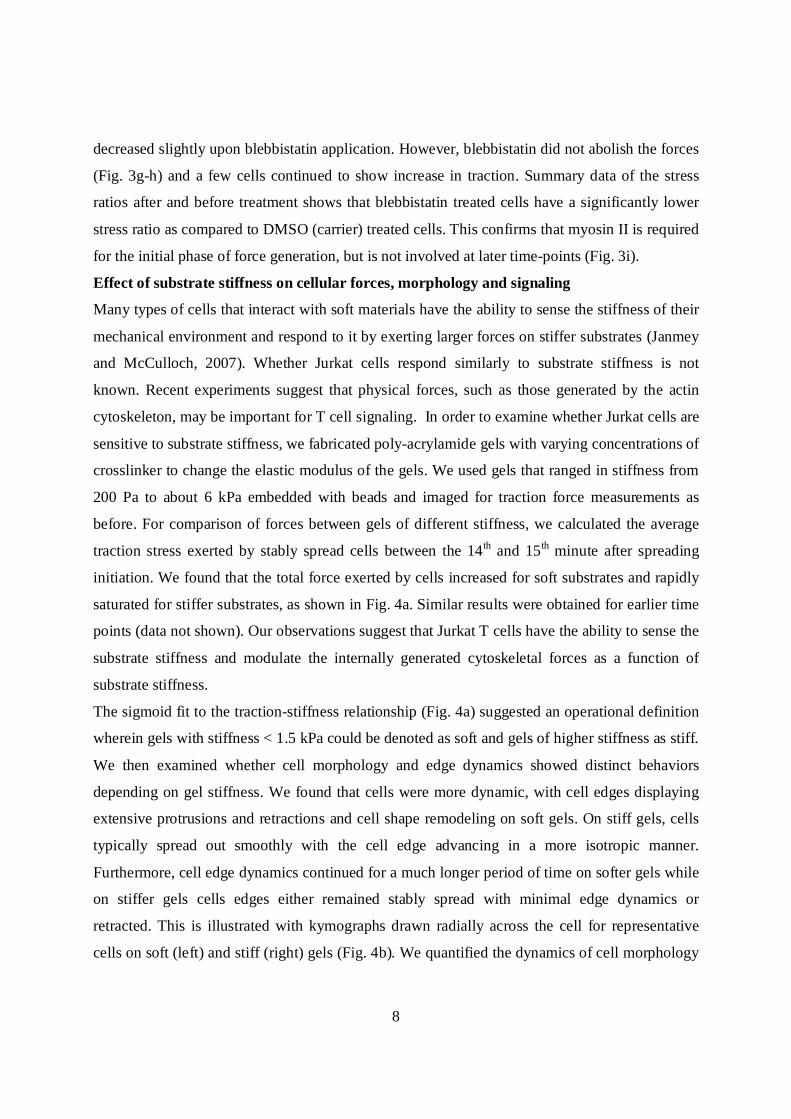
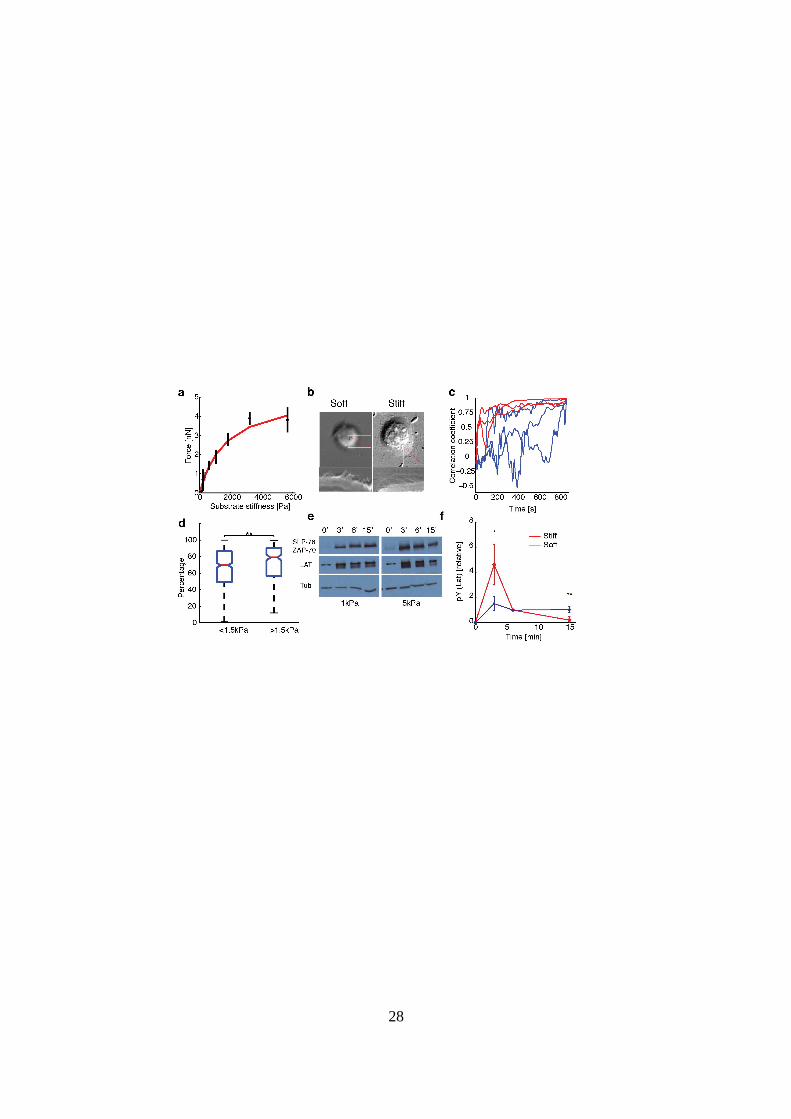
Effect of substrate stiffness on cellular forces, morphology and signaling
Many types of cells that interact with soft materials have the ability to sense the stiffness of their
mechanical environment and respond to it by exerting larger forces on stiffer substrates (Janmey
and McCulloch, 2007). Whether Jurkat cells respond similarly to substrate stiffness is not
known. Recent experiments suggest that physical forces, such as those generated by the actin
cytoskeleton, may be important for T cell signaling. In order to examine whether Jurkat cells are
sensitive to substrate stiffness, we fabricated poly-acrylamide gels with varying concentrations of
crosslinker to change the elastic modulus of the gels. We used gels that ranged in stiffness from
200 Pa to about 6 kPa embedded with beads and imaged for traction force measurements as
before. For comparison of forces between gels of different stiffness, we calculated the average
traction stress exerted by stably spread cells between the 14th and 15th minute after spreading
initiation. We found that the total force exerted by cells increased for soft substrates and rapidly
saturated for stiffer substrates, as shown in Fig. 4a. Similar results were obtained for earlier time
points (data not shown). Our observations suggest that Jurkat T cells have the ability to sense the
substrate stiffness and modulate the internally generated cytoskeletal forces as a function of
substrate stiffness.
The sigmoid fit to the traction-stiffness relationship (Fig. 4a) suggested an operational definition
wherein gels with stiffness < 1.5 kPa could be denoted as soft and gels of higher stiffness as stiff.
We then examined whether cell morphology and edge dynamics showed distinct behaviors
depending on gel stiffness. We found that cells were more dynamic, with cell edges displaying
extensive protrusions and retractions and cell shape remodeling on soft gels. On stiff gels, cells
typically spread out smoothly with the cell edge advancing in a more isotropic manner.
Furthermore, cell edge dynamics continued for a much longer period of time on softer gels while
on stiffer gels cells edges either remained stably spread with minimal edge dynamics or
retracted. This is illustrated with kymographs drawn radially across the cell for representative
cells on soft (left) and stiff (right) gels (Fig. 4b). We quantified the dynamics of cell morphology
9
by comparing the radial distance profile (from the cell center around the cell edge as tracked
from EGFP-actin images) at 15 minutes with that at each earlier time point. We calculated the
Pearson correlation coefficient of these two profiles as the cell edge evolved in time.
Representative time courses of the correlation coefficient for cells spreading on soft (< 1.5 kPa,
blue) and stiff (> 1.5 kPa red) gels are shown in Fig. 4c. On stiff gels, the correlation coefficient
was small initially, indicating considerable edge dynamics but approached one as the cell
periphery remained stable and persistent. However, on softer gels, the correlation coefficient
remained low throughout indicating ongoing edge dynamics through the duration of the movie.
In order to quantify the population response to substrate stiffness, we calculated the percentage
of time (P(t)) that the correlation coefficient was larger than 0.5, i.e. with a shape similar to that
at 15 min (Fig. 4d). We found that cells on soft gels were significantly more dynamic, with low
P(t) (t-test, p<0.001) as compared to those on stiffer gels. These observations demonstrate that
cell morphologies are more dynamic on soft substrates.
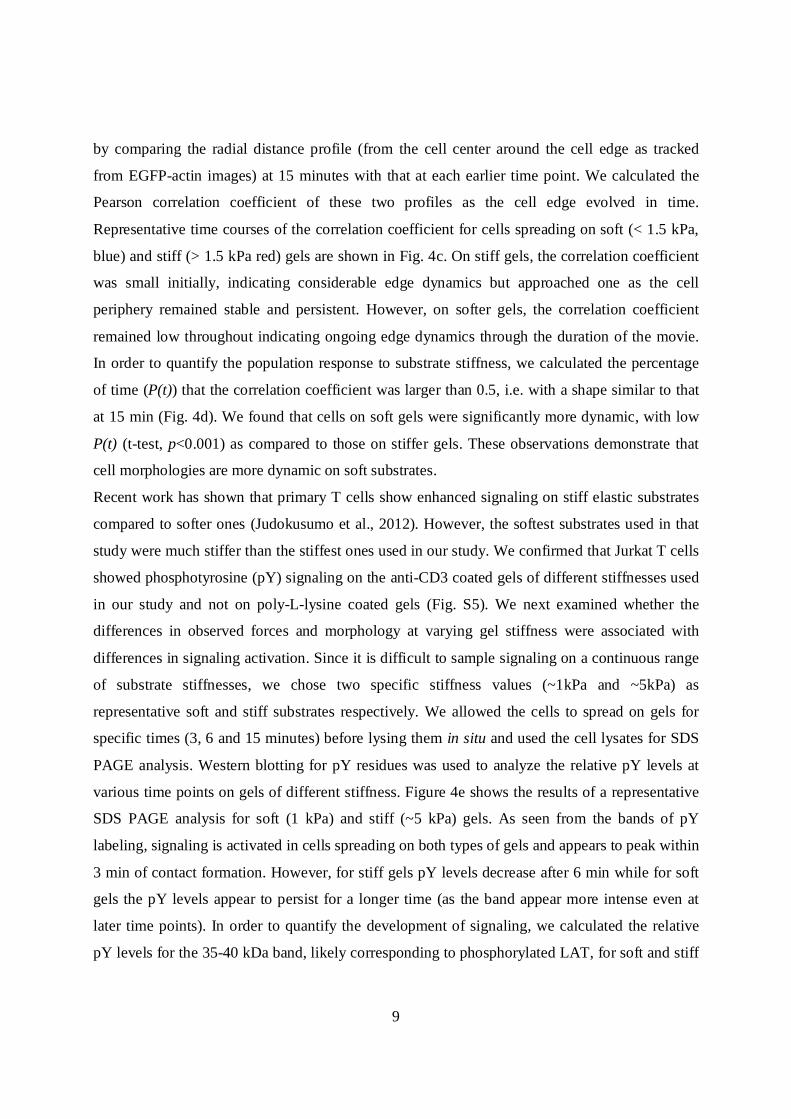
Recent work has shown that primary T cells show enhanced signaling on stiff elastic substrates
compared to softer ones (Judokusumo et al., 2012). However, the softest substrates used in that
study were much stiffer than the stiffest ones used in our study. We confirmed that Jurkat T cells
showed phosphotyrosine (pY) signaling on the anti-CD3 coated gels of different stiffnesses used
in our study and not on poly-L-lysine coated gels (Fig. S5). We next examined whether the
differences in observed forces and morphology at varying gel stiffness were associated with
differences in signaling activation. Since it is difficult to sample signaling on a continuous range
of substrate stiffnesses, we chose two specific stiffness values (~1kPa and ~5kPa) as
representative soft and stiff substrates respectively. We allowed the cells to spread on gels for
specific times (3, 6 and 15 minutes) before lysing them in situ and used the cell lysates for SDS
PAGE analysis. Western blotting for pY residues was used to analyze the relative pY levels at
various time points on gels of different stiffness. Figure 4e shows the results of a representative
SDS PAGE analysis for soft (1 kPa) and stiff (~5 kPa) gels. As seen from the bands of pY
labeling, signaling is activated in cells spreading on both types of gels and appears to peak within
3 min of contact formation. However, for stiff gels pY levels decrease after 6 min while for soft
gels the pY levels appear to persist for a longer time (as the band appear more intense even at
later time points). In order to quantify the development of signaling, we calculated the relative
pY levels for the 35-40 kDa band, likely corresponding to phosphorylated LAT, for soft and stiff
10
gels. We found that pY levels peaked at about 3 min. on stiff gels and rapidly declined, whereas
on softer gels, the levels were lower but sustained even at 15 min after stimulation (Fig. 4f). We
observed the same trend for bands corresponding to ZAP70/SLP76. Our results suggest that the
temporal evolution of early signaling in Jurkat T cells is sensitive to substrate stiffness.
DISCUSSION
Mechanical forces have been implicated to play a role in TCR signaling and activation. Here, we
have measured the traction stresses generated by Jurkat T cells and transmitted through TCRs to
the contacting surface. We find that T cells are soft and weak force generators exerting average
stresses on the order of 10-20 Pa during activation by anti-CD3-coated substrates. We find that
the stresses are distributed peripherally around the contact zone. The forces peak rapidly upon
stimulation and are maintained for several minutes after initiation of spreading during signaling
activation. Moreover, these forces are specifically generated in response to CD3 stimulation, as
shown for human primary CD4+ cells (Bashour et al., 2014). Overall, the forces are of lower
magnitude than those associated with integrin receptors in adherent cells.
In many adherent cells, integrins serve as the primary mediators of adhesion, and integrin
mediated adhesion plays an important role in T cell activation (Alon and Dustin, 2007; Grakoui
et al., 1999; Scholer et al., 2008). It is likely that Jurkat cells may exert lower stresses on
substrates coated with integrin ligands, e.g. VCAM in addition to anti-CD3, due to the reduction
of retrograde flow (Nguyen et al., 2008). However, experiments measuring forces applied on
anti-CD3+anti-LFA-1 (lymphocyte function-associated antigen-1) coated beads only displayed
subtle differences and similar loading rates as compared to anti-CD3 coated beads alone (Husson
et al., 2011).
Previous studies have established that actin cytoskeletal dynamics is essential for TCR signaling
and activation (Babich et al., 2012). We found that an intact and dynamic f-actin cytoskeleton
was essential for the exertion of traction stresses by Jurkat T cells. As expected, inhibition of
actin polymerization with Lat-A significantly decreased the forces generated. We also found that
the Arp2/3 complex was required for force production, suggesting that the biochemical pathway
that leads to Arp2/3 activation and actin polymerization (Goley and Welch, 2006) might also link
activated TCR to the actin cytoskeleton physically (Billadeau et al., 2007). The decrease in
forces upon Arp2/3 inhibition was not as severe as that due to Lat-A, suggesting that other
pathways, such as formin dependent ones leading to actin polymerization, may also contribute to
11
force production. We further found that actin flow speeds were reduced by the inhibition of
CK666. This reduction of flow speeds is consistent with observations in neuronal growth cones
(Yang et al., 2012). Since it is known that formin-mediated actin polymerization plays a
significant role in T cell activation (Gomez et al., 2007), it is possible that formin-mediated actin
polymerization is able to maintain actin structures and support traction forces in the absence of
Arp2/3-mediated actin assembly. Stabilization of F-actin by Jasp consistently led to a reduction
in forces in cells in which actin flows and edge dynamics were inhibited upon Jasp treatment. In
some cells though, in which Jasp treatment did not affect the actin dynamics or flow, the stresses
remained unaffected. These results point to a relationship between actin flows and stress
generation. We have not been able to relate actin flows to local forces due to the limitations of
wide field imaging, but this will be a subject of future study.
Myosin IIA-driven contraction of actomyosin networks is the major contributor to actin
retrograde flow in neuronal growth cones and filopodia (Van Goor et al., 2012) and contributes
90% of the traction stress exerted by mouse embryonic fibroblasts (Cai et al., 2006). The role of
myosin II in TCR signaling has not been unequivocally established. The primary form of myosin
II present in T cells is myosin IIA with a very small fraction of myosin IIB (Ilani et al., 2009;
Jacobelli et al., 2004). While some studies have shown that myosin II inhibition has no effect on
actin retrograde flow or microcluster transport (Babich et al., 2012; Beemiller et al., 2012;
Jacobelli et al., 2004; Yu et al., 2012), others have shown that myosin IIA inhibition results in
fewer and more unstable conjugates between T cells and stimulatory cells, as well as reduction in
microcluster formation and transport in primary and Jurkat T cells stimulated by antigens
presented on bilayer substrates (Ilani et al., 2009; Yi et al., 2012). We find that suppression of
myosin IIA activity by blebbistatin and ML7 application did not affect the maintenance of
traction forces in cells that were already spread. On the other hand, application of blebbistatin
during the early phase of spreading retarded further development of tractions, which is consistent
with the observation that myosin inhibition reduces the stability of T cell-APC conjugates.
In contrast, inhibition of Rho-kinase by Y-27632 modestly decreased the forces. It is possible
that inhibition of Rho-kinase has additional effects on the actin cytoskeleton, which may result in
decreased traction. Alternately, Y-27632 may slow down the movement of acto-myosin
structures such as actin arcs, which may exert a contractile force and contribute to the forces (Yi
et al., 2012). Overall, our results suggest that myosin plays a limited role in the maintenance of
12
force but is required for the proper development of force during early spreading. This is
consistent with the transient effect of myosin on microcluster movement in primary T cells
spreading on patterned bilayers (Yu et al., 2012). A better understanding of the relationship
between gradients of actin retrograde flow and traction stress requires a more careful
characterization of actin dynamics using fluorescence speckle microscopy. While in general,
myosin IIA contractility is essential for the transmission of tractions to integrin dependent
adhesions (Aratyn-Schaus et al., 2011; Cai et al., 2006; Fournier et al., 2010; Koch et al., 2012),
the extent of stress reduction upon myosin IIA inhibition is variable (Cai et al., 2006; Meili et al.,
2010). Dictyostelium cells lacking an analogous myosin show only modest (50%) inhibition,
suggesting that additional mechanisms, possibly due to actin retrograde flow, can maintain and
transmit sufficiently high tractions.
We found that Jurkat T cells exert larger forces on substrates of increased stiffness (in the
stiffness range of 200 Pa – 6 kPa), indicating that they are able to sense the substrate rigidity
over this large range and modulate their force generation accordingly. Many cell types, including
fibroblasts, neutrophils and neurons, have been shown to be mechanosensitive, being able to
exert increasing force on substrates of greater stiffnesses (Chan and Odde, 2008; Lo et al., 2000;
Oakes et al., 2009). This appears to be in contrast to a recent study on human primary CD4+ cells
spreading on anti-CD3 coated micropillar arrays (Bashour et al., 2014), which did not show any
change in traction force per pillar as a function of pillar stiffness. However, our results are
consistent with a previous study using red blood cells as a force probe showed that T cells
engage anti-CD3 coated beads and pull with loading rates that increased with probe stiffness
(Husson et al., 2011). Mouse primary T cells have been found to respond to the mechanical
stiffness of substrates, with increased IL2 production and enhanced tyrosine phosphorylation on
stiffer polyacrylamide gels (Judokusumo et al., 2012). However, the stiffness range explored in
those studies was considerably higher (10-200 kPa) and traction forces were not measured. In
vivo, T cells spread on APC which are soft (in the stiffness range of a few 100 to 1 kPa
(Rosenbluth et al., 2006)), suggesting that our observations of enhanced dynamics of the cell
edge on soft gels may be physiologically relevant to T cell function.
We also found altered cell morphology on gels of different rigidities. On soft substrates, the cell
edge was observed to be highly dynamic, undergoing repeated rounds of protrusion and
retraction. The repeated edge dynamics may result from repeated bursts of actin polymerization
13
leading to multiple leading edges and formation of fresh signaling clusters at the nascent cell
periphery. In contrast, on stiff substrates, the cell edge expansion is smoother without repeated
protrusions. Previous studies have shown that the continuous recycling of signaling intermediates
(tyrosine kinases and substrates) is essential for maintaining levels of pY following cell
spreading (Bunnell et al., 2002; Campi et al., 2005; Lee et al., 2002; Varma et al., 2006). Thus, it
is likely that the continued cell-edge dynamics of cells on softer substrates may mediate the
sustained signaling observed on these substrates.
The response of Jurkat cells to substrate stiffness can be explained using a model derived from
active matter theory (Marcq et al., 2011). In a simple one-dimensional version of this model, the
extra-cellular environment can be represented by a linear spring of length, at time t, rest
length, , and a spring constant, . The cell exerts an active stress ( ) resulting from
actin polymerization and myosin contractility, which consumes energy by ATP hydrolysis. Force
balance leads to a simple expression for the force, , where Feq is the steady
state force, where A is the cell area, ksubs is the effective spring constant for the
substrate (0.1 – 10 nN/µm for the gel stiffnesses considered here) and kcell is the stiffness of the
cell (~1 nN/µm). Thus, on soft substrates, the steady state force exerted by the cell linearly
increases with stiffness and saturates when . Given our measured saturating force of
5 nN and the typical cell area A~100 µm2, we can estimate the peak active stress, 0 Pa,
which is in agreement with the measured Young’s moduli of Jurkat cells (Rosenbluth et al.,
2006). The same model can also be used to estimate the maximal strain rate that can be exerted
by these cells, which will pull on TCR-ligand bonds. Assuming a linear force-velocity
relationship (appropriate for overdamped systems), the loading rate can be estimated as
, where is the viscous dissipation in the actin gel and A is
the area over which the stress is exerted. Again, using our estimated values for these parameters
( , ), a typical bead (area ~1 µm2) would experience a loading rate of ~2-3
pN/sec which is well in agreement with observed rates experienced by anti-CD3 coated beads in
a force sensor apparatus (Husson et al., 2011).
The molecular mechanisms that underlie mechanosensing remain a topic of intense study (Moore
et al., 2010). A number of studies suggest that integrins may serve as putative mechanosensors
14
(Alon and Dustin, 2007). We find that Jurkat cells exhibit mechanosensitivity even without
integrin engagement, suggesting that these mechanisms may be quite general. Jurkat cells also
lack CasL (a p130Cas homolog), a protein implicated in mechanosensitivity (Sawada et al.,
2006; Yu et al., 2012), but other possible candidates include PLC- (Babich et al., 2012). In
conclusion, our studies show that mechanosenstivity may be a general feature of T cells. Our
results place constraints on the forces that these cells are able to generate and thereby apply on
TCR-ligand linkages to potentially initiate signaling.
Acknowledgments: This research was supported by the NSF (Grant numbers 1121710 and
1206060 to AU) and the Intramural Research Program of the NIH, NCI, CCR.
METHODS
Cells and Reagents
Jurkat E6-1 cells transfected with EGFP-actin were cultured in RPMI 1640, supplemented with
10 % fetal bovine serum (FBS) and 1 % Penn-Strep (PS). TagRFP-T sequence was cloned from
pcass TagRFP-T (a gift from Dr. Morgan Huse, Rockefeller) into pEGFP-actin (Clontech,
Mountain View CA), to create pTagRFP-T-actin, then further cloned into Z4-MSCV-TagRFP-T
(a gift from Dr. Morgan Huse, Rockefeller) to create Z4-MSCV-TagRFP-T-actin, allowing
retroviral bicistronic expression of TagRFP-T-actin and a zeocin resistant gene. Retroviruses
were generated according to standard protocol with Phoenix Amphotropic cells and were
transduced into Jurkat E6-1 cells by spin infection. The cells were then selected in 200 µg/ml
zeocin for 2 weeks, and sorted with FACS to obtain TagRFP-T-actin cells.
Anti-CD3 was purchased from eBioscience. Y27632 was purchased from SelleckChem
(Houston, TX). (-)-blebbistatin and jasplakinolide was purchased from Calbiochem (Billerica,
MA). 40% Acrylamide, 2% BIS-acrylamide, ammonium persulfate and TEMED were purchased
from Bio-Rad (Hercules, CA). 0.2 µm FluoSphereRed microspheres were purchased from
Molecular Probes. Poly-l-lysine, ML-7, latrunculin A and nocodazole were purchased from
Sigma Aldrich (St. Louis, MO). Sylgard 164 elastomers were purchased from Ellsworth
Adhesives (Germantown, WI). Stainless steel microspheres were purchased from Salem Balls.
Polystyrene microspheres were purchased from Polysciences (Warrington, PA). Hydrazine
hydrate was purchased from Acros (Pittsburgh, PA).
Fabrication and calibration of polyacrylamide gels
15
Traction force microscopy procedures were followed as described in Sabass et al. (Sabass et al.,
2008), with a slight modification, to form a thin and dense layer of fluorescent beads trapped on
top of the polyacrylamide gel. Before coating of proteins, the top of the gel was observed under
an epifluorescence microscope (TE2000, Nikon Corporation, Japan) at 10× magnification in
rhodamine channel to ensure a monolayer of densely spaced beads was present. Suitable gels
were then attached to the bottom of MatTek 35 mm dish (MatTek Corporation, Ashland, MA)
with Sylgard 164 silicone elastomer (Dow Corning Corporation, Midland, MI). 0.01 % poly-L-
lysine was coated on polyacrylamide with the hydrazine hydrate method. After coating with
poly-L-lysine, the gel was washed 3 times with DPBS and 10 µg/ml anti-human CD3 (Hit3a)
was added to the gel and was either incubated in 37◦ C for 2 hours or in 4◦ C overnight.
Fluorescently labeled Hit3a was used to verify that antibody coating did not depend on subsrate
stiffness (data not shown). After each image acquisition, gel height was determined by
microscope’s focusing mechanism and corrected for axial scaling. Stainless steel balls (1/64”,
1/32” and 3/64” diameter) or polystyrene balls (for gels with Young modulus <300 Pa) were
then added to where the time series was taken. Steel balls were removed by a magnetic stir bar
and polystyrene balls were removed by bulb aspiration for a few times. The indentation caused
by the ball and gel height at that spot were recorded. The acrylamide concentration was changed
from 2-8% with the cross-linker (BIS) concentration kept fixed at 0.1% in order to change the
gel stiffness. The Young’s modulus of each individual gel used for the experiments was
calculated using a Hertz model for an elastic substrate with finite thickness (Pelham and Wang,
1997) rather than using an average relation between gel stiffness and BIS concentration.
Typically, gels with acrylamide/BIS ratios of 2:0.1, 3:0.1, 4:0.1 and 5:0.1 were measured to have
an average stiffness of 0.8, 1, 3 and 5 kPa respectively.
Microscopy
Live cell movies of cell spreading were taken over 15 minutes, at frame rate of 5 seconds per
frame, in Bright Field Differential Interference Contrast (DIC), FluoSphereRed and GFP
channels. Images were collected using an inverted microscope (TE2000 PFS, Nikon, Melville,
NY) with a cooled CCD camera (Coolsnap HQ2, Photometrics, Tucson, AZ). EGFP-actin and
fluorescent receptors were imaged with TIRF using a 60× 1.49 NA objective lens, a 491 nm laser
(100mW, Andor, South Windsor, CT) for EGFP excitation and a 561 nm laser (75mW, Andor)
for FluoSphereRed excitation. The imaging medium used was L-15 and the dish was kept in 37◦
16
C throughout data acquisition by means of an airstream incubator (Nevtek). Illumination
wavelength and exposure times were controlled using a multi-bandpass dichromatic mirror
(Chroma, Rockingham, VT) and bandpass excitation and emission filters (Chroma) in electronic
filterwheel/shutter devices (Sutter Instruments). In inhibitor addition experiments, data
acquisition was paused at 15 min. Inhibitors were added at an equal volume as the imaging
medium and double in target final concentration were added and data acquisition was resumed
for 5-15 minutes. For blebbistatin experiments, we inserted a filter in the light path to block blue-
green illumination.
Data analysis
The image sequences in FluoSphere Red channel were denoised and input into the freely
available MATLAB package, MatPIV for particle image velocimetry analysis. The first image in
the sequence before the cells the cells contacted the substrate was taken as the zero displacement
image and sample drift was corrected for by tracking the displacements of fiduciary beads far
away from any cells using particle tracking algorithms. Displacement vector maps generated
were then input into an unconstrained Fourier transform traction cytometry (FTTC) algorithm
implemented in MATLAB (Butler et al., 2002), and extended to include finite thickness
correction (Del Alamo et al., 2007). The analysis was carried out for every frame in the image
sequence and the analyzed traction stress data was presented as traction stress magnitude and
vector maps image sequences respectively. Cells showing significant above background
displacements and traction were chosen by observation for cell edge tracking and further
analysis. The method was sufficiently sensitive to detect bead displacements in gels up to 6 kPa
as verified by single particle tracking (Fig. S6). Cell edge tracking was implemented as described
in Hui et al. (Lam Hui et al., 2012). The centroid of the tracked cell area in the first frame was
treated as the cell’s center. At each frame, the radial distance and angle of each piece of the cell
edge from the centroid was recorded and grouped into bins of 6◦. The radial edge profile of the
cell at each time point was represented by the average radial distance in each bin. Pearson’s
correlation coefficient of the radial edge profile was calculated in MATLAB. Stress vectors
calculated at each grid point from FTTC were assigned to neighboring pixels, and average
traction stress magnitude was obtained by integrating the magnitudes of stress vectors at every
pixel inside the cell boundary, irrespective of the stress direction (presented in Figures 1-3). We
17
noted that on gels of high stiffness, the bead displacements caused by the cell were small while
the background noise in PIV tracking remained the same, resulting in higher background traction
compared with data from cells spreading on a soft substrate, owing to the fact that the calculated
traction stress is proportional to the substrate’s Young modulus. To eliminate the bias, we used
the traction stress measured at the first frame as the background and subtracted this from the
stresses at later times, to obtain the effective traction stress exerted by the cell. Typically, we
found that the stress measured in the first frame was comparable to the traction field outside the
cell boundary and was about 1 Pa.
Densitometry analysis: We first normalized the intensity within the 35-40 kDa band by tubulin
intensity at every time point. Then the normalized difference was calculated as the (ratio – ratio0
min)/(ratio6 min- ratio0 min).
REFERENCES
Alon, R., and M.L. Dustin. 2007. Force as a facilitator of integrin conformational changes during leukocyte arrest on blood vessels and antigen-presenting cells. Immunity. 26:17-27.
Aratyn-Schaus, Y., P.W. Oakes, and M.L. Gardel. 2011. Dynamic and structural signatures of lamellar actomyosin force generation. Molecular biology of the cell. 22:1330-1339.
Babich, A., S. Li, R.S. O'Connor, M.C. Milone, B.D. Freedman, and J.K. Burkhardt. 2012. F-actin polymerization and retrograde flow drive sustained PLCgamma1 signaling during T cell activation. The Journal of cell biology. 197:775-787.
Bashour, K.T., A. Gondarenko, H. Chen, K. Shen, X. Liu, M. Huse, J.C. Hone, and L.C. Kam. 2014. CD28 and CD3 have complementary roles in T-cell traction forces. Proceedings of the National Academy of Sciences of the United States of America.
Beemiller, P., J. Jacobelli, and M.F. Krummel. 2012. Integration of the movement of signaling microclusters with cellular motility in immunological synapses. Nature immunology. 13:787-795.
Beemiller, P., and M.F. Krummel. 2010. Mediation of T-cell activation by actin meshworks. Cold Spring Harbor perspectives in biology. 2:a002444.
Betz, T., D. Koch, Y.B. Lu, K. Franze, and J.A. Kas. 2011. Growth cones as soft and weak force generators. Proceedings of the National Academy of Sciences of the United States of America. 108:13420-13425.
Billadeau, D.D., J.C. Nolz, and T.S. Gomez. 2007. Regulation of T-cell activation by the cytoskeleton. Nat Rev Immunol. 7:131-143.
Bunnell, S.C., D.I. Hong, J.R. Kardon, T. Yamazaki, C.J. McGlade, V.A. Barr, and L.E. Samelson. 2002. T cell receptor ligation induces the formation of dynamically regulated signaling assemblies. The Journal of cell biology. 158:1263-1275.
Burkhardt, J.K., E. Carrizosa, and M.H. Shaffer. 2008. The actin cytoskeleton in T cell activation. Annu Rev Immunol. 26:233-259.
18
Butler, J.P., I.M. Tolic-Norrelykke, B. Fabry, and J.J. Fredberg. 2002. Traction fields, moments, and strain energy that cells exert on their surroundings. American journal of physiology. 282:C595-605.
Cai, Y., N. Biais, G. Giannone, M. Tanase, G. Jiang, J.M. Hofman, C.H. Wiggins, P. Silberzan, A. Buguin, B. Ladoux, and M.P. Sheetz. 2006. Nonmuscle myosin IIA-dependent force inhibits cell spreading and drives F-actin flow. Biophys J. 91:3907-3920.
Campi, G., R. Varma, and M.L. Dustin. 2005. Actin and agonist MHC-peptide complex-dependent T cell receptor microclusters as scaffolds for signaling. J Exp Med. 202:1031-1036.
Chan, C.E., and D.J. Odde. 2008. Traction dynamics of filopodia on compliant substrates. Science. 322:1687-1691.
Cheung, A., J.A. Dantzig, S. Hollingworth, S.M. Baylor, Y.E. Goldman, T.J. Mitchison, and A.F. Straight. 2002. A small-molecule inhibitor of skeletal muscle myosin II. Nature cell biology. 4:83-88.
Choudhuri, K., and P.A. van der Merwe. 2007. Molecular mechanisms involved in T cell receptor triggering. Seminars in immunology. 19:255-261.
Del Alamo, J.C., R. Meili, B. Alonso-Latorre, J. Rodriguez-Rodriguez, A. Aliseda, R.A. Firtel, and J.C. Lasheras. 2007. Spatio-temporal analysis of eukaryotic cell motility by improved force cytometry. Proceedings of the National Academy of Sciences of the United States of America. 104:13343-13348.
Dembo, M., and Y.L. Wang. 1999. Stresses at the cell-to-substrate interface during locomotion of fibroblasts. Biophys J. 76:2307-2316.
Douglass, A.D., and R.D. Vale. 2005. Single-molecule microscopy reveals plasma membrane microdomains created by protein-protein networks that exclude or trap signaling molecules in T cells. Cell. 121:937-950.
Dustin, M.L., and J.T. Groves. 2012. Receptor signaling clusters in the immune synapse. Annual review of biophysics. 41:543-556.
Fournier, M.F., R. Sauser, D. Ambrosi, J.J. Meister, and A.B. Verkhovsky. 2010. Force transmission in migrating cells. The Journal of cell biology. 188:287-297.
Goley, E.D., and M.D. Welch. 2006. The ARP2/3 complex: an actin nucleator comes of age. Nature reviews. Molecular cell biology. 7:713-726.
Gomez, T.S., K. Kumar, R.B. Medeiros, Y. Shimizu, P.J. Leibson, and D.D. Billadeau. 2007. Formins regulate the actin-related protein 2/3 complex-independent polarization of the centrosome to the immunological synapse. Immunity. 26:177-190.
Grakoui, A., S.K. Bromley, C. Sumen, M.M. Davis, A.S. Shaw, P.M. Allen, and M.L. Dustin. 1999. The immunological synapse: a molecular machine controlling T cell activation. Science. 285:221-227.
Hammer, J.A., 3rd, and J.K. Burkhardt. 2013. Controversy and consensus regarding myosin II function at the immunological synapse. Current opinion in immunology. 25:300-306.
Husson, J., K. Chemin, A. Bohineust, C. Hivroz, and N. Henry. 2011. Force generation upon T cell receptor engagement. PloS one. 6:e19680.
Ilani, T., G. Vasiliver-Shamis, S. Vardhana, A. Bretscher, and M.L. Dustin. 2009. T cell antigen receptor signaling and immunological synapse stability require myosin IIA. Nature immunology. 10:531-539.
19
Jacobelli, J., S.A. Chmura, D.B. Buxton, M.M. Davis, and M.F. Krummel. 2004. A single class II myosin modulates T cell motility and stopping, but not synapse formation. Nature immunology. 5:531-538.
Janmey, P.A., and C.A. McCulloch. 2007. Cell mechanics: integrating cell responses to mechanical stimuli. Annual review of biomedical engineering. 9:1-34.
Judokusumo, E., E. Tabdanov, S. Kumari, M.L. Dustin, and L.C. Kam. 2012. Mechanosensing in T lymphocyte activation. Biophys J. 102:L5-7.
Kandula, S., and C. Abraham. 2004. LFA-1 on CD4+ T cells is required for optimal antigen-dependent activation in vivo. Journal of immunology. 173:4443-4451.
Kim, S.T., K. Takeuchi, Z.Y. Sun, M. Touma, C.E. Castro, A. Fahmy, M.J. Lang, G. Wagner, and E.L. Reinherz. 2009. The alphabeta T cell receptor is an anisotropic mechanosensor. J Biol Chem. 284:31028-31037.
Koch, D., W.J. Rosoff, J. Jiang, H.M. Geller, and J.S. Urbach. 2012. Strength in the periphery: growth cone biomechanics and substrate rigidity response in peripheral and central nervous system neurons. Biophys J. 102:452-460.
Kumari, S., S. Vardhana, M. Cammer, S. Curado, L. Santos, M.P. Sheetz, and M.L. Dustin. 2012. T Lymphocyte Myosin IIA is Required for Maturation of the Immunological Synapse. Frontiers in immunology. 3:230.
Lam Hui, K., C. Wang, B. Grooman, J. Wayt, and A. Upadhyaya. 2012. Membrane dynamics correlate with formation of signaling clusters during cell spreading. Biophys J. 102:1524-1533.
Lee, J., M. Leonard, T. Oliver, A. Ishihara, and K. Jacobson. 1994. Traction forces generated by locomoting keratocytes. The Journal of cell biology. 127:1957-1964.
Lee, K.H., A.D. Holdorf, M.L. Dustin, A.C. Chan, P.M. Allen, and A.S. Shaw. 2002. T cell receptor signaling precedes immunological synapse formation. Science. 295:1539-1542.
Li, Y.C., B.M. Chen, P.C. Wu, T.L. Cheng, L.S. Kao, M.H. Tao, A. Lieber, and S.R. Roffler. 2010. Cutting Edge: mechanical forces acting on T cells immobilized via the TCR complex can trigger TCR signaling. Journal of immunology. 184:5959-5963.
Lo, C.M., H.B. Wang, M. Dembo, and Y.L. Wang. 2000. Cell movement is guided by the rigidity of the substrate. Biophys J. 79:144-152.
Ma, Z., and T.H. Finkel. T cell receptor triggering by force. Trends Immunol. 31:1-6. Ma, Z., P.A. Janmey, and T.H. Finkel. 2008. The receptor deformation model of TCR triggering.
Faseb J. 22:1002-1008. Marcq, P., N. Yoshinaga, and J. Prost. 2011. Rigidity sensing explained by active matter theory.
Biophys J. 101:L33-35. Meili, R., B. Alonso-Latorre, J.C. del Alamo, R.A. Firtel, and J.C. Lasheras. 2010. Myosin II is
essential for the spatiotemporal organization of traction forces during cell motility. Molecular biology of the cell. 21:405-417.
Monks, C.R., B.A. Freiberg, H. Kupfer, N. Sciaky, and A. Kupfer. 1998. Three-dimensional segregation of supramolecular activation clusters in T cells. Nature. 395:82-86.
Moore, S.W., P. Roca-Cusachs, and M.P. Sheetz. 2010. Stretchy proteins on stretchy substrates: the important elements of integrin-mediated rigidity sensing. Developmental cell. 19:194-206.
Mossman, K.D., G. Campi, J.T. Groves, and M.L. Dustin. 2005. Altered TCR signaling from geometrically repatterned immunological synapses. Science. 310:1191-1193.
20
Nguyen, K., N.R. Sylvain, and S.C. Bunnell. 2008. T cell costimulation via the integrin VLA-4 inhibits the actin-dependent centralization of signaling microclusters containing the adaptor SLP-76. Immunity. 28:810-821.
Nolen, B.J., N. Tomasevic, A. Russell, D.W. Pierce, Z. Jia, C.D. McCormick, J. Hartman, R. Sakowicz, and T.D. Pollard. 2009. Characterization of two classes of small molecule inhibitors of Arp2/3 complex. Nature. 460:1031-1034.
Oakes, P.W., D.C. Patel, N.A. Morin, D.P. Zitterbart, B. Fabry, J.S. Reichner, and J.X. Tang. 2009. Neutrophil morphology and migration are affected by substrate elasticity. Blood. 114:1387-1395.
Pelham, R.J., Jr., and Y. Wang. 1997. Cell locomotion and focal adhesions are regulated by substrate flexibility. Proceedings of the National Academy of Sciences of the United States of America. 94:13661-13665.
Rosenbluth, M.J., W.A. Lam, and D.A. Fletcher. 2006. Force microscopy of nonadherent cells: a comparison of leukemia cell deformability. Biophys J. 90:2994-3003.
Sabass, B., M.L. Gardel, C.M. Waterman, and U.S. Schwarz. 2008. High resolution traction force microscopy based on experimental and computational advances. Biophys J. 94:207-220.
Saitoh, M., T. Ishikawa, S. Matsushima, M. Naka, and H. Hidaka. 1987. Selective inhibition of catalytic activity of smooth muscle myosin light chain kinase. J Biol Chem. 262:7796-7801.
Sawada, Y., M. Tamada, B.J. Dubin-Thaler, O. Cherniavskaya, R. Sakai, S. Tanaka, and M.P. Sheetz. 2006. Force sensing by mechanical extension of the Src family kinase substrate p130Cas. Cell. 127:1015-1026.
Scholer, A., S. Hugues, A. Boissonnas, L. Fetler, and S. Amigorena. 2008. Intercellular adhesion molecule-1-dependent stable interactions between T cells and dendritic cells determine CD8+ T cell memory. Immunity. 28:258-270.
Uehata, M., T. Ishizaki, H. Satoh, T. Ono, T. Kawahara, T. Morishita, H. Tamakawa, K. Yamagami, J. Inui, M. Maekawa, and S. Narumiya. 1997. Calcium sensitization of smooth muscle mediated by a Rho-associated protein kinase in hypertension. Nature. 389:990-994.
Van Goor, D., C. Hyland, A.W. Schaefer, and P. Forscher. 2012. The role of actin turnover in retrograde actin network flow in neuronal growth cones. PloS one. 7:e30959.
Varma, R., G. Campi, T. Yokosuka, T. Saito, and M.L. Dustin. 2006. T cell receptor-proximal signals are sustained in peripheral microclusters and terminated in the central supramolecular activation cluster. Immunity. 25:117-127.
Wulfing, C., and M.M. Davis. 1998. A receptor/cytoskeletal movement triggered by costimulation during T cell activation. Science. 282:2266-2269.
Yang, Q., X.F. Zhang, T.D. Pollard, and P. Forscher. 2012. Arp2/3 complex-dependent actin networks constrain myosin II function in driving retrograde actin flow. The Journal of cell biology. 197:939-956.
Yi, J., X.S. Wu, T. Crites, and J.A. Hammer, 3rd. 2012. Actin retrograde flow and actomyosin II arc contraction drive receptor cluster dynamics at the immunological synapse in Jurkat T cells. Molecular biology of the cell. 23:834-852.
Yokosuka, T., K. Sakata-Sogawa, W. Kobayashi, M. Hiroshima, A. Hashimoto-Tane, M. Tokunaga, M.L. Dustin, and T. Saito. 2005. Newly generated T cell receptor
21
microclusters initiate and sustain T cell activation by recruitment of Zap70 and SLP-76. Nature immunology. 6:1253-1262.
Yu, Y., N.C. Fay, A.A. Smoligovets, H.J. Wu, and J.T. Groves. 2012. Myosin IIA modulates T cell receptor transport and CasL phosphorylation during early immunological synapse formation. PloS one. 7:e30704.
Yu, Y., A.A. Smoligovets, and J.T. Groves. 2013. Modulation of T cell signaling by the actin cytoskeleton. Journal of cell science. 126:1049-1058.
22
Figure 1: Jurkat T cells are weak generators of traction force. (a) Time lapse fluorescence
images of EGFP-actin expressing Jurkat T cells spreading on an anti-CD3 coated elastic
substrate (of stiffness 1.2 kPa). Scale bar: 10 µm. (b) Time-lapse images of traction stresses color
maps for the same cell as in (a). The colors correspond to magnitudes of stresses as indicated in
the color bar. (c) Vector map of traction force vectors showing the direction of exerted traction
stresses. Scale bar: 10 µm. (d) Development of total force as a function of time for three example
cells. Black trace corresponds to the cell in Figure 1(a). (e) Histogram of total traction force
23
exerted by Jurkat T cells (N=95). (f) Comparison of traction stresses generated by cells on
substrates coated with stimulatory antibody anti-CD3 and non-stimulatory antibody anti-CD45.
(g) A snapshot of an EGFP-actin cell on an elastic substrate (left) (scale bar 10 µm), and a
kymograph (right) drawn along the dashed line. The linear streaks illustrate actin retrograde flow
in the cell periphery. Scale bar: horizontal: 5 µm vertical: 5 min. (h) Histogram of retrograde
flow speeds of cells spreading on gels in the stiffness range 1-2 kPa (N=46).
24
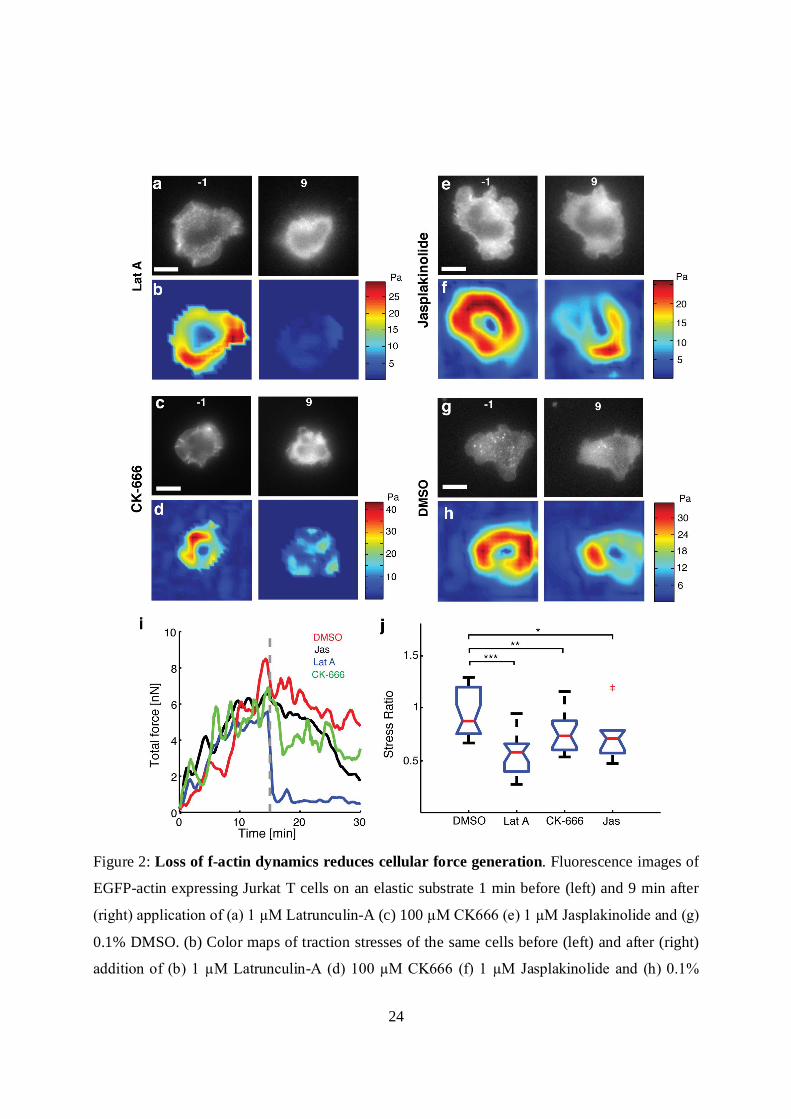
Figure 2: Loss of f-actin dynamics reduces cellular force generation. Fluorescence images of
EGFP-actin expressing Jurkat T cells on an elastic substrate 1 min before (left) and 9 min after
(right) application of (a) 1 µM Latrunculin-A (c) 100 µM CK666 (e) 1 µM Jasplakinolide and (g)
0.1% DMSO. (b) Color maps of traction stresses of the same cells before (left) and after (right)
addition of (b) 1 µM Latrunculin-A (d) 100 µM CK666 (f) 1 µM Jasplakinolide and (h) 0.1%
25
DMSO. (i) Total traction force as a function of time for a representative cell in each of the
conditions described above. The dashed line represents the time point at which the drug was
added. (j) Comparison of the after-to-before ratios of traction stresses for application of Lat-A (N
= 20 cells), CK666 (N = 17 cells) and Jasp (N = 10 cells) with control (DMSO carrier, N = 20
cells). The average stresses in a 3 min time interval just before addition of drug, and in the time
interval 9-12 min after addition of drugs were used to compute the ratios. (*, p < 0.05; **, p <
0.01, ***, p < 0.001).
26
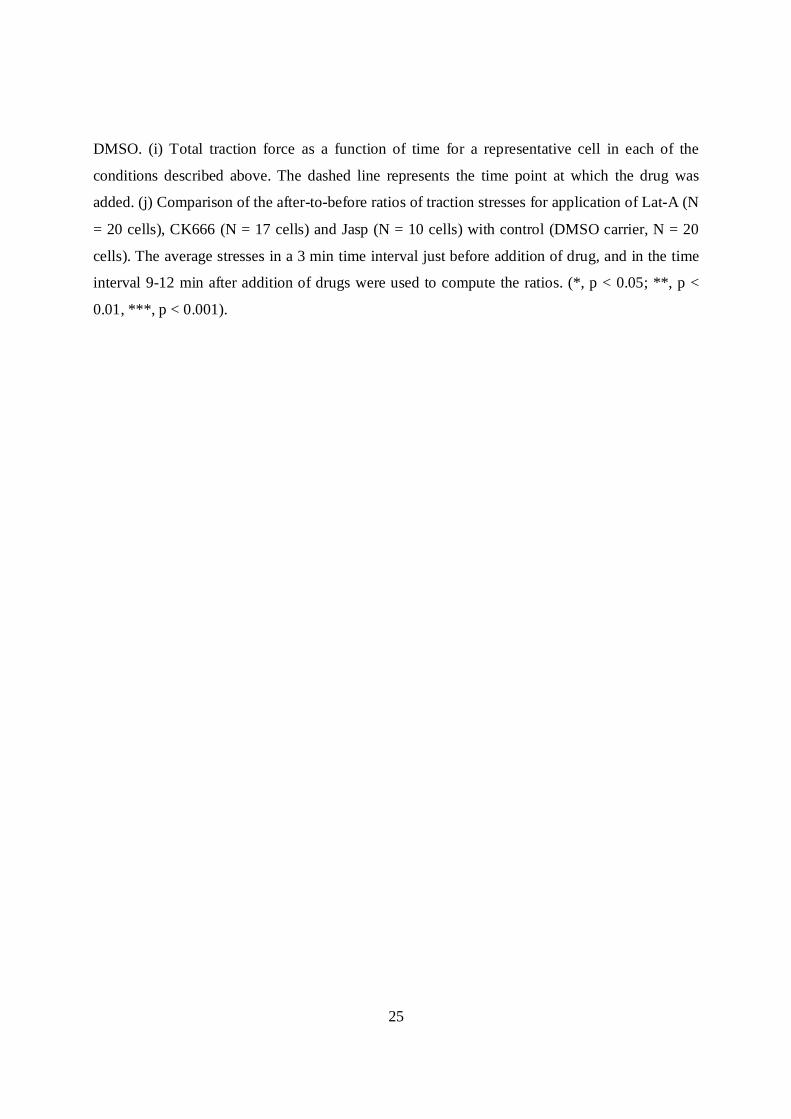
Figure 3: Effect of myosin II activity on cellular force generation. (a) Fluorescence image of
an EGFP-actin Jurkat T cells on an elastic substrate 1 min before addition of 50 µM Blebbistatin.
(b) Traction stress color map of the same cell 1 min before (left) and 9 min after (right) addition
of Blebbistatin. (c) Fluorescence images of an EGFP-actin Jurkat T cell on an elastic substrate 1
27
min before (left) and 9 min after (right) application of 100 µM Y-27632. (d) Traction stress color
maps of the same cell before and after addition of Y-27632. (e) Comparison of the after-to-
before ratios of traction stresses upon addition of Blebbistatin (N = 20 cells) and ML7 (N = 17
cells) with control (DMSO carrier), and comparison of traction stress ratios upon addition of Y-
27632 (N = 20 cells) with ddH20 control (N = 11 cells). The average stresses in a 3 min time
interval just before addition of drug, and in the time interval 9-12 min after addition of drugs
were used to compute the ratios. (**, p < 0.01). (f-g) Traction stress color maps for example cells
(at the indicated time points following stimulation.) Drug or vehicle was added at 5 min after
stimulation (f: DMSO, g: blebbistatin). h) Traces of the total force exerted by 4 example cells
with drug addition 5 min after stimulation (vertical dashed line). The total force is normalized to
the value exerted at 5 min after stimulation. Red lines indicate vehicle and blue lines indicate the
time of blebbistatin addition. i) Summary statistics of the stress ratio following drug addition for
cells averaged between 9-12 min after stimulation. N=13 for blebbistatin and N=12 for DMSO
(p<0.05, Wilcoxon’s rank sum test). All scale bars: 10 µm.
28
29
Figure 4: Substrate stiffness affects traction forces and signaling. (a) Average total force
exerted by cells (between 14-15 minutes of spreading initiation) as a function of gel stiffness (N
= 500). The data is fit to (red curve) with Fsat = 5 nN, and kcell = 1 nN/ µm
(corresponding to 1.5 kPa). (b) Top panels: DIC images of two representative cells spreading on
soft (200 Pa) and stiff (10 kPa) gels. Kymographs of edge dynamics for the two cells along the
locations indicated by the red lines. (c) Example time traces of Pearson coefficient between cell
edge’s radial position profile at 15 minutes and at earlier time points for cells spreading on soft
(blue) and stiff (red) gels. (d) Comparison of the percentage of time for which the cell edge
profile had correlation coefficient > 0.5 compared to the profile at 15 min, for softer (< 1.5 kPa
stiffness) and stiffer (> 1.5 kPa stiffness) gels. The difference between the two conditions is
significant (t-test, p < 0.001) and indicates that cell edges are more dynamic on softer gels. (e)
Western blot analysis of tyrosine phosphorylation (pY) levels (of LAT and ZAP70/SLAP76
substrates) at the indicated times on two different gel stiffnesses (~1 kPa and ~5 kPa). (f)
Densitometry analysis of relative pY levels (for LAT substrate) as a function of time for cells on
soft gels (blue curve, ~1 kPa) and stiff gels (red curve, ~ 5 kPa). Analysis represents average of 5
different experiments.