Embed Size (px)
Citation preview

Molecular Ecology (2002)
11
, 139–151
© 2002 Blackwell Science Ltd
Blackwell Science Ltd
Data from amplified fragment length polymorphism (AFLP) markers show indication of size homoplasy and of a relationship between degree of homoplasy and fragment size
X . VEKEMANS,
*
T . BEAUWENS,
*
M. LEMAIRE
*
and I . ROLDÁN-RUIZ
†
*
Université Libre de Bruxelles, Laboratoire de Génétique et Ecologie Végétales 1850 chaussée de Wavre, 1160 Bruxelles, Belgium,
†
Department of Plant Genetics and Breeding, Centre of Agricultural Research-Gent, Caritasstraat 21, 9090 Melle, Belgium
Abstract
We investigate the distribution of sizes of fragments obtained from the amplified fragmentlength polymorphism (AFLP) marker technique. We find that empirical distributionsobtained in two plant species,
Phaseolus lunatus
and
Lolium perenne
, are consistent withthe expected distributions obtained from analytical theory and from numerical simulations.Our results indicate that the size distribution is strongly asymmetrical, with a much higherproportion of small than large fragments, that it is not influenced by the number of selectivenucleotides nor by genome size but that it may vary with genome-wide GC-content, witha higher proportion of small fragments in cases of lower GC-content when considering thestandard AFLP protocol with the enzyme
Mse
I. Results from population samples of the twoplant species show that there is a negative relationship between AFLP fragment size andfragment population frequency. Monte Carlo simulations reveal that size homoplasy, arisingfrom pulling together nonhomologous fragments of the same size, generates patterns similarto those observed in
P. lunatus
and
L. perenne
because of the asymmetry of the size distribution.We discuss the implications of these results in the context of estimating genetic diversitywith AFLP markers.
Keywords
:
AFLP, genetic diversity, homoplasy,
Lolium perenne
,
Phaseolus lunatus
Received 12 April 2001; revision received 13 September 2001; accepted 13 September 2001
Introduction
Genetic markers obtained from the amplified fragmentlength polymorphism (AFLP) technique, based on theselective polymerase chain reaction (PCR) amplificationof restriction fragments from a total restriction digest ofgenomic DNA (Vos
et al
. 1995), are commonly used ingenome mapping applications, but are also adopted in thefields of ecological genetics (Mueller & Wolfenbarger 1999)and conservation of plant genetic resources (e.g. Zhu
et al
.1998; De Riek
et al
. 1999). For example, in the journal
Molecular Ecology
, the number of papers dealing with AFLPmarkers was three in 1997, four in 1998, 10 in 1999, and 15in 2000. Several studies comparing different molecular
techniques have highlighted the key qualities of the AFLPtechnique, which are a high multiplex ratio (number ofpolymorphic markers generated in a single PCR experiment)and high reproducibility (Powell
et al
. 1996; Jones
et al
.1998; Pejic
et al
. 1998). Because of these qualities, someauthors speculated that AFLP markers would eventuallydisplace random amplified polymorphic DNA (RAPD)markers, which suffer from reproducibility problems, andmight also partially replace high-resolution markerssuch as restriction fragment length polymorphismsand microsatellites in some applications (Mueller &Wolfenbarger 1999).
However, these optimistic figures should be temperedby several drawbacks of the technique that are not alwaysrecognized by the end-user. An important feature of AFLPdata is the large number of loci that are commonly scored,because the information content of a single AFLP marker is
Correspondence: Xavier Vekemans. Fax: + 322 650 9170; E-mail:[email protected]
MEC_1415.fm Page 139 Thursday, December 13, 2001 9:10 PM

140
X . V E K E M A N S
E T A L .
© 2002 Blackwell Science Ltd,
Molecular Ecology
, 11, 139–151
low. However, when the number of loci scored is large, theaverage level of linkage between loci will be substantialand this will cause a decrease in the precision of estimatorslike the pairwise genetic relationship between individuals(Thompson & Meagher 1998). In most of their applications,AFLP markers are treated as dominant markers, whichalso contributes to a lower information content that iscritical in applications such as estimation of effective popu-lation size ( Jorde
et al
. 1999), paternity assessment (Lewis& Snow 1992), estimation of male mating success (Milligan& McMurry 1993), or parentage analysis (Gerber
et al
. 2000).Another potential source of imprecision in AFLP datacomes from the unverified assumption that fragments ofthe same size are truly homologous. Clark & Lanigan (1993)suggest in the case of RAPD markers that the homology ofbands of the same size should be tested systematically, e.g. bySouthern hybridization. In practice such verifications haverarely been performed (Thormann
et al
. 1994; Rieseberg1996) because they are technically demanding and timeconsuming, although a simplified method to detect sizehomoplasy among AFLP fragments has been recently pro-posed (O’Hanlon & Peakall, 2000).
In this paper, we suggest that nonhomologous AFLPfragments of the same size may be frequent as a con-sequence of the very nonuniform distribution of fragmentsizes and of the large number of fragments that are usuallyamplified. Moreover, we hypothesize that the level of sizehomoplasy varies as a function of fragment size and thatthis could bias estimations of genetic diversity based onobserved AFLP fragment frequencies. We first review thetheory describing the distribution of AFLP fragment sizes.Then we check the theory using numerical simulations andinvestigate the empirical distribution of fragment sizesusing data sets from two plant models,
Lolium perenne
L.and
Phaseolus lunatus
L. Finally, we test our hypothesis thatthe level of size homoplasy may be related to fragment sizeby analysing AFLP population data from the two plantmodels and show that the observed patterns are quantit-atively consistent with the hypothesis by means of MonteCarlo simulations of the fragment size sampling process.
Theory of AFLP fragment size distribution
The expected distribution of AFLP fragment sizes has beenderived by Innan
et al
. (1999), based on the derivation ofNei & Li (1979) for single restriction fragments. We re-formulate the derivation here to emphasize the key factorsinfluencing the shape of the distribution, in particular thegenome-wide GC-content which was not explicitly takeninto account by Innan
et al
. (1999), and to provide anexpression for the mean fragment size. For simplicity, weassume in the text that AFLP markers are obtainedaccording to the original protocol (Vos
et al
. 1995) but theequations can be applied to modified procedures using, for
instance, alternative restriction enzymes. Three classes offragments are typically obtained with the AFLP techniqueafter the double restriction and the ligation procedures:fragments flanked by (1)
Eco
RI-adapters on both sides; (2)an
Eco
RI-adapter on one side and an
Mse
I-adapter on theother; and (3)
Mse
I-adapters on both sides. Of these, onlyfragments from classes (1) and (2) are usually recordedbecause visualization is achieved through labelling of the
Eco
RI-primer. For consistency with Innan
et al
. (1999) werefer to these two classes of fragments as types 1 and 2,respectively.
To produce an AFLP fragment from a genomic sequence,at least two conditions must be met: (i) each fragment edgeshould match an
Eco
RI- or
Mse
I-restriction site; (ii) no
Eco
RI-or
Mse
I-restriction site should occur within the fragmentsequence. An additional condition arises when selectivenucleotides are used for the
Eco
RI- and/or
Mse
I-primers(typically three on each side for large genomes), but thenumber of selective nucleotides will not influence fragmentsizes because the latter are defined strictly by the doublerestriction procedure preceding the amplification step. Theexpected frequency of occurrence of an
Eco
RI-restrictionsite in a random genomic sequence,
a
1
, is given by
(1)
where
g
is the genomic GC-content (proportion of
G
+ Cnucleotides), 2 and 4 are the number of
G
+ C and A + Tresidues, respectively, in the
Eco
RI-restriction site motif[5
′
-GAATTC-3
′
]. Similarly, the frequency of occurrence ofa
Mse
I-restriction site,
a
2
, is given by
(2)
because it consists of four A + T residues only [5
′
-TTAA-3
′
].Eqns 1 and 2 can easily be adapted to other restrictionenzymes by changing the numbers of
G
+ C and A + Tresidues accordingly. Considering that each position ina sequence of length
L
, occurring between the tworestriction sites on the edges, is a potential starting pointof either an
Eco
RI- or
Mse
I-restriction site with probability
a
1
and
a
2
, respectively, the probability that no restrictionsite starts at a given position is
A
= 1 –
a
1
–
a
2
, (3)
because the two types of restriction events are mutuallyexclusive. Innan
et al
. (1999) considered the two events asindependent for simplicity, but this eventually leads to thesame final approximate equation. When considering allpositions, the probability that no restriction occurs withinthe sequence of length
L
is given by
ag g
1
2 4
21
2
,=
−
ag g g
2
0 4 4
21
21
2
,=
−
=
−
MEC_1415.fm Page 140 Thursday, December 13, 2001 9:10 PM
S I Z E H O M O P L A S Y W I T H A F L P M A R K E R S
141
© 2002 Blackwell Science Ltd,
Molecular Ecology
, 11, 139–151
A
L
–6+1
(1 –
a
2
)
2
, (4)
because there are
L
– 6 + 1 possible starting points of
Eco
RI-restriction sites and two additional potential
Mse
I-restriction sites. Now, we consider the probabilitydensity function of
L
for type 1 fragments,
G
1
(
L
), assumingthat electrophoretic conditions limit the detection range ofAFLP fragments between
L
min
and
L
max
. We obtain anexpression for
G
1
(
L
) by conforming to conditions (i) and (ii)above as
(5)
where the denominator is a normalizing factor expressingthe expected frequency of occurrence of type 1 fragmentsof any length within the detection range. Eqn 5 leads to
(6)
which is mathematically equivalent to formula 9 fromInnan
et al
. (1999), and amounts to a truncated negativeexponential distribution. The denominator of eqn 6 issimply the proportion
V
of type 1 fragments occurringbetween
L
min
and
L
max
because
(7)
where
C
is the overall genome size (considered assufficiently large). A similar calculation for the sizedistribution of AFLP type 2 fragments,
G
2
(
L
), leads toexactly the same equation as 6. Hence, as noted by Innan
et al
. (1999), AFLP type 1 and type 2 fragment sizes have thesame probability density function. Another property ofeqn 6 is that
G
1
(
L
) is independent of genome size.Finally, the expected mean fragment length is obtaine
from
which gives
(8)
Values of
L
,
L
min
and
L
max
in these equations correspondto the length of the sequence occurring between the tworestriction sites. In order to transform these into expectedsizes of PCR fragments, one should add the length of the
primer sequences excluding the selective nucleotides. Forall data analyses we chose
L
min
= 43 bp and
L
max
= 418 bpin order to correspond to PCR fragments in the range 75–450 bp, because the typical
Eco
RI and
Mse
I primers containa 16-bp long sequence when excluding the selective nucle-otides. In the following text, we will refer to fragment sizesas sizes of PCR fragments, thus including the length of theprimer sequences.
Materials and methods
Numerical simulations of fragment distributions
Numerical simulations of the AFLP technique wereperformed in order to test the validity of the mathematicalmodel used above. For each replicate, a nucleotide sequenceof length
C
was driven at random under the constraint of agiven overall GC-content. The sequence was then screenedfor the presence of AFLP fragments by specifying thenumber, identities and sequence of nucleotides in therestriction site of both restriction enzymes, as well asthe number, identities and sequence of selective nucle-otides used in each primer. The program reports the numberof type 1 and type 2 fragments detected in the range
L
min
=43 bp to
L
max
= 418 bp (see above), their size distribution,and their mean size. The distributions of fragment sizeswere tested against the expected distribution of eqn 6 usinga
G
-test for goodness of fit (Sokal & Rohlf 1995) afterspecifying a variable number of size intervals. We simulatedtypical AFLP analyses with six and four nucleotides,respectively, in the recognition motif of types 1 and 2restriction enzymes. The number of selective nucleotideson each side varied from one to three. Three genome sizeswere tested:
C
= 10
4
, 10
6
and 10
7
. Three values of the overallGC-content were used: 0.45, 0.50 and 0.55. The number ofreplicates per parameter set was at least 2000.
AFLP analyses in
Phaseolus lunatus
and
Lolium perenne
For
P. lunatus
, seeds were sampled in 10 naturalpopulations from the Central Valley of Costa Rica. Fiveseedlings from each population were used for DNAextraction according to a CTAB protocol described inFofana
et al
. (1997). AFLP reactions were performedaccording to the standard protocol with double restriction(
Eco
RI,
Mse
I), ligation, and first PCR amplification performedwith the AFLP ligation and pre-selective amplificationmodule from PE Biosystems. For a single individual, drivenat random from the 50 available, selective amplificationreactions were performed with 17 primer combinationscharacterized by a total of six selective nucleotides, usingcombinations of
Mse
I-CAG,
Mse
I-CAC,
Mse
I-CAT,
Mse
I-CTA,
Mse
I-CTC,
Mse
I-CTT, or
Mse
I-CTG, with
Eco
RI-ACA,
G L a A a a A aL
L L
LL
1 12 6 1
22
12 6 1
221 1( ) ( ) / ( ) ,
min
max
= − −− +
=
− +∑
G LA A
A A
L
L L1 1
1( )
( )
,
min max=
−− +
V
a A a
a A a
A A
L
L L
L
L
L
CL L
( )
( )
,min
max
min max=
−
−
≅ −
− +
=
− +
=
+
∑
∑
12 6 1
22
12 6 1
22
0
1
1
1
E G L LG LL
L
[ ( )] ( ),min
max
1 1= ∑
E G LL A L A
A AA
A A
L LL L
L L[ ( )]
( )
.min maxmin max
min max
min max1
11 1
11=
− + −−
−
++ +
+
MEC_1415.fm Page 141 Thursday, December 13, 2001 9:10 PM

142
X . V E K E M A N S
E T A L .
© 2002 Blackwell Science Ltd,
Molecular Ecology
, 11, 139–151
Eco
RI-ACC,
Eco
RI-ACT,
Eco
RI-ACG,
Eco
RI-AGC,
Eco
RI-AGG,
Eco
RI-AAG, or
Eco
RI-AAC from the AFLP selectiveamplification start-up module from PE Biosystems. For thesame individual, amplifications were also performed with22 primer combinations characterized by a total of fiveselective nucleotides, using combinations of MseI-CT, MseI-CA, MseI-CG, or MseI-AG with the fluorescently labelledEcoRI primers described above. For all 50 individuals,selective amplifications were performed with the fourfollowing primer combinations only: MseI-CG with EcoRI-AGG; MseI-CA with EcoRI-ACT; MseI-AC with EcoRI-AGG,and MseI-CA with EcoRI-AGG. All amplifications were donewith the AFLP amplification core mix module on aGeneAmp PCR System 2400, both from PE Biosystems.Electrophoresis and detection of PCR products werecarried out on denaturing polyacrylamide gels (5% LongRanger; 36-cm length), with internal molecular weight sizestandards, using an ABI PRISM® 377 DNA sequencer fromPE Biosystems. Gels were run for 2 h at 3000 V in TBEbuffer.
For L. perenne two artificial populations (Merganda andPaddok) were analysed. Merganda and Paddok are twocommercial diploid cultivars bred at the Department ofPlant Genetics and Breeding and derived from multiplecrosses (polycrosses) involving four and six parental plants,respectively. In L. perenne breeding, several generations ofrandom mating are constructed before the cultivar is readyfor commercialization. In this study we analysed Syn3seed, i.e. seed produced after three generations of randommating. AFLP reactions and gel analysis were performedaccording to Roldán-Ruiz et al. (2001). Thirty plants of thecultivar Paddok and 31 plants of the cultivar Mergandawere fingerprinted with two primer combinations: MseI-CAA with EcoRI-ACG and MseI-CTT with EcoRI-AGG. Forone individual drawn at random from the cultivar Mer-ganda, 25 selective amplification reactions were performedwith 25 primer combinations characterized by a total of sixselective nucleotides, using combinations of MseI-CAA,MseI-CAC, MseI-CAT, MseI-CAG, MseI-CTA, MseI-CTC,MseI-CTG or MseI-CTT, with EcoRI-AAG, EcoRI-ACA,EcoRI-ACC, EcoRI-ACG, EcoRI-AGC or EcoRI-AGG.
Data analysis of AFLP fingerprints
All electropherograms were analysed with softwaregenotyper® 2.5 from PE Biosystems. For each individualand primer combination, the number of AFLP fragmentsand the size of each fragment in the range 75–450 bp weredetermined. For analysis of the whole sample from P.lunatus, and of each of the two populations of L. perenne,the population frequency of each fragment from eachprimer combination was computed. The product–momentcorrelation coefficient between fragment size and fragmentfrequency was computed for each sample taking into
account all fragments from all primer combinations. Thesignificance of the correlation coefficient was tested with at-test (Sokal & Rohlf 1995). The fragments were thendivided into four size categories (75–124 bp, 125–199 bp,200–299 bp, 300–450 bp) and average population frequencieswere computed for each category. Categories of unequallength were chosen to compensate for the asymmetry inthe distribution of fragment sizes.
In order to estimate within-population genetic divers-ities, we first computed allelic frequencies for the markeralleles associated with each fragment, assuming each frag-ment to be encoded by a distinct locus and dominance ofthe marker allele, and then estimated nucleotide diversitiesusing the following procedure.
A Allelic frequencies at AFLP loci were computed fromthe observed frequencies of fragments using the Bayesianestimates proposed by Zhivotovsky (1999) for diploid spe-cies. Parameters from the prior distribution of allele fre-quency were estimated from the between-locus variationin fragment frequency using formula 13 from Zhivotovsky(1999). For L. perenne, an obligate outcrosser, Hardy–Weinberggenotypic proportions have been assumed and allelic fre-quencies were computed with formula 5 from Zhivotovsky(1999). For P. lunatus, a predominantly autogamous species,Hardy–Weinberg genotypic proportions cannot be assumed,but the average inbreeding coefficient, FIS, has beenestimated for allozyme loci in the same populations fromCosta Rica (FIS = 0.79, Maquet et al. 1996). Hence, we appliedformula 15 from Zhivotovsky (1999) using FIS = 0.79.B From the allelic frequencies we estimated the proportionof shared fragments between random pairs of haploidgenomes within a population, or probability of band sharing,as
where xi is the frequency of the marker allele at locus i andthe sums are over all fragments recorded from all primercombinations (Clark 1997).C From the value of F obtained for each populationsample, we estimated the average nucleotide diversity inthe sample, π, or average number of nucleotide differencesper site between two randomly sampled haploid genomes(Nei 1987), using the method of Innan et al. (1999) for AFLPdata that takes into account relative probabilities of evolu-tionary events such as mutations in the restriction sites orin the additional selective nucleotides, and appearance ofnew restriction sites within the fragments. The only changewe introduced in the calculation was to set C = 0 in formula16 from Innan et al. (1999), where C is the expected propor-tion of fragments shared by chance, because we think thatthis correction for size homoplasy is misleading (see theDiscussion).
F x xii
ii
/ ,= ∑ ∑2
MEC_1415.fm Page 142 Thursday, December 13, 2001 9:10 PM
S I Z E H O M O P L A S Y W I T H A F L P M A R K E R S 143
© 2002 Blackwell Science Ltd, Molecular Ecology, 11, 139–151
D Bootstraps were performed on steps B–C with randomsampling of fragments with replacement, in order to obtainconfidence intervals for the average nucleotide diversity.
The procedure to compute the nucleotide divergence,or net nucleotide substitutions per site (Nei 1987),between the two populations of L. perenne was the sameexcept that the equation to compute F, the probability ofband sharing among individuals belonging to differentpopulations, is
where xAi and xBi are the frequencies of the marker allele atlocus i in populations A and B, respectively (Clark 1997).
These calculations have been performed with thesoftware aflp-survey that is available upon request [email protected].
Monte Carlo simulations of fragment sampling
In order to test if the patterns observed in our empir-ical data were consistent with our hypothesis that sizehomoplasy among AFLP fragments occurs and varies asa function of fragment size, we implemented simpleMonte Carlo simulations of the fragment size samplingprocess. The principle is to use the theoretical distributionof fragment sizes to simulate observed distributions inpopulation samples in order to: (i) evaluate expected sizehomoplasy by computing the proportion of fragmentssharing identical size; and (ii) quantify the influence of sizehomoplasy on estimates of population fragment frequen-cies and compare expected patterns with the empiricalresults. The procedure to reach objective (i) is as follows.
A We randomly drew nt fragment sizes from the theoreticaldistribution G1(L) using the following method. For eachvalue of fragment size L in the interval Lmin to Lmax we storethe value of
with G1(l) given by eqn 6, where G1cum(L) is the expectedproportion of fragments with size smaller or equal toL. Random series of fragment sizes were then drawn bygenerating repetitively random real values from a uniformdistribution between 0 and 1, and looking up amongvalues of G1cum(L) to find the corresponding values ofL. The following parameters were used: for P. lunatus-likesimulations, GC-content = 0.45, Lmin = 43 bp, Lmax = 418 bp,and nt = 250 (chosen after iteration to get a mean numberof detectable fragments close to the observed mean valueper primer pair, ndif = 169.3, cf. Table 3); for L. perenne,
GC-content = 0.50, Lmin = 43 bp, Lmax = 418 bp, nt = 220(chosen to get close to the observed ndif in the range 154–163,cf. Table 3).B Among the nt fragment sizes obtained, we counted thenumber of detectable fragments, i.e. the number of distinctsize values, that we note ndif.C We divided the range of fragment sizes in four categor-ies (75–124 bp, 125–199 bp, 200–299 bp, 300–450 bp) andfor each category i we computed the total number of frag-ment sizes generated, nti, the corresponding number ofdetectable fragments, ndifi, and the ratio ndifi/nti that isinversely related to size homoplasy.D We repeat steps A–C over 5000 replicates.
The procedure to reach objective (ii) is as follows:
A We start by performing step A of the previous pro-cedure in order to get the distribution of nt fragment sizesin the total population sample.B We simulate phenotypic data for a sample of npop indi-viduals by randomly choosing, without replacement foreach individual, a number nind of fragments from thosegenerated in A. Thus the same number of fragments isassigned to each individual, but with different combina-tions. This procedure assumes that all fragments have anidentical a priori frequency (= nind/nt) and are encoded bygenetically unlinked loci. For P. lunatus-like simulationsnpop = 50 and nind = 150 (chosen after iteration to get amean number of detectable fragments per individual closeto the mean observed value per primer pair = 115.3, datanot shown). For L. perenne, npop = 30 and nind = 80 (chosento get close to the mean observed number of detectablefragments per individual = 70.2).C We compute the population frequency of each detecta-ble fragment by counting, for each fragment size L in therange Lmin to Lmax, the number of individuals possessing atleast one fragment of size L. Average frequencies of detect-able fragments are also computed for each of the four sizecategories described above.D We compute, after exclusion of fragment sizes with nullfrequency, the correlation coefficient between fragmentsize and population frequency.E We repeat 5000 times steps A to D and compute meansand standard deviations of the statistics over these replicates.The resulting distribution of the correlation coefficientcomputed in D is used to calculate a 99% confidenceinterval for the mean using the percentile method.
A software package that computes the expected distributionof fragment sizes for different restriction enzymes and anyvalue of genomic GC-content, and that performs simulationsto estimate the expected proportion of detectable fragments,as a function of the observed number of fragments detectedis available upon request at [email protected].
F x x x xAi Bii
Ai Biii
/ ( ),= ∑ ∑∑√ 2 2
G L G ll L
L
1 1cum( ) ( ),min
==∑
MEC_1415.fm Page 143 Thursday, December 13, 2001 9:10 PM

144 X . V E K E M A N S E T A L .
© 2002 Blackwell Science Ltd, Molecular Ecology, 11, 139–151
Results
Distribution of AFLP fragment sizes
The size distributions of types 1 and 2 AFLP fragmentsobtained by numerical simulations with two selective sites,C = 106 and a GC-content of 0.45 are shown in Fig. 1. Alsoshown in Fig. 1 are the expected distributions for overallGC-contents of 0.45, 0.50 and 0.55. It can be seen that the
shape of the expected distributions is influenced by theGC-content, with a higher proportion of small fragments incases of lower GC-content. Both observed distributions areconsistent with the expected distribution for a GC-contentof 0.45, but oscillations are much larger for type 1 frag-ments, because of their lower abundance. Results fromsimulations with different numbers of selective nucleotides,genome size and GC-content are given in Table 1. In mostcases the observed mean sizes of type 1 and 2 fragments are
0
0.005
0.01
0.015
0.02
0.025
0.03
0.035
0.04
0.045
50 100 150 200 250 300 350 400 450 500
Fragment size (bp.)
Pro
port
ion
of f
ragm
ents
observed type 1 (N=1394)
observed type2 (N=47867)
expected (GC=0.45)
expected (GC=0.50)
expected (GC=0.55)
Fig. 1 Comparison of distributions of sizesof types 1 and 2 AFLP fragments obtainedfrom 2000 replicates of numerical simulationswith two selective sites, genome sizeC = 106 and a GC-content of 0.45, withexpected distributions for three differentlevels of GC-content. The proportion offragments of a given size is expressed as asum within nonoverlapping intervals of5 bp-width of the observed or expectedrelative frequencies of fragments.
Table 1 Simulations of the effect of the number of selective nucleotides, GC-content, and genome size on the mean AFLP fragment size,on the proportion of fragments lying in the range 75–450 bp (V), and on the shape of the size distribution (results from a G-test of goodnessof fit against theoretical distribution). Observed and expected parameters for different simulations tested. Results are obtained from 2000to 200 000 replicate runs according to genome size. Only fragments between 75 and 450 bp were taken into account in the G-test and in thecomputation of observed and expected mean fragment size
No. of selective nucleotides
GC-content
Genome size (bp)
No. of replicate runs
Total no. of fragments
No. of fragments(75–450 bp)
Observed Expected
G-test of goodness of fit
Observed mean fragment size (SD‡)
Expected mean fragment size§V V* G df† P
Type 1 fragments (EcoRI-EcoRI)2 0.50 104 200 000 1839 1275 0.69 0.66 72.9–71 0.41 210.8 (100.0) 215.42 0.45 106 2 000 1977 1394 0.71 0.69 74.6–70 0.33 194.3 (95.1) 196.92 0.50 106 2 000 1687 1117 0.66 0.66 73.4–73 0.40 214.7 (102.4) 215.42 0.55 106 2 000 1348 780 0.58 0.57 62.2–70 0.74 228.2 (108.7) 230.54 0.50 106 10 000 582 409 0.70 0.66 40.3–33 0.18 211.5 (99.0) 215.46 0.50 107 10 000 350 241 0.69 0.66 14.2–13 0.36 201.8 (98.7) 215.4
Type 2 fragments (EcoRI-MseI)2 0.50 104 200 000 56 104 37 602 0.67 0.66 88.3–74 0.12 214.0 (102.3) 215.42 0.45 106 2 000 68 356 47 867 0.70 0.69 79.6–74 0.31 194.9 (95.3) 196.92 0.50 106 2 000 57 579 38 382 0.67 0.66 81.1–74 0.27 214.8 (101.6) 215.42 0.55 106 2 000 44 516 25 755 0.58 0.57 66.0–74 0.73 230.5 (105.2) 230.54 0.50 106 10 000 17 670 11 954 0.68 0.66 49.2–74 0.99 214.9 (102.1) 215.46 0.50 107 10 000 11 184 7 620 0.68 0.66 46.7–35 0.09 213.7 (101.7) 215.4
*Computed from eqn 7. †Degrees of freedom. ‡Standard deviation under parentheses. §Computed from eqn 8.
MEC_1415.fm Page 144 Thursday, December 13, 2001 9:10 PM

S I Z E H O M O P L A S Y W I T H A F L P M A R K E R S 145
© 2002 Blackwell Science Ltd, Molecular Ecology, 11, 139–151
very close to the expected sizes (ranging from 196.9 bpto 230.5 bp, for GC-content ranging from 0.45 to 0.50)computed for an AFLP analysis with restriction enzymesof type EcoRI/MseI and a scoring range of PCR productsfrom 75 to 450 bp. Results from G goodness of fit tests aimingat detecting departure from the expected distribution areall nonsignificant. The proportion of fragments occurringwithin the detection range (75–450 bp) varied between0.58 (GC-content = 0.55) to 0.71 (GC-content = 0.45) andwas very close to those expected from eqn 8. It also appearsthat genome size (C) in the range studied here does notinfluence the distribution statistics. Hence, our numericalresults confirm that type 1 and type 2 fragments havesimilar size distributions, that the total number of selectivenucleotides and the genome size do not modify theshape of the distribution, but that the GC-content has asubstantial effect on mean fragment size, on the overallshape of the distribution, and on the proportion offragments lying within the detection range.
For one individual of Phaseolus lunatus, AFLP analysesperformed using 22 primer combinations with five selective
nucleotides produced a total of 1506 fragments between 75and 450 bp. With six selective nucleotides, 801 fragmentswere obtained by using 17 primer combinations. Empiricaldistributions of AFLP fragment sizes with five and sixselective nucleotides are given in Fig. 2(a,b), respectively. Itappears that the two distributions are very similar, whichconfirms results from numerical simulations. Three expectedsize distributions corresponding, respectively, to genome-wide GC-contents of 0.45, 0.50 and 0.55 are also illustratedin Fig. 2. The observed distributions for P. lunatus seemto fit best the expected distribution with a GC-contentof 0.45, although the fit is poorer in the region of smallfragment sizes. The observation that observed values arelower than expected values for small fragment sizescould be attributed to the occurrence of size homoplasy(see below). In the case of the observed distribution withfive selective nucleotides, results from the G-test signific-antly reject the fit to the expected distributions under0.50 and 0.55 GC-content (P < 0.05 and P < 0.001, respect-ively). With six selective nucleotides, results from theG-test significantly reject the fit to the expected distribution
0.000
0.005
0.010
0.015
0.020
0.025
0.030
0.035
0.040
50 100 150 200 250 300 350 400 450 500
Fragment size (bp)
Pro
port
ion
of fr
agm
ents
observed (N=1506)
expected (GC=0.45)
expected (GC=0.50)
expected (GC=0.55)
0.000
0.005
0.010
0.015
0.020
0.025
0.030
0.035
0.040
50 100 150 200 250 300 350 400 450 500
Fragment size (bp)
Pro
port
ion
of fr
agm
ents
observed (N=801)
expected (GC=0.45)
expected (GC=0.50)expected (GC=0.55)
(a)
(b)
Fig. 2 Comparisons of empirical distributionsof AFLP fragment sizes in Phaseolus lunatuswith expected distributions for three dif-ferent levels of genome-wide GC-content.(a) Fragments obtained from 22 primercombinations with five selective nucleotides.(b) Fragments obtained from 17 primercombinations with six selective nucleotides.The proportion of fragments of a given size isexpressed as a sum within nonoverlappingintervals of 5-bp width of the observed orexpected relative frequencies of fragments.
MEC_1415.fm Page 145 Thursday, December 13, 2001 9:10 PM
146 X . V E K E M A N S E T A L .
© 2002 Blackwell Science Ltd, Molecular Ecology, 11, 139–151
with 0.55 GC-content only (P < 0.001), with the lowestvalue of the G-statistic obtained for the 0.45 GC-contentdistribution.
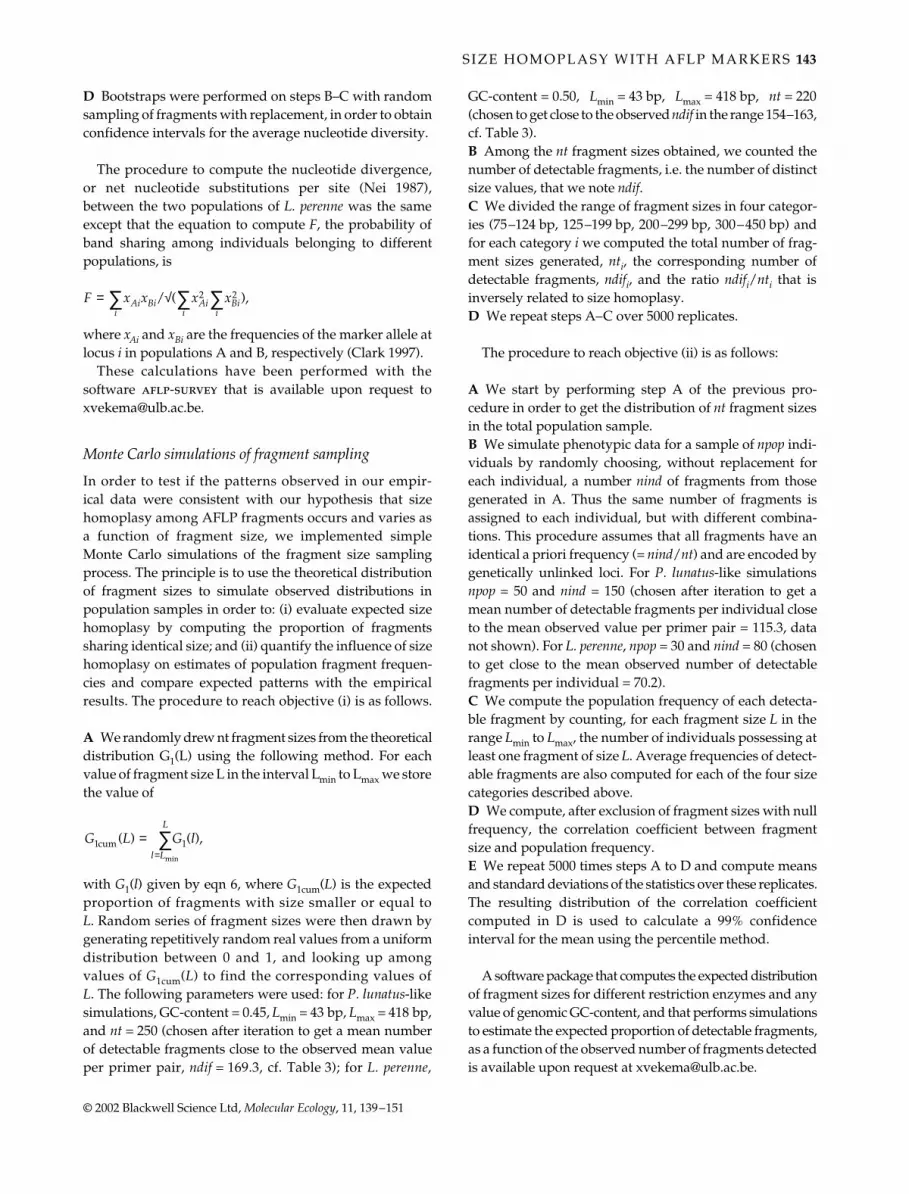
For one individual of Lolium perenne, AFLP analyseswere carried out using 25 primer combinations with sixselective nucleotides. A total of 1599 fragments between 75and 450 bp were obtained. The observed distribution ofAFLP fragment sizes fits very closely the expected distri-bution under a GC-content of 0.50 (Fig. 3). Results fromthe G-test for L. perenne significantly reject the fit to theexpected distribution with a GC-content of 0.45 (P < 0.001),with the lowest value of the G-statistic obtained for the 0.50GC-content distribution.
Detection of homoplasy in AFLP data sets and validation with Monte Carlo simulations
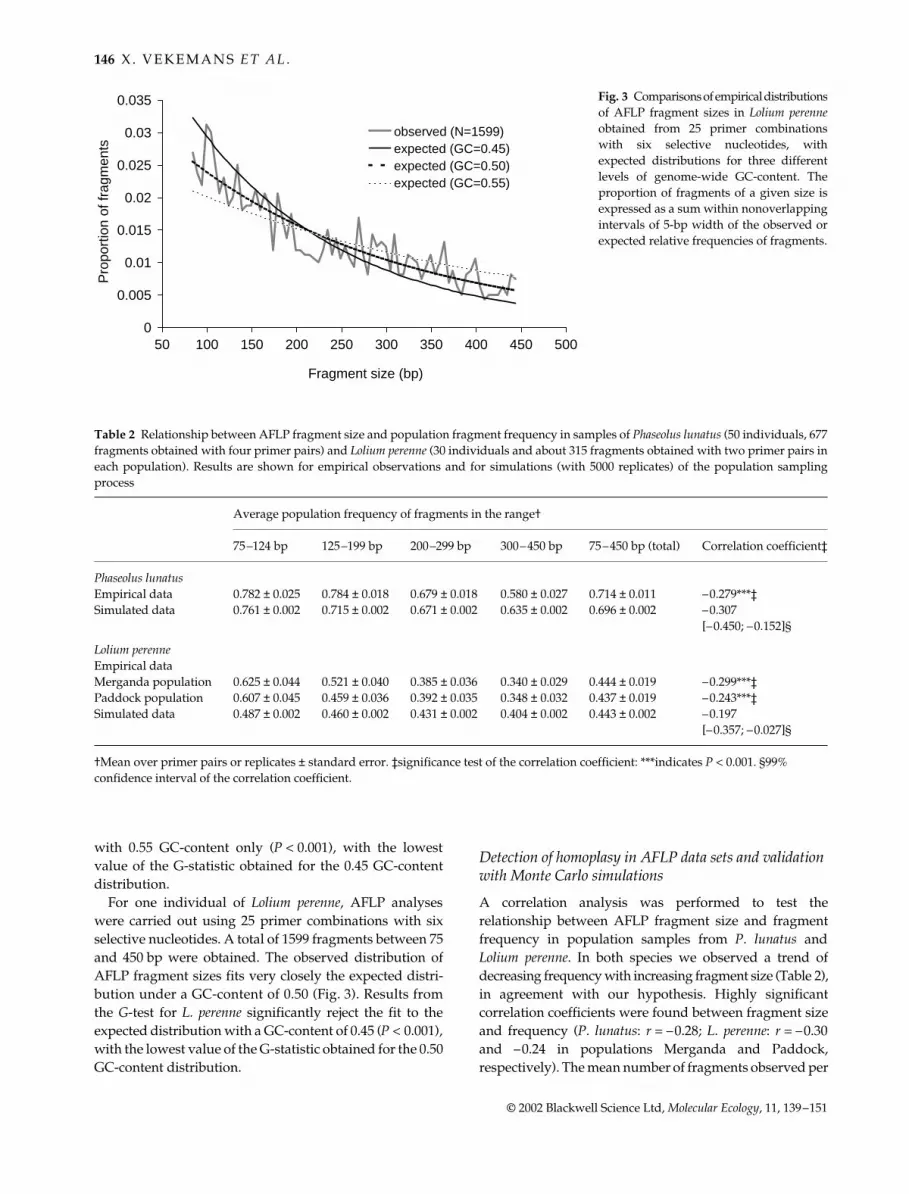
A correlation analysis was performed to test therelationship between AFLP fragment size and fragmentfrequency in population samples from P. lunatus andLolium perenne. In both species we observed a trend ofdecreasing frequency with increasing fragment size (Table 2),in agreement with our hypothesis. Highly significantcorrelation coefficients were found between fragment sizeand frequency (P. lunatus: r = –0.28; L. perenne: r = –0.30and –0.24 in populations Merganda and Paddock,respectively). The mean number of fragments observed per
0
0.005
0.01
0.015
0.02
0.025
0.03
0.035
50 100 150 200 250 300 350 400 450 500
Fragment size (bp)
Pro
port
ion
of fr
agm
ents
observed (N=1599)expected (GC=0.45)expected (GC=0.50)expected (GC=0.55)
Fig. 3 Comparisons of empirical distributionsof AFLP fragment sizes in Lolium perenneobtained from 25 primer combinationswith six selective nucleotides, withexpected distributions for three differentlevels of genome-wide GC-content. Theproportion of fragments of a given size isexpressed as a sum within nonoverlappingintervals of 5-bp width of the observed orexpected relative frequencies of fragments.
Table 2 Relationship between AFLP fragment size and population fragment frequency in samples of Phaseolus lunatus (50 individuals, 677fragments obtained with four primer pairs) and Lolium perenne (30 individuals and about 315 fragments obtained with two primer pairs ineach population). Results are shown for empirical observations and for simulations (with 5000 replicates) of the population samplingprocess
Average population frequency of fragments in the range†
75–124 bp 125–199 bp 200–299 bp 300–450 bp 75–450 bp (total) Correlation coefficient‡
Phaseolus lunatusEmpirical data 0.782 ± 0.025 0.784 ± 0.018 0.679 ± 0.018 0.580 ± 0.027 0.714 ± 0.011 –0.279***‡Simulated data 0.761 ± 0.002 0.715 ± 0.002 0.671 ± 0.002 0.635 ± 0.002 0.696 ± 0.002 –0.307
[–0.450; –0.152]§
Lolium perenneEmpirical dataMerganda population 0.625 ± 0.044 0.521 ± 0.040 0.385 ± 0.036 0.340 ± 0.029 0.444 ± 0.019 –0.299***‡Paddock population 0.607 ± 0.045 0.459 ± 0.036 0.392 ± 0.035 0.348 ± 0.032 0.437 ± 0.019 –0.243***‡Simulated data 0.487 ± 0.002 0.460 ± 0.002 0.431 ± 0.002 0.404 ± 0.002 0.443 ± 0.002 –0.197
[–0.357; –0.027]§
†Mean over primer pairs or replicates ± standard error. ‡significance test of the correlation coefficient: ***indicates P < 0.001. §99% confidence interval of the correlation coefficient.
MEC_1415.fm Page 146 Thursday, December 13, 2001 9:10 PM

S I Z E H O M O P L A S Y W I T H A F L P M A R K E R S 147
© 2002 Blackwell Science Ltd, Molecular Ecology, 11, 139–151
primer pair, and the proportion of monomorphic fragments(i.e. fragments observed in all individuals) are reported foreach category of fragment sizes in Table 3. We observea decreasing proportion of monomorphic fragments withincreasing fragment size, again in agreement with ourhypothesis because frequencies of fragments with similarsize are cumulated unknowingly. Highly significantcorrelation between fragment size and frequency was alsofound when excluding these monomorphic fragments(P. lunatus: r = –0.23; L. perenne: r = –0.26 and –0.19 inpopulations Merganda and Paddock, respectively). Hencethe relationship between fragment size and averagefragment frequency is only partly due to variation in theproportion of monomorphic fragments.
To test whether the observed pattern is quantitativelyconsistent with our hypothesis, we performed MonteCarlo simulations of the fragment size sampling processchoosing parameters dictated by the observed data sets(Table 3). For P. lunatus-like simulations, 250 fragmentsizes were randomly drawn from the expected distributionwhich gave, after elimination of redundant size values, anaverage of 167.0 distinct fragment sizes (based on 5000replicates), hence only 67% of the fragments would bedetectable. Similarly, for L. perenne, the 220 fragment sizesgenerated gave an average of only 160.0 (73%) detectablefragments. This suggests that, according to our model, theobserved number of different fragment sizes in P. lunatusand in both populations of L. perenne (ndif = 169.3 and154.5–163.5, respectively, cf. Table 3) may hide a totalnumber of nonhomologous fragments in the order of 250and 220, respectively. In both simulations, it appears
that the proportion of detectable fragments substanti-ally increases as a function of fragment size, hence sizehomoplasy decreases with increasing fragment size(Table 3).
Extending the simulations of the fragment samplingprocess to the generation of individual phenotypic datalead to estimations of population frequencies of fragmentswith known sizes. The results show a highly significantnegative correlation between simulated fragment frequen-cies and fragment size (for P. lunatus, r = –0.307, 99%confidence interval, CI = [–0.450; –0.152]; for L. perenne,r = –0.197 and 99% CI = [–0.357; –0.027]), as was observedin the empirical data (Table 2). Average population fre-quencies of fragments for each size category show that thetrend of decreasing frequency with increasing fragmentsize is similar to the empirical result, but with a smallerrange of variation (Table 2).
The consequences of this pattern on the estimation ofgenetic diversity within and between populations fromempirical data are illustrated in Table 4. In both speciesvalues of F, the proportion of shared fragments betweenrandom pairs of haploid genomes, decrease substantiallywith increasing fragment sizes. Estimates of nucleotidediversity (π), i.e. the proportion of nucleotide differencesbetween pairs of haploid genomes sampled within popu-lations, are shown to increase with fragment size. In P.lunatus the estimate of π in the lowest category (75–125 bp)is only 40% as high as that for the highest category (300–450 bp). In L. perenne, π in the lowest category is only halfas high as that for the highest category. Non-overlapping95% confidence intervals among estimates for some
Table 3 Influence of AFLP fragment size on expected size homoplasy in simulations of Phaseolus lunatus and Lolium perenne-like samples
75–124 bp 125–199 bp 200–299 bp 300–450 bp 75–450 bp (total)
Phaseolus lunatusNumber of fragment sizes observed 31.5 53.5 54.5 29.8 169.3Proportion of monomorphic fragments 0.27 0.21 0.07 0.04 0.15Number of fragment sizes generated (nt) 72.8 75.0 59.3 42.9 250Number of detectable fragments (ndif ) 38.3 47.2 44.4 37.1 167.0Proportion of detectable fragments 0.53 0.63 0.75 0.86 0.67
Lolium perenneNumber of fragment sizes observed
Merganda population 29.5 36.5 44.5 53.0 163.5Paddock population 29.0 40.5 40.0 45.0 154.5
Proportion of monomorphic fragmentsMerganda population 0.22 0.11 0.06 0.04 0.09Paddock population 0.17 0.12 0.06 0.04 0.09
Number of fragment sizes generated (nt) 52.3 60.6 56.3 50.9 220Number of detectable fragments (ndif ) 32.5 41.5 43.0 43.0 160.0Proportion of detectable fragments 0.62 0.69 0.76 0.85 0.73
Statistics are given as means over primer pairs (number of fragment sizes observed, proportion of monomorphic fragments observed) or over 5000 replicates (number of fragment sizes generated, number of detectable fragments, proportion of detectable fragments) for each of four categories of fragment size and for the whole range (75–450 bp).
MEC_1415.fm Page 147 Thursday, December 13, 2001 9:10 PM

148 X . V E K E M A N S E T A L .
© 2002 Blackwell Science Ltd, Molecular Ecology, 11, 139–151
categories show that these differences are significant inboth species. For L. perenne, it is shown that the estimates ofgenetic differentiation between the two populations, thenucleotide divergence, also increase with increasing frag-ment sizes, with a value in the lowest size category abouthalf that for the highest category, but these differences arenot significant.
Discussion
Distribution of AFLP fragment sizes
Distributions obtained by simulations as well as empiricaldistributions from Phaseolous lunatus and Lolium perenneappear to fit very closely the analytical theory developedby Innan et al. (1999). The empirical distributions alsoresemble that obtained for Arabidopsis thaliana by Miyashitaet al. (1999). The average size reported by these authors,over 472 AFLP fragments in the range 50–600 bp, is225.8 bp, which is close to the expected value (228 bp)obtained by applying eqn 8. In particular, our resultsconfirm that: (i) the probability of finding an AFLPfragment of a given size is much more likely for small thanfor large fragments and the difference is substantial withinthe size range commonly recorded; (ii) type 1 and type 2fragments have similar distributions of sizes; (iii) the shapeof the size distributions is not influenced by the numberof selective nucleotides nor by genome size; and (iv) theshape of the size distributions varies with genome-wideGC-content, with a higher proportion of small fragments incase of lower GC-content. The latter observation is due tothe fact that AFLP fragment size is mostly determined bythe frequency of occurrence of restriction sites of the type
with the shortest recognition motif (because a2 from eqn 3is much higher than a1), which in the standard AFLPprotocol is MseI that contains only A and T residues. Forthe restriction enzyme TaqI, which is sometimes usedinstead of MseI but has a restriction motif with a balancedGC-content [5′-TCGA-3′], the shape of the size distributionbecomes insensitive to variation in genomic GC-contentand is similar to the distribution for MseI with a GC-content of 0.50 (results not shown). Replacement of EcoRIby alternative restriction enzymes with a recognition siteof six nucleotides does not modify significantly the shapeof the size distribution (results not shown). Hence, allconclusions from our study apply to any pair of restrictionenzymes, except the amplitude of the effect of the genomicGC-content, which depends on the choice of the restrictionenzyme with the shortest recognition motif.
Using the observed distribution of fragment sizes, weshowed that the best fit to an expected distribution wasobtained with GC-contents of 0.45 and 0.50 for P. lunatusand L. perenne, respectively. We are not aware of direct esti-mates of GC-content in P. lunatus and L. perenne. However,our result is consistent with that of Salinas et al. (1988) whoshowed that the average compositional distribution ofhigh molecular weight nuclear DNA molecules was lowerin GC-content in dicotyledonous plants than in monocoty-ledonous species. Note that Phaseolus is dicotyledonousand Lolium is monocotyledonous.
Relationship between fragment size and population frequency
Our results clearly demonstrate that in the two empiricaldata sets, there is a negative relationship between fragment
Table 4 Influence of AFLP fragment size on estimation of genetic diversity within populations of Phaseolus lunatus and Lolium perenne andbetween populations of L. perenne
Within populations
75–125 bp 125–199 bp 200–299 bp 300–450 bp 75–450 bp (total)
F π F π F π F π F π
Phaseolus lunatus 0.862 0.008 0.856 0.008 0.759 0.015 0.690 0.020 0.804 0.011[6–10]* [7–10] [13–17] [17–23] [10–12]
Lolium perenneMerganda population 0.686 0.019 0.610 0.025 0.556 0.030 0.453 0.040 0.579 0.027
[16–25] [20–32] [24–38] [32–50] [25–31]Paddock population 0.677 0.020 0.547 0.031 0.497 0.036 0.466 0.039 0.553 0.030
[15–25] [24–39] [28–45] [31–50] [27–34]Between populations F d F d F d F d F dLolium perenne 0.946 0.0028 0.940 0.0031 0.896 0.0055 0.904 0.0052 0.925 0.0039
[1.5–4.5] [1.9–5.0] [3.4–8.4] [3.1–8.5] [3.1–4.9]
*95% confidence limits obtained through 1000 bootstraps performed on the original data sets.F, mean proportion of shared fragments between individuals; π, estimated nucleotide diversity; d, estimated nucleotide divergence between populations. 95% confidence limits for π and d are given under brackets (as multiplied by 1000).
MEC_1415.fm Page 148 Thursday, December 13, 2001 9:10 PM

S I Z E H O M O P L A S Y W I T H A F L P M A R K E R S 149
© 2002 Blackwell Science Ltd, Molecular Ecology, 11, 139–151
size and fragment population frequency, which is partlydue to a higher proportion of monomorphic fragmentsamong the smaller fragments. Using ad hoc simulationsbased on an appropriate theoretical fragment sizedistribution, we showed that size homoplasy alone canproduce patterns matching the observed ones. Althoughthis does not prove that size homoplasy did occur and hada substantial effect on our empirical analysis, it shows thatit is potentially a major concern with the application of theAFLP method in population genetics and ecology. Wenoted that the trend of decreasing population frequencywith increasing fragment size in simulations was similar,but with a smaller range of variation, than in empiricaldata. This could be due to the very crude nature of theMonte Carlo simulations performed. For instance, we didnot take into account diploidy of both model species, andwe assumed that the distribution of fragment frequencieswas binomial (by assuming identical a priori frequency forall fragments), whereas the observed distributions are U-shaped (data not shown, Miyashita et al. 1999). Anotherexplanation is that factors other than size homoplasy alsoinfluence population frequencies of fragments in relationto fragment size. One such factor could be differencesbetween large and small fragments in the rate of muta-tion from the marker allele (fragment present) to the nullallele (fragment absent). Intuitively, the loss of a fragmentthrough appearance of a new restriction site within itssequence should be more likely for larger than for smallerfragments. Hence, equilibrium frequencies for largefragments should be lower than for small fragments.Although this hypothesis seems correct, a quantitativeassessment of its effect shows that it should be much lesseffective than size homoplasy, as we computed from thetheory of Innan et al. (1999) (eqn 5 with values of nucleotidediversities in the range of those calculated for our modelspecies) that the probability that a fragment of theshortest length (50 bp) is conserved among two random
individuals is only 10% higher than a fragment of thelargest (450 bp).
Our simulations indicated very strong expected sizehomoplasy for both plant models, as shown by strikinglylow values of the proportion of detectable fragments(around 70% when considering the whole size range,Table 3). This is probably due to the large number offragments detected in both plant species for each primercombination (± 160). In reviewing the literature, we foundvalues of the mean number of fragments detected perprimer combination ranging between 49 and 216 fragments(with 65.5 as a median value) from a set of 15 AFLP studieson plants (Winfield et al. 1998; Zhu et al. 1998, 1999;Angiolillo et al. 1999; De Riek et al. 1999; Innan et al.1999; Krauss 1999; Miyashita et al. 1999; Muluvi et al.1999; Palacios et al. 1999; Singh et al. 1999; Zhang et al. 1999;Kiers et al. 2000; Schmidt & Jensen 2000; Teulat et al. 2000).If we take the median value, 65, as a more common numberof detected fragments per primer combination (= ndif ), weobtain by simulations that the expected proportion ofdetectable fragments in the range 75–450 bp would bearound 88%, hence size homoplasy seems to remain an issuein most studies. For illustration, we present a graph of theexpected number of detectable fragments (representingobserved fragments) as a function of the total number offragments drawn from the theoretical distribution (rep-resenting amplified fragments) for three values of GC-content, that was obtained from a set of simulations(Fig. 4). From the graph, one can see for example that witha GC-content of 0.5 and a number of observed fragmentsequal to 150, our theory predicts that about 200 fragmentsmay have been amplified, with 50 of them hidden becauseof size homoplasy. From the literature survey, we alsofound that the range of fragment sizes recorded variesgreatly among studies: e.g. 30–600 bp (Zhang et al. 1999);50–350 bp (Singh et al. 1999); 70–450 bp (De Riek et al.1999). According to our results, a higher risk of homoplasy
0
50
100
150
200
250
300
0 50 100 150 200 250 300
Number of simulated fragments
Exp
ecte
d nu
mbe
r of
det
ecta
ble
frag
men
ts
Fig. 4 Graph of the expected number ofdetectable fragments obtained by simulationas a function of the total number of frag-ments drawn from a theoretical distribu-tion in the range 75–450 bp for three valuesof the genomic GC-content (0.40: dottedline; 0.45: broken line; 0.50, thick solid line).The bisector (narrow solid line) representsthe case without homoplasy (all fragmentsgenerated are detectable).
MEC_1415.fm Page 149 Thursday, December 13, 2001 9:10 PM

150 X . V E K E M A N S E T A L .
© 2002 Blackwell Science Ltd, Molecular Ecology, 11, 139–151
is to be expected in studies using information from veryshort fragments.
However, the potential degree of homoplasy raised inthe present work might represent an overestimation of theactual degree of homoplasy present in AFLP fingerprint-ing experiments. In the living organism, some biologicalprocesses not considered in the simulations, influenceclearly the number of fragments produced in the reactiontube during the restriction process. For example, someDNA sequences are protected against restriction. Thiswould result in a lower number of fragments generatedafter restriction than would be theoretically expected. Inaddition, the models constructed were based on the simu-lation of random DNA sequences of specified length andGC-content, but in fact the DNA sequences of living organ-isms follow specific nonrandom patterns. For example, thefrequency of restriction sites is lower in DNA areas con-taining highly repetitive sequences, which are very com-mon in plant genomes (Moore & Gustafson 1998), and thisresults again in a decrease of the number of restriction frag-ments as compared to theoretical calculations. In addition,the identity of the nucleotide at a given site is not random,as assumed in the models, but is influenced by the identityof the nucleotides in surrounding sites.
Taking into account that the actual effects of the factorsmentioned are unknown, and based on our results, we sug-gest that strategies to minimize the effect of size homoplasyshould rely on the following: (i) avoidance of fragments inthe small-size classes. This is often done in practice, asthese small fragments are less polymorphic and thus arenot scored. (ii) Use of fragments of known map positionwhen possible. Mapped AFLP markers should displayMendelian segregation at least in the population used formapping purposes, and the chance that they also displaymendelian behaviour in the natural population analysed ishigher than for nonmapped markers. And (iii) increaseof the number of selective nucleotides in the primersequences.
Estimation of genetic diversity and divergence with AFLP markers
One major difficulty in the estimation of genetic diversitywith AFLP markers lies in the dominance of the markerallele (Mueller & Wolfenbarger 1999). Failure to correct fordominance results in underestimating genetic diversity(Clark 1997). Fortunately, some approximations may help.In highly autogamous species like Arabidopsis thaliana,heterozygous genotypes are rare and allelic frequenciesare set to the observed fragment frequencies (Miyashitaet al. 1999). In predominantly outcrossing species, allelicfrequencies can be estimated by assuming that genotypicproportions follow Hardy–Weinberg expectation (Innanet al. 1999). For species with intermediate mating systems,
allelic frequencies can still be estimated if the averageinbreeding coefficient is known (Chong et al. 1994;Zhivotovsky 1999). The difference in mating systembetween our two model species is probably the cause of thehigher estimate of π in L. perenne than in P. lunatus. Indeed,outcrossing in L. perenne is enforced by self-incompatibility(Cornish et al. 1979) whereas high levels of selfing (> 90%)have been reported in P. lunatus (Maquet et al. 1996), andthere is increasing empirical evidence that selfing specieshave lower amounts of nucleotide diversity at thepopulation level than outcrossing species (Liu et al. 1998).
In this paper we emphasize the potential effect ofanother factor, i.e. size homoplasy among AFLP fragments,which also results in underestimating genetic diversitywithin and genetic divergence between populations. Innanet al. (1999) already recognized this effect and proposedan overall correction factor based on the expected size dis-tribution. However, we showed that the strength of thedownward bias strongly varies with fragment size, andthus we think that the ‘blind’ adoption of an overall cor-rection factor is misleading. All efforts should be takento avoid situations of high potential confusion betweennonhomologous fragments, as discussed above.
Acknowledgements
We thank J.P. Baudoin, O. Rocha and A. Maquet for obtainingseeds from Phaseolus lunatus, M. Milinkovitch for allowing use ofits laboratory equipment for the Lima bean work, and A. Staelensfor carrying out the AFLP runs for Lolium perenne. O. Hardy hasgiven valuable comments on an earlier draft of the manuscript.We also thank the two referees for their stimulating comments.This study was in part financed by the Belgian National Fund forScientific Research (FRFC convention # 24548.98.).
References
Angiolillo A, Mencuccini M, Baldoni L (1999) Olive genetic diver-sity assessed using amplified fragment length polymorphisms.Theoretical and Applied Genetics, 98, 411–421.
Clark AG (1997) Estimating nucleotide divergence with RAPDdata. In: Fingerprinting Methods Based on Arbitrarily Primed PCR(eds Micheli MR, Bova R), pp. 219–226. Springer-Verlag, Berlin.
Clark AG, Lanigan CMS (1993) Prospects for estimating nucle-otide divergence with RAPDs. Molecular Biology and Evolution,10, 1096–1111.
Chong DKX, Yang R-C, Yeh FC (1994) Nucleotide divergencebetween populations of trembling aspen (Populus tremuloides)estimated with RAPDs. Current Genetics, 26, 374–376.
Cornish MA, Hayward MD, Lawrence MJ (1979) Self-incompatibilityin ryegrass. I. Genetic control in diploid Lolium perenne L. Heredity,43 (1), 95–106.
De Riek J, Dendauw J, De Mertens M, Loose M, Heursel J, VanBockstaele E (1999) Validation of criteria for the selection ofAFLP markers to assess the genetic variation of a breeders’collection of evergreen azaleas. Theoretical and Applied Genetics,99, 1155–1165.
MEC_1415.fm Page 150 Thursday, December 13, 2001 9:10 PM

S I Z E H O M O P L A S Y W I T H A F L P M A R K E R S 151
© 2002 Blackwell Science Ltd, Molecular Ecology, 11, 139–151
Fofana B, Vekemans X, du Jardin P, Baudoin JP (1997) Geneticdiversity in Lima bean (Phaseolus lunatus L.) as revealed byRAPD markers. Euphytica, 95, 157–165.
Gerber S, Mariette S, Streiff R, Bodénès C, Kremer A (2000) Com-parison of microsatellites and amplified fragment lengthpolymorphism markers for parentage analysis. Molecular Ecology,9, 1037–1048.
Innan H, Terauchi R, Kahl G, Tajima F (1999) A method forestimating nucleotide diversity from AFLP data. Genetics, 151,1157–1164.
Jones CJ, Edwards KJ, Castiglione S et al. (1998) Reproducibilitytesting of AFLPs by a network of European laboratories. In:Molecular Tools for Screening Biodiversity (eds Karp A, Isaac PG,Ingram DS), pp. 191–192. Chapman & Hall, London.
Jorde PE, Palm S, Ryman N (1999) Estimating genetic drift andeffective population size from temporal shifts in dominant genemarker frequencies. Molecular Ecology, 8, 1171–1178.
Kiers AM, Mes THM, van der Meijden R, Bachmann K (2000) Asearch for diagnostic AFLP markers in Cichorium species withemphasis on endive and chicory cultivar groups. Genome, 43,470–476.
Krauss SL (1999) Complete exclusion of nonsires in an analysis ofpaternity in a natural plant population using amplifiedfragment length polymorphism (AFLP). Molecular Ecology, 8,217–226.
Lewis PO, Snow AA (1992) Deterministic paternity exclusionusing RAPD markers. Molecular Ecology, 1, 155–160.
Liu F, Zhang L, Charlesworth D (1998) Genetic diversity in Leaven-worthia populations with different inbreeding levels. Proceedingsof the Royal Society of London B, 265, 293–301.
Maquet A, Zoro Bi I, Rocha OJ, Baudoin JP (1996) Case studies onbreeding systems and its consequences for germplasm con-servation 1. Isoenzyme diversity in wild Lima bean populationsin central Costa Rica. Genetic Resources and Crop Evolution, 43,309–318.
Milligan BG, McMurry CK (1993) Dominant vs. codominantgenetic markers in the estimation of male mating success. Molecu-lar Ecology, 2, 275–283.
Miyashita NT, Kawabe A, Innan H (1999) DNA variation in thewild plant Arabidopsis thaliana revealed by amplified fragmentlength polymorphism analysis. Genetics, 152, 1723–1731.
Moore G, Gustafson JP (1998) Comparative analysis of cerealgenomes. In: DNA Markers: Protocols, Applications and Overviews(eds Caetano-Anolles G, Gresshoff PM), pp. 259–270. Wiley-LissInc., New York.
Mueller UG, Wolfenbarger LL (1999) AFLP genotyping and finger-printing. Trends in Ecology and Evolution, 14, 389–394.
Muluvi GM, Sprent JI, Soranzo N et al. (1999) Amplified fragmentlength polymorphism (AFLP) analysis of genetic variation inMoringa oleifera Lam. Molecular Ecology, 8, 463–470.
Nei M (1987) Molecular Evolutionary Genetics. Columbia UniversityPress, New York.
Nei M, Li W-S (1979) Mathematical model for studying geneticvariation in terms of restriction endonuclease. Proceedings of theNational Academy of Science of the USA, 76, 5269–5273.
O’Hanlon PC, Peakall R (2000) A simple method for the detectionof size homoplasy among amplified fragment length poly-morphism fragments. Molecular Ecology, 9, 815–816.
Palacios C, Kresovich S, Gonzalez-Candelas F (1999) A populationgenetic study of the endangered plant species Limonium dufourii(Plumbaginaceae) based on amplified fragment length poly-morphism (AFLP). Molecular Ecology, 8, 645–657.
Pejic I, Ajmone-Marsan P, Morgante M (1998) Comparative ana-lysis of genetic similarity among maize inbred lines detectedby RFLPs, RAPDs, SSRs, and AFLPs. Theoretical and AppliedGenetics, 97, 1248–1255.
Powell W, Morgante M, Andre C et al. (1996) The comparisonof RFLP, RAPD, AFLP and SSR (microsatellite) markers forgermplasm analysis. Molecular Breeding, 2, 225–238.
Rieseberg LH (1996) Homology among RAPD fragments in inter-specific comparisons. Molecular Ecology, 5, 99–105.
Roldán-Ruiz I, van Eeuwijk FA, Gilliland TJ et al. (2001) A, com-parative study of molecular and morphological methods ofdescribing relationships between perennial ryegrass (Loliumperenne L.) varieties. Theoretical and Applied Genetics, 103, 1138–1150.
Salinas J, Matassi G, Montero LM, Bernardi G (1988) Composi-tional compartmentalization and compositional patterns in thenuclear genomes of plants. Nucleic Acids Research, 16, 4269–4285.
Schmidt K, Jensen K (2000) Genetic structure and AFLP variationof remnant populations in the rare plant Pedicularis palustris(Scrophulariaceae) and its relation to population size and repro-ductive components. American Journal of Botany, 87, 678–689.
Singh A, Negi MS, Rajagopal J et al. (1999) Assessment of geneticdiversity in Azadirachta indica using AFLP markers. Theoreticaland Applied Genetics, 99, 272–279.
Sokal RR, Rohlf FJ (1995) Biometry. Freeman, New York.Teulat B, Aldam C, Trehin R et al. (2000) An analysis of genetic
diversity in coconut (Cocos nucifera) populations from across thegeographic range using sequence-tagged microsatellites (SSRs)and AFLPs. Theoretical and Applied Genetics, 100, 764–771.
Thompson EA, Meagher TR (1998) Genetic linkage in the estima-tion of pairwise relationship. Theoretical and Applied Genetics, 97,857–864.
Thormann CE, Ferreira ME, Camargo LEA, Tivang JG, Osborn TC(1994) Comparison of RFLP and RAPD markers in estimatinggenetic relationships within and among cruciferous species.Theoretical and Applied Genetics, 88, 973–980.
Vos P, Hogers R, Bleeker M et al. (1995) AFLP: a new technique forDNA fingerprinting. Nucleic Acids Research, 23, 4407–4414.
Winfield MO, Arnold GM, Cooper F et al. (1998) A study of geneticdiversity in Populus nigra subsp. betulifolia in the upper Severnarea of the UK using AFLP markers. Molecular Ecology, 5, 3–10.
Zhang LH, Ozias-Akins P, Kochert G, Kresovich S, Dean R, Hanna W(1999) Differentiation of bermudagrass (Cynodon spp.) genotypesby AFLP analyses. Theoretical and Applied Genetics, 98, 895–902.
Zhivotovsky LA (1999) Estimating population structure indiploids with multilocus dominant DNA markers. MolecularEcology, 8, 907–913.
Zhu J, Gale MD, Quarrie S, Jackson MT, Bryan GJ (1998) AFLPmarkers for the study of rice biodiversity. Theoretical and AppliedGenetics, 96, 602–611.
Zhu SL, Monti LM, Avitabile A, Rao R (1999) Evaluation of geneticdiversity in Chinese soyabean germplasm by AFLP. PlantGenetic Resources Newletter, 119 (Suppl. 10), 14.
Xavier Vekemans is senior researcher at ULB working in plantpopulation and conservation genetics. Isabel Roldán-Ruiz is a seniorresearcher at the Laboratory for applied plant biotechnology of theDvP-CLO. She works in the development and application ofmolecular makers for the analysis of genetic diversity in naturalplant populations, and in agricultural crops and vegetables.
MEC_1415.fm Page 151 Thursday, December 13, 2001 9:10 PM

MEC_1415.fm Page 152 Thursday, December 13, 2001 9:10 PM


