Embed Size (px)
Citation preview
Decentralisation, Democracy and Allocation of Poverty Alleviation Programmes in Rural India
Takahiro Sato1
Katsushi S. Imai 2*
November 2010 BWPI Working Paper 136
Creating and sharing knowledge to help end poverty
1 Research Institute for Economics & Business Administration (RIEB), Kobe University, Japan 2 University of Manchester, UK and RIEB, Kobe University, Japan [email protected]. * Corresponding author
Brooks World Poverty Institute ISBN : 978-1-907247-35-4
www.manchester.ac.uk/bwpi
2
Abstract
This paper investigates the effect of the devolution of power to the village level government on the household-level allocation of poverty alleviation programmes, drawing upon National Sample Survey data and the Election Commission’s election data. First, greater inequality in land-holdings and less competition between the two major political parties generally lead to less provision of the poverty alleviation programmes. Second, the disadvantaged groups were not necessarily likely to be the primary beneficiaries of the poverty alleviation programmes. Third, our results based on the natural experiment approach suggest that decentralisation did not lead to wider household access to poverty alleviation programmes during the 1990s. Our results imply the possibility that the power and resources were captured by the local elite after decentralisation, that is, decentralisation did not necessarily contribute to the improvement of the welfare of the socially disadvantaged groups.
Keywords: Decentralisation, Democracy, Poverty Alleviation Programmes, Poverty, IRDP (Integrated Rural Development Programme), RPW (Rural Public Works), India JEL classifications: C20, I38, O22, P46
Takahiro Sato works in the Research Institute for Economics & Business Administration (RIEB), Kobe University, Japan. Katsushi Imai is a lecturer (assistant professor) in Development Economics and Quantitative Methods at Economics, School of Social Sciences, University of Manchester, UK and Research Institute for Economics & Business Administration (RIEB), Kobe University, Japan
3
I. Introduction Whether decentralisation actually improves the living conditions of the poor, women, or the minority groups in India is still one of the key research questions in the area of political economy and has been widely discussed among academics and policy makers. Among many paths through which decentralisation affects poverty directly or indirectly, the present study highlights one of the important routes - its effects on allocation of poverty alleviation programmes. That is, we evaluate how decentralisation or democratisation would affect the allocation of poverty alleviation programmes, namely, IRDP (Integrated Rural Development Programmes) and RPW (Rural Public Works) drawing upon National Sample Survey (NSS) data in 1993-1994 and 1999-2000. Here the NSS data are supplemented by the regionally aggregated election data from the Election Commission of India. The reason that we focus on these two rounds is that we are able to compare Madhya Pradesh which clearly implemented decentralisation between 1993-4 and 1999-2000, with the states which had already been decentralised well before 1993, namely, Karnataka, Kerala, and West Bengal. This would give us an ideal situation where we evaluate the effects of decentralisation on allocation of poverty alleviation programmes by taking a ‘natural experiment’ approach based on the difference-in-difference method. We also evaluate the effects of political democracy or political competition on allocation of poverty alleviation programmes. An important progress was made on decentralisation in India by the 73rd Constitutional Amendment of 1993 which stipulated that regular compulsory elections for local self-governments, i.e, 'Panchayats,' be held. In addition, it devolved powers to Panchayats for the planning and implementation of the poverty alleviation programmes in such a way that the elected Panchayats can determine the beneficiary selection for poverty alleviation programmes, such as the Integrated Rural Development Programme (IRDP) and Jawhar Rozgar Yojana (JRY, the former National Rural Employment Programme (NREP)). A number of states, including Madhya Pradesh, were decentralised after 1993. It is noted that decentralisation should have some advantages over centralisation. First, the actions of the elected representatives are effectively monitored and disciplined by the pressure of election competition. Therefore, decentralisation is supposed to improve the accountability of the governance. Second, the local government can more easily collect and use the information flows from the grassroots than the upper level government. This information advantage supports, in principle, a more appropriate allocation of publicly provided goods within the local area (Seabright, 1996). However, it can be argued that due to decentralisation, the local elite may dominate the democratic institutions and monopolise the resource allocation by using their political influence. The most disadvantaged groups may be excluded from rural politics, as they will seldom be able to compete against the local elite, especially within a small village. Thus, in the local areas, there is likely to be little or even an adverse impact on the wellbeing of the poor when there is a large amount of
4
inequality and the governance structure for accountability is weak (Bardhan, 2002; 2003).1 Generally speaking, the success of decentralisation in distributing poverty alleviation programmes widely and alleviating poverty depends on whether the disadvantaged groups are able to increase their voice in local politics and whether the democratic process can enhance the accountability of the Panchayat. The main objective of this study is thus to test whether decentralisation has a positive or negative impact on allocation of poverty alleviation programmes. We particularly focus on households which were the beneficiaries of the poverty alleviation programmes before and after decentralisation. There is a growing body of literature that investigated the effects of political democratisation, including decentralisation, on the allocation of public goods in India (e.g. Bardhan and Mookherjee, 2006, 2007, Betancourt and Gleason, 2000, Besley and Burgess, 2002, Besley, Pande, and Rao, 2005, Besley, Pande, Rahman, and Rao, 2004, Burgess, Pande and Wong, 2005, Chattopadhay and Duflo, 2004a, 2004b, Chhibber and Nooruddin, 2004, Chhibber, Shastri, and Sisson, 2004, Foster and Rosenzweig, 2004, Gaiha, 2003, Greason, 2001, Pande, 2003). For example, Bardhan and Mookherjee (2006) assessed the determinants of the allocation of the poverty alleviation programmes drawing upon the panel data set at the village level spanning from the 1970s to the 1990s. They found that intra-village allocations are targeted in favour of the poor and there are the mild adverse effects of land inequality, low caste status, and illiteracy among the poor. In contrast, inter-village allocations show a stronger and significant bias against the poor. While not distinguishing between inter and intra village allocations, the present study explicitly assesses the effects of decentralisation on the allocation of poverty alleviation programmes in India. Besley, Pande, Rahman, and Rao (2004) used the household data from a survey that they conducted in 2002 in three southern states, namely, Andhra Pradesh, Karnataka, and Tamil Nadu in order to understand the politics of the provision of public goods. They found that on one hand, for high spill-over public goods such as roads, drains, streetlights, and water sources, the residence of the elected politician was relevant; on the other, for low spill-over public goods such as public schemes for the construction of houses and toilets, and the provision of private water and electricity connections, the politician's group identity was relevant. Besley, Pande, and Rao (2005) investigated who participated in the Gram Sabha and the extent to which the Gram Sabha had an effect on beneficiary selection for government programmes in the southern Indian states. They found that the more disadvantaged social groups such as the illiterate, landless, and SCs/STs participate in the Gram Sabha and the establishment of the Gram Sabha has a positive effect in terms of the greater allocation of resources to the neediest. Our econometric results, however, show the results in contrast with Besley, Pande, and Rao (2005) - decentralisation had an adverse effect in the allocation of poverty alleviation programmes. While the growing body of the literature generally points to the positive effect of decentralisation on welfare of the disadvantaged group (e.g. the poor, the landless, Scheduled Castes, women) through more equitable public goods allocation, there has been few works to explicitly evaluate the effects of decentralisation on allocation of poverty alleviation programmes. The present study attempts to fill the gap.
1 Crook and Manor (1998, p.61) based on the detailed fieldwork in Karnataka state ‘Decentralisation in Karnataka yielded paradoxical results. The number of people involved in corrupt acts increased significantly. But the overall amount of money stolen almost certainly decreased - at least modestly. We cannot offer absolute proof of this latter point, but the evidence to support it is strong.’
5
The rest of the paper is organised as follows. The next section provides the institutional background of the 73rd Constitutional Amendment and the salient features of poverty alleviation programmes. The data are briefly explained and discussed in Section Three. Section Four provides the econometric models and results to empirically investigate the allocation of the poverty alleviation programmes before and after decentralisation. The final section offers some concluding observations. 2. Institutional context This section describes the features of the 73rd Constitutional Amendment of 1993 which aimed at decentralisation, and then summarises the nature of the poverty alleviation programmes in rural areas. 2.1 The 73rd Constitutional Amendment The 73rd Amendment provided constitutional status to the three-tier 'Panchyati Raj' (local self-governance) system. ‘Panchayat’ is an institution of local self-government in rural areas. This three-tier system consists of the ‘Zilla Parishad’ at the district level, the ‘Panchayat Samiti’ at the block level, and the ‘Gram Panchayat’ at the village level. Persons selected by direct election fill all the seats in a Panchayat. In addition, the ‘Gram Sabha’ is a village assembly consisting of persons registered in the Gram Panchayat election. The relationship between the Gram Sabha and the Gram Panchayat can be considered to be the same as that between the parliament and the government. The role of Gram Sabha is to monitor and regulate the behavior of the Gram Panchayat. As per the 73rd Amendment, Panchayat elections are held regularly every five years. In many states, the Gram Sabha meetings are required to be held four times a year. To implement the Amendment, with the exception of Jammu and Kashmir, National Capital Territory (NCT) Delhi, and Arunachal Pradesh, all the other states and union territories (UTs) passed their corresponding Panchayat acts. Almost all the states and UTs, except for Assam, Arunachal Pradesh, Bihar, NCT Delhi, and Pondicherry have held Panchayat elections. As per the 73rd Amendment, seats for the Scheduled Castes (SCs) and Scheduled Tribes (STs) in Panchayats were reserved to reflect the population share of SCs and STs. Not less than one-third of the total number of seats were reserved for the SCs/STs and not less than one-third of all seats were reserved for women. Moreover, the position of chairpersons in the Panchayat was also reserved for SCs, STs, and women in the same manner that seats were reserved for them. The reservation of the chairperson for women was allotted by randomised rotation to different constituencies in a Panchayat. The scope of a Panchayat’s responsibilities for preparing and implementing plans for economic development and social justice is listed in the Eleventh Schedule of the Constitution. Indeed, one of
6
the roles of a Panchayat is to plan and implement poverty alleviation programmes; this clause is listed as number 16 in the Eleventh Schedule. Finally, we refer to the Panchayats (Extension to the Scheduled Area) Act that went into effect in 1996. This act extends to the tribal areas of nine states, which had not been covered under the decentralisation of 1993. In 1996, all the state governments enacted the registrations corresponding to the Panchayats (Extension to the Scheduled Area) Act. Therefore, the provisions of the 73rd Amendment are applicable to all the Indian people after 1996. 2.2 Poverty alleviation programmes The IRDP, under which the Small Farmers Development Agencies Programme (SFDA), the Drought Prone Area Programme (DPAP), and other similar self-employment programmes were merged, was launched universally from October 1980. The IRDP had been one of the major poverty alleviation programmes in India until it was merged with another Scheme named Swarnjayanti Gram Swarozgar Yojana (SGSY) in April 1999. The IRDP aimed to generate sufficient income to enable the rural poor to cross the poverty line. The IRDP provided government subsidy and bank credit to the poor identified as below the poverty line (BPL) families in order to encourage the application of new agricultural technologies such as pump sets and to diversify the agriculture economy through subsidiary activities such as animal husbandry. Roughly speaking, the IRDP assisted about 3.4 million families per year in the 1980s and 2.5 million families per year in the 1990s2 . According to the National Sample Survey (NSS), the percentage of rural households receiving IRDP assistance was 6.3 percent in the period 1987-88, 6.3 percent in the period 1993-94, and 5.2 percent in the period 1999-20003 . With regard to the Training of Rural Youth for Self Employment Programme (TRYSEM) as a subsidiary programme of the IRDP, in the late 1990s, about 60 percent of the beneficiaries were made aware of the TRYSEM by their respective Panchayats or relatives. On one hand, around half of the beneficiaries were selected by block officials, based on the list of BPL families; on the other, one-fourth were selected directly by the Panchayat 4. According to the Ministry of Rural Development, the role of the Panchayat in the implementation of the IRDP could be described as follows. First, the Gram Sabha approves the list of BPL families. Second, the list of activities and names of villages identified under the IRDP in the block should be approved by the Panchayat Samiti. Third, the list of beneficiaries finally selected should be made available to the Gram Panchayat for placing it before the next Gram Sabha. Fourth, the Gram Panchayat actively monitors the performance of the beneficiaries. Fifth, the Zilla Parishad reviews in its meetings the performance under the IRDP 5.
2 Planning Commission, Government of India, Sixth Five Year Plan 1980-85, Seventh Five Year Plan 1985-90, Eighth Five Year Plan 1992-97, Ninth Five Year Plan 1997-2002, and Tenth Five Year Plan 2002-07. 3 NSSO, Government of India (2001). 4 Ministry of Rural Development, Quick Evaluation Study of TRYSEM. 5 Ministry of Rural Development, Role of Panchayati Raj Institutions in the Rural Development Programmes.
7
The assets under the IRDP consist of milk animals, drought animals, sheep/goats, pump-sets, fish-ponds, sewing machines, other agricultural tools and equipment, and others, which include all forms of assistance not specified. According to the NSS, in the period 1999-2000 the share of assets in the form of total milk animals was 71 percent; drought animals, 2 percent; and sheep/goats, 4 percent; in the period 1993-1994, the share of assets in the form of total milk animals, drought animals, and sheep/goats was 40 percent, 11 percent, and 8 percent, respectively. 6 Rural Public Works (RPW) defined in the NSS consists of the NREP, Rural Landless Employment Guarantee Programme (RLEGP), Minimum Needs Programme (MNP), and other schemes aiming at providing employment for wages set at an appropriate level, which are expected to attract only the poor. The NREP was launched in October 1980 and the RLEGP was initiated in August 1983. These two programmes were the main wage employment programmes which were nationally implemented by the collaboration of the central government and the state governments. The NREP and RLEGP were merged under the JRY in April 1989. Moreover, the JRY was revamped as the Jawahar Gram Samridhi Yojana (JGSY) in April 1999. With regard to other wage employment programmes, the Employment Assurance Scheme (EAS) was initiated from October 1993, to provide employment to the poor in the agriculturally slack season and the Food for Work Programme was launched in the period 2000-01 to provide nutrition to the vulnerable groups in the drought-prone states. From September 2001, the JGSY, EAS, and Food for Work Programme were integrated into the Sampoorna Gramin Rozgar Yojana (SGRY)7. 8 Generally speaking, RPW provides wage employment to the poor in agriculturally slack seasons and during natural calamities such as floods and droughts. They also create and maintain productive community assets for supporting future economic activity. They cover the construction of roads, drainage structures, dams and bunds, the digging of ponds, maintenance of forestry, building of schools, and so on. The JRY and EAS provided annual full employment to about 1 million workers in the 1980s and about 2 million workers in 1990s, subject to the assumption that full employment for one person per year is regarded as 300 working days9 . According to the NSS, the percentage of rural households participating in public works programmes was 6.4 percent in the period 1987-88, 5.9 percent in the period 1993-94, and 2.9 percent in the period 1999-200010. According to the Concurrent Evaluation Report of the JRY, whose reference period is 1993-94, Gram Panchayats spent 83 percent of available funds under the JRY and gave the highest priority to the construction of rural link roads. The same report on the late 1990s confirms that the
6 NSSO, Government of India (2001). 7 Planning Commission, Government of India, Tenth Five Year Plan 2002-07. 8 National Rural Employment Guarantee Scheme (NREGS), a variant of RPW, has been launched since 2005. The plan was launched in February 2006 in 200 districts and eventually extended to cover 593 districts. More than 4 million rural households were provided jobs under NREGA during 2008-09. Our results on RPW should have some implications for designing and implementing NREGS. 9 These figures are calculated from the following plan documents: Planning Commission, Government of India, Sixth Five Year Plan 1980-85, Seventh Five Year Plan 1985-90, Eighth Five Year Plan 1992-97, Ninth Five Year Plan 1997-2002, Tenth Five Year Plan 2002-07. 10 NSSO, Government of India (2001).
8
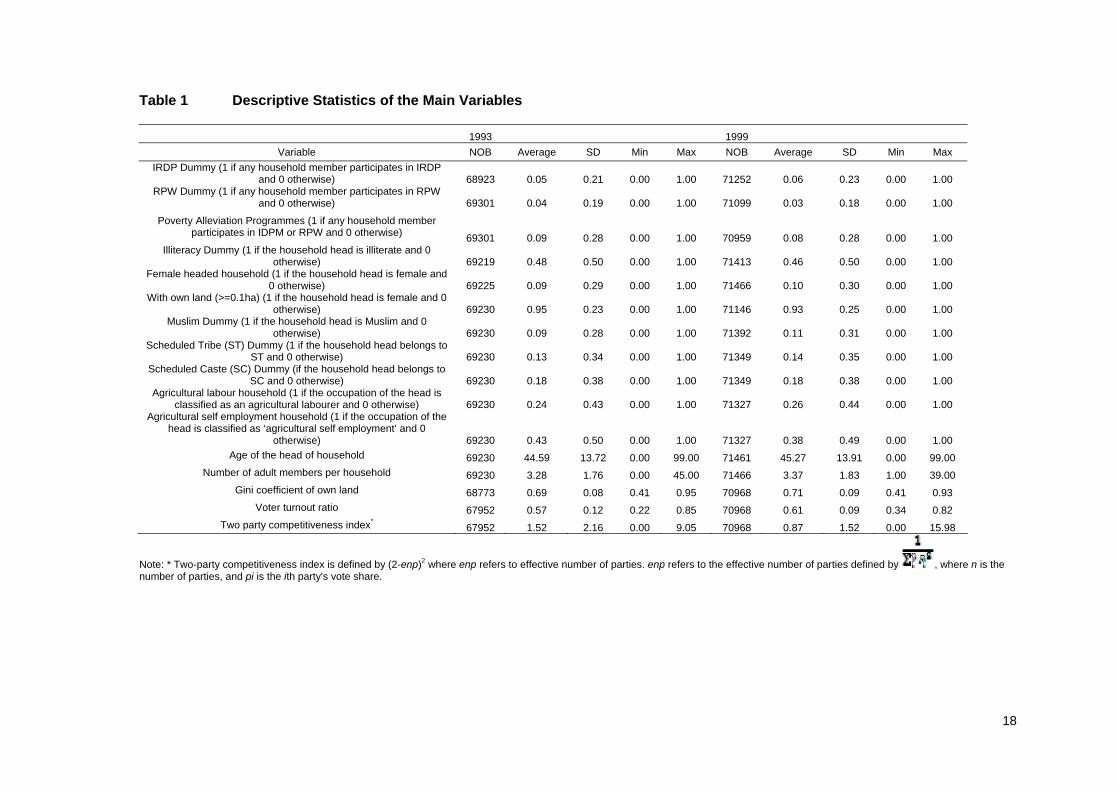
executive agency for the implementation of the JRY was primarily the Gram Panchayat. It suggests that at the district, the block, and the village levels, it seems necessary to involve elected representatives in the decision-making process while undertaking JRY works11. The role of the Panchayats in the implementation of the SGRY (JRY) is as follows: The first stream of the programme will be implemented at the district and block level Panchayats. Half the funds will be distributed between the Zilla Panchayat and the Panchayat Samiti in the ratio 40:60. The second stream of the programme will be implemented at the village level. The remainder of the funds will be released to the Gram Panchayats through the District Rural Development Agency (DRDA) and Panchayat Samiti12. 3. Data and main variables The present study draws upon household data constructed by two rounds of consumption module of NSS data, the 50th round in 1993-1994, and the 55th round in 1999-2000 collected by National Sample Survey Organization (NSSO), Government of India. NSS covers detailed socioeconomic information on approximately 700,000 rural households. In addition, we use the election data sets from the Election Commission of India's Statistical Report on General Elections, 1991 to the Tenth Lok Sabha13 and Statistical Report on General Elections, 1999 to the Thirteenth Lok Sabha in order to investigate the political influence on beneficiary selection. The former corresponds to the 50th round (1993-1994) NSS data set; the latter to the 55th round (1999-2000) data set. These reports contain detailed election data at the constituency level. We combine NSS data and the election data by using the identification of the 'NSS region', which NSSO classifies according to the ecological and agricultural similarities14. That is, we aggregate the constituency election results at the level of NSS region by using the district map obtained from the Census of India website, the constituency map on the Election Commission of India website, and the NSS’s code manual which indicates the relationship between the district and NSS region. The number of NSS regions in India is around 70 and that of districts is around 500 and thus we cannot capture electoral competition within the NSS region. Table 1 shows the descriptive statistics of the main variables used in the present study. The dependent variable for a probit model to be discussed in the next section is a dummy variable that is equal to one if someone in a household receives public support, i.e., the IRDP in the last five years, or has been beneficiary of public works for more than 60 days in the last 365 days, and zero otherwise. The number of observations (NOB) varies with different dependent variables due to missing observations. Explanatory variables can be classified according to three categories, namely, (1) household characteristics, (2) state fixed effect, and (3) socio political environment at the regional level. First, household characteristics include the illiteracy dummy of head of household (illiterate=1, literate=0); sex of head of household (female=1, male=0); land owner dummy (landed=1, landless=0); Muslim
11 Ministry of Rural Development, Concurrent Evaluation Report of JRY. 12 Ministry of Rural Development, Role of Panchayati Raj Institutions in the Rural Development Programmes. 13 The election data of Punjab is drawn from the Statistical Report on General Elections, 1992 to the Tenth Lok Sabha. 14 Matching at district levels is impossible because of the lack of district code in the 50th NSS.
9
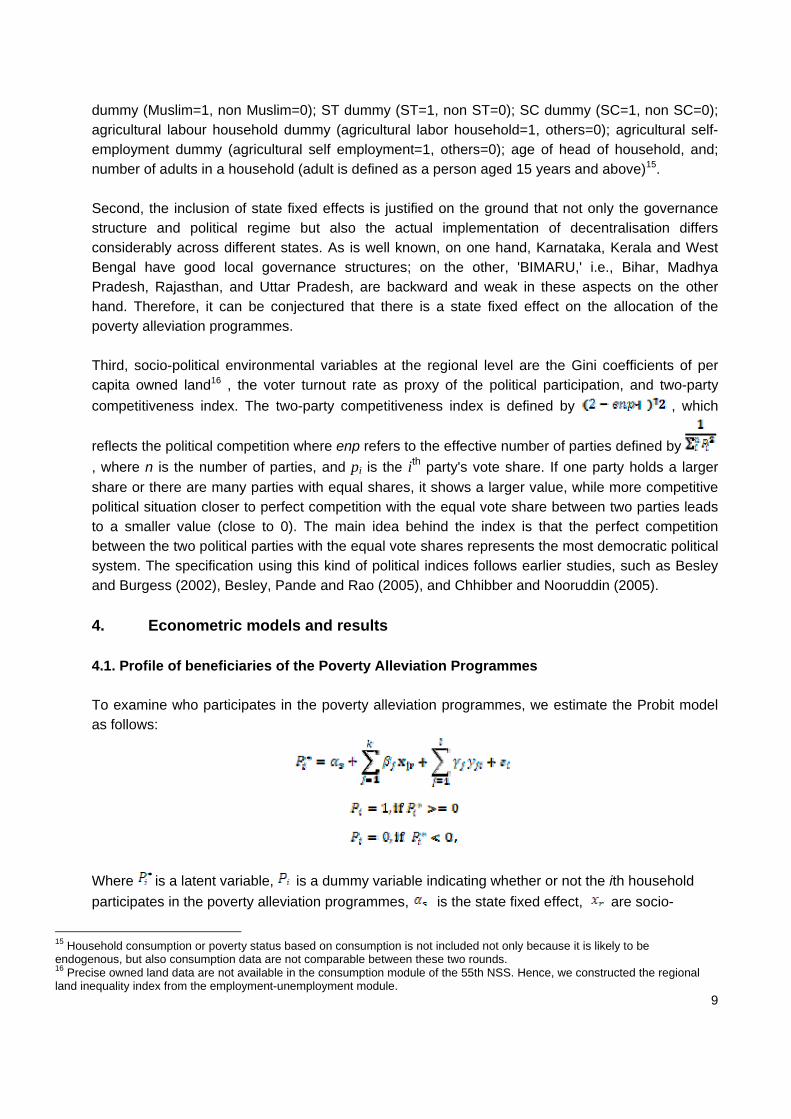
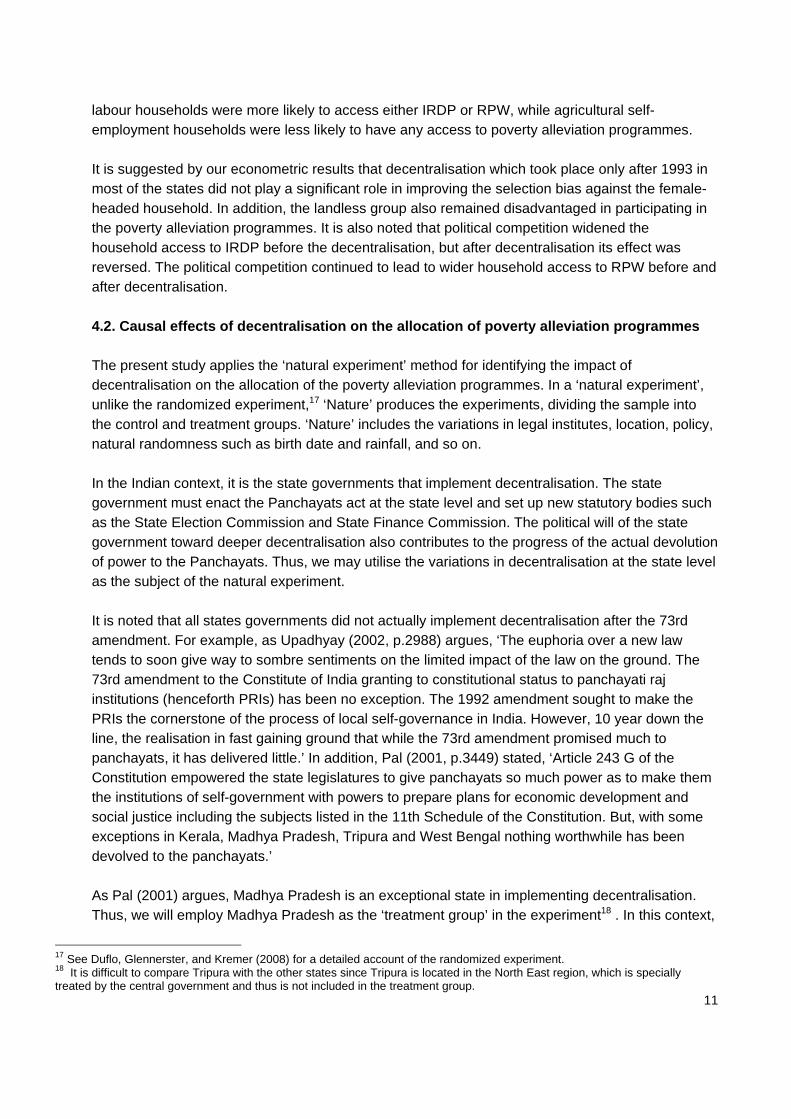
dummy (Muslim=1, non Muslim=0); ST dummy (ST=1, non ST=0); SC dummy (SC=1, non SC=0); agricultural labour household dummy (agricultural labor household=1, others=0); agricultural self-employment dummy (agricultural self employment=1, others=0); age of head of household, and; number of adults in a household (adult is defined as a person aged 15 years and above)15. Second, the inclusion of state fixed effects is justified on the ground that not only the governance structure and political regime but also the actual implementation of decentralisation differs considerably across different states. As is well known, on one hand, Karnataka, Kerala and West Bengal have good local governance structures; on the other, 'BIMARU,' i.e., Bihar, Madhya Pradesh, Rajasthan, and Uttar Pradesh, are backward and weak in these aspects on the other hand. Therefore, it can be conjectured that there is a state fixed effect on the allocation of the poverty alleviation programmes. Third, socio-political environmental variables at the regional level are the Gini coefficients of per capita owned land16 , the voter turnout rate as proxy of the political participation, and two-party competitiveness index. The two-party competitiveness index is defined by , which
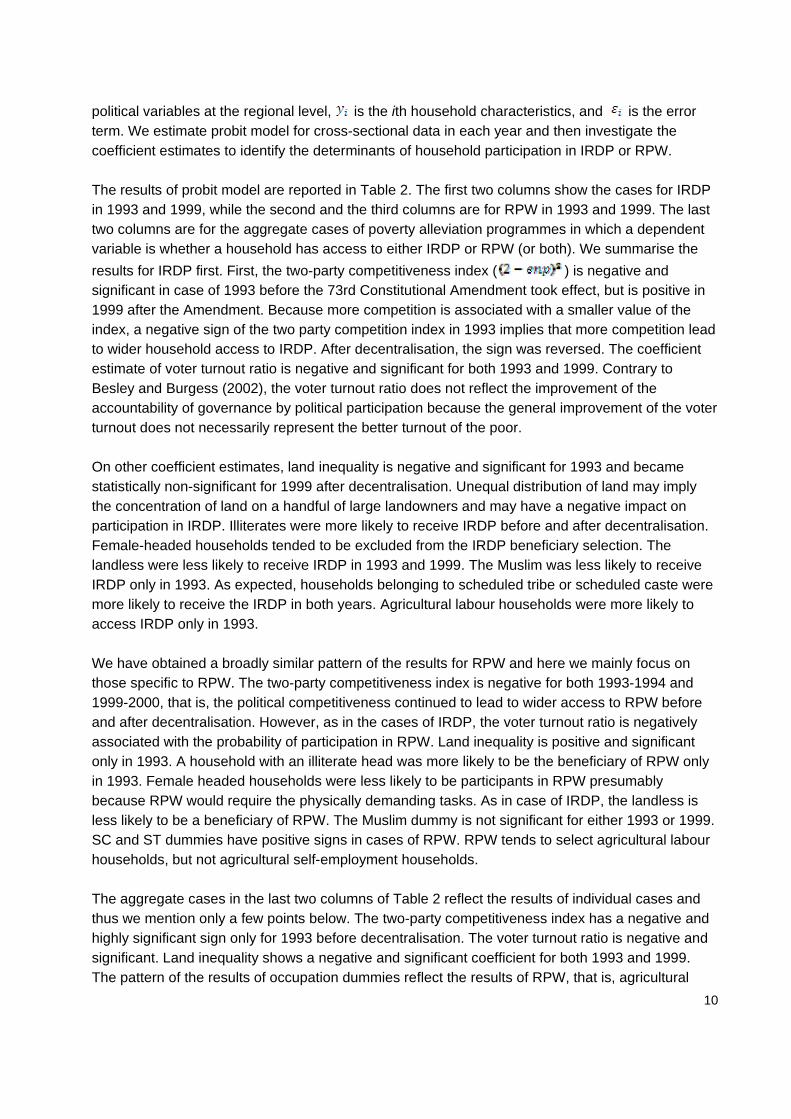
reflects the political competition where enp refers to the effective number of parties defined by , where n is the number of parties, and pi is the ith party's vote share. If one party holds a larger share or there are many parties with equal shares, it shows a larger value, while more competitive political situation closer to perfect competition with the equal vote share between two parties leads to a smaller value (close to 0). The main idea behind the index is that the perfect competition between the two political parties with the equal vote shares represents the most democratic political system. The specification using this kind of political indices follows earlier studies, such as Besley and Burgess (2002), Besley, Pande and Rao (2005), and Chhibber and Nooruddin (2005). 4. Econometric models and results 4.1. Profile of beneficiaries of the Poverty Alleviation Programmes To examine who participates in the poverty alleviation programmes, we estimate the Probit model as follows:
Where is a latent variable, is a dummy variable indicating whether or not the ith household participates in the poverty alleviation programmes, is the state fixed effect, are socio-
15 Household consumption or poverty status based on consumption is not included not only because it is likely to be endogenous, but also consumption data are not comparable between these two rounds. 16 Precise owned land data are not available in the consumption module of the 55th NSS. Hence, we constructed the regional land inequality index from the employment-unemployment module.
10
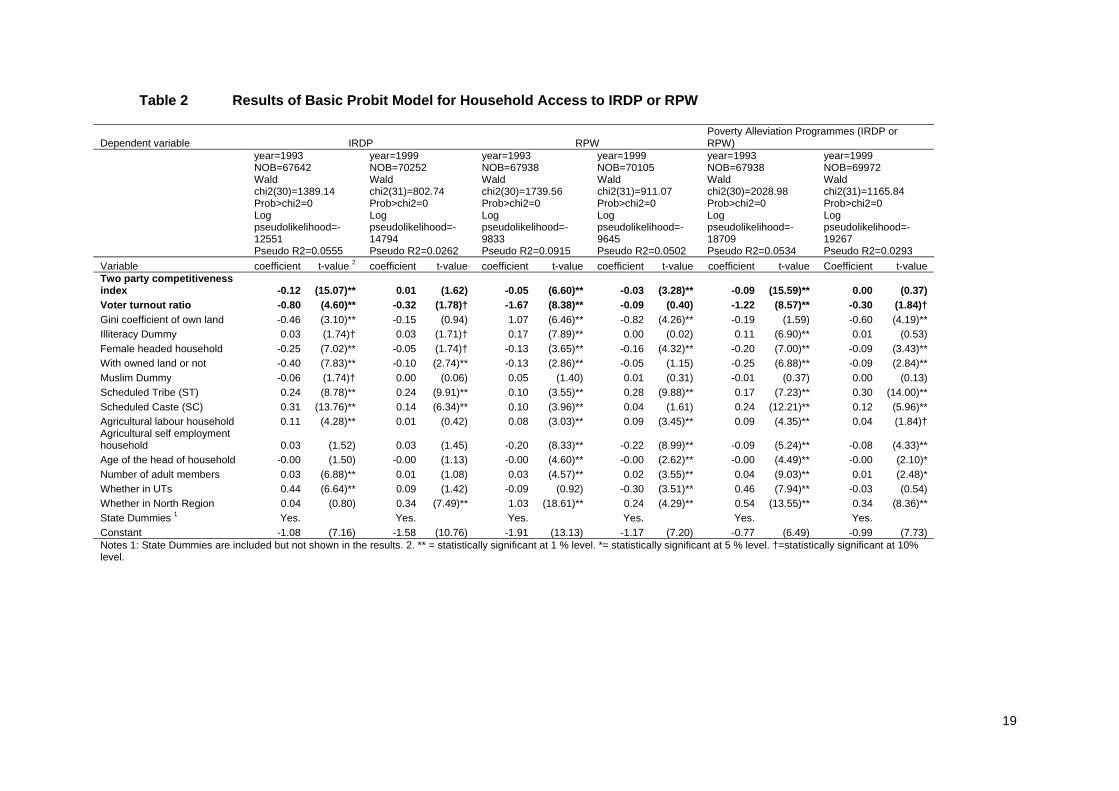
political variables at the regional level, is the ith household characteristics, and is the error term. We estimate probit model for cross-sectional data in each year and then investigate the coefficient estimates to identify the determinants of household participation in IRDP or RPW. The results of probit model are reported in Table 2. The first two columns show the cases for IRDP in 1993 and 1999, while the second and the third columns are for RPW in 1993 and 1999. The last two columns are for the aggregate cases of poverty alleviation programmes in which a dependent variable is whether a household has access to either IRDP or RPW (or both). We summarise the results for IRDP first. First, the two-party competitiveness index ( ) is negative and significant in case of 1993 before the 73rd Constitutional Amendment took effect, but is positive in 1999 after the Amendment. Because more competition is associated with a smaller value of the index, a negative sign of the two party competition index in 1993 implies that more competition lead to wider household access to IRDP. After decentralisation, the sign was reversed. The coefficient estimate of voter turnout ratio is negative and significant for both 1993 and 1999. Contrary to Besley and Burgess (2002), the voter turnout ratio does not reflect the improvement of the accountability of governance by political participation because the general improvement of the voter turnout does not necessarily represent the better turnout of the poor. On other coefficient estimates, land inequality is negative and significant for 1993 and became statistically non-significant for 1999 after decentralisation. Unequal distribution of land may imply the concentration of land on a handful of large landowners and may have a negative impact on participation in IRDP. Illiterates were more likely to receive IRDP before and after decentralisation. Female-headed households tended to be excluded from the IRDP beneficiary selection. The landless were less likely to receive IRDP in 1993 and 1999. The Muslim was less likely to receive IRDP only in 1993. As expected, households belonging to scheduled tribe or scheduled caste were more likely to receive the IRDP in both years. Agricultural labour households were more likely to access IRDP only in 1993. We have obtained a broadly similar pattern of the results for RPW and here we mainly focus on those specific to RPW. The two-party competitiveness index is negative for both 1993-1994 and 1999-2000, that is, the political competitiveness continued to lead to wider access to RPW before and after decentralisation. However, as in the cases of IRDP, the voter turnout ratio is negatively associated with the probability of participation in RPW. Land inequality is positive and significant only in 1993. A household with an illiterate head was more likely to be the beneficiary of RPW only in 1993. Female headed households were less likely to be participants in RPW presumably because RPW would require the physically demanding tasks. As in case of IRDP, the landless is less likely to be a beneficiary of RPW. The Muslim dummy is not significant for either 1993 or 1999. SC and ST dummies have positive signs in cases of RPW. RPW tends to select agricultural labour households, but not agricultural self-employment households. The aggregate cases in the last two columns of Table 2 reflect the results of individual cases and thus we mention only a few points below. The two-party competitiveness index has a negative and highly significant sign only for 1993 before decentralisation. The voter turnout ratio is negative and significant. Land inequality shows a negative and significant coefficient for both 1993 and 1999. The pattern of the results of occupation dummies reflect the results of RPW, that is, agricultural
11
labour households were more likely to access either IRDP or RPW, while agricultural self-employment households were less likely to have any access to poverty alleviation programmes. It is suggested by our econometric results that decentralisation which took place only after 1993 in most of the states did not play a significant role in improving the selection bias against the female-headed household. In addition, the landless group also remained disadvantaged in participating in the poverty alleviation programmes. It is also noted that political competition widened the household access to IRDP before the decentralisation, but after decentralisation its effect was reversed. The political competition continued to lead to wider household access to RPW before and after decentralisation. 4.2. Causal effects of decentralisation on the allocation of poverty alleviation programmes The present study applies the ‘natural experiment’ method for identifying the impact of decentralisation on the allocation of the poverty alleviation programmes. In a ‘natural experiment’, unlike the randomized experiment,17 ‘Nature’ produces the experiments, dividing the sample into the control and treatment groups. ‘Nature’ includes the variations in legal institutes, location, policy, natural randomness such as birth date and rainfall, and so on. In the Indian context, it is the state governments that implement decentralisation. The state government must enact the Panchayats act at the state level and set up new statutory bodies such as the State Election Commission and State Finance Commission. The political will of the state government toward deeper decentralisation also contributes to the progress of the actual devolution of power to the Panchayats. Thus, we may utilise the variations in decentralisation at the state level as the subject of the natural experiment. It is noted that all states governments did not actually implement decentralisation after the 73rd amendment. For example, as Upadhyay (2002, p.2988) argues, ‘The euphoria over a new law tends to soon give way to sombre sentiments on the limited impact of the law on the ground. The 73rd amendment to the Constitute of India granting to constitutional status to panchayati raj institutions (henceforth PRIs) has been no exception. The 1992 amendment sought to make the PRIs the cornerstone of the process of local self-governance in India. However, 10 year down the line, the realisation in fast gaining ground that while the 73rd amendment promised much to panchayats, it has delivered little.’ In addition, Pal (2001, p.3449) stated, ‘Article 243 G of the Constitution empowered the state legislatures to give panchayats so much power as to make them the institutions of self-government with powers to prepare plans for economic development and social justice including the subjects listed in the 11th Schedule of the Constitution. But, with some exceptions in Kerala, Madhya Pradesh, Tripura and West Bengal nothing worthwhile has been devolved to the panchayats.’ As Pal (2001) argues, Madhya Pradesh is an exceptional state in implementing decentralisation. Thus, we will employ Madhya Pradesh as the ‘treatment group’ in the experiment18 . In this context,
17 See Duflo, Glennerster, and Kremer (2008) for a detailed account of the randomized experiment. 18 It is difficult to compare Tripura with the other states since Tripura is located in the North East region, which is specially treated by the central government and thus is not included in the treatment group.
12
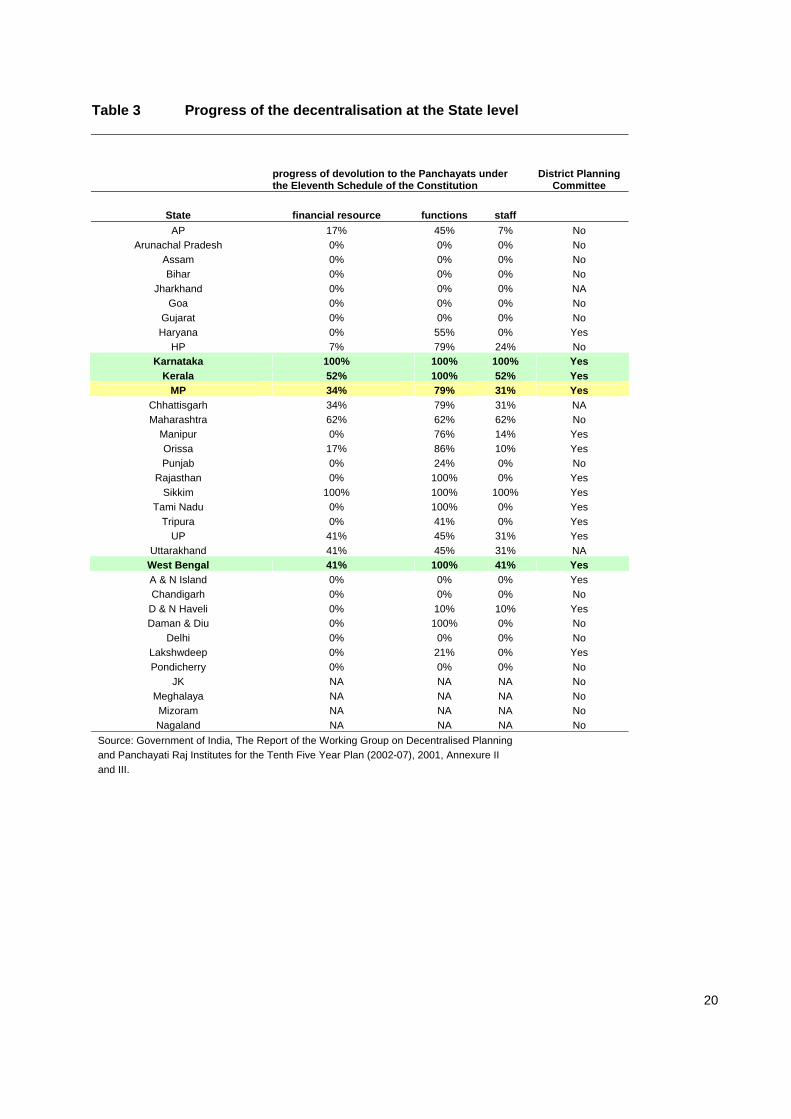
‘treatment’ refers to the actual implementation of decentralisation after the 73rd Constitutional Amendment. Madhya Pradesh is regarded as one of the most backward states and is one of the 'BIMARU' states. In fact, before the Amendment, there had been no serious decentralisation in Madhya Pradesh. In this sense, the 73rd Constitutional Amendment treats Madhya Pradesh and it is thus conjectured that the data in Madhya Pradesh in 1993 were considered to be those before decentralisation and the data in 1999 were after decentralisation. According to Behar (1999, p.3342), the chief Minister of Madhya Pradesh, Digvijay Singh stated, ‘decentralisation of governance is imperative in a big state like Madhya Pradesh, for development to take place, for people to get their rights, for the marginalised and disadvantaged to claim their space in society and for the administrative system to work efficiently and properly.’ We can confirm that the political will for decentralisation is clearly evident in Madhya Pradesh. In fact, Madhya Pradesh was the first state to conduct the Panchayat elections in 1994 under the provision of the 73rd Constitutional Amendment. In this election, the vacancy rate of the members of the Panchayats was less than 1 percent, and that of the chairman of the Panchayats was only 0.2 percent (Institute of Social Sciences 2000, p.173). Madhya Pradesh is the only state to introduce the right to recall the members of the Gram Panchayats (MaCarten and Vyasulu, 2004). Moreover, Madhya Pradesh is an advanced state in terms of establishing the District Planning Committee and enacting the Right to Information Act. Table 3 shows the progress of decentralisation at the state level. According to Table 3, Madhya Pradesh devolved power in terms of financial resource, functions, and staffs to the Panchayats more progressively and set up the District Planning Committee. It is for these reasons that we regard Madhya Pradesh as the treatment group. The next question is how we identify the control groups. It is well known that the Karnataka, Kerala, and West Bengal governments committed to the decentralisation before the 73rd Constitution Amendment. The decentralisation implemented by these governments has been considered as a good practice case of decentralisation in India, since in these states, the Panchayats have worked relatively well. The decentralisation in the early 1980s in Karnataka, in particular, is regarded as a model case in preparing the 73rd Constitutional Amendments. Therefore, we regard Karnataka, Kerala, and West Bengal as the control groups in the experiments since these states implemented decentralisation both before and after the 73rd Constitution Amendment. We can summarise the framework of this natural experiment as follows: treatment group control group 1993 Madhya Pradesh Karnataka, Kerala, West Bengal 1999 Madhya Pradesh Karnataka, Kerala, West Bengal Our estimation strategy is to pool the sample restricted to Karnataka, Kerala, West Bengal, and Madhya Pradesh in both reference years and then estimate the probit model as follows:
13
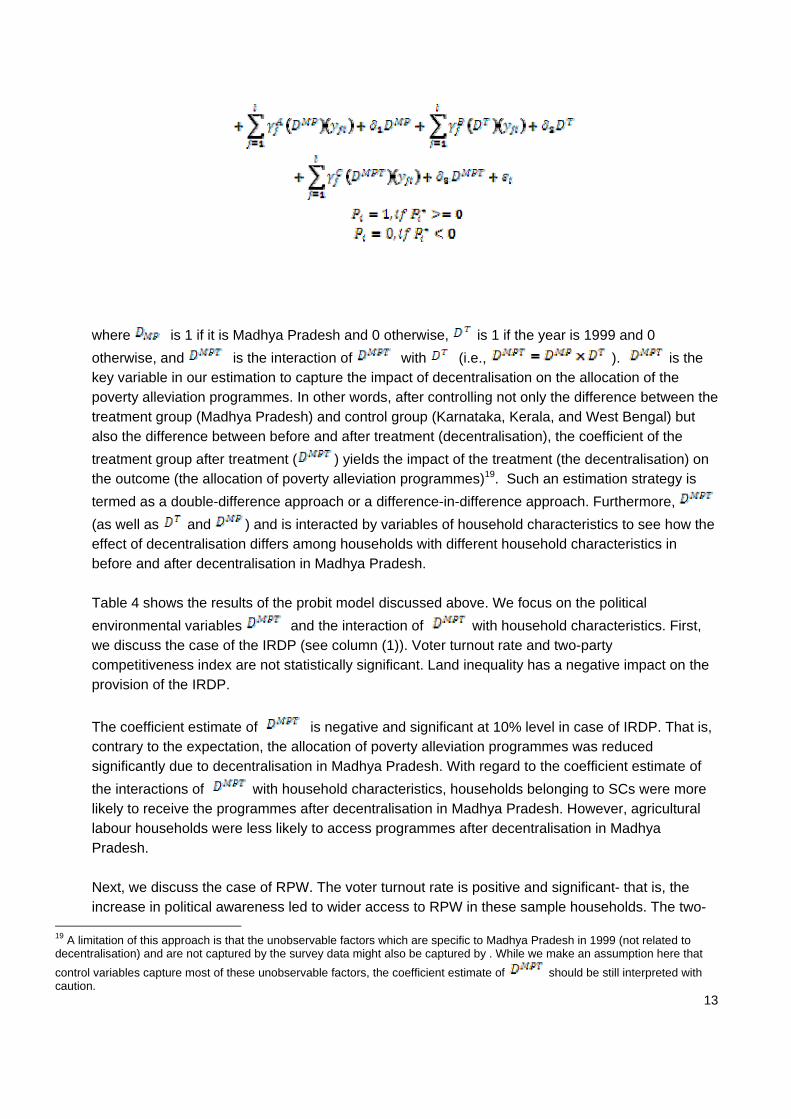
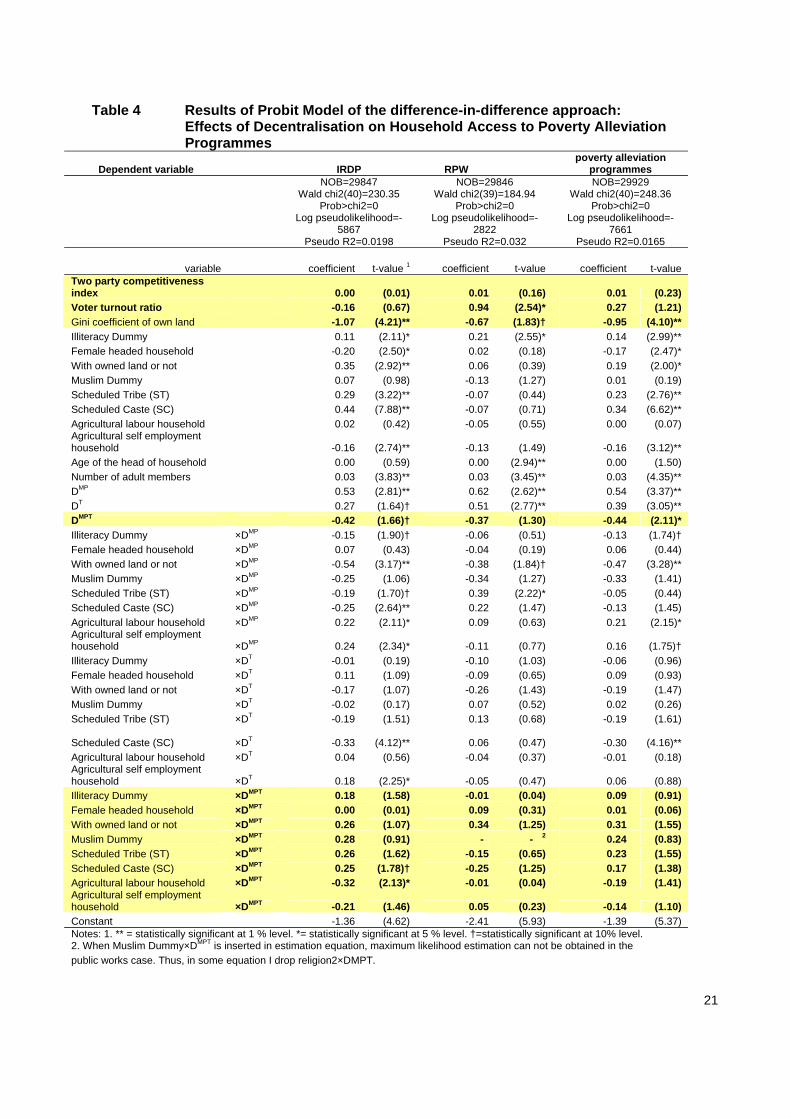
where is 1 if it is Madhya Pradesh and 0 otherwise, is 1 if the year is 1999 and 0 otherwise, and is the interaction of with (i.e., ). is the key variable in our estimation to capture the impact of decentralisation on the allocation of the poverty alleviation programmes. In other words, after controlling not only the difference between the treatment group (Madhya Pradesh) and control group (Karnataka, Kerala, and West Bengal) but also the difference between before and after treatment (decentralisation), the coefficient of the treatment group after treatment ( ) yields the impact of the treatment (the decentralisation) on the outcome (the allocation of poverty alleviation programmes)19. Such an estimation strategy is termed as a double-difference approach or a difference-in-difference approach. Furthermore, (as well as and ) and is interacted by variables of household characteristics to see how the effect of decentralisation differs among households with different household characteristics in before and after decentralisation in Madhya Pradesh. Table 4 shows the results of the probit model discussed above. We focus on the political environmental variables and the interaction of with household characteristics. First, we discuss the case of the IRDP (see column (1)). Voter turnout rate and two-party competitiveness index are not statistically significant. Land inequality has a negative impact on the provision of the IRDP. The coefficient estimate of is negative and significant at 10% level in case of IRDP. That is, contrary to the expectation, the allocation of poverty alleviation programmes was reduced significantly due to decentralisation in Madhya Pradesh. With regard to the coefficient estimate of the interactions of with household characteristics, households belonging to SCs were more likely to receive the programmes after decentralisation in Madhya Pradesh. However, agricultural labour households were less likely to access programmes after decentralisation in Madhya Pradesh. Next, we discuss the case of RPW. The voter turnout rate is positive and significant- that is, the increase in political awareness led to wider access to RPW in these sample households. The two-
19 A limitation of this approach is that the unobservable factors which are specific to Madhya Pradesh in 1999 (not related to decentralisation) and are not captured by the survey data might also be captured by . While we make an assumption here that control variables capture most of these unobservable factors, the coefficient estimate of should be still interpreted with caution.
14
party competitiveness index is not statistically significant. Land inequality is negative and significant. The coefficient estimate of is not significant in case of RPW. Second, with regard to the interaction of with household characteristics, none of the variables are statistically significant. We can conclude that there is little effect of the decentralisation on the provision of RPW20. Finally, we consider the case of the poverty alleviation programmes as a whole. Neither the voter turnout rate nor the two-party competitiveness index is statistically significant. Land inequality is negative and significant. While none of the interaction of with household characteristics is statistically significant, the coefficient of is positive and statistically significant, implying that the allocation of the poverty alleviation programmes is significantly reduced due to decentralisation in Madhya Pradesh. 5. Concluding observations This paper investigates the effect of the devolution of power - induced by the 73rd Constitution Amendment - to the village level government. After decentralisation, the elected Panchayats had the responsibility to decide the beneficiary selection for the poverty alleviation programmes. By using the National Sample Survey data and the Election Commission's election data, we highlighted the household-level allocation of poverty alleviation programmes before and after decentralisation as well as the causal effect of decentralisation on the provision of the programmes. The main findings are summarised below. First, the regional socio-political environment is likely to affect the allocation of the poverty alleviation programmes, that is, greater inequality in land-holdings and less competition between the two major political parties generally lead to less provision of the poverty alleviation programmes. Second, the disadvantaged groups were not necessarily likely to be the primary beneficiaries over others of the poverty alleviation programmes. For example, the female-headed households and the landless groups remained disadvantaged in participating in these programmes throughout the period. However, the Scheduled Castes, Scheduled Tribes, and agricultural labour households have were in an advantaged position in receiving the programmes. Third, it has been suggested by our ‘natural experiment’ based on the difference in difference approach applied to Madhya Pradesh that the provision of the poverty alleviation programmes was reduced by decentralisation. Further, decentralisation resulted in the allocation of the IRDP in less favour of the agricultural labour households, among which most of the poor are found in rural India. Our results imply the possibility that the power and resources were captured by the local elite after decentralisation. That is, decentralisation did not necessarily contribute to the improvement of the welfare of the socially disadvantaged groups. However, decentralisation resulted in greater allocation of the IRDP to the Scheduled Castes, which reflects to some extent an effect of
20 Using NSS data in 1987 and 1993, Gaiha, Imai and Kaushik (2001) showed that the large section of members in non-poor households participated in IRDP and RPW, with RPW maintaining a slight superiority in targeting performance and they suggested the possibility of wastage and diversion of public funds for these programmes in a context of corrupt bureaucracy and capture of locally elected bodies such as Panchayats by a few influential persons. Our results are in line with Gaiha, Imai and Kaushik’s (2001) findings.
15
decentralisation on the political reservation of the Panchayats for these groups. It is further suggested that the provision of Rural Public Works was not influenced by decentralisation. In general, public works involve the self-targeting mechanism. Discretionary manipulation of public works by the local elite might have been difficult, at least in Madhya Pradesh. However, it can be concluded by our econometric results given the limitation of the approach (e.g. imperfect control of year-and-state specific unobservable factors not related to decentralisation) that decentralisation did not necessarily lead to wider household access to poverty alleviation programmes and that a more accountable political system is required to prevent resources from being captured by local elites and to monitor the process of allocation of these programmes at local levels.
.
16
References Bardhan, P. (2002) Decentralisation of Governance and Development. Journal of Economic Perspective 16(4): 185-205. Bardhan, P. (2003) Poverty, Agrarian Structure, and Political Economy in India, New Delhi: Oxford University Press. Bardhan, P. and Mookherjee, D. (2006) Pro-poor targeting and accountability of local governments in West Bengal. Journal of Development Economics 79(2): 303-327. Bardhan, P. and Mookherjee, D. (2007) Political Economy of Land Reform in West Bengal,' The Institute for Economic Development Working Papers Series DP-163, Department of Economics , Boston University, Massachusetts. Besley, T. and Burgess, R. (2002) The Political Economy of Government Responsiveness, Quarterly Journal of Economics 117(4): 1415-1451. Besley, T., Pande, R. and Rao, V. (2005) Participatory Democracy in Action: Survey Evidence from South India, Journal of the European Economic Association, 3 (2-3): 648-657. Besley, T., Pande, R., Rahman, L. and Rao, V. (2004) The Politics of Public Good Provision: Evidence from Local Governments, Journal of the European Economic Association 2 (2-3): 416-426. Burgess, R, Wong, G. and Pande, R. (2005) Banking for the Poor: Evidence from India, Journal of the European Economic Association, 2 (2-3): 268-278. Behar, A. (1999) Initiative for Decentralisation of Governance in Madhya Pradesh, Economic and Political Weekly 34 (45) (Nov. 6-12): 3242-3244. Betancourt, R. and Gleason, S. (2000) The Allocation of Publicly-Provided Goods to Rural Households in India. World Development 28(12): 2169-2182. Chattopadhyay, R. and Duflo, E. (2004a) Women as Policy Makers: Evidence from a Randomised Policy Experiment in India. Econometrica 72(5): 1409-1443. Chattopadhyay, R. and Duflo, E. (2004b) The Impact of Reservation in the Panchayati Raj: Evidence from a Nationwide Randomised Experiment, Economic and Political Weekly 39 (9) (Feb. 28 - Mar. 5): 979-986. Chhibber, P., Shastri, S. and Sisson, R. (2004) Federal Arrangements and the Provision of Public Goods in India, Asian Survey, 44(3): 339-352. Chhibber, P. and Nooruddin, I. (2004) Do Party Systems Count? The Number of Parties and Government Performance in the Indian States, Comparative Political Studies 37: 152-187.
17
Crook, R..C. and Manor, J. (1998). Democracy and Decentralisation in South Asia and West Africa- Participation, Accountability And Performance, Cambridge: Cambridge University Press. Duflo, E., Glennerster, R. and Kremer, M. (2008) Using Randomization in Development Economics Research: A Toolkit. In T. P. Schultz and J. A. Strauss (eds.) Handbook of Development Economics Vol. 4, Amsterdam: North-Holland, Elsevier, Chapter 61, pp.3895-3962. Foster, A. D. and Rosenzweig, M. R. (2004) Democratization and the Distribution of Local Public Goods in a Poor Rural Economy, Mimeo, Penn Institute for Economic Research, University of Pennsylvania, Philadelphia. Gaiha, R. (2003) Decentralisation and Poverty Alleviation in Asia. In E. Pernia and A. Deolalikar (eds.) Poverty, Growth and Institutions in Asia, London: Palgrave Macmillan. Gaiha, R.,Imai, K., and Kaushik, P. D. (2001) On the Targeting and Cost-Effectiveness of Anti-Poverty Programmes in Rural India. Development and Change, 32(2): 309-342. Greason, S. (2001) Female Political Participation and Health in India,' Annals of the American Academy of Political and Social Science 573 (1): 105-126. Institute of Social Sciences (2000) Status of Panchayati Raj in the States and Union Territories of India 2000, New Delhi: Concept Publishing Company. MaCarten, W. and Vyasulu, V. (2004) Democratic Decentralisation and Poverty Reduction in Madhya Pradesh: Searching for an Institutional Equilibrium. Development in Practice 14(6) :733-740. NSSO, Government of India (2001), IRDP Assistance and Participation in Public Works, 1999-2000. NSS Report No. 467, New Delhi. Pal, M. (2001) Documenting Panchayat Raj, Economic and Political Weekly 36 (Sep. 8-14, 2001): 3448-3450. Pande, R. (2003) Can Mandated Political Representation Increase Policy Influence for Disadvantaged Minorities? American Economic Review 93(4): 1132-1151. Seabright, P. (1996) Accountability and Decentralisation in Government, European Economic Review 40: 61-89. Stock, J. H. and Watson, M. W. (2007) Introduction to Econometrics 2nd Edition. Amsterdam: Addison-Wesley Longman. Upadhyay, V. (2002) Panchayats and Paper Law: Simmering Discontent on 73rd Amendment. Economic and Political Weekly 37(29) (Jul. 20-26, 2002): 2988-2989.
18
Table 1 Descriptive Statistics of the Main Variables
1993 1999 Variable NOB Average SD Min Max NOB Average SD Min Max
IRDP Dummy (1 if any household member participates in IRDP and 0 otherwise) 68923 0.05 0.21 0.00 1.00 71252 0.06 0.23 0.00 1.00
RPW Dummy (1 if any household member participates in RPW and 0 otherwise) 69301 0.04 0.19 0.00 1.00 71099 0.03 0.18 0.00 1.00
Poverty Alleviation Programmes (1 if any household member participates in IDPM or RPW and 0 otherwise) 69301 0.09 0.28 0.00 1.00 70959 0.08 0.28 0.00 1.00
Illiteracy Dummy (1 if the household head is illiterate and 0 otherwise) 69219 0.48 0.50 0.00 1.00 71413 0.46 0.50 0.00 1.00
Female headed household (1 if the household head is female and 0 otherwise) 69225 0.09 0.29 0.00 1.00 71466 0.10 0.30 0.00 1.00
With own land (>=0.1ha) (1 if the household head is female and 0 otherwise) 69230 0.95 0.23 0.00 1.00 71146 0.93 0.25 0.00 1.00
Muslim Dummy (1 if the household head is Muslim and 0 otherwise) 69230 0.09 0.28 0.00 1.00 71392 0.11 0.31 0.00 1.00
Scheduled Tribe (ST) Dummy (1 if the household head belongs to ST and 0 otherwise) 69230 0.13 0.34 0.00 1.00 71349 0.14 0.35 0.00 1.00
Scheduled Caste (SC) Dummy (if the household head belongs to SC and 0 otherwise) 69230 0.18 0.38 0.00 1.00 71349 0.18 0.38 0.00 1.00
Agricultural labour household (1 if the occupation of the head is classified as an agricultural labourer and 0 otherwise) 69230 0.24 0.43 0.00 1.00 71327 0.26 0.44 0.00 1.00
Agricultural self employment household (1 if the occupation of the head is classified as ‘agricultural self employment’ and 0
otherwise) 69230 0.43 0.50 0.00 1.00 71327 0.38 0.49 0.00 1.00 Age of the head of household 69230 44.59 13.72 0.00 99.00 71461 45.27 13.91 0.00 99.00
Number of adult members per household 69230 3.28 1.76 0.00 45.00 71466 3.37 1.83 1.00 39.00 Gini coefficient of own land 68773 0.69 0.08 0.41 0.95 70968 0.71 0.09 0.41 0.93
Voter turnout ratio 67952 0.57 0.12 0.22 0.85 70968 0.61 0.09 0.34 0.82 Two party competitiveness index* 67952 1.52 2.16 0.00 9.05 70968 0.87 1.52 0.00 15.98
Note: * Two-party competitiveness index is defined by (2-enp)2 where enp refers to effective number of parties. enp refers to the effective number of parties defined by , where n is the number of parties, and pi is the ith party's vote share.
19
Table 2 Results of Basic Probit Model for Household Access to IRDP or RPW
Dependent variable IRDP RPW Poverty Alleviation Programmes (IRDP or RPW)
year=1993 NOB=67642 Wald chi2(30)=1389.14 Prob>chi2=0 Log pseudolikelihood=-12551 Pseudo R2=0.0555
year=1999 NOB=70252 Wald chi2(31)=802.74 Prob>chi2=0 Log pseudolikelihood=-14794 Pseudo R2=0.0262
year=1993 NOB=67938 Wald chi2(30)=1739.56 Prob>chi2=0 Log pseudolikelihood=-9833 Pseudo R2=0.0915
year=1999 NOB=70105 Wald chi2(31)=911.07 Prob>chi2=0 Log pseudolikelihood=-9645 Pseudo R2=0.0502
year=1993 NOB=67938 Wald chi2(30)=2028.98 Prob>chi2=0 Log pseudolikelihood=-18709 Pseudo R2=0.0534
year=1999 NOB=69972 Wald chi2(31)=1165.84 Prob>chi2=0 Log pseudolikelihood=-19267 Pseudo R2=0.0293
Variable coefficient t-value 2 coefficient t-value coefficient t-value coefficient t-value coefficient t-value Coefficient t-value Two party competitiveness index -0.12 (15.07)** 0.01 (1.62) -0.05 (6.60)** -0.03 (3.28)** -0.09 (15.59)** 0.00 (0.37) Voter turnout ratio -0.80 (4.60)** -0.32 (1.78)† -1.67 (8.38)** -0.09 (0.40) -1.22 (8.57)** -0.30 (1.84)† Gini coefficient of own land -0.46 (3.10)** -0.15 (0.94) 1.07 (6.46)** -0.82 (4.26)** -0.19 (1.59) -0.60 (4.19)** Illiteracy Dummy 0.03 (1.74)† 0.03 (1.71)† 0.17 (7.89)** 0.00 (0.02) 0.11 (6.90)** 0.01 (0.53) Female headed household -0.25 (7.02)** -0.05 (1.74)† -0.13 (3.65)** -0.16 (4.32)** -0.20 (7.00)** -0.09 (3.43)** With owned land or not -0.40 (7.83)** -0.10 (2.74)** -0.13 (2.86)** -0.05 (1.15) -0.25 (6.88)** -0.09 (2.84)** Muslim Dummy -0.06 (1.74)† 0.00 (0.06) 0.05 (1.40) 0.01 (0.31) -0.01 (0.37) 0.00 (0.13) Scheduled Tribe (ST) 0.24 (8.78)** 0.24 (9.91)** 0.10 (3.55)** 0.28 (9.88)** 0.17 (7.23)** 0.30 (14.00)** Scheduled Caste (SC) 0.31 (13.76)** 0.14 (6.34)** 0.10 (3.96)** 0.04 (1.61) 0.24 (12.21)** 0.12 (5.96)** Agricultural labour household 0.11 (4.28)** 0.01 (0.42) 0.08 (3.03)** 0.09 (3.45)** 0.09 (4.35)** 0.04 (1.84)† Agricultural self employment household 0.03 (1.52) 0.03 (1.45) -0.20 (8.33)** -0.22 (8.99)** -0.09 (5.24)** -0.08 (4.33)** Age of the head of household -0.00 (1.50) -0.00 (1.13) -0.00 (4.60)** -0.00 (2.62)** -0.00 (4.49)** -0.00 (2.10)* Number of adult members 0.03 (6.88)** 0.01 (1.08) 0.03 (4.57)** 0.02 (3.55)** 0.04 (9.03)** 0.01 (2.48)* Whether in UTs 0.44 (6.64)** 0.09 (1.42) -0.09 (0.92) -0.30 (3.51)** 0.46 (7.94)** -0.03 (0.54) Whether in North Region 0.04 (0.80) 0.34 (7.49)** 1.03 (18.61)** 0.24 (4.29)** 0.54 (13.55)** 0.34 (8.36)** State Dummies 1 Yes. Yes. Yes. Yes. Yes. Yes. Constant -1.08 (7.16) -1.58 (10.76) -1.91 (13.13) -1.17 (7.20) -0.77 (6.49) -0.99 (7.73) Notes 1: State Dummies are included but not shown in the results. 2. ** = statistically significant at 1 % level. *= statistically significant at 5 % level. †=statistically significant at 10% level.
20
Table 3 Progress of the decentralisation at the State level
progress of devolution to the Panchayats under the Eleventh Schedule of the Constitution
District Planning Committee
State financial resource functions staff AP 17% 45% 7% No
Arunachal Pradesh 0% 0% 0% No Assam 0% 0% 0% No Bihar 0% 0% 0% No
Jharkhand 0% 0% 0% NA Goa 0% 0% 0% No
Gujarat 0% 0% 0% No Haryana 0% 55% 0% Yes
HP 7% 79% 24% No Karnataka 100% 100% 100% Yes
Kerala 52% 100% 52% Yes MP 34% 79% 31% Yes
Chhattisgarh 34% 79% 31% NA Maharashtra 62% 62% 62% No
Manipur 0% 76% 14% Yes Orissa 17% 86% 10% Yes Punjab 0% 24% 0% No
Rajasthan 0% 100% 0% Yes Sikkim 100% 100% 100% Yes
Tami Nadu 0% 100% 0% Yes Tripura 0% 41% 0% Yes
UP 41% 45% 31% Yes Uttarakhand 41% 45% 31% NA
West Bengal 41% 100% 41% Yes A & N Island 0% 0% 0% Yes Chandigarh 0% 0% 0% No
D & N Haveli 0% 10% 10% Yes Daman & Diu 0% 100% 0% No
Delhi 0% 0% 0% No Lakshwdeep 0% 21% 0% Yes Pondicherry 0% 0% 0% No
JK NA NA NA No Meghalaya NA NA NA No Mizoram NA NA NA No Nagaland NA NA NA No
Source: Government of India, The Report of the Working Group on Decentralised Planning and Panchayati Raj Institutes for the Tenth Five Year Plan (2002-07), 2001, Annexure II and III.
21
Table 4 Results of Probit Model of the difference-in-difference approach: Effects of Decentralisation on Household Access to Poverty Alleviation Programmes
Dependent variable IRDP RPW poverty alleviation
programmes NOB=29847 NOB=29846 NOB=29929 Wald chi2(40)=230.35 Wald chi2(39)=184.94 Wald chi2(40)=248.36 Prob>chi2=0 Prob>chi2=0 Prob>chi2=0
Log pseudolikelihood=-
5867 Log pseudolikelihood=-
2822 Log pseudolikelihood=-
7661 Pseudo R2=0.0198 Pseudo R2=0.032 Pseudo R2=0.0165
variable coefficient t-value 1 coefficient t-value coefficient t-value Two party competitiveness index 0.00 (0.01) 0.01 (0.16) 0.01 (0.23) Voter turnout ratio -0.16 (0.67) 0.94 (2.54)* 0.27 (1.21) Gini coefficient of own land -1.07 (4.21)** -0.67 (1.83)† -0.95 (4.10)** Illiteracy Dummy 0.11 (2.11)* 0.21 (2.55)* 0.14 (2.99)** Female headed household -0.20 (2.50)* 0.02 (0.18) -0.17 (2.47)* With owned land or not 0.35 (2.92)** 0.06 (0.39) 0.19 (2.00)* Muslim Dummy 0.07 (0.98) -0.13 (1.27) 0.01 (0.19) Scheduled Tribe (ST) 0.29 (3.22)** -0.07 (0.44) 0.23 (2.76)** Scheduled Caste (SC) 0.44 (7.88)** -0.07 (0.71) 0.34 (6.62)** Agricultural labour household 0.02 (0.42) -0.05 (0.55) 0.00 (0.07) Agricultural self employment household -0.16 (2.74)** -0.13 (1.49) -0.16 (3.12)** Age of the head of household 0.00 (0.59) 0.00 (2.94)** 0.00 (1.50) Number of adult members 0.03 (3.83)** 0.03 (3.45)** 0.03 (4.35)** DMP 0.53 (2.81)** 0.62 (2.62)** 0.54 (3.37)** DT 0.27 (1.64)† 0.51 (2.77)** 0.39 (3.05)** DMPT -0.42 (1.66)† -0.37 (1.30) -0.44 (2.11)* Illiteracy Dummy ×DMP -0.15 (1.90)† -0.06 (0.51) -0.13 (1.74)† Female headed household ×DMP 0.07 (0.43) -0.04 (0.19) 0.06 (0.44) With owned land or not ×DMP -0.54 (3.17)** -0.38 (1.84)† -0.47 (3.28)** Muslim Dummy ×DMP -0.25 (1.06) -0.34 (1.27) -0.33 (1.41) Scheduled Tribe (ST) ×DMP -0.19 (1.70)† 0.39 (2.22)* -0.05 (0.44) Scheduled Caste (SC) ×DMP -0.25 (2.64)** 0.22 (1.47) -0.13 (1.45) Agricultural labour household ×DMP 0.22 (2.11)* 0.09 (0.63) 0.21 (2.15)* Agricultural self employment household ×DMP 0.24 (2.34)* -0.11 (0.77) 0.16 (1.75)† Illiteracy Dummy ×DT -0.01 (0.19) -0.10 (1.03) -0.06 (0.96) Female headed household ×DT 0.11 (1.09) -0.09 (0.65) 0.09 (0.93) With owned land or not ×DT -0.17 (1.07) -0.26 (1.43) -0.19 (1.47) Muslim Dummy ×DT -0.02 (0.17) 0.07 (0.52) 0.02 (0.26) Scheduled Tribe (ST) ×DT -0.19 (1.51) 0.13 (0.68) -0.19 (1.61)
Scheduled Caste (SC) ×DT -0.33 (4.12)** 0.06 (0.47)
-0.30 (4.16)** Agricultural labour household ×DT 0.04 (0.56) -0.04 (0.37) -0.01 (0.18) Agricultural self employment household ×DT 0.18 (2.25)* -0.05 (0.47) 0.06 (0.88) Illiteracy Dummy ×DMPT 0.18 (1.58) -0.01 (0.04) 0.09 (0.91) Female headed household ×DMPT 0.00 (0.01) 0.09 (0.31) 0.01 (0.06) With owned land or not ×DMPT 0.26 (1.07) 0.34 (1.25) 0.31 (1.55) Muslim Dummy ×DMPT 0.28 (0.91) - - 2 0.24 (0.83) Scheduled Tribe (ST) ×DMPT 0.26 (1.62) -0.15 (0.65) 0.23 (1.55) Scheduled Caste (SC) ×DMPT 0.25 (1.78)† -0.25 (1.25) 0.17 (1.38) Agricultural labour household ×DMPT -0.32 (2.13)* -0.01 (0.04) -0.19 (1.41) Agricultural self employment household ×DMPT -0.21 (1.46) 0.05 (0.23) -0.14 (1.10) Constant -1.36 (4.62) -2.41 (5.93) -1.39 (5.37) Notes: 1. ** = statistically significant at 1 % level. *= statistically significant at 5 % level. †=statistically significant at 10% level. 2. When Muslim Dummy×DMPT is inserted in estimation equation, maximum likelihood estimation can not be obtained in the public works case. Thus, in some equation I drop religion2×DMPT.
The Brooks World Poverty Institute (BWPI) creates and shares knowledge to help end global poverty. BWPI is multidisciplinary, researching poverty in both the rich and poor worlds. Our aim is to better understand why people are poor, what keeps them trapped in poverty and how they can be helped - drawing upon the very best international practice in research and policy making. The Brooks World Poverty Institute is chaired by Nobel Laureate, Professor Joseph E. Stiglitz.
Executive Director Professor David Hulme Research Director Professor Armando Barrientos Contact: Brooks World Poverty Institute The University of Manchester Humanities Bridgeford Street Building Oxford Road Manchester M13 9PL United Kingdom Email: [email protected] www.manchester.ac.uk/bwpi
www.manchester.ac.uk/bwpi