Embed Size (px)
Citation preview

Design and potentiality of an apparatus for measuring yarn/yarn and fabric/fabric friction.
G. Hivet, S. Allaoui, B.T. Cam, P. Ouagne, D.Soulat
Laboratoire PRISME, UPRES EA 4229, Université d’Orléans, Polytech’Orléans, 8 rue Léonard de
Vinci 45072 Orléans Cedex 2, France
Keywords: RTM, woven reinforcement, friction, fabrics, contact, tribology, textiles, friction measurements.
The market demand for thicker complex shaped structural composite parts is increasing. Processes of
the Liquid Composite Moulding (LCM) family, such as Resin Transfer Moulding (RTM) are considered
to manufacture such parts. The first stage of the RTM process consists in the preforming of the part.
During the pre-forming of multilayered reinforcements, frictions between the plies occur and need to
be taken into account for the forming simulation. An experimental device designed to analyse the
ply/ply and ply/tool frictions has been set up. The different set up steps of the device are described.
First results are presented, which show the ply/ply friction behaviour for a glass plain weave fabric. A
specific contact behaviour has been observed for dry reinforcement fabric in comparison to non-
technical textiles. A honing effect classically observed in dry fabric testing has also been pointed out
through cyclic experiments. It can be attributed to both fibre material abrasion and fibre reorganisation
inside the yarn.
1 Introduction
The use of fibre reinforced composites in various industries and especially in the
transportation area is increasing because lighter complex shaped parts can be manufactured.
Processes of the LCM (Liquid Composite Moulding) family, such as RTM (Resin Transfer Moulding),
can be considered to elaborate such parts. The first step of the process consists in draping a dry
preform before liquid resin is injected. The preforming stage is a delicate phase. Indeed, the
mechanisms involved during this stage are complex, very different from those occurring during the
stamping of metallic sheets, and are far from being fully understood [1]. Among the strategies that can
be used to optimise LCM processes, finite element forming simulation is one of the most promising.
Many methods have been proposed recently to achieve representative sheet forming simulations for

one layer of dry or thermoplastic fabric, through different types of finite elements (trusses, shells,
membrane elements), with continuous, discrete or semi-discrete approaches [2-9]. Several key entry
parameters for the simulation models need to be determined. The mechanical properties of a fabric ply
have been widely studied [10-20], and many teams are still working on this topic to refine the
knowledge of the composite community. However, in addition to the ply properties, the fabric/tool
contacts and, when dealing with multi-ply forming, the fabric/fabric contact have to be studied and
modelled. Concerning composite reinforcements, the tool/fabric contact and, to a lower extent, the
yarn/yarn contact have been investigated by different authors, for carbon fibre reinforced
thermoplastics or dry fabrics [21-27].
Accurate models of both the ply mechanical properties and the tool/ply contact are crucial
when dealing with the forming of one dry ply. However, since composite parts are getting thicker,
several layers of fabric are used to manufacture them. Up to now, numerical studies carried out to
simulate the multi-layer forming of dry fabrics have used very approximate modelling of the contact
between layers. For instance, an approximate friction coefficient, which is independent from the yarns
angle, is used by Hamila et al. [9]. In addition, preliminary multi-layer forming tests confirmed the
significant influence of the relative positioning of the dry plies against one another [28]. This sensitivity
of the process to the layer stacking is clearly due to the contact between the layers. It reflects the
ability of two layers to glide one on the other during the sheet forming process. It is therefore
necessary to better understand the contact behaviour between the sheets of woven reinforcement
during that stage, in order to properly understand, optimize and model the first stage of the RTM
process.
Different studies concerning the forming of thermoplastic pre-impregnated reinforcements
have identified the mechanical phenomena involved during the sliding friction between two fabric plies
([29, 27, 22, 30] for example). They point out the influence of the orientation of the different layers.
They also come to the conclusion that this influence could be attributed to the friction variability ([30]).
Above all, these papers demonstrate that the friction taking place during the forming of CFRTP is
mainly a viscous friction. Consequently, models based on the fact that the viscous interlayer plays a
major role in the inter-ply and tool-ply slip are proposed for the tool/ply or ply/ply friction [3, 31, 32].
However, since the contact behaviour is mainly governed by the resin film leading to a viscous friction,

these results cannot be used to quantify and analyse the friction between dry fabrics. The CFRTP
models make it possible to study the influence of the yarns orientation and the contact pressure, but
the phenomena involved in dry fabric forming are expected to be different, as the fabric mesostructure
should have a much more significant influence on the contact behaviour between dry fabrics.
Moreover, the mesoscopic irregularities of the fabric surface combined with the more or less complex
weaving may lead to consider models with assumptions and parameters ignored in the classical
Coulomb’s approach for metallic materials. As a consequence, experiments concerning dry fabric
frictions at different scales need to be carried out.
Studies investigating dry fabric frictions can be found in the textile scientific community, [33-
42] and are among the most relevant over the past few years. However, the yarns are different from
those used in composite reinforcements, in terms of mechanical properties and geometry. Therefore, a
direct use of the textile results seems difficult, and a dedicated study concerning composite
reinforcement is necessary. The goal of this paper is then to propose an analysis of the contact
behaviour between two layers of different dry technical fabrics, using a specific device. This
equipment was designed to investigate fabric/metal and yarn/yarn frictions, but the main application
should concern the fabric/ fabric dry friction. After a short presentation of the device principles, first
results obtained on fabric/fabric contact will be given, demonstrating the potential of the device for the
study of fabric/fabric friction.
2 Description of the device
2.1 DEVICE PRINCIPLES
During the forming of multi-ply composite reinforcements, and particularly for curved parts, the dry
fabric plies glide on each other, especially when the plies are oriented in different directions. The
sliding movement is therefore an important factor to understand, in order to improve the process
parameters or simulate it accurately. Since only few studies concerning the friction of composite dry
fabrics have been performed, the mechanical phenomena involved during the contact between two
layers of fabrics are not really known and understood. It is therefore highly necessary to start with
experimental observations. When considering experimental investigations on dry fabric frictions,

various mesoscopic heterogeneities should be considered, due to the interlacement of yarns which
width and thickness have a milimeter order of magnitude . In addition, very different unit cell sizes and
anisotropy also have to be dealt with. This suggests that specific experimental equipment should be
considered to take into account these specifications [10-19].
As mentioned in the introduction, the influence of the relative orientation between the plies implies that
the displacement direction according to the yarns orientation should be controlled very accurately .
Finally, a simple Coulomb friction coefficient is not expected to take into account the physical
phenomena involved. The parameters influencing the friction coefficient should lead to a specific
behaviour.
Considering all these constraints, the classical principle consisting in two plane surfaces sliding on
each other is considered to be the most promising for this study. This principle has besides been
chosen by most of the teams working on fabric friction ([43, 35, 44, 22, 45, 36, 40, 24], for instance).
The device proposed here consists in a moving sample (the bottom one) sliding horizontally in a
specified direction, at a determinate and adjustable speed, on a fixed top sample (Figure 1). The top
sample is fixed and linked to the ground through a load sensor and different joints that will be detailed
hereafter. The load sensor measures the tangential loads induced by the contact reaction.
This experimental principle is very simple and directly related to the interply sliding during forming.
However, the main difficulty with plane/plane measurements is to ensure a full plane/plane contact
with a uniform loading. This point is essential as the mesoscopic heterogeneities are expected to be
very sensitive to this defect and the measured values may be consequently affected. Different
strategies can be considered to get a uniform pressure distribution. Applying a resultant load (through
a cylinder for instance) on one or both samples (through its support) could be efficient but would
impose either a complex and expensive design or an expensive precise manufacturing [22].
Furthermore, these techniques are all the less indicated for our application that a finite vertical
movement of the sample due to the mesoscopic heterogeneity of the weaving will probably be
observed during the tests. Among the existing solutions, the use of gravity seems to be the simplest
because a constant pressure distribution on the whole area of the sample can be obtained through a
clever mass distribution of the unit (support + sample), and an horizontal positioning of the two units is

relatively easy to realise. However, since dynamic measurements are considered, it is necessary to
apply a constant accurate load, and a specific procedure is proposed in the following section.
The kinematical scheme of the retained solution is presented in Figure 2. The bottom sample is rigidly
and accurately guided by a linear system in order to translate horizontally in a fixed direction.
The upper steel plate, supporting the tested sample, is linked to the load sensor using two classical
balls joints, so that the sample remains in a plane positioning and transmits nothing but the
longitudinal load to be measured (Figure 2Figure 17). Furthermore, the sensor is consequently
protected against accidental torques.
The lateral positioning of the upper sample is ensured by a linear joint. The linear joint (Figure 2Figure
17) is obtained with two rollers rolling on two vertical plates. The functional play in this connection
enables a little rotation around axis x in order to respect the preponderant plane positioning. Indeed,
the top sample (i.e. support + sample) lays freely upon the horizontal bottom sample. The sample is
only guided laterally in the horizontal direction, in order to ensure that a plane contact is respected.
2.2 PRESSURE DISTRIBUTION DURING MEASUREMENTS
2.2.1 PROBLEM AND PROPOSED SOLUTION
The previously exposed principle theoretically makes it possible to obtain a static equi-distribution of
the pressure, but it has to remain so during measurements. Locally, an equi-distribution of the
pressure is much more difficult to achieve, because of all the mechanical phenomena involved.
Several assumptions need to be taken into account:
- the lower plane is perfectly horizontal, the tangential loads and displacement take place along
direction x.
- inertia effects are neglected since a constant speed is used during the measurements
- If C is the centre of the contact surface, R one possible centre of the joint local coordinate
system of the linear joint, G the centre of mass of the upper sample unit and S is the centre of
the ball joint (Figure 3), the loads exerted on the top sample can be modelled as follows:

Contact with the bottom sample:
, Nc is the normal
load, Tc the tangential (friction) load and Mc is the torque due to the possible non
uniform pressure distribution (Figure 3).
(1)
Load exerted by the load sensor
with (2)
Load exerted by the linear joint (to avoid any spurious z displacement)
with (3)
Weight of the unit support + sample:
with
(4)
The moment balancing along direction x at point C (Figure 3) can then be written as follows:
(5)
If the centre of mass is supposed to be at the vertical of the centre of the contact surface C, then we
obtain:
(6)
During sliding, tangential loads appear therefore (Figure 3):
(7)
If the contact torque at the centre C of the contact area cannot be neglected. The load
distribution is consequently no more homogeneous. In order to avoid this unwished torque,
could be imposed, i.e. S has to be located in the contact plane. But since fabric thicknesses vary in a
wide range depending on the yarn and the weaving type (from thin 2D fabrics to thick interlocks or 3D
fabrics), the height of the S point should be adjusted for each type of studied material. Another
approach consists in reducing the discrepancy induced by this phenomenon until it becomes negligible
with respect to the accuracy the user is looking for. Indeed, this spurious torque can be balanced by a
slight displacement of the centre of mass. The centre of mass displacement can be expressed using
the coordinate xG of the real centre of mass. In order to obtain , back to equation (5) written in
the case xG≠0, the centre of gravity has to be located at the abscissa with
(8)
A correct positioning of the centre of gravity of the upper sled can theoretically enable a correct equi
distribution of the pressure. Nevertheless, the real time positioning of this centre of gravity is not
possible. Therefore, in order to control the variations involved during the test (variations in the friction
coefficient, in the sample altitude,…), the sensitivity of the pressure repartition to parameter variations
( , , ) shall be studied. An experimental validation is also conducted to confirm the stability of the
test.
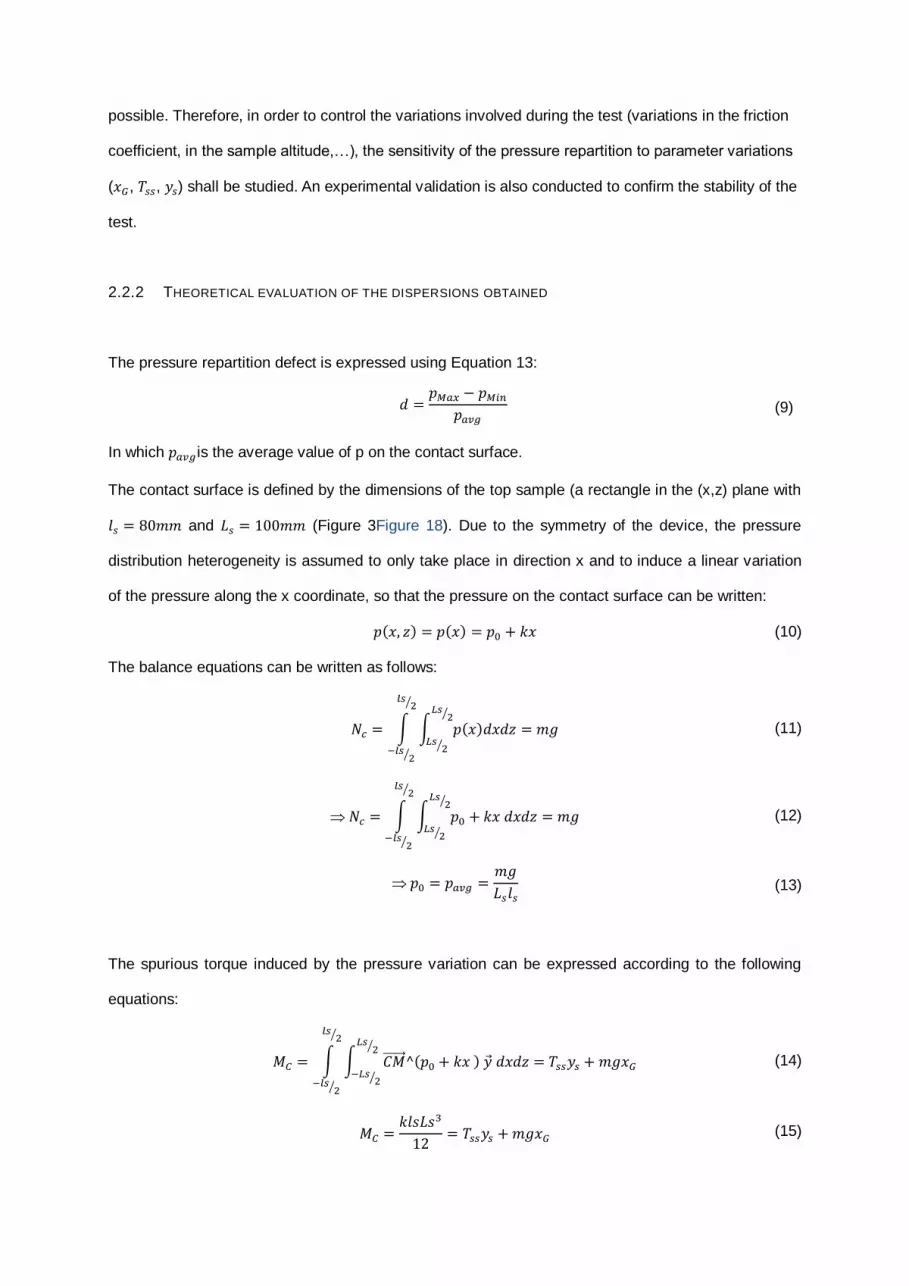
2.2.2 THEORETICAL EVALUATION OF THE DISPERSIONS OBTAINED
The pressure repartition defect is expressed using Equation 13:
(9)
In which is the average value of p on the contact surface.
The contact surface is defined by the dimensions of the top sample (a rectangle in the (x,z) plane with
and (Figure 3Figure 18). Due to the symmetry of the device, the pressure
distribution heterogeneity is assumed to only take place in direction x and to induce a linear variation
of the pressure along the x coordinate, so that the pressure on the contact surface can be written:
(10)
The balance equations can be written as follows:
(11)
(12)
(13)
The spurious torque induced by the pressure variation can be expressed according to the following
equations:
(14)
(15)

(16)
As a consequence, the pressure repartition can be given by:
(17)
(18)
All test parameters being fixed, a coefficient µ can be introduced.
(19)
So the pressure repartition defect is expressed using Equation 24:
(20)
The acceptable value admitted for d in this work for such type of measurement in the field of dry
fabrics is ±5%. A better accuracy cannot reasonably be expected, considering the dispersions between
the different unit cells of the same fabric. Thus the following relationship is obtained:
(21)
In order to stay within the 10% deviation of the pressure dispersion, relation (25) has to be validated.
As an example, assuming a careful positioning of the centre of gravity at the initial state, this defect
can be majored by 0.2 mm and a maximum variation of µ between 0 and 1 can be observed. The
acceptable deviation for ys is really reasonable
(22)
As a conclusion, the proposed design is capable of responding to the pressure repartition needed.
With a good estimation of the average friction coefficient and the average y position of the contact
surface (obtained with a first test for instance), the centre of mass can be placed accurately enough.
This has been verified by a sensitivity study on metallic, polymers and woven materials.

2.3 TECHNOLOGICAL OVERVIEW
The device designed according to the principles detailed in the previous sections is presented on
Figure 4. The bottom sample (Figure 5) is clamped by screws on a PVC plate on a 60 cm long and 9
cm wide steel plate (Figure 6). The sample is manually tensed a little so that it does not wrinkle; the
amount of tension introduced is therefore low enough to be neglected, especially when considering
the high amount of tension that can be undergone by dry fabrics.
A brushless motor and an electronic speed controller linked via an Oldham joint to a ball screw/bold
system (Figure 6) is used to imposed the displacement of the steel plate. This enables to obtain a
speed variation from 0 to 100 mm/s with a 50 cm displacement range. These values have been
chosen in reference to the classical speed values used for the measurement of friction coefficients in
both textiles and composite materials. This speed range also matches the velocities involved during
the composite forming processes.
The velocity ramp is piloted to avoid dynamic effects, especially at high speed ranges. The velocity
profile can be adjusted depending on the required steady state velocity. The velocity profile
theoretically obtained is governed by equation (1).
(23)
The top sample (Figure 7) is clamped on a 10 cm long and 8 cm wide steel plate. The tangential load
is measured through an FGP FN3148 50 N capacity sensor. It is calibrated and used in the 0-20N
range in order to get a fully acceptable 0.01N accuracy.
A rubber damper and a low pass filter (25Hz to 100Hz) chosen in match with the natural frequencies of
the different elements limit the vibrations and enable a smoother signal without interfering with the
steady state measurement. A Burster Digiforce acquisition system is used to record up to 4000
measurements at a frequency of up to 5000 Hz, which is convenient for our application.

2.4 DEVICE VALIDATION
The device has been validated on a steel/steel friction at different speeds (0.5, 1.5, 6 cm/sec) and
normal loads (7.4, 17.2 and 24.5 N). The steel considered is C48 with no resurfacing and lubrication.
The average steady state coefficient of friction (that is targeted by this study) obtained with these tests
is about 0.1900.008, which is in good correlation with results found in the literature and has a good
repeatability (±5%) in the range of what was expected.
3 Dry fabric/Dry fabric friction
3.1 MATERIALS TESTED
Three different woven fabrics with different architectures have been used for this first experimental
study (Figure 8): two glass plain weave fabrics and a carbon twill weave. The first glass plain weave is
a 0.6 mm thick Tissa+ glass plain weave. The yarns have a width of 1.1 mm and an average spacing
of 2.3 mm between each other. The second material tested in this work is a 0.75 thick “balanced” glass
plain weave, with 3.7 mm wide yarns and a 5 mm average spacing between weft yarns and 4.5 mm
spacing between warp yarns. The carbon twill weave is the Hexcel G986. It has an areal weight of
285g/m² and is constituted of HTA 5131 6K yarns. The Average yarn width is 1.68 mm (~ 1.6 mm for
warp, ~ 1.8 mm for weft). The average yarns spacing is 2.92 mm (~ 2.91 mm for warp, ~ 2.93 for
weft).
3.2 PRELIMINARY RESULTS ON ONE COUPLE OF PLAIN WEAVE SAMPLES
3.2.1 FRICTION LOADS AND COULOMB FRICTION COEFFICIENT
After preliminary tests, a 5 mm/s displacement speed is chosen for the bottom sample. A
15 ms acquisition period is considered to distinguish the frequencies of the different physical
phenomena taking place during the measurement. One couple of samples of the first glass plain
weave has been submitted to a 10 cycle test with a 0.7 s tempo and a normal force of 10N. The
acquisition of 4000 points leads to a test duration of 60s and 30cm gliding between the two samples.
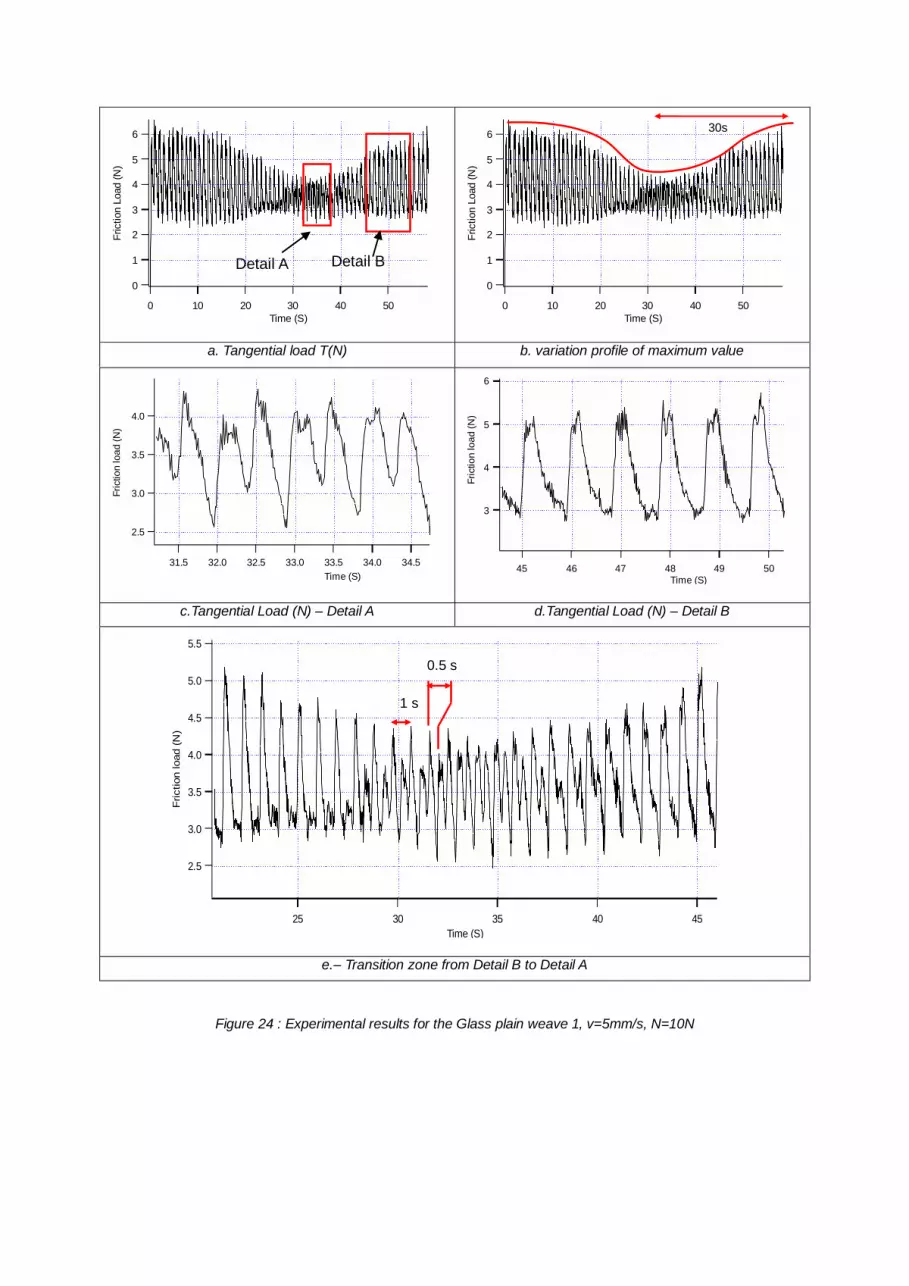
Figure 9 shows the results obtained.
As expected, the tangential load, measured when the steady state is reached, is far from being
constant. This conclusion is relatively similar to what has been observed in the different publications
cited in the previous sections concerning textiles. Nevertheless, the magnitude of the variations is
much higher. The tangential load varies from 2 to 6 N with an average value of about 3.8 N, and a
variation with respect to the average value greater than 50%. Consequently, the difference between
the responses obtained for composite, thermoplastic materials, garment textiles and technical dry
fabrics appears to be significant.
A more accurate analysis of the response enables us to distinguish three characteristic pseudo
periods. The first one depicts the undulation of the local maximum values (Figure 9.b). Even if its value
is not so easy to quantify, this first period can be approximately evaluated and is equal to about
T1=60s. Local minimum values are not submitted to the same type of undulation as the maximum
values, and their magnitude is much smaller. A representative period does not appear so clearly, the
lack of symmetry is noticeable. The second period is associated to the interval between two maximum
load values when the response magnitude is the highest (6N, Figure 9Figure 24.a, Figure 9Figure
24.d). Its value is about T2=1s. The third one is the duration separating two maximum load values
when the response magnitude is the lowest (4N, Figure 9Figure 24.a, Figure 9.c).Its value is about
T3=0.5s. Figure 9.e, depicts the transition between zone A and B.
This preliminary analysis of the first results directly issued from the device reveals a very specific
fabric/fabric contact behaviour. The nature of the signals, the amount and the frequencies of the
variations are very different from those obtained through tests on metallic, thermoplastic or textile
fabrics.
Coulomb’s theory is undoubtedly not the best to depict fabric/fabric friction. For complex surfaces such
as dry fabrics, the contact behaviour cannot be brought back to a simple variation of a friction
coefficient. As will be shown in the next sections, different physical phenomena may occur that are not
directly linked to what is classically associated with the friction coefficient. However, a “pseudo” friction
coefficient µ(t) can be introduced according to Coulomb’s model, in order to make the results
independent from the normal load and to compare the different materials studied in this work. To our
knowledge, all the macro-scale forming simulations on dry fabrics consider up to now a single average
friction coefficient. It is then interesting to get this average coefficient from our own results, even if we

intend to show that it is far from being enough to correctly represent the complexity of the contact
behaviour between dry fabrics.
(24)
(25)
Results will often be expressed giving this friction coefficient, as the friction coefficient follows the
same variations as the tangential load (Figure 10).
3.2.2 CYCLING
Cycling results are presented on Figure 11 for this first couple of samples. A grinding effect is
observed: the average friction load and standard deviation tend to decrease and then converge toward
an asymptotic value. This effect can be attributed to the abrasion of the material itself but also to fibre
reorganisations under contact loads. This phenomenon is not surprising because it is classically
encountered in dry reinforcements fabric testing, whatever the type of solicitation applied (shear,
biaxial, bending,…). Consequently, the number of cycles has to be taken into consideration when
looking at the friction results. Two particular values are more interesting: the first cycle and the
asymptotic ones. The first because it is the one that is mainly encountered in the multi-layer forming
process and the asymptotic value because it makes it possible to perform many tests without replacing
the samples.
The influence of the number of cycles is confirmed by the results obtained for the carbon twill weave
fabric (Figure 12Figure 27.c,d) and for the second glass plain weave (Figure 12Figure 27.a,b). The
higher amount of discrepancies observed for the latest material is due to the weak cohesion of the
fibres inside the yarns and to the weak cohesion of the yarns within the fabric. Nevertheless, the
average friction coefficient and standard deviation values are as expected decreasing as a function of
the increase in the number of cycles.
3.2.3 REPEATABILITY
Other couples of samples of the same Tissa+ glass plain weave fabric have been tested in the same
conditions in order to investigate repeatability. The results for two of them are presented on Figure
13a. is representative of what was observed for most of the couples of samples. A comparison with

the results of the preliminary test on Figure 9 indicates that frequencies and magnitudes previously
observed in detail A and detail B (Figure 9) are consistent. However, the time-tagged of each of them
corresponding to the previously identified period T1 can be significantly different. Figure 13.b shows
the extreme case for which only the highest frequency response is observed. The value of period T3 is
consistent with the ones obtained for the two other samples but periods T1 and T2 are different from
the corresponding periods identified on all the other couples of samples. Because this phenomenon
did not appear during the cycling tests it is supposed that this observation is due to the samples
positioning in direct relationship with the meso architecture.
3.3 ANALYSIS OF PRELIMINARY RESULTS
At a 0.5 cm/S speed, the two main periods measured in section 3.2.1 respectively represent 2.5mm
and 5mm, i.e. values very close to the yarn spacing and twice as big as the yarn spacing. This relation
is confirmed by the results of the second glass plain weave and will be investigated further through
experiments on other weavings as part of further research. Figure 14 presents an example of results
obtained for the second Glass plain weave. They confirm the contact behaviour obtained and the
consistency between the period values and the geometrical parameters (weft yarns spacing: 5mm).
Average signal periods expressed in millimeters: and .
The periods found in the friction response therefore seem to be associated to the meso geometrical
parameters of the fabric. This influence can easily be explained through a simple
geometrical analysis illustrated on Figure 15.
If the two samples are perfectly superimposed, the highest zone of the bottom layer encounters the
lower zone of the upper sample. The contact consists in the superposition of yarn/yarn sliding friction
and shocks between the transverse yarns of each sample at the same time everywhere on the sample
width (Figure 15Figure 15), at each period of the unit cell. Consequently, high maximum friction value
and variations are observed. This phenomenon is representative of zone B on Figure 9 and Figure 14.
This perfectly explains why the non-technical fabrics with lower crimp and thinner yarns are submitted
to lower magnitude variations. Shocks are indeed all the more significant that the crimp is high and the
yarns are thick.
On the contrary, if the samples are shifted of half a geometrical period (Figure 15), the highest zone of

the bottom layer never impacts the lowest zone of the top layer. This time, the configuration is
repeated every half geometrical period and the impact is lower. This therefore leads to lower maximum
friction values, lower variations and a signal period value of half the geometrical one. This corresponds
to zone A on Figure 9 and Figure 14. Between the two extreme shifts, the signal is a combination of
these two contact morphologies, depending on the actual shift between the two samples.
The results obtained on Figure 9 and Figure 14 are therefore due to the modification of the relative
displacement between the two samples along the stroke. This displacement is the consequence of the
play in the linear joint (between the two plates and the roller), to ensure the preponderant plane
positioning between the two samples, and of the difficulty to perfectly align all the yarns of two
samples of dry fabrics. Thus, depending on the initial positioning of each sample (shift, angle), there
can be more or less relative displacement between the two samples at different location along the
samples. Since these first tests, the play has been a little bit reduced so that this phenomenon is
reduced.
4 Conclusion
A specific device has been developed to characterise the contact behaviour between two layers of
woven fabrics. The knowledge of the contact behaviour between layers of woven fabrics is of
particular importance when multiply forming is concerned. The device appeared to be well adapted to
investigate fabric friction. Preliminary results have been presented. A honing effect classically
observed in dry fabric testing has also been pointed out through cyclic experiments. It can be
attributed to both fibre material abrasion and fibre reorganisation inside the yarns.
As expected, a specific contact behaviour is observed for dry reinforcement fabrics in comparison to
non-technical textiles (garments,…), yarn/yarn or fabric/metal friction. Particularly, the variations of the
contact tangential loads can be very substantial, all test parameters remaining constant. The large
amplitude of friction can undoubtedly be explained by the meso architecture of dry fabrics, and
especially by the contact between the parallel yarns of the two samples. An intensive analysis with
higher sampling frequencies and more complex weavings (interlocks,…) is in progress, in order to help
analyse this phenomenon more accurately.
Consequently, using an average friction coefficient will lead to a high amount of uncertainties in the
mechanical analysis of these materials. Particularly, the variations of the friction load magnitude

should be considered when trying to optimise multiply forming. The evolution of the relative orientation
of the yarns of each ply may result in high variations of the tangential friction forces. This can also lead
to manufacturing defaults, such as unweaving or wrinkles. Up to now, finite element codes predicting
the forming behaviour of woven reinforcement fabrics do not take into account the evolution of this
friction coefficient to accurately model the process. This point should therefore be addressed in future
works on this topic with the view of optimising the multiply forming of complex shaped composite parts.
Some interesting conclusions have already been obtained, but this device will furthermore make it
possible to perform an extensive experimental campaign, so the fabric/fabric contact behaviour can be
fully understood and modelled.

[1] Soulat D. Wendling A. Chatel S. Hivet G., Allaoui S. Analysis of woven reinforcement
preforming using an experimental approach. In ICCM-17, 17th International Conference on Composite
Materials., Edinburgh International Convention Centre (EICC), Edinburgh, UK, 27 Jul-31 Jul 2009.
[2] A.K. Pickett, T. Queckbörner, P. De Luca, and E. Haug. An explicit finite element solution for
the forming prediction of continuous fibre-reinforced thermoplastic sheets. Composites Manufacturing,
6(3-4):237–243, 1995.
[3] K. Vanclooster, S. Lomov, and I. Verpoest. Simulation of multi-layered composites forming.
International Journal of Material Forming, 3:695–698, 2010. 10.1007/s12289-010-0865-2.
[4] R.H.W. ten Thije, R. Akkerman, and J. Huétink. Large deformation simulation of anisotropic
material using an updated lagrangian finite element method. Computer Methods in Applied Mechanics
and Engineering, 196(33-34):3141–3150, July 2007.
[5] X.Q. Peng and J. Cao. A continuum mechanics-based non-orthogonal constitutive model for
woven composite fabrics. Composites Part A: Applied Science and Manufacturing, 36(6):859–874,
June 2005.
[6] B. Ben Boubaker, B. Haussy, and J.F. Ganghoffer. Discrete models of woven structures.
macroscopic approach. Composites Part B: Engineering, 38(4):498 – 505, 2007.
[7] David Jauffres, James Sherwood, Corey Morris, and Julie Chen. Discrete mesoscopic
modeling for the simulation of woven-fabric reinforcement forming. International Journal of Material
Forming, 3:1205–1216, 2010. 10.1007/s12289-009-0646-y.
[8] G. Creech and A. Pickett. Meso-modelling of non-crimp fabric composites for coupled drape
and failure analysis. Journal of Materials Science, 41:6725–6736, 2006. 10.1007/s10853-006-0213-6.
[9] Nahiene Hamila and Philippe Boisse. A meso macro three node finite element for draping of
textile composite preforms. Applied Composite Materials, 14:235–250, 2007. 10.1007/s10443-007-
9043-1.
[10] S.V. Lomov and I. Verpoest. Model of shear of woven fabric and parametric description of
shear resistance of glass woven reinforcements. Composites Science and Technology, 66(7-8):919–
933, June 2006.
[11] J. Launay, G. Hivet, A.V. Duong, and P. Boisse. Experimental analysis of the influence of
tensions on in plane shear behaviour of woven composite reinforcements. Composites Science and

Technology, 68(2):506–515, February 2008.
[12] P. Boisse, A. Gasser, and G. Hivet. Analyses of fabric tensile behaviour: determination of the
biaxial tension-strain surfaces and their use in forming simulations. Composites Part A: Applied
Science and Manufacturing, 32(10):1395–1414, October 2001.
[13] E. de Bilbao, G. Soulat, D. Launay, J. Hivet, and A. Gasser. Experimental study of bending
behaviour of reinforcements. Experimental Mechanics, 50(3):333–351, 2010.
[14] J. Cao, R. Akkerman, P. Boisse, J. Chen, H.S. Cheng, E.F. de Graaf, J.L. Gorczyca,
P. Harrison, G. Hivet, J. Launay, W. Lee, L. Liu, S.V. Lomov, A. Long, E. de Luycker, F. Morestin,
J. Padvoiskis, X.Q. Peng, J. Sherwood, Tz. Stoilova, X.M. Tao, I. Verpoest, A. Willems, J. Wiggers,
T.X. Yu, and B. Zhu. Characterization of mechanical behavior of woven fabrics: Experimental methods
and benchmark results. Composites Part A: Applied Science and Manufacturing, 39(6):1037–1053,
June 2008.
[15] A. Willems, S.V. Lomov, I. Verpoest, and D. Vandepitte. Optical strain fileds in shear and
tensile testing of textile reinforcements. Composites Science and Technology, 68:807–819, 2008.
[16] T. M. McBride and Julie Chen. Unit-cell geometry in plain-weave fabrics during shear
deformations. Composites Science and Technology, 57(3):345–351, 1997.
[17] J. Wang, J. R. Page, and R. Paton. Experimental investigation of the draping properties of
reinforcement fabrics. Composites Science and Technology, 58(2):229 – 237, 1998. Australasian
Special Issue on Manufacturing Processes and Mechanical Properties Characterisation of Advanced
Composites.
[18] Wiggers J. Harrison, P. and A.C. Long. Normalisation of shear test data for rate-independent
compressible fabrics. Journal of Composite Materials, 42(22):2315–2343, 2008.
[19] Gilbert Lebrun, Martin N. Bureau, and Johanne Denault. Evaluation of bias-extension and
picture-frame test methods for the measurement of intraply shear properties of pp/glass commingled
fabrics. Composite Structures, 61(4):341–352, September 2003.
[20] P. Badel, E. Vidal-Sallé, and P. Boisse. Computational determination of in-plane shear
mechanical behaviour of textile composite reinforcements. Computational Materials Science,
40(4):439–448, October 2007.
[21] Bilel Ben Boubaker, Bernard Haussy, and Jean-François Ganghoffer. Discrete woven structure
model: yarn-on-yarn friction. Comptes Rendus Mécanique, 335(3):150 – 158, 2007.

[22] R. H. W. ten Thije and R. Akkerman. Design of an experimental setup to measure tool-ply and
ply-ply friction in thermoplastic laminates. International Journal of Material Forming, 2:197–200, 2009.
[23] S. Rebouillat. Tribological properties of woven para-aramid fabrics and their constituent yarns.
Journal of Materials Science, 33:3293–3301, 1998. 10.1023/A:1013225027778.
[24] Jennifer L. Gorczyca, James A. Sherwood, Lu Liu, and Julie Chen. Modeling of friction and
shear in thermostamping of composites - part i. Journal of Composite Materials, 38(21):1911–1929,
2004.
[25] Lu Liu, Julie Chen, Jennifer L. Gorczyca, and James A. Sherwood. Modeling of friction and
shear in thermostamping of composites - part ii. Journal of Composite Materials, 38(21):1931–1947,
2004.
[26] Ben Nadler and David J. Steigmann. A model for frictional slip in woven fabrics. Comptes
Rendus Mecanique, 331(12):797 – 804, 2003.
[27] Gilbert Lebrun, Martin N. Bureau, and Johanne Denault. Thermoforming-stamping of
continuous glass fiber/polypropylene composites: Interlaminar and tool laminate shear properties.
Journal of Thermoplastic Composite Materials, 17(2):137–165, 2004.
[28] A. Wendling D. Soulat S. Chatel S. Allaoui, G. Hivet. Experimental approach for optimizing dry
fabric formability. In 14th European Conference on Composite Materials, Budapest, Hungary, 7-10
june 2010.
[29] Mallon PJ. Murtagh AM, Monaghan MR. Investigation of the interply slip process in continuous
fibre thermoplastic composites. In Proceedings of ICCM-9, Madrid, Spain, page 311–318., 1994.
[30] K. Vanclooster, S. Van Goidsenhoven, S. Lomov, and I. Verpoest. Optimizing the deepdrawing
of multilayered woven fabric composites. International Journal of Material Forming, 2:153–156, 2009.
10.1007/s12289-009-0522-9.
[31] R. ten Thije, R. Akkerman, L. van der Meer, and M. Ubbink. Tool-ply friction in thermoplastic
composite forming. International Journal of Material Forming, 1:953–956, 2008. 10.1007/s12289-008-
0215-9.
[32] Jennifer L. Gorczyca-Cole, James A. Sherwood, and Julie Chen. A friction model for
thermostamping commingled glass-polypropylene woven fabrics. Composites Part A: Applied Science
and Manufacturing, 38(2):393 – 406, 2007.
[33] J. O. Ajayi, H. M. Elder, E. G. Kolawole, K. A. Bello, and M. U. Darma. Resolution of the stick-

slip friction traces of fabrics. Journal of the Textile Institute, 86(4):600–609, 1995.
[34] J. O. Ajayi and H. M. Elder. Fabric friction, handle, and compression. Journal of the Textile
Institute, 88(3):232–241, 1997.
[35] A. A. A. Jeddi, S. Shams, H. Nosraty, and A. Sarsharzadeh. Relations between fabric structure
and friction: Part i: Woven fabrics. Journal of the Textile Institute, 94(3):223–234, 2003.
[36] P. M. Taylor and D. M. Pollet. The low-force frictional characteristics of fabrics against
engineering surfaces. Journal of the Textile Institute, 91(1):1–15, 2000.
[37] J. P. P. Marcicano, C. C. Tu, and H. G. Rylander. Measurement of the transverse yarn-on-solid
coefficient of friction. Journal of the Textile Institute, 95(1):349–357, 2004.
[38] USA B S Gupta, NCSU, editor. Friction in textile materials. Woodhead Publishing Limited,
2008.
[39] Bhupender S. Gupta and Yehia E. El Mogahzy. Friction in fibrous materials part i: Structural
model. Textile Research Journal, 61(9):547–555, 1991.
[40] Luis Virto and Arun Naik. Frictional behavior of textile fabrics : Part ii dynamic response for
sliding friction. Textile Research Journal, 70(3):256–260, 2000.
[41] Mario Lima, Rosa M. Vasconcelos, Luis F Silva, and Joana Cunha. Fabrics made from non-
conventional blends: What can we expect from them related to frictional properties? Textile Research
Journal, 79(4):337–342, 2009.
[42] A.D. Vickers, D.G. Beale, Y.T. Wang, and S. Adanur. Analyzing yarn-to-surface friction with
data acquisition and digital imaging techniques. Textile Research Journal, 70(1):36–43, 2000.
[43] Adrian M. Murtagh, John J. Lennon, and Patrick J. Mallon. Surface friction effects related to
pressforming of continuous fibre thermoplastic composites. Composites Manufacturing, 6(3-4):169 –
175, 1995. 3rd International Conference on Flow Processes in Composite Materials 94.
[44] O.J Ajayi. Fabric smoothness, friction, and handle. Textile research journal, 62(1):52–59, 1992.
[45] K. Vanclooster, S. Lomov, and I. Verpoest. Investigation of interply shear in composite forming.
International Journal of Material Forming, 1:957–960, 2008. 10.1007/s12289-008-0216-8.

Figures:
Figure 1: Scheme of the device
Figure 2 : Kinematical scheme of the device (Top view)
Figure 3 : Geometrical parameters and points location
Figure 4 : External view of the friction device
Figure 5 : Top and Bottom glass plain weave sample
Figure 6 : External view of the bottom unit
Figure 7 : External view of the top unit of the device
Figure 8 : Fabrics used for fabric/fabric friction
Figure 9 : Experimental results for the Glass plain weave 1, v=0.5cm/s, N=10N
Figure 10 : Experimental time depending on average friction coefficient for the Glass plain weave 1,
v=0.5cm/s, N=10N.
Figure 11 : Average friction coefficient and standard deviation as a function of the number of cycles for
a couple of the first glass plain weave samples, v=5mm/s, N=10N.
Figure 12 : Average friction coefficient in function of the number of cycle for the 2nd
glass plain weave
(a., b.) and the carbon twill weave (c.,d.) .
Figure 13 : Friction coefficient results for another 2 samples identical to glass plain weave 1.
Figure 14 : Results for a couple of samples of the second glass plain weave, a. tangential force response, b., c. Periods in length units for zone A and B.
Figure 15 : Samples relative lateral positioning

Figures :
V
Load
Sansor
N
Figure 16 Scheme of the device
screw
Lower
sampleupper
sampleLoad
sensor
Figure 17 : kinematical scheme of the device (Top view).

Figure 18 : Geometrical, force parameters and points location
Figure 19 : External view of the friction device.
R +
+S
G +C
C
+
+ G
x
z
y
xyG
+S
yS
+ +
Gy
x
+S
Tc
Nc
Tss
Mc
ZB
MB
+
xG
mg

a. Bottom sample b. Top sample
Figure 20 : Top and Bottom glass plain weave sample
a. External view of the bottom sled
b. External view of the power train c. External view of the linear guidance system
Figure 21 : external view of the bottom unit

a. External view of the top sample with the two rollers
b. External view of the link between sensor and top sample.
c. External view of the roller/plane contact
Figure 22 : external view of the top unit of the device
a. Glass plain Weave 1 b. Glass plain Weave 2 c. carbon twill 2*2 weave
Figure 23 : fabrics used for fabric/fabric friction
a. Tangential load T(N) b. variation profile of maximum value
c.Tangential Load (N) – Detail A d.Tangential Load (N) – Detail B
e.– Transition zone from Detail B to Detail A
Figure 24 : Experimental results for the Glass plain weave 1, v=5mm/s, N=10N
6
5
4
3
2
1
0
Friction L
oad (
N)
50403020100
Time (S)
6
5
4
3
2
1
0
Friction L
oad (
N)
50403020100
Time (S)
4.0
3.5
3.0
2.5
Fri
ction load (
N)
34.534.033.533.032.532.031.5
Time (S)
6
5
4
3
Fri
ctio
n lo
ad
(N
)
504948474645Time (S)
5.5
5.0
4.5
4.0
3.5
3.0
2.5
Friction load (
N)
4540353025
Time (S)
30s
Detail A Detail B
1 s
0.5 s

Figure 25 : Experimental time depending and average friction coefficient for the Glass plain weave 1, v=5mm/s, N=10N.
a. Average friction coefficient as a function of the number of cycles for the first glass plain weave.
b. standard deviation as a function of the number of cycles for the first glass plain weave.
Figure 26 : average friction coefficient and standard deviation as a function of the number of cycles for a couple of the first glass plain weave samples, v=5mm/s, N=10N.
0.6
0.5
0.4
0.3
0.2
0.1
0.0
Fri
ctio
n c
oe
ffic
ien
t
50403020100Time (S)
Average coef
0
0,05
0,1
0,15
0,2
0,25
0,3
0,35
0,4
0 2 4 6 8 10
Ave
rage
fric
tio
n c
oe
ffic
ien
t
Test number
0
0,005
0,01
0,015
0,02
0,025
0,03
0,035
0,04
0,045
0 2 4 6 8 10
Sta
nd
ard
devia
tio
n
Test number

a. Average friction coefficient as a function of the number of cycles for the second glass plain weave.
b. Standard deviation as a function of the number of cycles for the second glass plain weave.
c. Average friction coefficient as a function of the
number of cycles for the twill weave. d. Standard deviation as a function of the number of
cycles for the twill weave.
Figure 27 : Average friction coefficient as a function of the number of cycle for the 2
nd glass plain weave (a., b.)
and the carbon twill weave (c.,d.) .
a. Results of Couple 2 b. Results of Couple 3
Figure 28 : friction coefficient results for 2 other identical samples of the glass plain weave 1.
0
0,05
0,1
0,15
0,2
0,25
0 2 4 6 8 10
Ave
rage
fric
tio
n c
oe
ffic
ien
t
Test Number
0
0,01
0,02
0,03
0,04
0,05
0,06
0,07
0,08
0,09
0 2 4 6 8 10
Stan
dar
d d
evi
atio
n
Test Number
0
0,05
0,1
0,15
0,2
0,25
0,3
1 6 11 16 21 26 31 36 41 46 51
Avera
ge f
rictio
n c
oeff
icie
nt
Test number
0
0,002
0,004
0,006
0,008
0,01
0,012
0,014
1 6 11 16 21 26 31 36 41 46 51
Sta
nd
ard
devia
tio
n
Test number

a. Friction coefficient for a global test (4mm/s, 33Hz) in
length units
b. Friction coefficient for local test (4mm/s, 200Hz) for zone A in length units
c. Friction coefficient for local test (4mm/s, 200Hz) for zone B in length units
Figure 29 : Results for a couple of samples of the second glass plain weave, a. tangential force response, b, c. Periods in length units for zone A and B.
0.5
0.4
0.3
0.2
0.1
0.0
Friction c
oeff
icie
nt
4003002001000
Distance (mm)
Detail A Detail B
0.50
0.45
0.40
0.35
0.30
0.25
0.20
Friction c
oeff
icie
nt
180170160150140130
Distance (mm)
0.5
0.4
0.3
0.2
Friction c
oeff
icie
nt
390380370360350340
Distance (mm)
10 mm 5 mm

a. Superimposed samples
b. Shifted samples
Figure 30 Samples relative lateral positioning
Weft
Warp
2.3mm
Weft
Warp
4.6mm


