Embed Size (px)
Citation preview
Journal of Environment and Earth Science www.iiste.org
ISSN 2224-3216 (Paper) ISSN 2225-0948 (Online)
Vol.4, No.12, 2014
68
Solid Waste for Knit Fabric: Quantification and Ratio Analysis
Saiful Islam Tanvir* Engr. Md. Tarique Mahmood Lecturer and Adviser, Department of Apparel Manufacturing Management and Technology
Shanto-Mariam University of Creative Technology, Bangladesh *Corresponding E-mail: [email protected]
Abstract
The study analyses the solid waste in the knit apparel industry of Bangladesh and the exploitation of waste generated from different categories of input fabrics. It also explores the waste producing rate for the accumulated waste on daily or shift basis in the several sections in the knit apparel industry of Bangladesh, and the environmental collision for this. Nevertheless numerous issues are allied to the knit apparel industry of Bangladesh in terms of the congregated wastes, the study briefly analyses those issues with a prominence on management attempt. This study intends to provide an extensive study that covers the types of solid waste in the knit apparel industry, the differences of waste according to the several sections and the kind of industry. Thus the major research question that as explored is: “what are the solid waste substances and the producing rate inside the knit apparel industries?” Data collected from the knit industries by the intensive observations and following a semi structured open ended questionnaire. All the sources (primary and secondary) are justified and utilized with the progression of this study. Key words: Knit, Apparel, Fabric, Solid Waste, Compliance, Composite and Jhoot
1. Introduction
In Bangladesh businesses are growing at an ever fast rate. New businesses are opening everyday in every possible sector. Taking purchasing power parity into account Bangladesh is the 44th largest economy in the world. Bangladesh is also listed in the N-11 (next 11) by the Goldman Sachs Group, Inc. Among all the industries, at present textiles and readymade garments‟ industry are the top ones. Recently WTO has ranked Bangladesh as the 4th largest exporter of readymade garments‟ in the world. This sector contributes for 75% of foreign currency earning for Bangladesh. Textiles and Readymade Garments‟ sector contributes 13% of GDP (Habib Shah, 2012) and employs more than 3,000,000 people. It has bought benefit and blessings for millions of people in the country. This industry has played a significant role in elevating economic and living standard of millions of families all over the country. Environmental degradation due to unplanned waste disposal and improper waste range in the apparel industries’ areas were not the prime concern even a few decades ago in the developing countries like Bangladesh (Bhuiyan et al., 2003). This apparent disbelief in the dynamics and creativity of Bangladeshi RMG entrepreneurs seems to have sprung from the more general notion, widely held by many scholars during the 1970s and 1980s, that Bangladesh lacks entrepreneurial resources. But such changes can be made.
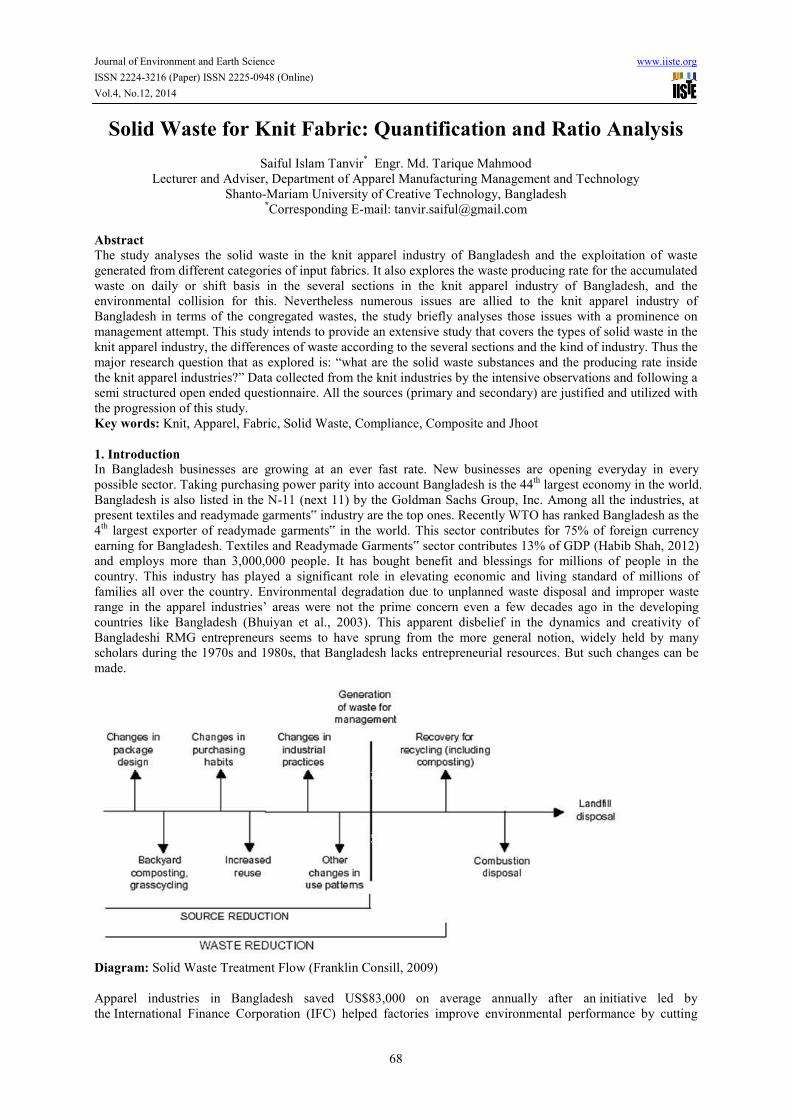
Diagram: Solid Waste Treatment Flow (Franklin Consill, 2009) Apparel industries in Bangladesh saved US$83,000 on average annually after an initiative led by the International Finance Corporation (IFC) helped factories improve environmental performance by cutting
Journal of Environment and Earth Science www.iiste.org
ISSN 2224-3216 (Paper) ISSN 2225-0948 (Online)
Vol.4, No.12, 2014
69
their water, energy and chemical consumption (BGMEA, 2014). Its cleaner-production initiative, which began in 2009, has now involved assessing more than 50 industries each for every section like knit, woven and sweater for resource efficiency upgrades, an IFC spokesman in Bangladesh told just-style (IFC-BD, 2013). It has only been in the very recent times, when certain NGOs started working and highlighting the pathetic state of apparel waste services provision in the country. Then the decision-makers began to realize the importance of this particular aspect of environmental management (Rahman et al., 2000). The study make an attempt to assess the existing solid waste management system of apparel industry and the environmental aspects associated with the current practice of final disposal of solid wastes. The study reveals that the uncollected wastes are dumped in open spaces and streets which clog the solid and rest waste managing system creating serious environmental degradation and health risks in the industrial outflow arena.
2. Literature Review
Knit fabric solid waste producing rate is comparatively higher and mostly contacted by the environment in the soil ground (Walmart Journal, 2013). Relatively comprehensive laws on solid waste handling do exist, but enforcement is hardly taking place and systematic disposal of different types of waste is rather limited. More than 11,200 tons of knit fabric solid waste is produced in Bangladesh each day (S. Bentall, 2012). In 2025 it is expected that the number will be 43,000 tons of solid waste and only a fraction of it will be systematically handled however, 60-72% of the knit industrial solid waste is untreated and pose a major potential for production of manure and ingredients etc. (Sara J. Kadolph, 2013). Despite legislation effluent and other fabric solid waste and untreated industrial solid waste products are often released directly to the environment or dumped without treatment at municipal landfills (Ministry of Foreign Affairs of Denmark, 2012-2013). However, with economy growth more and more focus is being placed on environmental and health risks and more companies are taking initiatives to install treatment plants or other measures. Nevertheless, the know-how and technical abilities of installing and handling knit industrial solid waste in Bangladesh is limited and market opportunities exists for almost all kinds of technologies that deals with knit industrial solid waste whether it is in regular knit, composite knit, compliance knit or other areas.
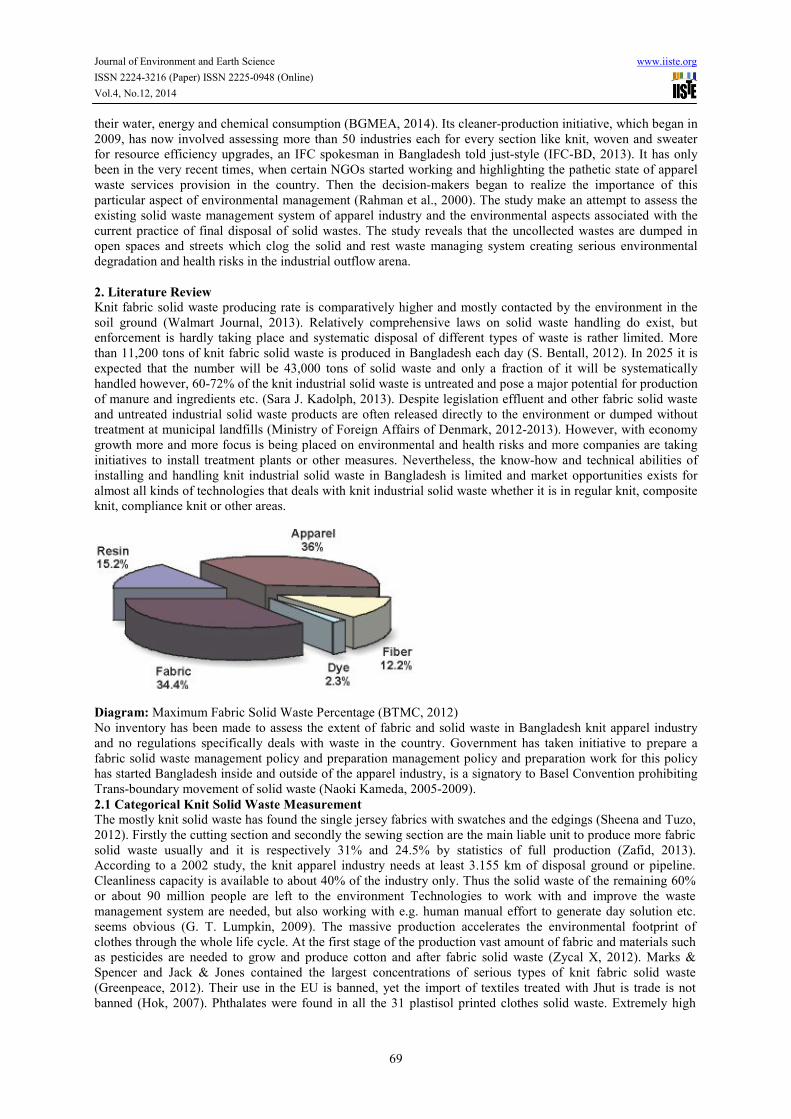
Diagram: Maximum Fabric Solid Waste Percentage (BTMC, 2012) No inventory has been made to assess the extent of fabric and solid waste in Bangladesh knit apparel industry and no regulations specifically deals with waste in the country. Government has taken initiative to prepare a fabric solid waste management policy and preparation management policy and preparation work for this policy has started Bangladesh inside and outside of the apparel industry, is a signatory to Basel Convention prohibiting Trans-boundary movement of solid waste (Naoki Kameda, 2005-2009).
2.1 Categorical Knit Solid Waste Measurement
The mostly knit solid waste has found the single jersey fabrics with swatches and the edgings (Sheena and Tuzo, 2012). Firstly the cutting section and secondly the sewing section are the main liable unit to produce more fabric solid waste usually and it is respectively 31% and 24.5% by statistics of full production (Zafid, 2013). According to a 2002 study, the knit apparel industry needs at least 3.155 km of disposal ground or pipeline. Cleanliness capacity is available to about 40% of the industry only. Thus the solid waste of the remaining 60% or about 90 million people are left to the environment Technologies to work with and improve the waste management system are needed, but also working with e.g. human manual effort to generate day solution etc. seems obvious (G. T. Lumpkin, 2009). The massive production accelerates the environmental footprint of clothes through the whole life cycle. At the first stage of the production vast amount of fabric and materials such as pesticides are needed to grow and produce cotton and after fabric solid waste (Zycal X, 2012). Marks & Spencer and Jack & Jones contained the largest concentrations of serious types of knit fabric solid waste (Greenpeace, 2012). Their use in the EU is banned, yet the import of textiles treated with Jhut is trade is not banned (Hok, 2007). Phthalates were found in all the 31 plastisol printed clothes solid waste. Extremely high
Journal of Environment and Earth Science
ISSN 2224-3216 (Paper) ISSN 2225-0948 (Online)
Vol.4, No.12, 2014
concentrations (up to 37.6% by weight) were found in 4 garmentVictoria’s Secret. In addition, the tests identified 5 industrial chemicals, which are “toxic” and falling knit fabric solid waste (Greenpeace, 2012).
2.2 Knit Solid Waste Configure
Export of any kind of solid waste requires Government permission Knowdisposing (selling) all kinds of solid waste or e.g. Egovernment knit apparel industries (Asib K. Ahmed, 2011), 1.600 clandestine knit heavy knit and 1.200 basic knit products (BKMEA, 2013) in Bangladesh Studies show that huge amount of knit fabric solid waste is generated from these and the waste generated is rising with the increasing population. Projection indicates that the solid waste generation would be 12,512 tons/ year by 2013 and 16,356 tons/year by 2017. According to Hines and Bruce (2001) the sustainably problems are highly visible in the world knit industry as it is the type of fashion which aims to motime to keep up with the current market trends and also emerging the solid waste usually.
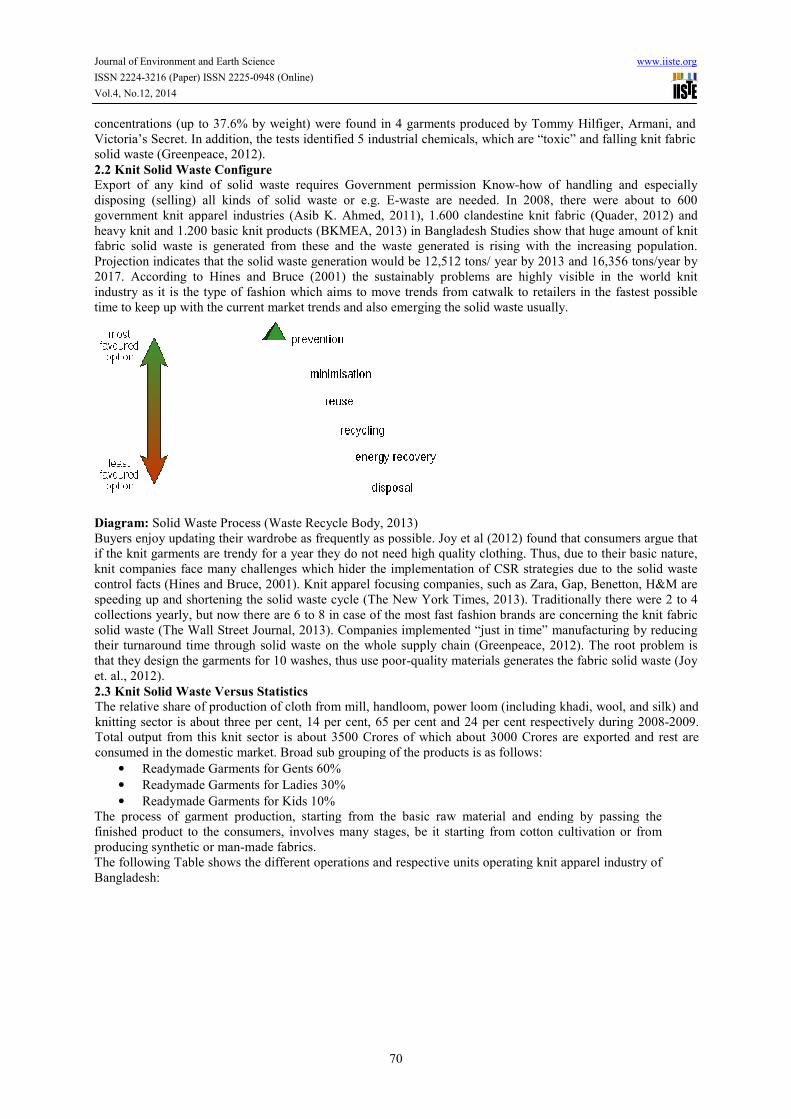
Diagram: Solid Waste Process (Waste Recycle Body, 2013)Buyers enjoy updating their wardrobe as frequently as possible. Joy et al (2012) found that consumers argue that if the knit garments are trendy for a year they do not need high quality clothing. Thus, due to their basic nature, knit companies face many challenges which hider the implementation of CSR strategies due to the solid waste control facts (Hines and Bruce, 2001). Knit apparel focusing companies, such as Zara, Gap, Benetton, H&M are speeding up and shortening the solid waste cycle (The New York Timcollections yearly, but now there are 6 to 8 in case of the most fast fashion brands are concerning the knit fabric solid waste (The Wall Street Journal, 2013). Companies implemented “just in time” manufacturing btheir turnaround time through solid waste on the whole supply chain (Greenpeace, 2012). The root problem is that they design the garments for 10 washes, thus use pooret. al., 2012).
2.3 Knit Solid Waste Versus Statistics
The relative share of production of cloth from mill, handloom, power loom (including khadi, wool, and silk) and knitting sector is about three per cent, 14 per cent, 65 per cent and 24 per cent respectively during 2008Total output from this knit sector is about 3500 Crores of which about 3000 Crores are exported and rest are consumed in the domestic market. Broad sub grouping of the products is as follows:
• Readymade Garments for Gents 60%
• Readymade Garments for Ladie
• Readymade Garments for Kids 10%The process of garment production, starting from the basic raw material and ending by passing the finished product to the consumers, involves many stages, be it starting from cotton cultivation or from producing synthetic or man-made fabrics. The following Table shows the different operations and respective units operating knit apparel industry of Bangladesh:
0948 (Online)
70
concentrations (up to 37.6% by weight) were found in 4 garments produced by Tommy Hilfiger, Armani, and Victoria’s Secret. In addition, the tests identified 5 industrial chemicals, which are “toxic” and falling knit fabric
e requires Government permission Know-how of handling and especially disposing (selling) all kinds of solid waste or e.g. E-waste are needed. In 2008, there were about to 600 government knit apparel industries (Asib K. Ahmed, 2011), 1.600 clandestine knit fabric (Quader, 2012) and heavy knit and 1.200 basic knit products (BKMEA, 2013) in Bangladesh Studies show that huge amount of knit fabric solid waste is generated from these and the waste generated is rising with the increasing population.
icates that the solid waste generation would be 12,512 tons/ year by 2013 and 16,356 tons/year by 2017. According to Hines and Bruce (2001) the sustainably problems are highly visible in the world knit industry as it is the type of fashion which aims to move trends from catwalk to retailers in the fastest possible time to keep up with the current market trends and also emerging the solid waste usually.
Solid Waste Process (Waste Recycle Body, 2013)
Buyers enjoy updating their wardrobe as frequently as possible. Joy et al (2012) found that consumers argue that if the knit garments are trendy for a year they do not need high quality clothing. Thus, due to their basic nature,
allenges which hider the implementation of CSR strategies due to the solid waste control facts (Hines and Bruce, 2001). Knit apparel focusing companies, such as Zara, Gap, Benetton, H&M are speeding up and shortening the solid waste cycle (The New York Times, 2013). Traditionally there were 2 to 4 collections yearly, but now there are 6 to 8 in case of the most fast fashion brands are concerning the knit fabric solid waste (The Wall Street Journal, 2013). Companies implemented “just in time” manufacturing btheir turnaround time through solid waste on the whole supply chain (Greenpeace, 2012). The root problem is that they design the garments for 10 washes, thus use poor-quality materials generates the fabric solid waste (Joy
nit Solid Waste Versus Statistics
The relative share of production of cloth from mill, handloom, power loom (including khadi, wool, and silk) and knitting sector is about three per cent, 14 per cent, 65 per cent and 24 per cent respectively during 2008Total output from this knit sector is about 3500 Crores of which about 3000 Crores are exported and rest are consumed in the domestic market. Broad sub grouping of the products is as follows:
Readymade Garments for Gents 60%
Readymade Garments for Ladies 30%
Readymade Garments for Kids 10% The process of garment production, starting from the basic raw material and ending by passing the finished product to the consumers, involves many stages, be it starting from cotton cultivation or from
made fabrics. The following Table shows the different operations and respective units operating knit apparel industry of
www.iiste.org
s produced by Tommy Hilfiger, Armani, and Victoria’s Secret. In addition, the tests identified 5 industrial chemicals, which are “toxic” and falling knit fabric
how of handling and especially waste are needed. In 2008, there were about to 600
fabric (Quader, 2012) and heavy knit and 1.200 basic knit products (BKMEA, 2013) in Bangladesh Studies show that huge amount of knit fabric solid waste is generated from these and the waste generated is rising with the increasing population.
icates that the solid waste generation would be 12,512 tons/ year by 2013 and 16,356 tons/year by 2017. According to Hines and Bruce (2001) the sustainably problems are highly visible in the world knit
ve trends from catwalk to retailers in the fastest possible
Buyers enjoy updating their wardrobe as frequently as possible. Joy et al (2012) found that consumers argue that if the knit garments are trendy for a year they do not need high quality clothing. Thus, due to their basic nature,
allenges which hider the implementation of CSR strategies due to the solid waste control facts (Hines and Bruce, 2001). Knit apparel focusing companies, such as Zara, Gap, Benetton, H&M are
es, 2013). Traditionally there were 2 to 4 collections yearly, but now there are 6 to 8 in case of the most fast fashion brands are concerning the knit fabric solid waste (The Wall Street Journal, 2013). Companies implemented “just in time” manufacturing by reducing their turnaround time through solid waste on the whole supply chain (Greenpeace, 2012). The root problem is
quality materials generates the fabric solid waste (Joy
The relative share of production of cloth from mill, handloom, power loom (including khadi, wool, and silk) and knitting sector is about three per cent, 14 per cent, 65 per cent and 24 per cent respectively during 2008-2009. Total output from this knit sector is about 3500 Crores of which about 3000 Crores are exported and rest are
The process of garment production, starting from the basic raw material and ending by passing the finished product to the consumers, involves many stages, be it starting from cotton cultivation or from
The following Table shows the different operations and respective units operating knit apparel industry of
Journal of Environment and Earth Science www.iiste.org
ISSN 2224-3216 (Paper) ISSN 2225-0948 (Online)
Vol.4, No.12, 2014
71
Operations
Number of Units
Knitting/Stitching Units
13,345
Dyeing and Bleaching
5,423
Fabric Printing
4,987
Embroidery
4,768
Other Ancillary Units
4,231
Compacting and Calendaring
3,421
Total
36,175
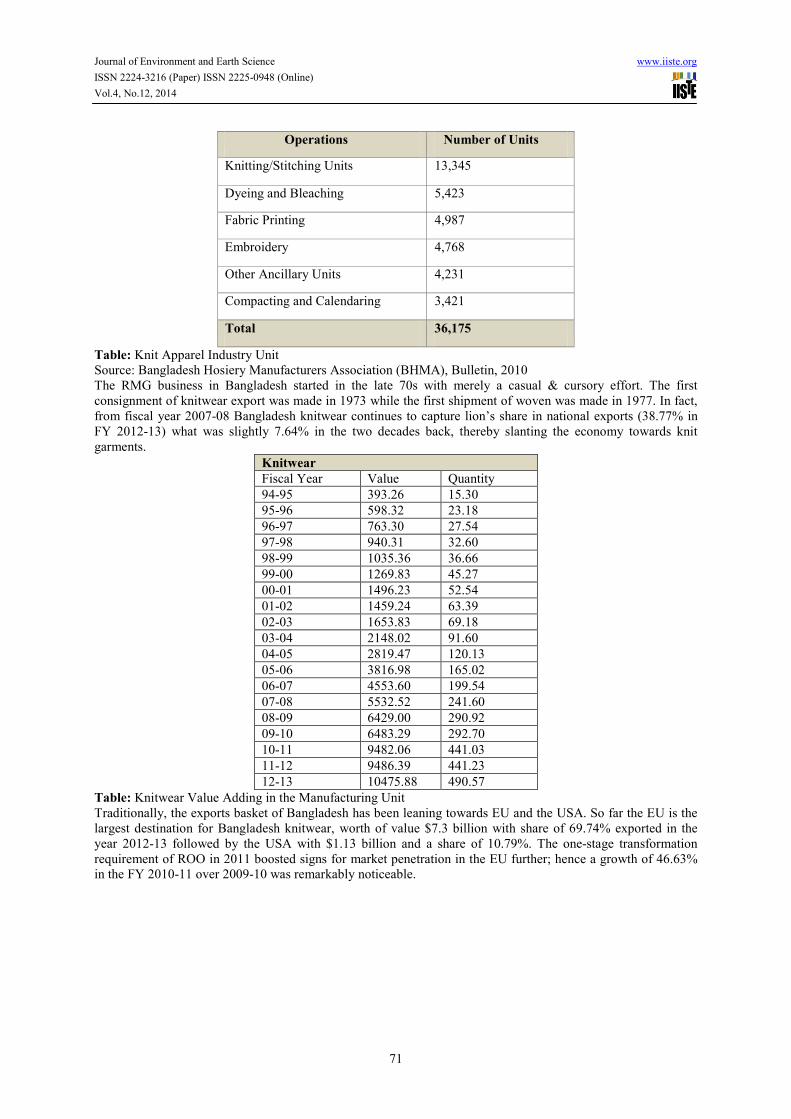
Table: Knit Apparel Industry Unit Source: Bangladesh Hosiery Manufacturers Association (BHMA), Bulletin, 2010 The RMG business in Bangladesh started in the late 70s with merely a casual & cursory effort. The first consignment of knitwear export was made in 1973 while the first shipment of woven was made in 1977. In fact, from fiscal year 2007-08 Bangladesh knitwear continues to capture lion’s share in national exports (38.77% in FY 2012-13) what was slightly 7.64% in the two decades back, thereby slanting the economy towards knit garments.
Knitwear
Fiscal Year Value Quantity
94-95 393.26 15.30
95-96 598.32 23.18
96-97 763.30 27.54
97-98 940.31 32.60
98-99 1035.36 36.66
99-00 1269.83 45.27
00-01 1496.23 52.54
01-02 1459.24 63.39
02-03 1653.83 69.18
03-04 2148.02 91.60
04-05 2819.47 120.13
05-06 3816.98 165.02
06-07 4553.60 199.54
07-08 5532.52 241.60
08-09 6429.00 290.92
09-10 6483.29 292.70
10-11 9482.06 441.03
11-12 9486.39 441.23
12-13 10475.88 490.57
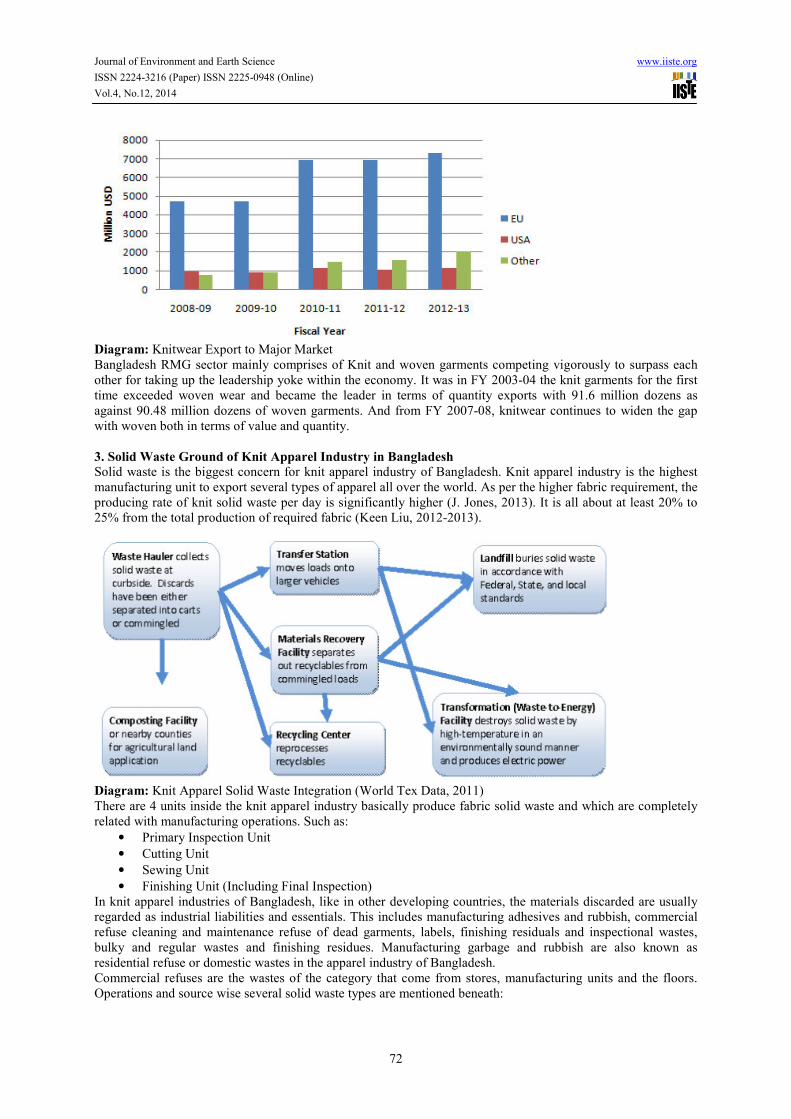
Table: Knitwear Value Adding in the Manufacturing Unit Traditionally, the exports basket of Bangladesh has been leaning towards EU and the USA. So far the EU is the largest destination for Bangladesh knitwear, worth of value $7.3 billion with share of 69.74% exported in the year 2012-13 followed by the USA with $1.13 billion and a share of 10.79%. The one-stage transformation requirement of ROO in 2011 boosted signs for market penetration in the EU further; hence a growth of 46.63% in the FY 2010-11 over 2009-10 was remarkably noticeable.
Journal of Environment and Earth Science www.iiste.org
ISSN 2224-3216 (Paper) ISSN 2225-0948 (Online)
Vol.4, No.12, 2014
72
Diagram: Knitwear Export to Major Market Bangladesh RMG sector mainly comprises of Knit and woven garments competing vigorously to surpass each other for taking up the leadership yoke within the economy. It was in FY 2003-04 the knit garments for the first time exceeded woven wear and became the leader in terms of quantity exports with 91.6 million dozens as against 90.48 million dozens of woven garments. And from FY 2007-08, knitwear continues to widen the gap with woven both in terms of value and quantity.
3. Solid Waste Ground of Knit Apparel Industry in Bangladesh
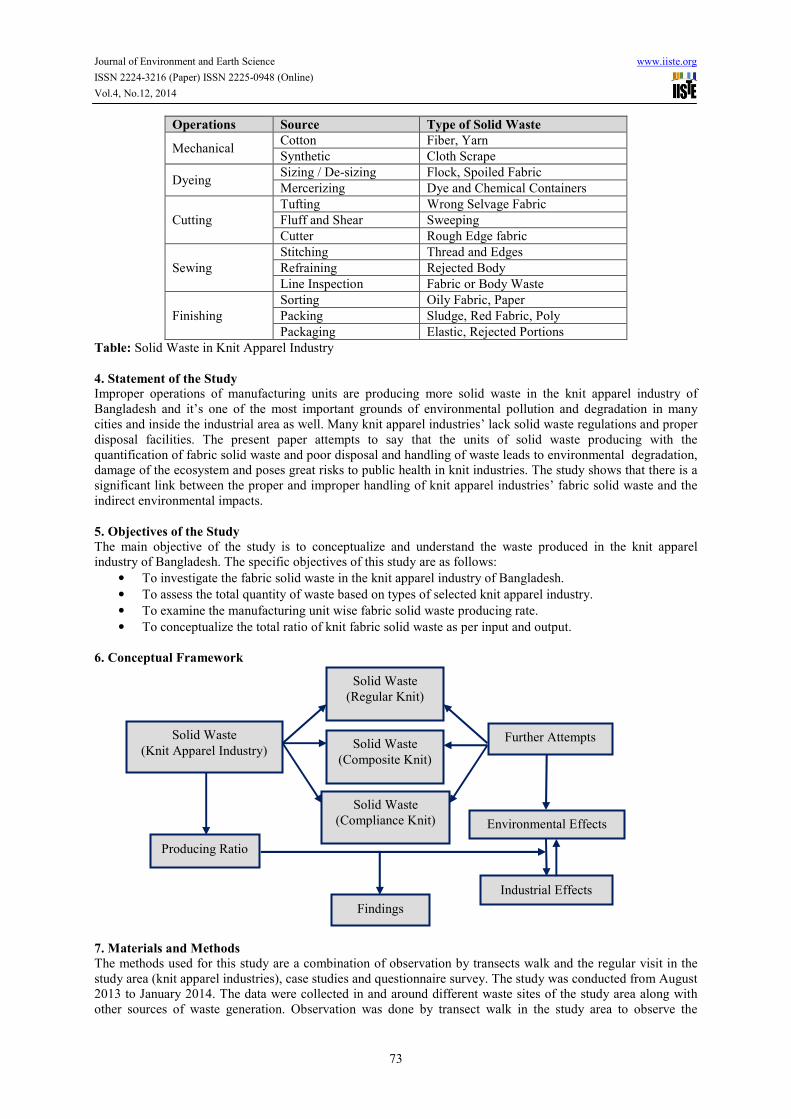
Solid waste is the biggest concern for knit apparel industry of Bangladesh. Knit apparel industry is the highest manufacturing unit to export several types of apparel all over the world. As per the higher fabric requirement, the producing rate of knit solid waste per day is significantly higher (J. Jones, 2013). It is all about at least 20% to 25% from the total production of required fabric (Keen Liu, 2012-2013).
Diagram: Knit Apparel Solid Waste Integration (World Tex Data, 2011) There are 4 units inside the knit apparel industry basically produce fabric solid waste and which are completely related with manufacturing operations. Such as:
• Primary Inspection Unit
• Cutting Unit
• Sewing Unit
• Finishing Unit (Including Final Inspection) In knit apparel industries of Bangladesh, like in other developing countries, the materials discarded are usually regarded as industrial liabilities and essentials. This includes manufacturing adhesives and rubbish, commercial refuse cleaning and maintenance refuse of dead garments, labels, finishing residuals and inspectional wastes, bulky and regular wastes and finishing residues. Manufacturing garbage and rubbish are also known as residential refuse or domestic wastes in the apparel industry of Bangladesh. Commercial refuses are the wastes of the category that come from stores, manufacturing units and the floors. Operations and source wise several solid waste types are mentioned beneath:
Journal of Environment and Earth Science www.iiste.org
ISSN 2224-3216 (Paper) ISSN 2225-0948 (Online)
Vol.4, No.12, 2014
73
Operations Source Type of Solid Waste
Mechanical Cotton Fiber, Yarn
Synthetic Cloth Scrape
Dyeing Sizing / De-sizing Flock, Spoiled Fabric
Mercerizing Dye and Chemical Containers
Cutting
Tufting Wrong Selvage Fabric
Fluff and Shear Sweeping
Cutter Rough Edge fabric
Sewing
Stitching Thread and Edges
Refraining Rejected Body
Line Inspection Fabric or Body Waste
Finishing
Sorting Oily Fabric, Paper
Packing Sludge, Red Fabric, Poly
Packaging Elastic, Rejected Portions
Table: Solid Waste in Knit Apparel Industry
4. Statement of the Study
Improper operations of manufacturing units are producing more solid waste in the knit apparel industry of Bangladesh and it’s one of the most important grounds of environmental pollution and degradation in many cities and inside the industrial area as well. Many knit apparel industries’ lack solid waste regulations and proper disposal facilities. The present paper attempts to say that the units of solid waste producing with the quantification of fabric solid waste and poor disposal and handling of waste leads to environmental degradation, damage of the ecosystem and poses great risks to public health in knit industries. The study shows that there is a significant link between the proper and improper handling of knit apparel industries’ fabric solid waste and the indirect environmental impacts.
5. Objectives of the Study
The main objective of the study is to conceptualize and understand the waste produced in the knit apparel industry of Bangladesh. The specific objectives of this study are as follows:
• To investigate the fabric solid waste in the knit apparel industry of Bangladesh.
• To assess the total quantity of waste based on types of selected knit apparel industry.
• To examine the manufacturing unit wise fabric solid waste producing rate.
• To conceptualize the total ratio of knit fabric solid waste as per input and output.
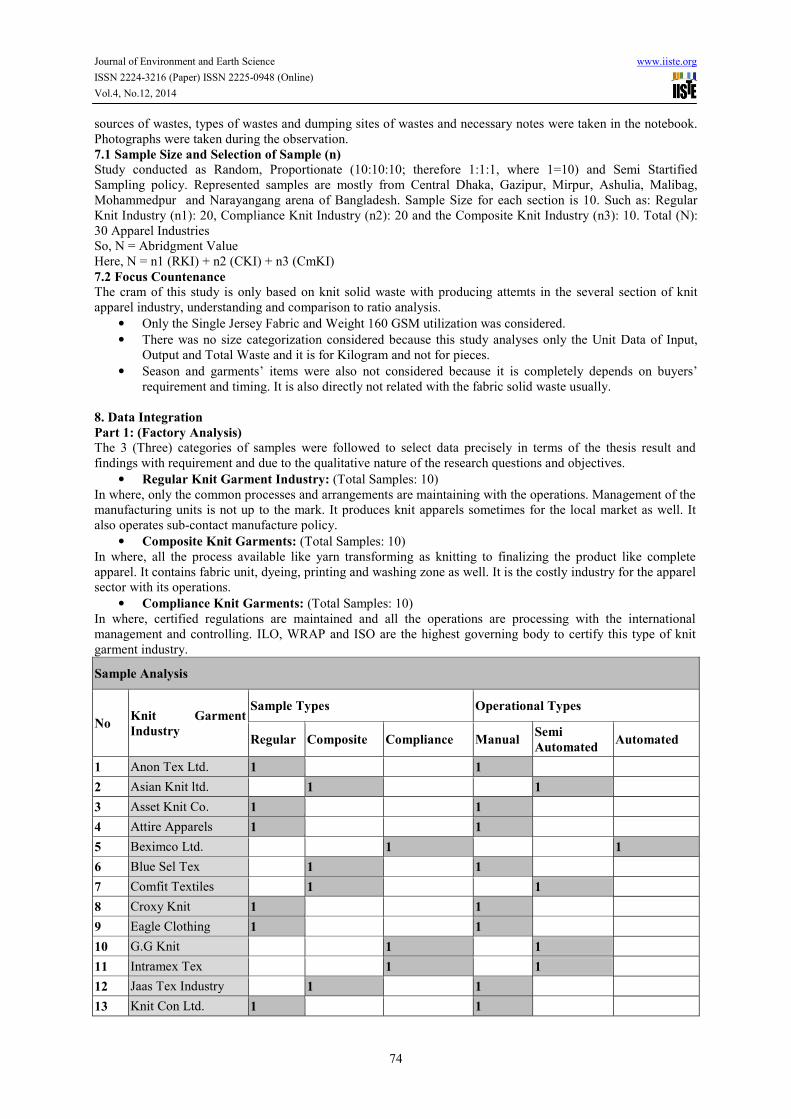
6. Conceptual Framework
7. Materials and Methods
The methods used for this study are a combination of observation by transects walk and the regular visit in the study area (knit apparel industries), case studies and questionnaire survey. The study was conducted from August 2013 to January 2014. The data were collected in and around different waste sites of the study area along with other sources of waste generation. Observation was done by transect walk in the study area to observe the
Solid Waste
(Knit Apparel Industry)
Solid Waste
(Regular Knit)
Solid Waste
(Composite Knit)
Solid Waste
(Compliance Knit)
Further Attempts
Producing Ratio
Industrial Effects
Environmental Effects
Findings
Journal of Environment and Earth Science www.iiste.org
ISSN 2224-3216 (Paper) ISSN 2225-0948 (Online)
Vol.4, No.12, 2014
74
sources of wastes, types of wastes and dumping sites of wastes and necessary notes were taken in the notebook. Photographs were taken during the observation.
7.1 Sample Size and Selection of Sample (n) Study conducted as Random, Proportionate (10:10:10; therefore 1:1:1, where 1=10) and Semi Startified Sampling policy. Represented samples are mostly from Central Dhaka, Gazipur, Mirpur, Ashulia, Malibag, Mohammedpur and Narayangang arena of Bangladesh. Sample Size for each section is 10. Such as: Regular Knit Industry (n1): 20, Compliance Knit Industry (n2): 20 and the Composite Knit Industry (n3): 10. Total (N): 30 Apparel Industries So, N = Abridgment Value Here, N = n1 (RKI) + n2 (CKI) + n3 (CmKI)
7.2 Focus Countenance
The cram of this study is only based on knit solid waste with producing attemts in the several section of knit apparel industry, understanding and comparison to ratio analysis.
• Only the Single Jersey Fabric and Weight 160 GSM utilization was considered.
• There was no size categorization considered because this study analyses only the Unit Data of Input, Output and Total Waste and it is for Kilogram and not for pieces.
• Season and garments’ items were also not considered because it is completely depends on buyers’ requirement and timing. It is also directly not related with the fabric solid waste usually.
8. Data Integration
Part 1: (Factory Analysis)
The 3 (Three) categories of samples were followed to select data precisely in terms of the thesis result and findings with requirement and due to the qualitative nature of the research questions and objectives.
• Regular Knit Garment Industry: (Total Samples: 10) In where, only the common processes and arrangements are maintaining with the operations. Management of the manufacturing units is not up to the mark. It produces knit apparels sometimes for the local market as well. It also operates sub-contact manufacture policy.
• Composite Knit Garments: (Total Samples: 10) In where, all the process available like yarn transforming as knitting to finalizing the product like complete apparel. It contains fabric unit, dyeing, printing and washing zone as well. It is the costly industry for the apparel sector with its operations.
• Compliance Knit Garments: (Total Samples: 10) In where, certified regulations are maintained and all the operations are processing with the international management and controlling. ILO, WRAP and ISO are the highest governing body to certify this type of knit garment industry.
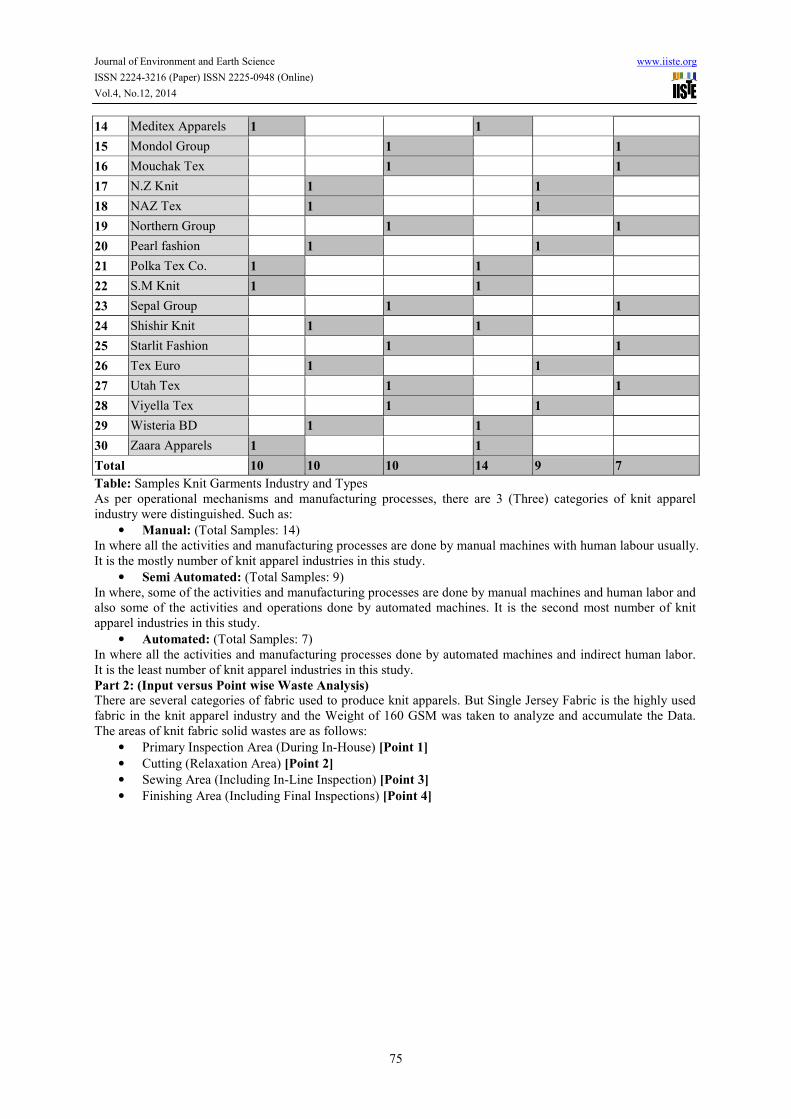
Sample Analysis
No Knit Garment
Industry
Sample Types Operational Types
Regular Composite Compliance Manual Semi
Automated Automated
1 Anon Tex Ltd. 1 1
2 Asian Knit ltd. 1 1
3 Asset Knit Co. 1 1
4 Attire Apparels 1 1
5 Beximco Ltd. 1 1
6 Blue Sel Tex 1 1
7 Comfit Textiles 1 1
8 Croxy Knit 1 1
9 Eagle Clothing 1 1
10 G.G Knit 1 1
11 Intramex Tex 1 1
12 Jaas Tex Industry 1 1
13 Knit Con Ltd. 1 1
Journal of Environment and Earth Science www.iiste.org
ISSN 2224-3216 (Paper) ISSN 2225-0948 (Online)
Vol.4, No.12, 2014
75
14 Meditex Apparels 1 1
15 Mondol Group 1 1
16 Mouchak Tex 1 1
17 N.Z Knit 1 1
18 NAZ Tex 1 1
19 Northern Group 1 1
20 Pearl fashion 1 1
21 Polka Tex Co. 1 1
22 S.M Knit 1 1
23 Sepal Group 1 1
24 Shishir Knit 1 1
25 Starlit Fashion 1 1
26 Tex Euro 1 1
27 Utah Tex 1 1
28 Viyella Tex 1 1
29 Wisteria BD 1 1
30 Zaara Apparels 1 1
Total 10 10 10 14 9 7
Table: Samples Knit Garments Industry and Types As per operational mechanisms and manufacturing processes, there are 3 (Three) categories of knit apparel industry were distinguished. Such as:
• Manual: (Total Samples: 14) In where all the activities and manufacturing processes are done by manual machines with human labour usually. It is the mostly number of knit apparel industries in this study.
• Semi Automated: (Total Samples: 9) In where, some of the activities and manufacturing processes are done by manual machines and human labor and also some of the activities and operations done by automated machines. It is the second most number of knit apparel industries in this study.
• Automated: (Total Samples: 7) In where all the activities and manufacturing processes done by automated machines and indirect human labor. It is the least number of knit apparel industries in this study.
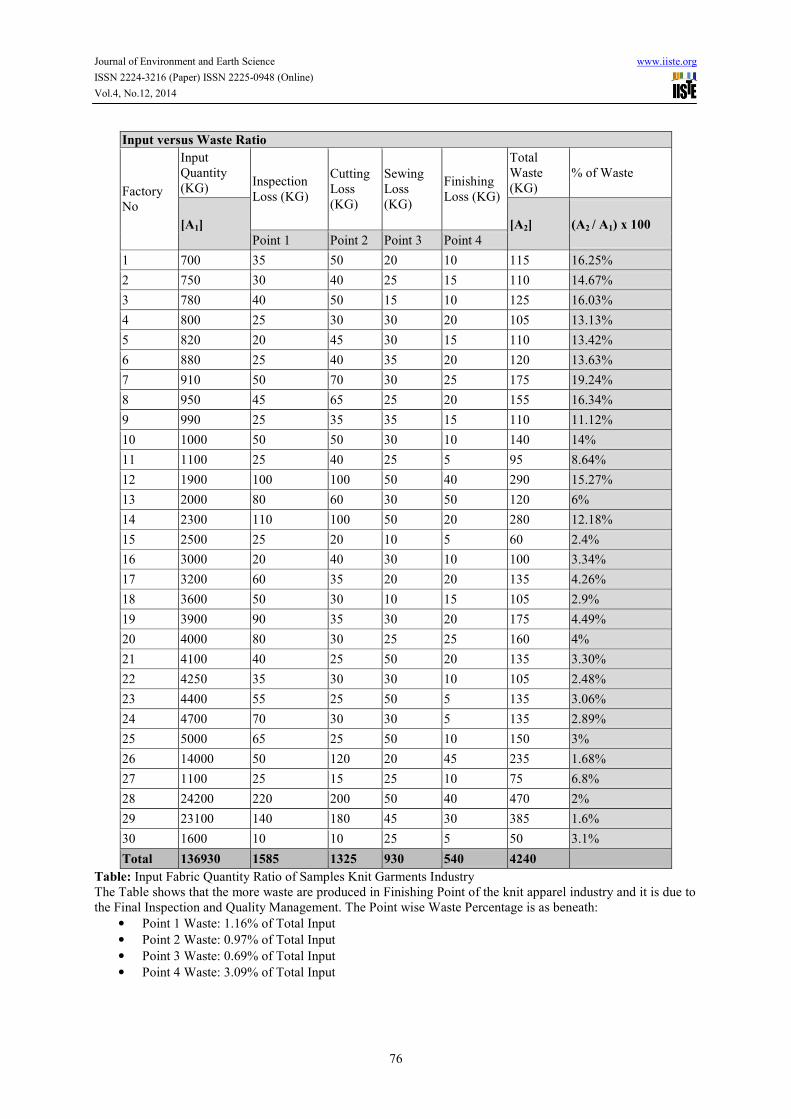
Part 2: (Input versus Point wise Waste Analysis)
There are several categories of fabric used to produce knit apparels. But Single Jersey Fabric is the highly used fabric in the knit apparel industry and the Weight of 160 GSM was taken to analyze and accumulate the Data. The areas of knit fabric solid wastes are as follows:
• Primary Inspection Area (During In-House) [Point 1]
• Cutting (Relaxation Area) [Point 2]
• Sewing Area (Including In-Line Inspection) [Point 3]
• Finishing Area (Including Final Inspections) [Point 4]
Journal of Environment and Earth Science www.iiste.org
ISSN 2224-3216 (Paper) ISSN 2225-0948 (Online)
Vol.4, No.12, 2014
76
Input versus Waste Ratio
Factory No
Input Quantity (KG)
Inspection Loss (KG)
Cutting Loss (KG)
Sewing Loss (KG)
Finishing Loss (KG)
Total Waste (KG)
% of Waste
[A1] [A2] (A2 / A1) x 100
Point 1 Point 2 Point 3 Point 4
1 700 35 50 20 10 115 16.25%
2 750 30 40 25 15 110 14.67%
3 780 40 50 15 10 125 16.03%
4 800 25 30 30 20 105 13.13%
5 820 20 45 30 15 110 13.42%
6 880 25 40 35 20 120 13.63%
7 910 50 70 30 25 175 19.24%
8 950 45 65 25 20 155 16.34%
9 990 25 35 35 15 110 11.12%
10 1000 50 50 30 10 140 14%
11 1100 25 40 25 5 95 8.64%
12 1900 100 100 50 40 290 15.27%
13 2000 80 60 30 50 120 6%
14 2300 110 100 50 20 280 12.18%
15 2500 25 20 10 5 60 2.4%
16 3000 20 40 30 10 100 3.34%
17 3200 60 35 20 20 135 4.26%
18 3600 50 30 10 15 105 2.9%
19 3900 90 35 30 20 175 4.49%
20 4000 80 30 25 25 160 4%
21 4100 40 25 50 20 135 3.30%
22 4250 35 30 30 10 105 2.48%
23 4400 55 25 50 5 135 3.06%
24 4700 70 30 30 5 135 2.89%
25 5000 65 25 50 10 150 3%
26 14000 50 120 20 45 235 1.68%
27 1100 25 15 25 10 75 6.8%
28 24200 220 200 50 40 470 2%
29 23100 140 180 45 30 385 1.6%
30 1600 10 10 25 5 50 3.1%
Total 136930 1585 1325 930 540 4240
Table: Input Fabric Quantity Ratio of Samples Knit Garments Industry The Table shows that the more waste are produced in Finishing Point of the knit apparel industry and it is due to the Final Inspection and Quality Management. The Point wise Waste Percentage is as beneath:
• Point 1 Waste: 1.16% of Total Input
• Point 2 Waste: 0.97% of Total Input
• Point 3 Waste: 0.69% of Total Input
• Point 4 Waste: 3.09% of Total Input
Journal of Environment and Earth Science www.iiste.org
ISSN 2224-3216 (Paper) ISSN 2225-0948 (Online)
Vol.4, No.12, 2014
77
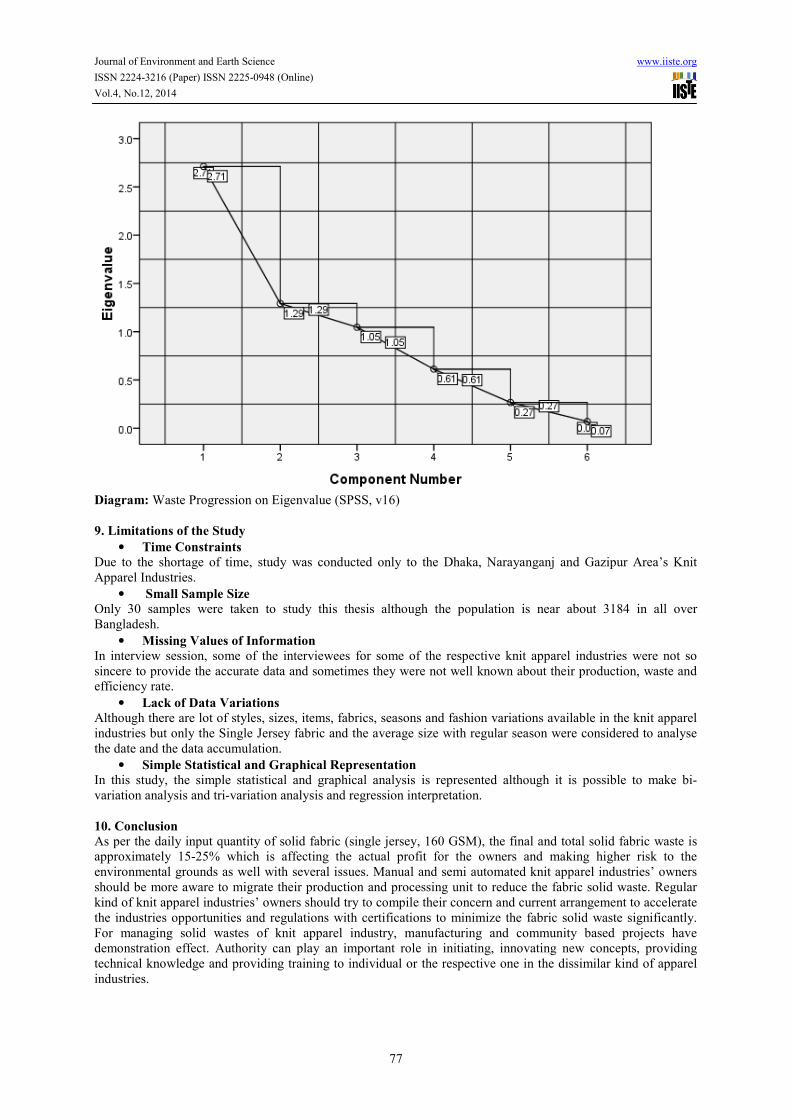
Diagram: Waste Progression on Eigenvalue (SPSS, v16)
9. Limitations of the Study
• Time Constraints
Due to the shortage of time, study was conducted only to the Dhaka, Narayanganj and Gazipur Area’s Knit Apparel Industries.
• Small Sample Size
Only 30 samples were taken to study this thesis although the population is near about 3184 in all over Bangladesh.
• Missing Values of Information
In interview session, some of the interviewees for some of the respective knit apparel industries were not so sincere to provide the accurate data and sometimes they were not well known about their production, waste and efficiency rate.
• Lack of Data Variations
Although there are lot of styles, sizes, items, fabrics, seasons and fashion variations available in the knit apparel industries but only the Single Jersey fabric and the average size with regular season were considered to analyse the date and the data accumulation.
• Simple Statistical and Graphical Representation
In this study, the simple statistical and graphical analysis is represented although it is possible to make bi-variation analysis and tri-variation analysis and regression interpretation.
10. Conclusion
As per the daily input quantity of solid fabric (single jersey, 160 GSM), the final and total solid fabric waste is approximately 15-25% which is affecting the actual profit for the owners and making higher risk to the environmental grounds as well with several issues. Manual and semi automated knit apparel industries’ owners should be more aware to migrate their production and processing unit to reduce the fabric solid waste. Regular kind of knit apparel industries’ owners should try to compile their concern and current arrangement to accelerate the industries opportunities and regulations with certifications to minimize the fabric solid waste significantly. For managing solid wastes of knit apparel industry, manufacturing and community based projects have demonstration effect. Authority can play an important role in initiating, innovating new concepts, providing technical knowledge and providing training to individual or the respective one in the dissimilar kind of apparel industries.
Journal of Environment and Earth Science www.iiste.org
ISSN 2224-3216 (Paper) ISSN 2225-0948 (Online)
Vol.4, No.12, 2014
78
References
1. The Waste Sector in Bangladesh, Udenrigsministeriet, Ministry of Foreign Affairs of Denmark, 2012-2013, pp: 3-29 2. S. Bentall, Technology and the Garment Industry, 2nd Edition, pp: 33-115, London, ISBN: 11700582-7, pp: 64-88 3. Sara J. Kadolph, Quality Asurance for Textiles and Apparel, 2012, ISBN: 156367-144-1, GST R: 133004424, pp: 65-89 4. Carr & Latham, Technology of Clothing Manufacture, 2011, 4th Edition, ISBN: 978-1-4051-6198-5, pp: 123-188 5. A. Hunter, R.King, R.H. Lowson, The Textile/Clothing Pipeline and Quick Response Management, 3rd Edition, 2010, ISBN: 36999-89-5, pp: 43-59 6. Gerry Cooklin, Introduction to Clothing Manufacturer, 2nd Edition, ISBN: 978-1-4051-6769-7, pp: 113-132 7. Market Access guide to the New and Emerging Market for Bangladesh Woven garments Manufacturers and Exporters, BGMEA Publications, BGMEA and gtz, Only Edition, 2012 8. 6th Bangladesh Knitwear Exhibition Knit Exposition 2012, 25-27 January, 2012, Introducing Bangladesh Knitwear to Japan and Beyond, BKMEA publications 9. Raymond V. Lesikar, Marie E. Flatley and Kathryn Rentz; Business Communication - Making Connections in a Digital Worlld; McGraw-Hil and Irwin 2008-2009, 11th Edition, ISBN: 978-0-07-110128-8, pp: 03 10. Steven J. Skinner and John M. Ivancevich, Business for the 21st Century, IRWIN 2007-2008, ISBN: 0-256-09222-2, pp: 245 11. Linda Beamer and Iris Varner, Intercultural Communication in The Global Workplace, 2nd edition, McGraw-Hill and Irwin, ISBN: 0-07-239690-3, pp: 51 12. Raymond V. Lesikar, Marie E. Flatley and Kathryn Rentz; Business Communication - Making Connections in a Digital Worlld; McGraw-Hil and Irwin 2008-2009, 11th Edition, ISBN: 978-0-07-110128-8, pp: 215 13. Jermy A. Rosenau and David Wilson, Apparel Merchandising-The Line Starst Here, Fairchild Publications, Inc., New York, 2001, ISBN: 1-56367-198-0, pp: 48 14. Paveen S. Goel, Praveen Gupta, Rajeev Jain and Rajesh K. Tyagi, Six Sigma for Transactions and Service, 2005 by McGraw-Hill, ISBN: 0-07-144330-4, pp: 474 15. Gregory G. Dess and G. T. Lumpkin, Strategic Management Creating Competitive Advantages, McGraw-Hill and Irwin, ISBN: 0-07-250917-1, International Edition ISBN: 0-07-115106-0, pp: 261 16. Elizabeth A. Smith, The Productivity Manual, 2nd Edition, GULF, 1990, 1995, ISBN: 0-88415-652-4, pp: 202 17. John Donnellan, Merchandise Buying and Management, Fairchild Publications, New York, 1996, ISBN: 1-56367-052-6, pp: 396 18. Nancy J. Miller, Terry L. Besser and Sandra Sattler Weber, Networking as Marketing Strategy: A Case Study of Small Community Businesses, Qualitative Market Research: An International Journal, DOI: 10.1108/13522751011053626, ISSN: 1352-2752, pp: 126-129 19. A research paradigm for international business communication", 2005, Corporate Communications: An International Journal, Vol. 10 Iss: 2, pp: 168 – 182, Naoki Kameda, DOI: 0.1108/13563280510596970 20. Jermy A. Rosenau and David Wilson, Apparel Merchandising – The Line Starst Here, Fairchild Publications, Inc., New York, 2001, ISBN: 1-56367-198-0, pp: 97 21. Raymond V. Lesikar, Marie E. Flatley and Kathryn Rentz; Business Communication - Making Connections in a Digital Worlld; McGraw-Hil and Irwin 2008-2009, 11th Edition, ISBN: 978-0-07-110128-8, pp: 138 22. Ron Masson, Laura Iosif, Grant MacKerron and June Fernie, Managing Complexity in Agile Global Fashion Industry Supply Chains; Vol. 18, Iss: 2, DOI: 10.1108/09574090710816959 23. http://mbathesispapers.blogspot.com/2011/10/internship-report-on-application-of.html 24. Mohammad Ali and Dr. Md Mamun Habib; Supply Chain Management of Textile Industry: A Case Study on Bangladesh; International Journal of Supply Chain Management; Vol. 1, No. 2, September 2012; ISSN: 2050-7399 (Online), 2051-3771 (Print) 25. Margaret Bruce, Lucy daly and Neil Towers; Lean or Agile: A Solution for Supply Chain Management in the Textile and Clothing Industry?; Vol. 24, Iss: 2; DOI: 10.1108/01443570410514867 26. Anni-Kaisa Kahkonen, Katrina Lintukangas, Veli Matti Virolainen; The Effects of e-Business on Supply Management; An International Journal of operations and Supply Chain Management; ISSN: 1979-3561, EISSN: 1979-3871 27. Apparel assignment Point and the Analyzing; http://www.assignmentpoint.com/science/textile/term-paper-on-delta-composite-knitting-industries-limited.html 28. Apparel Information and Fashion Marketing through Merchandising; (Apparel School), http://www.lawyersnjurists.com/articles-reports-journals/garments-and-textile/general-review-merchandising-knit-garment-sectors-bangladesh/
Journal of Environment and Earth Science www.iiste.org
ISSN 2224-3216 (Paper) ISSN 2225-0948 (Online)
Vol.4, No.12, 2014
79
29. Wahida Shahan Tinne, 2011, “Factors Affecting Impulse Buying Behaviour of Consumers at Superstores in Bangladesh” ASA University, Vol. 5 No. 1, pp 209 30. http://www.asaub.edu.bd/asaub_review.php#criteria7 31. Mohammed Ziaul Haider, 2007, “Competitiveness of the Bangladesh ready-made garment industry in major international markets” Asia-Pacific Trade and Investment Review, Vol. 3, No. 1, ISBN: 978-92-1-120519-0, ISSN: 1815-8897 32. Muzammil Hani, Sehrish Hafeez, Adnan Riaz, 2010, “Factors Affecting Customer Satisfaction” International Research Journal of Finance and Economics, Issue 60 (2010), ISSN 1450-2887, pp: 44-52 33. Aditya Marwaha (2008). Impact of China on Indian Garment Industry. A dissertation presented in part consideration for the degree of MA Marketing, The University of Nottingham. 34. Afuah, A. and Tucci, C (2003). Internet business models and strategies: text and cases. New York: McGraw-Hill, pp: 51-75. 35. Apparel Export Promotion Council (2009). Export Statistics for Garments and Knitwear. (New Delhi: Apparel Exports Promotion Council). 36. Apparel Fortnightly Report (2002). Review of Export Performance. Apparel fortnightly, April, pp: 63-64. 37. Apparel Online Report (2002). India Needs To Be Cautious But Not Worried. Apparel online, pp: 14-17. 38. Apparel Online Team Report (2002). Innovation for Garments Productivity, Apparel online, November, pp: 22-23. 39. Apparel View Report (2003). Are We Using the Right Technology For Apparel Production. Apparel View, February, pp: 1. 40. Balls, John D (2000). e-Business and ERP: Transforming the Enterprise. John Wiley and Sons, Inc., New York, pp: 13. 41. Beaman, B.M (1998). Supply chain design and Analysis: Models & Methods. International Journal of Production Economics, 55(30), pp: 294. 42. Breitman and Lucas (1987). Supplier perceptions of quick response systems. Journal of Enterprise Information Management, 19(3), 334-345. 43. Calvin and Joseph (2007). Occupation Related Accidents in Selected Garment Industries in Bangalore City. Indian Journal of Community Medicine,Vol. 31, No. 3, pp.123-141 44. Amjad, Rashid ed. (1981), The Development of Labour Intensive Industry in ASEAN Countries, Bangkok: International Labour Organisation, Asian Employment Programme. 45. Aw, Bee Yan, Xiaomin Chen, and Mark J. Roberts (2001), “Firm-level Evidence on Productivity Differentials and Turnover in Taiwanese Manufacturing,” Journal of Development Economics, Vol. 66, No. 1, October, pp. 51-86. 46. Bakht, Zaid, Md. Salimullah, Tatsufumi Yamagata and Mohammad Yunus (2007), “Competitiveness of Labor-Intensive Industry in a Least Developed Country: A Case of the Knitwear Industry in Bangladesh,” paper presented at the conference of “Productivity and Growth in Africa and Asia,” organized by the United Nations Industrial Development Organization (UNIDO) and the Institute of Developing Economies (IDE), Japan, at the International House of Japan, Tokyo, in October 11, 2007. 47. Bangladesh Bureau of Statistics (BBS) (2003), Report of the Household Income and Expenditure Survey 2000, Dhaka: Bangladesh Bureau of Statistics. 48. Bangladesh Bureau of Statistics (BBS) (2004), Report on Bangladesh Census of manufacturing Industries (CMI), 1999-2000, Dhaka: BBS. 49. Bangladesh Garment Manufacturers and Exporters Association (BGMEA) (2001), BGMEA Members Directory 2000-2001, Dhaka: BGMEA. 50. Bangladesh Garment Manufacturers and Exporters Association (BGMEA) (2003), BGMEA Members Directory 2002-2003, Dhaka: BGMEA. 51. Bils, Mark and Jang-Ok Cho (1994), “Cyclical Factor Utilization,” Journal of Monetary Economics, Vol. 33, No. 2, April, 319-354. 52. Burnside, Craig, Martin Eichenbaum, and Sergio Rebelo (1995), “Capital Utilization and Returns to Scale,” in Ben S. Bernanke and Julio J. Rotemberg eds., NBER Macroeconomics Annual 1995, Cambridge: MIT Press, pp. 67-110. 53. Caves, Douglas W., Laurits R. Christensen, and W. Erwin Diewert (1982), “Multilateral Comparisons of Output, Input, and Productivity Using Superlative Index Numbers,” Economic Journal, Vol. 92, No. 365, March, pp. 73-86. 54. Fecher, Fabienne and Sergio Perelman (1992), “Productivity Growth and Technical Efficiency in OECD Industrial Activities,” in Richard E. Caves et al. (eds), Industrial Efficiency in Six Nations, Cambridge, Massachusetts, and London: MIT Press, Chapter 12, pp. 459-488. 55. Fujita, Masahisa and Jacques-François Thisse (2002), Economics of Agglomeration: Cities, Industrial Location, and Regional Growth, Cambridge: Cambridge University Press.

Journal of Environment and Earth Science www.iiste.org
ISSN 2224-3216 (Paper) ISSN 2225-0948 (Online)
Vol.4, No.12, 2014
80
56. Fukunishi, Takahiro, Mayumi Murayama, Tatsufumi Yamagata and Akio Nishiura (2006), Industrialization and Poverty Alleviation: Pro-Poor Industrialization Strategies Revisited, Vienna: United Nations Industrial Development Organization (UNIDO). 57. Hansen, Lars Peter (1982) “Large Sample Properties of Generalized Method of Moments Estimators”. Econometrica 50, no. 4: 1029-54.
The IISTE is a pioneer in the Open-Access hosting service and academic event
management. The aim of the firm is Accelerating Global Knowledge Sharing.
More information about the firm can be found on the homepage:
http://www.iiste.org
CALL FOR JOURNAL PAPERS
There are more than 30 peer-reviewed academic journals hosted under the hosting
platform.
Prospective authors of journals can find the submission instruction on the
following page: http://www.iiste.org/journals/ All the journals articles are available
online to the readers all over the world without financial, legal, or technical barriers
other than those inseparable from gaining access to the internet itself. Paper version
of the journals is also available upon request of readers and authors.
MORE RESOURCES
Book publication information: http://www.iiste.org/book/
IISTE Knowledge Sharing Partners
EBSCO, Index Copernicus, Ulrich's Periodicals Directory, JournalTOCS, PKP Open
Archives Harvester, Bielefeld Academic Search Engine, Elektronische
Zeitschriftenbibliothek EZB, Open J-Gate, OCLC WorldCat, Universe Digtial
Library , NewJour, Google Scholar


