Embed Size (px)
Citation preview

Graduate Theses, Dissertations, and Problem Reports
2002
Design, construction and testing of an innovative mechanism for Design, construction and testing of an innovative mechanism for
manual wheelchair propulsion manual wheelchair propulsion
Thomas S. Burke Jr. West Virginia University
Follow this and additional works at: https://researchrepository.wvu.edu/etd
Recommended Citation Recommended Citation Burke, Thomas S. Jr., "Design, construction and testing of an innovative mechanism for manual wheelchair propulsion" (2002). Graduate Theses, Dissertations, and Problem Reports. 1521. https://researchrepository.wvu.edu/etd/1521
This Thesis is protected by copyright and/or related rights. It has been brought to you by the The Research Repository @ WVU with permission from the rights-holder(s). You are free to use this Thesis in any way that is permitted by the copyright and related rights legislation that applies to your use. For other uses you must obtain permission from the rights-holder(s) directly, unless additional rights are indicated by a Creative Commons license in the record and/ or on the work itself. This Thesis has been accepted for inclusion in WVU Graduate Theses, Dissertations, and Problem Reports collection by an authorized administrator of The Research Repository @ WVU. For more information, please contact [email protected].

Design, Construction and Testing of an Innovative Mechanism for Manual Wheelchair Propulsion
Thomas S. Burke Jr.
Thesis submitted to the College of Engineering and Mineral Resources
at West Virginia University in partial fulfillment of the requirements
for the degree of
Master of Science in
Mechanical Engineering
W. Scott Wayne, Ph.D., Chair
Thomas R. Long, Ed.D.
Alfred H. Stiller, Ph.D.
Kevin D. Swisher, WVUCED
Department of Mechanical Engineering
Morgantown, West Virginia
2002
Keyword: Wheelchair Assistive Technology

Abstract
Design, Construction and Testing of an Innovative Mechanism for Manual Wheelchair Propulsion
Thomas S. Burke Jr.
The concern for people with disabilities who are users of wheelchairs has become a dynamic research area in the past several years. This research is being done to enhance the health and lifestyles of standard manual wheelchair users. As part of this research new and innovative mechanisms that give the manual wheelchair users a mechanical advantage, and allow them to operate a standard wheelchair with less effort and muscle strain are being developed. In this research, an innovative mechanism was conceived, designed, built, and tested. The path of this innovative mechanism was modeled after the semi-circular (SC) wheelchair stroke pattern. It allows the user to propel a standard wheelchair in both the push and pull strokes of the handle. This new design will allow for a more symmetric muscle development of the shoulder and upper-arm complex, and should reduce muscle (skeletal) injuries. A conceptual model of the new mechanism was formulated using SolidWorks software. Preliminary position and torque analysis were analyzed using Microsoft Excel spreadsheets. A prototype of the innovative mechanism was built and retrofitted onto a standard manual wheelchair. In addition, a portable wheelchair testing station was designed and fabricated to allow for human testing comparative measurements between a standard wheelchair and the innovative mechanism. Comparison of data from the standard wheelchair and the innovative mechanism showed energy, horsepower, and RPM ratio gains of 1.638, 1.631, and 1.64. Therefore, the mechanism shows promise to enhance the quality of life for mobility impaired citizens.

iii
Table of Contents Abstract ………………………………………………………………………………………………….. . ii
List of Figures.................................................................................................................... v List of Tables ………………………………………………………………………………… ix
1 Introduction............................................................................................................... 1 1.1 Declaration of Problem..................................................................................... 1
1.2 Literature Review ............................................................................................. 3 1.2.1 Prelude ........................................................................................................ 3 1.2.2 Wheelchair Related Injuries........................................................................ 3
1.2.2.1 Case Study I ............................................................................................ 4 1.2.2.2 Case Study II........................................................................................... 6
1.2.3 Determining Wheelchair Type – User’s Ability......................................... 9 1.2.4 Wheelchair User Qualification List .......................................................... 10 1.2.5 Types of Wheelchair Propulsion............................................................... 11
1.2.5.1 Prelude .................................................................................................. 11 1.2.5.2 Geared Hubs.......................................................................................... 11 1.2.5.3 Power Assists ........................................................................................ 13 1.2.5.4 One Arm Drive ..................................................................................... 14 1.2.5.5 Lever Drive ........................................................................................... 16
1.2.5.5.1 Case Study III ................................................................................. 19 1.2.5.6 Specialty Chairs .................................................................................... 21
1.3 Problem Statement.......................................................................................... 22
2 Mechanism Development ....................................................................................... 23
2.1 Proposed Design .............................................................................................. 24
2.2 Cardan Gear System....................................................................................... 24
2.3 Adapting the Innovative Mechanism to a Wheelchair Frame.................... 28
2.4 Parametric Design Criteria of the Components of the Innovative Propulsion system ....................................................................................................... 30
2.4.1 Gear Selection........................................................................................... 30 2.4.2 Roller Chair Selection............................................................................... 31 2.4.3 Gear Arm Design ...................................................................................... 32 2.4.4 Lever B Design ......................................................................................... 33 2.4.5 Back Connecting Lever............................................................................. 34
2.5 Innovative Mechanism Parameters............................................................... 34
2.6 Mechanism Assembly ..................................................................................... 36
2.7 Visualization of Mechanism Handle Motion ................................................ 37

iv
2.8 Manufacturing of Prototype .......................................................................... 39
3 Experimental Setup ................................................................................................ 40
3.1 Dynamometer .................................................................................................. 43
3.2 Dynamometer Controller ............................................................................... 45
3.3 Rear Axle ......................................................................................................... 45 3.3.1 Singularity Function – Standard Wheels .................................................. 46 3.3.2 Singularity Function – Roller Chain Sprockets ........................................ 51 3.3.3 Rear Axle Validation ................................................................................ 56
3.4 Rear Axle Sprockets ....................................................................................... 58
3.5 Dynamometer Sprockets ................................................................................ 59
3.6 Complete Testing Apparatus ......................................................................... 59
4 Experimental Design and Testing.......................................................................... 61
4.1 Prelude ............................................................................................................. 61
4.2 Handle Motion Analysis ................................................................................. 62
4.3 Torque Analysis .............................................................................................. 64
4.4 Testing Load Calculation ............................................................................... 71
4.5 Testing of Human Subjects – Different Mechanism Angles ....................... 72
4.6 Testing of Human Subjects – Mechanism/Wheel Comparison .................. 74
5 Results ...................................................................................................................... 76
5.1 Results of Testing of Subjects at Different Mechanism Angles .................. 76
5.2 Results of Testing Subjects – Mechanism/Wheel Comparison................... 84
6 Conclusions.............................................................................................................. 94
6.1 Specific Accomplishments of This Research (What’s New)........................ 96
7 Recommendations ................................................................................................... 97 References …………………………………………………………………………………………….. .. 99
Appendix A ……………………………………………………………………………………………..101 Appendix B ……………………………………………………………………………………………. 110 Appendix C ……………………………………………………………………………………………. 114

v
List of Figures
Figure 1 - Wheelchair Stroke Patterns ................................................................................ 7 Figure 2 - Example of Power Assist Device..................................................................... 13 Figure 3 - Lever One Arm Drive Wheelchair ................................................................... 15 Figure 4 - Example Of Lever Drive Wheelchair .............................................................. 16 Figure 5 - Example of Lever Drive Wheelchair ............................................................... 17 Figure 6 - Wijit Assistive Device ............................................................................................. 18 Figure 7- Lever Asynchronous Propelled Wheelchair...................................................... 20 Figure 8- Example of Specialty Wheelchair ..................................................................... 21 Figure 9- Cardan Gearing System..................................................................................... 25 Figure 10 - Cardan Gearing Without Internal Gear .......................................................... 25 Figure 11 - Simplified Cardan System With Eccentricity ................................................ 27 Figure 12 - Wheelchair View With Mechanism and Sprockets ....................................... 28 Figure 13 - Example of Elliptical Path of Mechanism Handle......................................... 29 Figure 14 - Mechanism Position 0 Degrees Offset ........................................................... 29 Figure 15 - Mechanism Position 45 Degrees Offset......................................................... 30 Figure 16- Labeling System for Gear Selection ............................................................... 31 Figure 17 - Design of Gear Arm (Lever A) ...................................................................... 32 Figure 18 - Lever B, Handle, and Shaft Complex ............................................................ 33 Figure 19 - Back Connecting Lever.................................................................................. 34 Figure 20 - Elliptical Path Labels ..................................................................................... 35 Figure 21 - Exploded View of Innovative Mechanism..................................................... 36 Figure 22 - Side View Of Innovative Mechanism............................................................ 37 Figure 23 - Coordinate System Definition for Mechanism Position Analysis ................. 38 Figure 24 - Isometric View of Dynamometer Setup......................................................... 42 Figure 25 - Rear View of Dynamometer Setup ................................................................ 43 Figure 26 - Picture of Magtrol Dynamometer .................................................................. 44 Figure 27 - Magtrol DSP6000 Controller ......................................................................... 45 Figure 28 - Y - Direction Free Body Diagram (Wheels) .................................................. 46 Figure 29 - X - Direction Free Body Diagram (Wheels) .................................................. 47 Figure 30 - Y-Direction Shear Diagram For Wheels....................................................... 48 Figure 31 - Y-Direction Moment Diagram For Wheels ................................................... 48 Figure 32 - X-Direction Shear Diagram for Wheels......................................................... 49 Figure 33 - Y-Direction Moment Diagram For Wheels ................................................... 49 Figure 34 - X - Direction Free Body Diagram (Sprocket)................................................ 52 Figure 35 - Y - Direction Free Body Diagram (Sprocket)................................................ 52 Figure 36 - X - Direction Shear Diagram (Sprockets)..................................................... 53 Figure 37 – X - Direction Moment Diagram (Sprockets)................................................. 54 Figure 38 – Y - Direction Shear Diagram (Sprockets) ..................................................... 54 Figure 39 – Y - Direction Moment Diagram (Sprockets)................................................. 54

vi
Figure 40 - Testing Apparatus Picture 1 ........................................................................... 60 Figure 41 - Testing Apparatus Picture 2 ........................................................................... 60 Figure 42 - Testing Apparatus Picture 3 .......................................................................... 61 Figure 43 - Example of Handle Path (0-Degrees) ............................................................ 63 Figure 44 - Second Example of Handle Path (45-Degrees).............................................. 64 Figure 45 - Measurement of Human Angle ...................................................................... 65 Figure 46 - Torque Analysis - 45 Degrees Offset............................................................. 67 Figure 47 - Torque Analysis - 60 Degree Offset .............................................................. 68 Figure 48 - Torque Analysis - 70 Degrees Offset............................................................. 69 Figure 49 - Results of Curve Fit Analysis ........................................................................ 70 Figure 50 - Diagram of Wheelchair Ramp Requirements ................................................ 72 Figure 51 - RPM Results For Subject 6 (10*lbs).............................................................. 77 Figure 52 - RPM Results For Subject 7 (10 in*lbs).......................................................... 77 Figure 53 - RPM Results For Subject 8 (10 in*lbs).......................................................... 78 Figure 54 - RPM Results For Subject 1 (10 in*lbs).......................................................... 79 Figure 55 - RPM Results For Subject 2 (10 in*lbs).......................................................... 80 Figure 56 - RPM Results For Subject 3 (10 in*lbs).......................................................... 81 Figure 57 - RPM Results For Subject 4 (10 in*lbs).......................................................... 82 Figure 58 - RPM Results For Subject 5 (10 in*lbs).......................................................... 82 Figure 59 - RPM Results For Subject 9 (10 in*lbs).......................................................... 83 Figure 60 - RPM Results For Subject 10 (10 in*lbs)........................................................ 83 Figure 61 - RPM Results For Subject 1 - Wheels (10 in*lbs) .......................................... 86 Figure 62 - RPM Results For Subject 3 - Wheels (10 in*lbs) .......................................... 87 Figure 63 - RPM Results For Subject 4 - Wheels (10 in*lbs) .......................................... 87 Figure 64 - RPM Results For Subject 6 - Wheels (10 in*lbs) .......................................... 88 Figure 65 - RPM Results For Subject 8 - Wheels (10 in*lbs) .......................................... 88 Figure 66 - RPM Results For Subject 10 - Wheels (10 in*lbs) ........................................ 89 Figure 67 - RPM Results For Subject 7 - Wheels (10 in*lbs) .......................................... 90 Figure 68 - RPM Results For Subject 2 - Wheels (10 in*lbs) .......................................... 91 Figure 69 - RPM Results For Subject 9 - Wheels (10 in*lbs) .......................................... 91 Figure 70 - Drawing Of Back Connecting Lever............................................................ 102 Figure 71 - Drawing Of Lever B..................................................................................... 103 Figure 72 - Drawing Of Lever A (Gear Bar) .................................................................. 104 Figure 73 - Drawing Of Mechanism Shaft #1 ................................................................ 105 Figure 74 - Drawing Of Shaft #2 .................................................................................... 106 Figure 75 - Drawing Of Sun Sprocket ............................................................................ 107 Figure 76 - Drawing Of Planet Sprocket ........................................................................ 108 Figure 77 - Drawing Of Connecting Roller Chain Sprocket .......................................... 109 Figure 78 - Results of Torque Analysis For Subject 1.................................................... 115 Figure 79 - Results of Torque Analysis For Subject 2.................................................... 115 Figure 80 - Results of Torque Analysis For Subject 3.................................................... 116 Figure 81 - Results of Torque Analysis For Subject 4.................................................... 116 Figure 82 - Results of Torque Analysis For Subject 5.................................................... 117 Figure 83 - Results of Torque Analysis For Subject 6.................................................... 117 Figure 84 - Results of Torque Analysis For Subject 7.................................................... 118 Figure 85 - Results of Torque Analysis For Subject 8.................................................... 118

vii
Figure 86 - Results of Torque Analysis For Subject 9.................................................... 119 Figure 87 - Results of Torque Analysis For Subject 10.................................................. 119 Figure 88 - Torque Results For Subject 1 (10 in*lbs) .................................................... 121 Figure 89 - RPM Results For Subject 1 (10 in*lbs)........................................................ 121 Figure 90 - Horsepower Results for Subject 1 (10 in*lbs) ............................................. 122 Figure 91 - Torque Results For Subject 2 (10 in*lbs) .................................................... 122 Figure 92 - RPM Results For Subject 2 (10 in*lbs)........................................................ 123 Figure 93 - Horsepower Results For Subject 2 (10 in*lbs) ............................................ 123 Figure 94 - Torque Results For Subject 3 (10 in*lbs) .................................................... 124 Figure 95 - RPM Results For Subject 3 (10 in*lbs)........................................................ 124 Figure 96 - Horsepower Results For Subject 3 (10 in*lbs) ............................................ 125 Figure 97 - Torque Results For Subject 4 (10 in*lbs) .................................................... 125 Figure 98 - RPM Results For Subject 4 (10 in*lbs)........................................................ 126 Figure 99 - Horsepower Results For Subject 4 (10 in*lbs) ............................................ 126 Figure 100 - Torque Results For Subject 5 (10 in*lbs) .................................................. 127 Figure 101 - RPM Results For Subject 5 (10 in*lbs)...................................................... 127 Figure 102 - Horsepower Results For Subject 5 (10 in*lbs) .......................................... 128 Figure 103 - Torque Results For Subject 6 (10 in*lbs) .................................................. 128 Figure 104 - RPM Results For Subject 6 (10 in*lbs)...................................................... 129 Figure 105 - Horsepower Results For Subject 6 (10 in*lbs) .......................................... 129 Figure 106 - Torque Results For Subject 7 (10 in*lbs) .................................................. 130 Figure 107 - RPM Results For Subject 7 (10 in*lbs)...................................................... 130 Figure 108 - Horsepower Results For Subject 7 (10 in*lbs) .......................................... 131 Figure 109 - Torque Results For Subject 8 (10 in*lbs) .................................................. 131 Figure 110 - RPM Results For Subject 8 (10 in*lbs)...................................................... 132 Figure 111 - Horsepower Results For Subject 8 (10 in*lbs) .......................................... 132 Figure 112 - Torque Results For Subject 9 (10 in*lbs) .................................................. 133 Figure 113 - RPM Results For Subject 9 (10 in*lbs)...................................................... 133 Figure 114 - Horsepower Results For Subject 9 (10 in*lbs) .......................................... 134 Figure 115 - Torque Results For Subject 10 (10 in*lbs) ................................................ 134 Figure 116 - RPM Results For Subject 10 (10 in*lbs).................................................... 135 Figure 117 - Horsepower Results For Subject 10 (10 in*lbs) ........................................ 135 Figure 118 - Torque Results - Subject 1 - Wheels (10 in*lbs) ....................................... 136 Figure 119 - RPM Results - Subject 1 - Wheels (10 in*lbs) .......................................... 136 Figure 120 - Horsepower Results - Subject 1 - Wheels (10 in*lbs) ............................... 137 Figure 121 - Torque Results - Subject 2 - Wheels (10 in*lbs) ....................................... 137 Figure 122 - RPM Results - Subject 2 - Wheels (10 in*lbs) .......................................... 138 Figure 123 - Horsepower Results - Subject 2 - Wheels (10 in*lbs) ............................... 138 Figure 124 - Torque Results - Subject 3 - Wheels (10 in*lbs) ....................................... 139 Figure 125 - RPM Results - Subject 3 - Wheels (10 in*lbs) .......................................... 139 Figure 126 - Horsepower Results - Subject 3 - Wheels (10 in*lbs) ............................... 140 Figure 127 - Torque Results - Subject 4 - Wheels (10 in*lbs) ....................................... 140 Figure 128 - RPM Results - Subject 4 - Wheels (10 in*lbs) .......................................... 141 Figure 129 - Horsepower Results - Subject 4 - Wheels (10 in*lbs) ............................... 141 Figure 130 - Torque Results - Subject 6 - Wheels (10 in*lbs) ....................................... 142 Figure 131 - RPM Results - Subject 6 - Wheels (10 in*lbs) .......................................... 142

viii
Figure 132 - Horsepower Results - Subject 6 - Wheels (10 in*lbs) ............................... 143 Figure 133 - Torque Results - Subject 7 - Wheels (10 in*lbs) ....................................... 143 Figure 134 - RPM Results - Subject 7 - Wheels (10 in*lbs) .......................................... 144 Figure 135 - Horsepower Results - Subject 7 - Wheels (10 in*lbs) ............................... 144 Figure 136 - Torque Results - Subject 8 - Wheels (10 in*lbs) ....................................... 145 Figure 137 - RPM Results - Subject 8 - Wheels (10 in*lbs) .......................................... 145 Figure 138 - Horsepower Results - Subject 8 - Wheels (10 in*lbs) ............................... 146 Figure 139 - Torque Results - Subject 9 - Wheels (10 in*lbs) ....................................... 146 Figure 140 - RPM Results - Subject 9 - Wheels (10 in*lbs) .......................................... 147 Figure 141 - Horsepower Results - Subject 9 - Wheels (10 in*lbs) ............................... 147 Figure 142 - Torque Results - Subject 10 - Wheels (10 in*lbs) ..................................... 148 Figure 143 - RPM Results - Subject 10 - Wheels (10 in*lbs) ........................................ 148 Figure 144 - Horsepower Results - Subject 10 (10 in*lbs)............................................. 149 Figure 145 - Labeled Parts For Dynamometer Setup ..................................................... 150

ix
List of Tables Table 1– Wheelchair Use Related Injuries ......................................................................... 3 Table 2 - Compilation Table of Various Mechanism Parameters..................................... 35 Table 3 - Ellipse Compilation Data .................................................................................. 36 Table 4 - Magtrol Dynamometer Requirements ............................................................... 44 Table 5 - Results Of Boundary Conditions and Integration Constants............................. 51 Table 6 - Results of Boundary Conditions and Integration Constants.............................. 56 Table 7 - Results of Analysis With Wheelchair Wheels................................................... 57 Table 8 - Results of Analysis With Innovative Mechanisms............................................ 57 Table 9 - Summation of Sprocket Sizes............................................................................ 59 Table 10 - Parameter Inputs for Mechanism Handle Position.......................................... 62 Table 11 - Results of Human Angle Analysis .................................................................. 66 Table 12 - Comparison of Results For Mechanism Position Angle ................................. 71 Table 13 - Comparison of RPM Data For Wheels and Innovative Mechanism ............... 84 Table 14 - Horsepower Comparison of Wheel and Innovative Mechanism Propulsion
Methods..................................................................................................................... 92 Table 15 - Results of Energy Analysis for Wheels and Innovative Mechanism Propulsion
................................................................................................................................... 94 Table 16 - Results For Deflection and Stress Analysis -Table 1 .................................... 111 Table 17 - Results for Deflection and Stress Analysis -Table 2 ..................................... 112 Table 18 - Results of Deflection and Stress Analysis - Table 3 ..................................... 113 Table 19 - Testing Torque Calculation Spreadsheet....................................................... 120

1
1 Introduction
1.1 Declaration of Problem
Wheelchair development and use has become a topic of importance. There are
approximately 1.4 million users of wheelchairs (in the world) and if those 75% are using
a manual wheelchair. This figure is estimated to be growing at a rate of approximately
10% per year. Most manual wheelchair users have lower-extremity weakness,
amputation, or paralysis that makes walking difficult. These injuries may include spinal
cord injuries, hemiplegia, other paralysis, multiple sclerosis, cerebral palsy, spina bifida,
arthritis, or lower-limb amputations1.
Through increased legislation over the past twenty years, many new opportunities,
such as increased access, employment, and mobility, have been granted to wheelchair
users. The average of the population with disabilities in West Virginia is 2.9 percent,
whereas the national average is only 1.6 percent2. Therefore a higher percentage of the
citizens of West Virginia benefit more than most other states from this legislation. From
these statistics, it is easy to understand how users manual wheelchairs, can greatly benefit
from advances in wheelchair mobility and propulsion.
The environment of a wheelchair user is a very complex and difficult place in
which to maneuver. Some of the environmental factors that affect a wheelchair user’s
mobility are functions of the rolling surface; uneven, broken, or missing sidewalks,
inclined surfaces, and weather affected areas. Most wheelchairs are not equipped with
the necessary options to be able to transverse over such surfaces as sand, dirt, loose
gravel, or even thick carpeting. Consider the complexity of negotiating uneven sidewalks

2
or sidewalks that do not have ramps to enter from the street. These challenges might
discourage even the most physically able person. What if an icy sidewalk or a ramp is
added? The situation could become an almost impossibility for the average wheelchair
user with today’s technologies. There is a great need to find more efficient mechanisms
for wheeled-mobility patients.
A person’s inability to maneuver a wheelchair through the above-mentioned
environments could severely limit his or her independence. Lack of independence can
have a great affect on mental and physical health. The use of a manual wheelchair can
counteract these ill affects by improving a users cardiovascular and muscular strength.
Wheelchair users have less opportunity for aerobic exercise. Normally, the only aerobic
exercise that a wheelchair user has will be derived from propelling their wheelchair for
daily activities. Many elderly and frail individuals are unable to use a manual
wheelchair, but their health, both mental and physical, may be improved by extending the
time in which they can use the wheelchair1. Assistive technologies are being developed
to enable elderly and weaker individuals to gain greater mobility and independence.
These devices benefit them and generally lead to a higher quality of life.
It is the goal of this research to create, design, construct, and test a new assist
device that can be retrofitted into a standard wheelchair frame that will reduce the
potential of injury and produce a higher quality of life for wheelchair users.

3
1.2 Literature Review
1.2.1 Prelude
In this section the literature related to wheelchair injuries, stroke patterns, and
other devices will be explored. From this literature review the issues appropriate for the
hypothesized mechanism can be delineated.
1.2.2 Wheelchair Related Injuries
Users of wheelchairs experience a wide variety of physical injuries. Recent
studies have shown that the high degree of reliance of wheelchair users on the upper-
body and associated muscular skeleton system, along with the repetitiveness of the
wheelchair-stroking pattern, predisposes them to overuse injuries; especially at the
shoulder, elbow, and wrist3. The following table gives a summary of the various injuries,
and percentages of wheelchair users that experience these injuries.
Table 1– Wheelchair Use Related Injuries1
Injury Type Percentage of Wheelchair UsersShoulder-Related Injuries 51
Elbow Pain 16Wrist Pain 13Hand Pain 11
Rotator Cuff Greater Than 50Carpal Tunnel Greater Than 50
Table 1 only gives a small list of the injuries that wheelchair users develop.
Other injuries and conditions that wheelchair users encounter are: backaches, exhaustion,
burning of the hands on the rims, dirty clothes, dirty hands, perspiration, and over
heating4. Most of these injuries occur from an overuse or misuse of the muscles in the
shoulders, arms, and hands.

4
Wheelchair users face a higher percentage of certain injuries than the population
at large. For example, the incidence of carpal tunnel and rotator cuff tendonitis are
greater than 50 percent for wheelchair users as compared to 3 percent for the general
population1. Many of the injuries are produced by the manner in which an individual
must use their body while operating a wheelchair. On a standard wheelchair, the only
way to stop the chair comes from the force a person applies to the pushrim with his or her
hands. This continuous rubbing on the pushrim causes blisters. In general the inward
force generated by a wheelchair user does not help in braking or chair propulsion, but is
necessary for the user to gain friction with the pushrim on the wheel
Research in the field of wheelchair related injuries is an ongoing topic. Some
general conclusions can be reached from the above review: (1) The basic injuries are to
the shoulder and wrist. These are due to the repetitive nature required for wheelchair
propulsion. (2) Propulsion of the standard wheelchair requires the individual to use his
body in a way that may be responsible for some of these injuries. The following pages
contain some case studies that give an illustration of various research that is currently
being done in the area of preventing wheelchair related injuries.
1.2.2.1 Case Study I
Kibler studied the results of stretch weakness and inadequately developed
opposing muscles. Kibler advocated a preventive exercise program to stretch the muscles
most likely to be overdeveloped, and to strengthen the muscles most likely to show
stretch weakness. For the basic wheelchair user, this would mean that the anterior upper
body musculature is most likely to need stretching and the posterior upper body

5
musculature is most likely to need strengthening. This hypothesis was based on earlier
work that suggested that therapeutic exercise intervention specifically designed to stretch
and strengthen these given muscle groups may possibly reduce the risk of overuse
injuries. The procedures used to test the subjects will not be explained, but the results
from the testing will be presented. After the proper training and strengthening,
wheelchair users gained a significant increase in the peak joint moments at the wrist,
elbow, and shoulder. There was a 17.4% increase in the peak propulsive moment at the
handrim. At the wrist joint, there was a 14.4% increase in the ulnar deviation moment.
The extensor moment at the elbow increased by 16.9%, and the flexor moment at the
shoulder increased by 13.6%. Peak joint reaction force changes at the wrist included a
14.5% decrease in the shear force in the radioulnar direction and a 7.6% increase in the
compressive force. The anteroposterior shear forces increased 15.8% at the elbow, and
14.3% at the shoulder3. These findings suggested that specific training for wheelchair
users improved wheelchair propulsion mechanics and decreased the probability of
overuse injuries. Further investigation of joint kinetic changes is continuing and it is
anticipated that an optimal exercise protocol can be developed.
The general conclusion of this case study is that wheelchair injuries occur
from repetitive asymmetric muscle use and an exercise programs that promotes
symmetric muscle development can reduce the occurrence of such injuries.
--------------------------------------

6
1.2.2.2 Case Study II
This study characterizes wheelchair propulsion stroke patterns through the
investigation of joint accelerations, joint range of motion (ROM), propulsion phases, and
stroke efficiency. The second metacarpophalangeal joint plots of seven subjects were
used to obtain the data. The kinematic data revealed three distinct stroke patterns. The
following descriptions characterize those patterns: semi-circular (SC), single looping
over propulsion (SLOP), and double looping over propulsion (DLOP). These patterns are
shown in Figure 1 on the next page. The subjects using the SC (Figure 1-A) stroke
pattern dropped their hands below the propulsion path during the recovery phase. The
subjects using SLOP and DLOP stroke patterns lifted their hands over the propulsion
path during the recovery phase. The subjects not sharing a common point on the
propulsion and recovery strokes characterized the SLOP (Figure 1-B) stroke pattern. The
DLOP (Figure 1-C) stroke pattern had a characteristic shared point on both the
propulsion and recovery phases. Figure 1 gives an illustration of the different stroke
patterns that were characterized.

7
Figure 1 - Wheelchair Stroke Patterns5 From Figure 1 it can be seen that none of the given subjects used a pumping
stroke pattern. The pumping stroke pattern is considered to be a pattern used by
inexperienced wheelchair users.
It has long been known that high joint accelerations are the cause of many
wheelchair related injuries of the shoulder, elbow, and hand. The changes in joint angles
were quantified through an analysis of joint accelerations. This study revealed that
subjects with the SC pattern had smaller flexion/extension and shoulder
abduction/adduction acceleration measures during the slower speed, as compared to the

8
other stroke patterns. This decrease in acceleration may lessen the risk of acceleration-
related injuries.
The joint excursions data was then used to determine whether the joints were
being exposed to abnormal ROM during propulsion. This analysis revealed that subjects
with the SC stroke pattern did have a larger ROM during propulsion, but this data was
then compared to normal ROM for the given joints and it was concluded that the ROM
for the SC stroke pattern was within the satisfactory range. In addition, the study found
that individuals with the SC stroke pattern spent a greater percentage of the cycle time
(CT) in the propulsion phase of the stroke. By analyzing phases alone, it was concluded
that subjects using the SC stroke pattern are more efficient because a larger amount of
time is spent in the propulsion phase, which in turn produces a larger impulse at the
pushrim. Through the analysis of the data for this study, it was hypothesized that the
manual wheelchair users with the SC stroke pattern were more biomechanically efficient
when propelling a wheelchair. These subjects had the positive qualities of lower shoulder
and elbow joint acceleration measures, along with a greater percentage of time spent in
the propulsion phase of the wheelchair stroke. These individuals may also be less prone
to injury because they apply less force to the pushrim over a greater amount of time5.
In conclusion, this study hyposthesized that the simple elliptical path of the
semi-circular stroke produces less injuries to the shoulder and arm complex than
the other two patterns that are frequently employed by wheelchair users. Thus, any
device that we would like to develop should have an elliptical path in which the force is
as close to uniform over the path as possible.
-----------------------------

9
Wheelchair related injuries come at a price to insurance companies and ultimately
the population at large. Over a three-year period from 1995-1997 Medicare expenditures
for manual wheelchairs averaged $98,000,0006. There is a need for a device that could
be affixed to standard wheelchairs so users have the propulsive abilities of a powered
chair. This device would then allow for less expensive standard wheelchairs to be used
instead of more expensive wheelchairs that are used to accomplish that task. It is one
goal of this research to construct and test such a device.
1.2.3 Determining Wheelchair Type – User’s Ability
There are a wide variety of wheelchairs that are available to each individual. The
three main classifications of standard two-armed propelled wheelchairs are standard,
standard lightweight, and heavy-duty wheelchairs. Standard wheelchairs are normally
heavier than a high-end wheelchair, tending to weigh more than 44 pounds. There are
only a few options that are available on the standard chair. The standard lightweight
wheelchairs are lighter and often have more manufacturer options than the standard
wheelchair. In addition, they have more aftermarket options that are available. The
heavy-duty wheelchairs are made to operate at a higher load capacity, often up to 348
pounds. These heavy-duty wheelchairs are also proportionately heavier and cost more
than the standard chair7.
The cost and weight of a wheelchair are real concerns for the individuals who use
them. In many cases Medicare, Veteran’s Administration, and other insurances will pay
for most if not all of the cost of the wheelchair, but the person still must be able to
maneuver the wheelchair in and out of the car and around his or her environment. Where

10
independence issues are involved, lighter wheelchairs are seen as advancement because
they are easier to maneuver in and out of the back seat of a vehicle. A lot more emphasis
is being placed on the weight of the wheelchair because lightweight wheelchair users can
gain more independence. Lighter weight wheelchairs are more expensive, but their cost
must be weighed against the value of increased mobility and independence. It is a goal of
this research to develop a wheelchair mechanism that can be retrofitted into a standard
weight wheelchair and cost less than a lightweight wheelchair, but provide more mobility
and independence than a lightweight wheelchair.
1.2.4 Wheelchair User Qualification List
The needs of various wheelchair users can be very different. It is often necessary
to assess the ability of the user in order to gain a better fit to the individual. These
questions are often used to start a physical assessment:
� Is the user able to self propel? � What are the postural requirements? � What is the visual and cognitive ability of the user? � How does the user transfer?
The issues of self propelled motion, postural requirements, and transfer will give
the technician, doing the assessment, an understanding of the chair for a particular
individual. In addition, the issue of propulsion type must be considered to define the
proper wheelchair mechanism for a specific person. The following is a list of how most
propulsion issues are fitted:
� With both arms � With one arm � Foot propelled

11
Once the issue of propulsion has been addressed, the user can test several chairs
and configurations to determine which meets his or her needs7. Each of the above
mentioned types of propulsion are possible with today’s wheelchairs, and the following
sections will outline the different types of wheelchair propulsion that are available.
1.2.5 Types of Wheelchair Propulsion
1.2.5.1 Prelude
In this section of the literature review various assist devices and mechanisms are
described, along with a description of their advantages and disadvantages. This helped
the researcher to decide the best type of mechanism that could be developed at WVU.
The five types of wheelchair propulsion that will be looked at are geared hubs, power
assists, one arm drives, lever drives, and specialty wheelchairs.
1.2.5.2 Geared Hubs
A gearing system on a wheelchair provides the user the ability to switch from one
gear to the next as the incline or environmental conditions change. The gearing system
provides the mechanical advantage necessary to accommodate these changes. In many
situations, the gearing systems can be installed and used with standard hand rims.
Currently, the geared hubs for wheelchairs only have a limited number of gear ratios
available. The gearing system works in the same manner as a transmission works on a
bicycle. Whenever the user is going up a hill and needs more power, a lower gear can be
used to generate the needed power to transverse the obstacle. However, the user can then
switch back to a higher gear once the obstacle has been conquered and proceed as

12
normal. There is an infinite amount of gearing options that should be available with this
system, but without a demand and standardization, the system will never be used to its
full capacity. This system has the ability to be adjusted to meet each person’s individual
needs. This could be a customized application.
There are drawbacks to geared hub propulsion systems. (1) The act of switching
from one gear to the next can be “sloppy” and cause “play” in the system. (2) Whenever
a low gear is used, the user will have to propel the hand rims more than when a higher
gear is used. The added power comes at the expense of physical exertion. (3) This type
of system also adds extra weight to the wheelchair. Since these types of wheelchairs
have extra weight added, maneuverability may be a problem. (4) An automatic braking
system may need to be added to help the user slow the wheelchair down. (5) Some
geared systems inhibit the user from folding the chair. This feature adds an extra burden
to the user and makes independent automobile use almost non-existent for all
automobiles except vans. (6) With this type of system, the user could actually be at a
disadvantage when traveling for long distances due to the mechanical loss in the gearing
system and added weight of the wheelchair. (7) Above all, wheelchair users have not
accepted the geared hub systems as a viable solution to the current wheel-mobility
problems1.

13
1.2.5.3 Power Assists
The power assist system is an add-on used to turn a manual wheelchair into a
power wheelchair. This type of system gives the user the ability to use the wheelchair as
a standard manual chair or as a power chair with the add-on feature. The add-on power
assist feature is much cheaper than a power chair, but at the same time, it gives the user
all of the advantages a power chair. The power assist add-on is used whenever the user
wants to go up hills or over terrain that is beyond their physical ability to navigate. This
feature allows greater mobility and increased independence in the surrounding
environment. Another valuable feature of the power assist chair is that it can aid in
stopping the chair without grabbing the wheels or using wheel locks.
Figure 2 - Example of Power Assist Device8

14
With the advantages of this system come a number of disadvantages. (1) The
current power assists are not manufactured so that they can be fit onto a wide variety of
wheelchair styles. (2) Many of the wheelchairs that use power assists are hard to fold and
do not allow the user to put the wheelchair into the back seat of a car easily. (3) Another
concern, that many people have, is that the user could get the chair into a situation that he
or she would not normally venture into with a standard manual wheelchair. (4) Once
again, one of the biggest disadvantages of the power assist system is that it adds weight
and complexity to the wheelchair. (5) By adding weight to the chair, an individual will
not be able to get the wheelchair in and out of a car as easily. (6) The complexity of the
power assist mechanism will add more maintenance to the wheelchair4.
1.2.5.4 One Arm Drive
The one arm drive wheelchair is a type of wheelchair that you do not see
frequently. The wheelchair is propelled by a double hand rim system located on one side
of the chair. The user has the ability to lock the hand rims together and propel both at the
same time, or the rims can be propelled separately to give control to one side of the
wheelchair or the other. The users of these types of wheelchairs ordinarily encounter co-
ordination problems when the wheelchair is first acquired. In addition, the complexity of
trying to negotiate a hill or even a slope can be an almost impossible task for this type of
propulsion system9. Most people do not have the strength needed in only one arm to
propel themselves on relatively flat ground let alone a slope or hill. The operation of this
type of chair requires a lot of practice and co-ordination to use correctly.

15
A second type of one arm drive chair exists that uses a lever on one side of the
chair to propel the entire chair. Figure 3 shows an example of one such chair.
Figure 3 - Lever One Arm Drive Wheelchair10
The lever on the side of the wheelchair can be adjusted and positioned on either
side of the chair, thus it is ambidextrous10. The lever style design will give the user a
more natural feel and requires less time to adjust to the wheelchair design. But, this type
of chair still has the disadvantage of having to switch power from one wheel to the other
in order to propel the wheelchair around turns and corners. Consequently, the lever one
arm drive chair has the same disadvantages on hills and slopes as the push rim one arm
drive chair. In order to use either wheelchair, a person must be able to generate enough
power with one arm as the standard wheelchair users do with two arms for a given
distance. This type of design can be used to give a person with the use of only one arm

16
exercise, and it helps to keep these patients from becoming totally dependant on a power
wheelchair.
1.2.5.5 Lever Drive
Lever propulsion systems for wheelchairs are not a new idea. For years people
have been working on specialty wheelchair lever mechanisms. Many of the early lever
systems resembled the propulsion systems from bicycles. Some of these systems are only
called lever drives because they use a handle attached to a lever to provide a mechanical
advantage on the chain mechanism. The systems that are used to propel the wheelchair
on these models simply look like the pedals of a bicycle mounted above the frame of the
wheelchair.
Figure 4 - Example Of Lever Drive Wheelchair10
In many cases, the user needs to be strapped into the chair to be sure that he or she
does not fall out during operation. Placing a different type of seat that allows the user to
set back further and in a reclined position in the wheelchair could solve this problem.

17
Another type of lever drive wheelchair that has been developed uses a chain drive
on both sides that allows for independent operation of the wheels. Figure 5 gives an
example of one such lever drive wheelchair.
Figure 5 - Example of Lever Drive Wheelchair11
This type of wheelchair gives the user a more reclined position so that the user is
not falling out of the chair while it is being propelled. In addition, this wheelchair gives
the user a more standard feel by allowing two-sided propulsion. The motion is more
natural for the user and not a big change from a standard wheelchair design.
Another assistive lever device that has been invented for wheelchair propulsion is
the Wijit12. The Wijit is a device that was developed as a result of nine years of research.
It is a wheelchair propulsion and braking device that consists of levers on both sides of
the chair. The figure below shows an example of the Wijit system.

18
Figure 6 - Wijit Assistive Device12
The assistive technology of the Wijit reduces the stress that is normally placed on
the upper extremities during propulsion of a standard wheelchair, and amplifies the users
force by approximately 50%. In addition, the Wijit allows the user to sit erect in the chair
that provides better back support. This device permits wheelchair propulsion with
minimal grip changes and offers a variety of hand positions to accommodate a wider
range of impairments. The Wijit weighs less than 10 pounds and does not add more than
2 inches to the width of a wheelchair. However, this device only allows for a propulsion
stroke in one direction. The user will still have the asymmetric muscle development
associated with standard wheelchair propulsion.
Lever drive wheelchairs provide the user with a mechanical advantage over a
standard drive wheelchair through the use of chains and gearing. In addition, lever drive
wheelchairs also provide the user with a less tiresome method of propulsion. Instead of
the unnatural method of a conventional wheelchair, the user is able to use his or her arm
in a more natural and powerful manner. Additional advantage can be achieved by

19
changing the wheel size based on the user’s mobility needs, or changing the lever
position on the wheelchair to meet the comfort needs of the user.
On the other side, levers have a lower acceptance by users than standard
wheelchairs. The lever systems add weight to the wheelchair and in some cases inhibit
the wheelchair from being folded. This in turn inhibits the user from transporting the
chair in the back of automobiles. One of the biggest drawbacks of lever systems is that
they make side transfers very difficult4. Unless, the lever is mounted in a way that makes
it removable, the user is unable to transfer out the side of the wheelchair.
The following section is an example of research that has been done on the
mechanical advantage of lever drive propulsion.
1.2.5.5.1 Case Study III
This study was conducted to test the premise that in general manual wheelchair
propulsion is an inefficient form of human transportation. Handrim propulsion will lead
to relatively high strain on the musculoskeletal and cardio respiratory systems. The net
result will be high-energy consumption, high heart rate, low mechanical efficiency, and
future complaints related to the structures of the upper limb. Past research had shown
that crank and lever-propelled wheelchairs appeared to be less straining forms of
transportation. It had been shown that lever-propelled wheelchairs lead to lower physical
strain compared to handrim-propelled wheelchairs. Another advantage of lever-propelled
mechanisms is that they allow for a more ergonomic optimization to the individual
physical characteristics of the user. For this given study, the levers on the chair were
coupled together with a Bowden cable, and their orientation only allowed asynchronous

20
arm use, at a fixed position 180 degrees out of phase. A figure of the tested wheelchair
can be found below.
Figure 7- Lever Asynchronous Propelled Wheelchair
For all of the given tests, the mechanical advantage was controlled by using a
five-gear transmission (gear box). The current lever system that was used for the test
does not have an idle phase, and it does not have a “dead spot” at both ends. With this
design, the external force varies sinusoidally with the lever orientation. The mechanical
advantage of the gearing system was shown to have an effect on oxygen uptake,
mechanical efficiency, and energy expenditure. At the same power output level, the
mechanical efficiency of lever wheelchair propulsion in this study tended to increase and
energy expenditure tended to decrease as the mechanical advantage decreased13. Similar
studies on handrim propulsion were used to confirm these findings. Lastly, in this study,
the mechanical advantage was studied using a varied gearbox. The study also stated that
the mechanical advantage should be studied using varied lever lengths and changing
other aspects of the given wheelchair13. This study only used the mechanical advantage
of a gearbox. These results could be different if a longer lever were used, or if the seat

21
were positioned differently for the user. These are all aspects that must be considered
when testing for mechanical advantages on any type of system.
Most lever-powered wheelchairs are still developed to encourage asymmetric
muscle development. In addition, extra weight is still being added to the wheelchairs,
and these wheelchairs have not shown a real distinct advantage and thus they are not
widely accepted by the community of wheelchair users.
1.2.5.6 Specialty Chairs
In the scope of this paper, specialty wheelchair design includes everything from
standard power wheelchairs to wheelchairs that have the ability to climb stairs. The one
specialty chair that will be considered for discussion in this section is a power wheelchair
that has the means to give the user the ability to reach objects on higher shelves, and it
can climb stairs. Figure 8 contains a picture of the new revolutionary wheelchair.
Figure 8- Example of Specialty Wheelchair14

22
The inventor created this new wheelchair design after he watched people struggling to
use a standard wheelchair. The new wheelchair design uses sophisticated gyroscopes,
electric motors and computers to accomplish the goal of wheeled mobility.
The price and the inability to provide physical exercise are real drawbacks to
electric wheelchairs and this type of specialty wheelchair. Since the wheelchair is
powered by electric motors, the user will not get the exercise that is involved with the
operation of a standard manual wheelchair. However, the benefits that the chair provides
in mobility around a given environment could possibly be enough to offset the
drawbacks. It would be up to the given patient to weigh all the options. With this
wheelchair people would once again be able to go places and take part in activities that
they thought were once beyond their abilities.
1.3 Problem Statement
Upon completion of this research endeavor of an innovative wheelchair
mechanism, this thesis will show that the investigator completed the following tasks:
� Designed an innovative mechanism that incorporates the elliptical path of the
semi-circular stroke pattern that can be used to power a standard wheelchair.
This mechanism allows for simple construction and can be able to be retrofit
onto existing wheelchairs. The mechanics of this new design should not
inhibit symmetric muscle usage during its operation. Thus, it should have the
potential of reducing repetitive motion injuries common to standard manual
wheelchair users.

23
� Provided theoretical and practical modeling of the innovative mechanism.
The function of the innovative mechanism can be easily seen.
� Designed and constructed a prototype of the innovative mechanism that was
retrofitted into a standard wheelchair.
� Designed and constructed a testing station for the sole purpose of analyzing
and comparing the innovative mechanism to standard wheelchair propulsion.
� Showed a comparative analysis of the innovative mechanism to the standard
wheels on a wheelchair. This analysis included tables, graphs, and good
engineering data and assumptions to support the hypothesis.
2 Mechanism Development
The new mechanism that has been conceived is unlike any of the conventional
wheelchair or lever-actuated propulsion systems on the market today. Many of the other
lever-actuated motion devices use a ratcheting motion, that in turn only allows for
propulsion in one direction. These types of devices do not strengthen both sides of the
shoulder and upper arm complex simultaneously. Instead, addition exercise and strength
training are needed to reduce the risk of rotator cuff and other wheelchair related
injuries3. The new mechanism operates on a push/pull motion. Power is provided
during the entire stroke, and not just in one direction. This should lead to a more
desired symmetric muscle development. This would eliminate problems that are
associated with only developing one set of muscles. In addition, this mechanism may be
able to reduce the injuries that occur from harsh accelerations of the shoulder, elbow, and
24
hands. From the past research presented in the literature review section of the
report, it can be seen that the best stroke pattern for wheelchair users was found to
be the semi-circular (SC) stroke5. It would be ideal if the new mechanism had the
handle path of an ellipse. This new innovative mechanism travels recreates the SC stroke
pattern. An additional advantage could be a decrease in acceleration and a smaller
flexion/extension and shoulder abduction/adduction acceleration5. These advantages
coupled with the fact that the mechanism propels the wheelchair during its entire
elliptical travel path should give the user a more symmetric muscle development. It was
hypothesized that the new mechanism being proposed will relieve the burden of using the
smaller muscles that are injury-prone, and place more emphasis on the larger muscle
groups that have the ability to sustain more effort without injury.
2.1 Proposed Design
This new mechanism employs a lever-actuated elliptical input motion and a
Cardan gear system that changes the elliptical input into rotary output. The new
mechanism will not be easily understood until the Cardan gear system is explained.
2.2 Cardan Gear System
A Cardan gear mechanism is a hypocycloidal gear train that is used to convert
rotation (circular motion) into straight-line motion. A hypocycloidal curve is generated
when one circle (gear) is rolled along the inside of another circle (gear). Whenever the
ratio of the diameters of the gears is 1:2 the output arm will translate the rotation to a
linear path. The following figure gives an illustration of a true Cardan Gearing System.

25
Figure 9- Cardan Gearing System
One of the basic design criteria for most manual wheelchair manufacturing is to
minimize the equipment weight. The Cardan system can be made lighter by excluding
the use of an outside internal gear. The use of internal gearing added complexity and
weight to the design that was needed to power a wheelchair. In the proposed mechanism,
the use of an internal gear can be neglected by inserting an idler gear in between the inner
fixed spur gear (sun) and the smaller outside spur gear (planet). Figure 10 gives an
example of this new configuration.
Figure 10 - Cardan Gearing Without Internal Gear

26
In Figure 10, it can be seen that only standard spur gears are needed, and that the
entire design has been reduced in complexity. The only requirement was that the fixed
gear and the outermost gear must be in the 1:2 ratio. The idler gear (middle gear) does
not add to the mechanical advantage of the mechanism. The idler gear was used to
change direction of rotation of the planet gear. As long as the outer arm and the inner
arm are the same length, the output motion will be linear. If the length of either arm is
changed with respect to the other, eccentricity can be added to the gear system and the
path will be elliptical. In the proposed mechanism, these lengths were changed and an
elliptical path recreating the SC motion was obtained.
To further simplify the mechanism and reduce its weight, one change was needed.
The idler gear was removed and replaced with a roller chain connecting the sun and
planetary gears. The spur gears were replaced with roller chain sprockets. The following
figure gives an example of the current system that is being used for wheelchair
propulsion.

27
Figure 11 - Simplified Cardan System With Eccentricity
Whenever the user propels the handle, the planet gear turns about the sun gear.
The back connecting lever in turn also rotates around the sun gear. A roller chain
sprocket was attached to the back connecting lever. The roller chain sprocket on the back
connecting lever was connected to a roller chain sprocket on the axle of the rear wheel
through a roller chain. So, as the back connecting lever rotates around the sun gear, the
wheelchair is propelled in a forward or backward motion. It can be seen that the
simplified Cardan gear system is a compact mechanism that produces the desired
elliptical output. This discussion of the Cardan gear system gives a general description of
the innovative mechanism used to power the wheelchair. A detail discussion of the
parameters for each of the components of the new innovative mechanism will be given
later. The innovative mechanism must be fitted into a standard wheelchair. This thesis
will continue with a discussion of how the mechanism can be retrofitted into an existing
wheelchair frame.
Sun Gear
Planet Gear
Lever A
Lever B
Handle
Back Connecting Lever
Roller Chain Sprocket (Attaches To Rear Axle)

28
2.3 Adapting the Innovative Mechanism to a Wheelchair Frame
A sprocket was attached to the innovative mechanism that was then mounted on a
shaft on the side of the wheelchair. The inside sprocket on the innovative mechanism
was attached to a sprocket on the axle of the wheelchair by a roller chain. A figure of the
entire drive system without the driving chains can be found in Figure 12.
Figure 12 - Wheelchair View With Mechanism and Sprockets
The front and back wheels have been eliminated from the model for ease of
visualization. The inside sprocket of the mechanism on the front of the wheelchair
attaches to the sprocket shown on the rear axle of the wheelchair by a driving chain (not
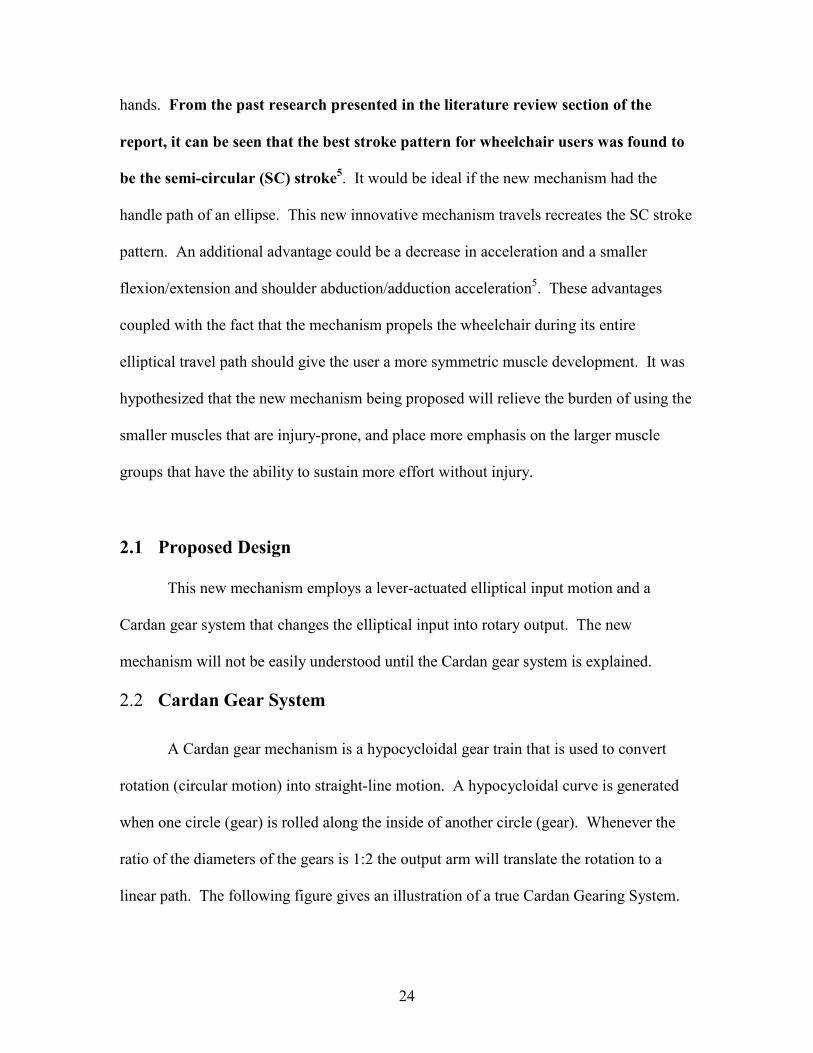
shown). As stated earlier the handle of the innovative mechanism follows an elliptical
path of travel. The following figure gives an example of the elliptical path of the
mechanism handle.
29
P O S I T I O N A N A L Y S I S O F M E C H A N I S M
- 2
- 1 . 5
- 1
- 0 . 5
0
0 . 5
1
1 . 5
2
- 6 - 4 - 2 0 2 4 6
I N C H E S
INC
HES
M e c h a n i s m
Figure 13 - Example of Elliptical Path of Mechanism Handle
The elliptical path of the handle was designed to serve the same function as the
SC stroke pattern does for wheelchair users. In addition, the initial starting angle (major
axis of orientation of the elliptical path) of the mechanism handle can be adjusted so that
it can be initially set at any angular displacement along the inner radius. Thus its
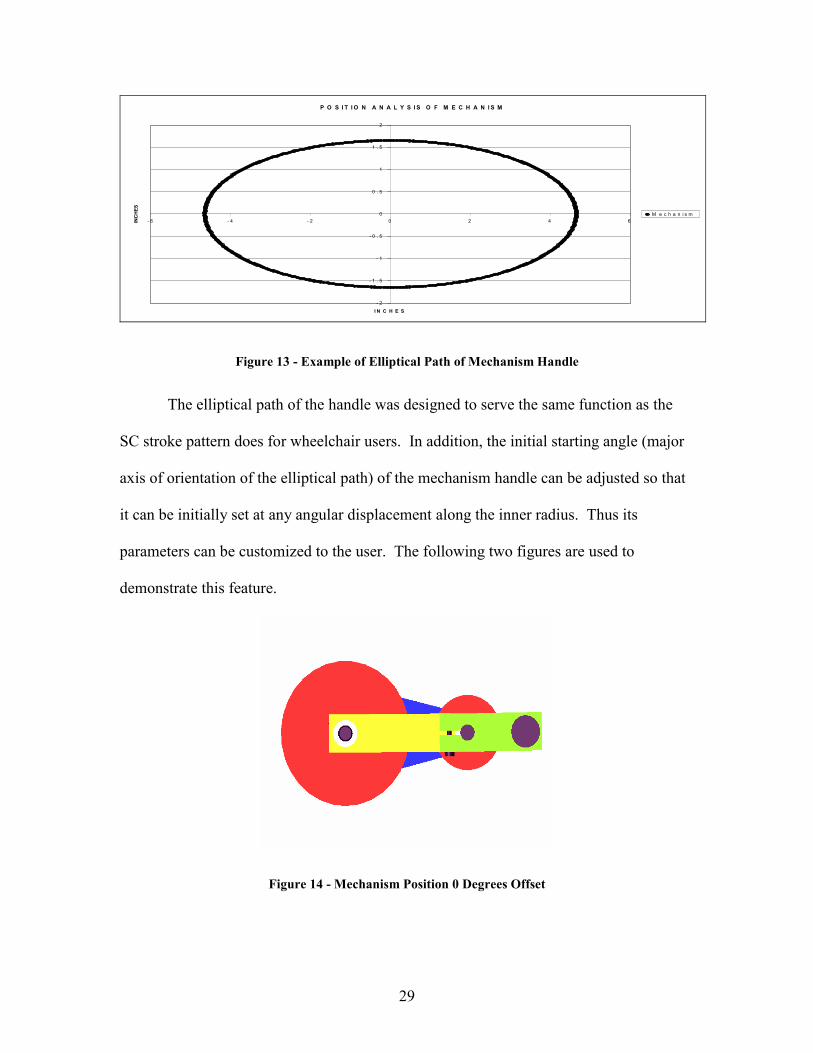
parameters can be customized to the user. The following two figures are used to
demonstrate this feature.
Figure 14 - Mechanism Position 0 Degrees Offset

30
Figure 15 - Mechanism Position 45 Degrees Offset
There are different initial angle positions that can be calculated for each
individual user. The initial angle at which the innovative mechanism is set allows for the
torque curve for the mechanism to be adjusted. Results of the tests of this concept are
presented in the analysis section.
2.4 Parametric Design Criteria of the Components of the Innovative
Propulsion system
2.4.1 Gear Selection
As it was discussed earlier, one of the requirements was to have the ratio between
the sun and planetary gears to be 2:1. The following figure gives a view of how the
various parts were defined.

31
Figure 16- Labeling System for Gear Selection
As seen in Figure 16, only two sprockets are used to create the elliptical handle motion.
The sun and planet gear must be in a 2:1 ratio. In addition, for a true linear motion Lever
A and Lever B would have to be the same length. But, for this application, elliptical
motion was achieved by making Lever B shorter than Lever A. The actual dimensional
drawings of the gears can be found in Appendix A.
2.4.2 Roller Chair Selection
The planet gear and the sun gear on the innovative mechanism were connected
using a roller chain. In addition, the inside sprocket on the mechanism and the sprocket
on the axle of the wheelchair were connected using a roller chain. The equation that was
used to find the proper length of the length roller chain is given below.
L/P = 2C/P + (N1 + N2)/2 +( N1 - N2)2/(4π2(C/P)) Equation 115
Where L is the chain length, P is the chain pitch, C is the center distance between
sprockets, N1 is the number of teeth on the small sprocket, and N2 is the number of teeth
Handle Position Sun Gear (Rs=2Rp)
Planet Gear (Rp)
Lever A
Lever B

32
on the larger sprocket. The length of the roller chain is measured in inches, but can also
be converted to pitches for chain selection. It is preferable to have an even number of
pitches, or an offset link will be needed for the application15.
2.4.3 Gear Arm Design
The gear arm (Lever A) was designed to maintain the position of the plant gear
with respect to the sun gear. In addition, Lever A must contain a bearing so that it can
rotate about a shaft. The dimensions were selected based on basic stress and moment
calculations. It is not within the scope of this thesis to carry out an entire force analysis of
the innovative mechanism and size each component accordingly.
To allow Lever A to rotate on the given shaft, needle bearings were chosen. Needle
bearings have a small outside diameter for a given inside diameter. This saves on radial
space in the design of the arm.
Figure 17 shows the gear arm (Lever A). As you can see, the size of the lever was
actually a function of the size of bearing that will be used.
Figure 17 - Design of Gear Arm (Lever A)
Gear Arm (Lever A) Needle Bearing

33
2.4.4 Lever B Design
The same design process was followed for Lever B as was followed for Lever A.
Lever B needed to be attached to Lever A, and be able to rotate about Lever A, and be
able to accommodate a handle attachment. Fixing Lever B to a shaft and allowing it to
rotate with the planet gear accomplished the rotation of Lever B about Lever A. This in
turn gave one rotation of Lever B for each rotation of the planet gear. Lever B was
attached to the shaft through a gripping-type attachment. The screw was tightened until a
secure fit was obtained between the shaft and Lever B. The handle was simply attached
to Lever B by a threaded stud and nut. The handle contains its own rotational ability.
The following figure gives an example of the Lever B, handle, and shaft assembly.
Figure 18 - Lever B, Handle, and Shaft Complex
Planet Gear Handle
Lever B

34
2.4.5 Back Connecting Lever
The final component of the mechanism developed was the back connecting lever.
The back connecting lever was used to add strength to the mechanism so that a moment
applied on the handle will not have to be loaded totally on Lever A. In addition, the back
connecting lever has the roller chain sprocket attached to it that was also connected to the
sprocket on the axle of the rear wheel by a roller chain. The following figure shows the
back connecting lever complete with needle bearings.
Figure 19 - Back Connecting Lever
2.5 Innovative Mechanism Parameters
Drawings of each of the above mentioned parts can be found in Appendix A. The
following table gives a compilation of some of the important dimensions for various parts
of the innovative mechanism.
Back Connecting Lever
Roller Chain Sprocket
Needle Bearing

35
Table 2 - Compilation Table of Various Mechanism Parameters
Length of Lever A = 3.15 In Length of Lever B = 1.5 In Length of Back Connecting Lever = 3.15 In Pitch of Planet Sprocket = 12.5 teeth/in Pitch Diameter of Planet Sprocket = 1.598 In Number of Teeth Planet Sprocket = 20 teeth Chain Length (Plant-Sun) = 14.43 inches
In addition, the following figure and table gives data about the elliptical path that
the handle on the innovative mechanism follows.
Figure 20 - Elliptical Path Labels
Pitch Sun Sprocket = 12.6 teeth/in Pitch Diameter Sun Sprocket = 3.187 in Number of Teeth Sun Sprocket = 40 teeth Pitch Chair Connecting Sprocket = 8.4 teeth/in Pitch Diameter Chair Connecting Sprocket = 3.11 in Number of Teeth Chair Connecting Sprocket = 26 teeth Chain Length (Chair – Axle) = 59.19 inches
Major Axis
Minor Axis Elliptical Handle Path

36
Table 3 - Ellipse Compilation Data
Major Axis (Stroke Length) = 9.3 inches Minor Axis = 3.3 inches Circumference = 21.921 inches
2.6 Mechanism Assembly
Each of the entities described above were fit together to obtain the innovative
mechanism. Figure 21 shows an exploded view of the entire mechanism complete with
Teflon washers and bushings.
Figure 21 - Exploded View of Innovative Mechanism

37
Figure 22 - Side View Of Innovative Mechanism
The stroke length for the innovative mechanism was found by measuring the
distance that a person’s hand travels in the propulsion phase of the wheelchair. This
measurement was taken on members of the original Innovative Wheelchair Team. This
distance was converted in the innovative mechanism to one complete stroke. The two
strokes to one advantage results from the fact that the innovative mechanism gives
propulsive force around the entire path of the ellipse. After the innovative mechanism
was developed, the next step was to start analyzing the current mechanism. The first step
in this process was to develop a program or spreadsheet that would allow the researcher
to visualize the path of travel for the handle of the innovative mechanism.
2.7 Visualization of Mechanism Handle Motion
In order to visualize the movements and path that the handle of the mechanism
will take, an Excel spreadsheet was formulated. The following figure shows the
coordinates that will be used for the analysis.

38
Figure 23 - Coordinate System Definition for Mechanism Position Analysis
From Figure 23, it can be seen that Lever A moves in a clockwise rotation, while
Lever B rotates counterclockwise. The joint at the origin and the joint between the two
levers were considered pin joints. These joints only allow rotation and not translation.
The analysis was conducted by first calculating the position of Lever A, and then the
Position of Lever B and adding the two positions together to get the final position of the
handle. The following set of equations was used to find the position of the end of Lever
A.
LAX = (Length of Lever A) *COS(θ1) Equation 2
LAY = (Length of Lever A) * SIN(θ1) Equation 3
The position of Lever B was found in a similar manner to Lever A using the
following relationship.
Θ2 = - Θ1 Equation 4
Handle Position Θ1
Lever ALever B
Θ2

39
The above equation was used because the rotation of Lever B was in the opposite
direction of the rotation of Lever A. One rotation of Lever A will equal one rotation of
Lever B. The following equations were used to find the location of the end of Lever B.
LBX = (Length of Lever B) * COS(θ2) Equation 5
LBY = (Length of Lever B) * SIN(θ2) Equation 6
The final position of the handle was found by using a moving coordinate system. The
global coordinate system was placed at the origin, and a moving coordinate system was
placed at the end of Lever A. With these conditions in place, the X and Y position of the
handle could be found by simply adding the respective X and Y components of Equations
2,3,5, and 6. The following are equations that were used to figure the X and Y positions
of the handle.
HX = (Length of Lever A) *COS(θ1) + (Length of Lever B) * COS(θ2) Equation 7
HY = (Length of LeverA) * SIN(θ1) + (Length of Lever B) * SIN(θ2) Equation 8
This spreadsheet gives a visual concept of the path of the mechanism. It also
provided the researcher with a way of analyzing various handle motions of the
mechanism. A torque analysis was incorporated into the Excel spreadsheet.
2.8 Manufacturing of Prototype
The spreadsheet was used to design the parameters that were incorporated into
engineering drawings. These drawings were submitted to Laser Processing, our
industrial partner, where components were CNC machined. The appropriate sprockets
and roller chains were purchased from McMaster Carr Supply Company. A wheelchair
was obtained from the Civil Engineering Department at WVU. Steel plates were welded

40
to the side of the wheelchair to support the mechanism, and the appropriate diameter
sprockets were welded to the rear wheel axles. The assembled mechanism was fitted into
the side plates on the frame, and the driving gears were connected via roller chain.
A testing platform on which a mock-up of a standard wheelchair could be
mounted was designed and manufactured in the MAE shop. An X-Y table was purchased
from McMaster Carr and mounted to the testing platform. A dynamometer, purchased
from Magtrol, was mounted on the X-Y table were it could be adjusted to proper tension.
With this work completed, the researcher could develop an experimental design and
protocol to compare the effectiveness of the new innovative mechanism and the standard
manual wheelchair.
3 Experimental Setup
After the basic idea for the innovative mechanism was conceived, a prototype of the
mechanism was developed. The goal of the research project then shifted to finding a way
to test the new innovative mechanism against a standard manually powered wheelchair.
The researcher established the following criteria to be met by the testing apparatus:
� The testing station had to be portable. � Be able to simulate actual wheelchair use.
� The researcher had to be able to change the testing procedures
between standard wheelchair wheels, and innovative
mechanism sprockets.
The first consideration that was analyzed was a source from which a load could be

41
applied to the wheelchair test subjects. A number of different ways of applying loads
were considered. The researcher looked at applying a load with a friction style brake,
such as the friction load system of a stationary exercise bicycle. This method of applying
a load was simple, but there was not a simple way to get a reading on the amount of load
that was being applied to the wheelchair test subjects. The researcher settled on a
dynamometer system to apply the load. A dynamometer is a device that allows for a load
to be applied as a torque on a shaft. The idea of using dynamometers was not new. For
years, many members of the innovative wheelchair team have worked with engine testing
dynamometers.
Before any final design was settled on, the researcher looked at many other
research projects that involved wheelchair testing to get ideas on how to design the
dynamometer testing station. Many of the research projects that were analyzed used a
SMARTWheel 5 wheel design. The SMARTWheel measures the amount and direction of
force the user applies to a given wheelchair wheel. Since this design consists of an
innovative mechanism, the SMARTWheel design will not meet the needs of this testing. In
addition, a way of applying a load would still be needed with the SMARTWheel approach.
The next step was to look at other dynamometer testing stations. The University of
Pittsburgh has done work in the past using wheelchair testing techniques. But, all of the
testing machines that were found in the literature reviewed by the researcher from the
University of Pittsburgh used a drum system that allowed the wheels of the wheelchair to
turn on a drum. This type of testing apparatus is very useful but was beyond the scope of
this preliminary research. The researcher was looking for a procedure for collecting data
to evaluate the innovative mechanism.
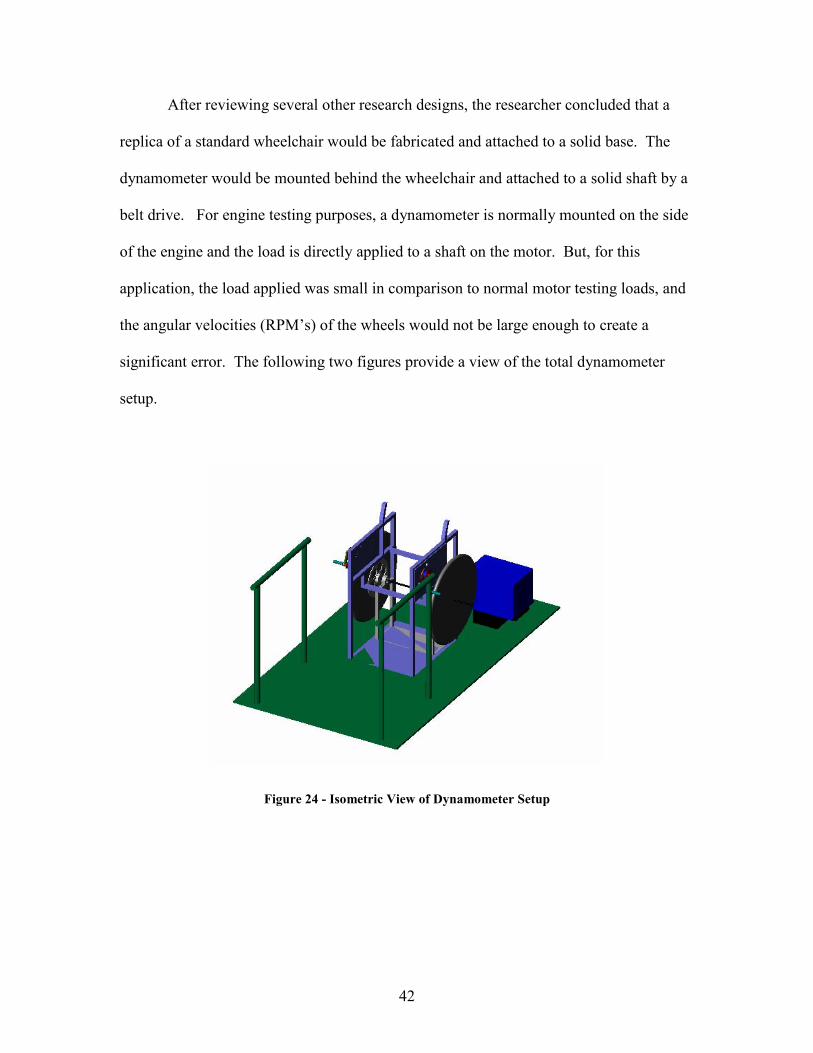
42
After reviewing several other research designs, the researcher concluded that a
replica of a standard wheelchair would be fabricated and attached to a solid base. The
dynamometer would be mounted behind the wheelchair and attached to a solid shaft by a
belt drive. For engine testing purposes, a dynamometer is normally mounted on the side
of the engine and the load is directly applied to a shaft on the motor. But, for this
application, the load applied was small in comparison to normal motor testing loads, and
the angular velocities (RPM’s) of the wheels would not be large enough to create a
significant error. The following two figures provide a view of the total dynamometer
setup.
Figure 24 - Isometric View of Dynamometer Setup

43
Figure 25 - Rear View of Dynamometer Setup
Figure 24 and Figure 25 show that a timing belt was fitted across the pulley on the
dynamometer and the pulley on the shaft connecting the wheels. The wheelchair wheels
are attached together through a solid axle system. The solid axle system does not allow
for independent rotation of the wheels. This design was selected because it was difficult
to attach a dynamometer to evaluate the power from two independent wheels. The
following sections will explain the various features and parts of the dynamometer testing
apparatus. Figure 145 is contained in Appendix C and has the labels for all of the below
mentioned features.
3.1 Dynamometer
Based on human design requirements, several dynamometer manufacturers were
contacted. Upon talking to the sales and technical teams for each manufacturer, the
Magtrol HD-705-6N dynamometer (Figure 26) was selected16. The following table gives
an overview of the capabilities and requirements of the Magtrol dynamometer.

44
Table 4 - Magtrol Dynamometer Requirements
From inspection of Table 4, it can be seen that our application will never reach the
maximum angular speeds that are allowed by the dynamometer. The real application of
this dynamometer is for testing small electric motors. The level of control that can be
obtained with this dynamometer will probably never be used for this project. This
dynamometer has the capabilities of being able to test our subjects, with both the
innovative mechanisms and the standard wheelchair wheels, and show preliminary data
on the conception of the mechanism.
Figure 26 - Picture of Magtrol Dynamometer
Magtrol HD-705-6N Dynamometer Maximum Torque Range = 50 lb*in Digital Torque Resolution = 0.1 lb*in Maximum Power Rating (5 Minutes) = 1400 Watts Maximum Power Rating (Continuous) = 300 Watts Maximum Speed = 10,000 RPM Brake Cooling Method = Convection

45
3.2 Dynamometer Controller
The controller that was selected for this application was a DSP6000 from Magtrol
(Figure 27). This controller allowed for full control over the torque loading of the
dynamometer, and it allowed for a computer to be used to collect the needed output data.
Figure 27 - Magtrol DSP6000 Controller
3.3 Rear Axle
Upon first inspection, the rear axle of the dynamometer testing station may not
seem important, but that is not true. The amount of stress that was being applied to the
shaft was of concern because if the user applies too much stress, the shaft will fail, and
injury to the user could result. In addition, the deflection of the shaft had to be controlled
because too much deflection at the dynamometer connection could lead to inaccurate or
false data. The following section will outline the design process that was employed for
the rear axle.

46
For the analysis of the rear axle, a series of singularity functions were formulated
for the axle using the innovative mechanism, and another set for the standard wheelchair
wheels. Whenever the innovative mechanisms were in use, the standard wheelchair
wheels will be taken off of the testing apparatus. In addition, the sprockets for the
innovative mechanism were taken off for testing with the standard wheelchair wheels.
The singularity functions for the standard wheelchair wheels will be presented first.
3.3.1 Singularity Function – Standard Wheels
The first step was to draw a free body diagram for the rear axle. The following
two figures show free body diagrams for both the X and Y directions of the rear axle.
Figure 28 - Y - Direction Free Body Diagram (Wheels)
7.768 lbs 7.768 lbs
8.586 lbs
RAY RBY
4” 1.5” 14.5” 4”

47
Figure 29 - X - Direction Free Body Diagram (Wheels)
Where RAX, RAY, RBX, RBY are the support reactions for the rear axle which sets in pillow
blocks. The 7.768 lb and 1.768 lb in the preceding figures are the amount of hand force
that the user must apply to the wheel to reach the dynamometer maximum load of 50
in*lbs. The 8.585 lbs and the 47.775 lbs are the component forces for the dynamometer
at a rated condition of 50 in*lbs.
The next step was to formulate the equations to solve for the reaction forces.
These are seen below.
ΣMRAY = 4(7.768) –1.5(8.580) + RBY*16 – 20(7.768) = 0 Equation 9
ΣFY = 0 = -7.768 + RAY – 8.586 + RBY – 7.768 Equation 10
ΣMRAX = 0 = 4(1.768) + 1.5(47.775 – 16(RBX) – 20(1.768) Equation 11
ΣFY = 0 = -1.768 – RAX + 47.775 – RBX – 1.768 Equation 12
The following set of results was obtained for the reaction in the previous equations.
RBY = 8.573 lbs.
1.768 lbs1.768 lbs RAX RBX
47.775 lbs
4” 4” 14.5”1.5”
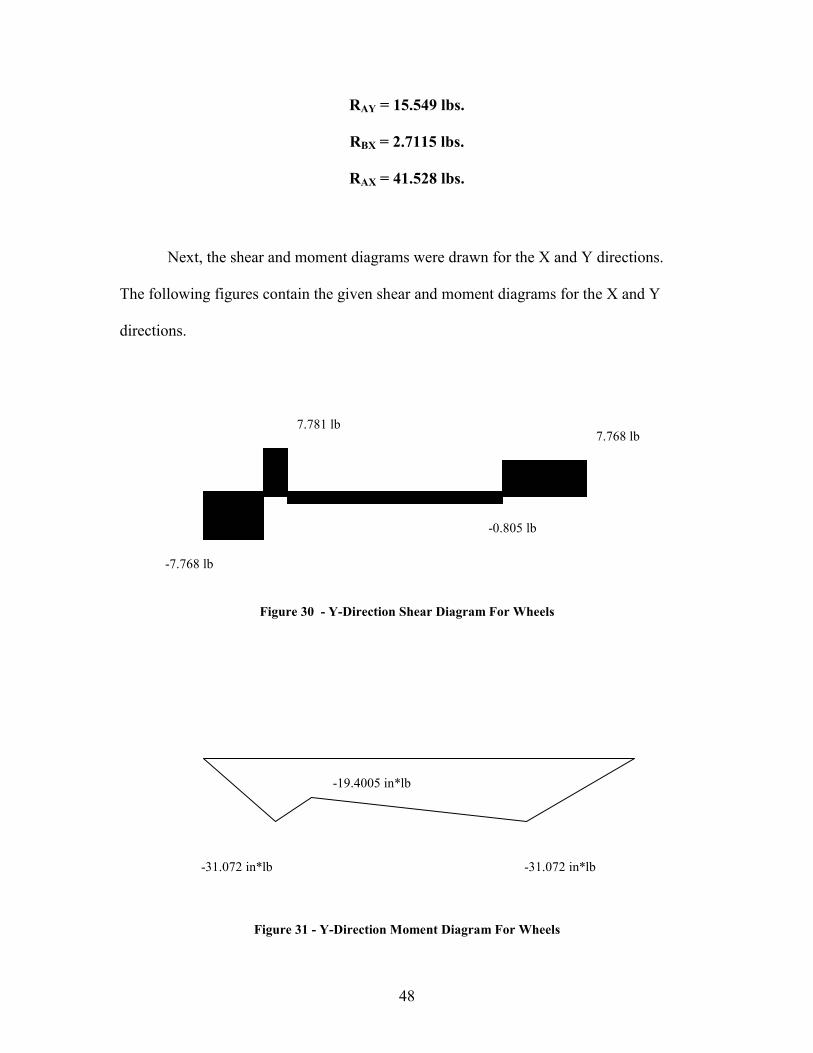
48
RAY = 15.549 lbs.
RBX = 2.7115 lbs.
RAX = 41.528 lbs.
Next, the shear and moment diagrams were drawn for the X and Y directions.
The following figures contain the given shear and moment diagrams for the X and Y
directions.
Figure 30 - Y-Direction Shear Diagram For Wheels
Figure 31 - Y-Direction Moment Diagram For Wheels
-7.768 lb
7.781 lb
-0.805 lb
7.768 lb
-31.072 in*lb -31.072 in*lb
-19.4005 in*lb

49
Figure 32 - X-Direction Shear Diagram for Wheels
Figure 33 - Y-Direction Moment Diagram For Wheels
The shear and moment diagrams were then used to set the boundary conditions
for the singularity functions. The following equations contain the singularity functions
for the condition with the wheelchair wheels in use in the X direction.
q = -FX-ARM<x>-1 – RAX<x-4>-1 + FDYNO<x-5.5>-1 – RBX<x-20>-1 - FX-ARM<x-24>-1 Equation 13
V= -FX-ARM<x>0 – RAX<x-4>0 + FDYNO<x-5.5>0 – RBX<x-20>0 - FX-ARM<x-24>0 + C1 Equation 14
M=-FX-ARM<x>1 –RAX<x-4>1 +FDYNO<x-5.5>1 –RBX<x-20>1 -FX-ARM<x-24>1 +C1(x) +C2 Equation 15
1.7675 lb
4.479 lb
-43.296 lb-1.768 lb
-7.032 in*lb
-71.976 in*lb
-7.0305 in*lb

50
EIΘ=-FX-ARM/2<x>2–RAX/2<x-4>2 +FDYNO/2<x-5.5>2 –RBX/2<x-20>2 -FX-ARM/2<x-24>2 +C1/2(x2) +C2(x)+C3 Equation 16
EIY=-FX-ARM/6<x>3–RAX/6<x-4>3 +FDYNO/6<x-5.5>3–RBX/6<x-20>3 -FX-ARM/6<x-24>3 +C1/6(x3) +C2/2(x2)+C3(x)+C4Equation 17
The following set of equations contains the singularity functions for the condition
with the wheels in use in the Y direction.
q = -FY-ARM<x>-1 + RAY<x-4>-1 - FDYNO<x-5.5>-1 + RBY<x-20>-1 – FY-ARM<x-24>-1 Equation 18
V= -FY-ARM<x>0 + RAY<x-4>0 - FDYNO<x-5.5>0 + RBY<x-20>0 – FY-ARM<x-24>0 + C1 Equation 19
M=-FY-ARM<x>1 +RAY<x-4>1 -FDYNO<x-5.5>1 +RBY<x-20>1 –FY-ARM<x-24>1 +C1(x) +C2 Equation 20
EIΘ=-FY-ARM/2<x>2+RAY/2<x-4>2 -FDYNO/2<x-5.5>2 +RBY/2<x-20>2 –FY-ARM/2<x-24>2 +C1/2(x2) +C2(x)+C3 Equation 21
EIY=-FY-ARM/6<x>3+RAY/6<x-4>3 -FDYNO/6<x-5.5>3 +RBY/6<x-20>3 –FY-ARM/6<x-24>3+C1/6(x3) +C2/2(x2)+C3(x)+C4Equation 22
Where FY-ARM and FX-ARM are the X and Y components of the arm force exerted by the
user to reach the rated dynamometer load, and FDYNO is the X and Y components of the
dynamometer force whenever the dynamometer is at the rated load, while C1 through C4
are the constants of integration.
The results for the boundary conditions and the results for the constants of
integration are presented in the following table.

51
Table 5 - Results Of Boundary Conditions and Integration Constants
With Wheel With Wheel RAY (lb) RBY (lb) 15.549 8.573
RAx (lb) RBx (lb) 41.528 2.711
Y-Direction X-Direction
at x=3 V=-7.768 at x=3 V=-1.768 c1 c1
-7.768 -1.768 at x=4 M=-31.072 at x=4 M=-7.032
c2 c2
0.0028 0.0391
c3 c3
1170.642 660.387 at x=4 y=0 at x=4 y=0
c4 c4
-9026.252592 -6785.072814
3.3.2 Singularity Function – Roller Chain Sprockets
The following section uses the singularity function approach for the condition
with the innovative mechanisms and roller chain sprockets on the testing apparatus, and
the wheels taken off. The first step was to draw a free body diagram for the rear axle.
The following two figures show free body diagrams for both the X and Y directions on
the rear axle.

52
Figure 34 - X - Direction Free Body Diagram (Sprocket)
Figure 35 - Y - Direction Free Body Diagram (Sprocket)
Where 3.903 lbs and 3.903 lbs are the X and Y components of the arm force that was
applied to the wheels at maximum torque. The forces were applied at 2 inches from the
end of the shaft to obtain a tighter clearance with the side of the wheelchair apparatus.
The next step was to formulate the equations to solve for the reaction forces in the
above equations. The following set of equations was used to solve for these reaction
forces.
ΣMRax = 0 = 2(3.581) + 1.5(47.775) +16*RBX – 18(3.581) Equation 23
3.581 lbs 3.581 lb
RAX RBX
47.775 lb
8.586 lb
3.903 lb 3.903 lb
RAY RBY
2” 2” 1.5” 14.5” 2” 2”

53
ΣFY = 0 = -3.581 – 3.581 – RAX – RBX + 47.775 Equation 24
ΣMAY = 0 = 2(3.903) + 8.586(1.5) – 18(3.903) –16*RBY Equation 25
ΣFY = 0 = 3.903 + RAY – 8.586 + RBY + 3.903 Equation 26
The following set of results was obtained for the reaction in the previous equations.
RBY = -3.098 lbs.
RAY = 3.878 lbs.
RBX = 0.897 lbs.
RAX = 39.716 lbs.
Next, the shear and moment diagrams were drawn for the X and Y directions.
The following figures contain the given shear and moment diagrams.
Figure 36 - X - Direction Shear Diagram (Sprockets)
3.599 lb
-43.297 lb
-3.581 lb
-3.581 lb

54
Figure 37 – X - Direction Moment Diagram (Sprockets)
Figure 38 – Y - Direction Shear Diagram (Sprockets)
Figure 39 – Y - Direction Moment Diagram (Sprockets)
-7.177 in*lb
-72.1075 in*lb
-7.162 in*lb
-3.903 lb -0.805 lb
7.781 lb
3.903 lb
7.805 in*lb
19.4775 in*lb
7.80 in*lb

55
The shear and moment diagrams were then used to set the boundary conditions
for the singularity functions. The following equations contain the singularity functions
for the condition with roller chain sprockets in use in the X direction.
q = -FMX<x-2>-1 –RAX<x-4>-1 +FDX<x-5.5>-1 –RBX<x-20>-1 –FMX<x-22>-1 Equation 27
v = -FMX<x-2>0 –RAX<x-4>0 +FDX<x-5.5>0 –RBX<x-20>0 –FMX<x-22>0 +C1 Equation 28
M = -FMX<x-2>1 –RAX<x-4>1 +FDX<x-5.5>1 –RBX<x-20>1 –FMX<x-22>1 +C1(x) +C2 Equation 29
EIΘ = -FMX/2<x-2>2 –RAX/2<x-4>2 +FDX/2<x-5.5>2 –RBX/2<x-20>2 –FMX/2<x-22>2 +C1/2(x)2 +C2(x) +C3 Equation 30
EIΘ = -FMX/2<x-2>3–RAX/2<x-4>3+FDX/2<x-5.5>3–RBX/2<x-20>3–FMX/2<x-22>3+C1/2(x)3+C2(x2)+C3(x)+C4 Equation 31
The following set of equations contains the singularity functions for the condition
with roller chain sprockets in use in the Y direction.
q = FMY<x-2>-1 +RAY<x-4>-1 -FDY<x-5.5>-1 +RBY<x-20>-1 +FMY<x-22>-1 Equation 32
v = FMY<x-2>0 +RAY<x-4>0 -FDY<x-5.5>0 +RBY<x-20>0 +FMY<x-22>0 +C1 Equation 33
M = FMY<x-2>1 +RAY<x-4>1 -FDY<x-5.5>1 +RBY<x-20>1 +FMY<x-22>1 +C1(x) +C2 Equation 34
EIΘ = FMY/2<x-2>2 +RAY/2<x-4>2 -FDY/2<x-5.5>2 +RBY/2<x-20>2 +FMY/2<x-22>2 +C1/2(x)2 +C2(x) +C3 Equation 35
EIΘ=FMY/6<x-2>3+RAY/6<x-4>3-FDY/6<x-5.5>3+RBY/6<x-20>3+FMY/6<x-22>3+C1/6(x)3+C2/2(x)2+C3(x)+C4 Equation 36

56
The following table contains the results for the boundary conditions and the
results for the constants of integration.
Table 6 - Results of Boundary Conditions and Integration Constants
With Mechanism
With Mechanism
RAY (lb) RBY (lb) 3.878 -3.098
RAx (lb) RBx (lb) 39.715 0.898
Y-Direction X-Direction
at x=3 V=3.903 at x=3 V=-3.581 c1 c1
3.903 -3.581 at x=4 M=7.806 at x=2 M=0
c2 c2
-7.806 7.162 At x=20 y=0 at x=20 y=0
c3 c3
-462.96 918.238 at x=4 y=0 at x=4 y=0
c4 c4
3541.428 -7754.109
3.3.3 Rear Axle Validation
The final step in the design of the rear axle was to validate the deflection and
stress results. The following two tables give a summary of the deflection data.

57
Table 7 - Results of Analysis With Wheelchair Wheels
Deflection @ x=24 Deflection @ x=24 Magnatude (24) -0.0539 -0.0441 0.0697 in
Deflection @ x=0 Deflection @ x=0 Magnatude (0) -0.098 -0.074 0.1228 in
Deflection @ x=5.5 Deflection @ x=5.5 Magnatude (5.5) -0.0327 -0.0356 0.0483 in
Deflection @ x=4 Deflection @ x = 4 -0.0490 -0.0454
Deflection @ x = 20 Deflection @ x=20 -0.00081 -0.02564
Table 8 - Results of Analysis With Innovative Mechanisms
In the previous tables, the left hand column is for the Y direction, and the right hand
column is for the X direction. It can be seen that the maximum displacement with the
wheels attached occurred at one end of the shaft, while the maximum deflection with the
innovative mechanisms attached occurred at the dynamometer sprocket connection. Each
of these deflections was small in comparison to the total length of the shaft, and thus they
were determined to be within the safe operating limits of the dynamometer testing
apparatus.
Deflection @ x=24 Deflection @ x=24 Magnitude (24) 0.0237 -0.0086 0.0253 in
Deflection @ x=0 Deflection @ x=0 Magnitude (0) 0.0385 -0.084 0.0927 in
Deflection @ x=5.5 Deflection @ x=5.5 Magnitude (5.5) 0.0390 -0.0298 0.0491 in
Deflection @ x=4 Deflection x=4 0.0182 -0.044208473
Deflection @ x=20 Deflection @ x=20 0.0000 0.01033

58
In Table 16 through Table 18 the results of a stress analysis can also be seen. The
bending stress was calculated at the point of the maximum moment and the results
yielded a safety factor of approximately 4. This value was within the limits of the yield
stress for the material.
3.4 Rear Axle Sprockets
The gears were tuned to equal arc distances per stroke with the innovative
mechanism and standard wheelchair wheels. The angular velocity of the rear axle
sprockets and the inside sprocket of the back connecting lever are related with the
following relationship.
ABS(ω1/ω2) = D2 / D1 Equation 3715
Where ω is the angular velocity of one of the sprockets in rev/min, and D is the diameter
of one of the sprockets in inches. In addition, the rotation of one sprocket with respect to
the other can be calculated using the formula
(REV1 / REV2) = D2 / D1 Equation 38
where REV is the revolution of the sprocket, and D is the diameter of the sprocket. Once
the desired revolution ratio for the sprockets was determined, the sprockets were sized
accordingly. The sprockets that were selected have the following dimensions.

59
Table 9 - Summation of Sprocket Sizes
Sprocket Number
Outside Diameter (in)
Pitch Diameter (in) # of Teeth
Rear Axle Sprocket 35A26 3.31 3.111 26 Back Connecting Lever 35H84 10.25 10.029 84
3.5 Dynamometer Sprockets
The sprockets for the dynamometer were selected based on size requirements for
the rear axle of the wheelchair on the dynamometer, and on the horsepower requirements
of the dynamometer. The only real requirements for the sprockets were that they should
be as small as possible to eliminate rotational inertia, and they had to be the same
diameter. The sprockets on the rear axle and the dynamometer will be the same size so
that a multiplication of torque does not occur.
3.6 Complete Testing Apparatus
The following figures contain pictures of the entire wheelchair testing apparatus.
These pictures are presented to give a total conceptual view of the testing apparatus.

60
Figure 40 - Testing Apparatus Picture 1
Figure 41 - Testing Apparatus Picture 2

61
Figure 42 - Testing Apparatus Picture 3
With its current design and application, the dynamometer testing station will
allow for the application of a torque load, and for data to be obtained on output RPM.
4 Experimental Design and Testing
4.1 Prelude
At the present state of development of the wheelchair driven by the innovative
mechanism, two types of experiments were done. As described earlier, the orientation of
major axis of the elliptical motion could be changed. In the first set of experiments, the
change of this axis from horizontal to downward (angular offset) direction of the angle
from shoulder to mid-thigh was evaluated against a constant torque load provided by the
dynamometer. The results of this test will establish the existence of any advantage in the
change of elliptical angle. The second test was a simulation of propelling a wheelchair
up an incline plane. To accomplish this simulation, a constant torque was applied to the
rear axle of wheelchair by the dynamometer. The test subjects were asked to propel the

62
wheelchair at the constant load. A comparison of the angular velocities (RPM’s) required
by the standard wheelchair and the innovative mechanism will provide a direct evaluation
of their comparative efficiencies. The mode of propulsion with the lower RPM will have
the higher efficiency.
4.2 Handle Motion Analysis
The first set of experimental results that were obtained was for the handle motion
analysis. In order to calculate the motion of the mechanism handle, the user must input a
few parameters of the mechanism so that the position analysis can be completed. The
following table lists the parameters that must be inserted by the user.
Table 10 - Parameter Inputs for Mechanism Handle Position
As you can see from Table 10 the spreadsheet allowed the user to input the initial
angle of the mechanism, the length of Lever A, and the length of Lever B. The initial
angle of Lever A feature was incorporated to allow for the tuning of the angular position
of the mechanism. It had always been the vision of the researcher that the mechanism
would be positioned with the major axis of the ellipse lying along the path from the user’s
shoulder to his or her mid-thigh. The following two figures give examples of how the
spreadsheet program can be changed and manipulated to give different mechanism
handle paths for different configurations.
MECHANISM PARAMETERS Length of Lever A 3.15 In Length of Lever B 1.5 In Initial Angle Lever A 0 degrees
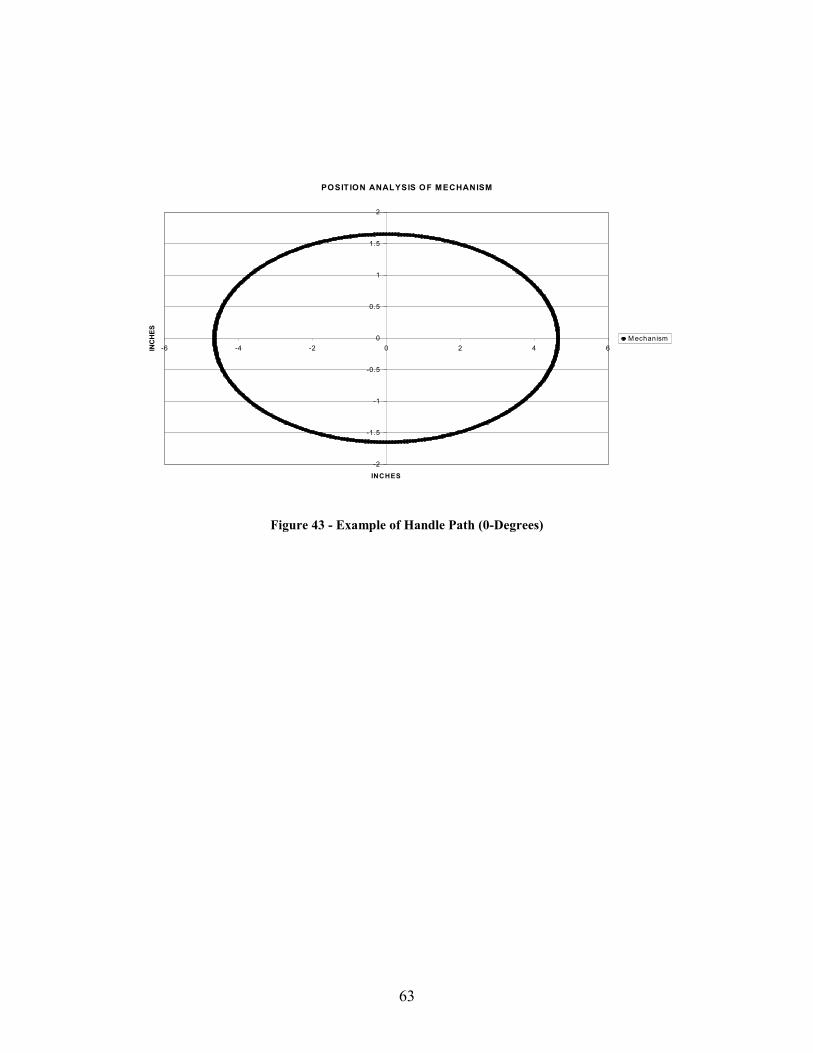
63
POSIT ION ANALYSIS OF MECHANISM
-2
-1.5
-1
-0.5
0
0.5
1
1.5
2
-6 -4 -2 0 2 4 6
INCHES
INC
HES
M echanism
Figure 43 - Example of Handle Path (0-Degrees)

64
PO SIT IO N ANALYSIS O F M EC HANISM
-4
-3
-2
-1
0
1
2
3
4
-4 -3 -2 -1 0 1 2 3 4
INCHES
INC
HES
M echanism
Figure 44 - Second Example of Handle Path (45-Degrees)
4.3 Torque Analysis
After the handle position analysis was complete, the next step was to conduct a
study to find the parameters of various human subjects and obtain a curve fit for the angle
that was obtained by drawing a line from the shoulder through the mid-thigh. This angle
was needed to find the angle for the major axis of the ellipse to lie along in order to
provide maximum torque. The following figure gives an illustration of the above stated
angle.
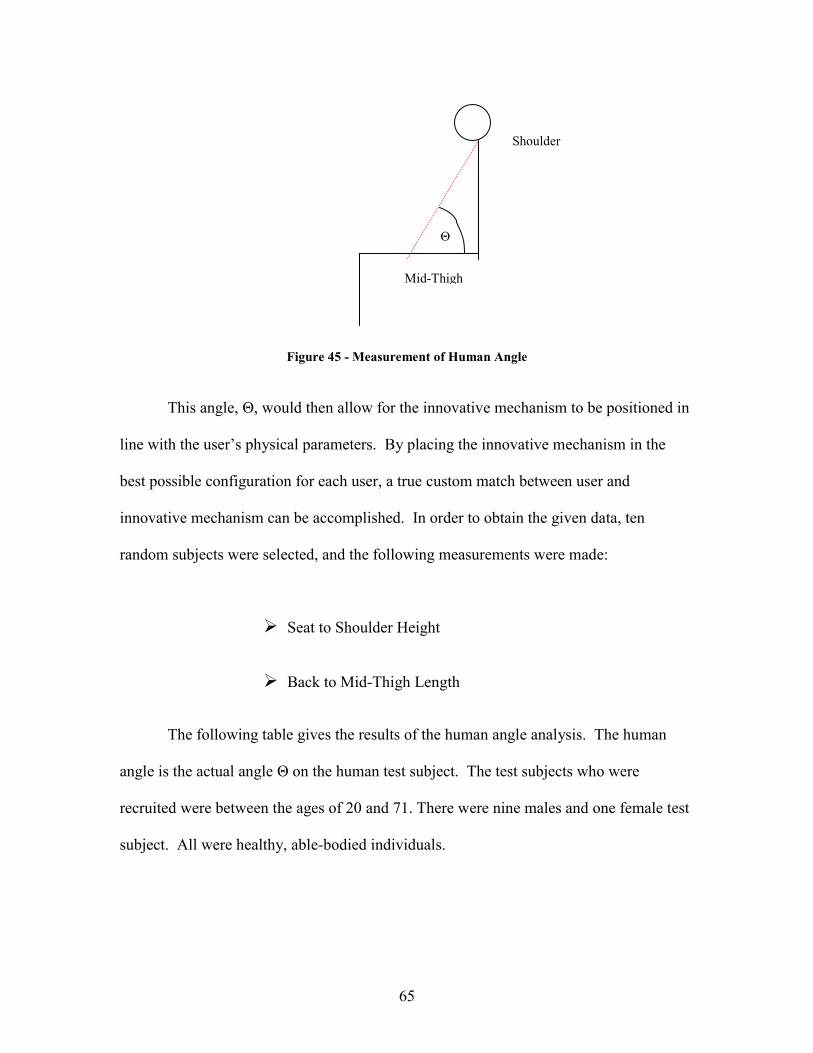
65
Figure 45 - Measurement of Human Angle
This angle, Θ, would then allow for the innovative mechanism to be positioned in
line with the user’s physical parameters. By placing the innovative mechanism in the
best possible configuration for each user, a true custom match between user and
innovative mechanism can be accomplished. In order to obtain the given data, ten
random subjects were selected, and the following measurements were made:
� Seat to Shoulder Height
� Back to Mid-Thigh Length
The following table gives the results of the human angle analysis. The human
angle is the actual angle Θ on the human test subject. The test subjects who were
recruited were between the ages of 20 and 71. There were nine males and one female test
subject. All were healthy, able-bodied individuals.
Shoulder
Mid-Thigh
Θ

66
Table 11 - Results of Human Angle Analysis
Subject # Human Angle (Degrees) 1 58.63 2 59.24 3 60.48 4 55.27 5 64.49 6 59.70 7 56.80 8 58.95 9 53.83 10 56.03
Once the human angles were obtained, a torque analysis was then completed on
the innovative mechanism. The torque curves for each subject were obtained using the
handle position analysis. The torque at each point along the path of the ellipse was
calculated by taking the cross product between the force applied by a human subject and
the position lever of the handle. The values for the lengths of Lever A and B were kept
the same as they can be found on the actual innovative mechanism. Values were then
entered for the Initial Angle of Lever A in the spreadsheet. A nominal force of 1 pound
was used for the human applied force. The following three figures give an example of
how the torque curves change as the initial angle (major axis orientation) of Lever A
changes.

67
INPUT AND OUTPUT TORQUE
0
0.5
1
1.5
2
2.5
3
3.5
4
4.5
5
-450 -400 -350 -300 -250 -200 -150 -100 -50 0
Angle Of Lever A (THETA)
TOR
QU
E (in
*lb)
INPUT TORQUE
Figure 46 - Torque Analysis - 45 Degrees Offset

68
INPUT AND OUTPUT TORQUE
0
0.5
1
1.5
2
2.5
3
3.5
4
4.5
-450 -400 -350 -300 -250 -200 -150 -100 -50 0
Angle of Lever A (THETA)
TOR
QU
E (in
*lb)
INPUT TORQUE
Figure 47 - Torque Analysis - 60 Degree Offset

69
INPUT AND OUTPUT TORQUE
0
0.5
1
1.5
2
2.5
3
3.5
4
-500 -450 -400 -350 -300 -250 -200 -150 -100 -50 0
ARM OF ARM 1 (THETA)
TOR
QU
E (in
*lb)
INPUT TORQUE
Figure 48 - Torque Analysis - 70 Degrees Offset
The human angles for each of the human subjects were calculated, and a torque
curve was developed for each of the subjects. As you can see, there does seem to exist a
point at which the minimums on the curves can be maximized. That is to say, the sharply
sloping valleys can be maximized. The torque curves for each subject were made as
smooth a possible by changing the initial angle of Lever A. The torque curves for each
individual subject can be found in the Appendix C.
Once the torque curves were maximized, the maximized angle (derived
mechanism angle) of Lever A was plotted verses the human angle to obtain a curve fit
and equation for the angle that is needed on Lever A for any given human angle. The
following figure contains the results of the curve fit analysis.
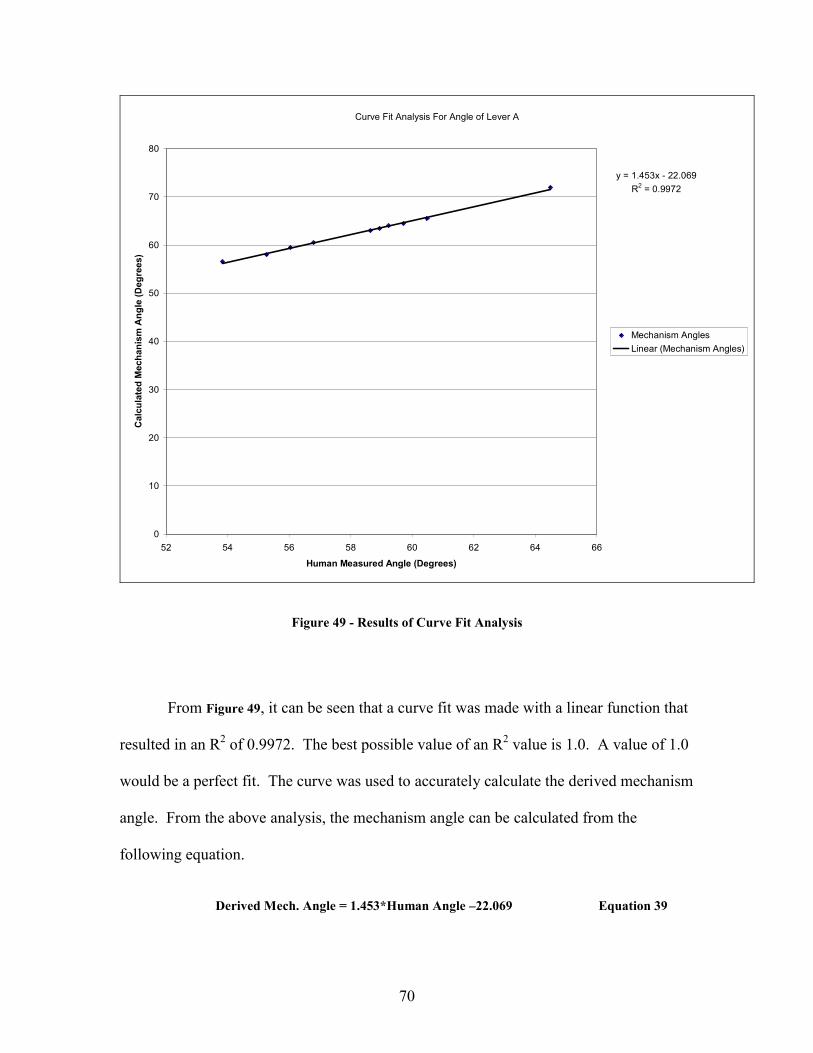
70
Curve Fit Analysis For Angle of Lever A
y = 1.453x - 22.069R2 = 0.9972
0
10
20
30
40
50
60
70
80
52 54 56 58 60 62 64 66
Human Measured Angle (Degrees)
Cal
cula
ted
Mec
hani
sm A
ngle
(Deg
rees
)
Mechanism AnglesLinear (Mechanism Angles)
Figure 49 - Results of Curve Fit Analysis
From Figure 49, it can be seen that a curve fit was made with a linear function that
resulted in an R2 of 0.9972. The best possible value of an R2 value is 1.0. A value of 1.0
would be a perfect fit. The curve was used to accurately calculate the derived mechanism
angle. From the above analysis, the mechanism angle can be calculated from the
following equation.
Derived Mech. Angle = 1.453*Human Angle –22.069 Equation 39

71
The following table contains a comparison of the mechanism position angle
calculated from the curve fit analysis compared to the same angle that was calculated
from the torque curve method.
Table 12 - Comparison of Results For Mechanism Position Angle
Measured Estimated From Torque Curves Calculated From Curve Fit Analysis Subject # Human Angle Mech. Pos. Angle Mech. Pos. Angle Percent Difference
(Degrees) (Degrees) (Degrees) (Percent) 1 58.63 63 63.12 0.184 2 59.24 64 64.00 0.004 3 60.48 65.5 65.81 0.466 4 55.27 58 58.24 0.412 5 64.49 72 71.63 0.517 6 59.70 64.5 64.68 0.279 7 56.80 60.5 60.46 0.058 8 58.95 63.5 63.58 0.124 9 53.83 56.5 56.14 0.640 10 56.03 59.5 59.35 0.259
These results were then used in the testing of the human subjects. The final step
before testing of human subjects could begin was to determine what load should be
applied on the dynamometer.
4.4 Testing Load Calculation
The standard slopes that a wheelchair user must negotiate shall not exceed 1:20 for
curbs coming from streets17.

72
Figure 50 - Diagram of Wheelchair Ramp Requirements17
In order to calculate the load that a person must apply to the wheels in order to
propel the wheelchair a spreadsheet program was developed. A copy of the spreadsheet
can be found in the Appendix C. From the spreadsheet in Appendix C, it can be seen
that calculating the load on the wheelchair and user was quite simple. But, this
spreadsheet was sensitive to the value that was entered for the coefficient of friction
between the wheels and the rolling surface. It was because of this sensitivity that the
spreadsheet was never used to its fullest extent. A small error in the coefficient of
friction resulted in a large error in the calculated force needed to propel the wheels.
Instead, trial runs were completed to compare the two types of wheel propulsion. Once a
load was reached that did not allow for the wheels to have a free rotation, this load was
used. The next step was to start testing human subjects.
4.5 Testing of Human Subjects – Different Mechanism Angles
The first set of human experimental data that was taken was for the innovative
mechanism positioned at two different angles. Earlier in the description of the
mechanism, the possibility of varying the major axis of the ellipse was described. The
benefits of that feature are being tested in this section. The stroke efficiency of two
angles was evaluated. The first angle that was used was 0 degrees, that is, with the major
axis of the ellipse parallel to the thigh of the subject. The second angle tested was the

73
mechanism position angle derived from the human angle measurements described in a
previous section. Generally, this angle was based on the angle from the shoulder to the
mid-thigh.
For each of the above stated tests, the human subjects had to propel the innovative
mechanism against a load of 10 in*lbs. This constant load allowed for comparison of the
angular velocity (RPM) and horsepower outputs as recorded by the dynamometer,
controller, and computer setup. The load of 10 in*lbs was chosen just to give a reference
point from which all of the given results can be compared. In addition, the entire test
lasted for 3 minutes with data being taken at one second intervals for a total of 180 data
points. The subjects were asked to propel the innovative mechanism set at one of the
angles during the first testing session, and then the subjects were asked to return at a later
date in order to test the other angle.
The data was collected for each of the human subjects, and graphs were configured
to show the results. For each subject, a graph was made for output torque, RPM, and
horsepower. Whenever each subject was tested on the dynamometer apparatus, the
output torque load was first analyzed to make sure that the subject had correctly kept the
output torque as close as possible to 10 in*lbs. In addition, the output had to be relatively
steady, in that large jumps would cause the data to be inconclusive. If the subjects were
unable to sustain the load, they were asked to start over, or a new subject was recruited.
For our testing procedures, each of the human subjects was able to propel the innovative
mechanisms for the test period of three minutes. The torque RPM, and Horsepower
graphs for each given subject can be found in the Appendix C labeled in Figure 88
through Figure 117.

74
4.6 Testing of Human Subjects – Mechanism/Wheel Comparison
One of the main focuses of this research project was to compare the output
characteristics of a standard manually powered wheelchair with the innovative
mechanism that has been developed. This section contains the comparison, and the
results are presented in graphical and tabular form.
For testing purposes, the same ten subjects were recruited for this part of the testing
procedure as were tested previously. Although, subject 5 was unable to take part in this
portion of the innovative mechanism testing procedure because of scheduling and
physical problems. So, a total of nine human subjects were included
The load that was applied on the dynamometer setup for this part of the testing
procedure was 10 in*lbs. This load was applied in a constant manner and will allow for a
comparison to be made between the innovative mechanism and the standard manually
powered wheelchair. The load was applied to the test subjects for a total of three
minutes, with data being taken every 1 second, same as before.
The human test subjects were recruited and asked whether or not they had shoulder
or upper arm problems and/or pain before the testing procedure started. By recruiting
only able-bodied subjects with no prior wheelchair experience, there will not be a bias
toward one method of propulsion or the other. The exact method of wheelchair stroke
pattern was not noted. After the initial question session, the subjects were given a couple
minutes to familiarize themselves with the testing procedure and the way in which the
wheels had to be powered. For each of the tests, the torque that was being applied was
carefully observed to make sure that each subject kept the output torque constant, within

75
reason, to the input torque of 10 in*lbs. There are variations in the output torque, but
each variation lies within the given scope of allowed variation from 10 in*lbs. In
addition, there are points on some of the subjects torque curves that show a few very low
torque values. These points were directly dependant upon a subject’s ability to keep the
wheels moving during propulsion. A couple subjects momentarily stopped the wheel
whenever they applied the propulsion stroke.
Each of the nine subjects powered the wheelchair dynamometer using the
innovative mechanisms, and then they were asked to return at a later date or time in order
to complete a test using only the standard wheels for propulsion. None of the subjects
were allowed to complete the second test procedure immediately after the first due to the
possibility of fatigue. After the data was acquired for each of the human test subjects
using both the innovative mechanisms and the standard wheelchair wheels for propulsion,
the data was tabulated and any necessary conversion factors were applied to the data.
The one conversion factor that was needed was a conversion of the power from watts to
horsepower. But, this was simply a multiplication operation, and none of the original
data was altered in any way. Once the data was compiled in the necessary format, charts
and graphs were made for output torque, angular velocity (RPM), and horsepower for
each of the nine human test subjects. The graphs of output torque, angular velocity, and
horsepower can be found in Appendix C labeled as Figure 118 through Figure 144. The
same issue arose with this set of graphs as arose with the set of graphs in the previous
section. The horsepower graphs are simply a scaled version of the angular velocity.
Once again, this condition exists because horsepower was simply equal to torque
multiplied by the angular velocity and divided by a constant. So, if the output torque was

76
constant, the only variable that was changing was the angular velocity. This was the
reason why the angular velocity and horsepower graphs look very similar to one another.
In order to analyze the given data, a method had to be documented whereby the data
could be analyzed in a scientific and objective manner. The following pages contain the
data reduction for the comparison between the manually powered wheelchair wheels and
the manually powered innovative mechanism.
5 Results
5.1 Results of Testing of Subjects at Different Mechanism Angles
The following paragraphs will be used to explain the results for the ten human test
subjects in detail.
The first graphs that were constructed for each of the 10 subjects were for the
output torque. Each output torque was analyzed to make sure the torque was being held
at a relatively constant value. However, there are sticking points that exist in the
mechanism due to the moment arm that is being produced, and because of the line of
action of the subject’s input force. If the torque dropped too close to 0 at the same time
as the angular velocity (RPM) dropped to a value close to 0, this was deemed a sticking
point and the testing was allowed to progress. Each of the ten subjects data that was
analyzed in this part of the Results section had data that fell within the range of the
allowable deviation.
The first set of results that will be compared are for subjects 6,7, and 8.

77
Figure 51 - RPM Results For Subject 6 (10*lbs)
Figure 52 - RPM Results For Subject 7 (10 in*lbs)
RPM vs. Time -Subject 6
-5
0
5
10
15
20
25
30
35
40
0 20 40 60 80 100 120 140 160 180 200
Time (s)
RPM
(rev
/min
)
0 Degrees60.59 Degrees
RPM vs. Time - Subject 7
0
5
10
15
20
25
30
35
40
45
0 20 40 60 80 100 120 140 160 180 200Time (s)
RPM
(rev
/min
)
0 Degrees59.75 Degrees

78
RPM vs. Time - Subject 8
0
5
10
15
20
25
30
35
40
45
50
0 20 40 60 80 100 120 140 160 180 200
Time (s)
RPM
(rev
/min
)
0 Degrees58.11 Degrees
Figure 53 - RPM Results For Subject 8 (10 in*lbs)
By inspection of the RPM curves for these three given subjects, it can be observed
that there was not an appreciable difference between the angular velocities that were
obtained with the innovative mechanism set at 0 degrees and the angular velocities with
the mechanism set at the derived mechanism angle. The horsepower results are similar to
the angular velocity results. This phenomenon was expected because horsepower is
simply the torque multiplied by the angular velocity and divided by a constant. So, if the
angular velocities for a subject were higher for one of the angle orientations, the
horsepower for the same subject will also be higher for that angle orientation because the
torque output of the mechanism was constant. The points on the angular velocity curve
that dip down to 0 are the sticking points. These points are reached where the moment
arm becomes equal to 0. In addition, the line of action of the user’s input force can cause
these sticking points. The subject’s arm was fully extended and no moment arm was
present, which resulted in the locking of the mechanism. Also, when the subject’s arm

79
was fully extended, the subject was propelling along the line of action, so no force was
being transmitted.
Subjects 1 and 2 had a higher overall angular velocity (RPM) range with the
innovative mechanisms orientated at the derived mechanism angle.
RPM vs. Time - Subject 1
0
5
10
15
20
25
30
35
0 20 40 60 80 100 120 140 160 180 200
Time (s)
RPM
(rev
/min
)
0 Degrees55.43 Degrees
Figure 54 - RPM Results For Subject 1 (10 in*lbs)

80
RPM vs. Time - Subject 2
0
5
10
15
20
25
30
35
0 20 40 60 80 100 120 140 160 180 200
Time (s)
RPM
(rev
/min
)
0 Degrees60.59 Degrees
Figure 55 - RPM Results For Subject 2 (10 in*lbs)
In addition, these two subjects experienced angular velocity values that were also
higher overall for the derived mechanism angle. The higher overall trend of angular
velocity values could stem from the fact that the user was able to supply more bodily
force to the mechanism in this configuration, or this configuration may have allowed for
the given user to have a higher mechanical advantage.
Subject 3 had a higher range of angular velocity values with the mechanism set at
the derived mechanism angle, but there was not a noticeable difference in the overall
trends of the angular velocity (RPM) curves.

81
RPM vs. Time - Subject 3
0
5
10
15
20
25
30
35
40
45
0 20 40 60 80 100 120 140 160 180 200
Time (s)
RPM
(rev
/min
)
0 Degrees54.02 Degrees
Figure 56 - RPM Results For Subject 3 (10 in*lbs)
Whereas, subject 4 demonstrated a higher overall trend in angular velocity with
the mechanism angle set at 0 degrees, but did not have a noticeable shift in the overall
range of angular velocity values that were obtained.

82
RPM vs. Time - Subject 4
0
5
10
15
20
25
30
35
40
0 20 40 60 80 100 120 140 160 180 200Time (s)
RPM
(rev
/min
)
0 Degrees51.41 Degrees
Figure 57 - RPM Results For Subject 4 (10 in*lbs)
Subjects 5, 9, and 10 demonstrated a higher range of angular velocity (RPM) values
for the 0 degree mechanism angle condition, in addition to a higher overall angular
velocity trend for the 0 degree mechanism position.
RPM vs. Time - Subject 5
0
5
10
15
20
25
30
35
0 20 40 60 80 100 120 140 160 180 200
Time (s)
RPM
(rev
/min
)
0 Degrees57.06 Degrees
Figure 58 - RPM Results For Subject 5 (10 in*lbs)

83
RPM vs. Time - Subject 9
0
5
10
15
20
25
30
35
0 20 40 60 80 100 120 140 160 180 200Time (s)
RPM
(rev
/min
)
0 Degrees60.59 Degrees
Figure 59 - RPM Results For Subject 9 (10 in*lbs)
RPM vs. Time - Subject 10
0
5
10
15
20
25
30
35
0 20 40 60 80 100 120 140 160 180 200
Time (s)
RPM
(rev
/min
)
0 Degrees64.27 Degrees
Figure 60 - RPM Results For Subject 10 (10 in*lbs)
The results show that there was not a definitive difference in the angular velocity
(RPM) values between the angle orientations of the major axis of the ellipse.

84
5.2 Results of Testing Subjects – Mechanism/Wheel Comparison
The first set of results that will be presented are the results from the angular
velocity (RPM) comparison data. It was originally the goal of the team to design a
mechanism that would allow for the user to propel a manually powered wheelchair with
less effort. The range of angular velocities that a person must use in order to propel the
wheelchair provides a direct relationship to the amount of energy that a person must use
to propel the wheelchair. In order to obtain a way of comparing the angular velocity
(RPM) graphs for each of the test subjects, a linear curve fit was made for each set of
data on the graph. A linear fit was used so that a simple curve or trend could be seen in
the data. The linear curve fit for the wheelchair wheel data is marked with a dotted line
on the graphs, whereas the linear fit for the innovative mechanism data is marked with a
solid line on the graphs. Once the curve fits were completed, a point in time in the
middle of the testing window was chosen to evaluate each curve. Since these are linear
curve fits, the value in the middle will be equal to approximately the average of the data
points. This idea will be further stated later in the results section. The following table
gives a comparison of the angular velocity data results for both the standard wheels and
the innovative mechanism.
Table 13 - Comparison of RPM Data For Wheels and Innovative Mechanism
Subject RPM (Wheels) RPM (0 Degrees) Ratio RPM(W)/RPM(0)1 22.542 18.021 1.2512 31.099 20.381 1.5263 30.373 23.808 1.2764 31.794 27.181 1.1705 Uncompleted Uncompleted6 27.748 19.926 1.3937 49.993 26.748 1.8698 42.145 26.425 1.5959 44.375 19.368 2.29110 48.711 20.399 2.388
AVERAGE 36.531 22.473 1.640

85
The angular velocities (RPM’s) in Table 13 were compared for a time of 90
seconds. This allowed for a comparison in the middle of the three-minute testing
window. It can also be seen that the highest ratio of RPM(W) to RPM(0) was 2.388,
whereas the lowest ratio was 1.170. This wide range of values could be due to each
person’s own personal way of propelling the wheelchair. Some subjects would set
further up in the chair, whereas others would set completely back in the chair. Each
subject had a different style of propulsion along with a different cadence at which they
propelled the wheels. The only instruction that was given to the test subjects was
whether or not they were holding the output torque values within the given range of 10
in*lbs. The cadence and seating position was then left up to the test subjects. The given
values of RPM(W) and RPM(0) were then averaged in order to give an average angular
velocity (RPM) value for each set of data. The average angular velocity value of the
wheel method of propulsion, RPM(W) was 36.531 RPM’s, whereas the average angular
velocity value for the innovative mechanism method of propulsion, RPM(0) was 22.473
RPM’s. The average ratio of the RPM(W)/RPM(0) that was obtained was 1.640. The
ratio of the wheel angular velocity (RPM) to the innovative mechanism angular velocity
(RPM) was formulated to demonstrate the mechanical advantage that was being created
by the innovative mechanism at a given load of 10 in*lbs. This value of 1.640 means that
the standard wheelchair propulsion system requires 1.640 times the angular velocity
(RPM) required by the innovative mechanism to sustain the same load.
By inspection of the graphs in Appendix C, it can be seen that subjects 1, 3, 4, 6,
8, and 10 demonstrated a general trend of slowly decreasing RPM values for the wheel

86
method of propulsion, whereas they demonstrated a slightly increasing RPM value for the
innovative mechanism method of propulsion.
RPM vs. Time - Subject 2 (Wheels)
y = -0.0105x + 23.487
y = -0.0008x + 18.093
0
5
10
15
20
25
30
35
40
0 20 40 60 80 100 120 140 160 180 200
Time (s)
RPM
(rev
/min
)
0 DegreesWheelsLinear (Wheels)Linear (0 Degrees)
Figure 61 - RPM Results For Subject 1 - Wheels (10 in*lbs)

87
RPM vs. Time - Subject 3 (Wheels)
y = -0.0091x + 31.192
y = 0.0227x + 21.765
0
5
10
15
20
25
30
35
40
45
0 20 40 60 80 100 120 140 160 180 200
Time (s)
RPM
(rev
/min
)
0 DegreesWheelsLinear (Wheels)Linear (0 Degrees)
Figure 62 - RPM Results For Subject 3 - Wheels (10 in*lbs)
RPM vs. Time -Subject 4 (Wheels)
y = -0.0259x + 34.125
y = 0.0077x + 26.488
0
5
10
15
20
25
30
35
40
45
50
0 20 40 60 80 100 120 140 160 180 200Time (s)
RPM
(rev
/min
)
0 DegreesWheelsLinear (Wheels)Linear (0 Degrees)
Figure 63 - RPM Results For Subject 4 - Wheels (10 in*lbs)

88
RPM vs Time - Subject 6 (Wheels)
y = -0.0356x + 30.952
y = 0.0014x + 19.8
0
5
10
15
20
25
30
35
40
45
0 20 40 60 80 100 120 140 160 180 200
Time (s)
RPM
(rev
/min
)
0 DegreesWheelsLinear (Wheels)Linear (0 Degrees)
Figure 64 - RPM Results For Subject 6 - Wheels (10 in*lbs)
RPM vs. Time - Subject 8 (Wheel)
y = -0.0443x + 46.132
y = 0.0333x + 23.428
0
10
20
30
40
50
60
0 20 40 60 80 100 120 140 160 180 200
Time (s)
RPM
(rev
/min
)
0 DegreesWheelsLinear (Wheels)Linear (0 Degrees)
Figure 65 - RPM Results For Subject 8 - Wheels (10 in*lbs)

89
RPM vs Time - Subject 10 (Wheel)
y = -0.025x + 50.961
y = 0.0081x + 19.67
0
10
20
30
40
50
60
70
80
0 20 40 60 80 100 120 140 160 180 200
Time (s)
RPM
(rev
/min
)
0 DegreesWheelsLinear (Wheels)Linear (0 Degrees)
Figure 66 - RPM Results For Subject 10 - Wheels (10 in*lbs)
This general trend could mean that fatigue was setting in during the wheel method
of propulsion, but the innovative mechanisms did not result in the subjects entering the
fatigue state as quickly. Subject 7 was the only subject that showed a steady RPM curve
for each of the two types of propulsion, but with the RPM values of the wheel propulsion
method still higher than the RPM range for the innovative mechanism propulsion.

90
RPM vs. Time - Subject 7
y = 0.0024x + 49.777
y = -0.0022x + 26.946
0
10
20
30
40
50
60
70
0 20 40 60 80 100 120 140 160 180 200
Time (s)
RPM
(rev
/min
)
0 DegreesWheelsLinear (Wheels)Linear (0 Degrees)
Figure 67 - RPM Results For Subject 7 - Wheels (10 in*lbs)
Subject 2 demonstrated an RPM increase in both the wheel and innovative
mechanism methods of propulsion. Whereas, subject 9 demonstrated an increase in RPM
for the wheel method of propulsion, but a decline in RPM for the innovative mechanism
method of propulsion.

91
RPM vs. Time - Subject 2 (Wheels)
y = 0.0096x + 31.013
y = 0.0133x + 19.184
0
5
10
15
20
25
30
35
40
45
50
0 20 40 60 80 100 120 140 160 180 200
Time (s)
RPM
(rev
/min
)
0 DegreesWheelsLinear (Wheels)Linear (0 Degrees)
Figure 68 - RPM Results For Subject 2 - Wheels (10 in*lbs)
RPM vs. Time - Subject 9 (Wheels)
y = 0.0241x + 42.206
y = -0.0036x + 19.692
0
10
20
30
40
50
60
70
0 20 40 60 80 100 120 140 160 180 200Time (s)
RPM
(rev
/min
)
0 DegreesWheelsLinear (Wheels)Linear (0 Degrees)
Figure 69 - RPM Results For Subject 9 - Wheels (10 in*lbs)
The overall range of the RPM values was larger in each case for the wheel
method of propulsion as compared to the innovative mechanism method of propulsion.

92
This general trend could explain the fact that eight of the nine subjects experienced
shoulder or upper-arm discomfort after the testing procedure. The shoulder was being
made to rapidly accelerate and move in an abnormal range of motion. This reiterates the
conclusions that have been drawn by other investigators, see Literature Review for
examples.
The next set of data that was analyzed was for horsepower results of the nine
human test subjects. The horsepower results look very reminiscent of the RPM value
results, but the horsepower results are shown to give validity to the analysis procedure
that was used. The horsepower curves were also fitted with a linear curve fit and point at
90 seconds was analyzed. Once again, this provided a way of comparing the actual
graphs of the horsepower. The following table contains the results of the horsepower
section of the analysis.
Table 14 - Horsepower Comparison of Wheel and Innovative Mechanism Propulsion Methods
The same general trends can be seen in Table 14 as were seen for the RPM results. The
average ratio of the horsepower used to propel the wheels, HP(W), to the horsepower
used to propel the innovative mechanism, HP(0), was 1.631. This value is essentially the
same as the value that was obtained for the RPM(W) to RPM(0) results. Any differences
Subject HP (Wheels) HP (0 Degrees) Ratio HP(W)/HP(0)1 0.00342 0.0028 1.2212 0.00508 0.00318 1.5973 0.00481 0.00376 1.2794 0.00504 0.00429 1.1755 Uncompleted Uncompleted6 0.00436 0.003618 1.2057 0.007927 0.004273 1.8558 0.00667 0.00415 1.6079 0.00706 0.00305 2.315
10 0.00774 0.00319 2.426AVERAGE 0.00579 0.00359 1.63128

93
are simply a result of rounding error in the calculations. The same general trends in the
horsepower curves can also be seen for each subject. Once again, the horsepower results
look very similar to the RPM results because there is simply a scaling factor used to go
between the two values.
The final set of results that were tabulated were for an energy analysis on the
wheel and innovative mechanism methods of propulsion. The data that was obtained
from the human testing included a column of data in watts. In order to give an energy
comparison the watts were divided by 1000 and multiplied by the number of hours each
subject spent in the test procedure. Each subject spent a total of 3 minutes in each test. 3
minutes gives a total of 0.05 hours. The energy results were then in kw-hrs. This is a
basic unit of energy that most people understand. In order to obtain one solid number for
the number of kilowatts that were used, an average was taken of all of the data points that
were obtained over the three-minute testing period. The comparison of the energy results
to the RPM and horsepower results will provide of method of verifying the various
methods of analysis. The following table gives a comparison of energy analysis for each
of the propulsion methods.

94
Table 15 - Results of Energy Analysis for Wheels and Innovative Mechanism Propulsion
Subject Energy (Wheels) Energy ( 0-Degrees) Ratio Energy(W)/Energy(0) (kw-hrs) (kw-hrs)
1 0.000126246 0.000105652 1.194918215 2 0.000188653 0.000120706 1.562906623 3 0.000179672 0.000140006 1.283322372 4 0.000188008 0.000160881 1.168620612 5 Uncompleted Uncompleted 6 0.00016287 0.000117425 1.387008574 7 0.000295986 0.000158439 1.868140048 8 0.000249042 0.000156508 1.591234871 9 0.000262593 0.000114663 2.290134863
10 0.000288119 0.000120254 2.395922038 AVERAGE 0.000215688 0.000132726 1.638023135
By inspection of Table 15 it can be seen that the average ratio of the energy used to
propel the wheels, Energy(W), to the energy used to propel the innovative mechanism,
Energy(0), was 1.638. This value of 1.638 means that is takes 1.638 times that energy to
propel the wheels as it takes to propel the innovative mechanism. In addition, the energy
ratio average of 1.638 was very comparable to the RPM ratio average of 1.640 and the
horsepower ratio average of 1.631. Since approximately the same advantage was found
throughout the three different analysis techniques, the results are confirmed. The
conclusion section contains a summary of the results that were obtained.
6 Conclusions
� A new innovative mechanism that can be adapted to traditional wheelchairs has been
designed, modeled, constructed, and tested.
� The test results indicate that preferential orientation of the major axis of the ellipse on
the propulsion system creates no distinct mechanical advantage. There was evidence

95
of significant frequency of sticking in the offset angle condition. It is believed this
was due to the lack of moment arm as the human arm was locked at the elbow, and
the because of the line of action of the human input force.
� When compared with the innovative mechanism propulsion system, it was shown that
an increase of 1.640 times the angular velocity of the innovative mechanism
propulsion system was required by the standard wheelchair propulsion system to
sustain a constant torque load of 10 in*lbs.
� Subjects that were used to test both methods of propulsion inevitably experienced and
complained of shoulder pain while using the traditional method of wheelchair
propulsion. No complaints of discomfort were experienced for the innovative
mechanism method of propulsion.
The innovative mechanism propulsion system has been shown to allow for
advantages over standard wheelchair propulsion. However, it must be noted that data
was only taken on the output side. Data needs to be taken on the input parameters to
determine the amount of work that is actually going into propelling the different modes of
propulsion.
The methods of testing and obtaining data should be revised. The experimental
procedures that were used in this project were only concerned with maintaining a
constant torque load. A testing regime should be developed that uses the dynamometer to
apply a load, and the subjects are instructed to hold the RPM’s as constant to a given
value as possible. This new testing methods would then assure that each of the
propulsion methods allowed the wheelchair to travel approximately the same distance.

96
The oxygen, heart rate, and muscle activation data could then be obtained to give a true
comparison between the two propulsion methods.
6.1 Specific Accomplishments of This Research (What’s New)
� A new innovative propulsion system based on Cardan gearing was invented for
wheelchair propulsion application.
� Engineering drawings for the mechanism were compiled based on mathematical
models to simulate the SC wheelchair propulsion stroke. These drawings were used
by Laser Processing to manufacture four complete propulsion units.
� The propulsion units were retrofitted onto a standard wheelchair frame in the MAE
shop.
� A testing station was design and fabricated to test wheelchair propulsion methods in
the MAE shop. A dynamometer was sized, purchased, and mounted on the testing
station.
� Human subjects were recruited and tested for both mechanism angle efficiency and
propulsion method comparison.
� Testing has shown that angular orientation does not demonstrate any efficiency in the
innovative mechanism propulsion system.
� Testing has shown that the innovative propulsion system required less angular
velocity (RPM) to maintain a constant load as compared to the standard method of
wheelchair propulsion.

97
7 Recommendations
The work that has been done so far on the innovative wheelchair project has laid the
groundwork upon which further work can be based. The innovative mechanism has
already been shown to work, and it has also been shown that the innovative mechanism
has advantages over standard wheelchair propulsion. The next step of this design process
should include data on which muscles are being used, and on the amount of work that the
person is actually doing in the wheelchair. This thesis has shown an energy advantage by
using the innovative mechanism, but this was only based on the outputs of the system.
Tests should be run to obtain the oxygen consumption, heart rate, and breathing rate of
test subjects using both the innovative mechanism and the standard wheelchair wheels.
All of this data may not be able to be collected during the same phase of the project, but
the investigators should look at the amount of energy consumption that is required for a
person to propel both modes of propulsion. In addition, an EKG machine or some other
method of obtaining muscle contraction data should be used to validate which muscles
are being used with both the innovative mechanism and the standard wheelchair wheels.
It is my belief that once these future steps are accomplished, a real advantage will be seen
in the innovative mechanism.
On the design side of the project, a method should be investigated as to how the play
in the mechanism, especially around the bearings, could be prevented. Whenever the
user pushes on the handle, a large moment is generated at the bearings, and subsequent
wear of the shaft follows. In addition, before the innovative mechanism can be marketed,
a housing should be made that encloses the working parts of the mechanism. This

98
housing will keep people’s clothes and other objects form coming in contact with the
sprockets and roller chains.
Work also needs to be done on installing a gearing or transmission system on the
retrofitted wheelchair. There also needs to be work done on the scotch yoke system that
has been talked about. In addition, a method needs to be designed to add a coast phase
into the gearing of the innovative mechanism. Hand brakes will also have to be designed
in conjunction with the coast mechanism phase of development.
Funding has also been a problem, but now that the initial groundwork has been laid
and data has been taken to initially validate the innovative mechanism, funding should be
easier to come by, and more doors will be open.
This may seem like a lot of work that still should be done on the project, but when I
started, all that I had was the basic design of the innovative mechanism. This project has
come a long way in the past 18 months. One of my main concerns on this project was
accessing the benefits of the innovative mechanism because there are serious health and
social benefits that can be accomplished with this project!

99
References
1 http://cosmos.ot.buffalo.edu/t2rerc/programs/demandpull/mobility/problem-statements/ps-geared-hubs.html 2 “State Makes Advances For People With Disabilities”. WV Retirement Times. April/May/June 1999. P1. 3 http://asb-biomech.org (January 2002) 4 http://cosmos.ot.buffalo.edu (January 2002) 5 Sean D. Shimada, PhD; Rick N. Robertson, PhD; Michael L. Bonninger, MD; Rory A. Cooper, PhD, “Kinematic characterization of wheelchair propulsion.” Journal of Rehabilitation Research and Development Vol. 35 No. 2 (June 1998) : Pages 210-218. 6 www.wheelchairnet.org (January 2002) 7 http://www.ilcnsw.asn.au/ability.cfm (January 2002) 8 www.frankmobility.com (April 2002) 9 http://factsheets.disabledliving.org.uk (January 2002) 10 http://catalog.invacare.com (January 2002) OR www.invacare.com (May 2002) 11 http://www.jbtc.or.jp/current/english/wheelchairs/ (January 2002) 12 www.wijit.com 13 Lucas H.V. van der Woude, PhD; Eugenie Botden, MsC; Ingrid Vriend, MsC; Dirtjan Veeger, PhD. “Mechanical advantage In wheelchair lever propulsion: Effect on physical strain and efficiency.” Journal of Rehabilitation Research and Development Vol 34 No. 3. (July 1997): Pages 286-294. 14 http://www.msnbc.com/news/285231.asp#BODY (January 2002) 15 Shigley and Mishke. Mechanical Engineering Design, Firth Edition. McGraw-Hill, Inc., 1989. 16 http://www.magtrol.com 17 http://www.access-board.gov/adaag/html/fig11.html (May 2002).

100
Acknowledgements
When I graduated with my Bachelor’s Degree, I never thought that I would be
graduating with my Master’s Degree. It was my original plans to get a job and make
money as soon as possible. But, through the continued efforts (badgering) of Dr. Long I
ended up in the Master’s Degree program at WVU and began working on the Innovative
Wheelchair Project. This project has really allowed me to see how engineers can make a
real difference in the world. I’d just like to thank Dr. Long for his continued effort and
guidance through my entire Master’s Degree tenure. Dr. Long says that he’s going on
phased retirement, but I’m not sure how working only part time is any different than what
he is doing now! And then there’s Dr. Stiller. When I first met Al, I wasn’t even sure
what this “Mad-Man” was doing. I have learned so much from Al. One of the most
important things that I have learned is how to play the “GAME” very successfully. I will
always remember the famous words of Dr. Stiller: “No really, I’m innocent, … , Thank
you very much.” I’d also like to thank Dr. Wayne for his support as a chairman. I know
that you had a lot of things going on with your fuels projects, so thank you for finding the
time to help with this project. I’d like to thank Kevin Swisher for his help on the project.
I don’t know whom you made mad at work, but you sure must have rattled some chains
to get put on a project with us. Also, I’d like to thank Dr. McMullin for her help before
she left for Boeing. I’d also like to thank the various undergraduate students who have
worked on this project during the past several years.
I’d like to thank the research funding sources that have contributed to this project:
Laser Processing Inc., WVUCED, Kellogg Partnership Program, WVU Research
Corporation, Mon HealthCare, and NIOSH.

101
Appendix A

102
Figure 70 - Drawing Of Back Connecting Lever

103
Figure 71 - Drawing Of Lever B
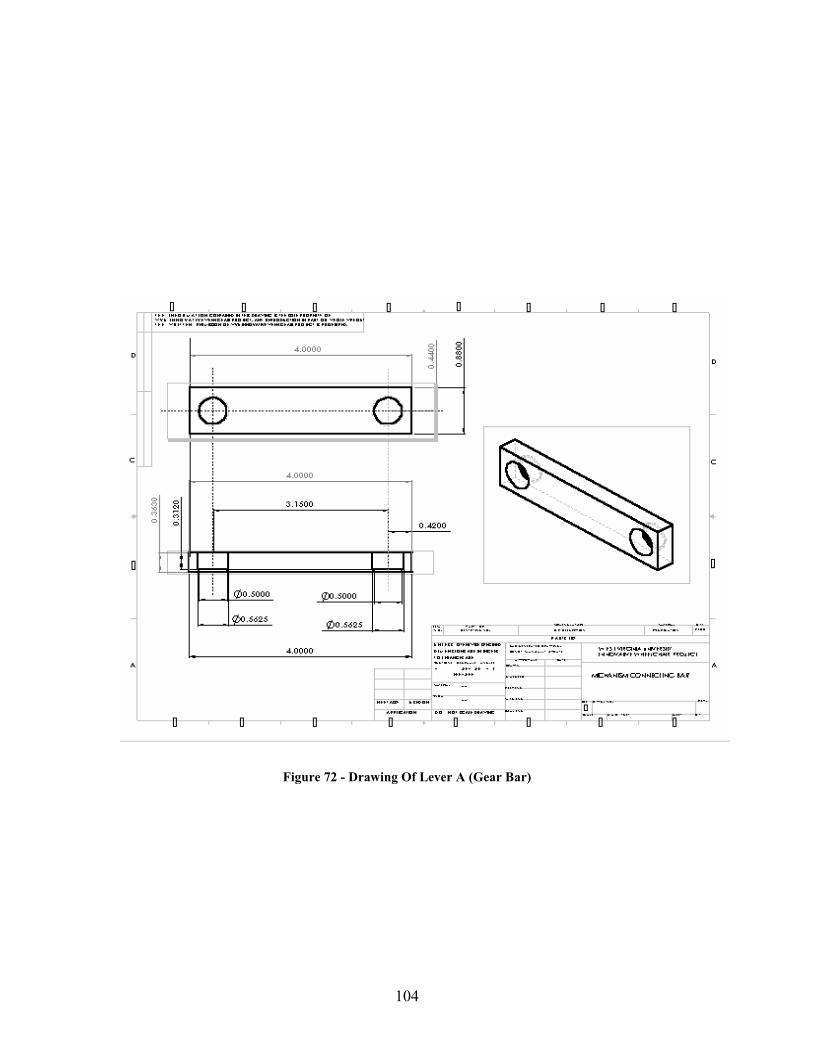
104
Figure 72 - Drawing Of Lever A (Gear Bar)

105
Figure 73 - Drawing Of Mechanism Shaft #1

106
Figure 74 - Drawing Of Shaft #2

107
Figure 75 - Drawing Of Sun Sprocket

108
Figure 76 - Drawing Of Planet Sprocket

109
Figure 77 - Drawing Of Connecting Roller Chain Sprocket

110
Appendix B

111
Table 16 - Results For Deflection and Stress Analysis -Table 1
�dyno �mech �arm 10.189 47.463 45
Fx dyno 47.775 Fy dyno 8.586
Fx mech 3.581 Fy mech 3.903
Fx arm 1.768 Fy arm 1.768
Fy arm& wheel 7.768
E (psi) 3.00E+07I (in^4) 0.003
Diameter (in) = 0.5Area (in^2) = 0.1963C (in) = 0.25I (in^4) = 0.003068
With Wheel Safety Factor = 3.7With Mechanism Safety Factor = 3.9

112
Table 17 - Results for Deflection and Stress Analysis -Table 2
With Wheel RAY (lb) RBY (lb) 15.549 8.573
RAx (lb) RBx (lb) 41.528 2.711
Y-Direction X-Direction
at x=3 V=-7.768 at x=3 V=-1.768 c1 c1
-7.768 -1.768 at x=4 M=-31.072 at x=4 M=-7.032
c2 c2 0.0028 0.0391
c3 c3
1170.642 660.387 at x=4 y=0 at x=4 y=0
c4 c4 -9026.252592 -6785.072814
Deflection @ x=24 Deflection @ x=24 Magnatude (24) -0.0539 -0.0441 0.0697
Deflection @ x=0 Deflection @ x=0 Magnatude (0) -0.098 -0.074 0.1228
Deflection @ x=5.5 Deflection @ x=5.5 Magnatude (5.5) -0.0327 -0.0356 0.0483
Deflection @ x=4 Deflection @ x = 4 -0.0490 -0.0454
Deflection @ x = 20 Deflection @ x=20 -0.00081 -0.02564

113
Table 18 - Results of Deflection and Stress Analysis - Table 3
With Mechanism
RAY (lb) RBY (lb) 3.878 -3.098
RAx (lb) RBx (lb) 39.715 0.898
Y-Direction X-Direction
at x=3 V=3.903 at x=3 V=-3.581 c1 c1
3.903 -3.581 at x=4 M=7.806 at x=2 M=0
c2 c2 -7.806 7.162
at x=20 y=0 at x=20 y=0 c3 c3
-462.96 918.238 at x=4 y=0 at x=4 y=0
c4 c4 3541.428 -7754.109
Deflection @ x=24 Deflection @ x=24 Magnitude (24) 0.0237 -0.0086 0.0253 in
Deflection @ x=0 Deflection @ x=0 Magnitude (0) 0.0385 -0.084 0.0927 in
Deflection @ x=5.5 Deflection @ x=5.5 Magnitude (5.5) 0.0390 -0.0298 0.0491 in
Deflection @ x=4 Deflection x=4 0.0182 -0.044208473
Deflection @ x=20 Deflection @ x=20 0.0000 0.01033

114
Appendix C

115
Torque Analysis - Subject 1
0
0.5
1
1.5
2
2.5
3
3.5
4
4.5
-450 -400 -350 -300 -250 -200 -150 -100 -50 0
Angle of Lever A (THETA)
Torq
ue (i
n*lb
)
INPUT TORQUE
Figure 78 - Results of Torque Analysis For Subject 1
Torque Analysis - Subject 2
0
0.5
1
1.5
2
2.5
3
3.5
4
4.5
-450 -400 -350 -300 -250 -200 -150 -100 -50 0
Lever A Position (Degrees)
Torq
ue (i
n*lb
)
Figure 79 - Results of Torque Analysis For Subject 2

116
Torque Analysis - Subject 3
0
0.5
1
1.5
2
2.5
3
3.5
4
4.5
-450 -400 -350 -300 -250 -200 -150 -100 -50 0
LeverA (Degrees)
Torq
ue (i
n*lb
)
Figure 80 - Results of Torque Analysis For Subject 3
Torque Analysis - Subject 4
0
0.5
1
1.5
2
2.5
3
3.5
4
4.5
5
-450 -400 -350 -300 -250 -200 -150 -100 -50 0
LeverA (Degrees)
Torq
ue (l
b*in
)
Figure 81 - Results of Torque Analysis For Subject 4

117
Torque Analysis - Subject 5
0
0.5
1
1.5
2
2.5
3
3.5
4
-500 -450 -400 -350 -300 -250 -200 -150 -100 -50 0
Lever A (Degrees)
Torq
ue (i
n*lb
)
Figure 82 - Results of Torque Analysis For Subject 5
Toque Analysis - Subject 6
0
0.5
1
1.5
2
2.5
3
3.5
4
4.5
-450 -400 -350 -300 -250 -200 -150 -100 -50 0
Lever A (Degrees)
Torq
ue (l
b*in
)
Figure 83 - Results of Torque Analysis For Subject 6

118
Toque Analysis - Subject 7
0
0.5
1
1.5
2
2.5
3
3.5
4
4.5
-450 -400 -350 -300 -250 -200 -150 -100 -50 0
Lever A (Degrees)
Torq
ue (l
b*in
)
Figure 84 - Results of Torque Analysis For Subject 7
Torque Analysis - Subject 8
0
0.5
1
1.5
2
2.5
3
3.5
4
4.5
-450 -400 -350 -300 -250 -200 -150 -100 -50 0
Lever A (Degrees)
Torq
ue (l
b*in
)
Figure 85 - Results of Torque Analysis For Subject 8

119
Torque Analysis - Subject 9
0
0.5
1
1.5
2
2.5
3
3.5
4
4.5
5
-450 -400 -350 -300 -250 -200 -150 -100 -50 0
Lever A (Degrees)
Torq
ue (l
b*in
)
Figure 86 - Results of Torque Analysis For Subject 9
Torque Analysis - Subject 10
0
0.5
1
1.5
2
2.5
3
3.5
4
4.5
-450 -400 -350 -300 -250 -200 -150 -100 -50 0
Lever A (Degrees)
Torq
ue (l
b*in
)
Series1
Figure 87 - Results of Torque Analysis For Subject 10

120
Table 19 - Testing Torque Calculation Spreadsheet
Input Rise of Ramp = 1 In Input Run of Ramp = 20 In Input Inclination Angle = 0.049958 Radians Inclination Angle = 2.862405 Degrees Input Human Weight = Lbs Input Wheelchair Weight = Lbs Input Coeff. Of Friction = Input Wheel Diameter = In SIN (THETA) 0.049938COS(THETA) 0.998752Input Initial Arm Angle = Degrees Arm Angle = 0 Radians SIN (ARM ANGLE) = 0 Test Torque Calculations COS (ARM ANGLE) = 1
Two-Sided Arm Force FARM = 0 One-Sided Arm Force FARM = 0 lbs Total Normal Force N = 0 lbs One Arm -Total Torque Torque = 0 in*lbs Two Arm - Total Torque Torque = 0 in*lbs

121
Output Torque vs. Time - Subject 1
0
2
4
6
8
10
12
14
0 20 40 60 80 100 120 140 160 180 200
Time (s)
Out
put T
orqu
e (lb
*in)
55.43 Degrees0 Degrees
Figure 88 - Torque Results For Subject 1 (10 in*lbs)
RPM vs. Time - Subject 1
0
5
10
15
20
25
30
35
0 20 40 60 80 100 120 140 160 180 200
Time (s)
RPM
(rev
/min
)
0 Degrees55.43 Degrees
Figure 89 - RPM Results For Subject 1 (10 in*lbs)

122
HP Output vs. Time - Subject 1
0
0.001
0.002
0.003
0.004
0.005
0.006
0 20 40 60 80 100 120 140 160 180 200Time (s)
Out
put H
orse
pow
er (H
P)
0 Degrees55.43 Degrees
Figure 90 - Horsepower Results for Subject 1 (10 in*lbs)
Output Torque vs Time - Subject 2
0
2
4
6
8
10
12
14
0 20 40 60 80 100 120 140 160 180 200
Time (s)
Out
put T
orqu
e (lb
*in)
0 Degrees60.59 Degrees
Figure 91 - Torque Results For Subject 2 (10 in*lbs)
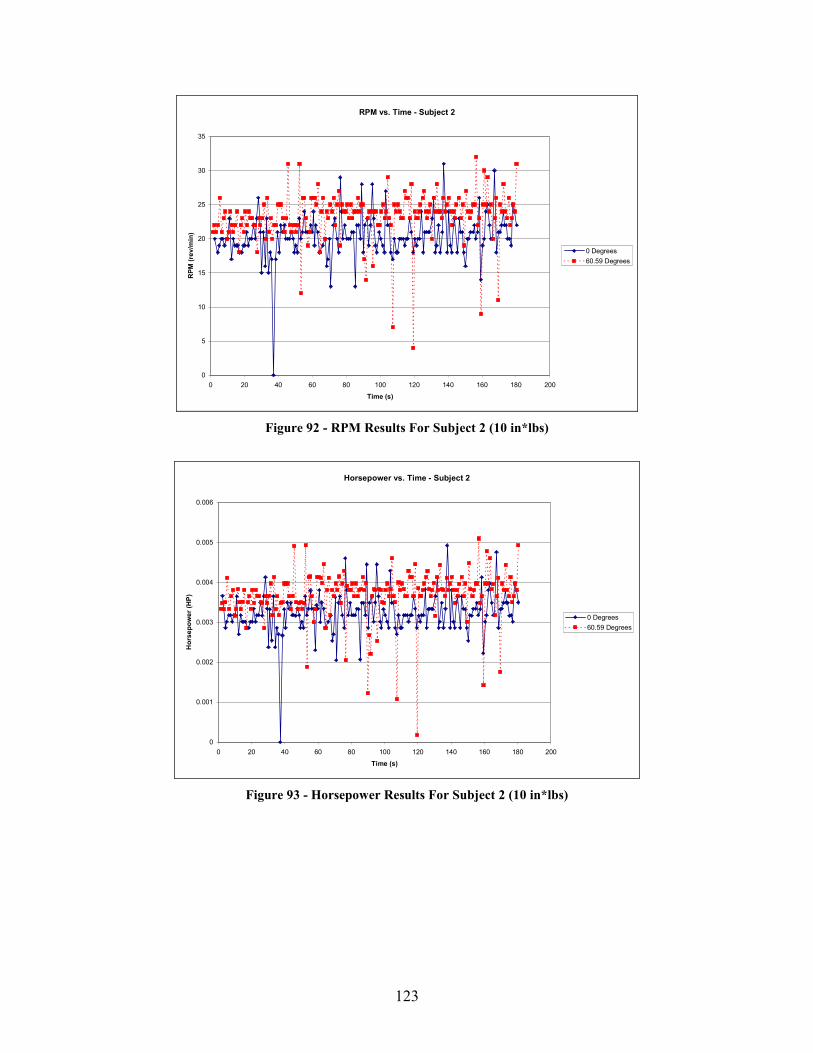
123
RPM vs. Time - Subject 2
0
5
10
15
20
25
30
35
0 20 40 60 80 100 120 140 160 180 200
Time (s)
RPM
(rev
/min
)
0 Degrees60.59 Degrees
Figure 92 - RPM Results For Subject 2 (10 in*lbs)
Horsepower vs. Time - Subject 2
0
0.001
0.002
0.003
0.004
0.005
0.006
0 20 40 60 80 100 120 140 160 180 200
Time (s)
Hor
sepo
wer
(HP)
0 Degrees60.59 Degrees
Figure 93 - Horsepower Results For Subject 2 (10 in*lbs)
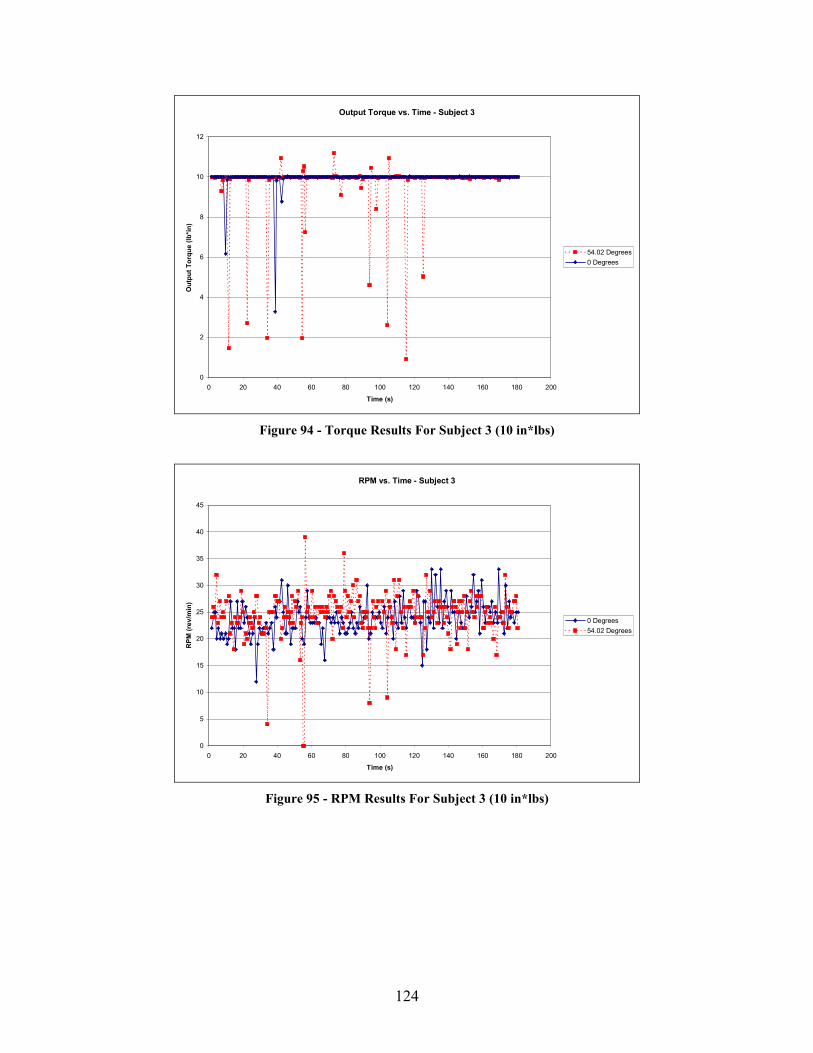
124
Output Torque vs. Time - Subject 3
0
2
4
6
8
10
12
0 20 40 60 80 100 120 140 160 180 200
Time (s)
Out
put T
orqu
e (lb
*in)
54.02 Degrees0 Degrees
Figure 94 - Torque Results For Subject 3 (10 in*lbs)
RPM vs. Time - Subject 3
0
5
10
15
20
25
30
35
40
45
0 20 40 60 80 100 120 140 160 180 200
Time (s)
RPM
(rev
/min
)
0 Degrees54.02 Degrees
Figure 95 - RPM Results For Subject 3 (10 in*lbs)

125
Output Horsepower vs. Time - Subject 3
0
0.001
0.002
0.003
0.004
0.005
0.006
0 20 40 60 80 100 120 140 160 180 200Time (s)
Out
put H
orse
pow
er (H
P)
0 Degrees54.02 Degrees
Figure 96 - Horsepower Results For Subject 3 (10 in*lbs)
Output Torque vs. Time - Subject 4
9.96
9.97
9.98
9.99
10
10.01
10.02
10.03
0 20 40 60 80 100 120 140 160 180 200Time (s)
Out
put T
orqu
e (lb
*in)
0 Degrees51.41 Degrees
Figure 97 - Torque Results For Subject 4 (10 in*lbs)

126
RPM vs. Time - Subject 4
0
5
10
15
20
25
30
35
40
0 20 40 60 80 100 120 140 160 180 200
Time (s)
RPM
(rev
/min
)
0 Degrees51.41 Degrees
Figure 98 - RPM Results For Subject 4 (10 in*lbs)
Output Horsepower vs. Time - Subject 4
0
0.001
0.002
0.003
0.004
0.005
0.006
0 20 40 60 80 100 120 140 160 180 200
Time (s)
Out
put H
orse
pow
er (H
P)
0 Degrees51.41 Degrees
Figure 99 - Horsepower Results For Subject 4 (10 in*lbs)

127
Output Torque vs. Time - Subject 5
0
2
4
6
8
10
12
0 20 40 60 80 100 120 140 160 180 200
Time (s)
Out
put T
orqu
e (lb
*in)
0 Degrees57.06 Degrees
Figure 100 - Torque Results For Subject 5 (10 in*lbs)
RPM vs. Time - Subject 5
0
5
10
15
20
25
30
35
0 20 40 60 80 100 120 140 160 180 200
Time (s)
RPM
(rev
/min
)
0 Degrees57.06 Degrees
Figure 101 - RPM Results For Subject 5 (10 in*lbs)

128
Horsepower vs. Time - Subject 5
0
0.0005
0.001
0.0015
0.002
0.0025
0.003
0.0035
0.004
0.0045
0.005
0 20 40 60 80 100 120 140 160 180 200
Time (s)
Hor
sepo
wer
(HP)
0 Degrees57.06 Degrees
Figure 102 - Horsepower Results For Subject 5 (10 in*lbs)
Output Torque vs. Time - Subject 6
0
2
4
6
8
10
12
14
0 20 40 60 80 100 120 140 160 180 200
Time (s)
Out
put T
orqu
e (lb
*in)
0 Degrees60.59 Degrees
Figure 103 - Torque Results For Subject 6 (10 in*lbs)

129
RPM vs. Time -Subject 6
-5
0
5
10
15
20
25
30
35
40
0 20 40 60 80 100 120 140 160 180 200
Time (s)
RPM
(rev
/min
)
0 Degrees60.59 Degrees
Figure 104 - RPM Results For Subject 6 (10 in*lbs)
Horsepower vs. Time - Subject 6
0
0.001
0.002
0.003
0.004
0.005
0.006
0 20 40 60 80 100 120 140 160 180 200Time (s)
Hor
sepo
wer
(HP)
0 Degrees60.59 Degrees
Figure 105 - Horsepower Results For Subject 6 (10 in*lbs)

130
Output Torque vs. Time - Subject 7
0
2
4
6
8
10
12
0 20 40 60 80 100 120 140 160 180 200
Time (s)
Out
put T
orqu
e (lb
*in)
0 Degrees59.75 Degrees
Figure 106 - Torque Results For Subject 7 (10 in*lbs)
RPM vs. Time - Subject 7
0
5
10
15
20
25
30
35
40
45
0 20 40 60 80 100 120 140 160 180 200Time (s)
RPM
(rev
/min
)
0 Degrees59.75 Degrees
Figure 107 - RPM Results For Subject 7 (10 in*lbs)

131
Horsepower vs Time - Subject 7
0
0.001
0.002
0.003
0.004
0.005
0.006
0.007
0 20 40 60 80 100 120 140 160 180 200Time (s)
Hor
sepo
wer
(HP)
0 Degrees59.75 Degrees
Figure 108 - Horsepower Results For Subject 7 (10 in*lbs)
Output Toque vs. Time - Subject 8
9.92
9.94
9.96
9.98
10
10.02
10.04
10.06
0 20 40 60 80 100 120 140 160 180 200
Time (s)
Out
put T
orqu
e (lb
*in)
0 Degrees58.11 Degrees
Figure 109 - Torque Results For Subject 8 (10 in*lbs)

132
RPM vs. Time - Subject 8
0
5
10
15
20
25
30
35
40
45
50
0 20 40 60 80 100 120 140 160 180 200
Time (s)
RPM
(rev
/min
)
0 Degrees58.11 Degrees
Figure 110 - RPM Results For Subject 8 (10 in*lbs)
Horsepower vs. Time - Subject 8
0
0.001
0.002
0.003
0.004
0.005
0.006
0.007
0.008
0 20 40 60 80 100 120 140 160 180 200Time (s)
Hor
sepo
wer
(HP)
0 Degrees58.11 Degrees
Figure 111 - Horsepower Results For Subject 8 (10 in*lbs)

133
Output Torque vs. Time - Subject 9
9.8
10
10.2
10.4
10.6
10.8
11
11.2
11.4
11.6
11.8
0 20 40 60 80 100 120 140 160 180 200
Time (s)
Out
put T
orqu
e (lb
*in)
0 Degrees60.59 Degrees
Figure 112 - Torque Results For Subject 9 (10 in*lbs)
RPM vs. Time - Subject 9
0
5
10
15
20
25
30
35
0 20 40 60 80 100 120 140 160 180 200
Time (s)
RPM
(rev
/min
)
0 Degrees60.59 Degrees
Figure 113 - RPM Results For Subject 9 (10 in*lbs)

134
Horsepower vs. Time - Subject 9
0
0.001
0.002
0.003
0.004
0.005
0.006
0 20 40 60 80 100 120 140 160 180 200Time (s)
Hor
sepo
wer
(HP)
0 Degrees60.59 Degrees
Figure 114 - Horsepower Results For Subject 9 (10 in*lbs)
Output Torque vs. Time - Subject 10
0
2
4
6
8
10
12
14
0 20 40 60 80 100 120 140 160 180 200
Time (s)
Out
put T
orqu
e (lb
*in)
0 Degrees64.27 Degrees
Figure 115 - Torque Results For Subject 10 (10 in*lbs)

135
RPM vs. Time - Subject 10
0
5
10
15
20
25
30
35
0 20 40 60 80 100 120 140 160 180 200
Time (s)
RPM
(rev
/min
)
0 Degrees64.27 Degrees
Figure 116 - RPM Results For Subject 10 (10 in*lbs)
Horsepower vs. Time - Subject 10
0
0.001
0.002
0.003
0.004
0.005
0.006
0 20 40 60 80 100 120 140 160 180 200
Time (s)
Hor
sepo
wer
(HP)
0 Degrees64.27 Degrees
Figure 117 - Horsepower Results For Subject 10 (10 in*lbs)

136
Output Torque vs. Time - Subject 1 (Wheels)
0
2
4
6
8
10
12
14
0 20 40 60 80 100 120 140 160 180 200
Time (s)
Out
put T
orqu
e (in
*lbs)
0 DegreesWheels
Figure 118 - Torque Results - Subject 1 - Wheels (10 in*lbs)
RPM vs. Time - Subject 2 (Wheels)
y = -0.0105x + 23.487
y = -0.0008x + 18.093
0
5
10
15
20
25
30
35
40
0 20 40 60 80 100 120 140 160 180 200
Time (s)
RPM
(rev
/min
)
0 DegreesWheelsLinear (Wheels)Linear (0 Degrees)
Figure 119 - RPM Results - Subject 1 - Wheels (10 in*lbs)

137
Horsepower vs. Time - Subject 1 (Wheels)
y = -2E-06x + 0.0036
y = 5E-08x + 0.0028
0
0.001
0.002
0.003
0.004
0.005
0.006
0 20 40 60 80 100 120 140 160 180 200
Time (s)
Hor
sepo
wer
(HP)
0 DegreesWheelsLinear (Wheels)Linear (0 Degrees)
Figure 120 - Horsepower Results - Subject 1 - Wheels (10 in*lbs)
Output Torque vs. Time - Subject 2 (Wheels)
0
2
4
6
8
10
12
14
0 20 40 60 80 100 120 140 160 180 200
Time (s)
Out
put T
orqu
e (in
*lbs)
0 DegreesWheels
Figure 121 - Torque Results - Subject 2 - Wheels (10 in*lbs)

138
RPM vs. Time - Subject 2 (Wheels)
y = 0.0096x + 31.013
y = 0.0133x + 19.184
0
5
10
15
20
25
30
35
40
45
50
0 20 40 60 80 100 120 140 160 180 200
Time (s)
RPM
(rev
/min
)
0 DegreesWheelsLinear (Wheels)Linear (0 Degrees)
Figure 122 - RPM Results - Subject 2 - Wheels (10 in*lbs)
Horsepower vs. Time - Subject 2 (Wheels)
y = 2E-06x + 0.0049
y = 2E-06x + 0.003
0
0.001
0.002
0.003
0.004
0.005
0.006
0.007
0.008
0 20 40 60 80 100 120 140 160 180 200
Time (s)
Hor
sepo
wer
(HP)
0 DegreesWheelsLinear (Wheels)Linear (0 Degrees)
Figure 123 - Horsepower Results - Subject 2 - Wheels (10 in*lbs)

139
Output Torque vs. Time - Subject 3 (Wheels)
0
2
4
6
8
10
12
0 20 40 60 80 100 120 140 160 180 200
Time (s)
Out
put T
orqu
e (in
*lbs)
0 DegreesWheels
Figure 124 - Torque Results - Subject 3 - Wheels (10 in*lbs)
RPM vs. Time - Subject 3 (Wheels)
y = -0.0091x + 31.192
y = 0.0227x + 21.765
0
5
10
15
20
25
30
35
40
45
0 20 40 60 80 100 120 140 160 180 200
Time (s)
RPM
(rev
/min
)
0 DegreesWheelsLinear (Wheels)Linear (0 Degrees)
Figure 125 - RPM Results - Subject 3 - Wheels (10 in*lbs)

140
Horsepower vs. Time - Subject 3 (Wheels)
y = -1E-06x + 0.0049
y = 4E-06x + 0.0034
0
0.001
0.002
0.003
0.004
0.005
0.006
0.007
0 20 40 60 80 100 120 140 160 180 200
Time (s)
Hor
sepo
wer
(HP)
0 DegreesWheelsLinear (Wheels)Linear (0 Degrees)
Figure 126 - Horsepower Results - Subject 3 - Wheels (10 in*lbs)
Output Torque vs. Time - Subject 4 (Wheels)
9.9
9.92
9.94
9.96
9.98
10
10.02
10.04
10.06
10.08
10.1
0 20 40 60 80 100 120 140 160 180 200Time (s)
Out
put T
orqu
e (in
*lbs)
0 DegreesWheels
Figure 127 - Torque Results - Subject 4 - Wheels (10 in*lbs)

141
RPM vs. Time -Subject 4 (Wheels)
y = -0.0259x + 34.125
y = 0.0077x + 26.488
0
5
10
15
20
25
30
35
40
45
50
0 20 40 60 80 100 120 140 160 180 200
Time (s)
RPM
(rev
/min
)
0 DegreesWheelsLinear (Wheels)Linear (0 Degrees)
Figure 128 - RPM Results - Subject 4 - Wheels (10 in*lbs)
Horsepower vs. Time - Subject 4 (Wheels)
y = -4E-06x + 0.0054
y = 1E-06x + 0.0042
0
0.001
0.002
0.003
0.004
0.005
0.006
0.007
0.008
0 20 40 60 80 100 120 140 160 180 200
Time (s)
Hor
sepo
wer
(HP)
0 DegreesWheelsLinear (Wheels)Linear (0 Degrees)
Figure 129 - Horsepower Results - Subject 4 - Wheels (10 in*lbs)

142
Output Torque vs. Time - Subject 6 (Wheels)
0
2
4
6
8
10
12
14
0 20 40 60 80 100 120 140 160 180 200
Time (s)
Out
put T
orqu
e (in
*lbs)
0 DegreesWheels
Figure 130 - Torque Results - Subject 6 - Wheels (10 in*lbs)
RPM vs Time - Subject 6 (Wheels)
y = -0.0356x + 30.952
y = 0.0014x + 19.8
0
5
10
15
20
25
30
35
40
45
0 20 40 60 80 100 120 140 160 180 200
Time (s)
RPM
(rev
/min
)
0 DegreesWheelsLinear (Wheels)Linear (0 Degrees)
Figure 131 - RPM Results - Subject 6 - Wheels (10 in*lbs)

143
Horsepower vs. Time - Subject 6 (Wheels)
y = -6E-06x + 0.0049
y = 2E-07x + 0.0036
0
0.001
0.002
0.003
0.004
0.005
0.006
0.007
0.008
0 20 40 60 80 100 120 140 160 180 200Time (s)
Hor
sepo
wer
(HP)
0 DegreesWheelsLinear (Wheels)Linear (0 Degrees)
Figure 132 - Horsepower Results - Subject 6 - Wheels (10 in*lbs)
Output Torque vs. Time - Subject 7
0
2
4
6
8
10
12
0 20 40 60 80 100 120 140 160 180 200Time (s)
Torq
ue (l
b*in
)
0 DegreesWheels
Figure 133 - Torque Results - Subject 7 - Wheels (10 in*lbs)

144
RPM vs. Time - Subject 7
y = 0.0024x + 49.777
y = -0.0022x + 26.946
0
10
20
30
40
50
60
70
0 20 40 60 80 100 120 140 160 180 200
Time (s)
RPM
(rev
/min
)
0 DegreesWheelsLinear (Wheels)Linear (0 Degrees)
Figure 134 - RPM Results - Subject 7 - Wheels (10 in*lbs)
Horsepower vs. Time - Subject 7
y = 3E-07x + 0.0079
y = -3E-07x + 0.0043
0
0.002
0.004
0.006
0.008
0.01
0.012
0 20 40 60 80 100 120 140 160 180 200
Time (s)
Hor
sepo
wer
(HP)
0 DegreesWheelsLinear (Wheels)Linear (0 Degrees)
Figure 135 - Horsepower Results - Subject 7 - Wheels (10 in*lbs)

145
Output Torque vs. Time - Subject 8 (Wheels)
9.85
9.9
9.95
10
10.05
10.1
0 20 40 60 80 100 120 140 160 180 200Time (s)
Out
put T
orqu
e (in
*lbs)
0 DegreesWheels
Figure 136 - Torque Results - Subject 8 - Wheels (10 in*lbs)
RPM vs. Time - Subject 8 (Wheel)
y = -0.0443x + 46.132
y = 0.0333x + 23.428
0
10
20
30
40
50
60
0 20 40 60 80 100 120 140 160 180 200
Time (s)
RPM
(rev
/min
)
0 DegreesWheelsLinear (Wheels)Linear (0 Degrees)
Figure 137 - RPM Results - Subject 8 - Wheels (10 in*lbs)

146
Horsepower vs. Time - Subject 8 (Wheels)
y = -7E-06x + 0.0073
y = 5E-06x + 0.0037
0
0.001
0.002
0.003
0.004
0.005
0.006
0.007
0.008
0.009
0.01
0 20 40 60 80 100 120 140 160 180 200Time (s)
Hor
sepo
wer
(HP)
0 DegreesWheelsLinear (Wheels)Linear (0 Degrees)
Figure 138 - Horsepower Results - Subject 8 - Wheels (10 in*lbs)
Output Torque vs. Time - Subject 9 (Wheels)
9.8
10
10.2
10.4
10.6
10.8
11
11.2
11.4
11.6
11.8
0 20 40 60 80 100 120 140 160 180 200Time (s)
Out
put T
orqu
e (in
*lbs)
0 DegreesWheels
Figure 139 - Torque Results - Subject 9 - Wheels (10 in*lbs)

147
RPM vs. Time - Subject 9 (Wheels)
y = 0.0241x + 42.206
y = -0.0036x + 19.692
0
10
20
30
40
50
60
70
0 20 40 60 80 100 120 140 160 180 200
Time (s)
RPM
(rev
/min
)
0 DegreesWheelsLinear (Wheels)Linear (0 Degrees)
Figure 140 - RPM Results - Subject 9 - Wheels (10 in*lbs)
Horsepower vs. Time - Subject 9 (Wheels)
y = 4E-06x + 0.0067
y = -6E-07x + 0.0031
0
0.001
0.002
0.003
0.004
0.005
0.006
0.007
0.008
0.009
0.01
0 20 40 60 80 100 120 140 160 180 200
Time (s)
Hor
sepo
wer
(HP)
0 DegreesWheelsLinear (Wheels)Linear (0 Degrees)
Figure 141 - Horsepower Results - Subject 9 - Wheels (10 in*lbs)

148
Output Torque vs. Time - Subject 10 (Wheels)
0
2
4
6
8
10
12
14
0 20 40 60 80 100 120 140 160 180 200
Time (s)
RPM
(rev
/min
)
0 DegreesWheels
Figure 142 - Torque Results - Subject 10 - Wheels (10 in*lbs)
RPM vs Time - Subject 10 (Wheel)
y = -0.025x + 50.961
y = 0.0081x + 19.67
0
10
20
30
40
50
60
70
80
0 20 40 60 80 100 120 140 160 180 200
Time (s)
RPM
(rev
/min
)
0 DegreesWheelsLinear (Wheels)Linear (0 Degrees)
Figure 143 - RPM Results - Subject 10 - Wheels (10 in*lbs)

149
Horsepower vs. Time - Subject 10 (Wheels)
y = -4E-06x + 0.0081
y = 1E-06x + 0.0031
0
0.002
0.004
0.006
0.008
0.01
0.012
0 20 40 60 80 100 120 140 160 180 200
Time (s)
Hor
sepo
wer
(HP)
0 DegreesWheelsLinear (Wheels)Linear (0 Degrees)
Figure 144 - Horsepower Results - Subject 10 (10 in*lbs)

150
Figure 145 - Labeled Parts For Dynamometer Setup
Rear Axle Sprockets
Dynamometer Sprockets
Rear Axle