Embed Size (px)
Citation preview

DETECTION AND CLASSIFICATION OF
ELECTRICAL POWER SIGNAL DISTURBANCE
USING SOFT COMPUTATION TECHNIQUE
Dissertation submitted
in partial fulfillment of requirements
for MASTER OF TECHNOLOGY
in
POWER SYSTEM of
MAULANA ABUL KALAM AZAD UNIVERSITY of TECHNOLOGY
by
SUBHRODIPTO BASU CHOUDHURY
Roll No.-10913414019
Reg. No. - 141090410027
Under the guidance of
Prof. SANKHADIP SAHA
DEPARTMENT OF ELECTRICAL ENGINEERING
NETAJI SUBHASH ENGINEERING COLLEGE
TECHNO CITY, GARIA, PANCH POTA
KOLKATA-700152
May, 2016

Dedicated
to
almighty
Guide
Parents
grandparents

CERTIFICATE
This is to certify that this dissertation titled “DETECTION AND CLASSIFICATION OF ELECTRICAL POWER
SIGNAL DISTURBANCE USING SOFT OMPUTATION TECHNIQUE” submitted in partial fulfillment of
requirements for award of the degree Master of Technology (M. Tech) in POWER SYSTEM of Maulana Abul
Kalam Azad University of Technology is a faithful record of the original work carried out by,
SUBHRODIPTO BASU CHOUDHURY, Roll no 10913414019 Regd. No. 141090410027, Year-2014
under my guidance and supervision.
It is further certified that it contains no material, which to a substantial extent has been submitted for the award
of any degree in any institute or has been published in any form, except the assistances drawn from other
sources, for which due acknowledgement has been made.
___________
Date:……………… Guide’s Signature
Prof. Sankhadip Saha
Sd/__________________
Head of the Department
ELECTRICAL ENGINEERING
NETAJI SUBHASH ENGINEERING COLLEGE
TECHNO CITY, GARIA, KOLKATA – 700 152

DECLARATION
I hereby declare that this dissertation titled
DETECTION AND CLASSIFICATION OF ELECTRICAL POWER SIGNAL
DISTURBANCE USING SOFT COMPUTATION TECHNIQUE
is my own original work carried out as a post graduate student in NETAJI SUBHASH ENGINEERING
COLLEGE (109) except to the extent that assistances from other sources are
duly acknowledged.
All sources used for this dissertation have been fully and properly cited. It contains no material which to a
substantial extent has been submitted for the award of any degree in any institute or has been published in any
form, except where due acknowledgement is made.
Date:………………… ……………………………………….
Student’s signature
SUBHRODIPTO BASU CHOUDHURY
Roll No. – 10913414019

CERTIFICATE OF APPROVAL
We hereby approve this dissertation titled “DETECTION AND CLASSIFICATION OF
ELECTRICAL POWER SIGNAL DISTURBANCE USING SOFT COMPUTATION
TECHNIQUE” carried out by SUBHRODIPTO BASU CHOUDHURY, Roll no. 10913414019 Regd.
No.-141090410027 & Year- 2014 under the guidance of Prof. Sankhadip Saha of Netaji Subhash
Engineering College (109), in partial fulfillment of requirements for award of the degree
Master of Technology (M. Tech) in POWER SYSTEM of Maulana Abul Kalam Azad University
of Technology (M.A.K.A.U.T).
Date:……………………………
Examiners’ signatures:
1. ………………………………………….
2. ………………………………………….
3. ………………………………………….

CONTENTS
CHAPTER NAME Page No.
ACKNOWLEDGEMENT i
ABSTRACT ii
ORGANISATION OF THESIS iii
1. INTRODUCTION
1.1 Overview 1-2
1.2 Literature review 3-8
1.3 Aim of thesis 9
2. GENERAL DISTURBANCE SIGNAL IN ELECTRICAL POWER SYSTEM
2.1 SAG 12-15
2.2 SWELL 16-17
2.3 HARMONIC 18-19
2.4 FLICKER 20-21
2.5 NOTCH 22-23
2.6 OSCILLATORY TRANSIENT 24-25
2.7 SPIKE 26-27
2.8 INTERRUPTION 28-29
2.9 TEMPORARY OUTAGE 30-31

3. NECESSITY AND REQUIREMENT OF FAULT CLASSIFICATION 33
4. FEATURE EXTRACTION FROM DISTURBANCE SIGNAL 34-37
4.1 CORRELATION
4.1.1 AUTO-CORRELATION
4.1.2 CROSS-CORRELATION
5. FEATURE SELECTION AND CLASSIFICATION TECHNIQUE 38-43
5.1 ARTIFICIAL NEURAL NETWORK (ANN)
5.2 PROBABILISTIC NEURAL NETWORK (PNN)
5.3 RADIAL BASIS FUNCTION (RBF)
6. BLOCK DIAGRAM FOR CLASSIFICATION OF ELECTRICAL DISTURBANCE 44
7. RESULT 45
8. CONCLUSION 46
9. FUTURE ADVANCEMENT 47
10. REFERENCE 48-49
APPENDIX 1 50-51
APPENDIX 2 52

ACKNOWLEDGEMENT
I am grateful to the Almighty for providing me a caring and helpful guide Prof. Sankhadip Saha (Dept. of
ELECTRICAL ENGINEERING) in carrying out my project activities. He constantly extended his helping
hand during problems and took updated news regarding project. He also paved me a way to my future research
work on SOFT COMPUTATION as it is subject of my taste. He also introduced me to this vast field and
informed me on present research on SOFT COMPUTATION.
I equally pay my gratitude to Prof. Subrata Biswas (Incharge, MTECH, POWER SYSTEM) for
provision of constant updated information regarding POWER SYSTEM department. I am also grateful to Head
of Electrical Engineering department Prof. Tridibesh Nag and Dean Prof. Dr. S. K. Bhattacharya.
Finally, I am thankful to my parents and late grandparents for their well wish and constant motivation during
any tension for project progress.
Dated:………………………...
SUBHRODIPTO BASU CHOUDHURY
Roll No.: 10913414019
i
Abstract
Electrical power disturbances are undesirable interruption of electrical power signal. They are mainly caused by
switching of loads. According to IEEE there are several types of disturbance that occur in real time situation: Sag, Swell,
Interruption, Transient, Harmonic, Notch, Spike, Flicker, and Temporary Outage.
Nowadays, electrical consumers are very aware of paying for only the electrical energy they are consuming. Since, cost
of generation of electrical power is economical area of concern to electrical utility companies; hence wastage of
electrical energy is avoided. This can be achieved by identification n powers of electrical disturbances occurring in
electrical power signal and swiftly mitigate the disturbance.
The proposed method constantly extract the features from disturbance signal and detect the type of disturbance
occurring. These disturbances actually cumulatively impair the insulation and aggravate electrical energy wastage, which
is undesirable. The method uses cross-correlogram of power signal and electrical disturbance signal to extract features.
These features are distinct or different for different class or type of electrical disturbance. If any of the features does not
match with features of that class of electrical disturbance, the classifier machine cannot identify the electrical
disturbance. The cross-correlogram is utilized to extract certain distinct features.
These features are used to train classifier machine and it is tested using data of some other set of disturbance and
accuracy is computed.
Classifier is delicate and soft computation part evolved in the middle of 21st century. They are primarily used for
classification purposes. Several researchers put forward new algorithms to design new classification technique to
improve classification accuracy. Earlier only ARTIFICIAL NEURAL NETWORK was used for classification purpose. But,
present era witnesses several new classification techniques like kNN, SUPPORT VECTOR MACHINE, CORE VECTOR
MACHINE, ENSEMBLE METHODS, DEMPSTER-SHAFER METHOD OF CLASSIFICATION, BOOTSTUP METHODS, etc.
A new advanced technology can be used to classify the electrical disturbances. GAME THEORY technology can
also be used.
Keywords: disturbance, classification, computation, features
ii

ORGANISATION OF THESIS
Chapter 1 deals with overview and vitality for electrical signal disturbance classification. It also describes the earlier
classification method used by earlier eminent personalities with their classification accuracy. They are presented
chronologically year wise. It also describes about the method used here to classify the disturbance signal in brief.
Chapter 2 describes twenty different types of electrical faults occur in real life situation. It also guides about the reason
for occurance of specific faults. Their appearance in real life field is presented pictorially using modern simulation
software. They are presented using IEEE standard 1159-1995.
Chapter 3 guides the significance of disturbance classification as mitigation methods are distinct pertaining to type of
occurring electrical disturbance.
Chapter 4 elaborates signal processing technique. Here CROSS-CORRELATION technique is used. It enlightens about
correlation method and type of CORRELATION used. Mostly, as two signals are different i.e. one is normal electrical
power signal and other one is disturbed signal, therefore, CROSS-CORRELATION technique is used. Cross-correlogram is
also attached for SAG disturbance and normal power signal.
Chapter 5 describes the significance of feature selection technique. The presented method compares two classification
technique using ARTIFICIAL NEURAL NETWORK (ANN), PROBABILISTIC NEURAL NETWORK (PNN) and RADIAL BASIS
FUNCTION NEURAL NETWORK (RBFNN). Twelve features are extracted from CROSS-CORRELOGRAM of disturbed signal
with normal electrical power signal. These features are extracted using certain feature extraction code in simulation
program. A feature matrix is formed which is used to train classifier and validate it by using some other number of
samples.
Chapter 6 shows a pictorial representation of classification technique in block diagram. Each block represents a method
or activity that a classification technique passes by.
Chapter 7 describes about classification accuracy of different single and multiple electrical disturbance signals. It is
noted that classification accuracy degrades on addition of noise of higher magnitude.
Chapter 8 concludes and specifies the reason for degradation of disturbance classification accuracy on addition of noise
level (db). It also specifies the reason for different classification accuracy in case of different classification techniques.
Chapter9 gives idea about other signal processing techniques to extract features. They can be merged with features
extracted from cross-correlogram and use several other feature selection algorithms to classify them.
Chapter 10 lists about the research work paper or journal from where inspirations have been drawn to urge for the
presented real life electrical disturbance classification method.
iii

1. INTRODUCTION
1.1 Overview
Power equipments demand better power quality for smooth and reliable operation. Due to excessive use of non-linear
electronic loads such as adjustable speed drive, energy efficient lamp, PLC operated devices, etc. Equipments that are
used to generate renewable energy also indulge contamination to the electrical power signal. These electrical
disturbances cause unreliable operation of electrical equipment and require frequent maintenance of electrical
equipment which highlights economical background. Reliable operation of electrical devices is desirable and essential to
consumers as they pay for the usage of electrical energy.
It is essential to sense electrical disturbance (ED) (if any) present in the signal. Different methods are suggested like,
wavelet transform based in [1] and [7], S-transform analysis in [2], wavelet based neural network in [3], etc. in recent
years to detect and classify electrical disturbances in signal. Due to presence of noise in signal classification accuracy of
wavelet network degrades. Noise attachment in the electrical signal is an inherent property which arises due to
switching operation and discrepant connection between terminals of electrical equipment. Switching is employed to
convert high voltage alternating electrical quantities to high voltage direct electrical quantities in substations to reduce
transmission losses. During continuous conduction if switching operation is done, a discontinuation in flow of electrical
quantities is observed for infinitesimal small time interval. Hence, noise is observed as if during switching, the
conversion from alternating quantities to direct electrical quantities is not possible at the instant of switching operation.
But emphasis is not given on recognition of multiple electrical disturbances (MED) occurring simultaneously. Most of the
analysis in references uses high speed computer to handle the huge computational burden within small time. Moderate
trend is to build a detecting device using microcontroller as the features of the microcontroller can be easily changed by
modifying its firmware instead of changing its hardware.
The field of SOFT COMPUTATION utilizes several methodologies to detect certain set of patterns or events and hence
classify them. This field nowadays witnesses advanced research in the event of classification. Several renowned curious
persons indulge themselves in finding new advanced technology by gaining experiences from previous knowledge of
classification techniques.
This paper is an outcome of a comparative study between three classifier machines namely ARTIFICIAL NEURAL
NETWORK (ANN), PROBABILISTIC NEURAL NETWORK (PNN )and RADIAL BASIS FUNCTION NEURAL NETWORK (RBFNN)
classifier. The technique used in method has two parts. Primary part involves feature extraction from ELECTRICAL
DISTURBANCE SIGNAL using different signal processing techniques and secondary part employs classification of
disturbance signal based on extracted features.
1

Apart from other two classifier machine ARTIFICAL NEURAL NETWORK (ANN) is s better robust and gives better result.
Suitable features are extracted from cross-correlation sequence of two signals, viz. one is normal sinusoidal power
frequency electrical signal and the other is ELECTRICAL DISTURBANCE signal. Correlation gives the extension of similarity
between two signals.
This paper presents a comparative study between different electrical disturbance classification techniques. The
method successfully classifies disturbances like, sag, swell, spike, harmonic, notch, flicker and other single electrical
disturbance.
2

1.2 Literature review
A.M. Youssef et. Al. in [1] in 2004 utilises time warping classifier for detection of electrical distortion of power signal.
Vector quantization and fast match is used to accelerate classification process. Walsh transform and fast Fourier
transform are used to extract features. This method computes better result of classification than traditionally artificial
neural networks and fuzzy logic controllers. The method has lower sensitivity to noise levels.
P. Dash et. Al. in [2] in 2004 proposed a method of localization and classification of short duration disturbances in power
networks using phase-corrected wavelet transform known as S-transform and extended Kalman filter. It has time-
frequency resolution characteristics and provides detection, localization and visual patterns perceptible for automatic
recognition of automatic classification of electrical faults. The method is applied to practical disturbance and reveals
significant classification accuracy.
T. K. Abdel Galil et. Al. in [3] in 2004 presents a novel approach of classification of electrical disturbance signal based on
inductive learning using decision trees. Wavelet transform uses representative features that usually capture unique and
distinct features for each class of disturbance signal. Decision tree is formed using feature vectors from wavelet analysis
by inductive learning process. Decision tree has some predefined rules which are used to classify faults which are
interpreted form the extracted features. Classification accuracy is incomparable with artificial neural networks based
classification.
Haibo He et. Al. in [4] 2006 classifies the PQ disturbance based on WAVELET TRANSFORMATION and SELF-ORGANISING
LEARNING ARRAY (SOLAR) system. Features from electrical PQ disturbance signal are extracted utilizing the WAVELET
TRANSFORMATION method based on MULTIRESOLUTION ANALYSIS (MRA). Feature vector of PQ disturbance signal is
constructed from energy of the DETAIL and APPROXIMATION levels after multi-resolution analysis of sampled PQ
disturbance signal for future testing and training. Neuron parameters and connections of SOLAR are specified pertaining
to the minimum entropy adaptively set for each neuron. The accuracy for PQ disturbance classification is 94.3%.
Ömer Nezik Gerek et. Al. in [5] in 2006 presents higher order cumulants as feature parameter and quadratic classifiers
for classification purpose. A feature vector of six local maxima and minima of higher order cumulants starting from
second variance to fourth cumulant is constructed. Local vector magnitudes and simple threshold provides an
immediate detection criterion. Local maxima and minima around the vicinity of electrical disturbance of a particular type
are used for classification purpose. 2-D classifiers have classification success of 98% whereas 6-D classifiers have
classification success of 100%.
Inigo Monedero, Carlos Leon et.al.in [6] in 2006 is capable of classifying disturbances of electrical signal by usage of
ARTIFICIAL NEURAL NETWORK. Fourier and wavelet methods can be used to generate good signal features but they are
complex in comparison to feature extraction using ANN method. Fault signal is decomposed in APPROXIMATION
WAVELET COEFFICIENTS and other set of DETAIL WAVELET COEFFICEINTS. The obtained APPROXIMATION
COEFFICIENTS are further decomposed in several levels of successive APPROXIMATION and DETAIL WAVELET
COEFFICEINTS to increase the level of resolution. After feature extraction, classification process is executed using
method of pattern recognition by ANN. It is achieved by forming adequate number of training patterns to train ANNs
correctly so that they can classify future inputs (FEATURES FROM FUTURE OCCURING FAULT).
3

A problem with ANN applied to PQ is obtaining indispensible useful real training patterns directly from power grid due
to irregular apparition of these disturbances and problem in capturing them. The scheme satisfactorily classifies the
POWER QUALITY DISTURANCES in electrical signal with partial accuracy of 89%.
Ömer Nezih Gerek et. Al. in [7] in 2006 uses covariance method of classifying voltage disturbance. A feature vector is
constructed using selected features like, local wavelet transform at various decomposition levels, spectral harmonic
ratios local extrema of higher order statistical parameters. The proposed scheme distinguishes the loading conditions
within same class of electrical disturbance with accuracy of 70%.
Fengzhan Zhao et. Al. in [8] in 2007 detects disturbance in electrical power signals and classify them using the S-
transformation technique. Features like No. of main frequency, No. of peak in STANDARD DEVIATION (STD)curve, No.
of peaks in high frequency of (STD) curve, mean of POWER DISTURBANCE signal and a composite feature after S-
transformation of POWER DISTURBANCE signal. Composite features composed of 3 intermediate features like degree
of SAG, INTERRUPTIONS or SWELL in electrical signal. Classification is done based of some rule generated which is
required to classify the POWER SIGNAL DISTURBANCES. This scheme classifies 98.5% of SNR=30dBofPOWER SIGNAL
DISTURBANCE of electrical signal accurately.
S. Suja et. Al. in [9] in 2007 are capable of classifying POWER SIGNALDISTURBANCE based on features extracted using
DISCRETE WAVELET TRANSFORMATION (DWT). DWT technique is applied to extract time of disturbance occurance and
frequency features from POWER DISTURBANCE signal. These DWT coefficients are applied as inputs to neural networks
along with MRA technique and statistical manipulations to extract features from disturbance signal at different
resolution levels. The SQUARED APPROXIMATE COEFFICIENTS after DWT at primitive level are calculated. After that,
APPROXIMATE COEFFICIENTS and DETAIL COEFFICIENTS are further subjected to CUMULATIVE DISTRIBUTION
FUNCTION (CDF) and PROBABILITY DENSITY FUNCTION (PDF) at subsequent 2 levels for clear distinction between
different POWER SIGNAL DISTURBANCES. Their attempt has classification accuracy of 86% in pertaining to Power Signal
disturbance.
Mamun Bin Ibne Reaz et. Al in [10] in 2007 shows a different type univariate randomly optimized neural network in
conjunction of discrete wavelet transform and fuzzy logic to achieve better electrical disturbance classification accuracy.
The system is composed of VHSIC Hardware Description Language (VHDL) a hardware description language, succeeded
by extensive testing and simulation to justify functionality of system that allows hardware implementation.
4

The method reaches 98.19% classification accuracy for application of system on software-generated disturbance signal.
Ameen M. Gargoomet.al.in [11] in 2008 automatically classifies electrical disturbances using multi-resolution S-
transform and Parseval’s theorem. S-transform is utilized to produce instantaneous frequency vectors. Energy of these
vectors are used to classify disturbance signal using Parseval’s theorem. The significance of method is magnitude,
duration and frequency content can be effectively identified to characterize the electrical disturbance. The method was
tested using two typical case studies and produced favourable and desired classification accuracy of disturbance.
Suryannarayana Chandaka et. Al. in [12] in 2009 introduces a pattern recognition technique called CROSS-CORRELATION
aided SVM based classifier. The scheme is utilized for binary classification of EEG signals. The features like PEAK VALUE,
INSTANT OF PEAK OCCURANCE, CENTROID, EQUIVALENT WIDTH and MEAN SQUARE ABSCISSA are extracted from
CROSS-CORRELATED sequence between two different EEG signals. The classification of EEG signals is done using
SUPPORT VECTOR MACHINE (SVM) for solving a binary classification problem in a supervised manner and learning
problem is formulated as a quadratic optimization problem where the error surface is free of any local minimum and has
global optimum. SVM creates OPTIMAL SEPERATING HYPERPLANES (OSH) between different distinct CLASSES on basis
of STRUCTURAL RISK MINIMIZATION (SRM) principle. The method achieved ECG signal classification accuracy of
95.96%.
Chiung-Chou Liao et. Al. in [13] in 2009 introduces classification of noise influenced disturbance with integrated feature
extraction and neuro-fuzzy network. Wavelet transformation coefficients ahs numerous features needed for transient
signal identification of electrical signal variation. This scheme reduces features of noise, noise-suppression and energy
spectrum in wavelet transform coefficients in different scales are computed using Parseval’s theorem. Neuro-fuzzy
network is applied to frame fuzzy-rule and classify disturbance signal.
P. Rajamani et. Al. in [14] in 2011 shows the capability of identifying fault characteristics of dynamic insulation failure
during impulse test. Features viz. FAULT TYPE, CONDITION OF FAULT and LOCATION OF OCCURANCE OF FAILURE
ALONG LENGTH OF WINDING OF THE TRANSFORMER are extracted from cross-correlated sequence of fault signal and
electrical signal of fundamental frequency (50Hz). A stochastic gradient based MULTI-DIMENSIONAL WAVELET
NETWORK (MDWN) is developed and employed for identification of fault characteristics of dynamic insulation failure.
Features like MAXIMUM VALUE OF CROSS-CORRELATED SEQUENCE, EQUIVALENT WIDTH, CENTROID, ABSOLUTE
CENTROID, ROOT MEAN SQUARE ABSCISSA, KURTOSIS OF CORRELATED SEQUENCE, SKEWNESS OF CORRELATED
SEQUENCE and SKEWNESS OF FAULT SIGNAL are extracted from cross-correlated sequence of electrical power signal of
fundamental frequency of 50Hz and fault signal of transformer under insulation test and used to train the MDWN to
generate the targets. This MDWN is used in future to test the classification of fault characteristics. The approach has
classification accuracy of 90.70%.
5

Now the classification accuracy attained variability on use of different mother wavelet to train MDWN.
Chun-Yao Lee et. Al. [15]in 2011 uses PROBABILISTIC NEURAL NETWORK BASED FEATURE SELECTION(PFS) method to
classify PQ fault in electrical signal. The scheme combines global optimization algorithm with an ADAPTIVE
PROBABILISTIC NEURAL NETWORK (APNN) for removing redundant and irrelevant features from PQ disturbance signal.
Total 62 features were extracted from 11 different types of PQ disturbance signals from ST and TT transformations. A
PNN (PROBABILISTIC NEURAL NETWORK) based feature extraction was implemented by combination of FULLY
INFORMED PARTICLE SWARM (FIPS) with an APNN. FIPS was used for optimization of smoothing parameters of APNN
by gradual removal of irrelevant features from PQ disturbance signal. This method classifies the PQ disturbance signal
with accuracy of 96.3%, 90.8% and 96.1% of SNR of ∞Db, 20Db and 30Db.
Milan Biswal et. Al. in [16] in 2013 proposed a fast variant of S-transform algorithm for extraction of relevant features
used to distinguish different electrical signal deviations by a fuzzy decision tree based classifier. It has higher recognition
success rate for identification of simultaneous disturbances in electrical signal. Fast dynamic S-transform is used to for
appropriate time-frequency localization, decision tree algorithm finds its use in selection of optimal features and fuzzy
decision rules complements overlapping patterns. It has an accuracy rate of 98.6% for classifying electrical distortion
with 40Db noise level.
Sovan Dalai et.al.on [17] in 2013 successfully selects the optimal features from cross-correlation sequence between PQ
disturbance signal and power signal of fundamental frequency(50Hz). Several signals with single fault and combination
between different fault signals are used to generate other different categories of fault signals using simulation
software(MATLAB). Their work emphasize on successful extraction of 12 features namely MAXIMUM VALUE OF
CORRELATION SEQUENCE, INDEX VALUE OF CORRELATION SEQUENCE, EQUIVALENT WIDTH, CENTROID, ABSOLUTE
CENTROID, ROOT MEAN SQUARE WIDTH, MEAN VALUE OF CORREATION, STANDARD DEVIATION, SKEWNESS OF
CORRELATION SEQUENCE, KURTOSIS OF CORRELATION and PQ DISTURBANCE signal. ROUGH SET THEORY is used as it
successfully selects optimal features from a situation where knowledge of features is less and also redundant features
exist. CONDITION ATTRIBUTES is tabulated containing the features from CORRELATION SEQUENCES of PQ disturbance
signal and power signal of fundamental frequency. DECISION ATTRIBUTE is created based on ROUGH SET THEORY
concept. Their proposed approach has the classification accuracy of 97.10%.
Shufan He et. Al. in [18] in 2013 uses hybrid method based on S-transform and dynamics. Hybrid method primarily
dynamics to identify the signal components in frequency spectrum of Fourier transform and uses inverse Fourier
transform to some signal components. Features are extracted from Fourier transform, S-transform and dynamics and
decision tree is used to classify the faults. Reduction of Heisenberg’s uncertainty is achieved by windowing signal
components by different Gaussian windows, results in better adaption and flexibility. DSP-FPGA hardware platform is
used to test run time and justification of the proposed method.
6

Swati Banerjee et. Al. in [19]2014 successfully classifies ECG signal based on features extraction from CROSS-WAVELET
transformation. CROSS-WAVELET transformation is used for analysis of different stationary ECG signals. Single lead data
from ECG signal is first deionised and beat segmentation is done to normalize the cardiac beats in time domain.
CONTINUOUS WAVELET TRANSFORMATION of NORMAL TEMPLATE SIGNAL and SIGNAL TO BE ANALYSED is carried
out for CROSS-WAVELET TRANSFORMATION of two continuous wavelet transformed of signals. CROSS-WAVELET
TRANSFORMAITON is succeeded by CROSS-WAVELET SPECTRUM and WAVELET COHERENCE for classification of
different ECG signals. The datasets that is used to classify the ECG signals composed of three sets of parameters namely
(pa1,pp1), …..,(pa3,pp3). The ECG signals were classified by THRESHOLD-BASED CLASSIFICATION technique. The work
incurred an ECG signal classification accuracy of 97.6%.
Martin-Valtierra Rodriguez et. Al. in [20] in 2014 proposed a new method of classifying single and multiple electrical
disturbances using dual neural network. It uses adaptive linear network for estimation of harmonic and inter-harmonic
for computation of root mean square voltage and total harmonic indices. These indices are used to classify sag, swell,
outages and harmonic and inter-harmonic disturbances whereas feed-forward neural network is used to recognize
pattern of identification of spike, flicker, notch and oscillatory transients from vertical and horizontal histograms of
specific voltage waveform. It reaches classification of accuracy of 98% for noiseless signal and 90% for contamination of
20Db SNR noise level.
Sovan Dalai et. Al. in [21]in 2015 enables to classify MULTIPLE POWER QUALITY DISTURBANCES in electrical signal. Their
work comprises of two steps of feature extraction from MULTIPLE POWER QUALITY signal and classification of the
signal. FLDA (Fischer Linear Discriminant Analysis) method is used for feature extraction on its suitability of non-linear &
non-stationary MULTIPLE POWER QUALITY signal and its capability of fetching smaller set of data from higher order
statistical data sets. Features are extracted from CROSS WAVELET SPECTRUM of MULTIPLE POWER QUALITY SIGNAL
and POWER SIGNAL of standard fundamental frequency (50Hz). Classification of MULTIPLEPOWER QUALITY signal is
done using SUPPRT VECTOR MACHINE (SVM) as it ensures reduction of structural and experimental risk in search of
superior generalization when the large dimension set of training set is provided but the dimension of test set is limited.
Their scheme successfully classifies MULTIPLE POWER QUALITY DISTURBANCE of an electrical signal with 99.09%
accuracy.
Zhigang Liu et. Al. in [22]2015 develops a combination method for recognition of complex electrical disturbances based
on ensemble empirical mode decomposition and multi-label learning. EEMD is used to extract features suitable for non-
stationary disturbance in signals. Rank wavelet support vector machine is finds its application in classification of
electrical distortion. Features are extracted from complex disturbance using EEMD by defining standard energy
difference of each intrinsic mode function. Optimization of rank based SVM based of wavelet kernel function ranking
function and multilabel functions are prepared.
7
Finally, rank-WSVM finds its classification task of electrical disturbance.
C. –H. Lin et. Al.in [23] in 2005 proposes harmonic detection and voltages using wavelet-based network. It is a two-layer
architecture containing wavelet layer and probabilistic network. Wavelet transformation carries out feature extraction
from various disturbances and probabilistic network to analyse translation patterns form time-domain distorted wave
and perform classification task. The test result concludes that simplified network architecture enhances classification
performance and curtails processing time for disturbance event detection. It achieves an average classification accuracy
of 98.7%.
8

1.3 Aim of thesis The thesis provides the importance of fault classification technique. The noticeable fact about the
classification method is the type of significant features extracted from cross-correlogram.
It also uses modern simulation software to generate nine different types of electrical
disturbances that generally occur in power system. The mathematical equations of the fault are in
accordance with IEEE 1159-1995 standards. The features extracted from faults should be distinct otherwise,
it classifier will be unable to detect the type of electrical disturbances.
Other features can also be extracted. But the computational time for feature extraction would
become more and also memory requirement would be large. Thus, here only twelve features are extracted.
Power system network is frequently subjected to transients which cause generation of electrical
disturbance. These are cumulative in nature and relay should be fast acting to send tripping alarm signal to
circuit breaker. Hence, relay has to transmit which type of disturbance a power system network is subjected
as mitigation methods are different for different type of disturbances.
Nowadays power system uses smart relays which can transmit signal to telecommunication
device specifying the type of disturbance.
9

2. GENERAL DISTURBANCE SIGNAL IN ELECTRICAL POWER SYSTEM
Disturbance in power signal occurs due irregular deviation in argument (magnitude, frequency, etc.) of power signal.
This disturbance is manifested by electrical energy wastage and imparts damage to user’s electrical equipments.
Disturbance occurs due to continuous switching on/off of user’s electrical equipments. As power system is subjected to
continuous load demand change hence, disturbance in power signal transmission is inevitable situation.
Based on observation and study the list entails the categories of disturbance in power signal.
SAG
SWELL
OSCILLATORY TRANSIENT
HARMONIC
FLICKER
NOTCH
SPIKE
MOMENTARY INTERRUPTION
TEMPORARY OUTAGE
Pertaining to the knowledge on occurance of multiple electrical disturbances several other types of faults are
generated in combination of aforementioned faults. Electrical disturbance signals are generated according to
the mathematical formulation of each signal in accordance with IEEE 1159-1995. The mathematical formula for
single electrical disturbance is given in the table next page.
10

Table I
MATHEMATICAL FORMULATION OF DIFFERENT ELECTRICAL DISTURBANCE SIGNAL
Sl. No. TYPE of ELECTRICAL
DISTURBANCE (Event)
CAUSE MODEL EQUATION PARAMETER CONSTRAINT
1 Sag
Line Fault VSlf=[1-m(u1-u2)]sin(2πft+θ) 0.1≤m≤0.9,u1
, u2-unit step function
f-fundamental frequency
Transformer Energizing VSt=[1-m(u1e-a(t-t1))] sin(2πft+θ)
Induction Motor Starting VSm=[1-m(Fs-Fr)] sin(2πft+θ) Fs= u1(1-e-at1)+ u1(mrsin(2πfrt1
+θ))e-ϒt1
Fr= u2(1-e-bt1) 0.1≤m≤0.9 a-sag decay
rate b-sag recovery
rate
2 Swell Unbalance fault VSw=[1+ m(u1-u2)]sin(2πftt+θ) 1.1≤m≤ 1.8 u1, u2-unit
step function f-fundamental
frequency
3 Transient Capacitor switching VTc= sin(2πft+θ)+[u1mtsin(2πftt1)e-ϒt1] ft≤5kHz mt≤4
Line Energizing VTl=u1* sin(2πft+θ)+[u1mtsin(2πfrt1)e-ϒt1] ft≤5kHz mt≤4
Lightning Strike VTl= sin(2πft+θ)+[u1mte-ϒt1] 1.2/50µs
4 Notch Electronic switching VNT= sin(2πft+θ)-sign(sin(2πft+θ)) 𝛴09 𝜅[(u1(t-(t1+0.02n)-u2(t-
(t2+0.02n)]
5 Flicker Electric arc furnace and wind farm
VF=[1+mFsin(2πfFt+θF)] sin(2πft+θ) mF≤0.03 fF≤10Hz
6 Harmonic Non-linear electronic loads
VHm=sin(2πft+θ)+[ΣmNsin(2πfNt+θN)],n>1 mN=magnitude of n order
harmonic fN- n order harmonic frequency
7 Noise Electromagnetic interference
VN= sin(2πft+θ)+[nNLW(t)] nNL- noise level(%)
W(t)-white Gaussian
noise
11

DISCUSSION ON ELECTRICAL SIGNAL DISTURBANCE
2.1 SAG Sag in signal occurs when the amplitude of transmitting signal lessen its value than a normal value of electrical
power signal. According to IEEE 1159-1995 a fault is said to be SAG if its peak magnitude varies from 0.1-0.9 pu
(per unit) of system voltage and persists for 0.5-30 cycles. This situation occurs due to the following causes:
Single line fault carrying high capacity of electrical power
Starting of induction motor
Energizing of unloaded transformer
SINGLE LINE FAULT: Power system is stable by generation side and load side balance of active power and reactive power.
On occurance of single-ground fault, the generation and load side balance of both active and reactive power are not in
parity. Due to this disparity, the generation side suffers from oscillation of frequency of generator though it is mitigated
by AUTOMATIC LOAD FREQUENCY CONTROL (ALFC). But the disparity of reactive power results in dipping of voltage
signal through the transmission line which causes mal-operation of end user’s electrical equipments. A sample sag signal
for single line fault in per unit system is given in next page:
Fig.1. Voltage signal with Sag
The effects of faults are given below:
o Steady and transient instability
o Aging effects of electrical equipments
12

STARTING OF INDUCTION MOTOR: Induction motor is composed of ferromagnetic rotor and stator. It develops torque
on basis of DOUBLE REVOLVING FIELD THEORY as two revolving magnetic fields are sweeping across each other stator
field is revolving at synchronous speed. Hence, the induction motor requires large reactive power from power supply as
the both stator and rotor circuits are both mostly inductive. Thus during starting of induction motor the voltage
magnitude suddenly dips on consumption of reactive power .A sample sag signal for starting of induction motor in per
unit system is given below:
Fig.2. Voltage with Sag due to starting of induction motor
The fault creates transient state problem in the power system operation.
ENERGISING OF UNLOADED TRANSFORMER: Transformer is a static electric device that transforms electrical power from
one electrical circuit to another electrical circuit at constant electrical frequency. It actually consists of an
electromagnetic core wounded by two or more electrical conductors to energize the core and sets up electromagnetic
flux. Due to mutual flux linkage between different coils wound on the core, the coils gets electromagnetically energized
and electromagnetic force (emf) induced in the coil. This situation occurs when all coils are connected to some active
(closed) electrical equipment. But when one or more coils are not connected to active electrical equipments the mutual
flux linkage does not takes place between coils. The coil not connected to active electrical equipments gets highly
energized and consumes huge amount of reactive power from the electrical power supply causing voltage to dip in
magnitude.
The situation is manifested by effect listed under:
Transient instability
13

Fig.3. Voltage with Sag due to energizing of unloaded transformer
14
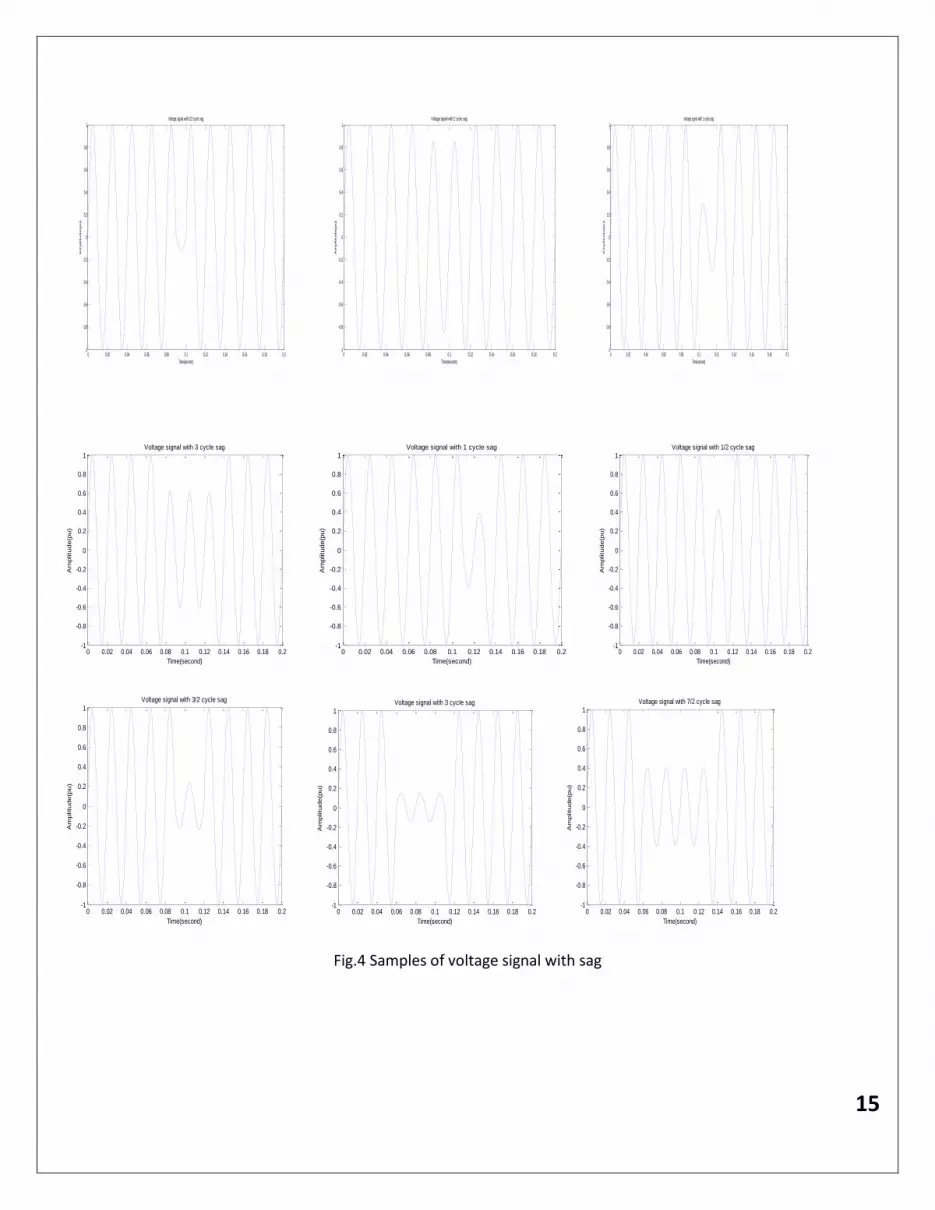
Fig.4 Samples of voltage signal with sag
15
0 0.02 0.04 0.06 0.08 0.1 0.12 0.14 0.16 0.18 0.2-1
-0.8
-0.6
-0.4
-0.2
0
0.2
0.4
0.6
0.8
1Voltage signal with 1/2 cycle sag
Time(second)
Am
plitude(pu)
0 0.02 0.04 0.06 0.08 0.1 0.12 0.14 0.16 0.18 0.2-1
-0.8
-0.6
-0.4
-0.2
0
0.2
0.4
0.6
0.8
1Voltage signal with 2 cycle sag
Time(second)
Am
plitude(pu)
0 0.02 0.04 0.06 0.08 0.1 0.12 0.14 0.16 0.18 0.2-1
-0.8
-0.6
-0.4
-0.2
0
0.2
0.4
0.6
0.8
1Voltage signal with 1 cycle sag
Time(second)
Am
plitude(pu)
0 0.02 0.04 0.06 0.08 0.1 0.12 0.14 0.16 0.18 0.2-1
-0.8
-0.6
-0.4
-0.2
0
0.2
0.4
0.6
0.8
1Voltage signal with 3 cycle sag
Time(second)
Am
plitu
de(p
u)
0 0.02 0.04 0.06 0.08 0.1 0.12 0.14 0.16 0.18 0.2-1
-0.8
-0.6
-0.4
-0.2
0
0.2
0.4
0.6
0.8
1Voltage signal with 1 cycle sag
Time(second)
Am
plitu
de(p
u)
0 0.02 0.04 0.06 0.08 0.1 0.12 0.14 0.16 0.18 0.2-1
-0.8
-0.6
-0.4
-0.2
0
0.2
0.4
0.6
0.8
1Voltage signal with 1/2 cycle sag
Time(second)
Am
plitu
de(p
u)
0 0.02 0.04 0.06 0.08 0.1 0.12 0.14 0.16 0.18 0.2-1
-0.8
-0.6
-0.4
-0.2
0
0.2
0.4
0.6
0.8
1Voltage signal with 3/2 cycle sag
Time(second)
Am
plitu
de(p
u)
0 0.02 0.04 0.06 0.08 0.1 0.12 0.14 0.16 0.18 0.2-1
-0.8
-0.6
-0.4
-0.2
0
0.2
0.4
0.6
0.8
1Voltage signal with 3 cycle sag
Time(second)
Am
plitu
de(p
u)
0 0.02 0.04 0.06 0.08 0.1 0.12 0.14 0.16 0.18 0.2-1
-0.8
-0.6
-0.4
-0.2
0
0.2
0.4
0.6
0.8
1Voltage signal with 7/2 cycle sag
Time(second)
Am
plitu
de(p
u)

2.2 SWELL The swell in signal occurs when the magnitude of amplitude increases with respect to the normal value
of electrical power signal A swell generally has peak magnitude of 1.1-1.8 pu(per unit) of system voltage
and remains for 0.5-30cycles.The situation occurs due to following causes:
Switching of large capacitor banks
Switching off large loads
SWITCHING OF LARGE CAPACITOR: Charged capacitor plays a vital role to supply electrical reactive
power in its shortage. They also serve the role of power factor improvement of the whole electrical
power system. So when capacitor bank is switched on there is excess of electrical reactive power in the
power system. Thus the voltage suddenly increases in magnitude than its normal value.
This cause has subsequent effects listed under:
Insulation breakdown of electrical equipments:
Fig.5. Voltage signal with Swell due to switching of large charged capacitor
16

Fig. 6 Samples of voltage signal with swell
17
0 0.02 0.04 0.06 0.08 0.1 0.12 0.14 0.16 0.18 0.2-2
-1.5
-1
-0.5
0
0.5
1
1.5
2Voltage signal with 2 cycle swell
Time(second)
Am
plitude(pu)
0 0.02 0.04 0.06 0.08 0.1 0.12 0.14 0.16 0.18 0.2-2
-1.5
-1
-0.5
0
0.5
1Voltage signal with 1/2 cycle swell
Time(second)
Am
plitude(pu)
0 0.02 0.04 0.06 0.08 0.1 0.12 0.14 0.16 0.18 0.2-1.5
-1
-0.5
0
0.5
1
1.5Voltage signal with 1 cycle swell
Time(second)
Am
plitude(pu)
0 0.02 0.04 0.06 0.08 0.1 0.12 0.14 0.16 0.18 0.2-1.5
-1
-0.5
0
0.5
1
1.5Voltage signal with 7/2 cycle swell
Time(second)
Am
plitu
de(p
u)
0 0.02 0.04 0.06 0.08 0.1 0.12 0.14 0.16 0.18 0.2-2
-1.5
-1
-0.5
0
0.5
1
1.5
2Voltage signal with 3 cycle swell
Time(second)
Am
plitu
de(p
u)
0 0.02 0.04 0.06 0.08 0.1 0.12 0.14 0.16 0.18 0.2-2
-1.5
-1
-0.5
0
0.5
1
1.5
2Voltage signal with 3/2 cycle swell
Time(second)
Am
plitu
de(p
u)
0 0.02 0.04 0.06 0.08 0.1 0.12 0.14 0.16 0.18 0.2-1
-0.5
0
0.5
1
1.5
2Voltage signal with 1/2 cycle swell
Time(second)
Am
plitu
de(p
u)
0 0.02 0.04 0.06 0.08 0.1 0.12 0.14 0.16 0.18 0.2-1.5
-1
-0.5
0
0.5
1
1.5Voltage signal with 3 cycle swell
Time(second)
Am
plitu
de(p
u)
0 0.02 0.04 0.06 0.08 0.1 0.12 0.14 0.16 0.18 0.2-2
-1.5
-1
-0.5
0
0.5
1
1.5
2Voltage signal with 2 cycle swell
Time(second)
Am
plitu
de(pu)

2.3 HARMONIC
It is caused due to introduction to higher order harmonics of fundamental component of the electrical power signal.
Frequent switching of electrical equipments introduces harmonics in power system. Also mal-operation of electrical
equipments like motors causes harmonics to merge with the system electrical power signal. According to IEEE 1159-
1995, harmonic has peak magnitude of maximum 0.2 pu (per unit) system voltage and has integral multiple of system
frequency (in India it is 50 Hz).
The causes for the harmonic introduction into the power signal are listed below:
excessive usage of non-linear electrical motor loads and speed drives
large UPS (UNINTERRUPTIBLE POWER SUPPLY) system
The effects of harmonic introduction are given below:
overheating of electrical equipment and conductor
produces noise at excessive level of harmonic introduction
Fig.7. Voltage signal with Harmonic
18

Fig. 8 Samples of voltage signal with harmonic
19
0 0.02 0.04 0.06 0.08 0.1 0.12 0.14 0.16 0.18 0.2-1
-0.8
-0.6
-0.4
-0.2
0
0.2
0.4
0.6
0.8
1Voltage signal 1st,2nd & 3rd harmonic
Time(second)
Am
plitude(pu)
0 0.02 0.04 0.06 0.08 0.1 0.12 0.14 0.16 0.18 0.2-1
-0.8
-0.6
-0.4
-0.2
0
0.2
0.4
0.6
0.8
1Voltage signal 1st,2nd & 3rd harmonic
Time(second)
Am
plitude(pu)
0 0.02 0.04 0.06 0.08 0.1 0.12 0.14 0.16 0.18 0.2-1
-0.8
-0.6
-0.4
-0.2
0
0.2
0.4
0.6
0.8
1Voltage signal 1st,2nd & 3rd harmonic
Time(second)
Am
plitu
de(p
u)
0 0.02 0.04 0.06 0.08 0.1 0.12 0.14 0.16 0.18 0.2-1
-0.8
-0.6
-0.4
-0.2
0
0.2
0.4
0.6
0.8
1Voltage signal 1st,2nd & 3rd harmonic
Time(second)
Am
plitu
de(p
u)
0 0.02 0.04 0.06 0.08 0.1 0.12 0.14 0.16 0.18 0.2-1
-0.8
-0.6
-0.4
-0.2
0
0.2
0.4
0.6
0.8
1Voltage signal 1st,2nd & 3rd harmonic
Time(second)
Am
plitude(pu)
0 0.02 0.04 0.06 0.08 0.1 0.12 0.14 0.16 0.18 0.2-1
-0.8
-0.6
-0.4
-0.2
0
0.2
0.4
0.6
0.8
1Voltage signal 1st,2nd & 3rd harmonic
Time(second)
Am
plitu
de(p
u)
0 0.02 0.04 0.06 0.08 0.1 0.12 0.14 0.16 0.18 0.2-1
-0.8
-0.6
-0.4
-0.2
0
0.2
0.4
0.6
0.8
1Voltage signal 1st,2nd & 3rd harmonic
Time(second)
Am
plitude(pu)
0 0.02 0.04 0.06 0.08 0.1 0.12 0.14 0.16 0.18 0.2-1
-0.8
-0.6
-0.4
-0.2
0
0.2
0.4
0.6
0.8
1Voltage signal 1st,2nd & 3rd harmonic
Time(second)
Am
plitude(pu)
0 0.02 0.04 0.06 0.08 0.1 0.12 0.14 0.16 0.18 0.2-1
-0.8
-0.6
-0.4
-0.2
0
0.2
0.4
0.6
0.8
1Voltage signal 1st,2nd & 3rd harmonic
Time(second)
Am
plitude(pu)

2.4 FLICKER
Flicker in electrical power signal is situation occurs due to irregular dip and hike in magnitude of amplitude
in electrical power signal. The causes for flicker in electrical power signal are listed below:
arcing in electrical conductor
usage of large electrical motor loads with variable loads
Flicker produce consequence listed below:
Disturbance in monitoring equipment
Fig. 9: Voltage signal with flicker
20
0 0.02 0.04 0.06 0.08 0.1 0.12 0.14 0.16 0.18 0.2-1.5
-1
-0.5
0
0.5
1
1.5Voltage signal flicker
Time(second)
Am
plit
ude(p
u)

Fig. 10 Samples of voltage signal with flicker
21
0 0.02 0.04 0.06 0.08 0.1 0.12 0.14 0.16 0.18 0.2-1.5
-1
-0.5
0
0.5
1
1.5Voltage signal flicker
Time(second)
Am
plitu
de(p
u)
0 0.02 0.04 0.06 0.08 0.1 0.12 0.14 0.16 0.18 0.2-1.5
-1
-0.5
0
0.5
1
1.5Voltage signal flicker
Time(second)
Am
plitu
de(p
u)
0 0.02 0.04 0.06 0.08 0.1 0.12 0.14 0.16 0.18 0.2-1.5
-1
-0.5
0
0.5
1
1.5Voltage signal flicker
Time(second)
Am
plitude(pu)
0 0.02 0.04 0.06 0.08 0.1 0.12 0.14 0.16 0.18 0.2-1.5
-1
-0.5
0
0.5
1
1.5Voltage signal flicker
Time(second)
Am
plitu
de(p
u)
0 0.02 0.04 0.06 0.08 0.1 0.12 0.14 0.16 0.18 0.2-1.5
-1
-0.5
0
0.5
1
1.5Voltage signal flicker
Time(second)
Am
plitu
de(p
u)
0 0.02 0.04 0.06 0.08 0.1 0.12 0.14 0.16 0.18 0.2-1.5
-1
-0.5
0
0.5
1
1.5Voltage signal flicker
Time(second)
Am
plitude(pu)
0 0.02 0.04 0.06 0.08 0.1 0.12 0.14 0.16 0.18 0.2-1.5
-1
-0.5
0
0.5
1
1.5Voltage signal flicker
Time(second)
Am
plitude(pu)
0 0.02 0.04 0.06 0.08 0.1 0.12 0.14 0.16 0.18 0.2-1.5
-1
-0.5
0
0.5
1
1.5Voltage signal flicker
Time(second)
Am
plitude(pu)
0 0.02 0.04 0.06 0.08 0.1 0.12 0.14 0.16 0.18 0.2-1.5
-1
-0.5
0
0.5
1
1.5Voltage signal flicker
Time(second)
Am
plitude(pu)

2.5 NOTCH
Fig. 11 Voltage signal with notch
Notch signal is caused due to sudden switching operation. It can be viewed as sudden voltage sag for infinitesimal time.
This type of operation is employed when heavy electrical loading is the consequence of 1 single-ground fault. During this
type of fault, the terminal voltage of alternator should be lowered for reduction of electrical loading. Depth of notch
depends on switching instant or ignition angle of convertor devices in substations.
Notch can be avoided in following ways:
Decreasing switching angle
Reduction of switching operation
22
0 0.02 0.04 0.06 0.08 0.1 0.12 0.14 0.16 0.18 0.2-1
-0.8
-0.6
-0.4
-0.2
0
0.2
0.4
0.6
0.8
1
Notch
Time(seconds)
Ampl
itude
(pu)

Fig. 12 Samples of voltage signal with notch
23
0 0.02 0.04 0.06 0.08 0.1 0.12 0.14 0.16 0.18 0.2-1
-0.8
-0.6
-0.4
-0.2
0
0.2
0.4
0.6
0.8
1Voltage signal with notch
Time(second)
Am
plitu
de(p
u)
0 0.02 0.04 0.06 0.08 0.1 0.12 0.14 0.16 0.18 0.2-1
-0.8
-0.6
-0.4
-0.2
0
0.2
0.4
0.6
0.8
1Voltage signal with notch
Time(second)A
mplitude(pu)
0 0.02 0.04 0.06 0.08 0.1 0.12 0.14 0.16 0.18 0.2-1
-0.8
-0.6
-0.4
-0.2
0
0.2
0.4
0.6
0.8
1Voltage signal with notch
Time(second)
Am
plitude(pu)
0 0.02 0.04 0.06 0.08 0.1 0.12 0.14 0.16 0.18 0.2-1
-0.8
-0.6
-0.4
-0.2
0
0.2
0.4
0.6
0.8
1Voltage signal with notch
Time(second)
Am
plitu
de(p
u)
0 0.02 0.04 0.06 0.08 0.1 0.12 0.14 0.16 0.18 0.2-1
-0.8
-0.6
-0.4
-0.2
0
0.2
0.4
0.6
0.8
1Voltage signal with notch
Time(second)
Am
plitu
de(p
u)
0 0.02 0.04 0.06 0.08 0.1 0.12 0.14 0.16 0.18 0.2-1
-0.8
-0.6
-0.4
-0.2
0
0.2
0.4
0.6
0.8
1Voltage signal with notch
Time(second)
Am
plitu
de(p
u)
0 0.02 0.04 0.06 0.08 0.1 0.12 0.14 0.16 0.18 0.2-1
-0.8
-0.6
-0.4
-0.2
0
0.2
0.4
0.6
0.8
1Voltage signal with notch
Time(second)
Am
plitu
de(p
u)
0 0.02 0.04 0.06 0.08 0.1 0.12 0.14 0.16 0.18 0.2-1
-0.8
-0.6
-0.4
-0.2
0
0.2
0.4
0.6
0.8
1Voltage signal with notch
Time(second)
Am
plitu
de(p
u)
0 0.02 0.04 0.06 0.08 0.1 0.12 0.14 0.16 0.18 0.2-1
-0.8
-0.6
-0.4
-0.2
0
0.2
0.4
0.6
0.8
1Voltage signal with notch
Time(second)
Am
plitude(pu)

2.6 OSCILLATORY TRANSIENT
Fig. 13.Voltage signal with oscillatory transient
Transient disturbance occurs due to irregular switching of equipments. This type of disturbance mainly occurs in
energizing characteristics of transformer. This phenomenon is familiar with electrical equipments producing
harmonics. These disturbances results in unusual energy wastage and insulation breakdown. They may also switch
off a load in case of excessive transiency of the electrical signal.
It is defined as a sudden; non-power frequency change in the steady state condition of voltage, current or both
that have both positive and negative values. It exhibits a damped oscillation, with a voltage or current waveform
continuing to oscillate for half a cycle to three cycles. Oscillatory transients event occur due to switching of circuits,
specially the energizing and de-energizing of capacitors and inductors.
The disturbance can cause temporary or permanent damage to electrical equipment. A transient overvoltage can
damage components, especially semiconductors, which are not designed to withstand over voltages. They can cause
data errors in data processing and storage equipment because transients in electrical power circuits can couple to
communications and control circuits or cause adjustable drives to trip accidentally.
24
0 0.02 0.04 0.06 0.08 0.1 0.12 0.14 0.16 0.18 0.2-1.5
-1
-0.5
0
0.5
1
1.5
Oscillatory transient
Time(second)
Am
plitu
de(p
u)

Fig.14 Samples of voltage signal with oscillatory transient
25
0 0.02 0.04 0.06 0.08 0.1 0.12 0.14 0.16 0.18 0.2-1.5
-1
-0.5
0
0.5
1
1.5Voltage signal with transient
Time(second)
Am
plitu
de(p
u)
0 0.02 0.04 0.06 0.08 0.1 0.12 0.14 0.16 0.18 0.2-1.5
-1
-0.5
0
0.5
1
1.5
2Voltage signal with transient
Time(second)
Am
plitu
de(p
u)
0 0.02 0.04 0.06 0.08 0.1 0.12 0.14 0.16 0.18 0.2-1.5
-1
-0.5
0
0.5
1
1.5Voltage signal with transient
Time(second)
Am
plitude(pu)
0 0.02 0.04 0.06 0.08 0.1 0.12 0.14 0.16 0.18 0.2-1.5
-1
-0.5
0
0.5
1
1.5Voltage signal with transient
Time(second)
Am
plitu
de(p
u)
0 0.02 0.04 0.06 0.08 0.1 0.12 0.14 0.16 0.18 0.2-1
-0.5
0
0.5
1
1.5Voltage signal with transient
Time(second)
Am
plitu
de(p
u)
0 0.02 0.04 0.06 0.08 0.1 0.12 0.14 0.16 0.18 0.2-1.5
-1
-0.5
0
0.5
1
1.5Voltage signal with transient
Time(second)
Am
plitu
de(p
u)
0 0.02 0.04 0.06 0.08 0.1 0.12 0.14 0.16 0.18 0.2-1.5
-1
-0.5
0
0.5
1
1.5
2Voltage signal with transient
Time(second)
Am
plitu
de(p
u)
0 0.02 0.04 0.06 0.08 0.1 0.12 0.14 0.16 0.18 0.2-1.5
-1
-0.5
0
0.5
1
1.5Voltage signal with transient
Time(second)
Am
plitu
de(p
u)
0 0.02 0.04 0.06 0.08 0.1 0.12 0.14 0.16 0.18 0.2-1.5
-1
-0.5
0
0.5
1Voltage signal with transient
Time(second)
Am
plitude(pu)

2.7 SPIKE
Fig. 15 Voltage signal with spike
Voltage spikes are sudden and momentary increase in voltage. It may be caused by lightning strikes power
outages, tripping of circuit breakers, short circuits, power transitions in other large equipment on the same
power line etc. Due to voltage surge electronic devices may operate at decreased efficiencies.
Spikes permanently damage the equipments.
26
0 0.02 0.04 0.06 0.08 0.1 0.12 0.14 0.16 0.18 0.2-1
-0.8
-0.6
-0.4
-0.2
0
0.2
0.4
0.6
0.8
1
Spike
Time(second)
Am
plitu
de(p
u)

Fig. 16 Samples of voltage signal with spike
27
0 0.02 0.04 0.06 0.08 0.1 0.12 0.14 0.16 0.18 0.2-1
-0.8
-0.6
-0.4
-0.2
0
0.2
0.4
0.6
0.8
1Voltage signal with spike
Time(second)
Am
plitude(pu)
0 0.02 0.04 0.06 0.08 0.1 0.12 0.14 0.16 0.18 0.2-1
-0.8
-0.6
-0.4
-0.2
0
0.2
0.4
0.6
0.8
1Voltage signal with spike
Time(second)
Am
plitude(pu)
0 0.02 0.04 0.06 0.08 0.1 0.12 0.14 0.16 0.18 0.2-1
-0.8
-0.6
-0.4
-0.2
0
0.2
0.4
0.6
0.8
1Voltage signal with spike
Time(second)
Am
plitude(pu)
0 0.02 0.04 0.06 0.08 0.1 0.12 0.14 0.16 0.18 0.2-1
-0.8
-0.6
-0.4
-0.2
0
0.2
0.4
0.6
0.8
1Voltage signal with spike
Time(second)
Am
plitu
de(p
u)
0 0.02 0.04 0.06 0.08 0.1 0.12 0.14 0.16 0.18 0.2-1
-0.8
-0.6
-0.4
-0.2
0
0.2
0.4
0.6
0.8
1Voltage signal with spike
Time(second)
Am
plitu
de(p
u)
0 0.02 0.04 0.06 0.08 0.1 0.12 0.14 0.16 0.18 0.2-1
-0.5
0
0.5
1
1.5Voltage signal with spike
Time(second)
Am
plitude(pu)
0 0.02 0.04 0.06 0.08 0.1 0.12 0.14 0.16 0.18 0.2-1
-0.8
-0.6
-0.4
-0.2
0
0.2
0.4
0.6
0.8
1Voltage signal with spike
Time(second)
Am
plitude(pu)
0 0.02 0.04 0.06 0.08 0.1 0.12 0.14 0.16 0.18 0.2-1
-0.8
-0.6
-0.4
-0.2
0
0.2
0.4
0.6
0.8
1Voltage signal with spike
Time(second)
Am
plitu
de(p
u)
0 0.02 0.04 0.06 0.08 0.1 0.12 0.14 0.16 0.18 0.2-1
-0.8
-0.6
-0.4
-0.2
0
0.2
0.4
0.6
0.8
1Voltage signal with spike
Time(second)
Am
plitude(pu)

2.8 INTERRUPTION
Fig.17 Voltage signal with interruption
It may be seen as a loss of voltage in power system. This disturbance describes a drop of 0.9-1 pu of rated
voltage for duration of 0.5 cycles to 1 minute as per IEEE 1995. It occurs from accidents like faults and
component malfunctions. Short voltage interruptions are typically the result of a malfunction of a switching
device or a deliberate or inadvertent operation of a fuse, circuit breaker in response to faults and disturbance.
Thus a voltage interruption can cause a permanent shutdown of equipment and also can lead to damage. A
voltage interruption over a large geographical area lasting for long time is usually undesirable.
28
0 0.02 0.04 0.06 0.08 0.1 0.12 0.14 0.16 0.18 0.2-1
-0.8
-0.6
-0.4
-0.2
0
0.2
0.4
0.6
0.8
1Interruption
Time(second)
Am
plitu
de(p
u)

Fig. 18 Samples of voltage signal with interruption
29
0 0.02 0.04 0.06 0.08 0.1 0.12 0.14 0.16 0.18 0.2-1
-0.8
-0.6
-0.4
-0.2
0
0.2
0.4
0.6
0.8
1Voltage signal with interruption
Time(second)
Am
plitu
de(p
u)
0 0.02 0.04 0.06 0.08 0.1 0.12 0.14 0.16 0.18 0.2-1
-0.8
-0.6
-0.4
-0.2
0
0.2
0.4
0.6
0.8
1Voltage signal with interruption
Time(second)A
mplitu
de(p
u)
0 0.02 0.04 0.06 0.08 0.1 0.12 0.14 0.16 0.18 0.2-1
-0.8
-0.6
-0.4
-0.2
0
0.2
0.4
0.6
0.8
1Voltage signal with interruption
Time(second)
Am
plitu
de(p
u)
0 0.02 0.04 0.06 0.08 0.1 0.12 0.14 0.16 0.18 0.2-1
-0.8
-0.6
-0.4
-0.2
0
0.2
0.4
0.6
0.8
1Voltage signal with interruption
Time(second)
Am
plitu
de(p
u)
0 0.02 0.04 0.06 0.08 0.1 0.12 0.14 0.16 0.18 0.2-1
-0.8
-0.6
-0.4
-0.2
0
0.2
0.4
0.6
0.8
1Voltage signal with interruption
Time(second)
Am
plitu
de(p
u)
0 0.02 0.04 0.06 0.08 0.1 0.12 0.14 0.16 0.18 0.2-1
-0.8
-0.6
-0.4
-0.2
0
0.2
0.4
0.6
0.8
1Voltage signal with interruption
Time(second)
Am
plitu
de(p
u)
0 0.02 0.04 0.06 0.08 0.1 0.12 0.14 0.16 0.18 0.2-1
-0.8
-0.6
-0.4
-0.2
0
0.2
0.4
0.6
0.8
1Voltage signal with interruption
Time(second)
Am
plitu
de(p
u)
0 0.02 0.04 0.06 0.08 0.1 0.12 0.14 0.16 0.18 0.2-1
-0.8
-0.6
-0.4
-0.2
0
0.2
0.4
0.6
0.8
1Voltage signal with interruption
Time(second)
Am
plitu
de(p
u)
0 0.02 0.04 0.06 0.08 0.1 0.12 0.14 0.16 0.18 0.2-1
-0.8
-0.6
-0.4
-0.2
0
0.2
0.4
0.6
0.8
1Voltage signal with interruption
Time(second)
Am
plitu
de(p
u)

2.9 TEMPORARY OUTAGE
Fig.19 Voltage signal with outage
Outage is defined as a temporary disconnection of load from supply. This event stops electrical equipments
that are running. Sudden outage may damage mechanical parts of electrical motors. This occurs due to
undesirable governor action of alternator. If the governor does not open properly this temporary
disconnection is observed.
Revival from outage takes a long time. During this situation all load are disconnected from transformer
and after repair of governor control system the substations are informed via telemetry system to connect
load. A outage for long time from the supply is usually termed as BLACKOUT, which in undesirable.
30
0 0.02 0.04 0.06 0.08 0.1 0.12 0.14 0.16 0.18 0.2-1
-0.8
-0.6
-0.4
-0.2
0
0.2
0.4
0.6
0.8
1Outage
Time(second)
Am
plit
ude(p
u)

Fig. 20 Samples of voltage signal with temporary outage
31
0 0.02 0.04 0.06 0.08 0.1 0.12 0.14 0.16 0.18 0.2-1
-0.8
-0.6
-0.4
-0.2
0
0.2
0.4
0.6
0.8
1Voltage signal with temporary outage
Time(second)
Am
plitu
de(p
u)
0 0.02 0.04 0.06 0.08 0.1 0.12 0.14 0.16 0.18 0.2-1
-0.8
-0.6
-0.4
-0.2
0
0.2
0.4
0.6
0.8
1Voltage signal with temporary outage
Time(second)A
mplitu
de(p
u)
0 0.02 0.04 0.06 0.08 0.1 0.12 0.14 0.16 0.18 0.2-1
-0.8
-0.6
-0.4
-0.2
0
0.2
0.4
0.6
0.8
1Voltage signal with temporary outage
Time(second)
Am
plitu
de(p
u)
0 0.02 0.04 0.06 0.08 0.1 0.12 0.14 0.16 0.18 0.2-1
-0.8
-0.6
-0.4
-0.2
0
0.2
0.4
0.6
0.8
1Voltage signal with temporary outage
Time(second)
Am
plitude(pu)
0 0.02 0.04 0.06 0.08 0.1 0.12 0.14 0.16 0.18 0.2-1
-0.8
-0.6
-0.4
-0.2
0
0.2
0.4
0.6
0.8
1Voltage signal with temporary outage
Time(second)
Am
plitude(pu)
0 0.02 0.04 0.06 0.08 0.1 0.12 0.14 0.16 0.18 0.2-1
-0.8
-0.6
-0.4
-0.2
0
0.2
0.4
0.6
0.8
1Voltage signal with temporary outage
Time(second)
Am
plitude(pu)
0 0.02 0.04 0.06 0.08 0.1 0.12 0.14 0.16 0.18 0.2-1
-0.8
-0.6
-0.4
-0.2
0
0.2
0.4
0.6
0.8
1Voltage signal with temporary outage
Time(second)
Am
plitu
de(p
u)
0 0.02 0.04 0.06 0.08 0.1 0.12 0.14 0.16 0.18 0.2-1
-0.8
-0.6
-0.4
-0.2
0
0.2
0.4
0.6
0.8
1Voltage signal with temporary outage
Time(second)
Am
plitu
de(p
u)
0 0.02 0.04 0.06 0.08 0.1 0.12 0.14 0.16 0.18 0.2-1
-0.8
-0.6
-0.4
-0.2
0
0.2
0.4
0.6
0.8
1Voltage signal with temporary outage
Time(second)
Am
plitude(pu)

Fig. 21 Flowchart for generation of electrical disturbance signal and formation of feature matrix
32
3. NECESSITY AND REQUIREMENTS FOR DISTURBANCE CLASSIFICATION
Disturbances are some undesirable events occurring in electrical signal which enhance unusual wastage of energy. Fault
can occur at any time with disruptive operation of instruments. Electrical energy finds no substitute of its existence as it
can be easily generated and transferred to distant places.
Several disturbances have their own mitigation methods. It is necessary to identify type of electrical disturbance
so as to ensure the type of mitigation method required.
The process or methods employed here for classification of faults are given below:
Several types (9) of disturbances are generated using modern simulation software (MATLAB) as occurs in real life
situation.
Signal processing techniques are used to correlate fault signal and normal electrical power signal. Here, CROSS-
CORRELATION technique is used.
Twelve features are extracted from cross-correlogram. These features are distinct with respect to type of
disturbance.
Three modern classification techniques like ARTIFICIAL NEURAL NETWORK (ANN), PROBABILISTIC NEURAL
NETWORK (PNN) and RADIAL BASIS NEURAL NETWORK (RBFNN) are used to classify disturbance.
The fault classification is necessary for the exact mitigation methods that is to be applied for type of
disturbance occurring. Nowadays PLC based mitigation methods are widely used where the location and type of
faults are sent to control room of generating or substation by telemetry system. The fault types are computed in
microprocessor based PLC based on logic provided for classification.
It is responsibility of power utility company to assure reliability of power to their consumers. Hence,
disturbance free power signal is expected from these companies. Since, disturbance is inheritable occurance,
thus detection and classification of fault is indispensible for provision of power reliability to consumers.
33

4. FEATURES EXTRACTION FROM ELECTRICAL DISTURBANCE SIGNAL
Several methods were proposed by earlier researchers for features extraction from the electrical disturbance signal. The
approach by Haibo He et. Al. in [4] utilizes the CROSS-WAVELET TRANSFORMATION TECHIQUE based on MULTI-
RESOLUTION ANALYSIS (MRA) for features extraction form the electrical disturbance signal achieving an accuracy of
94.3% in 2006. Noble attempt by Inigo Monedero, Carlos Leon et.al.in [6] classifies the electrical fault signal with an
accuracy of 89% using WAVELET DECOMPOSITION for feature extraction and ARTIFICIAL NEURAL NETWORK (ANN) for
classification of the fault signal. The scheme of Fengzhan Zhao et. Al. in [8] detects disturbance in electrical power signals
and classify them using the S-TRANSFORMATIONTECHNIQUE with an accuracy of 89.5%. S. Suja et. Al. in [9] are capable
of classifying power signal disturbance based on features extracted using DISCRETE WAVELET TRANSFORMATION
(DWT) with accuracy of 86%.
But the recent year’s attempts by Suryannarayana Chandaka et.al.in [12], P. Rajamani et.al. in [14] and Sovan Dalai et.
Al. in [16] used CROSS-CORRELATION TECHNIQUE for feature extraction form the disturbance signal which increases the
accuracy percentage to 98% approximately.
The present attempt of ELECTRICAL DISTURBANCE CLASSIFICATION also utilizes CROSS-CORRELATION TECHNIQUE for
features extraction from the disturbance signal.
4.1 CORRELATION
Correlation interprets statistical relation between different broad classes of dependent objects. They indicate predictive
relationship that can be dispensed in practice. DEPENDENCE refers to any situation in which random variables do not
satisfy a mathematical condition of probabilistic independence. There are several methods for measuring the degree of
correlation. Among them PEARSON CORRELATION TECHNIQUE is used broadly for measuring degree correlation
between two different situations or sets of data.
The population correlation coefficient 𝝆(𝒙, 𝒚) between two random sets of variable 𝑥and 𝑦 with expected values µ𝑥 and µ𝑦 and standard deviations 𝜎𝑥 and 𝜎𝑦 is defined as:
𝝆(𝒙, 𝒚) = 𝒄𝒐𝒓𝒓(𝒙, 𝒚) =𝒄𝒐𝒗(𝒙,𝒚)
𝝈𝒙𝝈𝒚=
𝑬[(𝑿−µ𝒙)(𝒀−µ𝒚)]
𝝈𝒙𝝈𝒚
Now there are two types of correlation technique proposed by PEARSON. They are auto-correlation and cross-correlation.
34

4.1.1 AUTO-CORRELATION
When the two same signals are correlated with provision of arbitrary lag to the sample of disturbance signal, the
resulting sequence is called AUTO-CORRELATION SEQUENCE.
N−m−1
Cxx(m)= Σ Xn+m X n, m ≥ 0 n=0 Cxx(-m)=0, m <0. Where m indicates the shift parameter of correlation sequence and Cxx(m)indicates the auto-correlation sequence of the signal. If the signal has N no. of samples, then the correlation correlation sequence would have (2N-1) no. of samples. 4.1.2 CROSS-CORRELATION
When the two different signals are correlated with provision of arbitrary lag to the sample of disturbance signal, the resulting sequence is called CROSS-CORRELATION SEQUENCE.
N−m−1 Cxy(m)= Σ Xn+m X n, m ≥ 0 n=0 Cxy(-m)=0, m <0 Where m indicated the shift parameter of correlation sequence and Cxy(m) indicates the cross-correlation sequence of the signal. If the signal has N no. of samples, then the correlation correlation sequence would have (2N-1) no. of samples.
Fig. 22. Plot of a typical cross-correlogram
The present problem utilizes 10 cycles of power frequency electrical signal during multiple electrical disturbance signal data acquisition and analysis. Thus 20 half cycles of power frequency exist in the recorded signals. These cycles are utilized for cross-correlation between electrical power signal and electrical disturbance signal as shown in Fig. 14 below.
35

Fig. 23.Cross-correlogram of voltage sag signal
Several features were extracted from cross-correlation sequence between electrical disturbance signal and electrical
power signal. They are designated in Table II as F1-F12 listed below:
Table II FEATURE DESIGNATION LIST FOR DISTURBANCE SIGNAL
Sl. No. Feature Index Feature Designator
1 F1 Maximum value of correlation sequence
2 F2 Index of the maximum value of correlation sequence
3 F3 Equivalent width of correlation sequence
4 F4 Mean value of correlation sequence
5 F5 Standard deviation of correlation sequence
6 F6 Skewness of correlation sequence
7 F7 Kurtosis of correlation sequence
8 F8 Variance of disturbance signal
9 F9 Kurtosis of disturbance signal
10 F10 Kurtosis of correlation coefficient
11 F11 Variance of disturbance signal
12 F12 Kurtosis of disturbance signal
The mathematical interpretation pertaining to features F3-F10 and F12 are formulated below:
1. F3=[∑ 𝒏∗𝑪𝒏𝑵
𝒏=−𝑵 ]
𝑹𝒎𝒂𝒙
2. F4=[∑ 𝒏∗𝑪𝒏𝑵
𝒏=−𝑵 ]
[∑ 𝑪𝒏𝑵𝒏=−𝑵 ]
3. F5=[∑ |𝒏|∗𝑪𝒏𝑵
𝒏=−𝑵 ]
∑ 𝑹𝒏𝑵𝒏=−𝑵
4. F6=√[∑ 𝒏∗𝒏∗𝑪𝒏𝑵
𝒏=−𝑵 ]
∑ 𝑪𝒏𝑵𝒏=−𝑵
5. F7=Σ𝑪𝒏
(𝟐𝑵+𝟏)
6. F8=𝜮(𝑪𝒏−𝑭𝟕)∗(𝑪𝒏−𝑭𝟕)
(𝟐𝑵+𝟏)
7. F9=𝜮(𝑪𝒏−𝑭𝟕)∗(𝑪𝒏−𝑭𝟕)∗(𝑪𝒏−𝑭𝟕)
𝟐𝑵∗𝑭𝟖∗𝑭𝟖∗𝑭𝟖
8. F10=𝜮(𝑪𝒏−𝑭𝟕)∗(𝑪𝒏−𝑭𝟕)∗(𝑪𝒏−𝑭𝟕)∗(𝑪𝒏−𝑭𝟕)
𝟐𝑵∗𝑭𝟖∗𝑭𝟖∗𝑭𝟖∗𝑭𝟖
9. F12=𝜮(𝒀−𝒚)∗(𝒀−𝒚)∗(𝒀−𝒚)∗(𝒀−𝒚)
𝟐𝑵∗(𝒀𝒔∗𝒀𝒔∗𝒀𝒔∗𝒀𝒔)
where 𝒏 represents index of correlation coefficients,𝑵 represent no. of samples in electrical power signal,𝑪𝒏 represents correlation coefficient and 𝒀𝒔 is standard deviation of disturbance signal. The above 12 distinct features were extracted from disturbance signal after cross-correlation operation is employed.
Features to be chosen are calculated by examination process and utilizing previous experience.
36

However, user may apply different other features depending on the hurdle passes by the user. These features are extracted for all the electrical disturbances that are used to train and they are stored in a matrix as input of ANN based feature selection method. Large amount of data is required for training and testing. Electrical disturbance data obtained either from condition monitoring of different electrical equipment for long period of time or it is obtained directly from monitoring of electrical power signal of the any large industrial plant.
The present method is an initiative to create a prototype for monitoring electrical disturbance signal. Several fault
signals are generated by simulation software using suitable IEEE standard 1159-1995and mathematical model with
some constraints. Table I gives the mathematical model of electrical fault signals.
Table III
DESIGNATION OF ELECTRICAL DISTURBANCE
Sl. No. ELECTRICAL DISTURBANCE CLASS
COMBINATION OF DISTURBANCE
1 C1 Sag+Noise
2 C2 Swell+Noise
3 C3 Transient+Noise
4 C4 Flicker+Noise
5 C5 Harmonic+Noise
6 C6 Notch+Noise
7 C7 Spike+Noise
8 C9 Interruption+Noise
9 C9 Temporary outage +Noise
The classifier machine employs here to classify the above mentioned 9 types of electrical disturbances occurring in electrical signal.
37

5. FEATURE SELECTION AND DISTURBANCE CLASSIFICATION TECHNIQUE
Experts used several feature selection and classification techniques in earlier years with acceptable accuracy. Haibo He
et. Al. [4] in 2006 uses SELF-ORGANISING LEARNING ARRAY (SOLAR) system yielding classification accuracy of 94.3%.
Electrical disturbances are classified with accuracy of 89% Inigo Monedero, Carlos Leon et.al in [6] in the same year.
Scheme formulated by Fengzhan Zhao et. Al. in [8] classifies the disturbance signal with accuracy of 98.5% of SNR=30Db
utilizing S-TRANSFORMATION technique in 2007. The succeeding years witness the electrical disturbance classification
accuracy of 86%, 90.70%, 96.3%, 97.10%, and 99.09% by S. Suja et. Al., P. Rajamani et. Al., Chun-Yao Lee et. Al., Sovan
Dalai et. Al., Sovan Dalai et. Al. in [7], [14], [15], [17] and [21] respectively.
The present scheme is a comparative study of classification of electrical disturbances accuracy between
ARTIFICIAL NEURAL NETWORK (ANN)
PROBABILISTIC NEURAL NETWORK (PNN)
RADIAL BASIS NEURAL NETWORK (RBN)
Fig. 24. SVM divides space in 12D pertaining to each class of disturbance
38
5.1 ARTIFICAL NEURAL NETWORK
In machine learning and cognitive science, artificial neural networks (ANNs) are a family of models inspired by biological
neural networks (the central nervous systems of animals, in particular the brain) which are used to estimate
or approximate functions that can depend on a large number of inputs and are generally unknown. Artificial neural
networks are generally presented as systems of interconnected “neurons” which exchange messages between each
other. The connections have numeric weights that can be tuned based on experience, making neural nets adaptive to
inputs and capable of learning.
For example, a neural network for handwriting recognition is defined by a set of input neurons which may be activated
by the pixels of an input image. After being weighted and transformed by a function (determined by the network’s
designer), the activations of these neurons are then passed on to other neurons. This process is repeated until finally,
the output neuron that determines which character was read is activated.
Like other machine learning methods – systems that learn from data – neural networks have been used to solve a wide
variety of tasks, like computer-version and speech-recognition that are hard to solve using ordinary rule-based
programming.
Examinations of humans’ central nervous systems inspired the concept of artificial neural networks. In an artificial neural
network, simple artificial nodes, known as “neurons”, “neurodes”, “processing elements” or “units”, are connected
together to form a network which mimics a biological neural network.
There is no single formal definition of what an artificial neural network is. However, a class of statistical models may
commonly be called “neural” if it possesses the following characteristics:
1. contains sets of adaptive weights, i.e. numerical parameters that are tuned by a learning algorithm, and
2. is capable of approximating non-linear functions of their inputs.
The adaptive weights can be thought of as connection strengths between neurons, which are activated during training
and prediction.
Artificial neural networks are similar to biological neural networks in the performing by its units of functions collectively
and in parallel, rather than by a clear delineation of subtasks to which individual units are assigned. The term “neural
network” usually refers to models employed in statistics, cognitive psychology and artificial intelligence. Neural network
models which command the central nervous system and the rest of the brain are part of theoretical
neuroscience and computational neuroscience.
39

In modern software implementations of artificial neural networks, the approach inspired by biology has been largely
abandoned for a more practical approach based on statistics and signal processing. In some of these systems, neural
networks or parts of neural networks (like artificial neurons) form components in larger systems that combine both
adaptive and non-adaptive elements. While the more general approach of such systems is more suitable for real-world
problem solving, it has little to do with the traditional, artificial intelligence connectionist models.
What they do have in common, however, is the principle of non-linear, distributed, parallel and local processing and
adaptation.
Historically, the use of neural network models marked a directional shift in the late eighties from high-level (symbolic)
artificial intelligence, characterized by expert systems with knowledge embodied in if-then rules, to low-level (sub-
symbolic) machine-learning, characterized by knowledge embodied in the parameters of a dynamical representations.
40

5.2 PROBABILISTIC NEURAL NETWORK (PNN)
It is acronym of PROBABILISTIC NEURAL NETWORK. With context to real time electrical disturbance classification PNN
has proven to be more effective than traditional back propagation neural networks. In order to a feature pattern vector f
€ Fm, to assign the definite among predefined classes the conditional density P (f¦ Ck) of each class Ck is estimated since
it represents the uncertainty associated to class attribution. They are combined according to Bayes theorem that makes
optimal decision. Conditional density estimation is achieved by implementation of Parzen window. It can be viewed as a
sphere of influence p(s, x) around each training (known) sample s and to add them up for each of the k classes
P(x|C ) = p(s , x), p (s, x) = exp (-||x-s||2/2s 2) where the only free parameter is the width σ of the Gaussians.
ARCHITECTURE OF PNN
It consists of a node for each layer one for each training samples. Here 900 training samples are used for each class of
electrical disturbance. The weights leading from the input to a layer one node are the coordinates of the corresponding
sample. The node computes the distance d(s, x) from the test vector x to the training sample s and outputs the value of
the Gaussian.
The experimental results have been carried and it verify the ability of modified PNN in achieving good classification rate
in compared to traditional PNN or back propagation Neural Networks.
This paper presents a PNN based classification technique in order to compare with other classification process. The
pictorial representation of a basic PNN is given below.
Fig.25Basic architecture of PNN
41

5.3 RADIAL BASIS FUNCTION NEURAL NETWORK (RBFNN)
A radial basis function network is an artificial neural network that works on radial basis functions as activation functions. The
output from the network is a linear combination of radial basis functions and its neuron parameters. Radial basis function
networks finds its applications in function approximation, time series prediction, classification, and system control.
NETWORK ARCHITECTURE
Fig.26Architecture of RADIAL BASIS NEURAL NETWORK (RBNN)
Radial basis function (RBF) networks typically have three layers: an input layer, a hidden layer with a non-linear RBF activation
function and a linear output layer. The input can be modeled as a vector of real numbers .The output of the network is
then a scalar function of the input vector, , and is given by
where is the number of neurons in the hidden layer, is the center vector for neuron , and is the weight of
neuron in the linear output neuron. Functions that depend only on the distance from a center vector are radially symmetric
about that vector, hence the name radial basis function. In the basic form all inputs are connected to each hidden neuron.
The norm is typically taken to be the Eucledian distance (although the Mahalanobish distance appears to perform better in
general) and the radial basis function is commonly taken to be Gaussian
.
42

The Gaussian basis functions are local to the center vector in the sense that
i.e. changing parameters of one neuron has only a small effect for input values that are far away from the center of
that neuron.
43

6. BLOCK DIAGRAM FOR ELECTRICAL DISTURBANCE CLASSIFICATION
The above figure represents block diagram for the whole process of electrical faults classification. The process
commences with parameter initialization of electrical disturbance and proceeded by generation of samples of faults
giving range of parameter throughout the samples generated. The next task is feature extraction using signal processing
technique. Here cross-correlation technique is used. The feature matrix is formed for training neural network. The same
process is applied to create feature matrix for testing the classification accuracy. The training matrix is used to train the
neural network specifying definite class corresponding to feature matrix.
44

7. RESULT ANALYSIS Table IV
AVERAGE CLASSIFICATION ACCURACY FOR ANN WITH 0db, 30db AND 50db NOISE
45
CLASS SAG
(%)
SWELL
(%)
HARMONIC
(%)
FLICKER
(%)
NOTCH
(%)
SPIKE
(%)
TRANSIENT
(%)
INTERRUPTION
(%)
OUTAGE
(%)
SAG 95 0 0 0 0 0 0 0 0
SWELL 0 80 0 0 0 0 0 0 0
HARMONIC 0 0 99 0 0 0 0 0 0
FLICKER 0 0 0 91 0 0 0 0 0
NOTCH 0 0 0 0 100 0 0 0 0
SPIKE 0 0 0 0 0 87 0 0 0
TRANSIENT 0 0 0 0 0 0 100 0 0
INTERRUPTION 0 0 0 0 0 0 0 80 0
OUTAGE 0 0 0 0 0 0 0 0 81

8. CONCLUSION The presented method compares four types of classification techniques. Soft computation finds its
essential and efficient use in electrical fault classification. Among
the above methods mentioned, artificial neural network (ANN) classification is widely applied for its
robustness and low computational techniques.
Classification accuracy also draws attention on comparing noiseless fault signal and single electrical
disturbance signal. It reduces on introduction of noise. At higher noise level (db) the classification
accuracy reduces. This is due to the fact that on introduction of noise to fault signal the feature
matrix’s value changes drastically which becomes almost illegible the type of electrical faults occurring
by the neural network.
Proposed method classified nine types of single electrical disturbances. Accuracy increases on
iterative training of neural network with feature matrix of training sample of disturbance signal.
The most efficient soft classification method is as its classification accuracy is. The judgement on
best classification technique is based on average classification accuracy.
The above classification technique has been arranged in order of their decreasing average classification
accuracy:
Table V
ARRANGEMENT OF AVERAGE CLASSIFICATION ACCURACY
Sl. No. CLASSIFICATION TECHNIQUE AVERAGE ACCURACY
(%)
1 ARTIFICAL NEURAL NETWORK (ANN) 90.3
2 RADIAL BASIS FUNCTION (RBFNN) 94.3
3 PROBABILISTIC NEURAL NETWORK (PNN) 91
From the table, it can be concluded that RBFNN has more classification accuracy than other classification techniques
used. It has an average classification accuracy of 94.3%.
46

9. FUTURE DEVELOPMENT
Disturbance in electrical signal occur in association with several other types of disturbances. Those types of
signal are called multiple disturbance signals. Now the above classification techniques can be applied to
multiple disturbance signal and search for the most efficient method for fault classification.
As these classification has become more common, new and advanced classification algorithm needs
to be evolved which has higher classification accuracy and takes low computational time.
A new technique needs to be evolved which works in online classification of fault. GSM based
technique can be used to obtain the type of fault that occurred in the power system. But nowadays PLC based
telemetry system is used to for signal communication purpose. GSM technique can be used for signal
communication system. GSM is faster in communication process. Wi-Fi technique can also be utilized for signal
communication purpose.
A recent theory by John Nash for which he received Nobel Prize in year 1991 can be also used for
classification. The theory is called GAME THEORY. It is feature selection algorithm where significant features
are selected to get more classification accuracy. This theory reduces computational time required to classify
the disturbance signal as the feature matrix gets reduced and also memory requirement squeezed and
compact. This is completely a new theory to this area of power system.
47

10. REFERENCES
[1]A. M. Youssef, T. K. Abdel-Galil, E. F. El-Saadany and M. M. A. Salama, “Disturbance Classification Utilizing Time
Warping Classifier,” IEEE Transactions on Power Delivery, vol. 19, no. 1, pp. 272-278, Jan. 2004
[2]P. K. Dash and M. V. Chilukuri, “Hybrid S-Transform and Kalman Filtering for Detection and Measurement of Short
Duration Disturbances in Power Networks,” IEEE Transactions on Instrumentation and Measurement, vol. 53, no. 2, pp.
588-596, April 2004
[3]T. K. Abdel-Galil, M. Kamel, A. M. Youssef, E. F. El-Saadany, M. M. A. Salama, “Power Quality Classification Using
Inductive Inference Approach,” IEEE Transactions on Power Delivery, vol. 19. No. 4, pp. 1812-1818, Oct. 2004
[4]Haibo He and Janusz A. Starzyk , “A Self Organizing Learning Array System For Power Quality Classification Based on
Wavelet Transform,” IEEE Journals on Power Delivery, vol.21, no.1, pp. 286-295, Jan. 2006
[5]ÖmerNezihGerek and DoganGökhanEce, “Power-Quality Event Analysis Using Higher Order Cumulants and Quadratic
Classifiers,” IEEE Transactions on Power Delivery, vol. 21, no. 2, pp. 883-889, April, 2006
[6]InigoMonedero, Carlos Leon, Jorge Ropero, Antonio Garcia, Jose Manuel Elena, Juan C. Montano, “Classification of
Electrical Disturbances in Real Time Using Neural Networks,” IEEE Transaction on Power Delivery, pp. 1-9, September
2006
[7]ÖmerNezihGerek ,DoganGökhanEce and AtalayBarkana, “Covariance Analysis of Voltage Waveform Signature for
Power-Quality Event Classification,” IEEE Transactions on Power Delivery, vol. 21, no. 4, pp. 2022-2031, October 2006
[8]Fengzhan Zhao and Rengang Yang, “Power Quality Disturbance Recognition Using S-Transform,” IEEE Transactions on
Power Delivery, vol.22, no.2, pp. 944-950, April 2007
[9]S.Suja and Jovitha Jerome, “Power Signal Disturbance Classification Using Wavelet Based Neural Network,” Serbian
Journal Of Electrical Engineering, vol.4, no. 1, pp. 71-83, June 2007
[10]Mamun Bin IbneReaz, Florence Choong, MohdSahimanSulaiman, Faisal Mohd-Yasin and Masaru Kamada, “Expert
System for Power Quality Disturbance Classifier,” IEEE Transactions on Power Delivery, vol. 22, no. 3, pp. 1979-1988, July
2007
[11]Ameen A. Gargoom, NesimiErtugrul, Wen. L. Soong, “Automatic Classification and Characterization of Power Quality
Events,” IEEE Transactions on Power Delivery, vol. 23, no. 4, pp. 2417-2425, Oct. 2008
48

[12]SuryannarayanaChandaka, AmitavaChatterjee, SugataMunshi, “Support Vector Machine Employing Cross-
Correlation for Emotional Speech Recognition,” Elsevier System with Application 36 (2009) pp. 611-618
[13]Chiung-Chou Liao and Hong-Tzer Yang, “Recognizing Noise-Influenced Power Quality Events with Integrated Feature
Extraction and Neuro-Fuzzy Neworks,” IEEE Transactions on Power Delivery, vol. 24, no. 4, pp. 2132-2141, Oct. 2009
[14]P. Rajamani, DebangshuDey and SivajiChakravorti, “Cross-Correlation Aided Wavelet Network for Classification of
Dynamic Insulation Failures in Transformer Winding during Impulse Test,” IEEE Transactions on Dielectrics and Electrical
Insulation, vol. 18, no. 2, pp. 521-532, April 2011
[15]Chun-Yao Lee and Yi-Xing Shen, “Optimal Feature Selection for Power Quality Disturbances Classification,” IEEE
Transactions on Power Delivery, vol. 26, no. 4, pp. 2342-2351, October 2011
[16]S. Dalai, D. Dey, B. Chatterjee, S. Chakravorti and K. Bhattacharya, “Rough-Set Based Feature Selection and
Classification for Power Quality Sensing Device Employing Correlation Technique,” IEEE Sensors Journal, vol. 13, no. 2,
pp. 563-573, February 2013
[17]Milan Biswal and P. K. Dash, “Measurement and Classification of Simultaneous Power Signal Patterns With an S-
transform Variant and Fuzzy Decision Tree,” IEEE Transactions on Industrial Informatics, vol. 9, no. 4, pp. 1819-1827,
Nov. 2013
[18]Shufan He, Kaicheng Li and Ming Zhang, “A Real-Time Power Quality Disturbances Classification Using Hybrid
Method Based on S-transform and Dynamics,” IEEE Transactions on Instrumentation and Measurement, vol. 62, no. 9,
pp. 2465-2475, Sept. 2013
[19]Swati Banerjee and MadhuchhandaMitra, “Application of Cross-Wavelet Transform for ECG Pattern Analysis and
Classification,” IEEE Transactions on Instrumentation and Measurement, vol. 63, no. 2, pp. 326-333, February 2014
[20]Martin Valtierra-Rodriguez, Rene de Jesus Romero Troncoso, Roque Alfredo Osornio-Rios and Arturo Garcia Perez,
“Detection and Classification of Single and Multiple Power Quality Disturbances Using Neural Network,”IEEE
Transactions on Industrial Electronics, vol. 61, no. 5, pp. 2473-2482, May 2014
[21]S. Dalai, D. Dey, B. Chatterjee, S. Chakravorti and K. Bhattacharya, “Cross-Spectrum Analysis-Based Scheme for
Multiple Power Quality Disturbance Sensing Device,” IEEE Sensors Journal, vol. 15, no. 7, July 2015
[22]Zhigang Liu, Yan Cui and Wenhui Li, “A Classification Method for Complex Power Quality Disturbances Using EEMD
and Rank Based Wavelet,” IEEE Transactions on Smart Grid, vol. 6, no. 4, pp. 1678-1685, July 2015
49

APPENDIX 1
LIST OF FIGURES
Sl.
No.
Figure
Number
Figure Name Page No.
1 1 Voltage signal with sag 12
2 2 Voltage with Sag due to starting of induction motor 13
3 3 Voltage with Sag due to energizing of unloaded
transformer
14
4 4 Samples of voltage signal with sag 15
5 5 Voltage signal with Swell due to switching of large
charged capacitor
16
6 6 Samples of voltage signal with swell 17
7 7 Voltage signal with Harmonic 18
8 8 Samples of voltage signal with harmonic 19
9 9 Voltage signal with flicker 20
10 10 Samples of voltage signal with flicker 21
11 11 Voltage signal with notch 22
12
12 Samples voltage signal with notch 23
13
13 Voltage signal with oscillatory transient 24
14 14 Samples of voltage signal with oscillatory transient 25
15 15 Voltage signal with spike 26
16
16
Samples of voltage signal with spike 27
17 17 Voltage with interruption 28
50

18 18 Sample of voltage signal with interruption 29
19 19 Voltage signal with outage 30
20 20 Sample of voltage signals with temporary outage 31
21 21 Flowchart for generation of electrical disturbance signal and
formation of feature matrix
32
22 22 Plot of a typical cross-correlogram 35
23 23 Cross-correlogram of voltage sag signal 36
24 24 SVM divides space in 12D pertaining to each class of
disturbance
38
25 25 Basic architecture of PNN 41
26 26 Architecture of RADIAL BASIS NEURAL NETWORK (RBNN)
42
51

APPENDIX 2
LIST OF TABLES
Sl. No. Table No. Table Name Page No.
1 I MATHEMATICAL FORMULATION OF
DIFFERENT ELECTRICAL DISTURBANCE
SIGNAL
11
2 II FEATURE DESIGNATION OF DIRRENT
DISTURBANCE SIGNAL
36
3 III DESIGNATION OF ELECTRICAL DISTURBANCE 37
4 IV AVERAGE CLASSIFICATION
ACCURACY FOR ANN WITH 0db,
30db AND 50db NOISE
45
5
V
ARRANGEMENT OF AVERAGE
CLASSIFICATION ACCURACY
46
52


