Embed Size (px)
Citation preview
ARTICLE IN PRESS
Journal of Financial Economics 81 (2006) 255–281
0304-405X/$
doi:10.1016/j
$This pap
of the Banco
paper signific
seminar for t
Repullo. Com
and in the E
J. Dermine,
J. Segura for
Department
authors’ own�CorrespoE-mail ad
www.elsevier.com/locate/jfec
Determinants of collateral$
Gabriel Jimeneza, Vicente Salasa,b, Jesus Saurinaa,�
aBanco de Espana, C/Alcala 48, 28014 Madrid, SpainbUniversidad de Zaragoza, Spain
Received 12 December 2003; received in revised form 24 February 2005; accepted 17 June 2005
Available online 25 January 2006
Abstract
We estimate a comprehensive model of the determinants of collateral in loans extended to business
firms. We use a panel data on a sample of bank loans to Spanish firms from 1984 to 2002. Consistent
with theories that view collateral as a solution to adverse selection problems, our results provide
direct evidence of a negative association between collateral and a borrower’s risk. We also present
evidence on previously unexplored determinants of collateral such as credit market competition,
lender type, and the business cycle.
r 2005 Elsevier B.V. All rights reserved.
JEL classification: G21; D43; E32
Keywords: Collateral; Asymmetric information; Relationship banking; Competition; Business cycle
- see front matter r 2005 Elsevier B.V. All rights reserved.
.jfineco.2005.06.003
er is the sole responsibility of its authors and the views presented here do not necessarily reflect those
de Espana. We appreciate the detailed comments made by the referee, which helped us improve the
antly. Moreover, we thank everyone at a Centro de Estudios Monetarios y Financieros (CEMFI)
heir numerous comments and suggestions, in particular, M. Arellano, S. Bentolila, O. Bover, and R.
ments from participants at the Second International Conference on Credit Risk held at Montreal
uropean Finance Association meetings held in Maastrich, in particular, those from E. Altman,
M. Levonian, and K. Roszbach were likewise gratefully received. We also thank A. Almazan and
their very detailed comments on previous drafts, as well as our colleagues at the Financial Stability
at Banco de Espana for their helpful suggestions. Any errors that remain are, however, entirely the
.
nding author. Tel.: +3491 3385080; fax: +34 91 3386104.
dress: [email protected] (J. Saurina).
ARTICLE IN PRESSG. Jimenez et al. / Journal of Financial Economics 81 (2006) 255–281256
1. Introduction
What determines the use of collateral in credit contracts? Drawing from current theories,we examine this question empirically by hypothesizing that the use of collateral is afunction of characteristics of the borrower (credit quality), the lender (specialization), thecredit market (competition), the nature of the borrower–lender relationship (duration), theloan (size), and macroeconomic conditions (business cycle). We test our comprehensivespecification of the determinants of collateral with panel data on financial loans extendedto business firms by Spanish banks from 1984 to 2002. Thus, our test control for borrowerfixed effects and for time-varying factors such as macroeconomic conditions. Thanks to aunique data set, we are able to examine as-of-yet-unexplored determinants of collateral,and we provide a new, sharper test of the relation between collateral use and a borrower’scredit risk.1
Collateral requirements are common terms in loan contracts, together with the interestrate, maturity, and size and possible covenants. Credit market research explains the use ofcollateral as a consequence of adverse selection (Bester, 1985; Chan and Kanatas, 1985;Besanko and Thakor, 1987a, b), and/or moral hazard (Boot et al., 1991), which problemsarise in transactions between borrowers and lenders. The nature of the borrower–lenderrelationshipo, i.e., transactional or relationship lending (Sharpe, 1990; Rajan, 1992), thelevel of competition in the credit market (Besanko and Thakor, 1987a), and the net cost(benefits) of a thorough screening of borrowers (Manove and Padilla, 1999, 2001) can alsoexplain why some loans are secured whereas others are granted without collateral.Moreover, theories that relate the use of collateral to credit market competition and to
other determining factors have not yet been empirically tested. Little is known about howmacroeconomic conditions (the business cycle and the risk-free interest rate) affect the useof collateral in business loans. Finally, the empirical literature has not yet settled importantissues such as whether collateral signals a riskier or a safer loan, or whether relationshipincreases or decreases the requirements for obtaining a loan.The data we use is the Credit Register database of Banco de Espana, which allows us to
group borrowers into three risk classes according to their public record in the Register.Specifically, these three groups comprise those borrowers that have a loan in default at thetime they obtain a new one, those that do not have a loan in default at the time the newloan is granted but that do default in the near future, and all other borrowers. Thisgrouping of borrowers provides the appropriate setup for testing the theories that link theuse of collateral to the credit risk of the borrower and to information conditions in thecredit market. For the group that has a public record of a past default, and thus has lowcredit quality, theory predicts that the likelihood of these borrowers pledging collateral isthe highest among all borrowers (Berger and Udell, 1990; Boot et al., 1991). For thoseborrowers with no record of default when they obtain a loan their credit quality, which canbe high or low, can be observed or it may be private information. In the case of observedcredit quality, the likelihood of collateral will be higher for low-quality borrowers than for
1Note that we focus only on external collateral, i.e., the assets pledged to secure the loan that are external to the
firm, because casual observation of the data suggests that this is the most frequent form of collateral. However, we
do not know the precise nature of the collateral, and we cannot rule out the possibility that, in some cases,
collateral is internal to the firm. While, the use of internal collateral is useful in solving asset-substitution problems
(Smith and Warner, 1979) and Mayers’s under investment problem (Stulz and Johnson, 1985), internal collateral
can only be effective if its value can be monitored (Rajan and Winton, 1995).
ARTICLE IN PRESSG. Jimenez et al. / Journal of Financial Economics 81 (2006) 255–281 257
high-quality borrowers (those that are not likely to default) and will be similar to thatobserved for the group with a default record at the time the loan is granted.
However, if credit quality is private information, then the theory of collateral predictsthat borrowers who consider themselves to be of high credit quality will use collateral tosignal their quality and thereby secure a lower interest rate on their loans (Bester, 1985;Chan and Kanatas, 1985; Chan et al., 1986; Besanko and Thakor, 1987a, b). Thus, withinthe group of borrowers of unknown credit quality (those with no loans in default whenthey receive a new loan), the use of collateral will be more likely to be pledged by high-quality borrowers (those that do not default in the next period) than by low-qualityborrowers (those that do default next period). This means that to the extent that collateralserves as a signal of credit quality, the likelihood of collateral use among borrowers thatdefault one year after the loan was granted is expected to be lower than that among theborrowers that do not default.
We find that the likelihood of collateral usage is higher both among borrowers who have aloan in default prior to obtaining a new loan and among borrowers who default after receivingthe loan than it is among borrowers that do not default before or after receipt of the loan. Thisresult confirms that observed risk matters in decisions about the terms of a loan. But we alsofind, however, that among borrowers that default after the current loan is granted, theincremental likelihood of their pledging collateral (relative to the likelihood of collateral useamong borrowers who do not default) increases with the age of the borrower. Moreover,among younger borrowers, the likelihood of pledging collateral is lower within the group ofborrowers that default after the current loan is granted than it is among those that do notdefault. As expected, the lender’s ability to estimate borrower risk is better for older borrowers.The possibility of using collateral to signal credit quality therefore occurs mainly among youngborrowers who have no previous record of financial or commercial activity; this is the groupfor which the asymmetric information effect is likely to be the strongest. Our paper is the firstto present empirical evidence in support of theories that explain collateral as a signal of aborrower’s credit quality, and as a solution to adverse selection problems in credit markets.
The structure of the paper is as follows. Section 2 describes our empirical model of thedeterminants of collateral usage in loans, and presents our main hypotheses, which arebased on previous theoretical models and empirical research. In Section 3 we describe thedata, variables, and method we use to test the main hypotheses. We present the results ofour empirical analysis in Section 4, and Section 5 concludes.
2. Empirical model and main hypotheses
Theories of collateral analyze the information asymmetries that arise between borrowersand lenders, the costs and benefits of relationship lending, the competitive conditions in thecredit market, the inclination of lenders to substitute collateral for a thorough screening ofthe borrower, and the characteristics of the loan. Taking all of this into account, weformulate the following empirical model on the use of collateral:
PrðCollateralijklt ¼ 1Þ ¼ F ða0 þ a1Defaultlt�1 þ a2Defaultltþ1
þ a3Defaultltþ1 x Age as Borrowerlt�1
þ a4Durationjlt�1 þ a5Defaultl;t�1 x Durationjlt�1
þ a6Scopejlt�1 þ a7Number of Lenderslt�1
ARTICLE IN PRESSG. Jimenez et al. / Journal of Financial Economics 81 (2006) 255–281258
þ a8Herfidahlkt þ a9Herfindahlkt x Durationjlt�1
þ a10Specializationjt þ a11Size of Lenderjt
þ a12Bankj þ a13Control Variablesijklt þ ZlÞ, ð1Þ
where i, j, k, l, and t denote the loan, bank, market, firm (borrower), and time period(year), respectively, Zl represent borrower fixed effects, F(.) is the logistic distributionfunction and Collateralijklt is a dummy variable that takes a value of one if the loan hascollateral, and zero otherwise. We define each of the variables in Eq. (1) as we develop ourhypotheses. Note that this model captures the predictions from the theory.We now present our hypotheses:
Hypothesis 1 (H1). The likelihood of using collateral in loans is higher among borrowerswith observed lower credit quality.
Boot et al. (1991) show that when lenders can observe a borrower’s credit quality, low-quality borrowers obtain loans with collateral and high-quality borrowers obtain loanswithout having to pledge collateral. In Eq. (1), the variable DEFAULTlt�1 is a dummy thattakes the value of one when, according to the Credit Register, the borrower who is granteda loan has a loan in default at the beginning of the year, and zero otherwise. We define thevariable in this way because the information that lenders receive from the Credit Registeronly consist of the number of loans the borrower has in default at the time of the inquiry.Thus, we predict a positive coefficient for a1.
Hypothesis 2 (H2). Among borrowers whose credit quality is private information (i.e.,unobserved), the likelihood of using collateral is higher among those of higher creditquality.
We base this hypothesis on the use of collateral as a signal of high credit quality insituations of adverse selection in which borrowers know their credit quality but lenders donot (Bester, 1985; Chan and Kanatas, 1985; Besanko and Thakor, 1987a). To test thisprediction, we require information on the ex post credit quality of the borrowers. Weproxy for this information using the variable DEFAULTlt+1, which takes the value of oneif a borrower did not have a loan in default in t�1 but defaults in t+1, and zero otherwise.This variable allows us to identify those borrowers with no defaults when they obtain aloan but that default after obtaining the loan. If high-quality borrowers use collateral tosignal credit quality in t, then we expect a negative sign for a2, the coefficient onDEFAULTlt+1, since collateral theory predicts that low-quality borrowers are less likely topledge collateral than are high-quality borrowers. The drawback of this test is that we donot know if borrowers that default in t+1 belong to the observed risk group or to theprivate information group. Most likely, there will be a mix of the two situations, with thesign of the coefficient on DEFAULTlt+1 depending on which proportion of casespredominates.To address the above ambiguity, we introduce AGE AS BORROWERlt�1, which we
define as the number of years since the borrower obtained its first registered loan, as of thebeginning of the year in which the loan is made. This measure can identify borrowerssorted by observed risk or private information. Ideally, the age variable should be thenumber of years since the firm was created; however, this information is not available inthe database. Note that AGE AS BORROWERlt�1 coincides with the age of the firm if thefirm gets a loan, and thus is registered in the CIR database, in the year it is created.
ARTICLE IN PRESSG. Jimenez et al. / Journal of Financial Economics 81 (2006) 255–281 259
Otherwise, it is a lower bound of the firm’s age. We prefer this variable to, for instance, thenumber of years since the borrower has been with the bank that grants the loan,DURATION, because the borrower could have had previous relationships with otherbanks.
We develop our prediction for AGE AS BORROWERlt�1 as follows. Young borrowersstart with scant information in their commercial and financial records, but as time goes by,information accumulates that can be used by lenders to update their credit qualityassessments (e.g., Diamond, 1991). Since private information is more likely to prevailamong young borrowers, the use of collateral to signal credit quality will be more frequentamong young borrowers than among old borrowers. Thus, as borrowers age the likelihoodof being classified as more or less risky increases.
Accordingly, our hypothesis is that within the group that defaults in t+1, theproportion of borrowers sorted by observed risk in t should increase with the age of theborrower, that is, the coefficient on DEFAULTt+1 is not constant, but rather increasingwith borrower age. Therefore, in model (1), the coefficient on DEFAULTt+1 is written asa2+a3 AGE AS BORROWER. If the data support these predictions, then we expect to finda negative sign for a2, as we discuss above, and a positive sign for a3.
Turning now to our next set of hypotheses, loan maturity is also an indicator of loansmade according to the differences in private information. We expect the informationadvantage of the borrower over the lender to be higher for long-term loans than for short-term loans, since the lender is less forward-looking than the borrower, who will use thelong-term loan to finance a long-term project. In our empirical analysis, we classify loansas short- and long-term loans. We expect that the results that pertain to privateinformation compared to those that pertain to observed risk will be more relevant to long-term loans than to short-term loans.
Hypothesis 3a (H3a). The likelihood of using collateral decreases with the duration ofborrower–lender relationship if the benefits of relationship lending dominate, and increaseswith the duration of the relationship if the cost of the ‘‘hold-up’’ problem associated withrelationship lending dominate.
The above hypothesis summarizes the predictions in studies on relationship lending(Boot, 2000; Berger and Udell, 2002) on the likelihood of collateral. In addition, Boot et al.(1991) observe that collateral can be a solution to problems of moral hazard, and Boot andThakor (1994) show that repeated interactions between borrowers and lenders help tobuild trust and reduce moral hazard. From these predictions the sign of a4, the coefficienton DURATIONjlt�1, which equals the number of years the lender has had a relationshipwith the borrower who receives the loan, should be negative. On the other hand, a longerduration can be associated with a higher likelihood of collateral use, i.e., positive a4, iflonger-term relationships reflect more severe hold-up problems (Greenbaum et al., 1989;Sharpe, 1990; Rajan, 1992; Farinha and Santos, 2002). The empirical results will tell uswhich of the above two situations prevails in the data.
Hypothesis 3b (H3b). On the one hand, if a longer borrower–lender relationshipcontributes to the development of trust, then duration will be negatively related to thelikelihood of collateral usage for all borrowers. On the other hand, if a longer relationshipsimply means that lenders can more accurately sort borrowers by credit quality, then the
ARTICLE IN PRESSG. Jimenez et al. / Journal of Financial Economics 81 (2006) 255–281260
likelihood of using collateral will be independent of duration for borrowers whose creditquality is known at the time of the loan.
An increase in the length of the borrower–lender relationship can decrease the likelihoodof collateral use because it facilitates builds trust (Boot and Thakor, 1994). Alternatively,Berger and Udell (1995) argue that the likelihood of using collateral decreases with theduration of a relationship because lenders collect better information about borrowers andthus can more properly sort them in terms of credit quality.2 Note, however, that bettersorting is relevant only for those borrowers whose credit quality is not known at the timethe loan is granted. Borrowers that have a loan in default at the time they receive a newloan are known to have low credit quality, in which case, under the better sortingexplanation, the likelihood of collateral use will be independent of DURATIONjlt�1 forthese borrowers. Hypothesis 3b determines which of these explanations prevails.In model (1) the coefficient on DURATIONjlt�1 is written as a function of
DEFAULTt�1: a4+a5DEFAULTt�1. Under the Berger and Udell (1995) explanation ofthe advantages of relational lending, the coefficient on DURATION is zero whenDEFAULTt�1 ¼ 1 and the prediction is a4 þ a5 ¼ 0. If longer relationships also build trust(Boot and Thakor, 1994), however, then a4+a5 will be still be negative, as trust is expectedto lower the likelihood of collateral to all borrowers.
Hypothesis 4a (H4a). The likelihood of using collateral decreases with the concentration ofthe credit market.
Besanko and Thakor (1987b) show that Competition lowers the rents of lenders in allthe states of the world, and suggest that the use of collateral is more likely withcompetition than monopoly. Accordingly, we assume that credit market concentrationreduces competition among lenders. Thus, this hypothesis summarizes the effects of creditmarket competition on the use of collateral. If competition is inversely related toconcentration, then coefficient a8 on the Herfindahl index of concentration, HERFIN-
DAHLkt, will be negative.3
Hypothesis 4b (H4b). The reduction in the likelihood of using collateral as a result oflonger borrower–lender relationships will be higher (lower) in more concentrated marketsif the value of information obtained in the relationship decreases (increases) withcompetition in the credit market.
Competition shortens the borrower–lender relationship and reduces the incentives toinvest in information (Chan et al., 1986; Diamond, 1991; Petersen and Rajan, 1995).However, Boot and Thakor (2000) argue that banks respond to greater competition bydeveloping closer relationships with their clients, increasing differentiation and loyalty.If the value of the investment in borrower-specific information decreases with
competition, the same duration will imply more investment and lower likelihood ofcollateral in more concentrated credit markets. However, if competition and the incentivesto differentiation foster this investment, the reverse will be true. The variable
2Diamond (1991) and Petersen and Rajan (1994) present models in which the loan’s interest rates decrease over
time as lenders learn more about the attributes and decisions of the borrowers. Their results can be partially
extended to the case of collateral.3Inderst and Muller (2004) offer an additional explanation of why credit market competition increases the
likelihood of collateral use.
ARTICLE IN PRESSG. Jimenez et al. / Journal of Financial Economics 81 (2006) 255–281 261
HERFINDAHLkt x DURATIONjlt�1 accounts for this cross-effect in the empirical model.A negative sign for a9 would support the theories that predict higher investment inrelationship-specific information in less competitive, more concentrated credit markets,since the same duration would result in a greater reduction in the likelihood of collateraluse in highly concentrated credit markets than in less concentrated credit markets.However, a positive sign would support Boot and Thakor’s (2000) prediction that in morecompetitive markets, banks invest more to increase customer loyalty.
Hypothesis 5 (H5). The use of collateral requirements in loans will be more likely if theloan is granted by a lender with a low level of expertise in evaluating loan applications.
Banks with less expertise (in particular, new product or regional market entrants) andfewer resources for evaluating the economic risk of a loan will have a greater incentive touse collateral as a substitute for such evaluation (Manove and Padilla, 1999, 2001).Moreover, may exist differences in lending practices across financial intermediaries, giventheir specialization (Carey et al., 1998) and their ownership structure (Saunders et al., 1990;Gorton and Rosen, 1995).
Our sample banks reflect different degrees of specialization and vary in size and type(commercial compared to savings bank). Larger banks and those that specialize more inbusiness loans should have a comparative advantage in terms of evaluating borrower risk.Thus, we expect that such banks will rely on collateral less than will other banks, implyinga negative sign for the coefficients of the variables SPECIALIZATIONjt, a10, and SIZE
OF THE LENDERjt, a11.Savings banks, traditionally providing loans to households, have only recently expanded
into business loans. Moreover, savings banks are generally more conservative institutions,since they are under the control of their managers and workers who are interested inavoiding possible financial distress and keeping their jobs. The probability of usingcollateral in a loan should, therefore, be higher among savings banks than amongcommercial banks. For this reason, we expect to find a negative coefficient on the variableBANKj, a12, which takes the value of one if the lender is a commercial bank and zerootherwise.
Hypothesis 6 (H6). The amount of collateral in a loan will increase with the risk-freeinterest rate and decrease with the size of the loan.
This hypothesis concerns the amount of collateral required, once the decision to pledgecollateral is already made. Boot et al. (1991) show that under moral hazard, once thelender chooses to ask for collateral, the amount of collateral increases with the real interestrate and decreases with the size of the loan and with a reduction in the dissipative cost ofthe collateral. Allowing the increase in the risk-free real interest rate to translate into ahigher collateral requirement rather a higher interest rate on the loan helps to reduce theagency costs of the transaction. Loans of a larger size reduce the amount of collateralbecause they imply a higher payoff for the lender in the good states of the world. We knowof no previous empirical work, however, that uses loan-level data to explain the amount ofcollateral.
In assigning control variables, little is known about the impact of macroeconomicconditions, such as the business cycle or monetary policy on the decision to pledgecollateral, and we know of no previous empirical work on these potential determinantsof the use of collateral. We introduce gross domestic product growth, GDP GROWTH,
ARTICLE IN PRESSG. Jimenez et al. / Journal of Financial Economics 81 (2006) 255–281262
and the real interest rate, REAL INTEREST RATE, to account for macroeconomicconditions.The duration of the relationship of the borrower with a particular bank,
DURATIONjlt�1, is jointly determined with the number of operations a borrower haswith the bank, SCOPEjlt�1, and with the number of banks with which the borrower isworking, NUMBER OF LENDERSlt�1. Thus, we test the hypothesis on the variableDURATIONjlt�1 controlling for the variables SCOPEjlt�1 and NUMBER OF
LENDERSlt�1. In principle, more loans with the same bank imply more relationshipsand in turn more opportunities for the lender to improve its knowledge of the borrower.As the number of banks a borrower works with increases, the relationship with each bankwill become weaker, thereby reducing the value of any individual bank’s investment ininformation (Thakor, 1996). From these arguments we might expect a negative coefficientfor SCOPEjlt�1 and a positive coefficient for NUMBER OF LENDERSlt�1 if the benefitsof relationship lending are higher than the costs. However, these two variables can berelated to other unobserved borrower characteristics, such as credit quality (Petersen andRajan, 1994) or availability of assets to be used as collateral (Farinha and Santos, 2002).Therefore, the specific predictions on these variables require a deeper analysis than ispossible in this paper.The borrower’s debt, DEBTlt�1, at the time the new loan is granted is a control variable
to account for the size of the borrower. Given a loan’s SIZE, DEBTlt�1 also indicates alender’s relative increase in credit risk. We also include the controls PROVINCEk andGEOGRAPHIC RISKkt�1 in our model, because many borrowers conduct business inlocal markets. Specifically, PROVINCEk is a dummy variable for each of the 50 Spanishprovinces, and GEOGRAPHIC RISKkt�1 is the proportion of bad loans over total loans inthe province at the time the new loan is granted. Differences in technology, production,and marketing conditions across industries might at least partially account for possibledifferences in the risk of projects financed with the new loan, and for differences inborrowers’ economic risks. The dummy variable INDUSTRY controls for these effects foreach of the 11 industries in which firms are grouped.The observable characteristics of the borrowers (business firms) in the sample are limited
to total bank debt, the number of years in the Credit Register, and the record of defaults.We cannot observe variables such as total assets, number of years since the firm wascreated, accounting statements, credit ratings, training and experience of the managementteam, assets that can be pledged as collateral, etc. Since these omitted variables might becorrelated with our model’s explanatory variables of the collateral decision, it is importantto control for unobserved fixed borrowers’ effects in the estimation of model (1). We,therefore, include these fixed effects among the explanatory variables of the model.
3. Database and methodology
Most of the data we use to test the hypotheses above come from the Credit Register ofBanco de Espana (CIR). The CIR database contains detailed monthly information on allloans over h6,000 granted by any credit institution in Spain. Reporting institutions thatwish to study the credit record of any applicant have access to the CIR database, but onlyat an aggregate level and without the possibility to obtain the borrower’s history. For eachloan, the CIR registers information on the instrument type, currency, maturity, collateral,default situation, and amounts drawn and available. The CIR also records characteristics
ARTICLE IN PRESSG. Jimenez et al. / Journal of Financial Economics 81 (2006) 255–281 263
of the borrower, namely, whether it is a person or a firm, and the borrower’s industry (forfirms) and province. We are also able to determine whether the loan uses collateral, and ifit does, whether it is fully secured (i.e., 100% collateralized) or partially secured (between50% and 100% collateralized).
For each year between December 1984 and December 2002, we focus on all newfinancial loans4 granted to firms by any Spanish commercial or savings bank (95% marketshare among credit institutions), which result in approximately two million loans. Weconcentrate only on financial loans and exclude other types of debt (such as commercialloans, leases, factoring operations, and off-balance sheet commitments) because we wish toensure homogeneity in the conditions of the loan transaction. Previous research (e.g.Berger and Udell, 1995), finds that loan terms can differ depending on the type ofoperation, even if the transactions are between the same borrowers and lenders. The CIRdatabase does not have a code for each loan. Thus, it is difficult to track a loan over time.Since we wish to know the precise year in which the loan was granted, we limit our finalsample to those loans for which we can estimate the year it was made. We exclude loansthat mature in less than one year because it is impossible to know whether such facilitiesare new or an extension of a loan made in the past.
We estimate Eq. (1) using a logit model with fixed effects. The econometric procedure weuse to introduce borrower fixed effects (Greene, 1993) is based on a conditional likelihoodapproach implemented in a logit model in which it is possible to find a sufficient statisticfor the fixed effect. After conditioning on this statistic, our results have properties similarto those that obtain by differentiating the data in conventional time and cross-sectionaldata panels. Specifically, we write the model as
PrðCollaterallt ¼ 1jxl1; . . . ;xlT ; ZlÞ ¼expðxltbþ ZlÞ
1þ expðxltbþ ZlÞ, (2)
where Zl denotes the borrower-specific effect.The logit model with borrower-specific effects works for samples in which each
individual has at least a collateralized loan and loan without collateral. This constraintreduces the sample of observations in relation to the entire available population of loans.Nevertheless, the number of usable observations is around 550,000 loans.
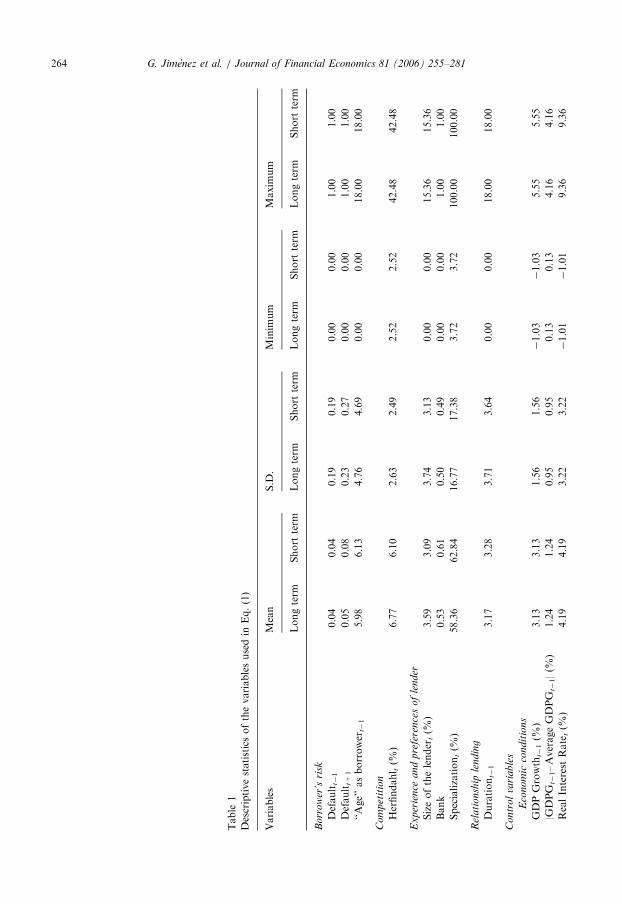
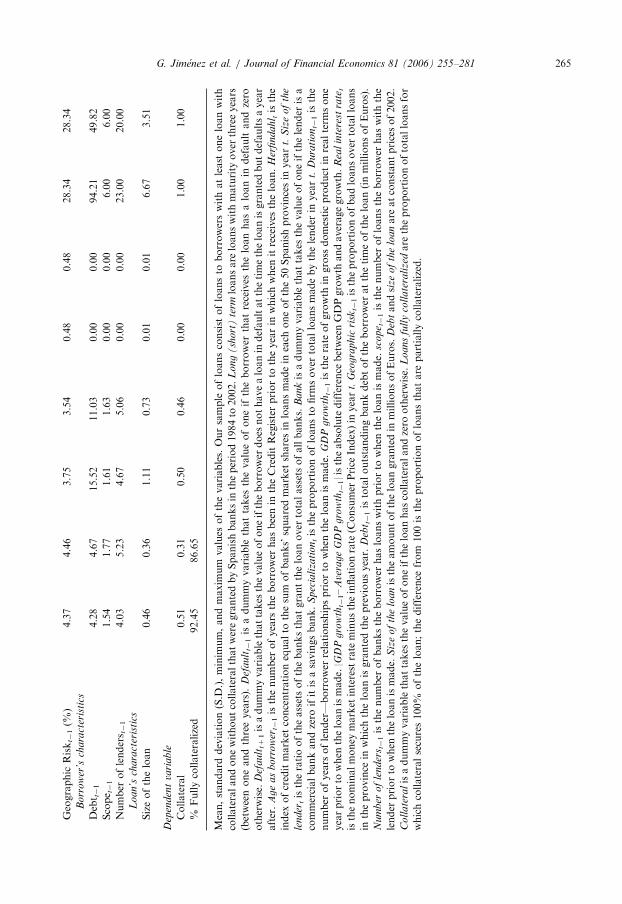
Table 1 presents summary statistics for the dependent and explanatory variables of themodel that we obtain from the sample of usable observations. We present separatestatistics for long-term loans (maturity over three years), which account for almost 80% ofthe sample, and for short-term loans (less than three years). We winsorize the primary dataso that we can substitute the values of the continuous variables above (below) the 99th(1st) percentile with the respective percentile values of the variable. The statisticscorrespond to the winsorized data.
The average size of the loan in the short-term group is 70% of that in the long-termgroup. This result is as might be expected given that short-term loans can be renewed overtime. Commercial banks typically offer a greater proportion of short-term loans then dosavings banks, while the reverse is true for long-term loans. The variables DURATIONjlt�1
and AGE AS BORROWERlt�1 show similar patterns for short- and long-term loans. The
4Financial loans are 60% of the total number of loans in the CIR. We do not know whether the loan is
effectively committed, but commitments are very rare in Spain (i.e., commitments are usually unilaterally
cancelable by the bank).
ARTICLE IN PRESS
Table
1
Descriptivestatisticsofthevariablesusedin
Eq.(1)
Variables
Mean
S.D
.Minim
um
Maxim
um
Longterm
Short
term
Longterm
Short
term
Longterm
Short
term
Longterm
Short
term
Borr
ow
er’s
risk
Default
t�1
0.04
0.04
0.19
0.19
0.00
0.00
1.00
1.00
Default
t+1
0.05
0.08
0.23
0.27
0.00
0.00
1.00
1.00
‘‘Age’’asborrower
t�1
5.98
6.13
4.76
4.69
0.00
0.00
18.00
18.00
Co
mp
etit
ion
Herfindahl t(%
)6.77
6.10
2.63
2.49
2.52
2.52
42.48
42.48
Ex
per
ience
and
pre
fere
nce
sof
lender
Sizeofthelender
t(%
)3.59
3.09
3.74
3.13
0.00
0.00
15.36
15.36
Bank
0.53
0.61
0.50
0.49
0.00
0.00
1.00
1.00
Specialization
t(%
)58.36
62.84
16.77
17.38
3.72
3.72
100.00
100.00
Rel
ati
onsh
iple
ndin
g
Duration
t�1
3.17
3.28
3.71
3.64
0.00
0.00
18.00
18.00
Co
ntr
ol
vari
ab
les
Eco
nom
icco
nd
itio
ns
GDPGrowth
t�1(%
)3.13
3.13
1.56
1.56
�1.03
�1.03
5.55
5.55
|GDPG
t�1–AverageGDPG
t�1|(%
)1.24
1.24
0.95
0.95
0.13
0.13
4.16
4.16
RealInterest
Rate
t(%
)4.19
4.19
3.22
3.22
�1.01
�1.01
9.36
9.36
G. Jimenez et al. / Journal of Financial Economics 81 (2006) 255–281264
ARTICLE IN PRESSGeographic
Risk
t�1(%
)4.37
4.46
3.75
3.54
0.48
0.48
28.34
28.34
Bo
rro
wer
’sch
ara
cter
isti
cs
Debt t�1
4.28
4.67
15.52
11.03
0.00
0.00
94.21
49.82
Scope t�1
1.54
1.77
1.61
1.63
0.00
0.00
6.00
6.00
Number
oflenders t�1
4.03
5.23
4.67
5.06
0.00
0.00
23.00
20.00
Lo
an
’sch
ara
cter
isti
cs
Sizeoftheloan
0.46
0.36
1.11
0.73
0.01
0.01
6.67
3.51
Dep
end
ent
vari
ab
le
Collateral
0.51
0.31
0.50
0.46
0.00
0.00
1.00
1.00
%Fullycollateralized
92.45
86.65
Mean,standard
deviation(S.D
.),minim
um,andmaxim
um
values
ofthevariables.Oursample
ofloansconsist
ofloansto
borrowerswithatleast
oneloanwith
collateralandonewithoutcollateralthatweregrantedbySpanishbanksin
theperiod1984to
2002.
Lo
ng
(sh
ort
)te
rmloansare
loanswithmaturity
over
threeyears
(betweenoneandthreeyears).
Def
au
ltt�
1is
adummyvariable
thattakes
thevalueofoneiftheborrower
thatreceives
theloanhasaloanin
defaultandzero
otherwise.
Def
au
ltt+
1isadummyvariablethattakes
thevalueofoneiftheborrower
does
nothavealoanin
defaultatthetimetheloanisgrantedbutdefaultsayear
after.
Ag
ea
sb
orr
ow
ert�
1isthenumber
ofyears
theborrower
hasbeenin
theCreditRegisterpriorto
theyearin
whichwhen
itreceives
theloan.
Her
fin
da
hl tisthe
index
ofcreditmarket
concentrationequalto
thesum
ofbanks’squaredmarket
sharesin
loansmadein
each
oneofthe50Spanishprovincesin
year
t.S
ize
of
the
len
der
tistheratiooftheassetsofthebanksthatgranttheloanover
totalassetsofallbanks.
Ba
nkisadummyvariablethattakes
thevalueofoneifthelender
isa
commercialbankandzero
ifitisasavingsbank.
Sp
ecia
liza
tio
ntistheproportionofloansto
firm
sover
totalloansmadebythelender
inyear
t.D
ura
tio
nt�
1isthe
number
ofyears
oflender—
borrower
relationshipspriorto
when
theloanismade.
GD
Pg
row
tht�
1istherate
ofgrowth
ingross
domesticproduct
inrealterm
sone
yearpriorto
when
theloanismade.|G
DP
gro
wth
t�1–
Ave
rag
eG
DP
gro
wth
t�1|istheabsolute
difference
betweenGDPgrowth
andaveragegrowth.
Rea
lin
tere
stra
tet
isthenominalmoney
market
interestrate
minustheinflationrate
(Consumer
Price
Index)in
year
t.G
eogra
ph
icri
skt�
1istheproportionofbadloansover
totalloans
intheprovince
inwhichtheloanisgrantedthepreviousyear.
Deb
t t�1istotaloutstandingbankdebtoftheborrower
atthetimeoftheloan(inmillionsofEuros).
Nu
mb
ero
fle
nd
ers t�1isthenumber
ofbankstheborrower
hasloanswithpriorto
when
theloanismade.
sco
pe t�1isthenumber
ofloanstheborrower
haswiththe
lender
priorto
when
theloanismade.
Siz
eo
fth
elo
anistheamountoftheloangrantedin
millionsofEuros.
Deb
tandsi
zeo
fth
elo
anare
atconstantpricesof2002.
Co
lla
tera
lisadummyvariablethattakes
thevalueofoneiftheloanhascollateralandzero
otherwise.
Loans
full
yco
llate
rali
zedare
theproportionoftotalloansfor
whichcollateralsecures100%
oftheloan;thedifference
from
100istheproportionofloansthatare
partiallycollateralized.
G. Jimenez et al. / Journal of Financial Economics 81 (2006) 255–281 265
ARTICLE IN PRESSG. Jimenez et al. / Journal of Financial Economics 81 (2006) 255–281266
proportion of borrowers with a loan in default at the time they obtain a new loan,DEFAULTlt�1, is 4% for both long- and short-term loans. Among those borrowers thatare not in default when they obtain a short-term loan, 5% (8%) default in the followingyear if the last loan is a long-term (short-term) loan. Finally, the proportion of loans withcollateral is 30.5% in short-term loans and 50.8% for long-term loans.5 The differences wefind between the terms and characteristics of loans of different maturity suggest that topreserve homogeneity, we should estimate model (1) separately for each maturity.The model that tests the predictions on the amount of collateral, partial or total, is a
multinomial logit model in which the dependent variable falls under one of threecategories: no collateral, partial collateral (i.e., more than 50% of the loan is secured), andtotal collateral (i.e., 100% secured).6
Because we expect decreasing marginal effects on the impact of each variable in theprobability of collateral use in a particular loan, DEBT, AGE AS BORROWER,DURATION, SCOPE, NUMBER OF LENDERS, and SIZE OF THE LOAN enter intothe models in natural logs.7
4. Empirical results
4.1. The use of collateral
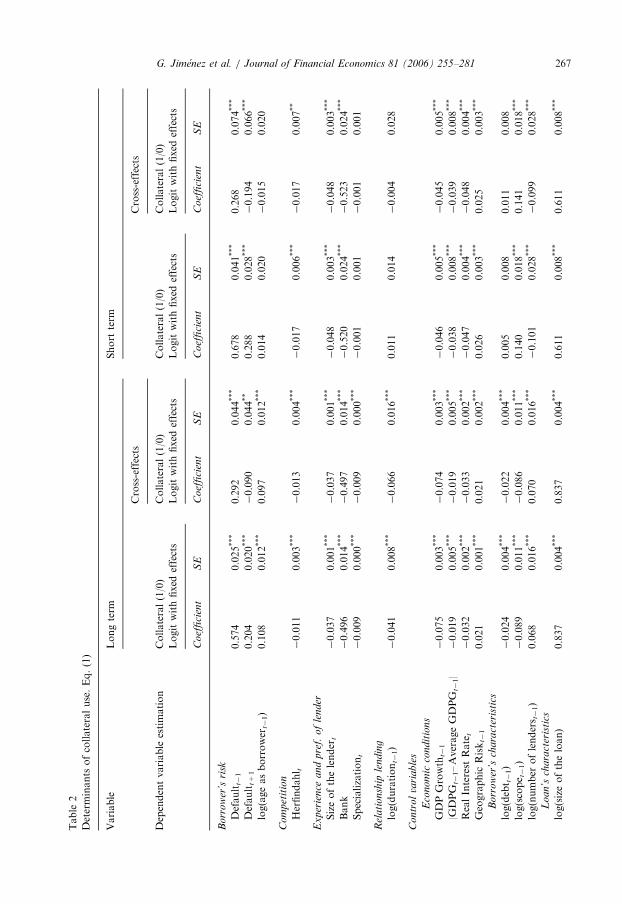
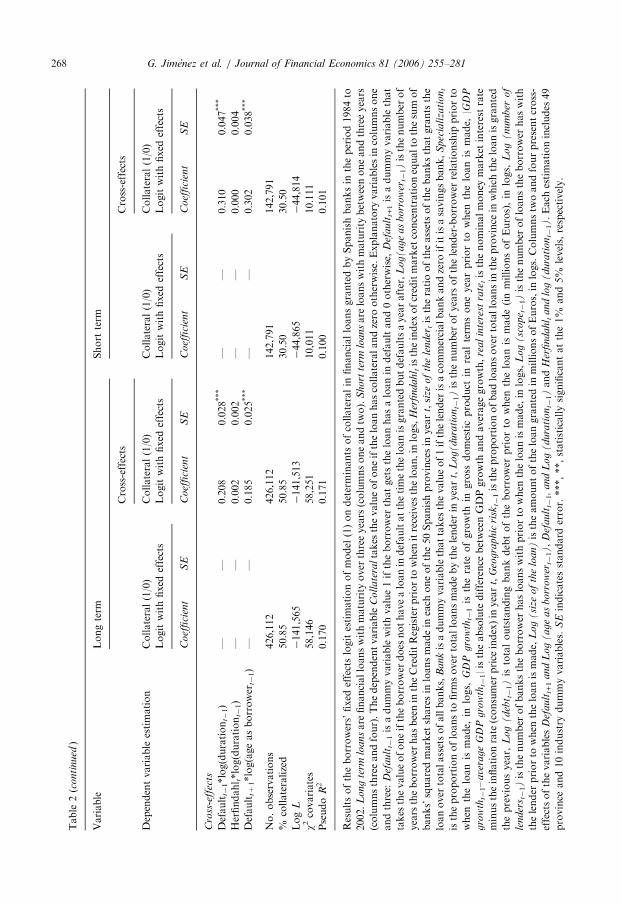
Table 2 shows the fixed effects logit model estimations of model (1) for both long-(columns one and two) and short-term (columns three and four) loans. The null hypothesisof borrowers’ fixed effects in the explanation of the use of collateral cannot be rejected. Inboth cases, the Hausman test of fixed versus random effects rejects the null hypothesis of anon-systematic difference in coefficients with a p-value of zero.The positive and significant coefficient of DEFAULTt�1 in all estimations confirms H1.
Borrowers with lower credit quality are more likely to pledge collateral to obtain a loanthan are other borrowers. Since information on the borrower’s record in the CreditRegister is available to all lenders, it is realistic to assume that the bank that grants the loanin year t knows the borrower’s record. Therefore, all borrowers for whom DEFAULTt�1
takes the value of one reasonably belong to the group with lower credit quality.
5It is interesting to compare data above with the data presented by Berger and Udell (1995) for the U.S., and by
Harhoff and Korting (1998) for Germany, bearing in mind that these two papers deal only with credit line data. In
the U.S. sample, 53% of the loans have collateral while in the German sample this figure is 62%. In the U.S., 78%
of the time borrowers obtain their line of credit from the bank with which they first engaged in their activity (11.4
years of DURATION and 14.1 years of AGE AS BORROWER), while for the German sample the percentage is
70% (12 and 17.5 years, respectively). In our sample AGE AS BORROWER is the time since each borrower
obtains its first loan, and the ratio of loyalty to the lender is 53% (3.2 of DURATION over 6 of AGE AS
BORROWER). Almost 30% of the firms in the German sample had been in financial distress during the past five
years, while the average number of lenders with which they have relationships with is 1.82. The German and U.S.
samples consider only small firms, while we have the population of Spanish firms as well as the whole population
of financial loans.6We note that when one or more of the explanatory variables is endogenous, for example, loan SIZE, the most
appropriate model to use is the probit model. Our use of the multinomial logit model here should be taken as an
approximation.7Except for SIZE OF THE LOAN, we add one to all these variables before we take logs in order to avoid the
variable approaching �N.
ARTICLE IN PRESSTable
2
Determinants
ofcollateraluse.Eq.(1)
Variable
Longterm
Short
term
Cross-effects
Cross-effects
Dependentvariable
estimation
Collateral(1/0)
Collateral(1/0)
Collateral(1/0)
Collateral(1/0)
Logitwithfixed
effects
Logitwithfixed
effects
Logitwithfixed
effects
Logitwithfixed
effects
Co
effi
cien
tS
EC
oef
fici
ent
SE
Co
effi
cien
tS
EC
oef
fici
ent
SE
Borr
ow
er’s
risk
Default
t�1
0.574
0.025***
0.292
0.044***
0.678
0.041***
0.268
0.074***
Default
t+1
0.204
0.020***
�0.090
0.044**
0.288
0.028***
�0.194
0.066***
log(ageasborrower
t�1)
0.108
0.012***
0.097
0.012***
0.014
0.020
�0.015
0.020
Co
mp
etit
ion
Herfindahl t
�0.011
0.003***
�0.013
0.004***
�0.017
0.006***
�0.017
0.007**
Ex
per
ien
cea
nd
pre
f.o
fle
nder
Sizeofthelender
t�0.037
0.001***
�0.037
0.001***
�0.048
0.003***
�0.048
0.003***
Bank
�0.496
0.014***
�0.497
0.014***
�0.520
0.024***
�0.523
0.024***
Specialization
t�0.009
0.000***
�0.009
0.000***
�0.001
0.001
�0.001
0.001
Rel
ati
onsh
iple
ndin
g
log(duration
t�1)
�0.041
0.008***
�0.066
0.016***
0.011
0.014
�0.004
0.028
Co
ntr
ol
vari
ab
les
Eco
nom
icco
nd
itio
ns
GDPGrowth
t�1
�0.075
0.003***
�0.074
0.003***
�0.046
0.005***
�0.045
0.005***
|GDPG
t�1–AverageGDPG
t�1|
�0.019
0.005***
�0.019
0.005***
�0.038
0.008***
�0.039
0.008***
RealInterest
Rate
t�0.032
0.002***
�0.033
0.002***
�0.047
0.004***
�0.048
0.004***
Geographic
Risk
t�1
0.021
0.001***
0.021
0.002***
0.026
0.003***
0.025
0.003***
Bo
rro
wer
’sch
ara
cter
isti
cs
log(debt t�1)
�0.024
0.004***
�0.022
0.004***
0.005
0.008
0.011
0.008
log(scope t�1)
�0.089
0.011***
�0.086
0.011***
0.140
0.018***
0.141
0.018***
log(number
oflenders t�1)
0.068
0.016***
0.070
0.016***
�0.101
0.028***
�0.099
0.028***
Lo
an
’sch
ara
cter
isti
cs
log(sizeoftheloan)
0.837
0.004***
0.837
0.004***
0.611
0.008***
0.611
0.008***
G. Jimenez et al. / Journal of Financial Economics 81 (2006) 255–281 267
ARTICLE IN PRESSTable
2(c
onti
nu
ed)
Variable
Longterm
Short
term
Cross-effects
Cross-effects
Dependentvariable
estimation
Collateral(1/0)
Collateral(1/0)
Collateral(1/0)
Collateral(1/0)
Logitwithfixed
effects
Logitwithfixed
effects
Logitwithfixed
effects
Logitwithfixed
effects
Co
effi
cien
tS
EC
oef
fici
ent
SE
Co
effi
cien
tS
EC
oef
fici
ent
SE
Cro
ss-e
ffec
ts
Default
t�1*log(duration
t�1)
——
0.208
0.028***
——
0.310
0.047***
Herfindahl t*log(duration
t�1)
——
0.002
0.002
——
0.000
0.004
Default
t+1*log(ageasborrower
t�1)
——
0.185
0.025***
——
0.302
0.038***
No.observations
426,112
426,112
142,791
142,791
%collateralized
50.85
50.85
30.50
30.50
Log
L�141,565
�141,513
�44,865
�44,814
w2covariates
58,146
58,251
10,011
10.111
Pseudo
R2
0.170
0.171
0.100
0.101
Resultsoftheborrowers’fixed
effectslogitestimationofmodel
(1)ondeterminants
ofcollateralin
financialloansgrantedbySpanishbanksin
theperiod1984to
2002.
Lon
gte
rmlo
an
sare
financialloanswithmaturity
over
threeyears
(columnsoneandtw
o).
Sh
ort
term
loa
nsare
loanswithmaturity
betweenoneandthreeyears
(columnsthreeandfour).Thedependentvariable
Co
lla
tera
ltakes
thevalueofoneiftheloanhascollateralandzero
otherwise.Explanatory
variablesin
columnsone
andthree:
Def
au
ltt�
1isadummyvariable
withvalue1iftheborrower
thatgetstheloanhasaloanin
defaultand0otherwise,
Def
au
ltt+1isadummyvariable
that
takes
thevalueofoneiftheborrower
does
nothavealoanin
defaultatthetimetheloanisgrantedbutdefaultsayearafter,
Lo
g(
age
as
bo
rrow
ert�
1)isthenumber
of
years
theborrower
hasbeenin
theCreditRegisterpriorto
when
itreceives
theloan,in
logs,
Her
find
ah
l tistheindex
ofcreditmarket
concentrationequalto
thesum
of
banks’squaredmarket
sharesin
loansmadein
each
oneofthe50Spanishprovincesin
year
t,si
zeo
fth
ele
nder
tistheratiooftheassetsofthebanksthatgrantsthe
loanover
totalassetsofallbanks,
Ba
nkisadummyvariablethattakes
thevalueof1ifthelender
isacommercialbankandzero
ifitisasavingsbank,
Sp
ecia
liza
tio
nt
istheproportionofloansto
firm
sover
totalloansmadebythelender
inyear
t,L
og
(d
ura
tio
nt�
1)isthenumber
ofyears
ofthelender-borrower
relationship
priorto
when
theloanis
made,
inlogs,
GD
Pg
row
tht�
1is
therate
ofgrowth
ingross
domesticproduct
inrealterm
soneyearpriorto
when
theloanis
made,
|GD
P
gro
wth
t�1–
ave
rag
eG
DP
gro
wth
t�1|istheabsolute
difference
betweenGDPgrowth
andaveragegrowth,
rea
lin
tere
stra
tetisthenominalmoney
market
interest
rate
minustheinflationrate
(consumer
price
index)in
year
t,G
eog
rap
hic
risk
t�1istheproportionofbadloansover
totalloansin
theprovince
inwhichtheloanisgranted
thepreviousyear,
Lo
g(
deb
t t�1)is
totaloutstandingbankdebtoftheborrower
priorto
when
theloanis
made(inmillionsofEuros),in
logs,
Lo
g(
nu
mb
ero
f
len
der
s t�1)isthenumber
ofbankstheborrower
hasloanswithpriorto
when
theloanismade,in
logs,
Log
(sc
op
e t�1)isthenumber
ofloanstheborrower
haswith
thelender
priorto
when
theloanismade,
Log
(si
zeo
fth
elo
an
)istheamountoftheloangrantedin
millionsofEuros,in
logs.Columnstw
oandfourpresentcross-
effectsofthevariables
Def
au
ltt+1
an
dL
og
(a
ge
as
bo
rrow
ert�
1),
Def
au
ltt�
1,
an
dL
og
(d
ura
tio
nt�
1)and
Her
fin
da
hl t
an
dlo
g(
du
rati
on
t�1).Each
estimationincludes
49
province
and10industry
dummyvariables.
SEindicatesstandard
error.***,**,statisticallysignificantatthe1%
and5%
levels,respectively.
G. Jimenez et al. / Journal of Financial Economics 81 (2006) 255–281268
ARTICLE IN PRESSG. Jimenez et al. / Journal of Financial Economics 81 (2006) 255–281 269
Table 2 reports that for the average borrower, DEFAULTt+1 has a positive andsignificant coefficient in columns one and three. The likelihood that borrowers will berequired to pledge collateral is higher for borrowers with a clean record of no defaults atthe time of the new loan (but who later reveal themselves as having low credit quality) thanit is for borrowers who do not default. Lenders also have other sources of informationbeyond the CIR with which they can sort borrowers (i.e., accounting statements, creditratings and so on). Thus, our findings confirm the conclusion reached in previous work(Berger and Udell, 1990, 1995; Jimenez and Saurina, 2004) that observed credit risk is thedominant mechanism for sorting borrowers at the time the loan is granted. However, theex ante and ex post credit risk variables that we use in this paper to distinguish amongborrowers of different credit quality permit a sharper test of the hypothesis than do thevariables used in the previous studies.8
We also find that the estimated coefficient of DEFAULTt+1 is significantly lower thanthat of DEFAULTt�1. One possible explanation for this result is that among borrowersthat have a record of no defaults at the time they receive a new loan, some are sorted underobserved risk and some are sorted under private information. Among the latter group,high-credit-quality borrowers use collateral to signal their high quality and thereby obtaina lower interest rate on the loan. Therefore, in the pool of all borrowers, some on high- andlow-credit-quality borrowers simultaneously pledge collateral. The positive coefficient onDEFAULTt+1 is the net result of the two, pointing out that the proportion of borrowerssorted by observed risk is higher than the proportion of those sorted by privateinformation. Nevertheless, one can also argue that the lower estimated coefficient forDEFAULTt+1 compared with that for DEFAULTt�1 is due to the fact that the informationthat lenders use to sort borrowers in the group with defaults differs from that used to sortborrowers in the group with no defaults; in the first case, there is a direct and objectivemeasure of credit risk, whereas and in the second case, there is not.9
To further explain the observed differences in the estimated coefficients of DEFAULTt�1
and DEFAULTt+1, in Section 2 we postulate that the coefficient on DEFAULTt+1 is anincreasing function of the borrower’s experience, since more experienced borrowers havegreater opportunities to learn about their credit qualities. Table 2, columns two and four,reports a positive sign for the coefficient of the variable DEFAULTt+1 x Log(AGE AS
BORROWER), consistent with our prediction.Moreover, column two of Table 2 shows that for long-term loans, for example, the coeffi-
cient on DEFAULTt+1 with cross-effects, is –0.090+0.185Log(AGE AS BORROWER), as
8Other papers look at the relation between collateral and risk. In some, risk is measured by the risk premium in
the interest rate of the loan (Berger and Udell, 1990; Degryse and Van Cayseele, 2000). However, the risk
premium in the interest rate can be a measure of the risk of the project to be financed with the loan, while the
theory links the use of collateral to the risk of the borrower, not to the risk of the project. Harhoff and Korting
(1998) find a positive association between use of collateral and observed low borrower credit quality, but they do
not consider future defaults.9Borrowers’ fixed effects will also control for the fact that ratings of bonds issued by firms are another source of
information on the quality of the borrowers. However, in Spain, the number of firms that issue public debt is
limited. Moreover, the number of non-financial firms with rated debt is much lower (21 firms had rated debt at the
beginning of 2004). In addition, John et al. (2003) show that the credit ratings of bond issues by U.S. firms are not
sufficient statistics for determining credit risk. If these results apply to Spain and to bank loans, it could mean that
credit ratings will not be sufficient statistics for the risk of the bank loan and the use of collateral will still depend
on other explanatory variables. Similarly, Altman et al. (2005) argue that the loan market is more informational
efficient than the bond market around default dates.
ARTICLE IN PRESSG. Jimenez et al. / Journal of Financial Economics 81 (2006) 255–281270
H2 predicts under the sorting-by-private information explanation of collateral. This resultimplies that for young borrowers, i.e., those with Log(AGE AS BORROWERS) close tozero, the coefficient on DEFAULTt+1 is negative and statistically significant. Theconclusion is the same for short-term loans, where for Log(AGE AS BORROWER) ¼ 0,the coefficient on DEFAULTt+1 is �0.194. Therefore, among young borrowers, thelikelihood of pledging collateral is positively associated with credit quality because thoseborrowers who reveal lower credit quality ex post are less likely to pledge collateral thanare those who do not default. This evidence is the first that we are aware of that isconsistent with the theory that explains collateral as a signalling device in response toadverse selection problems (H2).While relationship lending lowers the likelihood of collateral for long-term loans,
duration does not have a significant effect on short-term loans (H3a). The coefficients onLog(DURATION) are negative and statistically significant in columns one and two ofTable 2, but not significant in columns three and four.The control variables SCOPE and NUMBER of LENDERS also show that the
coefficients change signs based on loan maturity. For long-term loans, the evidence thatboth an increase in the number of relationships and a greater concentration of thoserelationships in a reduced number of banks lower the likelihood of collateral use reinforcesour earlier result that relationship lending yields better loan terms than transactionallending, particularly for long-term loans. However, the opposite is true for short-termloans, for which transactional lending (fewer relationships with each of many banks)results in a lower likelihood of collateral use.An important conclusion that emerges from these results is that we cannot assume that
differences in loan terms across relationship and transactional lending are unaffected by loanmaturity. It is possible that banks specialize along two dimensions, in particular, relationshipversus transactional lending, and short-term versus long-term lending. These results are alsoconsistent with the finding of Berger and Udell (1995) that for credit-line loans, such as ourlong-term loans, relationship lending improves the terms of the loan, while for other loans,as reported by Petersen and Rajan (1994), it does not.10 Thus, examining the determinants ofcollateral separately for short- and long-term loans, appears to be a better approach thansimply using loan maturity as an additional explanatory variable in a pooled model.The evidence for H3b indicates that borrowers with a loan in default at the time they
obtain a new loan do not benefit from longer relationships with the lender. Rather, forthese borrowers, duration increases the likelihood of collateral: among long-term loans(column two), the coefficient of Log(DURATION) for borrowers with DEFAULTt�1 ¼ 1is 0.142 (�0.066+0.208). Thus, for borrowers with known low credit quality, longerrelationships seem to turn into a hold-up situation. This result provides stronger supportfor Berger and Udell’s (1995) hypothesis that duration improves the sorting of borrowersin terms of credit quality than for Boot and Thakor’s (1994) hypothesis that a longerduration implies higher trust and less moral hazard.The negative estimated coefficient on HERFINDAHL is consistent with the prediction
in H4a. If we assume that competition and rivalry are lower in more concentrated creditmarkets, then the results support the hypothesis that competition increases the likelihood
10In short-term loans, reputation and relationship effects are less important than those associated with the
forward commitment to provide future financing that are embodied in a line of credit (Berger and Udell, 1995,
p. 356).
ARTICLE IN PRESSG. Jimenez et al. / Journal of Financial Economics 81 (2006) 255–281 271
of collateral use. However, the coefficient of the cross-effect between the duration of theborrower–lender relationship and market concentration is not statistically significant. Wemust, therefore, conclude that credit market concentration does not change the effect thatrelationship duration has on the likelihood of collateral use. This may be because there arecountervailing forces when it comes to the impact of credit market concentration on banks’investments in borrower-specific information, as in H4b.
The data confirm H5, which predicts more use of collateral in loans granted by lenderswith lower expertise in credit operations and higher risk aversion. Larger banks that areprivately owned (commercial) and that specialize more in business loans are less likely torequire collateral in loans than are smaller banks, savings banks, and banks that are moreoriented toward retail banking. This conclusion is true for both long- and short-term loans.Thus, the empirical evidence is consistent with the theories that explain the use of collateralas a substitute for a thorough screening of the borrower’s credit risk (Manove and Padilla,1999, 2001).
Macroeconomic conditions such as the business cycle and monetary policy have aneconomically significant effect on the use of collateral. During downturns, lenders are morelikely to ask for collateral. In fact, since we observe a different impact depending onwhether output growth is above or below its average trend (captured by the variable |GDP
GROWTH—Average GDP GROWTH|), our analysis actually shows that output growthhas an asymmetric effect on the use of collateral: the likelihood of collateral use decreasesmore in upturns (GDP growth is above the trend) than it increases in downturns (GDPgrowth is below the trend). In periods of tighter monetary policy or higher real interestrates, borrowers are less likely to use collateral than they are in periods of loose monetarypolicy.
We know of no theory or any previous evidence on the relation between the use ofcollateral and macroeconomic conditions. A possible explanation of our results could bethat banks take into account the evidence that bad loans are inversely related to GDPgrowth, and that higher interest rates coincide with periods of more restrictive monetarypolicy. If the availability of credit is limited, then banks will prefer high-quality borrowersto low-quality ones in granting credit.
The rest of the control variables indicate that larger borrowers are less likely to pledgecollateral than are smaller ones, especially if the loan granted is a long-term loan. Whenfixed effects are included among of the explanatory variables, the variable DEBT, whichwe use as a proxy for size, has a negative and significant coefficient for long-term loans.Controlling for the size of outstanding debt, the likelihood of collateral increases with thesize of the loan, both for short-term and long-term loans. The coefficient of AGE AS
BORROWER is positive and significant for long-term loans but insignificant for short-term loans. Our empirical evidence differs from that of Berger and Udell (1995), who find anegative effect of borrower age in the likelihood of collateral use. Therefore, improvementsin loan terms, if any, come from the private information obtained by the bank through aclose relationship with the borrower (duration).
4.2. Marginal effects
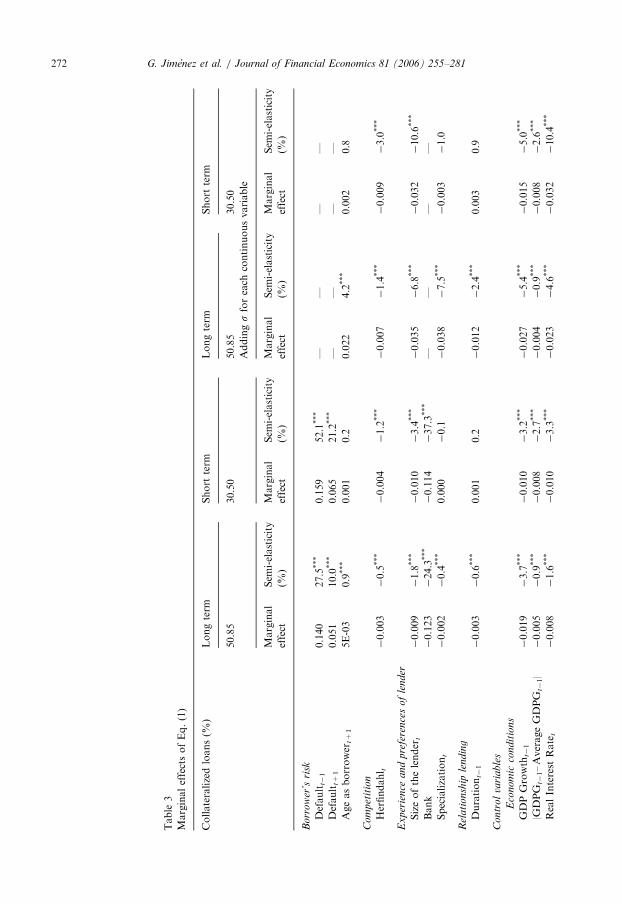
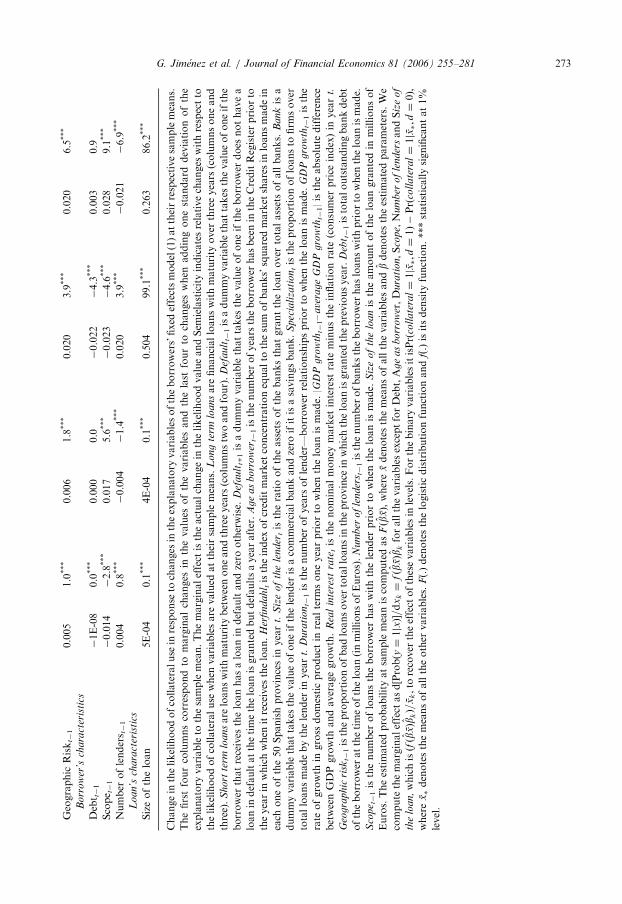
Table 3 shows the marginal effects of changes in the values of the explanatory variableson the probability of collateral use. We obtain our results from the logit estimations ofTable 2. We estimate the mean of the fixed effects so that F ðbxÞ is close to its observed
ARTICLE IN PRESS
Table
3
MarginaleffectsofEq.(1)
Collateralizedloans(%
)Longterm
Short
term
Longterm
Short
term
50.85
30.50
50.85
30.50
Addingsforeach
continuousvariable
Marginal
effect
Sem
i-elasticity
(%)
Marginal
effect
Sem
i-elasticity
(%)
Marginal
effect
Sem
i-elasticity
(%)
Marginal
effect
Sem
i-elasticity
(%)
Borr
ow
er’s
risk
Default
t�1
0.140
27.5
***
0.159
52.1
***
——
——
Default
t+1
0.051
10.0
***
0.065
21.2
***
——
——
Ageasborrower
t+1
5E-03
0.9
***
0.001
0.2
0.022
4.2
***
0.002
0.8
Co
mp
etit
ion
Herfindahl t
�0.003
�0.5
***
�0.004
�1.2
***
�0.007
�1.4
***
�0.009
�3.0
***
Ex
per
ience
and
pre
fere
nce
sof
lender
Sizeofthelender
t�0.009
�1.8
***
�0.010
�3.4
***
�0.035
�6.8
***
�0.032
�10.6
***
Bank
�0.123
�24.3
***
�0.114
�37.3
***
——
——
Specialization
t�0.002
�0.4
***
0.000
�0.1
�0.038
�7.5
***
�0.003
�1.0
Rel
ati
onsh
iple
ndin
g
Duration
t�1
�0.003
�0.6
***
0.001
0.2
�0.012
�2.4
***
0.003
0.9
Co
ntr
ol
vari
ab
les
Eco
nom
icco
nd
itio
ns
GDPGrowth
t�1
�0.019
�3.7
***
�0.010
�3.2
***
�0.027
�5.4
***
�0.015
�5.0
***
|GDPG
t�1–AverageGDPG
t�1|
�0.005
�0.9
***
�0.008
�2.7
***
�0.004
�0.9
***
�0.008
�2.6
***
RealInterest
Rate
t�0.008
�1.6
***
�0.010
�3.3
***
�0.023
�4.6
***
�0.032
�10.4
***
G. Jimenez et al. / Journal of Financial Economics 81 (2006) 255–281272
ARTICLE IN PRESSGeographic
Risk
t�1
0.005
1.0
***
0.006
1.8
***
0.020
3.9
***
0.020
6.5
***
Bo
rro
wer
’sch
ara
cter
isti
cs
Debt t�1
�1E-08
0.0
***
0.000
0.0
�0.022
�4.3
***
0.003
0.9
Scope t�1
�0.014
�2.8
***
0.017
5.6
***
�0.023
�4.6
***
0.028
9.1
***
Number
oflenders t�1
0.004
0.8
***
�0.004
�1.4
***
0.020
3.9
***
�0.021
�6.9
***
Lo
an
’sch
ara
cter
isti
cs
Sizeoftheloan
5E-04
0.1
***
4E-04
0.1
***
0.504
99.1
***
0.263
86.2
***
Changein
thelikelihoodofcollateraluse
inresponse
tochanges
intheexplanatory
variablesoftheborrowers’fixed
effectsmodel(1)attheirrespectivesamplemeans.
Thefirstfourcolumnscorrespondto
marginalchanges
inthevalues
ofthevariablesandthelast
fourto
changes
when
addingonestandard
deviationofthe
explanatory
variableto
thesamplemean.Themarginaleffect
istheactualchangein
thelikelihoodvalueandSem
ielasticityindicatesrelativechanges
withrespectto
thelikelihoodofcollateraluse
when
variablesare
valued
attheirsamplemeans.
Lon
gte
rmlo
an
sare
financialloanswithmaturity
over
threeyears
(columnsoneand
three).
Sh
ort
term
loa
nsare
loanswithmaturity
betweenoneandthreeyears
(columnstw
oandfour).
Def
au
ltt�
1isadummyvariablethattakes
thevalueofoneifthe
borrower
thatreceives
theloanhasaloanin
defaultandzero
otherwise.
Def
au
ltt+1isadummyvariablethattakes
thevalueofoneiftheborrower
does
nothavea
loanin
defaultatthetimetheloanisgrantedbutdefaultsayearafter.
Ag
ea
sb
orr
ow
ert�
1isthenumber
ofyears
theborrower
hasbeenin
theCreditRegisterpriorto
theyearin
whichwhen
itreceives
theloan.
Her
fin
da
hl tistheindex
ofcreditmarket
concentrationequalto
thesum
ofbanks’squaredmarket
sharesin
loansmadein
each
oneofthe50Spanishprovincesin
year
t.S
ize
of
the
len
der
tistheratiooftheassetsofthebanksthatgranttheloanover
totalassetsofallbanks.
Ban
kisa
dummyvariablethattakes
thevalueofoneifthelender
isacommercialbankandzero
ifitisasavingsbank.
Spec
iali
zati
on
tistheproportionofloansto
firm
sover
totalloansmadebythelender
inyear
t.D
ura
tio
nt�
1isthenumber
ofyears
oflender—borrower
relationshipspriorto
when
theloanismade.
GD
Pg
row
tht�
1isthe
rate
ofgrowth
ingross
domesticproduct
inrealterm
soneyearpriorto
when
theloanismade.
|GD
Pg
row
tht�
1–
ave
rage
GD
Pg
row
tht�
1|istheabsolute
difference
betweenGDPgrowth
andaveragegrowth.
Rea
lin
tere
stra
tetisthenominalmoney
market
interest
rate
minustheinflationrate
(consumer
price
index)in
year
t.
Geo
gra
phic
risk
t�1istheproportionofbadloansover
totalloansin
theprovince
inwhichtheloanisgrantedthepreviousyear.
Deb
t t�1istotaloutstandingbankdebt
oftheborrower
atthetimeoftheloan(inmillionsofEuros).
Nu
mb
ero
fle
nder
s t�1isthenumber
ofbankstheborrower
hasloanswithpriorto
when
theloanismade.
Sco
pe t�1isthenumber
ofloanstheborrower
haswiththelender
priorto
when
theloanismade.
Siz
eo
fth
elo
anistheamountoftheloangrantedin
millionsof
Euros.Theestimatedprobabilityatsamplemeaniscomputedas
Fðb
xÞ,where
xdenotesthemeansofallthevariablesandbdenotestheestimatedparameters.We
compute
themarginaleffect
asd½Probðy¼
1jx�=d
xk¼
fðb
xÞb
kforallthevariablesexceptforDebt,A
ge
as
bo
rrow
er,D
ura
tio
n,S
cope,N
um
ber
of
len
der
sandS
ize
of
the
loa
n,whichisðfðb
xÞb
kÞ=
xk,to
recover
theeffect
ofthesevariablesin
levels.Forthebinary
variablesitisPrð
coll
ate
ral¼
1jx�;d¼
1Þ�
Prð
coll
ate
ral¼
1jx�;d¼
0Þ,
where
x�denotesthemeansofalltheother
variables.
F(.)denotesthelogisticdistributionfunctionand
f(.)isitsdensity
function.***statisticallysignificantat1%
level.
G. Jimenez et al. / Journal of Financial Economics 81 (2006) 255–281 273
ARTICLE IN PRESSG. Jimenez et al. / Journal of Financial Economics 81 (2006) 255–281274
value. The magnitude of these effects helps to calibrate the economic significance of theresults in Table 2, which in most cases is rather high.For borrowers who are in default at the time they obtain a new loan, the likelihood of
collateral use for the new long- (short-) term loan is 27.5% (52.1%) higher than forborrowers who have no default at all. Moreover, the increase in the likelihood of collateraluse for a borrower that defaults next period is 10% (21%) for a long- (short) term loan,compared to a borrower with no default at all. Among borrowers whose AGE AS
BORROWER equals one, those in the group that defaults in period t+1 observe a lowerlikelihood of collateral, 4% (14%), compared to borrowers that do not default.If the values of the Herfindahl index are one standard deviation higher than the sample
mean, then the likelihood of using collateral for the loan is 1.4% (3%) lower than the meanvalue for long-term (short term) loans. On the one hand, while a one-standard deviationincrease of the variable DURATION decreases the likelihood of collateral use by 2.4% forlong-term loans, the likelihood of collateral is unchanged if the loan is a short-term loan.On the other hand, a one-standard deviation increase in the NUMBER OF LENDERS
raises the likelihood of collateral use by 3.9% if the new loan is a long-term loan andreduces it by 6.9% if it is a short-term loan. If the loan is a long-term (short-term) loan, thelikelihood that it will use collateral is 24.3% (37.3%) lower if a commercial bank, ratherthan with a savings bank, grants the loan.Macroeconomic conditions affect the likelihood of collateral use in an economically
significant way for all the cases we consider. A one-additional percentage point increase inGDP growth lowers the likelihood of collateral in long-term loans by 3.7 percentage points(pp). If the loan is granted in a year in which GDP grows at a rate above the long-termtrend, then the probability of using collateral falls by an additional 0.9 pp for long-termloans and 2.7 pp for short-term loans. The reduction in the likelihood of collateral use dueto marginal increases in the real interest rate ranges between 1.6% for long-term loans to3.3% for short-term loans.
4.3. Amount of collateral
Table 4 presents the results of the multinomial logit model on the determinants of theamount of collateral for the same sample of loans used to estimate the models that explainthe use of collateral. The model has the same explanatory variables as the model of thedeterminants of the use of collateral, but we now limit the theoretical predictions to theREAL INTEREST RATE and the SIZE of the loan. We obtain the results by using a two-stage conditional maximum likelihood estimation. This method accounts for the fact thatSIZE is likely to be endogenous because it is jointly determined with other loan terms suchas the interest rate and the use of collateral.11 Since loan SIZE is one of the variables weuse to test H6, it is important to reduce potential bias in performing the tests.In Table 4, columns one and two show that, for long-term and short-term loans,
respectively, the estimated values, standard errors, and levels of significance for thedifferences between the coefficients of the multinomial logit that explains the likelihood ofcollateral covering 100% of the face value of the loan and the model of the likelihood ofthe loan being only partially covered by the collateral. A positive value indicates that an
11The technical details, of the two-stage estimation procedure are in Rivers and Vuong (1988). Jimenez et al.
(2004) provide a more detailed explanation of the procedure.

ARTICLE IN PRESSG. Jimenez et al. / Journal of Financial Economics 81 (2006) 255–281 275
increase in the corresponding variable increases the likelihood that the bank will requirethe use of full collateral as opposed to partial collateral.
Our results are consistent with the predictions by Boot et al. (1991) that the amount ofcollateral pledged in a particular loan will increase if the loan is granted in a period ofhigher real interest rates, and will decrease with the size of the loan. Thus, the empiricalevidence confirms H6 and explanations of the use of collateral now deal with problems ofmoral hazard. In situations in which the risk-free interest rate is high, the additional riskpremium in the interest rate of the loan will aggravate the moral hazard problem. Usingcollateral instead of charging higher interest rates reduces the moral hazard problem andthereby increases efficiency.
4.4. Robustness of the results
We obtain statistics such as those presented in Table 1 for the whole population of short-term and long-term loans. The total number of loans of each maturity is similar, so thedifference between usable and total loans is especially important for the group of short-term loans. Not surprisingly, then, the main differences between the statistics for thevariables from the sample and from the population correspond with the short-term loans.For example, DEBTlt�1 and SIZE are up to five times larger in the sample of short-termloans than in the population of loans. Moreover, short-term loans with collateral as aproportion of the total number of short-term loans is 8.5%, compared to 30.5% for thesample of usable observations.
To verify that the process with which we select usable sample does not distort the mainconclusions of the study, we perform a robustness exercise by estimating model (1) for theentire population of loans, although in this case we use a different estimation method.Here, we estimate Eq. (1) for the whole population of loans by using a two-step probitmodel to check the robustness of the results.
The two-step probit estimation leaves the main results unchanged, although it producesdifferent signs for coefficients of control variables such as SCOPE, NUMBER OF
LENDERS, and DEBT. Therefore, the tests of Hypotheses 1–5 using the full population offinancial loans generate conclusions that are similar to those reported in the text, and anydifferences in results between the logit with fixed effects and the two-stage probit modelcome derive from the estimation method, not the sample data. Note that while thedifferences in this particular case occur for variables that are not part of the main model(i.e., the control variables), using panel data and controlling for borrowers’ fixed effectsreassures us that our results represent an unbiased estimation of the true model’sparameters.
We note that in addition to DURATION, variables such as SCOPE and NUMBER of
LENDERS are often used to describe the nature of the borrower–lender relationship. Thedifferences in the estimated coefficients of these variables with and without fixed effectsalert us to the relevance of controlling for unobserved effects in testing theories thatinvolve the consequences of relationship and transactional lending.
We perform an additional robustness test on the measures of ex ante and ex post creditrisk, DEFAULTt�1 and DEFAULTt+1. Although the CIR reports only the loans in defaultat the time of the inquiry (DEFAULTt�1) and not the whole record of past defaults, theremay be some information a lender obtains in previous inquiries that can be used to sort outborrowers at the time the new loan is granted. We are interested in determining the value
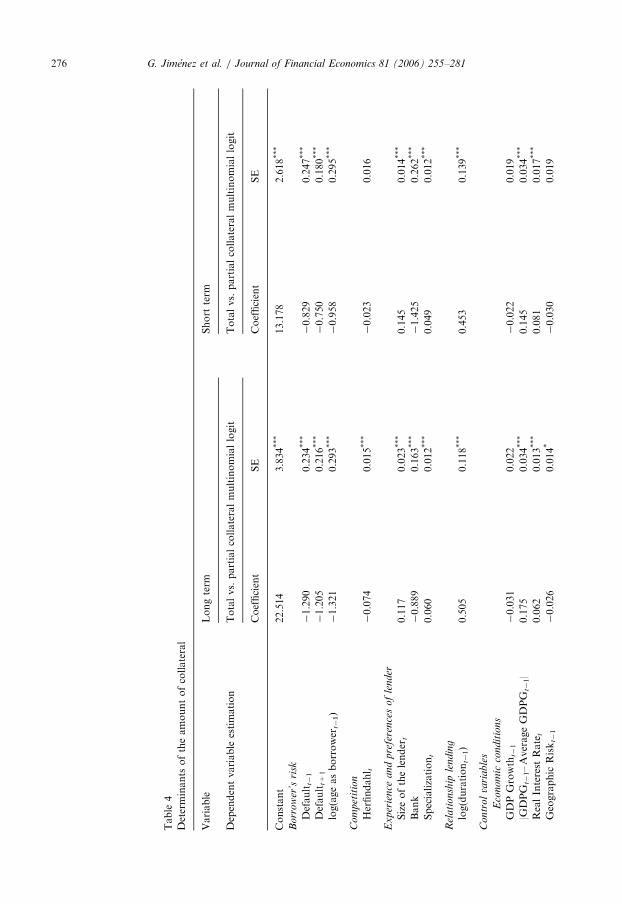
ARTICLE IN PRESS
Table
4
Determinants
oftheamountofcollateral
Variable
Longterm
Short
term
Dependentvariable
estimation
Totalvs.partialcollateralmultinomiallogit
Totalvs.partialcollateralmultinomiallogit
Coefficient
SE
Coefficient
SE
Constant
22.514
3.834***
13.178
2.618***
Borr
ow
er’s
risk
Default
t�1
�1.290
0.234***
�0.829
0.247***
Default
t+1
�1.205
0.216***
�0.750
0.180***
log(ageasborrower
t�1)
�1.321
0.293***
�0.958
0.295***
Co
mp
etit
ion
Herfindahl t
�0.074
0.015***
�0.023
0.016
Ex
per
ience
and
pre
fere
nce
sof
lender
Sizeofthelender
t0.117
0.023***
0.145
0.014***
Bank
�0.889
0.163***
�1.425
0.262***
Specialization
t0.060
0.012***
0.049
0.012***
Rel
ati
onsh
iple
ndin
g
log(duration
t�1)
0.505
0.118***
0.453
0.139***
Co
ntr
ol
vari
ab
les
Eco
nom
icco
nd
itio
ns
GDPGrowth
t�1
�0.031
0.022
�0.022
0.019
|GDPG
t�1–AverageGDPG
t�1|
0.175
0.034***
0.145
0.034***
RealInterest
Rate
t0.062
0.013***
0.081
0.017***
Geographic
Risk
t�1
�0.026
0.014*
�0.030
0.019
G. Jimenez et al. / Journal of Financial Economics 81 (2006) 255–281276
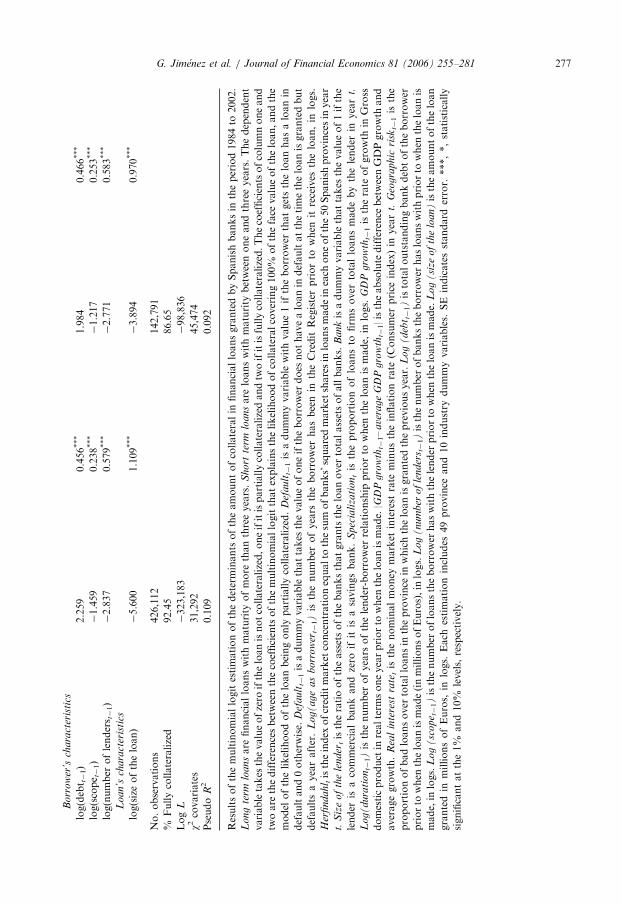
ARTICLE IN PRESSB
orr
ow
er’s
chara
cter
isti
cs
log(debt t�1)
2.259
0.456***
1.984
0.466***
log(scope t�1)
�1.459
0.238***
�1.217
0.253***
log(number
oflenders t�1)
�2.837
0.579***
�2.771
0.583***
Lo
an
’sch
ara
cter
isti
cs
log(sizeoftheloan)
�5.600
1.109***
�3.894
0.970***
No.observations
426,112
142,791
%Fullycollateralized
92.45
86.65
Log
L�323,183
�98,836
w2covariates
31,292
45,474
Pseudo
R2
0.109
0.092
Resultsofthemultinomiallogitestimationofthedeterminants
oftheamountofcollateralin
financialloansgrantedbySpanishbanksin
theperiod1984to
2002.
Lon
gte
rmlo
an
sare
financialloanswithmaturity
ofmore
thanthreeyears.
Sho
rtte
rmlo
an
sare
loanswithmaturity
betweenoneandthreeyears.Thedependent
variabletakes
thevalueofzero
iftheloanisnotcollateralized,oneifitispartiallycollateralizedandtw
oifitisfullycollateralized.Thecoefficientsofcolumnoneand
twoare
thedifferencesbetweenthecoefficientsofthemultinomiallogitthatexplainsthelikelihoodofcollateralcovering100%
oftheface
valueoftheloan,andthe
model
ofthelikelihoodoftheloanbeingonly
partiallycollateralized.
Def
au
ltt�
1isadummyvariable
withvalue1iftheborrower
thatgetstheloanhasaloanin
defaultand0otherwise.
Def
au
ltt�
1isadummyvariablethattakes
thevalueofoneiftheborrower
does
nothavealoanin
defaultatthetimetheloanisgrantedbut
defaultsayearafter.
Log
(a
ge
as
bo
rro
wer
t�1)is
thenumber
ofyears
theborrower
hasbeenin
theCredit
Registerpriorto
when
itreceives
theloan,in
logs.
Her
find
ah
l tistheindex
ofcreditmarket
concentrationequalto
thesum
ofbanks’squaredmarket
sharesin
loansmadein
each
oneofthe50Spanishprovincesin
year
t.S
ize
of
the
len
der
tistheratiooftheassetsofthebanksthatgrantstheloanover
totalassetsofallbanks.
Ban
kisadummyvariablethattakes
thevalueof1ifthe
lender
isacommercialbankandzero
ifit
isasavingsbank.
Spec
iali
zati
on
tis
theproportionofloansto
firm
sover
totalloansmadebythelender
inyear
t.
Log
(d
ura
tio
nt�
1)isthenumber
ofyears
ofthelender-borrower
relationship
priorto
when
theloanismade,
inlogs.
GD
Pg
row
tht�
1istherate
ofgrowth
inGross
domesticproduct
inrealterm
soneyearpriorto
when
theloanismade.|G
DP
gro
wth
t�1–
ave
rag
eG
DP
gro
wth
t�1|istheabsolute
difference
betweenGDPgrowth
and
averagegrowth.
Rea
lin
tere
stra
tetis
thenominalmoney
market
interest
rate
minustheinflationrate
(Consumer
price
index)in
year
t.G
eogra
ph
icri
skt�
1is
the
proportionofbadloansover
totalloansin
theprovince
inwhichtheloanisgrantedthepreviousyear.
Lo
g(
deb
t t�1)istotaloutstandingbankdebtoftheborrower
priorto
when
theloanismade(inmillionsofEuros),in
logs.
Log
(n
um
ber
of
len
der
s t�1)isthenumber
ofbankstheborrower
hasloanswithpriorto
when
theloanis
made,in
logs.
Lo
g(
sco
pe t�1)isthenumber
ofloanstheborrower
haswiththelender
priorto
when
theloanismade.
Lo
g(
size
of
the
loa
n)istheamountoftheloan
grantedin
millionsofEuros,
inlogs.
Each
estimationincludes
49province
and10industry
dummyvariables.
SE
indicatesstandard
error.
***,*,statistically
significantatthe1%
and10%
levels,respectively.
G. Jimenez et al. / Journal of Financial Economics 81 (2006) 255–281 277
ARTICLE IN PRESSG. Jimenez et al. / Journal of Financial Economics 81 (2006) 255–281278
of such information. For the variable DEFAULTt�1, which groups all borrowers with aloan in default at the time of the new lone, we substitute a variable that takes the value ofone for any borrower who had a loan in default two years before the present loan isgranted. Accordingly, we change the variable DEFAULTt+1 such that it consists of thoseborrowers that did not have a loan in default in the two years prior to the current loan. Theresults (not reported) associated with this modified variable are qualitatively the same asthose shown in Table 2, and the goodness of fit of the model remains unchanged.Second, to determine whether lenders anticipate borrowers’ risks beyond one year in the
future, we estimate the model with the additional explanatory variable DEFAULTt+2.This variable takes the value of one for borrowers that default two years after they aregranted the last loan. The estimated coefficient of this variable is not statisticallysignificant. The rest of the results remain unchanged. We rerun this robustness test and theprevious one with lagged defaults by estimating the two-stage probit model on the totalpopulation of loans, and we reach similar conclusions.In computing the marginal effects of the logit model with fixed effects, we must assume
an arbitrary value for the intercept of the logit function. We obtain the results in Table 3 byassuming a value for the intercept such that the predicted likelihood of collateral withvariables at their sample means is close to the proportion of loans with collateral. Toensure that the choice of the intercept does not affect these results, we reestimate themarginal effects with other values for the intercept. The new effects are not significantlyaffected.Another concern might be the limited borrower credit quality information that is
provided by the variable that we use as a proxy of the borrower’s age. Merging the CIRdatabase with the Commercial Register database, which contains accounting data for alimited sample of firms, allows us to estimate model (1) for the restricted sample thatincludes accounting-based proxies of a borrower’s credit quality, such as leverage, returnon assets, and liquidity, as additional explanatory variables. The sign and statisticalsignificance of the estimated coefficients of DEFAULTt+1 and DEFAULTt+1xAGE AS
BORROWER are very similar to those presented in the paper.
5. Conclusions
In this paper we present a comprehensive empirical analysis of the determinants ofcollateral use in financial loans to business firms. We summarize our analysis for six mainhypotheses, and we explore other empirical determinants that we introduce into the modelas control variables. To perform our empirical analysis we use a unique database, namely,the Credit Register (CIR) run by Banco de Espana, which contains, for each year between1984 and 2002, the total population of new loans made in Spain.Using a selected sample of CIR loans, we are able to test theories that explain the use of
collateral. We control for borrower fixed effects (by applying panel data econometrictechniques), which proves to be a very important methodological innovation for correctlyevaluating some of the determinants of collateral. Nevertheless, the database has somelimitations. First, it does not contain information on the interest rate or the purpose of theloan. Moreover, it does not detail the nature of the collateral (i.e., if it is internal or not),the exact amount of the collateral (i.e., collateral is not a continuous variable), or somerelevant firm characteristics (i.e., financial variables). This lack of information limits the
ARTICLE IN PRESSG. Jimenez et al. / Journal of Financial Economics 81 (2006) 255–281 279
scope of our tests. However, we believe it does not affect the results we do obtain since weinclude variables that control for these unobserved effects, including the fixed effects.
Previous empirical research (Berger and Udell 1990, 1995) shows that lenders requirecollateral for loans granted to borrowers with lower credit quality. Following Berger andUdell (1990), we interpret this evidence as suggesting that borrowers of different creditquality are sorted according to observed risk. The results in our paper confirm that thecredit quality of the borrower is the primary determinant of the use of collateral in thepopulation of Spanish business loans. Moreover, we find that in the pool of loans toborrowers of all ages, observed risk appears to be the dominant sorting variable. We reachthis conclusion by analyzing previously unexplored ex ante and ex post direct measures ofborrower credit quality, which we obtain from records in the Credit Register database.
In addition, we uncover evidence that unobserved credit risk (hidden information) alsoaffects credit contracts. Our paper is the first to find empirical evidence that supports theprivate information hypothesis, which explains the collateral use as a way to sortborrowers (Bester, 1985; Besanko and Thakor, 1987a, b). In particular, young borrowerscan send credible signals about their private information on credit quality since there ishardly any other useful information about them. We find that among young borrowers,the likelihood of collateral use is lower among those that reveal themselves ex post to be oflow credit quality than it is among those that do not.
We find support for the hypothesis that relationship lending pays off for borrowers interms of a lower likelihood that banks will require borrowers to pledge collateral in newloans. However, this likelihood applies only to loans with maturities of over three years.For short-term loans, contract terms improve for borrowers that take transactional loans.The terms of such loans appear to be determined by the nature of the transaction, not byan across-the-board relationship between the borrower and the lender. In explaining whyrelationship lending improves the terms of the loan, our results point towards betterinformation resulting in improved sorting of borrowers according to their credit quality.
The use of collateral is less likely in more concentrated credit markets. However,concentration does not seem to alter the lender’s incentives to invest in information, sincethe effect of the variable for the duration of the borrower–lender relationship in thelikelihood of collateral use does not depend on credit market concentration. The use ofcollateral also depends on lender characteristics such as size, specialization, and ownershipform, that determine the expertise of the lender in screening loan applications and thelender’s risk aversion. In sum, lenders have different inclinations to use collateral as asubstitute for thorough credit screening (Manove and Padilla, 1999, 2001).
We also study differences in the amount of collateral required in loans. The amount ofcollateral increases in periods of higher interest rates and decreases with loan size. Thisfinding is consistent with the theory that explains collateral as a solution to problems ofmoral hazard (Boot et al., 1991).
Our empirical analysis also addresses new questions related to explaining the regularitiesthat we observe with respect to how macroeconomic conditions affect the decision to usecollateral. We find that a decrease in the GDP growth rate increases the likelihood thatloans are made with collateral. We also find that this effect is asymmetric, i.e., that thelikelihood of collateral decreases proportionally more when growth is above its long-termtrend than it increases when growth is below its long-term trend.
Credit markets seem to function differently for loans with different maturities andamong borrowers with different levels of experience in the loan market. Future research on
ARTICLE IN PRESSG. Jimenez et al. / Journal of Financial Economics 81 (2006) 255–281280
the determinants of loan terms and conditions should focus on credit market segmentsother than small or large firms, as has been the common practice in the past. Our evidenceshows that macroeconomic conditions such as the business cycle play a role in determiningterms of credit, even after controlling for microeconomic variables. Thus, large databaseswould be better suited for this new line of research, and in particular data that coverseveral time periods.Banking regulators often look for signals that are predictors of risk and other sources of
financial instability. The presence of collateral in loans may be one of these signals, forinstance, greater collateral use could indicate that loans go to borrowers of low quality andhigher risk. However, collateral is a way to decrease the risk of the loan operation. In linewith the general observation that credit markets appear to be highly segmented, we findthat the information content of the signal ‘‘use of collateral in a loan’’ is substantiallydifferent for new borrowers relative to old ones, and also different for short-term loansrelative to long-term loans.Basel II, the new regulatory capital framework for banks, will create incentives for
lenders to invest in a more thorough analysis of the borrower’s credit risk (e.g., Decampset al., 2004). Evidence indicates that lenders differ in their expertise and ability to evaluatethe risk of the loans they grant. This finding may not be so relevant at a time when thebenefits of investing to gain such expertise and capabilities are low, but the benefits may bemore important in the future under the new regulation of capital. Thus, another importanttopic for future research is whether the new regulations in banks’ capital requirementschange the way banks view the use of collateral in loan operations.
References
Altman, E., Gande A., Saunders, A., 2005. Informational efficiency of loans versus bonds: evidence from
secondary market prices. New York University working paper.
Berger, A.N., Udell, G.F., 1990. Collateral, loan quality, and bank risk. Journal of Monetary Economics 25,
21–24.
Berger, A.N., Udell, G.F., 1995. Relationship lending and lines of credit in small firm finance. Journal of Business
68, 351–382.
Berger, A.N., Udell, G.F., 2002. Small business credit availability and relationship lending: the importance of
bank organization structure. Economic Journal 112, 32–53.
Besanko, D., Thakor, A.V., 1987a. Collateral and rationing: sorting equilibria in monopolistic and competitive
credit markets. International Economic Review 28, 671–689.
Besanko, D., Thakor, A.V., 1987b. Competitive equilibria in the credit market under asymmetric information.
Journal of Economic Theory 42, 167–182.
Bester, H., 1985. Screening vs. rationing in credit markets with imperfect information. American Economic
Review 75, 850–855.
Boot, A.W.A., 2000. Relationship banking: what do we know? Journal of Financial Intermediation 9, 7–25.
Boot, A.W.A., Thakor, A.V., 1994. Moral hazard and secured lending in an infinitely repeated credit market
game. International Economic Review 35, 899–920.
Boot, A.W.A., Thakor, A.V., 2000. Can relationship banking survive competition? Journal of Finance 55,
679–713.
Boot, A.W.A., Thakor, A.V., Udell, G.F., 1991. Secured lending and default risk: equilibrium analysis, policy
implications and empirical results. Economic Journal 101, 458–472.
Carey, M., Post, M., Sharpe, S.A., 1998. Does corporate lending by banks and finance companies differ? Evidence
on specialization in private debt contracting. Journal of Finance 53, 845–878.
Chan, Y.S., Kanatas, G., 1985. Asymmetric valuation and the role of collateral in loan agreements. Journal of
Money, Credit and Banking 17, 85–95.
ARTICLE IN PRESSG. Jimenez et al. / Journal of Financial Economics 81 (2006) 255–281 281
Chan, Y.S., Greenbaum, S.I., Thakor, A.V., 1986. Information reusability, competition and bank asset quality.
Journal of Banking and Finance 10, 255–276.
Decamps, J.-P., Rochet, J.-C., Roger, B., 2004. The three pillars of Basel II: optimizing the mix. Journal of
Financial Intermediation 13, 132–155.
Degryse, H., Van Cayseele, P., 2000. Relationship lending within a bank-based system: evidence from European
small business data. Journal of Financial Intermediation 9, 90–109.
Diamond, 1991. Monitoring and reputation: the choice between bank loans and privately placed debt. Journal of
Political Economy 99, 689–721.
Farinha, L., Santos, J.A.C., 2002. Switching from single to multiple bank lending relationships: determinants and
implications. Journal of Financial Intermediation 11, 124–151.
Gorton, G., Rosen, R., 1995. Corporate control, portfolio choice, and the decline of banking. Journal of Finance
50, 1377–1420.
Greenbaum, S., Kanatas, G., Venezia, I., 1989. Equilibrium loan pricing under the bank-client relationship.
Journal of Banking and Finance 13, 221–235.
Greene, W.H., 1993. Econometric Analysis. Macmillan, New York.
Harhof, D., Korting, R., 1998. Lending relationships in Germany—empirical evidence from survey data. Journal
of Banking and Finance 22, 1317–1353.
Inderst, R., Muller, H., 2004. A lender-based theory of collateral. Unpublished working paper.
Jimenez, G., Saurina, J., 2004. Collateral, type of lender and relationship banking as determinants of credit risk.
Journal of Banking and Finance 28, 2191–2212.
Jimenez, G., Salas, V., Saurina, J., 2004. Determinants of collateral. Unpublished Working Paper No. 0420.
Banco de Espana.
John, K., Lynch, A.W., Puri, M., 2003. Credit ratings, collateral and loan characteristics: implications for yield.
Journal of Business 76, 371–409.
Manove, M., Padilla, A.J., 1999. Banking (conservatively) with optimists. RAND Journal of Economics 30,
324–350.
Manove, M., Padilla, A.J., 2001. Collateral versus project screening: a model of lazy banks. RAND Journal of
Economics 32, 726–744.
Petersen, M.E., Rajan, R.G., 1994. The benefits of firm-creditor relationships: evidence from small business data.
Journal of Finance 49, 3–37.
Petersen, M.E., Rajan, R.G., 1995. The effect of credit market competition on lending relationships. Quarterly
Journal of Economics 110, 407–444.
Rajan, R.G., 1992. Insiders and outsiders: the choice between informed and arm’s-length debt. Journal of Finance
47, 1367–1399.
Rajan, R.G., Winton, A., 1995. Covenants and collateral as incentives to monitor. Journal of Finance 50,
1113–1146.
Rivers, D., Vuong, Q.H., 1988. Limited information estimators and exogeneity test for simultaneous Probit
models. Journal of Econometrics 39, 347–366.
Saunders, A., Strock, E., Travlos, N., 1990. Ownership structure, deregulation, and bank risk taking. Journal of
Finance 45, 643–654.
Sharpe, S.A., 1990. Asymmetric information, bank lending, and implicit contracts: a stylised model of customer
relationships. Journal of Finance 45, 1069–1087.
Smith, C., Warner, J., 1979. On financial contracting: an analysis of bond covenants. Journal of Financial
Economics 7, 117–161.
Stulz, R., Johnson, H., 1985. An analysis of secured debt. Journal of Financial Economics 14, 501–522.
Thakor, A., 1996. Capital requirements, monetary policy and aggregate bank lending: theory and empirical
evidence. The Journal of Finance 51, 279–324.