Embed Size (px)
Citation preview

Courant Research Centre ‘Poverty, Equity and Growth in Developing and Transition Countries: Statistical Methods and
Empirical Analysis’ Georg-August-Universität Göttingen
(founded in 1737)
No. 147
Determinants of Empowerment in a Capability Based
Poverty Approach: Evidence from The Gambia
Sofia Karina Trommlerová, Stephan Klasen, Ortrud Lessmann
August 2013
Discussion Papers
Wilhelm-Weber-Str. 2 ⋅ 37073 Goettingen ⋅ Germany Phone: +49-(0)551-3914066 ⋅ Fax: +49-(0)551-3914059
Email: [email protected] Web: http://www.uni-goettingen.de/crc-peg

0
Determinants of Empowerment in a Capability Based Poverty Approach:
Evidence from The Gambia
Sofia Karina Trommlerová (IHEID Geneva)
Stephan Klasen (University of Göttingen)
Ortrud Lessmann (Helmut-Schmidt-Universität Hamburg)
August 2013
Abstract
Although empowerment is seen as intrinsically important and instrumentally valuable to escape
poverty, there is very little research on the empirical drivers of empowerment. Using custom-made
household-level information and using advanced econometric techniques that also correct for
endogeneity, we examine what empowers individuals in The Gambia to change their own lives and
affect changes in their communities. We show that people’s self-reported capabilities are the most
important drivers of empowerment. We also show that respondents’ confidence that they will be the
most powerful agents in their lives is higher for men, foreigners, people free of health limitations,
and younger people.
JEL codes: I30, I32, O15, Z13, Z18
Keywords: empowerment, agency, capability approach, The Gambia, correction for endogeneity
Acknowledgments
The authors would like to thank Jean-Louis Arcand for including their questions to the CDDP survey he was in charge of
in The Gambia and Eric Djimeu for conducting the survey and for helpful comments.

1
1. Introduction
Well-being and poverty are nowadays perceived as multidimensional concepts that cannot be
assessed merely in monetary terms. The Capability Approach goes even further by emphasizing the
importance of agency in promoting human development. Increasing agency means enhancing
people’s freedoms to act and to achieve what they consider valuable, i.e. having the freedom to act in
line with one’s own values and to pursue one’s goals. Empowerment is a concept closely related to
agency and thereby to human development. We define empowerment as an increase in agency which
enables individuals to pursue valuable and important goals. Both agency and empowerment are
intrinsically valuable, and can be instrumentally effective in promoting human development and
reducing poverty (Alkire, 2009). In fact, there has been a number of theoretical and empirical studies
that focus on women’s empowerment or empowerment of the poor and found positive well-being
outcomes of increases in agency (e.g. Thomas, 1997; Hindin, 2000; Allendorf, 2007a; Kim et al.
2007). In contrast, there is very little literature that considers empowerment outside of this gender
context, which is the focus of our study. Moreover, most of these studies employ suboptimal
measures of agency and empowerment. In the last few years, the Oxford Poverty and Human
Development Initiative (OPHI) has developed a superior set of desirable agency and empowerment
measures that aim at capturing various aspects of empowerment. Whereas some of these aspects have
already been analyzed empirically, others are still to be investigated. The most widely researched
empowerment measures are those focusing on household decision-making (e.g. Malhotra and
Mather, 1997; Hindin, 2000; Jejeebhoy, 2000) and to a certain extent those capturing domain-
specific autonomy (e.g. Chirkov et al. 2005).1
This article presents an empirical analysis of those aspects of empowerment which have been largely
neglected so far. The analysis is based on a unique dataset from The Gambia which contains
information on capabilities and on empowerment indicators as had been proposed by OPHI. The
1 See Ibrahim and Alkire (2007) for a more detailed list of relevant empirical studies.
2
main goal is to look for correlates and determinants of empowerment, with a particular focus on
individuals’ self-reported ability to induce changes in their lives at communal and individual level.
Generalized ordered logit and multinomial logit models are employed in search for correlates of this
type of empowerment and tested for potential sample selection and endogeneity biases.
Our results show that individuals’ ability to induce changes in communal life in The Gambia is
causally related to education, age, marital status, and health. Concerning the ability to change things
in one's own life (which we call 'individual' empowerment), we first show that people’s self-reported
capabilities are much more important correlates of individuals’ desire to change something in their
lives than their socio-demographic characteristics or economic situation. We also show that
respondents’ confidence that they will be the most powerful agents in their lives is significantly
higher for men, foreigners, people free of health limitations, and younger people. Furthermore,
economic inactivity and significant health limitations cause Gambians to rely more often on their
families for support.
We argue that the results matter for several reasons. First, it is pioneering exploratory work in using
new, internationally comparable direct measures of communal and individual agency and
empowerment. Second, the pool of possible correlates and determinants of empowerment comprises
not only objectively observable socio-demographic and economic characteristics of respondents but
also a unique set of self-reported capabilities. Third, this work is of great relevance in considering
empowerment in general terms, not exclusively women’s or poor’s empowerment. Finally, advanced
econometric techniques are applied in the empirical analysis and an attempt is made to correct for
endogeneity problems.
The structure of this article is as follows. The next chapter is concerned with definition and
measurement of empowerment as an agency-related concept. It also formulates our hypotheses
regarding the determinants of empowerment. Section 3 describes the data. Section 4 presents the
empirical evidence on empowerment at both communal and individual level. Section 5 concludes
and identifies areas for potential future research.

3
2. Measurement of empowerment and hypotheses
Empowerment is a relatively broad concept lacking a single clear definition. It has experienced
growing importance in the development economics literature especially since the turn of the new
millennium when Voices of the Poor (Narayan, 2000) and the World Development Report
2000/2001 were published. Dozens of theoretical and empirical studies have refined the concept
since then; most of them focus on women’s empowerment or on empowerment of the poor. Ibrahim
and Alkire (2007) alone list 29 distinct definitions. Their main common feature is that they define
empowerment as a process (e.g. Kabeer, 1999; Malhotra and Schuler, 2005) in which a marginalized
or relatively powerless group improves its position. The critical point, in which the proposed
definitions differ, is in regard of the domain or dimension of improvement brought about by
empowerment. In this study, following largely Alkire (2005) and Ibrahim and Alkire (2007),
empowerment is understood as an increased possibility to gain agency.2
Agency is one of the integral parts of Amartya Sen’s Capability Approach. Sen (1985) defines
agency freedom as “what the person is free to do and achieve in pursuit of whatever goals or values
he or she regards as important.” (p. 203). Thus, we see empowerment as a gain in agency, enabling
the individual to pursue valuable and important goals. Agency, seen in Sen’s definition, is both
intrinsically valuable and instrumentally effective in promoting human development and reducing
poverty (Alkire, 2009).
2 Generally, the concept of empowerment is related to agency, autonomy, self-direction, self-confidence, self-worth, self-determination, liberation, participation, and mobilization (Narayan, 2005; Ibrahim and Alkire, 2007). More specifically, different studies define empowerment in different terms, for instance as an increased possibility to make choices (Alsop et al., 2006; Kabeer, 1999; Mayoux, 2000; Moser, 1991) or decisions (Appleyard, 2002; Khwaja, 2005; Rowlands, 1997), or to gain power (Lokshin and Ravallion, 2005; Malena, 2003; Moser, 1991), control (Chambers, 1993; Jackson, 1994; Mason and Smith, 2003; Moser, 1991; Strandberg, 2001), influence (Khwaja, 2005; McMillan et al., 1995; Moser, 1991; World Bank, 2001), or assets and capabilities (Grootaert, 2003; Malhotra et al., 2002; Narayan, 2005).This overview is based on a list of definitions which was assembled by Ibrahim and Alkire (2007); the definitions often refer specifically to women’s empowerment.

4
2.1 Conceptualization and indicators
When framing empowerment as an increase in human agency, Ibrahim and Alkire (2007) draw on
the concept of four types of power developed by Rowlands (1997): power over (‘controlling power’),
power to (‘generative or productive power’), power with (collective power of a group), and power
from within (strength based on self-acceptance). Ibrahim and Alkire (2007) think of each type of
power as a distinct exercise of agency, namely in terms of control, choice, communal belonging, and
change, see Table 1. The latter two, which will be the focus of this article, represent the ability to
change aspects in one’s life at communal and individual level, respectively.
[Table 1 approximately here]
There are two types of agency measures: proxy measures and direct measures. According to Alsop
and Heinsohn (2005), commonly used proxy measures of agency are different types of assets, such as
material, human, social, political, and psychological assets. Examples of these proxy measures
encompass land ownership, literacy, group membership, participation in political parties, level of
self-confidence, etc. (Alsop and Heinsohn, 2005). Alkire (2009) criticizes the use of proxy measures
and articulates a strong need for direct measures of agency. In her critique, she identifies three
reasons why proxy measures are not desirable. First, the conversion of assets into agency may vary
considerably among individuals just as the conversion of resources into functionings differs. Second,
changes in agency and empowerment might stem from other assets than those covered by the
proxies, or they might not stem from any assets at all. Third, the very same assets which are used as
proxies for agency are often used as poverty measures. Therefore, it is impossible to examine the
relationship between “proxy-measured” agency and poverty.
Direct measures of agency and empowerment face, however, considerable methodological
challenges related to the local of empowerment, the comparability of empowerment across contexts,
and the difficulty of measuring this elusive concept with quantitative methods (Narayan, 2005).

5
Despite these difficulties, Ibrahim and Alkire (2007) propose a set of internationally comparable
direct measures of agency and empowerment. The main criteria for empowerment indicators to
qualify into Ibrahim’s and Alkire’s (2007) final set are: coverage of areas particularly relevant to the
life of the poor, international comparability, coverage of both instrumental and intrinsic aspects of
empowerment, possibility to identify changes in agency over time, and positive experience with the
particular indicators in previous surveys. Regarding the first and second type of empowerment in
Table 1, Ibrahim and Alkire (2007) list a number of empirical studies that were undertaken based on
the proposed indicators. However, there seem to be no empirical studies focusing on the third and
fourth type of empowerment. In an attempt to fill this gap, we focus on empowerment in community
and empowerment as change. The indicators proposed by Ibrahim and Alkire (2007) are adopted
here with minor alterations.
The empowerment in community is captured by the following question:
Q: Do you feel that people like yourself can generally change things in their community if they
want to?
A: Yes, very easily / Yes, fairly easily / Yes, but with a little difficulty / Yes, but with a great deal of
difficulty / No, not at all
Despite being measured at individual level, the question aims at capturing “the ability of people to
change things collectively in their community” (Ibrahim and Alkire, 2007, p. 29, accentuations by the
authors), i.e. their power with other community members. The formulation ‘people like yourself’
intends to depart at least partly from the individual empowerment and to encompass, to a certain
degree, collective empowerment.
The empowerment as change in one’s own life is measured by two questions:3
Q1: Would you like to change anything in your life at this point in time?
3 Originally, there are three questions measuring empowerment as change in Ibrahim’s and Alkire’s (2007) proposal. Since one of them is not a subject of the investigation here, it is not mentioned in detail.

6
A1: Yes / No
Q2: Who do you think will contribute most to any change in your own life?
A2: Myself / My family / Village development committee / Our community (village) / The ward
development committee / The state government / Don’t know / Other
Both questions aim at measuring “the ability to induce change in one’s life, thus enhancing one’s
own self-acceptance” (Ibrahim and Alkire, 2007, p. 28), i.e. the power from within. While the first
question addresses individuals’ willingness to change their lives, the second question assesses their
actual ability to act as agents (Ibrahim and Alkire, 2007).
Overall, our indicators can be classified according to Alkire’s (2009) classification of direct
measures of agency as global measures of autonomy that are directed at both one’s own and others’
well-being and measure both direct control and effective power. In this sense, the indicators of
empowerment analyzed in this article cover also the traditionally neglected aspects of autonomy,
other-regarding agency, and effective power.
2.2 Existing literature on drivers of empowerment
As our paper is largely empirical, we will focus primarily on empirical drivers of empowerment, but
briefly want to comment on some of the theoretical literature on the drivers of empowerment.
Kabeer (1999) presents a useful conceptual framework and claims that a broad notion of 'resources',
including material, human, and social resources available to individuals and communities affect their
empowerment. Consequently, greater control over economic resources (such as control over land,
property, access to paid employment), better education and access to information, and more social
rights (which are often related to group membership such as membership of a caste or clan, an
ethnicity, one's sex, age, etc.) can all be important drivers of both individual and communal
empowerment. Empirical studies have indeed mostly focused on these factors.
The existing empirical literature that is concerned with empowerment in general terms is rather small
(Samman and Santos (2009) offer an overview). In fact, we have found only one study on this topic

7
(Lokshin and Ravallion, 2005); the vast majority of empirical studies investigate specifically
women’s empowerment. Another common feature of some of these studies is that they are not
primarily concerned with socio-demographic determinants or correlates of empowerment per se.
Instead, they investigate the empowering effect of specific economic characteristics or interventions,
such as land ownership or microcredit programs, and add socio-demographic factors merely as
control variables. We restrict our literature review to research that focuses on the intrinsic importance
of empowerment, examines the determinants of empowerment, and uses direct measures of
empowerment. However, one caveat applies – as Samman and Santos (2009) point out, most of the
current literature identifies correlates of empowerment rather than its causes, i.e. the majority of
studies does not address possible endogeneity problems, such as reverse causality, and thus cannot
identify causal effects. The following overview starts with studies that do not address endogeneity
issues and identify correlates of women’s empowerment. Subsequently, two studies that correct for
endogeneity are presented. The studies are summarized in Table 2.
[Table 2 approximately here]
Gupta and Yesudian (2006) focus on a sample of ever-married women in India. In order to measure
empowerment, they create indices on women’s mobility and participation in household decision
making. In a logit regression, they find that women’s educational level, literacy, age, mass media
exposure, and wealth of the household are significant correlates of women’s empowerment within
the household.
Allendorf (2007a) investigates the impact of female agricultural workers’ land rights on their
empowerment in Nepal. Empowerment is measured by women’s participation in household decision
making. Ordinary Least Squares (OLS) and logit estimations reveal that women’s ownership of land
or livestock, effective land or livestock rights, and receipt of pay for work promote empowerment.
Women’s age and education have also expected but relatively weak empowerment effects, as have
religion and caste of the respondent. Additionally, the position of a woman within the household

8
structure seems to be particularly important for her empowerment in terms of her participation in
household’s decision making.
In another study, Allendorf (2012) measures women’s empowerment by their mobility and decision
making in terms of spending. In an OLS regression, she identifies family relationship quality, area of
residence, age, higher education, and employment outside the household as correlates of married
mother’s empowerment in India.
Other studies that find empowering effects of education in various countries are Malhotra and
Mather (1997) for Sri Lanka, Hindin (2000) for Zimbabwe, Jejeebhoy and Sathar (2001) for India
and Pakistan, and Jejeebhoy (2000) and Roy and Niranjan (2004) for India.
The only study that does not focus explicitly on women’s empowerment is Lokshin and Ravallion
(2005). In their analysis of Russian data, they find positive correlation between income and power.
Concerning socio-demographic characteristics, men and educated individuals feel empowered.
Younger and unemployed respondents, on the other hand, perceive themselves as less empowered.
The empirical studies presented until now find merely correlates of (women’s) empowerment
because they ignore a possible endogeneity bias. Two studies, that make an attempt to identify
determinants of women’s empowerment by addressing endogeneity problems, follow.
Garikipati (2008) measures Indian women’s empowerment in terms of household decision making
and ownership of assets and income. In a 2SLS tobit-logit regression, women’s secondary education,
household wealth status, and women’s participation in a microcredit program are identified as
significant determinants of empowerment.4 Surprisingly, the latter shows a negative effect. This
study has to be treated with a great deal of caution, though, because the data on women’s
empowerment were reported either by women themselves or by their husbands. As Allendorf
(2007b) shows in her study on Nepal, husbands’ and wives’ perceptions on women’s empowerment
4 Women’s participation in a microcredit program is endogenous due to self-selection. Therefore, it is instrumented by the size of respondent’s neighborhood and by a dummy variable indicating whether the respondent belongs to a minority caste in her neighborhood.

9
differ substantially. Additionally and more importantly, using two nonlinear models (tobit and logit)
in a 2SLS approach is, from econometrical point of view, incorrect and yields biased and inconsistent
estimates (Stock and Watson, 2011).
Lastly, Anderson and Eswaran (2009) apply the 2SLS method in order to examine data on household
heads’ wives in Bangladesh. Again, empowerment is measured by women’s participation in
household decision making. Anderson and Eswaran (2009) correct for the endogeneity bias and find
that value of woman’s assets, woman’s earnings from work, and the time a woman worked for
income have positive impact on empowerment.5 The household structure and age are also relevant.
Surprisingly, the effect of age is negative.
To summarize, Kabeer's notion of 'resources' seem to matter for empirically matter for
empowerment: education, literacy, age, and position within the household were identified as the
main socio-demographic correlates of women’s empowerment. Additionally, women’s assets and
income as well as the wealth of the household belong to economic correlates of women’s
empowerment. Studies focusing on empowerment in general are rare; they find that age, gender,
education, employment, and income are significantly correlated with empowerment in general terms.
2.3 Hypotheses
Based on both the theoretical background and the empirical literature, we pose the following
hypotheses regarding the correlates and determinants of agency and empowerment. First, we expect
gender, age, position within the household, religion, ethnicity, education, employment, household
wealth status, and area of residence to affect empowerment. Additionally, we expect marital status,
foreigner status, and literacy to be relevant as well. Although these characteristics have not been
explored so far, they are closely related to the correlates and determinants that were already
identified. Lastly, we hypothesize that the self-reported capabilities of respondents are extremely
5 Women’s earnings from work and the time they worked for income, as potentially endogenous explanatory variables, are instrumented by exogenous shocks to the household, namely crop loss, sickness of a family member, and rainfall patterns.

10
relevant for empowerment, not least due to the close relationship between capabilities, agency, and
empowerment.
In terms of empowerment within the community, certain groups of individuals are expected to be
more influential than others. Socio-economic status, knowledge, experience, ethnic origin, and social
standing are individual characteristics that are very likely to be relevant. In this sense, we
hypothesize that wealth, employment, education and literacy, and being Gambian (rather than
foreigner) leads to more communal empowerment. Similarly, age is expected to be a positive
determinant of empowerment in the community, possibly with a diminishing marginal return. Apart
from economic means and other factors mentioned to far, better health might cause individuals to
feel more control over their life and therefore to feel more empowered in their communities. Gender
norms and social norms might also play a role. When it comes to marital status and position within
the household, household heads and married individuals might be more respected in their
communities. What is unclear is whether being married has the same effect for both genders.
Additionally, the type of marriage (polygamous or monogamous) could matter in terms of communal
empowerment as well.
Second, in terms of the empowerment at the individual level, the question is whether individuals rely
more on themselves or rather on their families or government. We expect that men rely more often
on themselves whereas women more on their families. Also, younger individuals are expected to rely
more on themselves and less on their families or the government. In terms of marital status and
position within the household, household heads and married individuals might rely more often on
their families whereas unmarried individuals on themselves. Furthermore, being employed, educated,
literate, and foreigner might cause individuals to rely rather on themselves than on their families or
the government. The effect of health is not clear ex ante. Concerning regional information, one can
hypothesize that rural dwellers put higher expectations on their families due to stronger social
networks in the villages and due to remittances sent from relatives working in the cities.
11
Furthermore, as a consequence of lower access to public goods in the villages, rural dwellers may
expect the government to introduce developmental programs and improve infrastructure.
Lastly, the effects of tribal belonging and religious belief are not clear ex ante and will not be
focused on in detail. However, it is important to include them in the analysis in order to control for
cultural differences in The Gambia.
3. Context and data
The dataset used in this analysis stems from a household survey that was conducted in The Gambia
in August 2008. The Gambia is the smallest country on the mainland of Africa, situated on the
Western coast of the continent. It spreads along the river Gambia and, except for its Atlantic
seaboard, it is entirely surrounded by Senegal. The climate is tropical with two distinct seasons – a
hot rainy season between June and November and a cooler dry season between November and May
(CIA, 2012). It belongs to the group of the least developed countries in the world, both from
economic and developmental point of view. With its GDP per capita of 590 US$ in 2008, The
Gambia falls into the Low Income group of countries. The GDP growth over the last five years has
been relatively high, though, with annual growth rates of over 6% between 2007 and 2010. In spite
of these relatively high growth rates, 48.4% of population lived below the national poverty line in
2010 (World Bank, 2012).From the developmental perspective, The Gambia ranked 155 out of 177
countries, i.e. in the Low Human Development group, according to the Human Development Index
(HDI) in 2007/2008. The socio-demographic situation is characterized by a low life expectancy at
birth (59 years for women and 56 years for men in 2008) and high fertility rates(5.1 births per
woman in 2008); the maternal mortality reached 360 deaths per 100,000 births in 2010 (World Bank,
2012). 90% of Gambians are Muslims (CIA, 2012) and polygamous marriages are very common.
Our data stems from the ‘Joint Rural Labor Force / Community Driven Development Project
(CDDP) Baseline Survey’ that was conducted in The Gambia in August 2008. The survey was
implemented in order to collect baseline data for an impact evaluation of World Bank’s CDDPs in

12
The Gambia and to study the characteristics of the Gambian rural labor force. A special module
containing capability-approach and empowerment related questions was added in order to gather new
unique data analyzed in this paper.6 The survey collected information both at household and
individual level. At the individual level, basic personal information, such as socio-demographic
characteristics, was collected for all household members. Specific information, e.g. information on
the Capability Approach, was gathered only for the survey respondents, who were mostly household
heads (83.9% of respondents in the final sample). Since the questions on empowerment were asked
within the block on the Capability Approach, our sample consists of one observation per household
which is always the respondent. The final sample comprises 2184 observations on individuals with
valid responses for all the variables used in the analysis.
Variables capturing empowerment in terms of communal and personal life are taken as dependent
variables (see section 2.1 for the specific questions). The first dependent variable captures
individuals’ ability to change something in their communal life. As for empowerment at the
individual level, one variable measures respondents’ desire for a change in their lives and another
variable captures respondents’ expectations about who will contribute most to changes in their lives:
respondents themselves (referred to as ‘myself’ hereafter), their family, the government, and other
actors.7 This variable is available only for those respondents who indicated that they want to change
something in their lives, i.e. the sample size for this dependent variable is smaller.
Table 3 gives an overview of the explanatory variables and of our hypotheses on how they affect
communal and individual empowerment. The variables encompass socio-demographic and socio-
economic characteristics, spatial information, and self-reported information on capabilities.
[Table 3 approximately here]
6 Since the sampling processes differed in rural and urban areas, the survey is not representative unless special sampling weights are applied. Our sample is not nationally representative given that only one household member was interviewed on empowerment related questions. 7 Originally, there were eight answer choices. Four of them (Village development committee, Our community (village), The ward development committee, and Don’t know) were subsumed into the already existing category ‘Other’. The main reason was an extremely low response rate for these categories (less than 2% for each category).
13
As outlined earlier, the socio-demographic variables that are expected to affect empowerment
include age, gender, marital status (currently not married, living in a monogamous marriage, living in
a polygamous marriage), position within the household (household head or regular household
member), religion (Muslim or other religion, i.e. majority or minority religion), ethnicity (tribe), and
foreigner status (Gambian or foreigner). Socio-economic variables include education (attended
school or not), literacy, economic activity (engages or is willing to engage in economic activities or
not), and two variables created to capture short-term and long-term economic well-being of the
household. Among the economic variables, short-term economic well-being is represented by the
logarithm of expenditure aggregate. In general, expenditure reflects the actual economic situation of
the household better than income because it is less volatile. We measure expenditure on 15 groups of
items per year and in equivalence scales. The second economic variable reflects household’s
accumulated wealth in form of assets, and therefore its long-term economic situation. Based on 16
household’s assets, a wealth index was created using polychoric principal component analysis (PCA)
following an approach by Filmer and Pritchett (2001), and refined by Kolenikov and Angeles (2009).
Based on the wealth index, a household’s wealth percentile was created.
Spatial information included refers to the area of residence of the household (rural or urban) and on
the local government area (LGA; the administrative unit in The Gambia). The self-reported
information on capabilities comprises respondents’ assessment of their health, accommodation,
happiness, and whether they are being treated with respect or unfairly. Only the health-related
variable will enter the regressions on empowerment.
4. Empirical results
This section presents both descriptive statistics and empirical results on correlates and determinants
of empowerment. Each indicator of empowerment is investigated in a different model, depending on
the nature of the indicator. We employ generalized ordered logit, binary probit, and multinomial logit
models. In addition, we test and correct for a possible sample selection bias in a Heckman probit

14
model. However, these models do not detect causal relationships due to possible endogeneity of
some explanatory variables, particularly reverse causality and simultaneity. Therefore, they detect
correlates of empowerment rather than its determinants. The second step of the analysis represents
an attempt to correct for possible endogeneity by applying a 2SLS technique. Given strong
simplifying assumptions that will be made in both stages of the 2SLS estimation, the corresponding
results are interpreted qualitatively rather than quantitatively.
4.1 Descriptive statistics
Table A1 in the appendix summarizes the descriptive statistics of respondents’ characteristics, both
overall and disaggregated by respondents’ “empowerment status” on communal and individual level.
Table A2 gives an overview of the empowerment variables, both overall and disaggregated by
respondents’ characteristics.
The average respondent (Table A1) is 47 years old, male, household head, Muslim, Gambian, with
no education, illiterate, economically active, and living in a monogamous marriage in rural area.
Most of the respondents live in the LGA Brikama and belong to the tribe Fula. The majority of
respondents is not limited at all in their daily activities by their health, feels happy, has suitable
accommodation, and is always treated with respect and never unfairly. An average respondent in the
restricted sample has the same profile, as shown in the column ‘Wants change’ in Table A1.
When looking at the distribution of empowerment at communal level (Table A2 in the appendix),
one half of the sample falls into the middle category (change possible albeit with difficulty), and one
third feels completely empowered in the sense that people like them can change things in their
community easily if they want to. At the individual level, most respondents (94%) wish to change
something in their lives. Out of them, one third of respondents relies on themselves, another third on

15
their family, one fourth has expectations towards the government and 7% of the sample rely on other
actors.8
4.2 Correlates and determinants of empowerment at communal level
The main objective of this section is to determine the respondents’ characteristics that are associated
with higher or lower levels of perceived empowerment at communal level. In response to the
question whether they feel that people like themselves can generally change things in their
community if they want to, the respondents could answer: ‘Yes, easily’, ‘Yes, with difficulty’ and
‘No, not at all’. The resulting variable is ordinal and is examined using the generalized ordered logit
model.9 The first column of Table 4 shows the estimated odds-ratios; variables which violate the
parallel regression assumption have two odds-ratios. Except for the variables not Muslim,
log(expenditure), and urban, all odds-ratios are significant at least at 10% significance level.10
[Table 4 approximately here]
The strongest effects are observed for foreigners as compared to the Gambians and for health-related
variables. In particular, the odds of feeling any degree of empowerment (‘change with difficulty’ or
‘change easily’) as compared to no empowerment in the community are 2.65 times higher for the
Gambians than for foreigners, holding all other variables constant.11 This is one of the few cases
8 There are some unexpected findings in the data: people completely limited by their health seem to rely on the government or on themselves rather than on their families. Furthermore, those being partially limited by their health feel disproportionately empowered in their communities. See also the discussion below on interpreting these effects. 9 A logit model is preferred over probit because the former offers the possibility to interpret coefficients in terms of odds-ratios. The originally preferred ordered logit model cannot be used because it is based on a parallel regression assumption, which means that the coefficients are assumed to be identical across all categories of the dependent variable. This assumption was tested by both the Brant test and the approximate Likelihood Ratio test, as proposed by Long and Freese (2006), and was rejected at 1% significance level. The generalized ordered logit model, proposed by Williams (2006), starts with the parallel regression assumption but allows estimating separate coefficients for comparison of adjacent categories for those variables for which the parallel regression assumption is violated. These variables include
foreigner, literate, log(expenditure), urban, four regional variables (LGAs), and the tribe Wollof. The significance level used for testing the parallel regression assumption was set to 5%. 10 Despite being individually insignificant, the variables on tribal belonging are jointly significant at 5% significance level. 11 The odds-ratios represent a comparison between the category represented by the dummy variable and the base category. In order to compare the reverse, i.e. the left-out category with the category in the regression, the inverse of the odds-ratio must be taken (1/odds-ratio). Since odds-ratios higher than 1 are easier to comprehend than those below 1, the

16
when two separate coefficients were estimated and one notices that the second odds-ratio, which
compares full empowerment with partial or no empowerment, is lower both in magnitude and
significance. Concerning health, the changes in odds are even larger. People limited a lot by their
health have 2.98 times higher odds to feel more able to change their communal life than people with
a complete health limitation, which is the strongest effect in the regression. Remarkably, the odds
when comparing absolutely healthy people to those completely limited are not as strong (2.34).
Education (odds-ratio 1.52) and literacy (odds-ratio 1.44; comparison of any degree of empowerment
to no empowerment) are also important correlates of higher levels of communal empowerment.
Further effects that are significant and of considerable magnitude occur for gender, economic
activity, and marital status. In particular, people living in polygamous marriages feel more able to
change matters in their communities than both unmarried respondents (odds-ratio 1.41) and
monogamously married people (odds-ratio 1.24). Additionally, there are regional effects of
considerable magnitude which will not be elaborated in further detail. Variables representing age and
wealth have statistically significant but economically insignificant coefficients; the variable
distinguishing household head from an ordinary household member is only marginally significant.
Some explanatory variables, namely education, literacy, economic activity, and wealth may suffer
from endogeneity problems such as reverse causality or unobserved heterogeneity. It is not clear a
priori whether these four variables enable and facilitate empowerment or whether they result from
empowerment. Since they are important and significant correlates of empowerment, as indicated
both in our analysis and in various empirical studies presented in section 2, we correct for possible
endogeneity in an instrumental variables approach.12 The 2SLS procedure yields qualitatively similar
comparisons will always be made for the constellation in which the odds-ratio is larger than 1. All the interpretations that follow are to be understood as holding all other explanatory variables constant. 12 We apply the 2SLS method in order to correct for possible endogeneity biases. In the first stage, the instrumental variables (IVs) chosen for respondents’ education, literacy, and economic activity are average education, literacy, and engagement in paid work in respondent’s village. The calculation is based on all adults in the village (available in our data) except for the respondent. As for wealth percentile, which is measured at household level, the IV is the average wealth percentile in respondent’s village. Again, the calculation is based on all households in the village except for the respondent’s household. All IVs are individually significant with regard to their respective endogenous variables and they are also jointly significant in all first stage regressions, see Table A3. We believe that these instruments do not
17
results to OLS (see columns 2 and 3 in Table 4) which supports the view that these variables can be
interpreted causally as determinants of communal empowerment.
In Table A4, we calculate the changes in the probability of feeling a certain degree of communal
empowerment when the explanatory dummy variable switches from 0 to 1, i.e. the marginal effects.
Table A4 summarizes the changes in these probabilities evaluated at the median of the explanatory
variables and indicates whether they are statistically significant. Most of them lie between 3 and 8
percentage points (p.p. hereafter) although some changes are substantially larger, up to 21.1 p.p..
Health, which was confirmed as a significant determinant of communal empowerment also in the
2SLS, shows the largest effects, as expected from the analysis of the odds-ratios. The health-related
variable comprises four ordered categories. Probability changes between virtually all combinations
of these four categories are significant, which means that the effects occur not only when comparing
the worst category (‘health completely limiting’) to any better category but also when comparing the
categories gradually. This result was not visible in the regression in the first column of Table 4. The
results regarding health can be summarized as follows: Generally, less limiting health leads to a
significantly lower probability of individuals thinking that they cannot change anything at all and to a
higher probability of thinking that they can change things in their community easily. It also leads to a
lower probability in the middle category (‘change with difficulty’) but these effects are not always
significant and are smaller in magnitude.
Another interesting finding concerns the effect of gender and marital status. For women, the
probability to feel no empowerment at all or partial empowerment is higher by 3.3 and 2.8
percentage points than for men, respectively. Accordingly, the probability to be able to change things
easily is 6.1 p.p. higher for men than for women. Concerning marital status, statistically significant
directly influence our dependent variable, i.e. they are exogenous. Their exogeneity together with their relevance (they affect the endogenous explanatory variables significantly) make them valid instruments.
The second stage of the 2SLS has been estimated with some simplifications: The dependent variable is treated as a continuous variable that indicates ascending easiness in changing one’s community life. Four variables are statistically significant in the 2SLS estimation: age, marital status, education, and health. All of these variables show stronger effects than they have in the OLS regression, see columns 2 and 3 of Table 4.
We are happy to provide more information on this analysis upon request.

18
differences occur between polygamous and monogamous marriages, and between polygamous
marriages and people living without a partner (i.e. never married, divorced, widowed). Generally,
people in polygamous marriages feel more empowered – the probability that they can change things
easily is 7.7 and 4.9 p.p. higher for them than for unmarried and for those living in monogamous
marriages, respectively. Since polygamy affects men and women in a different way, a new estimation
was made allowing for interactions between marital status and gender. The results are shown in the
lower panel of Table A4. As expected, it is explicitly the polygamous men who turn out to feel more
influential in their communities. The probability that they feel fully empowered is significantly
higher when compared to unmarried males (14.0 p.p.), to men living in monogamous marriages (7.2
p.p.) and to women living in polygamous marriages (15.6 p.p.). At the same time, polygamous men
feel hardship or powerlessness in changing their communal life with a significantly lower probability
than their counterparts, the effects lie between 2.8 and 7.9 p.p.. As for the monogamously married
men, there is weak evidence that they feel more empowered when compared to unmarried men and
to women in monogamous marriages. In the light of these findings, the gender and marital status
effects observed in the original specification are misleading. In particular, lower female
empowerment occurs only within (polygamous) marriages. Marital effects emerge only for men:
married men feel more influential than unmarried men and men living in polygamous marriages feel
generally more empowered in their communities.
The remaining two effects concern education and age. People who went to school tend to feel
completely empowered with a higher probability (9.7 p.p.) than their counterparts. In contrast, those
who did not go to school are significantly more prone to feel difficulties in changing things (6.2 p.p.
higher probability) or not being able to change anything at all in their community (3.6 p.p. higher
probability). Given that a comparison of the OLS and 2SLS regressions in Table 4 indicates a large
downward endogeneity bias one can assume that the effects of education on communal
empowerment are in reality considerably larger than what was estimated in Table A4. Concerning
the age, there is a positive diminishing effect. Getting older means more empowerment and less

19
disempowerment in the community. However, this effect is strong only for young people and it
becomes less prevalent as they grow older, until it disappears completely. For example, becoming 10
years older means a 4.5 p.p. higher probability of full empowerment for a 20-year-old individual but
only a 1.9 p.p. higher probability for a 40-year old.13 For a 60-year old person, the probability
becomes negative and insignificant. The turning point, after which there is a negative marginal effect
of age on empowerment in the community, was estimated at 56 years of age.
4.3 Correlates and determinants of empowerment at individual level
We now shift from empowerment at the communal level to empowerment at the individual level. In
order to analyze this issue, two stages will be considered in the analysis. In the first stage, the focus
will be on respondents’ desire to change something in their lives. Although it does not represent
empowerment per se, it determines whether data on individual empowerment were collected.
Therefore, its correlates will be examined. In the second stage, perceptions of individual
empowerment will be explored conditionally on the existence of the desire for change. In particular,
the question of interest will be who is expected to contribute most to any changes in respondent’s
life.
4.3.1 Desire to change something in one’s life
When looking for correlates of the desire to change something in one’s life at individual level, two
specifications will be estimated. First, a probit model without self-reported capability variables will
be fitted.14 Subsequently, capability variables will be added in order to see whether self-reported
variables alter the explanatory power of objectively observed variables and whether they have added
value in analyzing empowerment-related issues. Table 5 shows results of both probit specifications.
The first column indicates that age, religion, schooling, and wealth are statistically significant
correlates of the desire for change. There are also regional effects. When self-reported variables on
13 The latter effect corresponds to ‘10 years increase around the median’ in Table A4. 14 Although a logit model was preferred in the previous section due to the possibility to interpret results in terms of odds-ratios, a probit model is the preferred one in this section. One of the reasons is its comparability to a Heckman probit model which will be estimated later.

20
respondents’ capabilities are added, none of the variables from the previous specification loses its
importance. On the contrary, the coefficients generally become higher and are at least as significant
as before. The only exception is wealth – its coefficient is relatively small in the first specification
and it decreases further in the second regression, approximately by 40%, but stays significant. The
newly added capability variables include health, happiness, accommodation, and perceptions
regarding respectful and unfair treatment. All of them are highly significant.
[Table 5 approximately here]
Overall, the coefficients in the second column of Table 5 indicate a negative association between the
desire for change and age, not being Muslim (i.e. belonging to a religious minority), being a
foreigner, having formal education, and being wealthy. Regarding the self-reported variables, the
effects can be grouped into three categories. First, there are straightforward effects of happiness and
quality of accommodation – more happiness and better accommodation decrease the desire for
change. Second, there seem to be nonlinear effects of health and respectful treatment in the sense that
more respectful treatment and less health limitations are associated with decreases in the desire for
change at first but with increases in such a desire afterwards. For instance, those who are treated with
respect always or occasionally seem to be more prone to wish to change their lives than their
counterparts who are treated with respect frequently. Lastly, there is a rather counter intuitive finding
on unfair treatment – those who are treated unfairly less often show bigger desire for change. It is
striking that this pattern holds even when controlling for socio-demographic characteristics and
subjective measures of life satisfaction.
When we calculate the marginal effects, i.e. the changes in probabilities at the mean of the
explanatory variables, we find that nearly all self-reported capability variables show marginal effects
that are both statistically and economically significant (results not shown). Happiness and good
accommodation lead to less need to change things in one’s life – the marginal effects are around 3
p.p. and 5 p.p., respectively. The marginal effects corresponding to better health and more respect are
approximately -2.7 p.p. and -3.4 p.p., respectively. However, they are substantial only when the

21
average individual moves out of the worst health or respect-related category and they become rather
negligible with further improvements. Overall, these results confirm the expectation that the desire to
change one’s life depends on both objectively observable and self-reported variables. What is more,
persons’ self-reported capabilities seem to be much more relevant than their socio-demographic
characteristics.
4.3.2 Correlates and determinants of empowerment at individual level
After studying the determinants of wishing to change things, the following analysis is performed
conditionally on the existence of such a desire. Respondents’ expectations about actors contributing
most to changes in their lives will be examined in order to find their correlates and determinants.
Actors who can bring about changes in respondents’ lives are respondents themselves, their families,
the state government, and other actors. Given that these categories are represented by a nominal
variable, a multinomial logit model was employed in order to make pairwise comparisons between
all categories. Table 6 shows the resulting six sets of odds-ratios.15 The last three columns show that
odds-ratios related to the category ‘other actors’ are hardly ever significant. Therefore, the following
analysis will focus only on pairwise comparisons among the remaining three categories. Generally,
respondents’ ability to change their lives on their own is significantly influenced by their age, gender,
health, and foreigner status. Reliance on family depends on economic activity of the individual.
Expectations towards government depend on wealth and area of residence of the household. Lastly,
marital status is correlated with the decision whether to rely on government or family. A more
detailed analysis of these general patterns follows.
[Table 6 approximately here]
When comparing the categories ‘myself’ and ‘family’, the strongest effects in the whole regression
emerge for health, gender, and foreigner variables. Health-related variables show the strongest
effects overall but their direction are somewhat surprising. According to the results, respondents
15 The corresponding marginal effects evaluated in terms of changes in probabilities at the median of the explanatory variables are shown in Table A5.

22
completely limited by their health are much more prone to rely on themselves (rather than on their
family) than people with less or even no health-related limitations. In particular, the odds of relying
on themselves are 3.63 and 4.14 times higher for the completely limited individuals when compared
to those a lot limited and somewhat limited, respectively. This means that less limited people are by
263% and 314% more prone to rely on their families when compared to the disabled individuals.
What is more, even those who are not limited at all have 1.76 times higher odds to expect their
family to change their life than the disabled respondents. One possible explanation is that disabled
individuals have learned that they cannot rely much on others in this generally poor socio-economic
environment and consequently expect not much assistance. With regard to other substantial effects,
women, when compared to men, are 2.75 times more prone to rely on their families than on
themselves. Foreigners, on the other hand, tend to rely on themselves 2.43 times more often than the
Gambians. Furthermore, economically inactive people are 1.67 times more prone to expect their
families to contribute to changes in their own lives. Lastly, age shows a positive effect in favor of
reliance on the family; the economic significance is negligible, though. Those effects are all in line
with the hypotheses stated above.
The same pattern (in favor or to the detriment of the category ‘myself’) emerges also when
comparing the choices ‘myself’ and ‘government’. The magnitudes of the odds-ratios are smaller,
though, and the economic activity variable is insignificant. Instead, the area of residence is
significant – urban dwellers are 1.61 times more prone to rely on themselves than rural dwellers and
the inhabitants of rural areas are, correspondingly, by 61% more likely to rely on the government
than urban residents. The wealth percentile is statistically but not economically significant.
The last comparison comprises the categories family and government. Wealth and urbanization
effects are similar to the previous case. Whereas the magnitude of the urbanization odds-ratio is
smaller than it was in case of myself-government comparison, the wealth odds-ratio is larger, albeit
still economically insignificant. Furthermore, economic activity is statistically significant:
economically inactive people expect more support from their families whereas the active ones rely

23
1.84 times more often on the government. A very similar effect was present in the myself-
government comparison as well. What is completely new are the marital status effects. People living
in polygamous marriages tend to expect more from their families than from the government – they
do 1.59 and 1.34 times more often than unmarried and monogamous people, respectively.
As was already mentioned, the variable measuring empowerment at individual level is observed only
for those respondents who indicated that they want to change something in their lives. This is a
potential source of sample selection bias because the restricted sample was selected in a non-random
way. Despite the non-random sampling, there are two indications that the sample selection bias
might not be present. First, the fraction of the “excluded” observations is small (6% of the full
sample). Second, the selection criterion is correlated only with a few explanatory variables from the
empowerment-regression. More precisely, most of the objectively observable respondents’
characteristics turned out to be either statistically or economically insignificant when the desire for
change was modeled in section 4.3.1, see Table 5. Both these facts indicate that the correlates of
empowerment at individual level, which were presented in the previous section, should not be
affected greatly by the sample selection. Nevertheless, we run a separate Heckman probit model for
each of the actors (‘myself’, ‘family’, ‘government’) in order to provide empirical evidence for such
a statement. Table A6 shows sample-selection-adjusted Heckman probit and unadjusted probit
models for each actor. The signs and significances of coefficients in the Heckman probit model are
consistent with the multinomial logit estimations presented in Table 6. Also, the differences between
Heckman probit and unadjusted probit models are rather negligible. Therefore, we conclude that the
sample selection, although it is indicated by a Likelihood Ratio test, is clearly of little practical
importance and does not alter the results substantially.16
Similarly to the communal empowerment, we run a 2SLS regression in order to avoid possible
endogeneity bias in education, literacy, economic activity, and wealth. A linear probability model is
16 The Likelihood Ratio test of independent equations shows that there is a sample selection bias in case of actors ‘myself’ (p-value 0.025) and ‘government’ (p-value 0.007); ‘family’ equation does not suffer from this problem (p-value 0.402).

24
estimated in the second stage for each actor separately (see Table A7 for the first stages and Table
A8 for the second stages and simple OLS results for comparison).17 The 2SLS identifies health,
gender, foreigner status, position within the household, and economic activity as the main
statistically and economically significant determinants of empowerment at individual level; marital
status and literacy are only marginally significant.
To sum up the main results, partially disabled people tend to rely on their families and government
whereas those with great or no health problems expect to change their lives on their own. Women, as
compared to men, are less prone to rely on themselves and more prone to expect their families to
change their own lives. The opposite is true for foreigners – they expect to change their lives on their
own whereas the Gambians rely more often on their families. Also, people not engaged and not
planning to engage in economic activities feel more often than their counterparts that their families
will contribute to changes in their lives. Regarding marital status, monogamously married people rely
more often on government than those living in polygamous marriages. Lastly, literate respondents
are more prone to rely on their government than their illiterate counterparts.
4.4 Discussion of the results
A qualitative summary of the results obtained in all estimations is shown in Table 7.
[Table 7 approximately here]
The correlates of empowerment at communal level in The Gambia were found to be age, gender,
marital status and arrangement, foreigner status, education, literacy, economic activity, health, and to
a lesser extent also the area of residence and wealth. In particular, age was shown to have a positive
but diminishing marginal effect, and gender effects were found to depend on the marital status and
arrangement. Surprisingly, household headship and the wealth status of the household have no
(economically) significant effect on empowerment in the community. While most findings confirm
17 The Hausman test of endogeneity indicates that there is no endogeneity bias in the category ‘myself’ (p-value 0.333), whereas endogeneity is a problem in case of categories ‘family’ and ‘government’ (p-value 0.015 and 0.039, respectively).

25
our hypotheses stated above, a surprising finding was found in case of the health status: a lot limited
individuals feel fully empowered more often than anyone else, even than those completely healthy.
Correcting for possible endogeneity of education, literacy, economic activity, and wealth confirmed
age, marital status, education, and health as significant determinants of communal empowerment.
In terms of the ability to change aspects in one’s life at individual level, the analysis comprised two
stages. In the first stage, the focus was on individuals’ desire to change something in their lives. The
results indicate that the desire to change one’s life depends both on objectively observable
characteristics and self-reported capabilities. The latter are much more important than the observable
socio-demographic and economic characteristics.
In the second stage of the analysis, expectations about the actors contributing to any changes in one’s
life were analyzed, conditionally on the existence of a desire for change. Gender, foreigner status,
age, and health are significant correlates of respondents’ reliance on themselves or their families. In
case of expectations towards the family, wealth of the household and economic activity of the
respondent are relevant as well. The correlates of expectations towards the government are the area
of residence, age, wealth, health, literacy, and marital status. Most of these effects are in line with
what was expected. However, the health variable yielded a surprising result again: the disabled
individuals were found to believe that they themselves will contribute most to any changes in their
lives. Testing for possible sample selection bias showed no considerable deviations from the original
results. When correcting for possible endogeneity, we concluded that the category ‘myself’ does not
suffer from endogeneity problems. Thus, gender, foreigner status, age, and health are determinants of
empowerment at individual level. The results in case of categories ‘family’ and ‘government’ are less
clear. Nevertheless, marital status, economic activity, and health are confirmed as determinants of
empowerment in the ‘family’ regression.
To sum up, age, health, and marital status are determinants of empowerment at both individual and
communal level. Additionally, whereas education determines positively communal empowerment,
gender, foreigner status, and economic activity determine empowerment at individual level. Given

26
these findings, policy interventions oriented at improvements in education and health sectors could
lead to a rise in empowerment of less educated groups and of individuals constrained by their health
problems.
5. Conclusion
The concept of empowerment is closely related to agency and thereby to human development. Since
both agency and empowerment are not only intrinsically valuable but also instrumentally important
for poverty reduction, this study investigated empirically the correlates and determinants of
empowerment and agency. Further we asked which socio-demographic groups feel particularly
empowered.
In our empirical analysis, we focused on empowerment at communal and individual level.
Individuals’ ability and willingness to induce changes in their lives as well as respondents’
expectations about the actors who will most contribute to any changes in their lives were examined
using a unique dataset from The Gambia. It contains not only new and superior direct measures of
agency and empowerment but also self-reported data on capabilities. We included the latter in our
analysis in order to complement socio-demographic and economic characteristics of respondents.
Most importantly, this analysis is concerned with empowerment in general terms, i.e. no particular
group is focused on a priori. In this sense it is a pioneer work because it gives new and valuable
insights into empowerment of various socio-demographic groups in a developing country setting, not
exclusively into women’s empowerment. Additionally, econometric techniques aimed at correcting
for possible sample selection and endogeneity biases have been applied.
This work was a first attempt to determine which characteristics and capabilities of individuals in a
developing country setting are particularly relevant and causal for their empowerment. Future
research could deploy more sensible econometric techniques such as General Method of Moments
(GMM) in order to deal with endogeneity in a more sophisticated way. Also, availability of panel
data would be of great importance as it would enable to explore changes in empowerment over time.
27
References
Alkire, S., 2005. Subjective quantitative studies of human agency. Social Indicators Research, 74,
pp. 217–260.
Alkire, S., 2009. Concepts and Measures of Agency. In: Basu, K., S. M. R. Kanbur and A. Sen, eds.
2009. Arguments for a Better World. Essays in Honor of Amartya Sen Vol. 1, Ethics, Welfare and
Measurement. Oxford; New York: Oxford University Press. pp. 455-474.
Allendorf, K., 2007a. Do Women’s Land Rights Promote Empowerment and Child Health in Nepal?
World Development, 35(11), pp. 1975-1988.
Allendorf, K., 2007b. Couples’ Reports of Women’s Autonomy and Health-care Use in Nepal.
Studies in Family Planning, 38 (1), pp. 35–46.
Allendorf, K., 2012. Women’s Agency and the Quality of Family Relationships in India. Population
Research and Policy Review, 31 (2), pp. 187–206.
Alsop, R., M. F. Bertelsen and J. Holland, 2006. Empowerment in Practice: From Analysis to
Implementation. Washington D.C.: World Bank.
Alsop, R. and N. Heinsohn, 2005. Measuring Empowerment in Practice: Structuring Analysis and
Framing Indicators. Policy Research Working Paper. World Bank.
Anderson, S. and M. Eswaran, 2009. What Determines Female Autonomy? Evidence from
Bangladesh. Journal of Development Economics, 90 (2), pp. 179–191.
Appleyard, S., 2002. A Rights-Based Approach to Development: What the policy documents of the
UN, development cooperation and NGO agencies say. Background Paper for Human Rights
Roundtable No. 1: “A rights-based approach to development”. Office of the United Nations High
Commissioner for Human Rights, Asia-Pacific.
Chambers, R., 1993. Challenging the Professions: Frontiers for Rural Development. London:
Intermediate Technology Publications.

28
Chirkov, V., R. M. Ryanand C. Willness, 2005. Cultural context and psychological needs in Canada
and Brazil: testing a self-determination approach to the internalization of cultural practices,
identity, and well-being. Journal of Cross-Cultural Psychology, 36, pp. 423–443.
CIA. 2012. The World Factbook: The Gambia. Central Intelligence Agency. Version updated on
September 11, 2012; accessed on October 7, 2012. www.cia.gov/library/publications/the-world-
factbook/geos/ga.html
Filmer, D. and L. Pritchett, 2001. Estimating Wealth Effect Without Expenditure Data – Or Tears:
An Application to Educational Enrollments in States of India. Demography, 38, pp. 115-132.
Garikipati, S., 2008. The Impact of Lending to Women on Household Vulnerability and Women’s
Empowerment: Evidence from India. World Development, 36 (12), pp. 2620–2642.
Grootaert, C., 2003. Assessing Empowerment in the Eca Region. Paper given at the World Bank
Workshop on Measuring Empowerment: Cross-disciplinary Perspectives. Washington D.C.
Gupta, K. and P. P. Yesudian, 2006. Evidence of Women’s Empowerment in India: a Study of
Socio-spatial Disparities. GeoJournal, 65 (4), p.p. 365–380.
Hindin, M. J., 2000. Women’s Power and Anthropometric Status in Zimbabwe. Social Science and
Medicine, 51, pp. 1517-1528.
Ibrahim, S. and S. Alkire, 2007. Agency and Empowerment: A Proposal for Internationally
Comparable Indicators. Oxford Development Studies, 35(4), pp. 379-403.
Jackson, C., 1996. Rescuing Gender from the Poverty Trap. World Development, 24(3), pp. 489–504.
Jejeebhoy, S. J., 2000. Women’s autonomy in rural India: Its dimensions, determinants and the
influence of context. In: Presser, H. and G. Sen, eds. 2000. Women‘s Empowerment and
Demographic Processes. New York: Oxford University Press.
Jejeebhoy S. J. and Z. A. Sathar, 2001. Women’s Autonomy in India and Pakistan: The Influence of
Religion and Region. Population and Development Review, 27, pp. 687-712.

29
Kabeer, N., 1999. Resources, agency, achievements: reflections on the measurement of women's
empowerment. Development and Change, 30(3), pp. 435-464.
Khwaja, A. I., 2005. Measuring empowerment at the community level: an economist’s perspective.
In: Narayan, D., ed. 2005. Measuring Empowerment: Cross-Disciplinary Perspectives.
Washington D.C.: World Bank. pp. 267–284.
Kim, J. C., Ch. H. Watts, J. R. Hargreaves, L. X. Ndhlovu, G. Phetla, L. A. Morison, J. Busza, J. D.
H. Porter and P. Pronyk, 2007. Understanding the Impact of a Microfinance-Based Intervention
on Women’s Empowerment and the Reduction of Intimate Partner Violence in South Africa.
American Journal of Public Health, 97 (10), pp. 1794–1802.
Klasen, S., 2000. Measuring Poverty and Deprivation in South Africa. Review of Income and Wealth,
46 (1), pp. 33–58.
Kolenikov, S. and G. Angeles, 2009. Socioeconomic Status Measurement with Discrete Proxy
Variables: Is Principal Component Analysis A Reliable Answer? Review of Income and Wealth,
55 (1), pp. 128–165.
Lokshin, M. and M. Ravallion, 2005. Self-Rated Power and Welfare in Russia. In: Narayan, D., ed.
2005. Measuring Empowerment: Cross-Disciplinary Perspectives. Washington D.C.: World
Bank. pp. 177-195.
Long, J. S. and J. Freese, 2006. Regression Models for Categorical Dependent Variables Using
Stata. College Station, Tex.: Stata Press.
Malena, C., 2003. Measuring empowerment at the national level: the case of the CIVICUS Civil
Society Index (CSI).Paper given at the World Bank Workshop on Measuring Empowerment:
Cross-disciplinary Perspectives. Washington D.C.

30
Malhotra, A. and M. Mather, 1997. Do Schooling and Work Empower Women in Developing
Countries? Gender and Domestic Decisions in Sri Lanka. Sociological Forum, 12(4), pp. 599-
630.
Malhotra, A., Schuler, S. R. and C. Boender, 2002. Measuring Women’s Empowerment as a
Variable in International Development. Washington D.C.: The World Bank.
Malhotra, A. and S. R. Schuler, 2005. Women’s empowerment as a variable in international
development. In: Narayan, D., ed. 2005. Measuring Empowerment: Cross-Disciplinary
Perspectives. Washington D.C.: World Bank. pp. 219–246.
Mason, K. O. and H. Smith, 2003. Women’s Empowerment and Social Context: Results from Five
Asian Countries. Washington D.C.: Gender and Development Group, World Bank.
Mayoux, L., 2000. From Access to Empowerment: Gender Issues in Micro-Finance. CSD NGO
Women’s Caucus Position Paper for CSD-8.
McMillan, B., Florin, P., Stevenson, J., Kerman, B. and R. Mitchell, 1995. Empowerment Praxis in
Community Coalitions. American Journal of Community Psychology, 23(5), pp. 699–728.
Moser, C., 1991. Gender Planning and Development. London: Routledge.
Narayan, D., 2000. Voices of the Poor: Can Anyone Hear Us? New York: Oxford University Press.
Narayan, D., 2005. Conceptual Framework and Methodological Challenges. In: Narayan, D., ed.
2005. Measuring Empowerment: Cross-Disciplinary Perspectives. Washington D.C.: World
Bank. pp. 3-38.
Rowlands, J., 1997. Questioning Empowerment: Working with Women in Honduras. Oxford: Oxfam.
Roy, T. K. and S. Niranjan, 2004. Indicators of Women’s Empowerment in India. Asia-Pacific
Population Journal, 19 (3).
Samman, E. and M. E. Santos, 2009. Agency and Empowerment: A review of concepts, indicators
and empirical evidence. Background paper for the 2009 Human Development Report in Latin

31
America and the Caribbean on Agency, Empowerment and the Intergenerational Transmission of
Inequality in Latin America.
Sen, A., 1985. Well-being, agency and freedom: the Dewey Lectures 1984. The Journal of
Philosophy, 82, pp. 169–221.
Stock, J. H. and M. W. Watson, 2011. Introduction to Econometrics. Boston: Addison-Wesley.
Strandberg, N., 2001. Conceptualizing Empowerment as a Transformative Strategy for Poverty
Eradication and the Implications for Measuring Progress. Paper given at United Nations
Division for the Advancement of Women Expert Group Meeting. New Delhi.
Thomas, D., 1997. Incomes, Expenditures, and health Outcomes: Evidence on Intra-household
Resource Allocation. In: Lawrence H., J. Hoddinnott and H. Alderman, eds. 1997. Intra-
household Resource Allocation in Developing Countries: Models, Methods and Policy.
Baltimore; London: John Hopkins University Press.
UNDP, 2011. Human Development Report 2011. Sustainability and equity : a better future for all.
New York: United Nations Development Programme.
Williams, R., 2006. Generalized Ordered Logit/ Partial Proportional Odds Models for Ordinal
Dependent Variables. The Stata Journal, 6(1), pp. 58-82.
World Bank, 2001. World Development Report 2000/2001. Attacking Poverty. New York: Oxford
University Press.
World Bank, 2012. World Development Indicators: The Gambia. Accessed on October 7, 2012.
http://data.worldbank.org/country/gambia

32
Tables
Type of power Type of empowerment
Power from within Empowerment as change:
changing aspects in one’s life at individual level
Note: Based on Ibrahim and Alkire (2007), p. 388.
Table 1: Four types of power and empowerment
Power over Empowerment as control:
control over personal decisions
Power to Empowerment as choice:
domain-specific autonomy, household decision-making
Power with Empowerment in community:
changing aspects in one’s life at communal level

33
Stu
dy
Sam
ple
Esti
mat
ion
meth
od
Co
rrec
tio
n f
or
end
og
en
eit
yC
orr
ela
tes/d
ete
rmin
ants
Gu
pta
an
d Y
esu
dia
n (
200
6)ev
er-
mar
ried
wo
men
in I
nd
ialo
git
reg
ressi
on
no
ed
ucat
ion
, lit
eracy
, ag
e,
mas
s m
edia
exp
osu
re,
ho
useh
old
wea
lth
Allen
do
rf (
2007
a)
fem
ale
agri
cult
ura
l wo
rkers
in
Nep
al
OL
S, l
og
it r
egre
ssi
on
no
ow
ner
sh
ip o
f la
nd
or
liv
esto
ck,
eff
ecti
ve
lan
d o
r liv
esto
ck
rig
hts
,
pay
fo
r w
ork
, p
osit
ion
in
th
e
ho
useh
old
, ag
e, e
du
cat
ion
,
cas
te, re
ligio
n
Allen
do
rf (
2012
)m
arr
ied
mo
ther
s in
In
dia
OL
Sn
o
fam
ily r
elat
ion
sh
ip q
ual
ity
,
are
a o
f re
sid
ence,
ag
e,
ed
ucat
ion
, em
plo
ym
ent
ou
tsid
e
the
ho
useh
old
Lo
ksh
in a
nd
Rav
alli
on
(20
05)
ad
ult
s in
Ru
ssi
ao
rder
ed
pro
bit
reg
ress
ion
no
inco
me,
gen
der,
ed
uca
tio
n,
ag
e, e
mp
loy
men
t
Gar
ikip
ati (
200
8)w
om
en
in
In
dia
2S
LS
to
bit
-lo
git
reg
ress
ion
yes
ed
ucat
ion
, p
art
icip
ati
on
in a
mic
rocre
dit
pro
gra
m,
ho
useh
old
wea
lth
An
ders
on
an
d E
swara
n (
200
9)h
ou
seh
old
head
s’ w
ives
in B
ang
lad
esh
2S
LS
yes
val
ue
of
ass
ets, t
ime
wo
rked
,
ear
nin
gs
fro
m w
ork
, ag
e,
po
siti
on
in t
he h
ou
seh
old
Tab
le 2
: Em
pir
ical
stu
die
s o
f co
rrel
ates
and
det
erm
inan
ts o
f em
po
wer
men
t

34
Ty
pe
of
vari
ab
leV
aria
ble
Ori
gin
al s
cal
eM
easu
rem
en
tC
om
mu
nal e
mp
ow
erm
ent
Ind
ivid
ual
em
po
wer
men
t
age
card
inal
year
so
lder
yo
un
ger
gen
der
no
min
al
du
mm
ym
en
men
mar
ital
sta
tus
no
min
al
set
of
3 d
um
mie
sm
arr
ied
un
marr
ied
po
siti
on
wit
hin
th
e h
ou
seh
old
no
min
al
du
mm
yh
ou
seh
old
head
reg
ula
r h
ou
seh
old
mem
ber
relig
ion
no
min
al
du
mm
yu
ncle
ar
un
cle
ar
eth
nic
ity
no
min
al
set
of
7 d
um
mie
su
ncle
ar
un
cle
ar
fore
ign
er s
tatu
sn
om
inal
du
mm
yG
amb
ian
fore
ign
er
edu
cat
ion
no
min
al
du
mm
yed
uca
ted
edu
cate
d
litera
cyn
om
inal
du
mm
ylite
rate
litera
te
eco
no
mic
act
ivit
yn
om
inal
du
mm
yem
plo
yed
/ e
co
no
mic
ally
act
ive
emp
loy
ed
/ e
co
no
mic
ally
act
ive
exp
end
itu
re (
sh
ort
-ter
m w
ell-
bei
ng
)ca
rdin
al
log
arit
hm
weal
thy
(mea
sure
d a
t h
ou
seh
old
lev
el)
wea
lth
ind
ex (
lon
g-t
erm
well-
bei
ng
)ca
rdin
al
perc
enti
lew
eal
thy
(mea
sure
d a
t h
ou
seh
old
lev
el)
rura
l or
urb
ann
om
inal
du
mm
yu
ncle
ar
urb
an
local
go
vern
men
t are
an
om
inal
set
of
8 d
um
mie
su
ncle
ar
un
cle
ar
heal
th s
tatu
so
rdin
al
set
of
4 d
um
mie
sh
ealt
hy
un
cle
ar
acco
mm
od
ati
on
ord
inal
set
of
3 d
um
mie
s-
-
hap
pin
ess
ord
inal
set
of
3 d
um
mie
s-
-
trea
ted
wit
h r
esp
ect
ord
inal
set
of
3 d
um
mie
s-
-
trea
ted
un
fair
lyo
rdin
al
set
of
4 d
um
mie
s-
-
Exp
ecta
tio
ns r
eg
ard
ing
wh
ich
gro
up
s a
re m
ore
em
po
wer
ed
Tab
le 3
: Ove
rvie
w o
f ex
pla
nato
ry v
aria
ble
s an
d e
xpec
ted
influ
ence
on
emp
ow
erm
ent
so
cio
-dem
og
rap
hic
so
cio
-eco
no
mic
reg
ion
al
sel
f-re
po
rted
cap
abili
ties
Exp
lan
ato
ry v
aria
ble
s

35
Determinants
OLS 2SLS
Age 0.014** 0.088**
Age squared -0.000** -0.001*
Female -0.107** -0.085
Not married -0.116** -0.237**
Monogamous marriage * -0.077** -0.246**
Polygamous marriage RC RC
Not household head 0.095* -0.123
Not Muslim 0.061 0.038
Foreigner 0.377*** 0.692* -0.238*** 0.145
Went to school 0.139*** 1.859**
Literate 1.438*** 1.044 0.058 0.091
Economically inactive -0.089** 1.605
Log(expenditure) 1.064 1.024 - -
Expenditure missing - -
Wealth percentile 0.002*** -0.015
Health completely limiting RC RC
Health a lot limiting 0.376*** 0.481***
Health somewhat limiting 0.192*** 0.401*
Health not limiting * 0.299*** 0.519**
Urban 1.372 0.853 -0.010 -0.031
LGA Banjul 0.203*** 0.832 -0.223*** -0.084
LGA Kanifing 0.333*** 0.793 -0.171*** -0.080
LGA Brikama * RC RC
LGA Mansakonko 0.317*** 1.243 -0.163** -0.228
LGA Kerewan 0.076 0.089
LGA Kuntaur 0.628** 1.031 -0.074 0.082
LGA Janjanbureh 0.220*** 0.104
LGA Basse 0.122** 0.211
Tribe Mandinka 0.006 0.001
Tribe Fula * RC RC
Tribe Wollof 0.753 1.267 0.005 -0.026
Tribe Jola -0.079 -0.170
Tribe Sarehuleh 0.149 -0.158
Tribe Sererr 0.071 -0.199
Other tribe -0.038 -0.398*
Constant - - 1.483*** -0.137
Table 4: Correlates and determinants of the ability to change things in one's community in a
generalized ordered logit model, OLS, and 2SLS
Explanatory variables
Ascending grade of easiness in inducing changes in one's community
Generalized ordered logit model
(Odds-ratios)
0.806**
RC
0.746**
0.709**
1.043**
1.000**
1.217
1.006**
1.516***
0.764**
1.286*
1.174
Note: The reference categories (RC) are displayed for discrete variables with more than two categories. The mode
categories are marked with an asterisk for discrete variables with more than two categories; they are left out for binary
variables. Significance levels are marked as follows: * 10%, ** 5%, *** 1%. Sample size: 2184 observations. Odds-ratios
from a generalized ordered logit model estimation are displayed in the 1st column. The generalized ordered logit model
estimates one coefficient for each variable under the parallel regression assumption. Two coefficients are estimated for
those variables where this assumption is violated. For those variables, the left column coefficient compares (Change
easily or Change with difficulty) and (Change not possible). The right column coefficient compares (Change easily) and
(Change with difficulty or Change not possible).
Correlates
1.327
0.886
0.813
1.679
1.028
RC
1.922***
1.513**
RC
1.275
1.725***
2.336***
RC
2.977***

36
Without self-reported
capability variables
With self-reported
capability variables
Age -0.013*** -0.014***
Female 0.044 0.172
Not married -0.087 -0.093
Monogamous marriage * -0.049 -0.061
Polygamous marriage RC RC
Not household head -0.083 -0.185
Not Muslim -0.411** -0.544**
Foreigner -0.230 -0.316*
Went to school -0.254* -0.286**
Literate 0.023 0.089
Economically inactive -0.114 -0.084
Log(expenditure) 0.020 0.033
Expenditure missing -0.097 -0.084
Wealth percentile -0.013*** -0.008**
Health completely limiting RC
Health a lot limiting -0.891**
Health somewhat limiting -0.764*
Health not limiting * -0.574
Unhappy RC
Happy * -0.285
Very happy -0.719***
Accommodation unsuitable RC
Accommodation suitable * -0.557***
Accommodation very suitable -1.110***
Respected never or occasionally RC
Respected frequently -1.030***
Respected always * -0.643*
Treated unfairly always RC
Treated unfairly frequently 0.429*
Treated unfairly occasionally 0.427**
Treated unfairly never * 0.475**
Urban -0.098 -0.074
LGA Banjul -0.435* -0.538**
LGA Kanifing -0.819*** -0.853***
LGA Brikama * RC RC
LGA Mansakonko -0.178 -0.126
LGA Kerewan -0.722*** -0.797***
LGA Kuntaur -0.316 -0.540*
LGA Janjanbureh -0.405 -0.408
LGA Basse -0.464** -0.464*
Tribe Mandinka 0.118 0.005
Tribe Fula * RC RC
Tribe Wollof -0.228 -0.438***
Tribe Jola 0.246 0.200
Tribe Sarehuleh -0.212 -0.380
Tribe Sererr 0.205 0.037
Other tribe 0.161 0.071
Constant 3.592*** 5.134***
Explanatory variables
Desire to change something in one's life
Note: Coefficients from a probit model estimation are displayed. The reference categories (RC) are displayed for
discrete variables with more than two categories. The mode categories are marked with an asterisk for discrete
variables with more than two categories; they are left out for binary variables. Significance levels are marked as
follows: * 10%, ** 5%, *** 1%. Sample size: 2184 observations.
Table 5: Correlates of the desire to change something in one's life in a probit model

37
Myself vs.
Family
Myself vs.
Government
Family vs.
Government
Other vs.
Government
Other vs.
Family
Other vs.
Myself
Age 0.983*** 0.983*** 1.000 1.000 1.000 1.017**
Female 0.364*** 0.436*** 1.200 0.823 0.686 1.886**
Not married 1.148 0.724 0.631** 1.096 1.737* 1.513
Monogamous marriage * 1.018 0.759* 0.745** 0.788 1.058 1.039
Polygamous marriage RC RC RC RC RC RC
Not household head 0.931 0.760 0.816 0.832 1.019 1.094
Not Muslim 0.861 0.544* 0.632 0.524 0.830 0.964
Foreigner 2.428*** 1.649** 0.679 1.384 2.037* 0.839
Went to school 1.352* 1.156 0.855 1.126 1.317 0.974
Literate 1.016 0.758* 0.745* 0.706 0.947 0.932
Economically inactive 0.600*** 1.106 1.844*** 1.429 0.775 1.292
Log(expenditure) 1.096 1.070 0.976 1.096 1.123 1.024
Expenditure missing 3.199 1.816 0.568 1.675 2.951 0.922
Wealth percentile 0.995 1.008** 1.013*** 1.008 0.995 1.000
Health completely limiting RC RC RC RC RC RC
Health a lot limiting 0.276*** 0.464** 1.685 0.634 0.376* 1.366
Health somewhat limiting 0.242*** 0.343*** 1.419 0.775 0.546 2.260
Health not limiting * 0.568** 0.864 1.522 0.777 0.510 0.898
Urban 1.095 1.613** 1.474** 1.233 0.837 0.765
LGA Banjul 0.472** 0.752 1.595 6.738*** 4.224*** 8.955***
LGA Kanifing 0.810 1.382 1.706** 3.095*** 1.815 2.239**
LGA Brikama * RC RC RC RC RC RC
LGA Mansakonko 0.857 0.917 1.071 2.144 2.002 2.337*
LGA Kerewan 0.392*** 0.659* 1.684** 0.902 0.536 1.369
LGA Kuntaur 0.701 0.589** 0.841 0.997 1.185 1.692
LGA Janjanbureh 0.721 1.269 1.759** 2.196* 1.248 1.730
LGA Basse 0.869 0.756 0.870 0.297** 0.341* 0.392
Tribe Mandinka 0.797 1.048 1.316* 1.209 0.919 1.153
Tribe Fula * RC RC RC RC RC RC
Tribe Wollof 0.910 0.585*** 0.642** 1.092 1.700 1.867*
Tribe Jola 0.825 0.703 0.852 0.984 1.155 1.400
Tribe Sarehuleh 0.436* 0.760 1.745 3.219* 1.845 4.234**
Tribe Sererr 1.006 1.088 1.082 1.782 1.648 1.638
Other tribe 1.201 1.501 1.249 2.001 1.601 1.333
Table 6: Correlates of the expectations concerning who will contribute most to any changes in one's life in a
multinomial logit model
Note: Odds-ratios from a multinomial logit estimation are displayed. The reference categories (RC) are displayed for discrete variables
with more than two categories. The mode categories are marked with an asterisk for discrete variables with more than two categories; they
are left out for binary variables. Significance levels are marked as follows: * 10%, ** 5%, *** 1%. Sample size: 2052 observations.
Explanatory variables
Pairwise comparisons of the actors expected to contribute most to any changes in one's life

38
Myself vs.
Family
Myself vs.
Government
Family vs.
GovernmentMyself Family Government
Age + + - - 0 0 0 0
Age squared - - 0 0 0
Female - 0 - - 0 - 0 0
Not married - - 0 0 - 0 - +
Monogamous marriage * - - 0 - - 0 0 +
Polygamous marriage RC RC RC RC RC RC RC RC
Not household head + 0 0 0 0 0 - +
Not Muslim 0 0 0 - 0 0 0 0
Foreigner - 0 + + 0 + 0 0
Went to school + + + 0 0 0 0 0
Literate + 0 0 - - - + 0
Economically inactive - 0 - 0 + 0 + -
Log(expenditure) 0 0 0 0
Expenditure missing 0 0 0 0
Wealth percentile + 0 0 + + 0 0 0
Health completely limiting RC RC RC RC RC RC RC RC
Health a lot limiting + + - - 0 - + 0
Health somewhat limiting + + - - 0 - + 0
Health not limiting * + + - 0 0 0 + 0
Urban 0 0 0 + + 0 0 0
Number of observations 2184 2184 2052 2052 2052 2052 2052 2052
Table 7: Summary of correlates and determinants of empowerment at communal and individual level
Note: The table shows whether the effect of the explanatory variable on the dependent variable is significantly positive (+), significantly negative (-) or whether it is insignificant
(0) at 10% significance level. The reference categories (RC) are displayed for discrete variables with more than two categories; they are left out for binary variables. The mode
categories are marked with an asterisk for discrete variables with more than two categories; they are left out for binary variables.
Determinants
(2SLS)
Correlates
(multinomial logit)
Ascending grade of easiness in inducing
changes in one's communityActors expected to contribute most to any changes in one's life
Correlates
(generalized
ordered logit)
Determinants
(2SLS)
Empowerment at communal level Empowerment at individual level

39
Appendix

40
Change not
possible
Change with
difficulty
Change
easily
Wants
change
Does not
want changeMyself Family Government Other
Age 46.8 46.7 46.8 46.8 46.6 50.4 44.3 48.2 47.3 47.0
Male 73.8 66.2 74.3 76.7 74.1 68.2 84.0 64.2 75.3 67.9
Female 26.2 33.8 25.7 23.3 25.9 31.8 16.0 35.8 24.7 32.1
Not married 14.3 19.5 14.0 12.1 13.8 21.2 11.7 15.0 12.5 24.1
Monogamous marriage * 59.9 60.4 60.3 59.1 59.8 61.4 63.3 56.0 61.8 54.0
Polygamous marriage 25.8 20.1 25.7 28.8 26.3 17.4 25.0 29.0 25.6 21.9
Household head 83.9 84.3 83.6 84.0 83.9 83.3 87.9 79.8 84.1 83.2
Not household head 16.1 15.7 16.4 16.0 16.1 16.7 12.1 20.2 15.9 16.8
Muslim 94.1 94.2 93.6 95.0 94.6 87.1 94.3 95.5 94.2 92.7
Not Muslim 5.9 5.8 6.4 5.0 5.4 12.9 5.7 4.5 5.8 7.3
Gambian 92.2 84.1 93.5 94.3 92.5 87.1 88.6 95.7 94.4 89.8
Foreigner 7.8 15.9 6.5 5.7 7.5 12.9 11.4 4.3 5.6 10.2
Did not go to school 72.4 80.5 73.1 67.3 73.8 50.8 69.4 75.9 79.5 65.0
Went to school 27.6 19.5 26.9 32.7 26.2 49.2 30.6 24.1 20.5 35.0
Illiterate 53.9 62.9 53.5 50.1 55.1 36.4 50.2 59.5 57.3 50.4
Literate 46.1 37.1 46.5 49.9 44.9 63.6 49.8 40.5 42.7 49.6
Economically active 83.8 79.1 83.8 86.2 84.7 69.7 89.7 77.2 89.1 81.0
Economically inactive 16.2 20.9 16.2 13.8 15.3 30.3 10.3 22.8 10.9 19.0
Log(expenditure) 7.8 7.2 8.0 7.8 7.8 8.2 7.8 8.0 7.1 8.3
Wealth percentile 50.5 49.3 50.6 50.8 48.8 76.8 49.9 52.8 38.7 59.2
Health completely limiting 5.0 8.0 6.0 2.2 5.3 1.5 6.1 3.5 6.8 4.4
Health a lot limiting 10.1 8.2 9.2 12.3 9.7 15.2 6.5 12.7 10.3 9.5
Health somewhat limiting 20.8 23.6 22.2 17.5 20.7 23.5 12.4 24.8 25.6 24.8
Health not limiting * 64.1 60.2 62.6 68.1 64.3 59.8 75.0 59.0 57.3 61.3
Unhappy 28.6 39.6 25.8 27.3 30.2 3.8 28.0 24.1 42.7 26.3
Happy * 59.8 52.5 63.5 58.0 59.8 59.8 62.2 63.5 50.7 62.0
Very happy 11.6 8.0 10.8 14.7 10.0 36.4 9.9 12.4 6.6 11.7
Accomodation unsuitable 34.0 41.2 33.4 31.2 35.9 4.5 32.3 31.7 46.7 35.8
Accomodation suitable * 58.4 53.0 60.4 58.0 58.0 63.6 60.9 62.3 48.1 57.7
Accomodation very suitable 7.6 5.8 6.2 10.8 6.1 31.8 6.8 5.9 5.2 6.6
Respected occassionally or never 5.7 9.3 6.8 2.2 5.9 1.5 4.9 6.1 7.2 6.6
Respected frequently 15.2 23.4 17.1 8.5 14.6 25.8 14.0 14.9 13.9 18.2
Respected always * 79.1 67.3 76.1 89.4 79.5 72.7 81.1 79.1 78.9 75.2
Treated unfairly always 7.1 4.1 6.5 9.4 6.6 14.4 7.9 4.9 8.0 3.6
Treated unfairly frequently 10.6 4.7 10.1 14.2 10.4 12.9 9.0 9.1 12.9 15.3
Treated unfairly occasionally 27.3 38.5 31.1 16.1 27.1 30.3 23.1 30.4 25.8 35.8
Treated unfairly never * 55.0 52.7 52.3 60.3 55.8 42.4 59.9 55.6 53.3 45.3
Rural 56.2 55.2 54.9 58.5 58.7 17.4 55.1 53.5 75.5 41.6
Urban 43.8 44.8 45.1 41.5 41.3 82.6 44.9 46.5 24.5 58.4
LGA Banjul 6.5 10.2 5.4 6.3 6.2 11.4 4.9 6.6 3.0 22.6
LGA Kanifing 21.0 25.8 21.3 18.1 18.6 59.1 21.3 21.4 8.7 26.3
LGA Brikama * 21.8 15.7 24.6 20.7 22.8 6.1 25.6 21.4 22.9 15.3
LGA Mansakonko 6.1 12.9 3.7 6.4 6.4 1.5 6.1 5.6 7.6 8.0
LGA Kerewan 12.2 8.5 12.3 13.9 12.3 10.6 9.2 15.9 13.3 7.3
LGA Kuntaur 10.6 15.7 9.8 9.3 11.1 3.0 9.5 7.9 18.5 8.8
LGA Janjanbureh 8.3 2.5 8.6 10.8 8.6 3.0 8.2 9.5 8.0 8.8
LGA Basse 13.4 8.8 14.3 14.5 13.9 5.3 15.3 11.7 18.1 2.9
Tribe Mandinka 30.9 26.6 31.9 31.5 31.5 21.2 29.2 37.5 27.8 27.0
Tribe Fula * 31.3 31.0 32.2 30.2 32.0 21.2 35.6 27.4 35.6 22.6
Tribe Wollof 13.6 17.0 11.4 15.3 13.0 24.2 11.3 11.1 16.7 17.5
Tribe Jola 9.0 11.3 9.4 7.4 9.2 6.8 9.0 9.1 9.3 9.5
Tribe Sarehuleh 1.9 1.6 1.6 2.6 1.7 5.3 1.1 2.5 1.0 3.6
Tribe Sererr 5.1 4.4 4.7 6.1 5.0 6.8 4.3 5.8 4.0 8.8
Other tribe 8.1 8.0 8.8 7.0 7.7 14.4 9.5 6.6 5.6 10.9
Number of observations 2184 364 1087 733 2052 132 719 693 503 137
Note: The table displays the sample mean in case of continuous variables (age, log(expenditure), wealth percentile) and the fraction of respondents with the corresponding characteristic in case of discrete
variables. The mode category is listed first for binary variables and marked with an asterisk for discrete variables with more than two categories.
Table A1: Respondent's characteristics disaggregated by respondents' ability and willingness to change things in their life, and by respondents' expectations about
who will contribute most to any changes in their life
Overall
Grade of difficulty in inducing changes
in one's community
Desire to change something
in one's life
Actors expected to contribute most
to any changes in one's life

41
Change not
possible
Change with
difficulty
Change
easily
Wants
change
Does not
want changeMyself Family Government Other
Overall 16.7 49.8 33.6 94.0 6.0 2184 35.0 33.8 24.5 6.7 2052
Male 15.0 50.2 34.9 94.4 5.6 1611 39.7 29.3 24.9 6.1 1521
Female 21.5 48.7 29.8 92.7 7.3 573 21.7 46.7 23.4 8.3 531
Not married 22.8 48.7 28.5 91.0 9.0 312 29.6 36.6 22.2 11.6 284
Monogamous marriage * 16.8 50.1 33.1 93.8 6.2 1309 37.1 31.6 25.3 6.0 1228
Polygamous marriage 13.0 49.6 37.5 95.9 4.1 563 33.3 37.2 23.9 5.6 540
Household head 16.8 49.6 33.6 94.0 6.0 1832 36.7 32.1 24.6 6.6 1722
Not household head 16.2 50.6 33.2 93.8 6.3 352 26.4 42.4 24.2 7.0 330
Muslim 16.7 49.5 33.9 94.4 5.6 2056 34.9 34.1 24.4 6.5 1941
Not Muslim 16.4 54.7 28.9 86.7 13.3 128 36.9 27.9 26.1 9.0 111
Gambian 15.2 50.5 34.3 94.3 5.7 2013 33.6 34.9 25.0 6.5 1898
Foreigner 33.9 41.5 24.6 90.1 9.9 171 53.2 19.5 18.2 9.1 154
Did not go to school 18.5 50.3 31.2 95.8 4.2 1581 33.0 34.7 26.4 5.9 1514
Went to school 11.8 48.4 39.8 89.2 10.8 603 40.9 31.0 19.1 8.9 538
Illiterate 19.4 49.4 31.2 95.9 4.1 1178 31.9 36.5 25.5 6.1 1130
Literate 13.4 50.2 36.4 91.7 8.3 1006 38.8 30.5 23.3 7.4 922
Economically active 15.7 49.8 34.5 95.0 5.0 1831 37.1 30.8 25.8 6.4 1739
Economically inactive 21.5 49.9 28.6 88.7 11.3 353 23.6 50.5 17.6 8.3 313
Health completely limiting 26.4 59.1 14.5 98.2 1.8 110 40.7 22.2 31.5 5.6 108
Health a lot limiting 13.6 45.5 40.9 90.9 9.1 220 23.5 44.0 26.0 6.5 200
Health somewhat limiting 18.9 53.0 28.1 93.2 6.8 455 21.0 40.6 30.4 8.0 424
Health not limiting * 15.7 48.7 35.7 94.4 5.6 1399 40.8 31.0 21.8 6.4 1320
Unhappy 23.1 44.9 32.1 99.2 0.8 624 32.5 27.0 34.7 5.8 619
Happy * 14.6 52.8 32.5 94.0 6.0 1306 36.4 35.9 20.8 6.9 1227
Very happy 11.4 46.1 42.5 81.1 18.9 254 34.5 41.7 16.0 7.8 206
Accomodation unsuitable 20.2 48.9 30.9 99.2 0.8 742 31.5 29.9 31.9 6.7 736
Accomodation suitable * 15.1 51.5 33.3 93.4 6.6 1275 36.8 36.3 20.3 6.6 1191
Accomodation very suitable 12.6 40.1 47.3 74.9 25.1 167 39.2 32.8 20.8 7.2 125
Respected occassionally or never 27.4 59.7 12.9 98.4 1.6 124 28.7 34.4 29.5 7.4 122
Respected frequently 25.5 55.9 18.6 89.8 10.2 333 33.8 34.4 23.4 8.4 299
Respected always * 14.2 47.9 37.9 94.4 5.6 1727 35.7 33.6 24.3 6.3 1631
Treated unfairly always 9.7 45.8 44.5 87.7 12.3 155 41.9 25.0 29.4 3.7 136
Treated unfairly frequently 7.4 47.6 45.0 92.6 7.4 231 30.4 29.4 30.4 9.8 214
Treated unfairly occasionally 23.5 56.7 19.8 93.3 6.7 596 29.9 37.9 23.4 8.8 556
Treated unfairly never * 16.0 47.3 36.8 95.3 4.7 1202 37.6 33.6 23.4 5.4 1146
Rural 16.4 48.7 35.0 98.1 1.9 1227 32.9 30.8 31.6 4.7 1204
Urban 17.0 51.2 31.8 88.6 11.4 957 38.1 38.0 14.5 9.4 848
LGA Banjul 26.1 41.5 32.4 89.4 10.6 142 27.6 36.2 11.8 24.4 127
LGA Kanifing 20.5 50.5 29.0 83.0 17.0 459 40.2 38.8 11.5 9.4 381
LGA Brikama * 12.0 56.1 31.9 98.3 1.7 476 39.3 31.6 24.6 4.5 468
LGA Mansakonko 35.1 29.9 35.1 98.5 1.5 134 33.3 29.5 28.8 8.3 132
LGA Kerewan 11.6 50.2 38.2 94.8 5.2 267 26.1 43.5 26.5 4.0 253
LGA Kuntaur 24.6 46.1 29.3 98.3 1.7 232 29.8 24.1 40.8 5.3 228
LGA Janjanbureh 5.0 51.4 43.6 97.8 2.2 181 33.3 37.3 22.6 6.8 177
LGA Basse 10.9 52.9 36.2 97.6 2.4 293 38.5 28.3 31.8 1.4 286
Tribe Mandinka 14.4 51.4 34.2 95.9 4.1 675 32.5 40.2 21.6 5.7 647
Tribe Fula * 16.5 51.2 32.3 95.9 4.1 684 39.0 29.0 27.3 4.7 656
Tribe Wollof 20.8 41.6 37.6 89.3 10.7 298 30.5 28.9 31.6 9.0 266
Tribe Jola 20.8 51.8 27.4 95.4 4.6 197 34.6 33.5 25.0 6.9 188
Tribe Sarehuleh 14.3 40.5 45.2 83.3 16.7 42 22.9 48.6 14.3 14.3 35
Tribe Sererr 14.3 45.5 40.2 92.0 8.0 112 30.1 38.8 19.4 11.7 103
Other tribe 16.5 54.5 29.0 89.2 10.8 176 43.3 29.3 17.8 9.6 157
Note: The mode category is listed first for binary variables and marked with an asterisk for discrete variables with more than two categories.
Table A2: Fractions of respondents with different possibilities to change something in their community, fractions of respondents willing to change something in their life, and
fractions of respondents who expect a particular actor to contribute most to any changes in their life; disaggregated by respondent's characteristics
Grade of difficulty in inducing changes
in one's community
Desire to change something
in one's lifeNumber of
observations
Actors expected to contribute most
to any changes in one's lifeNumber of
observations
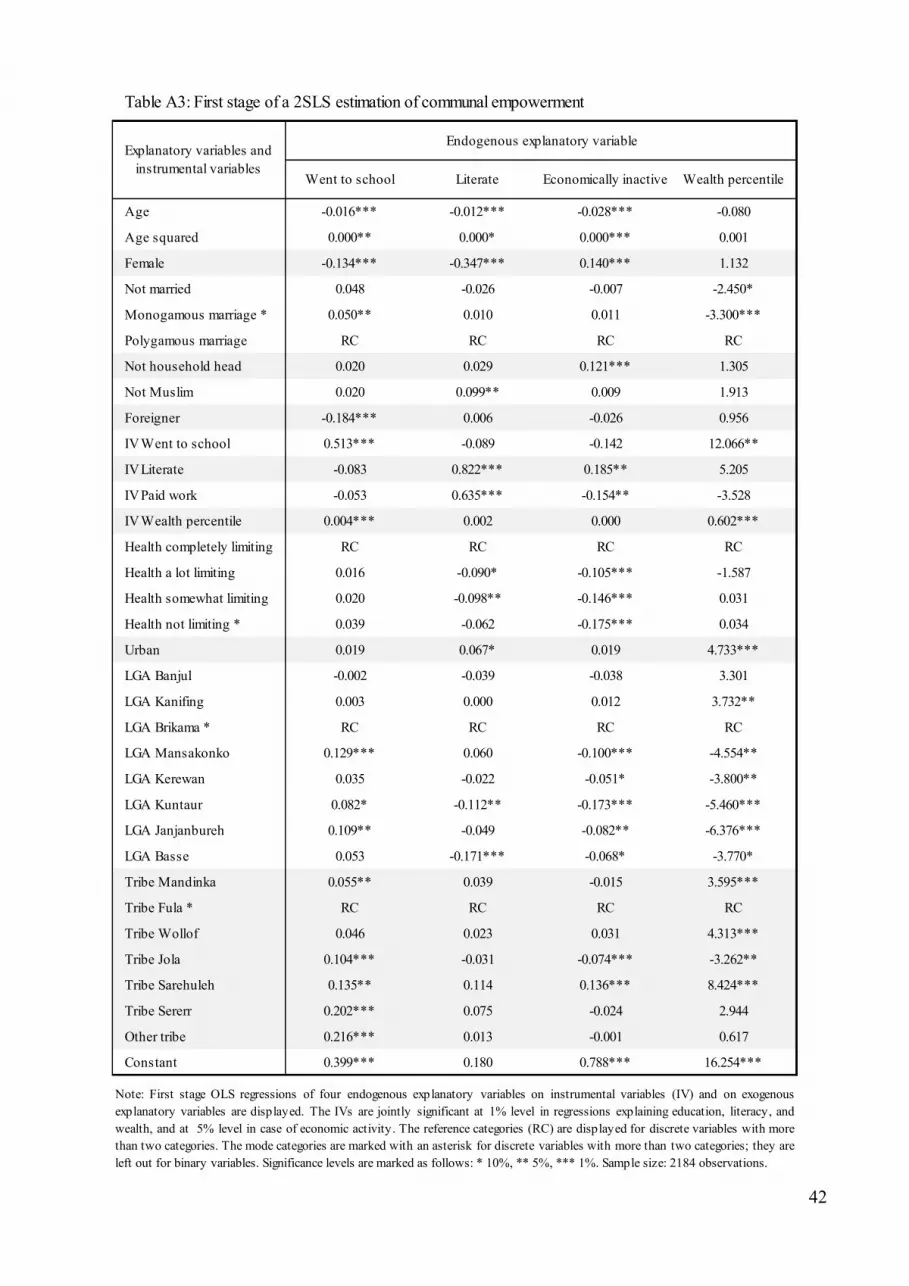
42
Went to school Literate Economically inactive Wealth percentile
Age -0.016*** -0.012*** -0.028*** -0.080
Age squared 0.000** 0.000* 0.000*** 0.001
Female -0.134*** -0.347*** 0.140*** 1.132
Not married 0.048 -0.026 -0.007 -2.450*
Monogamous marriage * 0.050** 0.010 0.011 -3.300***
Polygamous marriage RC RC RC RC
Not household head 0.020 0.029 0.121*** 1.305
Not Muslim 0.020 0.099** 0.009 1.913
Foreigner -0.184*** 0.006 -0.026 0.956
IV Went to school 0.513*** -0.089 -0.142 12.066**
IV Literate -0.083 0.822*** 0.185** 5.205
IV Paid work -0.053 0.635*** -0.154** -3.528
IV Wealth percentile 0.004*** 0.002 0.000 0.602***
Health completely limiting RC RC RC RC
Health a lot limiting 0.016 -0.090* -0.105*** -1.587
Health somewhat limiting 0.020 -0.098** -0.146*** 0.031
Health not limiting * 0.039 -0.062 -0.175*** 0.034
Urban 0.019 0.067* 0.019 4.733***
LGA Banjul -0.002 -0.039 -0.038 3.301
LGA Kanifing 0.003 0.000 0.012 3.732**
LGA Brikama * RC RC RC RC
LGA Mansakonko 0.129*** 0.060 -0.100*** -4.554**
LGA Kerewan 0.035 -0.022 -0.051* -3.800**
LGA Kuntaur 0.082* -0.112** -0.173*** -5.460***
LGA Janjanbureh 0.109** -0.049 -0.082** -6.376***
LGA Basse 0.053 -0.171*** -0.068* -3.770*
Tribe Mandinka 0.055** 0.039 -0.015 3.595***
Tribe Fula * RC RC RC RC
Tribe Wollof 0.046 0.023 0.031 4.313***
Tribe Jola 0.104*** -0.031 -0.074*** -3.262**
Tribe Sarehuleh 0.135** 0.114 0.136*** 8.424***
Tribe Sererr 0.202*** 0.075 -0.024 2.944
Other tribe 0.216*** 0.013 -0.001 0.617
Constant 0.399*** 0.180 0.788*** 16.254***
Explanatory variables and
instrumental variables
Endogenous explanatory variable
Note: First stage OLS regressions of four endogenous explanatory variables on instrumental variables (IV) and on exogenous
explanatory variables are displayed. The IVs are jointly significant at 1% level in regressions explaining education, literacy, and
wealth, and at 5% level in case of economic activity. The reference categories (RC) are displayed for discrete variables with more
than two categories. The mode categories are marked with an asterisk for discrete variables with more than two categories; they are
left out for binary variables. Significance levels are marked as follows: * 10%, ** 5%, *** 1%. Sample size: 2184 observations.
Table A3: First stage of a 2SLS estimation of communal empowerment

43
Change not possible Change with difficulty Change easily
Age (1 s.d. increase around median/mean) -1.23** -1.41* 2.64**
Age (increase from 20 to 30 years) -2.97** -1.51** 4.48***
Age (10 years increase around median/mean) -0.85** -1.00* 1.85**
Age (increase from 60 to 70 years) 0.64 0.78 -1.42
Female vs. Male 3.28** 2.82** -6.10**
Not married vs. Polygamous marriage 3.33** 4.33** -7.67**
Monogamous vs. Polygamous marriage 1.99** 2.93* -4.91**
Not married vs. Monogamous marriage 1.35 1.41 -2.75
Not household head vs. Household head -2.28* -3.47 5.76
Not muslim vs. Muslim -1.51 -2.11 3.62
Foreigner vs. Gambian 13.95*** -6.41 -7.54**
Went to school vs. Did not go to school -3.55*** -6.19*** 9.74***
Literate vs. illiterate -3.16*** 2.21 0.95
Economically inactive vs. Active 2.99* 2.65** -5.64**
Expenditure (10% increase around median/mean) -6.28 1.10 5.18
Wealth (10% points increase around median/mean) -0.60** -0.72** 1.32**
Health a lot vs. completely limiting -13.85*** -7.22** 21.07***
Health somewhat vs. completely limiting -8.22** -0.99 9.21***
Health not at all vs. completely limiting -11.64*** -3.89* 15.53***
Health somewhat vs. a lot limiting 5.63*** 6.23** -11.86***
Health not at all vs. a lot limiting 2.21* 3.34 -5.55*
Health not at all vs. somewhat limiting -3.42** -2.90** 6.31***
Urban vs. Rural -2.80 6.20** -3.40
Male not married vs. Male monogamous marriage 3.87 2.96** -6.83*
Male not married vs. Male polygamous marriage 6.70** 7.31*** -14.01***
Male monogamous vs. Male polygamous marriage 2.83*** 4.35** -7.18***
Female not married vs. Female monogamous marriage -0.14 -0.07 0.21
Female not married vs. Female polygamous marriage -1.63 -0.68 2.31
Female monogamous vs. Female polygamous marriage -1.50 -0.61 2.10
Female not married vs. Male not married -0.49 -0.24 0.73
Female monogamous vs. Male monogamous marriage 3.52 2.79* -6.31*
Female polygamous vs. Male polygamous marriage 7.85** 7.75*** -15.60***
Table A4: Change in the probability to answer Change not possible / Change with difficulty / Change easily when
asked about one's ability to change things in one's community
Grade of difficulty in inducing changes in one's community
Note: Based on generalized ordered logit model estimation. Changes in probabilities are measured in percentage points and evaluated at the
median of the explanatory variables. Significance levels are marked as follows: * 10%, ** 5%, *** 1%.
Interactions between gender and marital status
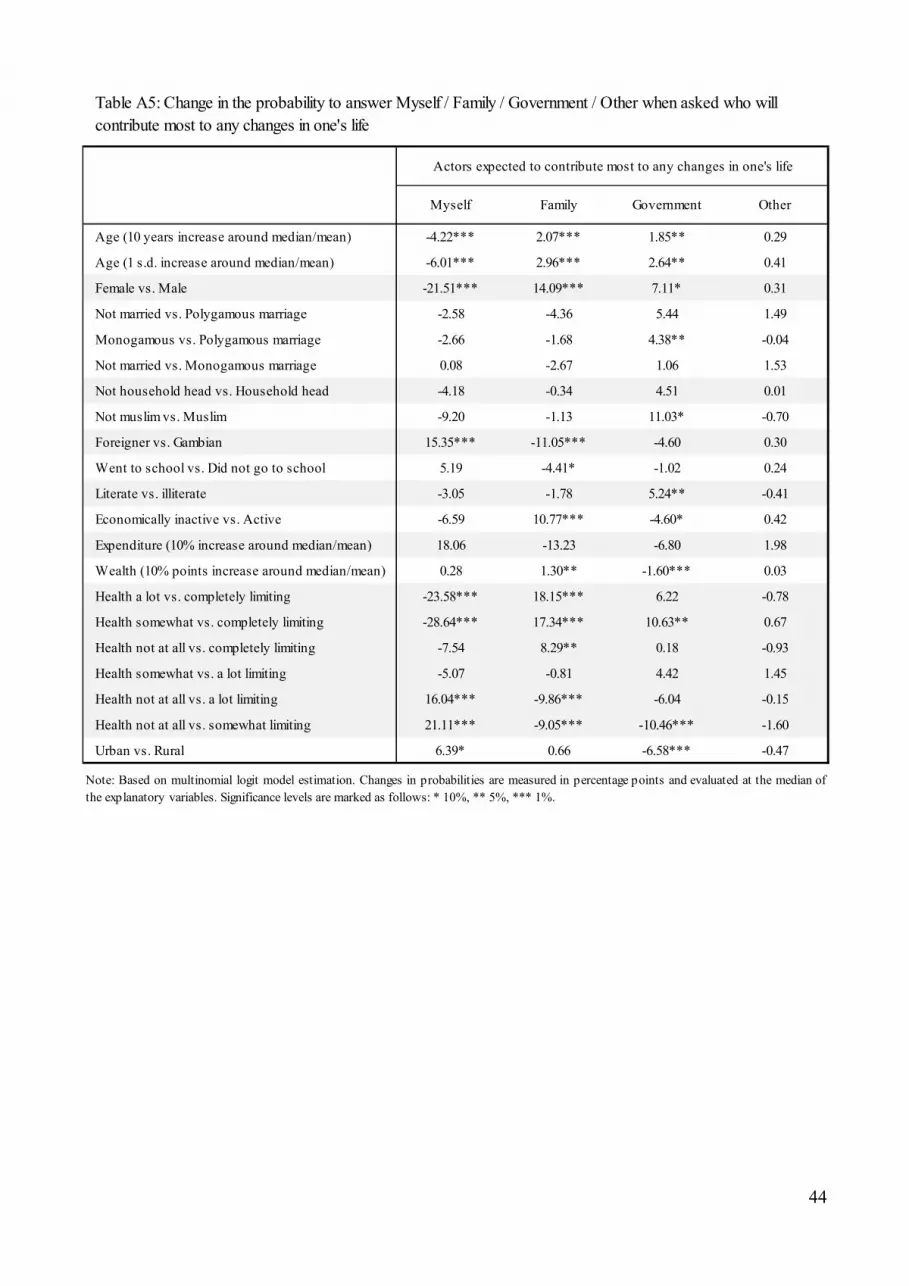
44
Myself Family Government Other
Age (10 years increase around median/mean) -4.22*** 2.07*** 1.85** 0.29
Age (1 s.d. increase around median/mean) -6.01*** 2.96*** 2.64** 0.41
Female vs. Male -21.51*** 14.09*** 7.11* 0.31
Not married vs. Polygamous marriage -2.58 -4.36 5.44 1.49
Monogamous vs. Polygamous marriage -2.66 -1.68 4.38** -0.04
Not married vs. Monogamous marriage 0.08 -2.67 1.06 1.53
Not household head vs. Household head -4.18 -0.34 4.51 0.01
Not muslim vs. Muslim -9.20 -1.13 11.03* -0.70
Foreigner vs. Gambian 15.35*** -11.05*** -4.60 0.30
Went to school vs. Did not go to school 5.19 -4.41* -1.02 0.24
Literate vs. illiterate -3.05 -1.78 5.24** -0.41
Economically inactive vs. Active -6.59 10.77*** -4.60* 0.42
Expenditure (10% increase around median/mean) 18.06 -13.23 -6.80 1.98
Wealth (10% points increase around median/mean) 0.28 1.30** -1.60*** 0.03
Health a lot vs. completely limiting -23.58*** 18.15*** 6.22 -0.78
Health somewhat vs. completely limiting -28.64*** 17.34*** 10.63** 0.67
Health not at all vs. completely limiting -7.54 8.29** 0.18 -0.93
Health somewhat vs. a lot limiting -5.07 -0.81 4.42 1.45
Health not at all vs. a lot limiting 16.04*** -9.86*** -6.04 -0.15
Health not at all vs. somewhat limiting 21.11*** -9.05*** -10.46*** -1.60
Urban vs. Rural 6.39* 0.66 -6.58*** -0.47
Table A5: Change in the probability to answer Myself / Family / Government / Other when asked who will
contribute most to any changes in one's life
Actors expected to contribute most to any changes in one's life
Note: Based on multinomial logit model estimation. Changes in probabilities are measured in percentage points and evaluated at the median of
the explanatory variables. Significance levels are marked as follows: * 10%, ** 5%, *** 1%.

45
Selection
modelProbit model
Selection
modelProbit model
Selection
modelProbit model
Age -0.014*** -0.010*** -0.010*** -0.015*** 0.006** 0.005** -0.012*** 0.006** 0.005*
Female 0.155 -0.536*** -0.555*** 0.162 0.356*** 0.362*** 0.147 0.136 0.153
Not married -0.083 -0.054 -0.045 -0.092 -0.193* -0.201* -0.124 0.17 0.168
Monogamous marriage * -0.111 -0.061 -0.06 -0.074 -0.08 -0.083 -0.116 0.146** 0.147*
Polygamous marriage RC RC RC RC RC RC RC RC RC
Not household head -0.197 -0.083 -0.078 -0.166 -0.005 -0.011 -0.18 0.154 0.151
Not Muslim -0.512** -0.218 -0.162 -0.534** 0.01 -0.025 -0.520** 0.374** 0.308*
Foreigner -0.319* 0.340*** 0.395*** -0.321* -0.391*** -0.414*** -0.301* -0.059 -0.111
Went to school -0.262* 0.101 0.129 -0.292** -0.13 -0.146* -0.294** 0.042 0.004
Literate 0.072 -0.054 -0.057 0.097 -0.076 -0.077 0.093 0.163** 0.170**
Economically inactive -0.034 -0.176* -0.173* -0.062 0.317*** 0.314*** -0.075 -0.201** -0.230**
Log(expenditure) 0.032 0.037 0.039 0.024 -0.041 -0.042 0.056 -0.005 -0.011
Expenditure missing -0.077 0.4 0.448 -0.155 -0.55 -0.581 0.11 0.087 0.002
Wealth percentile -0.008** 0 0.001 -0.009** 0.005*** 0.005*** -0.008** -0.004** -0.006***
Health completely limiting RC RC RC RC RC RC RC RC RC
Health a lot limiting -0.898** -0.607*** -0.571*** -0.917** 0.580*** 0.549*** -0.822* 0.147 0.078
Health somewhat limiting -0.799* -0.713*** -0.695*** -0.803* 0.521*** 0.496*** -0.712* 0.245* 0.197
Health not limiting * -0.572 -0.183 -0.162 -0.61 0.306** 0.289* -0.505 -0.004 -0.04
Unhappy RC RC RC
Happy * -0.26 -0.243 -0.452**
Very happy -0.612** -0.620** -0.922***
Accommodation unsuitable - RC RC
Accommodation suitable * -0.588*** -0.557*** -0.518***
Accommodation very suitable -1.133*** -1.139*** -0.939***
Respected never or occasionally RC RC RC
Respected frequently -1.172*** -1.107*** -1.093***
Respected always * -0.742** -0.708* -0.700*
Treated unfairly always RC RC RC
Treated unfairly frequently 0.586** 0.464* 0.491**
Treated unfairly occasionally 0.613*** 0.510** 0.458**
Treated unfairly never * 0.561*** 0.503*** 0.486***
Urban -0.09 0.155* 0.160* -0.093 0.072 0.071 -0.022 -0.216** -0.234**
LGA Banjul -0.520** -0.570*** -0.549*** -0.499* 0.139 0.116 -0.588** -0.117 -0.206
LGA Kanifing -0.819*** -0.189* -0.095 -0.815*** 0.153 0.102 -0.887*** -0.095 -0.268**
LGA Brikama * RC RC RC RC RC RC RC RC RC
LGA Mansakonko -0.016 -0.127 -0.113 -0.134 0.036 0.029 0.152 0.007 -0.021
LGA Kerewan -0.693*** -0.437*** -0.397*** -0.765*** 0.475*** 0.447*** -0.704*** 0.047 -0.039
LGA Kuntaur -0.414 -0.323*** -0.300** -0.457 0.066 0.048 -0.560* 0.247** 0.201
LGA Janjanbureh -0.405 -0.101 -0.073 -0.391 0.251* 0.234* -0.497* -0.203 -0.259*
LGA Basse -0.363 -0.131 -0.097 -0.404 0.054 0.031 -0.447* 0.195* 0.137
Tribe Mandinka -0.004 -0.059 -0.073 0.028 0.141* 0.148* -0.027 -0.111 -0.098
Tribe Fula * RC RC RC RC RC RC RC RC RC
Tribe Wollof -0.475*** -0.217** -0.198* -0.417** -0.075 -0.094 -0.514*** 0.273*** 0.253**
Tribe Jola 0.219 -0.119 -0.144 0.229 0.026 0.041 0.142 0.084 0.137
Tribe Sarehuleh -0.416 -0.460* -0.453* -0.378 0.313 0.29 -0.404 -0.02 -0.11
Tribe Sererr 0.105 0.019 0.002 0.095 -0.017 -0.008 0.06 -0.091 -0.062
Other tribe 0.095 0.137 0.118 0.078 -0.059 -0.047 0.085 -0.195 -0.183
Constant 5.128*** 0.405 0.29 5.248*** -1.075** -0.988** 4.935*** -0.912** -0.678
Number of observations 2184 2052 2052 2184 2052 2052 2184 2052 2052
Heckman probitProbit model
(restricted
sample)
Note: Heckman probit models (1st and 2nd column of each panel) correct for sample selection bias; Probit models (3rd column of each panel) are estimated on the restricted sample
without correction for sample selection. The Likelihood Ratio test of independent equations indicates that there is a sample selection bias in case of actors ‘myself’ (p-value 0.025)
and ‘government’ (p-value 0.007); there is no sample selection bias in case of ‘family’ (p-value 0.402). The reference categories (RC) are displayed for discrete variables with more
than two categories. The mode categories are marked with an asterisk for discrete variables with more than two categories; they are left out for binary variables. Significance levels
are marked as follows: * 10%, ** 5%, *** 1%.
Table A6: Correlates of the expectations concerning who will contribute most to any changes in one's life in a Heckman probit model
Explanatory variables
Separate models for actors expected to contribute most to any changes in one's life
Myself Family Government
Heckman probitProbit model
(restricted
sample)
Heckman probitProbit model
(restricted
sample)

46
Went to school Literate Economically inactive Wealth percentile
Age -0.018*** -0.014*** -0.028*** -0.013
Age squared 0.000*** 0.000** 0.000*** 0.000
Female -0.128*** -0.346*** 0.134*** 1.277
Not married 0.056* -0.032 0.005 -3.129**
Monogamous marriage * 0.045** 0.006 0.008 -3.680***
Polygamous marriage RC RC RC RC
Not household head 0.020 0.037 0.122*** 1.296
Not Muslim 0.004 0.102* 0.005 2.266
Foreigner -0.179*** 0.011 -0.037 0.007
IV Went to school 0.415*** -0.176 -0.101 8.337*
IV Literate -0.055 0.863*** 0.158* 6.295
IV Paid work -0.073 0.633*** -0.131* -2.560
IV crop 0.026 0.007 -0.081*** -4.575***
IV Wealth percentile 0.004*** 0.002 0.000 0.581***
Health completely limiting RC RC RC RC
Health a lot limiting 0.022 -0.096* -0.092** -1.915
Health somewhat limiting 0.035 -0.089* -0.144*** -0.658
Health not limiting * 0.035 -0.065 -0.171*** -0.620
Urban 0.033 0.074* -0.005 3.841**
LGA Banjul 0.011 -0.044 -0.081** 2.525
LGA Kanifing -0.006 -0.019 -0.022 1.614
LGA Brikama * RC RC RC RC
LGA Mansakonko 0.106** 0.050 -0.109*** -5.216**
LGA Kerewan 0.020 -0.027 -0.041 -3.763**
LGA Kuntaur 0.066 -0.124** -0.170*** -6.701***
LGA Janjanbureh 0.088** -0.059 -0.085** -6.882***
LGA Basse 0.041 -0.173*** -0.076* -4.499**
Tribe Mandinka 0.065*** 0.049* -0.009 4.003***
Tribe Fula * RC RC RC RC
Tribe Wollof 0.040 0.017 0.017 3.386**
Tribe Jola 0.102*** -0.030 -0.071** -2.737*
Tribe Sarehuleh 0.152** 0.162** 0.122** 7.902***
Tribe Sererr 0.198*** 0.064 -0.021 2.253
Other tribe 0.203*** 0.009 0.005 -0.518
Constant 0.452*** 0.216 0.882*** 20.971***
Explanatory variables and
instrumental variables
Endogenous explanatory variable
Note: First stage OLS regressions of four endogenous explanatory variables on instrumental variables (IV) and on exogenous explanatory
variables are displayed. The IVs are jointly significant at 1% level in all four regressions. The reference categories (RC) are displayed for
discrete variables with more than two categories. The mode categories are marked with an asterisk for discrete variables with more than
two categories; they are left out for binary variables. Significance levels are marked as follows: * 10%, ** 5%, *** 1%. Sample size: 2052
observations.
Table A7: First stage of a 2SLS estimation of individual empowerment
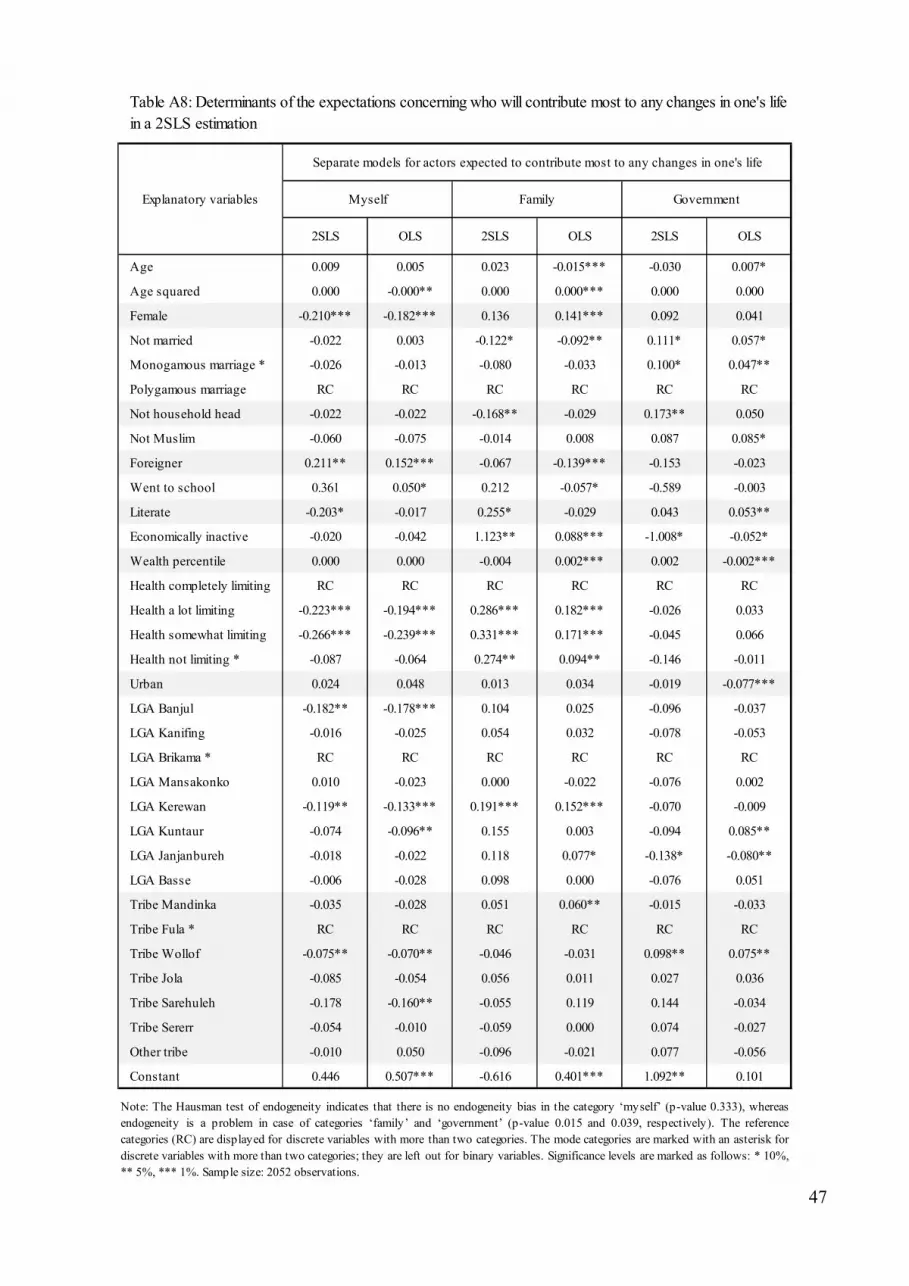
47
2SLS OLS 2SLS OLS 2SLS OLS
Age 0.009 0.005 0.023 -0.015*** -0.030 0.007*
Age squared 0.000 -0.000** 0.000 0.000*** 0.000 0.000
Female -0.210*** -0.182*** 0.136 0.141*** 0.092 0.041
Not married -0.022 0.003 -0.122* -0.092** 0.111* 0.057*
Monogamous marriage * -0.026 -0.013 -0.080 -0.033 0.100* 0.047**
Polygamous marriage RC RC RC RC RC RC
Not household head -0.022 -0.022 -0.168** -0.029 0.173** 0.050
Not Muslim -0.060 -0.075 -0.014 0.008 0.087 0.085*
Foreigner 0.211** 0.152*** -0.067 -0.139*** -0.153 -0.023
Went to school 0.361 0.050* 0.212 -0.057* -0.589 -0.003
Literate -0.203* -0.017 0.255* -0.029 0.043 0.053**
Economically inactive -0.020 -0.042 1.123** 0.088*** -1.008* -0.052*
Wealth percentile 0.000 0.000 -0.004 0.002*** 0.002 -0.002***
Health completely limiting RC RC RC RC RC RC
Health a lot limiting -0.223*** -0.194*** 0.286*** 0.182*** -0.026 0.033
Health somewhat limiting -0.266*** -0.239*** 0.331*** 0.171*** -0.045 0.066
Health not limiting * -0.087 -0.064 0.274** 0.094** -0.146 -0.011
Urban 0.024 0.048 0.013 0.034 -0.019 -0.077***
LGA Banjul -0.182** -0.178*** 0.104 0.025 -0.096 -0.037
LGA Kanifing -0.016 -0.025 0.054 0.032 -0.078 -0.053
LGA Brikama * RC RC RC RC RC RC
LGA Mansakonko 0.010 -0.023 0.000 -0.022 -0.076 0.002
LGA Kerewan -0.119** -0.133*** 0.191*** 0.152*** -0.070 -0.009
LGA Kuntaur -0.074 -0.096** 0.155 0.003 -0.094 0.085**
LGA Janjanbureh -0.018 -0.022 0.118 0.077* -0.138* -0.080**
LGA Basse -0.006 -0.028 0.098 0.000 -0.076 0.051
Tribe Mandinka -0.035 -0.028 0.051 0.060** -0.015 -0.033
Tribe Fula * RC RC RC RC RC RC
Tribe Wollof -0.075** -0.070** -0.046 -0.031 0.098** 0.075**
Tribe Jola -0.085 -0.054 0.056 0.011 0.027 0.036
Tribe Sarehuleh -0.178 -0.160** -0.055 0.119 0.144 -0.034
Tribe Sererr -0.054 -0.010 -0.059 0.000 0.074 -0.027
Other tribe -0.010 0.050 -0.096 -0.021 0.077 -0.056
Constant 0.446 0.507*** -0.616 0.401*** 1.092** 0.101
Note: The Hausman test of endogeneity indicates that there is no endogeneity bias in the category ‘myself’ (p-value 0.333), whereas
endogeneity is a problem in case of categories ‘family’ and ‘government’ (p-value 0.015 and 0.039, respectively). The reference
categories (RC) are displayed for discrete variables with more than two categories. The mode categories are marked with an asterisk for
discrete variables with more than two categories; they are left out for binary variables. Significance levels are marked as follows: * 10%,
** 5%, *** 1%. Sample size: 2052 observations.
Table A8: Determinants of the expectations concerning who will contribute most to any changes in one's life
in a 2SLS estimation
Explanatory variables
Separate models for actors expected to contribute most to any changes in one's life
Myself Family Government