Embed Size (px)
Citation preview

In: Advances in Chemistry Research. Volume 24 ISBN: 978-1-63463-846-3
Editor: James C. Taylor © 2015 Nova Science Publishers, Inc.
Chapter 1
DETERMINATION OF HYDRATE STABILITY ZONES
OF SOUR GASES USING A TWO PARAMETER MODEL
Ali Eslamimanesh1, Farhad Gharagheizi
2
and Amir H. Mohammadi2,3
1Department of Chemical and Biomolecular Engineering,
Clarkson University, Potsdam, NY, US 2Thermodynamics Research Unit, School of Chemical Engineering,
University of KwaZulu-Natal, Howard College Campus,
King George V Avenue, Durban, South Africa 3Institut de Recherche en Génie Chimique et Pétrolier (IRGCP),
Paris, France
ABSTRACT
In the present study, clathrate hydrate dissociation conditions of the methane +
carbon dioxide + hydrogen sulfide and methane + carbon dioxide/hydrogen sulfide
systems are correlated/predicted by applying the Least Squares Support Vector Machine
(LSSVM) algorithm. The Hybrid Genetic Algorithm (H-GA) is utilized to obtain the
optimal model parameters. The accuracy and reliability of the proposed model are proved
showing the average absolute relative deviations (AARD) of around 3% and squared
correlation coefficient of about 0.990. A computer program is finally developed for phase
equilibrium prediction of the investigated systems.
Keywords: Gas hydrate, support vector machine, model, methane, carbon dioxide, hydrogen
sulfide
Corresponding author: E-mail Address: [email protected] & [email protected]
Complimentary Contributor Copy

Ali Eslamimanesh, Farhad Gharagheizi and Amir H. Mohammadi 2
1. INTRODUCTION
Trapping of molecule(s) of a compound in a structure formed by the molecules of another
compound normally generates clathrate structures. [1, 2] The unique characteristics of the
water molecules result in formation of hydrogen-bonded three-dimensional networks able to
encage particular kinds of molecules. [3] The final compound is called the "hydrate", which
has been the subject of many studies from the 19th century. [1-3] At relatively high pressures
and low temperatures, water molecules form various crystalline structures generally
depending on the size and shape of the guest molecule(s). [1] Structures I (sI), II (sII), and H
(sH) are known to form as the three common structures of clathrate hydrates (or gas
hydrates).
The first industrial importance of the gas hydrate formation has been attributed to the
blockage of gas/oil transportation pipelines since this structure can form from association of
water with natural gas constituents in petroleum industry (or found abundantly in nature). [1-
4] More rigorously, gas hydrate formation may occur during the steps of natural gas
production and processing when traceable amounts of associated water exist (even in the form
of very low water content). On the other hand, there are indeed some positive applications of
gas hydrates, which have been generally proposed in the recent years and attracted much
attention. [1, 3] For instance, clathrate structures may be used as media for the storage and
transportation of natural gas and hydrogen, and CO2 capture and sequestration
process. [1, 3, 4]
In any case, reliable experimental phase equilibrium data of clathrate hydrates,
particularly those formed from natural gas components such as methane, carbon dioxide, and
hydrogen sulfide as well as accurate thermodynamic/numerical models are required to
prevent gas hydrate formation during processing and transportation of natural gas or use to
design separation/storage processes utilizing gas hydrate formation phenomenon.
Furthermore, since there is high probability of hydrogen sulfide clathrate hydrate formation in
the presence of liquid water, [5] accurate information on phase equilibria of gas hydrates
containing H2S is of importance during production, transportation, and processing of sour
gases.
A literature survey shows that comprehensive studies (both experimental and theoretical
ones) have been undertaken to date on phase equilibria of clathrate hydrates of hydrocarbons.
[1] However, phase equilibrium data regarding the mixed clathrate hydrates of CH4 + CO2 +
H2S are scarce and they are generally limited to the data reported by Robinson and Hutton [6]
and Sun et al. [7] Few experimental laboratories have the capability of experimental
measurements on hydrogen sulfide containing fluids mainly due to toxic and corrosive nature
of this compound.
Another point to mention is that the conventional thermodynamic gas hydrate models on
the basis of the van der Waals-Platteeuw [8] (vdW-P) theory for modeling the hydrate phase
and different equations of state for modeling the fluid phases may not normally lead to
acceptable phase equilibrium predictions for this system (it can be checked by commercial
softwares like HYSYS [9]). Furthermore, empirical correlations have not been demonstrated
to give reliable results for this purpose (mainly due to especial shape of the corresponding
phase boundary). In 1987, Baillie–Wichert [10] proposed some charts to predict the phase
behavior of the mixed clathrate hydrates of CH4 + CO2 + H2S. However, this method uses
Complimentary Contributor Copy
Determination of Hydrate Stability Zones of Sour Gases … 3
graphical steps, which are not generally straight-forward and have some limitations in range
of applicability. A brief discussion about the aforementioned methods limitations have been
given elsewhere. [5] Additionally, the adaptive neuro fuzzy inference system (ANFIS)
mathematical method has been applied by ZareNezhad and Aminian [5] to calculate/estimate
the hydrate dissociation conditions of the aforementioned system. However, this
mathematical algorithm is generally complex with many parameters.
Therefore, it merits to check the capability of a new model for phase equilibrium
prediction of the system of interest. Since the Least Squares Support Vector Machine
(LSSVM) [11-13] methodology has been already employed in phase equilibrium predictions
of the systems containing gas hydrates, [14] herein, this method is applied to develop a
numerical network-based model for correlating/estimating the hydrate dissociation conditions
of the CH4 + CO2 + H2S and CH4 + CO2/H2S systems.
2. EXPERIMENTAL DATA
In the present study, we have treated the available experimental data in open literature for
the gas hydrate dissociation conditions of the CH4 + CO2 + H2S system. [6, 7] In addition, the
binary mixed clathrate hydrate dissociation data for the CH4 + H2S [15] and CH4 + CO2 [16-
21] and some simple hydrate dissociation data present in the data sets [16, 17] for the CH4
system have been used to extend the model for the cases where there are no CO2 and/or H2S
in the feed gas.
3. MODEL DEVELOPMENT
3.1. Features of the Support Vector Machine
The main purpose in this step is to establish nonlinear relationships between the
experimental hydrate dissociation temperature and molar composition of the gas mixture in
the feed [6, 7, 15-21] as inputs of the model and the desired output (hydrate dissociation
pressure). To achieve this goal, a network-based mathematical approach has been employed.
The Artificial Neural Network (ANN)-based models normally lead to high accuracy in
different engineering and scientific problems. [22] However, random initialization of the
networks, variation of the stopping criteria during optimization of the model parameters, and
large numbers of the parameters may discourage their use for external predictions (or
extrapolations). [14, 23-25]
The support vector machine is a capable mathematical tool developed from the machine-
learning community [11-14]. This approach analyzes a group of data and recognizes patterns,
applied for regression objectives. Furthermore, it can be stated that the SVM is a non-
probabilistic binary linear classifier [11-14]. The significant advantages of the SVM-based
methods over the conventional methods based on the ANNs have been already discussed. [14]
It should be pointed out that both linear and nonlinear regressions can be pursued for solving
the corresponding problems using the SVM algorithm. [11-14]
Complimentary Contributor Copy

Ali Eslamimanesh, Farhad Gharagheizi and Amir H. Mohammadi 4
A considerable modification to the original SVM has been proposed by Suykens and
Vandewalle [11, 12] with the aim of facilitating the solution of set of nonlinear equations
(quadratic programming) in the original SVM algorithm. The new LLSVM strategy, brings
about an easier-to-implement calculation methods and faster solution-searches compared to
the traditional SVM method. [11-14]
3.2. Equations
The cost function of the applied model
has been calculated by the following
relation: [11-14]
N
kk
T
LSSVMewwQ
1
2
2
1 (1)
subject to the following constraint: [11-14]
kk
T
kebxwy )( k=1, 2,…, N (2)
where x is the input vector containing the input data (temperature and feed compositions of
the gas), y stands for the output vector (dependent parameter), b denotes the intercept of the
linear regression, w is the regression weight (slope of the linear regression), ek is the
regression error for N training objects, γ indicates the relative weight of the summation of the
regression errors compared to the regression weight (first right hand side of Eq. 1),
superscript T denotes the transpose matrix, and φ is the feature map, mapping the feasible
region (input space) to a high dimensional feature space.
The regression weight (w) is evaluated as: [11-14]
N
kkk
xw1
(3)
where,
kke 2 (4)
Therefore, Eq. (2) can be written as follows: [11-14]
N
k
T
kkbxxy
1
(5)
where, [11-14]
1)2(
)(
xx
byT
k
k
k (6)
Complimentary Contributor Copy

Determination of Hydrate Stability Zones of Sour Gases … 5
Eq. 7 can be used as an alternative nonlinear regression applying the Kernel function as
follows: [11-14]
N
kkk
bxxKxf1
),()( (7)
where K(x,xk) is the Kernel function dependent on the inner product of the two vectors x and
xk in the feasible region defined by the inner product of the vectors Ф(x) and Ф(xk)
as follows: [11-14]
)(Φ.)(Φ),(k
T
kxxxxK (8)
where the radial basis function (RBF) Kernel has been applied as follows: [11-14]
)/exp(),( 22
xxxxKkk (9)
where σ is a decision variable, which is obtained by an external optimization method. The
mean square error (MSE) of the results of the final model can be determined by the following
expression:
nsMSE
i.
n
iirep./pred
2
exp1
)P(P
(10)
where P is hydrate dissociation pressure, subscripts rep./pred. and exp. indicate the
represented/predicted, and experimental hydrate dissociation pressure values, respectively,
and ns stands for the number of data from the initial population (generation). It is worth
knowing that the LSSVM algorithm developed by Pelckmans et al. [13] and Suykens and
Vandewalle [11] has been employed in the present work.
3.3. Calculation Steps
A same computational procedure described in our previous work [14] has been followed
here to obtain the optimal values of the parameters of the LSSVM [11-13] algorithm (i.e., γ
and σ2). The experimental datasets [6, 7, 15-20] have been divided into three sub-datasets
including the ―Training‖ set, the ―Validation (Optimization)‖ set, and the ―Test‖ set. In this
study, the ―Training‖ set is used to generate the model structure, the ―Validation
(Optimization)‖ set is applied for optimization of the model, and the ―Test (prediction)‖ set is
used to investigate the prediction capability and validity of the proposed model. The division
of database into three sub-datasets has been conducted randomly. Thus, about 80%, 10%, and
10% of the main dataset are randomly selected for the ―Training‖ set (197 data points), the
―Optimization‖ set (24 data points), and the ―Test‖ set (24 data points), respectively. Many
distribution allocations have been taken into account to avoid the local accumulations of the
Complimentary Contributor Copy

Ali Eslamimanesh, Farhad Gharagheizi and Amir H. Mohammadi 6
data in the feasible region of the problem. As a result, the acceptable distribution is the one
with homogeneous accumulations of the data on the domain of the three
sub-datasets. [14] The computational steps have been performed following the described
procedure. The two main parameters of this algorithm are σ2 and γ, which are supposed to be
optimized using an appropriate optimization strategy. Because of the high nonlinearity of the
SVM method, the robust Hybrid Genetic Algorithm (H-GA) method [26, 27] has been
implemented for this purpose. This optimization method leads to faster calculations compared
with the conventional linear optimization algorithms. The optimization toolbox of
MATLAB® [28] software has been employed for parallel computations. The number of
populations of the optimization problem has been herein set to 1000. To ensure that the value
of the final solution is very close to the probable global optimum of the problem, the
optimization procedure has been repeated several times. [14]
4. RESULTS AND DISCUSSION
The values of the probable global optima of the problems including σ2 and γ have been
calculated as 1.205 and 1473.852, respectively. The numbers of the reported digits of these
parameters have been obtained by performing sensitivity analysis of the overall errors of the
optimization procedure to the corresponding values.
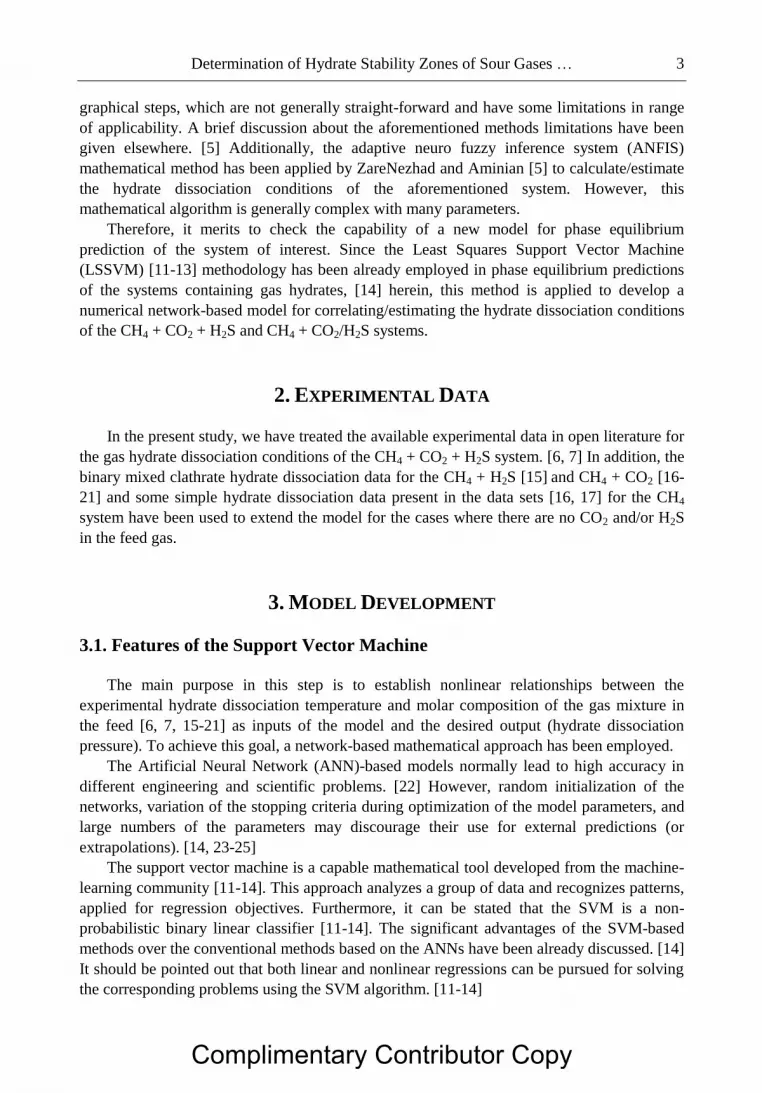
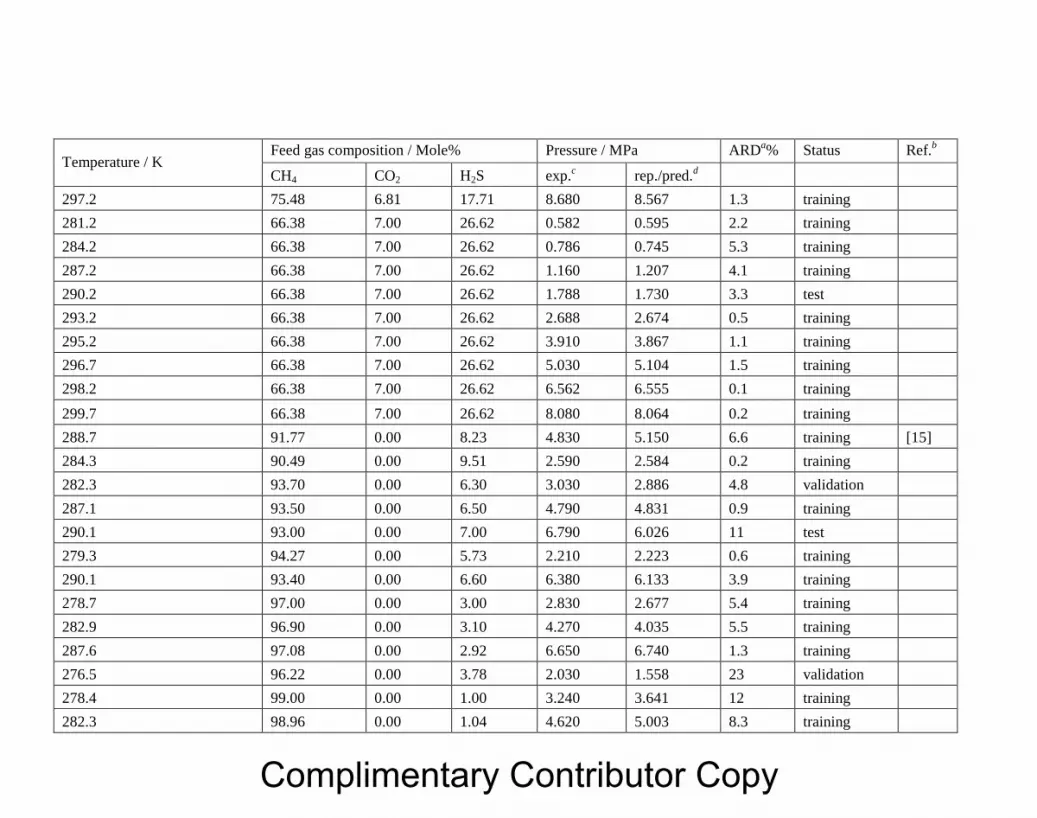
Figures 1 and 2 show the represented/predicted results applying the developed LSSVM
model vs. experimental values [6, 7, 15-21] of hydrate dissociation conditions for the CH4 +
CO2 + H2S system. The experimental [6, 7, 15-21] and determined hydrate dissociation
conditions, the absolute relative deviations of results from experimental values [6, 7, 15-21]
and the status of the data points (whether they have been used as training, validation, or test
sets are reported in Table 1). Moreover, Table 2 reports the statistical parameters of the
proposed model. Anyone can easily apply the software to reproduce all our results and may
predict phase equilibria of the investigated systems at temperature conditions of interest (in
gas hydrate formation region).
It can be observed from the results that some of the represented/predicted values have
high deviations from experimental values. [6, 7, 15-21] A number of possible explanations for
these deviations can be expressed as follows:
1. We may not be able to define a domain of temperature and pressure conditions in
which the developed model leads to poorer results;
2. The high deviations may be due to some doubtful experimental phase equilibrium
data resulting from possible errors in the measurements. However, high deviations
may not be attributed to unreliable data for the system in the absence of hydrogen
sulfide (the CH4 + CO2 system) because we have already performed a statistical
evaluation method on such data and removed the probable doubtful data for
developing the proposed model in this work.
Significant points may not be omitted from our discussions.
Complimentary Contributor Copy

Table 1. The detailed results of the developed model
Temperature / K Feed gas composition / Mole% Pressure / MPa ARD
a% Status Ref.
b
CH4 CO2 H2S exp.c rep./pred.
d
281.1 78.5 13.9 7.6 1.675 1.579 5.7 training [6]
282.5 80.3 13.0 6.7 2.275 2.018 11 training
286.6 81.0 13.0 6.0 3.868 3.917 1.3 validation
287.3 82.0 12.6 5.4 4.558 4.855 6.5 training
289.4 82.0 12.6 5.4 5.888 6.451 9.6 training
290.8 82.0 12.6 5.4 6.881 7.593 10 training
292.2 82.0 12.5 5.5 8.653 8.761 1.2 training
292.9 82.0 12.6 5.4 9.632 9.632 0 training
293.6 82.0 12.6 5.4 10.790 10.488 2.8 validation
294.7 82.5 12.1 5.4 12.341 11.933 3.3 training
295.6 82.0 12.6 5.4 14.079 13.665 2.9 training
296.4 82.0 12.6 5.4 15.707 15.254 2.9 validation
284.2 81.0 11.8 7.2 1.903 2.445 28 training
285.4 81.0 11.8 7.2 2.765 2.910 5.3 training
289.1 80.0 12.0 8.0 4.254 4.555 7.1 training
290.4 80.0 12.0 8.0 4.978 5.332 7.1 training
292.1 80.0 12.0 8.0 5.943 6.403 7.7 validation
293.1 81.6 11.1 7.3 6.984 7.776 11 training
294 83.9 9.4 6.7 7.529 8.933 19 training
279.2 68.6 24.9 6.5 1.475 1.466 0.6 training
282.1 69.9 24.1 6.0 2.034 2.179 7.1 training
Complimentary Contributor Copy

Table 1. (Continued)
Temperature / K Feed gas composition / Mole% Pressure / MPa ARD
a% Status Ref.
b
CH4 CO2 H2S exp.c rep./pred.
d
284 70.5 23.5 6.0 2.771 2.662 3.9 training
286.4 71.5 22.8 5.7 3.744 3.626 3.2 training
288.4 72.5 22.0 5.5 4.930 4.899 0.6 training
290 72.5 22.0 5.5 6.185 6.331 2.4 training
290.9 72.5 22.0 5.5 7.550 7.359 2.5 training
293 72.0 22.3 5.7 11.225 10.282 8.4 test
293.7 72.3 22.2 5.5 12.011 12.030 0.2 training
287.4 69.9 12.7 17.4 2.020 2.003 0.9 training
289.9 70.0 12.3 16.7 2.648 2.640 0.3 training
291.5 72.0 12.0 16.0 3.330 3.333 0.1 training
293.3 72.0 12.0 16.0 4.392 4.378 0.3 training
294.7 72.0 12.0 16.0 5.123 5.479 6.9 training
295.4 71.1 11.9 17.0 6.495 6.149 5.3 training
296.5 70.8 12.1 17.1 7.384 7.278 1.4 training
297.6 72.5 11.9 15.6 8.405 8.572 2 training
297.6 68.8 13.6 17.6 8.005 8.411 5.1 validation
274.2 87.65 7.40 4.95 1.044 1.032 1.2 training [7]
277.2 87.65 7.40 4.95 1.580 1.576 0.2 training
280.2 87.65 7.40 4.95 2.352 2.473 5.1 validation
282.2 87.65 7.40 4.95 3.126 3.079 1.5 training
284.2 87.65 7.40 4.95 3.964 3.942 0.6 training
Complimentary Contributor Copy

Temperature / K Feed gas composition / Mole% Pressure / MPa ARD
a% Status Ref.
b
CH4 CO2 H2S exp.c rep./pred.
d
286.2 87.65 7.40 4.95 5.121 5.214 1.8 validation
288.2 87.65 7.40 4.95 6.358 6.696 5.3 test
289.2 87.65 7.40 4.95 7.212 7.386 2.4 training
290.2 87.65 7.40 4.95 8.220 7.994 2.7 training
276.2 82.50 10.77 6.73 1.114 1.076 3.5 training
278.2 82.50 10.77 6.73 1.385 1.472 6.3 training
280.2 82.50 10.77 6.73 1.815 1.855 2.2 training
282.2 82.50 10.77 6.73 2.265 2.205 2.7 training
284.2 82.50 10.77 6.73 3.110 2.761 11 test
286.2 82.50 10.77 6.73 4.065 3.725 8.4 training
287.2 82.50 10.77 6.73 4.570 4.341 5 training
288.2 82.50 10.77 6.73 4.890 4.999 2.2 training
289.2 82.50 10.77 6.73 6.110 5.661 7.4 training
290.2 82.50 10.77 6.73 6.862 6.303 8.1 training
290.9 82.50 10.77 6.73 7.650 6.744 12 training
291.2 82.50 10.77 6.73 8.024 6.934 14 training
278.2 82.91 7.16 9.93 1.192 1.243 4.3 training
282.2 82.91 7.16 9.93 1.932 1.933 0 training
284.2 82.91 7.16 9.93 2.460 2.335 5.1 training
286.2 82.91 7.16 9.93 3.303 3.144 4.8 validation
288.2 82.91 7.16 9.93 4.212 4.328 2.7 training
289.7 82.91 7.16 9.93 4.930 5.254 6.6 training
291.2 82.91 7.16 9.93 5.868 6.061 3.3 training
Complimentary Contributor Copy

Table 1. (Continued)
Temperature / K Feed gas composition / Mole% Pressure / MPa ARD
a% Status Ref.
b
CH4 CO2 H2S exp.c rep./pred.
d
292.2 82.91 7.16 9.93 6.630 6.529 1.5 training
293.2 82.91 7.16 9.93 7.916 6.986 12 training
277.2 77.71 7.31 14.98 0.646 0.636 1.5 training
280.2 77.71 7.31 14.98 1.020 1.011 0.9 training
283.2 77.71 7.31 14.98 1.428 1.390 2.7 training
286.2 77.71 7.31 14.98 2.080 1.986 4.5 training
289.2 77.71 7.31 14.98 3.164 3.189 0.8 training
291.2 77.71 7.31 14.98 4.070 4.279 5.1 test
293.2 77.71 7.31 14.98 5.270 5.588 6 validation
294.7 77.71 7.31 14.98 6.698 6.781 1.2 training
295.7 77.71 7.31 14.98 7.910 7.701 2.6 training
282.2 75.48 6.81 17.71 0.950 0.987 3.9 training
284.2 75.48 6.81 17.71 1.244 1.378 11 validation
286.2 75.48 6.81 17.71 1.670 1.805 8.1 training
288.2 75.48 6.81 17.71 2.368 2.315 2.2 training
290.2 75.48 6.81 17.71 3.080 2.991 2.9 training
292.2 75.48 6.81 17.71 4.008 3.972 0.9 validation
294.2 75.48 6.81 17.71 5.314 5.429 2.2 training
295.2 75.48 6.81 17.71 6.310 6.363 0.8 training
295.8 75.48 6.81 17.71 6.880 6.985 1.5 training
296.6 75.48 6.81 17.71 7.825 7.872 0.6 training
Complimentary Contributor Copy
Temperature / K Feed gas composition / Mole% Pressure / MPa ARD
a% Status Ref.
b
CH4 CO2 H2S exp.c rep./pred.
d
297.2 75.48 6.81 17.71 8.680 8.567 1.3 training
281.2 66.38 7.00 26.62 0.582 0.595 2.2 training
284.2 66.38 7.00 26.62 0.786 0.745 5.3 training
287.2 66.38 7.00 26.62 1.160 1.207 4.1 training
290.2 66.38 7.00 26.62 1.788 1.730 3.3 test
293.2 66.38 7.00 26.62 2.688 2.674 0.5 training
295.2 66.38 7.00 26.62 3.910 3.867 1.1 training
296.7 66.38 7.00 26.62 5.030 5.104 1.5 training
298.2 66.38 7.00 26.62 6.562 6.555 0.1 training
299.7 66.38 7.00 26.62 8.080 8.064 0.2 training
288.7 91.77 0.00 8.23 4.830 5.150 6.6 training [15]
284.3 90.49 0.00 9.51 2.590 2.584 0.2 training
282.3 93.70 0.00 6.30 3.030 2.886 4.8 validation
287.1 93.50 0.00 6.50 4.790 4.831 0.9 training
290.1 93.00 0.00 7.00 6.790 6.026 11 test
279.3 94.27 0.00 5.73 2.210 2.223 0.6 training
290.1 93.40 0.00 6.60 6.380 6.133 3.9 training
278.7 97.00 0.00 3.00 2.830 2.677 5.4 training
282.9 96.90 0.00 3.10 4.270 4.035 5.5 training
287.6 97.08 0.00 2.92 6.650 6.740 1.3 training
276.5 96.22 0.00 3.78 2.030 1.558 23 validation
278.4 99.00 0.00 1.00 3.240 3.641 12 training
282.3 98.96 0.00 1.04 4.620 5.003 8.3 training
Complimentary Contributor Copy
Table 1. (Continued)
Temperature / K Feed gas composition / Mole% Pressure / MPa ARD
a% Status Ref.
b
CH4 CO2 H2S exp.c rep./pred.
d
284.8 98.89 0.00 1.11 6.690 6.121 8.5 validation
287.6 78.00 0.00 22.00 2.100 2.079 1 training
295.4 80.20 0.00 19.80 5.070 5.064 0.1 training
279.8 78.60 0.00 21.40 1.030 1.028 0.2 training
281.5 90.50 0.00 9.50 2.070 2.110 1.9 training
287.3 89.00 0.00 11.00 3.590 3.463 3.5 training
292.1 88.50 0.00 11.50 6.000 6.149 2.5 training
273.56 38.31 61.69 0 1.500 1.495 0.3 test [16]
273.56 73.66 26.34 0 2.000 2.012 0.6 validation
275.86 43.52 56.48 0 2.000 2.010 0.5 training
273.16 100.00 0.00 0 2.600 2.604 0.2 validation
275.36 81.46 18.54 0 2.600 2.634 1.3 training
277.96 38.05 61.95 0 2.600 2.572 1.1 training
276.16 100.00 0.00 0 3.500 3.485 0.4 training
278.06 79.91 20.09 0 3.500 3.443 1.6 training
280.16 39.13 60.87 0 3.500 3.390 3.1 training
279.6 100.00 0.00 0 5.000 4.928 1.4 training
281.46 80.29 19.71 0 5.000 4.968 0.6 training
283.26 40.11 59.89 0 5.000 4.998 0 training
272.66 59.33 40.67 0 1.500 1.506 0.4 training [17]
273.56 38.31 61.69 0 1.500 1.495 0.3 training
Complimentary Contributor Copy

Temperature / K Feed gas composition / Mole% Pressure / MPa ARD
a% Status Ref.
b
CH4 CO2 H2S exp.c rep./pred.
d
274.36 9.59 90.41 0 1.500 1.381 8 validation
273.56 73.66 26.34 0 2.000 2.012 0.6 test
274.36 66.25 33.75 0 2.000 2.032 1.6 training
275.86 43.52 56.48 0 2.000 2.010 0.5 training
276.56 20.46 79.54 0 2.000 2.046 2.3 test
273.16 100.00 0.00 0 2.600 2.604 0.2 training
275.36 81.46 18.54 0 2.600 2.634 1.3 training
276.76 60.28 39.72 0 2.600 2.598 0.1 training
277.96 38.05 61.95 0 2.600 2.572 1.1 training
278.26 21.57 78.43 0 2.600 2.514 3.3 training
276.16 100.00 0.00 0 3.500 3.485 0.4 training
278.06 79.91 20.09 0 3.500 3.443 1.6 training
279.26 57.35 42.65 0 3.500 3.313 5.3 training
280.16 39.13 60.87 0 3.500 3.390 3.1 training
280.76 23.83 76.17 0 3.500 3.419 2.3 test
279.6 100.00 0.00 0 5.000 4.928 1.4 training
281.46 80.29 19.71 0 5.000 4.968 0.6 test
282.56 59.11 40.89 0 5.000 4.969 0.6 validation
283.26 40.11 59.89 0 5.000 4.998 0 training
283.56 19.48 80.52 0 5.000 4.945 1.1 training
273.5 53.47 46.53 0 1.780 1.614 9.3 test [18]
274.2 53.40 46.60 0 1.830 1.771 3.2 test
Complimentary Contributor Copy

Table 1. (Continued)
Temperature / K Feed gas composition / Mole% Pressure / MPa ARD
a% Status Ref.
b
CH4 CO2 H2S exp.c rep./pred.
d
275.2 53.03 46.97 0 2.050 2.009 2 test
275.6 52.99 47.01 0 2.120 2.111 0.4 training
275.7 52.71 47.29 0 2.200 2.131 3.1 training
276.8 51.99 48.01 0 2.400 2.413 0.5 training
278.4 51.39 48.61 0 2.825 2.885 2.1 test
278.7 50.40 49.60 0 2.851 2.969 4.1 training
279.5 49.98 50.02 0 3.301 3.255 1.4 validation
280.1 49.60 50.40 0 3.370 3.493 3.6 training
281.8 49.58 50.42 0 4.410 4.313 2.2 training
283 49.42 50.58 0 5.001 5.022 0.4 training
283.1 48.38 51.62 0 5.070 5.065 0.1 training
280.3 0.0 100.0 0 3.040 3.027 0.4 training [19]
280.3 31.7 68.3 0 3.240 3.324 2.6 training
280.3 41.5 58.5 0 3.380 3.482 3 training
280.3 51.2 48.8 0 3.600 3.602 0.1 training
280.3 55.0 45.0 0 3.640 3.673 0.9 training
280.3 55.2 44.8 0 3.670 3.677 0.2 training
280.3 57.1 42.9 0 3.710 3.720 0.3 training
280.3 61.6 38.4 0 3.770 3.836 1.8 training
280.3 64.3 35.7 0 3.860 3.909 1.3 training
Complimentary Contributor Copy

Temperature / K Feed gas composition / Mole% Pressure / MPa ARD
a% Status Ref.
b
CH4 CO2 H2S exp.c rep./pred.
d
280.3 69.8 30.2 0 3.980 4.052 1.8 training
280.3 69.0 31.0 0 4.000 4.031 0.8 training
280.3 68.9 31.1 0 4.010 4.029 0.5 training
280.3 71.2 28.8 0 4.060 4.088 0.7 training
280.3 70.7 29.3 0 4.070 4.075 0.1 training
280.3 73.2 26.8 0 4.150 4.140 0.2 training
280.3 75.5 24.5 0 4.200 4.206 0.1 test
280.3 75.9 24.1 0 4.220 4.218 0 training
280.3 78.5 21.5 0 4.310 4.305 0.1 training
280.3 78.3 21.7 0 4.320 4.298 0.5 validation
280.3 79.7 20.3 0 4.340 4.351 0.2 training
280.3 79.7 20.3 0 4.370 4.351 0.4 training
280.3 81.7 18.3 0 4.370 4.434 1.5 training
280.3 82.1 17.9 0 4.440 4.452 0.3 training
280.3 83.1 16.9 0 4.500 4.498 0.1 validation
280.3 85.6 14.4 0 4.570 4.621 1.1 training
280.3 85.9 14.1 0 4.580 4.636 1.2 training
280.3 85.7 14.3 0 4.630 4.626 0.1 training
280.3 89.6 10.4 0 4.750 4.829 1.7 training
280.3 91.0 9.0 0 4.850 4.899 1 training
280.3 93.5 6.5 0 4.990 5.012 0.4 training
280.3 100.0 0.0 0 5.460 5.177 5.2 training
Complimentary Contributor Copy

Table 1. (Continued)
Temperature / K Feed gas composition / Mole% Pressure / MPa ARD
a% Status Ref.
b
CH4 CO2 H2S exp.c rep./pred.
d
273.7 90 10 0 2.520 2.510 0.4 training [20]
275.8 91 9 0 3.100 2.975 4 test
277.8 92 8 0 3.830 3.777 1.4 training
280.2 92 8 0 4.910 4.896 0.3 training
283.2 92 8 0 6.800 6.723 1.1 training
285.1 92 8 0 8.400 8.355 0.5 training
287.2 91 9 0 10.760 10.637 1.1 training
274.6 86 14 0 2.590 2.567 0.9 test
276.9 87 13 0 3.240 3.230 0.3 training
279.1 87 13 0 4.180 4.118 1.5 training
281.6 87 13 0 5.380 5.423 0.8 training
284 87 13 0 7.170 7.210 0.6 test
286.1 88 12 0 9.240 9.395 1.7 training
287.4 87 13 0 10.950 10.914 0.3 training
273.8 75 25 0 2.120 2.106 0.6 training
279.4 78 22 0 3.960 3.901 1.5 training
283.4 78 22 0 6.230 6.105 2 training
285.2 79 21 0 7.750 7.748 0 test
287.6 75 25 0 10.440 10.413 0.3 training
273.7 56 44 0 1.810 1.698 6.2 validation
Complimentary Contributor Copy

Temperature / K Feed gas composition / Mole% Pressure / MPa ARD
a% Status Ref.
b
CH4 CO2 H2S exp.c rep./pred.
d
276.9 58 42 0 2.630 2.583 1.8 training
280.7 60 40 0 4.030 3.972 1.4 training
283.1 61 39 0 5.430 5.380 0.9 training
285.1 61 39 0 6.940 7.022 1.2 training
275.6 50 50 0 1.990 2.047 2.8 training
278.5 53 47 0 2.980 2.950 1 validation
280.9 60 40 0 4.140 4.067 1.8 training
281.8 59 41 0 4.470 4.510 0.9 training
285.1 56 44 0 6.840 6.831 0.1 training
274.6 27 73 0 1.660 1.680 1.2 validation
276.4 30 70 0 2.080 2.078 0.1 test
278.2 32 68 0 2.580 2.587 0.3 training
280.2 32 68 0 3.280 3.289 0.3 training
282 33 67 0 4.120 4.138 0.4 training
273.7 21 79 0 1.450 1.482 2.2 test
275.9 22 78 0 1.880 1.907 1.4 training
277.8 24 76 0 2.370 2.401 1.3 training
279.6 25 75 0 2.970 2.971 0 training
281.6 26 74 0 3.790 3.826 0.9 training
282.7 15 85 0 4.370 4.406 0.8 training
284.2 73.6 26.4 0 5.290 6.287 19 training [21]
287.2 73.6 26.4 0 9.830 9.321 5.2 training
Complimentary Contributor Copy

Table 1. (Continued)
Temperature / K Feed gas composition / Mole% Pressure / MPa ARD
a% Status Ref.
b
CH4 CO2 H2S exp.c rep./pred.
d
289.2 73.6 26.4 0 11.620 12.218 5.1 training
279.1 72.8 27.2 0 3.600 3.638 1.1 training
284.8 51.0 49.0 0 5.820 6.158 5.8 training
289.9 51.0 49.0 0 12.410 12.375 0.3 training
284.9 50.0 50.0 0 5.880 6.195 5.4 training
279.1 49.6 50.4 0 2.960 3.107 5.0 training
280.6 27.0 73.0 0 3.160 3.369 6.6 training
281.9 27.0 73.0 0 4.020 4.012 0.2 training
289.1 27.0 73.0 0 13.060 13.040 0.2 training
a
b Reference of the experimental data. c Experimental value. d Represented/predicted value.
exp.(i)
exp.(i)ed.(i)rep.(i)/prARD
100%
Complimentary Contributor Copy

Determination of Hydrate Stability Zones of Sour Gases … 19
A preliminary study shows that the ARD% values of the conventional gas hydrate
thermodynamic models utilizing the van der Waals-Platteeuw [8] (vdW-P) theory for
modeling the hydrate phase and different equations of state for modeling the fluid phases are
normally increased by increasing the concentration of the hydrogen sulfide in the feed gas.
Figure 1. Comparison between the represented (rep)/predicted (pred) results of the model and
experimental values of hydrate dissociation pressure for the CH4 + CO2 + H2S or CH4 + CO2/H2S
systems. [6, 7, 15-20].
The obtained hydrate dissociation pressure values indicate that the average absolute
relative deviations (AARD) of the developed LSSVM model results show generally the same
trend regarding the different concentrations of the hydrogen sulfide in the feed gas mixture.
Moreover, ZareNezhad and Aminian [5] have already stated that the AARDs of the results
through application of the famous Chen and Guo model [29] and CSMHYD software [1] vary
within 4 to 26% by increasing the concentration of the hydrogen sulfide in the feed gas while
the maximum ARD of the developed LLSVM model in this work is 5.5% for the H2S
concentration of 26.62%.
In the final analysis, it is worth mentioning that the developed LSSVM method is a
mathematical black-box. Although it leads to generally more accurate predictions than the
conventional thermodynamic models, we recommend the users to use it for interpolation of
the data. However, it may be applied for rough estimations for external predictions.
Complimentary Contributor Copy

Ali Eslamimanesh, Farhad Gharagheizi and Amir H. Mohammadi 20
Table 2. Statistical parameters of the presented model for determination of hydrate
dissociation conditions of the CH4 + CO2 + H2S or CH4 + CO2/H2S systems
Statistical Parameter Value
training set
R2 a
0.991
Average absolute relative deviation b 2.9
Standard deviation error 0.24
Root mean square error 0.24
N c 197
validation set
R2 0.987
Average absolute relative deviation 4.8
Standard deviation error 0.39
Root mean square error 0.39
N 24
test set
R2 0.981
Average absolute relative deviation 4.7
Standard deviation error 0.33
Root mean square error 0.34
N 24
total
R2 0.990
Average absolute relative deviation 3.3
Standard deviation error 0.27
Root mean square error 0.27
N 245 a: Squared correlation coefficient.
b , where n is the number of the model parameters.
c Number of experimental data.
N
i exp.(i)
exp.(i)ed.(i)rep.(i)/pr
nNAARD
100%
Complimentary Contributor Copy

Determination of Hydrate Stability Zones of Sour Gases … 21
Figure 2. The relative deviations of the represented (rep)/predicted (red) results of the model and
experimental values of hydrate dissociation pressure for the CH4 + CO2 + H2S or CH4 + CO2/H2S
systems. [6, 7, 15-20].
CONCLUSION
A LSSVM network-based mathematical model was developed for correlating/estimating
the dissociation conditions of clathrate hydrates of methane + carbon dioxide + hydrogen
sulfide and methane + carbon dioxide/hydrogen sulfide.
The experimental data available in open literature [6, 7, 15-21] were applied for
developing and testing the model. The pattern search H-GA [26, 27] optimization algorithm
was used to optimize the LSSVM structure. The statistical parameters of the obtained model
demonstrate that it is a generally acceptable tool for representing and predicting the hydrate
dissociation conditions of the investigated systems compared to the conventional models or
softwares.
Finally, it should be noted that the proposed LSSVM model may not be able to predict
the hydrate dissociation conditions of the system of interest at higher concentrations of the
hydrogen sulfide than those applied for its development and testing.
Complimentary Contributor Copy

Ali Eslamimanesh, Farhad Gharagheizi and Amir H. Mohammadi 22
REFERENCES
[1] Sloan, E.D.; Koh, C.A. Clathrate Hydrates of Natural Gases, Third Edition, CRC Press,
Taylor & Francis Group, Boca Raton, 2008.
[2] Carroll, J. Natural Gas Hydrates, A Guide for Engineers. 2nd ed., Gulf Professional
Publishing, Burlington, MA, 2009.
[3] Eslamimanesh, A. Études Thermodynamiques sur les Semi-Clathrate Hydrates de
TBAB + Gaz Contenant du Dioxyde de Carbone (Thermodynamic Studies on Semi-
Clathrate Hydrates of TBAB + Gases Containing Carbon Dioxide), MINES ParisTech,
Paris, France, 2012.
[4] Hammerschmidt, E. G. Formation of gas hydrates in natural gas transmission lines. Ind.
Eng. Chem. 1934, 26, 851–5.
[5] ZareNezhad, B.; Aminian, A., Accurate prediction of sour gas hydrate equilibrium
dissociation conditions by using an adaptive neuro fuzzy inference system. Energy
Convers. Manage. 2012, 57, 143-147.
[6] Robinson, D. B.; Hutton, J. M. Hydrate formation in systems containing methane,
hydrogen sulfide, and carbon dioxide. J. Can. Pet. Tech. 1967, 6, 6-9.
[7] Sun, C. Y.; Chen, G. J.; Lin, W.; Guo, T. M., Hydrate Formation Conditions of Sour
Natural Gases. J. Chem. Eng. Data 2003, 48, 600-602.
[8] van der Waals, J.H.; Platteeuw, J.C. Clathrate solutions. Adv. Chem. Phys. 1959, 2, 1-
57.
[9] Aspen HYSYS, Aspen Technology, Inc., 2012.
[10] Baillie, C.; Wichert, E. Chart gives hydrate formation temperature for natural gas. Oil
Gas J. 1987, 85, 37-39.
[11] Suykens, J. A. K.; Van Gestel, T.; De Brabanter, J.; De Moor, B.; Vandewalle, J.; Least
Squares Support Vector Machines, World Scientific, Singapore, 2002.
[12] Suykens, J. A. K.; Vandewalle, J. Least squares support vector machine classifiers.
Neural Process. Lett. 1999, 9, 293-300.
[13] Pelckmans, K.; Suykens, J. A. K.; Van Gestel, T.; De Brabanter, D.; Lukas, L.; Hamers,
B.; De Moor, B.; Vandewalle, J. LS-SVMlab: a Matlab/C Toolbox for Least Squares
Support Vector Machines; Internal Report 02-44, ESATSISTA; K. U. Leuven: Leuven,
Belgium, 2002.
[14] Eslamimanesh, A.; Gharagheizi, F.; Illbeigi, M.; Mohammadi, A. H.; Fazlali, A.;
Richon, D., Phase equilibrium modeling of clathrate hydrates of methane, carbon
dioxide, nitrogen, and hydrogen + water soluble organic promoters using Support
Vector Machine algorithm. Fluid Phase Equilib. 2012, 316, 34-45.
[15] Noaker, L. J.; Katz, D. L. Gas hydrates of hydrogen sulfide-methane mixtures. Trans.
AIME 1954, 201, 237-239.
[16] Seo, Y.-T.; Lee, H.; Yoon, J.-H. Hydrate phase equilibria of the carbon dioxide,
methane, and water system. J. Chem. Eng. Data 2001, 46, 381-384.
[17] Seo, Y.-T.; Lee, H. Multiple-phase hydrate equilibria of the ternary carbon dioxide,
methane, and water mixtures. J. Phys. Chem. 2001, 105, 10084-10090.
[18] Servio, P.; Lagers, F.; Peters, C.; Englezos, P. Gas hydrate phase equilibrium in the
system methane-carbon dioxide-neohexane and water. Fluid Phase Equilib. 1999, 158-
160, 795-800.
Complimentary Contributor Copy

Determination of Hydrate Stability Zones of Sour Gases … 23
[19] Ohgaki, K.; Takano, K.; Sangawa, H.; Matsubara, T.; Nakano, S. Methane exploitation
by carbon dioxide from gas hydrates - Phase equilibria for CO2-CH4 mixed hydrate
system. J. Chem. Eng. Jpn. 1996, 29, 478-483.
[20] Adisasmito, S.; Frank Iii, R. J.; Dendy Sloan Jr, E. Hydrates of carbon dioxide and
methane mixtures. J. Chem. Eng. Data 1991, 36, 68-71.
[21] Belandria, V.; Mohammadi, A. H.; Richon, D., Phase equilibria of clathrate hydrates of
methane + carbon dioxide: New experimental data and predictions. Fluid Phase
Equilib. 2010, 296, 60-65.
[22] Hagan, M.; Demuth, H. B.; Beale, M. H. Neural Network Design; International
Thomson Publishing: Boston, 2002.
[23] Curilem, M.; Acuña, G.; Cubillos, F.; Vyhmeister, E. Neural Networks and Support
Vector Machine models applied to energy consumption optimization in
semiautogeneous grinding. Chemical Engineering Transactions 2011, 25, 761-766.
[24] Cortes, C.; Vapnik, V. Support-Vector Networks. Machine Learning, 20, 1995.
http://www.springerlink.com/content/k238jx04hm87j80g/.
[25] Support Vector Machine page, Wikipedia, accessed October 2011.
[26] Goldberg, D. E. Genetic Algorithms in Search, Optimization, and Machine Learning,
Addison-Wesley, MA, Reading, 1989.
[27] Davis, L. Handbook of Genetic Algorithms, Van Nostrand Reinhold, New York, 1991.
[28] MATLAB®
R2012a, The MathWorks, Inc.
[29] Chen, G. J.; Guo, T. M. A new approach to gas hydrate modeling. Chem. Eng J. 1998,
71, 145-51.
Complimentary Contributor Copy


