Embed Size (px)
Citation preview

International Journal of Environmental Monitoring and Analysis 2015; 3(6-1): 26-38
Published online October 15, 2015 (http://www.sciencepublishinggroup.com/j/ijema)
doi: 10.11648/j.ijema.s.2015030601.14
ISSN: 2328-7659 (Print); ISSN: 2328-7667 (Online)
Determination of Land and Marine Containment Sites of Oil Spills from Crude Oil Pipelines
Huseyin Murat Cekirge
Department of Mechanical Engineering, the Grove School of Engineering, the City College of the City University of New York, New York, USA
Email address: [email protected]
To cite this article: Huseyin Murat Cekirge. Determination of Land and Marine Containment Sites of Oil Spills from Crude Oil Pipelines. International Journal of
Environmental Monitoring and Analysis. Special Issue: Environmental Social Impact Assessment (ESIA) and Risk Assessment of Crude Oil
and Gas Pipelines.Vol. 3, No. 6-1, 2015, pp. 26-38. doi: 10.11648/j.ijema.s.2015030601.14
Abstract: Containment sites are the most important locations for recovering spilled oil on land and marine environments.
Analyses for determining of containment sites for crude oil pipelines are explained in detail. Necessary information for designing
land and marine containment sites is introduced. The necessary databases for efficient response are also mentioned. The paper is
guidance for planners who will design oil spill response plans.
Keywords: Land Containment Sites, Marine Containment Sites, Catchment Areas, Land Oil Spills, Oil Spill Response Plans,
OSRP Databases
1. Introduction
A forecasting and trajectory model is necessary to follow
and monitor the oil on land and sea. This program may help
to resolve legal claims aftermath of the oil spill. Monitoring
oil spills is;
� Spill size determination;
� Spill movements;
� Spill tracking that help Incident Command; and
� Environmental monitoring.
Oil spill can be initiated from oil tanks, terminal, open
water, vessels and pipelines on land. OSRP (Oil Spill
Response Plan) must consist of detailed information for
each case, [1 - 6]. Based on the size and location of the
whole installation, equipment depots should be established
for proper response; even considering air transport for
heavy equipment. The locations must be chosen for the
most efficient response to onshore and offshore oil spills.
Land Spills: On land, oil spills start from pipelines and
flow low spots by gravity and topographic contours through
catchment areas and end up river beds, Figure 1. At the each
kilometer point, an oil spill may start and reach a river bed,
which is called “containment site”. It is mostly required two
containment site for every Kilometer Point, KP, in other
words for a segment between two consecutive KP. The
cleaning operations can performed at these containment
sites. Each containment site must be analyzed; and the
following information must be recorded in pictures, maps
and sketches:
� Description of the site and directions;
� General cleanup options / equipment;
� Environmental sensitivity of the pipeline corridor;
� Pipeline crossings information; and
� Downstream environments.
Figure 1. Down slope potential oil spill flow analysis (Catchment Area),
related containment sites and pipeline KPs (Kilometer Points), [1].
The spills must be caught and cleaned from the
equipment coming from equipment depots which are

International Journal of Environmental Monitoring and Analysis 2015; 3(6-1): 26-38 27
established best reachable location for containment sites,
even considering Tier 1, Tier 2, and Tier 3, [1].
Oil will flow toward low spots under the influence of
gravity. In general, it will follow gullies and dry creek beds at
right angles to topographic contours toward surface water. At
colder temperatures, crude oil in the pipeline system will
become extremely viscous and may reach its pour point,
below which it will be essentially immobile. The probable
pathway of spill movement has been determined along the
entire pipeline by analysis of topographic maps supported by
fieldwork.
The degree of threat to groundwater presented by a
petroleum hydrocarbon spill is subject to variables including
the properties of the hydrocarbon, size and location of the
release, permeability of the soil impacted, depth to
groundwater, and effectiveness of any response action.
Petroleum hydrocarbons will adsorb onto soil particles and
be held in soil pore spaces by capillary action. Left
uncontrolled, a fluid hydrocarbon spill will penetrate into a
porous soil until it is absorbed and bound by soil particles or
until it reaches an impermeable layer or groundwater. Soils
typically can retain 15 to 40 liters of petroleum per cubic
meter. If temperatures are below the pour point of the
hydrocarbon, threat to groundwater is minimal.
Spills to Sediment Dominated Shorelines: Oil can
become incorporated into beaches by burial (shifting sand)
or penetration. Generally, the larger grain size results deeper
potential penetration. At the extreme, it can be expected that
penetration into coarse gravel/cobble beaches will be greater
than on compacted sand or mud flats. On sand beaches,
emulsions and waxy oils will not penetrate as readily as
lighter oils and crudes. As a general rule, the maximum level
of oil in sediment beaches is 10 percent by volume (where oil
may be dripping out of the sediment). It should be mentioned
that common levels are 2 to 5.
Creeks and Streams: Oil entering creeks and streams will
move downstream with the current. Maps prepared for the
Containment Manual Database indicate estimated flow
direction information and can be used to initially predict spill
flow directions at any location along the pipeline. Some
spreading may occur, particularly with diesel spills, but the
spreading motion will typically be overcome by even a slight
current. For planning purposes, assume that the oil will move
at stream flow velocity without wind or other effects. In
practice, oil will tend to accumulate in areas of quiet water,
eddies, in vegetation, and in debris accumulations. Natural
collection areas can frequently be identified by the presence
of accumulated debris. Flow velocity can be estimated by
timing the movement of a floating object, such as a stick,
over a measured distance. Field measurement of ambient
current conditions provides a useful method of identifying
locations where booming can be successfully conducted.
Storm Drains / Culverts: Storm drains in the region may
include buried pipes, open box culverts and lined or unlined
channels. Oil entering storm drains may be lost from view
and may be difficult and dangerous to recover. These
features are confined spaces where dangerous concentrations
of vapors may accumulate. As such, spills to storm drains
can present significant fire and explosion hazard (especially
for petrol spills) and constitute high-risk entry situations.
Spills to storm drains may be assessed by carefully opening
the nearest manhole cover and visually determining the
direction of flow. If oil is present, checking observation
down gradient continues until oil is disappeared. Vapor
monitoring instrumentation may be used for tracing fluids
and vapors. Oxygen deficient and explosive atmospheres
may exist with all releases involving confined spaces. All
releases to storm drains should be approached with caution.
Canals and Irrigation Channels: The pipeline may lie in
proximity to many water supply canals and irrigation
channels. Most of these canals have elevated banks and are
exposed to spills only at points where the pipeline crosses
them. Other water supply canals are located along major
rivers, and generally have control structures which may be
used to control floating oil. Flow velocities in canals can be
estimated by timing the movement of floating debris over a
known distance.
The purpose of this paper is to provide environmental and
containment site information needed to respond efficiently
during an oil spill incident generated by the operating
company related activities. Information is provided on:
1. Ecological resources in the area and their seasonality;
2. The type of shorelines present and their general
sensitivity to spilled oil;
3. Areas of human-use importance, particularly related to
recreational use and fishing; and
4. Preplanned sites for the deployment of oil spill
equipment, referred to as containment sites.
2. Land Oil Spills
For the pipeline, volume estimates can be calculated by
adding the estimated volume lost by pumping and drainage
of material free to gravity flow from the pipeline.
� Loss Due To Pumping: Loss due to pumping can be
calculated by multiplying the pumping rate by the time
elapsed from event discovery to pump shutdown.
Specific data should be available from the pipeline
control center.
� Loss Due To Drainage: After pumping has been
terminated, sections of pipeline topographically above
a point of failure will attempt to drain. Adjacent
sections of the pipeline may be above or below the leak
point and drainage may occur from one or both
directions, depending on location. In addition, pipeline
valves will influence pipeline drainage. Block valves
have been placed at strategic locations to control the
magnitude of potential spills by isolating pipeline
segments and controlling the flow of oil in both
directions.
Maximum pipeline loss may be complicated due to
topography and the placement of block valve. To roughly
determine the potential pipeline drainage, the contents of a
pipeline from the topographic high down to the break point

28 Huseyin Murat Cekirge: Determination of Land and Marine Containment Sites of Oil Spills from Crude Oil Pipelines
can be used. Block valves will reduce the potential flow if
between the high point and the break point. Siphoning effects
over topographic highs may occur, but are difficult to
estimate.
The amount of oil contained in a contaminated land area
may be estimated by using the following techniques:
� Classify the area: Land spills are usually irregular in
shape. To begin with estimation of volume, classify the
exposed area into either “flow” areas or “pooling” areas.
Flow areas are those over which the oil moves, and
typically contain an oil coating with minimal
penetration. Pooling areas consist of depressions or low
spots where oil accumulates. Soil penetration may
occur in these areas.
� Estimate the area covered: To develop an estimate of
the area covered by flow exposure or pooling, break
each category into a series of rectangle or squares
which approximate its shape. For edges, the rectangles
should contain approximately fifty percent oiled
surface and fifty percent unoiled surface. Multiply the
length by the width of each rectangle and sum the totals
to obtain the area estimate. The more rectangles you use,
the more accurate your estimate will be.
� Estimate the Average Depth of the Oil: Oil will
typically vary from very thin at the edges to thicknesses
depending on the depth at the low points. Depths can be
estimated by gauging with a stick at a number of
locations. If the oil pool is wide or inaccessible,
estimate probable depth by projecting the general
surface profile to the center of the pool.
� Calculate the Free Oil Volume: Multiply the estimated
areas by the estimated average depths to obtain free oil
spill volume. Roughly 1 cubic meter of oil is 1 ton and
equal to 7 barrels.
� Estimate Penetration into Soil: Oil may penetrate into
soils. The depth of penetration is determined by factors
including soil type and porosity, viscosity of the oil,
temperature, and presence of water. Field observations
should include sufficient small excavations to
determine whether soil penetration has occurred and if
it has, how deep. If penetration has occurred, estimate
the depth by excavation. It should be checked to
determine whether oil in the soil is mobile by allowing
a contaminated sample to drain. Any oil which will
drain is free to migrate vertically or horizontally
through the soil. Penetration estimates are necessary for
assessing the impact and identifying appropriate
response actions.
� Burrows: In some areas spilled oil may enter animal
burrows. Depending on its characteristics, oil entering
burrows may remain in the burrow, or soak into
surrounding soils. Oil hidden in burrows is often a
source of long term recontamination.
� Estimate Penetration into Snow: In cold temperatures
below its pour point, the pipeline system crude oil into
snow is anticipated. However, other hydrocarbons may
exhibit the ability to soak into snow. When evaluating
potential contamination in snow, always consider the
fact that spillage may be hidden from view by recent
snowfall. Small observation trenches may be necessary
to determine presence and extent of contamination in
such cases. Always plot the location of any
contamination on snow so it can be re-located after
additional snowfall. It is recommended that this be
done by walking the perimeter of the spill area using a
handheld GPS unit and downloading the resulting track
line. It is also advisable to stake locations around the
perimeter of the spill. This oil must be recovered right
before snow in the start to melt.
� Tank-related spills: These include spills from above
ground storage tanks and tanker trucks. The volume of
tank spills may be estimated by comparing pre-spill
fluid levels with post-spill levels or with the height of
the hole, assuming the tank dimensions or capacity is
known.
2.1. Containment Sites
The containment sites are the most important for mitigation
of oil spills and its effects on environment. These sites must be
determined as the end of the catchment areas, every one
kilometer segment should be assigned at least two containment
sites for the collection of spilled oil. The equipment depot must
be at distance in which the response must be started according
to the operating company’s policy.
These containment sites must be regularly inspected and the
pertinent data must be collected. The “Containment Site
Database” must be designed and updated. There other response
databases are:
Equipment database: The database for locating available
equipment could be used during oil spills. This database is
designed for obtaining equipment from the local and
international resources.
Notification Database: The database for notifying
authorities and interested parties who can help response
activities. These parties could be governmental, private,
medical and legal organizations that will facilitate the response
activities and accommodation of the response staff. It is again,
the databases must be updated regularly and tested for its
functionality.
Mammal database: The database contains in mammals
around the pipeline.
There may be some other databases related to transported
crude oil and environmental conditions of the pipeline location.
The data collected for the containment site are as follow:
� Location;
� Pipeline information;
� Necessary and proper for equipment for the site;
� Sensitivity of the area and
� Pertinent topographical environmental maps; and
� Pictures.
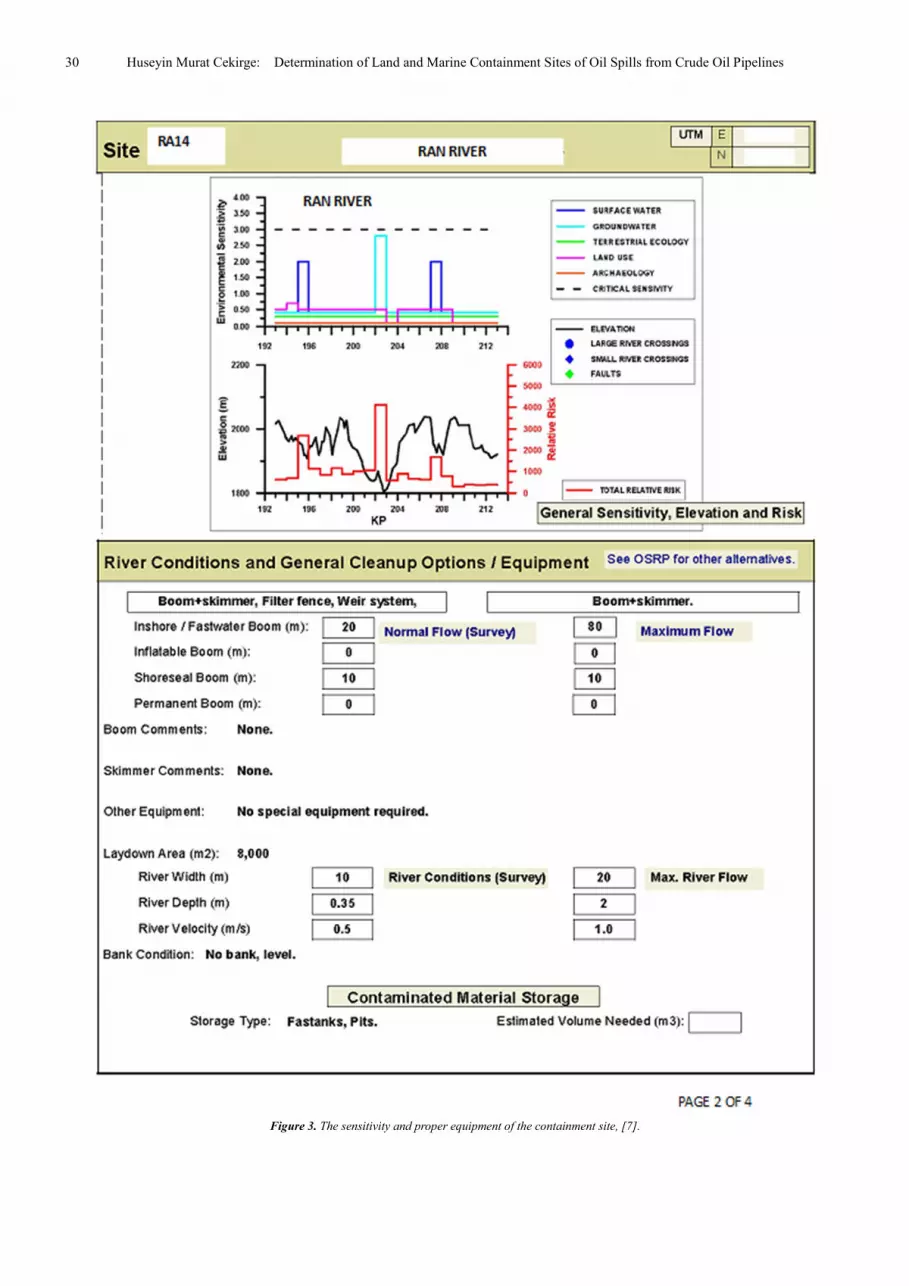
These data can be seen in Figures 2, 3, 4 and 5.
Equipment list for the equipment depots can be prepared
after the analysis and determination of appropriate equipment
for the the containment sites.

International Journal of Environmental Monitoring and Analysis 2015; 3(6-1): 26-38 29
2.2. Tracking Oil in Groundwater and Karst Areas
In areas where groundwater has been contaminated, wells
adjacent to the contamination site will be monitored for oil
contamination. Professional scientists will set up the monitoring
and instrumentation program working with the government
water agency, and related organizations.
In karst areas, and in areas with few or no operating water
wells, new wells must be drilled and pumped to determine the
extent of subsurface contamination. This is a highly specialized
field. Personnel from local groundwater organizations will be
consulted to oversee and/or advise on such operations.
Figure 2. The location of the containment site, [7].
30 Huseyin Murat Cekirge: Determination of Land and Marine Containment Sites of Oil Spills from Crude Oil Pipelines
Figure 3. The sensitivity and proper equipment of the containment site, [7].

International Journal of Environmental Monitoring and Analysis 2015; 3(6-1): 26-38 31
Figure 4. The environmental properties of the containment site, [7].

32 Huseyin Murat Cekirge: Determination of Land and Marine Containment Sites of Oil Spills from Crude Oil Pipelines
Figure 5. Pictures of the containment site, [7].

International Journal of Environmental Monitoring and Analysis 2015; 3(6-1): 26-38 33
2.3. Monitoring Guidelines
The basis of an environmental monitoring program is to
detect change in selected parameters over time. It will be
carried out in two parts:
� Comparisons of post-spill data with pre-spill data (a
baseline);
� Comparisons of post-spill data from the polluted area
with data from an unpolluted, representative reference or
control area; and
The baseline identifies conditions before the incident. The
reference or control area provides information on natural
site-to-site and seasonal fluctuations.
The design of a monitoring program will focus on
objectives and specific measures to be used, i.e. 'endpoints'.
For most credible scientific studies, a testable hypothesis will
be formulated. For example,
� Objective: Does manual clean-up affect the recovery rate
of oiled areas? ;
� Hypothesis: Manual clean-up of areas does not influence
the long term recovery compared to no treatment; and
� Endpoint (Measure): Distribution and percentage cover
of flora by oil within manually cleaned, uncleaned and
unpolluted areas.
The basis of monitoring is to identify changes through time.
However, if change is identified, the cause of change is not
always directly attributable to the oil spill that prompted the
study.
There can be large natural fluctuations in community
structures and species populations. The use of reference areas
would serve to identify these and prevent them being
attributed to an environmental stress such as an oil spill. When
formulating monitoring objectives, any relevant constraints
should be recognized and their impacts taken into account.
The specifics of a monitoring program are dependent upon
the details of any given incident. Among factors to consider
are:
� Identification of relevant baseline information;
� Inclusion of proper and useful reference or control sites
in the study;
� Establishment of objectives of the monitoring program,
including endpoints;
� Establishment of sampling methodologies; for example
quantitative versus qualitative measurements;
� What constraints are being applied and what mitigations
can be brought to carried on; and
� External reviews, such as peer review of the study and
results and engagement of the general public.
3. Marine Oil Spills
As appropriate, the operating company will establish a spill
tracking and monitoring program to assist in assessing the
conditions of the affected marine and the continuing
effectiveness of the response activities. This program may also
assist resolving damage claims. Close liaison will be
maintained with communities affected by the spill to ensure
their concerns are addressed. The program may be relatively
simple for small spills show little impact, or very complex for
large spills or spills affecting particularly complex or sensitive
habitats.
The implementation of a well-planned monitoring program
facilitates a greater understanding of the specific impacts of an
incident, as well as improving overall knowledge for future
incidents. Key elements of the spill tracking and monitoring
program include:
� Spill Size Assessment – Estimating spill volumes;
� Spill Movement – Estimating where oil will go;
� Spill Tracking - Monitoring of the characteristics and
movement of released oil will be conducted periodically
during the event to provide real-time information to
Incident Command. Shoreline Cleanup Assessment
Teams (SCAT) may be required to document the extent
and distribution of shoreline oiling; and
� Environmental Monitoring – Involving regular
monitoring after an incident up to the point where
agreement is reached that remediation is complete,
thereby providing information on the progress of
recovery in the area.
The operating company will provide oversight and work
with the Response Contractor to provide documentation,
observations and sampling of the ephemeral and longer term
environmental impacts of the oil spill and associated cleanup
operations, striving in all cases to reduce the short and long
impacts of these operations.
3.1. Spill Size Assessment
Terminal: A preliminary estimate of the size of a pipeline
spill is necessary to gage the size of the response. It can be
made from the SCADA system, from calculating pumping
loss from the time of the incident until shutdown, from
estimates of static pipeline drainage, and from visual estimates.
It is important to treat calculations based on visual
observations as preliminary, and for response planning
purposes only. The magnitude of the release may change with
time. In any case, precise calculation of the volume of a
release is difficult and may not be possible until the pipeline is
repaired. Release figures may be used to set fines and assess
damages.
Vessel Related: Losses from tanker vessels will primarily
be related to spills from the cargo or fuel tanks. Before and
after measurements are most commonly used to determine the
actual losses. If a rupture occurs during a loading operation,
then spill size can be calculated based on hole size and
location of the leak, and estimated leak duration. The location
of the hole with respect to the waterline and interior fill line is
important. The pressure head inside the cargo tank must be
greater than the outside pressure for material to exit. The
amount exiting a tank will eventually reach equilibrium with
the outside water pressure if the leak is below the water line.
These calculations can be difficult and sufficient information
is typically not available during the first stages of a spill.

34 Huseyin Murat Cekirge: Determination of Land and Marine Containment Sites of Oil Spills from Crude Oil Pipelines
Open Water: Once oil is on the water, accurate visual
estimates are difficult to achieve because spilled oil is seldom
uniformly distributed. The basic procedure involves
estimation or measurement of the spill surface area, multiplied
by its estimated average thickness of the oil. The thickness of
oil on water can be estimated from its color, [8 - 10].
Emulsions: In some cases, mechanical energy may have
mixed water into spilled crude oil, forming an emulsion, or
mousse. A practical measure of emulsion stability and
percentage can be obtained by allowing an oil sample to sit in
a glass container and after 12 to 24 hours, measure the water
fraction (water layer, if any). Refined products are not
expected to demonstrate significant emulsification.
3.2. Estimating Spill Movement
Open Water - Using a Computer Model: An oil spill fate
and trajectory model must be available for use at marine
terminal. Utilizing actual winds and concurrently measured
tides, the model provides an estimate of spill movement under
the actual conditions present at the time of the spill. The
procedures for model use must be developed.
Open Water - Vector Addition: Spilled oil movement on
water can be estimated graphically by adding wind and current
vectors. Surface currents will dominate spill movements
unless the winds are extremely strong. Observations in actual
spill situations have shown that wind will cause an oil slick to
move at about 3% of the wind speed, and in the same general
direction.
3.3. Tracking and Surveillance
The design of a monitoring program will focus on
objectives and specific measures to be used, i.e. 'endpoints'.
For most credible scientific studies, a testable hypothesis will
be formulated to investigate affects of clean-up on the
recovery rate. A key element in an effective spill response is knowledge of
where the spilled oil is located and tracking its movements.
The environment unit will work to provide the appropriate
level of oil spill tracking required by Incident Command. This
section describes procedures for effectively tracking oil when:
� On the water’s surface (rivers, lakes and oceans);
� On shorelines;
� Below the water’s surface (i.e. sunken oil) and
� Underground movement via groundwater or in karst
areas.
In all cases, the location of the observation is important. To
this end, 1:30,000 detailed topographic maps with UTM
(Universal Transverse Mercator) coordinates must be
prepared for the entire route and areas of potential marine
impacts. The specific location of the observation must be
determined using a GPS (Geographic Positioning System).
Photographs and video imaging can be marked and/or
coordinated to GPS location by using software and titling
units. Suppliers able to provide this expertise during oil spills
are listed in the Contacts Database.
Aerial surveillance via helicopter is the fastest and best
method to track oil on the water’s surface where long
distances are involved, and also offshore. Fixed-wing or
twin-engine aircraft may be a required alternative. The
Contacts Database provides information to obtain a helicopter
or fixed-wing from government and private sources.
General rules for aerial surveillance are as follows:
� Trained or experienced observers should be utilized;
� Communication to the pilot must be maintained via
headsets and hand signals;
� The observer should sit in front with the pilot;
� The ability to view through an open window is preferred;
and
� Low altitude (200 m), slow flight is preferred, with the
necessity of going up or down, or landing, for oil
verification.
During the initial spill stages, frequent overflights (two or
more times a day) are necessary:
� Detailed (1:30,000) maps must be brought on board to
mark the flight path and mark the distribution of oil;
� Oil is likely to be patchy (for example, large areas of no
oiling followed again by oiled shorelines or offshore
patches are common) and
� The NOAA (National Oceanic and Atmospheric
Administration) Open Water Oil Identification Job Aid
(http://response.restoration.noaa.gov/shor_aid/shor_aid.
html), [11], may be used, providing:
� Checklists;
� Photo examples of oil (and oil-similar material) on the
water’s surface;
� Example overflight maps; and
� Glossaries and charts.
Tracking Oil on Shoreline: Shoreline surveillance is
carried out by a combination of aerial and ground surveys with
the purpose of determining oil concentrations on the shoreline
to advise Operations for cleanup. This is a highly specialized
activity, and these activities must be done correctly. The
Contacts Database lists companies available to provide this
service, [12- 16].
Tracking Oil below the Water’s Surface: Highly weathered
or bunker oils, or oils combined with sediment, may sink
below the surface of the water, presenting a much more
difficult problem in tracking the distribution of the spill.
Methods to determine oil in the water column or on the bottom
include:
� Small fishing nets, partially lined with sorbents, to verify
oil presence (black spots on the white sorbent);
� Sorbent pads attached to a weight or anchor, and dropped
to the bottom;
� Bottom dredges (used to collect shellfish); and
� Oceanographic benthic (bottom) survey instruments
(grab sampler).
A portable flow-through fluorimeter may also used to track
dissolved oil in the water column, but involves sophisticated
instrumentation.

International Journal of Environmental Monitoring and Analysis 2015; 3(6-1): 26-38 35
3.4. Onshore Containment Sites
Spilled oil finally moves towards to shorelines and
threatens environmentally sensitive areas; and these areas are
estuaries, lagoons and beaches. The oil spilled from pipelines
and pipeline’s operations threatens marine areas of the
pipeline terminal. The sensitive areas and containment sites
can be determined by simulating oil spills for various
environmental and meteorological conditions. Once, these
sensitive areas areas determined, these are considered like
land containment sites for collecting spilled oil in marine
environment. These areas must be inspected, and the pertinent
data of the area are collected for establishing a database. The
rules of marine containment sites are same as the land
containments sites. The difference is the activation process,
which is determination of the containment sites that will be
threatened by the actual oil spills in the area. After activations
process, all the actions for recovering oil in containment sites
will be started.
The equipment for each containment site must be selected;
and then the equipment inventory for marine spills of response
depots can be determined. These equipments will be in the
general equipment database which will be used together with
notification and other databases. The details of the pertinent
data are presented by Figures 6, 7 and 8.
Figure 6. Onshore containment site, [17].

36 Huseyin Murat Cekirge: Determination of Land and Marine Containment Sites of Oil Spills from Crude Oil Pipelines
Figure 7. Activation conditions and appropriate equipment for the containment site, [17].

International Journal of Environmental Monitoring and Analysis 2015; 3(6-1): 26-38 37
Figure 8. Pictures and sensivity of the containment site, [17].

38 Huseyin Murat Cekirge: Determination of Land and Marine Containment Sites of Oil Spills from Crude Oil Pipelines
4. Conclusions
The paper presents detailed analysis of determination of
land and marine containment sites for crude oil pipelines. The
data must be collected to design these containment sites, and
the related databases must be prepared and regularly updated.
The procedure of determination of these sites and the required
data are explained, and practical examples are given including
pictures. The methodology is the directions for preparing oil
spill response plans.
References
[1] Huseyin Murat Cekirge. Outlines of an Oil Spill Response Plan (OSRP) for Crude Oil Pipelines. International Journal of Environmental Monitoring and Analysis. Vol. 3, No. 3, 2015, pp. 191-197. doi: 10.11648/j.ijema.20150303.21.
[2] Z. Zhong Z and Y. You, Oil spill response planning with consideration of physicochemical evolution of the oil slick: A multiobjective optimization approach, ANL/MCS-P1786-0810, Mathematics and Computer Science Division, Argonne National Laboratory, 2010.
[3] D. Mackay, I. A. Buis, R. Mascarenhas R and S. Paterson, Oil spill processes and models: Environment Canada, Manuscript Report No 8. EE-8; Ottawa, Ontario, 1980.
[4] N. P. Ventikos, E. Vergetis, H. N. Psaraftis and G.Triantafyllou, A high-level synthesis of oil spill response equipment and countermeasures. Journal of Hazardous Materials; 107:51-58, 2004.
[5] R. G. Pond, D. V. Aurand and J. A. Kraly, Ecological risk assessment principles applied to oil spill response planning in the Galveston Bay Area, Texas General Land Office, Austin, Texas, 2000.
[6] Z. Zhong and F. You, Oil spill response planning with consideration of physicochemical evolution of the oil slick: A multiobjective optimization approach, Computers & Chemical Engineering, 08/2011; 35(8):1614-1630. DOI: 10.1016/j.compchemeng.2011.01.009, 2011.
[7] H. M. Cekirge, Pipelines, Maltepe Uni., Int. Rep. 1/2, Istanbul, 2010.
[8] H. M. Cekirge, Oil spills and shorelines, Maltepe Uni., Int. Rep. Cekirge, H. M., “Oil Spills: Determination of Oil Spill Volumes Observed on Water Surfaces”, The International Journal of Technology, Knowledge And Society, 8 (6), 17 – 30, 2013.
[9] W. J. Lehr, R. J. Fraga, M. S. Belen, and H. M. Cekirge, "A New Technique to Estimate Initial Spill Size Using a Modified Fay-Type Spreading Formula," Marine Pollution Bulletin, 1 5(9), 326-329, 1984.
[10] W. J. Lehr, H. M. Cekirge, R. J. Fraga and M. S. Belen, "Empirical Studies of the Spreading of Oil Spills”, Oil and Petrochemical Pollution, 2 (1),7–11, 1984.
[11] NOAA (National Oceanic and Atmospheric Administration) Open Water Oil Identification Job Aid (http://response.restoration.noaa.gov/shor_aid/shor_aid.html), 2010.
[12] NOAA (USA, National Oceanic and Atmospheric Administration) Shoreline Assessment Job Aid: (http://response.restoration.noaa.gov/shor_aid/shor_aid.html), 2010.
[13] Environment Canada, (http://www.etc-cte.ec.gc.ca/estd_west/estdwest_scat_e.html#02), 2010.
[14] NOAA (National Oceanic and Atmospheric Administration), ( http://response.restoration.noaa.gov/oilaids/shore/shore.html), 2012.
[15] Environment Canada, (http://www.etc-cte.ec.gc.ca/estd_west/SOS%20FORM.pdf.), 2010.
[16] NOAA (National Oceanic and Atmospheric Administration), Assessment of the Risks Associated with the Shipment and Transfer of Group V Fuel Oils (NOAA, 1994), (http://response.restoration.noaa.gov/oilaids/GroupV.pdf), 1994.
[17] H. M. Cekirge, Oil spills and shorelines, Maltepe Uni., Int. Rep. 1/3, Istanbul, 2010.