Embed Size (px)
Citation preview

Deuterium retention studies on LithiatedTungsten under varying lithiation environments
Master Thesis
presented by
Pranay Valson
Thesis Promoter
Jose Ramon Martin Solis
Universidad Carlos III de Madrid
Thesis Supervisor
Francisco L. Tabares
June 28, 2015


Deuterium retention studies on LithiatedTungsten under varying lithiation environments
Master Thesis
presented by
Pranay Valson
Thesis Promoter
Jose Ramon Martin Solis
Universidad Carlos III de Madrid
Thesis Supervisor
Francisco L. Tabares
Erasmus Mundus Program on Nuclear Fusion Science and
Engineering Physics
June 28, 2015


Abstract
Tungsten (W) has been selected as the Plasma Facing Material (PFM) tobe used in the divertor region of ITER. Despite the advantages such as goodthermal properties, high melting point etc. Transient events, like edge localizedmodes (ELMs) and disruptions, can induce irreversible degradation on thissolid material limiting its lifetime. Use of liquid lithium (Li) as PFM however,offers unique advantages in terms of heat handling capabilities and plasmaperformance improvement. Furthermore a liquid metal does not present apermanent deformation and degradation compared to a solid material. For allthese reasons, lithium is considered as an alternative PFM for future fusiondevices.
In this work deuterium (D) retention (a substitute for Tritium) on Lithiated-W has been studied, by the development of necessary samples using a highpurity cold rolled tungsten sheet at 250C, Lithiated by evaporation of pureLi (99.9%) at 500C under Helium (He) flow, (corresponding to Li depositionon W) or He plasma conditions (Li deposition + implantation on W) undera pressure of ∼ 3 Pa for all instances, in a device constructed and designedat CIEMAT, Madrid for serving this particular purpose. Then deuterium up-take in the Li-W surface for the differently lithiated samples were studied at250C (sample temperature), using mass spectrometry and optical emissionspectroscopy (OES) under D2 glow discharge plasma (plasma voltage 100-250V, plasma current of 250− 300 mA and total fluence of ∼1023 D/m2) withoutaltering the physical or chemical state of the exposed samples.
The lithiated samples were also subjected to sputtering using Argon (Ar)plasma and then analyzed for the new surface conditions. Post-mortem Nu-clear Reaction analysis (NRA) and Laser induced breakdown spectroscopy(LIBS) are used to probe aspects related to retention in these PFMs withdepth profiles. The analysis indicates a higher D uptake for lithiated W surfaceunder He flow, compared to Lithiation under He plasma conditions (atomicD/(Li+W) rates between 0.40-0.50) in addition to implanted Li differenceswhich correlate with particle balance calculations, depending on the chemicalstate of the Li-W layer and treatment used.
Finally a mathematical model for implantation of W-PFM with Li andseparately D implanted on W is adapted. This is used for comparisons withexperimental values to fully aid the understanding of the underlying processesinvolved in the enhanced pumping action established on lithiated-W whichcould serve as the future reactor PFM and address Li-W interactions.
1

2
Contents
1 Introduction 51.1 Energy Crisis: Climate Change & Fusion Energy . . . . . . . . . 51.2 Magnetic Confinement Fusion . . . . . . . . . . . . . . . . . . . 8
1.2.1 Tokamak ingenuity: The First MCF Attempt . . . . . . 111.2.2 Inescapable Faults: Toroidal Plasma Current . . . . . . . 131.2.3 Stellarators: Modifying the Rotational Transform . . . . 141.2.4 Ignition: Reaching self sufficiency . . . . . . . . . . . . . 171.2.5 Future Reactors: Steady State Machines . . . . . . . . . 18
1.3 Main issues facing ITER like MCF machines . . . . . . . . . . . 201.4 Plasma Facing Components: Requirements & Challenges . . . . 22
1.4.1 Plasma Limiters & Divertors: Function & types . . . . . 221.4.2 The Scrape Off Layer . . . . . . . . . . . . . . . . . . . . 24
1.5 Liquid Metals & Lithium for Fusion . . . . . . . . . . . . . . . . 261.5.1 Lithium Capillary Porous Limiter & Limitations . . . . . 29
2 Experimental setup 332.1 Glow Discharge Setup . . . . . . . . . . . . . . . . . . . . . . . 332.2 Tungsten Wall & Lithium Evaporation Setup . . . . . . . . . . . 372.3 Data Acquisition & Diagnostics . . . . . . . . . . . . . . . . . . 39
2.3.1 Residual Gas Analyzer (RGA) . . . . . . . . . . . . . . . 392.3.2 Optical Emission Spectroscopy (OES) . . . . . . . . . . . 412.3.3 Laser Induced Ablation Spectroscopy (LIBS) . . . . . . . 432.3.4 Nuclear Reaction Analysis (NRA) . . . . . . . . . . . . . 45
3 Conduction & Results 473.1 Experimental Procedure . . . . . . . . . . . . . . . . . . . . . . 47
3.1.1 Pre-Experimental Setup . . . . . . . . . . . . . . . . . . 483.1.2 W-Lithiation using Helium Gas Flow . . . . . . . . . . . 483.1.3 Li Deposited-W, Sputtered with Argon . . . . . . . . . . 503.1.4 W Lithiation using Helium Plasma . . . . . . . . . . . . 523.1.5 Li Deposited & Implanted-W, Sputtered with Argon . . 553.1.6 Ultra Sound Cleaned W-wall . . . . . . . . . . . . . . . . 56
3.2 Simulations & Modeling . . . . . . . . . . . . . . . . . . . . . . 563.3 Particle Balance Calculations & Optical Emission Spectroscopy 583.4 Conclusions & Future Work . . . . . . . . . . . . . . . . . . . . 62
3

4 Contents

Chapter 1
Introduction
Everything not forbidden byphysics is compulsory
Murray Gell-MannParticle Physicist
1.1 Energy Crisis: Climate Change & Fusion
Energy
Humans have flourished despite wars, famines, natural disasters and epidemicsgiven the significant advantages of evolution that have been passed down tous over a hundred thousand years of Homo-Sapien development. Evolution, aphenomenon filled to the brim with complexity driven by uncertain principlesof order occurring within assured disorder (claimed by the second law of ther-modynamics: increase in entropy) has led to the development of the one of themost multifaceted mysteries of all, the human brain. Human development, inhistory of the Earth at this time, is at stake due to an unprecedented exponen-tial growth of science, technology, research resulting subsequently to naturalresource exploitation and population explosion, leading to a questionable ra-tionale behind the development model and human direction. With the increasein all these parameters of development, encompassing all the very basic needsof the human race, an enormous rise in demands of usable energy (electricity,chemical, heat, light, sound etc) has inadvertently occurred. The BP Statisti-cal Review of World Energy, 2015 [1], indicates the following trends as shownin figure 1.1. It is clear that populations and gross domestic product (GDP)are the most noteworthy drivers of growth in energy demand. Extrapolationsbased on existing trends show by 2035, the world’s populations reaches 8.7 bil-lion adding another 1.6 billion to the number of people with increasing energyneeds. Over this same period the GDP in terms of purchasing power parity(PPP), is expected to double anticipated from heightened development in thefields of computing and transportation. Meanwhile the shares of oil & coal as
5

6 1. Introduction
primary energy sources are predicted to fall, thus leading to a 30% void in theenergy production sector.
Figure 1.1: (a). Population, (b). Gross Domestic Product, (c). Energy source
shares in 2015 and projections to 2035 [1]
These projections clearly would put a severe strain on the existing en-ergy technologies in providing a stable source of continued, non-intermittent,on-demand power (a challenging problem faced by many renewables). Non-renewable are infamous for the ways in which they continue to afflict climatechange, global warming (S.Arrhenius estimated that a doubling of CO2 con-centration would lead to an increase of 4-6C of the earth global temperatureback in 1900) and runaway polar melting (point of no-return recently surpassedin 2014) leading to an increase in ocean levels. Though there have been severaldifferent phases in history with variable temperatures (∆T > 5 K) and CO2
concentrations (> 1000 ppm), human evolution has happened over a consid-erably colder period [2]. The actual impact of energy consumption can beunderstood from the modest Kaya Equation (named after Japanese professorYoichi Kaya) [3] in which CO2 is the main greenhouse gas of world emissions,contributed primarily from human & industrial activity.
CO2 =CO2
TOE× TOE
GDP× GDP
POP× POP (1.1)
Here, TOE is the world energy consumption equivalent which means ton oilequivalent, 1TOE = 11600 kWH = 42 billion joules. “CO2/TOE” is theamount of CO2 that we must let go in the atmosphere to get a given amountof energy. “TOE/GDP” is the amount of energy we have to use to get a euroof GDP. The ratio “GDP/POP” is frequently used, and can distinctively becalled “production per person” or creation of wealth. This equation then trans-lated to its literal meaning gives the following:

1.1 Energy Crisis: Climate Change & Fusion Energy 7
Figure 1.2: (a). Consumption of fuel and correlation with, (b). Greenhouse
carbon content by tonne oil equivalent of final energy, for various types of energies
[1] [3]
CO2 emissions = Carbon content of the energy * Energy intensity of the econ-omy * Production per person * Population
From this equation it can be estimated that in order to achieve gross goalsof growth of GDP of country and decrease of CO2 emissions we should havefossils fuels decreasing by 2.7% per year, while “carbonless energies” (renew-able and nuclear altogether) should increase over 5% per year, to be multipliedby almost 8 in 40 years. Additional information recently acquired for the G7summit (8-June-2015) at Kruen in Germany, directly acted upon these pro-jections, where the leaders of the world’s major industrial democracies haveresolved to wean their energy-hungry economies from carbon fuels. Under di-rection from Angela Merkel (the “Climate Chancellor”) they have pledged toreduce global greenhouse gas emissions by 40-70% by 2050 and backed a globaltarget for limiting the rise in average global temperatures to 2C. Resolutionsand global decisions would be finalized in the UN Climate change conferencesummit by 200 nations in Paris in December 2015, but this step by the G-7is vital to this direction. Thus, in a few decades we will see only renewablesas top contenders on the energy market. Actually that day is unavoidableand indispensable in terms of the numbers of years humans have taken toreach the current level of development. The elephant in the room has alreadybeen addressed several times now, which gives us the impetus to contributetowards the goal of seeing this day as soon as possible. Despite the enormousavailability of renewables that we see at this stage, a very prominent issue isrelated to inconsistency in terms of delivered power and the temporal fluctu-ations of the same. This is of course understandable given that the climateis also going to change further drastically by the time we can finally see thecoming of such non-fossil fuel dependent days, but undertakings such at the

8 1. Introduction
G-7 summit assist our goal. Though the change in global temperatures is ex-pected to exceed 2C, the consequences of changing environment and climate,effectively alters the renewable resources development and implementation torelated world climate issues. These projected increases would be altered asclimate change becomes more apparent, understandable from the above de-scription of the Kaya equation, meanwhile maintaining development level andGDP. This is an unavoidable issue all countries irrespective of their develop-ment would need to face. Nevertheless this fact is not very surprising giventhe previous knowledge of major energy shifts in history. Previous energy pro-duction techniques and distribution are already well developed and in use inmajor networks under ownership of corporates which have invested a lot onthe infrastructure, any new technology would take at least 40-60 years to reachthe state of comparable implementation ability. The new technologies reallyneed to jump start and push through many decades of obstacles, which thenuclear fusion industry is presently going through. It has formerly taken ap-proximately 50 years to replace wood as the major energy source to coal duringthe industrial revolution. Hence, the expected delay in the implementation ofrenewables. If anything a chance to learn from the mistakes made previouslyare surely tied towards greater percentages in renewable and nuclear energy.Fusion with its challenges is not considered as a practical contender, but thishas to change by 2035. Nuclear Fusion is demonstrated as a functional prin-ciple every morning, when the sun shines. Energy from the fusion reactionsin the sun are captured and processed by various organisms that have evolvedunder this energy source, for billions of years. The next section revolves aroundhow we can capture its potential in a controlled manner on Earth for advancingsustainably in the future.
1.2 Magnetic Confinement Fusion
Nuclei are made up of protons and neutrons, the mass of a nucleus is alwaysless than the sum of the individual masses of these constituents due to thenature of the strong nuclear force acting over a distance of the nucleon radius(1.75 − 15 fm). The difference is a measure of the nuclear binding energywhich holds the nucleus together. The nuclear binding energy per nucleon(proton and neutron) thus can be represented as a function of the mass number.Figure 1.3 shows this relationship [4]. Masses of the nuclei are smaller by∆m compared to the individual constituents. Any fusion reaction employsEinstein’s famous equation mass energy equivalence relation to convertthis mass defect into energy ∆E = ∆mc2. For light nuclei (Mass numberA < 60) it is in the orders of MeV, hence a 6 orders of magnitude greater thanthe energy released in chemical reactions of fossil fuels. Thus making it anyday, a better alternative. The binding energy curve in figure 1.3 also indicateswhy fusion for light nuclei would release more binding energy per nucleonfused than fission, which is considerably more probable for heavy nuclei above

1.2 Magnetic Confinement Fusion 9
Figure 1.3: Nuclear binding energy ∆E per nucleon as a function of mass number
‘A’ [5]
this range. Since the strong nuclear force acts over distances of the order ofthe nuclear radius, above these ranges coulomb repulsion starts to dominate.It is essential that light hydrogenic (or isotopes) atoms are stripped of theirelectrons to enable the nucleus to collide with another such species of ionstraightforwardly. This is a binary collision occurring between the two ionicspecies (they may be same or different isotopic species) and a plasma consistsof these entities and the stripped away electrons but maintaining overall globalneutrality.
In order to overcome the coulomb repulsion between the positively chargedparticles (nuclei) so that the strong nuclear force of attraction becomes domi-nant, leading to the two nuclei coming together to form a new nuclear species,sufficient kinetic energy in the ions motion of the order of several hundreds ofKeV is required to be gathered. Once brought together by providing externalenergy, the probability that they come to fuse to form another nuclei is rep-resented by the Ptun or the tunneling probability, this is often referred to asthe collision-cross section for a given nuclear reaction. The higher the crosssection, the higher the probability of the reaction taking place. eZ1and eZ2 arecharges of the colliding nuclei and ν their relative velocity. Ecrit represents thiscritical external energy that needs to be provided to the nuclei for overcomingthe repulsive forces and h is the Planck’s constant. [6]
Ecrit ∝ Ptunnel ∝ exp
(Z1Z2e
2
hν
)(1.2)
From the figure 1.4 it is obvious that the higher probability of fusion re-action due to larger cross sections lies in the D + T → He4 + n + 17.6 MeV

10 1. Introduction
Figure 1.4: (a). D-T nuclear reaction, (b). Collision Cross Sections for D−T,D−D,D −He3, P −B11, P − Li6 as a function of particle energies [7]
reaction and is energetically also more favorable. This 17.6 MeV is dividedas inversely proportionally to the particles masses that carry away the energyfrom the reaction. Thus a fusion reaction actually is a thermonuclear reaction.Assuming that all this is occurring in vacuum so that the ions do not actuallycollide with species that are not desirable nor thought of as possible candidatesin attaining fusion. Different confinement systems are able to ensure the fusionreaction in various ways. Gravity is one such confinement type which is thesource of the kinetic pressure for ions to fuse with each other, on the stars suchas the Sun. On earth however we do not have this resource at our disposalconsidering we do not know specifically know how to manipulate the force ofgravity, as it is not very well understood nor completely assimilated within thescope of our current explanatory theories of which quantum mechanics and re-ductionism dominates (however if we were to understand this, it would give usmore possibilities for exploring fusion). The foremost conceivable system forfusion on earth is magnetic confinement fusion. It is well known that chargedparticles such as ions undergo a process of entrapment or motion along lines ofa magnetic field. This is described by the Lorentz force in which a chargedparticle having a velocity along a given direction is in the presence of a mag-netic field (‘lines of force’), undergoes a helical motion along the direction ofthe magnetic field, also called gyro-motion (from the word gyrate). The radiusof this motion is called the Larmor Radius given in equation 1.3.
rL =mv⊥q | B |
(1.3)
Here m, q and v⊥ are the mass, charge and velocity components of the chargedparticle perpendicular to the magnetic field vector B. For B of several Teslathe Larmor radius of hydrogen isotopes with a temperature of 10 − 100 eV istypically a few hundred of µm. This is an action of the magnetic force on acharged particle due to the force of electromagnetism. Note that the action

1.2 Magnetic Confinement Fusion 11
due to magnetic field is a cross product hence the revolution around the fluxlines. But the revolution has a center which drifts along an electric field. Thisis due to the nature of action of the electric field on the charged particle it-self. This component of the force causing revolutionary motion on the chargedparticle, combines with the drift in it center leading to helical motion aroundthe fixed lines of flux as seen in figure 1.5 (a). Depending on the charge ofthe species ions or electrons, the helical motion is in opposite directions. It isobvious that neutral species need to be ionized in order to be confined by thismechanism otherwise they will escape. In case of naturally occurring gasesthey can be ionized by applying a very high voltage thus stripping the elec-trons from the atom’s nucleic force of attraction and freeing the atoms of theirelectrons producing ions. So now in place of randomly moving neutrals, ionsare confined to magnetic lines of force. Assuming a general understanding ofmagnetic confinement fusion (MCF) from the above generalization of magneticfield trapping, we are commonly acquainted with two main devices tokamaksand stellarators which are essential to this discussion and will be briefly ex-plained in this section. Both the devices have certain attributes that makethem alike and then certain other features that completely differentiate them.There are historical reasons as to why, of the two devices the one leading in re-search for achieving controlled fusion (and ignition) is the tokamak. There arerelated reasons as to why stellarators are lacking in this direction but are nowquickly catching up. Tokamaks have had the lead for long and are also fundedwith greater enthusiasm in general. It is important however to understandthe mechanism behind magnetic confinement fusion (MCF) and the specificaspects within it that lead to the main difference between the two machines.
1.2.1 Tokamak ingenuity: The First MCF Attempt
It is required that the trapped ions do not escape our magnetic bottle contain-ing the fields. The easiest way to avoid doing this is by converting the bottleinto a torus, in which the ends meet up. But this leads to the complication,that the field lines are no longer straight. Due to this there is a drift verticallyacross the field lines on the charged species called the ExB drift. This is truefor any magnetic fusion machine with a toroidal configuration. This would benaturally followed by a charge separation due to the motion across the fieldlines and hence neutrality would be destroyed and confinement would be lostquickly. This is unfavorable for fusion, since charged particles need to be mov-ing towards each other and not drifting apart across the field lines. The way toresolve this is by an additional magnetic field in the poloidal direction. In thecase of a confined plasma in a vacuum sealed container, the toroidal field as wesaw could be provided simply by loops of currents running around the poloidalcross section throughout the torus. It was the Russians, Igor Tamm and An-drei Sakharov in about 1950 [9] who realized that the additional poloidal fieldwhich could solve the problem of drift and charge separation, could be gener-ated by the plasma itself. This could be done by inducing a plasma current

12 1. Introduction
Figure 1.5: (a). Drift of charged particles in a magnetic field, (b). Obtaining the
rotational transform for tokamaks [8]
in it, (the plasma itself being a good conductor) by means of a transformer atthe center of the tokamak. At that point in time with geometrical symmetrya compulsion, this was a resourceful solution. The combination of the poloidaland toroidal fields leads to a net field which is called the rotational trans-form; as seen in figure 1.5 (b). this makes the charged species gyrate from thetop of the toroid to the bottom and back towards the top, hence preventing acomplete vertical charge separation. Another significant aspect to this is thatthe field lines should always close on themselves. The number of times theyneed to go around the torus in order to do that is called the toroidal numberm. The number of times they revolve around the radius of the torus beforeclosing in on themselves is the poloidal number n. The ratio of m/n gives thesafety factor. It determines the stability of the plasma as the plasmas thatrotate in the toroid poloidally with an equal number of times as toroidally areless susceptible to instabilities. The nested field lines going around the torusin closed loops form a surface through the torus and it is essential that thefield lines lie on this surface; this is called the flux surface. Along a given fluxsurface with constraints of geometric symmetry it can be estimated that theproperties of the plasma such as its temperature, density etc. remain the sameapproximately. The flux surface practically guarantees perfect motion of thecharges species along the flux surface and hence giving supplementary controlto its movement. This is crucial for confinement. However not all plasmasare collision-less (disturbing the existing orbits of the nuclei), this brings inadditional complications that need to resolved.
1.2 Magnetic Confinement Fusion 13
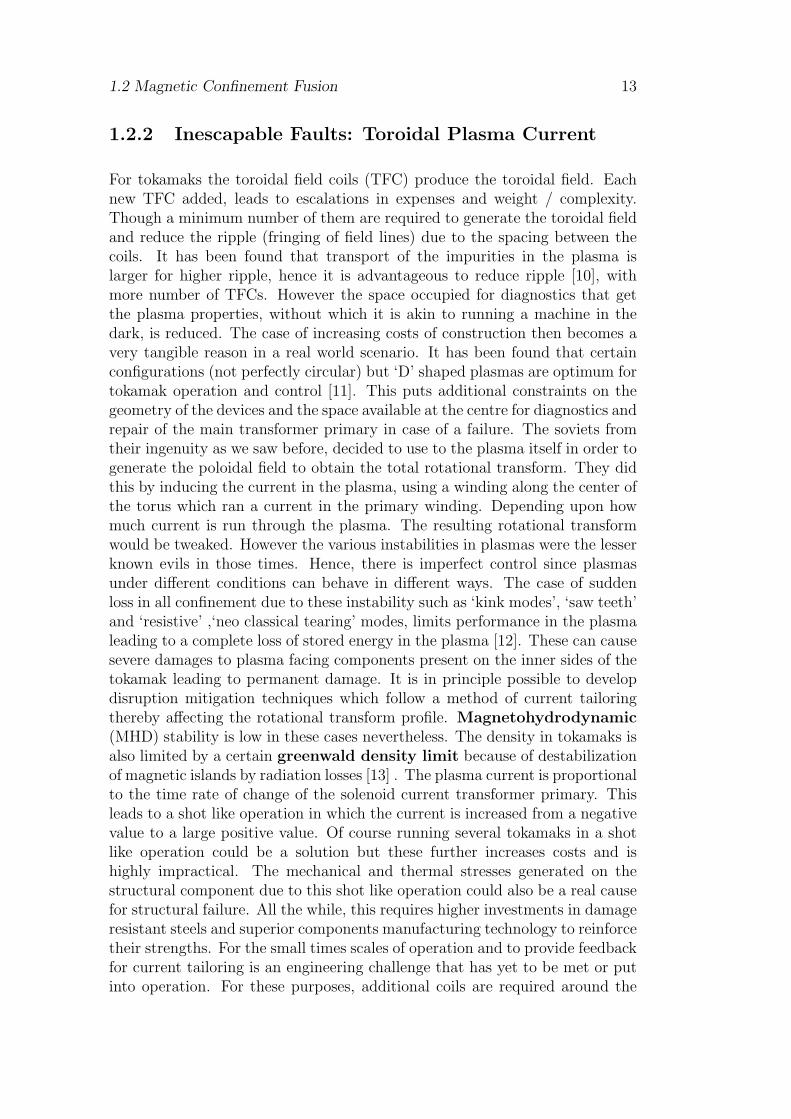
1.2.2 Inescapable Faults: Toroidal Plasma Current
For tokamaks the toroidal field coils (TFC) produce the toroidal field. Eachnew TFC added, leads to escalations in expenses and weight / complexity.Though a minimum number of them are required to generate the toroidal fieldand reduce the ripple (fringing of field lines) due to the spacing between thecoils. It has been found that transport of the impurities in the plasma islarger for higher ripple, hence it is advantageous to reduce ripple [10], withmore number of TFCs. However the space occupied for diagnostics that getthe plasma properties, without which it is akin to running a machine in thedark, is reduced. The case of increasing costs of construction then becomes avery tangible reason in a real world scenario. It has been found that certainconfigurations (not perfectly circular) but ‘D’ shaped plasmas are optimum fortokamak operation and control [11]. This puts additional constraints on thegeometry of the devices and the space available at the centre for diagnostics andrepair of the main transformer primary in case of a failure. The soviets fromtheir ingenuity as we saw before, decided to use to the plasma itself in order togenerate the poloidal field to obtain the total rotational transform. They didthis by inducing the current in the plasma, using a winding along the center ofthe torus which ran a current in the primary winding. Depending upon howmuch current is run through the plasma. The resulting rotational transformwould be tweaked. However the various instabilities in plasmas were the lesserknown evils in those times. Hence, there is imperfect control since plasmasunder different conditions can behave in different ways. The case of suddenloss in all confinement due to these instability such as ‘kink modes’, ‘saw teeth’and ‘resistive’ ,‘neo classical tearing’ modes, limits performance in the plasmaleading to a complete loss of stored energy in the plasma [12]. These can causesevere damages to plasma facing components present on the inner sides of thetokamak leading to permanent damage. It is in principle possible to developdisruption mitigation techniques which follow a method of current tailoringthereby affecting the rotational transform profile. Magnetohydrodynamic(MHD) stability is low in these cases nevertheless. The density in tokamaks isalso limited by a certain greenwald density limit because of destabilizationof magnetic islands by radiation losses [13] . The plasma current is proportionalto the time rate of change of the solenoid current transformer primary. Thisleads to a shot like operation in which the current is increased from a negativevalue to a large positive value. Of course running several tokamaks in a shotlike operation could be a solution but these further increases costs and ishighly impractical. The mechanical and thermal stresses generated on thestructural component due to this shot like operation could also be a real causefor structural failure. All the while, this requires higher investments in damageresistant steels and superior components manufacturing technology to reinforcetheir strengths. For the small times scales of operation and to provide feedbackfor current tailoring is an engineering challenge that has yet to be met or putinto operation. For these purposes, additional coils are required around the

14 1. Introduction
tokamak further increasing the already rising costs of the engineering excellentplasma facing components, diagnostics and coils. It seems to be the case ofadditional complexities in the face of existing problems, thus a revamp in thewhole idea was required to face the adding complexities.
1.2.3 Stellarators: Modifying the Rotational Transform
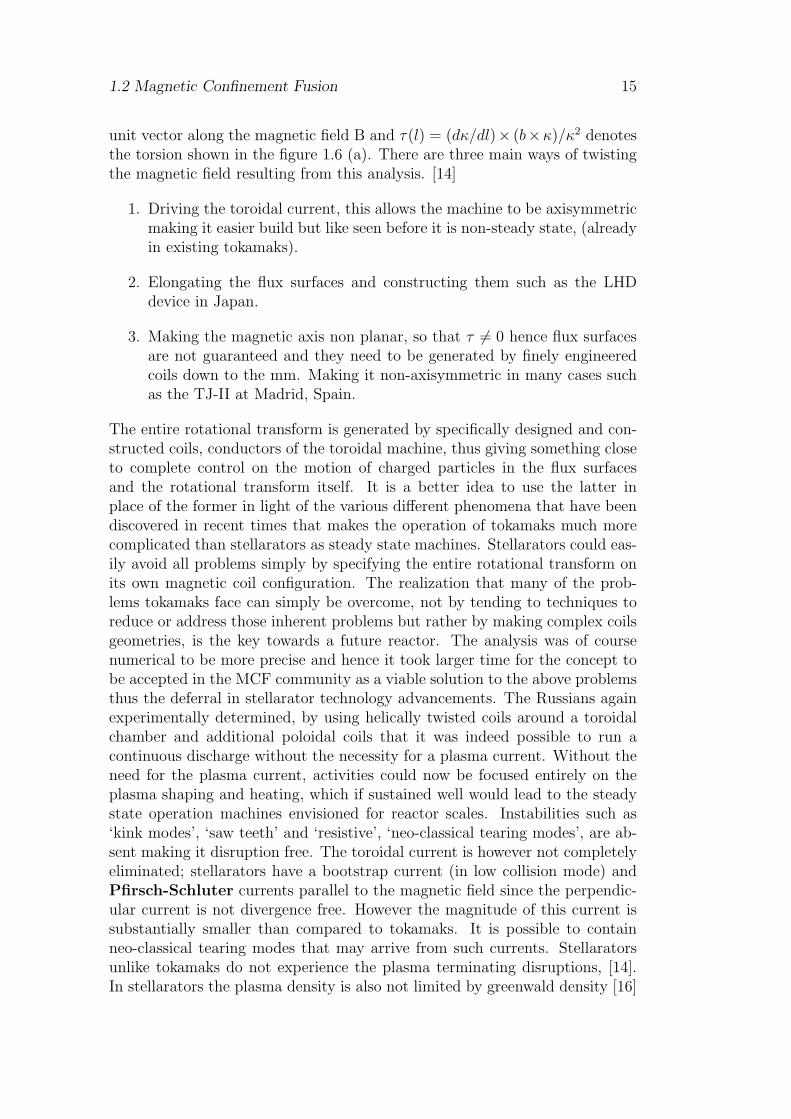
Figure 1.6: (a). LHD Flux Surface geometry in the vicinity of the magnetic axis
(the transform is generated by the poloidal rotation as one moves around the torus
and right the flux surfaces, (b). Magnetic Flux surface and coil construction in the
W7-X, Greifswald, IPP [14]
The primary difference between the stellarators and tokamaks can be un-derstood within the domain of how the rotational transform is created for bothmachines. Stellarators have a design, in which there is no dependence on theplasma for the rotational transform, and it is not necessary to induce a plasmacurrent for the generation of the rotational transform, this makes them a seri-ous candidate for a fusion machine besides the existing tokamak (lacking thisfeature) since continued operation becomes a possibilty. The Insight for thedevelopment has been granted to Lyman Spitzer of Princeton Plasma physicslab, he individually came up with concept of a stellarators [15]. Further Spitzerand Mercier proved mathematically that there are three ways of producing arotational transform of a toroidal magnetic field. They expanded Maxwell’sequations in the presences of a magnetic field; here the average number ofpoloidal turns of a field line in one toroidal revolution can be expressed as anintegral along the length l once around the magnetic axis.
ι =l
q=
1
2π
∫ L
0
[µ0J
2B0
− (coshη − 1)d′ − τ)
]dl
coshη−N (1.4)
Here J is the current density on the magnetic axis, N is the integer oftopological origin eη = r2/r1 the elongation of flux surface, d(l) the tiltingangle with respect to the curvature vector κ = db/dl where b = B/B is the
1.2 Magnetic Confinement Fusion 15
unit vector along the magnetic field B and τ(l) = (dκ/dl)× (b×κ)/κ2 denotesthe torsion shown in the figure 1.6 (a). There are three main ways of twistingthe magnetic field resulting from this analysis. [14]
1. Driving the toroidal current, this allows the machine to be axisymmetricmaking it easier build but like seen before it is non-steady state, (alreadyin existing tokamaks).
2. Elongating the flux surfaces and constructing them such as the LHDdevice in Japan.
3. Making the magnetic axis non planar, so that τ 6= 0 hence flux surfacesare not guaranteed and they need to be generated by finely engineeredcoils down to the mm. Making it non-axisymmetric in many cases suchas the TJ-II at Madrid, Spain.
The entire rotational transform is generated by specifically designed and con-structed coils, conductors of the toroidal machine, thus giving something closeto complete control on the motion of charged particles in the flux surfacesand the rotational transform itself. It is a better idea to use the latter inplace of the former in light of the various different phenomena that have beendiscovered in recent times that makes the operation of tokamaks much morecomplicated than stellarators as steady state machines. Stellarators could eas-ily avoid all problems simply by specifying the entire rotational transform onits own magnetic coil configuration. The realization that many of the prob-lems tokamaks face can simply be overcome, not by tending to techniques toreduce or address those inherent problems but rather by making complex coilsgeometries, is the key towards a future reactor. The analysis was of coursenumerical to be more precise and hence it took larger time for the concept tobe accepted in the MCF community as a viable solution to the above problemsthus the deferral in stellarator technology advancements. The Russians againexperimentally determined, by using helically twisted coils around a toroidalchamber and additional poloidal coils that it was indeed possible to run acontinuous discharge without the necessity for a plasma current. Without theneed for the plasma current, activities could now be focused entirely on theplasma shaping and heating, which if sustained well would lead to the steadystate operation machines envisioned for reactor scales. Instabilities such as‘kink modes’, ‘saw teeth’ and ‘resistive’, ‘neo-classical tearing modes’, are ab-sent making it disruption free. The toroidal current is however not completelyeliminated; stellarators have a bootstrap current (in low collision mode) andPfirsch-Schluter currents parallel to the magnetic field since the perpendic-ular current is not divergence free. However the magnitude of this current issubstantially smaller than compared to tokamaks. It is possible to containneo-classical tearing modes that may arrive from such currents. Stellaratorsunlike tokamaks do not experience the plasma terminating disruptions, [14].In stellarators the plasma density is also not limited by greenwald density [16]

16 1. Introduction
but rather by how radiation is lost form the plasma core. This hence dependson the concentration and the loss of impurities. They can operate at higherdensities compared to tokamaks due to this fact. The primary problems ofdisruptions is completely eliminated, however due to the lack of toroidal sym-metry additional problems arrive such as the ‘ripple’ transport. Numericalcalculations can make sure the flux lines are closed however; transport lossessuch as this contribute to a decrease in confinement. The problems in rippletransport were overcome by a physicist named Allen Boozer. [10] The chal-lenge in stellarator development is to design the outer flux surface (OFS).At the Max-Planck Institute for Plasma Physics it was understood that thelast outer flux surface could be enclosed by an overall twisted toroidal sur-face. This outer twisted toroidal surface could be generated using specificallytwisted or fringed conductor coils placed next to each other giving rise to theoverall stellarator field configuration. A remarkable example of this is W7-Xat IPP Greifswald, one of the largest stellarators of its type which uses su-perconducting coils to generate a very high magnetic field. The accuracy inengineering of the coils however it of principal importance due to the neces-sity of the perfect last closed flux surface (as the rotational depends on thisabsolutely and wholly). However the design also has some additional advan-tages since the coils are individually constructed, any problems in one of thecoils could be easily resolved by removing this and replacing it immediately toresume activities on the machine. The higher aspect ratio, of the stellaratorsalso provides for greater space in the inner circle of the High B field side. Thusincreasing access and allowing placement of diagnostics and heating devices forthe plasma in this space. The number of configurations thus for a stellaratorsare numerous considering the machine can be tweaked in design for improvingand optimizing the aspect ratio, cross sectional shape, current or magneticfield strength. The method chosen by the VMEC code can resolve this issue[17], this code makes guarantees on the presence of the nested flux surfaces.It is a crucial aspect in stellarators that alpha particle pressure Pα ∼ τs ∼T
3/4e /ne is proportional to slowing down time, this is smaller than compared
to tokamaks, credited to the ability of the stellarator to operate above thegreenwald limits. We are also aware that in fusion power Pfus ∼ n2
eT2i , the
alpha particle pressure scales as pα ∼ n−5/2e ,therefore increasing the density
brings down the alpha particle pressure which is great to reduce the lossesdue to impurity transport and radiation. The advantages are very clear mak-ing it a steady state, high density, disruption free continuous machine butwith complex geometry. However the existence of unconfined particle orbitssuch as those for alpha particles can lead to high neoclassical transport ofthe thermal particle species. The effective diffusivity scales as the followingDe ∼ e
3/2effTe
7/2/neB2R2
Here eeff is the quantity that symbolizes confinement quality, vd is thedrift velocity , Te is the electron temperature and R is the major radius ofthe device. Due to higher Te scaling, neoclassical losses are higher at highelectron temperatures. The transport regions on the outer edge are attributed

1.2 Magnetic Confinement Fusion 17
Figure 1.7: Collisionality Regimes for tokamaks and stellarators [14]
to turbulence losses. The so-called ‘mono-energetic’ diffusion coefficient versuscollisionality, ν∗ = νR/ιv, where ν is the mono-energetic pitch-angle-scatteringfrequency, R is the major radius and v is the speed of the particles. Stellaratorsas we have seen have neoclassical transport due to fiction between the bulkions and impurities, this is high due to the 1/ν∗ regime, therefore transportof particles dominates almost the entire plasma volume. The magnitude ofthis transport can be reduced significantly by making the field approximatelyquasi-isodynamic, so that the thermodiffusion and the radial electric field issmall.
1.2.4 Ignition: Reaching self sufficiency
A system in which the energy produced in D-T reactions compensates andprovides an excess of the energy required for bringing the particles together iscrucial to reach ignition. The neutrons released from the reaction are used togenerate heat and further breed tritium (currently only gathered from CANDUfission reactors), their supply otherwise remains a scarce on earth. The ignitioncriterion [18] can be derived from a simple energy balance in a fusion reactor.
nτET =12kT 2
〈συ〉Eα(1 + 5/Q)(1.5)
Here n is the density of colliding particles, τE is the energy confinement timethat is the quality to the total energy insider the reactor volume (∝ T ) dividedby the total power losses from the reactor volume, T is the temperature of thecolliding particles in the reactor which are assumed to be maxwellian, 〈συ〉[m3 s−1] is the mean of the product of the reaction cross-section and the relativevelocity of the colliding particle and Q is the ratio of the power release by thefusion reactions the external heating power. Ignition is this reached when

18 1. Introduction
Figure 1.8: Fusion triple product against operation (pulse) duration for various
magnetic fusion devices [6]
Q = ∞, when nτET ∼= 3× 10²¹ m−3skeV at T ∼= 10 keV, However the fusionreactor can operate economically at finite Q > 1. This approach for the tripleproduct or the ignition criterion is obtained for different experimental reactorsin the figure 1.8 and plotted as a function of pulse operation time.
1.2.5 Future Reactors: Steady State Machines
These efforts are culminating towards the global effort on the InternationalThermonuclear Experimental Reactor (ITER) which is essentially a tokamakwith a configuration and design based on the specifications given in table 1.1.ITER is to be operated in H-mode “High Confinement” mode. This modewas observed during an experiment in 1982 by Prof. Fritz Wagner when asudden change was observed in the behavior of the plasma as the heatingwas steadily increased. Losses abruptly dropped and the turbulence at theedge plasma almost disappeared. The transition from a low confinement toan H-mode is the most relevant single advancement in the history of fusionreactors since then. The mechanism of the H-mode include the appearance ofa ‘edge transport barrier’ however also leading to an increase in the pedestalpressure and steeper particle transport gradients which in the end lead tothe production of quasi-periodic type instabilities called edge localized modes(ELMs). They maybe of several types depending on their origin, duration andenergies (similar to solar flaring there are abrupt moments of intense energybursts followed by periods of stability). Each ELM leads to sudden steepjolt in the temperature faced by plasma facing reactor materials which causesignificant damage. However ITER would be equipped with additional coils
1.2 Magnetic Confinement Fusion 19
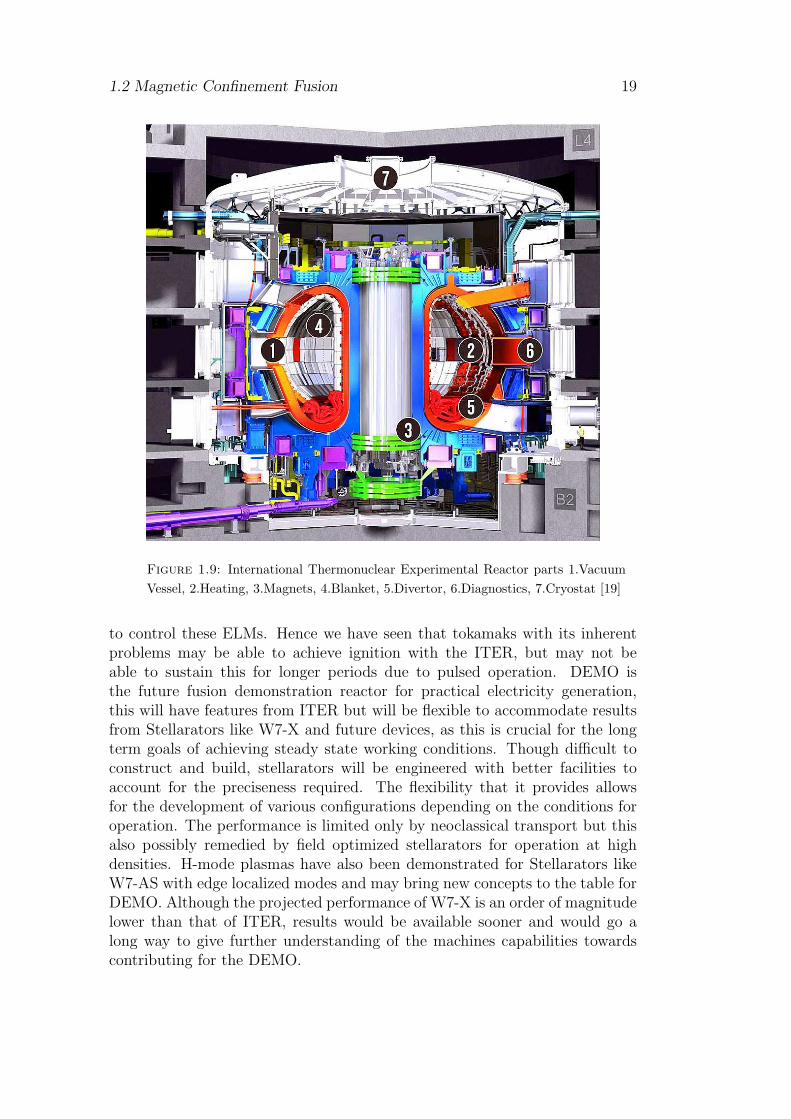
Figure 1.9: International Thermonuclear Experimental Reactor parts 1.Vacuum
Vessel, 2.Heating, 3.Magnets, 4.Blanket, 5.Divertor, 6.Diagnostics, 7.Cryostat [19]
to control these ELMs. Hence we have seen that tokamaks with its inherentproblems may be able to achieve ignition with the ITER, but may not beable to sustain this for longer periods due to pulsed operation. DEMO isthe future fusion demonstration reactor for practical electricity generation,this will have features from ITER but will be flexible to accommodate resultsfrom Stellarators like W7-X and future devices, as this is crucial for the longterm goals of achieving steady state working conditions. Though difficult toconstruct and build, stellarators will be engineered with better facilities toaccount for the preciseness required. The flexibility that it provides allowsfor the development of various configurations depending on the conditions foroperation. The performance is limited only by neoclassical transport but thisalso possibly remedied by field optimized stellarators for operation at highdensities. H-mode plasmas have also been demonstrated for Stellarators likeW7-AS with edge localized modes and may bring new concepts to the table forDEMO. Although the projected performance of W7-X is an order of magnitudelower than that of ITER, results would be available sooner and would go along way to give further understanding of the machines capabilities towardscontributing for the DEMO.

20 1. Introduction
Parameter Attributes
Fusion power 500 MW (700 MW)∗
Fusion power gain (Q) ≥ 10 (for 400 s inductively driven burn)
Plasma major radius (R) 6.2 m
Plasma minor radius (a) 2 m
Plasma current (Ip) 15 MA (17 MA)∗
Toroidal Field at 6.2 m radius 5.3 T
Installed auxiliary heating 73 MW
Plasma volume 830 m3
Table 1.1: Values for characteristic plasma parameters for ITER. ∗Increase possi-
ble with limitation on burn duration [20]
1.3 Main issues facing ITER like MCF ma-
chines
There are several issues being researched in the fusion community with everincreasing enthusiasm due to the repercussion involved in their effects on amachine in the scale of ITER. Here a brief description of the main challengesfacing such a machine will be discussed. These have been noted in brief froma discussion at a summer school at IPP, Garching given by R.Pitts to get ageneral perspective of the primary problems. ITER would demonstrate thefeasibility of fusion for energy development and generation purposes, thereforeto design and operate a machine at an operational scale that satisfies this goalan amplification factor (Q ≥ 10) is a challenging problem, here Q is the fusionperformance in a long pulse operation, given by the following equation.
Q =Fusion Power
Input Power(1.6)
The input power to this machine would be around 50 MW for which the out-put form this equation is expected to be 400 − 500 MW . The secondary aimis to achieve a steady-state like operation in ELMy- H mode as discussed inthe previous section. The main idea is as simple as confining a D-T plasmapreviously discussed in the section 1.2, in which alpha - particle heating issufficient enough to sustain the ‘burn’ and this form of heating dominates allother external sources of heating, neutrons released would be used for tritiumbreeding since the world stock of tritium is around 30 Kgs at the current es-timates. The costs of such a machine are at an estimated 15 billion eurosand would take upto the year 2020 for the development and infrastructurephase to be completed. This would also include later, 20 years of operationpost construction after initiation. Being a project that combines expertise andcomponents from many different nationalities it becomes an organizational,

1.3 Main issues facing ITER like MCF machines 21
international and management issue at the uppermost scales. Quality assur-ance becomes an issue since materials from different nations are many timesused in tandem, for the same purposes. Being a multi-national experiment italso is a testing platform for many contending fusion technologies, componentsand their relevance to the long term fusion project as a first step towards alarger, more capable DEMO reactor. DEMO would be constructed after ITERto demonstrate, create and sustain a fusion reaction for sufficiently long timescales fulfilling extraction of usable energy and electricity generation as theprimary purpose. The main challenges being faced by an experimental projectsuch as ITER can be summarized here:
1. The problem of plasma facing components (PFCs) erosion and damagefrom neutrals, ions and fast moving particles. ITER operation mightexceed technological limits of actively cooled PFCs, most damage is ex-pected from intense bombing of hot neutrons.
2. The issues facing tritium breeding, and the tritium fuel cycle is a majorchallenge for all D-T fusion devices. ITER will test to resolve these issues- 6 different modules from different perspectives have been proposed asprobable solutions, all would be tested.
3. To repair and replace complex components is nuclear environment un-der damage from edge localized modes is significant challenge. Remotehandling using state-of-the art systems for blanket and divertors are nec-essary.
4. Plasma control and plasma shaping due to various instabilities such asELMs in the plasma, real time systems for controlling and shaping theplasma is essential since instabilities can drive huge disruptions.
Few other problems worth mentioning are the engineering problems involvedfor production, procurement and installations of 80,000 Kms of superconduct-ing cables (Nb3SN) that is required to wire up 18 TFC magnets. In comparisonthe Large Hadron Collider, ‘LHC’ at CERN has only 7600 Kms of supercon-ductors. Due to the mode of pulsed operation, it is feared that fatigue maydegrade the magnet structure over time. Hence they need to be pressurized tobe used with pressures upto 6,000 tonnes using rings of glass fibres. The diver-tor of the ITER where a significant proportion of the fusion energy and alsothe helium ash is exhausted would face large particle fluxes and thus operateat engineering limits. Hence, it needs to be well designed and equipped withthe most resilient plasma facing materials. Tungsten is the chosen material forthis purpose in ITER. It has a high melting point, high thermal conductivityand low sputtering yield. Ultra high vacuum is also required to be maintainedto avoid impurities from disrupting the plasma. This is also a challenge sincefor a vessel of 830 m3 plasma volume containing many different componentswelded together, any contaminants trapped in these components would con-stantly leak into the chamber and alter the vacuum. Of these issues the focus

22 1. Introduction
in this thesis is on erosion and damage of PFCs during plasma operation, es-pecially connected with the divertor region. Hence the next sections discussessome of the main complications in detail along with their potential candidatesfor resolving them.
1.4 Plasma Facing Components: Requirements
& Challenges
Plasma facing components are the first line of defense from the hot plasma andalso the neutrals that emerge from them. They include the first wall, whichundergoes maximum interaction to the plasma second only to the divertor.The divertor is the region of the tokamak where all the heat from the plasmais extinguished and particles after losing their collision energy, are quenched.Heat removal and particle exhaust is predominantly the role of the divertor.Tritium breeding blanket modules are also plasma facing components howeverthere are designs to integrate them with the first wall. Since these interactionare really strong, it becomes vital to determine the materials that would beresistant and survive the longest under such conditions. As a consequenceit also becomes necessary to study the interactions that lead to resolutionof these problems and to study how certain materials have improved perfor-mances when compared with materials not well suited for fusion. The mainassessment criteria for qualifying components are the lifetimes of the materi-als, (the longer it lasts under energetic plasma exposure the more resilient thecomponents remain) formation of sputtered and eroded debris. Radioactivitythat affects the PFCs eventually also becomes a concern after long runtimes,especially in large experimental devices. Under reactor operation the immedi-ate consequences are on energy and particle exhaust on PFCs. Power leavingthe reactor must be converted into a usable form of heat from the PFC mate-rials. Power carried by neutrons will be converted to heat in the blanket walland would also breed tritium. Hot neutrons from the plasma also cause mod-ification of micro-structure and degradation of mechanical stability. Finallyafter the alpha particles that have been quenched of their energy having beenused beforehand to heat the plasma, they must be removed, this (helium ash)can choke the plasma burn if not removed. Transport of this helium ash canalso be studied using various diagnostics and is an important line of researchfor future devices.
1.4.1 Plasma Limiters & Divertors: Function & types
In this above presented scenario it is quite obvious that direct contact of theplasma with the wall would be detrimental to operation. Hence the edge ofthe plasma must be controlled. The last closed flux surface (LCFS) forms themagnetic surface immediately beyond the first wall. It is important to maintainthis boundary. The particles that in one way or another end up escaping the

1.4 Plasma Facing Components: Requirements & Challenges 23
plasma would collide with the first wall causing sputtering, damage to first wallcomponents and causing impurities into falling back into the main plasma. Thewall could also retain hydrogen isotopes which may or may not come back intothe plasma (depending on recycling) leading to an indeterminate situation onconcentration of fuel in the main plasma. It is important that this should beavoided as any impurities decreases the temperature by radiation from high Z(atomic number) elements known as ‘line radiation’. A divertor is an essentialregion, detrimental to the proper operation of a magnetic confinement devicethrough which escaping ions and ‘ash’ are removed using auxiliary magneticcoils. The boundary between the confined plasma and the divertor is calledseparatrix. The challenge with the plasma wall interaction is the particlesthat escape the plasma can cover a wide range of energies and fluxes, thusthere can be no identical engineering and plasma physics boundary conditionsfor analysis with computer codes. This leads to an uncertain situation withrespect to impurity production, formation of hydrogen wall inventories andthe related recycling processes. Particles bombarding the divertor or wallwould undergo many basic processes, electron hitting the wall would producesecondary electrons which are remitted back. Ions hitting the wall would beconverted to neutrals and a part of the incident ions would be re-implanted inthe wall, released at some other time during operation affecting the inventory.Charge exchange processes also take place, after these neutral are releasedback into the plasma, they then escape the plasma and cause re-sputtering ofPFCs. The different processes that dominate plasma wall interactions and theirrespective effects relevant to the PFC damage are described here in table 1.2with as much details as possible. The equation for particle reflection coefficientRn and energy reflection coefficient RE relevant to the table 1.2 are givenbelow and they can be determined by computer simulations where the particletrajectory and the energy transfer in the scattering process can be calculatedusing binary collision models.
Rn =number of reflected particles
number of incident particles
RE =energy of reflected particles
energy of incident particles
(1.7)
The diffusion of neutral hydrogen affecting the inventory is described below bya transport equation for the concentration of c(x) of free atoms in a depth ofx.
δc
δt= D ∗ δ
2c
δx2+Q− δcT
δt(1.8)
Here Q is the source of implanted hydrogen atoms and cT is the concentrationof trapped atoms. The maximum concentration of atoms is found at a depthapproximately equal to the mean ion range Rp. From here the atoms diffuseback to the surface as well as deeper into the bulk material. D is the diffusionconstant. [21] The sputtering yield Y is given by the equation given below andcan be used to determine the number of atoms ejected for a given incident ion

24 1. Introduction
of fixed energy. For different targets on bombardment with D yield varyingvalues of Y .
Y =average number of sputtered particles
incident ions(1.9)
PWI type Sources Effects Precedence
Reflection Low energy ions &neutrals back scat-tering
Collisions with nuclei,surface potential mod-ification
Particle reflec-tion coefficient‘RE’
Implantation,diffusion &re-emission
Energetic electrons,ions neutrals
Recombination withatoms, diffusionthrough material
Transport equa-tion includes dif-fusion, trapping& Implantation
Sputtering Ion and neutral atomcollision cascade
Removal of PFCatoms by energeticcollisions
Sputtering yield‘Y’
Chemicalerosion
Hydrogen plasmas,high energy particlebombardment
Volatile compoundswith target material
500− 60C
Sublimation& evapora-tion
Evaporation of fluidmaterials
Surface diffusion &further sublimate pro-duction, carbon pro-duction
800− 2000C
Desorption Water, cleaningagents & manu-facturing processresidues
Additional source ofplasma impurities
Possible to re-move using glowdischarge
Arcing &melting
Molten droplets ofmetals, field emission
Sudden cooling ofdroplets in plasmacausing breakdown ofdischarge
Only when met-als are used aswall materials
Table 1.2: Processes dominating plasma-wall interactions & their effects on the
PFC
1.4.2 The Scrape Off Layer
In continuation with the edge plasma and its effects, the region of the plasmabeyond the separatrix is called the scrape off layer. This region is of greatinterest since all the main interactions of plasma with the wall lie in this region.

1.4 Plasma Facing Components: Requirements & Challenges 25
Figure 1.10: (a). Unwrapped view of the limiter (scrape off layer) in a magneti-
cally confined plasma, (b). Schematic of the divertor of tokamak [21]
The LCFS can be confined with either a limiter configuration or a divertorconfiguration as described in figure 1.10. Outside the LCFS the field linescollide with a limiter or the wall components. The particles thus producedand the power transferred to these regions can be estimated using a simplemodel. With the plasma density and temperature as a function of minorradius described approximately by an exponential decay. A purely diffusivemodel along with transport in perpendicular direction can be used to calculatedecay length (λn) as a function of perpendicular diffusion coefficients (D⊥)and ion sound velocity (cs). The rate N⊥ of particles per unit poloidal lengthW diffusing across the separatrix into the SOL should be equal to the rate2N‖ particle per unit poloidal length streaming along the magnetic field linestowards the limiter plates.
N⊥ =D⊥n(a)
λn LcW= ΓLcW and
N‖ = n(a)CsλnW = ΓλnW
(1.10)
Here 2Lc is the connection length as given in image 1.10(a). and the ion soundvelocity (Cs) can be defined as,
Cs =
(Te + Timi
)1/2
(1.11)
Here Te and Ti are electron and ion temperatures respectively and mi is massof the ions. Solving these two sets of equations, it is possible to determine anexponential decrease of n with a decay length of λn = (D‖ Lc/Cs)
1/2. Insertingtypical parameters, a decay length in the range 1 − 5 cm is obtained. In caseof a machine like ITER the α - power heating would be in the range of ' 200MW considering a radius of ' 6 m the heat flux obtained is ' 100 MW/m2,this value is far greater than the engineering limits of any material known orfabricated so far for fusion purposes [21]. In divertors infrared themrography

26 1. Introduction
can be utilized to determine the power flux density loading with high timeresolution. In divertors the exponential function specified by SOL fall offlength at the outer midplane λq represents the processes in the SOL [22]. Inthis case the positive aspect of impurities arising from the above sources mustalso be considered: under certain conditions and high densities, impurities areconfined to divertor region of tokamaks. The line radiation from these lightimpurities can be used to spread the power flux over larger areas of the vesselthus changing the power load onto the divertors. In this way by covering thedivertor with an impurity on purpose (called a radiative divertor) is helpful tothe system. The requirement thus is heavily reliant on the fact that energy canbe eliminated from the system in other ways like radiation from impurities (orpre-divertors) and charge exchange processes. This kind of radiative coolingis achieved by impurity seeding of different impurities such as (argon, neon,etc.) However N2 has been considered as the most likely candidate [23]. But anumber of problems associated with N2 such as ammonia formation have alsoto be addressed.
1.5 Liquid Metals & Lithium for Fusion
In the light of the fact that solid PFCs have low erosion lifetime and heat-fluxhandling as described in the last section, it is a well-known fact that liquidmetals can out-perform the solid PFC approach[24]. The suitability of tung-sten(W) is far from certain in magnetic confinement devices. The problems ofwall erosion and re-deposition of wall and divertor materials is an issue thatmay not be solved with such solid PFCs. The problem however remains thatirrespective of the choice of the solid PFCs, sputter erosion, transport effects,permanent damage and T retention in the bulk, are going to weaken them,liquid metal PFCs have high potential to resolve each of these issues. Localmelting of components due to excessive heat loads have been reported in manymachines such as Alcator C-MOD [25] and Textor [26]. The melting of W tilein the divertor region indicate that these damaging events can affect the re-liable operation when the plasma is in contact with the tiles. Transients anddisruptions cause irreparable damage to PFCs in such devices. Hence ELMsand their type, frequency become major concerns for proper operations. Asalready discussed in the earlier section sputtering causes severe damage andmust be controlled at all costs. Since most of the power loading occurs in thedivertor region, research is focused on divertor technology with recent papersclarifying that upto ≈ 1000 of kgs of materials could be eroded and circulatedin a power reactor [27]. Many derivatives of divertors such as the snow flakedivertor and the Super- X point configurations try to address these problems[28]. However the uncertainties during operation, ion bombardment [29] arelikely to underestimate the true erosion, re-shaping and re-distribution of PFCmaterial. With such many uncertainties (even with tungsten), applicable to allPFCs it is essential that research along the lines of liquid metal divertor as an

1.5 Liquid Metals & Lithium for Fusion 27
alternative are necessary. The advantages presented by a liquid metal PFC aremany compared to a solid PFCs (such as tungsten). The most important is theregeneration and renewal of the PFC surface that can be made continuous, as apart of the implementation of a liquid metal system. In tokamak experimentsthey have been shown to be viable options [30] thus making them promisingcandidates for reactors. Liquid metal divertors are resistant towards dust for-mation (due to W erosion in solid PFCs), Helium (He) accumulation, blisterformation and bursting of He bubbles. In solid PFCs these produce structuralchanges such as fuzzy W for He irradiated surface. However power levels ofhigh magnitude have been shown to be sustained by Liquid Metal (LM)-PFCs[31]. Neutron damage to PFCs open up other Pandora’s box of issues for heatload handling and large amounts of efforts are being spent on tackling such is-sues for solid PFCs for an economically viable reactor. In LM-PFC the surfacecan be renewed after each exposure to plasma in continuous systems, hencesurface damage on long term scales in negligible. Recrystallization and rede-position in this situation does not take place. Only the substrate retains thehigh neutron dosage but still remains indirectly in contact with the plasma.Development of a flowing liquid metal system requires only a D-D plasma, andtesting operation in laboratory experiments can continue for further proof ofprinciple. Possibilities of extraction of tritium from flowing systems remainsan advantage with recycling of liquid metals as possibility in a low resourceconstrained enviro ent. Therefore recollection of evaporated and embeddedmaterials removed from the reactor by sputtering is a possibility, this kindof impurity filtration can be carried out in tandem with hydrogen inventoryrecollection. All these make LM-PFCs and Divertors an exciting possibilityto resolve current issues plaguing solid PFCs and one step solution that solidsface. The table 1.3 gives a list of the most relevant liquid metals for fusionapplications and their relevant properties. In order to tackle one of the pri-mary challenges in fusion, lithium (Li) has been found to be very effective. Liis the lightest alkali metal with a mass number of ∼ 7 and a density of ∼ 0.53g/cm3 and exists as a solid at room temperature. It has a low melting point of180.54C. And a workable upper temperature of ∼ 650C (as observed in theFTU). It is chemically compatible with reduced activation ferritic-martensitic(RAFM) steel over the whole temperature range. Being a highly reactive al-kali metal it also reacts readily with hydrogen including its isotopes deuteriumand tritium, carbon and oxygen, hence being able to provide strong pumping,low recycling and forming stable compound with them. All these propertiesmake it an attractive competitor as a plasma facing component. In previousexperiments application of small amounts of lithium have led to drastic im-provements in the device operation, reductions in recycling, operations at Hmode, and increase in fusion power output. The improvements in confine-ment have been confirmed in devices like EAST (China), NTSX (USA), TJ-II(Spain), RFX (Italy). Applications of around ∼ 20 mg of Li coating on thePFCs resulted in increment of fusion power output by a factor of two due toreduced recycling. With reduction in recycling the edge plasma density de-

28 1. Introduction
Properties Symbol(units) Lithium Tin Gallium
Atomic number Z 3 50 31
Atomic weight A (amu) 6.94 118.7 69.72
Mass density ρ (103 Kg/m3) 0.57 6.99 6.095
Melting point Tm ( C) 180.5 231.9 29.8
Boiling point Tb ( C) 1347 2270 2403
Surface tension σ (mN/m) at Tm 0.4 0.55 0.69
Dynamic viscosity η (Pa.s) at Tm 0.25 1.85 0.95
Latent Heat of vaporization ∆Hvap (kJ/mol) 147 296 256.1
Thermal conductivity κ at Tm (W/m.K) 45 30 50.9
Molar Heat Capacity Cmol (J/mol.K) 24.86 27.11 25.86
Table 1.3: Values for characteristic qualitative parameters for different liquid met-
als [32]
creases, the electron temperature rises. This leads to a significant lowering ofedge plasma collisionality.
There are no adverse effects that have been noticed from the introductionof lithium in a machine. Due to its low ‘Z’ it is ionized at ∼ 6 eV with a fullionization at Z = 3 at 120 eV . Hence it does not radiate in the hot plasma core.The total amount of core contamination also remains below 1% . Due to its lowmelting point it would be present in a liquid state in a reactor environment.With increase in temperature the partial pressure of lithium also increase asshown in the figure 1.11. [34] As Li evaporates it becomes quickly ionizedwhich cools the divertor due to radiation losses. This cooling is observed inseveral experiments such as described in [35] however the Li does not causeradiative loss effects in the core plasma hence is retained at the edges anddivertors. The radiative losses can be as high as 1.2 keV per injected lithiumion, which pertains to about 100 KJ per mole of lithium atoms [34]. Thus forthe divertor temperature range 30− 300 eV the power level of non-equilibriumlithium can exceed the coronal limit. This makes lithium ideal for operation asa PFC. The devices which have detected significant benefits of lithium coatingto their respective PFCs include CDX-U / LTX (USA) [36], CPD (Japan)[36],HT-7 (China)[37], EAST (China) [38] (both superconducting), FTU (Italy)[39], NSTX (USA) [30], T-10 and T-11M (Russia)[36], and TJ-II (Spain) [40].Out of this TJ-II is stellarator type with disruption free operation. The rest aretokamak devices with CDX-U / LTX , CPD and NSTX spherical configurationof low aspect ratio. NSTX and EAST also are divertor type tokamaks whichare suited for H mode plasma in the presence of Li. It is proposed that edgeelectron confinement improvement with reduced density and edge recyclingis likely to be aiding H-mode transition by increasing electron temperaturenear the edge. All the results indicate Li PFC coating enhanced the plasma

1.5 Liquid Metals & Lithium for Fusion 29
Figure 1.11: Partial pressure of lithium as a function of temperature [33]
performance by increasing confinement time and establishing a better plasmaedge temperature via reduced recycling. Also high secondary electron emissioncould be contributing to enhanced plasma performance observed in TJ-II [41].A summary of the activities on Li experiments and all related research can befound in [42]. In the TJ-II the lithium/boron coating produces a remarkablereduction in the recycling of hydrogen by about 10% and helium to about 80%as calculated from pump out density which leads to clear transition to H-mode,doubling the plasma energy confinement [40].
1.5.1 Lithium Capillary Porous Limiter & Limitations
The divertor PFCs are going to be facing the highest heat fluxes as discussedin the previous section, however by covering the surface with lithium, animportant radiative edge / divertor cooling was observed and demonstrated.The capillary porous system (CPS) has a high potential of handling heat fluxthrough a capillary action and high surface tension. This has a tendency tokeep the CPS porous metal surface replenished through capillary tubes froma Liquid Lithium [LL] reservoir (upto 50 MW/m2) for several seconds [44] .Provided the CPS system is saturated with LL, the CPS surface is able totolerate and survive through the high heat fluxes. CPS as a protective systemhas been shown to work in the FTU experiment as well. It was noticed thata ‘virtual’ toroidal limiter was formed which redistributed the heat flux to the

30 1. Introduction
Figure 1.12: Two possible designs for liquid metal-protected targets in a reactor
divertor (a). Evaporable liquid metal advanced coating (ELMAC) (b). Integrated
liquid metal adavaned target (ILMAT) [43]
tokamak vessel first wall by radiative processes hence decreased the load ontothe limiter [39]. The mechanism behind this is explained with the generationof convective flows to manage the effects of localized heat load fluxes. Thefollowing issues with using Li are to be addressed in further research work asper the recent 2nd lithium applications for fusion symposium in 2012 (ISLA3)[45].
1. Handling high divertor heat flux - The radiation is very high ∼ 100MJ/mole of Li, in a low confinement chamber it should be possible toprovide this easily however, it is not currency possible to keep the CPSsurface free of lithium compounds (this would constrict the flow of pureLL)
2. Removal of impurities from LL - During a steady state operation it is nec-essary to purify LL by removing D,T and other compounds continuously.The rate at which this should be done is 1 liter/sec .
3. Removal of high steady state heat flux - A method using a closed LLchamber which allows for vaporization and ionization would allow theuniform spreading of heat to the surrounding divertor wall, hence result-ing in removal of heat an order of magnitude lower.
4. Flowing LL in magnetic fields - LL being a liquid metal would be easilyaffected by electromagnetic forces it encounters. It is envisioned thata closed system carrying LL in a loop for circulations and purificationwould be able to run at lower power to resolve this problem.
5. Corrosion by Li - An issue to be addressed is the corrosive nature oflithium being a reactive alkali metal, LITER stainless steel containerswould be operated for multiple years at high temperatures of 600CLithium could react with copper, aluminum and ceramics. Segregationis key to resolve this issue

1.5 Liquid Metals & Lithium for Fusion 31
6. Safety of flowing LL - A large quantity of flowing LL can be addressed bythe methods being researched by IFMIF since they handle upto ∼ 1 tonof flowing LL [46], the proposed barrier consists of gases such as Argon.Using inert gases like He could also be helpful for divertor heat exchange,as the safety of lithium system is also enhanced.
7. Compatibility with hot first wall - The reactor first wall will be at hightemperatures of ∼ 500 − 700C in order to keep it clean. The LL di-vertor temperature would be around ∼ 200 − 450C to avoid Lithiumevaporation. However this has been found to be an advantage becauseparticles and gases tend to migrate to lower temperature regions in thevacuum plasma system within a reactor. Also the H isotope retentionof Li at these temperature is lower hence could be advantage [41]. Thehot first wall would still retain varying amounts of impurities dependingon the coating of LL that has been provided. In case of W, at differ-ent temperature since droplets can also condense on the surface, whileimplantation takes place due to higher plasma energies. Retention offuel could be an issue that has to be addressed. This forms the primarymotivation of the research work described in this thesis.

32 1. Introduction

Chapter 2
Experimental setup
2.1 Glow Discharge Setup
Figure 2.1: Overview of the setup built and designed to perform W-Li-D retention
experiments with in-situ diagnostic capabilities.
Seen above is the setup for performing experiments on glow discharge plas-mas for studying W-Li-D interactions. The experiments were carried out in avacuum chamber entirely designed, constructed and built at CIEMAT, Madridas the flexibility that comes associated with laboratory experiment is consider-able in comparison to subjecting W to similar interactions in the TJ-II. Hence,the requirement for the experiment. The setup as seen in figure 2.1 basicallyconsists of a main chamber with a coaxial heating element (rolled thermocoax)
33

34 2. Experimental setup
that can reach upto 300C and higher, depending on the conditions that needto be simulated inside the vacuum chamber, along the stainless steel wall atype ‘K’ thermocouple is also fitted which provides feedback to the heatingpower source for controlling and regulating the wall temperature. The mainchamber is fitted with a I.C manometer to measure pressures to the range of10−6 − 10−9 Torr. Directly underneath the chamber a turbo-molecular pumpin placed in series with a rotary pump which generates the central vacuumfor experimentation. Inside the chamber there are stainless steel meshes po-sitioned far away from the primary plasma region. On the topmost point ofthe chamber an electron gun necessary to provide a source of electrons andinitialize the plasma, is placed. This is operated with a separate power supply.The chamber is also attached to three digital flow controllers from a single portwhich can be adjusted with an analog pressure controller for allowing Helium(He), Deuterium (D) and Argon (Ar) flow separately or together as per neces-sity of the experiment (in our case they are all used separately). The stainlesssteel (SS) wall on the insides has 3 perforations at central level necessary forthe following purposes
1. A port on the left allowing the gases to reach the Residual Gas Analyzerchamber (SRS RGA 100).
2. One large port right in front to let the light from the plasma emis-sions through the optical window for the making optical emissions spec-troscopy measurements.
3. A port on the right for the incoming electrode that provides the currentfor the plasma.
The main chamber further includes a valve that leads to the RGA chamber,this consists of an RGA attached at the top as can be seen in the figure 2.2.The RGA is also fitted with a turbo pump in line with a rotary pump forreaching pressures upto 10−9 Torr directly in the analysis chamber. This formsthe differential pumping system. The RGA is fitted with a sensitive ioniza-tion manometer which is able to measures pressures in this range easily. Be-side the turbo-molecular pump in the image, is the rotational speed regulatorwhich controls the pumping speed of the RGA (important in making particlebalance calculations). The optical emissions spectroscopy (OES) instrumenta-tion is placed right in front of the optical window with good efficiency in the400−800 nm range and a spectral width of ∼ 0.5 nm. A focusing lens with wideaperture and ∼ 30 cm focal length is placed in front of it to capture maximumlight from the optical window and focus it on the small diffraction slit of theOES device. A photomultiplier is used to enhance the signal from the OESwhich is then measured from an RS-232 port coupled multimeter connectedto computer. The millivolts recorded correspond to the intensities of differentfrequencies of emitted light from the optical view port. These are calibratedwith respect to the speed of measurement of the OES equipment (running at

2.1 Glow Discharge Setup 35
Figure 2.2: Data acquisition systems and diagnostics present in the experimental
system
Figure 2.3: Oven feed-through for the Li-oven and optical window for optical
emission spectroscopy

36 2. Experimental setup
0.5nm/sec). One of the vacuum feedthroughs for the Li oven as seen in figure2.3 is fitted with two leads which follow into the Li-Oven necessary for evapo-rating the Li and also two other leads which are connected to the thermocouplerequired by the power source for regulation of Li-oven temperature. The frontside as visible is fitted with an optical window with a manual shutter whichcan be manipulated during Li-evaporation / deposition / implantation to pre-vent Li from sticking and covering the cool glass window placed exterior to themain W-wall. Externally it connects to the main power supply for the ovenplaced inside the chamber, specifically isolated from the wall heating, hencethe effects of wall heating are not transformed or carried over to the heatingof this oven. A ‘K’ type thermocouple placed directly inside the oven, is usedto control and regulate the temperature of the internal area of the over. The
Figure 2.4: Front and side view of electron gun
figure 2.2 shows all the data capturing and acquisition devices used for thesetup. The wall is heated by a variac transformer not seen in this image as itis placed below the entire setup. However two leads from the transformer jointhe feedthrough which connects the wall and coaxial heating elements. Twomore leads are used for the thermocouple which is connected to a multimeterand monitored through another coupled RS-232 connection to acquire datausing a PC. The different gases used for Li deposition, implantation, sputter-ing and calculating the retention are also seen here. Next to the digital flowcontroller input also is placed the electron gun power source which can be usedto trigger the plasma by releasing energetic electrons. Both these instrumentsare placed on top of an ‘antique’ DC three phase type power supply with aninbuilt voltage and current readout. The power supply leads to a feed-throughto the anode placed inside with a circular copper head isolate from the wall andthe oven with the help of Boron-Nitride (BN) insulation cylinder. The Li ovenheating power source is a much more advanced power supply for oven heating

2.2 Tungsten Wall & Lithium Evaporation Setup 37
with feedback control using the readout directly from the thermocouple. Thetemperature can be increased manually or automatically hence with greaterprecision over temperature. The electron gun was constructed using a smallW element wound and placed through a copper shielding as seen in figure 2.4.The gun also carries a ground connection in case of a short circuit (problemswith short circuit occurred during the course of experimentation). This is im-portant since many times during experimentation a drift of the plasma towardsthe electron gun occurs causing a huge short circuit, leading to the trippingand safety shut down of all systems (the TJ-II data acquisition systems wereshut down due to a large drift of this nature and all data was lost). Anothertwo leads of the electron gun are connected to the high voltage mesh whichprovides the electrons, arcing from the W-filament under the application ofhigh voltages from the electron gun voltage source.
2.2 Tungsten Wall & Lithium Evaporation Setup
Figure 2.5: Top view of the W-wall and Li-oven inside the vacuum chamber
Plasma facing wall primarily used in this experiment has the dimensions of13.5 cm×51.3 cm×0.1 cm, It is comprised of 99.9% pure tungsten acquired fromSpecial Metals and Products, technologies located in Barcelona, Spain. It isinstalled in two parts to occupy the inner coaxial heating element of the vacuumchamber, the total height of which is 25 cm. Directly beneath the chamber theturbo-molecular pump is visible. The pump is covered by a stainless steel(SS) gauze to prevent impurities from falling onto the blades directly. In thefigure 2.5, three of the ports are visible. The W sheets are designed and cut outexactly to occupy the slit position without blocking them from the diagnostics.Both sheet ‘1’ and sheet ‘2’ are cut in this fashion and placed on top of each

38 2. Experimental setup
other skewed by a trivial angle to the chamber, overlapping by around 3 cmhowever this does not seem to affect the Li deposition or plasma performance.Within the chamber also visible is the oven with its resistance coming at a rightangle through the edge of the optical port (preventing any hindrance of thelight from the optical port), the connections for oven are so adjusted that theylead from behind the W-wall (and external to the plasma region) preventingcontamination and sparking in the main glow discharge. To the left, in the topview of the chamber the port leading to the RGA analysis chamber is located.Tungsten samples to be analyzed using LIBS are placed in between the walls atdifferent points but mainly opposite to the oven located above the line of sightof the oven and near to the oven, at the same height. The oven is placed slightlycloser to the left port of the chamber to avoid sparking and arcing betweenthe electrodes (placed on the right) in the presence of plasma and gases. Aview from the electron gun port is also placed in the lower left of the image infigure 2.5. This shows another SS gauze that has been placed to keep the Wwall pressed against the coaxial heating element to ensure good contact andstability during expansions and contractions on heating. The Li evaporation
Figure 2.6: Details of oven construction and design
oven was constructed and designed at CIEMAT to serve the purpose of thisexperiment, the details of the oven are clear in figure 2.6. The resistance iswound around SS cylindrical chamber with a small hole of 10 mm in aperture.The winding is then wound tight around the oven using a containment vesselwhich can be tightened with the help of simple 10 cm bolts. The thermocouple
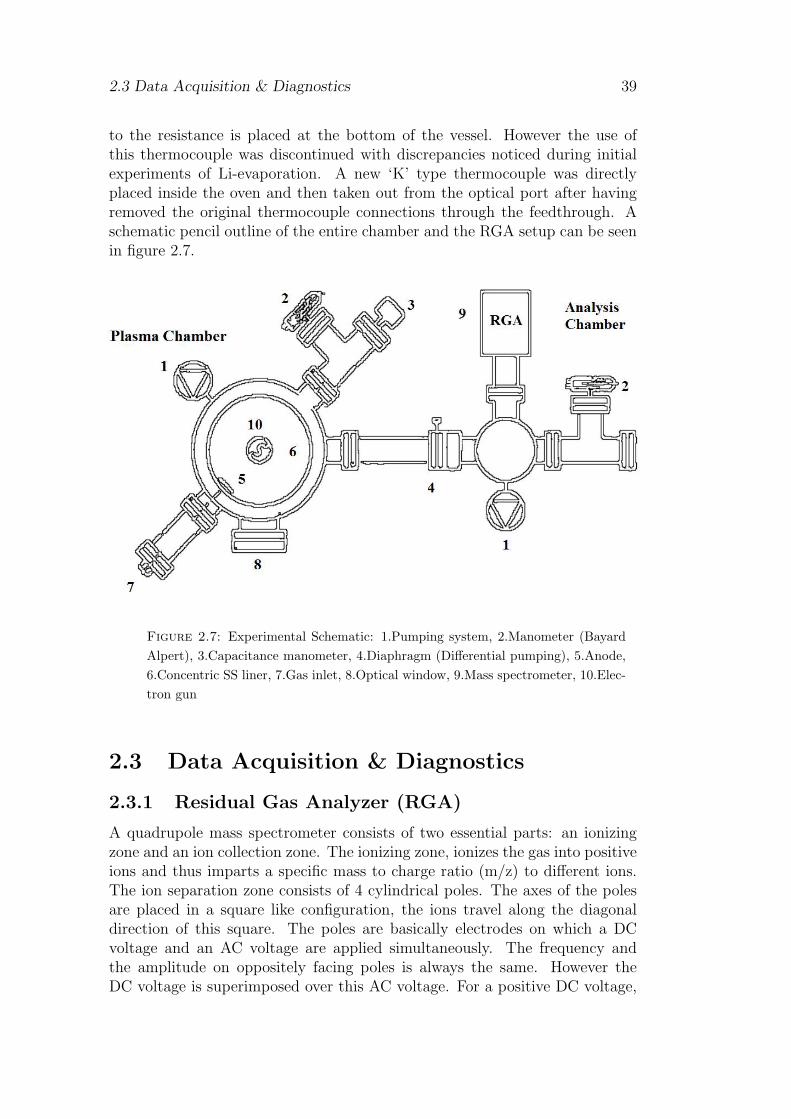
2.3 Data Acquisition & Diagnostics 39
to the resistance is placed at the bottom of the vessel. However the use ofthis thermocouple was discontinued with discrepancies noticed during initialexperiments of Li-evaporation. A new ‘K’ type thermocouple was directlyplaced inside the oven and then taken out from the optical port after havingremoved the original thermocouple connections through the feedthrough. Aschematic pencil outline of the entire chamber and the RGA setup can be seenin figure 2.7.
Figure 2.7: Experimental Schematic: 1.Pumping system, 2.Manometer (Bayard
Alpert), 3.Capacitance manometer, 4.Diaphragm (Differential pumping), 5.Anode,
6.Concentric SS liner, 7.Gas inlet, 8.Optical window, 9.Mass spectrometer, 10.Elec-
tron gun
2.3 Data Acquisition & Diagnostics
2.3.1 Residual Gas Analyzer (RGA)
A quadrupole mass spectrometer consists of two essential parts: an ionizingzone and an ion collection zone. The ionizing zone, ionizes the gas into positiveions and thus imparts a specific mass to charge ratio (m/z) to different ions.The ion separation zone consists of 4 cylindrical poles. The axes of the polesare placed in a square like configuration, the ions travel along the diagonaldirection of this square. The poles are basically electrodes on which a DCvoltage and an AC voltage are applied simultaneously. The frequency andthe amplitude on oppositely facing poles is always the same. However theDC voltage is superimposed over this AC voltage. For a positive DC voltage,

40 2. Experimental setup
Figure 2.8: RGA functioning and schematic [47]
low m/z ions are filtered and for negative DC voltages the high m/z ions arefiltered. By carefully selecting these voltages a window can be created in whichonly a particular species with a specific m/z ratio survives without crashingon the quadrupole filter. By hitting a collector electrode on the other end ofthe filter, a current is generated which is then measured and can be linked toa particle pressure through calibration. This value is converted to the numberof atoms being desorbed eventually by particle balance calculations on theplasma described in the next chapter. Calibration is performed on the massspectrometer of the device using gases stored in pressurized cylinders providedon site. The gases are He, D, Ar and were introduced electronically fromdigital flow controllers from cylinders using a precise micro valve. Each gaswas introduced into the vacuum chamber in staggered intervals of 15 seconds.Current values from the mass spectrometer were measured for each incrementin gas pressures and recorded into the data acquisition system. For this thecurrents of the mass spectrometer could eventually be linked to actual partialpressures of different species. From the ideal gas law, we have the followingdefinition for calculation number of particles per unit time.
PdV
dt= RT
dn
dt→ PS
RT=dn
dt(2.1)
Here, S = δ V/δ t is the pumping speed, V is volume, P is pressure, T is thetemperature (300 K), R is the gas constant. Using this equation and knowingP , S (varies for different gases), R and T , δ n/δ t can be determined. Thus ameasured mass spectrometer current can be eventually converted in a numberof particles desorbing per unit time. Given in figure 2.9 is the calibration curvedetermined for D2 gas. In the regime of pressure beyond 10 mTorr the pumpingspeed of the system changes due to the increasing flow and this explains theoffset. In our experiments the working regime is around 40 mTorr so it isessential that we use the slope of this part of the curve or above this region.The saturation of the RGA does not occur in the same range as depicted inthe graph and a probable increase in pressures upto ∼ 10−4 Torr in the RGA

2.3 Data Acquisition & Diagnostics 41
Figure 2.9: Calibration curve of Deuterium gas for RGA in setup
chamber would lead to a saturation. In experiments this saturation is avoidedusing the differential pumping system explained in sections 2.1.
2.3.2 Optical Emission Spectroscopy (OES)
Emission spectroscopy is one of the most fundamental diagnostic methods forplasmas. Since it can be used for many varying types of plasmas at low andhigh pressures without temperature limits, makes it a very flexible device.Moreover it does not affect the materials, being non-invasive for substancesbeing studied for its constitution and properties. Spectroscopic measurementsallow for determination of the plasma composition and temperature, howeverit is required that spectral resolution is about 0.01 nm or better. The tem-perature calculations involve line deconvolution, numeric simulation and noteasily computable in lack of this resolution. Molecular spectra obtained fromthe plasma can be degraded by the spectra from diatomic molecules. Determi-nation of plasma composition however from the molecular spectra is a difficultprocess since it is spread over in a extensive range of wavelengths and so nu-merous bands overlay each other. The measurements are performed for glowdischarge plasmas, in which collisions of plasma particle with electrons causethe particles of the plasma to be excited to higher electronic levels. Theseexcited atoms and ions in the discharge plasma create a unique emission spec-

42 2. Experimental setup
Figure 2.10: (a). Visible light spectroscopy schematic, (b). Photomultiplier tube
[48]
trum to each element when they return to the ground state on relaxation. Asingle element generates a number of distinctive emission spectral lines. Thelight generated in an emission of such a discharge can be said to contain acollections of spectral lines produced by the elements in the target and theplasma itself. The light then leaves the plasma through the optical windowin the chamber, gets focused and collected by the convex lens placed right infront of the window. This light is then made to hit a diffraction grating, theextraction of the emission spectrum for the target takes place. The intensity ofan emitted spectrum is the indicator of the concentration of the element in thesample. Photomultiplier tubes are used to measure this intensity extractedfor each element in a given range of scan of the wavelength and magnify itseveral fold to make a clear distinction from the background signal processedby the spectrometer. This is done by emitting electrons when photons strikethe cathode. These electrons are then accelerated towards a series of dynodesof increasing voltages. Additional electrons are generated at each dynode, theamplified signal is collected and measured at the anode. This data can thenbe used to perform qualitative and quantitative analysis of the plasma and theelements present within it.
N∗
N0
=g∗g0e−∆EkT and ∆E =
hc
λ(2.2)
Here, N∗ are the atoms in the excited state, N0 are the atoms in the groundstate g∗/g0 is the statistical factor, −∆E is the energy difference , k is theBoltzmann constant, h is the Planck’s constant, c is the speed of light and Tis the temperature.
Hence the wavelength of emissions from the estimated energy differencebetween excited states and ground states can provide the information on typeof excitation and element excited.
S = KN (2.3)
Here S is the Intensity of the line of a given wavelength, K is the proportion-ality constant and N is the number of atoms in the excited state. Calibration

2.3 Data Acquisition & Diagnostics 43
Figure 2.11: (a). Li line emissions from collisions in glow discharge setup (b).
OES for our system and overall schematic
curves for plasma emission spectrometry are most of the times a plot of theoutput current or voltage of a transducer as a function of analyte concentra-tion. When the range of concentrations is large, log-log plots are employedinstead. Using a well calibrated a lot of qualitative data can also be extractedfrom OES measurements.
2.3.3 Laser Induced Ablation Spectroscopy (LIBS)
In a reactor such at ITER, in order to monitor and judge the status of the firstwall divertors correctly it is necessary that an in-situ method be implemented.This would prevent the need to remove and break the vacuum for analysisof damages on the PFCs. Laser based method [49] have taken precedence inthis need as they are flexible with spectroscopic techniques as the possible di-agnostic. This method is really adaptive, based on the intensity of the laserand the duration different layers of a required PFC can be probed and an-alyzed. It could be utilized to develop an inventory of hydrogen isotopes orfor the determination of deposits in tokamak discharges. The image in figure2.12 (a)-(d). Shows the schematic of the process that could be used for suchpurposes using laser based techniques. Lasers used for this purpose shouldhave low divergence in order to provide the necessary power densities at the

44 2. Experimental setup
Figure 2.12: (a). Laser interaction with target and removal of surface material
by ablation, (b). Plasma formation from breakdown, (c). Expansion and element
specific emission (atomic and ionic) (d). Crater dependence on laser pulse duration
surfaces. It is mainly a spectro-chemical technique in which an intense laserpulse is shot at a target in vacuum to determine the elemental composition,via generation of high temperature micro plasma followed by time-resolvedoptical spectroscopy [50]. This method is extremely fast compared to othercompeting technologies by including multi-elemental analysis, light from allconstituent can be collected without bias. The analysis can be performedfrom far off distances, the spatial resolution is about ∼ 1µm and the depthresolution is micron to sub-micron.These methods work in the following way:the sample initially absorbs the energy from the laser by a pulsed radiationfield. The pulses can be of order of nanoseconds, but it can also be performedwith pico- and femto-second laser pulses. The absorbed energy is then rapidlyconverted into heating, resulting in vaporization of the sample (ablation) tillthe boiling point temperature of the material is reached. The removal of thisparticulate matter from the surface leads to the formation of vapor abovethe surface. The laser pulse is continued to be operated thereby illuminatingthe vapor plume. The vapor is then condensed onto sub-micrometer dropletsthat leads to absorption and scattering of the laser beam inducing the strongheating, ionization and plasma formation. The dynamical evolution of theplasma plume is then characterized by a fast expansion and subsequent cool-ing. Approximately 1µs after the pulse, ionic emissions may be identified inthe spectrum using spectroscopic methods. Figure 2.13 shows a schematicof the LIBS process. For the samples developed in this work LIBS analysis isperformed using neodymium-doped yttrium aluminium garnet (Nd:YAG) laseroperating at the fourth harmonic (266 nm, CFR, Quantel, 80 mJ) as the sourceof the laser ablation. The emitted optical signal is simultaneously recorded bytwo spectrometers. The first one is an echelle-type spectrometer (ME5000,Andor Technology, spectral range 230 − 975nm) coupled with an intelligentcharge coupled device camera(iCCD). The second is a vacuum UV (VUV)spectrometer (McPherson, 234/32VM , spectral range 115− 300nm) coupled
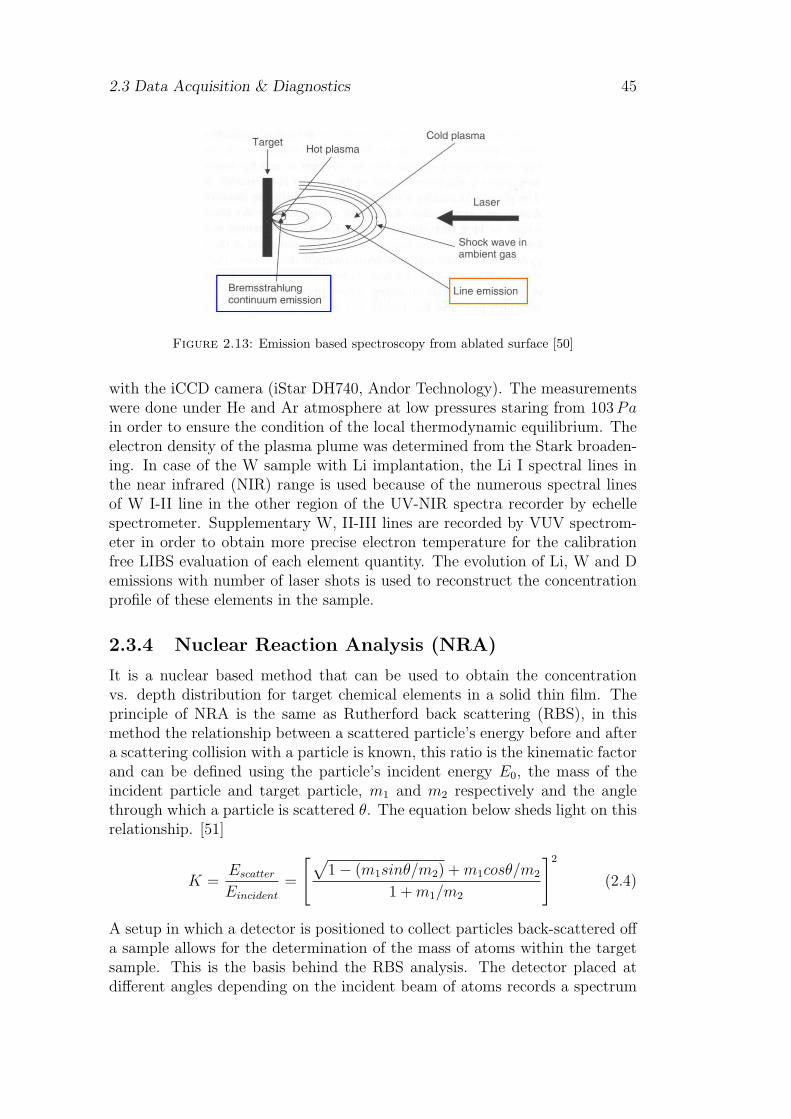
2.3 Data Acquisition & Diagnostics 45
Figure 2.13: Emission based spectroscopy from ablated surface [50]
with the iCCD camera (iStar DH740, Andor Technology). The measurementswere done under He and Ar atmosphere at low pressures staring from 103Pain order to ensure the condition of the local thermodynamic equilibrium. Theelectron density of the plasma plume was determined from the Stark broaden-ing. In case of the W sample with Li implantation, the Li I spectral lines inthe near infrared (NIR) range is used because of the numerous spectral linesof W I-II line in the other region of the UV-NIR spectra recorder by echellespectrometer. Supplementary W, II-III lines are recorded by VUV spectrom-eter in order to obtain more precise electron temperature for the calibrationfree LIBS evaluation of each element quantity. The evolution of Li, W and Demissions with number of laser shots is used to reconstruct the concentrationprofile of these elements in the sample.
2.3.4 Nuclear Reaction Analysis (NRA)
It is a nuclear based method that can be used to obtain the concentrationvs. depth distribution for target chemical elements in a solid thin film. Theprinciple of NRA is the same as Rutherford back scattering (RBS), in thismethod the relationship between a scattered particle’s energy before and aftera scattering collision with a particle is known, this ratio is the kinematic factorand can be defined using the particle’s incident energy E0, the mass of theincident particle and target particle, m1 and m2 respectively and the anglethrough which a particle is scattered θ. The equation below sheds light on thisrelationship. [51]
K =EscatterEincident
=
[√1− (m1sinθ/m2) +m1cosθ/m2
1 +m1/m2
]2(2.4)
A setup in which a detector is positioned to collect particles back-scattered offa sample allows for the determination of the mass of atoms within the targetsample. This is the basis behind the RBS analysis. The detector placed atdifferent angles depending on the incident beam of atoms records a spectrum
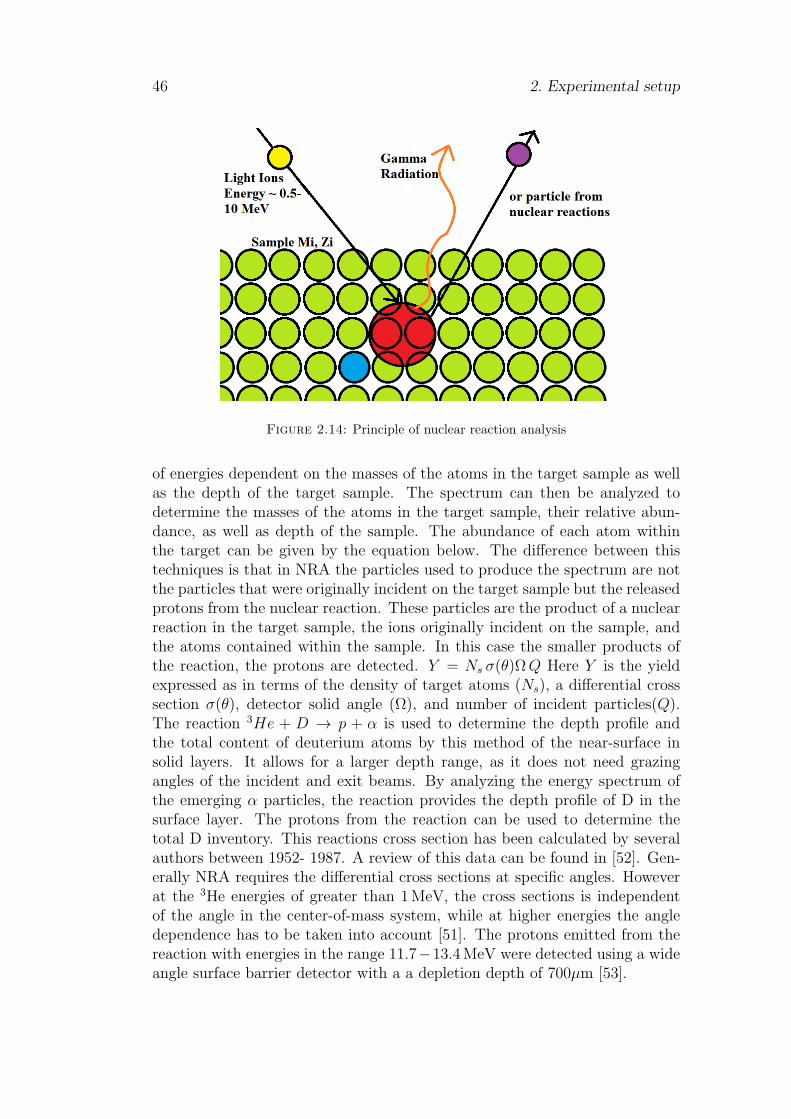
46 2. Experimental setup
Figure 2.14: Principle of nuclear reaction analysis
of energies dependent on the masses of the atoms in the target sample as wellas the depth of the target sample. The spectrum can then be analyzed todetermine the masses of the atoms in the target sample, their relative abun-dance, as well as depth of the sample. The abundance of each atom withinthe target can be given by the equation below. The difference between thistechniques is that in NRA the particles used to produce the spectrum are notthe particles that were originally incident on the target sample but the releasedprotons from the nuclear reaction. These particles are the product of a nuclearreaction in the target sample, the ions originally incident on the sample, andthe atoms contained within the sample. In this case the smaller products ofthe reaction, the protons are detected. Y = Ns σ(θ)ΩQ Here Y is the yieldexpressed as in terms of the density of target atoms (Ns), a differential crosssection σ(θ), detector solid angle (Ω), and number of incident particles(Q).The reaction 3He + D → p + α is used to determine the depth profile andthe total content of deuterium atoms by this method of the near-surface insolid layers. It allows for a larger depth range, as it does not need grazingangles of the incident and exit beams. By analyzing the energy spectrum ofthe emerging α particles, the reaction provides the depth profile of D in thesurface layer. The protons from the reaction can be used to determine thetotal D inventory. This reactions cross section has been calculated by severalauthors between 1952- 1987. A review of this data can be found in [52]. Gen-erally NRA requires the differential cross sections at specific angles. Howeverat the 3He energies of greater than 1 MeV, the cross sections is independentof the angle in the center-of-mass system, while at higher energies the angledependence has to be taken into account [51]. The protons emitted from thereaction with energies in the range 11.7−13.4 MeV were detected using a wideangle surface barrier detector with a a depletion depth of 700µm [53].

Chapter 3
Conduction & Results
3.1 Experimental Procedure
With the setup described in sections 2.1 - 2.2. It was possible to fabricate sam-ples of W under different lithiation environments. It was decided to performexperiments so as to make samples in a systematized order. The experimentswere piloted as three main investigatory ideas and two supplemented ideas toaid in the understanding of the overall process :
1. The W-wall was surface lithiated with evaporated Li in the presence ofHe gas flow. As only surface deposition was expected in the case of asimple flow, the sample was then subjected to a pure D2 plasma in orderto estimate for retention.
2. The lithiated W-wall (under He flow) was sputtered using an argonplasma thus leaving the W surface with lower levels of surface depositedLi. This surface was then subjected to pure D2 plasma again in or-der to estimate for retention. Following this the surface was completelycleaned using ultra sound in distilled water and then oven dried afteralcohol treatment.
3. The W-wall was lithiated with evaporated Li facilitated by a heliumplasma. Expected that the helium would provide energetic collisionsaccelerated by the plasma sheath on the W-wall and hence lead to aportion of the lithium being implanted into the W-wall. This surface wasthen subjected to pure D2 plasma again in order to assess for retention.
4. The lithiated W-wall (under He plasma) was then sputtered using anargon plasma, thus leaving the W surface with lower levels of surface Libut leaving the implanted Li in place as some implantation is expectedfrom an accelerated ion deposition on a surface. This surface was thensubjected to pure D2 plasma again in order to check for retention.
5. This was followed by an experiment on the W-wall after thoroughly clean-ing with ultrasound and distilled water, oven drying the surface, after
47

48 3. Conduction & Results
removal from the experimental vacuum chamber. This left the W-wallonly with implanted Li and hence provides an entirely new surface forexperimentation.
3.1.1 Pre-Experimental Setup
A new W sheet was placed in the cylindrical chamber in two separate pieces(the dimensions are as described in section 2.1). An oven was placed withthe resistance wound around the oven. The resistance is placed so that itdoes not interact with the plasma and the wires are taken around the W wallusing the optical port made in the sheet. The wires were covered with teflon.They were placed making sure there is sufficient opening for the spectroscopy.Li oven was filled with 2.5 grams of pure 99.99% Li after being cleaned ofthe paraffin, in which they are preserved to prevent oxidation. It was cutinto smaller pieces and placed in the oven as soon as possible in an operatingatmosphere of Argon and then immediately sealed using the heavy top flangeof the chamber. Before closing an SS metal gauze was placed to keep the wallin place accidental movements of the chamber at the bottom and the top. Twoother holes are included in this sheet. One for the RGA port and another forthe anode. The anode is placed in a position so that the oven is well awayto avoid sparking, this is clear in figure 3.2. Three separate samples of W areplaced in the chamber sized about 1 cm× 1 cm at different positions to be usedas samples for LIBS / NRA analysis. One near the top of the chamber, oneat the bottom and one near the oven itself. It was made sure that there wereno gaps between these samples and the wall to avoid plasma instabilities. Theoven was operated at 450−500C for the Li evaporation. The wall (Twall) waskept at a constant temperature of 250C. A heat resistant teflon joint for theupper seal was placed as it does not react with Li (unlike copper joints) andis also easier to manipulate for multiple chamber openings and closures.
3.1.2 W-Lithiation using Helium Gas Flow
The experiments were initiated with wall conditioning at 250C for about 2hours in order to desorb all the gaseous impurities lying on the wall, this wasfollowed by an Argon glow discharge plasma for a duration of 45 minutes,that further prepares the surface for the experiments. At 300C Hydrogento the level of 4.00E − 9 Torr was seen and markedly increased from earliervalue at a RGA pressure of 7.0E − 9 Torr showing that the lithium present inthe oven was also degassing absorbed hydrogen. The chamber pressure wasrecorded as 7.06E − 6 Torr by the emission gauge near the wall. After thehydrogen level reached the background, the heating of oven was stopped butthe wall was continued to be maintained at 250C . Immediately after the wallconditioning, Li evaporation was begun under Helium flow. The evaporationwas started at 450C however the temperature was quickly increased to 500Cand the timer clocked for a total period of 30 minutes of evaporation. The Li

3.1 Experimental Procedure 49
evaporation formula in section 3.3 gives the amount that was evaporated inthis regard. After evaporation of Li and deposition on W-wall using the Hegas flow. A D2 plasma was run for 30.55 minutes duration this correspondsto a fluence of ∼ 1023 D/m2 . This was sufficient to give rise to a saturationseen in the figure 3.3. Optical emission spectroscopy scans were also performedduring this time for the D2 plasma. All calculation for particle balance wereperformed soon after. The table 3.1 shows the various characteristics of theplasmas during the entire experiment, here Ar is used only for glow dischargewall conditioning prior to lithiation.
Plasma(Gas) & Pressure(Torr) Chamber(Torr) Flow(sccm) VP (V) IP (mA)
Argon - 1.51±0.05× 10⁻² 5.2±0.2× 10⁻⁷ 99.0 200 200
Helium (gas only) - 2.30±0.05× 10⁻² 5.6±0.2× 10⁻⁶ 64.9 - -
Deuterium - 3.87±0.05× 10⁻² 9.3±0.2× 10⁻⁷ 48.9 120 300
Table 3.1: Values for characteristic plasma parameters for different discharges for
lithiation of W under He flow.
Figure 3.1: Deuterium Plasma after W lithiation under Helium flow seen from
the optical window

50 3. Conduction & Results
3.1.3 Li Deposited-W, Sputtered with Argon
After the initial experiment, the lithiated-W surface was taken out and ana-lyzed for the deposition that was observed as seen in figure 3.2. The copperanode seen in the top-right inset shows areas of higher sputtering, this couldhave been caused due to excessive sputtering of Li at these points during lithi-ation. As the Li layer starts to develop on the anode it seeds the growth andaccumulation of more Li causing the bubbles seen in the top-left inset. Onremoval of Li these areas look cleaner and exposed to the copper layers un-derneath. The surface also shows higher levels of Li deposition near to theLi-oven as seen in the bottom left inset where Li bubble formation is higher.However regions away were more cleanly deposited with Li, sections cut outfrom these areas are used for making samples to be tested further using ex-situdiagnostics. However, before the cleaning and observation was carried out the
Figure 3.2: Lithiated W - preliminary experiments depicting the chamber, W-
walls, and electrodes after lithiation
lithiated surface was altered by sputtering the lithiated samples with an argonPlasma, this was supposed to get rid of excessive surface deposited Li, therebyreducing the overall retention of D after the D2 plasma. Figure 3.3 shows theclear retentions differences, these are more for the Ar sputtered lithiated layerof W. The difference in the magnitude of the Li emitted during the opticalemission spectroscopy (OES) after sputtering is also much less compared tothe first case. The D2 partial pressure recorded by the RGA dips, as the gasis ionized and slowly rises as the implantation on the lithiated wall increasesand reaches a pseudo-saturation. This also points towards saturation of Dplasma retention on the wall, hence the experiment is stopped after a periodof this saturation, which last for 30 minutes. The details of the experiment aresummarized in table 3.2. Here, Ar plasma is used only to sputter lithium from

3.1 Experimental Procedure 51
the already lithiated W. In figure 3.4 it is obvious that the lithium emission at671 nm drops from 0.07 to 0.06 due to sputtering (away of Li) by Ar plasma andthis also results in less retention of D since the α− 656 nm line emissions dropsfrom 0.09 to 0.086, both D and Li emission lines are within the standard errorbars limits of the two respective successive experiments. The drop in the OEScount intensities can be attributed to the change in plasma parameters as theplasma voltage drops from 120 V (in first W-lithiation) to 100 V (W-lithiatedsputtered case) as this voltage is directly related to the emission intensity andis a clear indicator of the concentrations of the elements in the experiment.Thus OES shows clear signs of dropping D and Li elemental content in theexperiments in relation to the drop in plasma parameters.
Plasma(Gas) & Pressure(Torr) Chamber(Torr) Flow(sccm) VP (V) IP (mA)
Argon - 1.58±0.05× 10⁻² 2.9±0.2× 10⁻⁷ 98.0 80 250
Deuterium - 3.3±0.05× 10⁻² 3.9±0.2× 10⁻⁶ 48.6 100 300
Table 3.2: Values for characteristic plasma parameters for different discharges
under Ar-sputtered lithiated-W under He flow
0 500 1000 1500 2000 2500
0.0
1.0x10⁻⁶
2.0x10⁻⁶
3.0x10⁻⁶
4.0x10⁻⁶
5.0x10⁻⁶
6.0x10⁻⁶
7.0x10⁻⁶
Deu
teriu
m(T
orr)
Time(s)
Before Ar Sputter After Ar Sputter
Figure 3.3: Partial pressure plots for D2 plasma before and after sputtering with
Ar on Li deposited W, against experimental time

52 3. Conduction & Results
450 495 540 585 630 675
0.00
0.02
0.04
0.06
0.08
0.10
Cou
nts
OE
S (
a.u)
Wavelength (nm)
DE OES (before Ar sputter) DE OES (after Ar sputter)
Figure 3.4: OES intensity plots for D2 plasma before and after sputtering using
Ar on Li deposited W, against wavelength
3.1.4 W Lithiation using Helium Plasma
The procedure for the experiment was the same as for deposition under He gasflow, but the only difference being during evaporation of Li, the W-wall wassubjected to He plasma which was to facilitate implantation of the directly Liinto the wall but this varies the implantation to deposited Li ratio, therebychanging the retention characteristics of the W-wall, one of the goal was alsoto measure by how much this changed and it is summed up in section 3.5. Thetable 3.3 shows the various characteristics of the plasmas during the entireexperiment. Here Ar plasma was used for glow discharge wall conditioningprior to lithiation and not for sputtering. Here the specific protocol for lithi-ation using He plasma is described in detail. This protocol was repeated fora few experiments till the process was closely monitored and enabled to bereplicated.

3.1 Experimental Procedure 53
Plasma(Gas)&Pressure(Torr) Chamber(Torr) Flow(sccm) VP (V) IP (mA)
Argon - 2.1±0.05× 10⁻² 3.0±0.2× 10⁻⁶ 104.0 150 250
Helium - 2.3±0.05× 10⁻² 9.3±0.2× 10⁻⁷ 64.4 70 250
Deuterium - 4.3±0.05× 10⁻² 9.3±0.2× 10⁻⁷ 47.8 100 300
Table 3.3: Values for characteristic plasma parameters for different discharges for
lithiation of W under He plasma
Figure 3.5: Helium plasma in the absence of Li evaporation seen from the optical
window with inset image of Li evaporation
Li Evaporation & Deposition protocol :
1. Temperature of Li evaporation oven was increased till 450C just underHe gas flow from room temperature.
2. As soon as 450C was reached the He plasma was initiated with theparameters as judged from the earlier Li evaporation experiments bytrial and error (using the Li evaporation formula mentioned in the nextsection).
3. Continued increasing of temperature of the Li evaporation oven to 500Cwithin least possible time with the power supply during the next 5 min-utes.
4. A steady He plasma was produced and observed for various characteris-tics as they evolved with the increase in Li evaporation.

54 3. Conduction & Results
5. Optical emission spectroscopy measurements were made simultaneouslyand recorded from 640 − 750 nm, as lines at 656 (Hα) and 671 nm (Li)were the expected peaks in this range.
6. The temperature of the oven was increased till stability was attained at500C it was noticed that the Vp also started dipping to around 40 Voltssuggesting a lower plasma potential from the initial 70. Ip also increasedtill 350 mA to compensate for the decrease in Vp meanwhile holding thepower value same.
7. The heating of oven was stopped after 30 minutes of He plasma at 500C.
8. The temperature of the oven was allowed to drop immediately afterward,it was noticed that the plasma potential started rising again to 70 Vagain, the plasma current re-adjusted to 250 mA.
9. After another 15 minutes the He flow was stopped to allow the drop intemperature of the oven to begin the D retention test experiments in theabsence of any evaporating Li.
Figure 3.6: Lithiation of W (implantation and deposition) using He Plasma seen
from the optical window
D2 plasma details :
1. On initiating the D plasma, it was observed that the pressure fell butnot significantly during the plasma generation (leading to a loss in theplasma). A stable plasma was achieved and an OES spectrograph wasrecorded from 420 nm.

3.1 Experimental Procedure 55
2. The pressure drop was caused due to Li forming compounds with Dimmediately and hence it was speculated that the uptake of D beinghigh in this period resulted the depression in pressure,. In the trend linefor D it was also found that it saturates after about half an hour of theplasma, though the experiment could be run for longer time scale. 30minutes from previous operations gave evidences of saturation in thisdirection as can be seen in figure 3.7. This shows the uptake of D tothe walls after molecular D is greater than that of W and we expect tosee a significant difference with Li evaporated in the presence of the Heplasma in place of just flow. This expected trend is clearly evident infigure 3.7 as saturation is reached faster.
0 250 500 750 1000 1250 1500 1750 2000 2250
0.0
1.0x10⁻⁶
2.0x10⁻⁶
3.0x10⁻⁶
4.0x10⁻⁶
5.0x10⁻⁶
6.0x10⁻⁶
7.0x10⁻⁶
Deu
teriu
m(T
orr)
Time(s)
Lithiation with He flow Lithiation with He plasma U.s cleaned after He plasma
Figure 3.7: Partial pressure plots for D2 plasma after being exposed to different
lithiation environments against experimental time
3.1.5 Li Deposited & Implanted-W, Sputtered with Ar-gon
Following the outlined procedures at the beginning of the chapter. The lithi-ated W under He plasma was then subjected to sputtering using an Ar plasmathe details of which are present in table 3.4.

56 3. Conduction & Results
Plasma(Gas)&Pressure(Torr) Chamber(Torr) Flow(sccm) VP (V) IP (mA)
Argon - 2.1±0.05× 10⁻² 3.0±0.2× 10⁻⁶ 104.0 150 250
Deuterium - 4.3±0.05× 10⁻² 9.3±0.2× 10⁻⁷ 47.8 100 300
Table 3.4: Values for characteristic plasma parameters for different discharges for
Ar-sputtered lithiated-W under He Plasma
3.1.6 Ultra Sound Cleaned W-wall
The W-walls after their lithiation and D2 plasma exposures were removedfrom the setup and cleaned thoroughly using an ultra sound cleaning systemin distilled water and then dried in an oven at 200C with the surface exposedto an inert gas, after alcohol treatment. The W wall was then placed backinto the system carefully in the same position as the earlier experiments, toreproduce the exact same conditions as previously exposed to. The W-wallwas then subjected to heat conditioning under vacuum and followed by anArgon glow discharge for a duration of 45 minutes, followed by this procedurea pure D2 plasma was initiated for the duration of 30 minutes. The plasmadetails are given in table 3.5.
Plasma(Gas)&Pressure(Torr) Chamber(Torr) Flow(sccm) VP (V) IP (mA)
Argon - 1.5±0.05× 10⁻² 2.3±0.1× 10⁻⁶ 102 180 250
Deuterium - 3.3±0.05× 10⁻² 3.0±0.1× 10⁻⁶ 47.3 250 300
Table 3.5: Values for characteristic plasma parameters for different discharges for
Ar-sputtered lithiated-W
3.2 Simulations & Modeling
Monte-carlo simulations using a binary collision model and amorphous targetapproach developed by James F. Ziegler (updated 2013 Version), were per-formed to determine the implantation depths of Li (and ion distributions).This does not include ion channeling effects and recombination of knocked offatoms however. The forces considered by this model are the electronic forcesoperating between the ions and the target atoms. Strong and weak forcesare neglected in this model. Using this a 3-D distribution of ions in the solidamorphous target can be obtained. Other details such as penetration depth,the concentration of vacancies and distribution of sputtered atoms can also beobtained. First simulations were of Li ions on W under an applied voltage of100 V as seen in figure 3.8, followed by simulations of D ion on W. These wereperformed with a voltage 125 V as seen in figure 3.9, to determine implantationdepths for the inclusion and calculation of D retained per Li and W combined,hence giving the total retention for lithiated-W which could be compared with

3.2 Simulations & Modeling 57
2040
6080
100
0
10000
20000
30000
40000
50000
60000
70000
80000
90000
C19C39
C59C79
C99
No of Li Ions
Matrix WidthW Depth (Ang)
Li (100eV) on W 3-D Ion distribution profileAverage Ion Range = 15A
Figure 3.8: Simulated ion distribution profile of Li on W with 100 eV energies
the experimental particle balance calculations. To determine the D retainedin the various lithiation cases is described in the next section. From the sim-ulations it was obtained that the penetration of D on W as seen in the figure3.9 had an ion range value of 30 A, with this value the penetration of D withinthe bulk of W was calculated. It is known that the D is exposed to a volumeof W which is around 2.30175×10⁻¹⁰ m3 calculated from the dimensions of theW sheet. This can be divided by the volume of a unit cells of W, each unitcell being of the volume in a body centered cubic cell, giving a value equal to3.155× 10−29 m3. Thus giving the total number of unit cells the implanted Dinteracts with at these depths, giving a value equal to 7.294× 10¹⁸ cells. Noweach cell has two atoms of W therefore the total number of atoms of W, Dinteracts with becomes 1.4589× 10¹⁹ atoms. This can be used for calculationsof D retention per atom of W and then give combined ratios of D retentionfor Li and W combined. The implantation range of Li in W at the energiesof 100 V is around 15 A and hence it can be said that even with these ener-gies a majority of the Li is deposited on the surface of W-wall. The ratio ofthe deposited to the implanted Li can be calculated by integration of the ion

58 3. Conduction & Results
distribution over a given depth range.
030
6090
120150
180
0
5000
10000
15000
20000
25000
30000
35000
40000
45000
C19C39
C59C79
C99W Depth (Ang)
No of D Ions
Matrix Width
Average Ion Range = 30AD (125eV) on W 3-D Ion distribution profile
Figure 3.9: Simulated ion distribution profile of D on W with 125 eV energies
3.3 Particle Balance Calculations & Optical
Emission Spectroscopy
Particle balance calculations were performed on the data recorded from theDeuterium depletion on the various lithiated tungsten walls to give an ideaof the retention in tungsten. This can be done by locating the pressure ofthe D2 gas flow after shutting down the plasma (and saturation reached) andthen subtracting this maximum from the area covered by the pressure Vs timegraph of D2 gas from the moment the plasma is started to the point it isstopped. This correspond to a duration of 30 minutes. The total flux of Deu-terium atoms on the surface of the lithiated tungsten can be calculated andthis compared for the different lithiation cases. The data from the particlebalance calculations must also correspond with NRA.

3.3 Particle Balance Calculations & Optical Emission Spectroscopy 59
The formulas used for the calculations are given as under. DeuteriumRetention formula: ∫ tf
t0
(Pgas − Pplasma)dt = Ddep
Retained atoms of D =Ddep × η0 × na × 10−3
κD2 × 750.2× SW
(3.1)
Here tf is the final time of the plasma, t0 is the instant the plasma in initiated.Pgas , is the saturation value in the plasma gas pressure. Pplasma is the pressurerecorded for a particular channel of the RGA. Ddep is the deposited deuteriumatoms per unit area. The table 3.6 sums up the calculations done for differentexperiments that were performed and their respective retention. In the formulaη0 is the locksmith’s number, na is the number of atoms in a molecule, 750.2is the conversion factor for Torr to pascals, SW is the surface area of tungstensheet, κD2 is the RGA constant for the Deuterium gas. The lithium evaporationformula gives the quantity of lithium evaporated at a given temperature andpressure:
Levap =(133.3× exp(18.4− (18759/(Toven + 273)))× Tevap × AO)√
(2× π × 1.1526× 10−26 × 1.38× 10−23)× (Toven + 273))gms
(3.2)Here Levap is the evaporated lithium in gms, this also includes the factor thepartial pressure of Li at different temperatures, AO is the oven area fromwhich the Li evaporates which is roughly equal to 1.852×10⁻⁴×π, Tevap is theevaporation time for which the oven is heated, Toven is the temperature of theoven at which it is heated, the square root contains all the different values ofconstant needed to calculate the exact Li evaporated, therefore from the abovetwo equations the deuterium retained per Li and W is given by:
Dratio =ND
(NLi +NW )(3.3)
Here Dratio is the ratio of the number of Deuterium atoms Retained per Liand W, ND is the number of D atoms, NLi is the number of Lithium atomsevaporated and deposited to the surface, and NW is the number of atomsof W interacting with the implanted/ deposited Deuterium determined usingSRIM plots. For determination of W particles interacting with the Deuteriumimplanted in section 3.2:
no of unit cells×Nu =Penetration depth× 0.135× 0.550
A3 (3.4)
Here Penetration depth can be determined from SRIM for a given calcula-tion which is found above and A is the lattice constant for tungsten (3.160 A),Nu is the number of unit cells interacting with Li, the rest are dimension of

60 3. Conduction & Results
the W sheet. The results in table 3.6 indicate towards retention being affectedafter lithiation since the retention of D in the lithiation layer is saturated withchemical bonds of lithium forming compounds.
Particle balance summary :
ExpNo.
Description VP (V) IA(mA) Dretention
D/m2
D/(Li + W )Ratio
1 W + LiDep (HeFlow)
120 0.3 1.25±0.17 E22 0.49±0.06
2 W + LiDep (Ar Sputter)
120 0.3 6.94±0.98 E21 0.27±0.03
3 W + Li Imp+Dep (HePlasma)
100 0.3 1.09±0.15 E22 0.42±0.06
4 W + Li Imp+Dep (Ar Sputter)
120 0.3 7.27±1.03 E21 0.28±0.04
5 W (U.S cleaned) 250 0.2 7.26±1.03 E21 -
6 W (noLi exposure) 250 0.3 4.45±0.63 E21 -
Table 3.6: Values for retention and characteristic plasma parameters for different
lithiation environment experiments
Experimental data indicates that D retained in case of W-lithiation withpure He flow is, ≈ 1.15 times larger than W-lithiation in case of He plasma.This can be found by simply taking the retention ratio of the number obtainedfrom W + LiDep (HeFlow)/W (noLi exposure) and the number obtainedfrom W +Li Impl+Dep (HePlasma)/W (noLi exposure). OES data for thetwo cases specifies that the D retention ratio as ≈ 1.76 times greater for flowlithiation, these values correspond to an extent within their error bars. OESfurther shows that a proportion of implanted lithium remains after completecleaning with ultra sound, which points towards Li implantation after W-lithiation under He plasma, also predicted from simulations. It can be assumedthat Ar sputtering reduces the surface deposited Li content but does not getrid of it completely because of which the retention drops considerably butnot completely since the implanted lithium remains in the W lattice. AlsoAr sputtering can implant deposited Li atoms further or implant the alreadyimplanted Li atoms deeper during the He plasma Lithiation. The ratio of theD retained per W and Li atom also is highest for He flow lithiation (0.492)compared to He plasma lithiation (0.429) and all sputtered cases. This pointstowards better retention capability in the case of He flow lithiation.
OES data was used to get a qualitative understanding of processes duringlithiation and interaction of the plasma with lithium as they are quite indicative

3.3 Particle Balance Calculations & Optical Emission Spectroscopy 61
656 660 664 668 672 676
0.02
0.04
0.06
0.08
0.10
O
ES
(a.
u)
Wavelength (nm)
DE OES He flow DE OES He plasma DE OES U.S
Figure 3.10: Deuterium Plasma OES comparing Lithiated-W with He flow and
He plasma and Ultra sound cleaned W containing implanted traces from He plasma
lithiation
of the physical processes dominating the experiments. Here in figure 3.10 acomparison of the OES spectra from different lithiation environments suggeststhat D retention is highest and the Dα peak has a magnitude of 0.095 in caseof He flow lithiation compared to the 0.072 peak for He plasma lithiation andleast (0.027) in case of ultra sound cleaned W. The values are well within theerror bars and hence comparable. The peaks of Li emission (671nm) are alsoindicative of the Li present on the wall during the emission spectroscopy as theOES is taken during D2 plasmas. The peak is highest for He flow lithiation0.074 and drops to 0.011 in successive cases, He plasma lithiation case beingintermediate at 0.042. The data suggest that the experiments were running asper their variations in lithiation environment.

62 3. Conduction & Results
3.4 Conclusions & Future Work
1. Simulations carried out estimate that of the 106 Li ions simulated on Wwith energies of 100 eV under a Maxwellian energy distribution, the ionsthat reach beyond a depth of 3.160 Am (W lattice parameter) are a sig-nificant proportion. By integrating the 3-D Li-ion distributions plots itwas found that 50% of total Li from the plasma is present within a depthof 15 Am, and consequently 95.8% - 96.6% of Li was present till the max-imum depth of 31− 32 Am in W, within this depth range, coincidentally50% of total D from the plasma (with energies of 125 eV) was found to beimplanted, from earlier simulations. In this region (0− 32 Am) twice theamount of Li atoms can be found than D atoms assuming a maxwelliandistribution. Combining the effects of this, a 2 fold increase in retentioncould be expected from Li implanted in W (due to formation of com-pounds with D), within this given depth range, under the assumptionthat all the Li in the W lattice reacts with D (Li:D::1:1). However parti-cle balance calculations indicate that the D retention in W lithiated underHe plasma conditions is ∼ 2.45 times higher, determined by taking theratio of retention of W+Li Impl+Dep (HePlasma)/W (noLi exposure)and W lithiated under He flow conditions is ∼ 2.81 times higher (ratioof W +LiDep (HeFlow)/W (noLi exposure)), compared to the non Liexposed retention in W.
2. This higher retention could be attributed to additional surface depo-sition of Li, larger in the case of only W-lithiation with He flow (as noimplantation takes place in this case whatsoever) and all of the Li can beassumed to be deposited on the surface, hence providing more Li in directexposure to D plasmas increasing retention. It is experimentally also evi-dent, that retention in W-lithiated-Ar sputtered samples dropped by ≈33.30% in case of He plasma lithiation, determined by taking the ratio ofW +Li Impl+Dep (HePlasma)/W +Li Imp+Dep (Ar Sputter) and by≈ 44.47% (ratio of W + LiDep (HeFlow)/W + LiDep (Ar Sputter) )in case of He flow lithiation from particle balance calculations. Thissuggests that a particular amount of lithium related to this drop inretention could be eroded or removed due to Ar-sputtering. This ex-perimental reduction in D retention from particle balance calculationssuggests that the implanted Li is ≈ 25.9% (determined by taking theratio of ((W + Li Imp+Dep (Ar Sputter) − W (noLi exposure))/W +Li Impl+Dep (HePlasma)) of the total Li that has been evaporatedunder He plasma. Simulations of W-lithiation with He plasma show that26.8% - 31.6% of Li (say 30% of total Li) can be found from the upperW surface to a maximum depth of 9 − 10 Am by integration of the iondistribution in this range.
3. Further significantly and importantly, sputtering from simulations withAr plasma suggests that upto 100% of Ar ions can be found at this depth

3.4 Conclusions & Future Work 63
range of 10− 11 Am. Thus Ar would sputter the upper 10− 11 Am lead-ing to this net loss (26.8% - 31.6%) of Li from the overall distribution ofLi implanted W, this is close to the experimentally estimated (25.9%) ofLi implantation in the same depth range. Hence the mathematical mod-els are in good agreement and coincide with experimentally determinedvalues within error limits.
4. With respect to the experiments carried out for this work, it is plannedthat small samples (1 cm × 1 cm) that have been produced would besent for testing Laser induced breakdown spectroscopy (LIBS) testingat the Department of Experimental Physics Faculty of Mathematics,Comenius University, Slovakia. This would give a detailed idea of theLi depth profile and the retention of D in the differently lithiated sam-ples. Further surface morphology analysis could also be performed withelectron microscopy to gain a better understanding of how the surfacereacts to different lithiation environments. Sufficient time could be ded-icated to separate experiments with higher plasma temperatures and ahigher temporal resolution OES could be used to determine this. Use ofhigher W-wall temperatures (reactor wall at 500C) could also providesome resolutions to the D retention issue due to only implanted lithium(apparent in experiments with 250C). Use of high flux linear devices(pilot-PSI, Magnum, PISCES) to expose samples to higher flux densi-ties are also highly relevant towards testing for reactor like conditions.These kind of experiments shed light on the many interactions goingon, where the plasma interacts with Li and plasma facing materials intandem. The logical next step would be to see how retention could beaffected in Li coated PFCs in relation to the plasma interaction directlyin tokamaks (such as in the CDX-U or the LTX [Lithium Tokamak Ex-periment]). In-situ methods such as LIBS or Lased induced desorptionspectroscopy (LIDS) techniques could be used for the retention analy-sis and cross checked with the results from RGA and OES spectra atthe site itself. Simulations which take into account recombination effectsand ion channeling effects could produce greater accuracy in simulatedresults with multiple impinging ions simultaneously interacting with thelithiated-W surface.

64 3. Conduction & Results

Bibliography
[1] B. Petroleum, BP Statistical Review of WorldEnergy, http://www.bp.com/content/dam/bp/
pdf/Energy-economics/statistical-review-2015/
bp-statistical-review-of-world-energy-2015-full-report.pdf,2015, [Online; accessed 22-May-2015].
[2] T. Eich, Impact of Energy Consumption On the Climate change (MaxPlanck Institute for Plasma Physics Summer University, Munich, Ger-many, 2014).
[3] J. M. Jancovici, The Kaya equation, http://www.manicore.com/
anglais/documentation_a/greenhouse/kaya_equation.html, 2014,[Online; accessed 1-May-2015].
[4] K. S. Krane, Introductory nuclear physics (John Wiley and Sons Inc.,,New York, NY, 1987).
[5] R.Nave, Nuclear Binding Energy Curve, http://hyperphysics.
phy-astr.gsu.edu/hbase/nucene/nucbin.html, 2000, [Online; ac-cessed 22-May-2015].
[6] A. Beiser, S. Mahajan, and S. R. Choudhury, Concepts of modern physics(Tata McGraw-Hill Education, New York, NY, 2003).
[7] W. Flint, D-T Fusion ITER, Tokamak, NIF, http://www.
polywellnuclearfusion.com/NuclearFusion/FusionReactors.html,2007, [Online; accessed 22-May-2015].
[8] Wikimedia-Commons, Tokamak, https://upload.wikimedia.org/
wikipedia/commons/c/cb/Tokamak_(scheme).jpg, 2014, [Online;accessed 22-May-2015].
[9] E. A. Azizov, Physics-Uspekhi 55, 190 (2012).
[10] J. N. Davidson, Nuclear Fusion 16, 731 (1976).
[11] E. Lazarus et al., Physical review letters 77, 2714 (1996).
[12] R. La Haye, L. Lao, E. Strait, and T. Taylor, Nuclear fusion 37, 397(1997).
65

66 Bibliography
[13] L. Delgado-Aparicio et al., Nuclear Fusion 53, 043019 (2013).
[14] P. Helander et al., Plasma Physics and Controlled Fusion 54, 124009(2012).
[15] L. Spitzer Jr, Physics of Fluids (1958-1988) 1, 253 (1958).
[16] M. Greenwald, Plasma Physics and Controlled Fusion 44, R27 (2002).
[17] S. Hirshman et al., Computer Physics Communications 43, 143 (1986).
[18] J. D. Lawson, Proceedings of the Physical Society. Section B 70, 6 (1957).
[19] I. O.-D. Butler, ITER keeps eye on prize, http://www.nature.com/news/iter-keeps-eye-on-prize-1.13957, 2013, [Online; accessed 22-May-2015].
[20] M. Shimada et al., Nuclear Fusion 47, S1 (2007).
[21] U. von Toussaint, Plasma -Wall interactions and first wall (Max PlanckInstitute for Plasma Physics Summer University, Munich, Germany,2014).
[22] R. Wenninger et al., Nuclear Fusion 54, 114003 (2014).
[23] A. Kallenbach et al., Journal of Nuclear Materials 415, S19 (2011).
[24] F. L. Tabares, Lithium (Nova Science, Madrid, Spain, 2013).
[25] B. Lipschultz et al., Nuclear Fusion 52, 123002 (2012).
[26] J. Coenen et al., Journal of Nuclear Materials 438, Supplement, S27(2013), proceedings of the 20th International Conference on Plasma-Surface Interactions in Controlled Fusion Devices.
[27] P. Stangeby, Journal of Nuclear Materials 415, S278 (2011).
[28] D. Ryutov, R. Cohen, T. Rognlien, and M. Umansky, Plasma Physics andControlled Fusion 54, 124050 (2012).
[29] A. Loarte et al., Nuclear Fusion 47, S203 (2007).
[30] M. Ono et al., Nuclear Fusion 40, 557 (2000).
[31] V. Evtikhin et al., Journal of nuclear materials 307, 1664 (2002).
[32] M. J. B. Panayiotis J Karditsas, Thermal and Structural Properties ofFusion related Materials, http://aries.ucsd.edu/LIB/PROPS/PANOS/
matintro.html, 1995, [Online; accessed 22-May-2015].
[33] UCSanDiego, ARIES Fusion Power Plant Studies, http://aries.ucsd.edu/LIB/PROPS/Ga_vap.gif, 1995, [Online; accessed 22-May-2015].

67
[34] T. Rognlien and M. Rensink, Physics of Plasmas (1994-present) 9, 2120(2002).
[35] J. Hogan, C. Bush, and C. Skinner, (1997).
[36] R. Majeski et al., Nuclear fusion 45, 519 (2005).
[37] J. Hu et al., Fusion Engineering and Design 85, 930 (2010).
[38] G. Xu et al., Nuclear Fusion 51, 072001 (2011).
[39] G. Mazzitelli et al., Nuclear Fusion 51, 073006 (2011).
[40] F. Tabares et al., Plasma Physics and Controlled Fusion 50, 124051(2008).
[41] E. Oyarzabal, A. Martin-Rojo, and F. Tabares, Journal of Nuclear Mate-rials 452, 37 (2014).
[42] M. Ono et al., Nuclear Fusion 53, 113030 (2013).
[43] F. L. Tabares, Plasma Physics and Controlled Fusion 57, (2015).
[44] S. Krasheninnikov, L. Zakharov, and G. Pereverzev, Physics of Plasmas(1994-present) 10, 1678 (2003).
[45] M. Ono, Fusion Engineering and Design 87, 1709 (2012).
[46] H. Kondo et al., Nuclear Fusion 51, 123008 (2011).
[47] P. Gates, Gas Chromatography Mass Spectrometry, GC-MS, http://
www.bris.ac.uk/nerclsmsf/techniques/gcms.html, 2005, [Online; ac-cessed 22-May-2015].
[48] A. Meiners, Optical emission spectroscopy for plasma diagnostics (AN-DOR technology, Goettingen, Germany, 2010).
[49] B. Schweer et al., Physica scripta 2009, 014008 (2009).
[50] D. A. Cremers, F.-Y. Yueh, J. P. Singh, and H. Zhang, Laser-InducedBreakdown Spectroscopy, Elemental Analysis (Wiley Online Library, AD-DRESS, 2006).
[51] A. Caldwell et al., Laboratory proceedings 23 (2006).
[52] H. S. Bosch and G. Hale, Nuclear Fusion 32, 611 (1992).
[53] I. beam Technologies, Nuclear Reaction analysis, http://www.
spirit-ion.eu/v1/Project/Techniques/NRA.html, 2005, [Online; ac-cessed 22-May-2015].

68 Bibliography

AcknowledgmentsThis master thesis has benefited greatly from the support of many people, someof whom, I would sincerely like to thank here. Prof. Francisco L. Tabares as theadvisor and supervisor, deserves special appreciation for his highly knowledge-able remarks, experienced suggestions and particular praise for his openness,calm and friendly manner which allowed him to convey everything to me mostgraciously, this was inspiring for me throughout the master thesis.
I also want to thank A. De Castro for his persistent support throughout theexperiments and for his comments that improved the manuscript, Dr. E.Oyarzabal, Dr. A.B. Martin-Rojo & Miguel Navarro Santana (vacuum tech-nician) for providing me the additional information, supplies needed for mywork and the extended lab times in times of trouble. I thank all the greatpeople I met during the master programme and especially all my colleaguesand professors, from whom I have learnt much more, than just academically.
A special thanks goes to Erasmus Mundus FUSION-EP committee for provid-ing the opportunity for this exposure, funding and continued support for thiswork. Prof. Jose Ramon Martin Solis for his guidance in many areas through-out the year. Finally but in no way the least, my parents and close relatives aredue my deep gratitude for their continued moral support. The broad educationthat I was able to enjoy while growing up has proven invaluable.
I declare that the work contained herein is my own except where explicitlyreferenced, stated or linked in the text. In this it has undergone repeatedscrutiny by myself, any minor errors that may have crept in inevitably, are myown.


Declaration in lieu of oathHerewith I declare in lieu of oath that I have prepared this thesis exclusivelywith the help of my scientific teachers and the means quoted by them.
City, thePranay Valson
Copyright AgreementI hereby grant the FUSION-EP consortium the non-exclusive right to publishthis work.
I declare that this work is free of copyright claims of third parties.
City, thePranay Valson


