Embed Size (px)
Citation preview

Statistical analysis of blister bursts during Temperature
Programmed Desorption of deuterium-implanted
polycrystalline tungsten
A Manhard, U v. Toussaint, T Durbeck, K Schmid, W Jacob
Max-Planck-Institut fur Plasmaphysik, EURATOM Association, Boltzmannstr. 2, 85748
Garching, Germany
E-mail: [email protected]
Abstract. During Temperature Programmed Desorption of stress-relieved polycrystalline
tungsten samples exposed to a deuterium plasma, short, intense bursts of D2 were observed
on the low–temperature flank of the main desorption peak. These bursts are attributed to
the rupturing of blisters filled with high–pressure D2 gas. A statistical analysis of the size
distribution and temporal correlation of the bursts is presented. The influence of different
measurement intervals and TPD heating rates on the observed bursts is simulated based on
these statistics and compared to experimental results. The contribution of bursts to the total D
inventory in the sample is also estimated.
PACS numbers: 68.43.Vx (thermal desorption), 52.40.Hf (plasma–material interactions),
52.77.Dq (ion implantation and deposition), 71.55.Ak (impurity and defect levels in metals),
68.35.bd (surface structure of metals), 89.30.Jj (nuclear fusion power), 02.50.-r (statistics)
Submitted to: Phys. Scr. / PFMC–13

Statistical analysis of blister bursts during TPD 2
1. Introduction
Temperature Programmed Desorption (TPD) measurements with different heating rates
were performed on hot-rolled polycrystalline tunsten samples exposed to a deuterium
plasma. The D2 desorption spectrum (mass 4) showed significant excursions for
temperatures from 300 K up to the desorption maximum at approximately 600–700 K.
These excursions were not visible in any of the other observed masses. Also, they
became more pronounced for slower heating rates and were clearly separable into short
individual bursts for heating rates of 3 K/min or slower. Because all samples showed
strong blistering due to the deuterium plasma exposure, the bursting of these blisters
is an obvious explanation for the observed D2 gas bursts. Such bursting events during
TPD that were associated to blisters were already reported several times for deuterium
implanted into tungsten [1, 2, 3]. Similar phenomena were also observed during TPD
analysis of other systems, e.g., for silicon co-implanted by helium and deuterium [4].
This paper presents a detailed statistical analysis of the D2 bursts during the
TPD experiments described above. The size distribution, temporal correlation and the
contribution of blister bursts to the total D release from the samples will be derived from
measurements acquired with high time resolution at a slow heating rate. Also, the effect
of overlapping blister bursts for fast heating rates and slow acquisition is discussed.
2. Experimental
16 hot-rolled polycrystalline tungsten samples (purity: 99.97 wt.%, manufacturer:
PLANSEE) were mechanically polished until no distorted surface layer was present

Statistical analysis of blister bursts during TPD 3
anymore. After ultrasonic cleaning, they were degassed and stress-relieved at 1200 K
for 60 minutes in a high-vacuum furnace. The microstructure of these samples, i.e.,
grain structure and dislocation density, was already described in [5]. All samples were
subsequently implanted with low-energy deuterium ions in a fully quantified remote ECR
plasma source [6] under identical conditions. The ion flux was 1022 D m−2 s−1 at an
energy of 38 eV/D. The samples were irradiated to a fluence of 6×1024 D m−2 at a
temperature of 370 K. These implantation conditions lead to a strong blister formation
on the surface of the samples. An example is shown in Figure 1.
After 2 months of resting time in a vacuum exsiccator, TPD measurements with
various temperature ramps between 0.3 K/min and 600 K/min were performed on these
samples. The TPD measurements were performed in the quartz tube of the TESS set-up
[7] at a base vacuum of the order of 10−9 Pa. The typical integration time for mass 4
(corresponding to D2) was 1 second, with a total cycle time of approximately 5 s for
the monitoring of masses 1–4, 12, 17–20, 28, 32 and 44. For very fast ramps, only
masses 3 and 4 were observed with an integration time of 100 ms and a cycle time of
≈ 0.35 s. For high time resolution measurements, only mass 4 was observed with an
integration time of 50 ms and a cycle time of 90 ms. The quadrupole mass spectrometer
was operated with the secondary electron multiplier in single ion counting mode for all
measurements. The temperature response of the samples to the linear oven temperature
ramp was calibrated by a thermocouple spot-welded to a sample prior to the actual TPD
measurements.

Statistical analysis of blister bursts during TPD 4
3. Observations
The signal of mass 4, corresponding to D2 molecules, always showed noticeable
excursions in the low-temperature part of the desorption spectrum. They did not occur
for any other observed mass. The excursions started already at very little above 300 K,
more or less at the same time as the D2 release from the sample. For faster heating
rates, e.g. 15 K/min, these excursions could be mistaken for unusually strong noise.
However, this apparent ”noise” was only present in the low-temperature part of the
desorption spectrum. In the high-temperature part at comparable or even lower count
rates, the signal was much smoother. For slow ramps, i.e., 3 K/min and slower, many
individual spikes in the mass 4 signal were visible up to the release maximum at about
600–700 K, with the position of the maximum depending on the heating ramp. Such
spikes were not observed significantly beyond the release maximum. Examples of TPD
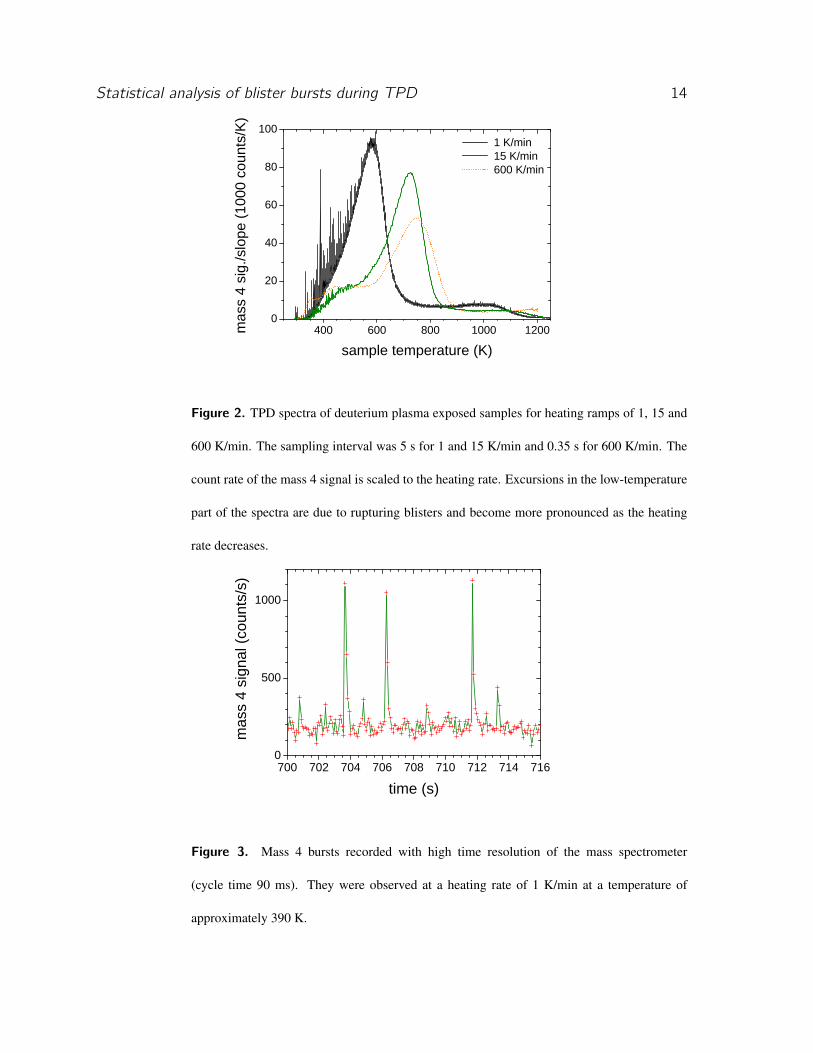
spectra with heating rates of 1, 15 and 600 K/min are shown in Figure 2. The sampling
interval was 5 s for both slower heating rates and 0.35 s for the fast one.
Due to the long cycle time of typically ≈ 5 seconds, each burst consisted only of a
single measurement point even for the slowest ramps. Therefore, a measurement was
performed where only mass 4 was recorded with a cycle time of 90 ms, at a temperature
ramp of 1 K/min. Due to limitations of the data acquisition system, only about one
third of the low-temperature part of the desorption spectrum could be observed with
this high time resolution. Now most bursts could be resolved individually and with
several measurement points in the decaying flank, as it is shown in Figure 3. One burst
typically contains of the order of 1011 D2 molecules. This is in reasonable agreement

Statistical analysis of blister bursts during TPD 5
with observations by [8]: In this paper the internal D2 gas pressure of blisters is estimated
to be of the order of 0.1 GPa. For a typical blister volume of the order of 10 µm3, this
corresponds to about 2×10¹¹ D2 molecules per blister. It is clear that the peak shape
observed in our experiment is dominated by the pumping time constant τ ≈ 100 ms of
the TESS set-up. The actual blister bursting event probably happens on an even shorter
timescale.
4. Statistical analysis
The statistical analysis of the blister burst events requires a separation of the blister
burst signal contribution from the remaining TPD signal. This task is complicated
by the unknown — but in any case non-Gaussian — distribution of the burst size.
For this signal–background separation problem elaborate approaches based on Bayesian
probability theory are known [9, 10, 11], which also allow the estimation of the higher
order moments. For the present paper the use of the simple but efficient median filtering
approach turned out to be adequate. A sliding median window spanning roughly 30
consecutive data points was used to estimate the TPD signal without burst contributions.
The subtraction of the median signal from the measured signal yielded the blister burst
signal. The low signal part of the extracted blister burst signal was fluctuating around
zero with no visible signs of a trend which substantiates that the median filtering process
did not convey contributions from the slowly varying TPD signal into the blister burst
data.
The blister bursts were analysed with respect to intensity (size) distribution,

Statistical analysis of blister bursts during TPD 6
temporal correlations and total contribution to the TPD signal. The time integral
over the separated burst signals turned out to be independent of the heating rate
of the sample. Within the experimental uncertainties the integral was the same for
0.3 K/min, 1 K/min and 3 K/min and was about 3–5% of the total TPD signal.
For the measurement of the size distribution of the blister events the mass 4 bursts
taken with a high time resolution of the mass spectrometer (90 ms) were used. For
this data set the bursts are well separated from each other. This allows performing a
statistical analysis on the magnitude of the individual events without too much influence
of data from simultaneously recorded blister burst events. Figure 4 shows the histogram
of all deviations from the median of the measured mass 4 signal. In order to avoid
multiple counting of a burst spanning more than one acquisition cycle (see Figure 3),
only local maxima respectively minima are considered in the histogram. Since a typical
burst consists of a (nearly) vertical rising flank followed by an exponential decay with
the pumping time constant τ , the relation between burst height A and burst integral I
is given by
I(t0) =
∞∫t0
Aet/τ dt = Aτe−t0/τ . (1)
Taking t0= 0 as the time when the peak maximum is observed, this yields I(0) =Aτ .
Therefore, considering only the burst maxima in the histogram still yields the correct size
distribution of the blister bursts. Equation 1 can also be used to estimate an upper bound
for the observation error of the total amount of D2 molecules released in a single burst:
Typically, the rising flank of a burst contains no other datapoint besides the maximum.
Considering the cycle time of 90 ms and the integration time of 50 ms per datapoint,

Statistical analysis of blister bursts during TPD 7
the actual burst event cannot have happened more than ∆t = 40 ms before the observed
maximum. In the worst case, the amount of D2 molecules released in a burst could
accordingly be underestimated by a factor I(−∆t)/I(0) = exp(∆t/τ)≈ 1.5.
Centred around zero deviation from the median is a Gaussian distribution of
excursions corresponding to the noise of the measured signal. This part of the distribution
is indicated by the dashed line. Towards larger excursions, a significant tail of the
distribution is visible. As the continuous line shows, the dominant part of the size
distribution can well be described by an exponential function. The contributions at even
larger sizes can be partly assigned to pile-up: the simultaneous recording of two or more
burst events, resulting in an apparently very large burst. Please note the peak in the
histogram exactly at zero, which is due to the median filter but does not harm the
further analysis. The time gaps between individual burst events ∆ti = ti+1− ti followed
over most of the disruptive phase (excluding the initial and final phases) a heating rate
dependent exponential distribution
p (∆t)∼ c exp(−ct) , (2)
where c is proportional to the heating rate. The results of a subsequent analysis
of the time lag distribution f (∆ti ,∆ti+1) of consecutive burst events as well as of
the size distribution of neighboured peaks were also compliant with the assumption of
independent burst events. These results favour a Poisson process [12] as probabilistic
model for the observations: The blister size distribution is a sample property and the
rate distribution of the burst events follows a Poisson distribution with a temperature
heating rate dependent burst rate. This model does not incorporate correlation effects

Statistical analysis of blister bursts during TPD 8
(e.g. a large burst event triggers immediate subsequent bursts) since no experimental
indications have been found for this. As a test if this simplified model captures the
essential features of the burst events a synthetic data series has been simulated based
on the burst rate coefficient and the size histogram derived from the TPD data as
the only input data. A comparison of the measured and simulated time series is given
in Fig. 5. The two spectra with high time resolution of the acquisition are virtually
indistinguishable in a statistical sense, thus providing some support that the introduced
Poisson model captures the essential features. It can also be clearly seen that at higher
heating rates and longer integration times individual spikes in the signal start to overlap
and an average signal is being recorded — which may even be mistaken as an (additional)
peak at low temperatures. With the present model these effects can be simulated and
subsequently taken into account or eventually deconvoluted.
5. Summary
It was shown that blisters formed on hot-rolled polycrystalline tungsten due to deuterium
plasma exposure produce bursts of D2 gas during TPD due to the rupturing of these
blisters. The size distribution of the bursts is exponential. The cumulative amount
of deuterium released in such bursts is approximately 3–5% of the total released
amount. The bursts occur independently from each other. Comparing the same
temperature region at different heating rates, the burst frequency per temperature
increase is constant. Faster heating rates and slower measurement intervals lead to a less
pronounced burst signature and this effect can be reproduced by simulation based on the

Statistical analysis of blister bursts during TPD 9
proposed Poisson model. The rupturing of blisters still produces a detectable signature
in the TPD spectrum even for very fast heating rates, both in the simulation and in the
present experiments but may be blurred significantly or even masked by lower pumping
speeds or low time resolution. This might, in the worst case, lead to misinterpretation of
TPD spectra. Binding energies of deuterium are usually derived assuming an Arrhenius-
like desorption process from traps. However, the D2 release due to rupturing of blisters
is certainly a different process. Accordingly, if there is a significant contribution from
blister bursts to the D2 release spectrum, it should be treated separately from thermally
activated release.
Statistical analysis of blister bursts during TPD 10
References
[1] Shu W, Wakai E and Yamanishi T 2007 Nucl. Fusion 47 201–209
[2] Shu W M, Nakamichi M, Alimov V K, Luo G N, Isobe K and Yamanishi T 2009 J. Nucl. Mater.
390–391 1017–1021
[3] Kolasinski R D, Shimada M, Buchenauer D A, Causey R A, Otsuka T, Clift W M, Shea J M, Allen
T R, Calderoni P and Sharpe J P 2009 Phys. Scr. T138 014042
[4] Corni F, Nobili C, Tonini R, Ottavani G and Tonelli M 2001 Appl. Phys. Lett. 78 (19) 2870–2872
[5] Manhard A, Schmid K, Balden M and Jacob W 2010 J. Nucl. Mater. in press
doi:10.1016/j.jnucmat.2010.10.045
[6] Manhard A, Schwarz-Selinger T and Jacob W 2011 Plasma Sources Sci. Technol. 20 015010
[7] Salancon E, Durbeck T, Schwarz-Selinger T, Genoese F and Jacob W 2008 J. Nucl. Mater. 376
160–168
[8] Balden M, Lindig S, Manhard A and You Y H 2011 J. Nucl. Mater. 414 69–72
[9] von der Linden W, Dose V, Padayachee J and Prozesky V 1999 Phys. Rev. E 59 6527–6534
[10] Fischer R, Hanson K M, Dose V and von der Linden W 2000 Phys. Rev. E 61 1152
[11] von Toussaint U and Dose V 2006 Appl. Phys. A 82 403–413
[12] Press W, Teukolsky S, Vetterlin W and Flannery B 2007 (Cambridge University Press)

Statistical analysis of blister bursts during TPD 11
Figure captions
Figure 1. Differential interference contrast micrograph of blisters on the sample surface
after deuterium plasma exposure.
Figure 2. TPD spectra of deuterium plasma exposed samples for heating ramps of
1, 15 and 600 K/min. The sampling interval was 5 s for 1 and 15 K/min and 0.35 s for
600 K/min. The count rate of the mass 4 signal is scaled to the heating rate. Excursions
in the low-temperature part of the spectra are due to rupturing blisters and become more
pronounced as the heating rate decreases.
Figure 3. Mass 4 bursts recorded with high time resolution of the mass spec-
trometer (cycle time 90 ms). They were observed at a heating rate of 1 K/min at a
temperature of approximately 390 K.
Figure 4. Histogram of excursions from the median value of the measured mass 4
signal for a heating rate of 1 K/min. Besides the Gaussian noise (dashed line), a heavy
tail of the distribution towards larger excursions, i.e., blister bursts, is visible. The domi-
nant contribution can be described by an exponential distribution (continuous line). Very
large events can be attributed to pile-up.
Figure 5. Simulation of the mass spectrometer response to blisters with an
exponential size distribution bursting at a fixed rate per temperature interval. The

Statistical analysis of blister bursts during TPD 12
simulation is compared to the TPD signal of the measurement with 90 ms time resolution.
A simulation with 15 K/min, integration time of 1 s and cycle time of 5 s shows the
effect of overlapping bursts.

Statistical analysis of blister bursts during TPD 13
Figures
Figure 1. Differential interference contrast micrograph of blisters on the sample surface after
deuterium plasma exposure.
Statistical analysis of blister bursts during TPD 14
4 0 0 6 0 0 8 0 0 1 0 0 0 1 2 0 00
2 0
4 0
6 0
8 0
1 0 0
mass
4 sig.
/slope
(100
0 cou
nts/K)
1 K / m i n 1 5 K / m i n 6 0 0 K / m i n
s a m p l e t e m p e r a t u r e ( K )
Figure 2. TPD spectra of deuterium plasma exposed samples for heating ramps of 1, 15 and
600 K/min. The sampling interval was 5 s for 1 and 15 K/min and 0.35 s for 600 K/min. The
count rate of the mass 4 signal is scaled to the heating rate. Excursions in the low-temperature
part of the spectra are due to rupturing blisters and become more pronounced as the heating
rate decreases.
7 0 0 7 0 2 7 0 4 7 0 6 7 0 8 7 1 0 7 1 2 7 1 4 7 1 60
5 0 0
1 0 0 0
t i m e ( s )
mass
4 sign
al (co
unts/
s)
Figure 3. Mass 4 bursts recorded with high time resolution of the mass spectrometer
(cycle time 90 ms). They were observed at a heating rate of 1 K/min at a temperature of
approximately 390 K.

Statistical analysis of blister bursts during TPD 15
- 2 0 0 0 2 0 0 4 0 0 6 0 0 8 0 01
1 0
1 0 0
1 0 0 0
occu
rence
d i f f e r e n c e t o m e d i a n s i g n a l ( c o u n t s / s )
Figure 4. Histogram of excursions from the median value of the measured mass 4 signal
for a heating rate of 1 K/min. Besides the Gaussian noise (dashed line), a heavy tail of the
distribution towards larger excursions, i.e., blister bursts, is visible. The dominant contribution
can be described by an exponential distribution (continuous line). Very large events can be
attributed to pile-up.
04 0 08 0 0
e x p e r i m e n t 1 K / m i n f a s t
04 0 08 0 0
s i m u l a t i o n 1 K / m i n f a s t
mass
4 sign
al (co
unts/
s)
4 0 0 5 0 0 6 0 0 7 0 00
4 0 08 0 0
s i m u l a t i o n 1 5 K / m i n s l o w
t i m e ( s )
Figure 5. Simulation of the mass spectrometer response to blisters with an exponential size
distribution bursting at a fixed rate per temperature interval. The simulation is compared to
the TPD signal of the measurement with 90 ms time resolution. A simulation with 15 K/min,
integration time of 1 s and cycle time of 5 s shows the effect of overlapping bursts.


