Embed Size (px)
Citation preview
Development of a New Stretch Nozzle for Air-Jet Looms
Pavel Peukert1,*, Josef Žák2 , and Norbert Pomp3
1VÚTS a.s., Department of Computations and Modelling, 460 01 Liberec, Czech Republic 2VÚTS a.s., Department of Weaving Technology, 460 01 Liberec, Czech Republic 3VÚTS a.s., Department of Measurements, 460 01 Liberec, Czech Republic
Abstract. The paper introduces a development of a new stretch nozzle for air-jet looms by support of numerical and experimental methods.
1 Introduction The root of the weaving technologies goes back to the early period of human history. During the centuries the loom designs evolved quite slowly. At the end of the 18th century the power loom was invented by Edmund Cartwright. It was a significant step in the powering and automatic operation. Since then there was a permanent need to increase the production of the looms.
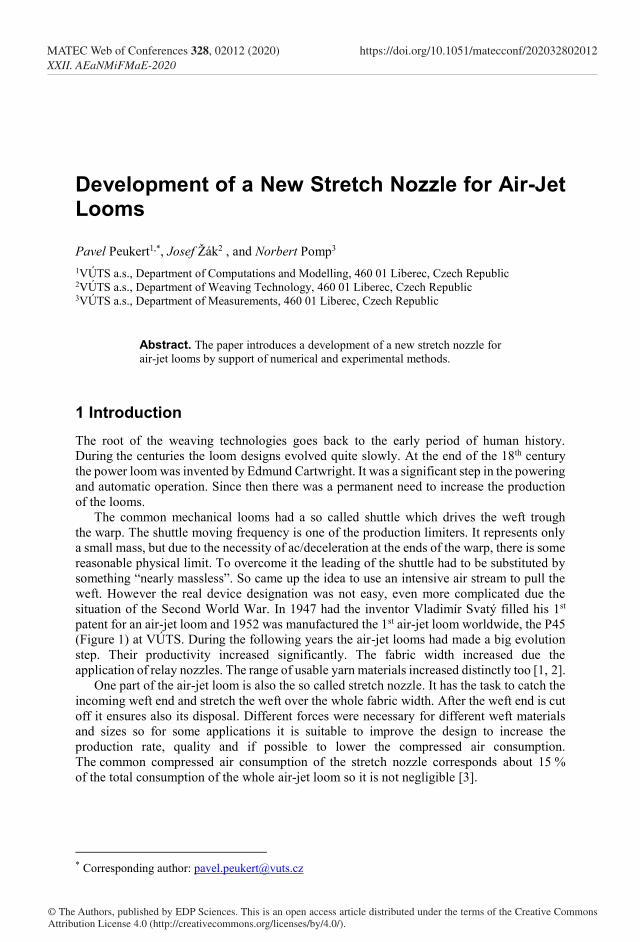
The common mechanical looms had a so called shuttle which drives the weft trough the warp. The shuttle moving frequency is one of the production limiters. It represents only a small mass, but due to the necessity of ac/deceleration at the ends of the warp, there is some reasonable physical limit. To overcome it the leading of the shuttle had to be substituted by something “nearly massless”. So came up the idea to use an intensive air stream to pull the weft. However the real device designation was not easy, even more complicated due the situation of the Second World War. In 1947 had the inventor Vladimír Svatý filled his 1st patent for an air-jet loom and 1952 was manufactured the 1st air-jet loom worldwide, the P45 (Figure 1) at VÚTS. During the following years the air-jet looms had made a big evolution step. Their productivity increased significantly. The fabric width increased due the application of relay nozzles. The range of usable yarn materials increased distinctly too [1, 2].
One part of the air-jet loom is also the so called stretch nozzle. It has the task to catch the incoming weft end and stretch the weft over the whole fabric width. After the weft end is cut off it ensures also its disposal. Different forces were necessary for different weft materials and sizes so for some applications it is suitable to improve the design to increase the production rate, quality and if possible to lower the compressed air consumption. The common compressed air consumption of the stretch nozzle corresponds about 15 % of the total consumption of the whole air-jet loom so it is not negligible [3].
* Corresponding author: [email protected]
© The Authors, published by EDP Sciences. This is an open access article distributed under the terms of the Creative Commons Attribution License 4.0 (http://creativecommons.org/licenses/by/4.0/).
MATEC Web of Conferences 328, 02012 (2020) https://doi.org/10.1051/matecconf/202032802012XXII. AEaNMiFMaE-2020
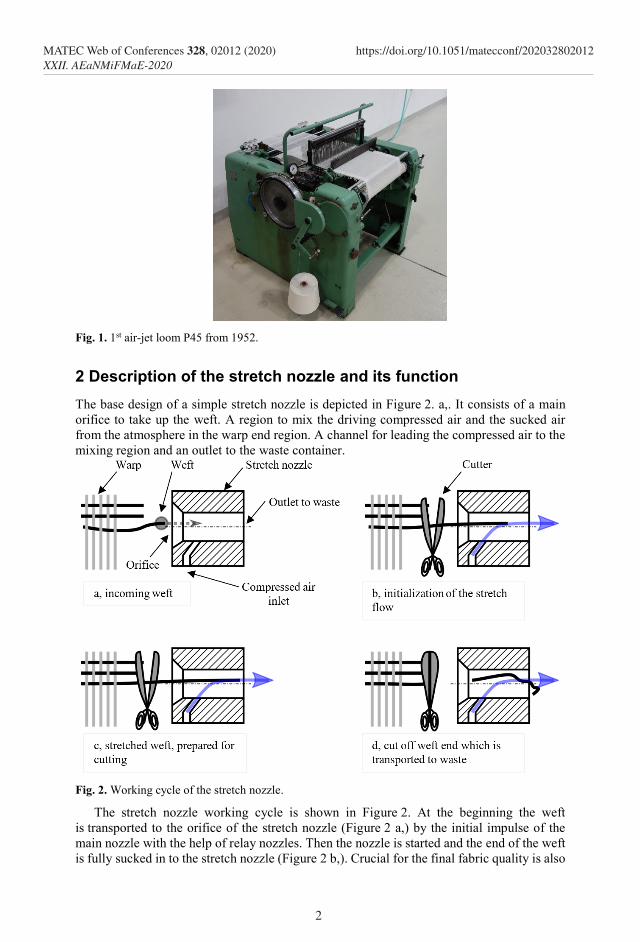
Fig. 1. 1st air-jet loom P45 from 1952.
2 Description of the stretch nozzle and its function The base design of a simple stretch nozzle is depicted in Figure 2. a,. It consists of a main orifice to take up the weft. A region to mix the driving compressed air and the sucked air from the atmosphere in the warp end region. A channel for leading the compressed air to the mixing region and an outlet to the waste container.
Fig. 2. Working cycle of the stretch nozzle.
The stretch nozzle working cycle is shown in Figure 2. At the beginning the weft is transported to the orifice of the stretch nozzle (Figure 2 a,) by the initial impulse of the main nozzle with the help of relay nozzles. Then the nozzle is started and the end of the weft is fully sucked in to the stretch nozzle (Figure 2 b,). Crucial for the final fabric quality is also
2
MATEC Web of Conferences 328, 02012 (2020) https://doi.org/10.1051/matecconf/202032802012XXII. AEaNMiFMaE-2020
Fig. 1. 1st air-jet loom P45 from 1952.
2 Description of the stretch nozzle and its function The base design of a simple stretch nozzle is depicted in Figure 2. a,. It consists of a main orifice to take up the weft. A region to mix the driving compressed air and the sucked air from the atmosphere in the warp end region. A channel for leading the compressed air to the mixing region and an outlet to the waste container.
Fig. 2. Working cycle of the stretch nozzle.
The stretch nozzle working cycle is shown in Figure 2. At the beginning the weft is transported to the orifice of the stretch nozzle (Figure 2 a,) by the initial impulse of the main nozzle with the help of relay nozzles. Then the nozzle is started and the end of the weft is fully sucked in to the stretch nozzle (Figure 2 b,). Crucial for the final fabric quality is also
the period where the weft is hold in a strained state before it is fixed (Figure 2 c,) and cut off. After the cut off (Figure 2 d,), the weft end is transported by the nozzle air to the waste container.
3 Numerical simulations For a new design evaluation of devices like the introduced stretch nozzle the numerical simulations represents today a common instrument in the design chain [4]. A complex fluid structure interaction (FSI) computation would be very admirable, but represent to high computational and preparatory requirements with questionable results. The FEM and CFD computations would also require very accurate descriptions of the yarn material and surface geometry description which would be hardly usable for a general yarn usage. So only a simple flow analysis trough the nozzle was performed.
The big challenge represents the flow field interpretation. The final influence on the yarn/weft was than only guessed. In reality there problem is very complex. The yarn movement in and just before the nozzle is influenced significantly by the flow, but how and also how the yarn influences the flow is highly dependent on the yarn properties, size and mass. To obtain credible verdicts, quasi static experiments and final test at the air-jet loom were performed on the new recommended designs from the numerical simulations.
Simulations were performed with the Ansys Fluent package. The actual and potentially new designs were computed. The flow was computed as steady, because for most of the time the nozzle works in a quasi-steady state. The compression ratio inside the computing domain was not negligible so the sufficient accurate ideal gas model for air was used. At the orifice and outlet was set atmospheric pressure, what is accurate enough. The driving pressure was set up to 3, 4 and 5 bar. The highest value corresponds to a common used value at actual design, but it was suitable to see how lower inlet pressures will influence the flow to. The k-omega SST turbulence model was used, which is and today a standard model for a wide range of turbulent flows [5].
Due to the uneven flow along the short nozzle it was not objectively possible to quantify near no variables, which would represent the force on the weft. A small exception represent the flow rates. A higher total flow rate represents higher velocities and should correspond to an increased stretch force on the yarn. But due to the real flow “shape” the real stretch force values could significantly variate. Another important parameter is the ration between driving and driven air which informs about the efficiency.
For the evaluation of the nozzle behavior were mostly used stream lines and velocity pressure fields. Figure 3 shows stream lines of one of the later tested design variants. There is obvious the high swirling flow character from the point where the two streams come together. This is given due to the connection angle of the driving air to the main channel. The high swirling probably would ensure good mixing of the two streams and a quite high stretch force. A possible negative effect could be a partial transfer of the swirling movement to the yarn/weft.
3
MATEC Web of Conferences 328, 02012 (2020) https://doi.org/10.1051/matecconf/202032802012XXII. AEaNMiFMaE-2020
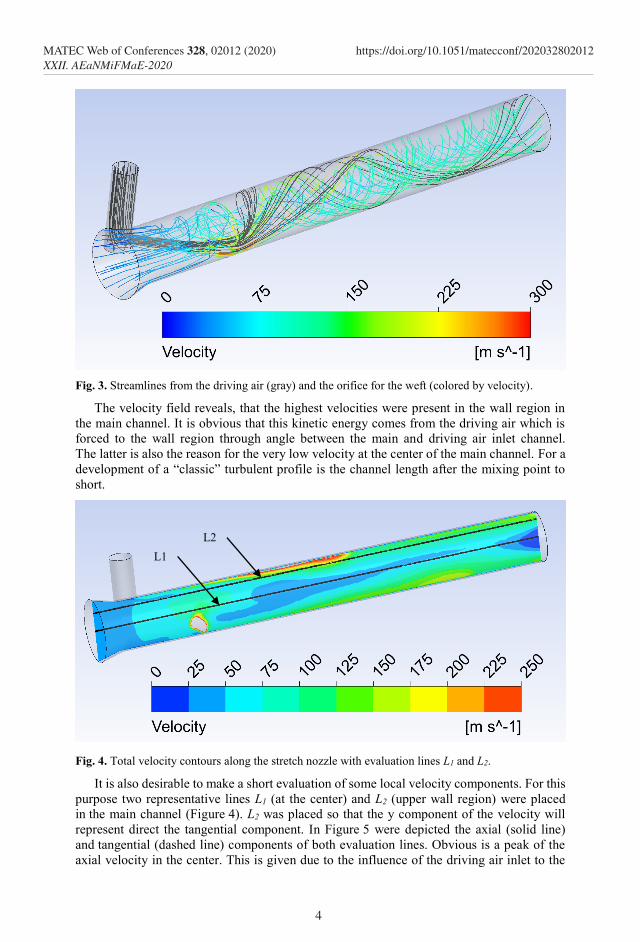
Fig. 3. Streamlines from the driving air (gray) and the orifice for the weft (colored by velocity).
The velocity field reveals, that the highest velocities were present in the wall region in the main channel. It is obvious that this kinetic energy comes from the driving air which is forced to the wall region through angle between the main and driving air inlet channel. The latter is also the reason for the very low velocity at the center of the main channel. For a development of a “classic” turbulent profile is the channel length after the mixing point to short.
Fig. 4. Total velocity contours along the stretch nozzle with evaluation lines L1 and L2.
It is also desirable to make a short evaluation of some local velocity components. For this purpose two representative lines L1 (at the center) and L2 (upper wall region) were placed in the main channel (Figure 4). L2 was placed so that the y component of the velocity will represent direct the tangential component. In Figure 5 were depicted the axial (solid line) and tangential (dashed line) components of both evaluation lines. Obvious is a peak of the axial velocity in the center. This is given due to the influence of the driving air inlet to the
L1 L21
4
MATEC Web of Conferences 328, 02012 (2020) https://doi.org/10.1051/matecconf/202032802012XXII. AEaNMiFMaE-2020
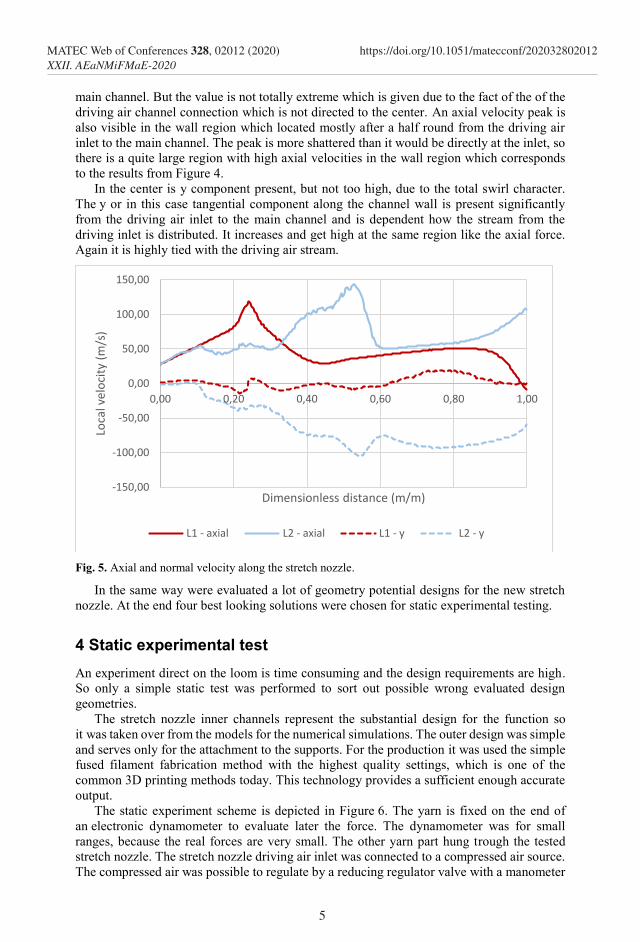
Fig. 3. Streamlines from the driving air (gray) and the orifice for the weft (colored by velocity).
The velocity field reveals, that the highest velocities were present in the wall region in the main channel. It is obvious that this kinetic energy comes from the driving air which is forced to the wall region through angle between the main and driving air inlet channel. The latter is also the reason for the very low velocity at the center of the main channel. For a development of a “classic” turbulent profile is the channel length after the mixing point to short.
Fig. 4. Total velocity contours along the stretch nozzle with evaluation lines L1 and L2.
It is also desirable to make a short evaluation of some local velocity components. For this purpose two representative lines L1 (at the center) and L2 (upper wall region) were placed in the main channel (Figure 4). L2 was placed so that the y component of the velocity will represent direct the tangential component. In Figure 5 were depicted the axial (solid line) and tangential (dashed line) components of both evaluation lines. Obvious is a peak of the axial velocity in the center. This is given due to the influence of the driving air inlet to the
L1 L21
main channel. But the value is not totally extreme which is given due to the fact of the of the driving air channel connection which is not directed to the center. An axial velocity peak is also visible in the wall region which located mostly after a half round from the driving air inlet to the main channel. The peak is more shattered than it would be directly at the inlet, so there is a quite large region with high axial velocities in the wall region which corresponds to the results from Figure 4.
In the center is y component present, but not too high, due to the total swirl character. The y or in this case tangential component along the channel wall is present significantly from the driving air inlet to the main channel and is dependent how the stream from the driving inlet is distributed. It increases and get high at the same region like the axial force. Again it is highly tied with the driving air stream.
Fig. 5. Axial and normal velocity along the stretch nozzle.
In the same way were evaluated a lot of geometry potential designs for the new stretch nozzle. At the end four best looking solutions were chosen for static experimental testing.
4 Static experimental test An experiment direct on the loom is time consuming and the design requirements are high. So only a simple static test was performed to sort out possible wrong evaluated design geometries.
The stretch nozzle inner channels represent the substantial design for the function so it was taken over from the models for the numerical simulations. The outer design was simple and serves only for the attachment to the supports. For the production it was used the simple fused filament fabrication method with the highest quality settings, which is one of the common 3D printing methods today. This technology provides a sufficient enough accurate output.
The static experiment scheme is depicted in Figure 6. The yarn is fixed on the end of an electronic dynamometer to evaluate later the force. The dynamometer was for small ranges, because the real forces are very small. The other yarn part hung trough the tested stretch nozzle. The stretch nozzle driving air inlet was connected to a compressed air source. The compressed air was possible to regulate by a reducing regulator valve with a manometer
5
MATEC Web of Conferences 328, 02012 (2020) https://doi.org/10.1051/matecconf/202032802012XXII. AEaNMiFMaE-2020
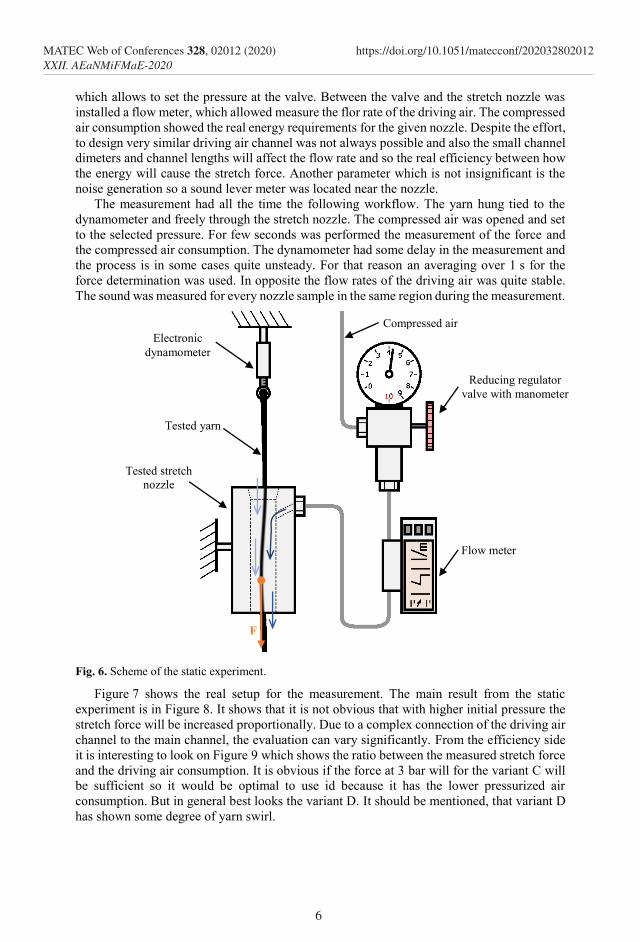
which allows to set the pressure at the valve. Between the valve and the stretch nozzle was installed a flow meter, which allowed measure the flor rate of the driving air. The compressed air consumption showed the real energy requirements for the given nozzle. Despite the effort, to design very similar driving air channel was not always possible and also the small channel dimeters and channel lengths will affect the flow rate and so the real efficiency between how the energy will cause the stretch force. Another parameter which is not insignificant is the noise generation so a sound lever meter was located near the nozzle.
The measurement had all the time the following workflow. The yarn hung tied to the dynamometer and freely through the stretch nozzle. The compressed air was opened and set to the selected pressure. For few seconds was performed the measurement of the force and the compressed air consumption. The dynamometer had some delay in the measurement and the process is in some cases quite unsteady. For that reason an averaging over 1 s for the force determination was used. In opposite the flow rates of the driving air was quite stable. The sound was measured for every nozzle sample in the same region during the measurement.
Fig. 6. Scheme of the static experiment.
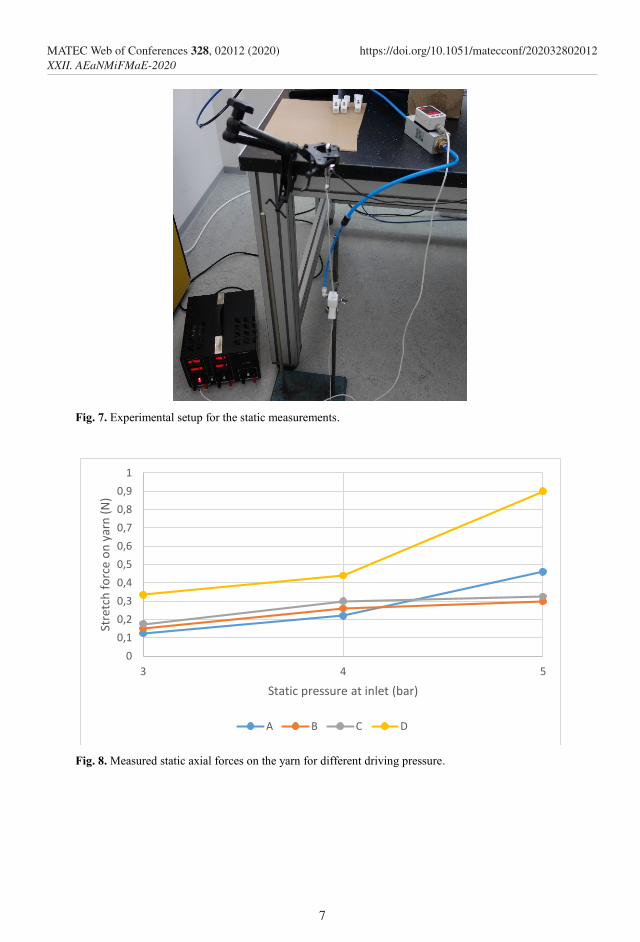
Figure 7 shows the real setup for the measurement. The main result from the static experiment is in Figure 8. It shows that it is not obvious that with higher initial pressure the stretch force will be increased proportionally. Due to a complex connection of the driving air channel to the main channel, the evaluation can vary significantly. From the efficiency side it is interesting to look on Figure 9 which shows the ratio between the measured stretch force and the driving air consumption. It is obvious if the force at 3 bar will for the variant C will be sufficient so it would be optimal to use id because it has the lower pressurized air consumption. But in general best looks the variant D. It should be mentioned, that variant D has shown some degree of yarn swirl.
Tested stretch nozzle
Flow meter
Reducing regulator valve with manometer
Electronic dynamometer
Tested yarn
F
Compressed air
6
MATEC Web of Conferences 328, 02012 (2020) https://doi.org/10.1051/matecconf/202032802012XXII. AEaNMiFMaE-2020
which allows to set the pressure at the valve. Between the valve and the stretch nozzle was installed a flow meter, which allowed measure the flor rate of the driving air. The compressed air consumption showed the real energy requirements for the given nozzle. Despite the effort, to design very similar driving air channel was not always possible and also the small channel dimeters and channel lengths will affect the flow rate and so the real efficiency between how the energy will cause the stretch force. Another parameter which is not insignificant is the noise generation so a sound lever meter was located near the nozzle.
The measurement had all the time the following workflow. The yarn hung tied to the dynamometer and freely through the stretch nozzle. The compressed air was opened and set to the selected pressure. For few seconds was performed the measurement of the force and the compressed air consumption. The dynamometer had some delay in the measurement and the process is in some cases quite unsteady. For that reason an averaging over 1 s for the force determination was used. In opposite the flow rates of the driving air was quite stable. The sound was measured for every nozzle sample in the same region during the measurement.
Fig. 6. Scheme of the static experiment.
Figure 7 shows the real setup for the measurement. The main result from the static experiment is in Figure 8. It shows that it is not obvious that with higher initial pressure the stretch force will be increased proportionally. Due to a complex connection of the driving air channel to the main channel, the evaluation can vary significantly. From the efficiency side it is interesting to look on Figure 9 which shows the ratio between the measured stretch force and the driving air consumption. It is obvious if the force at 3 bar will for the variant C will be sufficient so it would be optimal to use id because it has the lower pressurized air consumption. But in general best looks the variant D. It should be mentioned, that variant D has shown some degree of yarn swirl.
Tested stretch nozzle
Flow meter
Reducing regulator valve with manometer
Electronic dynamometer
Tested yarn
F
Compressed air
Fig. 7. Experimental setup for the static measurements.
Fig. 8. Measured static axial forces on the yarn for different driving pressure.
7
MATEC Web of Conferences 328, 02012 (2020) https://doi.org/10.1051/matecconf/202032802012XXII. AEaNMiFMaE-2020
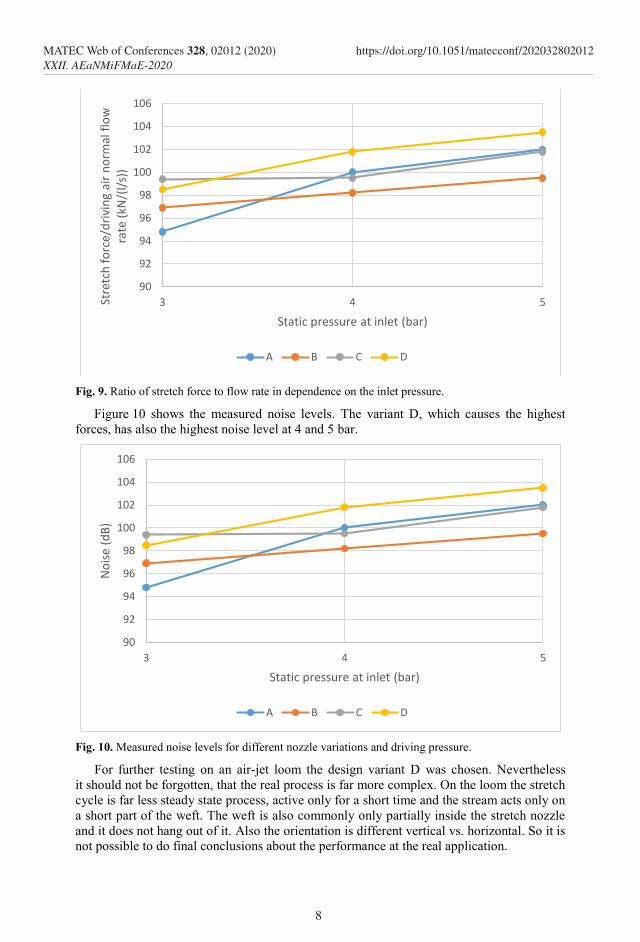
Fig. 9. Ratio of stretch force to flow rate in dependence on the inlet pressure.
Figure 10 shows the measured noise levels. The variant D, which causes the highest forces, has also the highest noise level at 4 and 5 bar.
Fig. 10. Measured noise levels for different nozzle variations and driving pressure.
For further testing on an air-jet loom the design variant D was chosen. Nevertheless it should not be forgotten, that the real process is far more complex. On the loom the stretch cycle is far less steady state process, active only for a short time and the stream acts only on a short part of the weft. The weft is also commonly only partially inside the stretch nozzle and it does not hang out of it. Also the orientation is different vertical vs. horizontal. So it is not possible to do final conclusions about the performance at the real application.
8
MATEC Web of Conferences 328, 02012 (2020) https://doi.org/10.1051/matecconf/202032802012XXII. AEaNMiFMaE-2020
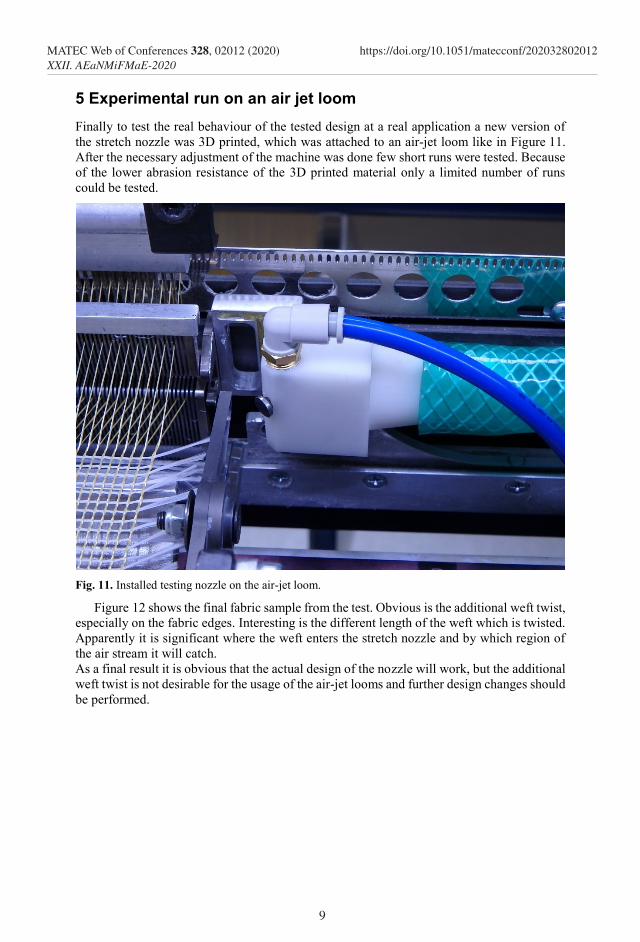
Fig. 9. Ratio of stretch force to flow rate in dependence on the inlet pressure.
Figure 10 shows the measured noise levels. The variant D, which causes the highest forces, has also the highest noise level at 4 and 5 bar.
Fig. 10. Measured noise levels for different nozzle variations and driving pressure.
For further testing on an air-jet loom the design variant D was chosen. Nevertheless it should not be forgotten, that the real process is far more complex. On the loom the stretch cycle is far less steady state process, active only for a short time and the stream acts only on a short part of the weft. The weft is also commonly only partially inside the stretch nozzle and it does not hang out of it. Also the orientation is different vertical vs. horizontal. So it is not possible to do final conclusions about the performance at the real application.
5 Experimental run on an air jet loom Finally to test the real behaviour of the tested design at a real application a new version of the stretch nozzle was 3D printed, which was attached to an air-jet loom like in Figure 11. After the necessary adjustment of the machine was done few short runs were tested. Because of the lower abrasion resistance of the 3D printed material only a limited number of runs could be tested.
Fig. 11. Installed testing nozzle on the air-jet loom.
Figure 12 shows the final fabric sample from the test. Obvious is the additional weft twist, especially on the fabric edges. Interesting is the different length of the weft which is twisted. Apparently it is significant where the weft enters the stretch nozzle and by which region of the air stream it will catch. As a final result it is obvious that the actual design of the nozzle will work, but the additional weft twist is not desirable for the usage of the air-jet looms and further design changes should be performed.
9
MATEC Web of Conferences 328, 02012 (2020) https://doi.org/10.1051/matecconf/202032802012XXII. AEaNMiFMaE-2020
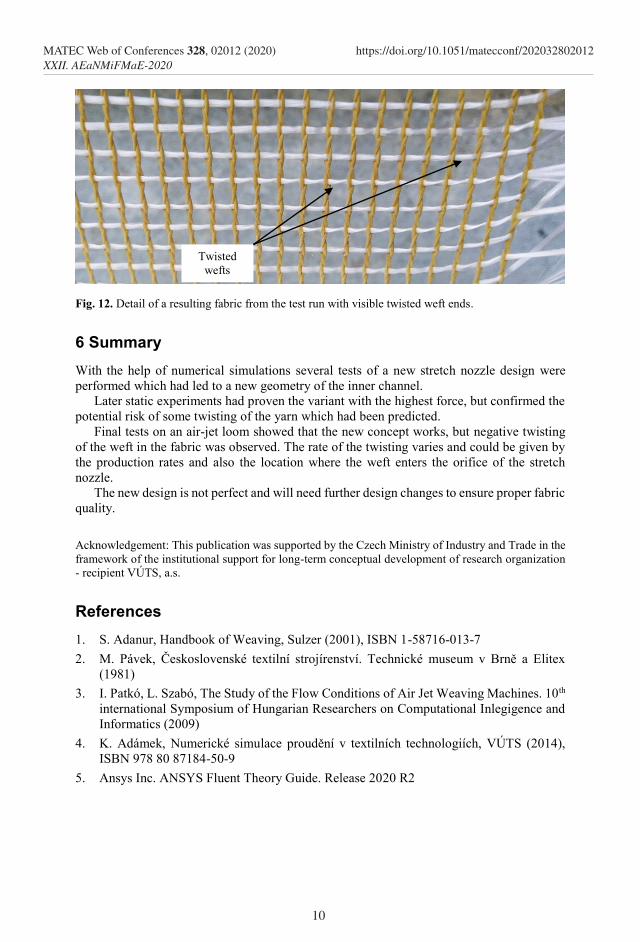
Fig. 12. Detail of a resulting fabric from the test run with visible twisted weft ends.
6 Summary With the help of numerical simulations several tests of a new stretch nozzle design were performed which had led to a new geometry of the inner channel.
Later static experiments had proven the variant with the highest force, but confirmed the potential risk of some twisting of the yarn which had been predicted.
Final tests on an air-jet loom showed that the new concept works, but negative twisting of the weft in the fabric was observed. The rate of the twisting varies and could be given by the production rates and also the location where the weft enters the orifice of the stretch nozzle.
The new design is not perfect and will need further design changes to ensure proper fabric quality.
Acknowledgement: This publication was supported by the Czech Ministry of Industry and Trade in the framework of the institutional support for long-term conceptual development of research organization - recipient VÚTS, a.s.
References 1. S. Adanur, Handbook of Weaving, Sulzer (2001), ISBN 1-58716-013-7 2. M. Pávek, Československé textilní strojírenství. Technické museum v Brně a Elitex
(1981) 3. I. Patkó, L. Szabó, The Study of the Flow Conditions of Air Jet Weaving Machines. 10th
international Symposium of Hungarian Researchers on Computational Inlegigence and Informatics (2009)
4. K. Adámek, Numerické simulace proudění v textilních technologiích, VÚTS (2014), ISBN 978 80 87184-50-9
5. Ansys Inc. ANSYS Fluent Theory Guide. Release 2020 R2
Twisted wefts
10
MATEC Web of Conferences 328, 02012 (2020) https://doi.org/10.1051/matecconf/202032802012XXII. AEaNMiFMaE-2020