Embed Size (px)
Citation preview
This article appeared in a journal published by Elsevier. The attachedcopy is furnished to the author for internal non-commercial researchand education use, including for instruction at the authors institution
and sharing with colleagues.
Other uses, including reproduction and distribution, or selling orlicensing copies, or posting to personal, institutional or third party
websites are prohibited.
In most cases authors are permitted to post their version of thearticle (e.g. in Word or Tex form) to their personal website orinstitutional repository. Authors requiring further information
regarding Elsevier’s archiving and manuscript policies areencouraged to visit:
http://www.elsevier.com/authorsrights
Author's personal copy
Journal of Pharmaceutical and Biomedical Analysis 91 (2014) 73– 80
Contents lists available at ScienceDirect
Journal of Pharmaceutical and Biomedical Analysis
jou rn al hom e page: www.elsev ier .com/ locate / jpba
Development of a validated UPLC method for simultaneousestimation of both free and entrapped (in solid lipid nanoparticles)all-trans retinoic acid and cholecalciferol (vitamin D3) and itspharmacokinetic applicability in rats
Manoj Kumara, Gaurav Sharmaa, Dinesh Singlab, Sukhjeet Singhb, Sudhir Sahwneyb,Anurag S. Chauhanb, Gagandeep Singhb, Indu Pal Kaura,∗
a Department of Pharmaceutics, University Institute of Pharmaceutical Sciences, Panjab University, Chandigarh 160014, Indiab Panacea Biotec Ltd, Lalru, Punjab 140501, India
a r t i c l e i n f o
Article history:Received 20 August 2013Received in revised form30 November 2013Accepted 12 December 2013Available online 24 December 2013
Keywords:UPLCATRACholecalciferolPlasmaSolid lipid nanoparticles
a b s t r a c t
A sensitive ultra-performance liquid chromatography (UPLC) method was developed for simultaneousestimation of all-trans retinoic acid (ATRA) and cholecalciferol (vitamin D3) in rat plasma. The methodwas validated over the linear range of 1.0–5000 ng/ml (r2 = 0.999) for both vitamins with a limit of detec-tion of 0.5 ng/ml. Chromatographic separation was achieved using liquid–liquid extraction (LLE) on anAcquity BEH RP 18 column (2.1 mm × 50 mm, I.D. 1.7 �m), with mobile phase comprising of acetoni-trile:methanol:water (90:8:2, v/v/v), at a flow rate of 0.20 ml/min and a total run time of 5 min. Intraand inter-day variability (RSD) was ≤3.1%, and the accuracy varied between 95.4–99.9% and 95.3–101.1%respectively, for ATRA and 98.5–100.8% and 99.3–101.7%, respectively for vitamin D3. High recoveryof ≥96.0% for ATRA and ≥87.80% for vitamin D3 was achieved. ATRA and vitamin D3 were stable inplasma under different storage and processing conditions. The method was applied to estimate the totaldrug content and entrapment efficiency of ATRA and vitamin D3 loaded solid lipid nanoparticles (SLNs).Concentration of these two agents was determined in rat plasma after simultaneous subcutaneous admin-istration in free form or when loaded into SLNs thus establishing pharmacokinetic application of thedeveloped procedure. Results indicated an improvement in AUC0–∞ by 5.4 times and 29.4 times for ATRAand vitamin D3, respectively, upon their incorporation into SLNs. Simultaneous administration of thesetwo vitamins and their improved and prolonged bioavailability has scope for their use in treatment andcontrol of tuberculosis.
© 2014 Elsevier B.V. All rights reserved.
1. Introduction
Administration of vitamins especially all-trans retinoic acid(ATRA) and cholecalciferol (vitamin D3) has been considered ben-eficial for the treatment of tuberculosis [1]. ATRA increases theresistance of cultured human macrophages to infection by viru-lent strains of M. tuberculosis [2] while tuberculosis patients arereported to be deficient in vitamin D3 [3,4].
ATRA acts synergistically with vitamin D3 to inhibit Mycobac-terium entry as well as survival within macrophages, possiblythrough the rescue of phagosome maturation arrest [5]. AsMycobacterium is highly resistant and can also shift strains, treat-ment with antitubercular drugs may fail at times, whilst the host
∗ Corresponding author: Professor of Pharmaceutics. Tel.: +91 172 2534191;fax: +91 172 2543101.
E-mail address: [email protected] (I.P. Kaur).
mediated macrophage directed pathway observed with ATRA andvitamin D3 can be a gunshot treatment for tuberculosis.
Development of a suitable analytical method for precise deter-mination of ATRA and vitamin D3 in plasma is a challenge dueto their high affinity for proteins [6]. The latter complementedwith their poor bioavailability results in untraceable concentra-tions, post administration of high and repetitive doses of bothATRA and vitamin D3. Various methods based on the use of pro-tein based assays or high pressure liquid chromatography havebeen reported for the determination of these vitamins in humanfluids. Most of these methods involve tedious extraction proce-dures, gradient flow, long elution times and often a purificationstep prior to their estimation [7–11]. Moreover several of thesemethods utilize solid phase extraction processes [12,13] involv-ing high processing cost. Furthermore there are limited reports onthe simultaneous quantification of ATRA and vitamin D3 in plasma.Qian and Sheng [14] demonstrated an optimized HPLC method forsimultaneous determination of vitamin A, D and mixture of other
0731-7085/$ – see front matter © 2014 Elsevier B.V. All rights reserved.http://dx.doi.org/10.1016/j.jpba.2013.12.011
Author's personal copy
74 M. Kumar et al. / Journal of Pharmaceutical and Biomedical Analysis 91 (2014) 73– 80
vitamins in the animal feed. A rapid and quantitative determina-tion of fat soluble vitamins [15] is also reported, however the reportdid not include the estimation of vitamin D3. Quantification of reti-nal, retinol and retinyl esters in serum and tissues using gradientelution by HPLC/UV is also reported, but with a retention time ofmore than 20 min, thus making the process time consuming andalso expensive in terms of large volumes of solvents used [16].
The present paper elaborates on a sensitive, reproducible andaccurate ultra-performance liquid chromatography (UPLC) methodinvolving liquid–liquid extraction (LLE) for simultaneous determi-nation of ATRA and vitamin D3 in plasma. The method was alsoapplied to determine total drug content (TDC) and % entrapmentefficiency (EE) of ATRA and vitamin D3 loaded solid lipid nanopar-ticles (SLNs). ATRA and vitamin D3 were incorporated into SLNsto enhance their bioavailability by presenting them as an aque-ous dispersion with high permeability and long circulation timesin addition to protecting them against photodegradation and oxida-tive degradation. Improved stability, including photostability, andpharmacokinetic performance of these vitamin loaded SLNs wasconfirmed presently.
2. Materials and methods
2.1. Reagents
All-trans retinoic acid (ATRA) (purity: 99.80%; 1 mg = 3333.3 IU)was purchased from Sigma Aldrich, India Ltd. and cholecalciferol(vitamin D3) (purity: 99.90%; 1 mg = 40,000 IU) was obtained asa generous gift from Fermenta Biotech, Kullu, Himachal Pradesh,India. Soy lecithin (Hi Media, India), Tween 80 (S.D. Fine Chemi-cals Ltd., India), and Compritol® 888 ATO (Glyceryl behenate, giftsample from Gattefosse, USA) were used for preparing SLNs in thestudy. HPLC grade acetonitrile and methanol, used in the prepara-tion of mobile phase were purchased from Merck KGaA, Darmstadt,Germany. All other chemicals and reagents were of analytical gradeand were used without further purification.
2.2. UPLC analysis
Measurement of ATRA and vitamin D3 was achieved using UPLC(Acquity, Waters Corp., U.S.) with an Acquity UPLC BEH RP18 col-umn (2.1 mm × 50 mm, 1.7 �m), maintained at 35 ◦C. The mobilephase comprised of a mixture of acetonitrile:methanol:water(90:8:2%, v/v/v) at a flow rate of 0.20 ml/min. Complete separationof peaks for both the vitamins was achieved within a run time of5 min.
The column was washed with acetonitrile for 2 min at0.50 ml/min and re-equilibrated with the mobile phase for 1 minbefore injecting the samples. The eluant was monitored at 351 nmand 265 nm for ATRA and vitamin D3, respectively, using an AcquityUV detector (Waters Corp.).
2.3. Animals
Wistar male rats weighing 200–300 g were used for the study.Animals were acclimatized to laboratory conditions for a weekbefore the start of the experiment. The protocol was duly approvedby the Institutional Animal Ethics Committee (IAEC) of Panjab Uni-versity, Chandigarh, India (letter No. CAH/131 dated 09.08.2010).For the validation protocol, blank plasma samples were used. Bloodwas withdrawn, from retro-orbital plexus of naïve rats (n = 10),transferred into heparinised vials and centrifuged at 1677 × g for10 min to obtain clear plasma which was distributed in plastictubes, sealed tightly and stored frozen at a temperature of −20 ◦C,till analysis.
Pharmacokinetic studies for simultaneous estimation of ATRAand vitamin D3 in rat plasma after subcutaneous administrationeither as free solution or after loading into SLNs were conducted ina group of 5 rats each.
2.4. Stock solutions
Concentrated stock solutions of ATRA and vitamin D3 wereprepared by dissolving 10.0 mg of each in 100 ml of chloro-form:methanol (1:1) v/v (solvent I) and methanol (solvent II) togive stock solutions containing 100 �g of each vitamin per ml ofrespective solvent. Solvent I was used subsequently for the estima-tion of total drug content and entrapment efficiency of the preparedSLNs while methanol was employed for pharmacokinetic studies inrat plasma.
2.5. Preparation of calibration curve (CC) in chloroform:methanol(1:1)
A nine point CC was prepared by adding 0.45 ml of chloro-form:methanol (1:1 v/v) to 25 �l each of the appropriate workingdilution of ATRA and vitamin D3, respectively, to result in the finalconcentrations of 1, 5, 25, 50, 100, 250, 500, 1000 and 5000 ng ofeach vitamin/ml. A plot for the resulting peak area for each vitaminagainst respective concentrations was plotted.
2.6. Preparation of the CC in plasma and quality control (QC)samples
A nine point CC was prepared as explained above by spiking0.45 ml of blank plasma with 25 �l each of the appropriate workingdilution of ATRA and vitamin D3 in methanol.
High quality control (HQC: 4000 ng/ml), medium quality con-trol (MQC: 2000 ng/ml) and low quality control (LQC: 75 ng/ml)samples were also prepared similarly. All solutions were stored inthe refrigerator at 5.0 ± 3.0 ◦C. The bulk spiked CC and QC plasmasamples were stored at −20 ◦C.
2.7. Plasma sample preparation
The vitamins were extracted from rat plasma samples by LLEin a polypropylene tube. To the above spiked plasma samples(Section 2.6) and the blank rat plasma samples, 400 �l of chilledmethanol and 2 ml of n-hexane:ethyl acetate (1:1) was addedand vortexed for 1 min. Resulting mixture was kept at −20 ◦C for5 min and cold centrifuged at 1677 × g for 10 min. Supernatant wasdecanted and another 2 ml of n-hexane:ethyl acetate (1:1) wasadded to the pellet, followed by vortexing (1 min) and extraction, asabove, to achieve complete recovery of these vitamins. Combinedsupernatants were dried by purging nitrogen gas through them(Turbovap, Biotage India). Utmost care was taken to perform thesesteps in dim light, complemented with the use of amber coloredcontainers or containers covered with aluminium foil to mini-mize light exposure. Dry samples were reconstituted with 250 �lof acetonitrile, transferred to amber colored autoinjector vial andanalyzed using UPLC (injected volume = 4 �l).
2.8. Method validation
2.8.1. System suitabilitySystem suitability was performed by determining the AUC for
the MQC (without spiking into plasma) sample injected into theUPLC before the start of each analytical run and its comparisonwith the average AUC value obtained for the MQC, upon repetitiveinjections (n = 7).
Author's personal copy
M. Kumar et al. / Journal of Pharmaceutical and Biomedical Analysis 91 (2014) 73– 80 75
2.8.2. SpecificityBlank plasma samples and methanol (n = 6) were prepared
according to the sample preparation procedure described aboveand screened for the presence of any interfering peaks correspond-ing to the retention time of either ATRA or vitamin D3.
2.8.3. SensitivityThe limit of quantification (LOQ) was taken as the lowest con-
centration in the standard curve with accuracy between 80–120%and limit of detection (LOD) was determined at a signal to noiseratio (S/N) of 3.
2.8.4. RecoveryTo determine recovery, the LLE efficiency was calculated by
comparing the peak areas obtained after extracting plasma stan-dards with areas obtained for corresponding stock standards. Thestudy was accomplished at three concentration levels (75, 2000,and 4000 ng/ml) for both ATRA and vitamin D3 (n = 6).
2.8.5. Inter-day and intra-day precision and accuracyInter-day and intra-day precision and accuracy were evaluated
by spiking known amounts of ATRA and vitamin D3 in plasma. Theprecision was expressed as % CV (coefficient of variation) and %accuracy was expressed by using the formula: measured concen-tration/nominal concentration × 100.
Three different concentrations (LQC, MQC and HQC) were usedand samples were prepared as per the procedures described above.Inter-day precision and accuracy were assessed over a period of 3days using replicate (n = 6) determinations for the spiked plasmasample, whereas intra-day precision and accuracy were assessedon three separate occasions on the same day (n = 6) for each con-centration respectively.
2.9. Stability at various storage conditions
2.9.1. Processed sample stabilityIn assessing the processed sample stability, the LQC and HQC
samples were quantified 6 h after they were first analyzed (0 timereading). Samples were stored at room temperature during thisperiod.
2.9.2. Autoinjector stabilityThe processed replicates of LQC and HQC samples were stored
in the autoinjector at 4 ◦C after analysis and were re-injected after24 h. Stability of QC samples was determined in percentage by com-paring the peak area values at 24 h against the values obtained forthe same samples when injected fresh (zero time).
2.9.3. Long-term stabilityLong-term stability of LQC and HQC samples was determined
after storing these samples for 5 days at −20 ◦C. The QC sampleswere quantified against the readings of the same samples at zerotime.
2.10. Preparation of ATRA and vitamin D3 loaded SLNs
Lipid (glyceryl behenate; 7.27%, w/v) was melted at approx-imately 10 ◦C above its melting temperature i.e. 82–85 ◦C.Polysorbate 80 (45.45%, v/v), soy lecithin (0.58%, w/v), and waterwere placed together in a beaker and heated to the lipid melt tem-perature. ATRA/vitamin D3 was added to the lipid phase, followingwhich the hot aqueous emulsifier mix was dropped at once into thelipid melt, under magnetic stirring to obtain a clear microemulsion.The hot microemulsion thus formed, was transferred into an equiv-alent amount of cold water (∼2 ◦C) under continuous mechanical
stirring for 2 h [17,18], to result in the formation of SLNs by crys-tallization of the lipid droplets present in the micro-emulsion. Theprepared SLNs were stored in a refrigerator until further analysis.
Note: ATRA and vitamin D3 loaded SLNs were prepared sep-arately but administered simultaneously. Hence, a suitable UPLCmethod is developed for their simultaneous determination inplasma.
2.11. Characterization of SLNs
2.11.1. Transmission electron microscopy (TEM)Morphological parameters including sphericity and aggregation
of the prepared vitamin loaded SLN dispersions were examinedafter appropriate dilution with DDW (1:20). Samples were stainedwith 2% phosphotungstic acid (PTA) in water for 5 min, after whichthe excess PTA was removed. Stained samples were spread on acarbon coated copper grid and examined under TEM (H 100, HitachiLtd., Japan) at a voltage of 80 kV.
2.11.2. Evaluation of TDC and EETDC and EE of ATRA and vitamin D3 loaded SLNs were evaluated
using developed UPLC method.
2.11.2.1. Total drug content (TDC). Respective SLN dispersions(1 ml) was disrupted using an appropriate quantity of a mixtureof chloroform:methanol (1:1) till a clear solution was obtained. A4 �l sample of the diluted sample was injected into the UPLC todetermine the total drug content (n = 6).
2.11.2.2. Entrapment efficiency (EE). Respective SLN dispersionswere ultracentrifuged at 802,000 × g for 2 h at 4 ◦C. The clear super-natant was decanted and the pellet was disrupted and dissolved in amixture of chloroform:methanol (1:1, v/v), suitably diluted and 4 �lsamples injected into the UPLC (n = 6). Amount of drug in the pelletgave a direct measure of the extent of entrapment, while valuesobtained for the supernatant (after suitable dilution with chloro-form:methanol, 1:1, v/v) were used to match the mass balance asper the values obtained for the TDC.
Entrapment efficiency = Amount of entrapped drugTotal drug incorporated as per TDC
× 100
2.12. Stability of developed SLNs
ATRA-SLNs and vitamin D3-SLNs were stored in screw capped,tightly closed amber colored vials at 5 ± 3 ◦C for 1 year. Total drugcontent and the entrapment efficiency were determined at the endof 1 year.
2.12.1. Photostability studiesCool white fluorescent light was used to provide an overall illu-
mination of not less than 1.2 million lux hours and an integratednear ultraviolet energy of not less than 200 watt hours/square tothe free drug solutions and drug loaded SLNs for 10 days at 25 ◦C ina photostability chamber (Binder, Germany). TDC and EE (for SLNsonly) of the samples before and after exposure was measured usingthe developed UPLC method.
2.13. Pharmacokinetic studies
Pharmacokinetic studies were conducted after subcutaneousadministration of 20 mg/kg body weight of ATRA [19] and0.54 mg/kg of vitamin D3. Latter was determined on the basis ofreported [1] human oral dose of 2.5 mg × 2.5 mg (subcutaneousroute)/70 kg (for a 70 kg person) × 6 (factor for conversion to ratdose as per USFDA) = 2.5 × 2.5 × 6/70 = 0.54 mg/kg. Both ATRA and
Author's personal copy
76 M. Kumar et al. / Journal of Pharmaceutical and Biomedical Analysis 91 (2014) 73– 80
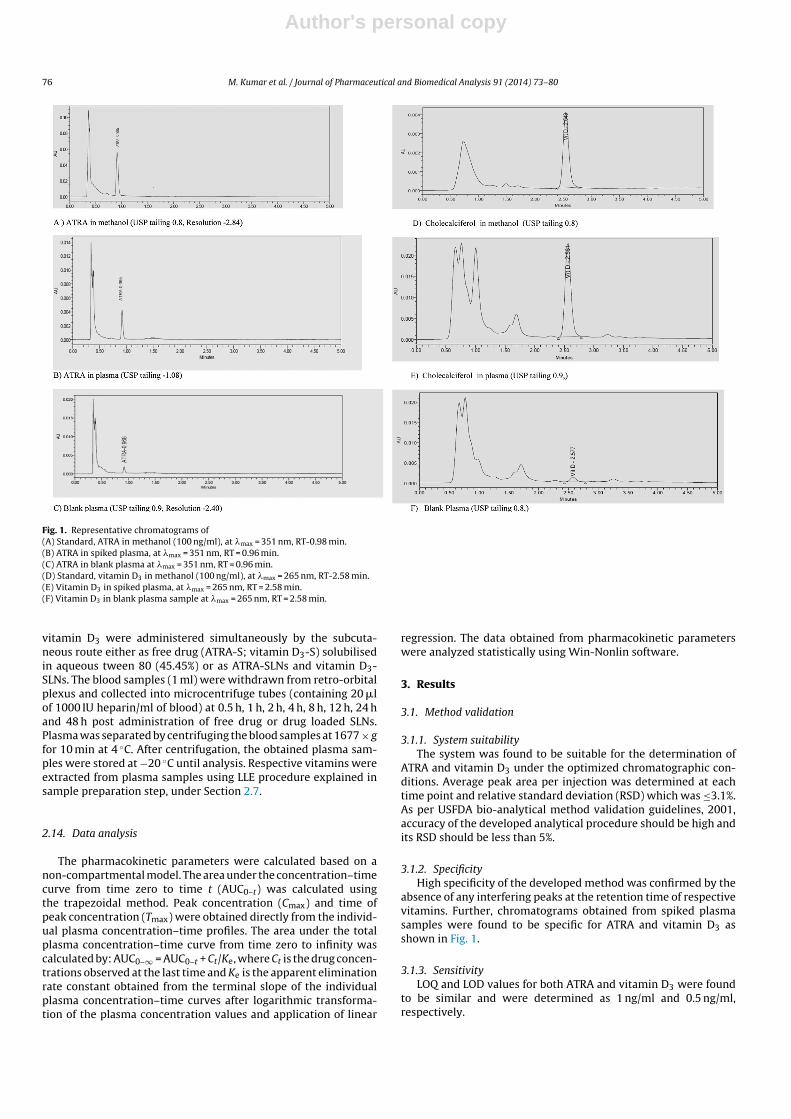
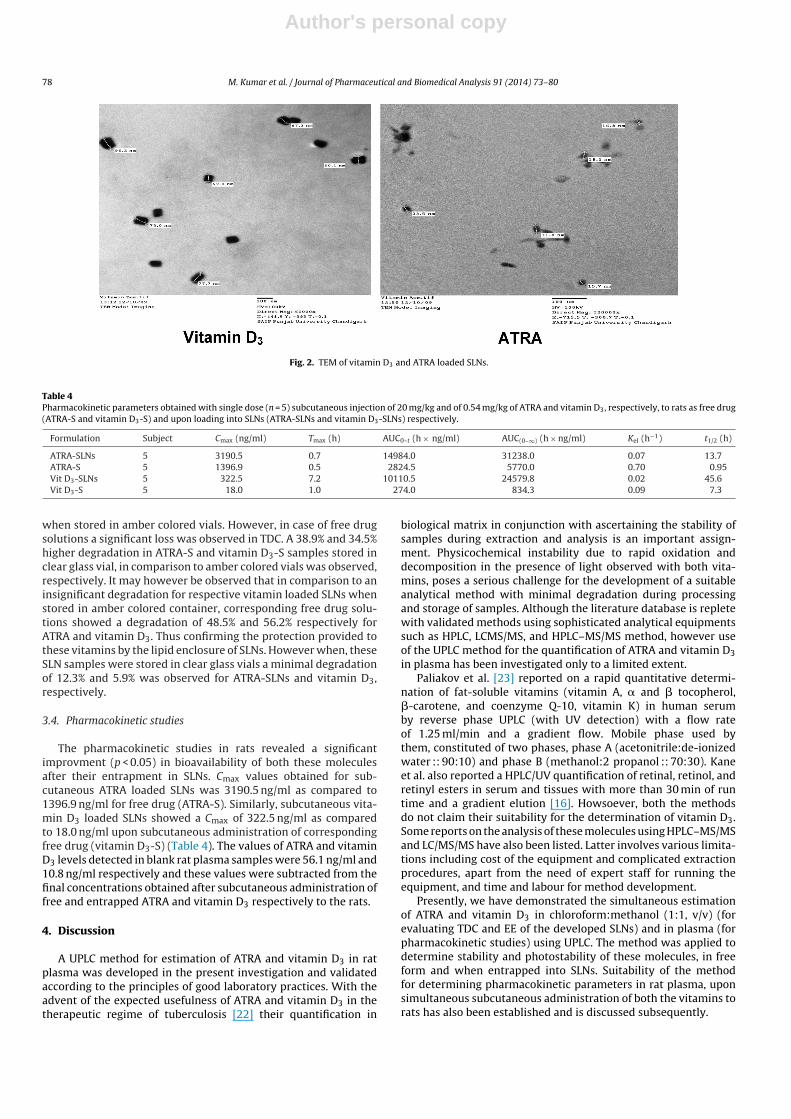
Fig. 1. Representative chromatograms of(A) Standard, ATRA in methanol (100 ng/ml), at �max = 351 nm, RT-0.98 min.(B) ATRA in spiked plasma, at �max = 351 nm, RT = 0.96 min.(C) ATRA in blank plasma at �max = 351 nm, RT = 0.96 min.(D) Standard, vitamin D3 in methanol (100 ng/ml), at �max = 265 nm, RT-2.58 min.(E) Vitamin D3 in spiked plasma, at �max = 265 nm, RT = 2.58 min.(F) Vitamin D3 in blank plasma sample at �max = 265 nm, RT = 2.58 min.
vitamin D3 were administered simultaneously by the subcuta-neous route either as free drug (ATRA-S; vitamin D3-S) solubilisedin aqueous tween 80 (45.45%) or as ATRA-SLNs and vitamin D3-SLNs. The blood samples (1 ml) were withdrawn from retro-orbitalplexus and collected into microcentrifuge tubes (containing 20 �lof 1000 IU heparin/ml of blood) at 0.5 h, 1 h, 2 h, 4 h, 8 h, 12 h, 24 hand 48 h post administration of free drug or drug loaded SLNs.Plasma was separated by centrifuging the blood samples at 1677 × gfor 10 min at 4 ◦C. After centrifugation, the obtained plasma sam-ples were stored at −20 ◦C until analysis. Respective vitamins wereextracted from plasma samples using LLE procedure explained insample preparation step, under Section 2.7.
2.14. Data analysis
The pharmacokinetic parameters were calculated based on anon-compartmental model. The area under the concentration–timecurve from time zero to time t (AUC0–t) was calculated usingthe trapezoidal method. Peak concentration (Cmax) and time ofpeak concentration (Tmax) were obtained directly from the individ-ual plasma concentration–time profiles. The area under the totalplasma concentration–time curve from time zero to infinity wascalculated by: AUC0–∞ = AUC0–t + Ct/Ke, where Ct is the drug concen-trations observed at the last time and Ke is the apparent eliminationrate constant obtained from the terminal slope of the individualplasma concentration–time curves after logarithmic transforma-tion of the plasma concentration values and application of linear
regression. The data obtained from pharmacokinetic parameterswere analyzed statistically using Win-Nonlin software.
3. Results
3.1. Method validation
3.1.1. System suitabilityThe system was found to be suitable for the determination of
ATRA and vitamin D3 under the optimized chromatographic con-ditions. Average peak area per injection was determined at eachtime point and relative standard deviation (RSD) which was ≤3.1%.As per USFDA bio-analytical method validation guidelines, 2001,accuracy of the developed analytical procedure should be high andits RSD should be less than 5%.
3.1.2. SpecificityHigh specificity of the developed method was confirmed by the
absence of any interfering peaks at the retention time of respectivevitamins. Further, chromatograms obtained from spiked plasmasamples were found to be specific for ATRA and vitamin D3 asshown in Fig. 1.
3.1.3. SensitivityLOQ and LOD values for both ATRA and vitamin D3 were found
to be similar and were determined as 1 ng/ml and 0.5 ng/ml,respectively.
Author's personal copy
M. Kumar et al. / Journal of Pharmaceutical and Biomedical Analysis 91 (2014) 73– 80 77
Table 1Intra-day and inter-day precision and accuracy of ATRA and vitamin D3 in rat plasma.
Nominal concentration (ng/ml) Observed concentrations (ng/ml) % Precision % Accuracy
ATRA Vitamin D3 ATRA Vitamin D3 ATRA Vitamin D3
Intra-day (n = 6)LQC (75) 71.6 ± 1.8 73.9 ± 2.3 2.5 3.1 95.4 98.5MQC (2000) 1999.7 ± 14.9 2012.3 ± 16.5 0.7 0.8 99.9 100.6HQC (4000) 3990.4 ± 21.3 4035.7 ± 25.1 0.5 0.6 99.8 100.8
Inter-day (n = 6)LQC (75) 71.5 ± 1.5 74.4 ± 2.1 2.1 2.8 95.3 99.3MQC (2000) 1952.9 ± 11.9 2034.2 ± 15.7 0.6 0.7 97.6 101.7HQC (4000) 4046.4 ± 24.5 3996.2 ± 27.7 0.6 0.6 101.1 99.9
Table 2Stability of ATRA and vitamin D3 under various storage conditions (n = 6).
Parameters LQC (75 ng/ml) HQC (4000 ng/ml)
% Accuracy % Accuracy
ATRA Vitamin D3 ATRA Vitamin D3
Long term solution stability at −20 ◦C for 5 days 98.6 ± 1.4 94.5 ± 2.1 99.5 ± 1.6 90.4 ± 1.1Processed sample stability for 6 h 103.9 ± 2.4 97.6 ± 2.0 106.1 ± 1.8 102.1 ± 1.5Autosampler stability for 24 h 96.5 ± 1.4 112.0 ± 1.2 95.4 ± 2.8 107.5 ± 1.6
3.1.4. RecoveryRecovery (n = 6) for ATRA was found to be 96.5 ± 1.4%,
98.1 ± 1.1% and 96.0 ± 2.4% for LQC, MQC, HQC samples, respec-tively. Similarly high recovery of 89.4 ± 1.8%, 88.9 ± 2.3% and87.8 ± 2.1% respectively, was observed for LQC, MQC and HQC sam-ples of vitamin D3.
3.1.5. Intra- day and inter-day precision and accuracyThe intra-day accuracy for ATRA was found to between the
95.4–99.9% and for vitamin D3 it was in the range of 98.5–100.8% inrat plasma samples with RSD less than 2.5% and 3.1%, respectively,for the QC samples.
The inter-day accuracy of ATRA and vitamin D3 in rat plasmasamples ranged from 95.3% to 101.1% and 99.3 to 101.7% respec-tively for the QC samples with RSD value less than 2.1% and 2.8%,respectively (Table 1), confirming high precision of the developedmethod.
3.1.6. LinearityThe calibration curve for both the vitamins were found to be
linear (r2 = 0.999) in chloroform:methanol (1:1, v/v) and in plasmaat the concentration range of 1–5000 ng/ml.
3.2. Stability at various storage conditions
Methanolic solutions of ATRA and vitamin D3 were found to bestable for up to 5 days at −20 ◦C, with their mean % stability rangingbetween 98.6–99.5% and 94.5–90.4% respectively. The acceptancecriterion for % accuracy for stability samples is ±15%, thus the valuesare sufficiently with in the limits. Solutions of both the agents wereagain found to be stable (Table 2) for up to 24 h in the autosampler at4 ◦C and room temperature for 6 h, as per the acceptance criteria ofUSFDA bio-analytical method validation guidelines, 2001 (Table 2).
3.3. Characterization of SLNs
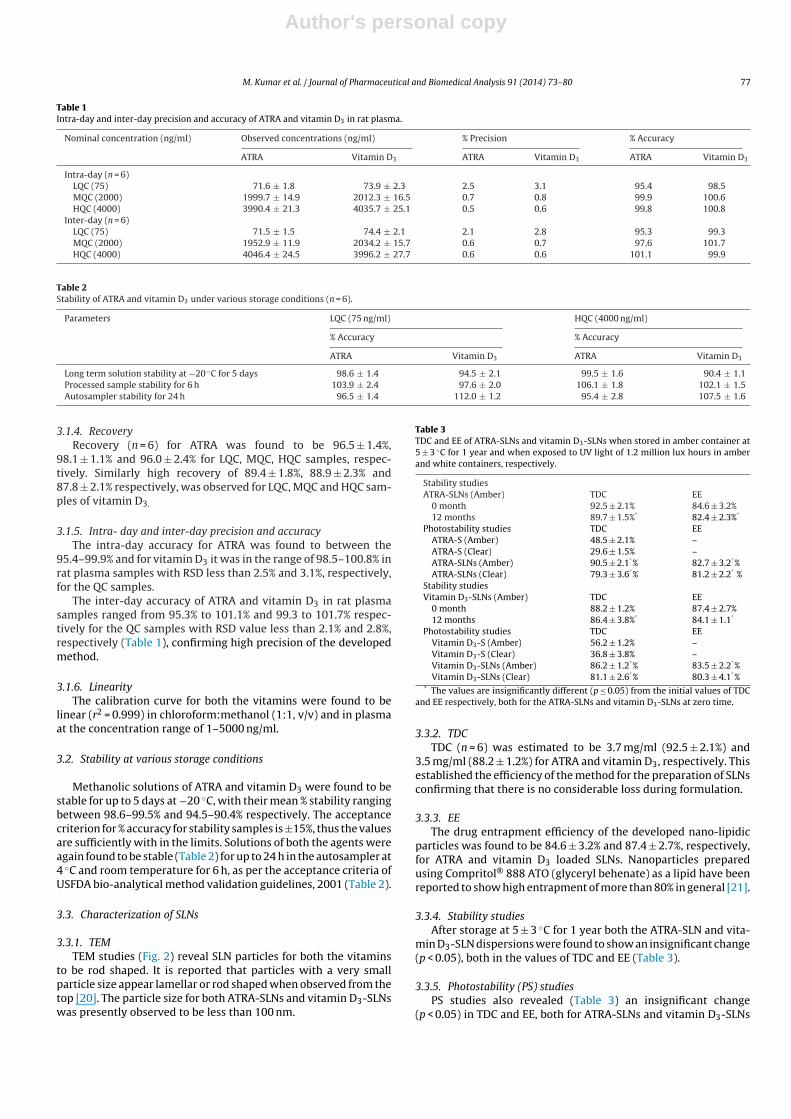
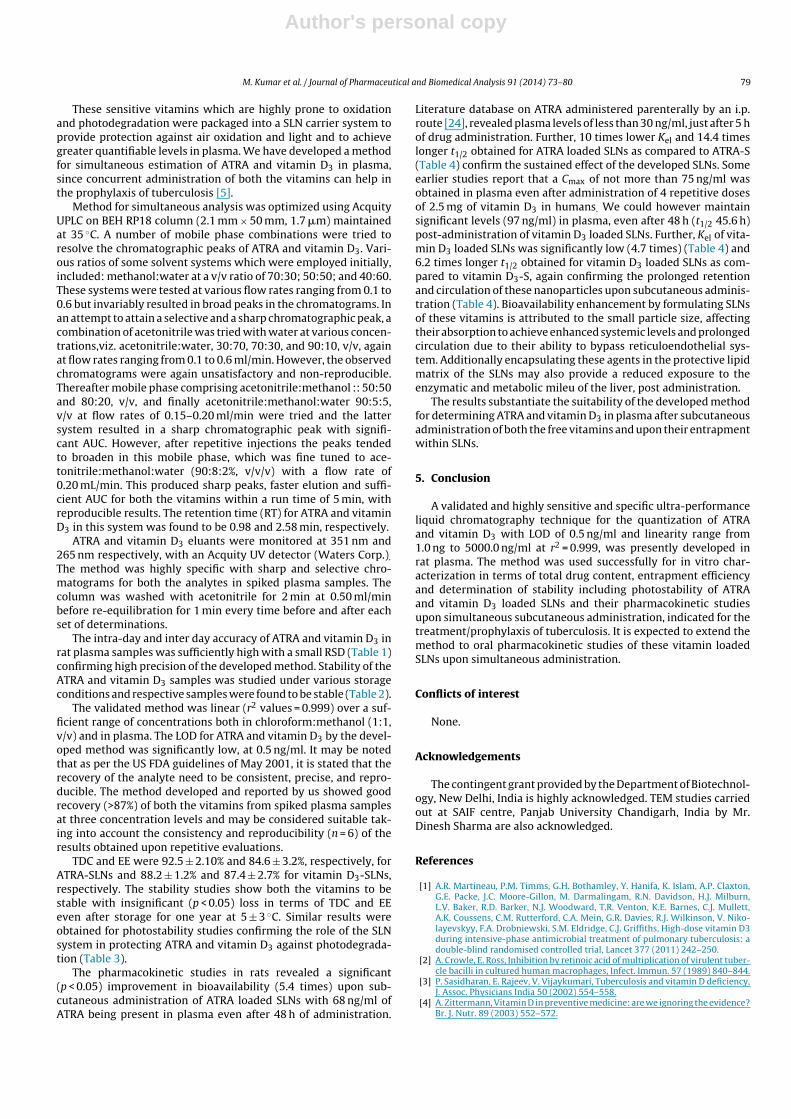
3.3.1. TEMTEM studies (Fig. 2) reveal SLN particles for both the vitamins
to be rod shaped. It is reported that particles with a very smallparticle size appear lamellar or rod shaped when observed from thetop [20]. The particle size for both ATRA-SLNs and vitamin D3-SLNswas presently observed to be less than 100 nm.
Table 3TDC and EE of ATRA-SLNs and vitamin D3-SLNs when stored in amber container at5 ± 3 ◦C for 1 year and when exposed to UV light of 1.2 million lux hours in amberand white containers, respectively.
Stability studiesATRA-SLNs (Amber) TDC EE
0 month 92.5 ± 2.1% 84.6 ± 3.2%12 months 89.7 ± 1.5%* 82.4 ± 2.3%*
Photostability studies TDC EEATRA-S (Amber) 48.5 ± 2.1% –ATRA-S (Clear) 29.6 ± 1.5% –ATRA-SLNs (Amber) 90.5 ± 2.1*% 82.7 ± 3.2*%ATRA-SLNs (Clear) 79.3 ± 3.6*% 81.2 ± 2.2* %
Stability studiesVitamin D3-SLNs (Amber) TDC EE
0 month 88.2 ± 1.2% 87.4 ± 2.7%12 months 86.4 ± 3.8%* 84.1 ± 1.1*
Photostability studies TDC EEVitamin D3-S (Amber) 56.2 ± 1.2% –Vitamin D3-S (Clear) 36.8 ± 3.8% –Vitamin D3-SLNs (Amber) 86.2 ± 1.2*% 83.5 ± 2.2*%Vitamin D3-SLNs (Clear) 81.1 ± 2.6*% 80.3 ± 4.1*%
* The values are insignificantly different (p ≤ 0.05) from the initial values of TDCand EE respectively, both for the ATRA-SLNs and vitamin D3-SLNs at zero time.
3.3.2. TDCTDC (n = 6) was estimated to be 3.7 mg/ml (92.5 ± 2.1%) and
3.5 mg/ml (88.2 ± 1.2%) for ATRA and vitamin D3, respectively. Thisestablished the efficiency of the method for the preparation of SLNsconfirming that there is no considerable loss during formulation.
3.3.3. EEThe drug entrapment efficiency of the developed nano-lipidic
particles was found to be 84.6 ± 3.2% and 87.4 ± 2.7%, respectively,for ATRA and vitamin D3 loaded SLNs. Nanoparticles preparedusing Compritol® 888 ATO (glyceryl behenate) as a lipid have beenreported to show high entrapment of more than 80% in general [21].
3.3.4. Stability studiesAfter storage at 5 ± 3 ◦C for 1 year both the ATRA-SLN and vita-
min D3-SLN dispersions were found to show an insignificant change(p < 0.05), both in the values of TDC and EE (Table 3).
3.3.5. Photostability (PS) studiesPS studies also revealed (Table 3) an insignificant change
(p < 0.05) in TDC and EE, both for ATRA-SLNs and vitamin D3-SLNs
Author's personal copy
78 M. Kumar et al. / Journal of Pharmaceutical and Biomedical Analysis 91 (2014) 73– 80
Fig. 2. TEM of vitamin D3 and ATRA loaded SLNs.
Table 4Pharmacokinetic parameters obtained with single dose (n = 5) subcutaneous injection of 20 mg/kg and of 0.54 mg/kg of ATRA and vitamin D3, respectively, to rats as free drug(ATRA-S and vitamin D3-S) and upon loading into SLNs (ATRA-SLNs and vitamin D3-SLNs) respectively.
Formulation Subject Cmax (ng/ml) Tmax (h) AUC0–t (h × ng/ml) AUC(0–∞) (h × ng/ml) Kel (h−1) t1/2 (h)
ATRA-SLNs 5 3190.5 0.7 14984.0 31238.0 0.07 13.7ATRA-S 5 1396.9 0.5 2824.5 5770.0 0.70 0.95Vit D3-SLNs 5 322.5 7.2 10110.5 24579.8 0.02 45.6Vit D3-S 5 18.0 1.0 274.0 834.3 0.09 7.3
when stored in amber colored vials. However, in case of free drugsolutions a significant loss was observed in TDC. A 38.9% and 34.5%higher degradation in ATRA-S and vitamin D3-S samples stored inclear glass vial, in comparison to amber colored vials was observed,respectively. It may however be observed that in comparison to aninsignificant degradation for respective vitamin loaded SLNs whenstored in amber colored container, corresponding free drug solu-tions showed a degradation of 48.5% and 56.2% respectively forATRA and vitamin D3. Thus confirming the protection provided tothese vitamins by the lipid enclosure of SLNs. However when, theseSLN samples were stored in clear glass vials a minimal degradationof 12.3% and 5.9% was observed for ATRA-SLNs and vitamin D3,respectively.
3.4. Pharmacokinetic studies
The pharmacokinetic studies in rats revealed a significantimprovment (p < 0.05) in bioavailability of both these moleculesafter their entrapment in SLNs. Cmax values obtained for sub-cutaneous ATRA loaded SLNs was 3190.5 ng/ml as compared to1396.9 ng/ml for free drug (ATRA-S). Similarly, subcutaneous vita-min D3 loaded SLNs showed a Cmax of 322.5 ng/ml as comparedto 18.0 ng/ml upon subcutaneous administration of correspondingfree drug (vitamin D3-S) (Table 4). The values of ATRA and vitaminD3 levels detected in blank rat plasma samples were 56.1 ng/ml and10.8 ng/ml respectively and these values were subtracted from thefinal concentrations obtained after subcutaneous administration offree and entrapped ATRA and vitamin D3 respectively to the rats.
4. Discussion
A UPLC method for estimation of ATRA and vitamin D3 in ratplasma was developed in the present investigation and validatedaccording to the principles of good laboratory practices. With theadvent of the expected usefulness of ATRA and vitamin D3 in thetherapeutic regime of tuberculosis [22] their quantification in
biological matrix in conjunction with ascertaining the stability ofsamples during extraction and analysis is an important assign-ment. Physicochemical instability due to rapid oxidation anddecomposition in the presence of light observed with both vita-mins, poses a serious challenge for the development of a suitableanalytical method with minimal degradation during processingand storage of samples. Although the literature database is repletewith validated methods using sophisticated analytical equipmentssuch as HPLC, LCMS/MS, and HPLC–MS/MS method, however useof the UPLC method for the quantification of ATRA and vitamin D3in plasma has been investigated only to a limited extent.
Paliakov et al. [23] reported on a rapid quantitative determi-nation of fat-soluble vitamins (vitamin A, � and � tocopherol,�-carotene, and coenzyme Q-10, vitamin K) in human serumby reverse phase UPLC (with UV detection) with a flow rateof 1.25 ml/min and a gradient flow. Mobile phase used bythem, constituted of two phases, phase A (acetonitrile:de-ionizedwater :: 90:10) and phase B (methanol:2 propanol :: 70:30). Kaneet al. also reported a HPLC/UV quantification of retinal, retinol, andretinyl esters in serum and tissues with more than 30 min of runtime and a gradient elution [16]. Howsoever, both the methodsdo not claim their suitability for the determination of vitamin D3.Some reports on the analysis of these molecules using HPLC–MS/MSand LC/MS/MS have also been listed. Latter involves various limita-tions including cost of the equipment and complicated extractionprocedures, apart from the need of expert staff for running theequipment, and time and labour for method development.
Presently, we have demonstrated the simultaneous estimationof ATRA and vitamin D3 in chloroform:methanol (1:1, v/v) (forevaluating TDC and EE of the developed SLNs) and in plasma (forpharmacokinetic studies) using UPLC. The method was applied todetermine stability and photostability of these molecules, in freeform and when entrapped into SLNs. Suitability of the methodfor determining pharmacokinetic parameters in rat plasma, uponsimultaneous subcutaneous administration of both the vitamins torats has also been established and is discussed subsequently.
Author's personal copy
M. Kumar et al. / Journal of Pharmaceutical and Biomedical Analysis 91 (2014) 73– 80 79
These sensitive vitamins which are highly prone to oxidationand photodegradation were packaged into a SLN carrier system toprovide protection against air oxidation and light and to achievegreater quantifiable levels in plasma. We have developed a methodfor simultaneous estimation of ATRA and vitamin D3 in plasma,since concurrent administration of both the vitamins can help inthe prophylaxis of tuberculosis [5].
Method for simultaneous analysis was optimized using AcquityUPLC on BEH RP18 column (2.1 mm × 50 mm, 1.7 �m) maintainedat 35 ◦C. A number of mobile phase combinations were tried toresolve the chromatographic peaks of ATRA and vitamin D3. Vari-ous ratios of some solvent systems which were employed initially,included: methanol:water at a v/v ratio of 70:30; 50:50; and 40:60.These systems were tested at various flow rates ranging from 0.1 to0.6 but invariably resulted in broad peaks in the chromatograms. Inan attempt to attain a selective and a sharp chromatographic peak, acombination of acetonitrile was tried with water at various concen-trations,viz. acetonitrile:water, 30:70, 70:30, and 90:10, v/v, againat flow rates ranging from 0.1 to 0.6 ml/min. However, the observedchromatograms were again unsatisfactory and non-reproducible.Thereafter mobile phase comprising acetonitrile:methanol :: 50:50and 80:20, v/v, and finally acetonitrile:methanol:water 90:5:5,v/v at flow rates of 0.15–0.20 ml/min were tried and the lattersystem resulted in a sharp chromatographic peak with signifi-cant AUC. However, after repetitive injections the peaks tendedto broaden in this mobile phase, which was fine tuned to ace-tonitrile:methanol:water (90:8:2%, v/v/v) with a flow rate of0.20 mL/min. This produced sharp peaks, faster elution and suffi-cient AUC for both the vitamins within a run time of 5 min, withreproducible results. The retention time (RT) for ATRA and vitaminD3 in this system was found to be 0.98 and 2.58 min, respectively.
ATRA and vitamin D3 eluants were monitored at 351 nm and265 nm respectively, with an Acquity UV detector (Waters Corp.).
The method was highly specific with sharp and selective chro-matograms for both the analytes in spiked plasma samples. Thecolumn was washed with acetonitrile for 2 min at 0.50 ml/minbefore re-equilibration for 1 min every time before and after eachset of determinations.
The intra-day and inter day accuracy of ATRA and vitamin D3 inrat plasma samples was sufficiently high with a small RSD (Table 1)confirming high precision of the developed method. Stability of theATRA and vitamin D3 samples was studied under various storageconditions and respective samples were found to be stable (Table 2).
The validated method was linear (r2 values = 0.999) over a suf-ficient range of concentrations both in chloroform:methanol (1:1,v/v) and in plasma. The LOD for ATRA and vitamin D3 by the devel-oped method was significantly low, at 0.5 ng/ml. It may be notedthat as per the US FDA guidelines of May 2001, it is stated that therecovery of the analyte need to be consistent, precise, and repro-ducible. The method developed and reported by us showed goodrecovery (>87%) of both the vitamins from spiked plasma samplesat three concentration levels and may be considered suitable tak-ing into account the consistency and reproducibility (n = 6) of theresults obtained upon repetitive evaluations.
TDC and EE were 92.5 ± 2.10% and 84.6 ± 3.2%, respectively, forATRA-SLNs and 88.2 ± 1.2% and 87.4 ± 2.7% for vitamin D3-SLNs,respectively. The stability studies show both the vitamins to bestable with insignificant (p < 0.05) loss in terms of TDC and EEeven after storage for one year at 5 ± 3 ◦C. Similar results wereobtained for photostability studies confirming the role of the SLNsystem in protecting ATRA and vitamin D3 against photodegrada-tion (Table 3).
The pharmacokinetic studies in rats revealed a significant(p < 0.05) improvement in bioavailability (5.4 times) upon sub-cutaneous administration of ATRA loaded SLNs with 68 ng/ml ofATRA being present in plasma even after 48 h of administration.
Literature database on ATRA administered parenterally by an i.p.route [24], revealed plasma levels of less than 30 ng/ml, just after 5 hof drug administration. Further, 10 times lower Kel and 14.4 timeslonger t1/2 obtained for ATRA loaded SLNs as compared to ATRA-S(Table 4) confirm the sustained effect of the developed SLNs. Someearlier studies report that a Cmax of not more than 75 ng/ml wasobtained in plasma even after administration of 4 repetitive dosesof 2.5 mg of vitamin D3 in humans. We could however maintainsignificant levels (97 ng/ml) in plasma, even after 48 h (t1/2 45.6 h)post-administration of vitamin D3 loaded SLNs. Further, Kel of vita-min D3 loaded SLNs was significantly low (4.7 times) (Table 4) and6.2 times longer t1/2 obtained for vitamin D3 loaded SLNs as com-pared to vitamin D3-S, again confirming the prolonged retentionand circulation of these nanoparticles upon subcutaneous adminis-tration (Table 4). Bioavailability enhancement by formulating SLNsof these vitamins is attributed to the small particle size, affectingtheir absorption to achieve enhanced systemic levels and prolongedcirculation due to their ability to bypass reticuloendothelial sys-tem. Additionally encapsulating these agents in the protective lipidmatrix of the SLNs may also provide a reduced exposure to theenzymatic and metabolic mileu of the liver, post administration.
The results substantiate the suitability of the developed methodfor determining ATRA and vitamin D3 in plasma after subcutaneousadministration of both the free vitamins and upon their entrapmentwithin SLNs.
5. Conclusion
A validated and highly sensitive and specific ultra-performanceliquid chromatography technique for the quantization of ATRAand vitamin D3 with LOD of 0.5 ng/ml and linearity range from1.0 ng to 5000.0 ng/ml at r2 = 0.999, was presently developed inrat plasma. The method was used successfully for in vitro char-acterization in terms of total drug content, entrapment efficiencyand determination of stability including photostability of ATRAand vitamin D3 loaded SLNs and their pharmacokinetic studiesupon simultaneous subcutaneous administration, indicated for thetreatment/prophylaxis of tuberculosis. It is expected to extend themethod to oral pharmacokinetic studies of these vitamin loadedSLNs upon simultaneous administration.
Conflicts of interest
None.
Acknowledgements
The contingent grant provided by the Department of Biotechnol-ogy, New Delhi, India is highly acknowledged. TEM studies carriedout at SAIF centre, Panjab University Chandigarh, India by Mr.Dinesh Sharma are also acknowledged.
References
[1] A.R. Martineau, P.M. Timms, G.H. Bothamley, Y. Hanifa, K. Islam, A.P. Claxton,G.E. Packe, J.C. Moore-Gillon, M. Darmalingam, R.N. Davidson, H.J. Milburn,L.V. Baker, R.D. Barker, N.J. Woodward, T.R. Venton, K.E. Barnes, C.J. Mullett,A.K. Coussens, C.M. Rutterford, C.A. Mein, G.R. Davies, R.J. Wilkinson, V. Niko-layevskyy, F.A. Drobniewski, S.M. Eldridge, C.J. Griffiths, High-dose vitamin D3during intensive-phase antimicrobial treatment of pulmonary tuberculosis: adouble-blind randomised controlled trial, Lancet 377 (2011) 242–250.
[2] A. Crowle, E. Ross, Inhibition by retinoic acid of multiplication of virulent tuber-cle bacilli in cultured human macrophages, Infect. Immun. 57 (1989) 840–844.
[3] P. Sasidharan, E. Rajeev, V. Vijaykumari, Tuberculosis and vitamin D deficiency,J. Assoc. Physicians India 50 (2002) 554–558.
[4] A. Zittermann, Vitamin D in preventive medicine: are we ignoring the evidence?Br. J. Nutr. 89 (2003) 552–572.
Author's personal copy
80 M. Kumar et al. / Journal of Pharmaceutical and Biomedical Analysis 91 (2014) 73– 80
[5] P. Anand, D. Kaul, M. Sharma, Synergistic action of vitamin D and retinoic acidrestricts invasion of macrophages by pathogenic mycobacteria, J. Microbiol.Immunol. Infect. (2008) 17–25.
[6] R. Blomhoff, M.H. Green, J.B. Green, T. Berg, K.R. Norum, Vitamin A metabolism:new perspectives on absorption, transport and storage, Physiol. Rev. 71 (1991)951–990.
[7] T. Gilberston, R. Stryd, High-performance liquid chromatographic assay for 25-hydroxyvitamin D3 in serum, Clin. Chem. 23 (1977) 1700.
[8] G. Jones, Assay of vitamins D2 and D3, and 25-hydroxyvitamins D2 and D3 inhuman plasma by high-performance liquid chromatography, Clin. Chem. 24(1978) 287.
[9] T. Clements, J. Adams, J. Nolan, M. Holick, Measurement of circulating vitaminD in man, Clin. Chem. Acta 121 (1982) 301.
[10] S. Gueguen, B. Herbeth, G. Siest, P. Leroy, An isocratic liquid chromatographicmethod with diode-array detection for the simultaneous determination of �-tocopherol, retinol, and five carotenoids in human serum, J. Chromatogr. Sci.40 (2002) 69–76.
[11] J. Dabek, M. Härkönen, O. Wahlroos, H. Adlercreutz, Assay for plasma 25-hydroxyvitamin D2 and 25-hydroxyvitamin D3 by “high-performance” liquidchromatography, Clin. Chem. 27 (1981) 1346–1351.
[12] E. Kohl, P. Schaefer, Improved high-pressure liquid chromatographic assay ofserum 25-hydroxycholecalciferol and 25-hydroxyergocalciferol after reverse-phase Sep-Pak C18 cartridge preparation of sample, J. Liq. Chromatogr. 4 (1981)2023.
[13] P. Kao, W. Heser, Simultaneous determination of 25-hydroxy- and 1,25-dihydroxyvitamin D from a single sample by dual-cartridge extraction, Clin.Chem. 30 (1984) 56.
[14] H. Qian, M. Sheng, Simultaneous determination of fat-soluble vitamins A, Dand E and pro-vitamin D2 in animal feeds by one-step extraction and high-performance liquid chromatography analysis, J. Chromatogr. A 825 (1998)127–133.
[15] E.M. Paliakov, B.S. Crow, M.J. Bishop, D.N.J. George, J.A. Bralley, Rapid quan-titative determination of fat-soluble vitamins and coenzyme Q-10 in humanserum by reversed phase ultra-high pressure liquid chromatography with UVdetection, J. Chromatogr. B 877 (2009) 89–94.
[16] M. Kane, A. Folias, J. Napoli, HPLC/UV quantitation of retinal, retinol, and retinylesters in serum and tissues, Anal. Biochem. 378 (2008) 71–79.
[17] I.P. Kaur, M.K. Verma, Solid nanolipidic particulates of vitamin D3 and retinoicacid, in: I.P. Office, India, 79/DEL/2012 dated 9.1.2012.
[18] I.P. Kaur, M.K. Verma, A process for preparing solid lipid sustainedrelease nanoparticles for delivery of vitamins, in: PCT/IB2013/050169 dated9.1.2013.
[19] T. Ehab, G. Dalia, Z. Abdelazim, P. Alleyna, Bioavailability assessment of vitaminA self-nanoemulsified drug delivery systems in rats: a comparative study, Med.Princ. Pract. 16 (2007) 355–359.
[20] K. Jores, W. Mehnert, M. Drechsler, H. Bunjes, C. Johann, K. Mäder, Investigationson the structure of solid lipid nanoparticles (SLN) and oil-loaded solid lipidnanoparticles by photon correlation spectroscopy, field-flow fractionation andtransmission electron microscopy, J. Control. Release 95 (2004) 217–227.
[21] V. Kakkar, S. Singh, D. Singla, I.P. Kaur, Exploring solid lipid nanoparticles toenhance the oral bioavailability of curcumin, Mol. Nut. Food Res. 55 (2011)495–503.
[22] B.J. Nonnecke, W.R. Waters, M.R. Foote, R.L. Horst, M.A. Fowler, B.L. Miller,In vitro effects of 1, 25-dihydroxyvitamin D3 on interferon-gamma and tumornecrosis factor-alpha secretion by blood leukocytes from young and adult cat-tle vaccinated with Mycobacterium bovis BCG, Int. J. Vitam. Nutr. Res. 73 (2003)235–244.
[23] M. Paliakov, B. Crow, M. Bishop, D. George, J. Bralley, J. Chromatogr. B 877 (2009)87–94.
[24] D. Franc, D.F. Daniele, L.B. Oise Albessard, D. Gilles Louis, Pharmacokinetics ofall-trans retinoic acid, 13-cis retinoic acid, and fenretinide in plasma and brainof rat, Drug Metabol. Dispos. 28 (2000) 205–508.


