Embed Size (px)
Citation preview

Domestic Animal Endocrinology 24 (2003) 265–285
Dietary 135-fold cholecalciferol supplementationseverely disturbs the endochondral
ossification in growing dogs
M.A. Tryfonidoua,∗, M.S. Holla, J.J. Stevenhagenb,C.J. Buurmanc, H.F. Delucad, M.A. Oosterlaken-Dijksterhuisa,
W.E. van den Broma, J.P.T.M. van Leeuwenc,H.A.W. Hazewinkela
a Department of Clinical Sciences of Companion Animals, Faculty of Veterinary Medicine,Utrecht University, Yalelaan 8, 3584 CM, Utrecht, The Netherlands
b TNO Nutrition and Food Research, Zeist, The Netherlandsc Department of Internal Medicine, Erasmus MC Rotterdam, Rotterdam, The Netherlands
d Department of Biochemistry, University of Wisconsin-Madison, Madison, WC, USA
Received 5 September 2002; accepted 13 January 2003
Abstract
The effects of excessive non-toxic dietary Vitamin D3 supplementation on Ca homeostasis withspecific effects on endochondral ossification and skeletal remodeling were investigated in a group ofgrowing Great Dane dogs supplemented with cholecalciferol (Vitamin D3; HVitD) versus a controlgroup (CVitD) (1350�g versus 11.4�g Vitamin D3 per kilogram diet) from 6 to 21 weeks of age.There were no differences between groups in plasma concentrations of total Ca, inorganic phos-phate, growth hormone, and insulin-like growth factor I and no signs of Vitamin D3 intoxicationin HVitD. For the duration of the study inHVitD compared toCVitD, plasma levels of parathyroidhormone (PTH) decreased, calcitonin (CT) increased, 25-hydroxycholecalciferol [25(OH)D3] in-creased 30- to 75-fold, 24,25-dihydroxycholecalciferol [24,25(OH)2D3] increased 12- to 16-fold,and 1,25-dihydroxycholecalciferol [1,25(OH)2D3] decreased by approximately 40%. The latter wasattributed to the two-fold increased metabolic clearance rate in theHVitD versusCVitD accompa-nied by the absence of the anabolic effect of PTH on the production of 1,25(OH)2D3. FractionalCa absorption (α) did not differ between groups at 8 and 14 weeks of age, whereas at 20 weeksof ageα increased by only 16.4% inHVitD compared toCVitD. Excessive non-toxic Vitamin D3supplementation resulted in decreased bone remodeling and focal enlargement of the growth platewith morphology resembling those induced by administration of CT. Hypercalcitoninemia and the
∗ Corresponding author. Tel.:+31-30-2539-411; fax:+31-30-2518-126.E-mail address:[email protected] (M.A. Tryfonidou).
0739-7240/03/$ – see front matter © 2003 Elsevier Science Inc. All rights reserved.doi:10.1016/S0739-7240(03)00018-3

266 M.A. Tryfonidou et al. / Domestic Animal Endocrinology 24 (2003) 265–285
imbalanced relationship between 1,25(OH)2D3 and 24,25(OH)2D3 are potent candidates for thedisturbed endochondral ossification.© 2003 Elsevier Science Inc. All rights reserved.
Keywords:1,25-Dihydroxycholecalciferol; 24,25-Dihydroxycholecalciferol; Endochondral ossification; Caabsorption; Dog
1. Introduction
Nutrition plays an important role in the skeletal development of growing dogs[1]. Largebreed dogs are over-represented in juvenile skeletal disorders associated with disturbances ofendochondral ossification and/or skeletal remodeling, including for example osteochondro-sis, the radius curvus syndrome, enostosis, and the Wobbler syndrome. These disturbanceshave been related mainly to high intake of (a) food[2], (b) energy[3], (c) calcium (Ca)[4,5], (d) Ca and P[6], and (e) possibly cholecalciferol (Vitamin D3), although the role ofthe latter has not yet been elucidated.
Dogs are completely dependent on dietary sources for their Vitamin D3 requirements,due to restricted availability of 7-dihydroxycholesterol in the skin[7]. Vitamin D3 ishydroxylated in the liver to 25-hydroxycholecalciferol [25(OH)D3] and subsequently to1,25-dihydroxycholecalciferol [1,25(OH)2D3] and 24,25-dihydroxycholecalciferol [24,25(OH)2D3] in the kidney. The latter two metabolites are reciprocally regulated. The rate of re-nal synthesis of 1,25(OH)2D3 is directly responsive to levels of plasma inorganic phosphate(Pi), growth hormone (GH), insulin-like growth factor I (IGF-I), and parathyroid hormone(PTH) [8–10], whereas regulatory feedback is provided by 1,25(OH)2D3 by inducing itsown catabolism[11].
The 1,25(OH)2D3 is the biologically most active metabolite of Vitamin D3 and facilitatesintestinal Ca absorption, renal Ca reabsorption, endochondral ossification, skeletal mineral-ization and remodeling[11,12]. The most abundantly present Vitamin D3 metabolites in theplasma of dogs [25(OH)D3 and 24,25(OH)2D3] do not have a well defined physiologicalrole. 25(OH)D3 may directly stimulate Ca absorption as known in man[13–15]althoughthis has been disputed by others[16]. 24,25(OH)2D3 has biological functions on bone byfacilitating skeletal mineralization[17], regulating chondrocyte differentiation[18], andpossibly affecting Ca absorption[19,20].
The period of fast growth has been associated in Great Danes with a juvenile excess inGH and IGF-I compared to Miniature Poodles[21]. Growth hormone and/or IGF-I excessis known to affect Vitamin D3 metabolism as characterized in rats[22], in pigs [23,24],and in man[25] by high plasma 1,25(OH)2D3 levels and low plasma 24,25(OH)2D3 levels.Similarly, growing Great Danes have higher plasma 1,25(OH)2D3 levels and a magnitudelower plasma 24,25(OH)2D3 levels than Miniature Poodles (unpublished data). Thus, GreatDanes seem to have a relative excess of 1,25(OH)2D3 and deficiency in 24,25(OH)2D3based (a) on the effects of the GH–IGF-I axis on Vitamin D3 metabolism and (b) on themaintenance of the plasma 25(OH)D3 levels at control levels, despite an eight-fold VitaminD3 supplementation[26]. This may give an indication for higher Vitamin D3 requirementsof growing large breed dogs than the NRC[28] recommendations that are based on studies

M.A. Tryfonidou et al. / Domestic Animal Endocrinology 24 (2003) 265–285 267
in growing Beagles experiencing a much shorter period of high GH release[27]. However,increased supplementation of Vitamin D3 can be detrimental as it may stimulate intestinalCa absorption and affect endochondral ossification and skeletal remodeling.
The present study was designed to elucidate the effects of excessive non-toxic dietaryVitamin D3 supplementation on Ca homeostasis with specific effects on endochondralossification and skeletal remodeling. In adult dogs, chronic daily intake of 500�g VitaminD3 per kilogram body weight (BW) exceeding by∼1000 times the NRC[28] VitaminD3 recommendations has been reported to cause Vitamin D3 toxicity with impaired kidneyfunction and calcifications[29]. Therefore,∼100-fold NRC-recommended[28] Vitamin D3supplementation was chosen in order to recognize the possible implications of excessivenon-toxic Vitamin D3 intake. Animals were monitored for signs of Vitamin D3 intoxicationby standard biochemical measurements and assessment of the kidney function. Skeletalgrowth and development were determined with the aid of biochemical measurements,45Cabalance studies, radiology, and histomorphometry and interpreted in light of the plasmalevels of the calciotropic hormones and intestinal Ca absorption.
2. Materials and methods
2.1. Animals and diets
The Utrecht University Ethical Committee for Animal Care and Use approved all pro-cedures. Sixteen (eight males and eight females) Great Dane dogs, originating from threedifferent litters (Utrecht University, The Netherlands), were divided into two groups at 3weeks of age: a control group (n = 9,CVitD) and a dietary Vitamin D3 supplemented group(n = 7, HVitD). Pups were raised on a dry pellet diet (Table 1) formulated to be compa-rable for energy, Ca, and P content. The supplemented Vitamin D3 diet was aimed to have∼100-fold greater Vitamin D3 per kilogram diet content than the recommended amountof 12.5�g Vitamin D3 per kilogram diet for growing dogs[30]. Diets were analyzed fortheir Vitamin D content[31] in a reference laboratory (TNO Nutrition and Food Research,Zeist, The Netherlands) (Table 2). The puppies received their diet as gruel in addition to thebitch milk by 3 weeks of age and exclusively fed dry diet by 6 weeks of age. Food intakewas adjusted biweekly to the actual BW and provided at two times maintenance energyrequirements of each dog[32] for the duration of the study.
2.2. Ca absorption measurements
Ca absorption was measured with the aid of one tracer45Ca, by techniques as describedpreviously and validated for the dog[33]. In short, the actual food intake was measured ineach dog and Ca intake (VI ) was calculated for each investigation period. The endogenousfecal excretion of45Ca (Vf ) was determined by collecting the feces for 3 consecutive daysafter an intravenous (i.v.) dose of 0.1, 0.25, and 0.4 MBq45Ca as45CaCl2 water (specificactivity 271.88 MBq/mg, NEN Life Science Products, Boston, USA) at 8, 14, and 20 weeksof age, respectively.Vf was calculated from the quotient of the part of the injected dose (Rf3)that was excreted in the feces during 3 days and the integral of plasma specific activityC(t)

268 M.A. Tryfonidou et al. / Domestic Animal Endocrinology 24 (2003) 265–285
Table 1Composition of the experimental diets
Ingredient Control cholecalciferol diet (g/kg) High cholecalciferol diet (g/kg)
Corn 528 528Chicken 200 200Poultry fat 75.5 75.5Brewers rice 74.2 74.2Mineral mixturea 35.4 35.4Beet pulp 34.0 34.0Egg 25.0 25.0Brewers yeast 10.0 10.0Menhaden oil 8.0 8.0Vitamin mixture Cb 6.7 0Vitamin mixture Hc 0 6.7Ground flax 2.8 2.8DL-methionine 0.4 0.4
a Composition of the mineral mixture (amount in 35.4 g): calcium carbonate (Ca= 4.41 g); monosodiumphosphate (P= 2.61 g); ferrous sulfate (Fe= 2.55 g); zinc oxide (Zn= 2.12 g); cupric sulfate (Cu= 159 mg);manganese oxide (Mn= 283 mg); manganese sulfate (Mn= 205 mg); potassium iodide (I= 32 mg); cobaltcarbonate (Co= 5.3 mg); with potassium chloride as the remainder.
b Composition of the vitamin mixture (amount in 6.7 g): Vitamin A (13.2 mg); Vitamin C (367 mg); chole-calciferol (22.1�g); Vitamin E (226 mg); thiamin (27 mg); riboflavin (168 mg); nicotinic acid (28 mg); calciumpantothenate (52 mg); pyridoxine-RCl (13 mg); biotin (0.76 mg); folic acid (2.5 mg); inositol (17 mg); cyanocobal-amin (0.30 mg); choline chloride (228 mg); with rice hulls as the remainder.
c Composition of the vitamin mixture (amount in 6.7 g): Vitamin A (13.2 mg); Vitamin C (367 mg); chole-calciferol (2204�g); Vitamin E (226 mg); thiamin (27 mg); riboflavin (168 mg); nicotinic acid (28 mg); calciumpantothenate (52 mg); pyridoxine-HC1 (13 mg); biotin (0.76 mg); folic acid (2.5 mg); inositol (17 mg); cyanocobal-amin (0.30 mg); choline chloride (228 mg); with rice hulls as the remainder.
according to the formula:Vf = Rf 3/∫ 3
0 C(t) dt. Although, in a similar manner, the urine lossof 45Ca (Vu) could be calculated asVu = Ru3/
∫ 30 C(t) dt with Ru3 the part of the injected
dose that was excreted in the urine during 3 days, the specific activity of45Ca in urine wastoo low for reliable counting and thusVu was determined by analysis of the total urinary
Table 2Analysis of the experimental diets
Item Control cholecalciferol dieta High cholecalciferol dietb
g/100 g diet dry matterCrude protein 26.90 26.83Crude lipid 14.65 15.44Ash 5.10 5.20Calcium 0.94 0.95Phosphate 0.80 0.85
�g/kg dietCholecalciferol 11.4c 1350c
a Moisture 7.1 g/100 g diet.b Moisture 10.1 g/100 g diet.c No detectable traces of ergocalciferol.
M.A. Tryfonidou et al. / Domestic Animal Endocrinology 24 (2003) 265–285 269
Ca content over the period of 3 days. On day 4 of each metabolic study, a dose of45Caequivalent to the i.v. dose was orally administered and feces were collected for 4 consecutivedays. The fecal content of45Ca was determined to calculate the total fecal content of Ca(VF). True Ca absorption (Va) was calculated by the formula:Va = VI − (VF − Vf ). Thefractional absorption of Ca (α) was defined as:α = Va/VI × 100%. Assuming a steadystate condition during each investigation period of 7 days, then turnover= input = outputand thusT = Va + V−
0 = Vu + Vf + V+0 whereV−
0 andV+0 are the calcium resorption
and accretion, respectively. Consequently,V−0 = T − Va andV+
0 = T − (Vu + Vf ). Allparameters were expressed in mmol per kg body per day.
2.3. Blood measurements
At 7, 13, and 19 weeks of age blood samples were collected after an overnight fast. Bloodsamples for the measurement of Ca, Pi , alkaline phosphatase (AP), corticosteroid-inducedAP (C-AP), and bile acid levels were transferred into heparine tubes, centrifuged and mea-sured according to standard procedures (Beckman Industries Inc., Brea, USA). C-AP wasdetermined as described previously[34]. Blood samples for the analysis of Ca2+ werecollected anaerobically in heparinized syringes (PICO 50, Radiometer Copenhagen, Den-mark), were placed on melting ice and analyzed within 2 h after collection with the aid ofthe ionized Ca analyzer (ABL 605, Radiometer Copenhagen).
Determination techniques of the plasma Vitamin D3 metabolites levels have been de-scribed earlier and validated for the dog[26]. In short, 25(OH)D3 and 24,25(OH)2D3 werequantitatively determined by a modified radioimmunoassay (RIA) (DiaSorin, Stillwater,Minnesota, USA) after extraction[35] and separation by solid phase extraction (NH2 car-tridge; Bakerbond spe Amino Disposable Extraction Columns, J.T. Baker, Philipsburg,USA) [36]. 1,25(OH)2D3 was quantitatively determined by a radioreceptor assay based onthe method described by Reinhardt et al.[37] and Hollis [38] after extraction with ace-tonitrile followed by a two-step solid phase extraction (C18 and Silicagel cartridge; WatersChromatography B.V. Etten Leur, The Netherlands). PTH was measured using an immuno-radiometric assay for intact PTH (iPTH, Nichols Institute, San Juan Capistrano, CA, USA)[39]. Calcitonin (CT) was measured after extraction with ethanol by a homologous RIA[40]. GH was measured by a homologous RIA[41]. Total IGF-I levels were measured bya heterologous RIA[42].
2.4. Kidney function
At 7, 13, and 19 weeks of age plasma creatinin and urea levels were determined bystandard procedures (Beckman Industries Inc., Brea, USA). After completion of every45Ca balance study, the glomerular filtration rate (GFR) was determined at 8, 14, and 20weeks of age with the aid of 99Tcm-Diethylenetriaminepentaacetic acid (99Tcm-DTPA) asdescribed before[43].
In addition to theVu of Ca, mean daily urine excretion of Pi (VuP, mmol per kg bodyper day) was measured during the45Ca balance studies over a period of 3 days, when dogswere housed in metabolic cages. Tubular Reabsorption of Pi (TRP) was determined by the

270 M.A. Tryfonidou et al. / Domestic Animal Endocrinology 24 (2003) 265–285
formula: TRP = 1 − (CRPi /CRCreatinin), where TRP is expressed in percentage of thefiltrated Pi and CR is the clearance rate expressed in ml kg per body per minute determinedfor either factorsX (i.e. P or creatinin). CR was calculated from CR= (Xu × Vu)/Xpland corrected for BW, whereXu is the concentration of the factor in the daily urine,Vu thevolume of urine in a day,Xpl the plasma concentration of the factorX.
2.5. Endogenous metabolic clearance rate (MCR) of 1,25(OH)2D3
At 19 weeks of age the MCR of 1,25(OH)2D3 was determined in eightCVitD and sevenHVitD dogs by techniques as described previously[26,44]. In short, after an i.v. admin-istration of approximately 3.7 kBq 1�,25-dihydroxy[23,24(n)-3H]cholecalciferol (3H-1,25(OH)2D3, specific activity 10.5 GBq/mg, Amersham Pharmacia Biotech, Buckinghamshire,UK) the plasma disappearance curve of3H-1,25(OH)2D3 was obtained and a two-compart-mental model was fitted to the plasma3H-1,25(OH)2D3 concentration. The MCR of 1,25(OH)2D3 was calculated by the quotient of the injected doseD of 3H-1,25(OH)2D3 and theintegral of plasma specific activity of3H-1,25(OH)2D3 as follows: MCR= D/
∫ ∞0 C(t) dt,
where MCR is given in l per kg body per day.
2.6. Vitamin D receptor (VDR) analysis
At the end of the study (at 21 weeks of age), animals were euthanized with an overdoseof Na-pentobarbital and after immediate laparotomy, the mucosal layer was sampled fromthe following defined intestinal segments: proximal and distal duodenum, beginning, mid-dle and end of the jejunum, ileum, and colon. Nuclear extracts were prepared as describedby Sandgren and DeLuca[45]. Briefly, segments were rinsed with ice-cold TED saline(50 mmol/l Tris–HCl, pH 7.4, 1.5 mmol/l EDTA, 5 mmol/l DTT, 10�g/ml TPCK, 1�g/mlleupeptin, 1�g/ml pepstatin) and the mucosal layer was scraped and washed three timesin TED saline by centrifugating for 10 min at 3000× g and 4◦C. Samples were homog-enized in 4 vol. (w/v) KTED-300 (TED, 300 mmol/l KCl) in a glass Teflon homogenizer.Homogenates were centrifuged at, 100,000× g for 1 h at 4◦C and supernatants (nuclearextracts) were stored at−70◦C until assayed. Concentration of VDR was measured by aVDR specific enzyme-linked immunoassay[46] and expressed as femtomole per milligrammucosal protein.
2.7. Radiology
At 9, 15, and 21 weeks of age radiographs of the right radius and ulna were made.Skeletal growth of the dogs was assessed radiographically by measuring the length of theradius (RL) and ulna (UL) along the axis of the bone using a curved ruler and correcting forgeometric magnification. Skeletal development was assessed by evaluating the developmentof the secondary ossification centers of the elbow joint, i.e. the anconeal process, medialhumeral epicondyl, and olecranon apophysis, and of the distal ulna the styloid process andarchitecture of the distal ulnar metaphysis (DUM) according to techniques described earlier[47].

M.A. Tryfonidou et al. / Domestic Animal Endocrinology 24 (2003) 265–285 271
2.8. Bone histomorphometry
At 10 and 21 weeks of age, bone biopsies were obtained from the 9th left and right rib,respectively. In addition to routine histological evaluation, histomorphometry was carriedout in longitudinal slices containing the growth plate and 2.5 cm metaphysis of the rib withthe aid of semi-automated image analyzing system, using the KS 400 software package (CarlZeiss Vision, Germany), a program running language for image analysis applications (Dr.M. Terlou, Faculty of Biology, Utrecht University, NL). The mean growth plate thickness(GPl.Th in millimeters) of the growth plate was determined from the mean of the completearea of the growth plate. The standard deviation of the mean thickness of the growth plate(GPl.ThS.D. in millimeters) was determined from the mean of 100 measurements at fixedspaced sites in samples fixated in alcohol and stained with Goldner’s Trichrome. In theentire area of the metaphyseal bone, which was parallel to and at 1 mm fixed distance fromthe growth plate, the percentage of mineralized trabecular bone (Md.Tb.V in percentage)was determined in samples fixated in 80% alcohol, undecalcified, stained with Von Kossa.Absolute osteoclast number (N.Oc) was determined from the mean number of osteoclastsof at least 15 microscopic fields (25× objective) in slices stained with Goldner’s Trichrome.
2.9. Statistical analysis
Statistical analyses were performed using the SPSS for Windows 10.1 (SPSS Inc, Chicago,USA). Differences between groups were analyzed by the two-tailed Studentst-test after test-ing for homogeneity of variance with Levene’s test, while differences between ages withingroups were analyzed by multiple comparisons (Tukey test) in an univariate ANOVA forrepeated measures. The significance of differences in VDR concentration between groupswas tested by the non-parametric Wilcoxon–Mann–WhitneyU test because the standarddeviation of the mean was in the majority greater than 50% of the mean. The differ-ence in growth plate regularity within each group was analyzed by comparing the ratioof GPl.ThS.D./GPl.Th due to a decrease in GPl.Th with increasing age. Values were con-sidered to be significant whenP < 0.05. Results are presented as mean± standard error ofthe mean (S.E.M.).
3. Results
Dogs from both groups had good general health with an undisturbed growth curve (Fig. 1)and complete uptake of the amount of food that was administered daily. Consequently,energy and food intake per kilogram metabolic BW did not differ between groups. Thesupplemented Vitamin D3 group (HVitD) consumed approximately 135-fold more VitaminD3 per kilogram body in comparison to the control group (CVitD) (Table 2).
3.1. Ca absorption
VI was similar in both groups at all ages (Fig. 2). Vf was significantly lower in theHVitDgroup in comparison to theCVitD group at 8 and 14 weeks of age, whereas it was not

272 M.A. Tryfonidou et al. / Domestic Animal Endocrinology 24 (2003) 265–285
Fig. 1. Undisturbed growth curve from weaning (6 weeks) to 21 weeks of age during 135-fold cholecalciferolsupplementation in Great Dane dogs.
significantly different between groups at 20 weeks of age inHVitD versusCVitD (Fig. 2).Vu accounted for less than 0.3% of theVI and ranged from 0.01±0.002 to 0.03±0.002 mmolper kg body per day and did not differ between groups.α decreased significantly with agefor both groups and was significantly lower at 20 weeks of age in comparison to 8 and 14weeks of age for both groups.Va andα did not differ significantly between both groups at8 and 14 weeks of age, whereas they were significantly higher in theHVitD versusCVitDgroup at 20 weeks of age (Fig. 2). V+
0 andV−0 were significantly lower only at 20 weeks of
age in theHVitD versus theCVitD group (Fig. 2).
3.2. Biochemical profiles
The biochemical profiles for both groups of dogs at 7, 13, and 19 weeks of age areshown inTable 3. There were no relevant differences between groups in the plasma lev-els of Ca, Pi , and AP, whereas plasma Ca2+ levels were higher in theHVitD versus theCVitD group only at 19 weeks of age. In both groups, C-AP was undetectable and bileacids ranged within the reference limits for dogs, i.e. 1–10�mol/l, for the duration ofthe study. Plasma 25(OH)D3 and 24,25(OH)2D3 levels increased significantly in bothgroups with age. Plasma 25(OH)D3 levels were significantly increased by 29-, 75-, and56-fold in theHVitD versusCVitD group at 7, 13, and 19 weeks of age, respectively.Plasma 24,25(OH)2D3 levels were significantly increased by 12- to 16-fold in theHVitDversusCVitD group with increasing age. At 7 weeks of age plasma 1,25(OH)2D3 levels

M.A. Tryfonidou et al. / Domestic Animal Endocrinology 24 (2003) 265–285 273
Fig. 2. Effects of cholecalciferol supplementation from partial weaning (3 weeks) to 21 weeks of age on the45Cabalance parameters: Ca intake (VI ), intestinal true Ca absorption (Va), fractional Ca absorption (α), endogenousfecal excretion (Vf ), urine Ca losses (Vu), Ca accretion (V+
0 ) and Ca resorption (V−0 ). Data are presented as
means± S.E.M. (∗) P ≤ 0.05 and (∗∗) P ≤ 0.01 between groups at the same age, (A) P ≤ 0.05 as compared tothe fractional Ca absorption at 8 weeks of age within the group, (B) P ≤ 0.05 as compared to the fractional Caabsorption at 14 weeks of age within the group.
were not different between groups, whereas they were significantly decreased by 40 and36% at 13 and 19 weeks of age in theHVitD versusCVitD group. At all ages, plasmaPTH levels were significantly lower in theHVitD versusCVitD group. Plasma CT levelswere higher in theHVitD versusCVitD group with significance at 7 and 13 weeks of age.There were no differences in the plasma GH and IGF-I levels between groups during thestudy.
3.3. Kidney function
Plasma creatinin and urea levels and GFR did not differ between groups and were withinthe reference range for dogs (Table 3) [43]. VuP did not differ between groups and was1.34±0.08, 1.05±0.05, and 0.99±0.04 mmol per kg body per day at 8, 14, and 20 weeksof age, respectively.
274M
.A.T
ryfon
ido
ue
tal./D
om
estic
An
ima
lEn
do
crino
logy
24
(20
03
)2
65
–2
85
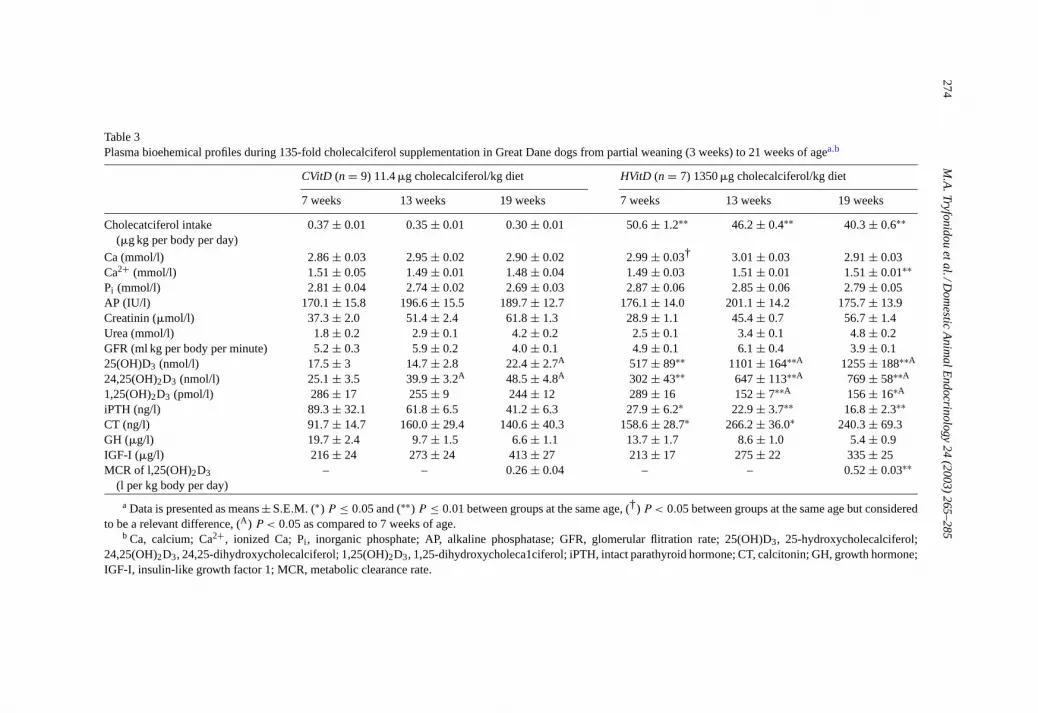
Table 3Plasma bioehemical profiles during 135-fold cholecalciferol supplementation in Great Dane dogs from partial weaning (3 weeks) to 21 weeks of agea,b
CVitD (n = 9) 11.4�g cholecalciferol/kg diet HVitD (n = 7) 1350�g cholecalciferol/kg diet
7 weeks 13 weeks 19 weeks 7 weeks 13 weeks 19 weeks
Cholecatciferol intake(�g kg per body per day)
0.37± 0.01 0.35± 0.01 0.30± 0.01 50.6± 1.2∗∗ 46.2± 0.4∗∗ 40.3± 0.6∗∗
Ca (mmol/l) 2.86± 0.03 2.95± 0.02 2.90± 0.02 2.99± 0.03† 3.01± 0.03 2.91± 0.03Ca2+ (mmol/l) 1.51± 0.05 1.49± 0.01 1.48± 0.04 1.49± 0.03 1.51± 0.01 1.51± 0.01∗∗Pi (mmol/l) 2.81± 0.04 2.74± 0.02 2.69± 0.03 2.87± 0.06 2.85± 0.06 2.79± 0.05AP (IU/l) 170.1± 15.8 196.6± 15.5 189.7± 12.7 176.1± 14.0 201.1± 14.2 175.7± 13.9Creatinin (�mol/l) 37.3± 2.0 51.4± 2.4 61.8± 1.3 28.9± 1.1 45.4± 0.7 56.7± 1.4Urea (mmol/l) 1.8± 0.2 2.9± 0.1 4.2± 0.2 2.5± 0.1 3.4± 0.1 4.8± 0.2GFR (ml kg per body per minute) 5.2± 0.3 5.9± 0.2 4.0± 0.1 4.9± 0.1 6.1± 0.4 3.9± 0.125(OH)D3 (nmol/l) 17.5± 3 14.7± 2.8 22.4± 2.7A 517± 89∗∗ 1101± 164∗∗A 1255± 188∗∗A
24,25(OH)2D3 (nmol/l) 25.1± 3.5 39.9± 3.2A 48.5± 4.8A 302± 43∗∗ 647± 113∗∗A 769± 58∗∗A
1,25(OH)2D3 (pmol/l) 286± 17 255± 9 244± 12 289± 16 152± 7∗∗A 156± 16∗A
iPTH (ng/l) 89.3± 32.1 61.8± 6.5 41.2± 6.3 27.9± 6.2∗ 22.9± 3.7∗∗ 16.8± 2.3∗∗CT (ng/l) 91.7± 14.7 160.0± 29.4 140.6± 40.3 158.6± 28.7∗ 266.2± 36.0∗ 240.3± 69.3GH (�g/l) 19.7± 2.4 9.7± 1.5 6.6± 1.1 13.7± 1.7 8.6± 1.0 5.4± 0.9IGF-I (�g/l) 216± 24 273± 24 413± 27 213± 17 275± 22 335± 25MCR of l,25(OH)2D3
(l per kg body per day)– – 0.26± 0.04 – – 0.52± 0.03∗∗
a Data is presented as means± S.E.M. (∗) P ≤ 0.05 and (∗∗) P ≤ 0.01 between groups at the same age, (†) P < 0.05 between groups at the same age but consideredto be a relevant difference, (A) P < 0.05 as compared to 7 weeks of age.
b Ca, calcium; Ca2+, ionized Ca; Pi , inorganic phosphate; AP, alkaline phosphatase; GFR, glomerular flitration rate; 25(OH)D3, 25-hydroxycholecalciferol;24,25(OH)2D3, 24,25-dihydroxycholecalciferol; 1,25(OH)2D3, 1,25-dihydroxycholeca1ciferol; iPTH, intact parathyroid hormone; CT, calcitonin; GH, growth hormone;IGF-I, insulin-like growth factor 1; MCR, metabolic clearance rate.

M.A. Tryfonidou et al. / Domestic Animal Endocrinology 24 (2003) 265–285 275
Table 4Parameters of skeletal growth (mean±S.E.M.) and development in growing Great Dane dogs raised on a balanceddiet differing only in Vitamin D3 content
Age (week) Length of radius (cm) Length of ulna (cm)
CVitD HVitD CVitD HVitD
9 8.1± 0.2 9.0± 0.3 9.9± 0.2 10.9± 0.315 12.6± 0.1 13.2± 0.2 14.9± 0.1 15.7± 0.321 15.8± 0.2 16.5± 0.3 18.8± 0.2 19.7± 0.3
Increase in length (%)
9–15 55.5± 2.2 47.2± 2.5∗ 50.0± 2.1 44.9± 2.215–21 25.7± 1.3 24.9± 1.3 26.7± 0.7 25.0± 1.4
Development of the secondary ossification centers of the elbow joint and of the distal ulna
9 weeks of age 15 weeks of age 21 weeks of age
CVitD HVitD CVitD HVitD CVitD HVitD
AnconeusNo ossification 9 7 1 – – –Some ossification, no fusion – – 3 – – –Complete ossification, no fusion – – 3 5 1 –Complete ossification, fusion – – 2 2 8 7
Olecranal apophysisIrregular shape 6 4 – – – –Round – 3 – – – –Rounded edges 3 – 4 1 – –Complete ossification – – 5 3 9 7
Medial humeral epicondylRound 1 3 – – – –Rounded edges 8 4 – – – –Compete ossification – – 9 7 9 7
Ulnar styloid processRectangular 6 2 – – – –Square 3 5 – – – –Young apex – – 2 1 – –Apex visible, no fusion – – 5 2 – –Complete ossification – – 2 4 9 7
Distal ulnar metaphysisFlattened or rounded 2 3 4 3 3 3Cartilage cone – – 5 3 3 2Irregular structure – – 2 4 6 4Normal shape 7 4 1 1 2 –
Two groups of Great Dane dogs were raised from partial weaning (3 weeks) until 21 weeks of age on a balancediet differing only in its Vitamin D3 content:CVitD group (n = 9) with 11.4�g andHVitD (n = 7) with 1350�gVitamin D3/kg diet.

276 M.A. Tryfonidou et al. / Domestic Animal Endocrinology 24 (2003) 265–285
3.4. Endogenous metabolic clearance of 1,25(OH)2D3
The MCR of 1,25(OH)2D3 at 19 weeks of age was increased two-fold in theHVitD versusCVitD group (Table 3).
3.5. Intestinal VDR content
VDR levels at the end of the study did not differ between groups and decreased graduallyin the distal segments of the intestine ranging from 350±33 fmol/mg protein in the proximalduodenum to 86± 19 fmol/mg protein in the colon.
3.6. Radiology
Length of the radius and ulna was greater in theCVitDversusHVitD group but the increasein length did not differ between groups (Table 4). The development of the secondary centersof ossification was variable in both groups, however at 21 weeks of age all dogs of bothgroups were at the same stage of development (Table 4). There were no obvious differencesbetween groups in the structure of the DUM except for that none of theHVitD dogs hadnormal structure of the DUM at the end of the study (Table 4).
3.7. Histomorphometry
Results of the histomorphometric analysis of the growth plate and metaphyseal area ofthe rib biopsies are presented inTable 5. At 10 weeks of age GPl.Th and GPl.ThS.D./GPl.Thwere significantly higher in theHVitD versusCVitD group. With increasing age, GPl.Thdecreased significantly only in theCVitD group. GPl.ThS.D./GPl.Th did not change withage in theCVitD group, whereas it increased significantly with age in theHVitD group. At10 weeks of age Md.Tb.V did not differ between groups and increased with age in both
Table 5Histomorphometric parameters of the growth plate and metaphyseal area of the rib of growing Great Dane dogsraised on diet differing only in Vitamin D3 content
10 weeks of age 21 weeks of age
CVitD HVitD CVitD HVitD
GP1.Th (mm) 1.14± 0.03 1.27± 0.05∗ 0.98± 0.03B l.26 ± 0.07∗∗GP1.ThS.D. (mm) 0.18± 0.02 0.26± 0 02 0.27± 0.09 0.49± 0.07GPl.ThS.D./GPl.Th (%) 15.7± 1.3 20.3± 0 7∗∗ 17.6± 1.3 38.7± 3.4∗∗A
Md.Tb.V (%) 15.6± 1.4 17.7± 0 7 22.4± 1.3B 22.4± 1.6A
N.Oc (n) 10.0± 0.3 9.4± 0.7 7.6± 0.4B 6.6± 0.3B
Two groups of dogs were raised from partial weaning (i.e. at 3 weeks) until 21 weeks of age on a balance dietdiffering only in its Vitamin D3 content:CVitD group (n = 9) with 11.4�g andHVitD (n = 7) with 1350�gVitamin D3/kg diet. GPl.Th, mean growth plate thickness; GPl.ThS.D., standard deviation of the GPl.Th; Md.Tb.V,mineralized trabecular bone percentage of the total bone area; N.Oc, Osteoclast number. Data is expressed asmean± S.E.M.(∗∗) P < 0.01 compared to theCVitD group; (A) P < 0.05 and (B) P < 0.01 compared to 10weeks of age.
M.A. Tryfonidou et al. / Domestic Animal Endocrinology 24 (2003) 265–285 277
groups, with no differences between groups at 21 weeks. At both measured points N.Ocdid not differ between groups and decreased significantly with age.
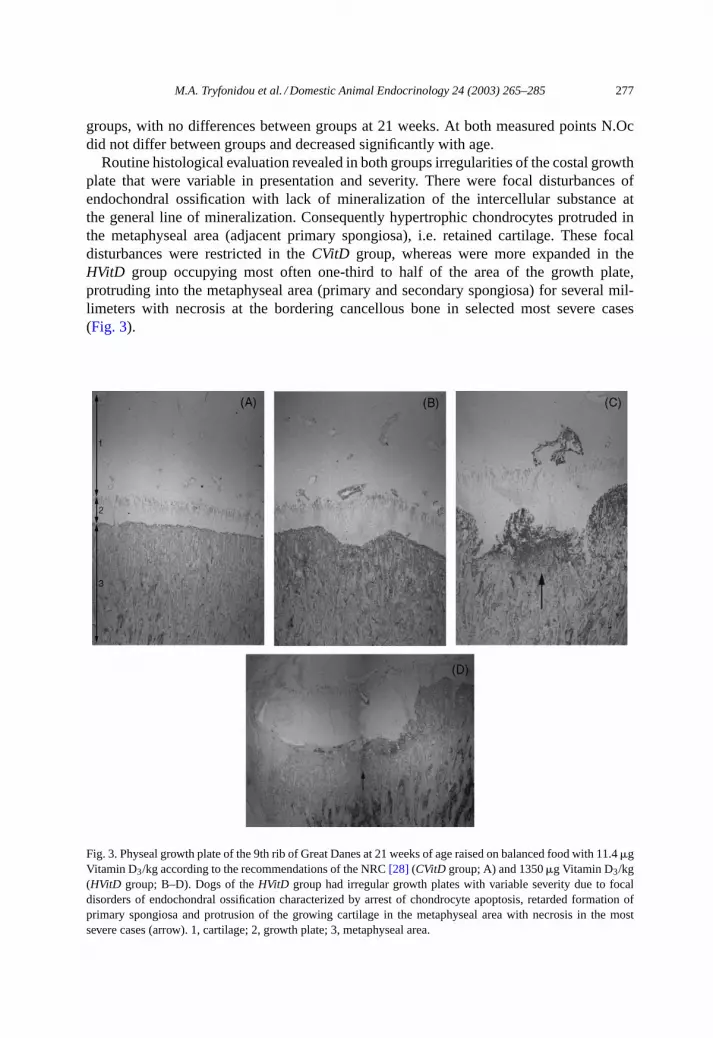
Routine histological evaluation revealed in both groups irregularities of the costal growthplate that were variable in presentation and severity. There were focal disturbances ofendochondral ossification with lack of mineralization of the intercellular substance atthe general line of mineralization. Consequently hypertrophic chondrocytes protruded inthe metaphyseal area (adjacent primary spongiosa), i.e. retained cartilage. These focaldisturbances were restricted in theCVitD group, whereas were more expanded in theHVitD group occupying most often one-third to half of the area of the growth plate,protruding into the metaphyseal area (primary and secondary spongiosa) for several mil-limeters with necrosis at the bordering cancellous bone in selected most severe cases(Fig. 3).
Fig. 3. Physeal growth plate of the 9th rib of Great Danes at 21 weeks of age raised on balanced food with 11.4�gVitamin D3/kg according to the recommendations of the NRC[28] (CVitD group; A) and 1350�g Vitamin D3/kg(HVitD group; B–D). Dogs of theHVitD group had irregular growth plates with variable severity due to focaldisorders of endochondral ossification characterized by arrest of chondrocyte apoptosis, retarded formation ofprimary spongiosa and protrusion of the growing cartilage in the metaphyseal area with necrosis in the mostsevere cases (arrow). 1, cartilage; 2, growth plate; 3, metaphyseal area.

278 M.A. Tryfonidou et al. / Domestic Animal Endocrinology 24 (2003) 265–285
4. Discussion
The 135-fold Vitamin D3 supplementation in growing dogs compared to age matchedcontrols induced major changes in the plasma levels of Vitamin D3 metabolites for theduration of the study. Vitamin D3 supplementation was accompanied by an increment infractional Ca absorption of only 16.4% solely at the end of the study and severe disturbancesof endochondral ossification. Both groups of dogs were raised on a diet differing only inits Vitamin D3 content and food consumption was restricted to the energy requirementsof growing dogs and thus Ca and P intake did not differ between groups. Dogs grew ac-cording to the curves described for Great Danes in earlier studies[26,42]. In addition, theHVitD group had plasma Ca, Pi, creatinin, and urea levels comparable to theCVitD group,plasma Ca2+ increased only at the end of the study, GFR in the optimal reference range forall dogs in both groups[43], and renal excretion of Ca and P at control levels. Thus, thechronic dietary 135-fold supplementation with Vitamin D3 was not accompanied by clini-cal signs of Vitamin D3 intoxication, such as severe hypercalcemia, hyperphosphatemia, orkidney failure. The effects of excessive non-toxic dietary Vitamin D3 supplementation dur-ing growth on skeletal development are here discussed in light of the calciotropic hormonesand influences on Ca homeostasis.
Oral Vitamin D3 supplementation in theHVitD group induced striking changes in theplasma levels of the calciotropic hormones, i.e. Vitamin D3 metabolites, PTH, and CTlevels. Plasma total Ca, Pi , GH, and IGF-I levels did not differ between groups and thuswere assumed not to play a differential regulatory role on Vitamin D3 metabolism be-tween groups. The 135-fold Vitamin D3 supplementation resulted in a major increase of theplasma 25(OH)D3 levels accompanied by a significant increase in plasma 24,25(OH)2D3levels compared to theCVitD group, which is a well established phenomenon[48,49]. Inhypervitaminosis D3, plasma 25(OH)D3 and 24,25(OH)2D3 levels may rise far above thebinding capacity of the Vitamin D binding protein (DBP) and displace 1,25(OH)2D3 fromDBP resulting in increase of the free plasma 1,25(OH)2D3 levels[50]. The latter may haveattributed to increased biologic activity of 1,25(OH)2D3 without concomitant increase inthe total plasma 1,25(OH)2D3 levels inHVitD. In the absence of hypercalcemia (in thebeginning and middle of the study) and of increased total plasma 1,25(OH)2D3 levels,either increased free plasma 1,25(OH)2D3 levels or high plasma 25(OH)D3 levels in theHVitD group mimicking the biologic actions of 1,25(OH)2D3 on parathyroid level[51]may result in down regulation of plasma PTH levels. Decreased plasma PTH levels indicateeither a decrease in production of PTH[52], an increase in sensitivity of the chief-cellsto stimuli [53], or a modification of the secretory profile of the parathyroid gland[54].Hypercalcitoninemia has been related in dogs to C-cell hyperplasia due to chronic hyper-calcemia[4,55,56]. However, hypercalcemia, the main mediator of hypercalcitoninemia[57], was only present at 19 weeks of age in theHVitD group. Taking into considerationthe inverse relationship of the plasma PTH and CT levels, it seems conceivable to sug-gest a direct influence of one of the Vitamin D3 metabolites either on CT production andsecretion, or on the responsiveness of the C-cells to stimuli. The relation of Vitamin D3metabolism to C-cells remains to be elucidated but is supported (a) by the presence of aCa sensing receptor (CaR) in chief- and C-cells which may influence the secretion of therespective hormones PTH and CT[53] and (b) by the up regulating effect of 1,25(OH)2D3

M.A. Tryfonidou et al. / Domestic Animal Endocrinology 24 (2003) 265–285 279
on CaR gene expression of the parathyroid gland in Vitamin D-deplete and -replete rats[58,59].
Plasma 1,25(OH)2D3 levels did not change with age in theCVitD group. On the con-trary, in theHVitD plasma 1,25(OH)2D3 levels decreased with age and were significantlydecreased by 40 and 36% at 13 and 19 weeks of age, respectively, compared to theCVitDgroup. This decrease in plasma 1,25(OH)2D3 levels is in accordance with earlier studies onVitamin D3 excess in rats[60] and is more pronounced than that encountered during moder-ate (i.e. eight-fold) Vitamin D3 supplementation in growing dogs over the same life period[26]. In theHVitD group, low plasma PTH levels indicated an attenuation of the anabolicaction of PTH on the production of 1,25(OH)2D3 [61]. In addition, MCR of 1,25(OH)2D3was two-fold higher in theHVitD than in theCVitD group indicating up regulation of24-oxidation pathway and thus increased conversion of 1,25(OH)2D3 into less biologicallyactive products in the target organs[49,62]. Summarizing, the absence of the anabolic ef-fect of PTH on the production of 1,25(OH)2D3 [49] accompanied by the enhanced MCR of1,25(OH)2D3 resulted in a modifying down regulating effect on the plasma 1,25(OH)2D3levels.
45Ca balance studies demonstrated that, despite the prominently lower plasma1,25(OH)2D3 levels in the middle and end of the study in theHVitD versusCVitD group,α was similar between groups at 14 weeks of age, whereas it was increased in theHVitDcompared to theCVitD group at 20 weeks of age. The up regulation ofα in theHVitD groupcan be attributed either to an increase of the free plasma 1,25(OH)2D3 levels or to the highplasma 25(OH)D3 levels. Excessive 25(OH)D3 may compete for binding at VDR sites andproduce similar effects to 1,25(OH)2D3 in the intestine, i.e. stimulate Ca absorption[63].In support of the biologic effect of 25(OH)D3 are the in vivo studies in man giving evidencethat 25(OH)D3 has a direct effect on Ca absorption even at physiological concentration[13,14]. Heaney et al.[15] reported in man an increment of the fractional Ca absorptionof 0.000299 for every rise of 1 nmol/l in plasma 25(OH)D3 levels. By extrapolating thisrelationship to the data of the present study and supposing that 25(OH)D3 stimulates Caabsorption also in the dog, the striking rise of plasma 25(OH)D3 levels in theHVitD group,would have been expected to evoke an increase inα of 14.9% at 8 weeks up to 35.8% at20 weeks of age compared to theCVitD group. However, the increase inα was significantonly at 20 weeks of age, being lower than the expected rise, i.e. just 16.4% higher in theHVitD group thanCVitD group. The blunted increase in Ca absorption at all ages in theHVitD group cannot be anticipated by an alteration in the abundance of intestinal VDR asthey were maintained in theHVitD group at the same levels as in theCVitD group. A mech-anism counter regulating Ca absorption may be provided either by relatively limited tissueresponsiveness to 25(OH)D3 by maintenance of the VDR at control level and/or by theincreased plasma 24,25(OH)2D3 levels in theHVitD group as has been described in chickintestine[19,64]. Two-fold increased plasma 24,25(OH)2D3 levels have been associatedwith the depression of intestinal Ca absorption in growing dogs receiving moderate dietaryVitamin D3 supplementation[26]. However, this consideration is rather tentative with con-troversy in the literature[19,20,64]and the counter regulating effect of 24,25(OH)2D3 onCa absorption in dogs needs further investigation.
Vitamin D3 supplementation had only moderate effects on skeletal mineralization andremodeling.V+
0 was higher thanV−0 at all measured points and regardless of the group

280 M.A. Tryfonidou et al. / Domestic Animal Endocrinology 24 (2003) 265–285
(Fig. 2) as may be expected in animals with a growing skeleton. This was reflected in theincreasing Md.Tb.V of the costal metaphyseal area with age in both groups (Table 5). Boneturnover decreased with age in both groups and at the end of the study it was significantlylower in theHVitD than in theCVitD group as indicated by the lowerV+
0 andV−0 , although
this was not reflected in the plasma AP levels and the N.Oc. However, plasma AP levelshave been reported not to correlate with the bone-isoform originating from active osteoblast[65], and the N.Oc is not necessarily related to the level of resorption activity. In addition tothat, histomorphometry is restricted to the costal metaphyseal area, whereas45Ca balancestudies give a whole body estimation of theV+
0 andV−0 1,25(OH)2D3 stimulates skeletal
mineralization as well as resorption[66], whereas 24,25(OH)2D3 stimulates mineralizationwithout affecting resorption[67], and CT attenuates bone resorption[57]. Increased plasma24,25(OH)2D3 levels in combination with lowered plasma 1,25(OH)2D3 levels explain thelower bone turnover/remodelling in theHVitD versusCVitD group[68], whereas increasedCT levels indicate retraction of the ruffle border of the osteoclasts resulting in decreasedbone resorption without affecting the N.Oc.
There is evidence that excessive non-toxic dietary Vitamin D3 intake in large breed dogsdirectly influences endochondral ossification. Radiological evaluation of the right forelimbrevealed that the development of the secondary ossification centers was not influenced byVitamin D3 supplementation. Evaluation of the structure of the distal ulna revealed irregularstructure and the presence of cartilage cones in both groups indicating that even in the controldogs endochondral ossification did not proceed undisturbed. However, at the end of thestudy allHVitD dogs revealed abnormal structure. Histomorphometric evaluation of costalgrowth plate at 10 and 21 weeks of age revealed that GPl.Th decreased significantly withage in theCVitD group, which is in agreement with other reports on growing Great Danes[4,69]. In addition, the regularity of the frontline between growth plate and metaphysealbone remained constant with age in theCVitD group. To the contrary, in theHVitD groupgrowth plates were irregular at 10 weeks and even more so at 21 weeks of age. The increasein irregularity of theHVitD group reflected the increasing severity of disturbances of theendochondral ossification with age (Fig. 3).
Chondrocyte proliferation, hypertrophy, and mineralization at growth plate level are sub-ject to complex autocrine, paracrine, and endocrine regulation. Disturbed endochondralossification seen in theHVitD group was related to increased plasma 24,25(OH)2D3 levelsand the decreased plasma 1,25(OH)2D3 levels, as well as to the increased plasma CT levels.High Ca intake resulting in high Ca retention has been related to osteochondrosis in growinglarge breed dogs[4,6] and may be a contributing factor in theHVitD group. At 20 weeksof age Ca retention was 5.3 mmol per kg body per day in theHVitD group,∼8.5 mmol perkg body per day in dogs raised on a diet with 3.3 g Ca/100 g diet (DM)[70], whereas itwas 4.1 mmol per kg body per day in theCVitD group. 24,25(OH)2D3 has been reportedto cause resting zone cells to mature in the endochondral lineage and become responsive to1,25(OH)2D3 [71] which is further responsible for the terminal chondrocyte differentiationand mineralization of the matrix[72]. We hypothesize that the 16- to 18-fold increasedplasma 24,25(OH)2D3 concentration in combination with the 30–40% decrease in plasma1,25(OH)2D3 levels may be implicated in the abnormal development of endochondral os-sification. The morphological findings in this study with thickening of the growth platesresemble those of other studies in turtles[73], rabbits[74], and rats[75,76] treated with

M.A. Tryfonidou et al. / Domestic Animal Endocrinology 24 (2003) 265–285 281
salmon CT. The described mechanisms of focal thickening of the growth plate due to CTexcess resulting in disturbances of endochondral ossification are not univocal and have beenattributed either to a direct effect of CT on the maturation of the hypertrophic cells[75] or adown regulating effect of CT in skeletal metaphyseal remodelling[76]. The causative roleof hypercalcitoninism in osteochondrosis of dogs as suggested by others[4,55] is supportedby the hypercalcitoninism with concomitant manifestation of osteochondrosis of the costalgrowth plates in theHVitD group.
In conclusion, the 135-fold Vitamin D3 supplementation in growing dogs from 3 to 21weeks of age resulted in decreased plasma PTH levels and increased plasma CT levelsand major changes in the plasma levels of the Vitamin D3 metabolites, i.e. increase inthe plasma 25(OH)D3 and 24,25(OH)2D3 levels and decrease in the plasma 1,25(OH)2D3levels. The decrease in plasma 1,25(OH)2D3 levels was attributed to a combination of en-hanced metabolic clearance and probably attenuation of the anabolic action of the loweredplasma PTH levels on the synthesis of 1,25(OH)2D3. Despite the 135-fold Vitamin D3 sup-plementation and on average 50-fold increase in plasma 25(OH)2D3 levels, Ca absorptionremained at control levels and increased significantly only at the end of the study. The at-tenuated increase in Ca absorption may be attributed to maintenance of the intestinal VDRlevels at control levels, a counter regulating effect of 24,25(OH)2D3 on Ca absorption, ora combination of the above. Excessive, non-toxic dietary Vitamin D3 supplementation re-sulted at the end of the study in decreased skeletal remodeling and severe disturbances ofendochondral ossification attributed to direct effects on the maturation process of hyper-trophic chondrocytes, as well as indirect effects on the remodelling of the metaphyseal area.Important candidates that may disturb endochondral ossification were either (a) increasedplasma 24,25(OH)2D3 levels in combination with decreased plasma 1,25(OH)2D3 levels,(b) increased plasma CT levels, or (c) a combination of the above. Dietary intake of VitaminD3 135-fold higher than the NRC recommendations during the period of fast growth in largebreed dogs does not cause clinical signs of Vitamin D3 intoxication, except for disturbancesof endochondral ossification.
Acknowledgements
Stable metabolites of 25(OH)D3 and 24,25(OH)2D3 were kindly provided by Dr. J.P.van de Velden (Solvay Pharmaceuticals, Weesp, The Netherlands). The authors would liketo acknowledge the clinic attendants for good caring of the pups and their assistance inperforming the experiments, as well as the assistance of the Biochemical Laboratory. Wethank Yvonne Pollak for the technical assistance in the GFR measurements.
References
[1] Johnson JA, Austin C, Breur GJ. Incidence of canine appendicular musculoskeletal disorders in 16 veterinaryteaching hospitals from 1980 through 1989. VCOT 1994; 56–69.
[2] Hedhammar A, Wu FM, Krook L, Schryver HF, De Lahunta A, Whalen JP, et al. Overnutrition and skeletaldisease. An experimental study in growing Great Dane dogs. Cornell Vet 1974;64(Suppl. 160).

282 M.A. Tryfonidou et al. / Domestic Animal Endocrinology 24 (2003) 265–285
[3] Blum JW, Zentek J, Meyer H. The effect of a different energy supply on the growth intensity and skeletaldevelopment of growing Great Danes. 2. Effect on insulin-like growth factor I and on thyroid hormones.Zentralbl Veterinarmed A 1992;39:568–74.
[4] Goedegebuure SA, Hazewinkel HAW. Morphological findings in young dogs chronically fed a diet containingexcess calcium. Vet Pathol 1986;23:594–605.
[5] Goodman SA, Montgomery RD, Fitch RB, Hathcock JT, Lauten SD, Cox NR, et al. Serial orthopedicexaminations of growing Great Dane puppies fed three diets varying in calcium and phosphorus. In: ReinhardtTA, Carey DP, editors, Recent advances in canine and feline nutrition II. Wilmington, OH: Orange FrazerPress; 1998. p. 3–12.
[6] Schoenmakers I, Hazewinkel HAW, Voorhout G, Carlson CS, Richardson D. Effects of diets with differentcalcium and phosphorus contents on the skeletal development and blood chemistry of growing Great Danes.Vet Rec 2000;147:652–60.
[7] How KL, Hazewinkel HAW, Mol JA. Dietary vitamin D dependence of cat and dog due to inadequatecutaneous synthesis of vitamin D. Gen Comp Endocrinol 1994;96:12–8.
[8] Gray RW, Garthwaite TL. Activation of renal 1,25-dihydroxyvitamin D3 synthesis by phosphate deprivation:evidence for a role for growth hormone. Endocrinology 1985;116:189–93.
[9] Nesbitt T, Drezner MK. Insulin-like growth factor-I regulation of renal 25-hydroxyvitamin D-1�-hydroxylaseactivity. Endocrinology 1993;132:133–8.
[10] Murayama A, Takeyama K, Kitanaka S, Kodera Y, Kawaguchi Y, Hosoya T, et al. Positive and negativeregulations of the renal 25-hydroxyvitamin D3 1�-hydroxylase gene by parathyroid hormone, calcitonin,and 1�,25(OH)2D3 in intact animals. Endocrinology 1999;140:2224–31.
[11] Brown AJ, Dusso A, Slatopolsky E. Vitamin D. Am J Physiol 1999;277:F157–75.[12] Norman AW. Intestinal calcium absorption: a vitamin D-hormone-mediated adaptive response. Am J Clin
Nutr 1990;51:290–300.[13] Colodro IH, Brickman AS, Coburn JW, Osborn TW, Norman AW. Effect of 25-hydroxyvitamin D3 on
intestinal absorption of calcium in normal man and patients with renal failure. Metabolism 1978;27:745–53.
[14] Barger-Lux MJ, Heaney RP, Lanspa SJ, Healy JC, DeLuca HF. An investigation of sources of variation incalcium absorption efficiency. J Clin Endocrinol Metab 1995;80:406–11.
[15] Heaney RP, Barger-Lux MJ, Dowell MS, Chen TC, Holick MF. Calcium absorptive effects of vitamin D andits major metabolites. J Clin Endocrinol Metab 1997;82:4111–6.
[16] Fraser DR, Kodicek E. Regulation of 25-hydroxycholecalciferol-1-hydroxylase activity in kidney byparathyroid hormone. Nat New Biol 1973;241:163–6.
[17] van Leeuwen JP, van den Bemd GJ, van Driel M, Buurman CJ, Pols HA. 24,25-dihydroxyvitamin D3 andbone metabolism. Steroids 2001;66:375–80.
[18] Boyan BD, Sylvia VL, Dean DD, Schwartz Z. 24,25-(OH)2D3 regulates cartilage and bone via autocrine andendocrine mechanisms. Steroids 2001;66:363–74.
[19] Nemere I. 24,25-dihydroxyvitamin D3 suppresses the rapid actions of 1,25-dihydroxyvitamin D3 andparathyroid hormone on calcium transport in chick intestine. J Bone Miner Res 1999;14:1543–9.
[20] Fleet JC, Wood RJ. Specific 1,25(OH)2D3-mediated regulation of transcellular calcium transport in Caco-2cells. Am J Physiol 1999;276:G958–64.
[21] Nap RC, Hazewinkel HAW, Mol JA. Prepubertal differences in plasma growth hormone and IGF-Iconcentrations related to adult body size in the dog. J Endocrin Invest 1992;15:91 [abstract].
[22] Wu S, Grieff M, Brown AJ. Regulation of renal vitamin D-24-hydroxylase by phosphate: effects ofhypophysectomy, growth hormone and insulin-like growth factor I. Biochem Biophys Res Commun1997;233:813–7.
[23] Goff JP, Caperna TJ, Steele NC. Effects of growth hormone administration on vitamin D metabolism andvitamin D receptors in the pig. Domest Anim Endocrinol 1990;7:425–33.
[24] Denis I, Thomasset M, Pointillart A. Influence of exogenous porcine growth hormone on vitaminD metabolism and calcium and phosphorus absorption in intact pigs. Calcif Tissue Int 1994;54:489–92.
[25] Lund B, Eskildsen PC, Lund B, Norman AW, Sorensen OH. Calcium and vitamin D metabolism in acromegaly.Acta Endocrinol (Copenh) 1981;96:444–50.

M.A. Tryfonidou et al. / Domestic Animal Endocrinology 24 (2003) 265–285 283
[26] Tryfonidou MA, Stevenhagen JJ, van den Bemd GJCM, Oosterlaken-Dijksterhuis MA, DeLuca HF, MolJA, et al. Moderate cholecalciferol supplementation depresses intestinal calcium absorption in dogs. J Nutr2002;132:2644–50.
[27] Favier RP, Mol JA, Kooistra HS, Rijnberk A. Large body size in the dog is associated with transient GHexcess at a young age. J Endocrinol 2001;170:479–84.
[28] National Research Council (NRC). Nutrient requirements of dogs. Washington, DC: National AcademyPress; 1985.
[29] Spangler WL, Gribble DH, Lee TC. Vitamin D intoxication and the pathogenesis of vitamin D nephropathyin the dog. Am J Vet Res 1979;40:73–83.
[30] National Research Council (NRC). Nutrient requirements of dogs. Washington, DC: National AcademyPress; 1974.
[31] van den Berg H, Boshuis PG, Schreurs WHP. Determination of vitamin D in fortified and nonfortified milkpowder and infant formula using a specific radioassay after purification by HPLC. J Agric Food Chem1986;34:264–8.
[32] Lewis LD, Morris ML, Hand MS. Nutrients. In: Lewis LD, Morris ML, Hand MS, editors. Small AnimalNutrition III. Topeka, Kansas: Mark Morris Associates; 1987. p. 1-1-1-25.
[33] Schoenmakers I, Hazewinkel HAW, van den Brom WE. Excessive Ca and P intake during early maturation indogs alters Ca and P balance without long-term effects after dietary normalization. J Nutr 1999;129:1068–74.
[34] Teske E, Rothuizen J, de Bruijne JJ, Rijnberk A. Corticosteroid-induced alkaline phosphatase isoenzyme inthe diagnosis of canine hypercorticism. Vet Rec 1989;125:12–4.
[35] Bosch R, Visser WJ, Thijssen JH, Duursma SA. Synthesis of [10S(19)-3H]-dihydrotachysterol2 fromergocalciferol and preliminary investigations into its metabolic fate in rats. J Steroid Biochem 1983;18:441–7.
[36] McGraw CA, Hug G. Simultaneous measurement of 25-hydroxy, 24,25-dihydroxy-, and 1,25-dihydroxy-vitamin D without use of HPLC. Med Lab Sci 1990;47:17–25.
[37] Reinhardt TA, Horst RL, Orf JW, Hollis BW. A microassay for 1,25-dihydroxyvitamin D not requiring highperformance liquid chromatography: application to clinical studies. J Clin Endocrinol Metab 1984;58:91–8.
[38] Hollis BW. Assay of circulating 1,25-dihydroxyvitamin D involving a novel single-cartridge extraction andpurification procedure. Clin Chem 1986;32:2060–3.
[39] Torrance AG, Nachreiner R. Human-parathormone assay for use in dogs: validation, sample handling studies,and parathyroid function testing. Am J Vet Res 1989;50:1123–7.
[40] Hazewinkel HAW, Schoenmakers I, Pelling D, Snijdelaar M, Wolfswinkel J, Mol JA. Biological potency andradioimmunoassay of canine calcitonin. Domest Anim Endocrinol 1999;17:333–44.
[41] Eigenmann JE, Eigenmann RY. Radioimmunoassay of canine growth hormone. Acta Endocrinol (Copenh)1981;98:514–20.
[42] Nap RC, Mol JA, Hazewinkel HAW. Age-related plasma concentrations of growth hormone (GH) andinsulin-like growth factor I (IGF-I) in Great Dane pups fed different dietary levels of protein. Domest AnimEndocrinol 1993;10:237–47.
[43] van den Brom WE, Biewenga WJ. Assessment of glomerular filtration rate in normal dogs: analysis of the51Cr-EDTA clearance and its relation to several endogenous parameters of glomerular filtration. Res Vet Sci1981;30:152–7.
[44] Gray RW, Caldas AE, Wilz DR, Lemann Jr J, Smith GA, DeLuca HF. Metabolism and excretion of3H-1,25-(OH)2-vitamin D3 in healthy adults. J Clin Endocrinol Metab 1978;46:756–65.
[45] Sandgren ME, DeLuca HF. An immunoradiometric assay for 1,25-dihydroxyvitamin D3 receptor. AnalBiochem 1989;183:57–63.
[46] Uhland-Smith A, Prahl JM, DeLuca HF. An enzyme-linked immunoassay for the 1,25-dihydroxyvitamin D3
receptor protein. J Bone Miner Res 1996;11:1921–5.[47] Voorhout G, Nap RC, Hazewinkel HAW. A radiographic study on the development of the antebrachium in
Great Dane pups, raised under standardized conditions. Veterinary Radiology and Ultrasound 1994;35:271–6.[48] Shepard RM, DeLuca HF. Plasma concentrations of vitamin D3 and its metabolites in the rat as influenced
by vitamin D3 or 25-hydroxyvitamin D3 intakes. Arch Biochem Biophys 1980;202:43–53.[49] Beckman MJ, Johnson JA, Goff JP, Reinhardt TA, Beitz DC, Horst RL. The role of dietary calcium in the
physiology of vitamin D toxicity: excess dietary vitamin D3 blunts parathyroid hormone induction of kidney1�-hydroxylase. Arch Biochem Biophys 1995;319:535–9.

284 M.A. Tryfonidou et al. / Domestic Animal Endocrinology 24 (2003) 265–285
[50] Pettifor JM, Bikle DD, Cavaleros M, Zachen D, Kamdar MC, Ross FP. Serum levels of free1,25-dihydroxyvitamin D in vitamin D toxicity. Ann Intern Med 1995;122:511–3.
[51] Silver J, Naveh-Many T, Mayer H, Schmelzer HJ, Popovtzer MM. Regulation by vitamin D metabolites ofparathyroid hormone gene transcription in vivo in the rat. J Clin Invest 1986;78:1296–301.
[52] Silver J, Yalcindag C, Sela-Brown A, Kilav R, Naveh-Many T. Regulation of the parathyroid hormone geneby vitamin D, calcium and phosphate. Kidney Int Suppl 1999;73:S2–7.
[53] Brown EM, MacLeod RJ. Extracellular calcium sensing and extracellular calcium signaling. Physiol Rev2001;81:239–97.
[54] Cloutier M, Gagnon Y, Gascon-Barre M, Brossard JH, D’Amour P. Adaptation of parathyroid functionto intravenous 1,25-dihydroxyvitamin D3 or partial parathyroidectomy in normal dogs. J Endocrinol1997;155:133–41.
[55] Nunez EA, Hedhammar A, Wu FM, Whalen JP, Krook L. Ultrastructure of the parafollicular (C) cells andthe parathyroid cell in growing dogs on a high calcium diet. Lab Invest 1974;31:96–108.
[56] Kameda Y. Increased mitotic activity of the parafollicular cells of the dog thyroid in experimentally inducedhypercalcemia. Arch Histol Jpn 1970;32:179–92.
[57] Azria M. Endogenous Calcitonin. In: Pittet R, Kälin HB, editors. The calcitonins: physiology andpharmacology. Karger, Basel; 1989. p. 21–66.
[58] Brown AJ, Zhong M, Finch J, Ritter C, McCracken R, Morrissey J, et al. Rat calcium-sensing receptor isregulated by vitamin D but not by calcium. Am J Physiol 1996;270:F454–60.
[59] Canaff L, Hendy GN. Human calcium-sensing receptor gene: Vitamin D response elements in promoters P1and P2 confer transcriptional responsiveness to 1,25-dihydroxyvitamin D. J Biol Chem 2002;1:25.
[60] Vieth R, Milojevic S, Peltekova V. Improved cholecalciferol nutrition in rats is noncalcemic, suppressesparathyroid hormone and increases responsiveness to 1,25-dihydroxycholecalciferol. J Nutr 2000;130:578–84.
[61] Tanaka Y, DeLuca HF. Rat renal 25-hydroxyvitamin. Am J Physiol 1984;246:E168–73.[62] Matsumoto T, Ikeda K, Yamato H, Morita K, Ezawa I, Fukushima M, et al. Effect of 24,25-dihydroxyvitamin
D3 on 1,25-dihydroxyvitamin D3 metabolism in calcium-deficient rats. Biochem J 1988;250:671–7.[63] Haussler MR, Cordy PE. Metabolites and analogues of vitamin D. Which for what? JAMA 1982;247:841–4.[64] Wilhelm F, Ross FP, Norman AW. Specific binding of 24R,25-dihydroxyvitamin D3 to chick
intestinal mucosa: 24R,25-dihydroxyvitamin D3 is an allosteric effector of 1,25-dihydroxyvitamin D3
binding-24R,25-dihydroxyvitamin D3 regulates 1,25-dihydroxyvitamin D3 binding to its chick intestinalreceptor. Arch Biochem Biophys 1986;249:88–94.
[65] Allen LC, Allen MJ, Breur GJ, Hoffmann WE, Richardson DC. A comparison of two techniques for thedetermination of serum bone-specific alkaline phosphatase activity in dogs. Res Vet Sci 2000;68:231–5.
[66] Suda T, Takahashi H. Vitamin and osteoclastogenesis. In: Feldman D, Glorieux FH, Wesley Pike J, editors.Vitamin D. San Diego, California: Academic Press; 1997. p. 329–40.
[67] Ono T, Tanaka H, Yamate T, Nagai Y, Nakamura T, Seino Y. 24R,25-dihydroxyvitamin D3 promotesbone formation without causing excessive resorption in hypophosphatemic mice. Endocrinology 1996;137:2633–7.
[68] Mortensen BM, Gautvik KM, Gordeladze JO. Bone turnover in rats treated with 1,25-dihydroxyvitamin D3,25-hydroxyvitamin D3 or 24,25-dihydroxyvitamin D3. Biosci Rep 1993;13:27–39.
[69] Nap RC, Hazewinkel HAW, Voorhout G, van den Brom WE, Goedegebuure SA, van’t Klooster ATh. Growthand skeletal development in Great Dane pups fed different levels of protein intake. J Nutr 1991;121:S107–13.
[70] Hazewinkel HAW, van den Brom WE, van’t Klooster AT, Voorhout G, Van Wees A. Calcium metabolism inGreat Dane dogs fed diets with various calcium and phosphorus levels. J Nutr 1991;121:S99–106.
[71] Schwartz Z, Dean DD, Walton JK, Brooks BP, Boyan BD. Treatment of resting zone chondrocytes with24,25-dihydroxyvitamin D3 [24,25-(OH)2D3] induces differentiation into a 1,25-(OH)2 D3-responsivephenotype characteristic of growth zone chondrocytes. Endocrinology 1995;136:402–11.
[72] Boyan BD, Sylvia VL, Dean DD, Pedrozo H, Del Toro F, Nemere I, et al. 1,25-(OH)2D3 modulatesgrowth plate chondrocytes via membrane receptor-mediated protein kinase C by a mechanism that involveschanges in phospholipid metabolism and the action of arachidonic acid and PGE2. Steroids 1999;64:129–36.

M.A. Tryfonidou et al. / Domestic Animal Endocrinology 24 (2003) 265–285 285
[73] Belanger LF, Dimond MT, Copp DH. Histological observations on bone and cartilage of growing turtlestreated with calcitonin. Gen Comp Endocrinol 1973;20:297–304.
[74] Tarsoly E, Bucher O. Histochemical and enzyme histochemical studies on the rat epiphyseal cartilagefollowing long-term calcitonin administration. Acta Histochem 1973;45:10–20.
[75] Burch WM, Corda G. Calcitonin stimulates maturation of mammalian growth plate cartilage. Endocrinology1985;116:1724–8.
[76] Pazzaglia UE, Zatti G, Di Nucci A, Coci A. Inhibitory effect of salmon calcitonin on bone resorption:morphological study of the tibial growth plate in rats. Calcif Tissue Int 1993;52:125–9.


